Jasper County, IA Map & Demographics
Jasper County Map
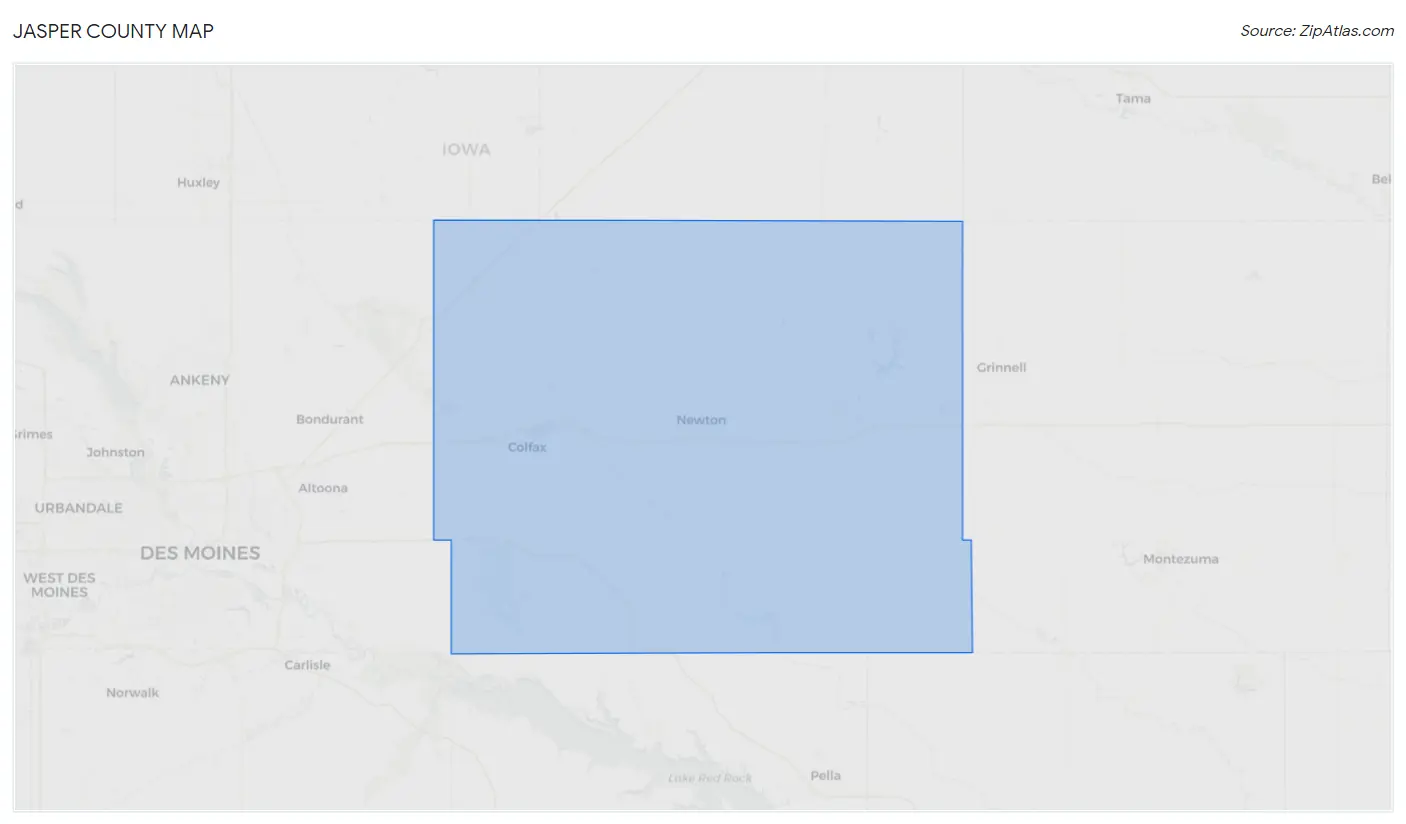
Jasper County Overview
$35,346
PER CAPITA INCOME
$81,606
AVG FAMILY INCOME
$67,784
AVG HOUSEHOLD INCOME
26.4%
WAGE / INCOME GAP [ % ]
73.6¢/ $1
WAGE / INCOME GAP [ $ ]
0.42
INEQUALITY / GINI INDEX
37,808
TOTAL POPULATION
19,739
MALE POPULATION
18,069
FEMALE POPULATION
109.24
MALES / 100 FEMALES
91.54
FEMALES / 100 MALES
41.0
MEDIAN AGE
3.0
AVG FAMILY SIZE
2.5
AVG HOUSEHOLD SIZE
19,236
LABOR FORCE [ PEOPLE ]
63.2%
PERCENT IN LABOR FORCE
4.8%
UNEMPLOYMENT RATE
Income in Jasper County
Income Overview in Jasper County
Per Capita Income in Jasper County is $35,346, while median incomes of families and households are $81,606 and $67,784 respectively.
| Characteristic | Number | Measure |
| Per Capita Income | 37,808 | $35,346 |
| Median Family Income | 9,825 | $81,606 |
| Mean Family Income | 9,825 | $103,149 |
| Median Household Income | 14,630 | $67,784 |
| Mean Household Income | 14,630 | $87,626 |
| Income Deficit | 9,825 | $0 |
| Wage / Income Gap (%) | 37,808 | 26.40% |
| Wage / Income Gap ($) | 37,808 | 73.60¢ per $1 |
| Gini / Inequality Index | 37,808 | 0.42 |
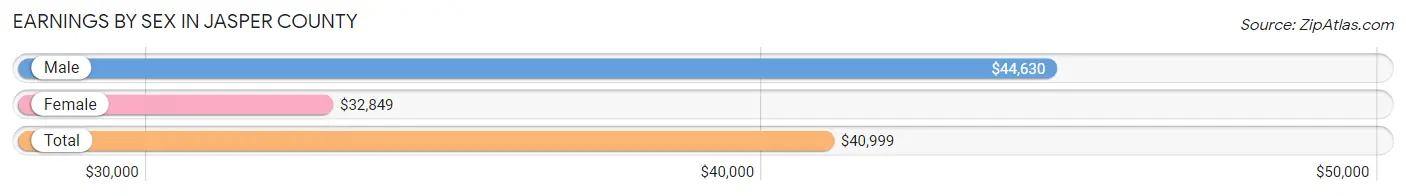
Earnings by Sex in Jasper County
Average Earnings in Jasper County are $40,999, $44,630 for men and $32,849 for women, a difference of 26.4%.
| Sex | Number | Average Earnings |
| Male | 11,581 (55.6%) | $44,630 |
| Female | 9,248 (44.4%) | $32,849 |
| Total | 20,829 (100.0%) | $40,999 |
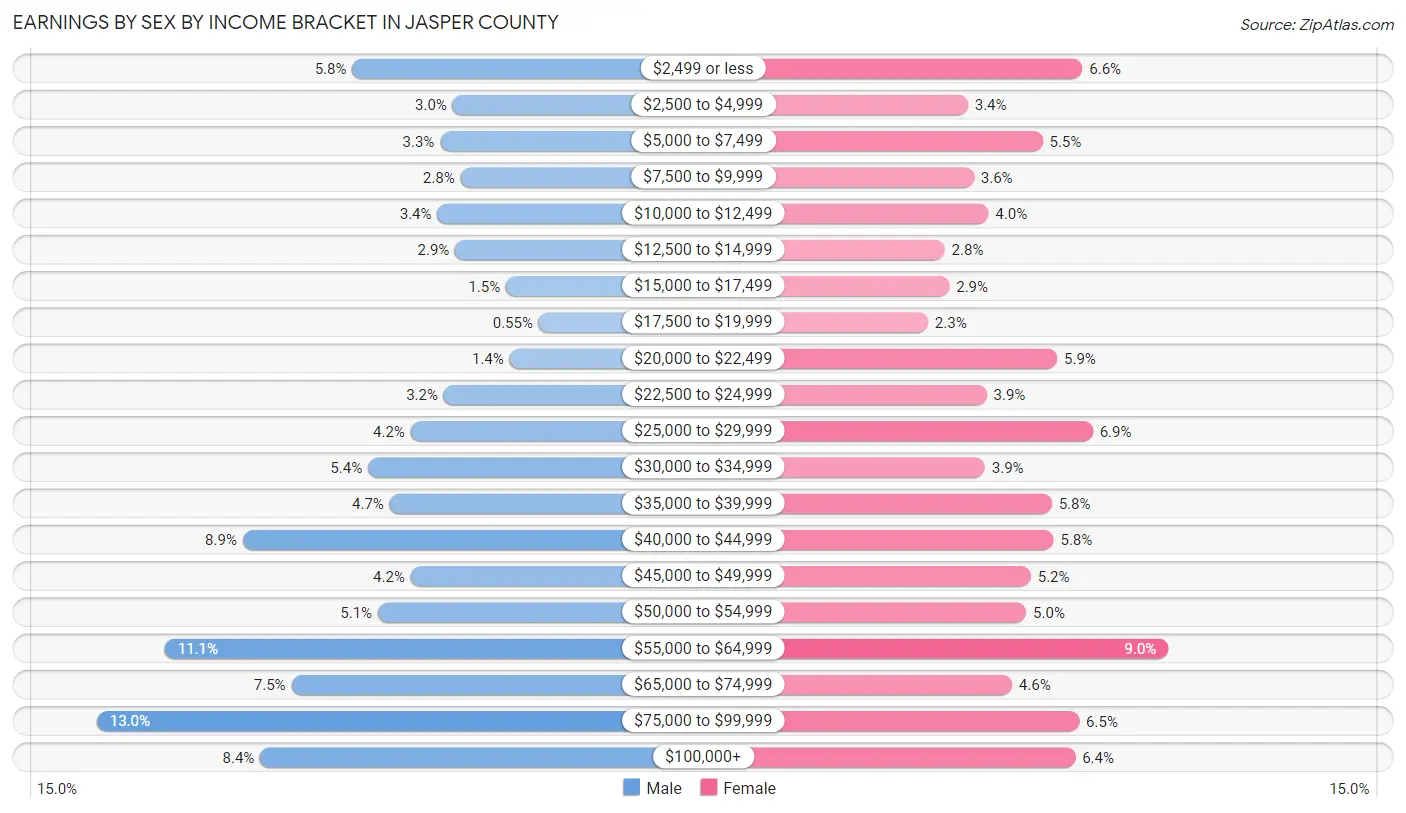
Earnings by Sex by Income Bracket in Jasper County
The most common earnings brackets in Jasper County are $75,000 to $99,999 for men (1,502 | 13.0%) and $55,000 to $64,999 for women (835 | 9.0%).
| Income | Male | Female |
| $2,499 or less | 671 (5.8%) | 612 (6.6%) |
| $2,500 to $4,999 | 344 (3.0%) | 314 (3.4%) |
| $5,000 to $7,499 | 384 (3.3%) | 509 (5.5%) |
| $7,500 to $9,999 | 318 (2.8%) | 330 (3.6%) |
| $10,000 to $12,499 | 394 (3.4%) | 368 (4.0%) |
| $12,500 to $14,999 | 336 (2.9%) | 254 (2.8%) |
| $15,000 to $17,499 | 170 (1.5%) | 266 (2.9%) |
| $17,500 to $19,999 | 64 (0.5%) | 211 (2.3%) |
| $20,000 to $22,499 | 159 (1.4%) | 547 (5.9%) |
| $22,500 to $24,999 | 373 (3.2%) | 363 (3.9%) |
| $25,000 to $29,999 | 481 (4.2%) | 639 (6.9%) |
| $30,000 to $34,999 | 620 (5.3%) | 359 (3.9%) |
| $35,000 to $39,999 | 549 (4.7%) | 533 (5.8%) |
| $40,000 to $44,999 | 1,027 (8.9%) | 537 (5.8%) |
| $45,000 to $49,999 | 481 (4.2%) | 478 (5.2%) |
| $50,000 to $54,999 | 587 (5.1%) | 466 (5.0%) |
| $55,000 to $64,999 | 1,281 (11.1%) | 835 (9.0%) |
| $65,000 to $74,999 | 869 (7.5%) | 429 (4.6%) |
| $75,000 to $99,999 | 1,502 (13.0%) | 604 (6.5%) |
| $100,000+ | 971 (8.4%) | 594 (6.4%) |
| Total | 11,581 (100.0%) | 9,248 (100.0%) |
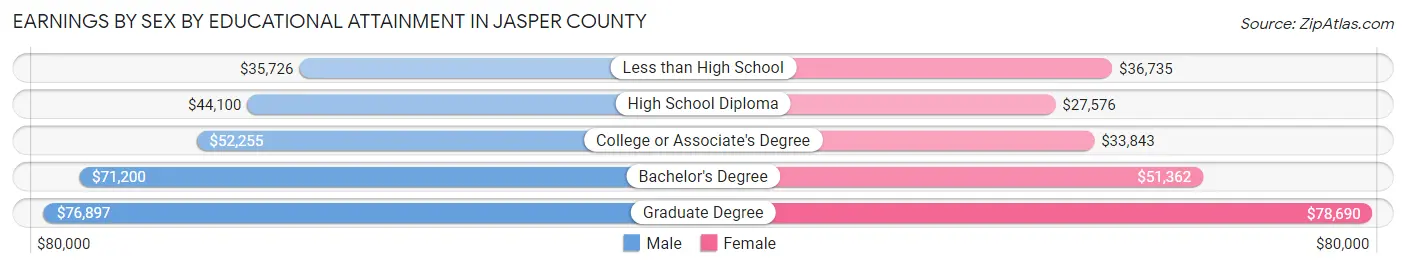
Earnings by Sex by Educational Attainment in Jasper County
Average earnings in Jasper County are $51,113 for men and $38,598 for women, a difference of 24.5%. Men with an educational attainment of graduate degree enjoy the highest average annual earnings of $76,897, while those with less than high school education earn the least with $35,726. Women with an educational attainment of graduate degree earn the most with the average annual earnings of $78,690, while those with high school diploma education have the smallest earnings of $27,576.
| Educational Attainment | Male Income | Female Income |
| Less than High School | $35,726 | $36,735 |
| High School Diploma | $44,100 | $27,576 |
| College or Associate's Degree | $52,255 | $33,843 |
| Bachelor's Degree | $71,200 | $51,362 |
| Graduate Degree | $76,897 | $78,690 |
| Total | $51,113 | $38,598 |
Family Income in Jasper County
Family Income Brackets in Jasper County
According to the Jasper County family income data, there are 2,260 families falling into the $100,000 to $149,999 income range, which is the most common income bracket and makes up 23.0% of all families. Conversely, the $10,000 to $14,999 income bracket is the least frequent group with only 88 families (0.9%) belonging to this category.
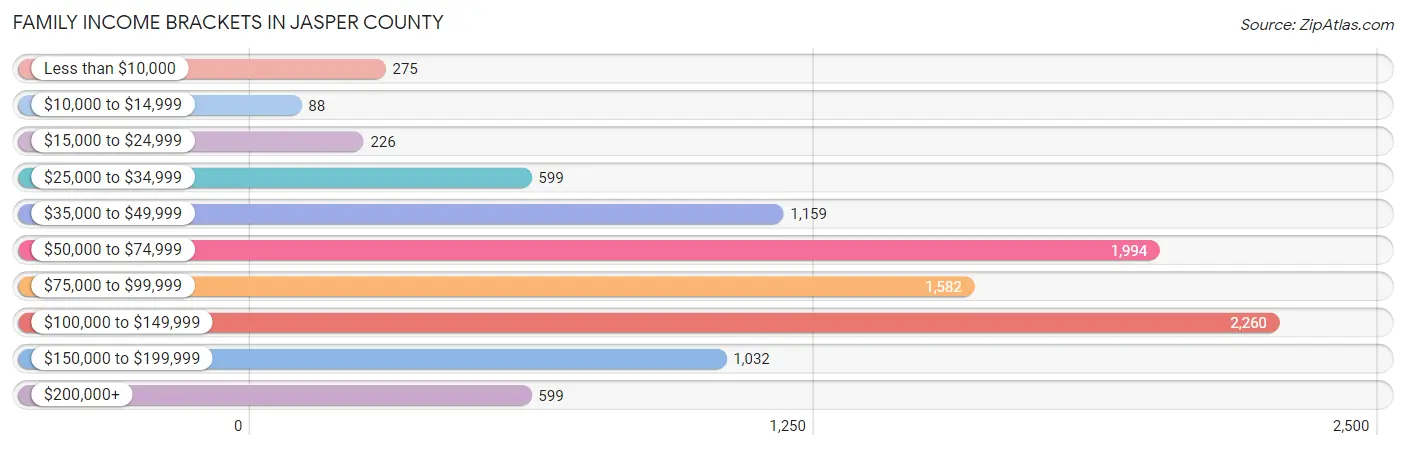
| Income Bracket | # Families | % Families |
| Less than $10,000 | 275 | 2.8% |
| $10,000 to $14,999 | 88 | 0.9% |
| $15,000 to $24,999 | 226 | 2.3% |
| $25,000 to $34,999 | 599 | 6.1% |
| $35,000 to $49,999 | 1,159 | 11.8% |
| $50,000 to $74,999 | 1,994 | 20.3% |
| $75,000 to $99,999 | 1,582 | 16.1% |
| $100,000 to $149,999 | 2,260 | 23.0% |
| $150,000 to $199,999 | 1,032 | 10.5% |
| $200,000+ | 599 | 6.1% |
Family Income by Famaliy Size in Jasper County
4-person families (1,681 | 17.1%) account for the highest median family income in Jasper County with $109,556 per family, while 2-person families (5,264 | 53.6%) have the highest median income of $38,413 per family member.
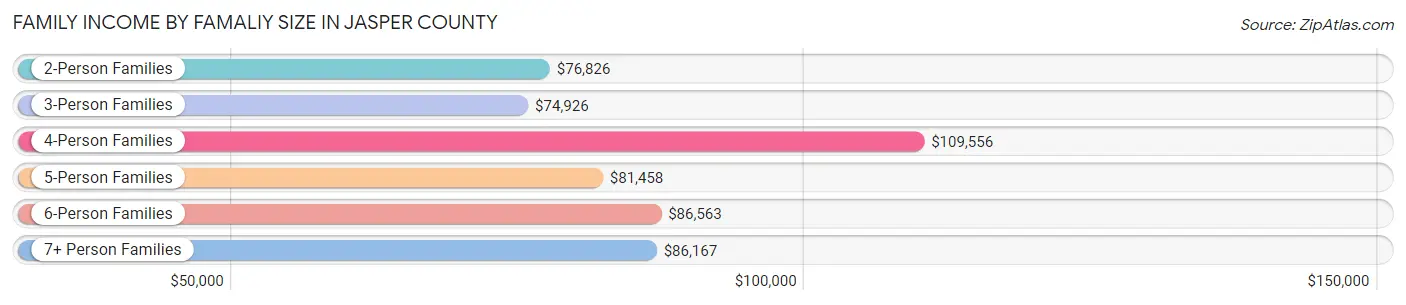
| Income Bracket | # Families | Median Income |
| 2-Person Families | 5,264 (53.6%) | $76,826 |
| 3-Person Families | 1,717 (17.5%) | $74,926 |
| 4-Person Families | 1,681 (17.1%) | $109,556 |
| 5-Person Families | 776 (7.9%) | $81,458 |
| 6-Person Families | 291 (3.0%) | $86,563 |
| 7+ Person Families | 96 (1.0%) | $86,167 |
| Total | 9,825 (100.0%) | $81,606 |
Family Income by Number of Earners in Jasper County
The median family income in Jasper County is $81,606, with families comprising 3+ earners (979) having the highest median family income of $123,580, while families with no earners (1,498) have the lowest median family income of $50,410, accounting for 10.0% and 15.2% of families, respectively.
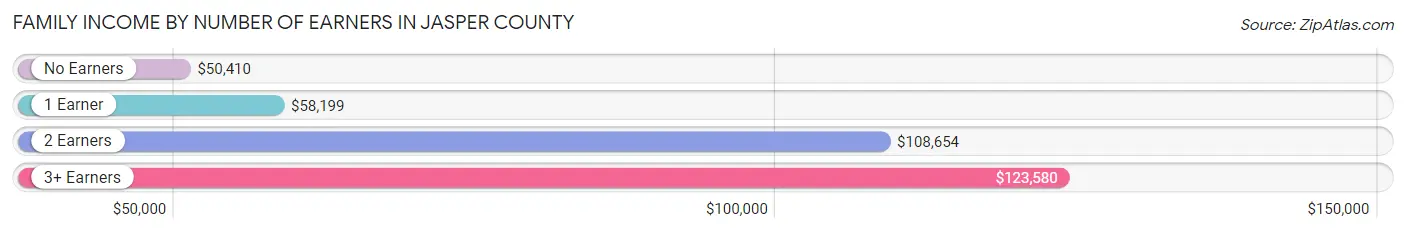
| Number of Earners | # Families | Median Income |
| No Earners | 1,498 (15.2%) | $50,410 |
| 1 Earner | 2,858 (29.1%) | $58,199 |
| 2 Earners | 4,490 (45.7%) | $108,654 |
| 3+ Earners | 979 (10.0%) | $123,580 |
| Total | 9,825 (100.0%) | $81,606 |
Household Income in Jasper County
Household Income Brackets in Jasper County
With 2,985 households falling in the category, the $50,000 to $74,999 income range is the most frequent in Jasper County, accounting for 20.4% of all households. In contrast, only 439 households (3.0%) fall into the $10,000 to $14,999 income bracket, making it the least populous group.
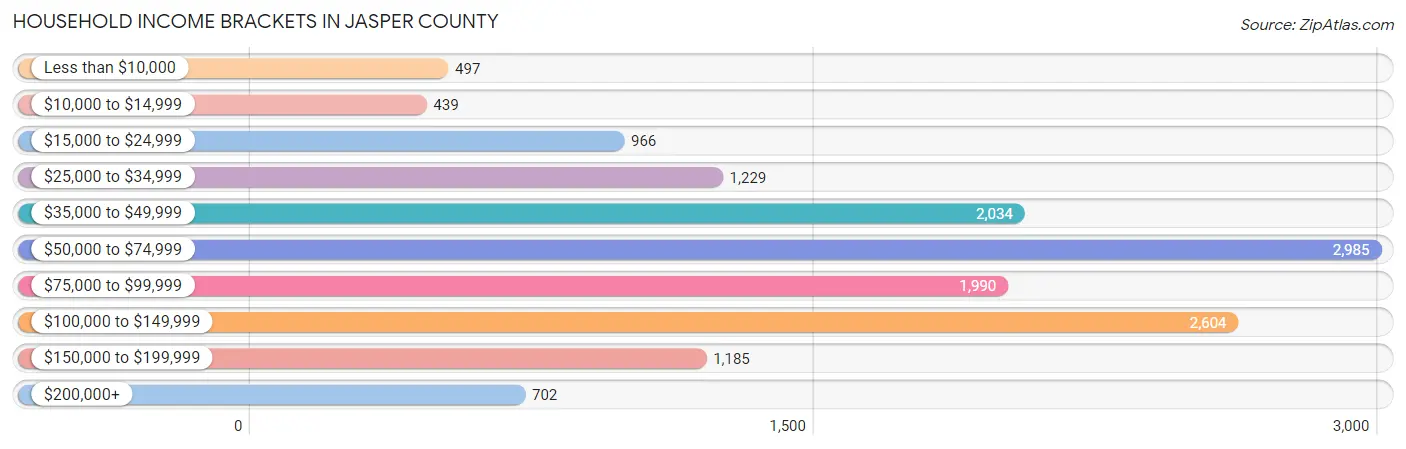
| Income Bracket | # Households | % Households |
| Less than $10,000 | 497 | 3.4% |
| $10,000 to $14,999 | 439 | 3.0% |
| $15,000 to $24,999 | 966 | 6.6% |
| $25,000 to $34,999 | 1,229 | 8.4% |
| $35,000 to $49,999 | 2,034 | 13.9% |
| $50,000 to $74,999 | 2,985 | 20.4% |
| $75,000 to $99,999 | 1,990 | 13.6% |
| $100,000 to $149,999 | 2,604 | 17.8% |
| $150,000 to $199,999 | 1,185 | 8.1% |
| $200,000+ | 702 | 4.8% |
Household Income by Householder Age in Jasper County
The median household income in Jasper County is $67,784, with the highest median household income of $80,263 found in the 25 to 44 years age bracket for the primary householder. A total of 4,186 households (28.6%) fall into this category. Meanwhile, the 15 to 24 years age bracket for the primary householder has the lowest median household income of $46,205, with 610 households (4.2%) in this group.
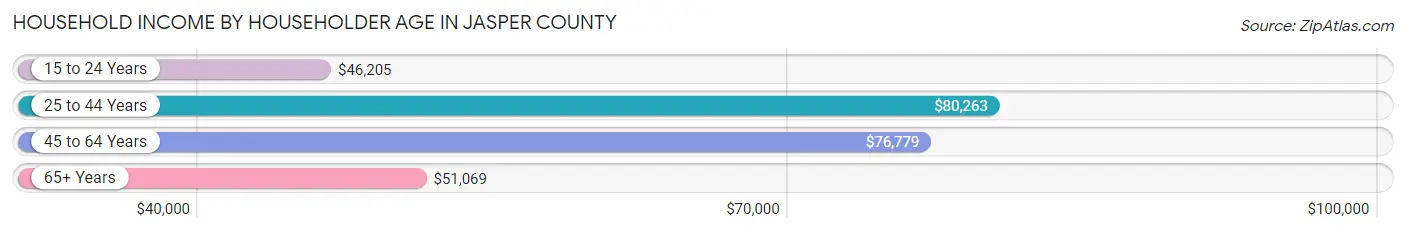
| Income Bracket | # Households | Median Income |
| 15 to 24 Years | 610 (4.2%) | $46,205 |
| 25 to 44 Years | 4,186 (28.6%) | $80,263 |
| 45 to 64 Years | 5,229 (35.7%) | $76,779 |
| 65+ Years | 4,605 (31.5%) | $51,069 |
| Total | 14,630 (100.0%) | $67,784 |
Poverty in Jasper County
Income Below Poverty by Sex and Age in Jasper County
With 8.8% poverty level for males and 8.8% for females among the residents of Jasper County, 5 year old males and 18 to 24 year old females are the most vulnerable to poverty, with 79 males (25.5%) and 232 females (19.0%) in their respective age groups living below the poverty level.
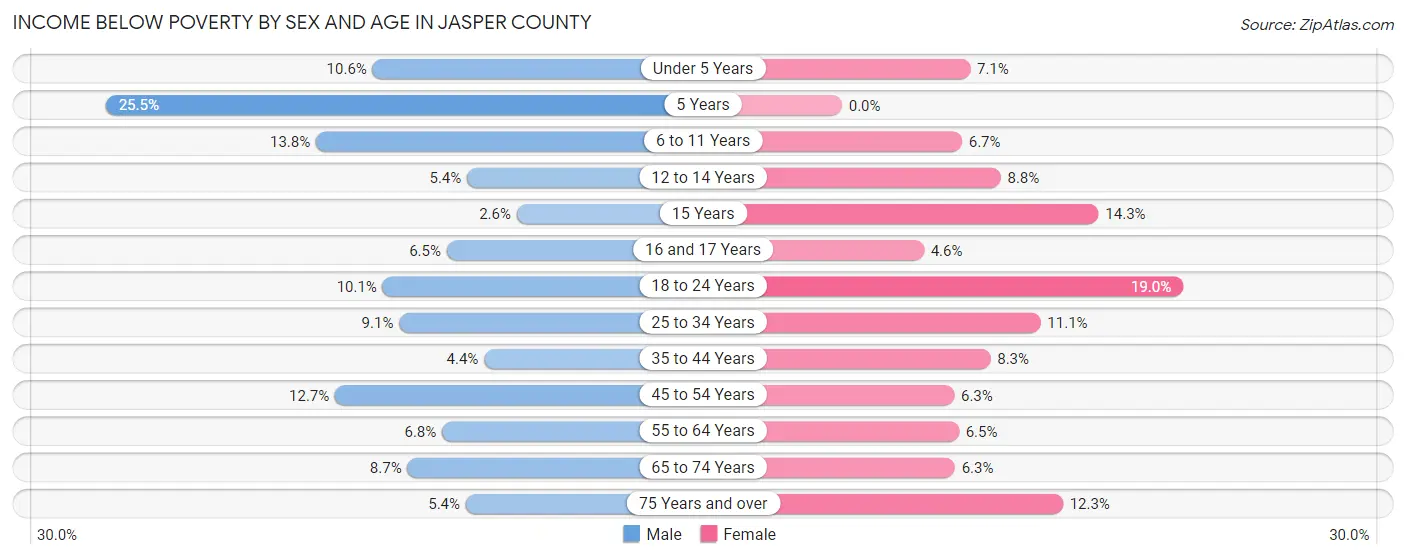
| Age Bracket | Male | Female |
| Under 5 Years | 114 (10.6%) | 66 (7.1%) |
| 5 Years | 79 (25.5%) | 0 (0.0%) |
| 6 to 11 Years | 208 (13.8%) | 89 (6.7%) |
| 12 to 14 Years | 35 (5.4%) | 66 (8.8%) |
| 15 Years | 6 (2.6%) | 45 (14.3%) |
| 16 and 17 Years | 34 (6.5%) | 20 (4.6%) |
| 18 to 24 Years | 141 (10.1%) | 232 (19.0%) |
| 25 to 34 Years | 202 (9.1%) | 228 (11.1%) |
| 35 to 44 Years | 107 (4.4%) | 180 (8.3%) |
| 45 to 54 Years | 290 (12.7%) | 132 (6.2%) |
| 55 to 64 Years | 171 (6.8%) | 166 (6.5%) |
| 65 to 74 Years | 163 (8.7%) | 123 (6.3%) |
| 75 Years and over | 72 (5.4%) | 214 (12.3%) |
| Total | 1,622 (8.8%) | 1,561 (8.8%) |
Income Above Poverty by Sex and Age in Jasper County
According to the poverty statistics in Jasper County, males aged 15 years and females aged 5 years are the age groups that are most secure financially, with 97.4% of males and 100.0% of females in these age groups living above the poverty line.
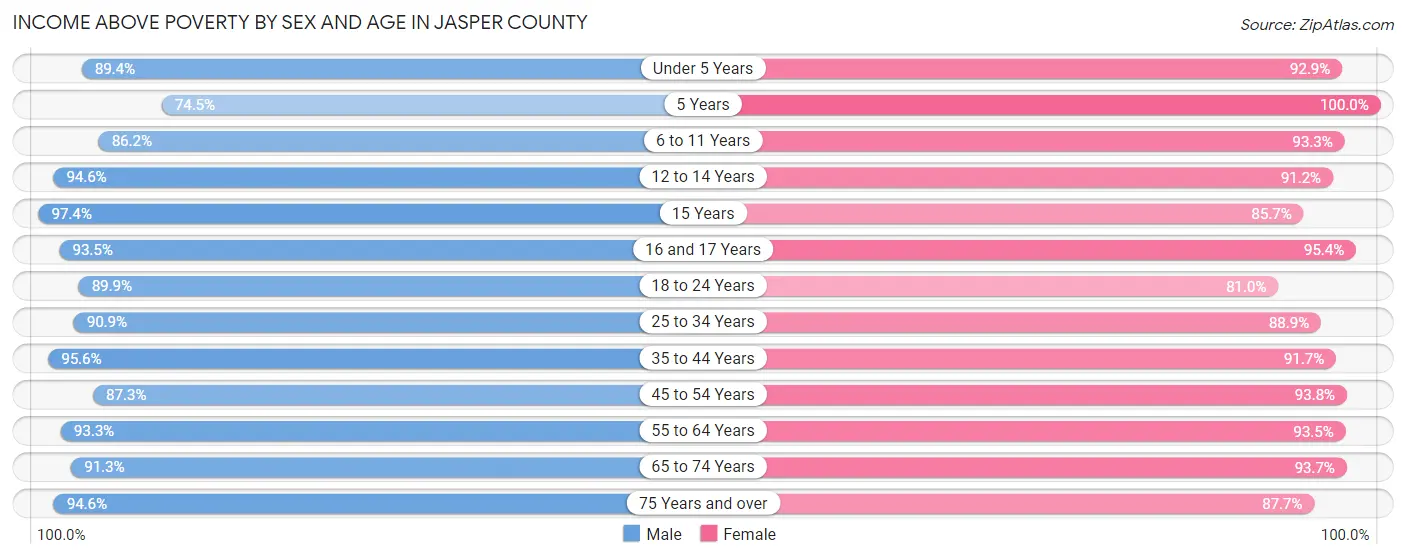
| Age Bracket | Male | Female |
| Under 5 Years | 959 (89.4%) | 859 (92.9%) |
| 5 Years | 231 (74.5%) | 161 (100.0%) |
| 6 to 11 Years | 1,303 (86.2%) | 1,244 (93.3%) |
| 12 to 14 Years | 618 (94.6%) | 681 (91.2%) |
| 15 Years | 226 (97.4%) | 270 (85.7%) |
| 16 and 17 Years | 490 (93.5%) | 419 (95.4%) |
| 18 to 24 Years | 1,261 (89.9%) | 989 (81.0%) |
| 25 to 34 Years | 2,008 (90.9%) | 1,834 (88.9%) |
| 35 to 44 Years | 2,322 (95.6%) | 1,997 (91.7%) |
| 45 to 54 Years | 1,992 (87.3%) | 1,979 (93.8%) |
| 55 to 64 Years | 2,361 (93.2%) | 2,384 (93.5%) |
| 65 to 74 Years | 1,714 (91.3%) | 1,831 (93.7%) |
| 75 Years and over | 1,253 (94.6%) | 1,526 (87.7%) |
| Total | 16,738 (91.2%) | 16,174 (91.2%) |
Income Below Poverty Among Married-Couple Families in Jasper County
The poverty statistics for married-couple families in Jasper County show that 3.7% or 287 of the total 7,761 families live below the poverty line. Families with 3 or 4 children have the highest poverty rate of 13.3%, comprising of 92 families. On the other hand, families with 5 or more children have the lowest poverty rate of 0.0%, which includes 0 families.
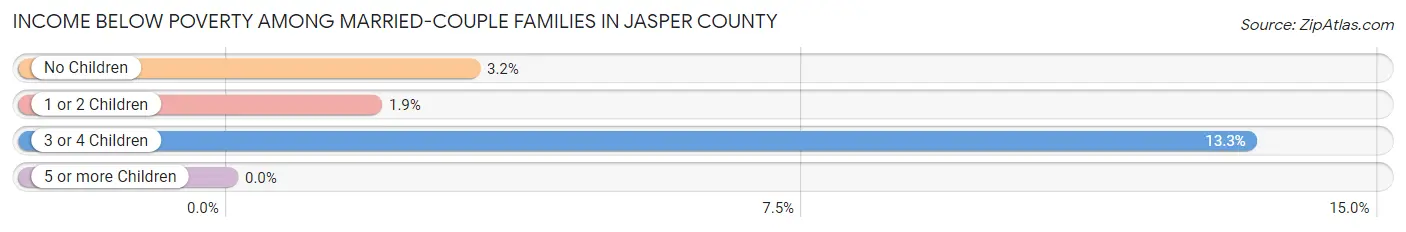
| Children | Above Poverty | Below Poverty |
| No Children | 4,774 (96.8%) | 156 (3.2%) |
| 1 or 2 Children | 2,041 (98.1%) | 39 (1.9%) |
| 3 or 4 Children | 599 (86.7%) | 92 (13.3%) |
| 5 or more Children | 60 (100.0%) | 0 (0.0%) |
| Total | 7,474 (96.3%) | 287 (3.7%) |
Income Below Poverty Among Single-Parent Households in Jasper County
According to the poverty data in Jasper County, 0.6% or 4 single-father households and 16.3% or 226 single-mother households are living below the poverty line. Among single-father households, those with 1 or 2 children have the highest poverty rate, with 4 households (0.9%) experiencing poverty. Likewise, among single-mother households, those with 5 or more children have the highest poverty rate, with 11 households (100.0%) falling below the poverty line.
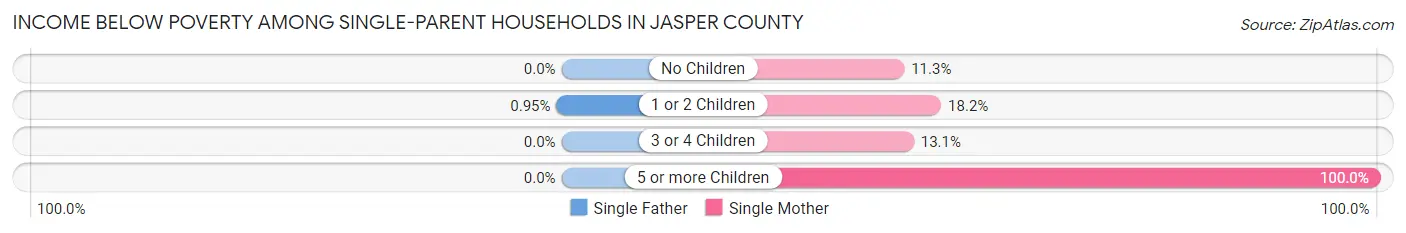
| Children | Single Father | Single Mother |
| No Children | 0 (0.0%) | 38 (11.3%) |
| 1 or 2 Children | 4 (0.9%) | 148 (18.2%) |
| 3 or 4 Children | 0 (0.0%) | 29 (13.1%) |
| 5 or more Children | 0 (0.0%) | 11 (100.0%) |
| Total | 4 (0.6%) | 226 (16.3%) |
Income Below Poverty Among Married-Couple vs Single-Parent Households in Jasper County
The poverty data for Jasper County shows that 287 of the married-couple family households (3.7%) and 230 of the single-parent households (11.1%) are living below the poverty level. Within the married-couple family households, those with 3 or 4 children have the highest poverty rate, with 92 households (13.3%) falling below the poverty line. Among the single-parent households, those with 5 or more children have the highest poverty rate, with 11 household (100.0%) living below poverty.
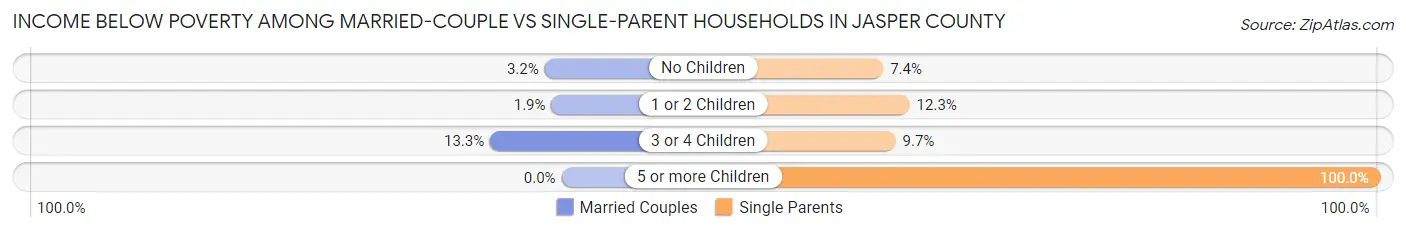
| Children | Married-Couple Families | Single-Parent Households |
| No Children | 156 (3.2%) | 38 (7.4%) |
| 1 or 2 Children | 39 (1.9%) | 152 (12.3%) |
| 3 or 4 Children | 92 (13.3%) | 29 (9.7%) |
| 5 or more Children | 0 (0.0%) | 11 (100.0%) |
| Total | 287 (3.7%) | 230 (11.1%) |
Race in Jasper County
The most populous races in Jasper County are White / Caucasian (35,470 | 93.8%), Two or more Races (1,065 | 2.8%), and Hispanic or Latino (1,054 | 2.8%).
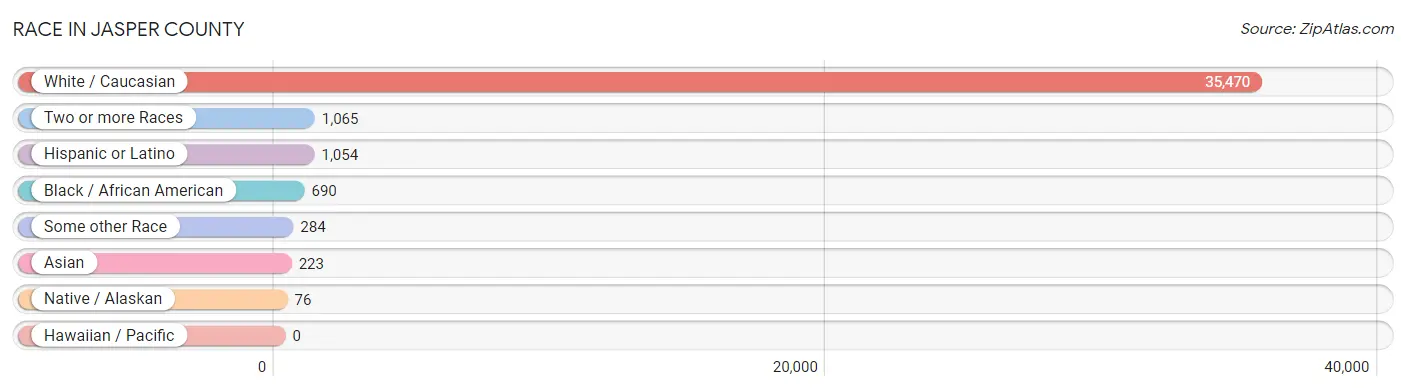
| Race | # Population | % Population |
| Asian | 223 | 0.6% |
| Black / African American | 690 | 1.8% |
| Hawaiian / Pacific | 0 | 0.0% |
| Hispanic or Latino | 1,054 | 2.8% |
| Native / Alaskan | 76 | 0.2% |
| White / Caucasian | 35,470 | 93.8% |
| Two or more Races | 1,065 | 2.8% |
| Some other Race | 284 | 0.7% |
| Total | 37,808 | 100.0% |
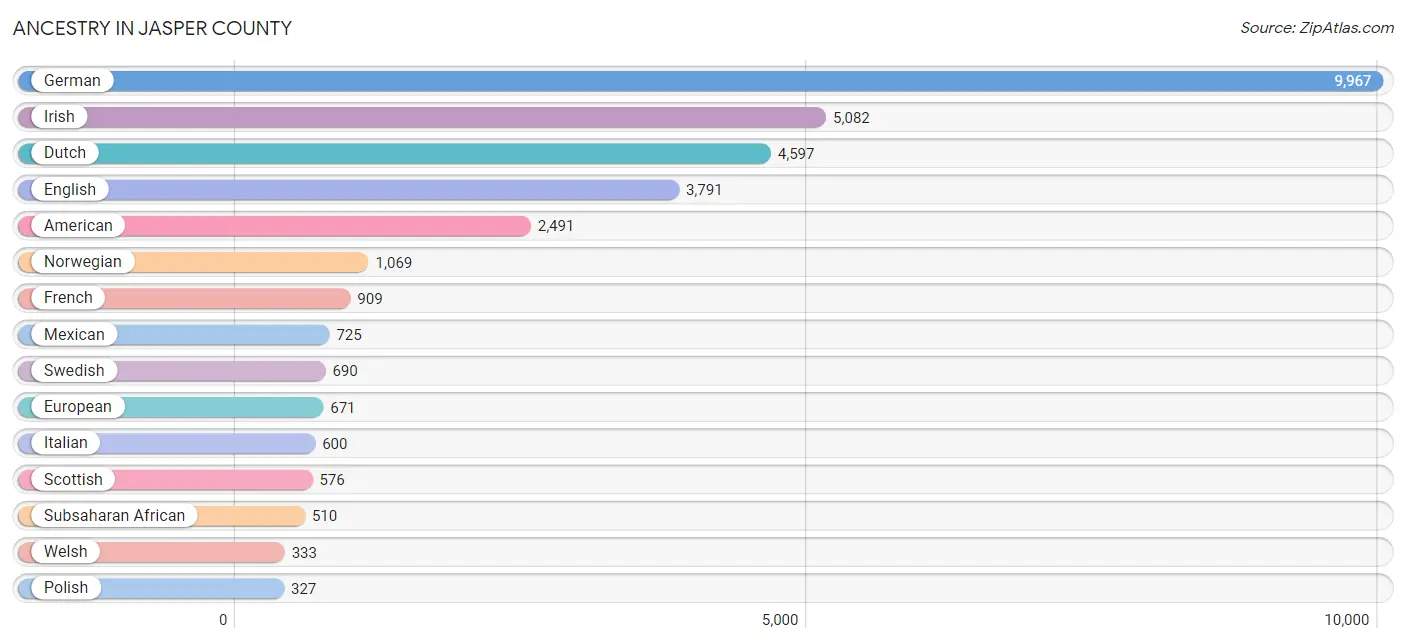
Ancestry in Jasper County
The most populous ancestries reported in Jasper County are German (9,967 | 26.4%), Irish (5,082 | 13.4%), Dutch (4,597 | 12.2%), English (3,791 | 10.0%), and American (2,491 | 6.6%), together accounting for 68.6% of all Jasper County residents.
| Ancestry | # Population | % Population |
| African | 223 | 0.6% |
| Albanian | 7 | 0.0% |
| American | 2,491 | 6.6% |
| Australian | 3 | 0.0% |
| Bangladeshi | 7 | 0.0% |
| Belgian | 20 | 0.1% |
| Bhutanese | 47 | 0.1% |
| British | 140 | 0.4% |
| Bulgarian | 10 | 0.0% |
| Burmese | 2 | 0.0% |
| Canadian | 11 | 0.0% |
| Cape Verdean | 1 | 0.0% |
| Celtic | 25 | 0.1% |
| Central American Indian | 17 | 0.0% |
| Cherokee | 54 | 0.1% |
| Chippewa | 33 | 0.1% |
| Choctaw | 4 | 0.0% |
| Croatian | 28 | 0.1% |
| Czech | 287 | 0.8% |
| Czechoslovakian | 64 | 0.2% |
| Danish | 212 | 0.6% |
| Dutch | 4,597 | 12.2% |
| Eastern European | 60 | 0.2% |
| English | 3,791 | 10.0% |
| Ethiopian | 18 | 0.1% |
| European | 671 | 1.8% |
| Finnish | 16 | 0.0% |
| French | 909 | 2.4% |
| French Canadian | 18 | 0.1% |
| German | 9,967 | 26.4% |
| Ghanaian | 24 | 0.1% |
| Greek | 10 | 0.0% |
| Hungarian | 16 | 0.0% |
| Indian (Asian) | 154 | 0.4% |
| Indonesian | 1 | 0.0% |
| Iranian | 4 | 0.0% |
| Irish | 5,082 | 13.4% |
| Italian | 600 | 1.6% |
| Jamaican | 11 | 0.0% |
| Korean | 120 | 0.3% |
| Lithuanian | 23 | 0.1% |
| Malaysian | 16 | 0.0% |
| Maltese | 6 | 0.0% |
| Mexican | 725 | 1.9% |
| Native Hawaiian | 98 | 0.3% |
| Navajo | 3 | 0.0% |
| Northern European | 20 | 0.1% |
| Norwegian | 1,069 | 2.8% |
| Pennsylvania German | 6 | 0.0% |
| Peruvian | 9 | 0.0% |
| Polish | 327 | 0.9% |
| Portuguese | 7 | 0.0% |
| Puerto Rican | 167 | 0.4% |
| Romanian | 5 | 0.0% |
| Russian | 31 | 0.1% |
| Scandinavian | 242 | 0.6% |
| Scotch-Irish | 198 | 0.5% |
| Scottish | 576 | 1.5% |
| Sioux | 13 | 0.0% |
| Slavic | 1 | 0.0% |
| Slovak | 22 | 0.1% |
| Slovene | 3 | 0.0% |
| Somali | 4 | 0.0% |
| South American | 9 | 0.0% |
| Spaniard | 1 | 0.0% |
| Spanish | 56 | 0.2% |
| Sri Lankan | 54 | 0.1% |
| Subsaharan African | 510 | 1.3% |
| Sudanese | 264 | 0.7% |
| Swedish | 690 | 1.8% |
| Swiss | 136 | 0.4% |
| Thai | 20 | 0.1% |
| Trinidadian and Tobagonian | 5 | 0.0% |
| Ukrainian | 34 | 0.1% |
| Vietnamese | 15 | 0.0% |
| Welsh | 333 | 0.9% |
| Yugoslavian | 13 | 0.0% |
| Yup'ik | 5 | 0.0% | View All 78 Rows |
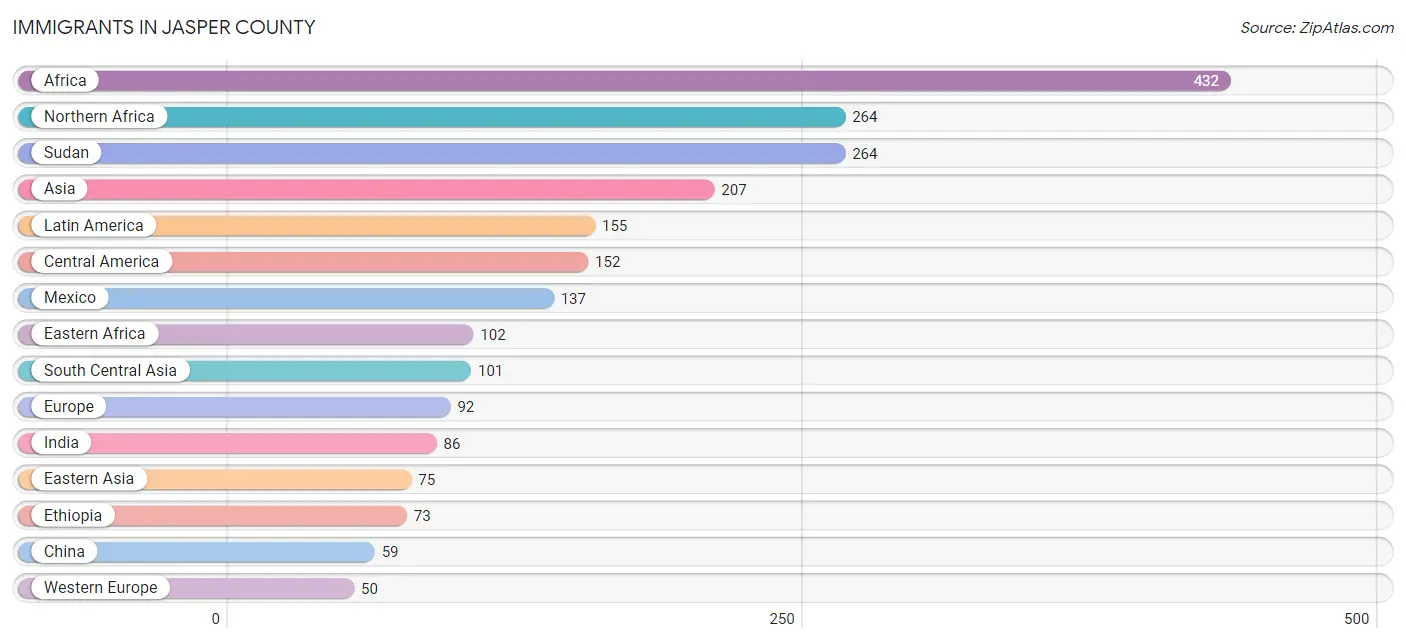
Immigrants in Jasper County
The most numerous immigrant groups reported in Jasper County came from Africa (432 | 1.1%), Northern Africa (264 | 0.7%), Sudan (264 | 0.7%), Asia (207 | 0.5%), and Latin America (155 | 0.4%), together accounting for 3.5% of all Jasper County residents.
| Immigration Origin | # Population | % Population |
| Africa | 432 | 1.1% |
| Asia | 207 | 0.5% |
| Bangladesh | 15 | 0.0% |
| Bosnia and Herzegovina | 9 | 0.0% |
| Canada | 3 | 0.0% |
| Caribbean | 3 | 0.0% |
| Central America | 152 | 0.4% |
| China | 59 | 0.2% |
| Czechoslovakia | 3 | 0.0% |
| Eastern Africa | 102 | 0.3% |
| Eastern Asia | 75 | 0.2% |
| Eastern Europe | 27 | 0.1% |
| England | 13 | 0.0% |
| Ethiopia | 73 | 0.2% |
| Europe | 92 | 0.2% |
| France | 7 | 0.0% |
| Germany | 38 | 0.1% |
| Ghana | 24 | 0.1% |
| Honduras | 12 | 0.0% |
| India | 86 | 0.2% |
| Japan | 15 | 0.0% |
| Korea | 1 | 0.0% |
| Laos | 4 | 0.0% |
| Latin America | 155 | 0.4% |
| Liberia | 2 | 0.0% |
| Mexico | 137 | 0.4% |
| Netherlands | 5 | 0.0% |
| Northern Africa | 264 | 0.7% |
| Northern Europe | 13 | 0.0% |
| Panama | 3 | 0.0% |
| Philippines | 15 | 0.0% |
| Poland | 3 | 0.0% |
| South Central Asia | 101 | 0.3% |
| South Eastern Asia | 31 | 0.1% |
| Southern Europe | 2 | 0.0% |
| Sudan | 264 | 0.7% |
| Thailand | 1 | 0.0% |
| Trinidad and Tobago | 3 | 0.0% |
| Ukraine | 5 | 0.0% |
| Vietnam | 11 | 0.0% |
| Western Africa | 26 | 0.1% |
| Western Europe | 50 | 0.1% | View All 42 Rows |
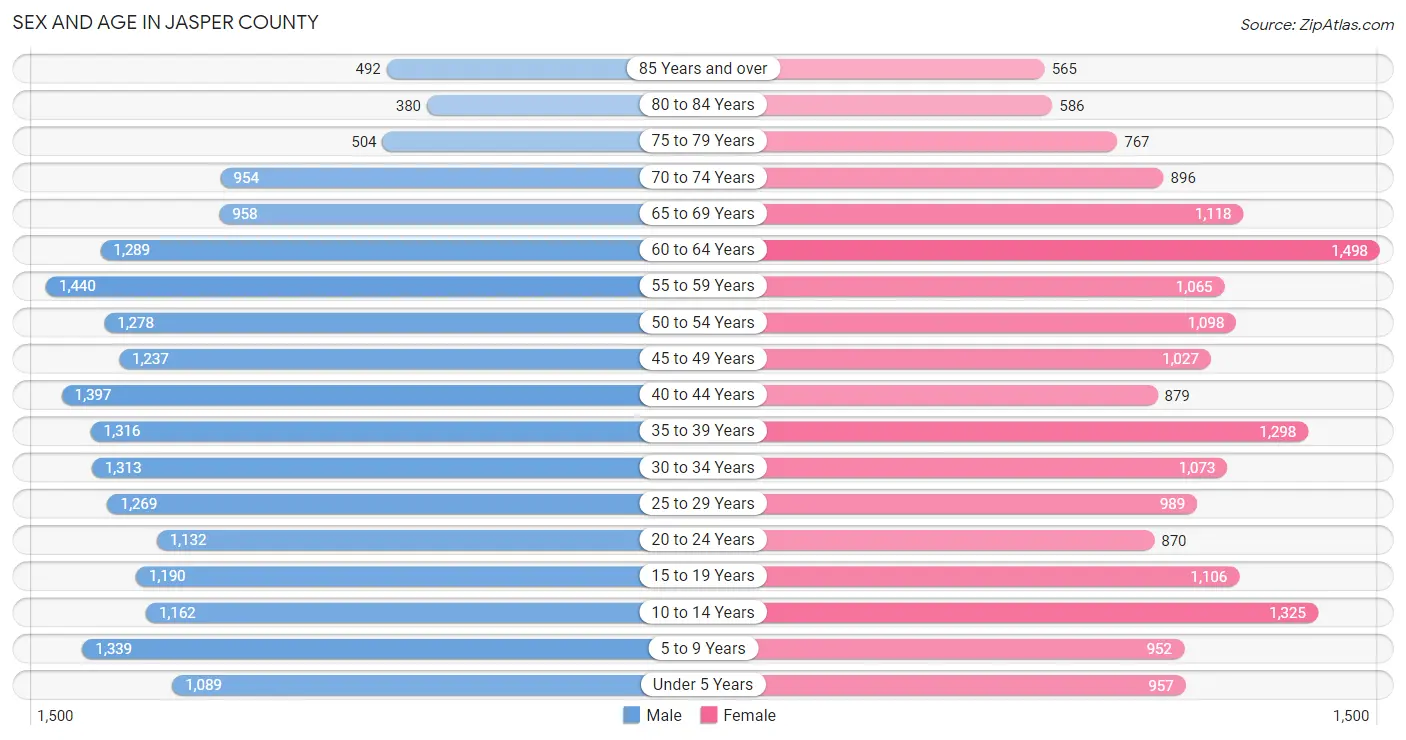
Sex and Age in Jasper County
Sex and Age in Jasper County
The most populous age groups in Jasper County are 55 to 59 Years (1,440 | 7.3%) for men and 60 to 64 Years (1,498 | 8.3%) for women.
| Age Bracket | Male | Female |
| Under 5 Years | 1,089 (5.5%) | 957 (5.3%) |
| 5 to 9 Years | 1,339 (6.8%) | 952 (5.3%) |
| 10 to 14 Years | 1,162 (5.9%) | 1,325 (7.3%) |
| 15 to 19 Years | 1,190 (6.0%) | 1,106 (6.1%) |
| 20 to 24 Years | 1,132 (5.7%) | 870 (4.8%) |
| 25 to 29 Years | 1,269 (6.4%) | 989 (5.5%) |
| 30 to 34 Years | 1,313 (6.7%) | 1,073 (5.9%) |
| 35 to 39 Years | 1,316 (6.7%) | 1,298 (7.2%) |
| 40 to 44 Years | 1,397 (7.1%) | 879 (4.9%) |
| 45 to 49 Years | 1,237 (6.3%) | 1,027 (5.7%) |
| 50 to 54 Years | 1,278 (6.5%) | 1,098 (6.1%) |
| 55 to 59 Years | 1,440 (7.3%) | 1,065 (5.9%) |
| 60 to 64 Years | 1,289 (6.5%) | 1,498 (8.3%) |
| 65 to 69 Years | 958 (4.9%) | 1,118 (6.2%) |
| 70 to 74 Years | 954 (4.8%) | 896 (5.0%) |
| 75 to 79 Years | 504 (2.5%) | 767 (4.2%) |
| 80 to 84 Years | 380 (1.9%) | 586 (3.2%) |
| 85 Years and over | 492 (2.5%) | 565 (3.1%) |
| Total | 19,739 (100.0%) | 18,069 (100.0%) |
Families and Households in Jasper County
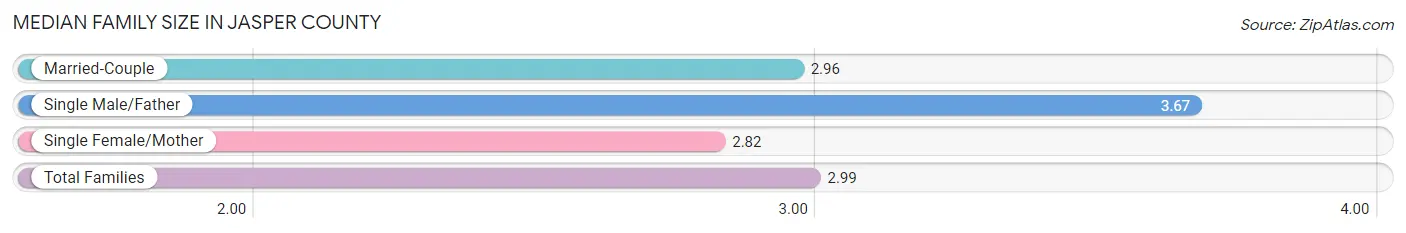
Median Family Size in Jasper County
The median family size in Jasper County is 2.99 persons per family, with single male/father families (679 | 6.9%) accounting for the largest median family size of 3.67 persons per family. On the other hand, single female/mother families (1,385 | 14.1%) represent the smallest median family size with 2.82 persons per family.
| Family Type | # Families | Family Size |
| Married-Couple | 7,761 (79.0%) | 2.96 |
| Single Male/Father | 679 (6.9%) | 3.67 |
| Single Female/Mother | 1,385 (14.1%) | 2.82 |
| Total Families | 9,825 (100.0%) | 2.99 |
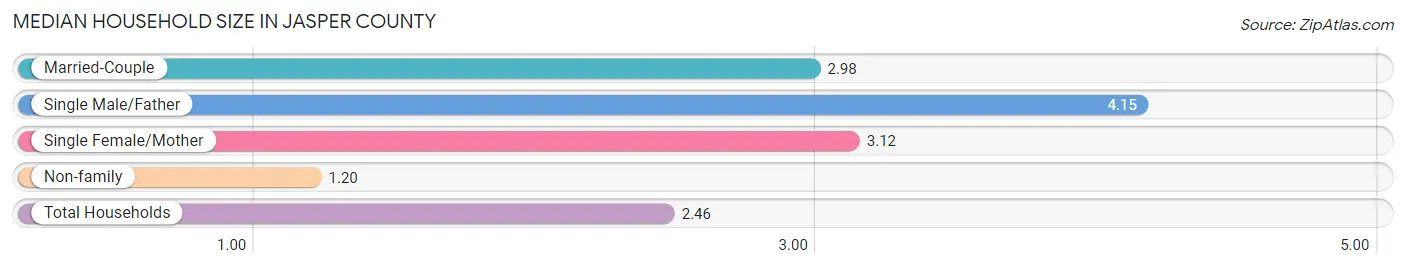
Median Household Size in Jasper County
The median household size in Jasper County is 2.46 persons per household, with single male/father households (679 | 4.6%) accounting for the largest median household size of 4.15 persons per household. non-family households (4,805 | 32.8%) represent the smallest median household size with 1.20 persons per household.
| Household Type | # Households | Household Size |
| Married-Couple | 7,761 (53.0%) | 2.98 |
| Single Male/Father | 679 (4.6%) | 4.15 |
| Single Female/Mother | 1,385 (9.5%) | 3.12 |
| Non-family | 4,805 (32.8%) | 1.20 |
| Total Households | 14,630 (100.0%) | 2.46 |
Household Size by Marriage Status in Jasper County
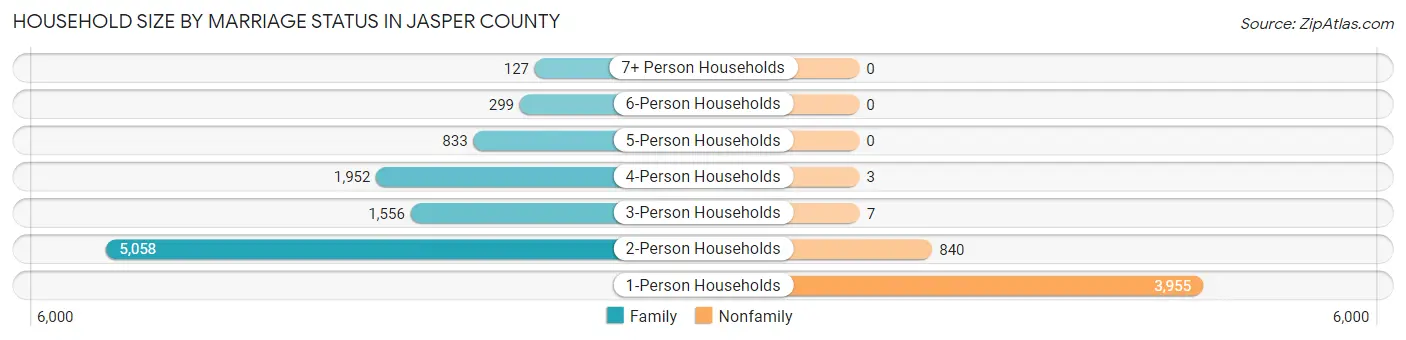
Out of a total of 14,630 households in Jasper County, 9,825 (67.2%) are family households, while 4,805 (32.8%) are nonfamily households. The most numerous type of family households are 2-person households, comprising 5,058, and the most common type of nonfamily households are 1-person households, comprising 3,955.
| Household Size | Family Households | Nonfamily Households |
| 1-Person Households | - | 3,955 (27.0%) |
| 2-Person Households | 5,058 (34.6%) | 840 (5.7%) |
| 3-Person Households | 1,556 (10.6%) | 7 (0.1%) |
| 4-Person Households | 1,952 (13.3%) | 3 (0.0%) |
| 5-Person Households | 833 (5.7%) | 0 (0.0%) |
| 6-Person Households | 299 (2.0%) | 0 (0.0%) |
| 7+ Person Households | 127 (0.9%) | 0 (0.0%) |
| Total | 9,825 (67.2%) | 4,805 (32.8%) |
Female Fertility in Jasper County
Fertility by Age in Jasper County
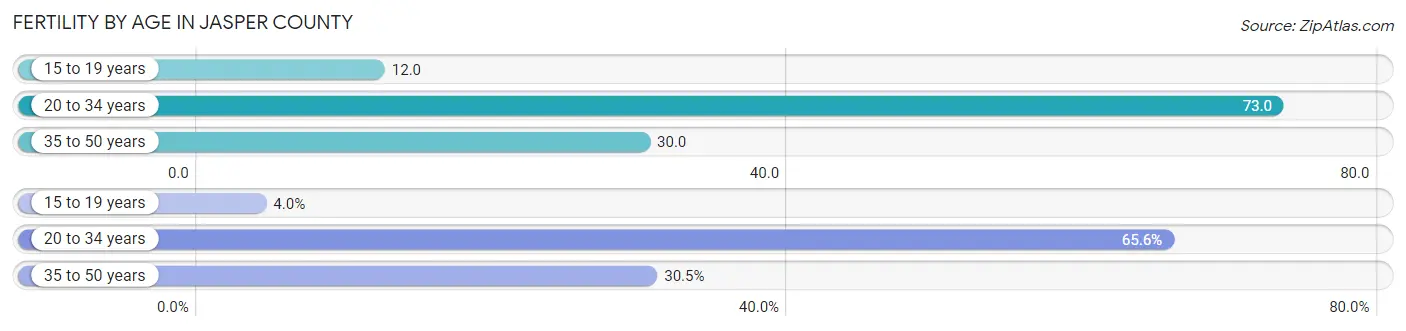
Average fertility rate in Jasper County is 44.0 births per 1,000 women. Women in the age bracket of 20 to 34 years have the highest fertility rate with 73.0 births per 1,000 women. Women in the age bracket of 20 to 34 years acount for 65.5% of all women with births.
| Age Bracket | Women with Births | Births / 1,000 Women |
| 15 to 19 years | 13 (4.0%) | 12.0 |
| 20 to 34 years | 215 (65.5%) | 73.0 |
| 35 to 50 years | 100 (30.5%) | 30.0 |
| Total | 328 (100.0%) | 44.0 |
Fertility by Age by Marriage Status in Jasper County
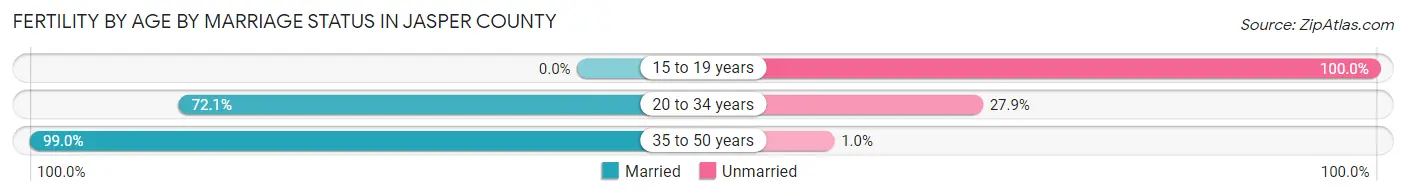
77.4% of women with births (328) in Jasper County are married. The highest percentage of unmarried women with births falls into 15 to 19 years age bracket with 100.0% of them unmarried at the time of birth, while the lowest percentage of unmarried women with births belong to 35 to 50 years age bracket with 1.0% of them unmarried.
| Age Bracket | Married | Unmarried |
| 15 to 19 years | 0 (0.0%) | 13 (100.0%) |
| 20 to 34 years | 155 (72.1%) | 60 (27.9%) |
| 35 to 50 years | 99 (99.0%) | 1 (1.0%) |
| Total | 254 (77.4%) | 74 (22.6%) |
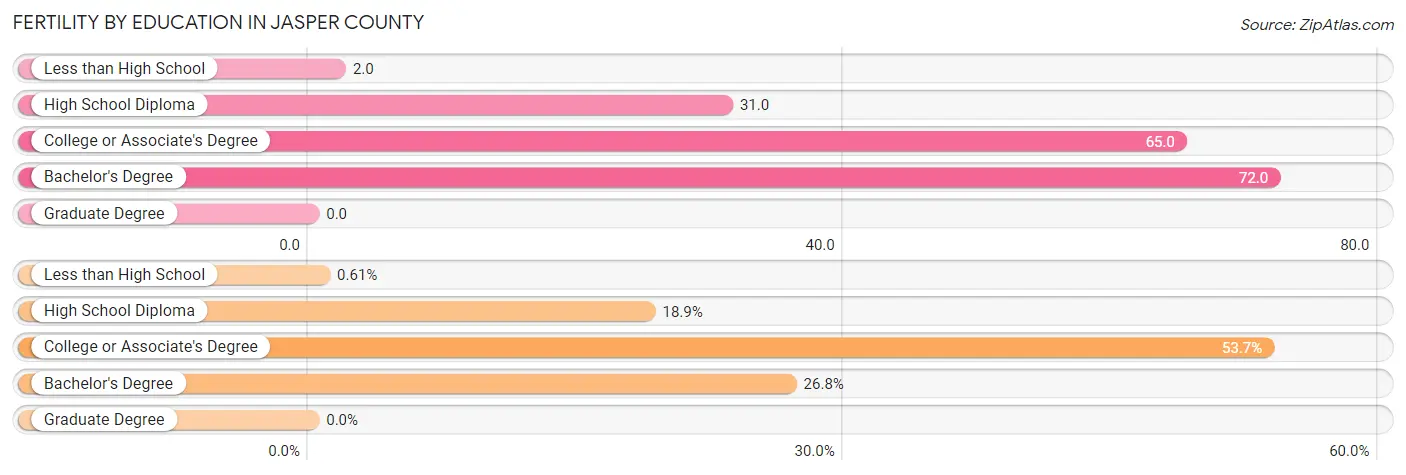
Fertility by Education in Jasper County
| Educational Attainment | Women with Births | Births / 1,000 Women |
| Less than High School | 2 (0.6%) | 2.0 |
| High School Diploma | 62 (18.9%) | 31.0 |
| College or Associate's Degree | 176 (53.7%) | 65.0 |
| Bachelor's Degree | 88 (26.8%) | 72.0 |
| Graduate Degree | 0 (0.0%) | 0.0 |
| Total | 328 (100.0%) | 44.0 |
Fertility by Education by Marriage Status in Jasper County
22.6% of women with births in Jasper County are unmarried. Women with the educational attainment of less than high school are most likely to be married with 100.0% of them married at childbirth, while women with the educational attainment of high school diploma are least likely to be married with 40.3% of them unmarried at childbirth.
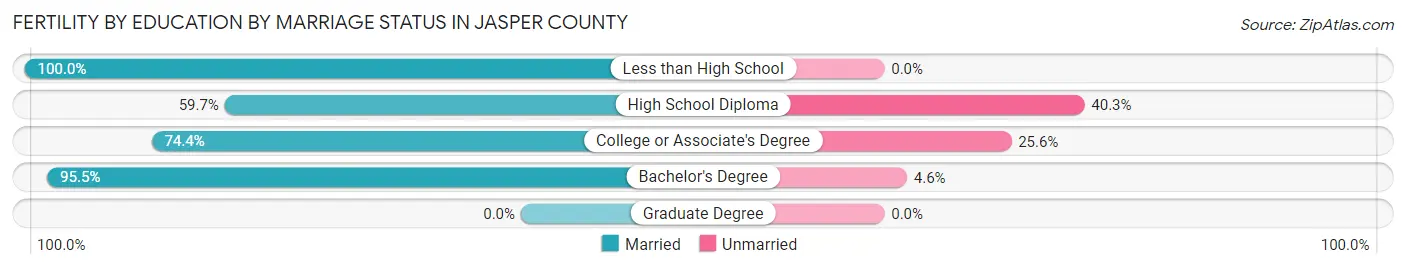
| Educational Attainment | Married | Unmarried |
| Less than High School | 2 (100.0%) | 0 (0.0%) |
| High School Diploma | 37 (59.7%) | 25 (40.3%) |
| College or Associate's Degree | 131 (74.4%) | 45 (25.6%) |
| Bachelor's Degree | 84 (95.5%) | 4 (4.5%) |
| Graduate Degree | 0 (0.0%) | 0 (0.0%) |
| Total | 254 (77.4%) | 74 (22.6%) |
Employment Characteristics in Jasper County
Employment by Class of Employer in Jasper County
Among the 18,050 employed individuals in Jasper County, private company employees (12,134 | 67.2%), not-for-profit organizations (1,349 | 7.5%), and local government employees (1,349 | 7.5%) make up the most common classes of employment.
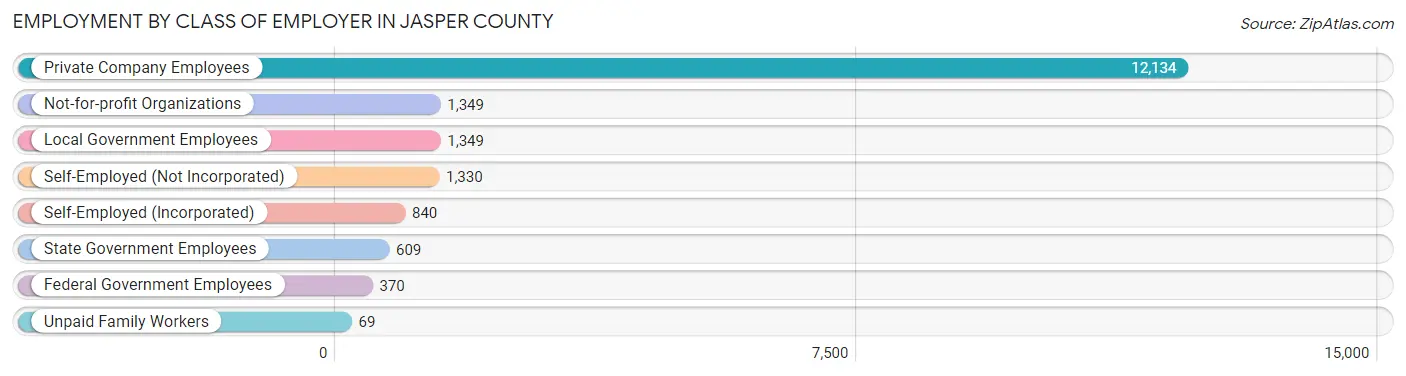
| Employer Class | # Employees | % Employees |
| Private Company Employees | 12,134 | 67.2% |
| Self-Employed (Incorporated) | 840 | 4.6% |
| Self-Employed (Not Incorporated) | 1,330 | 7.4% |
| Not-for-profit Organizations | 1,349 | 7.5% |
| Local Government Employees | 1,349 | 7.5% |
| State Government Employees | 609 | 3.4% |
| Federal Government Employees | 370 | 2.1% |
| Unpaid Family Workers | 69 | 0.4% |
| Total | 18,050 | 100.0% |
Employment Status by Age in Jasper County
According to the labor force statistics for Jasper County, out of the total population over 16 years of age (30,437), 63.2% or 19,236 individuals are in the labor force, with 4.8% or 923 of them unemployed. The age group with the highest labor force participation rate is 35 to 44 years, with 85.2% or 4,166 individuals in the labor force. Within the labor force, the 16 to 19 years age range has the highest percentage of unemployed individuals, with 13.6% or 132 of them being unemployed.
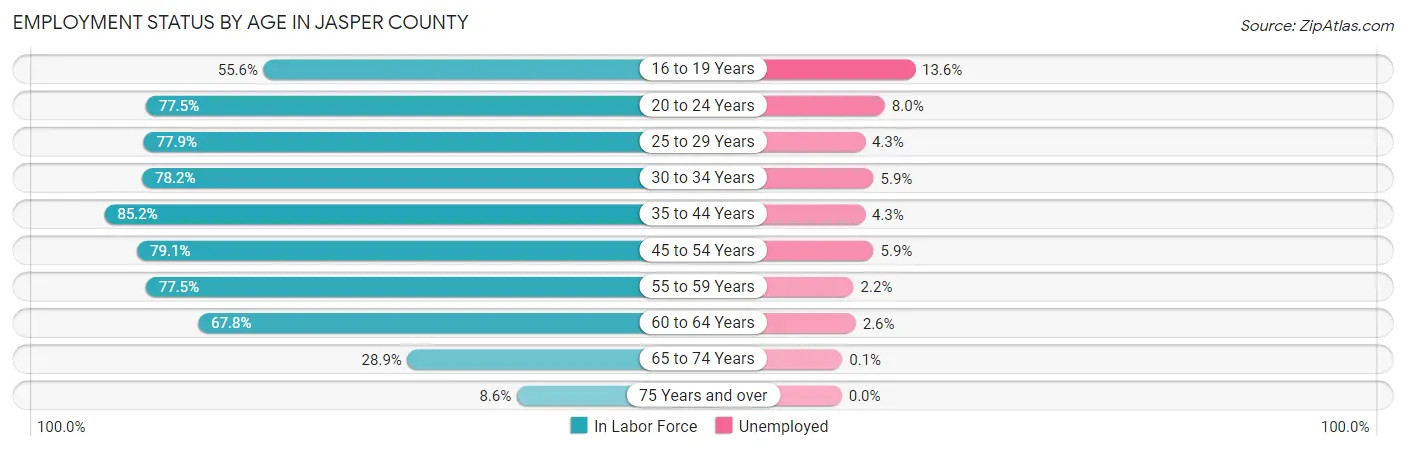
| Age Bracket | In Labor Force | Unemployed |
| 16 to 19 Years | 972 (55.6%) | 132 (13.6%) |
| 20 to 24 Years | 1,552 (77.5%) | 124 (8.0%) |
| 25 to 29 Years | 1,759 (77.9%) | 76 (4.3%) |
| 30 to 34 Years | 1,866 (78.2%) | 110 (5.9%) |
| 35 to 44 Years | 4,166 (85.2%) | 179 (4.3%) |
| 45 to 54 Years | 3,670 (79.1%) | 217 (5.9%) |
| 55 to 59 Years | 1,941 (77.5%) | 43 (2.2%) |
| 60 to 64 Years | 1,890 (67.8%) | 49 (2.6%) |
| 65 to 74 Years | 1,135 (28.9%) | 1 (0.1%) |
| 75 Years and over | 283 (8.6%) | 0 (0.0%) |
| Total | 19,236 (63.2%) | 923 (4.8%) |
Employment Status by Educational Attainment in Jasper County
According to labor force statistics for Jasper County, 78.6% of individuals (15,300) out of the total population between 25 and 64 years of age (19,466) are in the labor force, with 4.4% or 673 of them being unemployed. The group with the highest labor force participation rate are those with the educational attainment of bachelor's degree or higher, with 88.1% or 3,646 individuals in the labor force. Within the labor force, individuals with less than high school education have the highest percentage of unemployment, with 19.2% or 108 of them being unemployed.
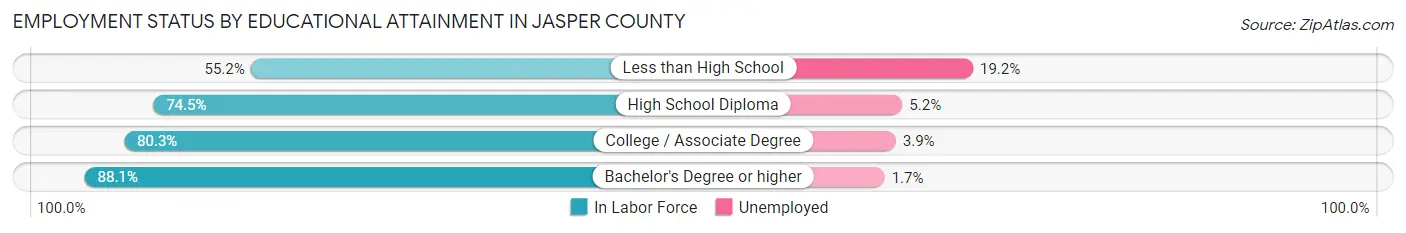
| Educational Attainment | In Labor Force | Unemployed |
| Less than High School | 562 (55.2%) | 195 (19.2%) |
| High School Diploma | 5,307 (74.5%) | 370 (5.2%) |
| College / Associate Degree | 5,770 (80.3%) | 280 (3.9%) |
| Bachelor's Degree or higher | 3,646 (88.1%) | 70 (1.7%) |
| Total | 15,300 (78.6%) | 857 (4.4%) |
Employment Occupations by Sex in Jasper County
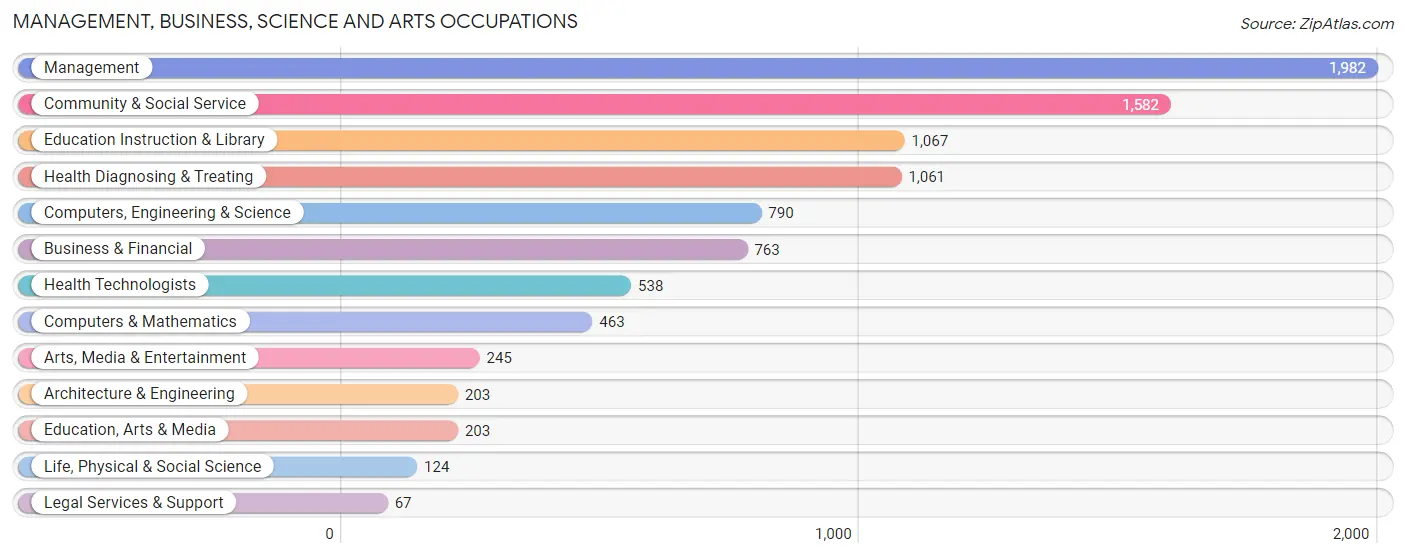
Management, Business, Science and Arts Occupations
The most common Management, Business, Science and Arts occupations in Jasper County are Management (1,982 | 10.9%), Community & Social Service (1,582 | 8.7%), Education Instruction & Library (1,067 | 5.8%), Health Diagnosing & Treating (1,061 | 5.8%), and Computers, Engineering & Science (790 | 4.3%).
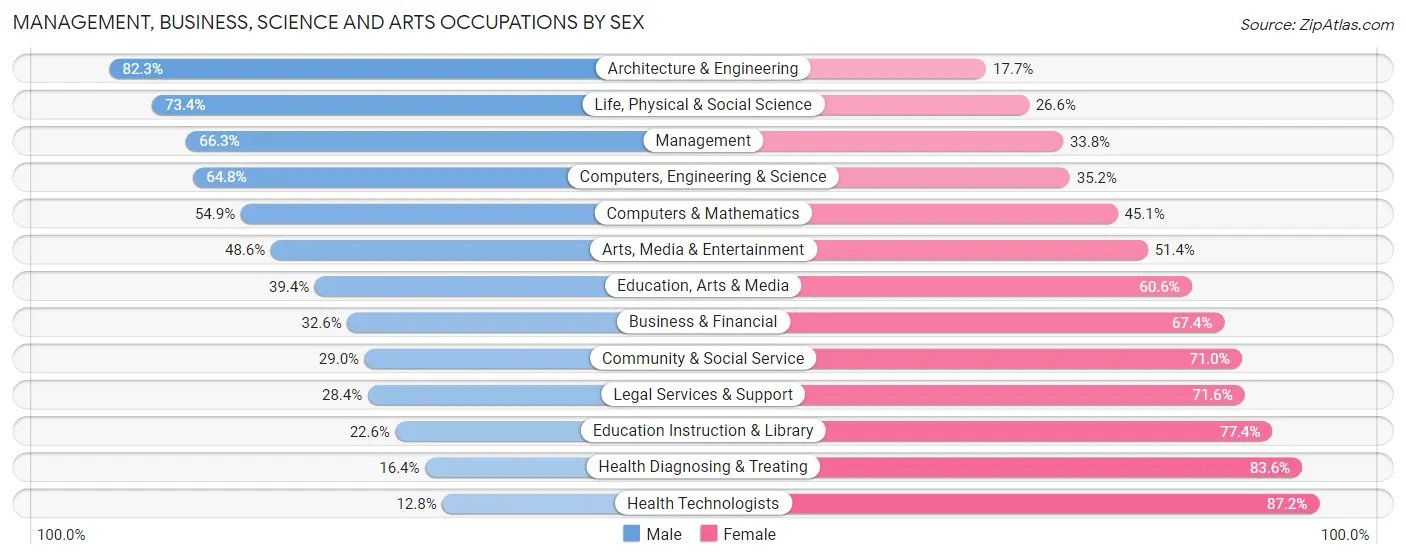
Management, Business, Science and Arts Occupations by Sex
Within the Management, Business, Science and Arts occupations in Jasper County, the most male-oriented occupations are Architecture & Engineering (82.3%), Life, Physical & Social Science (73.4%), and Management (66.2%), while the most female-oriented occupations are Health Technologists (87.2%), Health Diagnosing & Treating (83.6%), and Education Instruction & Library (77.4%).
| Occupation | Male | Female |
| Management | 1,313 (66.2%) | 669 (33.8%) |
| Business & Financial | 249 (32.6%) | 514 (67.4%) |
| Computers, Engineering & Science | 512 (64.8%) | 278 (35.2%) |
| Computers & Mathematics | 254 (54.9%) | 209 (45.1%) |
| Architecture & Engineering | 167 (82.3%) | 36 (17.7%) |
| Life, Physical & Social Science | 91 (73.4%) | 33 (26.6%) |
| Community & Social Service | 459 (29.0%) | 1,123 (71.0%) |
| Education, Arts & Media | 80 (39.4%) | 123 (60.6%) |
| Legal Services & Support | 19 (28.4%) | 48 (71.6%) |
| Education Instruction & Library | 241 (22.6%) | 826 (77.4%) |
| Arts, Media & Entertainment | 119 (48.6%) | 126 (51.4%) |
| Health Diagnosing & Treating | 174 (16.4%) | 887 (83.6%) |
| Health Technologists | 69 (12.8%) | 469 (87.2%) |
| Total (Category) | 2,707 (43.8%) | 3,471 (56.2%) |
| Total (Overall) | 9,847 (53.9%) | 8,409 (46.1%) |
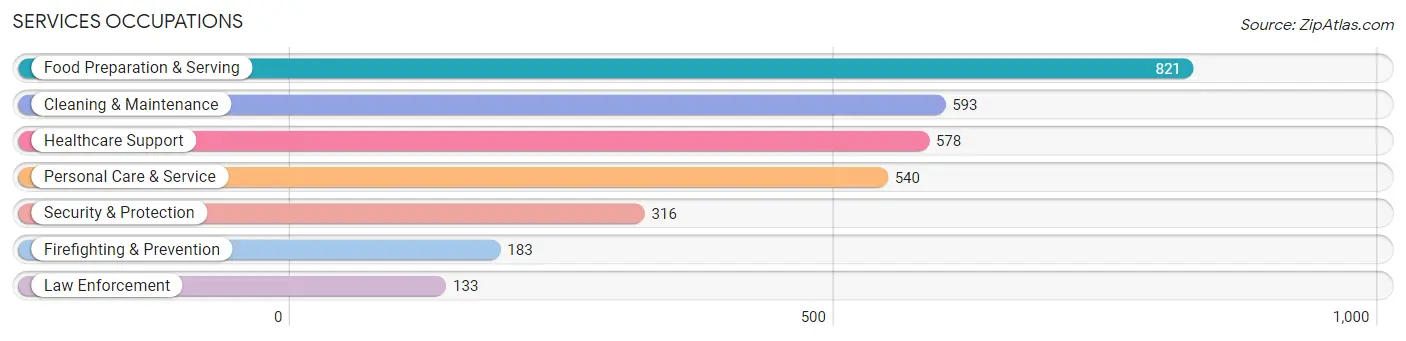
Services Occupations
The most common Services occupations in Jasper County are Food Preparation & Serving (821 | 4.5%), Cleaning & Maintenance (593 | 3.3%), Healthcare Support (578 | 3.2%), Personal Care & Service (540 | 3.0%), and Security & Protection (316 | 1.7%).
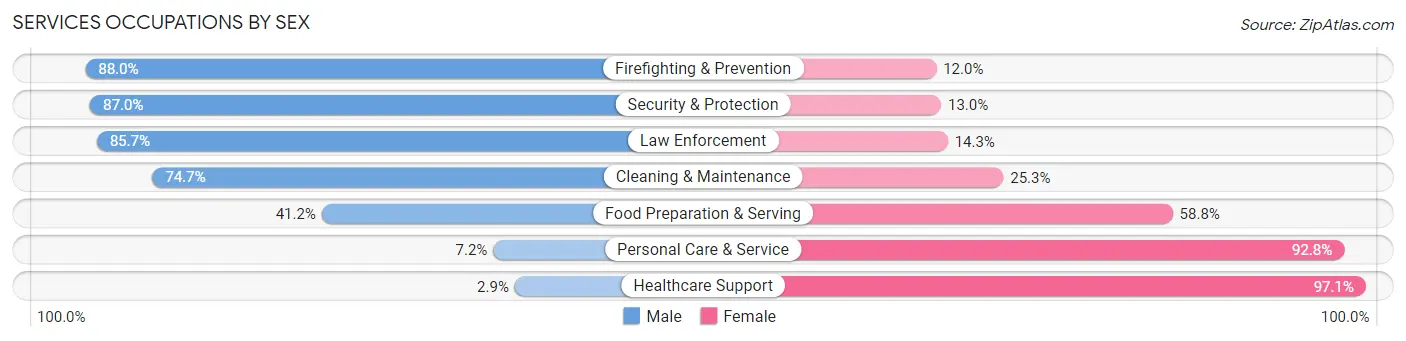
Services Occupations by Sex
Within the Services occupations in Jasper County, the most male-oriented occupations are Firefighting & Prevention (88.0%), Security & Protection (87.0%), and Law Enforcement (85.7%), while the most female-oriented occupations are Healthcare Support (97.1%), Personal Care & Service (92.8%), and Food Preparation & Serving (58.8%).
| Occupation | Male | Female |
| Healthcare Support | 17 (2.9%) | 561 (97.1%) |
| Security & Protection | 275 (87.0%) | 41 (13.0%) |
| Firefighting & Prevention | 161 (88.0%) | 22 (12.0%) |
| Law Enforcement | 114 (85.7%) | 19 (14.3%) |
| Food Preparation & Serving | 338 (41.2%) | 483 (58.8%) |
| Cleaning & Maintenance | 443 (74.7%) | 150 (25.3%) |
| Personal Care & Service | 39 (7.2%) | 501 (92.8%) |
| Total (Category) | 1,112 (39.0%) | 1,736 (61.0%) |
| Total (Overall) | 9,847 (53.9%) | 8,409 (46.1%) |
Sales and Office Occupations
The most common Sales and Office occupations in Jasper County are Office & Administration (1,938 | 10.6%), and Sales & Related (1,705 | 9.3%).
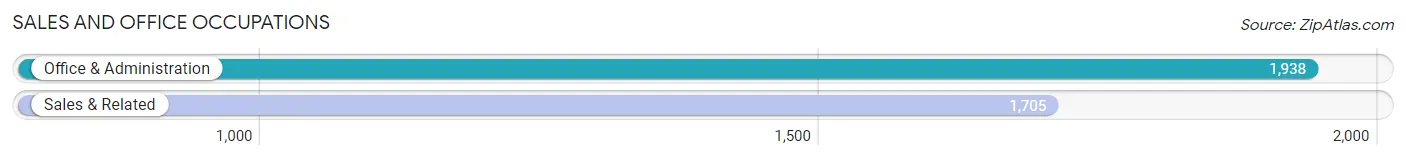
Sales and Office Occupations by Sex
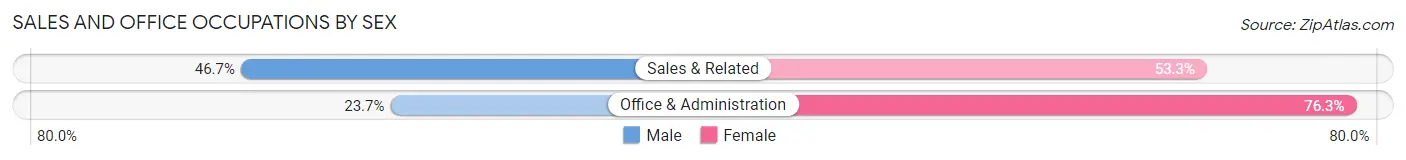
| Occupation | Male | Female |
| Sales & Related | 797 (46.7%) | 908 (53.3%) |
| Office & Administration | 460 (23.7%) | 1,478 (76.3%) |
| Total (Category) | 1,257 (34.5%) | 2,386 (65.5%) |
| Total (Overall) | 9,847 (53.9%) | 8,409 (46.1%) |
Natural Resources, Construction and Maintenance Occupations
The most common Natural Resources, Construction and Maintenance occupations in Jasper County are Construction & Extraction (988 | 5.4%), Installation, Maintenance & Repair (761 | 4.2%), and Farming, Fishing & Forestry (290 | 1.6%).
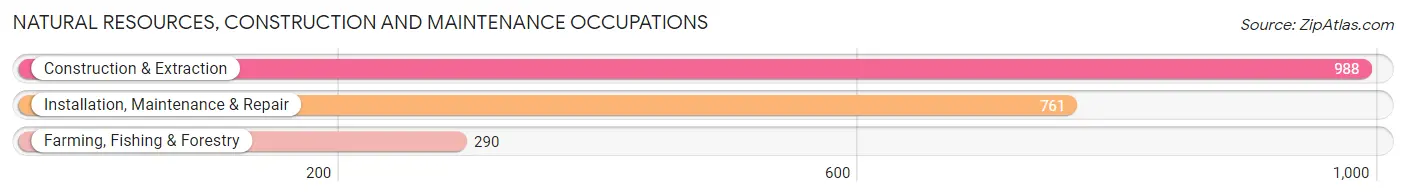
Natural Resources, Construction and Maintenance Occupations by Sex
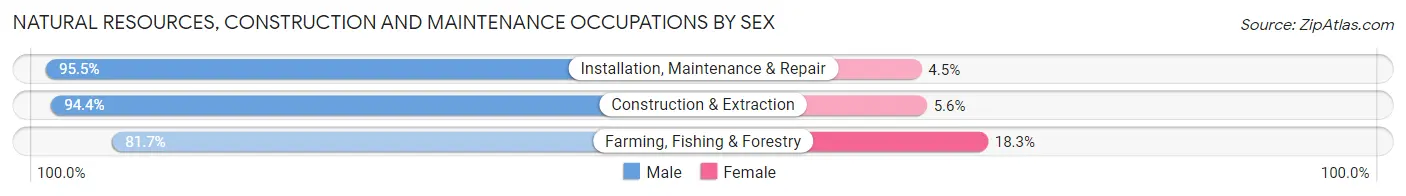
| Occupation | Male | Female |
| Farming, Fishing & Forestry | 237 (81.7%) | 53 (18.3%) |
| Construction & Extraction | 933 (94.4%) | 55 (5.6%) |
| Installation, Maintenance & Repair | 727 (95.5%) | 34 (4.5%) |
| Total (Category) | 1,897 (93.0%) | 142 (7.0%) |
| Total (Overall) | 9,847 (53.9%) | 8,409 (46.1%) |
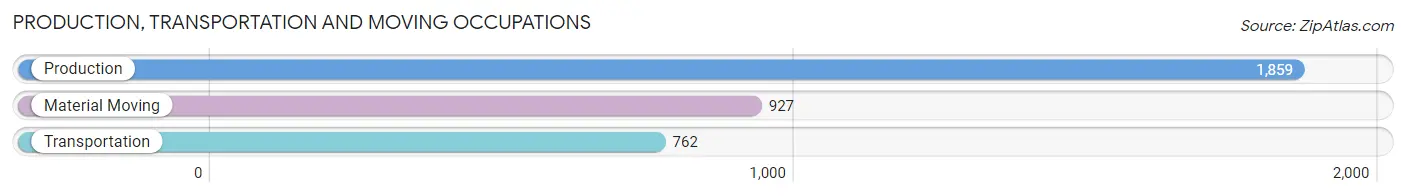
Production, Transportation and Moving Occupations
The most common Production, Transportation and Moving occupations in Jasper County are Production (1,859 | 10.2%), Material Moving (927 | 5.1%), and Transportation (762 | 4.2%).
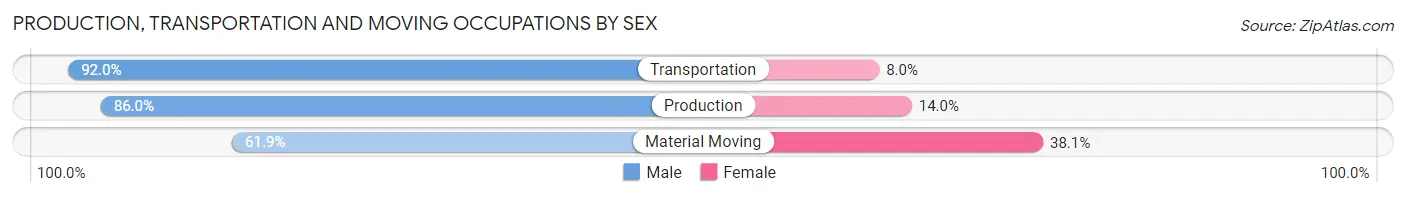
Production, Transportation and Moving Occupations by Sex
| Occupation | Male | Female |
| Production | 1,599 (86.0%) | 260 (14.0%) |
| Transportation | 701 (92.0%) | 61 (8.0%) |
| Material Moving | 574 (61.9%) | 353 (38.1%) |
| Total (Category) | 2,874 (81.0%) | 674 (19.0%) |
| Total (Overall) | 9,847 (53.9%) | 8,409 (46.1%) |
Employment Industries by Sex in Jasper County
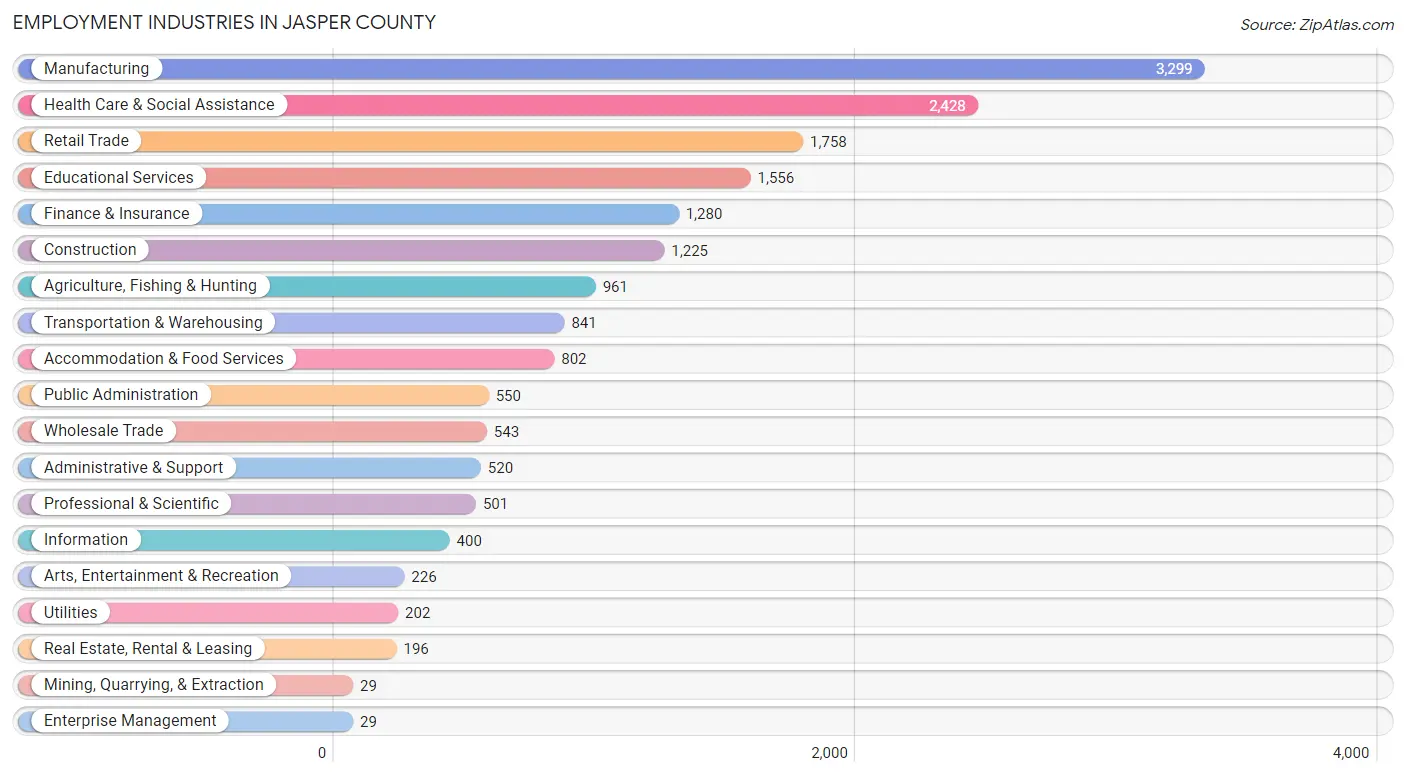
Employment Industries in Jasper County
The major employment industries in Jasper County include Manufacturing (3,299 | 18.1%), Health Care & Social Assistance (2,428 | 13.3%), Retail Trade (1,758 | 9.6%), Educational Services (1,556 | 8.5%), and Finance & Insurance (1,280 | 7.0%).
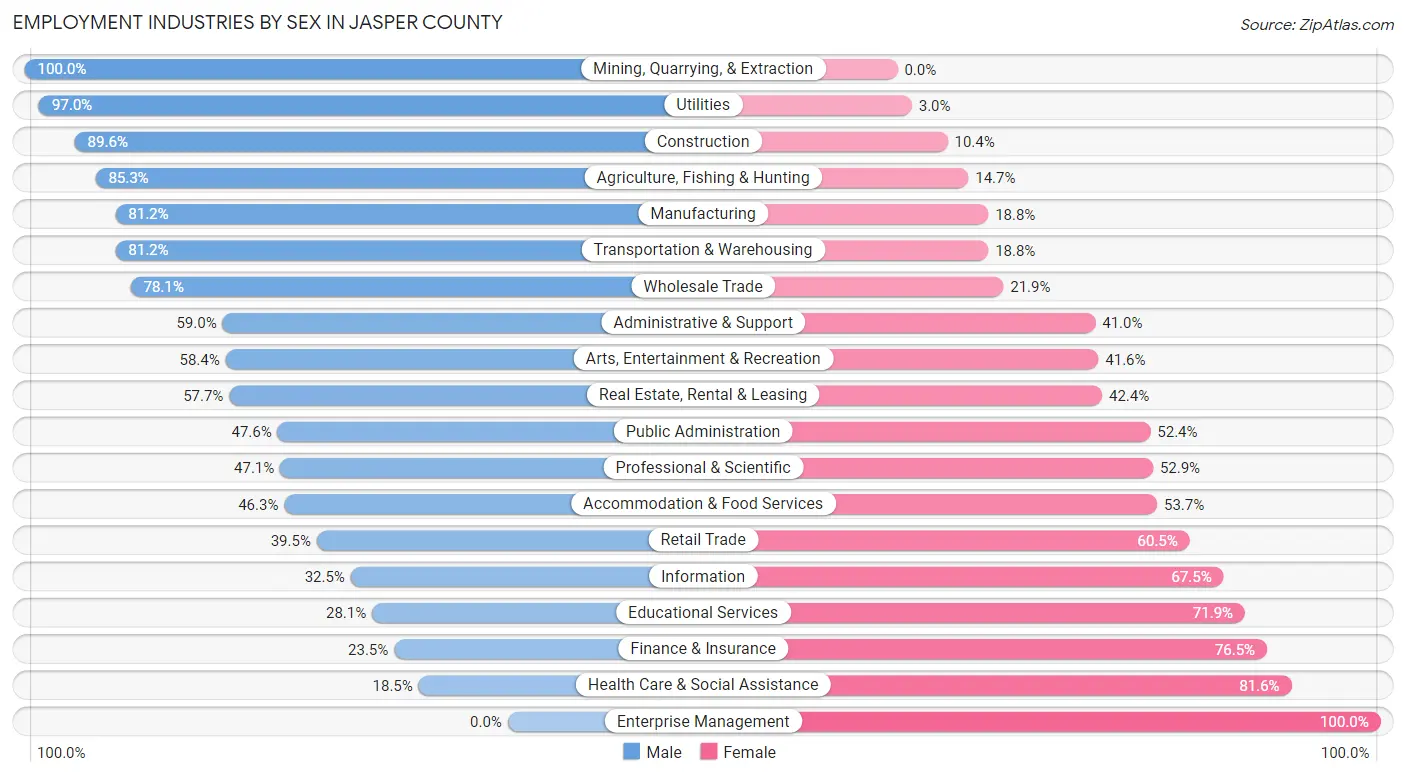
Employment Industries by Sex in Jasper County
The Jasper County industries that see more men than women are Mining, Quarrying, & Extraction (100.0%), Utilities (97.0%), and Construction (89.6%), whereas the industries that tend to have a higher number of women are Enterprise Management (100.0%), Health Care & Social Assistance (81.6%), and Finance & Insurance (76.5%).
| Industry | Male | Female |
| Agriculture, Fishing & Hunting | 820 (85.3%) | 141 (14.7%) |
| Mining, Quarrying, & Extraction | 29 (100.0%) | 0 (0.0%) |
| Construction | 1,098 (89.6%) | 127 (10.4%) |
| Manufacturing | 2,679 (81.2%) | 620 (18.8%) |
| Wholesale Trade | 424 (78.1%) | 119 (21.9%) |
| Retail Trade | 695 (39.5%) | 1,063 (60.5%) |
| Transportation & Warehousing | 683 (81.2%) | 158 (18.8%) |
| Utilities | 196 (97.0%) | 6 (3.0%) |
| Information | 130 (32.5%) | 270 (67.5%) |
| Finance & Insurance | 301 (23.5%) | 979 (76.5%) |
| Real Estate, Rental & Leasing | 113 (57.7%) | 83 (42.3%) |
| Professional & Scientific | 236 (47.1%) | 265 (52.9%) |
| Enterprise Management | 0 (0.0%) | 29 (100.0%) |
| Administrative & Support | 307 (59.0%) | 213 (41.0%) |
| Educational Services | 437 (28.1%) | 1,119 (71.9%) |
| Health Care & Social Assistance | 448 (18.4%) | 1,980 (81.6%) |
| Arts, Entertainment & Recreation | 132 (58.4%) | 94 (41.6%) |
| Accommodation & Food Services | 371 (46.3%) | 431 (53.7%) |
| Public Administration | 262 (47.6%) | 288 (52.4%) |
| Total | 9,847 (53.9%) | 8,409 (46.1%) |
Education in Jasper County
School Enrollment in Jasper County
The most common levels of schooling among the 8,156 students in Jasper County are middle school (2,035 | 24.9%), high school (1,937 | 23.7%), and elementary school (1,800 | 22.1%).
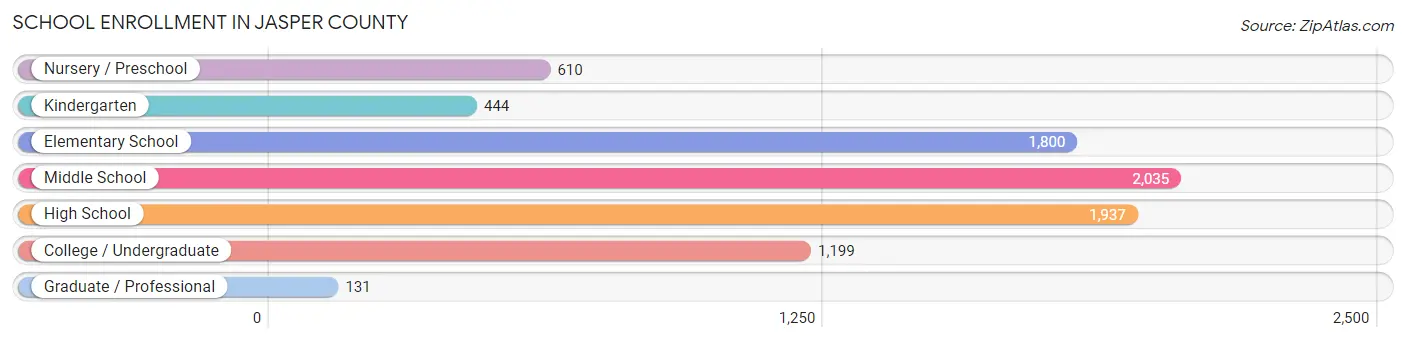
| School Level | # Students | % Students |
| Nursery / Preschool | 610 | 7.5% |
| Kindergarten | 444 | 5.4% |
| Elementary School | 1,800 | 22.1% |
| Middle School | 2,035 | 24.9% |
| High School | 1,937 | 23.7% |
| College / Undergraduate | 1,199 | 14.7% |
| Graduate / Professional | 131 | 1.6% |
| Total | 8,156 | 100.0% |
School Enrollment by Age by Funding Source in Jasper County
Out of a total of 8,156 students who are enrolled in schools in Jasper County, 987 (12.1%) attend a private institution, while the remaining 7,169 (87.9%) are enrolled in public schools. The age group of 35 years and over has the highest likelihood of being enrolled in private schools, with 170 (47.9% in the age bracket) enrolled. Conversely, the age group of 15 to 17 year olds has the lowest likelihood of being enrolled in a private school, with 1,415 (94.6% in the age bracket) attending a public institution.
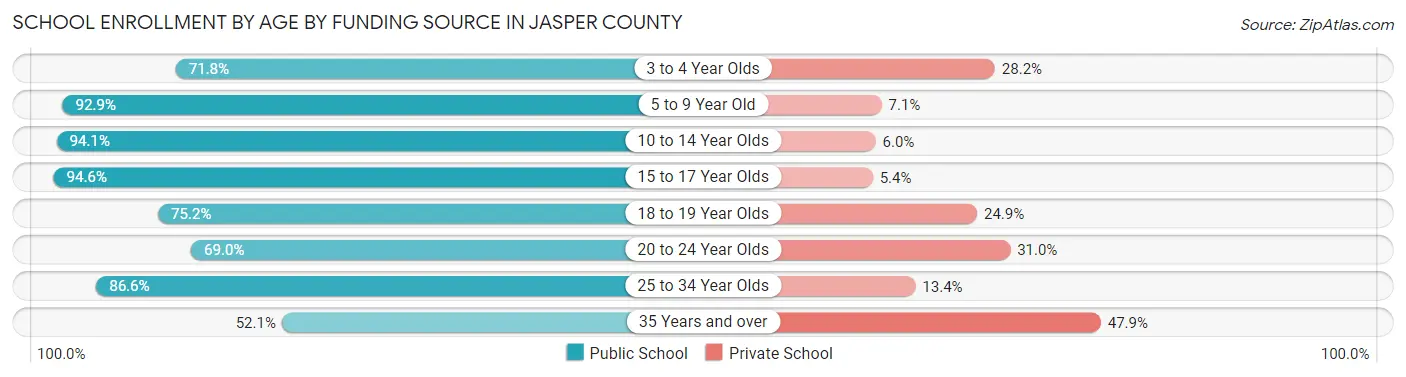
| Age Bracket | Public School | Private School |
| 3 to 4 Year Olds | 306 (71.8%) | 120 (28.2%) |
| 5 to 9 Year Old | 1,998 (92.9%) | 152 (7.1%) |
| 10 to 14 Year Olds | 2,306 (94.1%) | 146 (5.9%) |
| 15 to 17 Year Olds | 1,415 (94.6%) | 81 (5.4%) |
| 18 to 19 Year Olds | 372 (75.1%) | 123 (24.8%) |
| 20 to 24 Year Olds | 338 (69.0%) | 152 (31.0%) |
| 25 to 34 Year Olds | 253 (86.6%) | 39 (13.4%) |
| 35 Years and over | 185 (52.1%) | 170 (47.9%) |
| Total | 7,169 (87.9%) | 987 (12.1%) |
Educational Attainment by Field of Study in Jasper County
Education (1,303 | 22.6%), business (1,064 | 18.5%), bio, nature & agricultural (606 | 10.5%), science & technology (538 | 9.3%), and arts & humanities (450 | 7.8%) are the most common fields of study among 5,759 individuals in Jasper County who have obtained a bachelor's degree or higher.
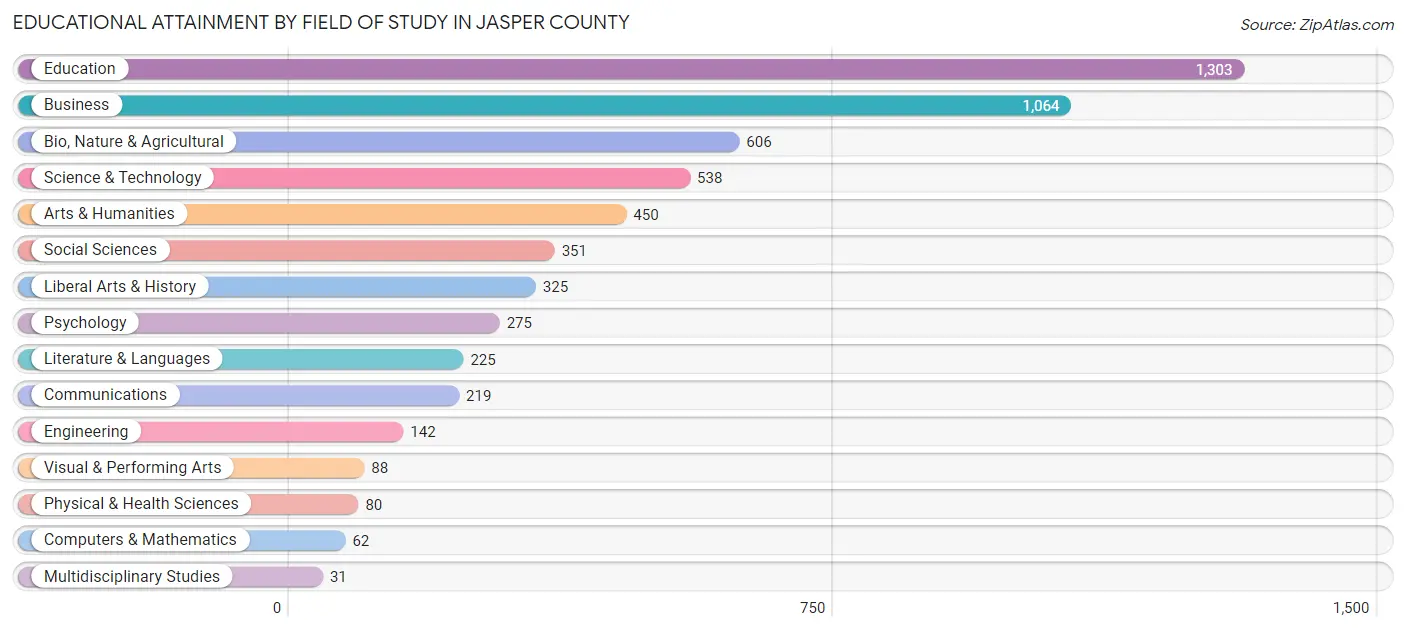
| Field of Study | # Graduates | % Graduates |
| Computers & Mathematics | 62 | 1.1% |
| Bio, Nature & Agricultural | 606 | 10.5% |
| Physical & Health Sciences | 80 | 1.4% |
| Psychology | 275 | 4.8% |
| Social Sciences | 351 | 6.1% |
| Engineering | 142 | 2.5% |
| Multidisciplinary Studies | 31 | 0.5% |
| Science & Technology | 538 | 9.3% |
| Business | 1,064 | 18.5% |
| Education | 1,303 | 22.6% |
| Literature & Languages | 225 | 3.9% |
| Liberal Arts & History | 325 | 5.6% |
| Visual & Performing Arts | 88 | 1.5% |
| Communications | 219 | 3.8% |
| Arts & Humanities | 450 | 7.8% |
| Total | 5,759 | 100.0% |
Transportation & Commute in Jasper County
Vehicle Availability by Sex in Jasper County
The most prevalent vehicle ownership categories in Jasper County are males with 2 vehicles (3,684, accounting for 37.8%) and females with 2 vehicles (3,039, making up 44.5%).
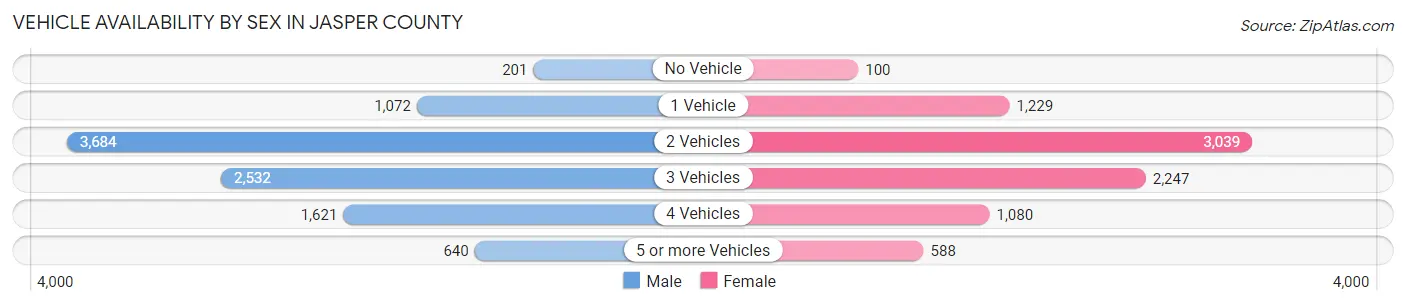
| Vehicles Available | Male | Female |
| No Vehicle | 201 (2.1%) | 100 (1.2%) |
| 1 Vehicle | 1,072 (11.0%) | 1,229 (14.8%) |
| 2 Vehicles | 3,684 (37.8%) | 3,039 (36.7%) |
| 3 Vehicles | 2,532 (26.0%) | 2,247 (27.1%) |
| 4 Vehicles | 1,621 (16.6%) | 1,080 (13.0%) |
| 5 or more Vehicles | 640 (6.6%) | 588 (7.1%) |
| Total | 9,750 (100.0%) | 8,283 (100.0%) |
Commute Time in Jasper County
The most frequently occuring commute durations in Jasper County are 5 to 9 minutes (2,841 commuters, 17.2%), 10 to 14 minutes (2,332 commuters, 14.1%), and 30 to 34 minutes (1,889 commuters, 11.4%).
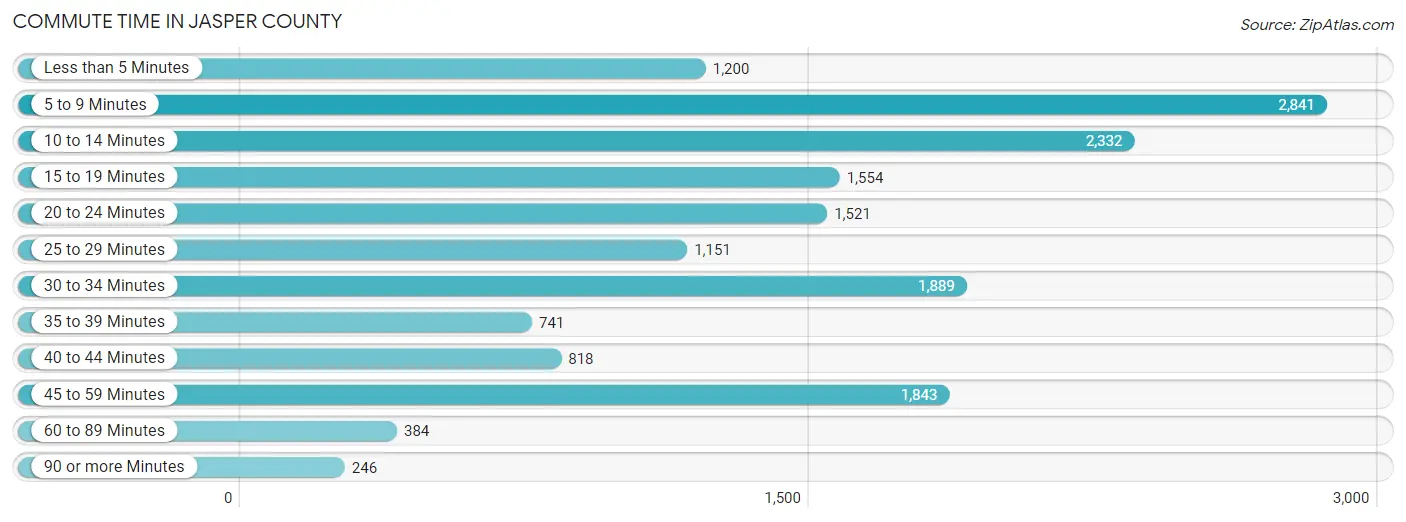
| Commute Time | # Commuters | % Commuters |
| Less than 5 Minutes | 1,200 | 7.3% |
| 5 to 9 Minutes | 2,841 | 17.2% |
| 10 to 14 Minutes | 2,332 | 14.1% |
| 15 to 19 Minutes | 1,554 | 9.4% |
| 20 to 24 Minutes | 1,521 | 9.2% |
| 25 to 29 Minutes | 1,151 | 7.0% |
| 30 to 34 Minutes | 1,889 | 11.4% |
| 35 to 39 Minutes | 741 | 4.5% |
| 40 to 44 Minutes | 818 | 5.0% |
| 45 to 59 Minutes | 1,843 | 11.2% |
| 60 to 89 Minutes | 384 | 2.3% |
| 90 or more Minutes | 246 | 1.5% |
Commute Time by Sex in Jasper County
The most common commute times in Jasper County are 5 to 9 minutes (1,519 commuters, 16.6%) for males and 5 to 9 minutes (1,322 commuters, 18.0%) for females.
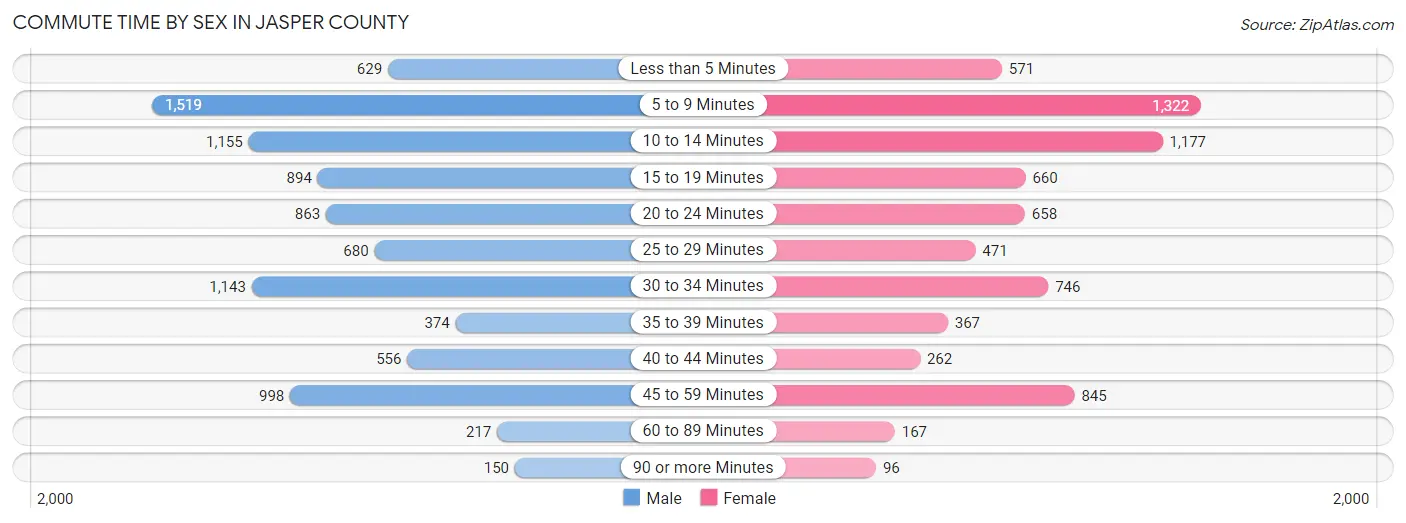
| Commute Time | Male | Female |
| Less than 5 Minutes | 629 (6.9%) | 571 (7.8%) |
| 5 to 9 Minutes | 1,519 (16.6%) | 1,322 (18.0%) |
| 10 to 14 Minutes | 1,155 (12.6%) | 1,177 (16.0%) |
| 15 to 19 Minutes | 894 (9.7%) | 660 (9.0%) |
| 20 to 24 Minutes | 863 (9.4%) | 658 (9.0%) |
| 25 to 29 Minutes | 680 (7.4%) | 471 (6.4%) |
| 30 to 34 Minutes | 1,143 (12.4%) | 746 (10.2%) |
| 35 to 39 Minutes | 374 (4.1%) | 367 (5.0%) |
| 40 to 44 Minutes | 556 (6.1%) | 262 (3.6%) |
| 45 to 59 Minutes | 998 (10.9%) | 845 (11.5%) |
| 60 to 89 Minutes | 217 (2.4%) | 167 (2.3%) |
| 90 or more Minutes | 150 (1.6%) | 96 (1.3%) |
Time of Departure to Work by Sex in Jasper County
The most frequent times of departure to work in Jasper County are 6:30 AM to 6:59 AM (1,229, 13.4%) for males and 7:00 AM to 7:29 AM (1,259, 17.2%) for females.
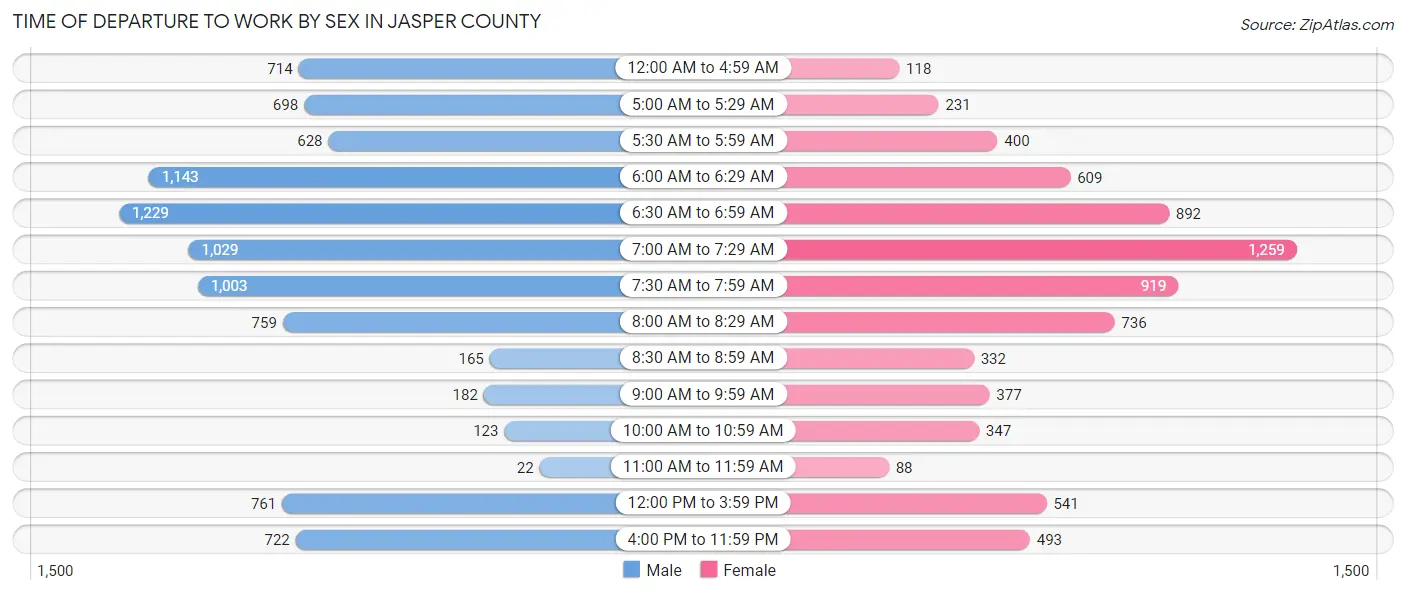
| Time of Departure | Male | Female |
| 12:00 AM to 4:59 AM | 714 (7.8%) | 118 (1.6%) |
| 5:00 AM to 5:29 AM | 698 (7.6%) | 231 (3.2%) |
| 5:30 AM to 5:59 AM | 628 (6.8%) | 400 (5.4%) |
| 6:00 AM to 6:29 AM | 1,143 (12.4%) | 609 (8.3%) |
| 6:30 AM to 6:59 AM | 1,229 (13.4%) | 892 (12.1%) |
| 7:00 AM to 7:29 AM | 1,029 (11.2%) | 1,259 (17.2%) |
| 7:30 AM to 7:59 AM | 1,003 (10.9%) | 919 (12.5%) |
| 8:00 AM to 8:29 AM | 759 (8.3%) | 736 (10.0%) |
| 8:30 AM to 8:59 AM | 165 (1.8%) | 332 (4.5%) |
| 9:00 AM to 9:59 AM | 182 (2.0%) | 377 (5.1%) |
| 10:00 AM to 10:59 AM | 123 (1.3%) | 347 (4.7%) |
| 11:00 AM to 11:59 AM | 22 (0.2%) | 88 (1.2%) |
| 12:00 PM to 3:59 PM | 761 (8.3%) | 541 (7.4%) |
| 4:00 PM to 11:59 PM | 722 (7.9%) | 493 (6.7%) |
| Total | 9,178 (100.0%) | 7,342 (100.0%) |
Housing Occupancy in Jasper County
Occupancy by Ownership in Jasper County
Of the total 14,630 dwellings in Jasper County, owner-occupied units account for 11,165 (76.3%), while renter-occupied units make up 3,465 (23.7%).
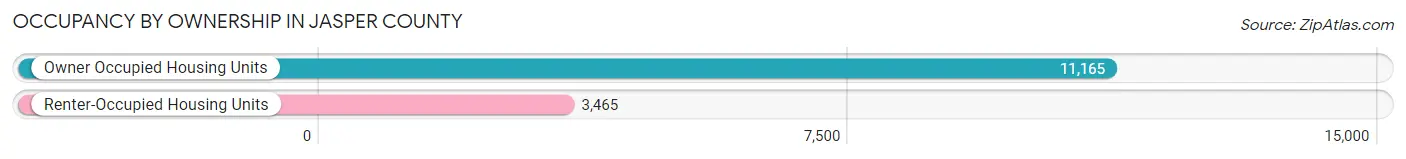
| Occupancy | # Housing Units | % Housing Units |
| Owner Occupied Housing Units | 11,165 | 76.3% |
| Renter-Occupied Housing Units | 3,465 | 23.7% |
| Total Occupied Housing Units | 14,630 | 100.0% |
Occupancy by Household Size in Jasper County
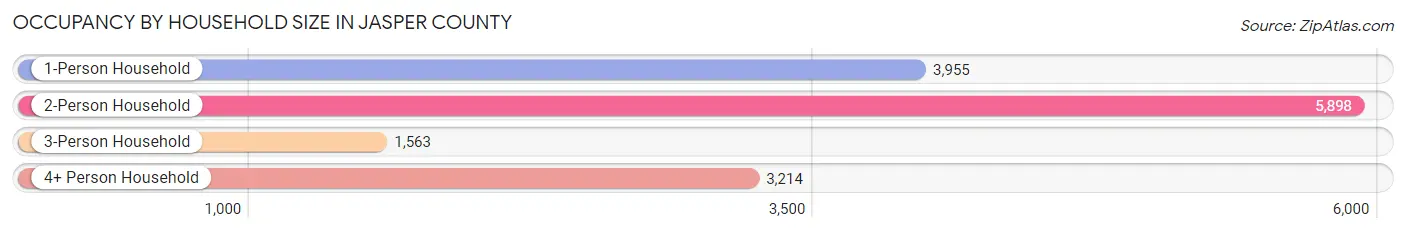
| Household Size | # Housing Units | % Housing Units |
| 1-Person Household | 3,955 | 27.0% |
| 2-Person Household | 5,898 | 40.3% |
| 3-Person Household | 1,563 | 10.7% |
| 4+ Person Household | 3,214 | 22.0% |
| Total Housing Units | 14,630 | 100.0% |
Occupancy by Ownership by Household Size in Jasper County
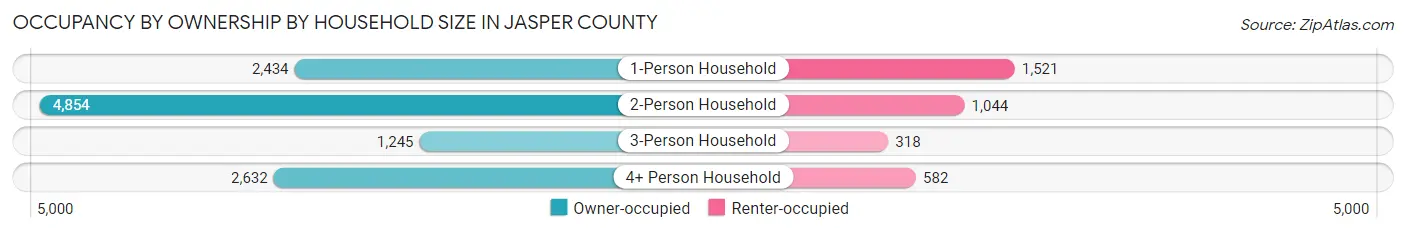
| Household Size | Owner-occupied | Renter-occupied |
| 1-Person Household | 2,434 (61.5%) | 1,521 (38.5%) |
| 2-Person Household | 4,854 (82.3%) | 1,044 (17.7%) |
| 3-Person Household | 1,245 (79.6%) | 318 (20.3%) |
| 4+ Person Household | 2,632 (81.9%) | 582 (18.1%) |
| Total Housing Units | 11,165 (76.3%) | 3,465 (23.7%) |
Occupancy by Educational Attainment in Jasper County
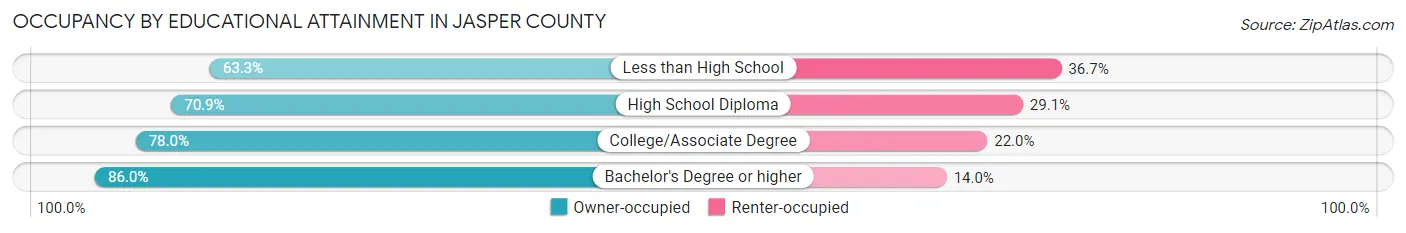
| Household Size | Owner-occupied | Renter-occupied |
| Less than High School | 384 (63.3%) | 223 (36.7%) |
| High School Diploma | 4,007 (70.9%) | 1,644 (29.1%) |
| College/Associate Degree | 4,134 (78.0%) | 1,169 (22.0%) |
| Bachelor's Degree or higher | 2,640 (86.0%) | 429 (14.0%) |
Occupancy by Age of Householder in Jasper County
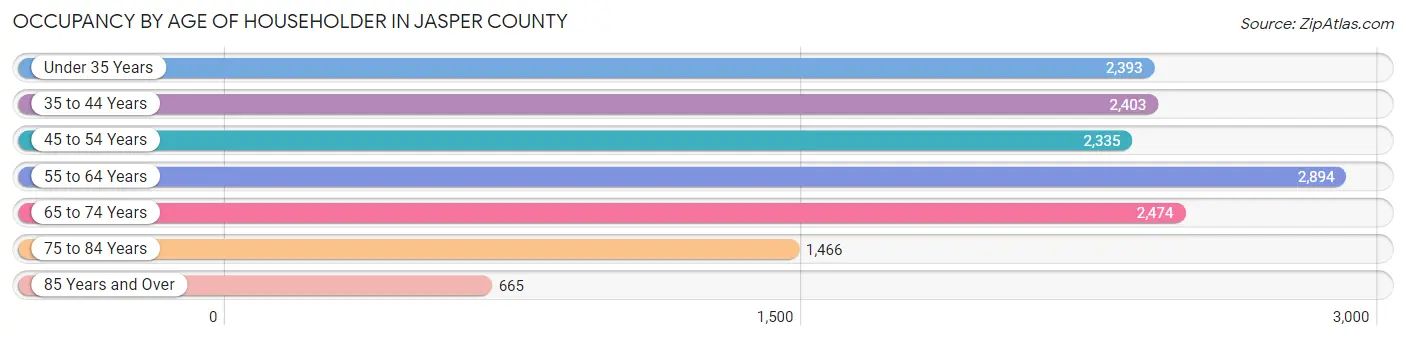
| Age Bracket | # Households | % Households |
| Under 35 Years | 2,393 | 16.4% |
| 35 to 44 Years | 2,403 | 16.4% |
| 45 to 54 Years | 2,335 | 16.0% |
| 55 to 64 Years | 2,894 | 19.8% |
| 65 to 74 Years | 2,474 | 16.9% |
| 75 to 84 Years | 1,466 | 10.0% |
| 85 Years and Over | 665 | 4.5% |
| Total | 14,630 | 100.0% |
Housing Finances in Jasper County
Median Income by Occupancy in Jasper County
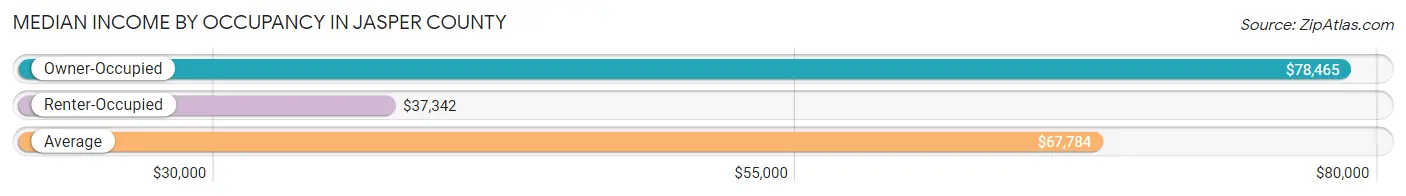
| Occupancy Type | # Households | Median Income |
| Owner-Occupied | 11,165 (76.3%) | $78,465 |
| Renter-Occupied | 3,465 (23.7%) | $37,342 |
| Average | 14,630 (100.0%) | $67,784 |
Occupancy by Householder Income Bracket in Jasper County
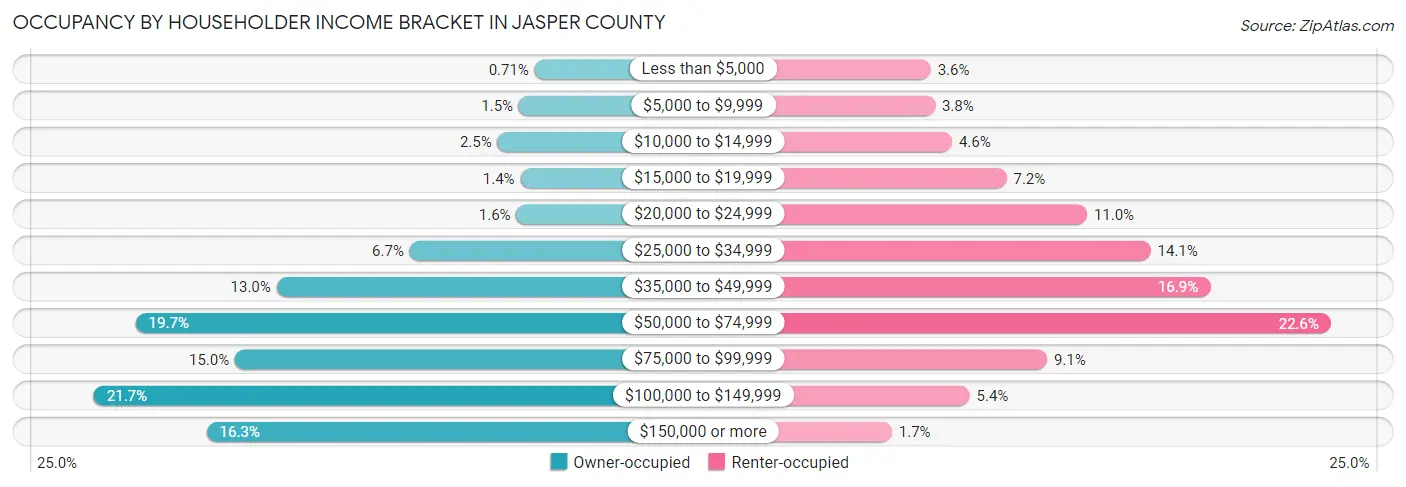
| Income Bracket | Owner-occupied | Renter-occupied |
| Less than $5,000 | 79 (0.7%) | 124 (3.6%) |
| $5,000 to $9,999 | 163 (1.5%) | 131 (3.8%) |
| $10,000 to $14,999 | 277 (2.5%) | 159 (4.6%) |
| $15,000 to $19,999 | 155 (1.4%) | 249 (7.2%) |
| $20,000 to $24,999 | 176 (1.6%) | 382 (11.0%) |
| $25,000 to $34,999 | 744 (6.7%) | 487 (14.1%) |
| $35,000 to $49,999 | 1,451 (13.0%) | 585 (16.9%) |
| $50,000 to $74,999 | 2,201 (19.7%) | 784 (22.6%) |
| $75,000 to $99,999 | 1,673 (15.0%) | 316 (9.1%) |
| $100,000 to $149,999 | 2,423 (21.7%) | 188 (5.4%) |
| $150,000 or more | 1,823 (16.3%) | 60 (1.7%) |
| Total | 11,165 (100.0%) | 3,465 (100.0%) |
Monthly Housing Cost Tiers in Jasper County
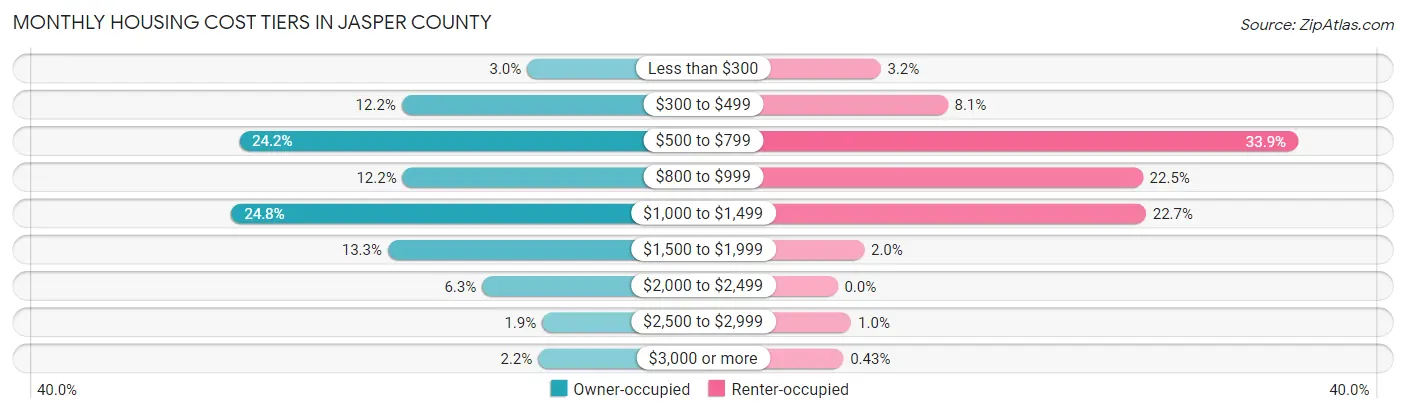
| Monthly Cost | Owner-occupied | Renter-occupied |
| Less than $300 | 334 (3.0%) | 110 (3.2%) |
| $300 to $499 | 1,366 (12.2%) | 281 (8.1%) |
| $500 to $799 | 2,702 (24.2%) | 1,175 (33.9%) |
| $800 to $999 | 1,359 (12.2%) | 779 (22.5%) |
| $1,000 to $1,499 | 2,766 (24.8%) | 787 (22.7%) |
| $1,500 to $1,999 | 1,479 (13.3%) | 68 (2.0%) |
| $2,000 to $2,499 | 705 (6.3%) | 0 (0.0%) |
| $2,500 to $2,999 | 211 (1.9%) | 35 (1.0%) |
| $3,000 or more | 243 (2.2%) | 15 (0.4%) |
| Total | 11,165 (100.0%) | 3,465 (100.0%) |
Physical Housing Characteristics in Jasper County
Housing Structures in Jasper County
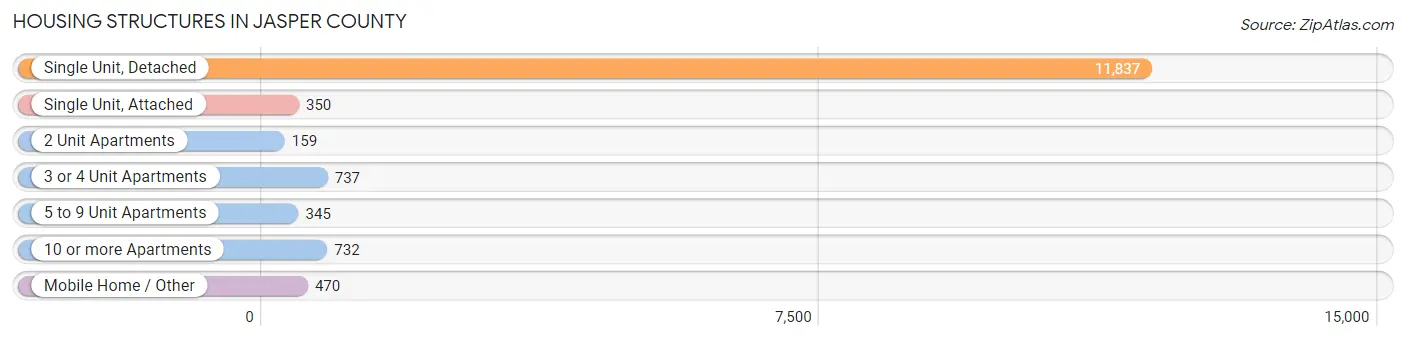
| Structure Type | # Housing Units | % Housing Units |
| Single Unit, Detached | 11,837 | 80.9% |
| Single Unit, Attached | 350 | 2.4% |
| 2 Unit Apartments | 159 | 1.1% |
| 3 or 4 Unit Apartments | 737 | 5.0% |
| 5 to 9 Unit Apartments | 345 | 2.4% |
| 10 or more Apartments | 732 | 5.0% |
| Mobile Home / Other | 470 | 3.2% |
| Total | 14,630 | 100.0% |
Housing Structures by Occupancy in Jasper County
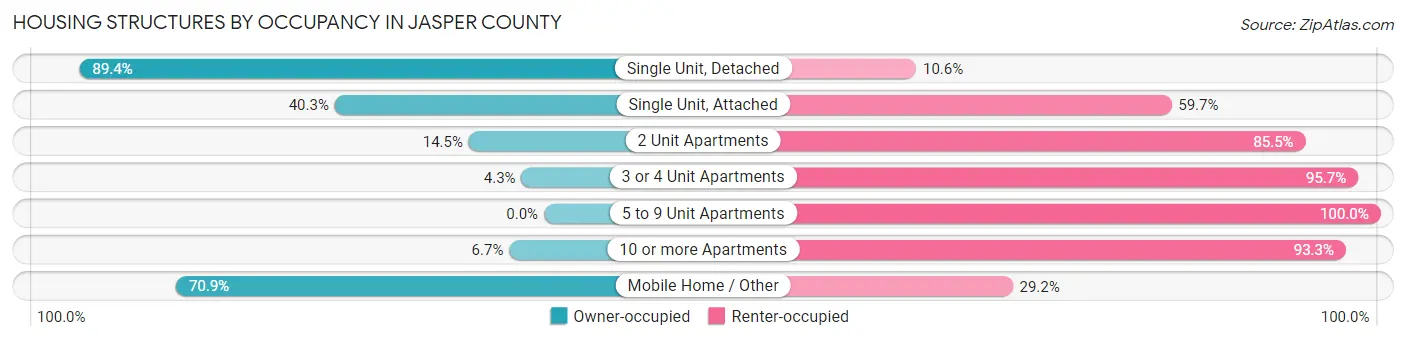
| Structure Type | Owner-occupied | Renter-occupied |
| Single Unit, Detached | 10,587 (89.4%) | 1,250 (10.6%) |
| Single Unit, Attached | 141 (40.3%) | 209 (59.7%) |
| 2 Unit Apartments | 23 (14.5%) | 136 (85.5%) |
| 3 or 4 Unit Apartments | 32 (4.3%) | 705 (95.7%) |
| 5 to 9 Unit Apartments | 0 (0.0%) | 345 (100.0%) |
| 10 or more Apartments | 49 (6.7%) | 683 (93.3%) |
| Mobile Home / Other | 333 (70.9%) | 137 (29.1%) |
| Total | 11,165 (76.3%) | 3,465 (23.7%) |
Housing Structures by Number of Rooms in Jasper County
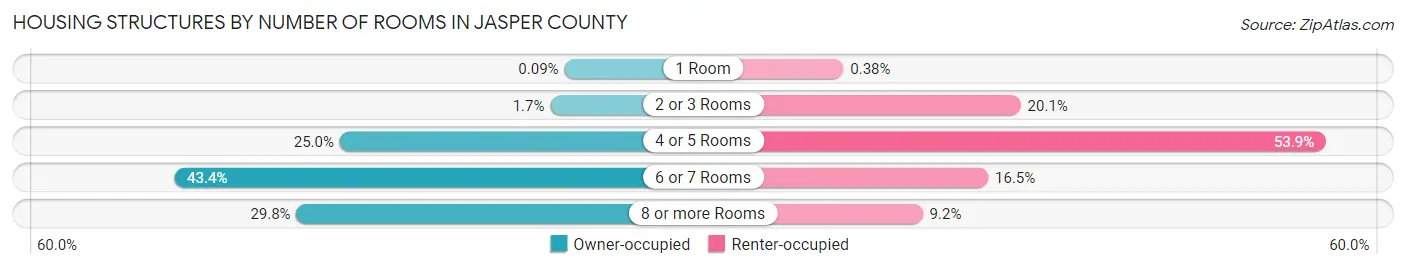
| Number of Rooms | Owner-occupied | Renter-occupied |
| 1 Room | 10 (0.1%) | 13 (0.4%) |
| 2 or 3 Rooms | 185 (1.7%) | 695 (20.1%) |
| 4 or 5 Rooms | 2,794 (25.0%) | 1,869 (53.9%) |
| 6 or 7 Rooms | 4,846 (43.4%) | 570 (16.5%) |
| 8 or more Rooms | 3,330 (29.8%) | 318 (9.2%) |
| Total | 11,165 (100.0%) | 3,465 (100.0%) |
Housing Structure by Heating Type in Jasper County
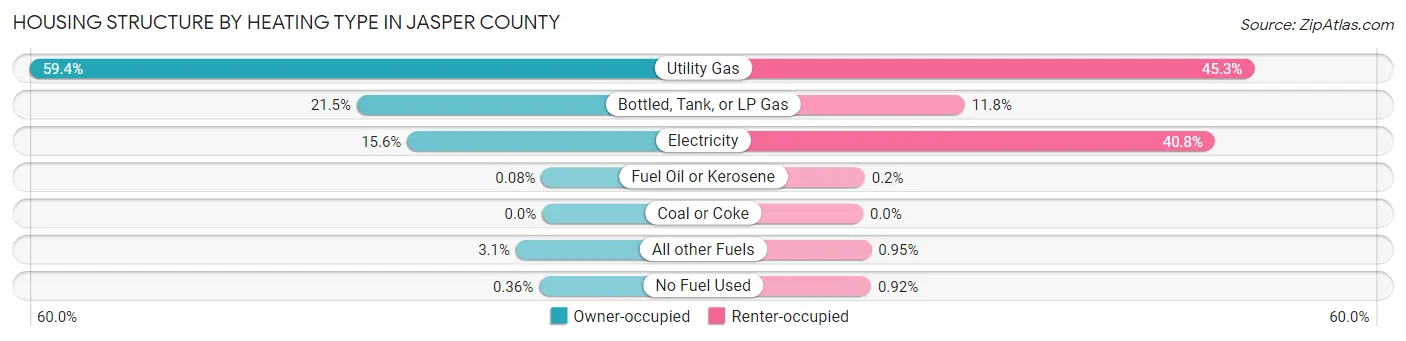
| Heating Type | Owner-occupied | Renter-occupied |
| Utility Gas | 6,632 (59.4%) | 1,571 (45.3%) |
| Bottled, Tank, or LP Gas | 2,398 (21.5%) | 409 (11.8%) |
| Electricity | 1,746 (15.6%) | 1,413 (40.8%) |
| Fuel Oil or Kerosene | 9 (0.1%) | 7 (0.2%) |
| Coal or Coke | 0 (0.0%) | 0 (0.0%) |
| All other Fuels | 340 (3.0%) | 33 (0.9%) |
| No Fuel Used | 40 (0.4%) | 32 (0.9%) |
| Total | 11,165 (100.0%) | 3,465 (100.0%) |
Household Vehicle Usage in Jasper County
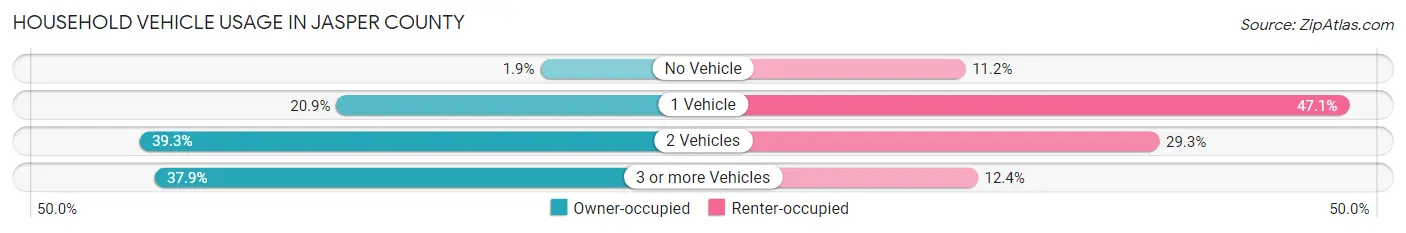
| Vehicles per Household | Owner-occupied | Renter-occupied |
| No Vehicle | 208 (1.9%) | 389 (11.2%) |
| 1 Vehicle | 2,334 (20.9%) | 1,631 (47.1%) |
| 2 Vehicles | 4,390 (39.3%) | 1,016 (29.3%) |
| 3 or more Vehicles | 4,233 (37.9%) | 429 (12.4%) |
| Total | 11,165 (100.0%) | 3,465 (100.0%) |
Real Estate & Mortgages in Jasper County
Real Estate and Mortgage Overview in Jasper County
| Characteristic | Without Mortgage | With Mortgage |
| Housing Units | 4,321 | 6,844 |
| Median Property Value | $158,500 | $167,500 |
| Median Household Income | $64,498 | $1,271 |
| Monthly Housing Costs | $567 | $243 |
| Real Estate Taxes | $2,368 | $90 |
Property Value by Mortgage Status in Jasper County
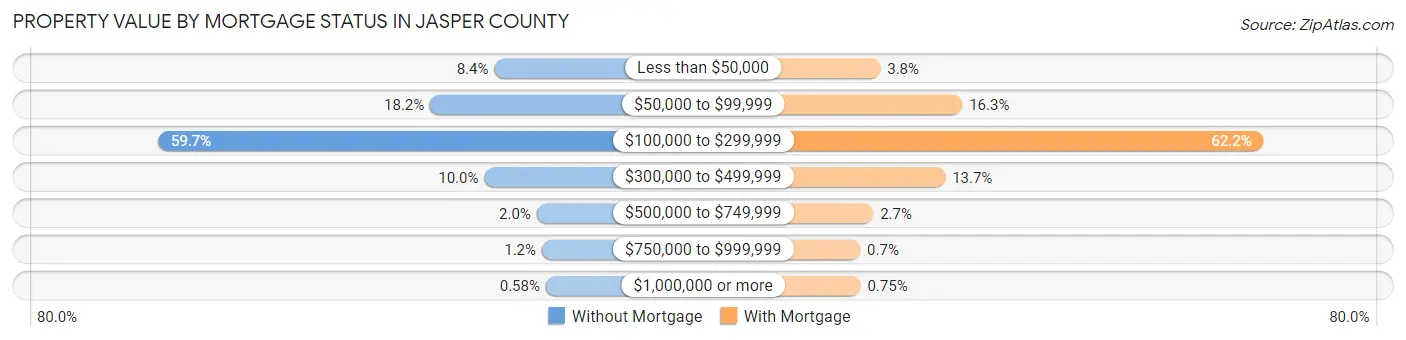
| Property Value | Without Mortgage | With Mortgage |
| Less than $50,000 | 364 (8.4%) | 258 (3.8%) |
| $50,000 to $99,999 | 787 (18.2%) | 1,113 (16.3%) |
| $100,000 to $299,999 | 2,579 (59.7%) | 4,255 (62.2%) |
| $300,000 to $499,999 | 430 (10.0%) | 935 (13.7%) |
| $500,000 to $749,999 | 85 (2.0%) | 184 (2.7%) |
| $750,000 to $999,999 | 51 (1.2%) | 48 (0.7%) |
| $1,000,000 or more | 25 (0.6%) | 51 (0.7%) |
| Total | 4,321 (100.0%) | 6,844 (100.0%) |
Household Income by Mortgage Status in Jasper County
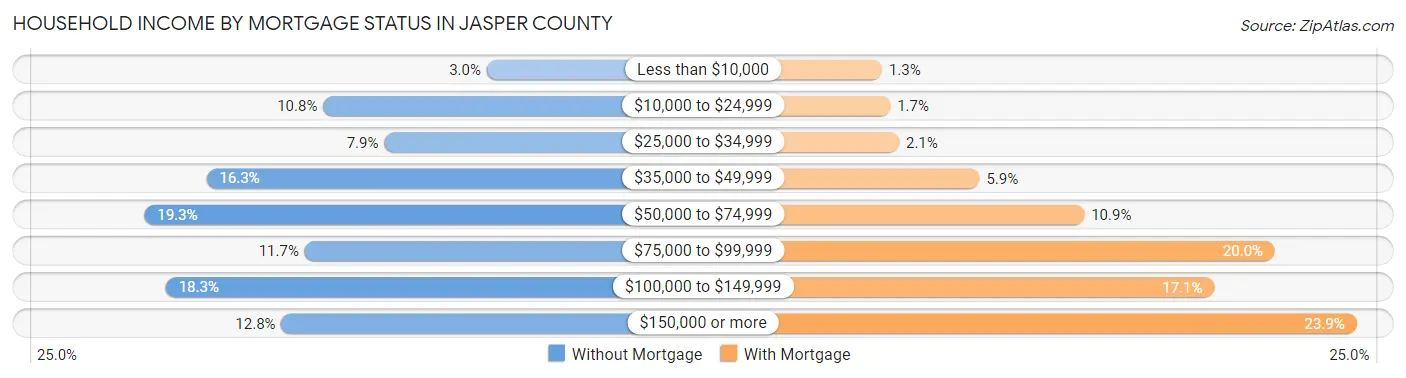
| Household Income | Without Mortgage | With Mortgage |
| Less than $10,000 | 129 (3.0%) | 86 (1.3%) |
| $10,000 to $24,999 | 466 (10.8%) | 113 (1.7%) |
| $25,000 to $34,999 | 340 (7.9%) | 142 (2.1%) |
| $35,000 to $49,999 | 706 (16.3%) | 404 (5.9%) |
| $50,000 to $74,999 | 834 (19.3%) | 745 (10.9%) |
| $75,000 to $99,999 | 504 (11.7%) | 1,367 (20.0%) |
| $100,000 to $149,999 | 790 (18.3%) | 1,169 (17.1%) |
| $150,000 or more | 552 (12.8%) | 1,633 (23.9%) |
| Total | 4,321 (100.0%) | 6,844 (100.0%) |
Property Value to Household Income Ratio in Jasper County
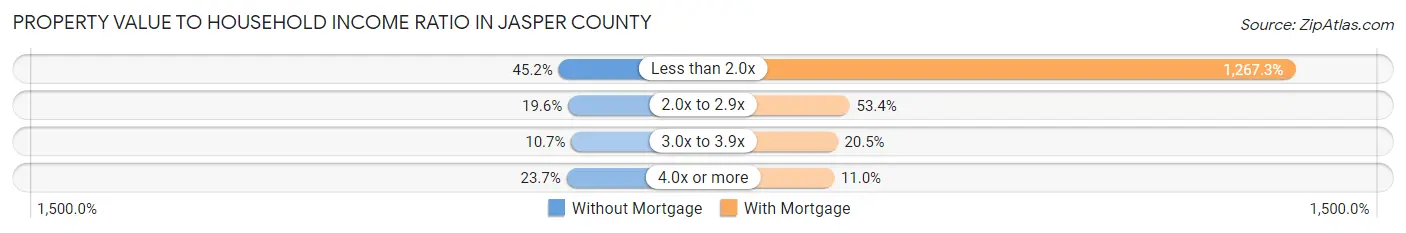
| Value-to-Income Ratio | Without Mortgage | With Mortgage |
| Less than 2.0x | 1,955 (45.2%) | 86,736 (1,267.3%) |
| 2.0x to 2.9x | 846 (19.6%) | 3,653 (53.4%) |
| 3.0x to 3.9x | 460 (10.6%) | 1,400 (20.5%) |
| 4.0x or more | 1,025 (23.7%) | 750 (11.0%) |
| Total | 4,321 (100.0%) | 6,844 (100.0%) |
Real Estate Taxes by Mortgage Status in Jasper County
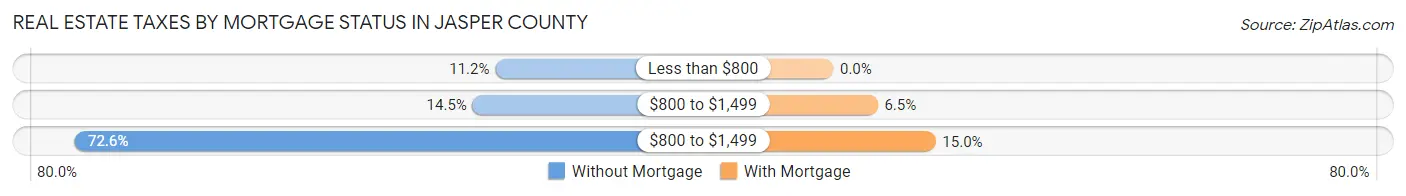
| Property Taxes | Without Mortgage | With Mortgage |
| Less than $800 | 485 (11.2%) | 0 (0.0%) |
| $800 to $1,499 | 628 (14.5%) | 444 (6.5%) |
| $800 to $1,499 | 3,138 (72.6%) | 1,024 (15.0%) |
| Total | 4,321 (100.0%) | 6,844 (100.0%) |
Health & Disability in Jasper County
Health Insurance Coverage by Age in Jasper County
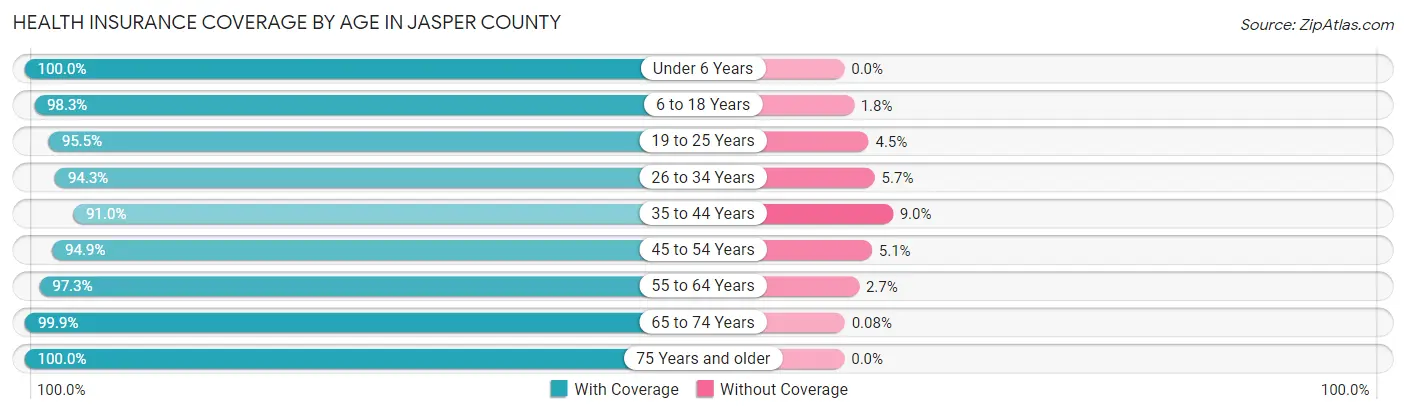
| Age Bracket | With Coverage | Without Coverage |
| Under 6 Years | 2,538 (100.0%) | 0 (0.0%) |
| 6 to 18 Years | 6,054 (98.3%) | 108 (1.8%) |
| 19 to 25 Years | 2,558 (95.5%) | 121 (4.5%) |
| 26 to 34 Years | 3,615 (94.3%) | 217 (5.7%) |
| 35 to 44 Years | 4,162 (91.0%) | 413 (9.0%) |
| 45 to 54 Years | 4,167 (94.9%) | 226 (5.1%) |
| 55 to 64 Years | 4,941 (97.3%) | 139 (2.7%) |
| 65 to 74 Years | 3,828 (99.9%) | 3 (0.1%) |
| 75 Years and older | 3,065 (100.0%) | 0 (0.0%) |
| Total | 34,928 (96.6%) | 1,227 (3.4%) |
Health Insurance Coverage by Citizenship Status in Jasper County
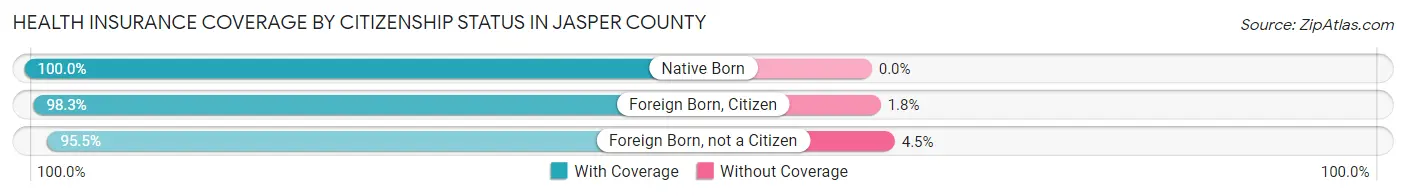
| Citizenship Status | With Coverage | Without Coverage |
| Native Born | 2,538 (100.0%) | 0 (0.0%) |
| Foreign Born, Citizen | 6,054 (98.3%) | 108 (1.8%) |
| Foreign Born, not a Citizen | 2,558 (95.5%) | 121 (4.5%) |
Health Insurance Coverage by Household Income in Jasper County
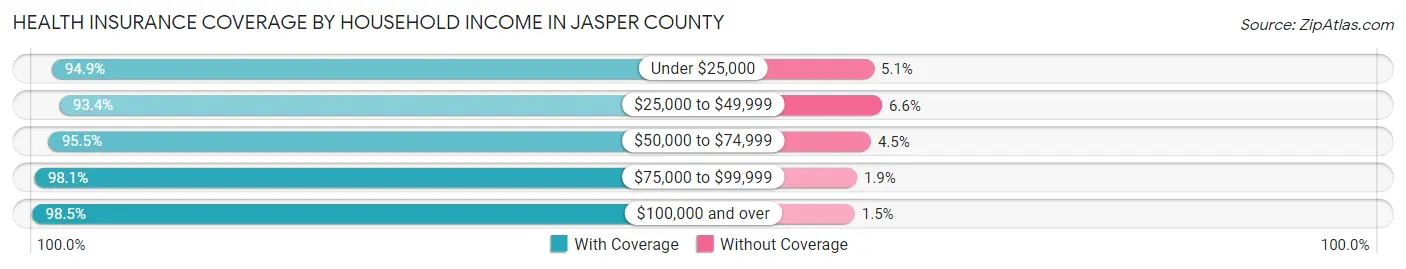
| Household Income | With Coverage | Without Coverage |
| Under $25,000 | 2,985 (94.9%) | 161 (5.1%) |
| $25,000 to $49,999 | 5,723 (93.4%) | 406 (6.6%) |
| $50,000 to $74,999 | 7,040 (95.5%) | 334 (4.5%) |
| $75,000 to $99,999 | 5,522 (98.1%) | 108 (1.9%) |
| $100,000 and over | 13,508 (98.5%) | 207 (1.5%) |
Public vs Private Health Insurance Coverage by Age in Jasper County
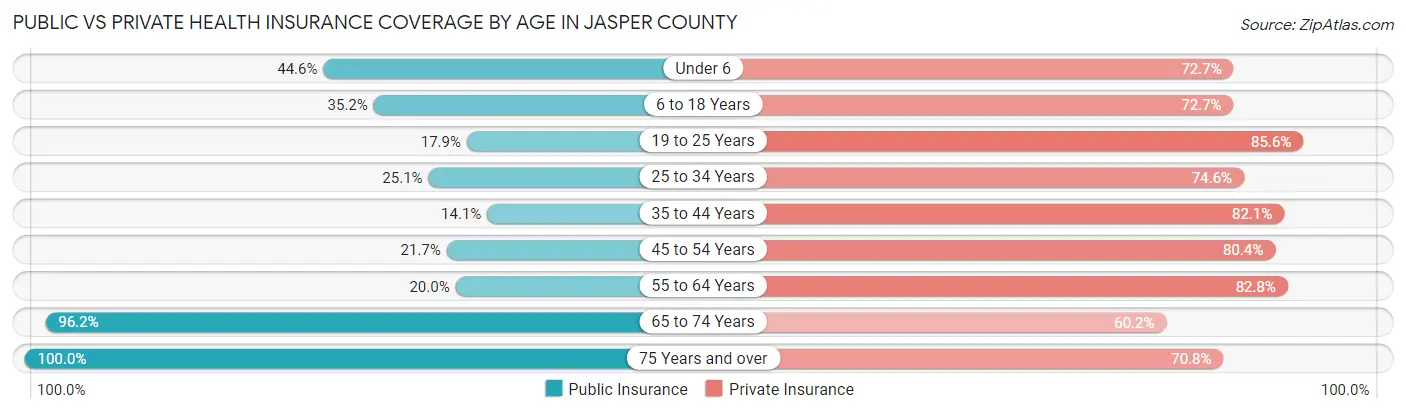
| Age Bracket | Public Insurance | Private Insurance |
| Under 6 | 1,131 (44.6%) | 1,845 (72.7%) |
| 6 to 18 Years | 2,170 (35.2%) | 4,479 (72.7%) |
| 19 to 25 Years | 480 (17.9%) | 2,294 (85.6%) |
| 25 to 34 Years | 960 (25.1%) | 2,860 (74.6%) |
| 35 to 44 Years | 647 (14.1%) | 3,755 (82.1%) |
| 45 to 54 Years | 952 (21.7%) | 3,533 (80.4%) |
| 55 to 64 Years | 1,017 (20.0%) | 4,204 (82.8%) |
| 65 to 74 Years | 3,684 (96.2%) | 2,307 (60.2%) |
| 75 Years and over | 3,065 (100.0%) | 2,170 (70.8%) |
| Total | 14,106 (39.0%) | 27,447 (75.9%) |
Disability Status by Sex by Age in Jasper County
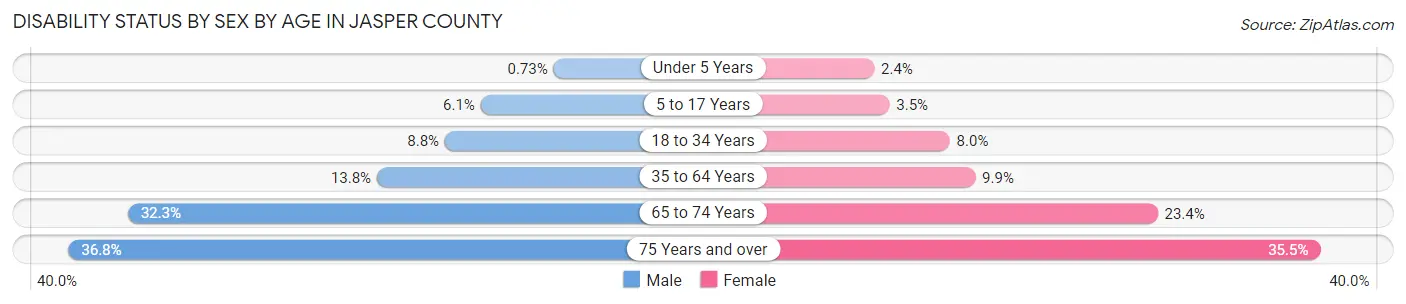
| Age Bracket | Male | Female |
| Under 5 Years | 8 (0.7%) | 23 (2.4%) |
| 5 to 17 Years | 200 (6.1%) | 107 (3.5%) |
| 18 to 34 Years | 317 (8.8%) | 262 (8.0%) |
| 35 to 64 Years | 999 (13.8%) | 676 (9.9%) |
| 65 to 74 Years | 607 (32.3%) | 458 (23.4%) |
| 75 Years and over | 487 (36.7%) | 618 (35.5%) |
Disability Class by Sex by Age in Jasper County
Disability Class: Hearing Difficulty
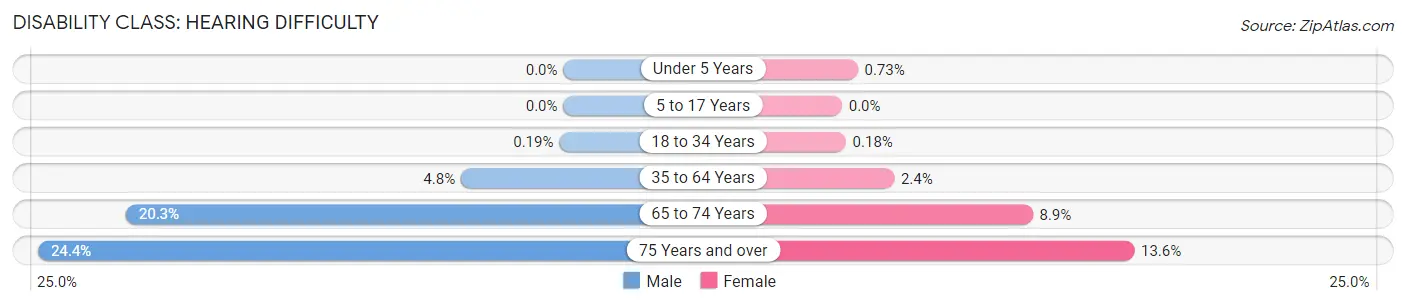
| Age Bracket | Male | Female |
| Under 5 Years | 0 (0.0%) | 7 (0.7%) |
| 5 to 17 Years | 0 (0.0%) | 0 (0.0%) |
| 18 to 34 Years | 7 (0.2%) | 6 (0.2%) |
| 35 to 64 Years | 343 (4.8%) | 165 (2.4%) |
| 65 to 74 Years | 381 (20.3%) | 173 (8.8%) |
| 75 Years and over | 323 (24.4%) | 236 (13.6%) |
Disability Class: Vision Difficulty
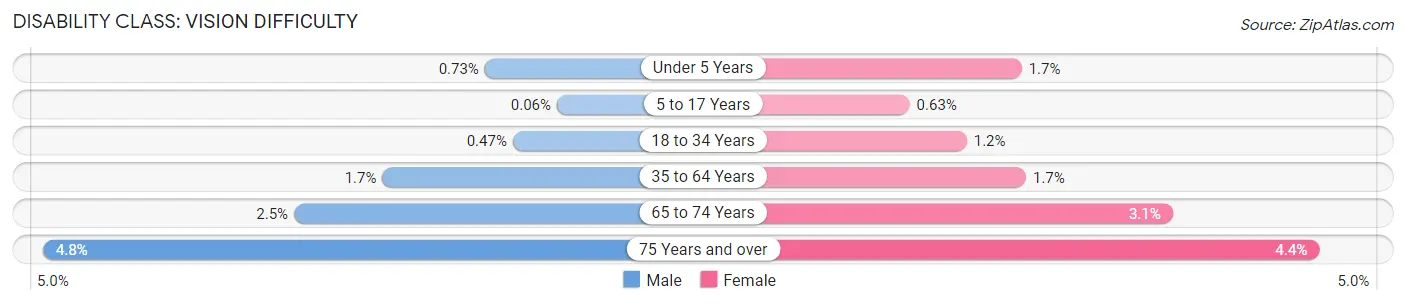
| Age Bracket | Male | Female |
| Under 5 Years | 8 (0.7%) | 16 (1.7%) |
| 5 to 17 Years | 2 (0.1%) | 19 (0.6%) |
| 18 to 34 Years | 17 (0.5%) | 38 (1.2%) |
| 35 to 64 Years | 121 (1.7%) | 117 (1.7%) |
| 65 to 74 Years | 47 (2.5%) | 60 (3.1%) |
| 75 Years and over | 64 (4.8%) | 77 (4.4%) |
Disability Class: Cognitive Difficulty
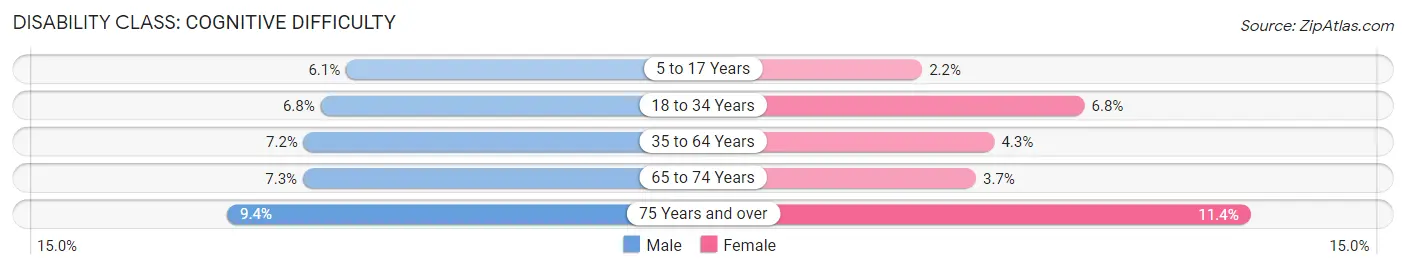
| Age Bracket | Male | Female |
| 5 to 17 Years | 197 (6.0%) | 68 (2.2%) |
| 18 to 34 Years | 244 (6.8%) | 221 (6.8%) |
| 35 to 64 Years | 522 (7.2%) | 290 (4.3%) |
| 65 to 74 Years | 136 (7.2%) | 73 (3.7%) |
| 75 Years and over | 124 (9.4%) | 198 (11.4%) |
Disability Class: Ambulatory Difficulty
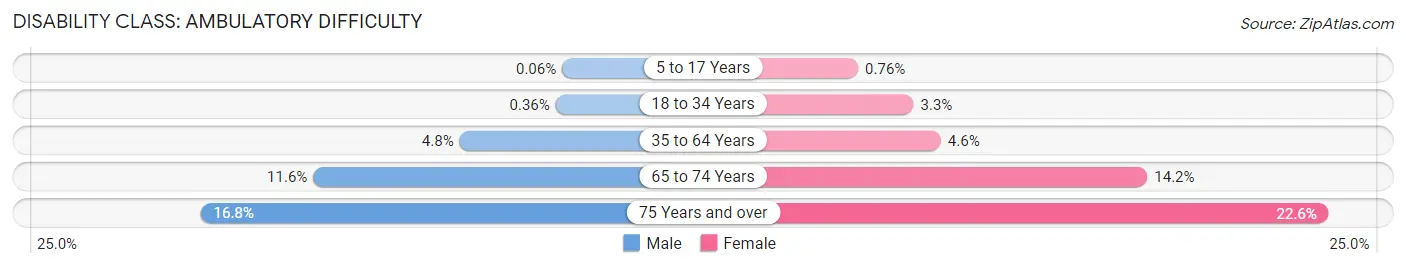
| Age Bracket | Male | Female |
| 5 to 17 Years | 2 (0.1%) | 23 (0.8%) |
| 18 to 34 Years | 13 (0.4%) | 109 (3.3%) |
| 35 to 64 Years | 348 (4.8%) | 314 (4.6%) |
| 65 to 74 Years | 218 (11.6%) | 277 (14.2%) |
| 75 Years and over | 223 (16.8%) | 393 (22.6%) |
Disability Class: Self-Care Difficulty
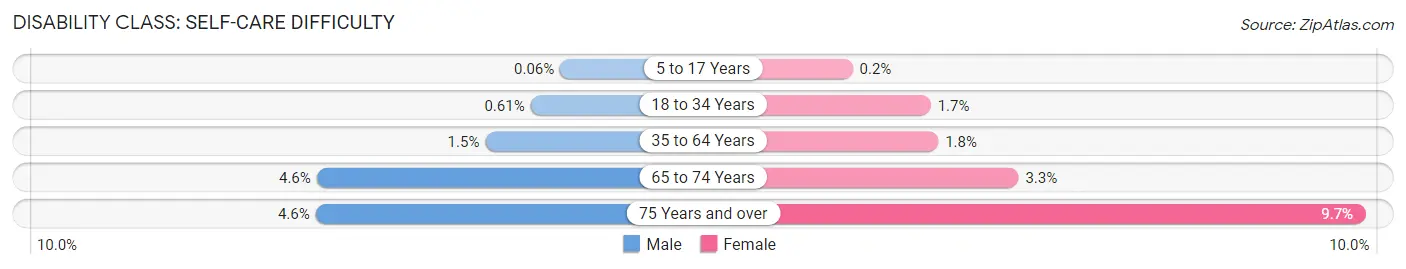
| Age Bracket | Male | Female |
| 5 to 17 Years | 2 (0.1%) | 6 (0.2%) |
| 18 to 34 Years | 22 (0.6%) | 54 (1.7%) |
| 35 to 64 Years | 105 (1.5%) | 122 (1.8%) |
| 65 to 74 Years | 86 (4.6%) | 64 (3.3%) |
| 75 Years and over | 61 (4.6%) | 169 (9.7%) |
Technology Access in Jasper County
Computing Device Access in Jasper County
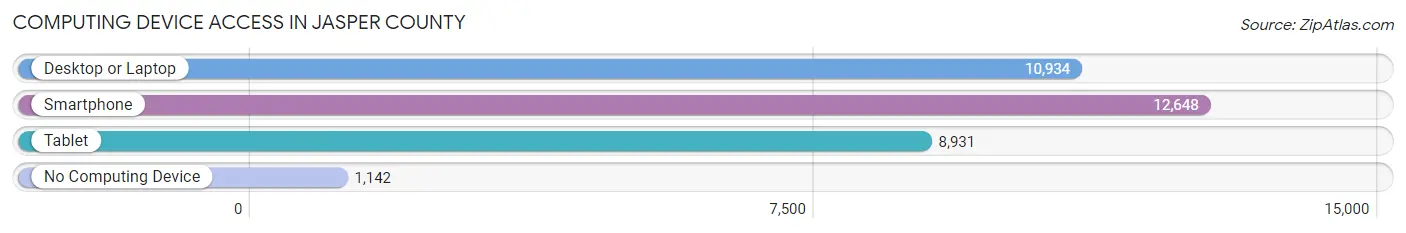
| Device Type | # Households | % Households |
| Desktop or Laptop | 10,934 | 74.7% |
| Smartphone | 12,648 | 86.5% |
| Tablet | 8,931 | 61.1% |
| No Computing Device | 1,142 | 7.8% |
| Total | 14,630 | 100.0% |
Internet Access in Jasper County
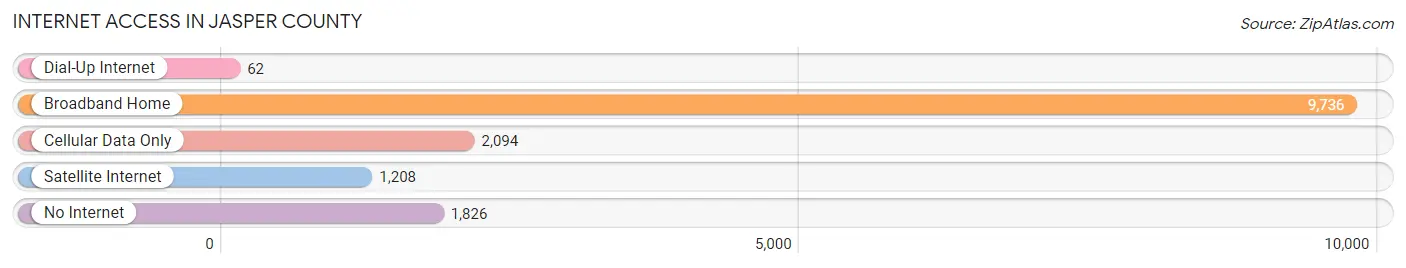
| Internet Type | # Households | % Households |
| Dial-Up Internet | 62 | 0.4% |
| Broadband Home | 9,736 | 66.5% |
| Cellular Data Only | 2,094 | 14.3% |
| Satellite Internet | 1,208 | 8.3% |
| No Internet | 1,826 | 12.5% |
| Total | 14,630 | 100.0% |
Jasper County Summary
Jasper County is located in the state of Iowa in the United States. It is part of the Des Moines–West Des Moines Metropolitan Statistical Area. The county seat is Newton. As of the 2010 census, the population was 36,842.
History
Jasper County was established in 1846 and was named after Sergeant William Jasper, a Revolutionary War hero. The county was originally part of Keokuk County, which was established in 1843. The county was divided into two parts in 1846, with the northern part becoming Jasper County.
The first settlers in the county were mostly from Ohio, Indiana, and Illinois. The first county seat was located in Monroe, but it was moved to Newton in 1853.
Geography
Jasper County is located in the central part of Iowa. It is bordered by Marshall County to the north, Poweshiek County to the east, Mahaska County to the south, and Marion County to the west. The county has a total area of 576 square miles, of which 574 square miles is land and 2 square miles is water.
The county is mostly flat, with some rolling hills in the northern part. The Des Moines River flows through the county, and there are several small lakes and ponds.
Economy
The economy of Jasper County is largely based on agriculture. The county is home to several large farms, and the main crops grown are corn, soybeans, and hay. Livestock production is also important, with cattle, hogs, and sheep being raised in the county.
The county also has a strong manufacturing sector, with several factories producing a variety of products, including automotive parts, furniture, and food products.
Demographics
As of the 2010 census, there were 36,842 people, 14,845 households, and 10,072 families living in the county. The population density was 64 people per square mile. The racial makeup of the county was 94.3% White, 1.3% African American, 0.3% Native American, 0.7% Asian, 0.1% Pacific Islander, 1.7% from other races, and 1.6% from two or more races. Hispanic or Latino of any race were 3.7% of the population.
The median income for a household in the county was $45,945, and the median income for a family was $54,945. The per capita income for the county was $22,845. About 8.2% of families and 11.2% of the population were below the poverty line, including 15.2% of those under age 18 and 6.2% of those age 65 or over.
Jasper County is a rural county with a strong agricultural base. The county has a diverse economy and a population that is largely white. The county has a strong manufacturing sector and a median income that is slightly higher than the state average.
Common Questions
What is Per Capita Income in Jasper County?
Per Capita income in Jasper County is $35,346.
What is the Median Family Income in Jasper County?
Median Family Income in Jasper County is $81,606.
What is the Median Household income in Jasper County?
Median Household Income in Jasper County is $67,784.
What is Income or Wage Gap in Jasper County?
Income or Wage Gap in Jasper County is 26.4%.
Women in Jasper County earn 73.6 cents for every dollar earned by a man.
What is Inequality or Gini Index in Jasper County?
Inequality or Gini Index in Jasper County is 0.42.
What is the Total Population of Jasper County?
Total Population of Jasper County is 37,808.
What is the Total Male Population of Jasper County?
Total Male Population of Jasper County is 19,739.
What is the Total Female Population of Jasper County?
Total Female Population of Jasper County is 18,069.
What is the Ratio of Males per 100 Females in Jasper County?
There are 109.24 Males per 100 Females in Jasper County.
What is the Ratio of Females per 100 Males in Jasper County?
There are 91.54 Females per 100 Males in Jasper County.
What is the Median Population Age in Jasper County?
Median Population Age in Jasper County is 41.0 Years.
What is the Average Family Size in Jasper County
Average Family Size in Jasper County is 3.0 People.
What is the Average Household Size in Jasper County
Average Household Size in Jasper County is 2.5 People.
How Large is the Labor Force in Jasper County?
There are 19,236 People in the Labor Forcein in Jasper County.
What is the Percentage of People in the Labor Force in Jasper County?
63.2% of People are in the Labor Force in Jasper County.
What is the Unemployment Rate in Jasper County?
Unemployment Rate in Jasper County is 4.8%.