Webster County, IA Map & Demographics
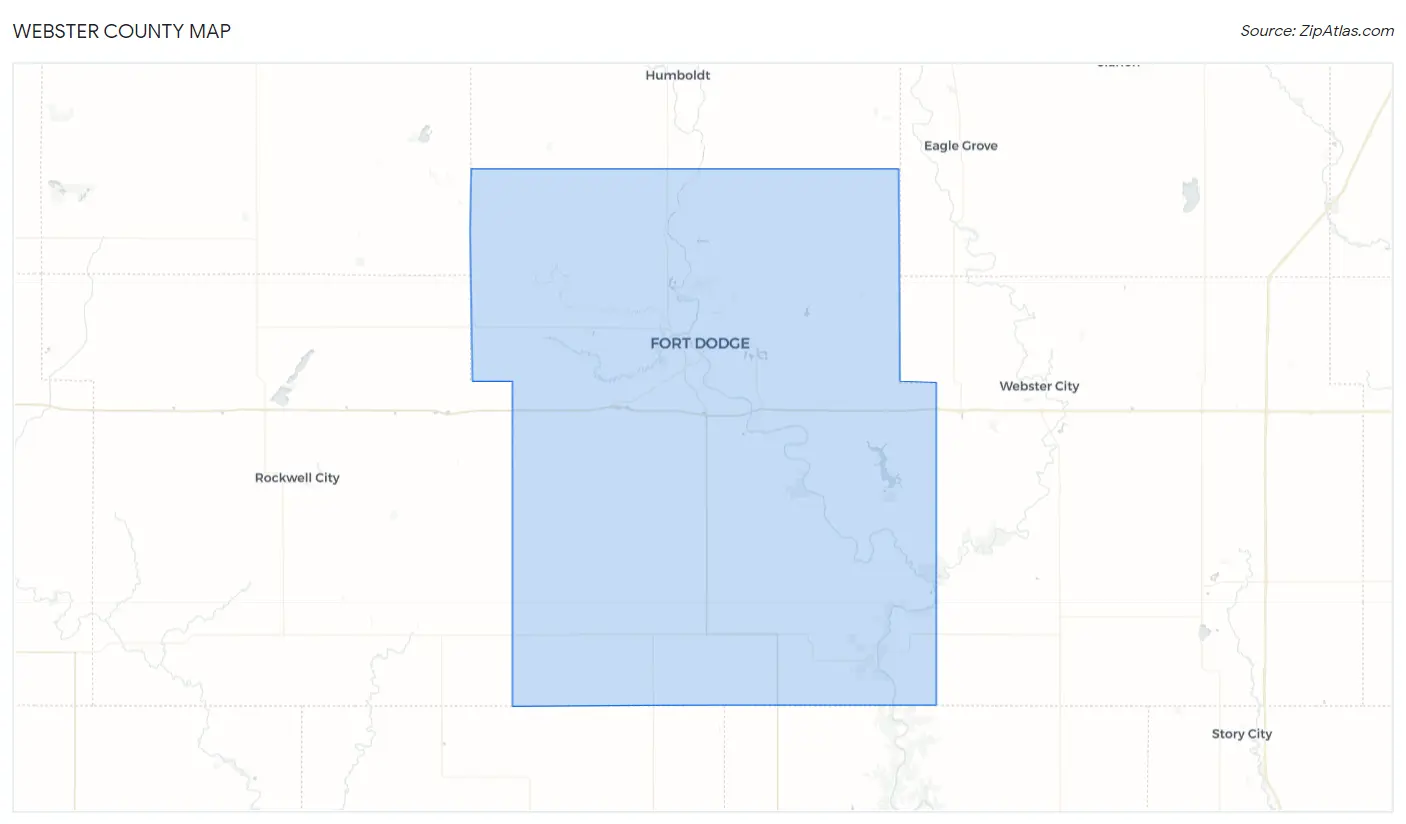
Webster County Map
Webster County Overview
$33,836
PER CAPITA INCOME
$82,733
AVG FAMILY INCOME
$65,335
AVG HOUSEHOLD INCOME
36.5%
WAGE / INCOME GAP [ % ]
63.5¢/ $1
WAGE / INCOME GAP [ $ ]
$10,661
FAMILY INCOME DEFICIT
0.44
INEQUALITY / GINI INDEX
36,986
TOTAL POPULATION
19,367
MALE POPULATION
17,619
FEMALE POPULATION
109.92
MALES / 100 FEMALES
90.97
FEMALES / 100 MALES
39.8
MEDIAN AGE
2.9
AVG FAMILY SIZE
2.2
AVG HOUSEHOLD SIZE
18,358
LABOR FORCE [ PEOPLE ]
60.5%
PERCENT IN LABOR FORCE
3.2%
UNEMPLOYMENT RATE
Webster County Area Codes
Income in Webster County
Income Overview in Webster County
Per Capita Income in Webster County is $33,836, while median incomes of families and households are $82,733 and $65,335 respectively.
| Characteristic | Number | Measure |
| Per Capita Income | 36,986 | $33,836 |
| Median Family Income | 8,691 | $82,733 |
| Mean Family Income | 8,691 | $97,642 |
| Median Household Income | 15,582 | $65,335 |
| Mean Household Income | 15,582 | $79,761 |
| Income Deficit | 8,691 | $10,661 |
| Wage / Income Gap (%) | 36,986 | 36.51% |
| Wage / Income Gap ($) | 36,986 | 63.49¢ per $1 |
| Gini / Inequality Index | 36,986 | 0.44 |
Earnings by Sex in Webster County
Average Earnings in Webster County are $36,676, $46,691 for men and $29,646 for women, a difference of 36.5%.
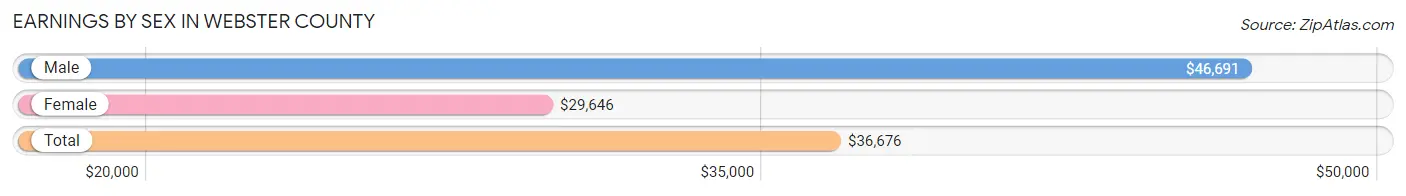
| Sex | Number | Average Earnings |
| Male | 11,374 (55.6%) | $46,691 |
| Female | 9,097 (44.4%) | $29,646 |
| Total | 20,471 (100.0%) | $36,676 |
Earnings by Sex by Income Bracket in Webster County
The most common earnings brackets in Webster County are $75,000 to $99,999 for men (1,585 | 13.9%) and $25,000 to $29,999 for women (886 | 9.7%).
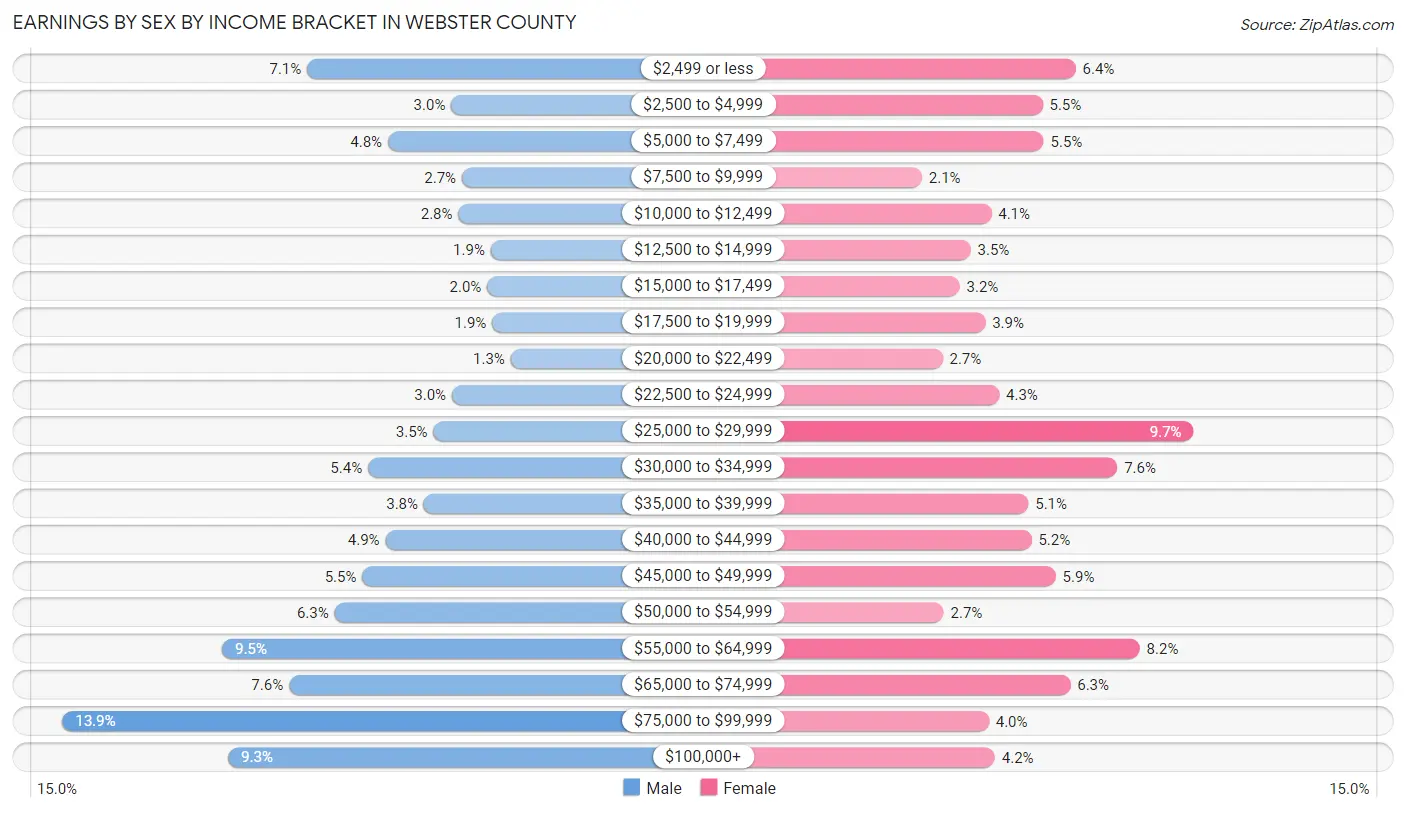
| Income | Male | Female |
| $2,499 or less | 803 (7.1%) | 585 (6.4%) |
| $2,500 to $4,999 | 342 (3.0%) | 500 (5.5%) |
| $5,000 to $7,499 | 545 (4.8%) | 503 (5.5%) |
| $7,500 to $9,999 | 308 (2.7%) | 192 (2.1%) |
| $10,000 to $12,499 | 320 (2.8%) | 369 (4.1%) |
| $12,500 to $14,999 | 216 (1.9%) | 317 (3.5%) |
| $15,000 to $17,499 | 227 (2.0%) | 288 (3.2%) |
| $17,500 to $19,999 | 211 (1.9%) | 354 (3.9%) |
| $20,000 to $22,499 | 152 (1.3%) | 245 (2.7%) |
| $22,500 to $24,999 | 340 (3.0%) | 389 (4.3%) |
| $25,000 to $29,999 | 399 (3.5%) | 886 (9.7%) |
| $30,000 to $34,999 | 609 (5.3%) | 691 (7.6%) |
| $35,000 to $39,999 | 430 (3.8%) | 464 (5.1%) |
| $40,000 to $44,999 | 553 (4.9%) | 472 (5.2%) |
| $45,000 to $49,999 | 627 (5.5%) | 534 (5.9%) |
| $50,000 to $54,999 | 715 (6.3%) | 247 (2.7%) |
| $55,000 to $64,999 | 1,075 (9.5%) | 749 (8.2%) |
| $65,000 to $74,999 | 861 (7.6%) | 571 (6.3%) |
| $75,000 to $99,999 | 1,585 (13.9%) | 363 (4.0%) |
| $100,000+ | 1,056 (9.3%) | 378 (4.2%) |
| Total | 11,374 (100.0%) | 9,097 (100.0%) |
Earnings by Sex by Educational Attainment in Webster County
Average earnings in Webster County are $53,646 for men and $34,287 for women, a difference of 36.1%. Men with an educational attainment of bachelor's degree enjoy the highest average annual earnings of $68,510, while those with high school diploma education earn the least with $46,978. Women with an educational attainment of graduate degree earn the most with the average annual earnings of $71,458, while those with high school diploma education have the smallest earnings of $28,383.
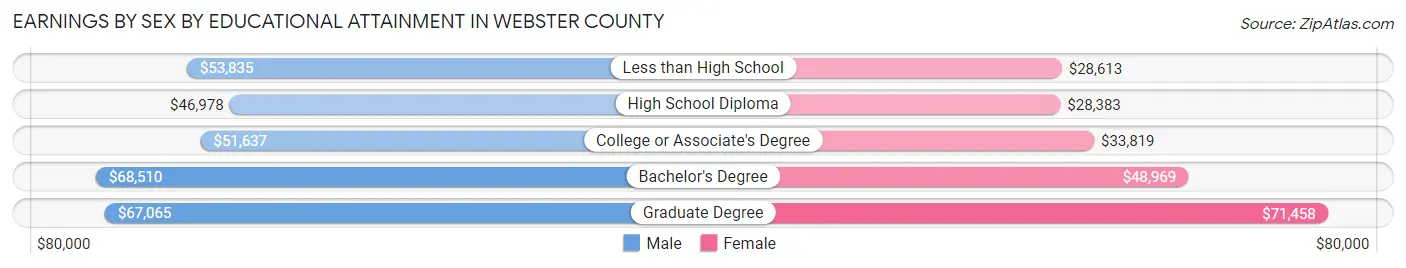
| Educational Attainment | Male Income | Female Income |
| Less than High School | $53,835 | $28,613 |
| High School Diploma | $46,978 | $28,383 |
| College or Associate's Degree | $51,637 | $33,819 |
| Bachelor's Degree | $68,510 | $48,969 |
| Graduate Degree | $67,065 | $71,458 |
| Total | $53,646 | $34,287 |
Family Income in Webster County
Family Income Brackets in Webster County
According to the Webster County family income data, there are 1,973 families falling into the $100,000 to $149,999 income range, which is the most common income bracket and makes up 22.7% of all families. Conversely, the $10,000 to $14,999 income bracket is the least frequent group with only 43 families (0.5%) belonging to this category.
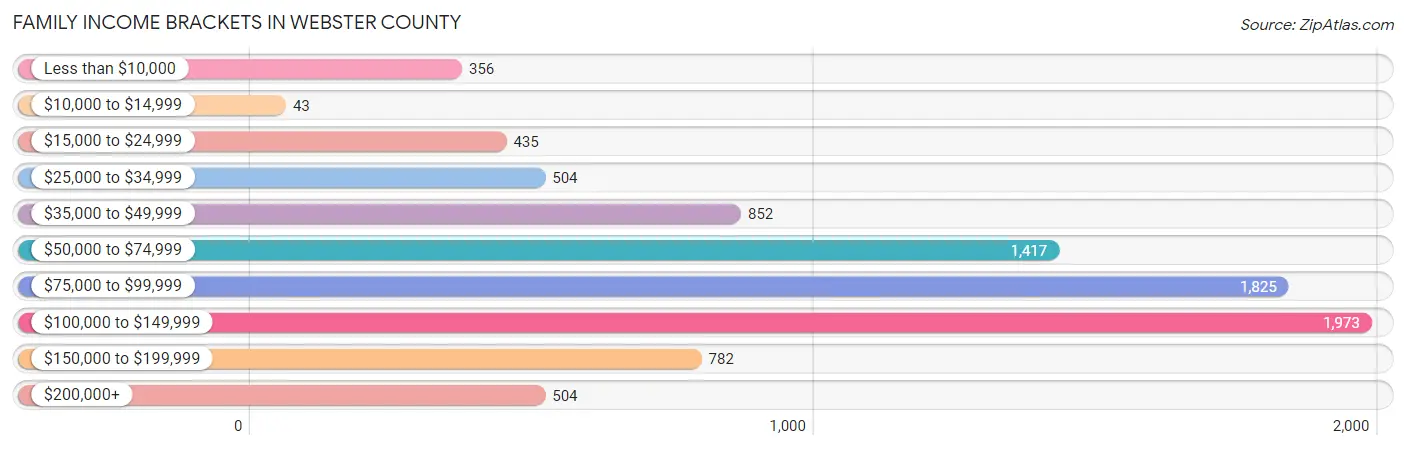
| Income Bracket | # Families | % Families |
| Less than $10,000 | 356 | 4.1% |
| $10,000 to $14,999 | 43 | 0.5% |
| $15,000 to $24,999 | 435 | 5.0% |
| $25,000 to $34,999 | 504 | 5.8% |
| $35,000 to $49,999 | 852 | 9.8% |
| $50,000 to $74,999 | 1,417 | 16.3% |
| $75,000 to $99,999 | 1,825 | 21.0% |
| $100,000 to $149,999 | 1,973 | 22.7% |
| $150,000 to $199,999 | 782 | 9.0% |
| $200,000+ | 504 | 5.8% |
Family Income by Famaliy Size in Webster County
5-person families (678 | 7.8%) account for the highest median family income in Webster County with $107,955 per family, while 2-person families (4,956 | 57.0%) have the highest median income of $38,295 per family member.
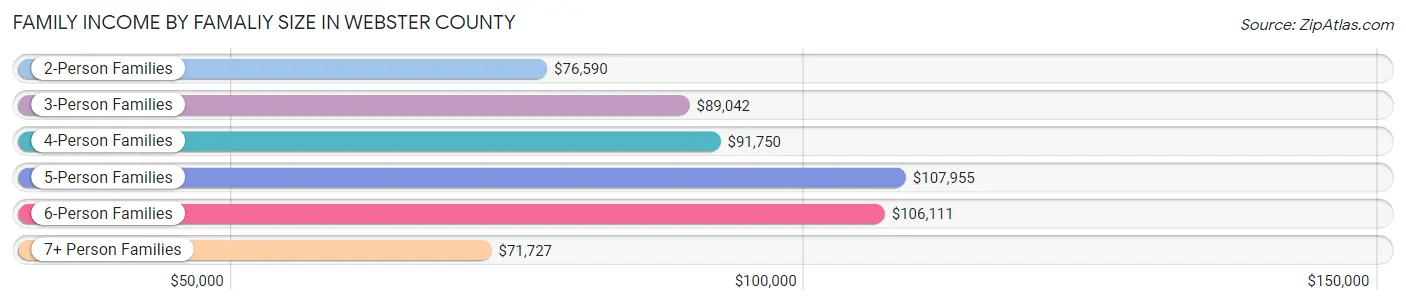
| Income Bracket | # Families | Median Income |
| 2-Person Families | 4,956 (57.0%) | $76,590 |
| 3-Person Families | 1,622 (18.7%) | $89,042 |
| 4-Person Families | 1,167 (13.4%) | $91,750 |
| 5-Person Families | 678 (7.8%) | $107,955 |
| 6-Person Families | 180 (2.1%) | $106,111 |
| 7+ Person Families | 88 (1.0%) | $71,727 |
| Total | 8,691 (100.0%) | $82,733 |
Family Income by Number of Earners in Webster County
The median family income in Webster County is $82,733, with families comprising 3+ earners (957) having the highest median family income of $140,532, while families with no earners (1,306) have the lowest median family income of $47,625, accounting for 11.0% and 15.0% of families, respectively.
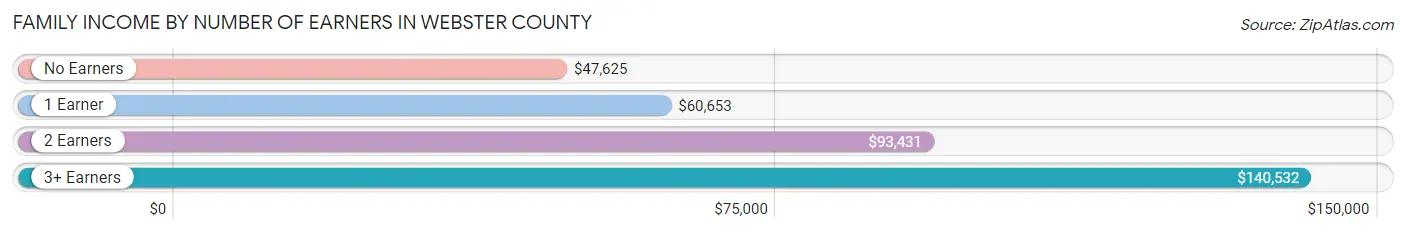
| Number of Earners | # Families | Median Income |
| No Earners | 1,306 (15.0%) | $47,625 |
| 1 Earner | 2,667 (30.7%) | $60,653 |
| 2 Earners | 3,761 (43.3%) | $93,431 |
| 3+ Earners | 957 (11.0%) | $140,532 |
| Total | 8,691 (100.0%) | $82,733 |
Household Income in Webster County
Household Income Brackets in Webster County
With 2,867 households falling in the category, the $50,000 to $74,999 income range is the most frequent in Webster County, accounting for 18.4% of all households. In contrast, only 545 households (3.5%) fall into the $10,000 to $14,999 income bracket, making it the least populous group.
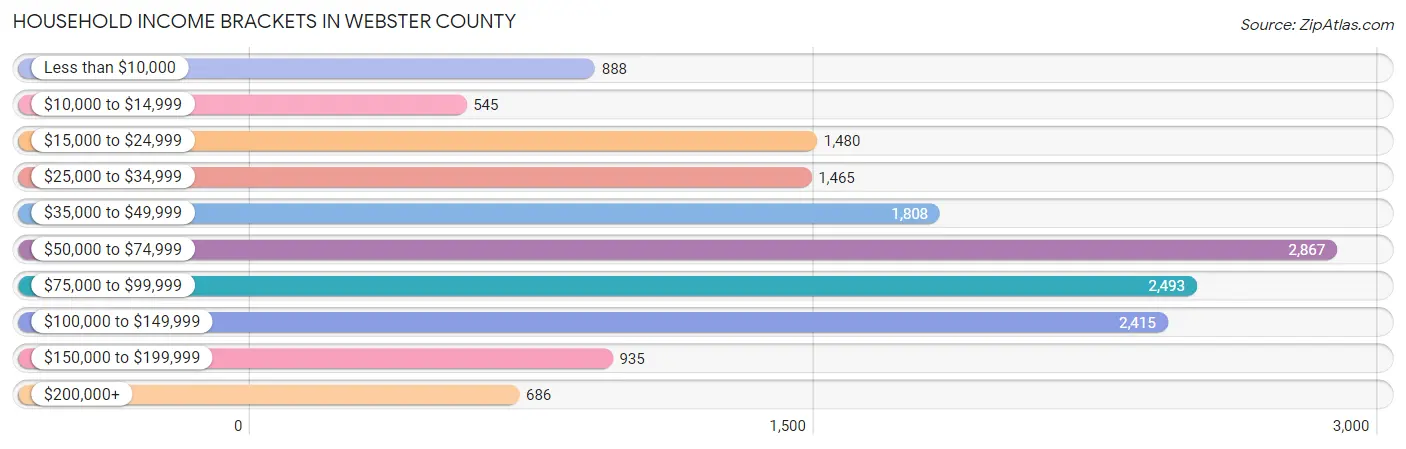
| Income Bracket | # Households | % Households |
| Less than $10,000 | 888 | 5.7% |
| $10,000 to $14,999 | 545 | 3.5% |
| $15,000 to $24,999 | 1,480 | 9.5% |
| $25,000 to $34,999 | 1,465 | 9.4% |
| $35,000 to $49,999 | 1,808 | 11.6% |
| $50,000 to $74,999 | 2,867 | 18.4% |
| $75,000 to $99,999 | 2,493 | 16.0% |
| $100,000 to $149,999 | 2,415 | 15.5% |
| $150,000 to $199,999 | 935 | 6.0% |
| $200,000+ | 686 | 4.4% |
Household Income by Householder Age in Webster County
The median household income in Webster County is $65,335, with the highest median household income of $78,599 found in the 45 to 64 years age bracket for the primary householder. A total of 5,429 households (34.8%) fall into this category. Meanwhile, the 65+ years age bracket for the primary householder has the lowest median household income of $40,670, with 4,705 households (30.2%) in this group.
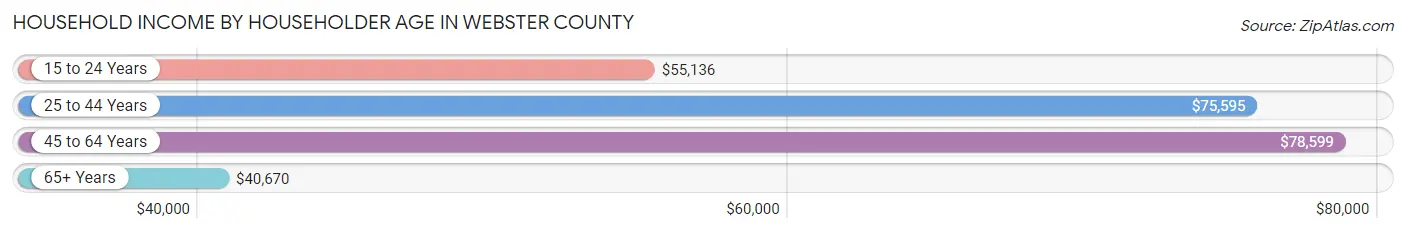
| Income Bracket | # Households | Median Income |
| 15 to 24 Years | 891 (5.7%) | $55,136 |
| 25 to 44 Years | 4,557 (29.2%) | $75,595 |
| 45 to 64 Years | 5,429 (34.8%) | $78,599 |
| 65+ Years | 4,705 (30.2%) | $40,670 |
| Total | 15,582 (100.0%) | $65,335 |
Poverty in Webster County
Income Below Poverty by Sex and Age in Webster County
With 8.3% poverty level for males and 16.2% for females among the residents of Webster County, 75 year old and over males and 12 to 14 year old females are the most vulnerable to poverty, with 144 males (12.0%) and 374 females (49.7%) in their respective age groups living below the poverty level.
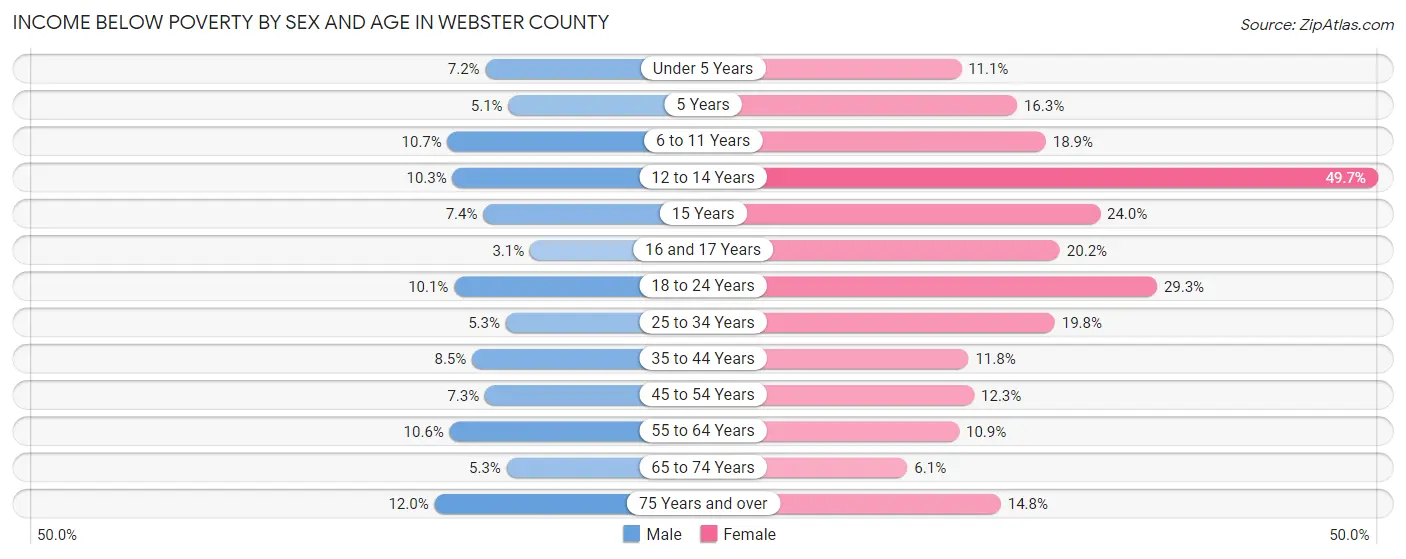
| Age Bracket | Male | Female |
| Under 5 Years | 80 (7.2%) | 106 (11.1%) |
| 5 Years | 10 (5.1%) | 20 (16.3%) |
| 6 to 11 Years | 147 (10.7%) | 203 (18.9%) |
| 12 to 14 Years | 58 (10.3%) | 374 (49.7%) |
| 15 Years | 11 (7.4%) | 35 (24.0%) |
| 16 and 17 Years | 15 (3.1%) | 119 (20.2%) |
| 18 to 24 Years | 182 (10.1%) | 392 (29.2%) |
| 25 to 34 Years | 119 (5.3%) | 373 (19.8%) |
| 35 to 44 Years | 170 (8.5%) | 211 (11.8%) |
| 45 to 54 Years | 139 (7.3%) | 246 (12.3%) |
| 55 to 64 Years | 263 (10.5%) | 270 (10.9%) |
| 65 to 74 Years | 96 (5.3%) | 123 (6.1%) |
| 75 Years and over | 144 (12.0%) | 245 (14.8%) |
| Total | 1,434 (8.3%) | 2,717 (16.2%) |
Income Above Poverty by Sex and Age in Webster County
According to the poverty statistics in Webster County, males aged 16 and 17 years and females aged 65 to 74 years are the age groups that are most secure financially, with 96.9% of males and 93.9% of females in these age groups living above the poverty line.
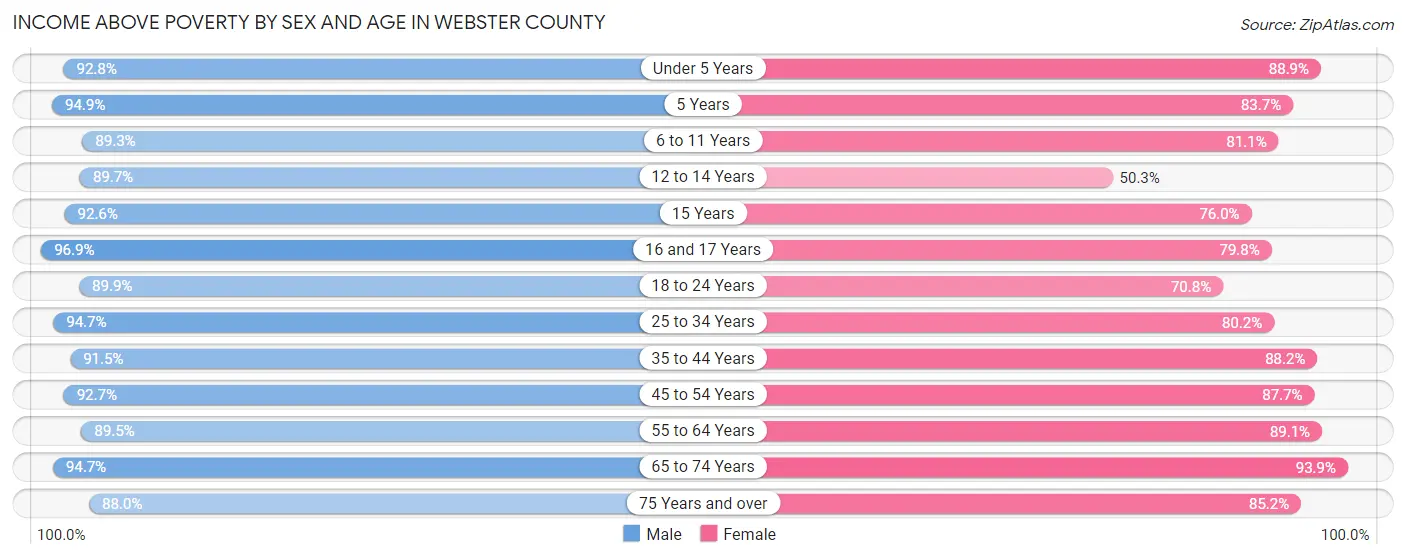
| Age Bracket | Male | Female |
| Under 5 Years | 1,027 (92.8%) | 851 (88.9%) |
| 5 Years | 186 (94.9%) | 103 (83.7%) |
| 6 to 11 Years | 1,222 (89.3%) | 869 (81.1%) |
| 12 to 14 Years | 506 (89.7%) | 378 (50.3%) |
| 15 Years | 137 (92.6%) | 111 (76.0%) |
| 16 and 17 Years | 471 (96.9%) | 469 (79.8%) |
| 18 to 24 Years | 1,614 (89.9%) | 948 (70.8%) |
| 25 to 34 Years | 2,109 (94.7%) | 1,514 (80.2%) |
| 35 to 44 Years | 1,838 (91.5%) | 1,583 (88.2%) |
| 45 to 54 Years | 1,773 (92.7%) | 1,757 (87.7%) |
| 55 to 64 Years | 2,230 (89.4%) | 2,211 (89.1%) |
| 65 to 74 Years | 1,729 (94.7%) | 1,897 (93.9%) |
| 75 Years and over | 1,060 (88.0%) | 1,415 (85.2%) |
| Total | 15,902 (91.7%) | 14,106 (83.9%) |
Income Below Poverty Among Married-Couple Families in Webster County
The poverty statistics for married-couple families in Webster County show that 4.6% or 293 of the total 6,427 families live below the poverty line. Families with no children have the highest poverty rate of 5.1%, comprising of 217 families. On the other hand, families with 5 or more children have the lowest poverty rate of 0.0%, which includes 0 families.
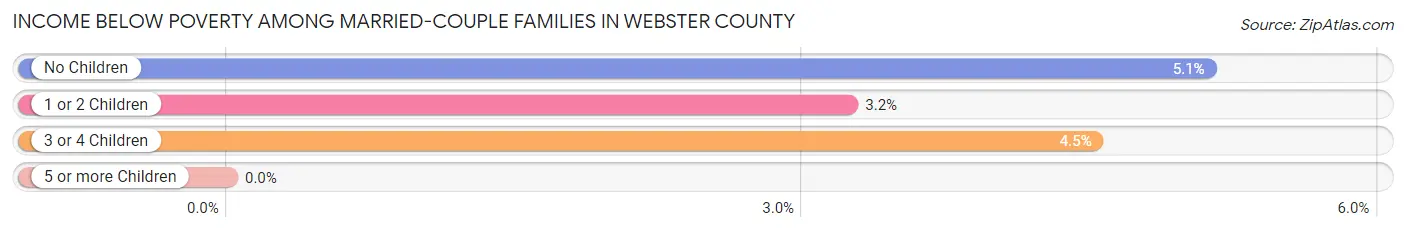
| Children | Above Poverty | Below Poverty |
| No Children | 4,030 (94.9%) | 217 (5.1%) |
| 1 or 2 Children | 1,464 (96.8%) | 49 (3.2%) |
| 3 or 4 Children | 570 (95.5%) | 27 (4.5%) |
| 5 or more Children | 70 (100.0%) | 0 (0.0%) |
| Total | 6,134 (95.4%) | 293 (4.6%) |
Income Below Poverty Among Single-Parent Households in Webster County
According to the poverty data in Webster County, 3.0% or 29 single-father households and 20.7% or 268 single-mother households are living below the poverty line. Among single-father households, those with 3 or 4 children have the highest poverty rate, with 16 households (29.6%) experiencing poverty. Likewise, among single-mother households, those with 5 or more children have the highest poverty rate, with 1 households (100.0%) falling below the poverty line.
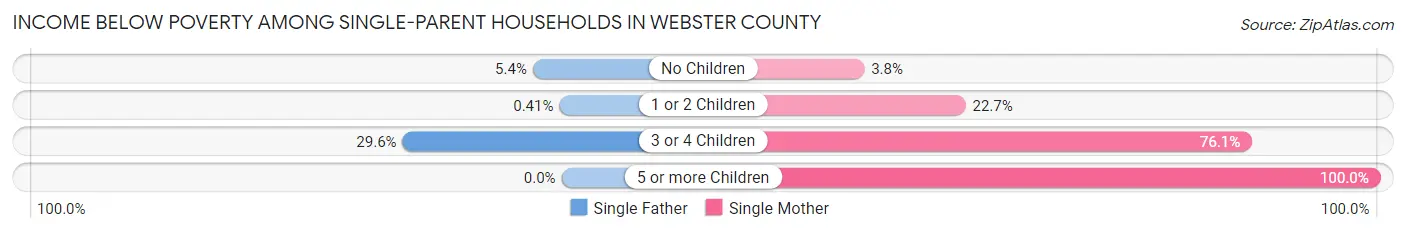
| Children | Single Father | Single Mother |
| No Children | 10 (5.3%) | 18 (3.8%) |
| 1 or 2 Children | 3 (0.4%) | 160 (22.7%) |
| 3 or 4 Children | 16 (29.6%) | 89 (76.1%) |
| 5 or more Children | 0 (0.0%) | 1 (100.0%) |
| Total | 29 (3.0%) | 268 (20.7%) |
Income Below Poverty Among Married-Couple vs Single-Parent Households in Webster County
The poverty data for Webster County shows that 293 of the married-couple family households (4.6%) and 297 of the single-parent households (13.1%) are living below the poverty level. Within the married-couple family households, those with no children have the highest poverty rate, with 217 households (5.1%) falling below the poverty line. Among the single-parent households, those with 5 or more children have the highest poverty rate, with 1 household (100.0%) living below poverty.
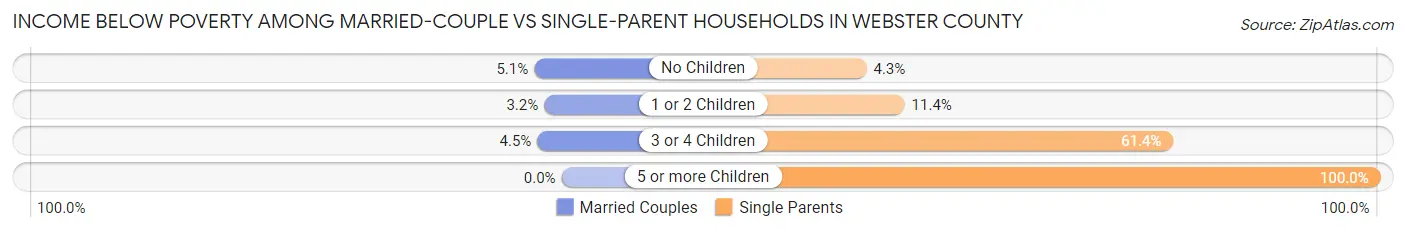
| Children | Married-Couple Families | Single-Parent Households |
| No Children | 217 (5.1%) | 28 (4.3%) |
| 1 or 2 Children | 49 (3.2%) | 163 (11.4%) |
| 3 or 4 Children | 27 (4.5%) | 105 (61.4%) |
| 5 or more Children | 0 (0.0%) | 1 (100.0%) |
| Total | 293 (4.6%) | 297 (13.1%) |
Race in Webster County
The most populous races in Webster County are White / Caucasian (32,373 | 87.5%), Hispanic or Latino (2,173 | 5.9%), and Two or more Races (2,101 | 5.7%).
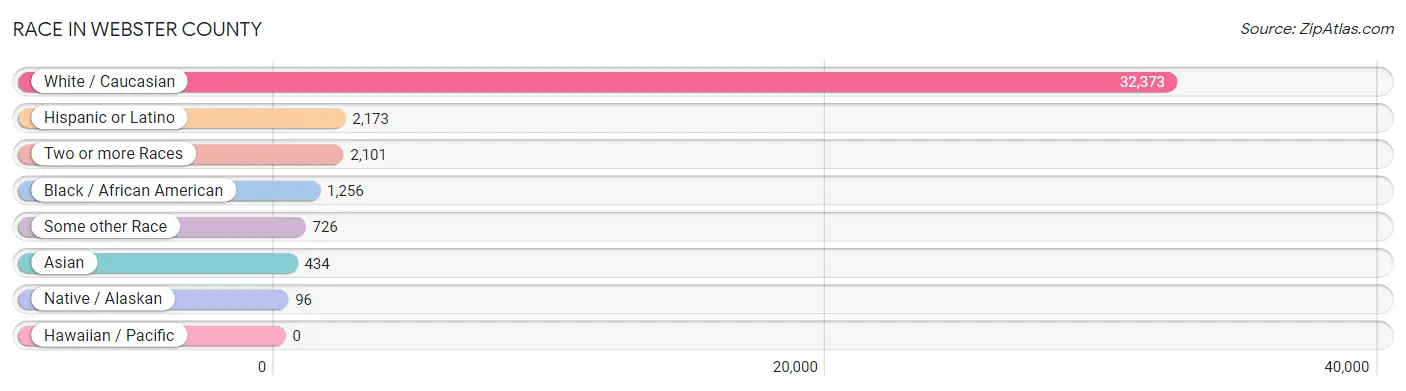
| Race | # Population | % Population |
| Asian | 434 | 1.2% |
| Black / African American | 1,256 | 3.4% |
| Hawaiian / Pacific | 0 | 0.0% |
| Hispanic or Latino | 2,173 | 5.9% |
| Native / Alaskan | 96 | 0.3% |
| White / Caucasian | 32,373 | 87.5% |
| Two or more Races | 2,101 | 5.7% |
| Some other Race | 726 | 2.0% |
| Total | 36,986 | 100.0% |
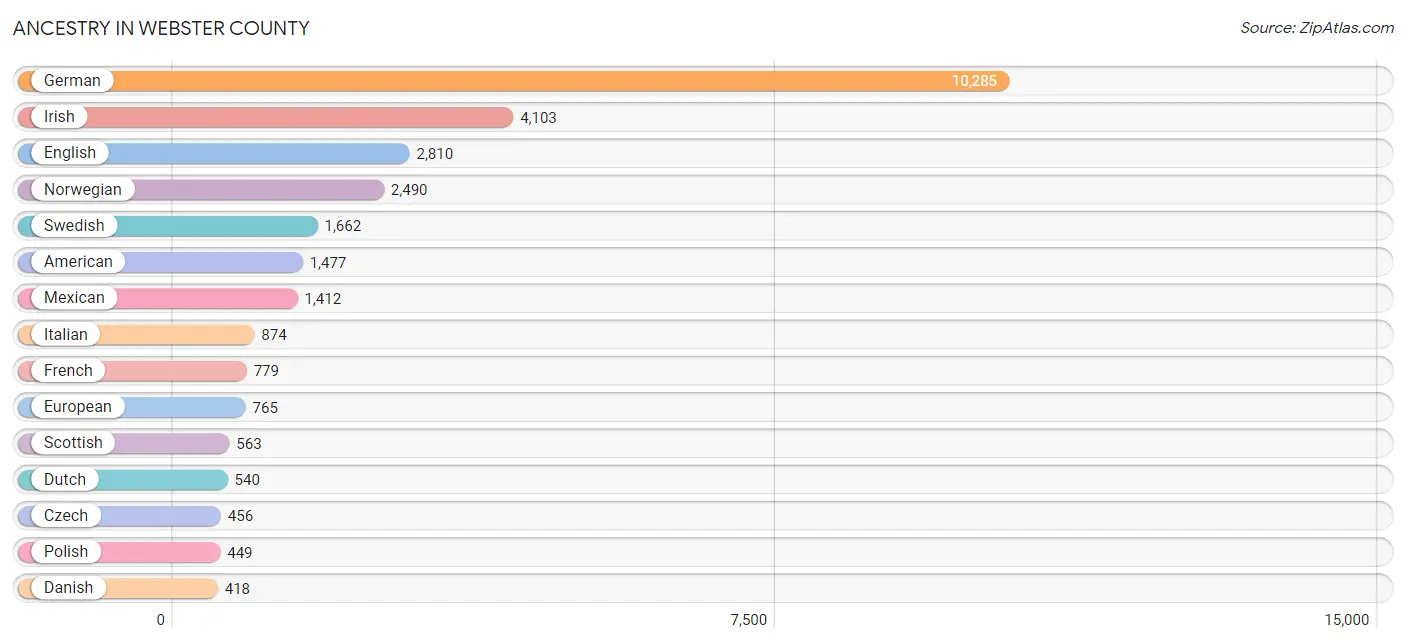
Ancestry in Webster County
The most populous ancestries reported in Webster County are German (10,285 | 27.8%), Irish (4,103 | 11.1%), English (2,810 | 7.6%), Norwegian (2,490 | 6.7%), and Swedish (1,662 | 4.5%), together accounting for 57.7% of all Webster County residents.
| Ancestry | # Population | % Population |
| African | 52 | 0.1% |
| Alaska Native | 28 | 0.1% |
| American | 1,477 | 4.0% |
| Arab | 35 | 0.1% |
| Australian | 43 | 0.1% |
| Austrian | 10 | 0.0% |
| Belgian | 21 | 0.1% |
| Bhutanese | 4 | 0.0% |
| Blackfeet | 20 | 0.1% |
| British | 98 | 0.3% |
| Bulgarian | 2 | 0.0% |
| Burmese | 232 | 0.6% |
| Canadian | 27 | 0.1% |
| Central American | 116 | 0.3% |
| Cherokee | 42 | 0.1% |
| Chickasaw | 1 | 0.0% |
| Chilean | 23 | 0.1% |
| Chippewa | 9 | 0.0% |
| Colombian | 3 | 0.0% |
| Cuban | 11 | 0.0% |
| Czech | 456 | 1.2% |
| Czechoslovakian | 77 | 0.2% |
| Danish | 418 | 1.1% |
| Dutch | 540 | 1.5% |
| Eastern European | 44 | 0.1% |
| English | 2,810 | 7.6% |
| European | 765 | 2.1% |
| Finnish | 6 | 0.0% |
| French | 779 | 2.1% |
| French Canadian | 15 | 0.0% |
| German | 10,285 | 27.8% |
| German Russian | 5 | 0.0% |
| Greek | 19 | 0.1% |
| Guamanian / Chamorro | 15 | 0.0% |
| Guatemalan | 91 | 0.3% |
| Haitian | 56 | 0.2% |
| Honduran | 3 | 0.0% |
| Hungarian | 17 | 0.1% |
| Icelander | 6 | 0.0% |
| Indian (Asian) | 133 | 0.4% |
| Irish | 4,103 | 11.1% |
| Italian | 874 | 2.4% |
| Jamaican | 14 | 0.0% |
| Japanese | 27 | 0.1% |
| Kenyan | 37 | 0.1% |
| Korean | 88 | 0.2% |
| Lebanese | 30 | 0.1% |
| Lithuanian | 25 | 0.1% |
| Luxembourger | 7 | 0.0% |
| Mexican | 1,412 | 3.8% |
| Mexican American Indian | 2 | 0.0% |
| Moroccan | 5 | 0.0% |
| Navajo | 28 | 0.1% |
| Nigerian | 36 | 0.1% |
| Northern European | 27 | 0.1% |
| Norwegian | 2,490 | 6.7% |
| Pakistani | 17 | 0.1% |
| Pennsylvania German | 3 | 0.0% |
| Polish | 449 | 1.2% |
| Portuguese | 21 | 0.1% |
| Puerto Rican | 123 | 0.3% |
| Romanian | 3 | 0.0% |
| Russian | 89 | 0.2% |
| Salvadoran | 22 | 0.1% |
| Scandinavian | 182 | 0.5% |
| Scotch-Irish | 214 | 0.6% |
| Scottish | 563 | 1.5% |
| Sioux | 4 | 0.0% |
| Slavic | 1 | 0.0% |
| Slovene | 18 | 0.1% |
| Somali | 2 | 0.0% |
| South American | 30 | 0.1% |
| Spaniard | 52 | 0.1% |
| Spanish | 221 | 0.6% |
| Sri Lankan | 31 | 0.1% |
| Subsaharan African | 138 | 0.4% |
| Sudanese | 11 | 0.0% |
| Swedish | 1,662 | 4.5% |
| Swiss | 82 | 0.2% |
| Ukrainian | 5 | 0.0% |
| Uruguayan | 4 | 0.0% |
| Welsh | 207 | 0.6% |
| West Indian | 5 | 0.0% |
| Yugoslavian | 31 | 0.1% | View All 84 Rows |
Immigrants in Webster County
The most numerous immigrant groups reported in Webster County came from Latin America (423 | 1.1%), Central America (376 | 1.0%), Mexico (347 | 0.9%), Asia (306 | 0.8%), and Eastern Asia (156 | 0.4%), together accounting for 4.4% of all Webster County residents.
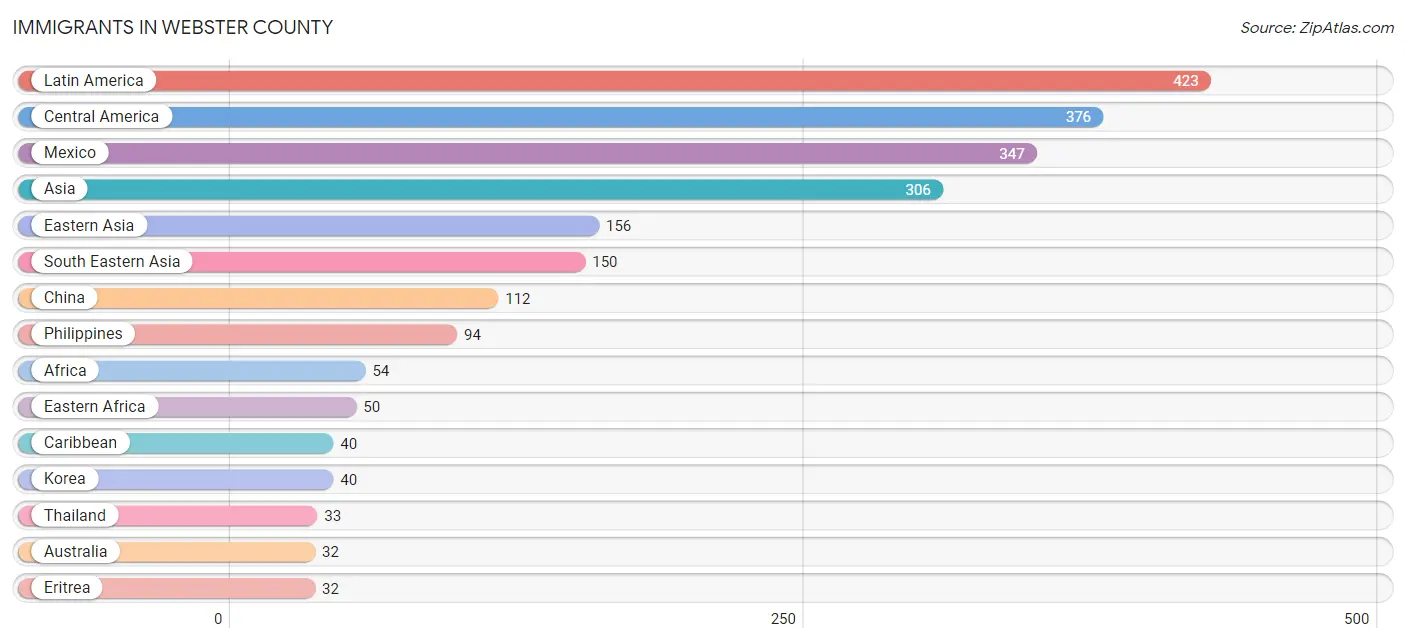
| Immigration Origin | # Population | % Population |
| Africa | 54 | 0.2% |
| Asia | 306 | 0.8% |
| Australia | 32 | 0.1% |
| Bosnia and Herzegovina | 5 | 0.0% |
| Canada | 7 | 0.0% |
| Caribbean | 40 | 0.1% |
| Central America | 376 | 1.0% |
| China | 112 | 0.3% |
| Colombia | 3 | 0.0% |
| Eastern Africa | 50 | 0.1% |
| Eastern Asia | 156 | 0.4% |
| Eastern Europe | 10 | 0.0% |
| El Salvador | 4 | 0.0% |
| Eritrea | 32 | 0.1% |
| Europe | 24 | 0.1% |
| France | 4 | 0.0% |
| Germany | 2 | 0.0% |
| Guatemala | 22 | 0.1% |
| Haiti | 24 | 0.1% |
| Honduras | 3 | 0.0% |
| Jamaica | 16 | 0.0% |
| Japan | 4 | 0.0% |
| Kenya | 18 | 0.1% |
| Korea | 40 | 0.1% |
| Latin America | 423 | 1.1% |
| Mexico | 347 | 0.9% |
| Northern Europe | 8 | 0.0% |
| Norway | 1 | 0.0% |
| Oceania | 32 | 0.1% |
| Philippines | 94 | 0.3% |
| Russia | 5 | 0.0% |
| Scotland | 5 | 0.0% |
| South America | 7 | 0.0% |
| South Eastern Asia | 150 | 0.4% |
| Thailand | 33 | 0.1% |
| Uruguay | 4 | 0.0% |
| Vietnam | 23 | 0.1% |
| Western Africa | 4 | 0.0% |
| Western Europe | 6 | 0.0% | View All 39 Rows |
Sex and Age in Webster County
Sex and Age in Webster County
The most populous age groups in Webster County are 15 to 19 Years (1,588 | 8.2%) for men and 65 to 69 Years (1,308 | 7.4%) for women.
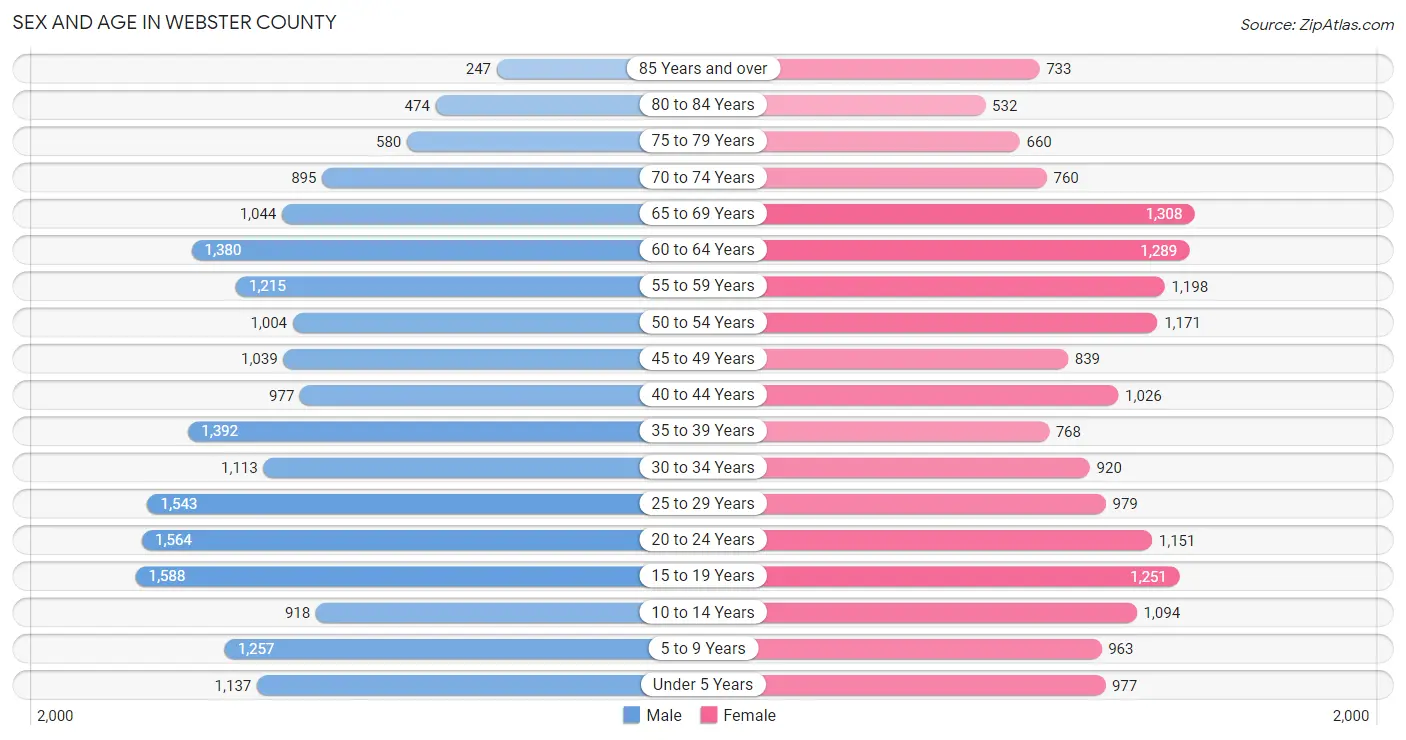
| Age Bracket | Male | Female |
| Under 5 Years | 1,137 (5.9%) | 977 (5.6%) |
| 5 to 9 Years | 1,257 (6.5%) | 963 (5.5%) |
| 10 to 14 Years | 918 (4.7%) | 1,094 (6.2%) |
| 15 to 19 Years | 1,588 (8.2%) | 1,251 (7.1%) |
| 20 to 24 Years | 1,564 (8.1%) | 1,151 (6.5%) |
| 25 to 29 Years | 1,543 (8.0%) | 979 (5.6%) |
| 30 to 34 Years | 1,113 (5.8%) | 920 (5.2%) |
| 35 to 39 Years | 1,392 (7.2%) | 768 (4.4%) |
| 40 to 44 Years | 977 (5.0%) | 1,026 (5.8%) |
| 45 to 49 Years | 1,039 (5.4%) | 839 (4.8%) |
| 50 to 54 Years | 1,004 (5.2%) | 1,171 (6.7%) |
| 55 to 59 Years | 1,215 (6.3%) | 1,198 (6.8%) |
| 60 to 64 Years | 1,380 (7.1%) | 1,289 (7.3%) |
| 65 to 69 Years | 1,044 (5.4%) | 1,308 (7.4%) |
| 70 to 74 Years | 895 (4.6%) | 760 (4.3%) |
| 75 to 79 Years | 580 (3.0%) | 660 (3.7%) |
| 80 to 84 Years | 474 (2.5%) | 532 (3.0%) |
| 85 Years and over | 247 (1.3%) | 733 (4.2%) |
| Total | 19,367 (100.0%) | 17,619 (100.0%) |
Families and Households in Webster County
Median Family Size in Webster County
The median family size in Webster County is 2.87 persons per family, with married-couple families (6,427 | 74.0%) accounting for the largest median family size of 2.95 persons per family. On the other hand, single male/father families (971 | 11.2%) represent the smallest median family size with 2.33 persons per family.
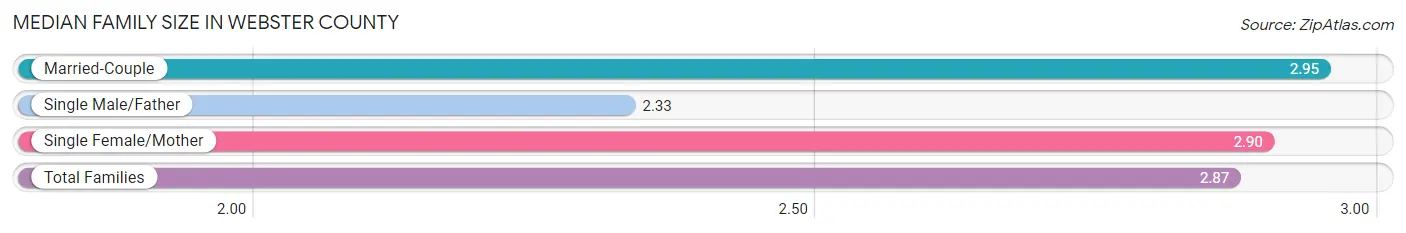
| Family Type | # Families | Family Size |
| Married-Couple | 6,427 (74.0%) | 2.95 |
| Single Male/Father | 971 (11.2%) | 2.33 |
| Single Female/Mother | 1,293 (14.9%) | 2.90 |
| Total Families | 8,691 (100.0%) | 2.87 |
Median Household Size in Webster County
The median household size in Webster County is 2.19 persons per household, with single female/mother households (1,293 | 8.3%) accounting for the largest median household size of 3.16 persons per household. non-family households (6,891 | 44.2%) represent the smallest median household size with 1.17 persons per household.
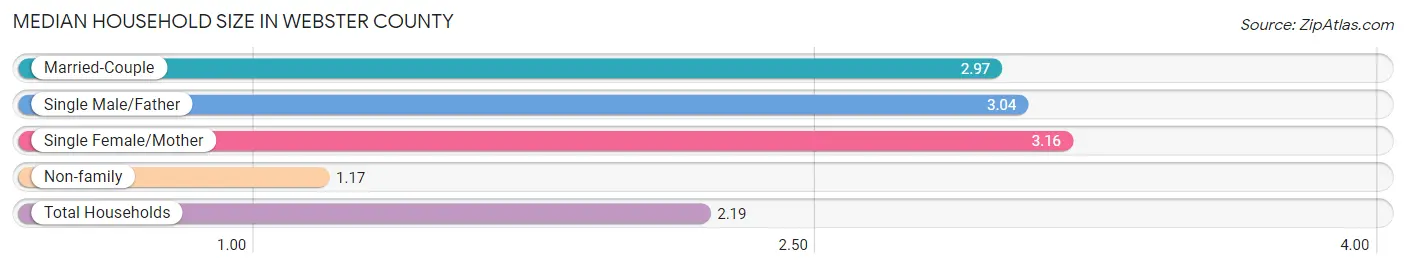
| Household Type | # Households | Household Size |
| Married-Couple | 6,427 (41.2%) | 2.97 |
| Single Male/Father | 971 (6.2%) | 3.04 |
| Single Female/Mother | 1,293 (8.3%) | 3.16 |
| Non-family | 6,891 (44.2%) | 1.17 |
| Total Households | 15,582 (100.0%) | 2.19 |
Household Size by Marriage Status in Webster County
Out of a total of 15,582 households in Webster County, 8,691 (55.8%) are family households, while 6,891 (44.2%) are nonfamily households. The most numerous type of family households are 2-person households, comprising 4,378, and the most common type of nonfamily households are 1-person households, comprising 5,634.
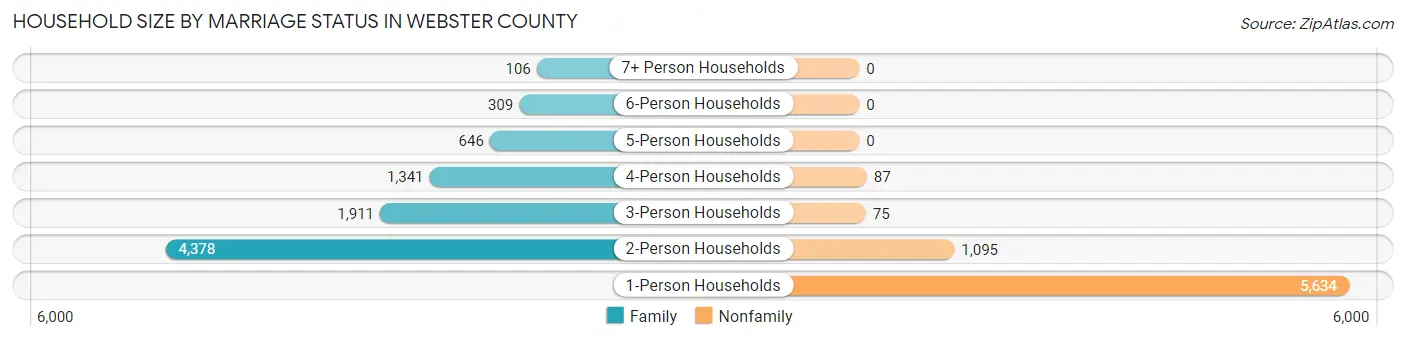
| Household Size | Family Households | Nonfamily Households |
| 1-Person Households | - | 5,634 (36.2%) |
| 2-Person Households | 4,378 (28.1%) | 1,095 (7.0%) |
| 3-Person Households | 1,911 (12.3%) | 75 (0.5%) |
| 4-Person Households | 1,341 (8.6%) | 87 (0.6%) |
| 5-Person Households | 646 (4.2%) | 0 (0.0%) |
| 6-Person Households | 309 (2.0%) | 0 (0.0%) |
| 7+ Person Households | 106 (0.7%) | 0 (0.0%) |
| Total | 8,691 (55.8%) | 6,891 (44.2%) |
Female Fertility in Webster County
Fertility by Age in Webster County
Average fertility rate in Webster County is 85.0 births per 1,000 women. Women in the age bracket of 20 to 34 years have the highest fertility rate with 184.0 births per 1,000 women. Women in the age bracket of 20 to 34 years acount for 93.2% of all women with births.
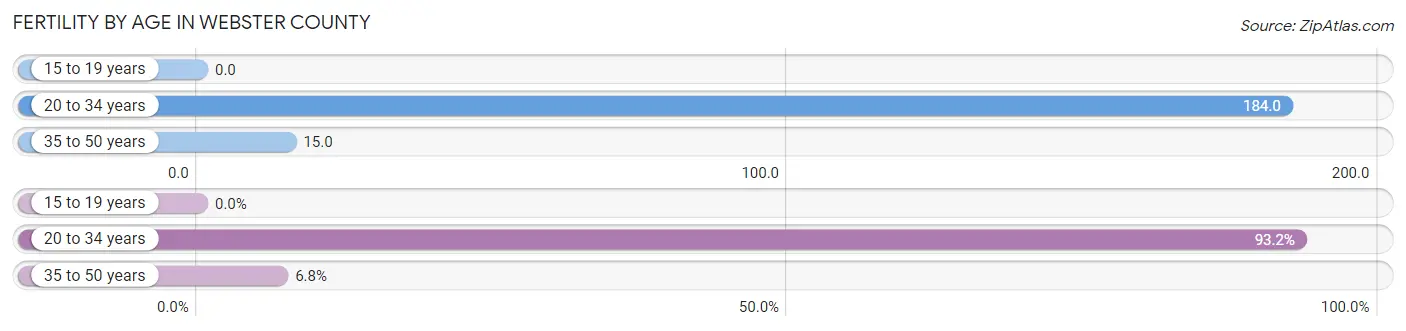
| Age Bracket | Women with Births | Births / 1,000 Women |
| 15 to 19 years | 0 (0.0%) | 0.0 |
| 20 to 34 years | 562 (93.2%) | 184.0 |
| 35 to 50 years | 41 (6.8%) | 15.0 |
| Total | 603 (100.0%) | 85.0 |
Fertility by Age by Marriage Status in Webster County
54.6% of women with births (603) in Webster County are married. The highest percentage of unmarried women with births falls into 20 to 34 years age bracket with 47.0% of them unmarried at the time of birth, while the lowest percentage of unmarried women with births belong to 35 to 50 years age bracket with 24.4% of them unmarried.
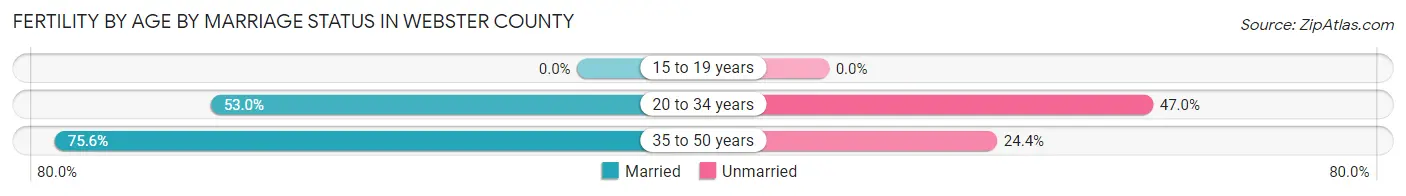
| Age Bracket | Married | Unmarried |
| 15 to 19 years | 0 (0.0%) | 0 (0.0%) |
| 20 to 34 years | 298 (53.0%) | 264 (47.0%) |
| 35 to 50 years | 31 (75.6%) | 10 (24.4%) |
| Total | 329 (54.6%) | 274 (45.4%) |
Fertility by Education in Webster County
Average fertility rate in Webster County is 85.0 births per 1,000 women. Women with the education attainment of high school diploma have the highest fertility rate of 115.0 births per 1,000 women, while women with the education attainment of less than high school have the lowest fertility at 33.0 births per 1,000 women. Women with the education attainment of college or associate's degree represent 48.4% of all women with births.
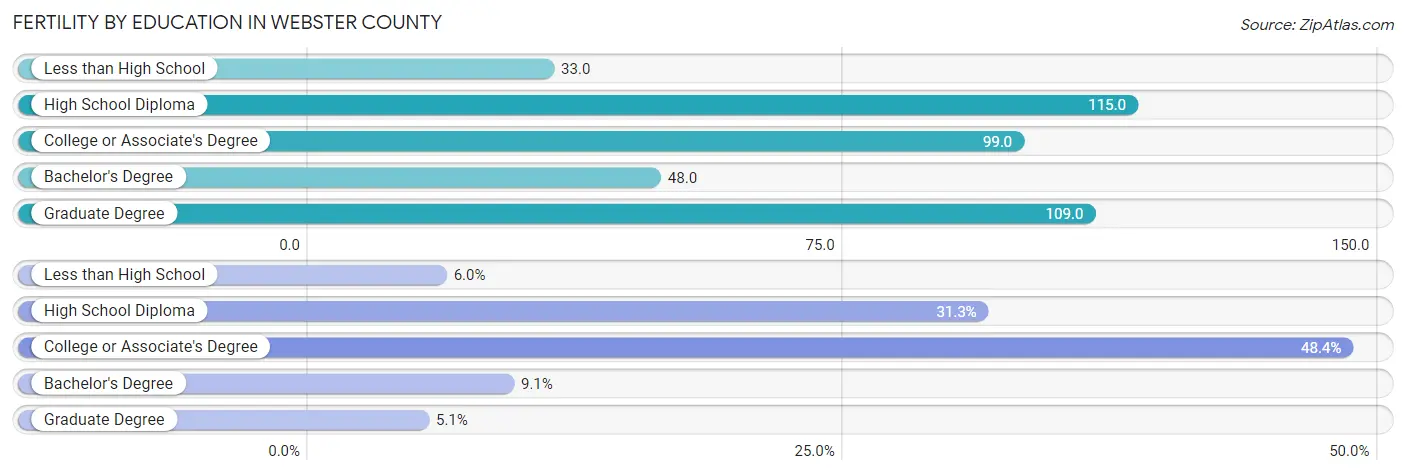
| Educational Attainment | Women with Births | Births / 1,000 Women |
| Less than High School | 36 (6.0%) | 33.0 |
| High School Diploma | 189 (31.3%) | 115.0 |
| College or Associate's Degree | 292 (48.4%) | 99.0 |
| Bachelor's Degree | 55 (9.1%) | 48.0 |
| Graduate Degree | 31 (5.1%) | 109.0 |
| Total | 603 (100.0%) | 85.0 |
Fertility by Education by Marriage Status in Webster County
45.4% of women with births in Webster County are unmarried. Women with the educational attainment of bachelor's degree are most likely to be married with 100.0% of them married at childbirth, while women with the educational attainment of less than high school are least likely to be married with 97.2% of them unmarried at childbirth.
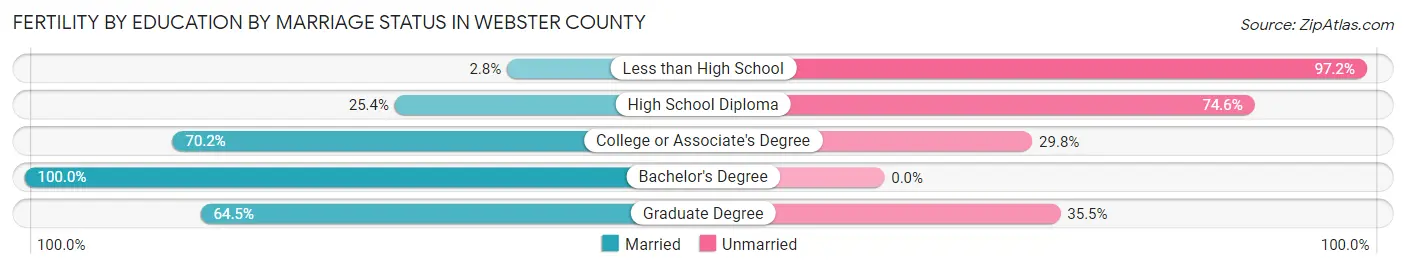
| Educational Attainment | Married | Unmarried |
| Less than High School | 1 (2.8%) | 35 (97.2%) |
| High School Diploma | 48 (25.4%) | 141 (74.6%) |
| College or Associate's Degree | 205 (70.2%) | 87 (29.8%) |
| Bachelor's Degree | 55 (100.0%) | 0 (0.0%) |
| Graduate Degree | 20 (64.5%) | 11 (35.5%) |
| Total | 329 (54.6%) | 274 (45.4%) |
Employment Characteristics in Webster County
Employment by Class of Employer in Webster County
Among the 17,470 employed individuals in Webster County, private company employees (11,393 | 65.2%), not-for-profit organizations (1,886 | 10.8%), and local government employees (1,241 | 7.1%) make up the most common classes of employment.
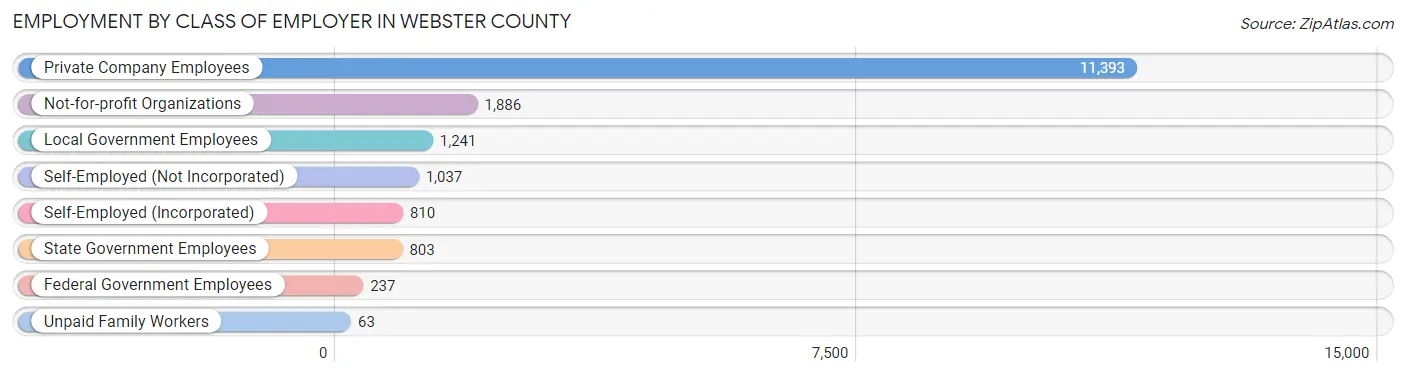
| Employer Class | # Employees | % Employees |
| Private Company Employees | 11,393 | 65.2% |
| Self-Employed (Incorporated) | 810 | 4.6% |
| Self-Employed (Not Incorporated) | 1,037 | 5.9% |
| Not-for-profit Organizations | 1,886 | 10.8% |
| Local Government Employees | 1,241 | 7.1% |
| State Government Employees | 803 | 4.6% |
| Federal Government Employees | 237 | 1.4% |
| Unpaid Family Workers | 63 | 0.4% |
| Total | 17,470 | 100.0% |
Employment Status by Age in Webster County
According to the labor force statistics for Webster County, out of the total population over 16 years of age (30,344), 60.5% or 18,358 individuals are in the labor force, with 3.2% or 587 of them unemployed. The age group with the highest labor force participation rate is 45 to 54 years, with 83.1% or 3,368 individuals in the labor force. Within the labor force, the 20 to 24 years age range has the highest percentage of unemployed individuals, with 7.6% or 152 of them being unemployed.
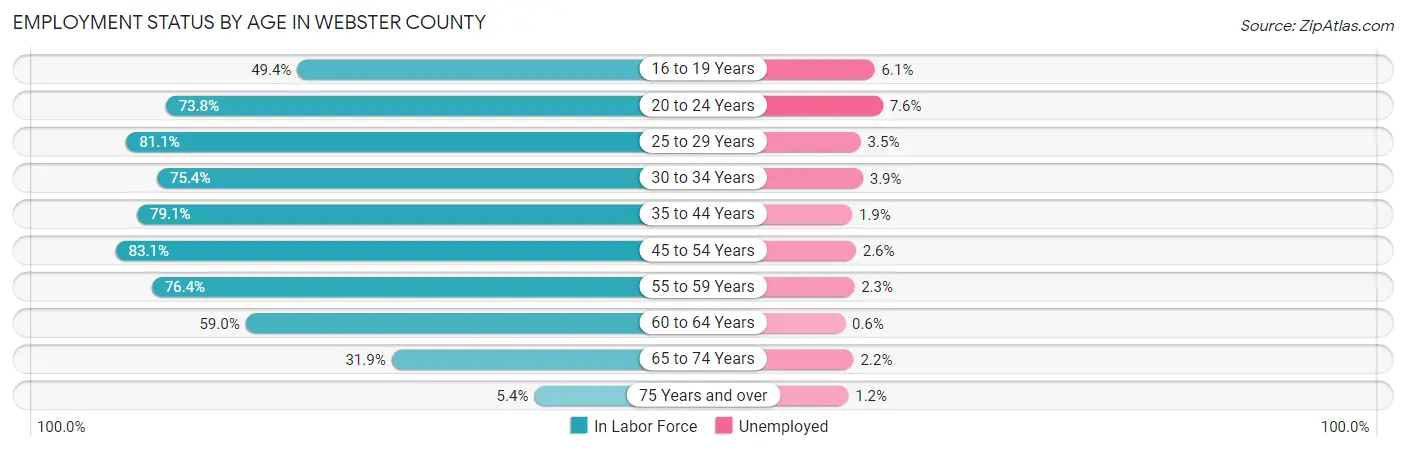
| Age Bracket | In Labor Force | Unemployed |
| 16 to 19 Years | 1,256 (49.4%) | 77 (6.1%) |
| 20 to 24 Years | 2,004 (73.8%) | 152 (7.6%) |
| 25 to 29 Years | 2,045 (81.1%) | 72 (3.5%) |
| 30 to 34 Years | 1,533 (75.4%) | 60 (3.9%) |
| 35 to 44 Years | 3,293 (79.1%) | 63 (1.9%) |
| 45 to 54 Years | 3,368 (83.1%) | 88 (2.6%) |
| 55 to 59 Years | 1,844 (76.4%) | 42 (2.3%) |
| 60 to 64 Years | 1,575 (59.0%) | 9 (0.6%) |
| 65 to 74 Years | 1,278 (31.9%) | 28 (2.2%) |
| 75 Years and over | 174 (5.4%) | 2 (1.2%) |
| Total | 18,358 (60.5%) | 587 (3.2%) |
Employment Status by Educational Attainment in Webster County
According to labor force statistics for Webster County, 76.5% of individuals (13,658) out of the total population between 25 and 64 years of age (17,853) are in the labor force, with 2.4% or 328 of them being unemployed. The group with the highest labor force participation rate are those with the educational attainment of bachelor's degree or higher, with 87.4% or 3,327 individuals in the labor force. Within the labor force, individuals with high school diploma education have the highest percentage of unemployment, with 3.2% or 127 of them being unemployed.
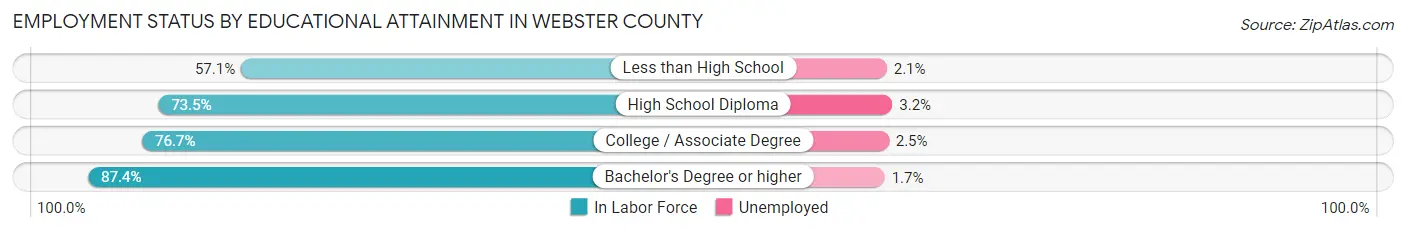
| Educational Attainment | In Labor Force | Unemployed |
| Less than High School | 805 (57.1%) | 30 (2.1%) |
| High School Diploma | 3,984 (73.5%) | 173 (3.2%) |
| College / Associate Degree | 5,535 (76.7%) | 180 (2.5%) |
| Bachelor's Degree or higher | 3,327 (87.4%) | 65 (1.7%) |
| Total | 13,658 (76.5%) | 428 (2.4%) |
Employment Occupations by Sex in Webster County
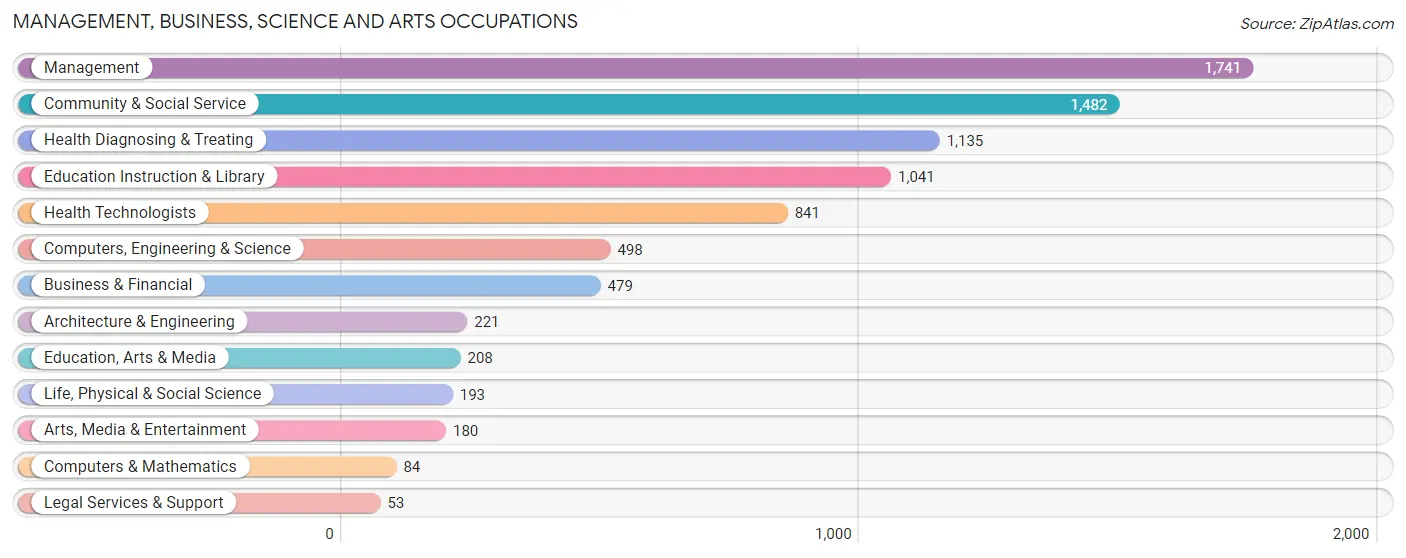
Management, Business, Science and Arts Occupations
The most common Management, Business, Science and Arts occupations in Webster County are Management (1,741 | 9.8%), Community & Social Service (1,482 | 8.4%), Health Diagnosing & Treating (1,135 | 6.4%), Education Instruction & Library (1,041 | 5.9%), and Health Technologists (841 | 4.7%).
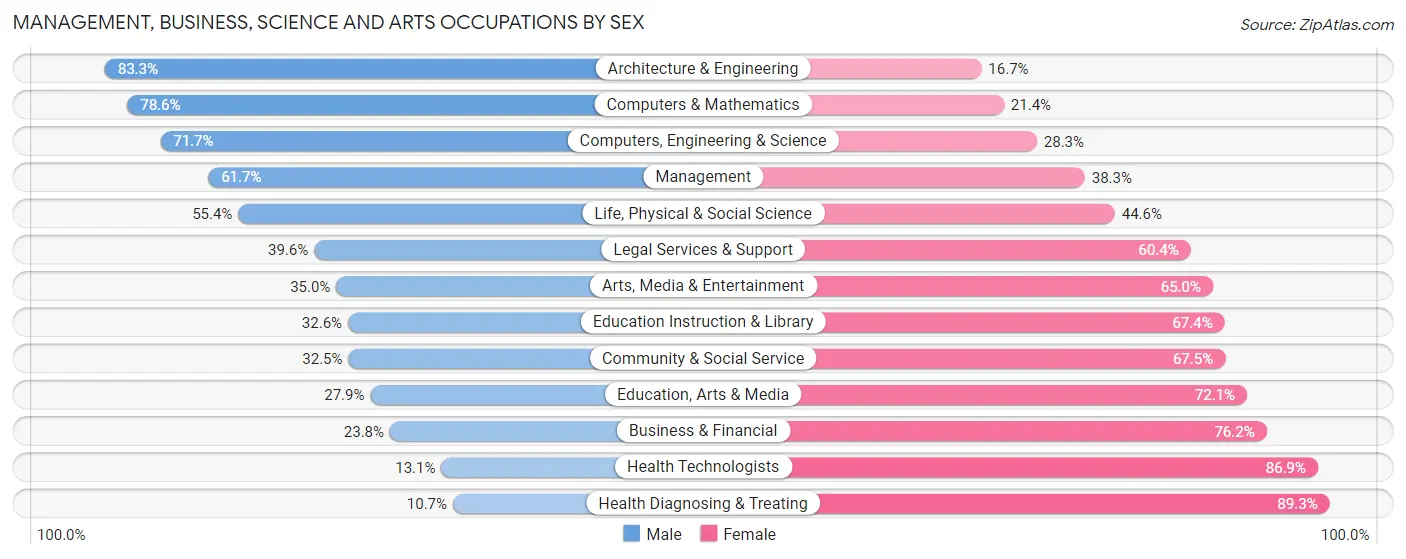
Management, Business, Science and Arts Occupations by Sex
Within the Management, Business, Science and Arts occupations in Webster County, the most male-oriented occupations are Architecture & Engineering (83.3%), Computers & Mathematics (78.6%), and Computers, Engineering & Science (71.7%), while the most female-oriented occupations are Health Diagnosing & Treating (89.3%), Health Technologists (86.9%), and Business & Financial (76.2%).
| Occupation | Male | Female |
| Management | 1,074 (61.7%) | 667 (38.3%) |
| Business & Financial | 114 (23.8%) | 365 (76.2%) |
| Computers, Engineering & Science | 357 (71.7%) | 141 (28.3%) |
| Computers & Mathematics | 66 (78.6%) | 18 (21.4%) |
| Architecture & Engineering | 184 (83.3%) | 37 (16.7%) |
| Life, Physical & Social Science | 107 (55.4%) | 86 (44.6%) |
| Community & Social Service | 481 (32.5%) | 1,001 (67.5%) |
| Education, Arts & Media | 58 (27.9%) | 150 (72.1%) |
| Legal Services & Support | 21 (39.6%) | 32 (60.4%) |
| Education Instruction & Library | 339 (32.6%) | 702 (67.4%) |
| Arts, Media & Entertainment | 63 (35.0%) | 117 (65.0%) |
| Health Diagnosing & Treating | 121 (10.7%) | 1,014 (89.3%) |
| Health Technologists | 110 (13.1%) | 731 (86.9%) |
| Total (Category) | 2,147 (40.2%) | 3,188 (59.8%) |
| Total (Overall) | 9,552 (53.8%) | 8,190 (46.2%) |
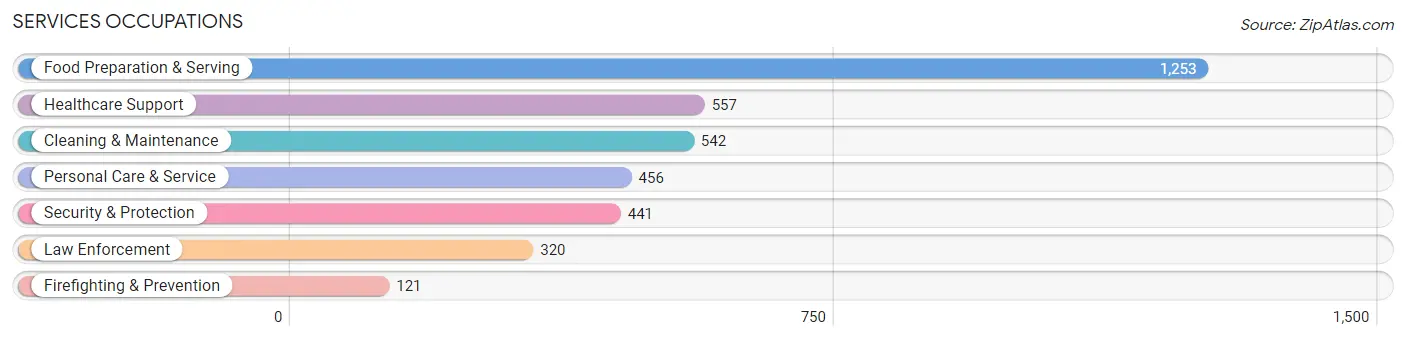
Services Occupations
The most common Services occupations in Webster County are Food Preparation & Serving (1,253 | 7.1%), Healthcare Support (557 | 3.1%), Cleaning & Maintenance (542 | 3.0%), Personal Care & Service (456 | 2.6%), and Security & Protection (441 | 2.5%).
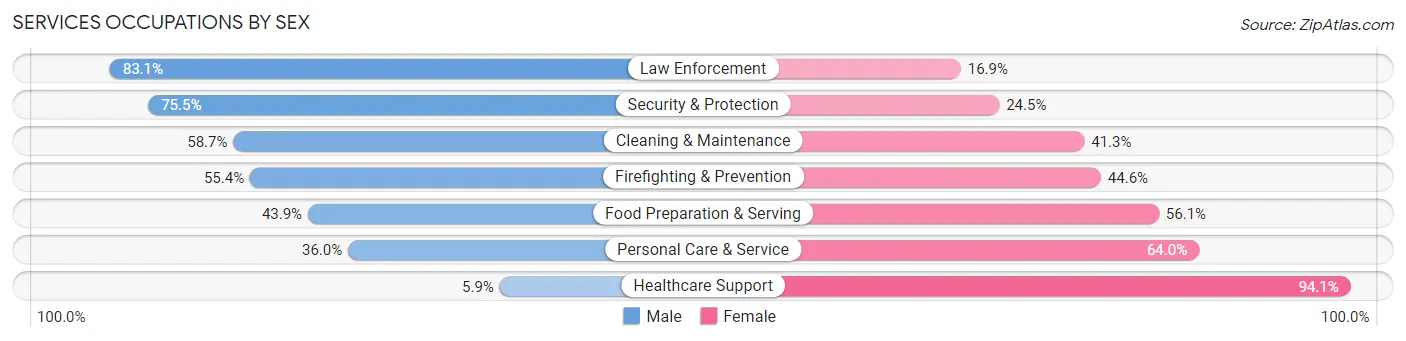
Services Occupations by Sex
Within the Services occupations in Webster County, the most male-oriented occupations are Law Enforcement (83.1%), Security & Protection (75.5%), and Cleaning & Maintenance (58.7%), while the most female-oriented occupations are Healthcare Support (94.1%), Personal Care & Service (64.0%), and Food Preparation & Serving (56.1%).
| Occupation | Male | Female |
| Healthcare Support | 33 (5.9%) | 524 (94.1%) |
| Security & Protection | 333 (75.5%) | 108 (24.5%) |
| Firefighting & Prevention | 67 (55.4%) | 54 (44.6%) |
| Law Enforcement | 266 (83.1%) | 54 (16.9%) |
| Food Preparation & Serving | 550 (43.9%) | 703 (56.1%) |
| Cleaning & Maintenance | 318 (58.7%) | 224 (41.3%) |
| Personal Care & Service | 164 (36.0%) | 292 (64.0%) |
| Total (Category) | 1,398 (43.0%) | 1,851 (57.0%) |
| Total (Overall) | 9,552 (53.8%) | 8,190 (46.2%) |
Sales and Office Occupations
The most common Sales and Office occupations in Webster County are Office & Administration (1,856 | 10.5%), and Sales & Related (1,748 | 9.9%).

Sales and Office Occupations by Sex

| Occupation | Male | Female |
| Sales & Related | 880 (50.3%) | 868 (49.7%) |
| Office & Administration | 319 (17.2%) | 1,537 (82.8%) |
| Total (Category) | 1,199 (33.3%) | 2,405 (66.7%) |
| Total (Overall) | 9,552 (53.8%) | 8,190 (46.2%) |
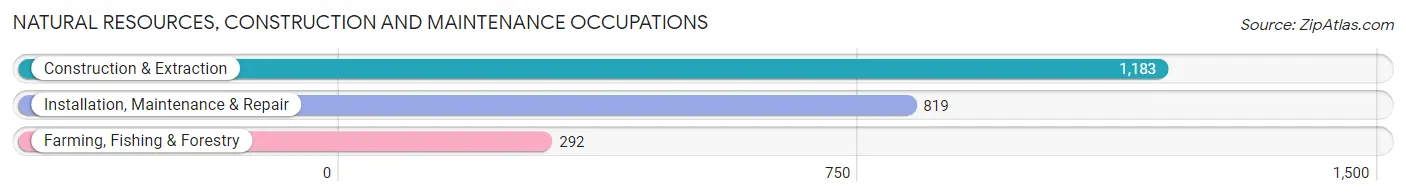
Natural Resources, Construction and Maintenance Occupations
The most common Natural Resources, Construction and Maintenance occupations in Webster County are Construction & Extraction (1,183 | 6.7%), Installation, Maintenance & Repair (819 | 4.6%), and Farming, Fishing & Forestry (292 | 1.7%).
Natural Resources, Construction and Maintenance Occupations by Sex
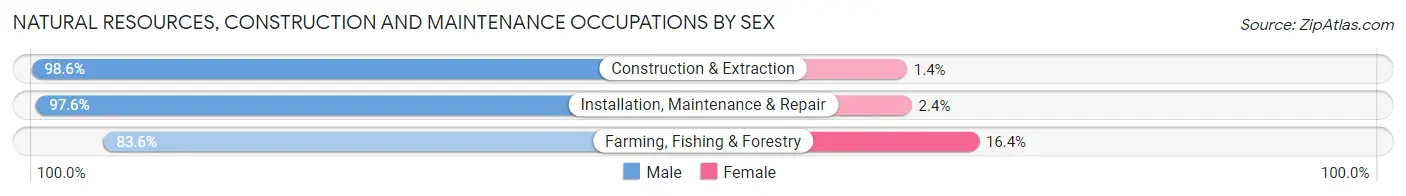
| Occupation | Male | Female |
| Farming, Fishing & Forestry | 244 (83.6%) | 48 (16.4%) |
| Construction & Extraction | 1,166 (98.6%) | 17 (1.4%) |
| Installation, Maintenance & Repair | 799 (97.6%) | 20 (2.4%) |
| Total (Category) | 2,209 (96.3%) | 85 (3.7%) |
| Total (Overall) | 9,552 (53.8%) | 8,190 (46.2%) |
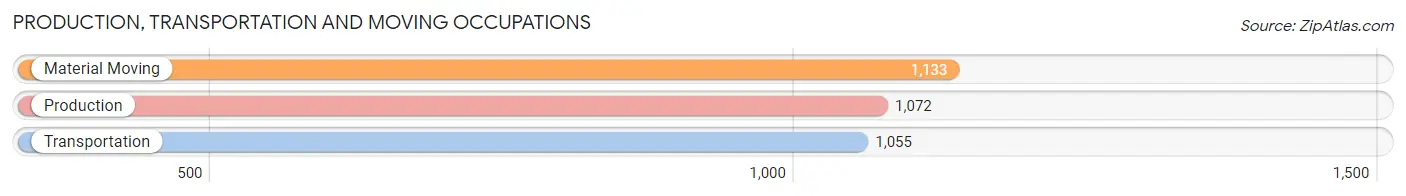
Production, Transportation and Moving Occupations
The most common Production, Transportation and Moving occupations in Webster County are Material Moving (1,133 | 6.4%), Production (1,072 | 6.0%), and Transportation (1,055 | 5.9%).
Production, Transportation and Moving Occupations by Sex
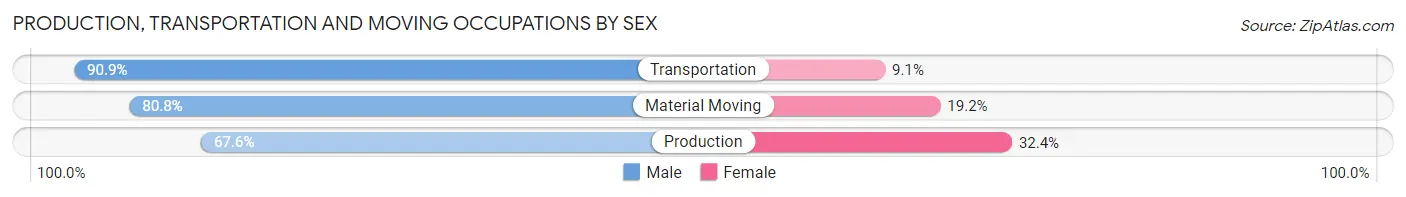
| Occupation | Male | Female |
| Production | 725 (67.6%) | 347 (32.4%) |
| Transportation | 959 (90.9%) | 96 (9.1%) |
| Material Moving | 915 (80.8%) | 218 (19.2%) |
| Total (Category) | 2,599 (79.7%) | 661 (20.3%) |
| Total (Overall) | 9,552 (53.8%) | 8,190 (46.2%) |
Employment Industries by Sex in Webster County
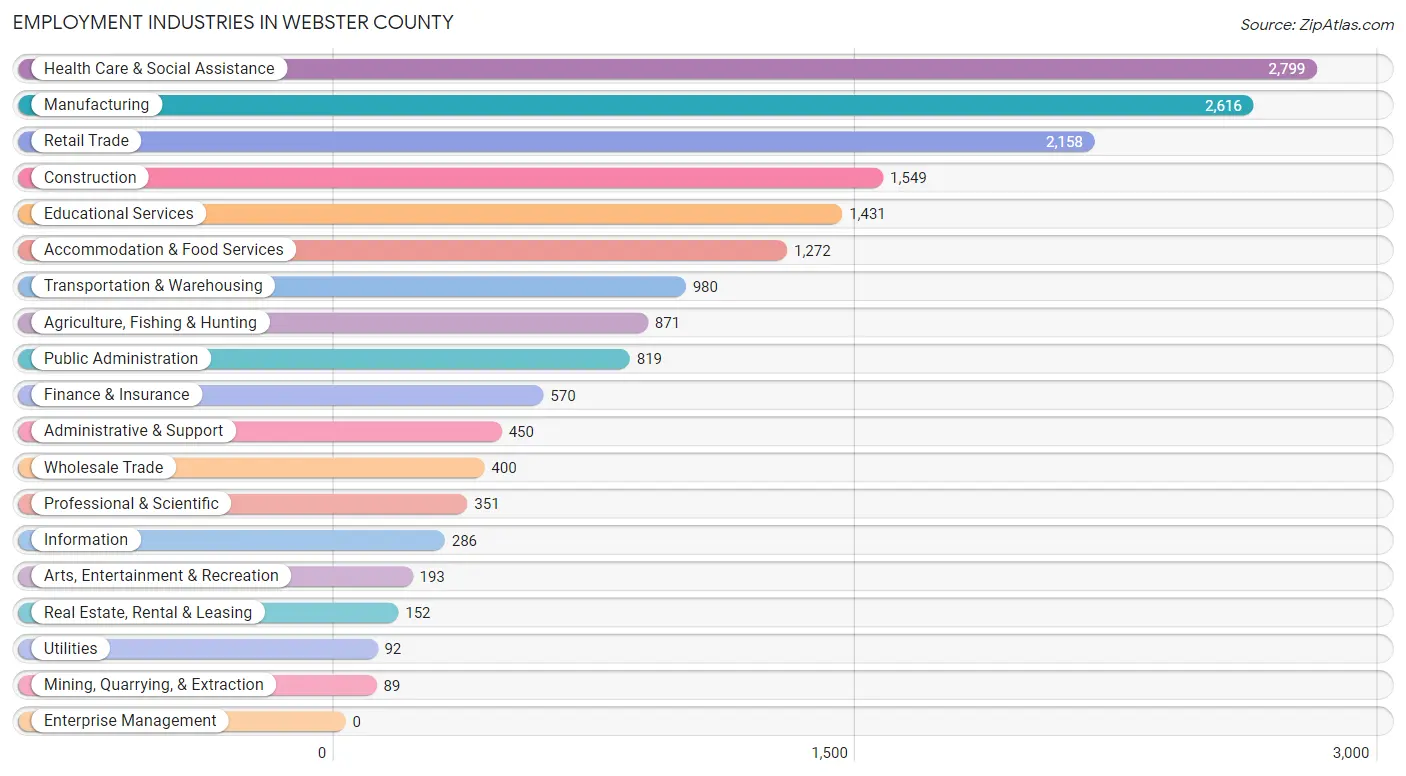
Employment Industries in Webster County
The major employment industries in Webster County include Health Care & Social Assistance (2,799 | 15.8%), Manufacturing (2,616 | 14.7%), Retail Trade (2,158 | 12.2%), Construction (1,549 | 8.7%), and Educational Services (1,431 | 8.1%).
Employment Industries by Sex in Webster County
The Webster County industries that see more men than women are Utilities (93.5%), Construction (91.4%), and Agriculture, Fishing & Hunting (87.6%), whereas the industries that tend to have a higher number of women are Health Care & Social Assistance (89.1%), Finance & Insurance (67.7%), and Educational Services (61.8%).
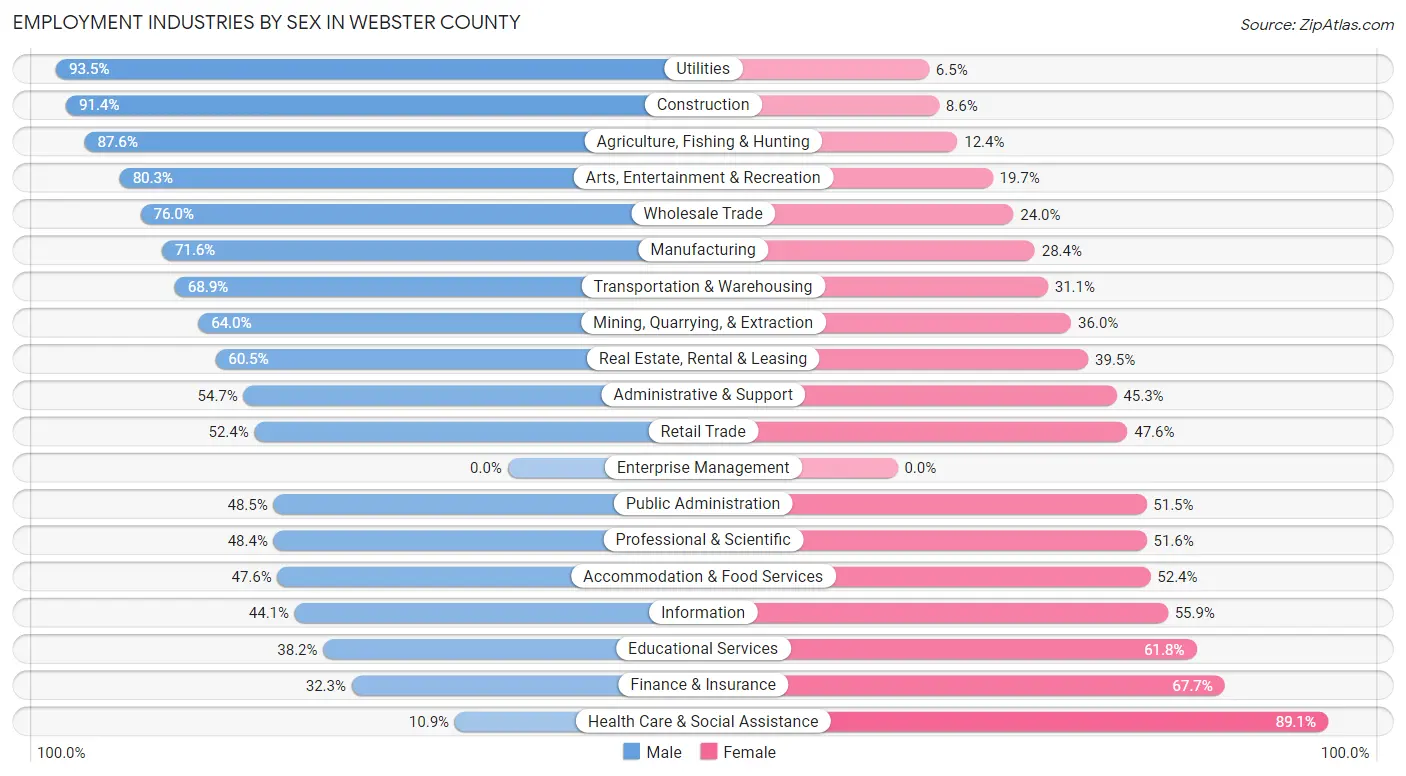
| Industry | Male | Female |
| Agriculture, Fishing & Hunting | 763 (87.6%) | 108 (12.4%) |
| Mining, Quarrying, & Extraction | 57 (64.0%) | 32 (36.0%) |
| Construction | 1,416 (91.4%) | 133 (8.6%) |
| Manufacturing | 1,872 (71.6%) | 744 (28.4%) |
| Wholesale Trade | 304 (76.0%) | 96 (24.0%) |
| Retail Trade | 1,131 (52.4%) | 1,027 (47.6%) |
| Transportation & Warehousing | 675 (68.9%) | 305 (31.1%) |
| Utilities | 86 (93.5%) | 6 (6.5%) |
| Information | 126 (44.1%) | 160 (55.9%) |
| Finance & Insurance | 184 (32.3%) | 386 (67.7%) |
| Real Estate, Rental & Leasing | 92 (60.5%) | 60 (39.5%) |
| Professional & Scientific | 170 (48.4%) | 181 (51.6%) |
| Enterprise Management | 0 (0.0%) | 0 (0.0%) |
| Administrative & Support | 246 (54.7%) | 204 (45.3%) |
| Educational Services | 546 (38.2%) | 885 (61.8%) |
| Health Care & Social Assistance | 306 (10.9%) | 2,493 (89.1%) |
| Arts, Entertainment & Recreation | 155 (80.3%) | 38 (19.7%) |
| Accommodation & Food Services | 606 (47.6%) | 666 (52.4%) |
| Public Administration | 397 (48.5%) | 422 (51.5%) |
| Total | 9,552 (53.8%) | 8,190 (46.2%) |
Education in Webster County
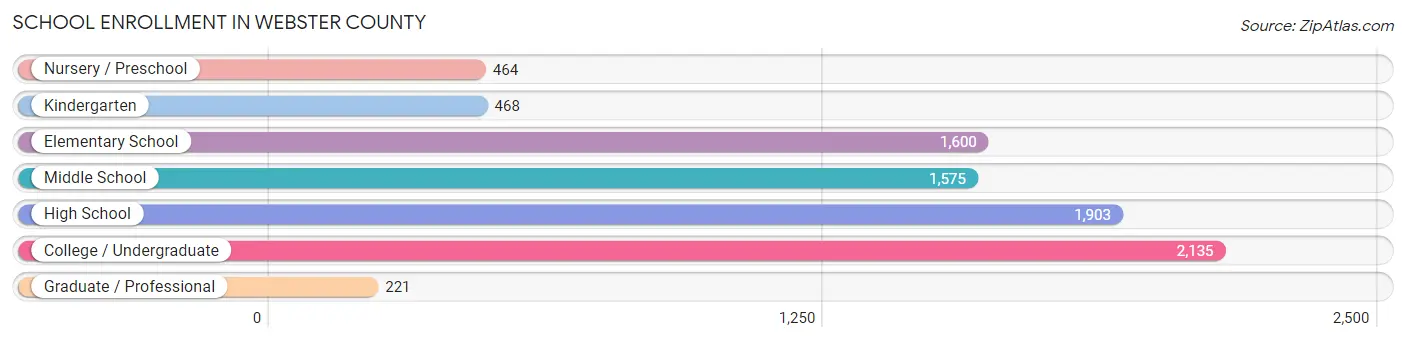
School Enrollment in Webster County
The most common levels of schooling among the 8,366 students in Webster County are college / undergraduate (2,135 | 25.5%), high school (1,903 | 22.8%), and elementary school (1,600 | 19.1%).
| School Level | # Students | % Students |
| Nursery / Preschool | 464 | 5.6% |
| Kindergarten | 468 | 5.6% |
| Elementary School | 1,600 | 19.1% |
| Middle School | 1,575 | 18.8% |
| High School | 1,903 | 22.8% |
| College / Undergraduate | 2,135 | 25.5% |
| Graduate / Professional | 221 | 2.6% |
| Total | 8,366 | 100.0% |
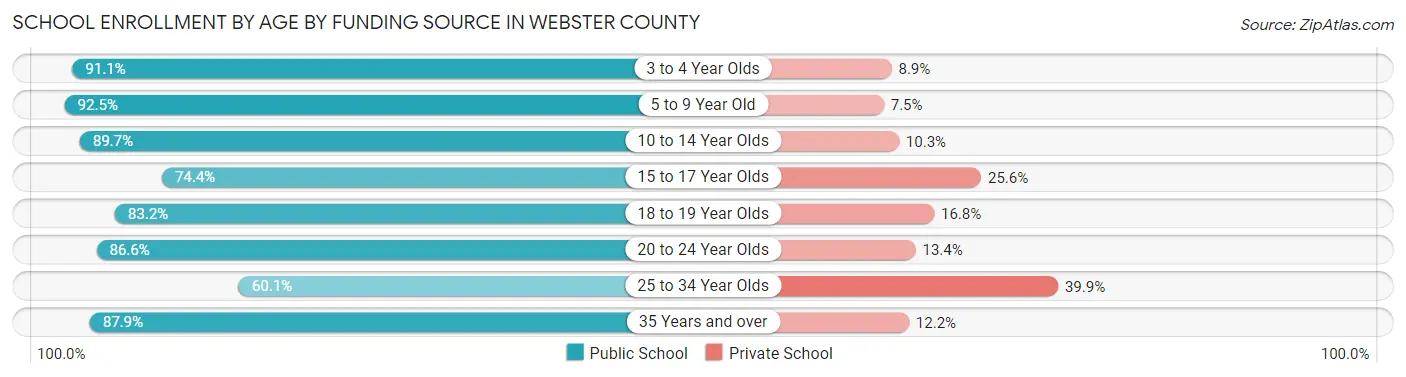
School Enrollment by Age by Funding Source in Webster County
Out of a total of 8,366 students who are enrolled in schools in Webster County, 1,255 (15.0%) attend a private institution, while the remaining 7,111 (85.0%) are enrolled in public schools. The age group of 25 to 34 year olds has the highest likelihood of being enrolled in private schools, with 188 (39.9% in the age bracket) enrolled. Conversely, the age group of 5 to 9 year old has the lowest likelihood of being enrolled in a private school, with 1,820 (92.5% in the age bracket) attending a public institution.
| Age Bracket | Public School | Private School |
| 3 to 4 Year Olds | 276 (91.1%) | 27 (8.9%) |
| 5 to 9 Year Old | 1,820 (92.5%) | 147 (7.5%) |
| 10 to 14 Year Olds | 1,743 (89.7%) | 200 (10.3%) |
| 15 to 17 Year Olds | 1,015 (74.4%) | 349 (25.6%) |
| 18 to 19 Year Olds | 845 (83.2%) | 171 (16.8%) |
| 20 to 24 Year Olds | 757 (86.6%) | 117 (13.4%) |
| 25 to 34 Year Olds | 283 (60.1%) | 188 (39.9%) |
| 35 Years and over | 376 (87.8%) | 52 (12.1%) |
| Total | 7,111 (85.0%) | 1,255 (15.0%) |
Educational Attainment by Field of Study in Webster County
Education (1,297 | 23.0%), business (957 | 17.0%), science & technology (695 | 12.3%), arts & humanities (609 | 10.8%), and bio, nature & agricultural (570 | 10.1%) are the most common fields of study among 5,645 individuals in Webster County who have obtained a bachelor's degree or higher.
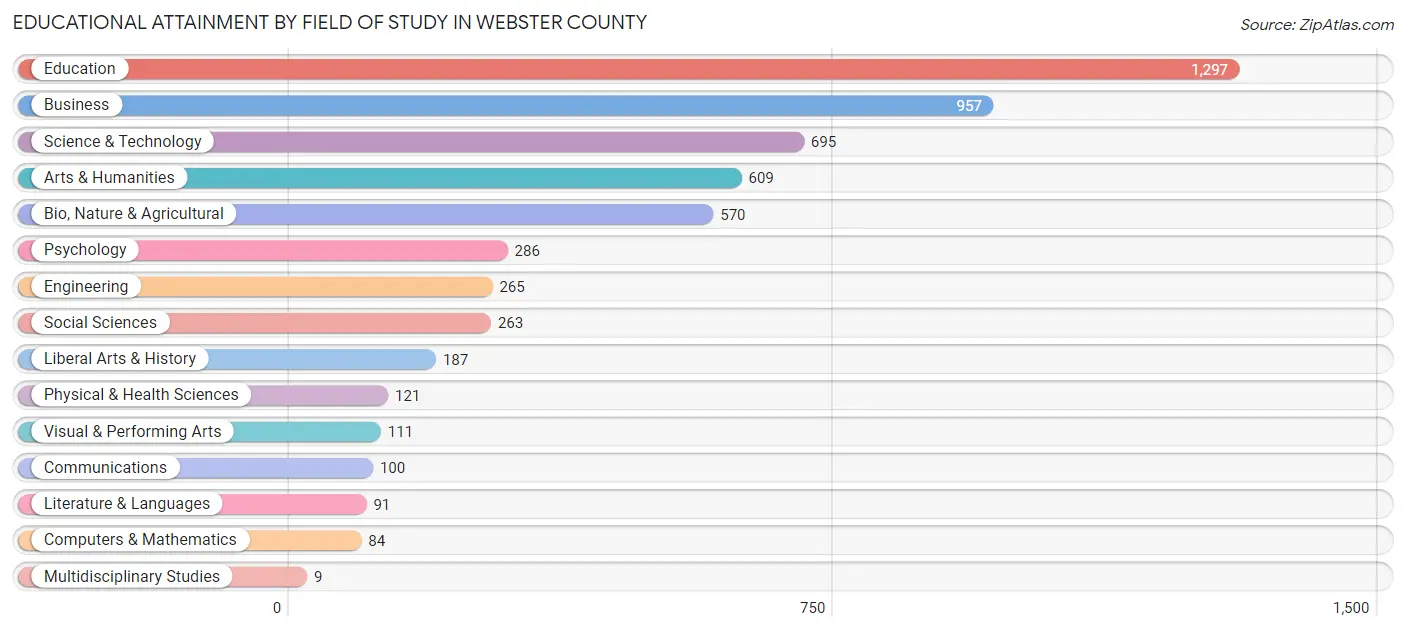
| Field of Study | # Graduates | % Graduates |
| Computers & Mathematics | 84 | 1.5% |
| Bio, Nature & Agricultural | 570 | 10.1% |
| Physical & Health Sciences | 121 | 2.1% |
| Psychology | 286 | 5.1% |
| Social Sciences | 263 | 4.7% |
| Engineering | 265 | 4.7% |
| Multidisciplinary Studies | 9 | 0.2% |
| Science & Technology | 695 | 12.3% |
| Business | 957 | 17.0% |
| Education | 1,297 | 23.0% |
| Literature & Languages | 91 | 1.6% |
| Liberal Arts & History | 187 | 3.3% |
| Visual & Performing Arts | 111 | 2.0% |
| Communications | 100 | 1.8% |
| Arts & Humanities | 609 | 10.8% |
| Total | 5,645 | 100.0% |
Transportation & Commute in Webster County
Vehicle Availability by Sex in Webster County
The most prevalent vehicle ownership categories in Webster County are males with 2 vehicles (3,671, accounting for 39.3%) and females with 2 vehicles (3,111, making up 46.4%).
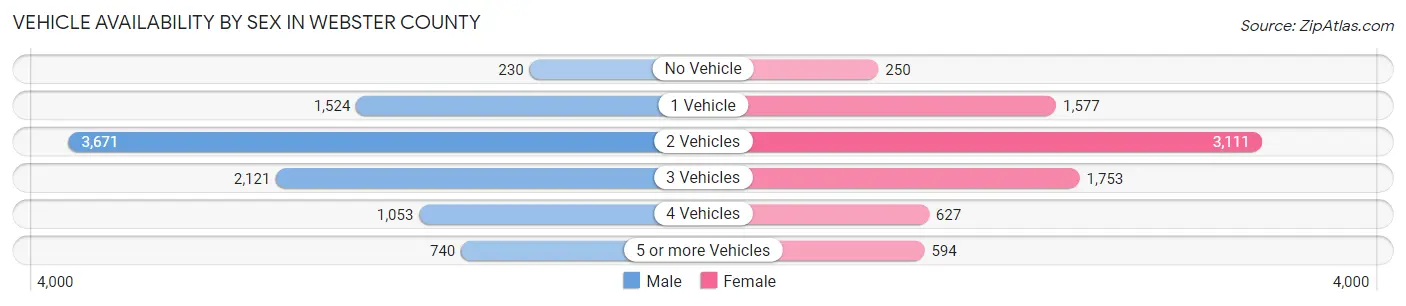
| Vehicles Available | Male | Female |
| No Vehicle | 230 (2.5%) | 250 (3.2%) |
| 1 Vehicle | 1,524 (16.3%) | 1,577 (19.9%) |
| 2 Vehicles | 3,671 (39.3%) | 3,111 (39.3%) |
| 3 Vehicles | 2,121 (22.7%) | 1,753 (22.2%) |
| 4 Vehicles | 1,053 (11.3%) | 627 (7.9%) |
| 5 or more Vehicles | 740 (7.9%) | 594 (7.5%) |
| Total | 9,339 (100.0%) | 7,912 (100.0%) |
Commute Time in Webster County
The most frequently occuring commute durations in Webster County are 5 to 9 minutes (3,967 commuters, 23.7%), 10 to 14 minutes (3,905 commuters, 23.3%), and 15 to 19 minutes (2,625 commuters, 15.7%).
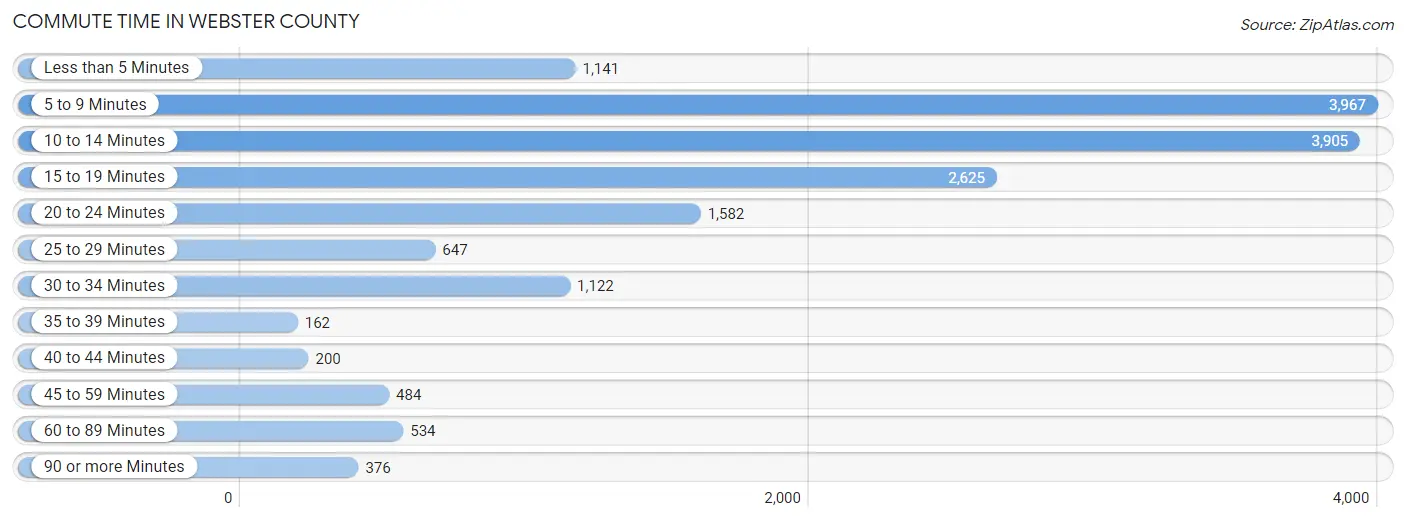
| Commute Time | # Commuters | % Commuters |
| Less than 5 Minutes | 1,141 | 6.8% |
| 5 to 9 Minutes | 3,967 | 23.7% |
| 10 to 14 Minutes | 3,905 | 23.3% |
| 15 to 19 Minutes | 2,625 | 15.7% |
| 20 to 24 Minutes | 1,582 | 9.5% |
| 25 to 29 Minutes | 647 | 3.9% |
| 30 to 34 Minutes | 1,122 | 6.7% |
| 35 to 39 Minutes | 162 | 1.0% |
| 40 to 44 Minutes | 200 | 1.2% |
| 45 to 59 Minutes | 484 | 2.9% |
| 60 to 89 Minutes | 534 | 3.2% |
| 90 or more Minutes | 376 | 2.2% |
Commute Time by Sex in Webster County
The most common commute times in Webster County are 5 to 9 minutes (2,208 commuters, 24.2%) for males and 10 to 14 minutes (1,956 commuters, 25.6%) for females.
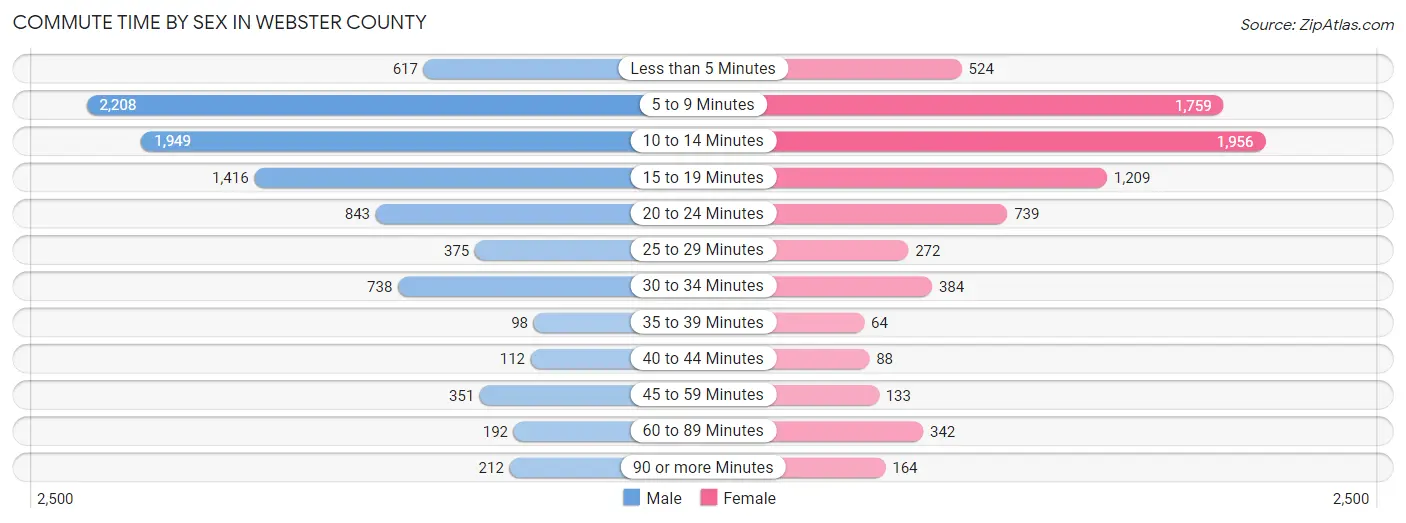
| Commute Time | Male | Female |
| Less than 5 Minutes | 617 (6.8%) | 524 (6.9%) |
| 5 to 9 Minutes | 2,208 (24.2%) | 1,759 (23.0%) |
| 10 to 14 Minutes | 1,949 (21.4%) | 1,956 (25.6%) |
| 15 to 19 Minutes | 1,416 (15.5%) | 1,209 (15.8%) |
| 20 to 24 Minutes | 843 (9.2%) | 739 (9.7%) |
| 25 to 29 Minutes | 375 (4.1%) | 272 (3.6%) |
| 30 to 34 Minutes | 738 (8.1%) | 384 (5.0%) |
| 35 to 39 Minutes | 98 (1.1%) | 64 (0.8%) |
| 40 to 44 Minutes | 112 (1.2%) | 88 (1.1%) |
| 45 to 59 Minutes | 351 (3.8%) | 133 (1.7%) |
| 60 to 89 Minutes | 192 (2.1%) | 342 (4.5%) |
| 90 or more Minutes | 212 (2.3%) | 164 (2.1%) |
Time of Departure to Work by Sex in Webster County
The most frequent times of departure to work in Webster County are 7:00 AM to 7:29 AM (1,439, 15.8%) for males and 7:30 AM to 7:59 AM (1,630, 21.3%) for females.
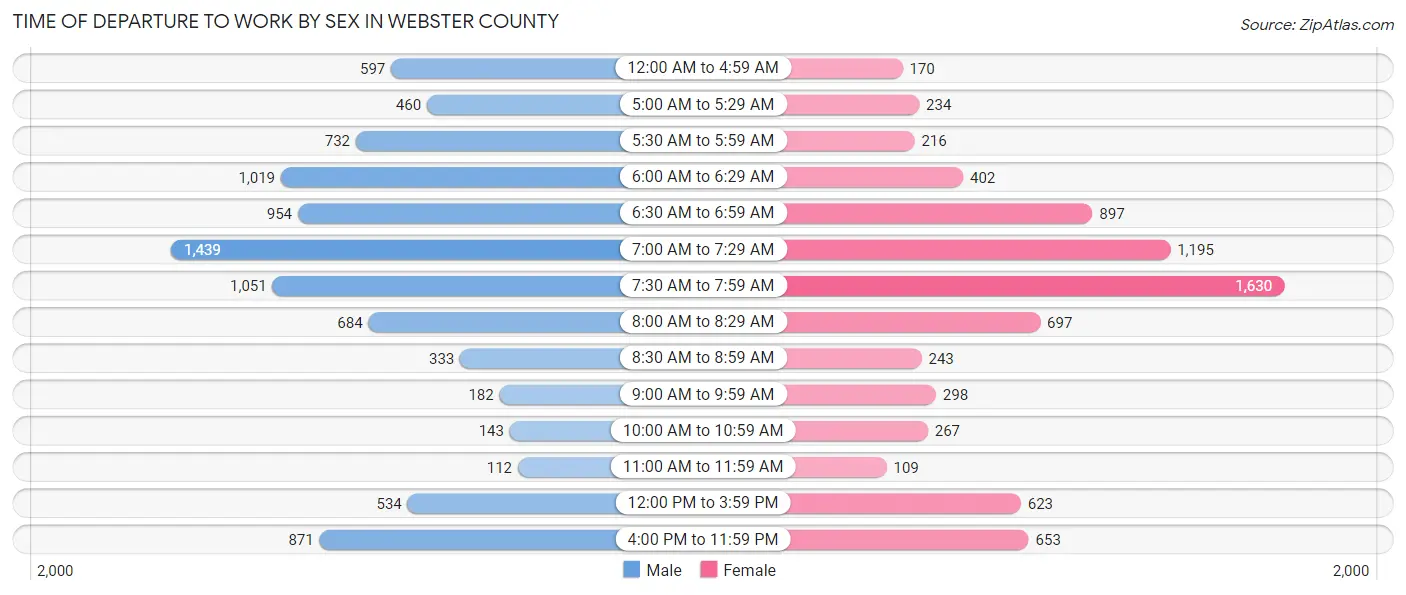
| Time of Departure | Male | Female |
| 12:00 AM to 4:59 AM | 597 (6.6%) | 170 (2.2%) |
| 5:00 AM to 5:29 AM | 460 (5.1%) | 234 (3.1%) |
| 5:30 AM to 5:59 AM | 732 (8.0%) | 216 (2.8%) |
| 6:00 AM to 6:29 AM | 1,019 (11.2%) | 402 (5.3%) |
| 6:30 AM to 6:59 AM | 954 (10.5%) | 897 (11.7%) |
| 7:00 AM to 7:29 AM | 1,439 (15.8%) | 1,195 (15.7%) |
| 7:30 AM to 7:59 AM | 1,051 (11.5%) | 1,630 (21.3%) |
| 8:00 AM to 8:29 AM | 684 (7.5%) | 697 (9.1%) |
| 8:30 AM to 8:59 AM | 333 (3.6%) | 243 (3.2%) |
| 9:00 AM to 9:59 AM | 182 (2.0%) | 298 (3.9%) |
| 10:00 AM to 10:59 AM | 143 (1.6%) | 267 (3.5%) |
| 11:00 AM to 11:59 AM | 112 (1.2%) | 109 (1.4%) |
| 12:00 PM to 3:59 PM | 534 (5.9%) | 623 (8.2%) |
| 4:00 PM to 11:59 PM | 871 (9.6%) | 653 (8.6%) |
| Total | 9,111 (100.0%) | 7,634 (100.0%) |
Housing Occupancy in Webster County
Occupancy by Ownership in Webster County
Of the total 15,582 dwellings in Webster County, owner-occupied units account for 10,858 (69.7%), while renter-occupied units make up 4,724 (30.3%).
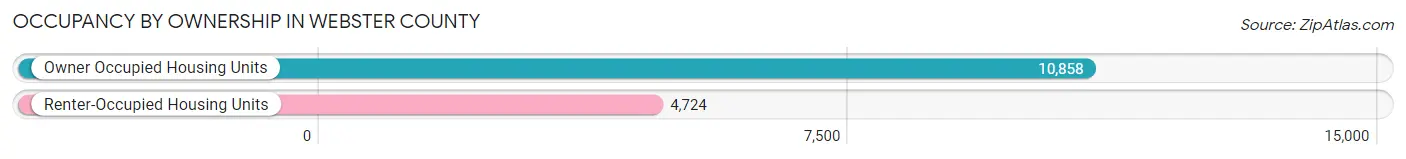
| Occupancy | # Housing Units | % Housing Units |
| Owner Occupied Housing Units | 10,858 | 69.7% |
| Renter-Occupied Housing Units | 4,724 | 30.3% |
| Total Occupied Housing Units | 15,582 | 100.0% |
Occupancy by Household Size in Webster County
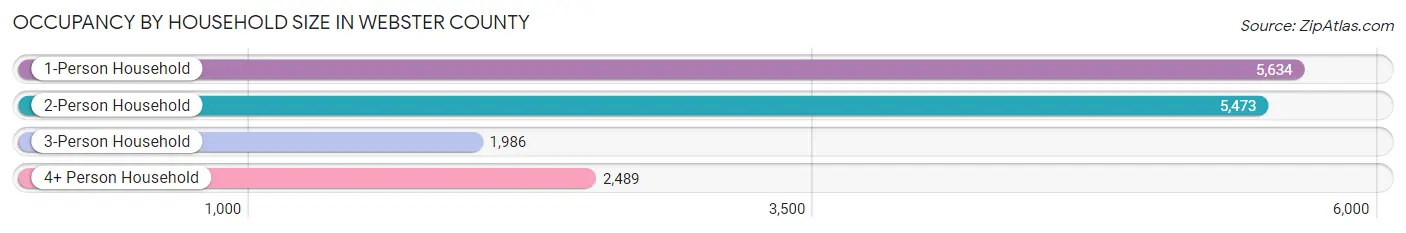
| Household Size | # Housing Units | % Housing Units |
| 1-Person Household | 5,634 | 36.2% |
| 2-Person Household | 5,473 | 35.1% |
| 3-Person Household | 1,986 | 12.8% |
| 4+ Person Household | 2,489 | 16.0% |
| Total Housing Units | 15,582 | 100.0% |
Occupancy by Ownership by Household Size in Webster County
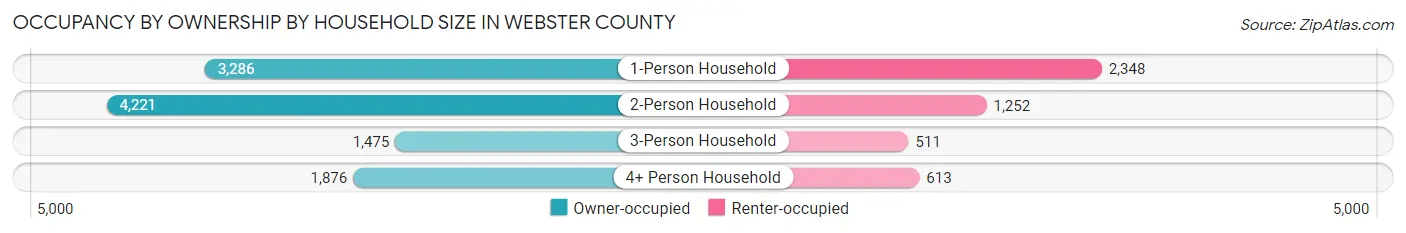
| Household Size | Owner-occupied | Renter-occupied |
| 1-Person Household | 3,286 (58.3%) | 2,348 (41.7%) |
| 2-Person Household | 4,221 (77.1%) | 1,252 (22.9%) |
| 3-Person Household | 1,475 (74.3%) | 511 (25.7%) |
| 4+ Person Household | 1,876 (75.4%) | 613 (24.6%) |
| Total Housing Units | 10,858 (69.7%) | 4,724 (30.3%) |
Occupancy by Educational Attainment in Webster County
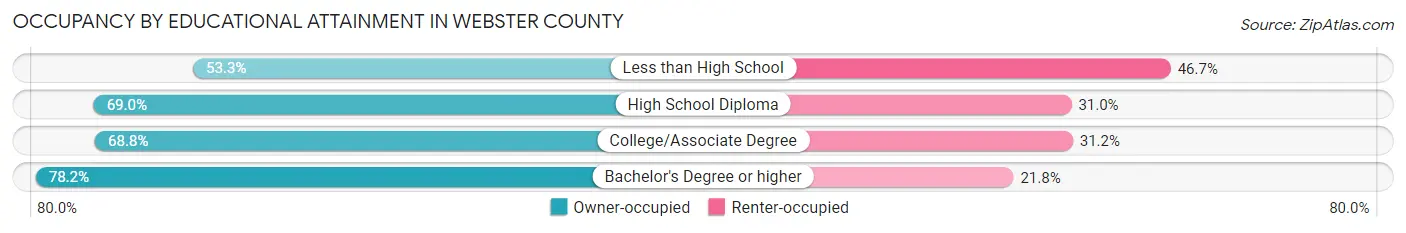
| Household Size | Owner-occupied | Renter-occupied |
| Less than High School | 650 (53.3%) | 570 (46.7%) |
| High School Diploma | 3,654 (69.0%) | 1,639 (31.0%) |
| College/Associate Degree | 3,947 (68.8%) | 1,789 (31.2%) |
| Bachelor's Degree or higher | 2,607 (78.2%) | 726 (21.8%) |
Occupancy by Age of Householder in Webster County
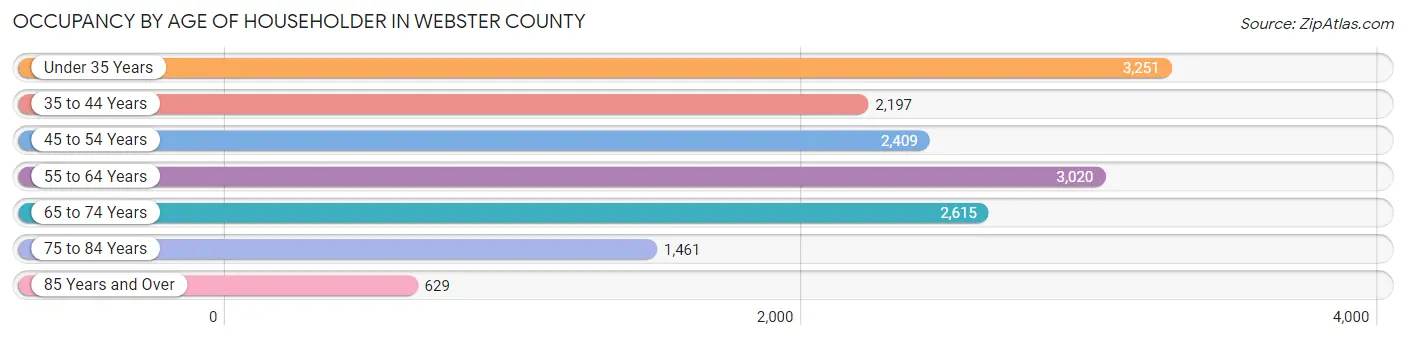
| Age Bracket | # Households | % Households |
| Under 35 Years | 3,251 | 20.9% |
| 35 to 44 Years | 2,197 | 14.1% |
| 45 to 54 Years | 2,409 | 15.5% |
| 55 to 64 Years | 3,020 | 19.4% |
| 65 to 74 Years | 2,615 | 16.8% |
| 75 to 84 Years | 1,461 | 9.4% |
| 85 Years and Over | 629 | 4.0% |
| Total | 15,582 | 100.0% |
Housing Finances in Webster County
Median Income by Occupancy in Webster County
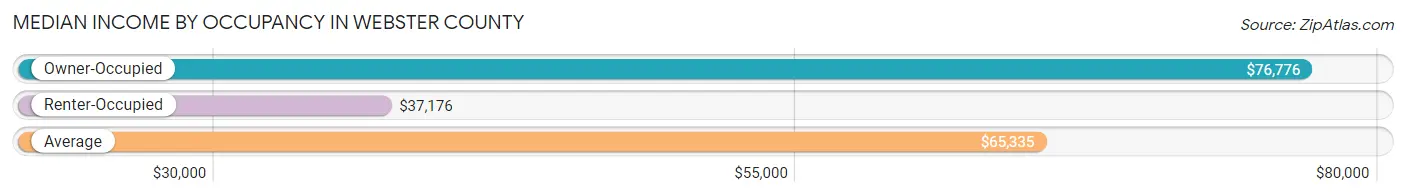
| Occupancy Type | # Households | Median Income |
| Owner-Occupied | 10,858 (69.7%) | $76,776 |
| Renter-Occupied | 4,724 (30.3%) | $37,176 |
| Average | 15,582 (100.0%) | $65,335 |
Occupancy by Householder Income Bracket in Webster County
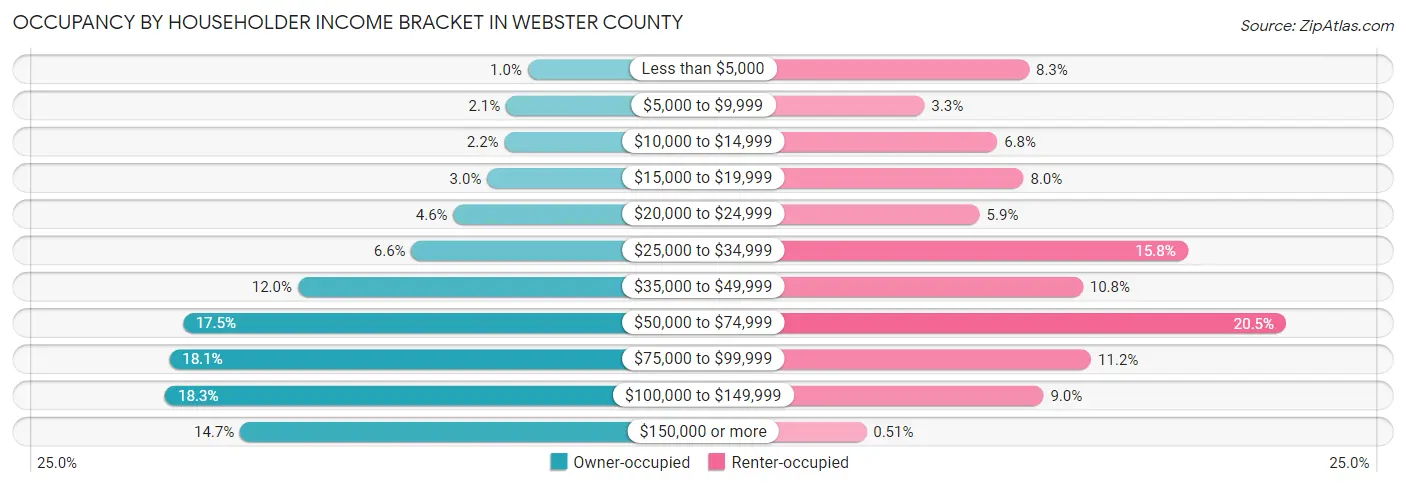
| Income Bracket | Owner-occupied | Renter-occupied |
| Less than $5,000 | 113 (1.0%) | 390 (8.3%) |
| $5,000 to $9,999 | 225 (2.1%) | 155 (3.3%) |
| $10,000 to $14,999 | 233 (2.1%) | 319 (6.8%) |
| $15,000 to $19,999 | 323 (3.0%) | 378 (8.0%) |
| $20,000 to $24,999 | 497 (4.6%) | 279 (5.9%) |
| $25,000 to $34,999 | 714 (6.6%) | 747 (15.8%) |
| $35,000 to $49,999 | 1,302 (12.0%) | 511 (10.8%) |
| $50,000 to $74,999 | 1,897 (17.5%) | 968 (20.5%) |
| $75,000 to $99,999 | 1,966 (18.1%) | 530 (11.2%) |
| $100,000 to $149,999 | 1,988 (18.3%) | 423 (8.9%) |
| $150,000 or more | 1,600 (14.7%) | 24 (0.5%) |
| Total | 10,858 (100.0%) | 4,724 (100.0%) |
Monthly Housing Cost Tiers in Webster County
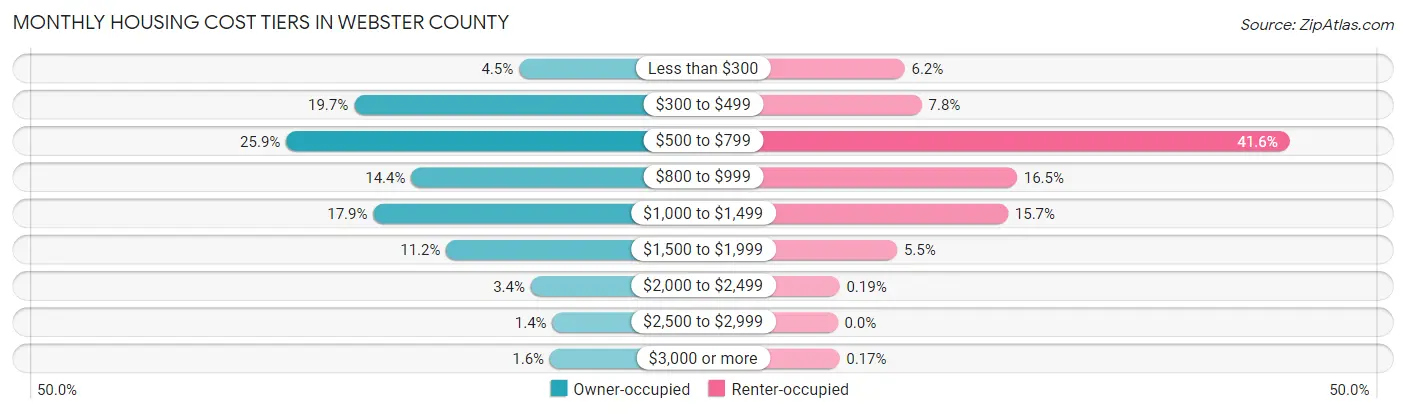
| Monthly Cost | Owner-occupied | Renter-occupied |
| Less than $300 | 486 (4.5%) | 292 (6.2%) |
| $300 to $499 | 2,136 (19.7%) | 366 (7.7%) |
| $500 to $799 | 2,814 (25.9%) | 1,966 (41.6%) |
| $800 to $999 | 1,564 (14.4%) | 780 (16.5%) |
| $1,000 to $1,499 | 1,944 (17.9%) | 741 (15.7%) |
| $1,500 to $1,999 | 1,214 (11.2%) | 259 (5.5%) |
| $2,000 to $2,499 | 369 (3.4%) | 9 (0.2%) |
| $2,500 to $2,999 | 153 (1.4%) | 0 (0.0%) |
| $3,000 or more | 178 (1.6%) | 8 (0.2%) |
| Total | 10,858 (100.0%) | 4,724 (100.0%) |
Physical Housing Characteristics in Webster County
Housing Structures in Webster County
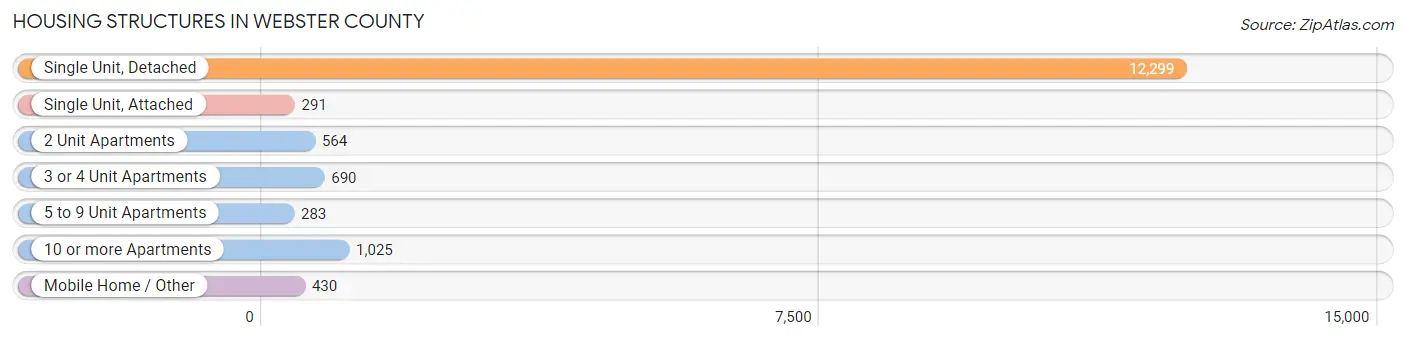
| Structure Type | # Housing Units | % Housing Units |
| Single Unit, Detached | 12,299 | 78.9% |
| Single Unit, Attached | 291 | 1.9% |
| 2 Unit Apartments | 564 | 3.6% |
| 3 or 4 Unit Apartments | 690 | 4.4% |
| 5 to 9 Unit Apartments | 283 | 1.8% |
| 10 or more Apartments | 1,025 | 6.6% |
| Mobile Home / Other | 430 | 2.8% |
| Total | 15,582 | 100.0% |
Housing Structures by Occupancy in Webster County
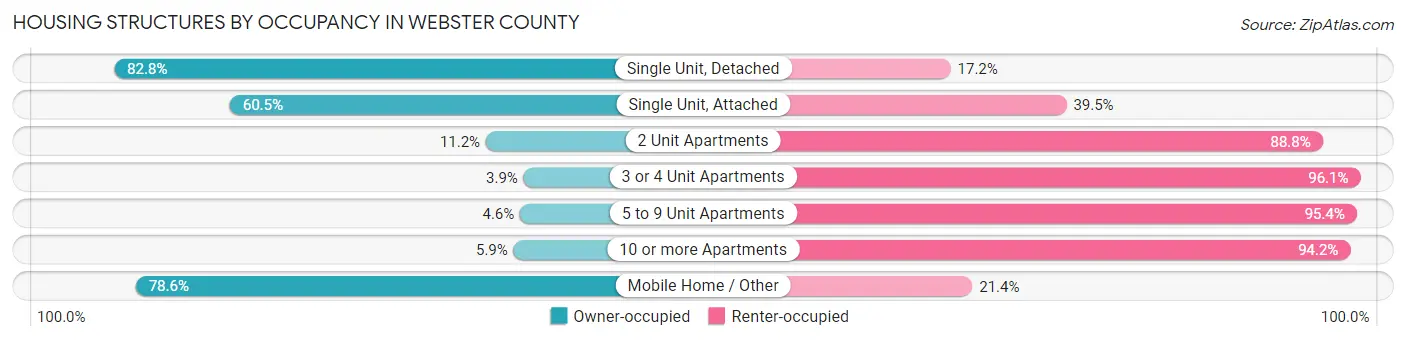
| Structure Type | Owner-occupied | Renter-occupied |
| Single Unit, Detached | 10,181 (82.8%) | 2,118 (17.2%) |
| Single Unit, Attached | 176 (60.5%) | 115 (39.5%) |
| 2 Unit Apartments | 63 (11.2%) | 501 (88.8%) |
| 3 or 4 Unit Apartments | 27 (3.9%) | 663 (96.1%) |
| 5 to 9 Unit Apartments | 13 (4.6%) | 270 (95.4%) |
| 10 or more Apartments | 60 (5.9%) | 965 (94.2%) |
| Mobile Home / Other | 338 (78.6%) | 92 (21.4%) |
| Total | 10,858 (69.7%) | 4,724 (30.3%) |
Housing Structures by Number of Rooms in Webster County
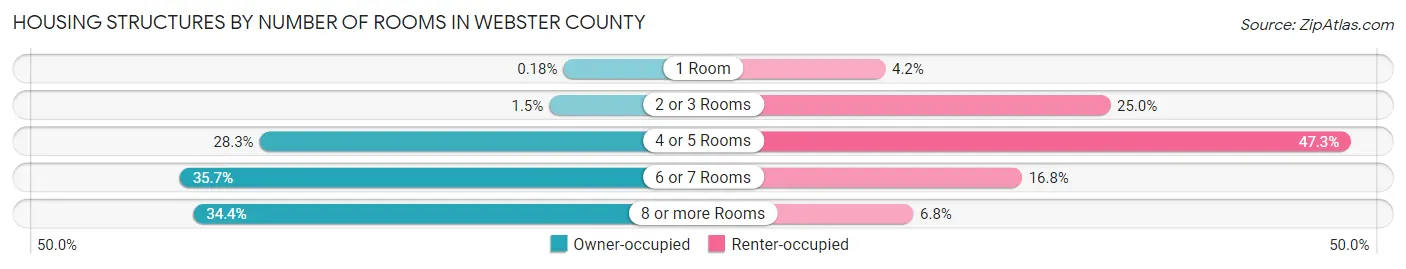
| Number of Rooms | Owner-occupied | Renter-occupied |
| 1 Room | 20 (0.2%) | 197 (4.2%) |
| 2 or 3 Rooms | 162 (1.5%) | 1,180 (25.0%) |
| 4 or 5 Rooms | 3,071 (28.3%) | 2,233 (47.3%) |
| 6 or 7 Rooms | 3,871 (35.6%) | 794 (16.8%) |
| 8 or more Rooms | 3,734 (34.4%) | 320 (6.8%) |
| Total | 10,858 (100.0%) | 4,724 (100.0%) |
Housing Structure by Heating Type in Webster County
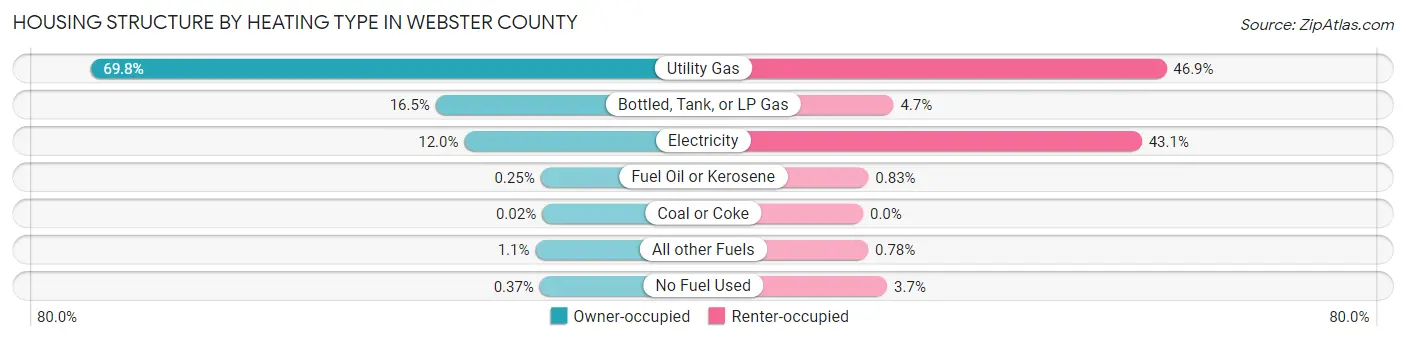
| Heating Type | Owner-occupied | Renter-occupied |
| Utility Gas | 7,583 (69.8%) | 2,215 (46.9%) |
| Bottled, Tank, or LP Gas | 1,786 (16.5%) | 222 (4.7%) |
| Electricity | 1,306 (12.0%) | 2,035 (43.1%) |
| Fuel Oil or Kerosene | 27 (0.3%) | 39 (0.8%) |
| Coal or Coke | 2 (0.0%) | 0 (0.0%) |
| All other Fuels | 114 (1.1%) | 37 (0.8%) |
| No Fuel Used | 40 (0.4%) | 176 (3.7%) |
| Total | 10,858 (100.0%) | 4,724 (100.0%) |
Household Vehicle Usage in Webster County
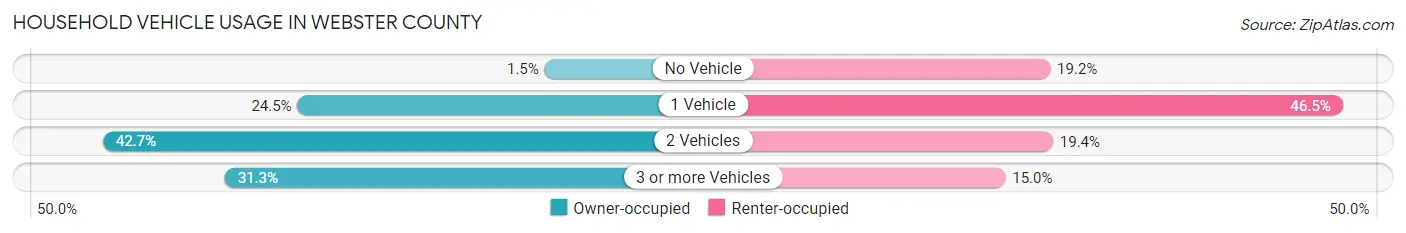
| Vehicles per Household | Owner-occupied | Renter-occupied |
| No Vehicle | 158 (1.5%) | 905 (19.2%) |
| 1 Vehicle | 2,664 (24.5%) | 2,195 (46.5%) |
| 2 Vehicles | 4,636 (42.7%) | 917 (19.4%) |
| 3 or more Vehicles | 3,400 (31.3%) | 707 (15.0%) |
| Total | 10,858 (100.0%) | 4,724 (100.0%) |
Real Estate & Mortgages in Webster County
Real Estate and Mortgage Overview in Webster County
| Characteristic | Without Mortgage | With Mortgage |
| Housing Units | 5,261 | 5,597 |
| Median Property Value | $119,300 | $139,600 |
| Median Household Income | $60,750 | $1,078 |
| Monthly Housing Costs | $508 | $170 |
| Real Estate Taxes | $1,836 | $154 |
Property Value by Mortgage Status in Webster County
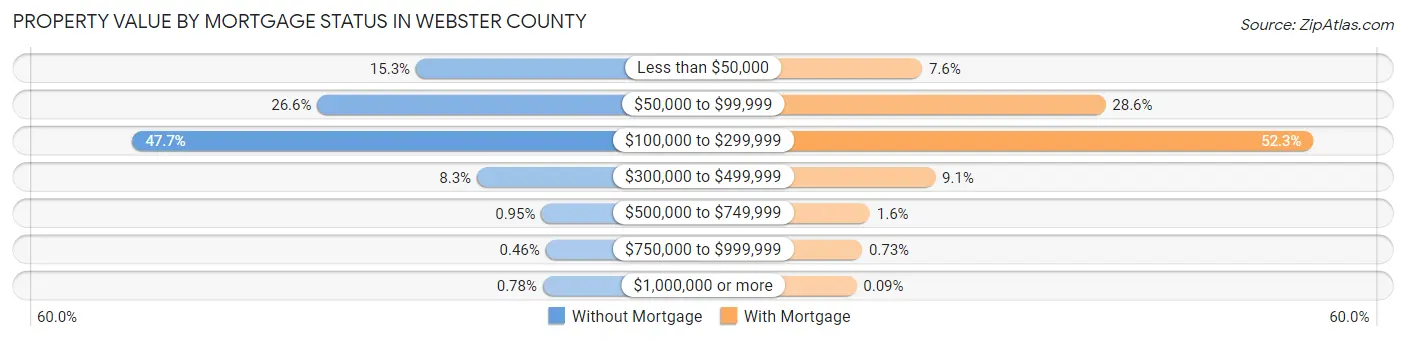
| Property Value | Without Mortgage | With Mortgage |
| Less than $50,000 | 804 (15.3%) | 425 (7.6%) |
| $50,000 to $99,999 | 1,397 (26.6%) | 1,598 (28.5%) |
| $100,000 to $299,999 | 2,508 (47.7%) | 2,928 (52.3%) |
| $300,000 to $499,999 | 437 (8.3%) | 509 (9.1%) |
| $500,000 to $749,999 | 50 (0.9%) | 91 (1.6%) |
| $750,000 to $999,999 | 24 (0.5%) | 41 (0.7%) |
| $1,000,000 or more | 41 (0.8%) | 5 (0.1%) |
| Total | 5,261 (100.0%) | 5,597 (100.0%) |
Household Income by Mortgage Status in Webster County
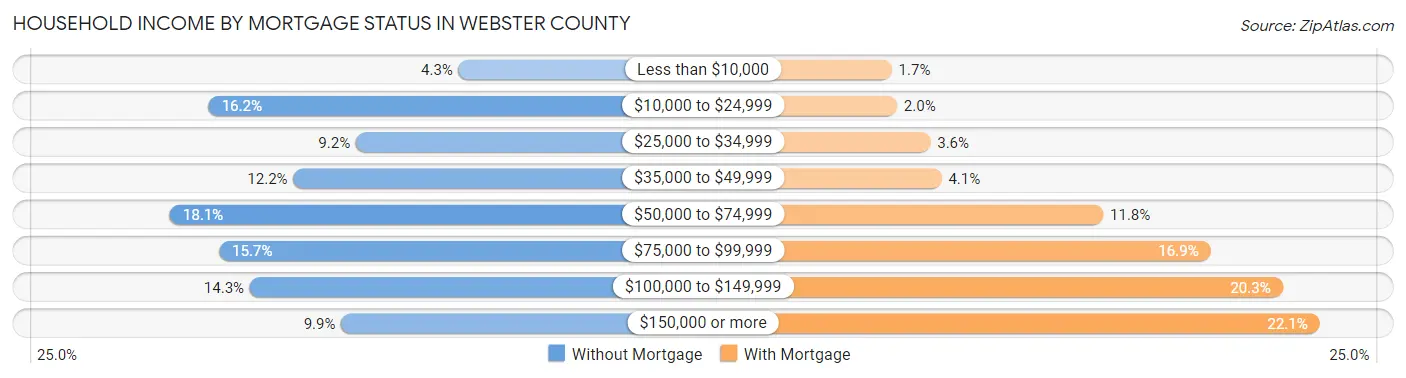
| Household Income | Without Mortgage | With Mortgage |
| Less than $10,000 | 228 (4.3%) | 96 (1.7%) |
| $10,000 to $24,999 | 854 (16.2%) | 110 (2.0%) |
| $25,000 to $34,999 | 485 (9.2%) | 199 (3.6%) |
| $35,000 to $49,999 | 642 (12.2%) | 229 (4.1%) |
| $50,000 to $74,999 | 951 (18.1%) | 660 (11.8%) |
| $75,000 to $99,999 | 828 (15.7%) | 946 (16.9%) |
| $100,000 to $149,999 | 751 (14.3%) | 1,138 (20.3%) |
| $150,000 or more | 522 (9.9%) | 1,237 (22.1%) |
| Total | 5,261 (100.0%) | 5,597 (100.0%) |
Property Value to Household Income Ratio in Webster County
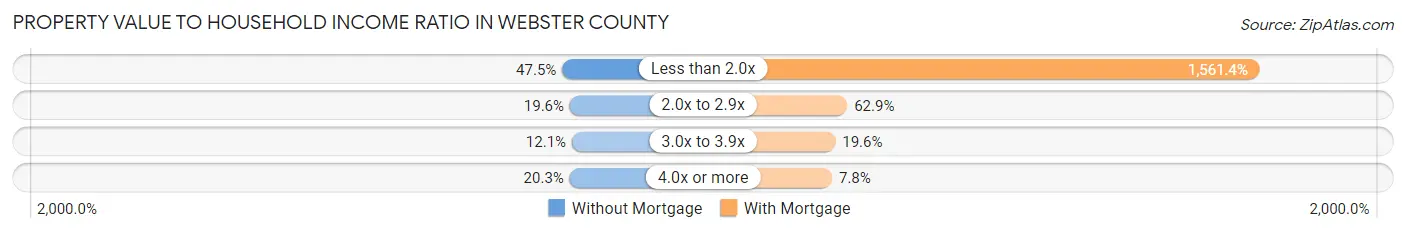
| Value-to-Income Ratio | Without Mortgage | With Mortgage |
| Less than 2.0x | 2,499 (47.5%) | 87,392 (1,561.4%) |
| 2.0x to 2.9x | 1,030 (19.6%) | 3,520 (62.9%) |
| 3.0x to 3.9x | 638 (12.1%) | 1,095 (19.6%) |
| 4.0x or more | 1,066 (20.3%) | 434 (7.7%) |
| Total | 5,261 (100.0%) | 5,597 (100.0%) |
Real Estate Taxes by Mortgage Status in Webster County
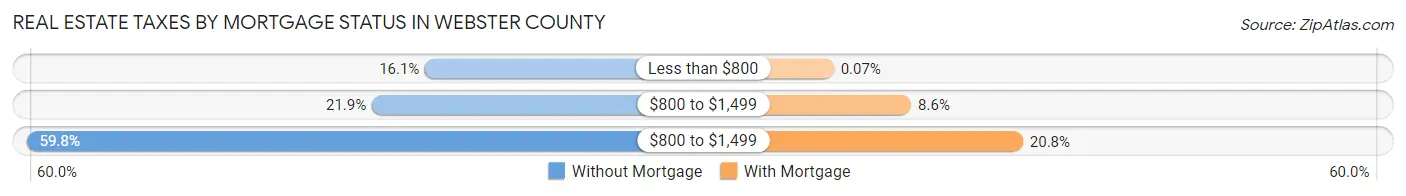
| Property Taxes | Without Mortgage | With Mortgage |
| Less than $800 | 847 (16.1%) | 4 (0.1%) |
| $800 to $1,499 | 1,153 (21.9%) | 479 (8.6%) |
| $800 to $1,499 | 3,145 (59.8%) | 1,164 (20.8%) |
| Total | 5,261 (100.0%) | 5,597 (100.0%) |
Health & Disability in Webster County
Health Insurance Coverage by Age in Webster County
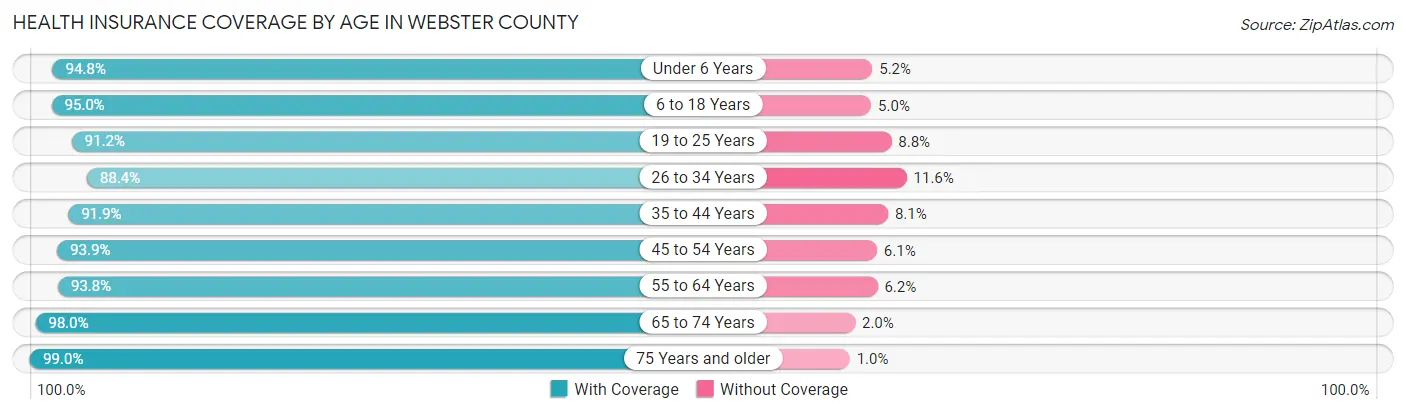
| Age Bracket | With Coverage | Without Coverage |
| Under 6 Years | 2,341 (94.8%) | 129 (5.2%) |
| 6 to 18 Years | 5,574 (95.0%) | 294 (5.0%) |
| 19 to 25 Years | 3,378 (91.2%) | 325 (8.8%) |
| 26 to 34 Years | 3,292 (88.4%) | 433 (11.6%) |
| 35 to 44 Years | 3,485 (91.9%) | 309 (8.1%) |
| 45 to 54 Years | 3,677 (93.9%) | 238 (6.1%) |
| 55 to 64 Years | 4,666 (93.8%) | 308 (6.2%) |
| 65 to 74 Years | 3,768 (98.0%) | 77 (2.0%) |
| 75 Years and older | 2,835 (99.0%) | 29 (1.0%) |
| Total | 33,016 (93.9%) | 2,142 (6.1%) |
Health Insurance Coverage by Citizenship Status in Webster County
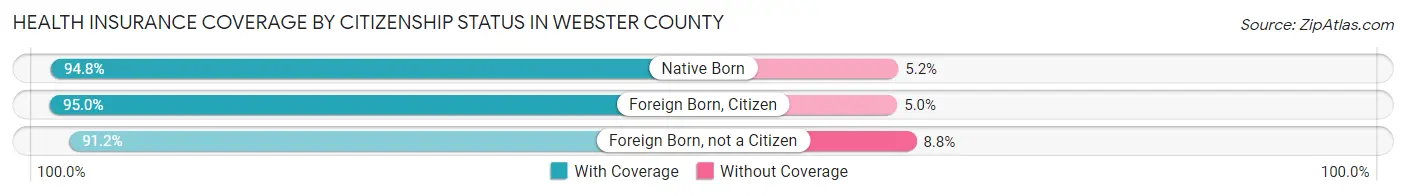
| Citizenship Status | With Coverage | Without Coverage |
| Native Born | 2,341 (94.8%) | 129 (5.2%) |
| Foreign Born, Citizen | 5,574 (95.0%) | 294 (5.0%) |
| Foreign Born, not a Citizen | 3,378 (91.2%) | 325 (8.8%) |
Health Insurance Coverage by Household Income in Webster County
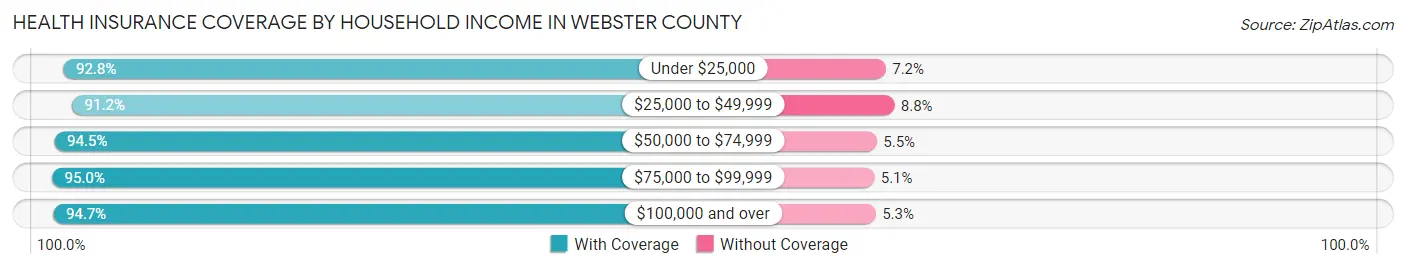
| Household Income | With Coverage | Without Coverage |
| Under $25,000 | 4,030 (92.8%) | 313 (7.2%) |
| $25,000 to $49,999 | 5,046 (91.2%) | 488 (8.8%) |
| $50,000 to $74,999 | 5,998 (94.5%) | 351 (5.5%) |
| $75,000 to $99,999 | 5,738 (95.0%) | 305 (5.1%) |
| $100,000 and over | 11,262 (94.7%) | 633 (5.3%) |
Public vs Private Health Insurance Coverage by Age in Webster County
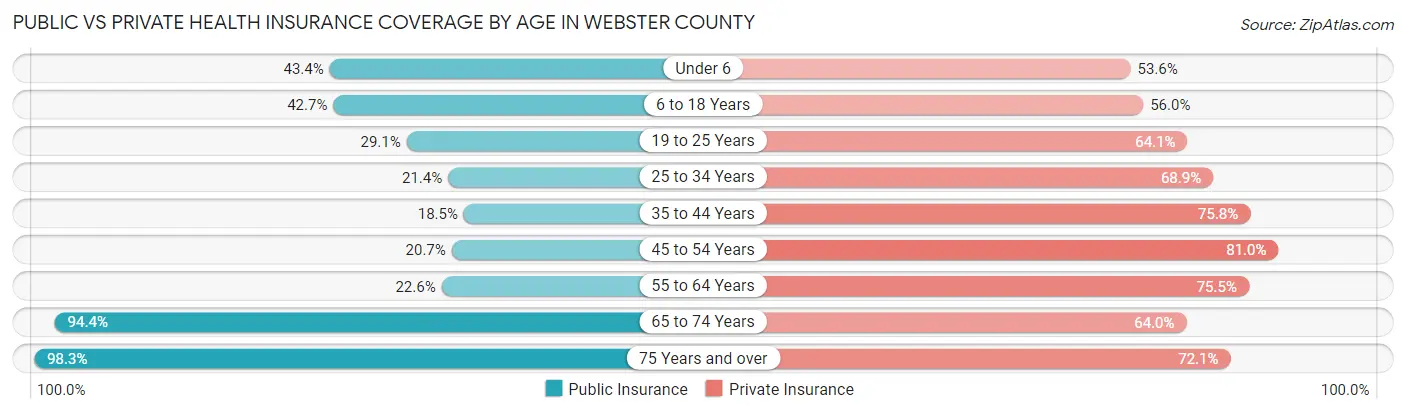
| Age Bracket | Public Insurance | Private Insurance |
| Under 6 | 1,072 (43.4%) | 1,324 (53.6%) |
| 6 to 18 Years | 2,506 (42.7%) | 3,283 (55.9%) |
| 19 to 25 Years | 1,078 (29.1%) | 2,375 (64.1%) |
| 25 to 34 Years | 797 (21.4%) | 2,566 (68.9%) |
| 35 to 44 Years | 701 (18.5%) | 2,875 (75.8%) |
| 45 to 54 Years | 812 (20.7%) | 3,172 (81.0%) |
| 55 to 64 Years | 1,125 (22.6%) | 3,757 (75.5%) |
| 65 to 74 Years | 3,630 (94.4%) | 2,459 (63.9%) |
| 75 Years and over | 2,814 (98.3%) | 2,065 (72.1%) |
| Total | 14,535 (41.3%) | 23,876 (67.9%) |
Disability Status by Sex by Age in Webster County
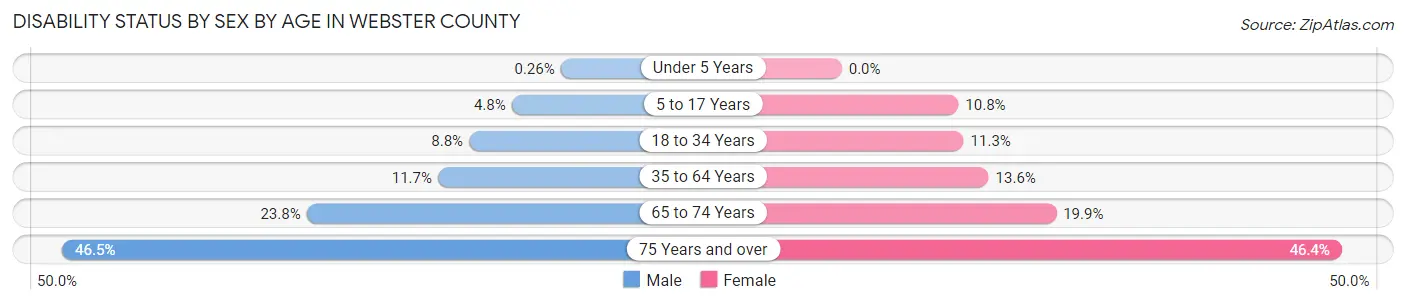
| Age Bracket | Male | Female |
| Under 5 Years | 3 (0.3%) | 0 (0.0%) |
| 5 to 17 Years | 135 (4.8%) | 302 (10.8%) |
| 18 to 34 Years | 394 (8.8%) | 402 (11.3%) |
| 35 to 64 Years | 746 (11.7%) | 856 (13.6%) |
| 65 to 74 Years | 435 (23.8%) | 402 (19.9%) |
| 75 Years and over | 560 (46.5%) | 770 (46.4%) |
Disability Class by Sex by Age in Webster County
Disability Class: Hearing Difficulty
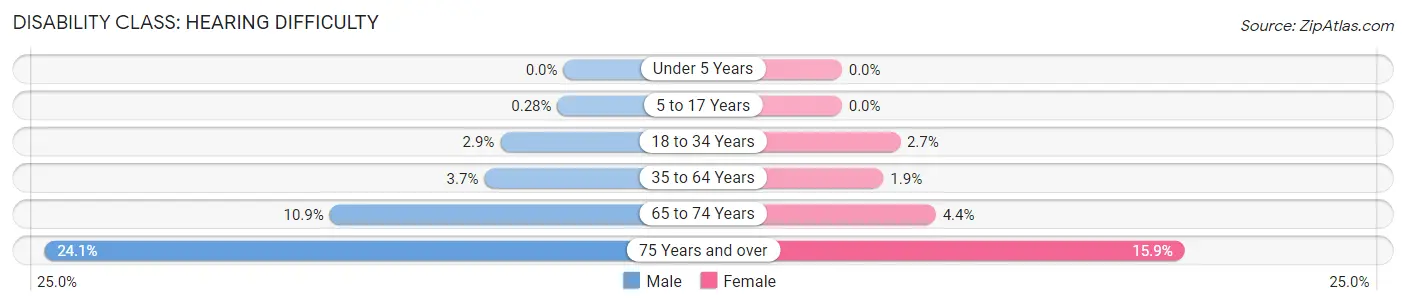
| Age Bracket | Male | Female |
| Under 5 Years | 0 (0.0%) | 0 (0.0%) |
| 5 to 17 Years | 8 (0.3%) | 0 (0.0%) |
| 18 to 34 Years | 132 (2.9%) | 96 (2.7%) |
| 35 to 64 Years | 235 (3.7%) | 121 (1.9%) |
| 65 to 74 Years | 198 (10.8%) | 88 (4.4%) |
| 75 Years and over | 290 (24.1%) | 264 (15.9%) |
Disability Class: Vision Difficulty
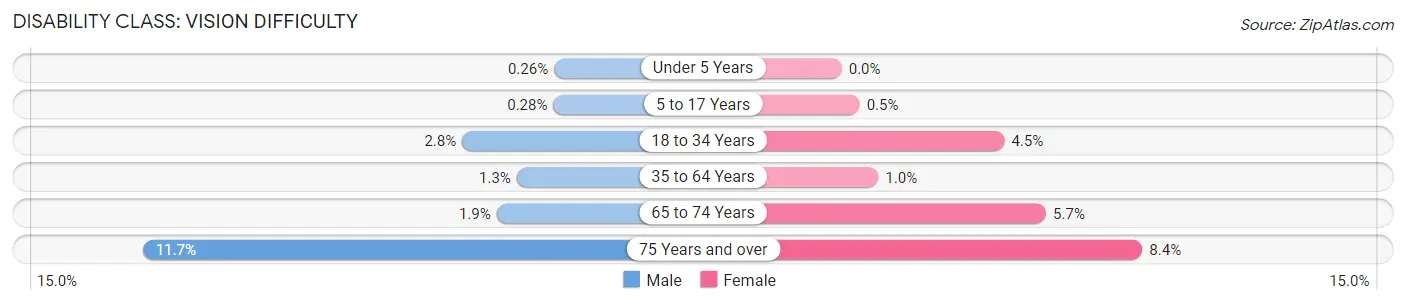
| Age Bracket | Male | Female |
| Under 5 Years | 3 (0.3%) | 0 (0.0%) |
| 5 to 17 Years | 8 (0.3%) | 14 (0.5%) |
| 18 to 34 Years | 127 (2.8%) | 161 (4.5%) |
| 35 to 64 Years | 83 (1.3%) | 64 (1.0%) |
| 65 to 74 Years | 34 (1.9%) | 115 (5.7%) |
| 75 Years and over | 141 (11.7%) | 139 (8.4%) |
Disability Class: Cognitive Difficulty
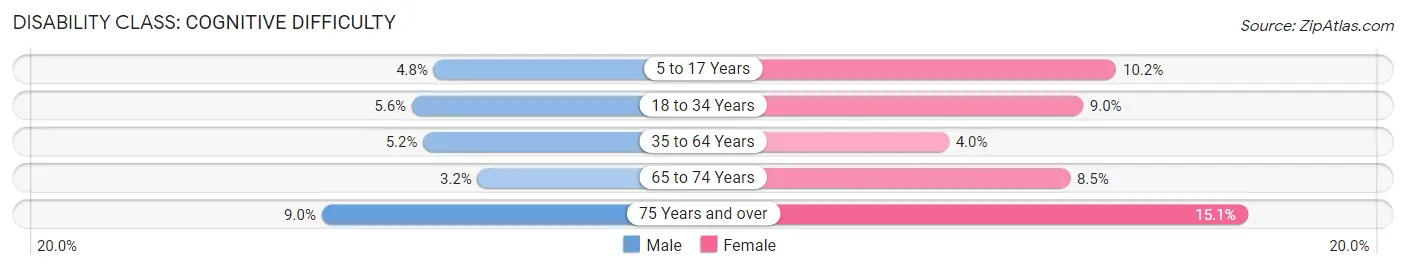
| Age Bracket | Male | Female |
| 5 to 17 Years | 135 (4.8%) | 284 (10.2%) |
| 18 to 34 Years | 253 (5.6%) | 318 (8.9%) |
| 35 to 64 Years | 333 (5.2%) | 249 (4.0%) |
| 65 to 74 Years | 58 (3.2%) | 171 (8.5%) |
| 75 Years and over | 108 (9.0%) | 250 (15.1%) |
Disability Class: Ambulatory Difficulty
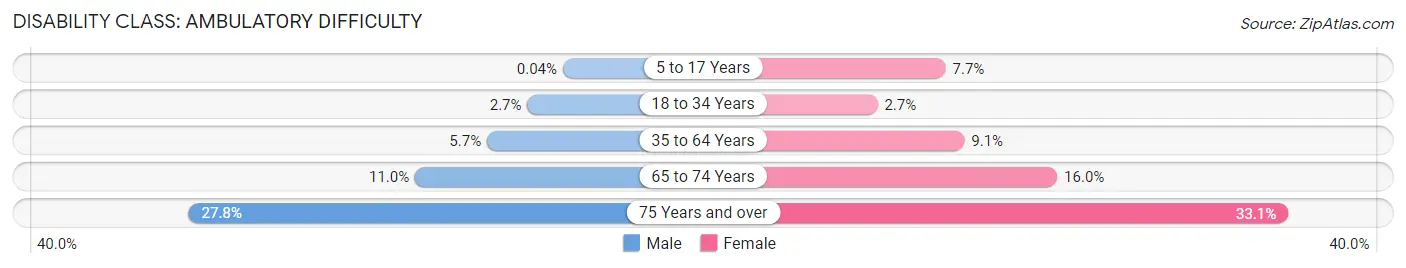
| Age Bracket | Male | Female |
| 5 to 17 Years | 1 (0.0%) | 215 (7.7%) |
| 18 to 34 Years | 120 (2.7%) | 94 (2.6%) |
| 35 to 64 Years | 363 (5.7%) | 571 (9.1%) |
| 65 to 74 Years | 201 (11.0%) | 323 (16.0%) |
| 75 Years and over | 335 (27.8%) | 550 (33.1%) |
Disability Class: Self-Care Difficulty
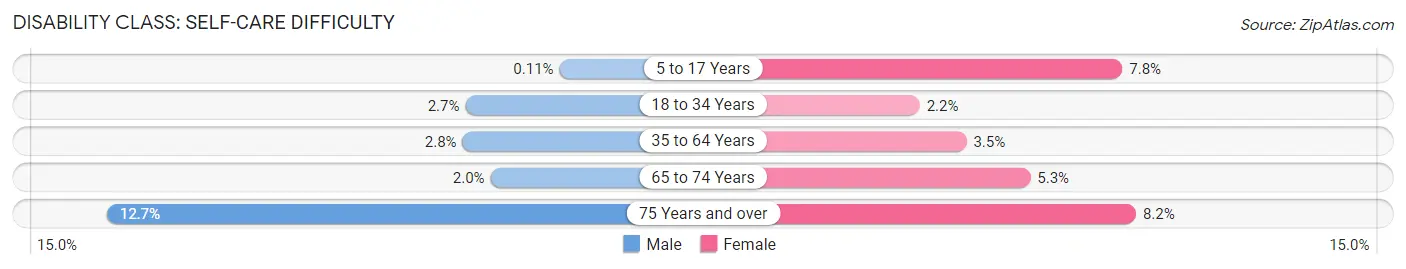
| Age Bracket | Male | Female |
| 5 to 17 Years | 3 (0.1%) | 218 (7.8%) |
| 18 to 34 Years | 123 (2.7%) | 77 (2.2%) |
| 35 to 64 Years | 180 (2.8%) | 218 (3.5%) |
| 65 to 74 Years | 37 (2.0%) | 106 (5.2%) |
| 75 Years and over | 153 (12.7%) | 136 (8.2%) |
Technology Access in Webster County
Computing Device Access in Webster County
| Device Type | # Households | % Households |
| Desktop or Laptop | 10,830 | 69.5% |
| Smartphone | 12,897 | 82.8% |
| Tablet | 8,499 | 54.5% |
| No Computing Device | 1,696 | 10.9% |
| Total | 15,582 | 100.0% |
Internet Access in Webster County
| Internet Type | # Households | % Households |
| Dial-Up Internet | 103 | 0.7% |
| Broadband Home | 9,399 | 60.3% |
| Cellular Data Only | 2,751 | 17.6% |
| Satellite Internet | 940 | 6.0% |
| No Internet | 2,677 | 17.2% |
| Total | 15,582 | 100.0% |
Webster County Summary
Webster County, Iowa is located in the northwest corner of the state and is bordered by the states of South Dakota and Minnesota. It is part of the Fort Dodge, IA Metropolitan Statistical Area and is the largest county in the state by area. The county seat is Fort Dodge, which is also the largest city in the county.
History
Webster County was established in 1851 and was named after Daniel Webster, a prominent American statesman. The county was originally part of the Iowa Territory and was part of the original land grant given to the Sac and Fox Indians. The county was organized in 1853 and the first county seat was located in Lehigh. In 1855, the county seat was moved to Fort Dodge, which was named after General Grenville M. Dodge.
The county was largely agricultural in the 19th century, with the majority of the population living in rural areas. The first railroad line in the county was built in 1867 and connected Fort Dodge to Des Moines. This line was later extended to Sioux City and Omaha.
In the early 20th century, the county experienced a period of rapid growth and development. The population increased from 10,000 in 1900 to over 40,000 by 1950. This growth was largely due to the development of the coal mining industry in the area. The coal mines provided jobs for many of the county’s residents and helped to fuel the local economy.
Geography
Webster County covers an area of 1,068 square miles and is the largest county in Iowa by area. The county is located in the northwest corner of the state and is bordered by the states of South Dakota and Minnesota. The Des Moines River flows through the county and is a major tributary of the Mississippi River.
The county is largely rural, with the majority of the population living in small towns and rural areas. The largest city in the county is Fort Dodge, which is also the county seat. Other major towns in the county include Lehigh, Otho, and Duncombe.
The county is located in the Central Plains region of the United States and is characterized by rolling hills and flat plains. The climate is generally temperate, with hot summers and cold winters.
Economy
The economy of Webster County is largely based on agriculture and manufacturing. The county is home to several large agricultural operations, including hog farms, cattle ranches, and grain farms. The county is also home to several large manufacturing companies, including John Deere, Cargill, and Tyson Foods.
The county is also home to several large retail stores, including Walmart, Target, and Hy-Vee. The county is also home to several large healthcare providers, including UnityPoint Health and Trinity Regional Medical Center.
Demographics
As of the 2010 census, the population of Webster County was 38,013. The population is largely white (94.2%), with small percentages of African Americans (2.2%), Asians (1.2%), and Native Americans (0.4%). The median household income in the county is $45,845 and the median home value is $117,400.
The largest city in the county is Fort Dodge, which has a population of 25,206. Other major cities in the county include Lehigh (1,845), Otho (1,072), and Duncombe (1,039). The county is served by several school districts, including the Fort Dodge Community School District, the Lehigh Community School District, and the Otho-Duncombe Community School District.
Common Questions
What is Per Capita Income in Webster County?
Per Capita income in Webster County is $33,836.
What is the Median Family Income in Webster County?
Median Family Income in Webster County is $82,733.
What is the Median Household income in Webster County?
Median Household Income in Webster County is $65,335.
What is Income or Wage Gap in Webster County?
Income or Wage Gap in Webster County is 36.5%.
Women in Webster County earn 63.5 cents for every dollar earned by a man.
What is Family Income Deficit in Webster County?
Family Income Deficit in Webster County is $10,661.
Families that are below poverty line in Webster County earn $10,661 less on average than the poverty threshold level.
What is Inequality or Gini Index in Webster County?
Inequality or Gini Index in Webster County is 0.44.
What is the Total Population of Webster County?
Total Population of Webster County is 36,986.
What is the Total Male Population of Webster County?
Total Male Population of Webster County is 19,367.
What is the Total Female Population of Webster County?
Total Female Population of Webster County is 17,619.
What is the Ratio of Males per 100 Females in Webster County?
There are 109.92 Males per 100 Females in Webster County.
What is the Ratio of Females per 100 Males in Webster County?
There are 90.97 Females per 100 Males in Webster County.
What is the Median Population Age in Webster County?
Median Population Age in Webster County is 39.8 Years.
What is the Average Family Size in Webster County
Average Family Size in Webster County is 2.9 People.
What is the Average Household Size in Webster County
Average Household Size in Webster County is 2.2 People.
How Large is the Labor Force in Webster County?
There are 18,358 People in the Labor Forcein in Webster County.
What is the Percentage of People in the Labor Force in Webster County?
60.5% of People are in the Labor Force in Webster County.
What is the Unemployment Rate in Webster County?
Unemployment Rate in Webster County is 3.2%.