Johnson County, IA Map & Demographics
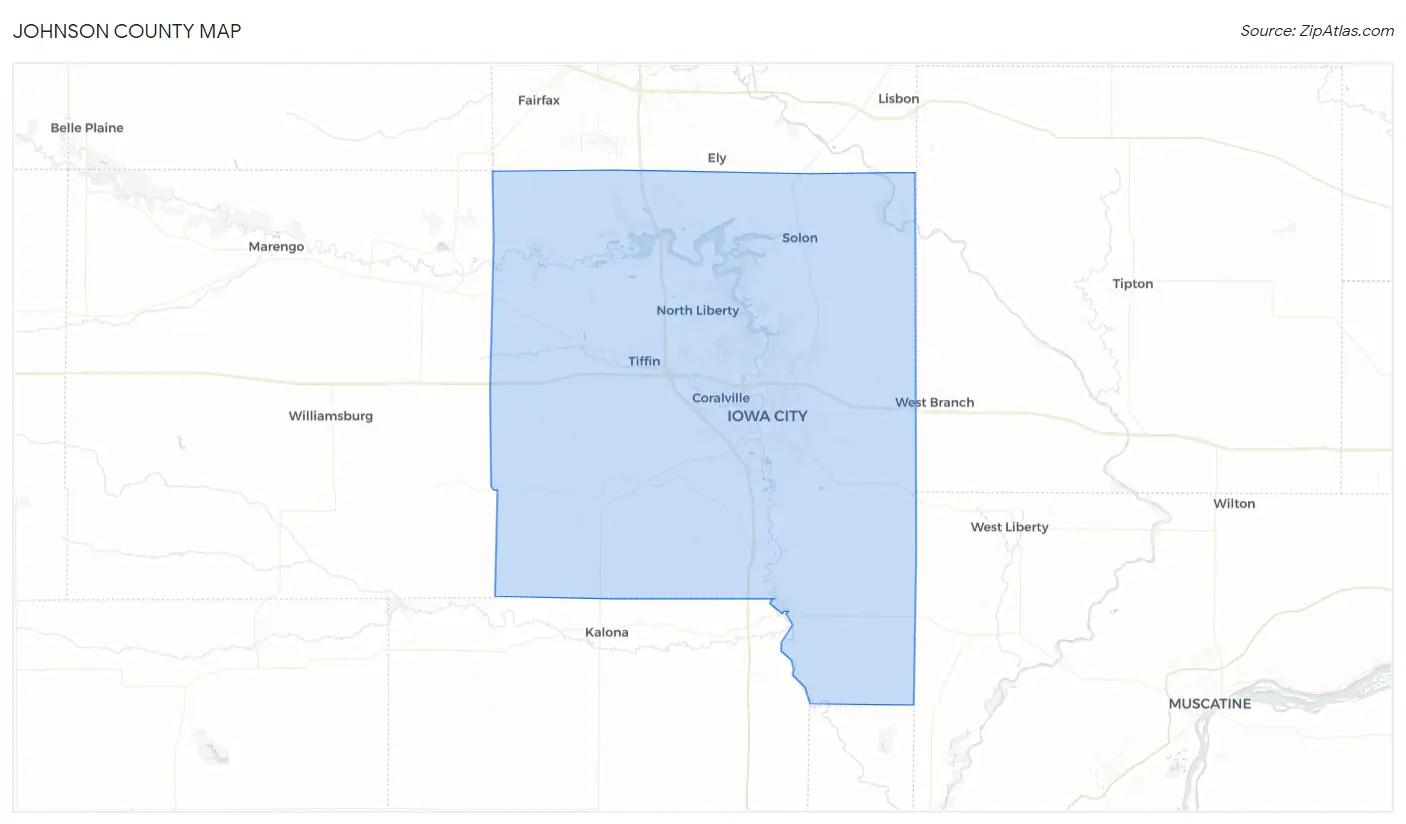
Johnson County Map
Johnson County Overview
$42,175
PER CAPITA INCOME
$112,575
AVG FAMILY INCOME
$72,977
AVG HOUSEHOLD INCOME
30.9%
WAGE / INCOME GAP [ % ]
69.1¢/ $1
WAGE / INCOME GAP [ $ ]
$13,108
FAMILY INCOME DEFICIT
0.49
INEQUALITY / GINI INDEX
153,360
TOTAL POPULATION
76,466
MALE POPULATION
76,894
FEMALE POPULATION
99.44
MALES / 100 FEMALES
100.56
FEMALES / 100 MALES
30.6
MEDIAN AGE
3.0
AVG FAMILY SIZE
2.4
AVG HOUSEHOLD SIZE
88,332
LABOR FORCE [ PEOPLE ]
69.7%
PERCENT IN LABOR FORCE
3.8%
UNEMPLOYMENT RATE
Johnson County Area Codes
Income in Johnson County
Income Overview in Johnson County
Per Capita Income in Johnson County is $42,175, while median incomes of families and households are $112,575 and $72,977 respectively.
| Characteristic | Number | Measure |
| Per Capita Income | 153,360 | $42,175 |
| Median Family Income | 32,754 | $112,575 |
| Mean Family Income | 32,754 | $141,023 |
| Median Household Income | 61,414 | $72,977 |
| Mean Household Income | 61,414 | $103,328 |
| Income Deficit | 32,754 | $13,108 |
| Wage / Income Gap (%) | 153,360 | 30.90% |
| Wage / Income Gap ($) | 153,360 | 69.10¢ per $1 |
| Gini / Inequality Index | 153,360 | 0.49 |
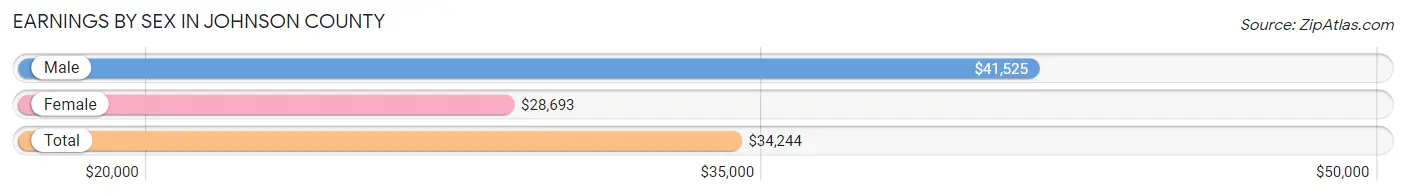
Earnings by Sex in Johnson County
Average Earnings in Johnson County are $34,244, $41,525 for men and $28,693 for women, a difference of 30.9%.
| Sex | Number | Average Earnings |
| Male | 50,205 (50.9%) | $41,525 |
| Female | 48,399 (49.1%) | $28,693 |
| Total | 98,604 (100.0%) | $34,244 |
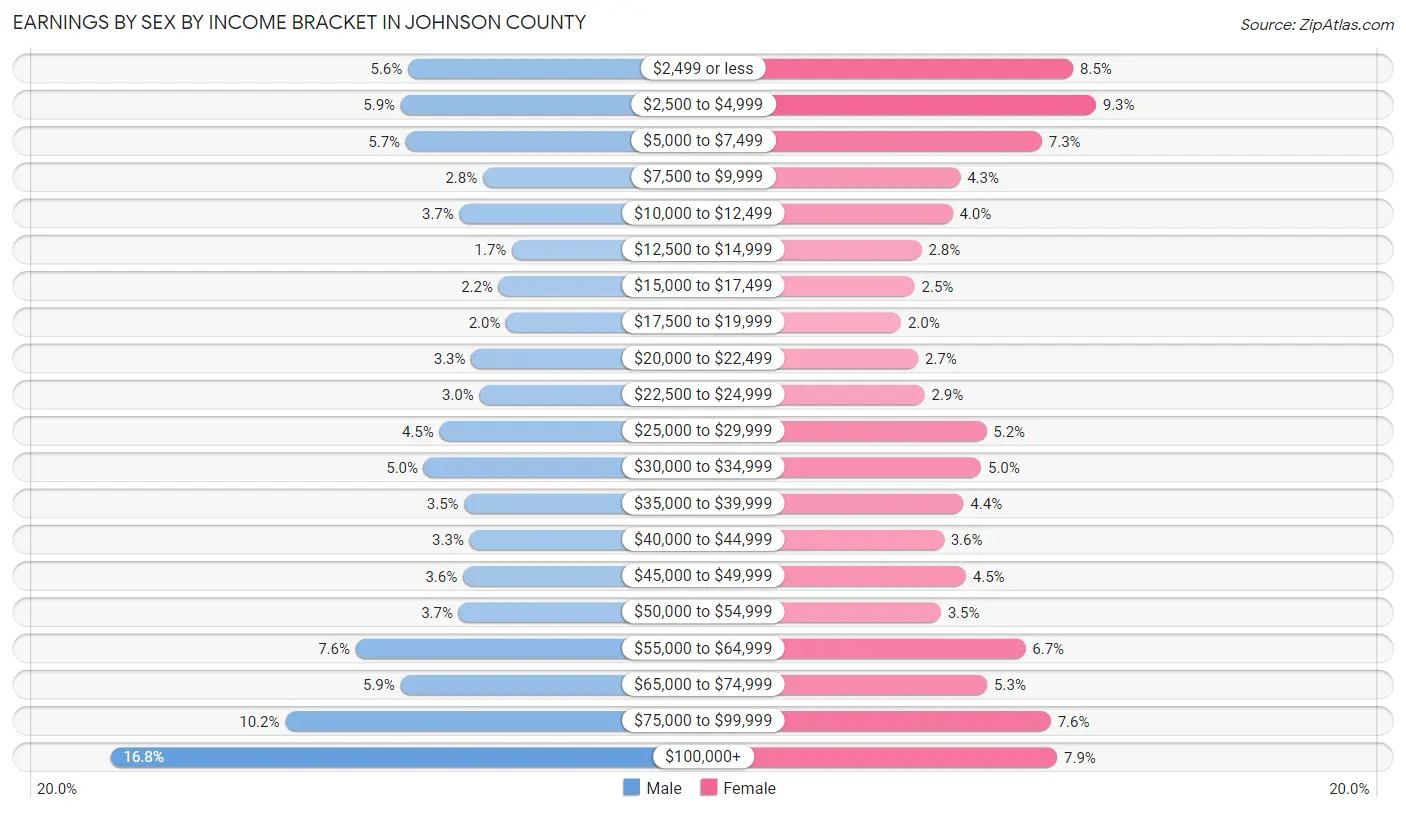
Earnings by Sex by Income Bracket in Johnson County
The most common earnings brackets in Johnson County are $100,000+ for men (8,423 | 16.8%) and $2,500 to $4,999 for women (4,516 | 9.3%).
| Income | Male | Female |
| $2,499 or less | 2,825 (5.6%) | 4,105 (8.5%) |
| $2,500 to $4,999 | 2,963 (5.9%) | 4,516 (9.3%) |
| $5,000 to $7,499 | 2,869 (5.7%) | 3,538 (7.3%) |
| $7,500 to $9,999 | 1,416 (2.8%) | 2,059 (4.3%) |
| $10,000 to $12,499 | 1,856 (3.7%) | 1,915 (4.0%) |
| $12,500 to $14,999 | 868 (1.7%) | 1,357 (2.8%) |
| $15,000 to $17,499 | 1,121 (2.2%) | 1,229 (2.5%) |
| $17,500 to $19,999 | 977 (1.9%) | 982 (2.0%) |
| $20,000 to $22,499 | 1,635 (3.3%) | 1,294 (2.7%) |
| $22,500 to $24,999 | 1,480 (2.9%) | 1,410 (2.9%) |
| $25,000 to $29,999 | 2,233 (4.4%) | 2,533 (5.2%) |
| $30,000 to $34,999 | 2,529 (5.0%) | 2,436 (5.0%) |
| $35,000 to $39,999 | 1,767 (3.5%) | 2,113 (4.4%) |
| $40,000 to $44,999 | 1,669 (3.3%) | 1,757 (3.6%) |
| $45,000 to $49,999 | 1,791 (3.6%) | 2,161 (4.5%) |
| $50,000 to $54,999 | 1,873 (3.7%) | 1,702 (3.5%) |
| $55,000 to $64,999 | 3,809 (7.6%) | 3,237 (6.7%) |
| $65,000 to $74,999 | 2,966 (5.9%) | 2,544 (5.3%) |
| $75,000 to $99,999 | 5,135 (10.2%) | 3,696 (7.6%) |
| $100,000+ | 8,423 (16.8%) | 3,815 (7.9%) |
| Total | 50,205 (100.0%) | 48,399 (100.0%) |
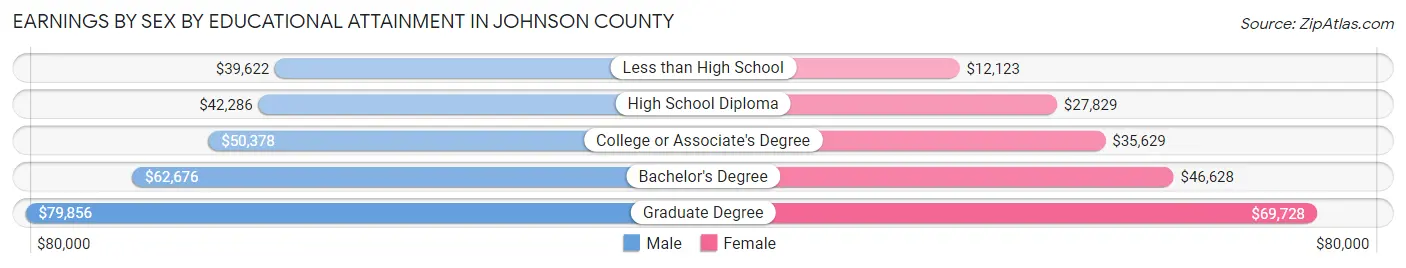
Earnings by Sex by Educational Attainment in Johnson County
Average earnings in Johnson County are $58,405 for men and $45,810 for women, a difference of 21.6%. Men with an educational attainment of graduate degree enjoy the highest average annual earnings of $79,856, while those with less than high school education earn the least with $39,622. Women with an educational attainment of graduate degree earn the most with the average annual earnings of $69,728, while those with less than high school education have the smallest earnings of $12,123.
| Educational Attainment | Male Income | Female Income |
| Less than High School | $39,622 | $12,123 |
| High School Diploma | $42,286 | $27,829 |
| College or Associate's Degree | $50,378 | $35,629 |
| Bachelor's Degree | $62,676 | $46,628 |
| Graduate Degree | $79,856 | $69,728 |
| Total | $58,405 | $45,810 |
Family Income in Johnson County
Family Income Brackets in Johnson County
According to the Johnson County family income data, there are 8,385 families falling into the $100,000 to $149,999 income range, which is the most common income bracket and makes up 25.6% of all families. Conversely, the $10,000 to $14,999 income bracket is the least frequent group with only 426 families (1.3%) belonging to this category.
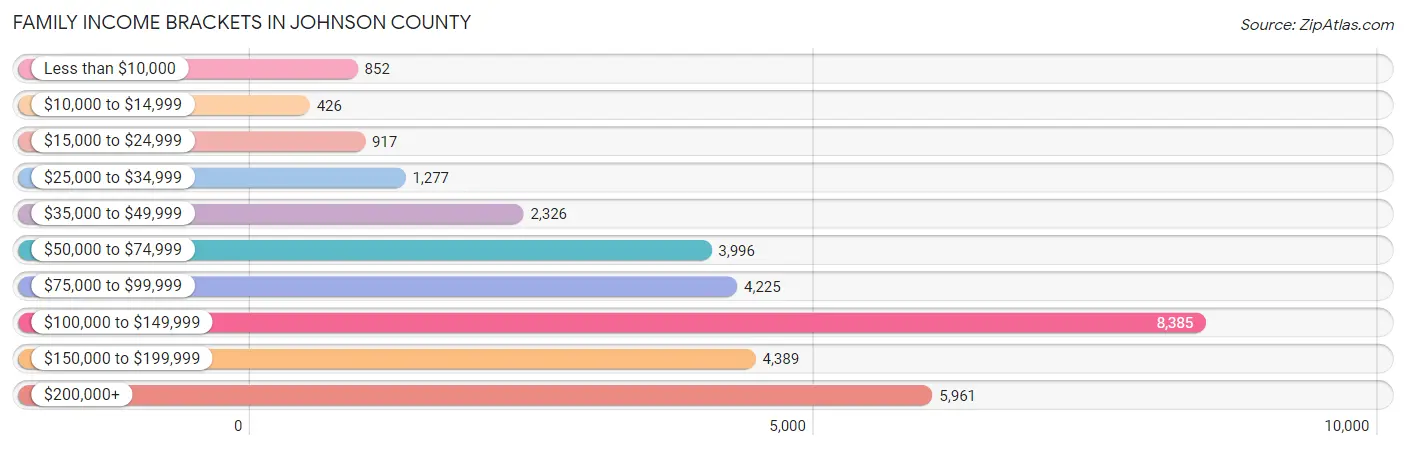
| Income Bracket | # Families | % Families |
| Less than $10,000 | 852 | 2.6% |
| $10,000 to $14,999 | 426 | 1.3% |
| $15,000 to $24,999 | 917 | 2.8% |
| $25,000 to $34,999 | 1,277 | 3.9% |
| $35,000 to $49,999 | 2,326 | 7.1% |
| $50,000 to $74,999 | 3,996 | 12.2% |
| $75,000 to $99,999 | 4,225 | 12.9% |
| $100,000 to $149,999 | 8,385 | 25.6% |
| $150,000 to $199,999 | 4,389 | 13.4% |
| $200,000+ | 5,961 | 18.2% |
Family Income by Famaliy Size in Johnson County
4-person families (5,725 | 17.5%) account for the highest median family income in Johnson County with $141,338 per family, while 2-person families (16,908 | 51.6%) have the highest median income of $49,778 per family member.
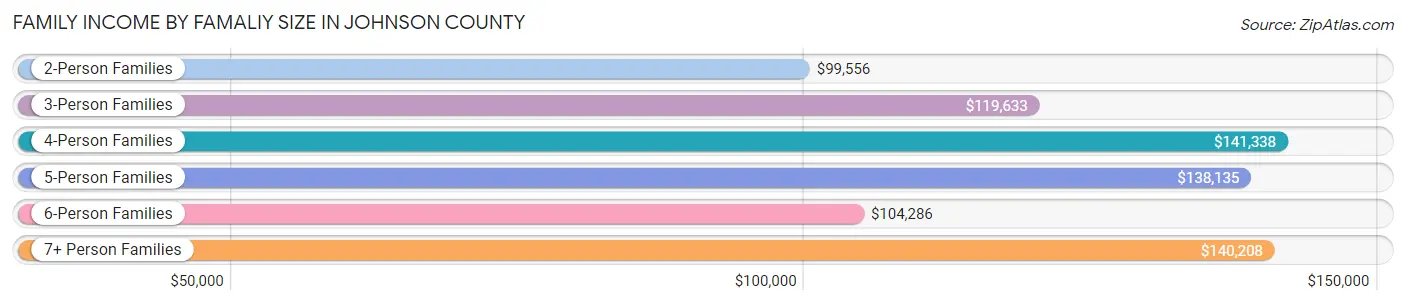
| Income Bracket | # Families | Median Income |
| 2-Person Families | 16,908 (51.6%) | $99,556 |
| 3-Person Families | 6,357 (19.4%) | $119,633 |
| 4-Person Families | 5,725 (17.5%) | $141,338 |
| 5-Person Families | 2,761 (8.4%) | $138,135 |
| 6-Person Families | 664 (2.0%) | $104,286 |
| 7+ Person Families | 339 (1.0%) | $140,208 |
| Total | 32,754 (100.0%) | $112,575 |
Family Income by Number of Earners in Johnson County
The median family income in Johnson County is $112,575, with families comprising 3+ earners (3,544) having the highest median family income of $142,331, while families with no earners (3,974) have the lowest median family income of $66,183, accounting for 10.8% and 12.1% of families, respectively.
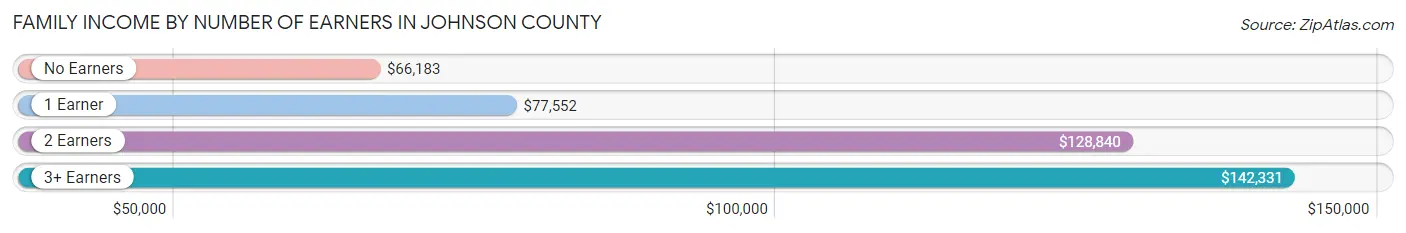
| Number of Earners | # Families | Median Income |
| No Earners | 3,974 (12.1%) | $66,183 |
| 1 Earner | 7,972 (24.3%) | $77,552 |
| 2 Earners | 17,264 (52.7%) | $128,840 |
| 3+ Earners | 3,544 (10.8%) | $142,331 |
| Total | 32,754 (100.0%) | $112,575 |
Household Income in Johnson County
Household Income Brackets in Johnson County
With 11,177 households falling in the category, the $100,000 to $149,999 income range is the most frequent in Johnson County, accounting for 18.2% of all households. In contrast, only 2,457 households (4.0%) fall into the $10,000 to $14,999 income bracket, making it the least populous group.
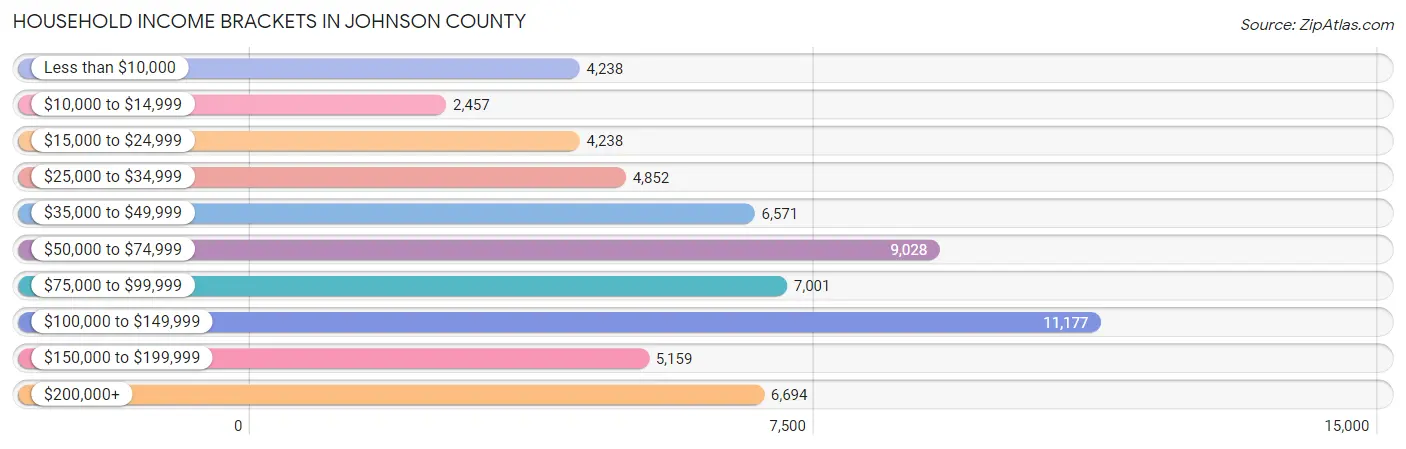
| Income Bracket | # Households | % Households |
| Less than $10,000 | 4,238 | 6.9% |
| $10,000 to $14,999 | 2,457 | 4.0% |
| $15,000 to $24,999 | 4,238 | 6.9% |
| $25,000 to $34,999 | 4,852 | 7.9% |
| $35,000 to $49,999 | 6,571 | 10.7% |
| $50,000 to $74,999 | 9,028 | 14.7% |
| $75,000 to $99,999 | 7,001 | 11.4% |
| $100,000 to $149,999 | 11,177 | 18.2% |
| $150,000 to $199,999 | 5,159 | 8.4% |
| $200,000+ | 6,694 | 10.9% |
Household Income by Householder Age in Johnson County
The median household income in Johnson County is $72,977, with the highest median household income of $104,734 found in the 45 to 64 years age bracket for the primary householder. A total of 17,442 households (28.4%) fall into this category. Meanwhile, the 15 to 24 years age bracket for the primary householder has the lowest median household income of $24,526, with 10,178 households (16.6%) in this group.
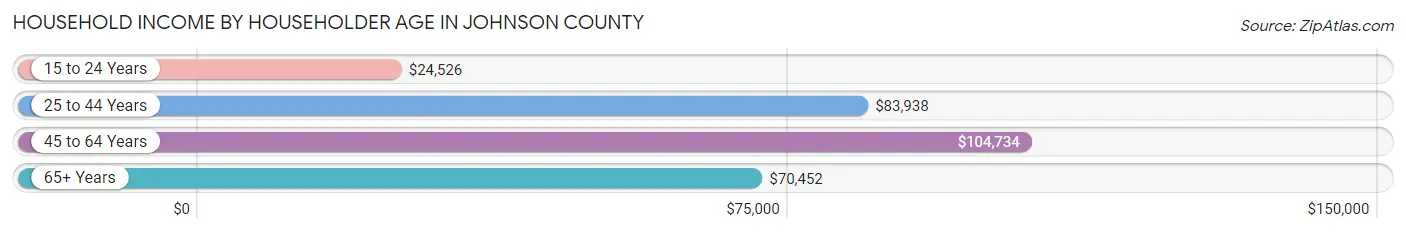
| Income Bracket | # Households | Median Income |
| 15 to 24 Years | 10,178 (16.6%) | $24,526 |
| 25 to 44 Years | 21,613 (35.2%) | $83,938 |
| 45 to 64 Years | 17,442 (28.4%) | $104,734 |
| 65+ Years | 12,181 (19.8%) | $70,452 |
| Total | 61,414 (100.0%) | $72,977 |
Poverty in Johnson County
Income Below Poverty by Sex and Age in Johnson County
With 15.6% poverty level for males and 18.2% for females among the residents of Johnson County, 18 to 24 year old males and 18 to 24 year old females are the most vulnerable to poverty, with 5,989 males (44.0%) and 8,063 females (58.5%) in their respective age groups living below the poverty level.
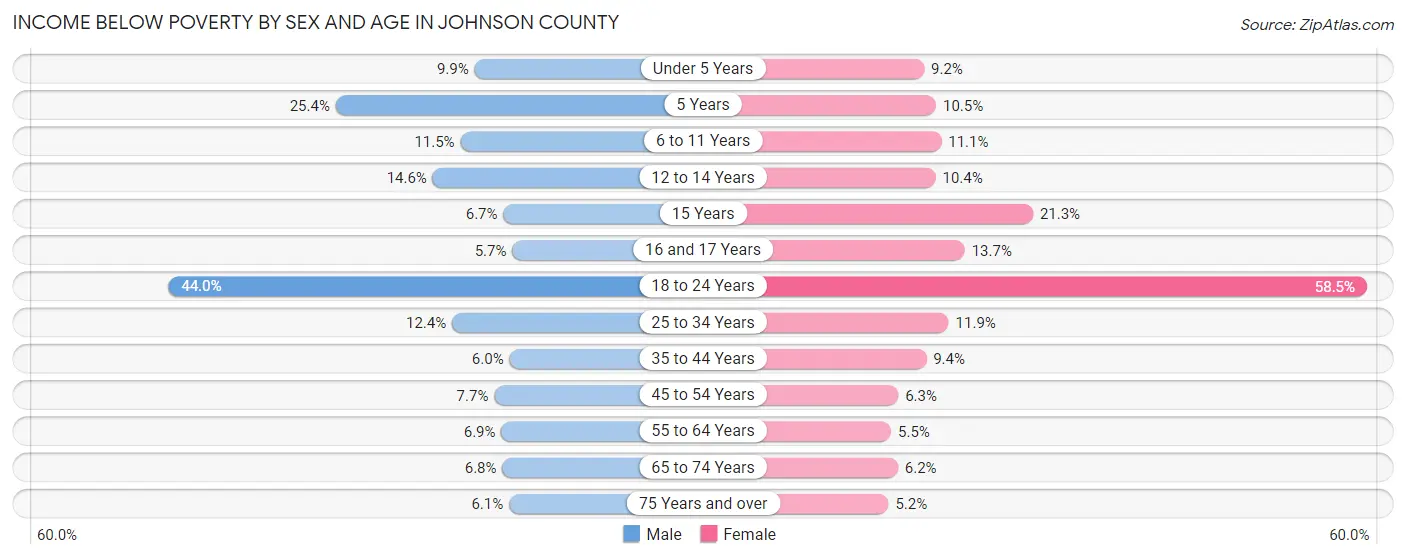
| Age Bracket | Male | Female |
| Under 5 Years | 430 (9.9%) | 355 (9.2%) |
| 5 Years | 274 (25.4%) | 80 (10.5%) |
| 6 to 11 Years | 589 (11.5%) | 576 (11.1%) |
| 12 to 14 Years | 310 (14.5%) | 219 (10.4%) |
| 15 Years | 66 (6.7%) | 162 (21.3%) |
| 16 and 17 Years | 83 (5.7%) | 224 (13.7%) |
| 18 to 24 Years | 5,989 (44.0%) | 8,063 (58.5%) |
| 25 to 34 Years | 1,413 (12.4%) | 1,300 (11.9%) |
| 35 to 44 Years | 568 (6.0%) | 847 (9.4%) |
| 45 to 54 Years | 585 (7.7%) | 462 (6.3%) |
| 55 to 64 Years | 493 (6.9%) | 411 (5.5%) |
| 65 to 74 Years | 372 (6.8%) | 384 (6.2%) |
| 75 Years and over | 179 (6.0%) | 213 (5.2%) |
| Total | 11,351 (15.6%) | 13,296 (18.2%) |
Income Above Poverty by Sex and Age in Johnson County
According to the poverty statistics in Johnson County, males aged 16 and 17 years and females aged 75 years and over are the age groups that are most secure financially, with 94.3% of males and 94.8% of females in these age groups living above the poverty line.
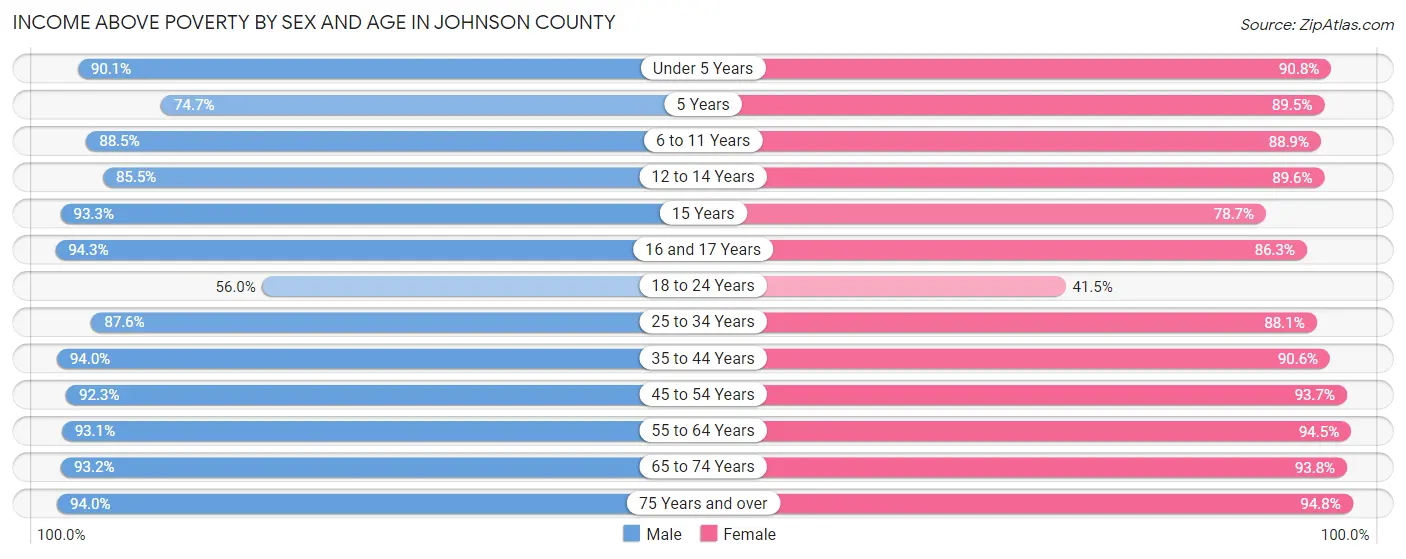
| Age Bracket | Male | Female |
| Under 5 Years | 3,918 (90.1%) | 3,518 (90.8%) |
| 5 Years | 807 (74.7%) | 682 (89.5%) |
| 6 to 11 Years | 4,550 (88.5%) | 4,621 (88.9%) |
| 12 to 14 Years | 1,821 (85.5%) | 1,879 (89.6%) |
| 15 Years | 922 (93.3%) | 599 (78.7%) |
| 16 and 17 Years | 1,375 (94.3%) | 1,412 (86.3%) |
| 18 to 24 Years | 7,627 (56.0%) | 5,727 (41.5%) |
| 25 to 34 Years | 9,984 (87.6%) | 9,621 (88.1%) |
| 35 to 44 Years | 8,901 (94.0%) | 8,167 (90.6%) |
| 45 to 54 Years | 7,014 (92.3%) | 6,897 (93.7%) |
| 55 to 64 Years | 6,657 (93.1%) | 7,082 (94.5%) |
| 65 to 74 Years | 5,108 (93.2%) | 5,767 (93.8%) |
| 75 Years and over | 2,780 (94.0%) | 3,887 (94.8%) |
| Total | 61,464 (84.4%) | 59,859 (81.8%) |
Income Below Poverty Among Married-Couple Families in Johnson County
The poverty statistics for married-couple families in Johnson County show that 3.4% or 912 of the total 26,653 families live below the poverty line. Families with 5 or more children have the highest poverty rate of 31.0%, comprising of 54 families. On the other hand, families with no children have the lowest poverty rate of 1.6%, which includes 240 families.
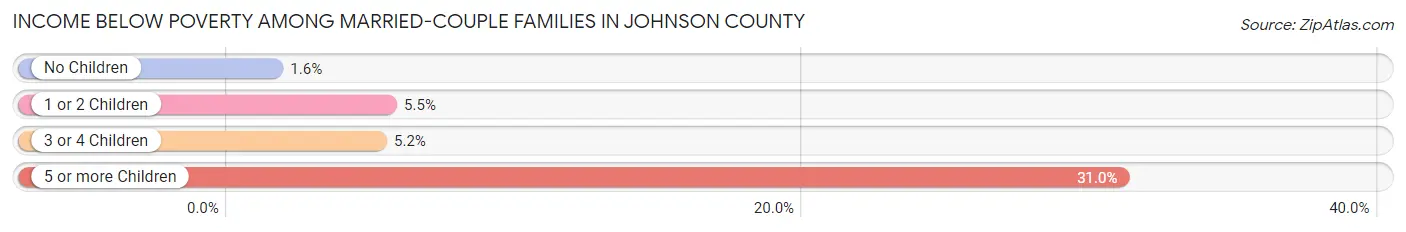
| Children | Above Poverty | Below Poverty |
| No Children | 14,922 (98.4%) | 240 (1.6%) |
| 1 or 2 Children | 8,251 (94.5%) | 484 (5.5%) |
| 3 or 4 Children | 2,448 (94.8%) | 134 (5.2%) |
| 5 or more Children | 120 (69.0%) | 54 (31.0%) |
| Total | 25,741 (96.6%) | 912 (3.4%) |
Income Below Poverty Among Single-Parent Households in Johnson County
According to the poverty data in Johnson County, 9.9% or 176 single-father households and 20.2% or 874 single-mother households are living below the poverty line. Among single-father households, those with 3 or 4 children have the highest poverty rate, with 53 households (58.2%) experiencing poverty. Likewise, among single-mother households, those with 5 or more children have the highest poverty rate, with 6 households (100.0%) falling below the poverty line.
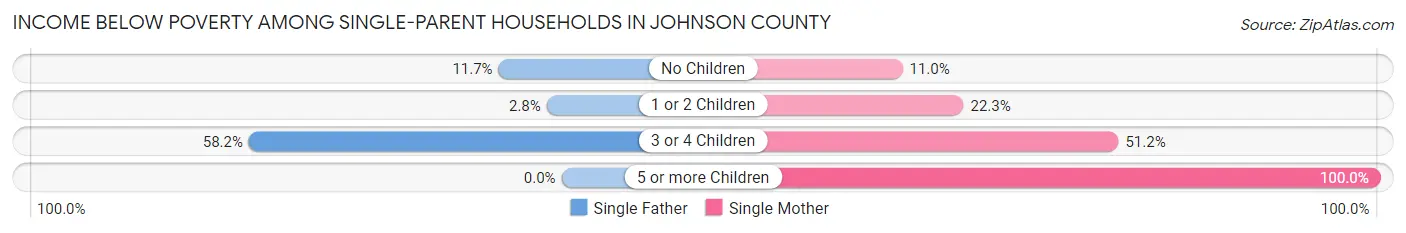
| Children | Single Father | Single Mother |
| No Children | 100 (11.7%) | 187 (11.0%) |
| 1 or 2 Children | 23 (2.8%) | 509 (22.3%) |
| 3 or 4 Children | 53 (58.2%) | 172 (51.2%) |
| 5 or more Children | 0 (0.0%) | 6 (100.0%) |
| Total | 176 (9.9%) | 874 (20.2%) |
Income Below Poverty Among Married-Couple vs Single-Parent Households in Johnson County
The poverty data for Johnson County shows that 912 of the married-couple family households (3.4%) and 1,050 of the single-parent households (17.2%) are living below the poverty level. Within the married-couple family households, those with 5 or more children have the highest poverty rate, with 54 households (31.0%) falling below the poverty line. Among the single-parent households, those with 5 or more children have the highest poverty rate, with 6 household (100.0%) living below poverty.
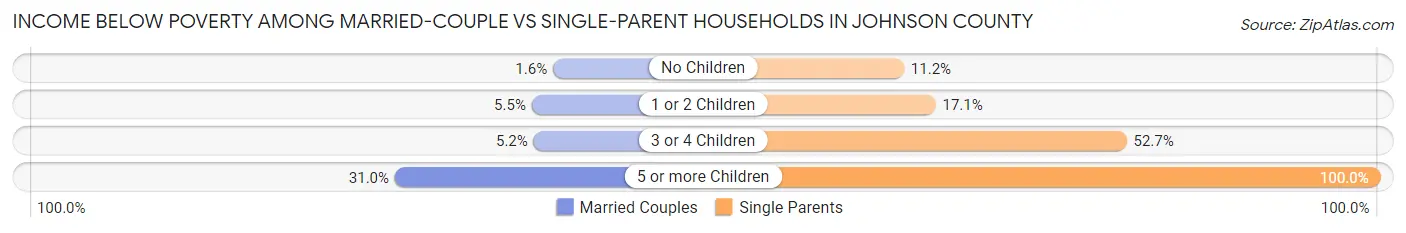
| Children | Married-Couple Families | Single-Parent Households |
| No Children | 240 (1.6%) | 287 (11.2%) |
| 1 or 2 Children | 484 (5.5%) | 532 (17.1%) |
| 3 or 4 Children | 134 (5.2%) | 225 (52.7%) |
| 5 or more Children | 54 (31.0%) | 6 (100.0%) |
| Total | 912 (3.4%) | 1,050 (17.2%) |
Race in Johnson County
The most populous races in Johnson County are White / Caucasian (121,054 | 78.9%), Black / African American (11,355 | 7.4%), and Asian (9,441 | 6.2%).
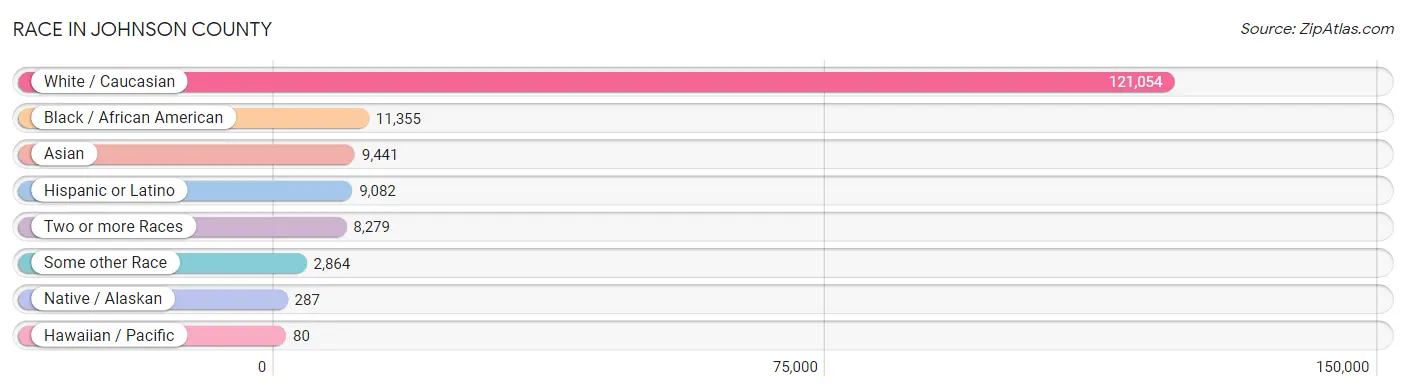
| Race | # Population | % Population |
| Asian | 9,441 | 6.2% |
| Black / African American | 11,355 | 7.4% |
| Hawaiian / Pacific | 80 | 0.1% |
| Hispanic or Latino | 9,082 | 5.9% |
| Native / Alaskan | 287 | 0.2% |
| White / Caucasian | 121,054 | 78.9% |
| Two or more Races | 8,279 | 5.4% |
| Some other Race | 2,864 | 1.9% |
| Total | 153,360 | 100.0% |
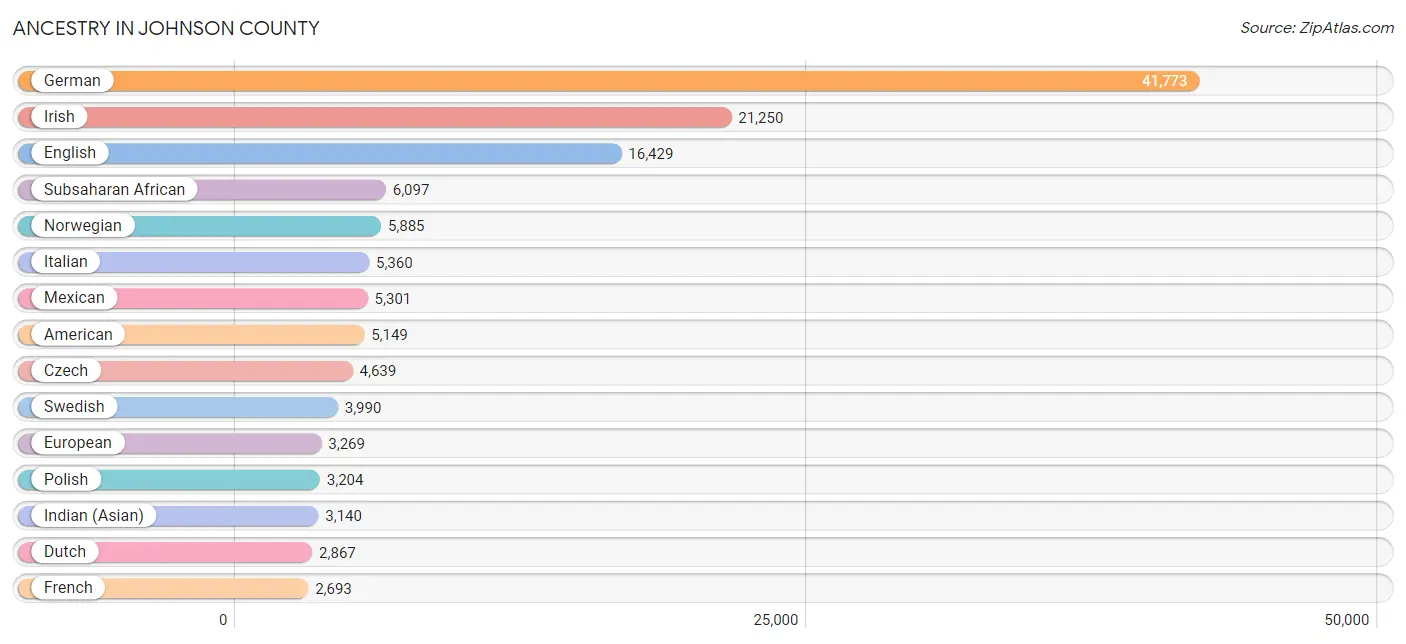
Ancestry in Johnson County
The most populous ancestries reported in Johnson County are German (41,773 | 27.2%), Irish (21,250 | 13.9%), English (16,429 | 10.7%), Subsaharan African (6,097 | 4.0%), and Norwegian (5,885 | 3.8%), together accounting for 59.6% of all Johnson County residents.
| Ancestry | # Population | % Population |
| African | 2,534 | 1.7% |
| Albanian | 172 | 0.1% |
| American | 5,149 | 3.4% |
| Apache | 16 | 0.0% |
| Arab | 1,411 | 0.9% |
| Argentinean | 34 | 0.0% |
| Armenian | 64 | 0.0% |
| Assyrian / Chaldean / Syriac | 14 | 0.0% |
| Australian | 28 | 0.0% |
| Austrian | 185 | 0.1% |
| Bahamian | 11 | 0.0% |
| Bangladeshi | 94 | 0.1% |
| Basque | 10 | 0.0% |
| Belgian | 509 | 0.3% |
| Bhutanese | 348 | 0.2% |
| Bolivian | 136 | 0.1% |
| Brazilian | 62 | 0.0% |
| British | 1,001 | 0.6% |
| British West Indian | 34 | 0.0% |
| Bulgarian | 4 | 0.0% |
| Burmese | 1,694 | 1.1% |
| Cambodian | 13 | 0.0% |
| Canadian | 180 | 0.1% |
| Celtic | 20 | 0.0% |
| Central American | 1,192 | 0.8% |
| Central American Indian | 127 | 0.1% |
| Cherokee | 272 | 0.2% |
| Chickasaw | 72 | 0.1% |
| Chilean | 51 | 0.0% |
| Chippewa | 69 | 0.0% |
| Colombian | 550 | 0.4% |
| Costa Rican | 20 | 0.0% |
| Croatian | 95 | 0.1% |
| Crow | 19 | 0.0% |
| Cuban | 234 | 0.2% |
| Czech | 4,639 | 3.0% |
| Czechoslovakian | 336 | 0.2% |
| Danish | 2,153 | 1.4% |
| Dominican | 30 | 0.0% |
| Dutch | 2,867 | 1.9% |
| Eastern European | 424 | 0.3% |
| Ecuadorian | 2 | 0.0% |
| Egyptian | 78 | 0.1% |
| English | 16,429 | 10.7% |
| Estonian | 3 | 0.0% |
| Ethiopian | 53 | 0.0% |
| European | 3,269 | 2.1% |
| Fijian | 20 | 0.0% |
| Filipino | 63 | 0.0% |
| Finnish | 223 | 0.2% |
| French | 2,693 | 1.8% |
| French American Indian | 12 | 0.0% |
| French Canadian | 645 | 0.4% |
| German | 41,773 | 27.2% |
| Ghanaian | 25 | 0.0% |
| Greek | 354 | 0.2% |
| Guamanian / Chamorro | 10 | 0.0% |
| Guatemalan | 221 | 0.1% |
| Guyanese | 26 | 0.0% |
| Haitian | 27 | 0.0% |
| Honduran | 559 | 0.4% |
| Hungarian | 393 | 0.3% |
| Icelander | 129 | 0.1% |
| Indian (Asian) | 3,140 | 2.1% |
| Indonesian | 13 | 0.0% |
| Iranian | 287 | 0.2% |
| Iraqi | 142 | 0.1% |
| Irish | 21,250 | 13.9% |
| Iroquois | 3 | 0.0% |
| Israeli | 32 | 0.0% |
| Italian | 5,360 | 3.5% |
| Jamaican | 96 | 0.1% |
| Japanese | 41 | 0.0% |
| Jordanian | 40 | 0.0% |
| Kenyan | 375 | 0.2% |
| Korean | 921 | 0.6% |
| Laotian | 8 | 0.0% |
| Latvian | 31 | 0.0% |
| Lebanese | 175 | 0.1% |
| Liberian | 17 | 0.0% |
| Lithuanian | 416 | 0.3% |
| Luxembourger | 168 | 0.1% |
| Malaysian | 317 | 0.2% |
| Maltese | 19 | 0.0% |
| Mexican | 5,301 | 3.5% |
| Mexican American Indian | 65 | 0.0% |
| Mongolian | 39 | 0.0% |
| Moroccan | 65 | 0.0% |
| Native Hawaiian | 168 | 0.1% |
| Navajo | 6 | 0.0% |
| Nicaraguan | 66 | 0.0% |
| Nigerian | 401 | 0.3% |
| Northern European | 703 | 0.5% |
| Norwegian | 5,885 | 3.8% |
| Okinawan | 45 | 0.0% |
| Osage | 19 | 0.0% |
| Pakistani | 108 | 0.1% |
| Palestinian | 305 | 0.2% |
| Panamanian | 16 | 0.0% |
| Pennsylvania German | 213 | 0.1% |
| Peruvian | 47 | 0.0% |
| Polish | 3,204 | 2.1% |
| Portuguese | 144 | 0.1% |
| Potawatomi | 34 | 0.0% |
| Pueblo | 12 | 0.0% |
| Puerto Rican | 691 | 0.4% |
| Romanian | 55 | 0.0% |
| Russian | 900 | 0.6% |
| Salvadoran | 310 | 0.2% |
| Samoan | 1 | 0.0% |
| Scandinavian | 947 | 0.6% |
| Scotch-Irish | 1,197 | 0.8% |
| Scottish | 2,640 | 1.7% |
| Serbian | 82 | 0.1% |
| Sioux | 149 | 0.1% |
| Slavic | 32 | 0.0% |
| Slovak | 200 | 0.1% |
| Slovene | 59 | 0.0% |
| Somali | 44 | 0.0% |
| South African | 15 | 0.0% |
| South American | 940 | 0.6% |
| Spaniard | 127 | 0.1% |
| Spanish | 260 | 0.2% |
| Spanish American | 29 | 0.0% |
| Sri Lankan | 1,523 | 1.0% |
| Subsaharan African | 6,097 | 4.0% |
| Sudanese | 1,769 | 1.1% |
| Swedish | 3,990 | 2.6% |
| Swiss | 1,031 | 0.7% |
| Syrian | 39 | 0.0% |
| Thai | 2,644 | 1.7% |
| Tongan | 11 | 0.0% |
| Trinidadian and Tobagonian | 29 | 0.0% |
| Turkish | 73 | 0.1% |
| Ukrainian | 281 | 0.2% |
| Uruguayan | 42 | 0.0% |
| Venezuelan | 78 | 0.1% |
| Vietnamese | 101 | 0.1% |
| Welsh | 1,073 | 0.7% |
| West Indian | 19 | 0.0% |
| Yaqui | 3 | 0.0% |
| Yugoslavian | 97 | 0.1% | View All 142 Rows |
Immigrants in Johnson County
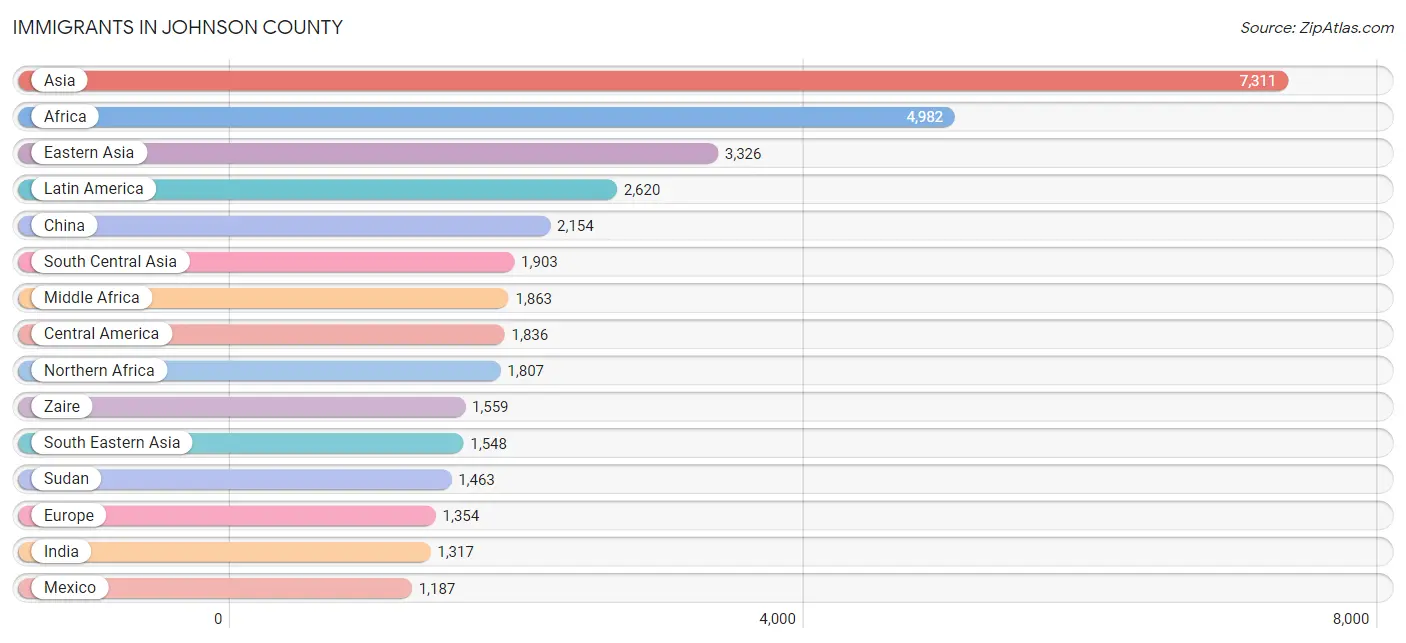
The most numerous immigrant groups reported in Johnson County came from Asia (7,311 | 4.8%), Africa (4,982 | 3.3%), Eastern Asia (3,326 | 2.2%), Latin America (2,620 | 1.7%), and China (2,154 | 1.4%), together accounting for 13.3% of all Johnson County residents.
| Immigration Origin | # Population | % Population |
| Africa | 4,982 | 3.3% |
| Argentina | 17 | 0.0% |
| Armenia | 22 | 0.0% |
| Asia | 7,311 | 4.8% |
| Australia | 24 | 0.0% |
| Austria | 14 | 0.0% |
| Bangladesh | 167 | 0.1% |
| Bosnia and Herzegovina | 65 | 0.0% |
| Brazil | 166 | 0.1% |
| Cambodia | 65 | 0.0% |
| Canada | 448 | 0.3% |
| Caribbean | 233 | 0.2% |
| Central America | 1,836 | 1.2% |
| Chile | 49 | 0.0% |
| China | 2,154 | 1.4% |
| Colombia | 212 | 0.1% |
| Congo | 304 | 0.2% |
| Cuba | 149 | 0.1% |
| Czechoslovakia | 68 | 0.0% |
| Denmark | 11 | 0.0% |
| Dominican Republic | 37 | 0.0% |
| Eastern Africa | 267 | 0.2% |
| Eastern Asia | 3,326 | 2.2% |
| Eastern Europe | 720 | 0.5% |
| Ecuador | 2 | 0.0% |
| Egypt | 89 | 0.1% |
| El Salvador | 247 | 0.2% |
| England | 75 | 0.1% |
| Ethiopia | 71 | 0.1% |
| Europe | 1,354 | 0.9% |
| France | 13 | 0.0% |
| Germany | 202 | 0.1% |
| Ghana | 11 | 0.0% |
| Greece | 14 | 0.0% |
| Guatemala | 79 | 0.1% |
| Guyana | 10 | 0.0% |
| Haiti | 17 | 0.0% |
| Honduras | 323 | 0.2% |
| Hong Kong | 29 | 0.0% |
| Hungary | 28 | 0.0% |
| India | 1,317 | 0.9% |
| Indonesia | 9 | 0.0% |
| Iran | 181 | 0.1% |
| Iraq | 112 | 0.1% |
| Ireland | 6 | 0.0% |
| Israel | 31 | 0.0% |
| Italy | 61 | 0.0% |
| Jamaica | 28 | 0.0% |
| Japan | 171 | 0.1% |
| Jordan | 131 | 0.1% |
| Kazakhstan | 25 | 0.0% |
| Kenya | 179 | 0.1% |
| Korea | 1,001 | 0.6% |
| Kuwait | 15 | 0.0% |
| Laos | 44 | 0.0% |
| Latin America | 2,620 | 1.7% |
| Lebanon | 21 | 0.0% |
| Liberia | 71 | 0.1% |
| Lithuania | 76 | 0.1% |
| Malaysia | 63 | 0.0% |
| Mexico | 1,187 | 0.8% |
| Middle Africa | 1,863 | 1.2% |
| Morocco | 47 | 0.0% |
| Nepal | 19 | 0.0% |
| Netherlands | 26 | 0.0% |
| Nigeria | 326 | 0.2% |
| North Macedonia | 80 | 0.1% |
| Northern Africa | 1,807 | 1.2% |
| Northern Europe | 218 | 0.1% |
| Oceania | 148 | 0.1% |
| Pakistan | 75 | 0.1% |
| Peru | 2 | 0.0% |
| Philippines | 234 | 0.2% |
| Poland | 97 | 0.1% |
| Russia | 208 | 0.1% |
| Saudi Arabia | 75 | 0.1% |
| Sierra Leone | 69 | 0.0% |
| Singapore | 80 | 0.1% |
| South Africa | 191 | 0.1% |
| South America | 551 | 0.4% |
| South Central Asia | 1,903 | 1.2% |
| South Eastern Asia | 1,548 | 1.0% |
| Southern Europe | 153 | 0.1% |
| Spain | 78 | 0.1% |
| Sri Lanka | 110 | 0.1% |
| Sudan | 1,463 | 0.9% |
| Switzerland | 8 | 0.0% |
| Taiwan | 88 | 0.1% |
| Thailand | 123 | 0.1% |
| Turkey | 55 | 0.0% |
| Uganda | 15 | 0.0% |
| Ukraine | 28 | 0.0% |
| Venezuela | 93 | 0.1% |
| Vietnam | 930 | 0.6% |
| Western Africa | 830 | 0.5% |
| Western Asia | 534 | 0.4% |
| Western Europe | 263 | 0.2% |
| Zaire | 1,559 | 1.0% | View All 98 Rows |
Sex and Age in Johnson County
Sex and Age in Johnson County
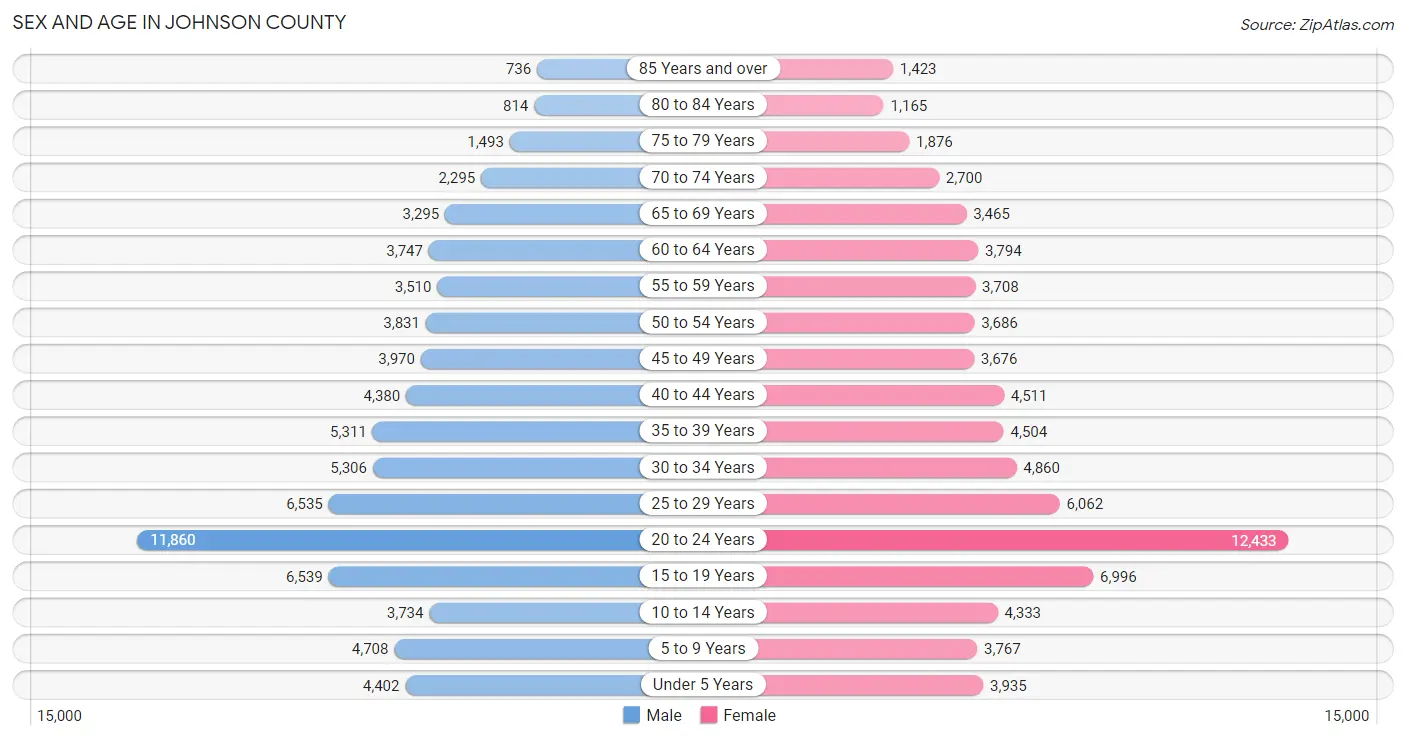
The most populous age groups in Johnson County are 20 to 24 Years (11,860 | 15.5%) for men and 20 to 24 Years (12,433 | 16.2%) for women.
| Age Bracket | Male | Female |
| Under 5 Years | 4,402 (5.8%) | 3,935 (5.1%) |
| 5 to 9 Years | 4,708 (6.2%) | 3,767 (4.9%) |
| 10 to 14 Years | 3,734 (4.9%) | 4,333 (5.6%) |
| 15 to 19 Years | 6,539 (8.6%) | 6,996 (9.1%) |
| 20 to 24 Years | 11,860 (15.5%) | 12,433 (16.2%) |
| 25 to 29 Years | 6,535 (8.6%) | 6,062 (7.9%) |
| 30 to 34 Years | 5,306 (6.9%) | 4,860 (6.3%) |
| 35 to 39 Years | 5,311 (7.0%) | 4,504 (5.9%) |
| 40 to 44 Years | 4,380 (5.7%) | 4,511 (5.9%) |
| 45 to 49 Years | 3,970 (5.2%) | 3,676 (4.8%) |
| 50 to 54 Years | 3,831 (5.0%) | 3,686 (4.8%) |
| 55 to 59 Years | 3,510 (4.6%) | 3,708 (4.8%) |
| 60 to 64 Years | 3,747 (4.9%) | 3,794 (4.9%) |
| 65 to 69 Years | 3,295 (4.3%) | 3,465 (4.5%) |
| 70 to 74 Years | 2,295 (3.0%) | 2,700 (3.5%) |
| 75 to 79 Years | 1,493 (1.9%) | 1,876 (2.4%) |
| 80 to 84 Years | 814 (1.1%) | 1,165 (1.5%) |
| 85 Years and over | 736 (1.0%) | 1,423 (1.8%) |
| Total | 76,466 (100.0%) | 76,894 (100.0%) |
Families and Households in Johnson County
Median Family Size in Johnson County
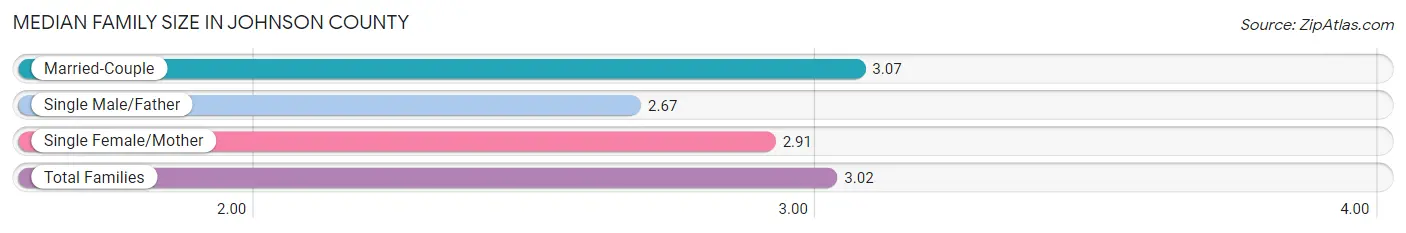
The median family size in Johnson County is 3.02 persons per family, with married-couple families (26,653 | 81.4%) accounting for the largest median family size of 3.07 persons per family. On the other hand, single male/father families (1,774 | 5.4%) represent the smallest median family size with 2.67 persons per family.
| Family Type | # Families | Family Size |
| Married-Couple | 26,653 (81.4%) | 3.07 |
| Single Male/Father | 1,774 (5.4%) | 2.67 |
| Single Female/Mother | 4,327 (13.2%) | 2.91 |
| Total Families | 32,754 (100.0%) | 3.02 |
Median Household Size in Johnson County
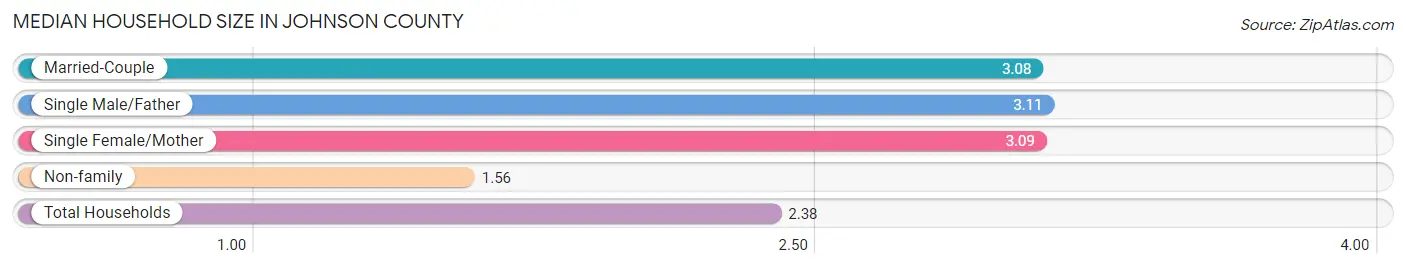
The median household size in Johnson County is 2.38 persons per household, with single male/father households (1,774 | 2.9%) accounting for the largest median household size of 3.11 persons per household. non-family households (28,660 | 46.7%) represent the smallest median household size with 1.56 persons per household.
| Household Type | # Households | Household Size |
| Married-Couple | 26,653 (43.4%) | 3.08 |
| Single Male/Father | 1,774 (2.9%) | 3.11 |
| Single Female/Mother | 4,327 (7.0%) | 3.09 |
| Non-family | 28,660 (46.7%) | 1.56 |
| Total Households | 61,414 (100.0%) | 2.38 |
Household Size by Marriage Status in Johnson County
Out of a total of 61,414 households in Johnson County, 32,754 (53.3%) are family households, while 28,660 (46.7%) are nonfamily households. The most numerous type of family households are 2-person households, comprising 15,934, and the most common type of nonfamily households are 1-person households, comprising 18,480.
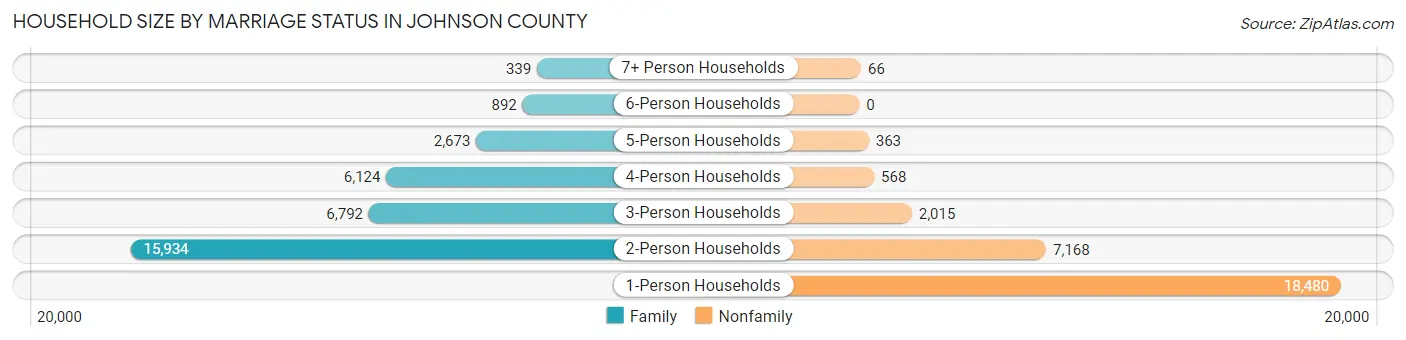
| Household Size | Family Households | Nonfamily Households |
| 1-Person Households | - | 18,480 (30.1%) |
| 2-Person Households | 15,934 (26.0%) | 7,168 (11.7%) |
| 3-Person Households | 6,792 (11.1%) | 2,015 (3.3%) |
| 4-Person Households | 6,124 (10.0%) | 568 (0.9%) |
| 5-Person Households | 2,673 (4.3%) | 363 (0.6%) |
| 6-Person Households | 892 (1.5%) | 0 (0.0%) |
| 7+ Person Households | 339 (0.5%) | 66 (0.1%) |
| Total | 32,754 (53.3%) | 28,660 (46.7%) |
Female Fertility in Johnson County
Fertility by Age in Johnson County
Average fertility rate in Johnson County is 44.0 births per 1,000 women. Women in the age bracket of 20 to 34 years have the highest fertility rate with 70.0 births per 1,000 women. Women in the age bracket of 20 to 34 years acount for 83.9% of all women with births.
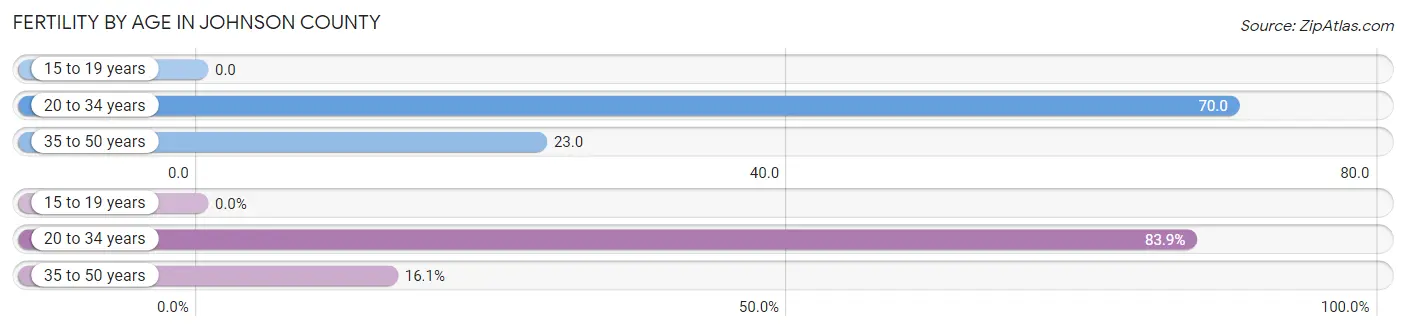
| Age Bracket | Women with Births | Births / 1,000 Women |
| 15 to 19 years | 0 (0.0%) | 0.0 |
| 20 to 34 years | 1,626 (83.9%) | 70.0 |
| 35 to 50 years | 312 (16.1%) | 23.0 |
| Total | 1,938 (100.0%) | 44.0 |
Fertility by Age by Marriage Status in Johnson County
85.4% of women with births (1,938) in Johnson County are married. The highest percentage of unmarried women with births falls into 35 to 50 years age bracket with 16.4% of them unmarried at the time of birth, while the lowest percentage of unmarried women with births belong to 20 to 34 years age bracket with 14.3% of them unmarried.
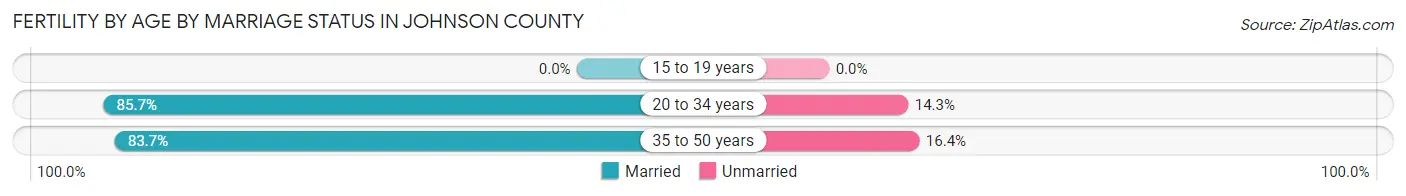
| Age Bracket | Married | Unmarried |
| 15 to 19 years | 0 (0.0%) | 0 (0.0%) |
| 20 to 34 years | 1,393 (85.7%) | 233 (14.3%) |
| 35 to 50 years | 261 (83.7%) | 51 (16.4%) |
| Total | 1,655 (85.4%) | 283 (14.6%) |
Fertility by Education in Johnson County
Average fertility rate in Johnson County is 44.0 births per 1,000 women. Women with the education attainment of less than high school have the highest fertility rate of 83.0 births per 1,000 women, while women with the education attainment of high school diploma have the lowest fertility at 18.0 births per 1,000 women. Women with the education attainment of bachelor's degree represent 44.0% of all women with births.
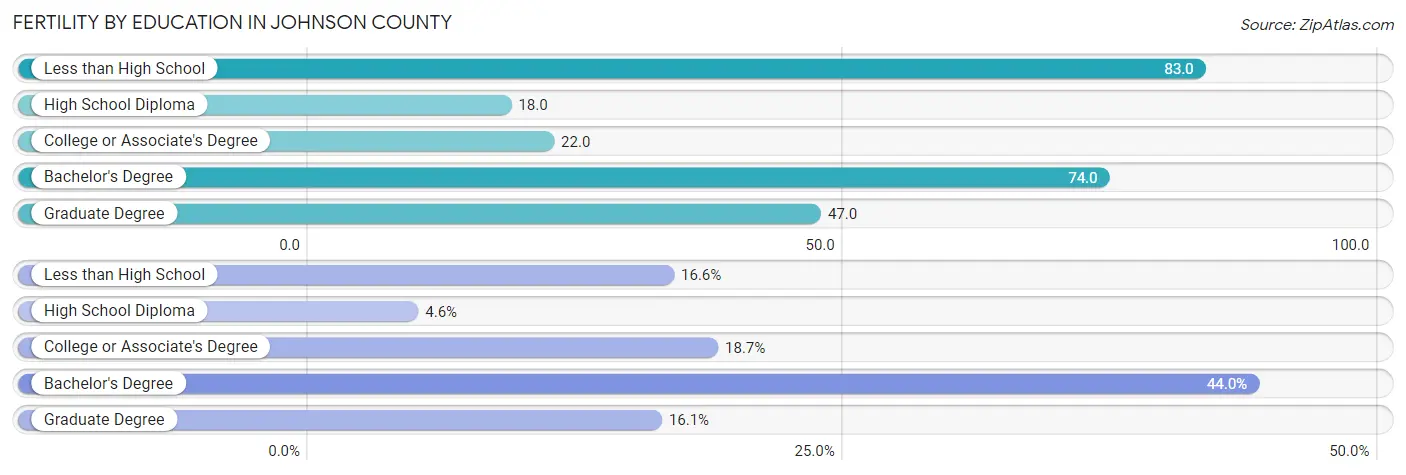
| Educational Attainment | Women with Births | Births / 1,000 Women |
| Less than High School | 322 (16.6%) | 83.0 |
| High School Diploma | 90 (4.6%) | 18.0 |
| College or Associate's Degree | 362 (18.7%) | 22.0 |
| Bachelor's Degree | 853 (44.0%) | 74.0 |
| Graduate Degree | 311 (16.1%) | 47.0 |
| Total | 1,938 (100.0%) | 44.0 |
Fertility by Education by Marriage Status in Johnson County
14.6% of women with births in Johnson County are unmarried. Women with the educational attainment of graduate degree are most likely to be married with 92.3% of them married at childbirth, while women with the educational attainment of less than high school are least likely to be married with 24.8% of them unmarried at childbirth.
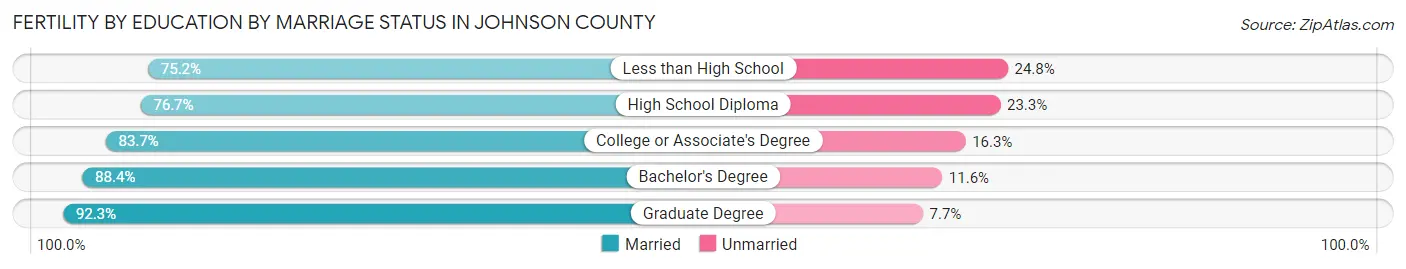
| Educational Attainment | Married | Unmarried |
| Less than High School | 242 (75.2%) | 80 (24.8%) |
| High School Diploma | 69 (76.7%) | 21 (23.3%) |
| College or Associate's Degree | 303 (83.7%) | 59 (16.3%) |
| Bachelor's Degree | 754 (88.4%) | 99 (11.6%) |
| Graduate Degree | 287 (92.3%) | 24 (7.7%) |
| Total | 1,655 (85.4%) | 283 (14.6%) |
Employment Characteristics in Johnson County
Employment by Class of Employer in Johnson County
Among the 82,604 employed individuals in Johnson County, private company employees (45,154 | 54.7%), state government employees (15,845 | 19.2%), and not-for-profit organizations (8,337 | 10.1%) make up the most common classes of employment.
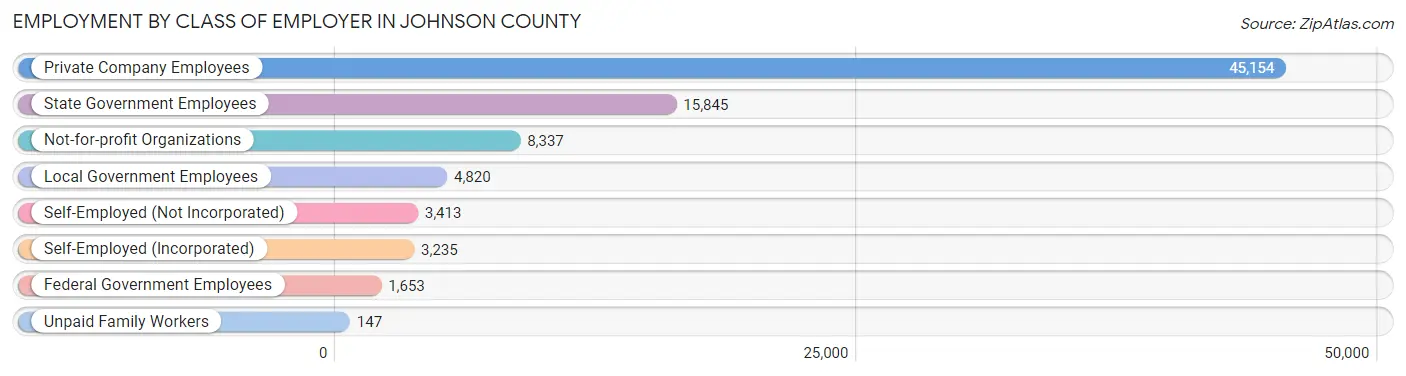
| Employer Class | # Employees | % Employees |
| Private Company Employees | 45,154 | 54.7% |
| Self-Employed (Incorporated) | 3,235 | 3.9% |
| Self-Employed (Not Incorporated) | 3,413 | 4.1% |
| Not-for-profit Organizations | 8,337 | 10.1% |
| Local Government Employees | 4,820 | 5.8% |
| State Government Employees | 15,845 | 19.2% |
| Federal Government Employees | 1,653 | 2.0% |
| Unpaid Family Workers | 147 | 0.2% |
| Total | 82,604 | 100.0% |
Employment Status by Age in Johnson County
According to the labor force statistics for Johnson County, out of the total population over 16 years of age (126,731), 69.7% or 88,332 individuals are in the labor force, with 3.8% or 3,357 of them unemployed. The age group with the highest labor force participation rate is 35 to 44 years, with 88.3% or 16,517 individuals in the labor force. Within the labor force, the 16 to 19 years age range has the highest percentage of unemployed individuals, with 9.7% or 559 of them being unemployed.
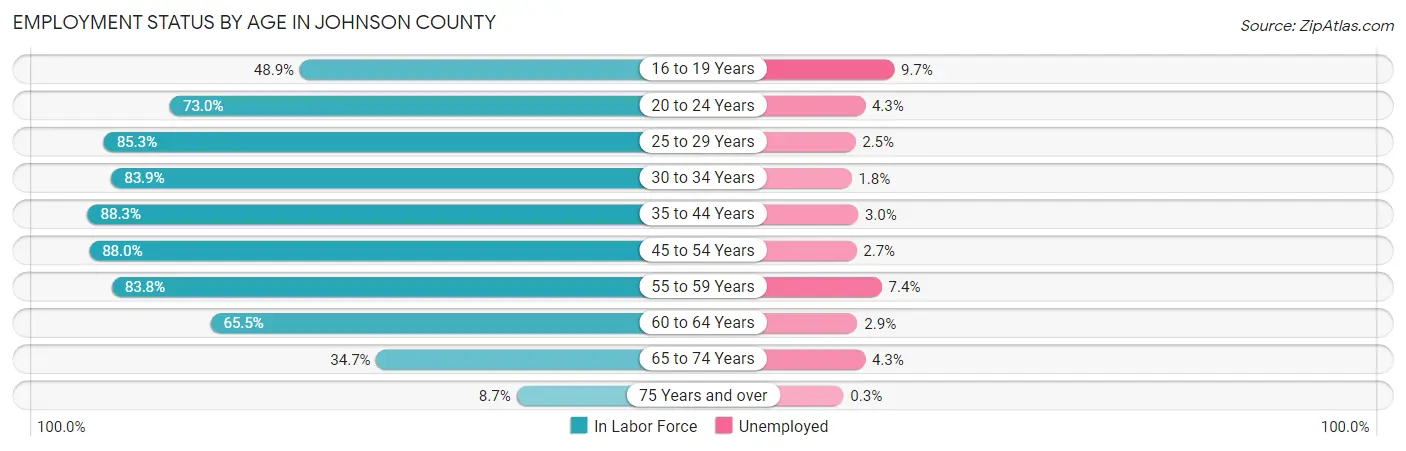
| Age Bracket | In Labor Force | Unemployed |
| 16 to 19 Years | 5,763 (48.9%) | 559 (9.7%) |
| 20 to 24 Years | 17,734 (73.0%) | 763 (4.3%) |
| 25 to 29 Years | 10,745 (85.3%) | 269 (2.5%) |
| 30 to 34 Years | 8,529 (83.9%) | 154 (1.8%) |
| 35 to 44 Years | 16,517 (88.3%) | 496 (3.0%) |
| 45 to 54 Years | 13,343 (88.0%) | 360 (2.7%) |
| 55 to 59 Years | 6,049 (83.8%) | 448 (7.4%) |
| 60 to 64 Years | 4,939 (65.5%) | 143 (2.9%) |
| 65 to 74 Years | 4,079 (34.7%) | 175 (4.3%) |
| 75 Years and over | 653 (8.7%) | 2 (0.3%) |
| Total | 88,332 (69.7%) | 3,357 (3.8%) |
Employment Status by Educational Attainment in Johnson County
According to labor force statistics for Johnson County, 84.2% of individuals (60,111) out of the total population between 25 and 64 years of age (71,391) are in the labor force, with 3.1% or 1,863 of them being unemployed. The group with the highest labor force participation rate are those with the educational attainment of bachelor's degree or higher, with 88.0% or 35,388 individuals in the labor force. Within the labor force, individuals with less than high school education have the highest percentage of unemployment, with 8.8% or 163 of them being unemployed.
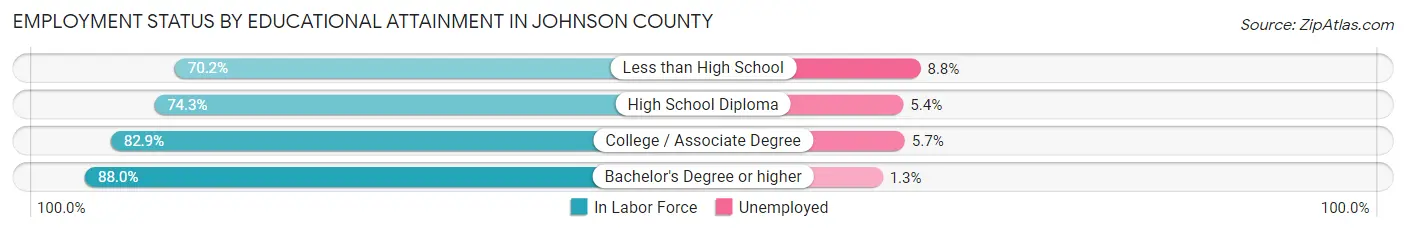
| Educational Attainment | In Labor Force | Unemployed |
| Less than High School | 1,853 (70.2%) | 232 (8.8%) |
| High School Diploma | 6,935 (74.3%) | 504 (5.4%) |
| College / Associate Degree | 15,919 (82.9%) | 1,095 (5.7%) |
| Bachelor's Degree or higher | 35,388 (88.0%) | 523 (1.3%) |
| Total | 60,111 (84.2%) | 2,213 (3.1%) |
Employment Occupations by Sex in Johnson County
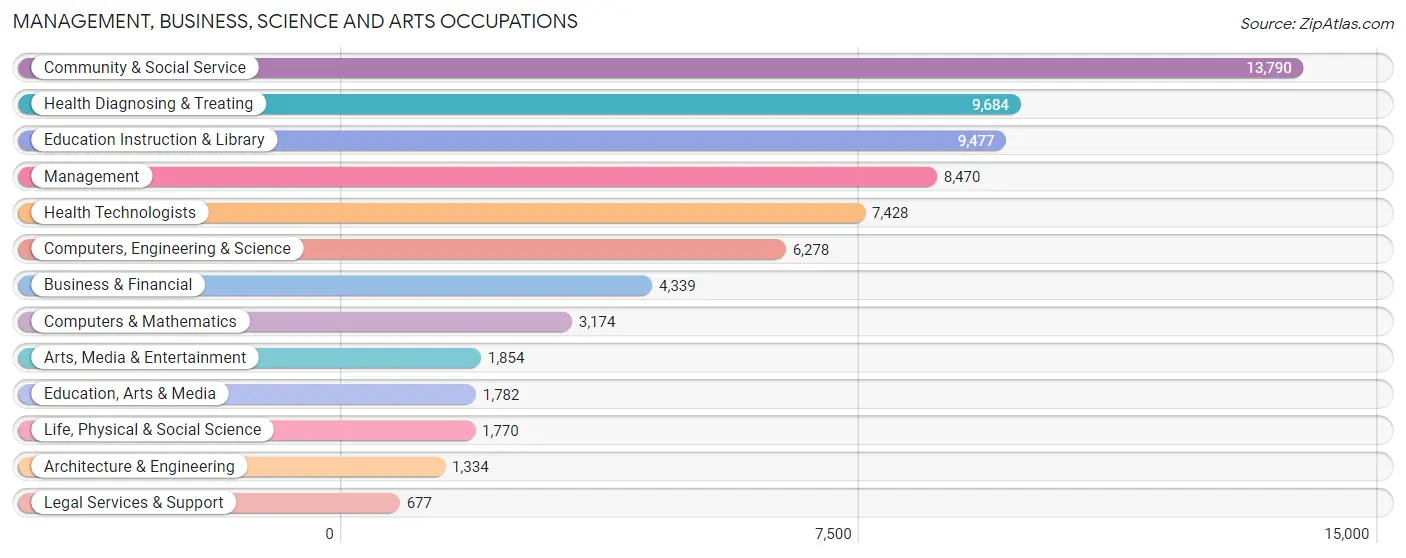
Management, Business, Science and Arts Occupations
The most common Management, Business, Science and Arts occupations in Johnson County are Community & Social Service (13,790 | 16.3%), Health Diagnosing & Treating (9,684 | 11.4%), Education Instruction & Library (9,477 | 11.2%), Management (8,470 | 10.0%), and Health Technologists (7,428 | 8.8%).
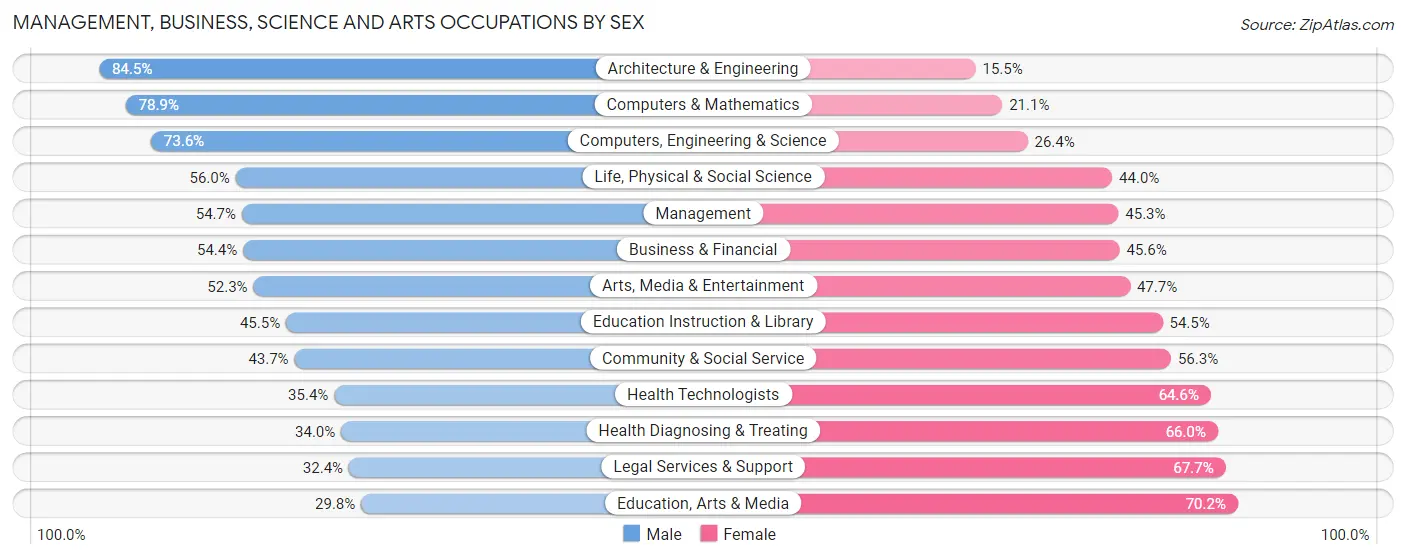
Management, Business, Science and Arts Occupations by Sex
Within the Management, Business, Science and Arts occupations in Johnson County, the most male-oriented occupations are Architecture & Engineering (84.5%), Computers & Mathematics (78.9%), and Computers, Engineering & Science (73.6%), while the most female-oriented occupations are Education, Arts & Media (70.2%), Legal Services & Support (67.6%), and Health Diagnosing & Treating (66.0%).
| Occupation | Male | Female |
| Management | 4,632 (54.7%) | 3,838 (45.3%) |
| Business & Financial | 2,362 (54.4%) | 1,977 (45.6%) |
| Computers, Engineering & Science | 4,623 (73.6%) | 1,655 (26.4%) |
| Computers & Mathematics | 2,505 (78.9%) | 669 (21.1%) |
| Architecture & Engineering | 1,127 (84.5%) | 207 (15.5%) |
| Life, Physical & Social Science | 991 (56.0%) | 779 (44.0%) |
| Community & Social Service | 6,028 (43.7%) | 7,762 (56.3%) |
| Education, Arts & Media | 531 (29.8%) | 1,251 (70.2%) |
| Legal Services & Support | 219 (32.4%) | 458 (67.6%) |
| Education Instruction & Library | 4,309 (45.5%) | 5,168 (54.5%) |
| Arts, Media & Entertainment | 969 (52.3%) | 885 (47.7%) |
| Health Diagnosing & Treating | 3,290 (34.0%) | 6,394 (66.0%) |
| Health Technologists | 2,632 (35.4%) | 4,796 (64.6%) |
| Total (Category) | 20,935 (49.2%) | 21,626 (50.8%) |
| Total (Overall) | 43,607 (51.4%) | 41,156 (48.5%) |
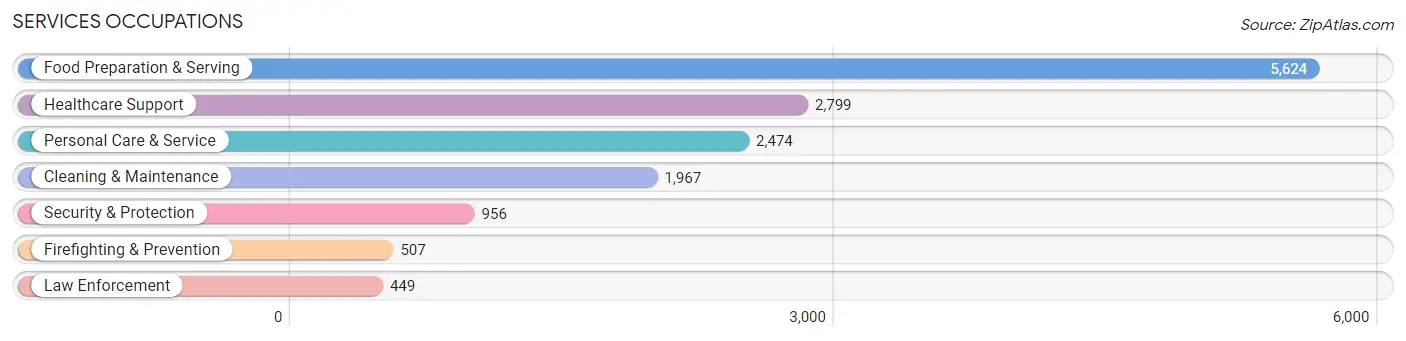
Services Occupations
The most common Services occupations in Johnson County are Food Preparation & Serving (5,624 | 6.6%), Healthcare Support (2,799 | 3.3%), Personal Care & Service (2,474 | 2.9%), Cleaning & Maintenance (1,967 | 2.3%), and Security & Protection (956 | 1.1%).
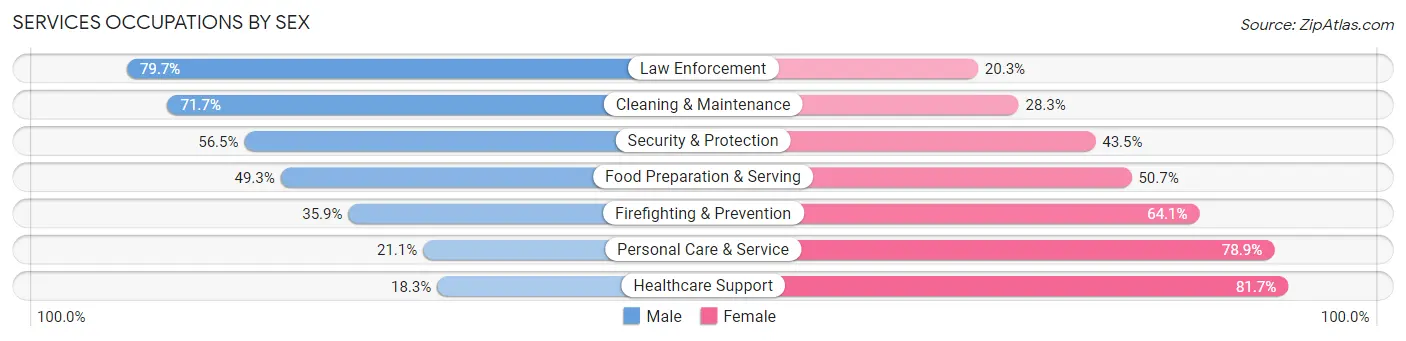
Services Occupations by Sex
Within the Services occupations in Johnson County, the most male-oriented occupations are Law Enforcement (79.7%), Cleaning & Maintenance (71.7%), and Security & Protection (56.5%), while the most female-oriented occupations are Healthcare Support (81.7%), Personal Care & Service (78.9%), and Firefighting & Prevention (64.1%).
| Occupation | Male | Female |
| Healthcare Support | 513 (18.3%) | 2,286 (81.7%) |
| Security & Protection | 540 (56.5%) | 416 (43.5%) |
| Firefighting & Prevention | 182 (35.9%) | 325 (64.1%) |
| Law Enforcement | 358 (79.7%) | 91 (20.3%) |
| Food Preparation & Serving | 2,774 (49.3%) | 2,850 (50.7%) |
| Cleaning & Maintenance | 1,410 (71.7%) | 557 (28.3%) |
| Personal Care & Service | 522 (21.1%) | 1,952 (78.9%) |
| Total (Category) | 5,759 (41.7%) | 8,061 (58.3%) |
| Total (Overall) | 43,607 (51.4%) | 41,156 (48.5%) |
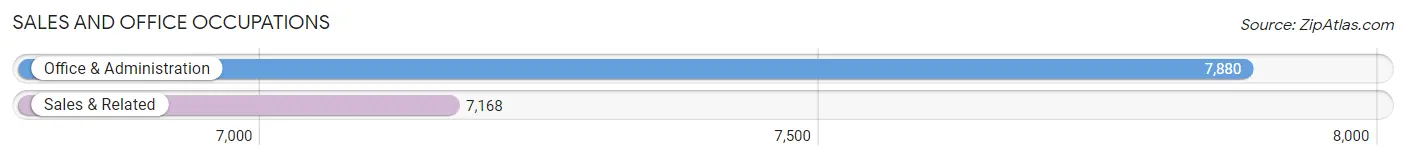
Sales and Office Occupations
The most common Sales and Office occupations in Johnson County are Office & Administration (7,880 | 9.3%), and Sales & Related (7,168 | 8.5%).
Sales and Office Occupations by Sex
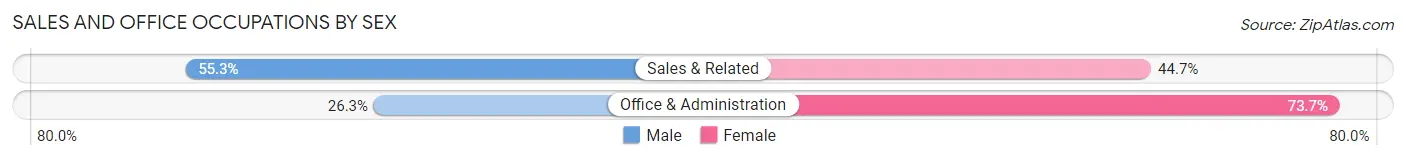
| Occupation | Male | Female |
| Sales & Related | 3,963 (55.3%) | 3,205 (44.7%) |
| Office & Administration | 2,070 (26.3%) | 5,810 (73.7%) |
| Total (Category) | 6,033 (40.1%) | 9,015 (59.9%) |
| Total (Overall) | 43,607 (51.4%) | 41,156 (48.5%) |
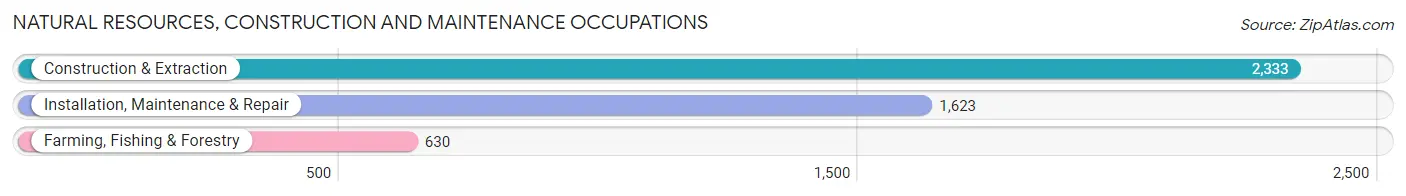
Natural Resources, Construction and Maintenance Occupations
The most common Natural Resources, Construction and Maintenance occupations in Johnson County are Construction & Extraction (2,333 | 2.8%), Installation, Maintenance & Repair (1,623 | 1.9%), and Farming, Fishing & Forestry (630 | 0.7%).
Natural Resources, Construction and Maintenance Occupations by Sex
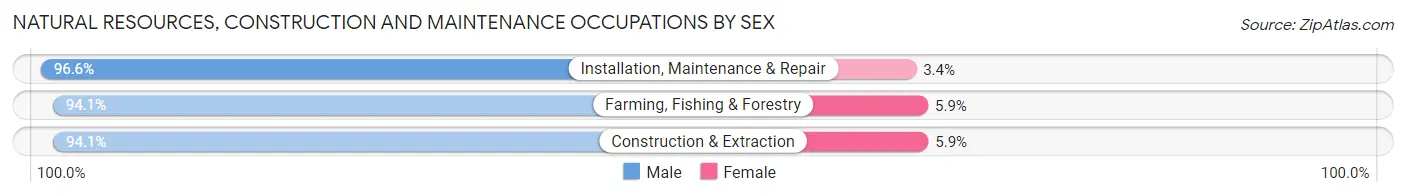
| Occupation | Male | Female |
| Farming, Fishing & Forestry | 593 (94.1%) | 37 (5.9%) |
| Construction & Extraction | 2,195 (94.1%) | 138 (5.9%) |
| Installation, Maintenance & Repair | 1,568 (96.6%) | 55 (3.4%) |
| Total (Category) | 4,356 (95.0%) | 230 (5.0%) |
| Total (Overall) | 43,607 (51.4%) | 41,156 (48.5%) |
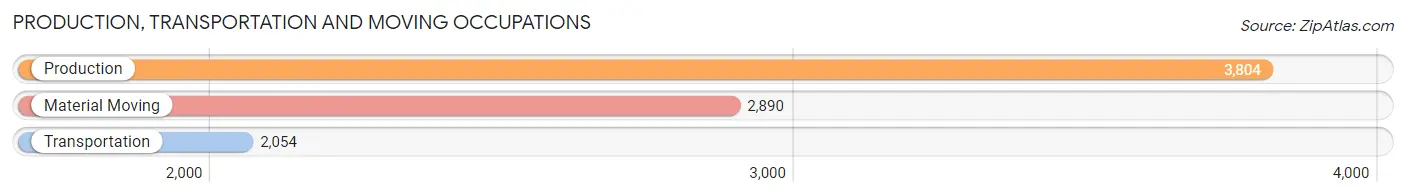
Production, Transportation and Moving Occupations
The most common Production, Transportation and Moving occupations in Johnson County are Production (3,804 | 4.5%), Material Moving (2,890 | 3.4%), and Transportation (2,054 | 2.4%).
Production, Transportation and Moving Occupations by Sex
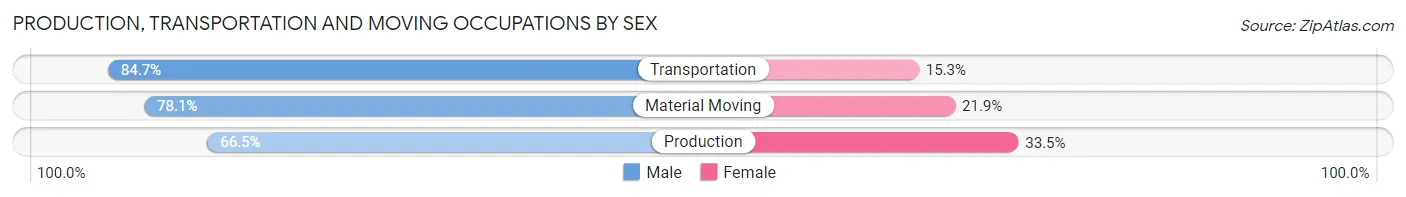
| Occupation | Male | Female |
| Production | 2,528 (66.5%) | 1,276 (33.5%) |
| Transportation | 1,740 (84.7%) | 314 (15.3%) |
| Material Moving | 2,256 (78.1%) | 634 (21.9%) |
| Total (Category) | 6,524 (74.6%) | 2,224 (25.4%) |
| Total (Overall) | 43,607 (51.4%) | 41,156 (48.5%) |
Employment Industries by Sex in Johnson County
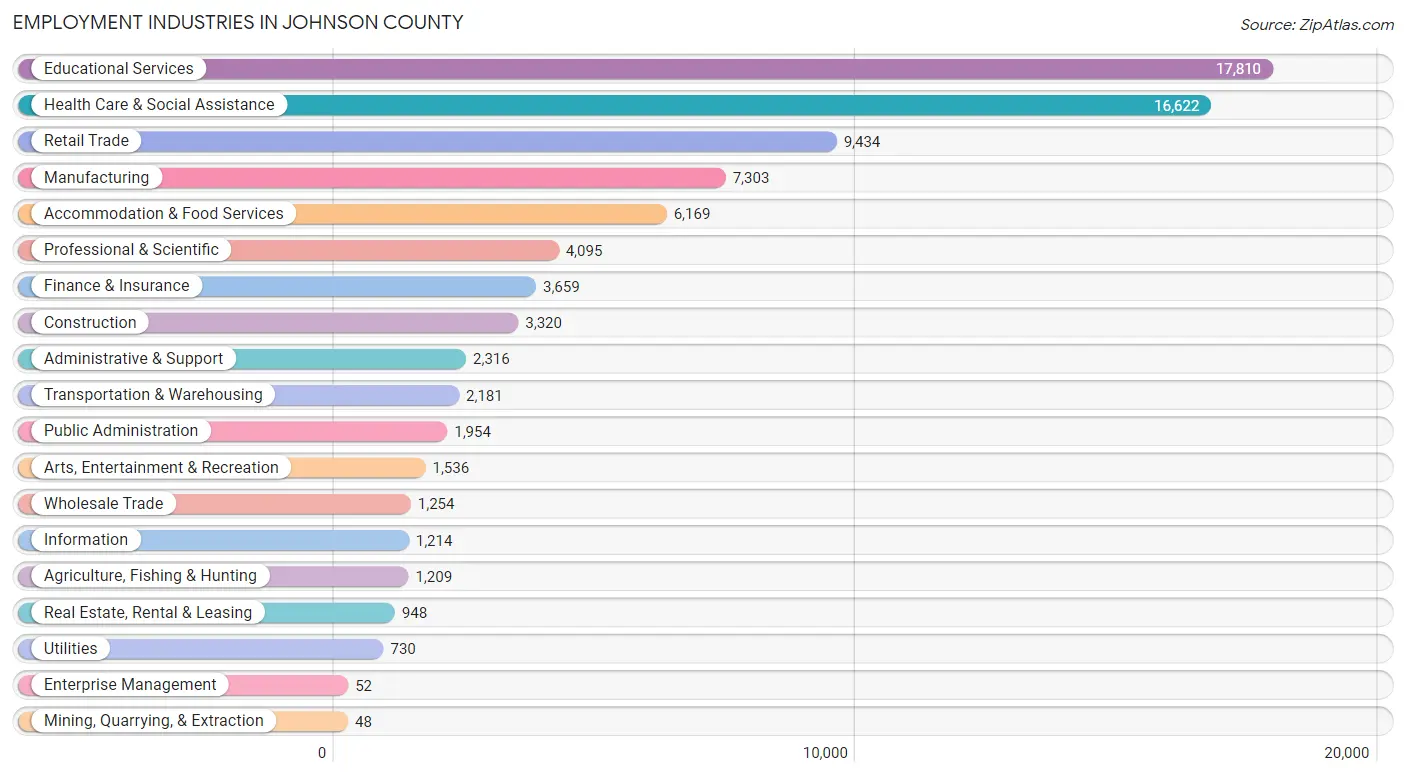
Employment Industries in Johnson County
The major employment industries in Johnson County include Educational Services (17,810 | 21.0%), Health Care & Social Assistance (16,622 | 19.6%), Retail Trade (9,434 | 11.1%), Manufacturing (7,303 | 8.6%), and Accommodation & Food Services (6,169 | 7.3%).
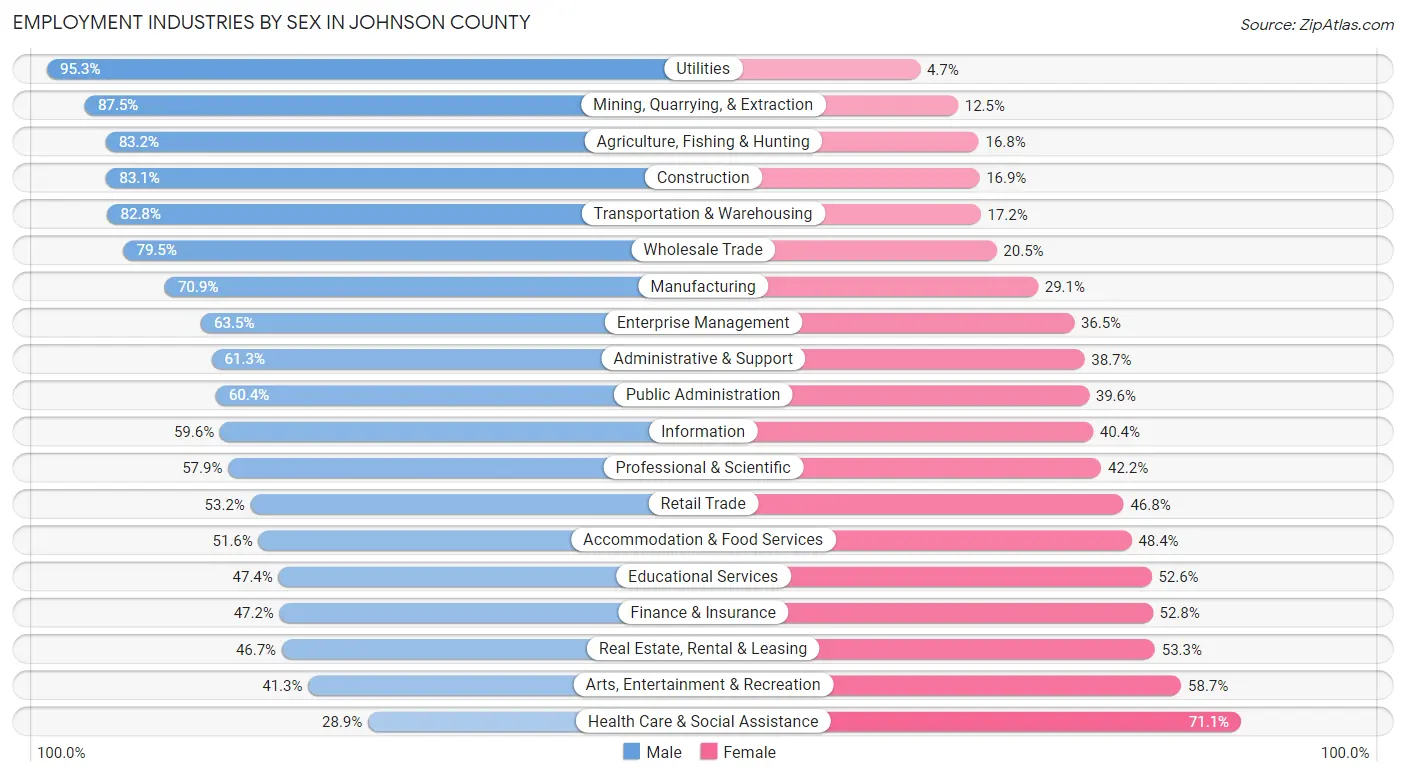
Employment Industries by Sex in Johnson County
The Johnson County industries that see more men than women are Utilities (95.3%), Mining, Quarrying, & Extraction (87.5%), and Agriculture, Fishing & Hunting (83.2%), whereas the industries that tend to have a higher number of women are Health Care & Social Assistance (71.1%), Arts, Entertainment & Recreation (58.7%), and Real Estate, Rental & Leasing (53.3%).
| Industry | Male | Female |
| Agriculture, Fishing & Hunting | 1,006 (83.2%) | 203 (16.8%) |
| Mining, Quarrying, & Extraction | 42 (87.5%) | 6 (12.5%) |
| Construction | 2,758 (83.1%) | 562 (16.9%) |
| Manufacturing | 5,181 (70.9%) | 2,122 (29.1%) |
| Wholesale Trade | 997 (79.5%) | 257 (20.5%) |
| Retail Trade | 5,020 (53.2%) | 4,414 (46.8%) |
| Transportation & Warehousing | 1,806 (82.8%) | 375 (17.2%) |
| Utilities | 696 (95.3%) | 34 (4.7%) |
| Information | 723 (59.6%) | 491 (40.4%) |
| Finance & Insurance | 1,727 (47.2%) | 1,932 (52.8%) |
| Real Estate, Rental & Leasing | 443 (46.7%) | 505 (53.3%) |
| Professional & Scientific | 2,369 (57.9%) | 1,726 (42.1%) |
| Enterprise Management | 33 (63.5%) | 19 (36.5%) |
| Administrative & Support | 1,420 (61.3%) | 896 (38.7%) |
| Educational Services | 8,445 (47.4%) | 9,365 (52.6%) |
| Health Care & Social Assistance | 4,803 (28.9%) | 11,819 (71.1%) |
| Arts, Entertainment & Recreation | 634 (41.3%) | 902 (58.7%) |
| Accommodation & Food Services | 3,181 (51.6%) | 2,988 (48.4%) |
| Public Administration | 1,180 (60.4%) | 774 (39.6%) |
| Total | 43,607 (51.4%) | 41,156 (48.5%) |
Education in Johnson County
School Enrollment in Johnson County
The most common levels of schooling among the 54,123 students in Johnson County are college / undergraduate (23,946 | 44.2%), graduate / professional (6,802 | 12.6%), and middle school (6,493 | 12.0%).
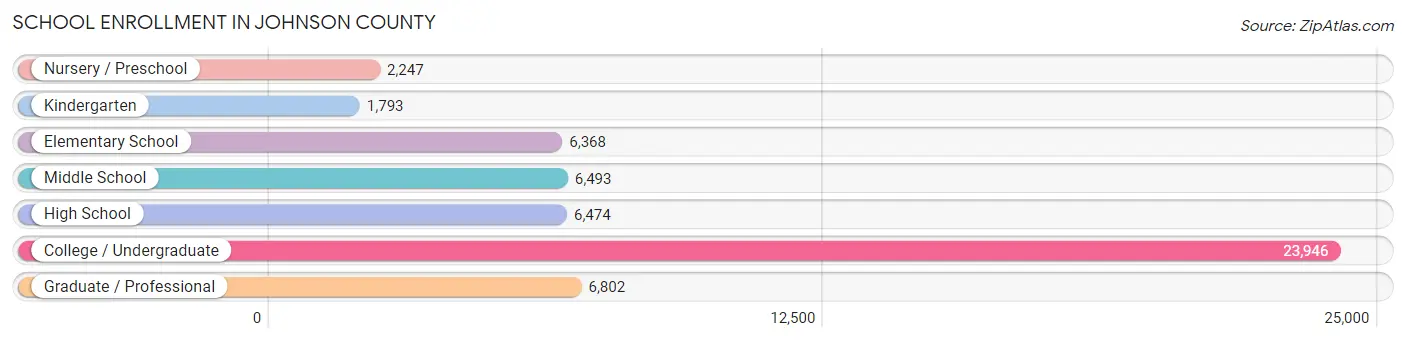
| School Level | # Students | % Students |
| Nursery / Preschool | 2,247 | 4.2% |
| Kindergarten | 1,793 | 3.3% |
| Elementary School | 6,368 | 11.8% |
| Middle School | 6,493 | 12.0% |
| High School | 6,474 | 12.0% |
| College / Undergraduate | 23,946 | 44.2% |
| Graduate / Professional | 6,802 | 12.6% |
| Total | 54,123 | 100.0% |
School Enrollment by Age by Funding Source in Johnson County
Out of a total of 54,123 students who are enrolled in schools in Johnson County, 5,088 (9.4%) attend a private institution, while the remaining 49,035 (90.6%) are enrolled in public schools. The age group of 3 to 4 year olds has the highest likelihood of being enrolled in private schools, with 930 (64.8% in the age bracket) enrolled. Conversely, the age group of 18 to 19 year olds has the lowest likelihood of being enrolled in a private school, with 7,695 (96.2% in the age bracket) attending a public institution.
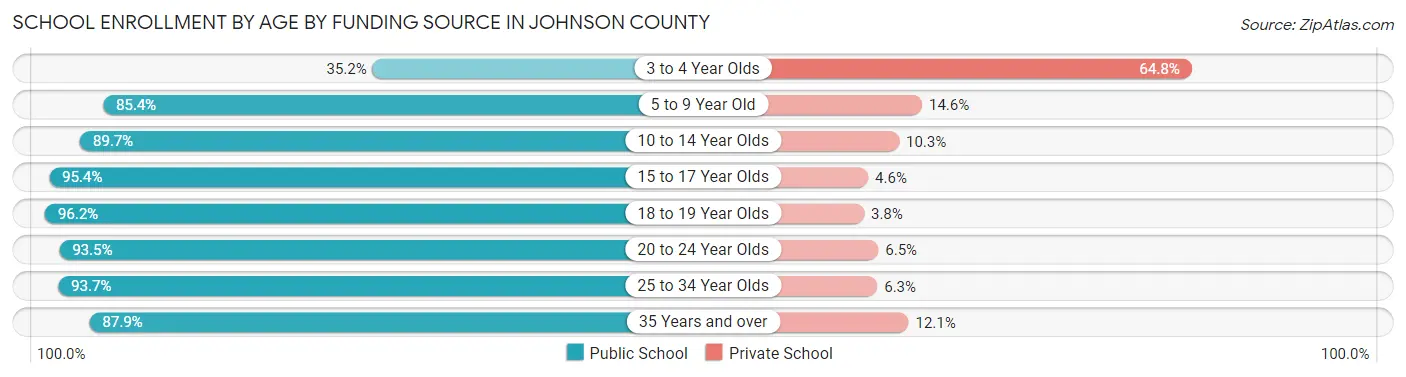
| Age Bracket | Public School | Private School |
| 3 to 4 Year Olds | 505 (35.2%) | 930 (64.8%) |
| 5 to 9 Year Old | 6,826 (85.4%) | 1,167 (14.6%) |
| 10 to 14 Year Olds | 7,134 (89.7%) | 820 (10.3%) |
| 15 to 17 Year Olds | 4,500 (95.4%) | 215 (4.6%) |
| 18 to 19 Year Olds | 7,695 (96.2%) | 303 (3.8%) |
| 20 to 24 Year Olds | 15,952 (93.5%) | 1,102 (6.5%) |
| 25 to 34 Year Olds | 4,713 (93.7%) | 315 (6.3%) |
| 35 Years and over | 1,711 (87.9%) | 235 (12.1%) |
| Total | 49,035 (90.6%) | 5,088 (9.4%) |
Educational Attainment by Field of Study in Johnson County
Business (6,576 | 11.9%), bio, nature & agricultural (6,155 | 11.1%), education (6,010 | 10.9%), science & technology (5,908 | 10.7%), and social sciences (4,175 | 7.6%) are the most common fields of study among 55,230 individuals in Johnson County who have obtained a bachelor's degree or higher.
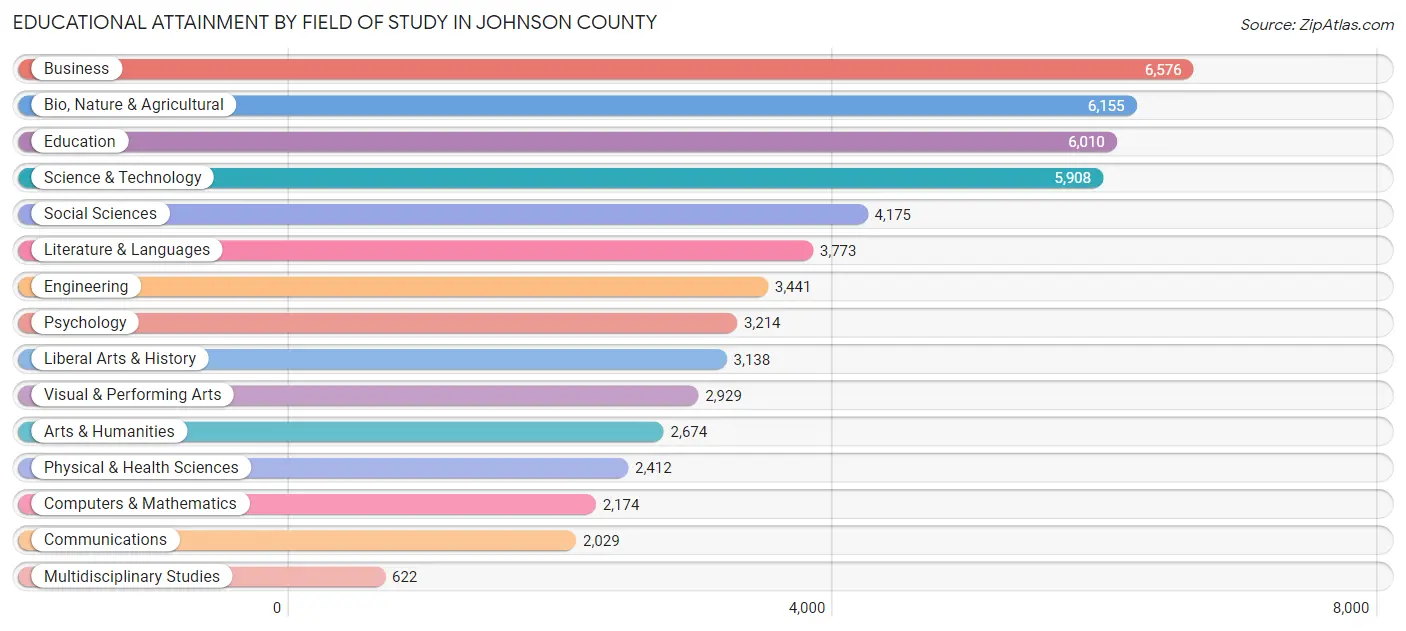
| Field of Study | # Graduates | % Graduates |
| Computers & Mathematics | 2,174 | 3.9% |
| Bio, Nature & Agricultural | 6,155 | 11.1% |
| Physical & Health Sciences | 2,412 | 4.4% |
| Psychology | 3,214 | 5.8% |
| Social Sciences | 4,175 | 7.6% |
| Engineering | 3,441 | 6.2% |
| Multidisciplinary Studies | 622 | 1.1% |
| Science & Technology | 5,908 | 10.7% |
| Business | 6,576 | 11.9% |
| Education | 6,010 | 10.9% |
| Literature & Languages | 3,773 | 6.8% |
| Liberal Arts & History | 3,138 | 5.7% |
| Visual & Performing Arts | 2,929 | 5.3% |
| Communications | 2,029 | 3.7% |
| Arts & Humanities | 2,674 | 4.8% |
| Total | 55,230 | 100.0% |
Transportation & Commute in Johnson County
Vehicle Availability by Sex in Johnson County
The most prevalent vehicle ownership categories in Johnson County are males with 2 vehicles (18,345, accounting for 43.8%) and females with 2 vehicles (17,451, making up 47.3%).
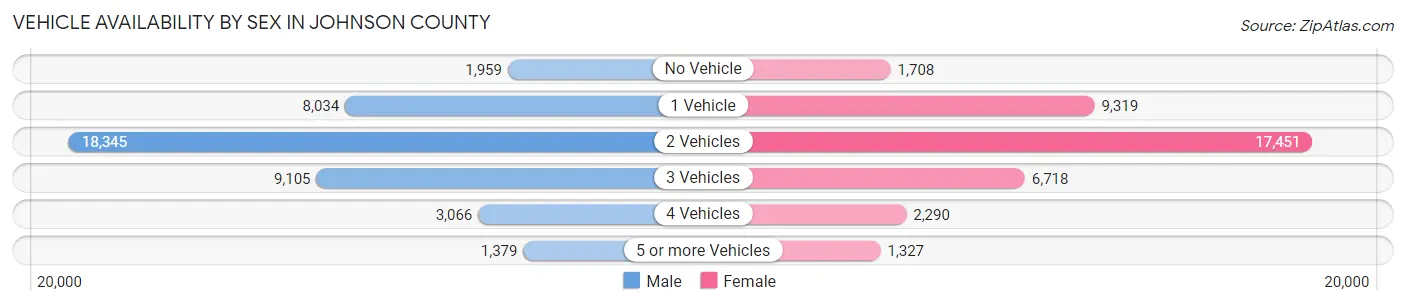
| Vehicles Available | Male | Female |
| No Vehicle | 1,959 (4.7%) | 1,708 (4.4%) |
| 1 Vehicle | 8,034 (19.2%) | 9,319 (24.0%) |
| 2 Vehicles | 18,345 (43.8%) | 17,451 (45.0%) |
| 3 Vehicles | 9,105 (21.7%) | 6,718 (17.3%) |
| 4 Vehicles | 3,066 (7.3%) | 2,290 (5.9%) |
| 5 or more Vehicles | 1,379 (3.3%) | 1,327 (3.4%) |
| Total | 41,888 (100.0%) | 38,813 (100.0%) |
Commute Time in Johnson County
The most frequently occuring commute durations in Johnson County are 10 to 14 minutes (16,114 commuters, 21.9%), 15 to 19 minutes (15,096 commuters, 20.5%), and 20 to 24 minutes (12,040 commuters, 16.4%).
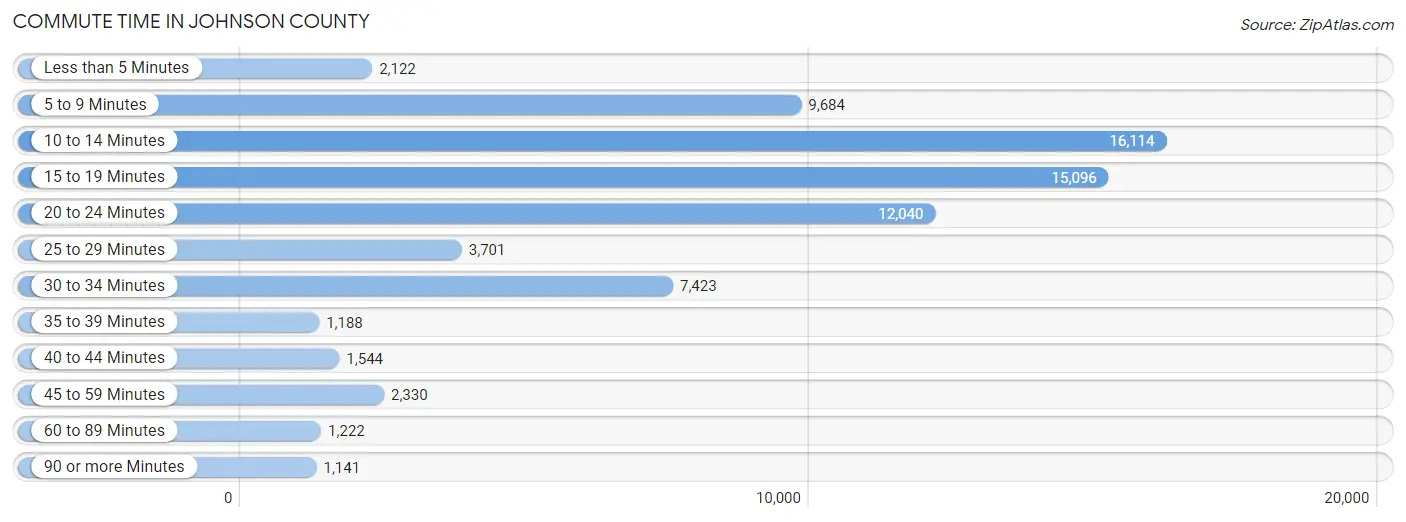
| Commute Time | # Commuters | % Commuters |
| Less than 5 Minutes | 2,122 | 2.9% |
| 5 to 9 Minutes | 9,684 | 13.2% |
| 10 to 14 Minutes | 16,114 | 21.9% |
| 15 to 19 Minutes | 15,096 | 20.5% |
| 20 to 24 Minutes | 12,040 | 16.4% |
| 25 to 29 Minutes | 3,701 | 5.0% |
| 30 to 34 Minutes | 7,423 | 10.1% |
| 35 to 39 Minutes | 1,188 | 1.6% |
| 40 to 44 Minutes | 1,544 | 2.1% |
| 45 to 59 Minutes | 2,330 | 3.2% |
| 60 to 89 Minutes | 1,222 | 1.7% |
| 90 or more Minutes | 1,141 | 1.5% |
Commute Time by Sex in Johnson County
The most common commute times in Johnson County are 10 to 14 minutes (8,559 commuters, 22.4%) for males and 15 to 19 minutes (7,942 commuters, 22.4%) for females.
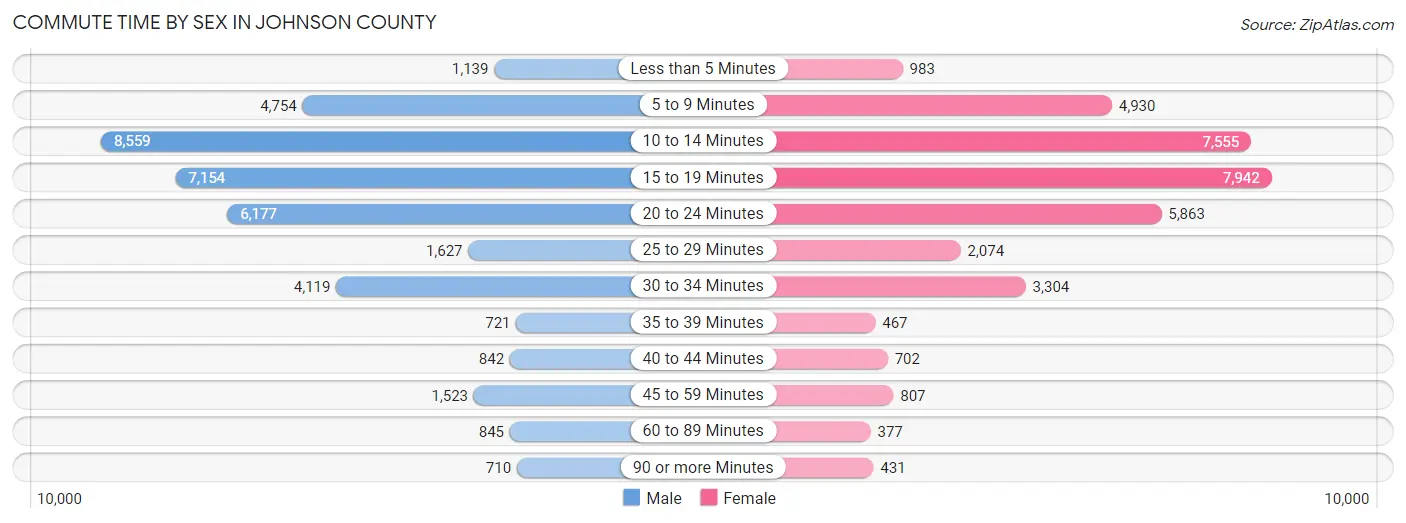
| Commute Time | Male | Female |
| Less than 5 Minutes | 1,139 (3.0%) | 983 (2.8%) |
| 5 to 9 Minutes | 4,754 (12.4%) | 4,930 (13.9%) |
| 10 to 14 Minutes | 8,559 (22.4%) | 7,555 (21.3%) |
| 15 to 19 Minutes | 7,154 (18.7%) | 7,942 (22.4%) |
| 20 to 24 Minutes | 6,177 (16.2%) | 5,863 (16.6%) |
| 25 to 29 Minutes | 1,627 (4.3%) | 2,074 (5.9%) |
| 30 to 34 Minutes | 4,119 (10.8%) | 3,304 (9.3%) |
| 35 to 39 Minutes | 721 (1.9%) | 467 (1.3%) |
| 40 to 44 Minutes | 842 (2.2%) | 702 (2.0%) |
| 45 to 59 Minutes | 1,523 (4.0%) | 807 (2.3%) |
| 60 to 89 Minutes | 845 (2.2%) | 377 (1.1%) |
| 90 or more Minutes | 710 (1.9%) | 431 (1.2%) |
Time of Departure to Work by Sex in Johnson County
The most frequent times of departure to work in Johnson County are 7:30 AM to 7:59 AM (5,280, 13.8%) for males and 7:30 AM to 7:59 AM (6,066, 17.1%) for females.
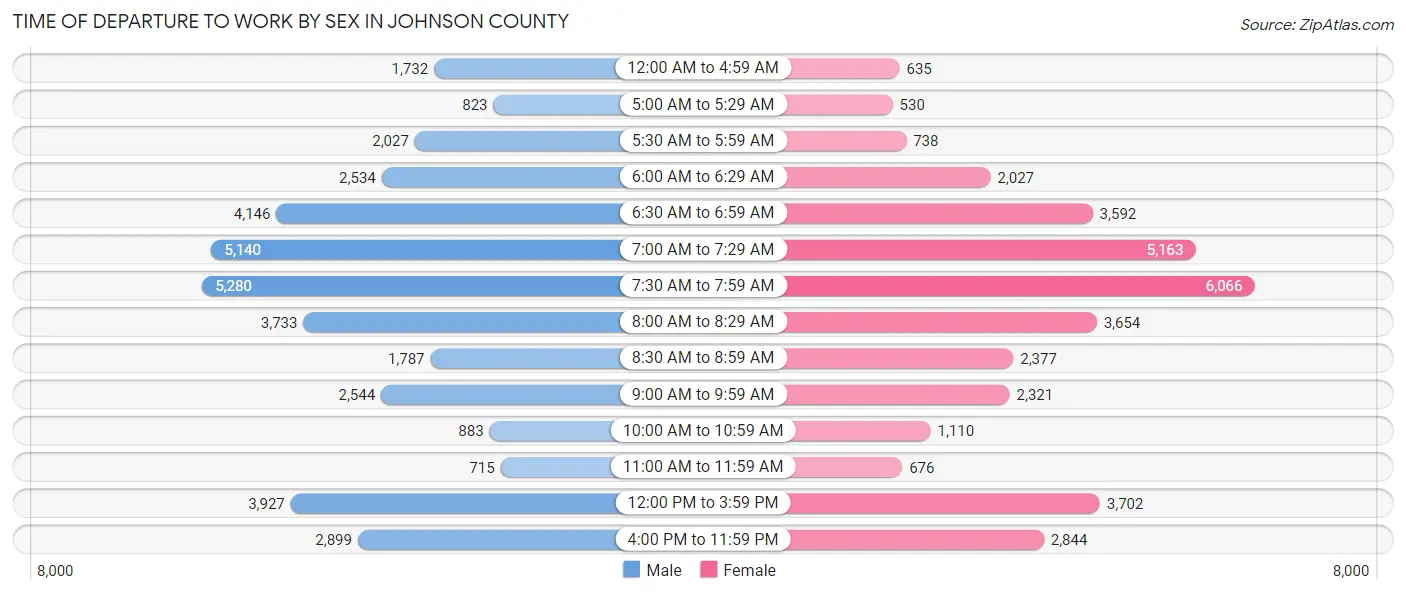
| Time of Departure | Male | Female |
| 12:00 AM to 4:59 AM | 1,732 (4.5%) | 635 (1.8%) |
| 5:00 AM to 5:29 AM | 823 (2.2%) | 530 (1.5%) |
| 5:30 AM to 5:59 AM | 2,027 (5.3%) | 738 (2.1%) |
| 6:00 AM to 6:29 AM | 2,534 (6.6%) | 2,027 (5.7%) |
| 6:30 AM to 6:59 AM | 4,146 (10.9%) | 3,592 (10.1%) |
| 7:00 AM to 7:29 AM | 5,140 (13.5%) | 5,163 (14.6%) |
| 7:30 AM to 7:59 AM | 5,280 (13.8%) | 6,066 (17.1%) |
| 8:00 AM to 8:29 AM | 3,733 (9.8%) | 3,654 (10.3%) |
| 8:30 AM to 8:59 AM | 1,787 (4.7%) | 2,377 (6.7%) |
| 9:00 AM to 9:59 AM | 2,544 (6.7%) | 2,321 (6.6%) |
| 10:00 AM to 10:59 AM | 883 (2.3%) | 1,110 (3.1%) |
| 11:00 AM to 11:59 AM | 715 (1.9%) | 676 (1.9%) |
| 12:00 PM to 3:59 PM | 3,927 (10.3%) | 3,702 (10.4%) |
| 4:00 PM to 11:59 PM | 2,899 (7.6%) | 2,844 (8.0%) |
| Total | 38,170 (100.0%) | 35,435 (100.0%) |
Housing Occupancy in Johnson County
Occupancy by Ownership in Johnson County
Of the total 61,414 dwellings in Johnson County, owner-occupied units account for 36,319 (59.1%), while renter-occupied units make up 25,095 (40.9%).
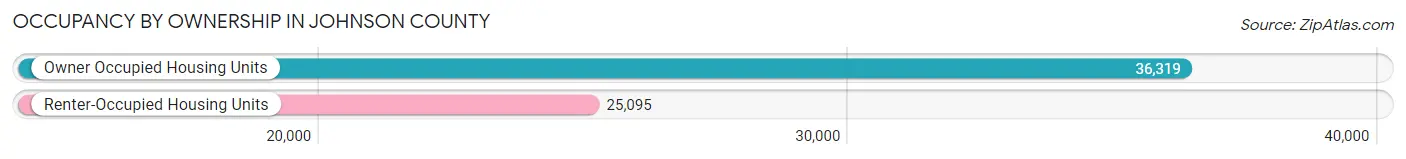
| Occupancy | # Housing Units | % Housing Units |
| Owner Occupied Housing Units | 36,319 | 59.1% |
| Renter-Occupied Housing Units | 25,095 | 40.9% |
| Total Occupied Housing Units | 61,414 | 100.0% |
Occupancy by Household Size in Johnson County
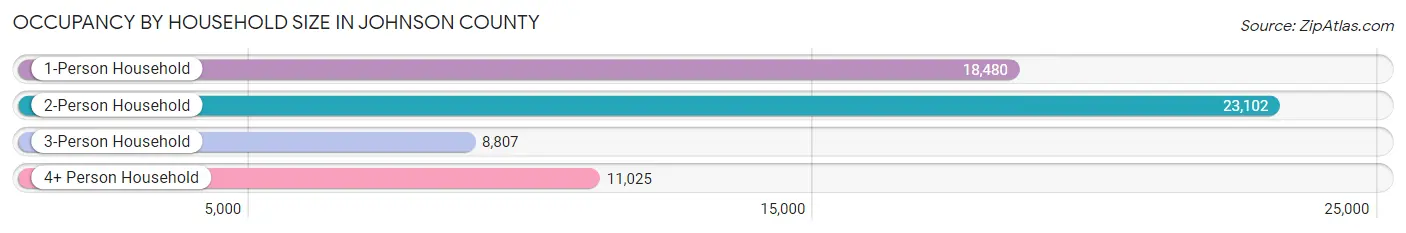
| Household Size | # Housing Units | % Housing Units |
| 1-Person Household | 18,480 | 30.1% |
| 2-Person Household | 23,102 | 37.6% |
| 3-Person Household | 8,807 | 14.3% |
| 4+ Person Household | 11,025 | 17.9% |
| Total Housing Units | 61,414 | 100.0% |
Occupancy by Ownership by Household Size in Johnson County
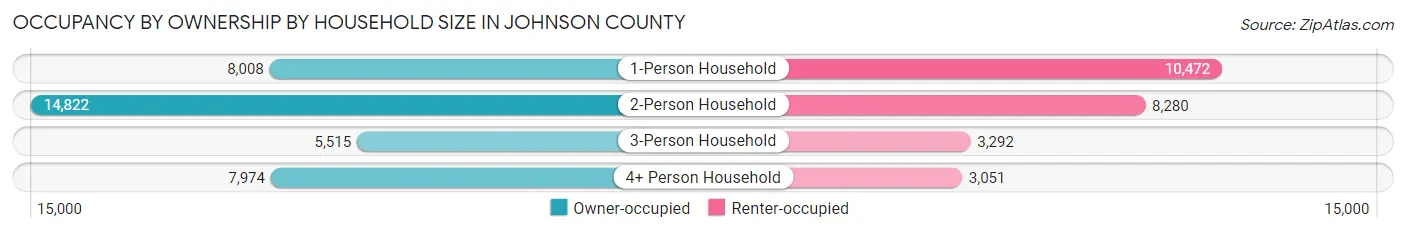
| Household Size | Owner-occupied | Renter-occupied |
| 1-Person Household | 8,008 (43.3%) | 10,472 (56.7%) |
| 2-Person Household | 14,822 (64.2%) | 8,280 (35.8%) |
| 3-Person Household | 5,515 (62.6%) | 3,292 (37.4%) |
| 4+ Person Household | 7,974 (72.3%) | 3,051 (27.7%) |
| Total Housing Units | 36,319 (59.1%) | 25,095 (40.9%) |
Occupancy by Educational Attainment in Johnson County
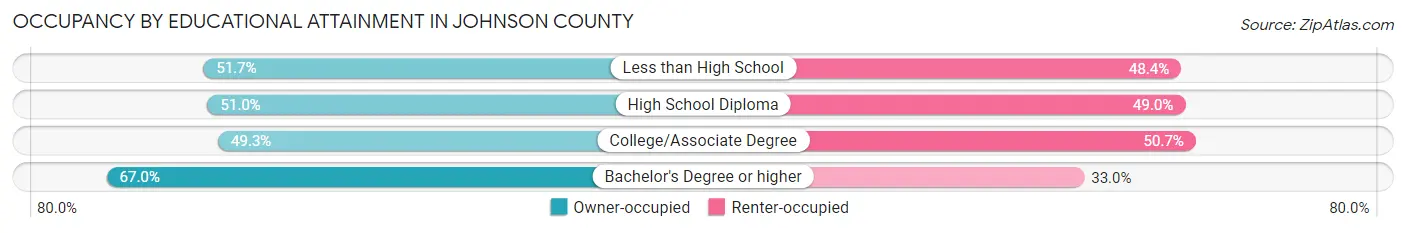
| Household Size | Owner-occupied | Renter-occupied |
| Less than High School | 910 (51.6%) | 852 (48.3%) |
| High School Diploma | 4,043 (51.0%) | 3,885 (49.0%) |
| College/Associate Degree | 9,172 (49.3%) | 9,423 (50.7%) |
| Bachelor's Degree or higher | 22,194 (67.0%) | 10,935 (33.0%) |
Occupancy by Age of Householder in Johnson County
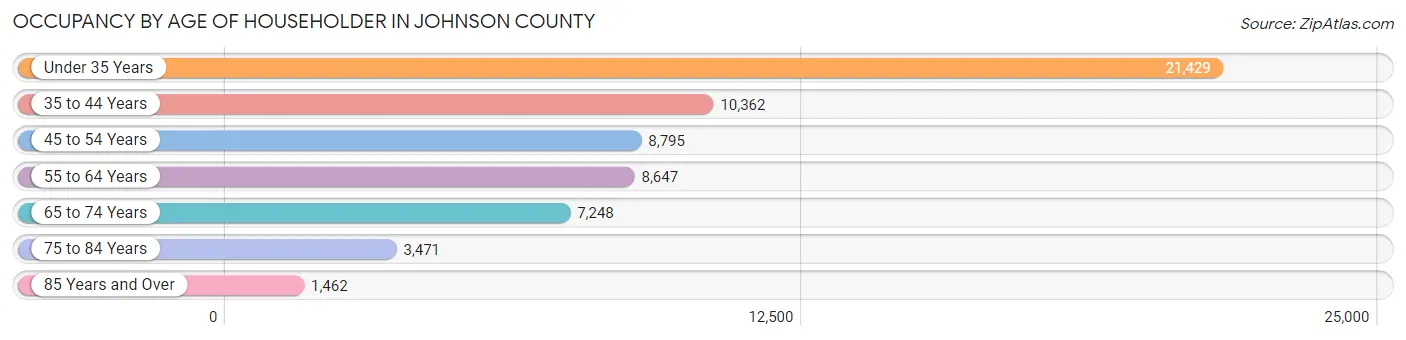
| Age Bracket | # Households | % Households |
| Under 35 Years | 21,429 | 34.9% |
| 35 to 44 Years | 10,362 | 16.9% |
| 45 to 54 Years | 8,795 | 14.3% |
| 55 to 64 Years | 8,647 | 14.1% |
| 65 to 74 Years | 7,248 | 11.8% |
| 75 to 84 Years | 3,471 | 5.7% |
| 85 Years and Over | 1,462 | 2.4% |
| Total | 61,414 | 100.0% |
Housing Finances in Johnson County
Median Income by Occupancy in Johnson County
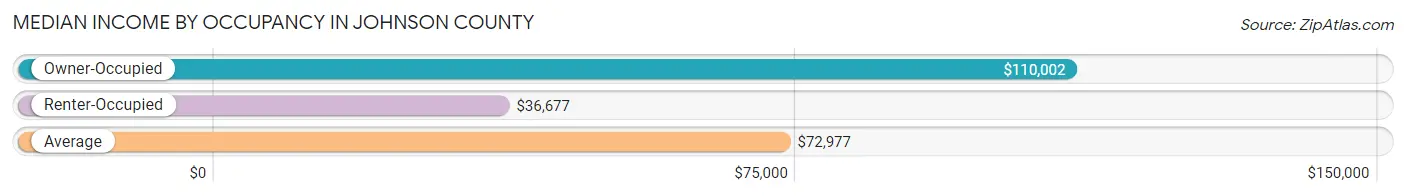
| Occupancy Type | # Households | Median Income |
| Owner-Occupied | 36,319 (59.1%) | $110,002 |
| Renter-Occupied | 25,095 (40.9%) | $36,677 |
| Average | 61,414 (100.0%) | $72,977 |
Occupancy by Householder Income Bracket in Johnson County
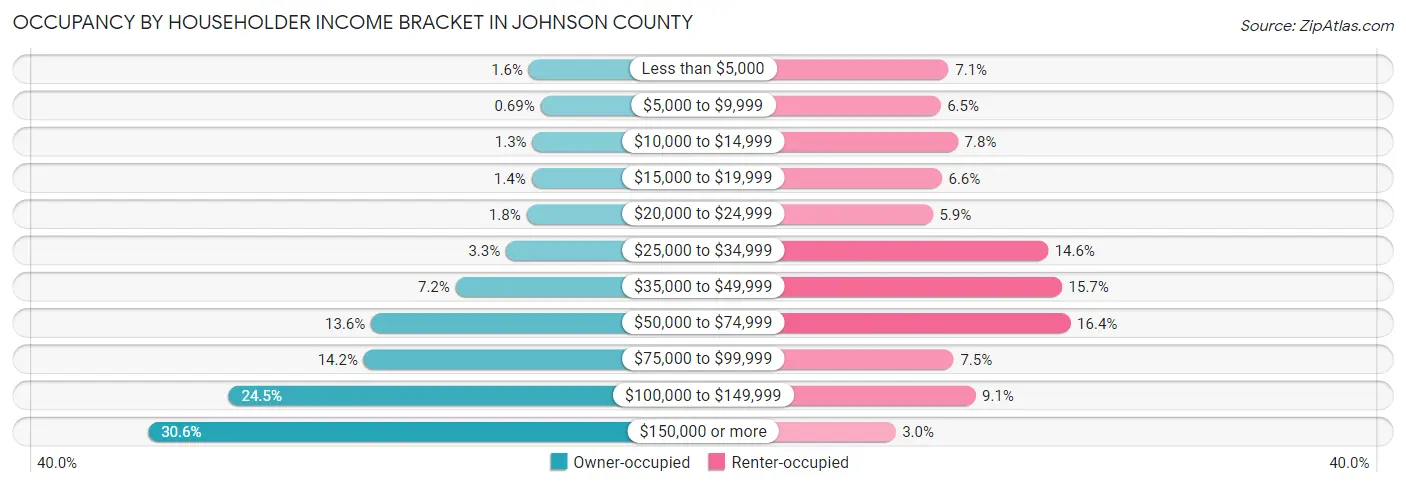
| Income Bracket | Owner-occupied | Renter-occupied |
| Less than $5,000 | 575 (1.6%) | 1,775 (7.1%) |
| $5,000 to $9,999 | 250 (0.7%) | 1,618 (6.5%) |
| $10,000 to $14,999 | 476 (1.3%) | 1,952 (7.8%) |
| $15,000 to $19,999 | 500 (1.4%) | 1,644 (6.6%) |
| $20,000 to $24,999 | 641 (1.8%) | 1,471 (5.9%) |
| $25,000 to $34,999 | 1,205 (3.3%) | 3,673 (14.6%) |
| $35,000 to $49,999 | 2,600 (7.2%) | 3,941 (15.7%) |
| $50,000 to $74,999 | 4,941 (13.6%) | 4,103 (16.4%) |
| $75,000 to $99,999 | 5,141 (14.2%) | 1,873 (7.5%) |
| $100,000 to $149,999 | 8,885 (24.5%) | 2,286 (9.1%) |
| $150,000 or more | 11,105 (30.6%) | 759 (3.0%) |
| Total | 36,319 (100.0%) | 25,095 (100.0%) |
Monthly Housing Cost Tiers in Johnson County
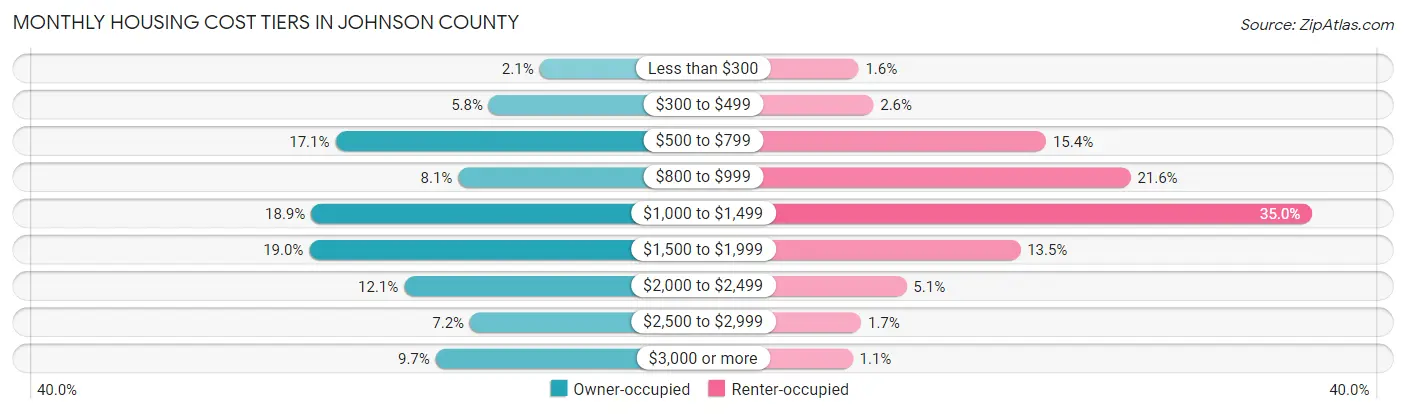
| Monthly Cost | Owner-occupied | Renter-occupied |
| Less than $300 | 754 (2.1%) | 389 (1.5%) |
| $300 to $499 | 2,109 (5.8%) | 663 (2.6%) |
| $500 to $799 | 6,216 (17.1%) | 3,854 (15.4%) |
| $800 to $999 | 2,932 (8.1%) | 5,416 (21.6%) |
| $1,000 to $1,499 | 6,866 (18.9%) | 8,772 (35.0%) |
| $1,500 to $1,999 | 6,914 (19.0%) | 3,377 (13.5%) |
| $2,000 to $2,499 | 4,378 (12.0%) | 1,274 (5.1%) |
| $2,500 to $2,999 | 2,615 (7.2%) | 437 (1.7%) |
| $3,000 or more | 3,535 (9.7%) | 282 (1.1%) |
| Total | 36,319 (100.0%) | 25,095 (100.0%) |
Physical Housing Characteristics in Johnson County
Housing Structures in Johnson County
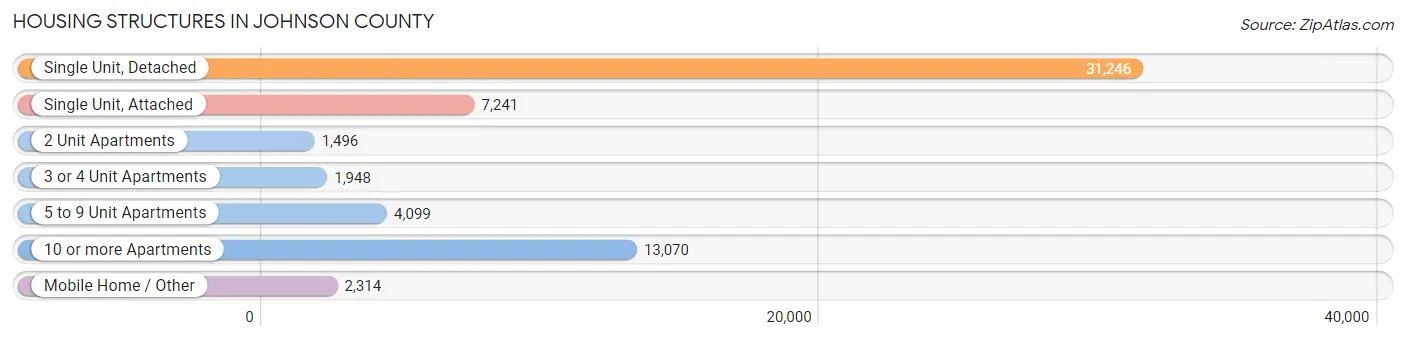
| Structure Type | # Housing Units | % Housing Units |
| Single Unit, Detached | 31,246 | 50.9% |
| Single Unit, Attached | 7,241 | 11.8% |
| 2 Unit Apartments | 1,496 | 2.4% |
| 3 or 4 Unit Apartments | 1,948 | 3.2% |
| 5 to 9 Unit Apartments | 4,099 | 6.7% |
| 10 or more Apartments | 13,070 | 21.3% |
| Mobile Home / Other | 2,314 | 3.8% |
| Total | 61,414 | 100.0% |
Housing Structures by Occupancy in Johnson County
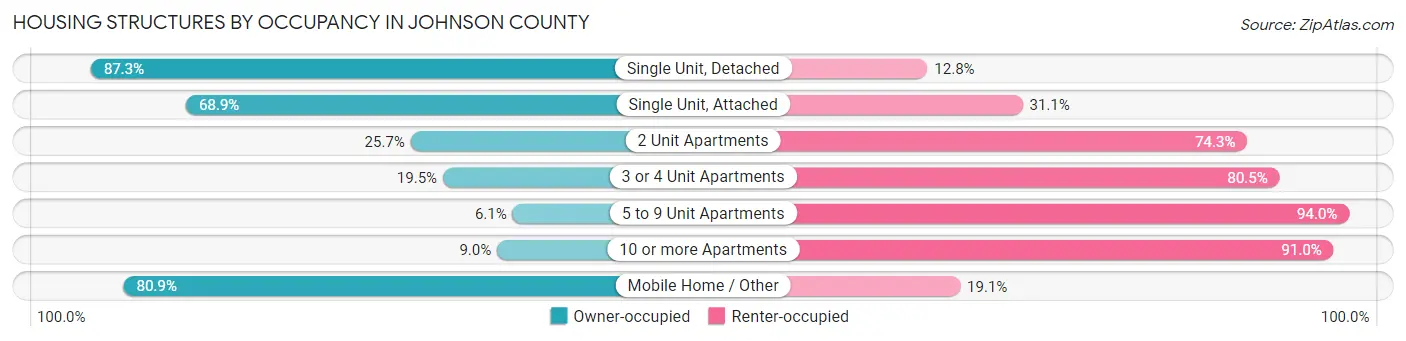
| Structure Type | Owner-occupied | Renter-occupied |
| Single Unit, Detached | 27,262 (87.3%) | 3,984 (12.8%) |
| Single Unit, Attached | 4,991 (68.9%) | 2,250 (31.1%) |
| 2 Unit Apartments | 384 (25.7%) | 1,112 (74.3%) |
| 3 or 4 Unit Apartments | 379 (19.5%) | 1,569 (80.5%) |
| 5 to 9 Unit Apartments | 248 (6.0%) | 3,851 (94.0%) |
| 10 or more Apartments | 1,182 (9.0%) | 11,888 (91.0%) |
| Mobile Home / Other | 1,873 (80.9%) | 441 (19.1%) |
| Total | 36,319 (59.1%) | 25,095 (40.9%) |
Housing Structures by Number of Rooms in Johnson County
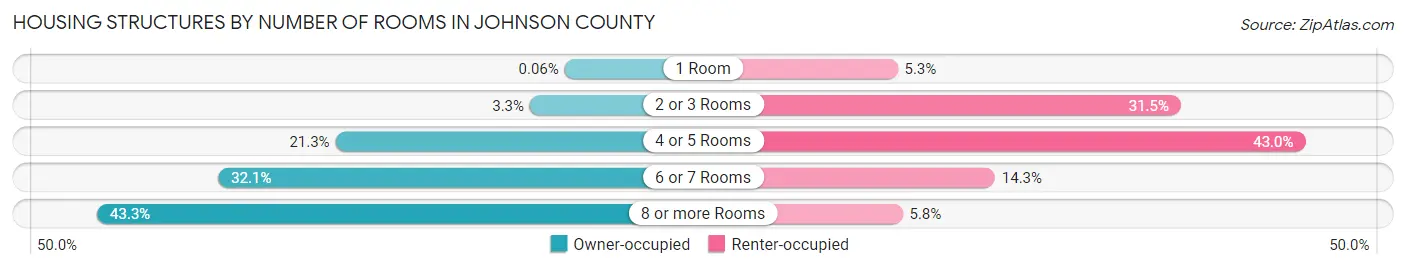
| Number of Rooms | Owner-occupied | Renter-occupied |
| 1 Room | 20 (0.1%) | 1,337 (5.3%) |
| 2 or 3 Rooms | 1,189 (3.3%) | 7,910 (31.5%) |
| 4 or 5 Rooms | 7,719 (21.2%) | 10,801 (43.0%) |
| 6 or 7 Rooms | 11,660 (32.1%) | 3,595 (14.3%) |
| 8 or more Rooms | 15,731 (43.3%) | 1,452 (5.8%) |
| Total | 36,319 (100.0%) | 25,095 (100.0%) |
Housing Structure by Heating Type in Johnson County
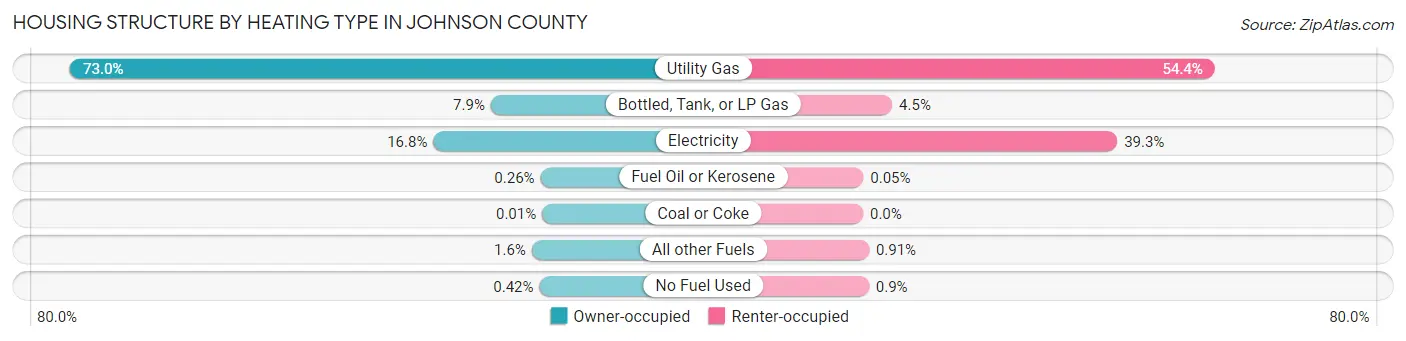
| Heating Type | Owner-occupied | Renter-occupied |
| Utility Gas | 26,493 (73.0%) | 13,639 (54.3%) |
| Bottled, Tank, or LP Gas | 2,882 (7.9%) | 1,129 (4.5%) |
| Electricity | 6,111 (16.8%) | 9,859 (39.3%) |
| Fuel Oil or Kerosene | 93 (0.3%) | 13 (0.1%) |
| Coal or Coke | 5 (0.0%) | 0 (0.0%) |
| All other Fuels | 583 (1.6%) | 228 (0.9%) |
| No Fuel Used | 152 (0.4%) | 227 (0.9%) |
| Total | 36,319 (100.0%) | 25,095 (100.0%) |
Household Vehicle Usage in Johnson County
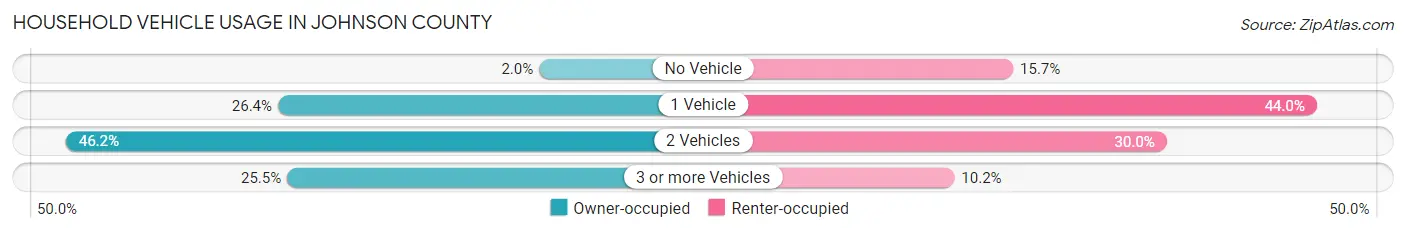
| Vehicles per Household | Owner-occupied | Renter-occupied |
| No Vehicle | 719 (2.0%) | 3,941 (15.7%) |
| 1 Vehicle | 9,574 (26.4%) | 11,052 (44.0%) |
| 2 Vehicles | 16,763 (46.2%) | 7,537 (30.0%) |
| 3 or more Vehicles | 9,263 (25.5%) | 2,565 (10.2%) |
| Total | 36,319 (100.0%) | 25,095 (100.0%) |
Real Estate & Mortgages in Johnson County
Real Estate and Mortgage Overview in Johnson County
| Characteristic | Without Mortgage | With Mortgage |
| Housing Units | 12,459 | 23,860 |
| Median Property Value | $257,100 | $288,800 |
| Median Household Income | $84,570 | $8,316 |
| Monthly Housing Costs | $667 | $3,533 |
| Real Estate Taxes | $4,170 | $390 |
Property Value by Mortgage Status in Johnson County
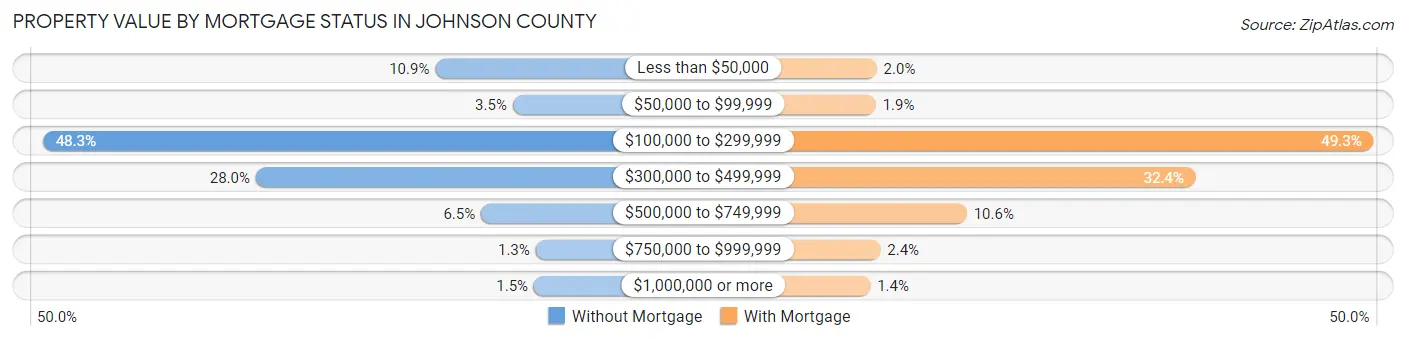
| Property Value | Without Mortgage | With Mortgage |
| Less than $50,000 | 1,357 (10.9%) | 479 (2.0%) |
| $50,000 to $99,999 | 437 (3.5%) | 457 (1.9%) |
| $100,000 to $299,999 | 6,014 (48.3%) | 11,771 (49.3%) |
| $300,000 to $499,999 | 3,486 (28.0%) | 7,732 (32.4%) |
| $500,000 to $749,999 | 813 (6.5%) | 2,526 (10.6%) |
| $750,000 to $999,999 | 166 (1.3%) | 562 (2.4%) |
| $1,000,000 or more | 186 (1.5%) | 333 (1.4%) |
| Total | 12,459 (100.0%) | 23,860 (100.0%) |
Household Income by Mortgage Status in Johnson County
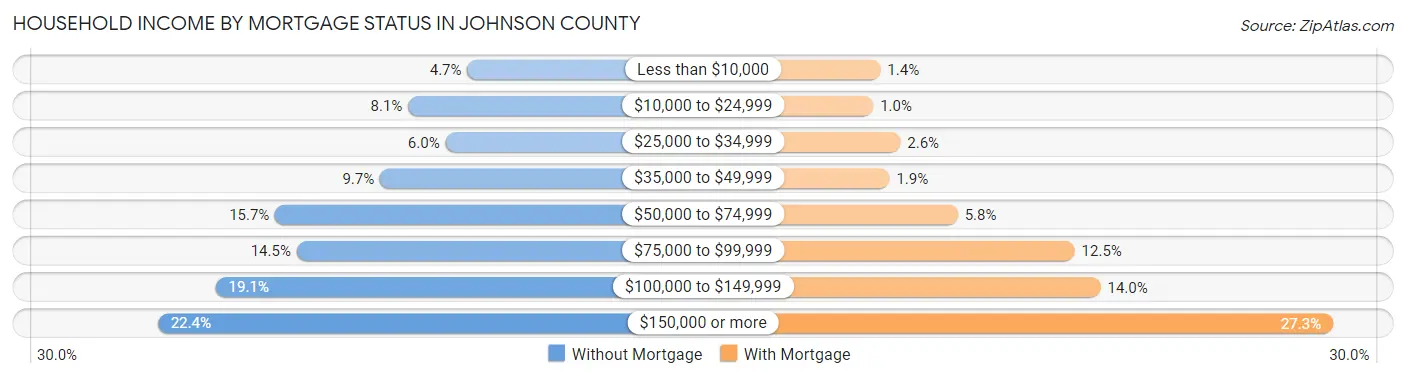
| Household Income | Without Mortgage | With Mortgage |
| Less than $10,000 | 585 (4.7%) | 338 (1.4%) |
| $10,000 to $24,999 | 1,007 (8.1%) | 240 (1.0%) |
| $25,000 to $34,999 | 741 (5.9%) | 610 (2.6%) |
| $35,000 to $49,999 | 1,207 (9.7%) | 464 (1.9%) |
| $50,000 to $74,999 | 1,953 (15.7%) | 1,393 (5.8%) |
| $75,000 to $99,999 | 1,800 (14.4%) | 2,988 (12.5%) |
| $100,000 to $149,999 | 2,377 (19.1%) | 3,341 (14.0%) |
| $150,000 or more | 2,789 (22.4%) | 6,508 (27.3%) |
| Total | 12,459 (100.0%) | 23,860 (100.0%) |
Property Value to Household Income Ratio in Johnson County
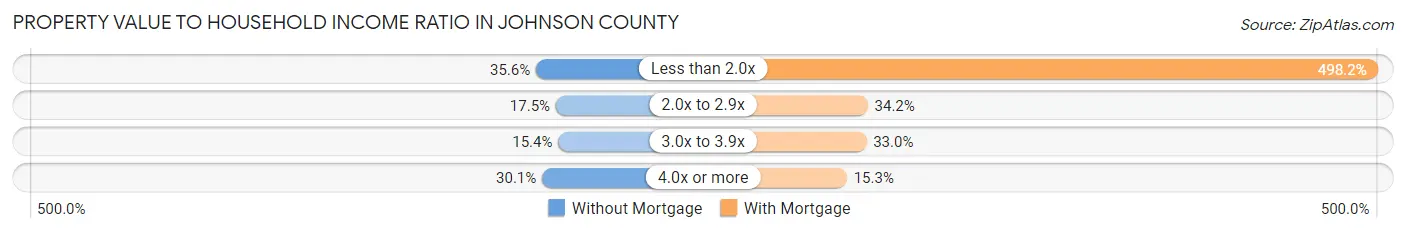
| Value-to-Income Ratio | Without Mortgage | With Mortgage |
| Less than 2.0x | 4,434 (35.6%) | 118,865 (498.2%) |
| 2.0x to 2.9x | 2,184 (17.5%) | 8,163 (34.2%) |
| 3.0x to 3.9x | 1,920 (15.4%) | 7,866 (33.0%) |
| 4.0x or more | 3,749 (30.1%) | 3,646 (15.3%) |
| Total | 12,459 (100.0%) | 23,860 (100.0%) |
Real Estate Taxes by Mortgage Status in Johnson County
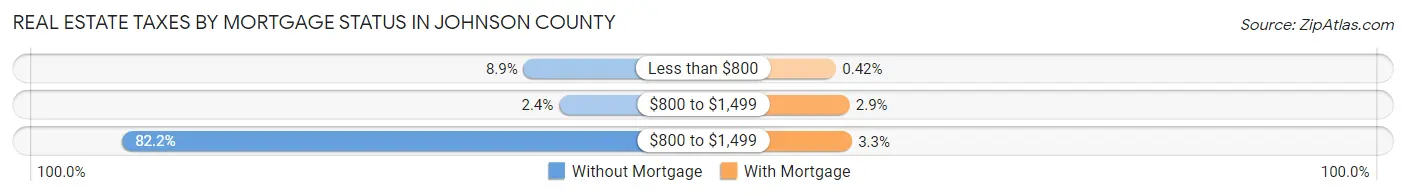
| Property Taxes | Without Mortgage | With Mortgage |
| Less than $800 | 1,105 (8.9%) | 100 (0.4%) |
| $800 to $1,499 | 295 (2.4%) | 690 (2.9%) |
| $800 to $1,499 | 10,236 (82.2%) | 791 (3.3%) |
| Total | 12,459 (100.0%) | 23,860 (100.0%) |
Health & Disability in Johnson County
Health Insurance Coverage by Age in Johnson County
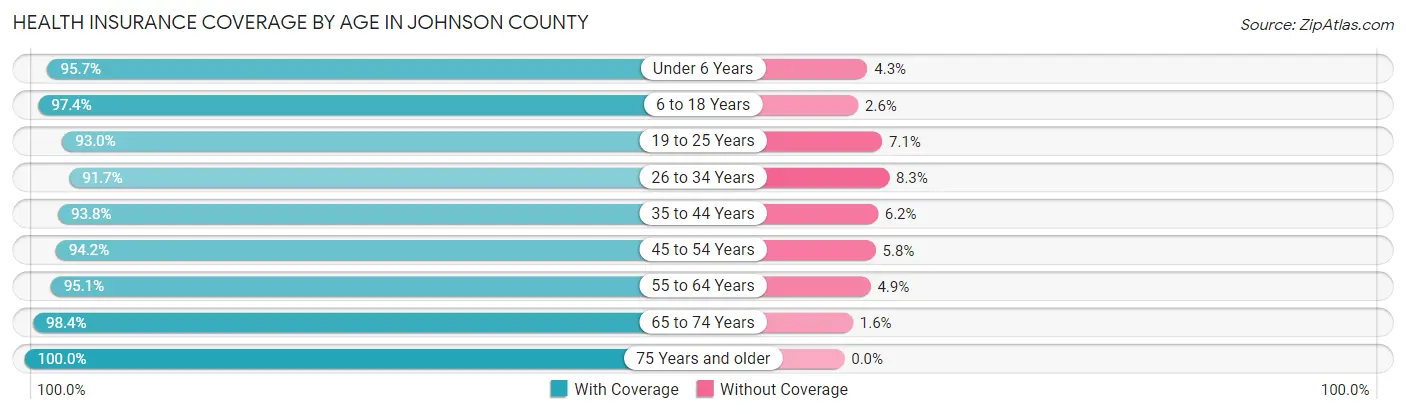
| Age Bracket | With Coverage | Without Coverage |
| Under 6 Years | 9,742 (95.7%) | 438 (4.3%) |
| 6 to 18 Years | 22,542 (97.4%) | 594 (2.6%) |
| 19 to 25 Years | 29,175 (92.9%) | 2,213 (7.0%) |
| 26 to 34 Years | 18,397 (91.7%) | 1,673 (8.3%) |
| 35 to 44 Years | 17,326 (93.8%) | 1,153 (6.2%) |
| 45 to 54 Years | 14,087 (94.2%) | 874 (5.8%) |
| 55 to 64 Years | 13,929 (95.1%) | 714 (4.9%) |
| 65 to 74 Years | 11,446 (98.4%) | 185 (1.6%) |
| 75 Years and older | 7,059 (100.0%) | 0 (0.0%) |
| Total | 143,703 (94.8%) | 7,844 (5.2%) |
Health Insurance Coverage by Citizenship Status in Johnson County
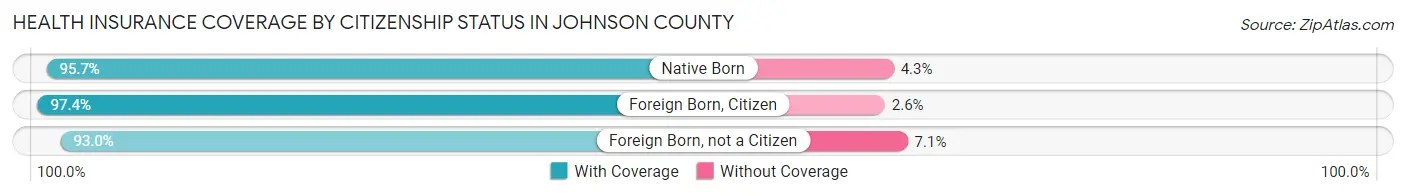
| Citizenship Status | With Coverage | Without Coverage |
| Native Born | 9,742 (95.7%) | 438 (4.3%) |
| Foreign Born, Citizen | 22,542 (97.4%) | 594 (2.6%) |
| Foreign Born, not a Citizen | 29,175 (92.9%) | 2,213 (7.0%) |
Health Insurance Coverage by Household Income in Johnson County
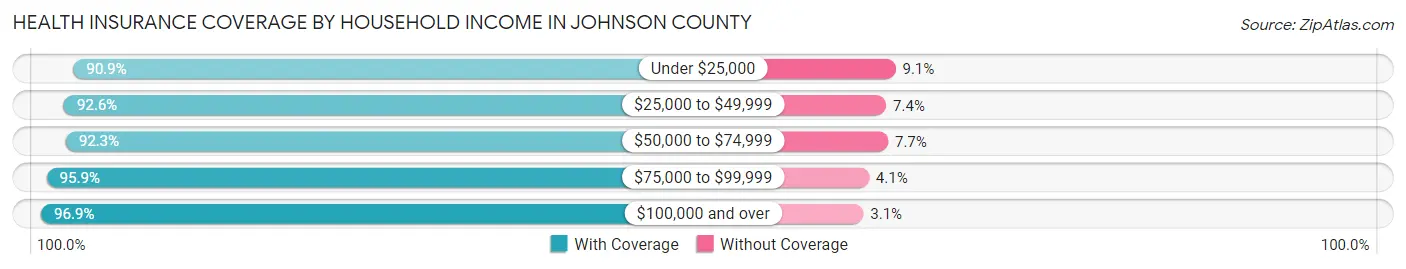
| Household Income | With Coverage | Without Coverage |
| Under $25,000 | 18,223 (90.9%) | 1,830 (9.1%) |
| $25,000 to $49,999 | 20,807 (92.6%) | 1,655 (7.4%) |
| $50,000 to $74,999 | 17,180 (92.3%) | 1,439 (7.7%) |
| $75,000 to $99,999 | 15,823 (95.9%) | 684 (4.1%) |
| $100,000 and over | 66,018 (96.9%) | 2,109 (3.1%) |
Public vs Private Health Insurance Coverage by Age in Johnson County
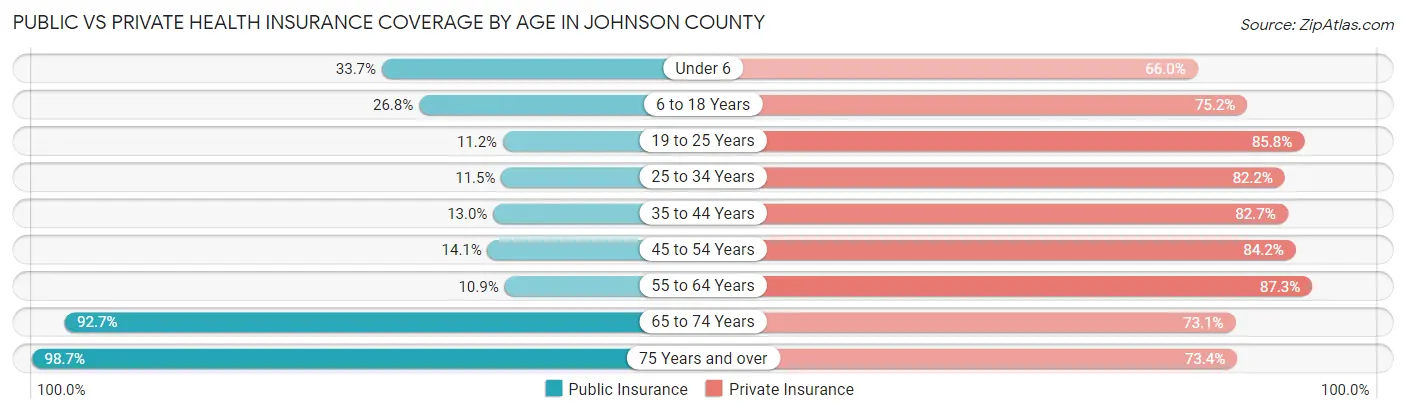
| Age Bracket | Public Insurance | Private Insurance |
| Under 6 | 3,430 (33.7%) | 6,720 (66.0%) |
| 6 to 18 Years | 6,198 (26.8%) | 17,408 (75.2%) |
| 19 to 25 Years | 3,520 (11.2%) | 26,926 (85.8%) |
| 25 to 34 Years | 2,312 (11.5%) | 16,500 (82.2%) |
| 35 to 44 Years | 2,406 (13.0%) | 15,286 (82.7%) |
| 45 to 54 Years | 2,103 (14.1%) | 12,602 (84.2%) |
| 55 to 64 Years | 1,601 (10.9%) | 12,781 (87.3%) |
| 65 to 74 Years | 10,776 (92.6%) | 8,496 (73.1%) |
| 75 Years and over | 6,967 (98.7%) | 5,179 (73.4%) |
| Total | 39,313 (25.9%) | 121,898 (80.4%) |
Disability Status by Sex by Age in Johnson County
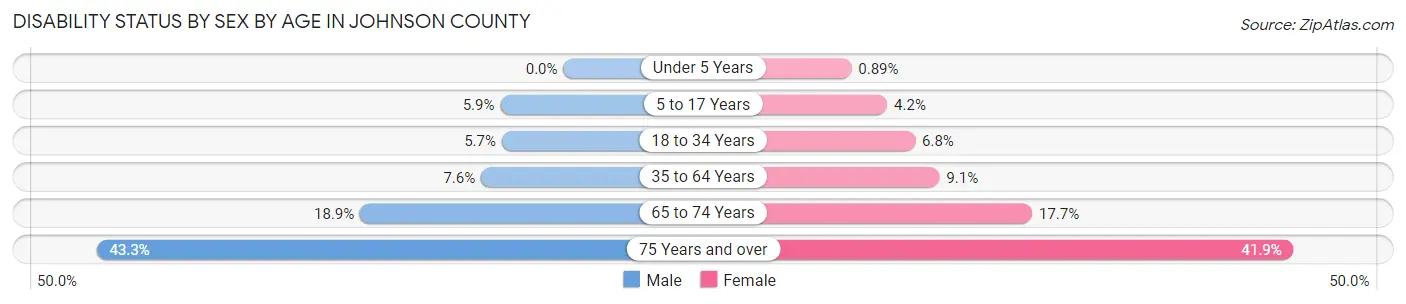
| Age Bracket | Male | Female |
| Under 5 Years | 0 (0.0%) | 35 (0.9%) |
| 5 to 17 Years | 638 (5.9%) | 443 (4.2%) |
| 18 to 34 Years | 1,546 (5.7%) | 1,899 (6.8%) |
| 35 to 64 Years | 1,850 (7.6%) | 2,163 (9.1%) |
| 65 to 74 Years | 1,034 (18.9%) | 1,086 (17.7%) |
| 75 Years and over | 1,282 (43.3%) | 1,719 (41.9%) |
Disability Class by Sex by Age in Johnson County
Disability Class: Hearing Difficulty
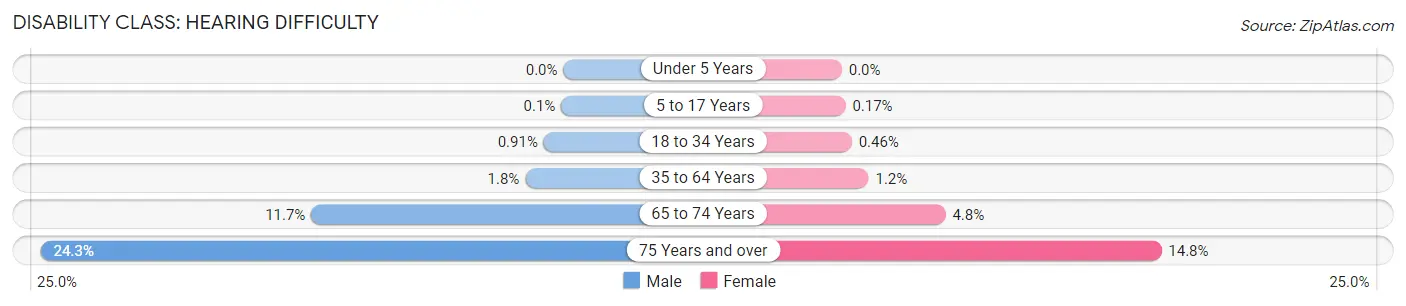
| Age Bracket | Male | Female |
| Under 5 Years | 0 (0.0%) | 0 (0.0%) |
| 5 to 17 Years | 11 (0.1%) | 18 (0.2%) |
| 18 to 34 Years | 247 (0.9%) | 129 (0.5%) |
| 35 to 64 Years | 429 (1.8%) | 295 (1.2%) |
| 65 to 74 Years | 641 (11.7%) | 296 (4.8%) |
| 75 Years and over | 718 (24.3%) | 608 (14.8%) |
Disability Class: Vision Difficulty
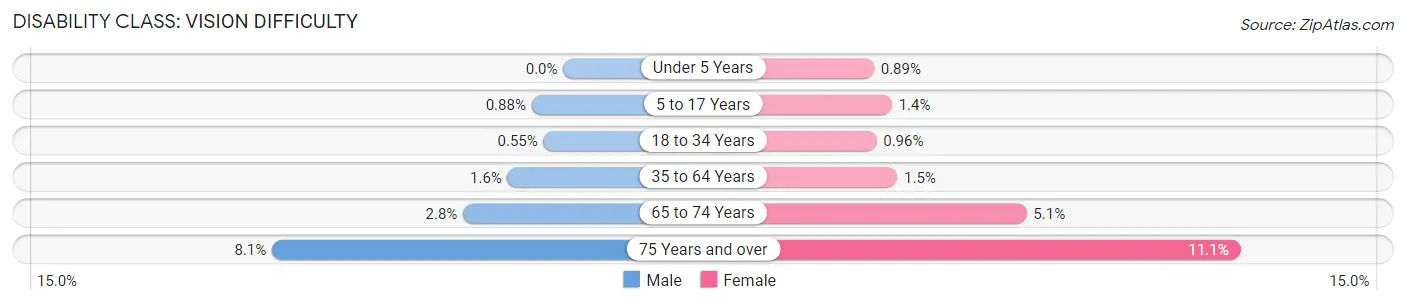
| Age Bracket | Male | Female |
| Under 5 Years | 0 (0.0%) | 35 (0.9%) |
| 5 to 17 Years | 96 (0.9%) | 146 (1.4%) |
| 18 to 34 Years | 148 (0.5%) | 269 (1.0%) |
| 35 to 64 Years | 376 (1.5%) | 368 (1.5%) |
| 65 to 74 Years | 153 (2.8%) | 316 (5.1%) |
| 75 Years and over | 240 (8.1%) | 455 (11.1%) |
Disability Class: Cognitive Difficulty
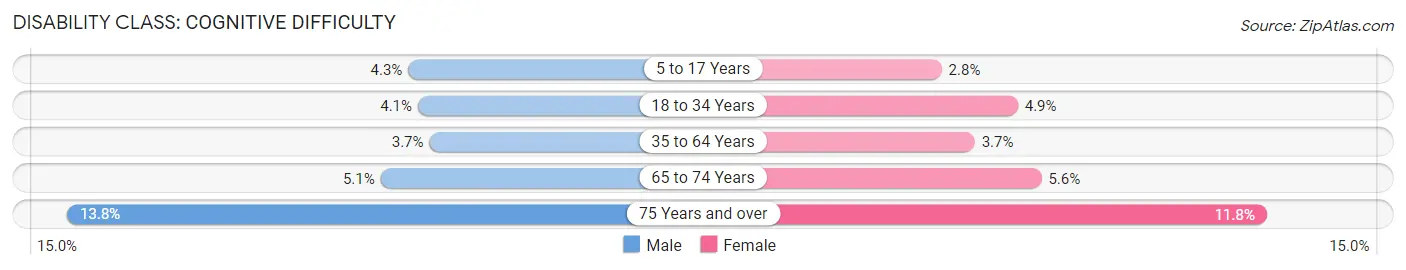
| Age Bracket | Male | Female |
| 5 to 17 Years | 471 (4.3%) | 292 (2.8%) |
| 18 to 34 Years | 1,097 (4.1%) | 1,368 (4.9%) |
| 35 to 64 Years | 904 (3.7%) | 882 (3.7%) |
| 65 to 74 Years | 279 (5.1%) | 342 (5.6%) |
| 75 Years and over | 409 (13.8%) | 485 (11.8%) |
Disability Class: Ambulatory Difficulty
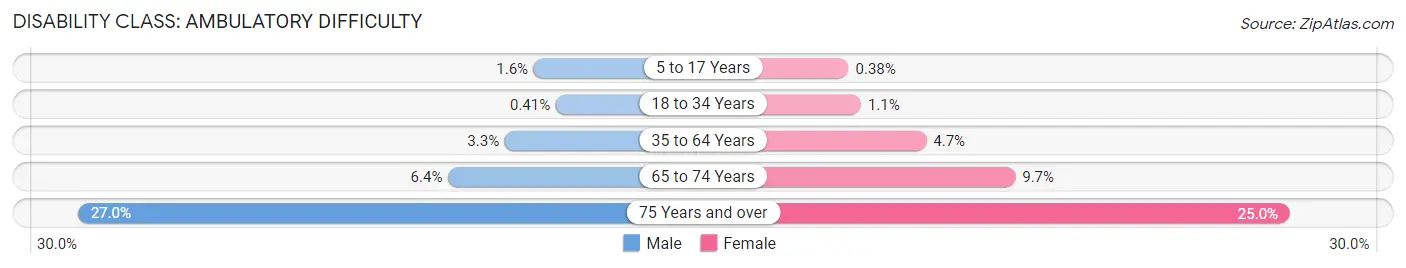
| Age Bracket | Male | Female |
| 5 to 17 Years | 179 (1.6%) | 40 (0.4%) |
| 18 to 34 Years | 111 (0.4%) | 298 (1.1%) |
| 35 to 64 Years | 787 (3.3%) | 1,124 (4.7%) |
| 65 to 74 Years | 351 (6.4%) | 594 (9.7%) |
| 75 Years and over | 800 (27.0%) | 1,023 (24.9%) |
Disability Class: Self-Care Difficulty
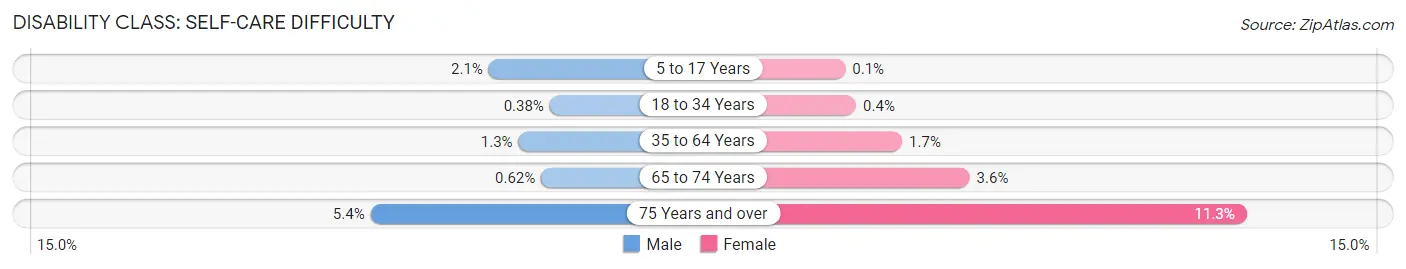
| Age Bracket | Male | Female |
| 5 to 17 Years | 227 (2.1%) | 10 (0.1%) |
| 18 to 34 Years | 103 (0.4%) | 113 (0.4%) |
| 35 to 64 Years | 302 (1.3%) | 402 (1.7%) |
| 65 to 74 Years | 34 (0.6%) | 219 (3.6%) |
| 75 Years and over | 159 (5.4%) | 462 (11.3%) |
Technology Access in Johnson County
Computing Device Access in Johnson County
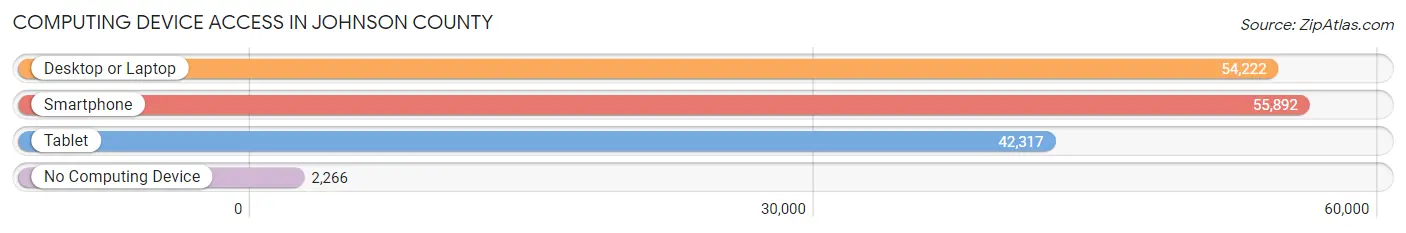
| Device Type | # Households | % Households |
| Desktop or Laptop | 54,222 | 88.3% |
| Smartphone | 55,892 | 91.0% |
| Tablet | 42,317 | 68.9% |
| No Computing Device | 2,266 | 3.7% |
| Total | 61,414 | 100.0% |
Internet Access in Johnson County
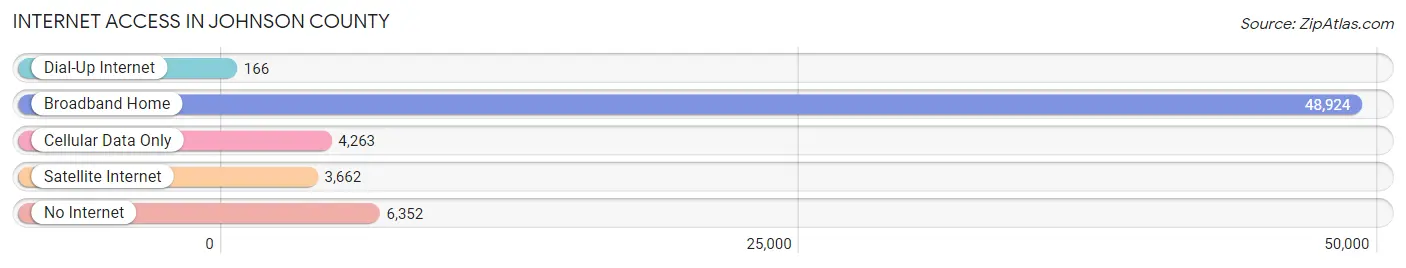
| Internet Type | # Households | % Households |
| Dial-Up Internet | 166 | 0.3% |
| Broadband Home | 48,924 | 79.7% |
| Cellular Data Only | 4,263 | 6.9% |
| Satellite Internet | 3,662 | 6.0% |
| No Internet | 6,352 | 10.3% |
| Total | 61,414 | 100.0% |
Johnson County Summary
Johnson County, Iowa is located in the southeastern corner of the state and is part of the Iowa City Metropolitan Statistical Area. It is the fifth most populous county in Iowa, with a population of 131,887 as of the 2010 census. The county seat is Iowa City, which is also the home of the University of Iowa.
History
Johnson County was established in 1837 and was named after Richard Mentor Johnson, the ninth Vice President of the United States. The county was originally part of the Iowa Territory, which was established in 1838. The county was initially populated by Native American tribes, including the Meskwaki, Sauk, Fox, and Ioway.
The first settlers in Johnson County were mostly of English and German descent. The first permanent settlement was established in 1839 in the town of Napoleon, which is now part of Iowa City. The county was officially organized in 1841 and the first county seat was established in the town of Napoleon.
In 1847, the county seat was moved to Iowa City, which had become the largest town in the county. The University of Iowa was established in Iowa City in 1847 and has since become one of the largest universities in the state.
Geography
Johnson County is located in the southeastern corner of Iowa and is bordered by Cedar, Muscatine, and Washington counties to the north, Iowa and Louisa counties to the east, and Keokuk and Washington counties to the south. The county covers an area of 576 square miles and is home to several rivers, including the Iowa, Cedar, and Wapsipinicon.
The county is mostly flat, with some rolling hills in the northern and western parts. The highest point in the county is located in the town of Oxford, which has an elevation of 1,068 feet. The county is also home to several state parks, including Lake Macbride State Park, Palisades-Kepler State Park, and Shimek State Forest.
Economy
Johnson County has a diverse economy that is largely driven by the University of Iowa and the healthcare industry. The county is home to several major employers, including the University of Iowa, Mercy Iowa City, and the Iowa City VA Health Care System.
The county also has a strong agricultural sector, with corn, soybeans, and hogs being the primary crops. The county is also home to several manufacturing companies, including John Deere, Rockwell Collins, and General Mills.
Demographics
As of the 2010 census, Johnson County had a population of 131,887. The racial makeup of the county was 87.3% White, 5.7% African American, 2.2% Asian, 0.5% Native American, 0.1% Pacific Islander, and 3.2% from two or more races. Hispanic or Latino of any race were 5.3% of the population.
The median household income in the county was $54,945 and the median family income was $68,945. The per capita income was $29,945. About 8.3% of the population was below the poverty line.
Conclusion
Johnson County, Iowa is a diverse and vibrant county located in the southeastern corner of the state. It is home to the University of Iowa and has a strong economy that is largely driven by the healthcare and agricultural industries. The county has a population of 131,887 and is home to a variety of racial and ethnic groups. The median household income in the county is $54,945 and the per capita income is $29,945.
Common Questions
What is Per Capita Income in Johnson County?
Per Capita income in Johnson County is $42,175.
What is the Median Family Income in Johnson County?
Median Family Income in Johnson County is $112,575.
What is the Median Household income in Johnson County?
Median Household Income in Johnson County is $72,977.
What is Income or Wage Gap in Johnson County?
Income or Wage Gap in Johnson County is 30.9%.
Women in Johnson County earn 69.1 cents for every dollar earned by a man.
What is Family Income Deficit in Johnson County?
Family Income Deficit in Johnson County is $13,108.
Families that are below poverty line in Johnson County earn $13,108 less on average than the poverty threshold level.
What is Inequality or Gini Index in Johnson County?
Inequality or Gini Index in Johnson County is 0.49.
What is the Total Population of Johnson County?
Total Population of Johnson County is 153,360.
What is the Total Male Population of Johnson County?
Total Male Population of Johnson County is 76,466.
What is the Total Female Population of Johnson County?
Total Female Population of Johnson County is 76,894.
What is the Ratio of Males per 100 Females in Johnson County?
There are 99.44 Males per 100 Females in Johnson County.
What is the Ratio of Females per 100 Males in Johnson County?
There are 100.56 Females per 100 Males in Johnson County.
What is the Median Population Age in Johnson County?
Median Population Age in Johnson County is 30.6 Years.
What is the Average Family Size in Johnson County
Average Family Size in Johnson County is 3.0 People.
What is the Average Household Size in Johnson County
Average Household Size in Johnson County is 2.4 People.
How Large is the Labor Force in Johnson County?
There are 88,332 People in the Labor Forcein in Johnson County.
What is the Percentage of People in the Labor Force in Johnson County?
69.7% of People are in the Labor Force in Johnson County.
What is the Unemployment Rate in Johnson County?
Unemployment Rate in Johnson County is 3.8%.