Waterloo, IA Map & Demographics
Waterloo Map
Waterloo Overview
$31,845
PER CAPITA INCOME
$70,173
AVG FAMILY INCOME
$54,104
AVG HOUSEHOLD INCOME
22.9%
WAGE / INCOME GAP [ % ]
77.1¢/ $1
WAGE / INCOME GAP [ $ ]
$9,909
FAMILY INCOME DEFICIT
0.46
INEQUALITY / GINI INDEX
67,256
TOTAL POPULATION
33,483
MALE POPULATION
33,773
FEMALE POPULATION
99.14
MALES / 100 FEMALES
100.87
FEMALES / 100 MALES
36.7
MEDIAN AGE
3.0
AVG FAMILY SIZE
2.3
AVG HOUSEHOLD SIZE
34,516
LABOR FORCE [ PEOPLE ]
65.2%
PERCENT IN LABOR FORCE
7.1%
UNEMPLOYMENT RATE
Waterloo Area Codes
Income in Waterloo
Income Overview in Waterloo
Per Capita Income in Waterloo is $31,845, while median incomes of families and households are $70,173 and $54,104 respectively.
| Characteristic | Number | Measure |
| Per Capita Income | 67,256 | $31,845 |
| Median Family Income | 16,493 | $70,173 |
| Mean Family Income | 16,493 | $89,671 |
| Median Household Income | 28,947 | $54,104 |
| Mean Household Income | 28,947 | $73,324 |
| Income Deficit | 16,493 | $9,909 |
| Wage / Income Gap (%) | 67,256 | 22.88% |
| Wage / Income Gap ($) | 67,256 | 77.12¢ per $1 |
| Gini / Inequality Index | 67,256 | 0.46 |
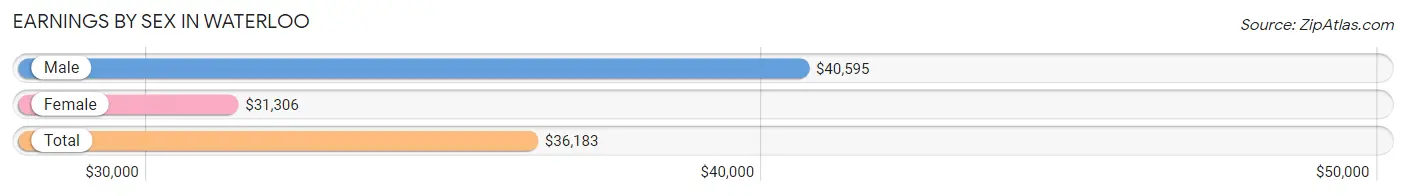
Earnings by Sex in Waterloo
Average Earnings in Waterloo are $36,183, $40,595 for men and $31,306 for women, a difference of 22.9%.
| Sex | Number | Average Earnings |
| Male | 18,560 (52.4%) | $40,595 |
| Female | 16,882 (47.6%) | $31,306 |
| Total | 35,442 (100.0%) | $36,183 |
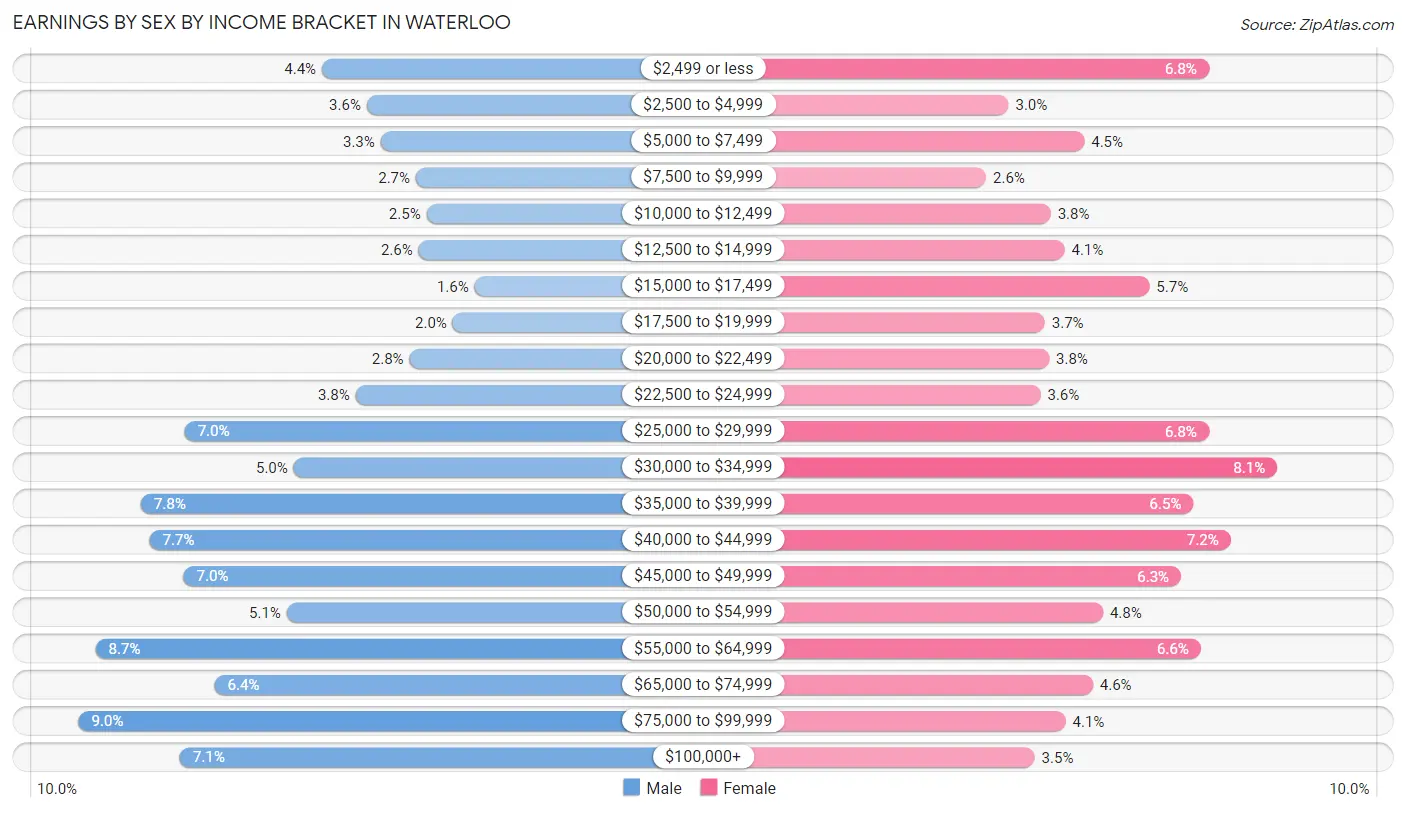
Earnings by Sex by Income Bracket in Waterloo
The most common earnings brackets in Waterloo are $75,000 to $99,999 for men (1,668 | 9.0%) and $30,000 to $34,999 for women (1,360 | 8.1%).
| Income | Male | Female |
| $2,499 or less | 823 (4.4%) | 1,144 (6.8%) |
| $2,500 to $4,999 | 667 (3.6%) | 512 (3.0%) |
| $5,000 to $7,499 | 618 (3.3%) | 752 (4.4%) |
| $7,500 to $9,999 | 496 (2.7%) | 440 (2.6%) |
| $10,000 to $12,499 | 458 (2.5%) | 645 (3.8%) |
| $12,500 to $14,999 | 487 (2.6%) | 689 (4.1%) |
| $15,000 to $17,499 | 292 (1.6%) | 958 (5.7%) |
| $17,500 to $19,999 | 367 (2.0%) | 627 (3.7%) |
| $20,000 to $22,499 | 518 (2.8%) | 639 (3.8%) |
| $22,500 to $24,999 | 705 (3.8%) | 612 (3.6%) |
| $25,000 to $29,999 | 1,300 (7.0%) | 1,145 (6.8%) |
| $30,000 to $34,999 | 921 (5.0%) | 1,360 (8.1%) |
| $35,000 to $39,999 | 1,452 (7.8%) | 1,096 (6.5%) |
| $40,000 to $44,999 | 1,421 (7.7%) | 1,213 (7.2%) |
| $45,000 to $49,999 | 1,302 (7.0%) | 1,056 (6.3%) |
| $50,000 to $54,999 | 945 (5.1%) | 810 (4.8%) |
| $55,000 to $64,999 | 1,609 (8.7%) | 1,119 (6.6%) |
| $65,000 to $74,999 | 1,195 (6.4%) | 779 (4.6%) |
| $75,000 to $99,999 | 1,668 (9.0%) | 692 (4.1%) |
| $100,000+ | 1,316 (7.1%) | 594 (3.5%) |
| Total | 18,560 (100.0%) | 16,882 (100.0%) |
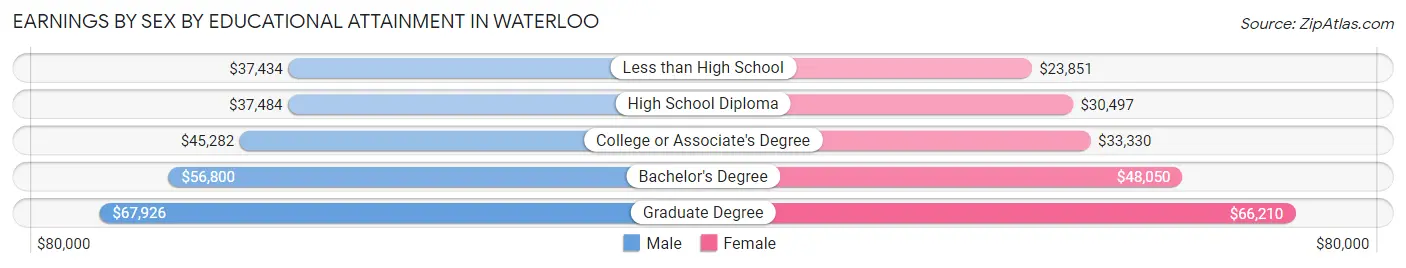
Earnings by Sex by Educational Attainment in Waterloo
Average earnings in Waterloo are $45,114 for men and $35,882 for women, a difference of 20.5%. Men with an educational attainment of graduate degree enjoy the highest average annual earnings of $67,926, while those with less than high school education earn the least with $37,434. Women with an educational attainment of graduate degree earn the most with the average annual earnings of $66,210, while those with less than high school education have the smallest earnings of $23,851.
| Educational Attainment | Male Income | Female Income |
| Less than High School | $37,434 | $23,851 |
| High School Diploma | $37,484 | $30,497 |
| College or Associate's Degree | $45,282 | $33,330 |
| Bachelor's Degree | $56,800 | $48,050 |
| Graduate Degree | $67,926 | $66,210 |
| Total | $45,114 | $35,882 |
Family Income in Waterloo
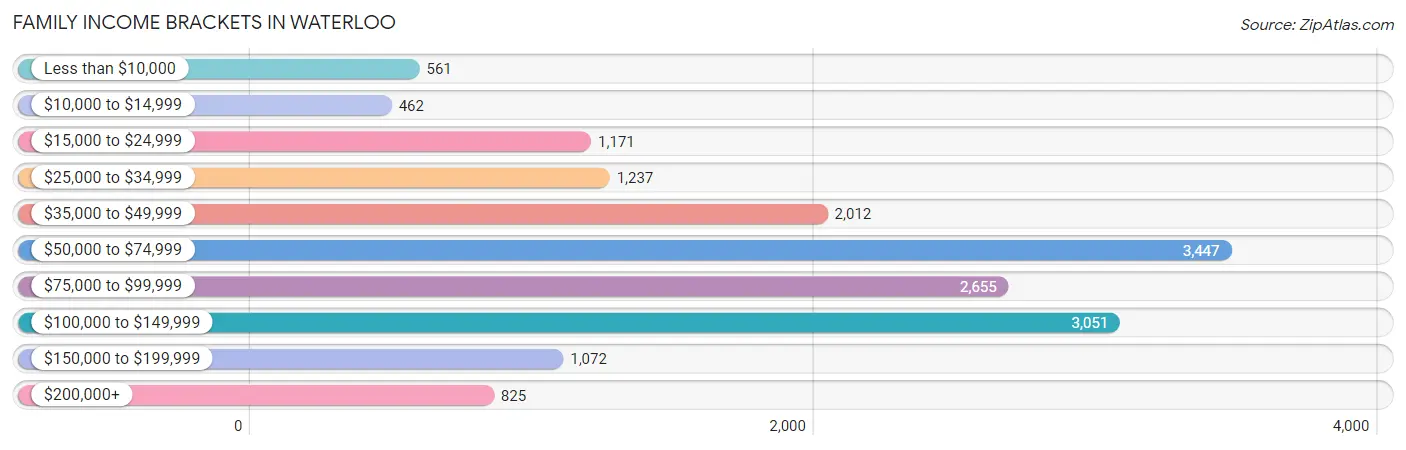
Family Income Brackets in Waterloo
According to the Waterloo family income data, there are 3,447 families falling into the $50,000 to $74,999 income range, which is the most common income bracket and makes up 20.9% of all families. Conversely, the $10,000 to $14,999 income bracket is the least frequent group with only 462 families (2.8%) belonging to this category.
| Income Bracket | # Families | % Families |
| Less than $10,000 | 561 | 3.4% |
| $10,000 to $14,999 | 462 | 2.8% |
| $15,000 to $24,999 | 1,171 | 7.1% |
| $25,000 to $34,999 | 1,237 | 7.5% |
| $35,000 to $49,999 | 2,012 | 12.2% |
| $50,000 to $74,999 | 3,447 | 20.9% |
| $75,000 to $99,999 | 2,655 | 16.1% |
| $100,000 to $149,999 | 3,051 | 18.5% |
| $150,000 to $199,999 | 1,072 | 6.5% |
| $200,000+ | 825 | 5.0% |
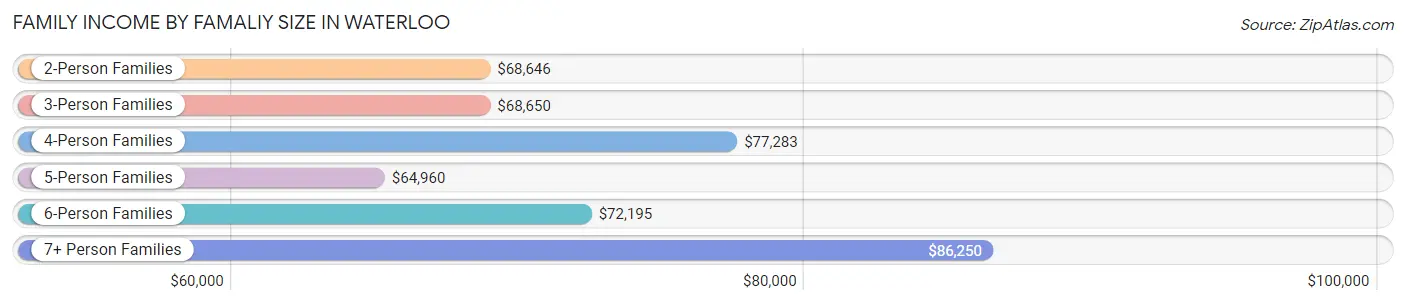
Family Income by Famaliy Size in Waterloo
7+ person families (214 | 1.3%) account for the highest median family income in Waterloo with $86,250 per family, while 2-person families (8,576 | 52.0%) have the highest median income of $34,323 per family member.
| Income Bracket | # Families | Median Income |
| 2-Person Families | 8,576 (52.0%) | $68,646 |
| 3-Person Families | 3,753 (22.8%) | $68,650 |
| 4-Person Families | 2,151 (13.0%) | $77,283 |
| 5-Person Families | 1,083 (6.6%) | $64,960 |
| 6-Person Families | 716 (4.3%) | $72,195 |
| 7+ Person Families | 214 (1.3%) | $86,250 |
| Total | 16,493 (100.0%) | $70,173 |
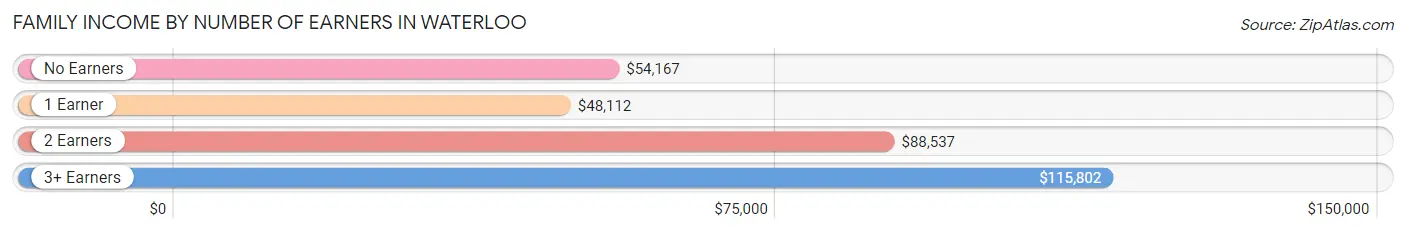
Family Income by Number of Earners in Waterloo
The median family income in Waterloo is $70,173, with families comprising 3+ earners (1,471) having the highest median family income of $115,802, while families with 1 earner (5,370) have the lowest median family income of $48,112, accounting for 8.9% and 32.6% of families, respectively.
| Number of Earners | # Families | Median Income |
| No Earners | 3,028 (18.4%) | $54,167 |
| 1 Earner | 5,370 (32.6%) | $48,112 |
| 2 Earners | 6,624 (40.2%) | $88,537 |
| 3+ Earners | 1,471 (8.9%) | $115,802 |
| Total | 16,493 (100.0%) | $70,173 |
Household Income in Waterloo
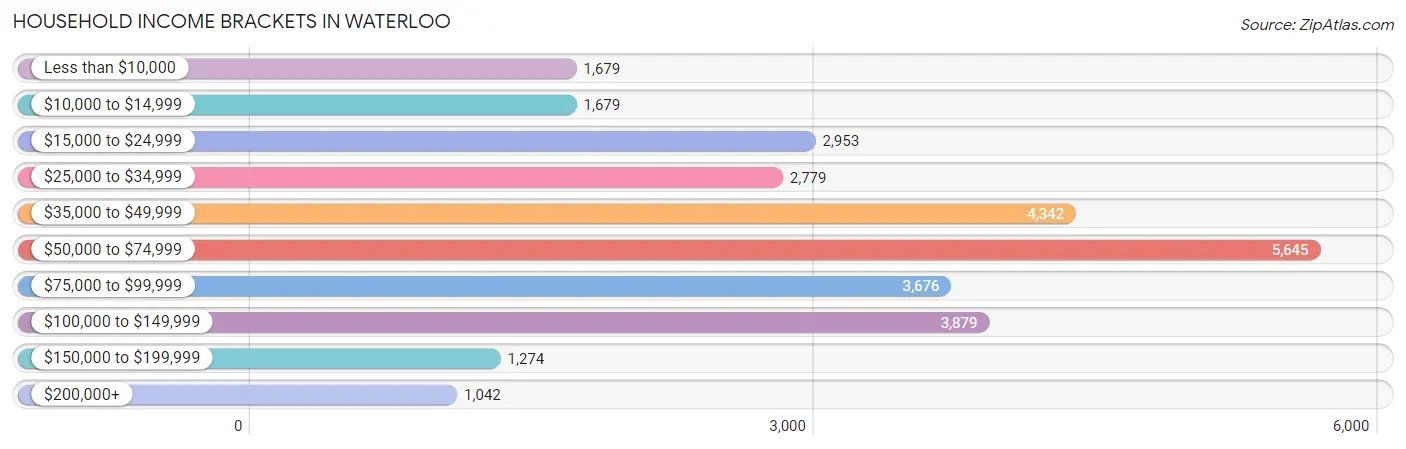
Household Income Brackets in Waterloo
With 5,645 households falling in the category, the $50,000 to $74,999 income range is the most frequent in Waterloo, accounting for 19.5% of all households. In contrast, only 1,042 households (3.6%) fall into the $200,000+ income bracket, making it the least populous group.
| Income Bracket | # Households | % Households |
| Less than $10,000 | 1,679 | 5.8% |
| $10,000 to $14,999 | 1,679 | 5.8% |
| $15,000 to $24,999 | 2,953 | 10.2% |
| $25,000 to $34,999 | 2,779 | 9.6% |
| $35,000 to $49,999 | 4,342 | 15.0% |
| $50,000 to $74,999 | 5,645 | 19.5% |
| $75,000 to $99,999 | 3,676 | 12.7% |
| $100,000 to $149,999 | 3,879 | 13.4% |
| $150,000 to $199,999 | 1,274 | 4.4% |
| $200,000+ | 1,042 | 3.6% |
Household Income by Householder Age in Waterloo
The median household income in Waterloo is $54,104, with the highest median household income of $59,176 found in the 45 to 64 years age bracket for the primary householder. A total of 9,137 households (31.6%) fall into this category. Meanwhile, the 15 to 24 years age bracket for the primary householder has the lowest median household income of $40,718, with 1,836 households (6.3%) in this group.
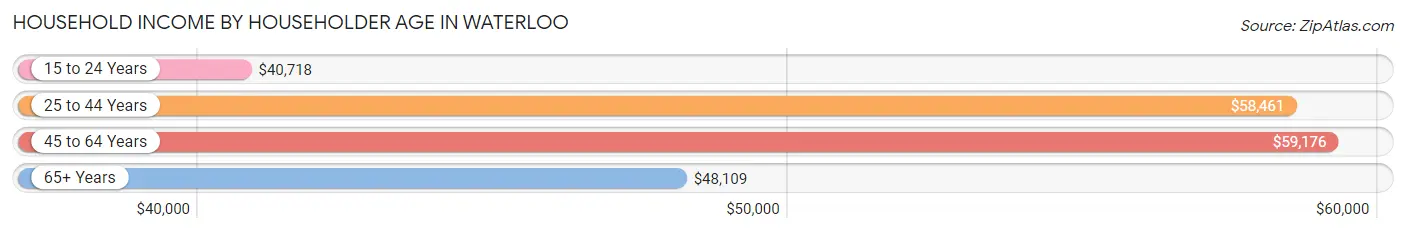
| Income Bracket | # Households | Median Income |
| 15 to 24 Years | 1,836 (6.3%) | $40,718 |
| 25 to 44 Years | 10,284 (35.5%) | $58,461 |
| 45 to 64 Years | 9,137 (31.6%) | $59,176 |
| 65+ Years | 7,690 (26.6%) | $48,109 |
| Total | 28,947 (100.0%) | $54,104 |
Poverty in Waterloo
Income Below Poverty by Sex and Age in Waterloo
With 15.1% poverty level for males and 19.7% for females among the residents of Waterloo, 6 to 11 year old males and 5 year old females are the most vulnerable to poverty, with 743 males (27.1%) and 131 females (48.5%) in their respective age groups living below the poverty level.
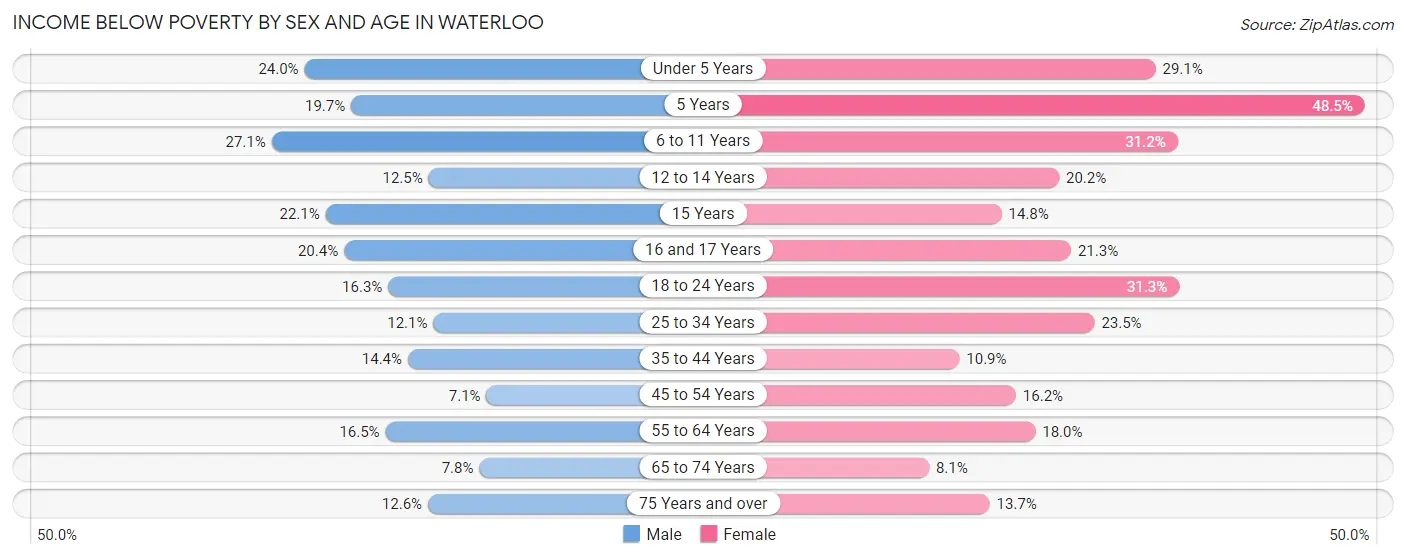
| Age Bracket | Male | Female |
| Under 5 Years | 610 (24.0%) | 650 (29.1%) |
| 5 Years | 92 (19.7%) | 131 (48.5%) |
| 6 to 11 Years | 743 (27.1%) | 785 (31.1%) |
| 12 to 14 Years | 120 (12.5%) | 274 (20.2%) |
| 15 Years | 79 (22.1%) | 74 (14.8%) |
| 16 and 17 Years | 183 (20.4%) | 161 (21.3%) |
| 18 to 24 Years | 570 (16.3%) | 971 (31.3%) |
| 25 to 34 Years | 550 (12.1%) | 1,084 (23.4%) |
| 35 to 44 Years | 635 (14.4%) | 451 (10.9%) |
| 45 to 54 Years | 252 (7.1%) | 564 (16.2%) |
| 55 to 64 Years | 650 (16.5%) | 768 (18.0%) |
| 65 to 74 Years | 246 (7.8%) | 278 (8.1%) |
| 75 Years and over | 228 (12.6%) | 364 (13.7%) |
| Total | 4,958 (15.1%) | 6,555 (19.7%) |
Income Above Poverty by Sex and Age in Waterloo
According to the poverty statistics in Waterloo, males aged 45 to 54 years and females aged 65 to 74 years are the age groups that are most secure financially, with 92.9% of males and 91.9% of females in these age groups living above the poverty line.
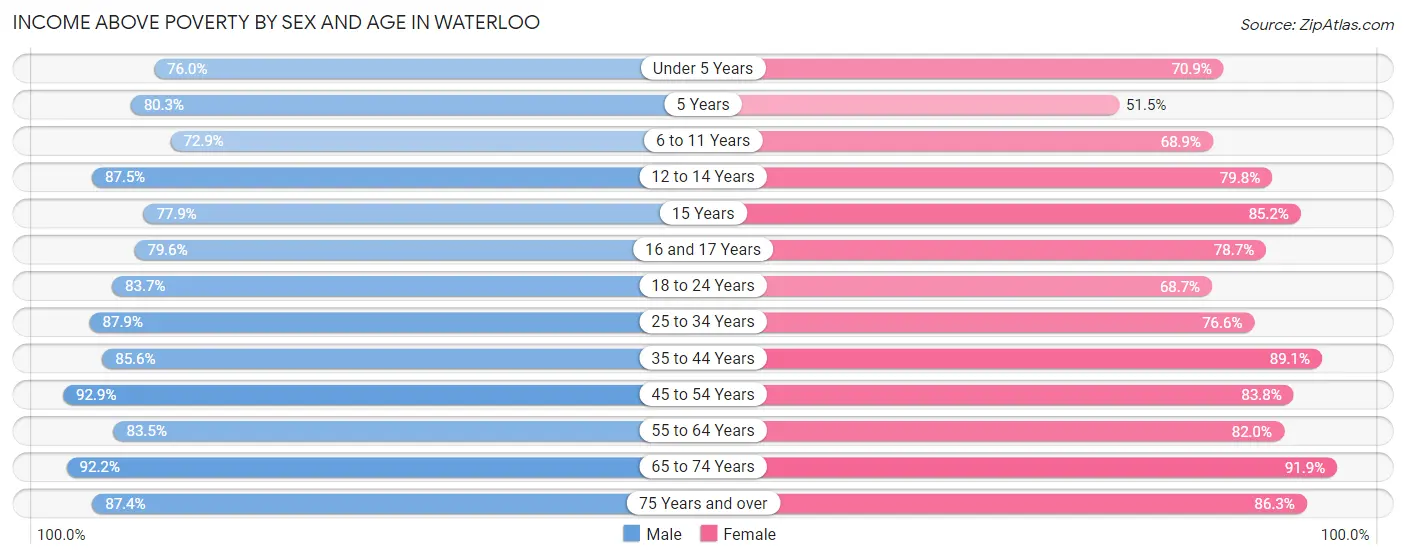
| Age Bracket | Male | Female |
| Under 5 Years | 1,928 (76.0%) | 1,582 (70.9%) |
| 5 Years | 375 (80.3%) | 139 (51.5%) |
| 6 to 11 Years | 2,001 (72.9%) | 1,735 (68.9%) |
| 12 to 14 Years | 839 (87.5%) | 1,085 (79.8%) |
| 15 Years | 279 (77.9%) | 425 (85.2%) |
| 16 and 17 Years | 716 (79.6%) | 596 (78.7%) |
| 18 to 24 Years | 2,935 (83.7%) | 2,131 (68.7%) |
| 25 to 34 Years | 4,007 (87.9%) | 3,539 (76.5%) |
| 35 to 44 Years | 3,767 (85.6%) | 3,683 (89.1%) |
| 45 to 54 Years | 3,278 (92.9%) | 2,926 (83.8%) |
| 55 to 64 Years | 3,286 (83.5%) | 3,507 (82.0%) |
| 65 to 74 Years | 2,906 (92.2%) | 3,158 (91.9%) |
| 75 Years and over | 1,586 (87.4%) | 2,289 (86.3%) |
| Total | 27,903 (84.9%) | 26,795 (80.3%) |
Income Below Poverty Among Married-Couple Families in Waterloo
The poverty statistics for married-couple families in Waterloo show that 5.1% or 560 of the total 10,997 families live below the poverty line. Families with 3 or 4 children have the highest poverty rate of 15.9%, comprising of 175 families. On the other hand, families with 5 or more children have the lowest poverty rate of 0.0%, which includes 0 families.
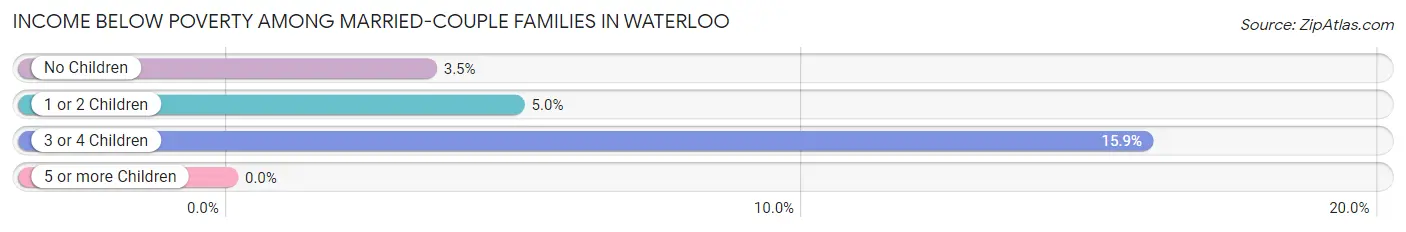
| Children | Above Poverty | Below Poverty |
| No Children | 6,688 (96.5%) | 240 (3.5%) |
| 1 or 2 Children | 2,761 (95.0%) | 145 (5.0%) |
| 3 or 4 Children | 923 (84.1%) | 175 (15.9%) |
| 5 or more Children | 65 (100.0%) | 0 (0.0%) |
| Total | 10,437 (94.9%) | 560 (5.1%) |
Income Below Poverty Among Single-Parent Households in Waterloo
According to the poverty data in Waterloo, 17.2% or 273 single-father households and 31.9% or 1,248 single-mother households are living below the poverty line. Among single-father households, those with 5 or more children have the highest poverty rate, with 11 households (47.8%) experiencing poverty. Likewise, among single-mother households, those with 5 or more children have the highest poverty rate, with 39 households (100.0%) falling below the poverty line.
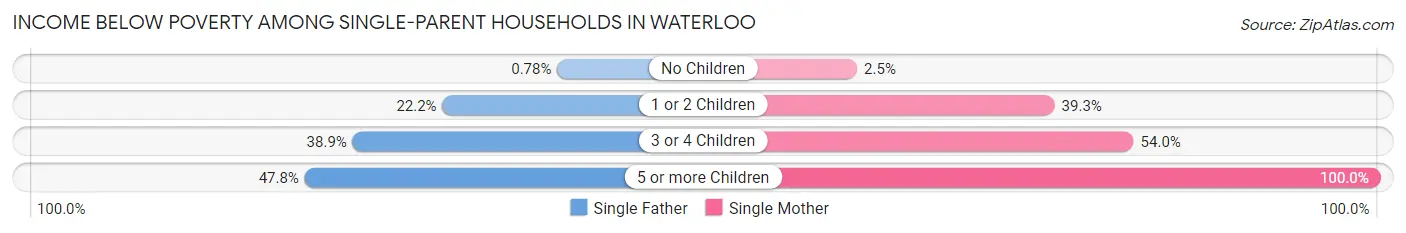
| Children | Single Father | Single Mother |
| No Children | 4 (0.8%) | 28 (2.5%) |
| 1 or 2 Children | 202 (22.2%) | 817 (39.3%) |
| 3 or 4 Children | 56 (38.9%) | 364 (54.0%) |
| 5 or more Children | 11 (47.8%) | 39 (100.0%) |
| Total | 273 (17.2%) | 1,248 (31.9%) |
Income Below Poverty Among Married-Couple vs Single-Parent Households in Waterloo
The poverty data for Waterloo shows that 560 of the married-couple family households (5.1%) and 1,521 of the single-parent households (27.7%) are living below the poverty level. Within the married-couple family households, those with 3 or 4 children have the highest poverty rate, with 175 households (15.9%) falling below the poverty line. Among the single-parent households, those with 5 or more children have the highest poverty rate, with 50 household (80.6%) living below poverty.
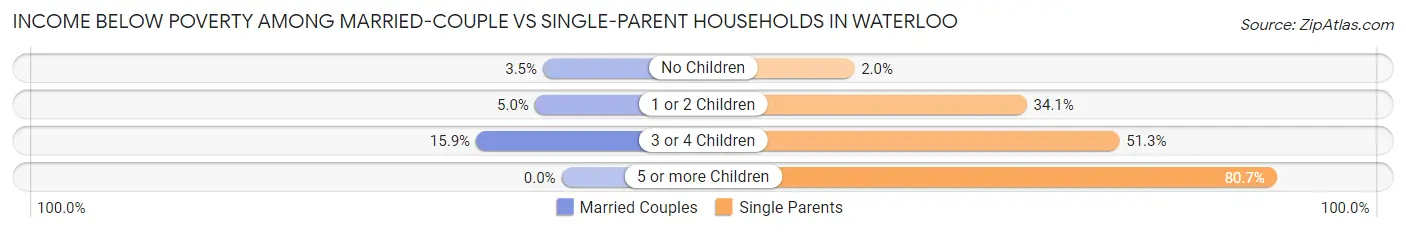
| Children | Married-Couple Families | Single-Parent Households |
| No Children | 240 (3.5%) | 32 (2.0%) |
| 1 or 2 Children | 145 (5.0%) | 1,019 (34.1%) |
| 3 or 4 Children | 175 (15.9%) | 420 (51.3%) |
| 5 or more Children | 0 (0.0%) | 50 (80.6%) |
| Total | 560 (5.1%) | 1,521 (27.7%) |
Race in Waterloo
The most populous races in Waterloo are White / Caucasian (47,499 | 70.6%), Black / African American (11,885 | 17.7%), and Hispanic or Latino (4,793 | 7.1%).
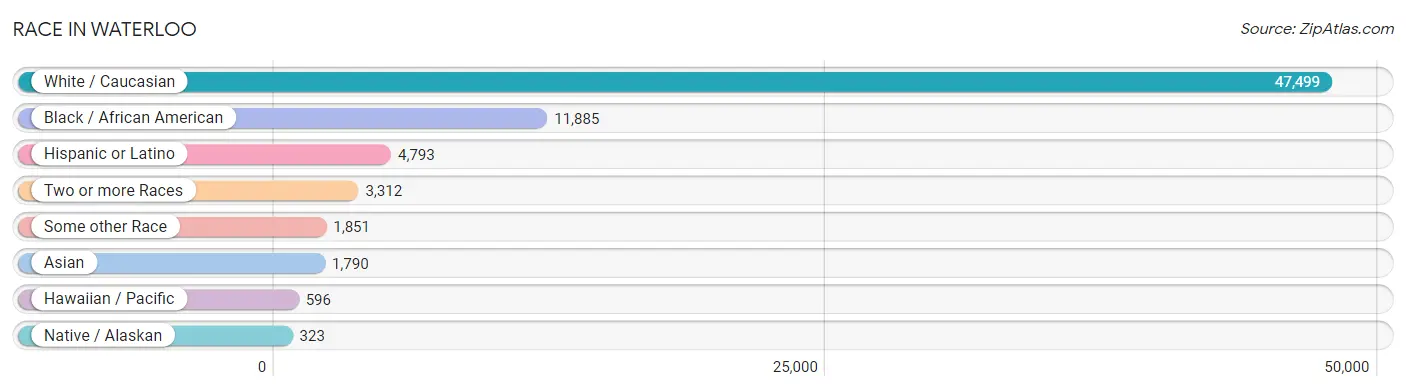
| Race | # Population | % Population |
| Asian | 1,790 | 2.7% |
| Black / African American | 11,885 | 17.7% |
| Hawaiian / Pacific | 596 | 0.9% |
| Hispanic or Latino | 4,793 | 7.1% |
| Native / Alaskan | 323 | 0.5% |
| White / Caucasian | 47,499 | 70.6% |
| Two or more Races | 3,312 | 4.9% |
| Some other Race | 1,851 | 2.8% |
| Total | 67,256 | 100.0% |
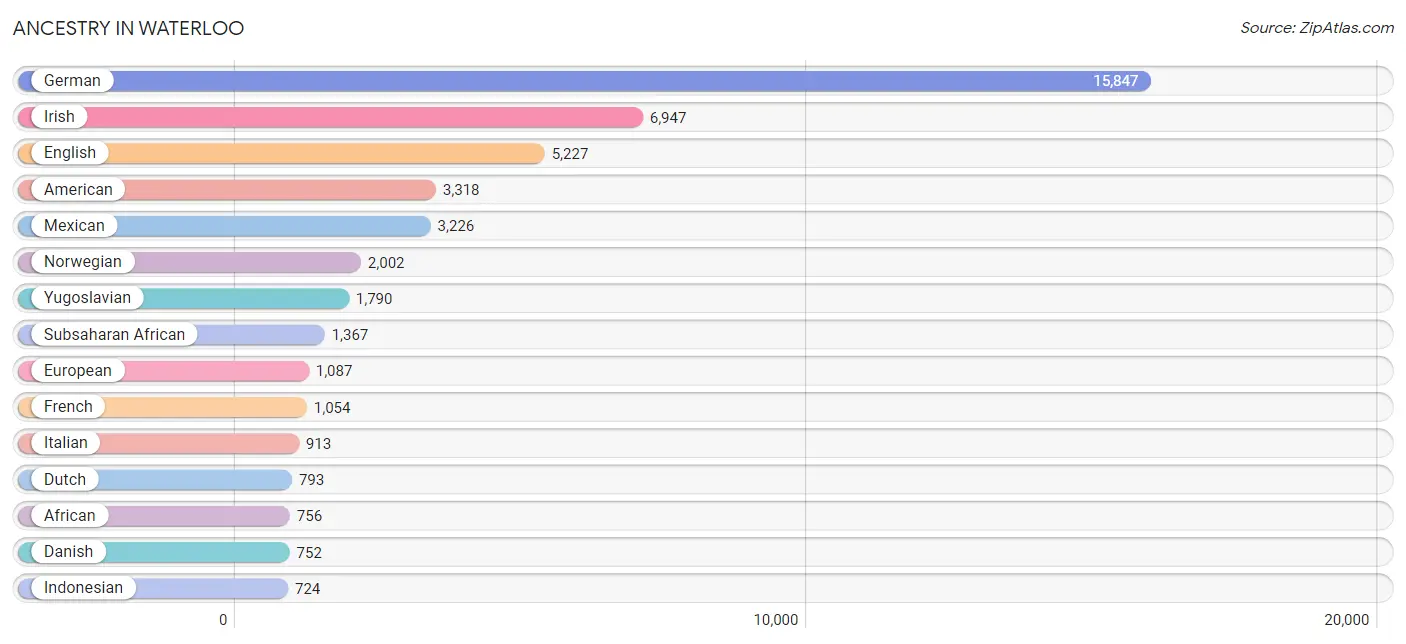
Ancestry in Waterloo
The most populous ancestries reported in Waterloo are German (15,847 | 23.6%), Irish (6,947 | 10.3%), English (5,227 | 7.8%), American (3,318 | 4.9%), and Mexican (3,226 | 4.8%), together accounting for 51.4% of all Waterloo residents.
| Ancestry | # Population | % Population |
| African | 756 | 1.1% |
| Alaskan Athabascan | 10 | 0.0% |
| Albanian | 51 | 0.1% |
| American | 3,318 | 4.9% |
| Apache | 63 | 0.1% |
| Arab | 85 | 0.1% |
| Austrian | 61 | 0.1% |
| Belgian | 145 | 0.2% |
| Bhutanese | 331 | 0.5% |
| Blackfeet | 6 | 0.0% |
| British | 216 | 0.3% |
| Bulgarian | 59 | 0.1% |
| Burmese | 159 | 0.2% |
| Canadian | 33 | 0.1% |
| Central American | 680 | 1.0% |
| Central American Indian | 45 | 0.1% |
| Cherokee | 336 | 0.5% |
| Chippewa | 8 | 0.0% |
| Choctaw | 15 | 0.0% |
| Colombian | 10 | 0.0% |
| Croatian | 53 | 0.1% |
| Cuban | 97 | 0.1% |
| Czech | 680 | 1.0% |
| Czechoslovakian | 102 | 0.2% |
| Danish | 752 | 1.1% |
| Dominican | 121 | 0.2% |
| Dutch | 793 | 1.2% |
| Eastern European | 124 | 0.2% |
| English | 5,227 | 7.8% |
| Ethiopian | 11 | 0.0% |
| European | 1,087 | 1.6% |
| Fijian | 187 | 0.3% |
| Finnish | 46 | 0.1% |
| French | 1,054 | 1.6% |
| French American Indian | 3 | 0.0% |
| French Canadian | 94 | 0.1% |
| German | 15,847 | 23.6% |
| German Russian | 5 | 0.0% |
| Ghanaian | 5 | 0.0% |
| Greek | 65 | 0.1% |
| Guamanian / Chamorro | 56 | 0.1% |
| Guatemalan | 401 | 0.6% |
| Haitian | 143 | 0.2% |
| Honduran | 55 | 0.1% |
| Hungarian | 34 | 0.1% |
| Indian (Asian) | 265 | 0.4% |
| Indonesian | 724 | 1.1% |
| Inupiat | 149 | 0.2% |
| Iranian | 77 | 0.1% |
| Irish | 6,947 | 10.3% |
| Italian | 913 | 1.4% |
| Jamaican | 49 | 0.1% |
| Japanese | 16 | 0.0% |
| Korean | 159 | 0.2% |
| Liberian | 254 | 0.4% |
| Luxembourger | 95 | 0.1% |
| Malaysian | 148 | 0.2% |
| Mexican | 3,226 | 4.8% |
| Mexican American Indian | 164 | 0.2% |
| Moroccan | 85 | 0.1% |
| Native Hawaiian | 8 | 0.0% |
| Navajo | 9 | 0.0% |
| Northern European | 25 | 0.0% |
| Norwegian | 2,002 | 3.0% |
| Paiute | 6 | 0.0% |
| Pakistani | 335 | 0.5% |
| Pennsylvania German | 10 | 0.0% |
| Peruvian | 129 | 0.2% |
| Polish | 353 | 0.5% |
| Puerto Rican | 423 | 0.6% |
| Puget Sound Salish | 7 | 0.0% |
| Russian | 69 | 0.1% |
| Salvadoran | 224 | 0.3% |
| Scandinavian | 174 | 0.3% |
| Scotch-Irish | 463 | 0.7% |
| Scottish | 668 | 1.0% |
| Seminole | 2 | 0.0% |
| Serbian | 75 | 0.1% |
| Sioux | 59 | 0.1% |
| Slavic | 73 | 0.1% |
| Somali | 15 | 0.0% |
| South African | 46 | 0.1% |
| South American | 139 | 0.2% |
| Spaniard | 24 | 0.0% |
| Spanish | 31 | 0.1% |
| Sri Lankan | 156 | 0.2% |
| Subsaharan African | 1,367 | 2.0% |
| Sudanese | 21 | 0.0% |
| Swedish | 697 | 1.0% |
| Swiss | 182 | 0.3% |
| Thai | 144 | 0.2% |
| Trinidadian and Tobagonian | 22 | 0.0% |
| Welsh | 353 | 0.5% |
| Yaqui | 7 | 0.0% |
| Yugoslavian | 1,790 | 2.7% | View All 95 Rows |
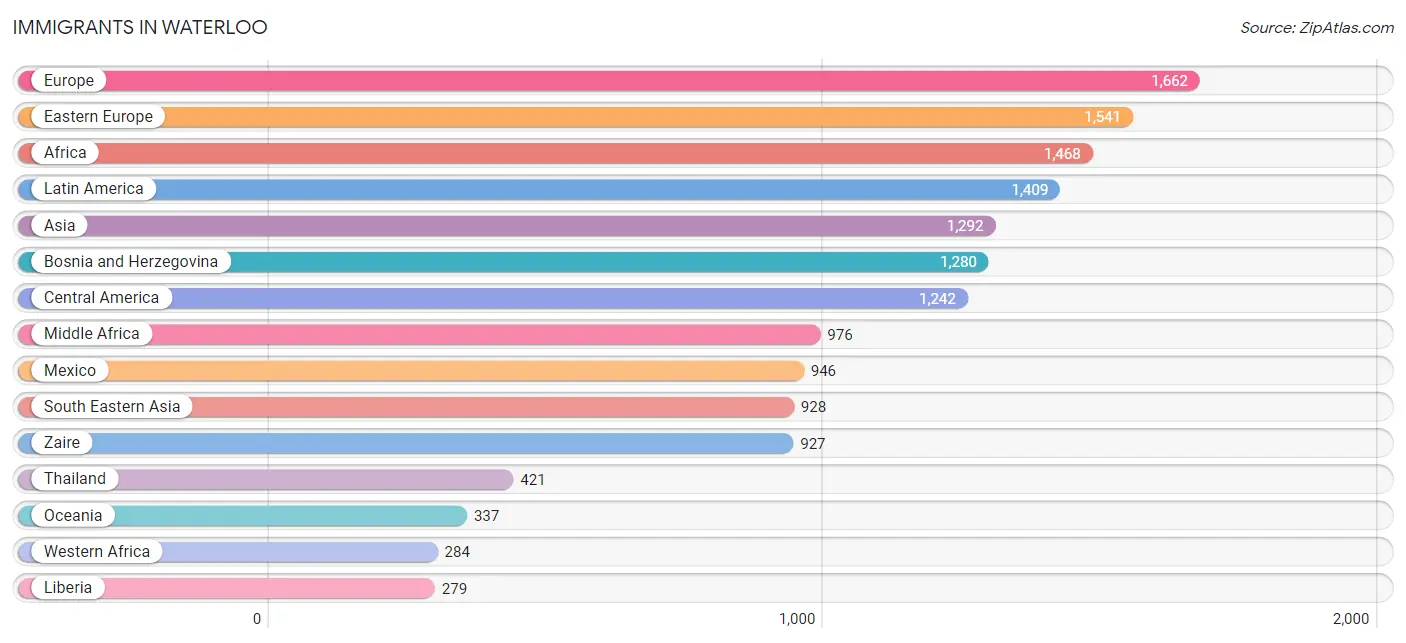
Immigrants in Waterloo
The most numerous immigrant groups reported in Waterloo came from Europe (1,662 | 2.5%), Eastern Europe (1,541 | 2.3%), Africa (1,468 | 2.2%), Latin America (1,409 | 2.1%), and Asia (1,292 | 1.9%), together accounting for 11.0% of all Waterloo residents.
| Immigration Origin | # Population | % Population |
| Africa | 1,468 | 2.2% |
| Albania | 7 | 0.0% |
| Argentina | 5 | 0.0% |
| Asia | 1,292 | 1.9% |
| Austria | 9 | 0.0% |
| Belgium | 14 | 0.0% |
| Bosnia and Herzegovina | 1,280 | 1.9% |
| Bulgaria | 30 | 0.0% |
| Canada | 67 | 0.1% |
| Caribbean | 111 | 0.2% |
| Central America | 1,242 | 1.8% |
| China | 111 | 0.2% |
| Congo | 49 | 0.1% |
| Croatia | 45 | 0.1% |
| Denmark | 20 | 0.0% |
| Eastern Africa | 47 | 0.1% |
| Eastern Asia | 203 | 0.3% |
| Eastern Europe | 1,541 | 2.3% |
| El Salvador | 139 | 0.2% |
| Ethiopia | 11 | 0.0% |
| Europe | 1,662 | 2.5% |
| Germany | 56 | 0.1% |
| Ghana | 5 | 0.0% |
| Guatemala | 108 | 0.2% |
| Haiti | 99 | 0.2% |
| Honduras | 49 | 0.1% |
| India | 103 | 0.2% |
| Iran | 31 | 0.1% |
| Jamaica | 12 | 0.0% |
| Kenya | 12 | 0.0% |
| Korea | 92 | 0.1% |
| Laos | 5 | 0.0% |
| Latin America | 1,409 | 2.1% |
| Liberia | 279 | 0.4% |
| Malaysia | 24 | 0.0% |
| Mexico | 946 | 1.4% |
| Micronesia | 270 | 0.4% |
| Middle Africa | 976 | 1.5% |
| Morocco | 61 | 0.1% |
| Netherlands | 3 | 0.0% |
| Northern Africa | 61 | 0.1% |
| Northern Europe | 39 | 0.1% |
| Oceania | 337 | 0.5% |
| Pakistan | 27 | 0.0% |
| Peru | 51 | 0.1% |
| Philippines | 7 | 0.0% |
| Poland | 22 | 0.0% |
| Russia | 46 | 0.1% |
| Serbia | 58 | 0.1% |
| Somalia | 15 | 0.0% |
| South Africa | 46 | 0.1% |
| South America | 56 | 0.1% |
| South Central Asia | 161 | 0.2% |
| South Eastern Asia | 928 | 1.4% |
| Thailand | 421 | 0.6% |
| Vietnam | 64 | 0.1% |
| Western Africa | 284 | 0.4% |
| Western Europe | 82 | 0.1% |
| Zaire | 927 | 1.4% | View All 59 Rows |
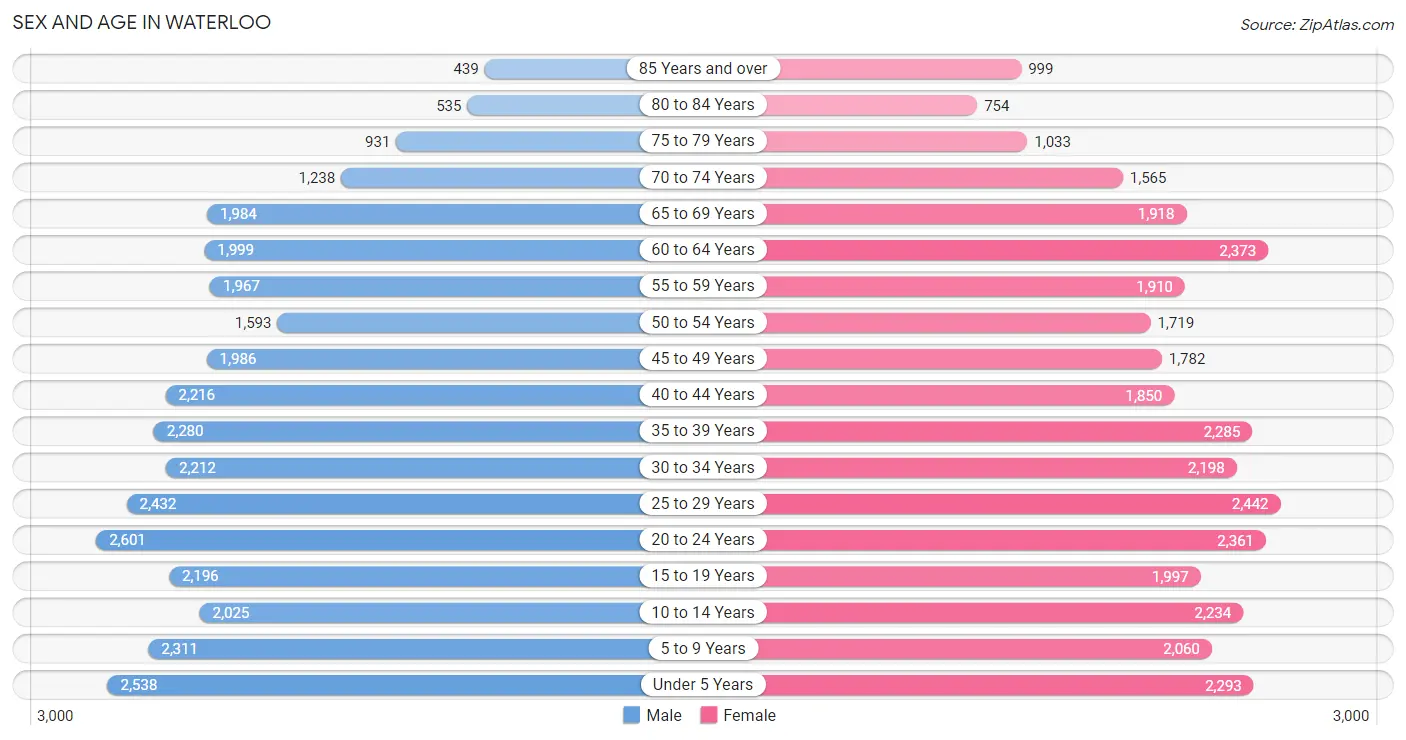
Sex and Age in Waterloo
Sex and Age in Waterloo
The most populous age groups in Waterloo are 20 to 24 Years (2,601 | 7.8%) for men and 25 to 29 Years (2,442 | 7.2%) for women.
| Age Bracket | Male | Female |
| Under 5 Years | 2,538 (7.6%) | 2,293 (6.8%) |
| 5 to 9 Years | 2,311 (6.9%) | 2,060 (6.1%) |
| 10 to 14 Years | 2,025 (6.0%) | 2,234 (6.6%) |
| 15 to 19 Years | 2,196 (6.6%) | 1,997 (5.9%) |
| 20 to 24 Years | 2,601 (7.8%) | 2,361 (7.0%) |
| 25 to 29 Years | 2,432 (7.3%) | 2,442 (7.2%) |
| 30 to 34 Years | 2,212 (6.6%) | 2,198 (6.5%) |
| 35 to 39 Years | 2,280 (6.8%) | 2,285 (6.8%) |
| 40 to 44 Years | 2,216 (6.6%) | 1,850 (5.5%) |
| 45 to 49 Years | 1,986 (5.9%) | 1,782 (5.3%) |
| 50 to 54 Years | 1,593 (4.8%) | 1,719 (5.1%) |
| 55 to 59 Years | 1,967 (5.9%) | 1,910 (5.7%) |
| 60 to 64 Years | 1,999 (6.0%) | 2,373 (7.0%) |
| 65 to 69 Years | 1,984 (5.9%) | 1,918 (5.7%) |
| 70 to 74 Years | 1,238 (3.7%) | 1,565 (4.6%) |
| 75 to 79 Years | 931 (2.8%) | 1,033 (3.1%) |
| 80 to 84 Years | 535 (1.6%) | 754 (2.2%) |
| 85 Years and over | 439 (1.3%) | 999 (3.0%) |
| Total | 33,483 (100.0%) | 33,773 (100.0%) |
Families and Households in Waterloo
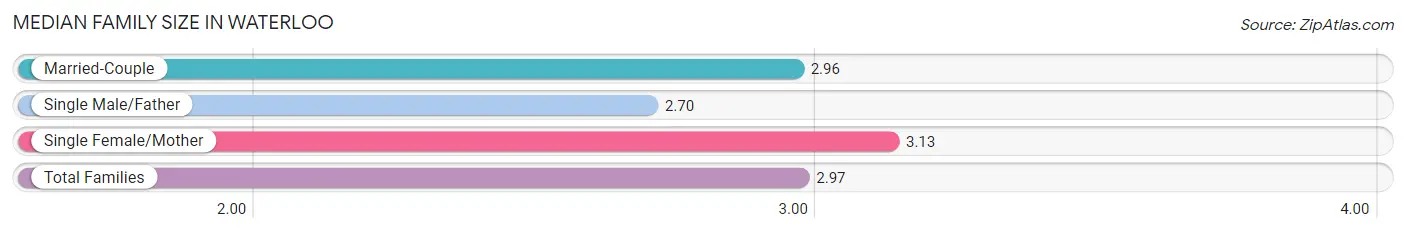
Median Family Size in Waterloo
The median family size in Waterloo is 2.97 persons per family, with single female/mother families (3,908 | 23.7%) accounting for the largest median family size of 3.13 persons per family. On the other hand, single male/father families (1,588 | 9.6%) represent the smallest median family size with 2.70 persons per family.
| Family Type | # Families | Family Size |
| Married-Couple | 10,997 (66.7%) | 2.96 |
| Single Male/Father | 1,588 (9.6%) | 2.70 |
| Single Female/Mother | 3,908 (23.7%) | 3.13 |
| Total Families | 16,493 (100.0%) | 2.97 |
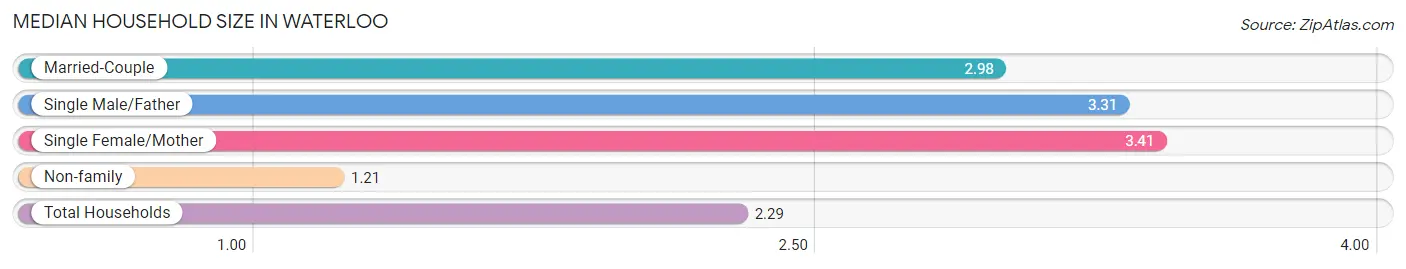
Median Household Size in Waterloo
The median household size in Waterloo is 2.29 persons per household, with single female/mother households (3,908 | 13.5%) accounting for the largest median household size of 3.41 persons per household. non-family households (12,454 | 43.0%) represent the smallest median household size with 1.21 persons per household.
| Household Type | # Households | Household Size |
| Married-Couple | 10,997 (38.0%) | 2.98 |
| Single Male/Father | 1,588 (5.5%) | 3.31 |
| Single Female/Mother | 3,908 (13.5%) | 3.41 |
| Non-family | 12,454 (43.0%) | 1.21 |
| Total Households | 28,947 (100.0%) | 2.29 |
Household Size by Marriage Status in Waterloo
Out of a total of 28,947 households in Waterloo, 16,493 (57.0%) are family households, while 12,454 (43.0%) are nonfamily households. The most numerous type of family households are 2-person households, comprising 7,552, and the most common type of nonfamily households are 1-person households, comprising 10,358.
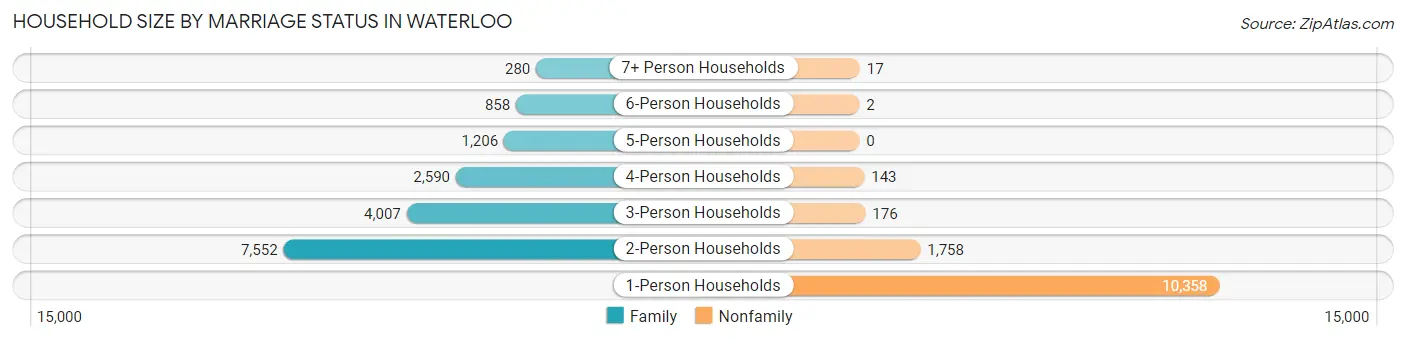
| Household Size | Family Households | Nonfamily Households |
| 1-Person Households | - | 10,358 (35.8%) |
| 2-Person Households | 7,552 (26.1%) | 1,758 (6.1%) |
| 3-Person Households | 4,007 (13.8%) | 176 (0.6%) |
| 4-Person Households | 2,590 (8.9%) | 143 (0.5%) |
| 5-Person Households | 1,206 (4.2%) | 0 (0.0%) |
| 6-Person Households | 858 (3.0%) | 2 (0.0%) |
| 7+ Person Households | 280 (1.0%) | 17 (0.1%) |
| Total | 16,493 (57.0%) | 12,454 (43.0%) |
Female Fertility in Waterloo
Fertility by Age in Waterloo
Average fertility rate in Waterloo is 73.0 births per 1,000 women. Women in the age bracket of 20 to 34 years have the highest fertility rate with 116.0 births per 1,000 women. Women in the age bracket of 20 to 34 years acount for 73.0% of all women with births.
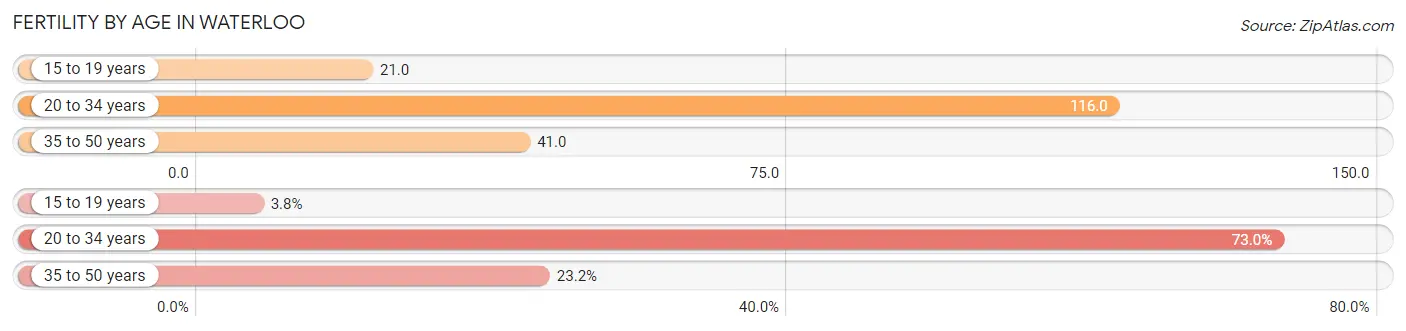
| Age Bracket | Women with Births | Births / 1,000 Women |
| 15 to 19 years | 42 (3.8%) | 21.0 |
| 20 to 34 years | 812 (73.0%) | 116.0 |
| 35 to 50 years | 258 (23.2%) | 41.0 |
| Total | 1,112 (100.0%) | 73.0 |
Fertility by Age by Marriage Status in Waterloo
46.3% of women with births (1,112) in Waterloo are married. The highest percentage of unmarried women with births falls into 15 to 19 years age bracket with 80.9% of them unmarried at the time of birth, while the lowest percentage of unmarried women with births belong to 35 to 50 years age bracket with 29.1% of them unmarried.
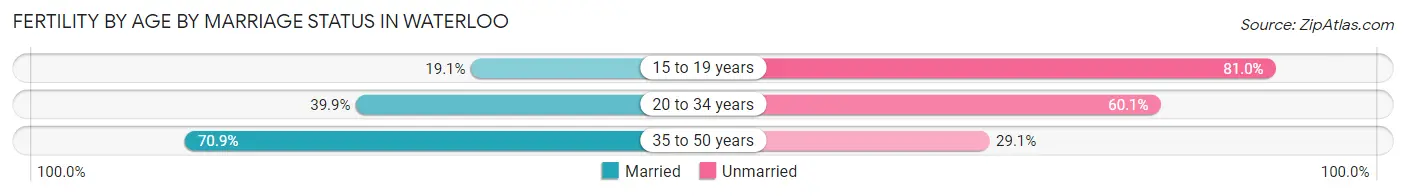
| Age Bracket | Married | Unmarried |
| 15 to 19 years | 8 (19.1%) | 34 (80.9%) |
| 20 to 34 years | 324 (39.9%) | 488 (60.1%) |
| 35 to 50 years | 183 (70.9%) | 75 (29.1%) |
| Total | 515 (46.3%) | 597 (53.7%) |
Fertility by Education in Waterloo
Average fertility rate in Waterloo is 73.0 births per 1,000 women. Women with the education attainment of high school diploma have the highest fertility rate of 106.0 births per 1,000 women, while women with the education attainment of college or associate's degree have the lowest fertility at 48.0 births per 1,000 women. Women with the education attainment of high school diploma represent 34.4% of all women with births.
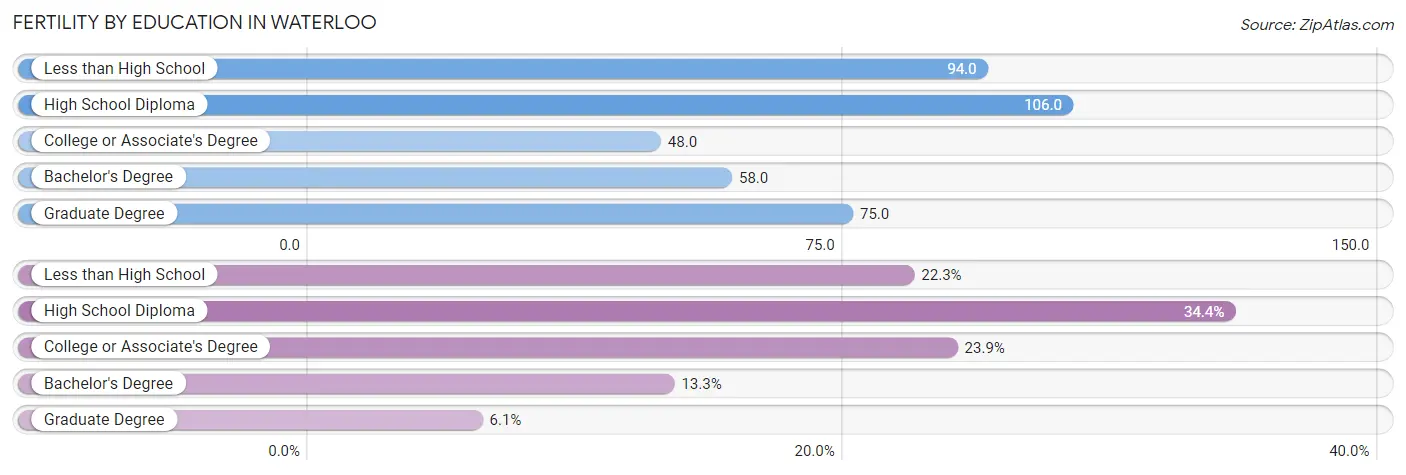
| Educational Attainment | Women with Births | Births / 1,000 Women |
| Less than High School | 248 (22.3%) | 94.0 |
| High School Diploma | 382 (34.4%) | 106.0 |
| College or Associate's Degree | 266 (23.9%) | 48.0 |
| Bachelor's Degree | 148 (13.3%) | 58.0 |
| Graduate Degree | 68 (6.1%) | 75.0 |
| Total | 1,112 (100.0%) | 73.0 |
Fertility by Education by Marriage Status in Waterloo
53.7% of women with births in Waterloo are unmarried. Women with the educational attainment of graduate degree are most likely to be married with 100.0% of them married at childbirth, while women with the educational attainment of high school diploma are least likely to be married with 80.1% of them unmarried at childbirth.
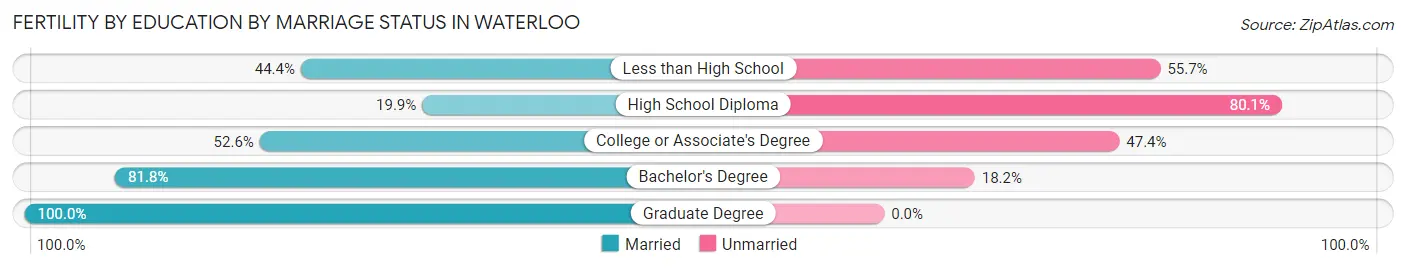
| Educational Attainment | Married | Unmarried |
| Less than High School | 110 (44.4%) | 138 (55.6%) |
| High School Diploma | 76 (19.9%) | 306 (80.1%) |
| College or Associate's Degree | 140 (52.6%) | 126 (47.4%) |
| Bachelor's Degree | 121 (81.8%) | 27 (18.2%) |
| Graduate Degree | 68 (100.0%) | 0 (0.0%) |
| Total | 515 (46.3%) | 597 (53.7%) |
Employment Characteristics in Waterloo
Employment by Class of Employer in Waterloo
Among the 31,390 employed individuals in Waterloo, private company employees (23,544 | 75.0%), not-for-profit organizations (3,265 | 10.4%), and local government employees (1,621 | 5.2%) make up the most common classes of employment.
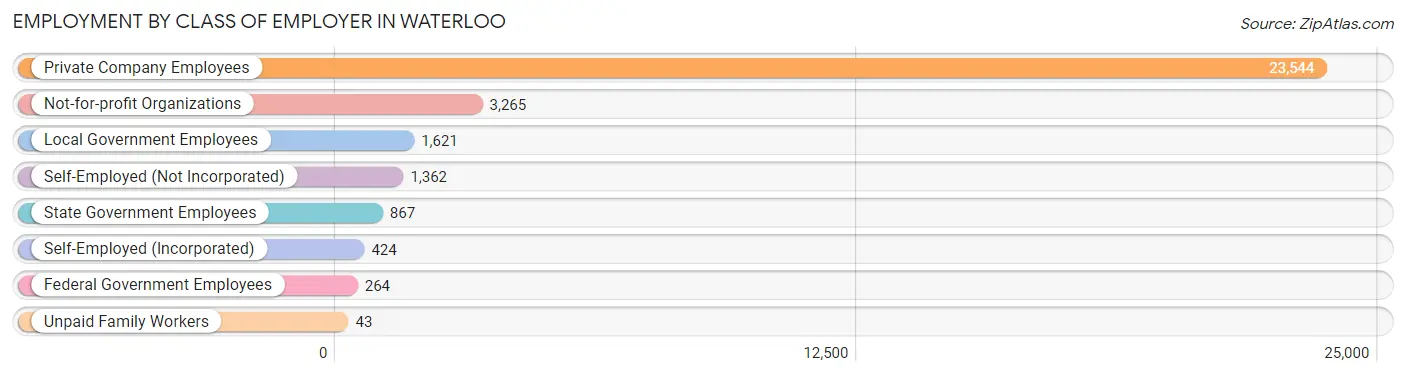
| Employer Class | # Employees | % Employees |
| Private Company Employees | 23,544 | 75.0% |
| Self-Employed (Incorporated) | 424 | 1.3% |
| Self-Employed (Not Incorporated) | 1,362 | 4.3% |
| Not-for-profit Organizations | 3,265 | 10.4% |
| Local Government Employees | 1,621 | 5.2% |
| State Government Employees | 867 | 2.8% |
| Federal Government Employees | 264 | 0.8% |
| Unpaid Family Workers | 43 | 0.1% |
| Total | 31,390 | 100.0% |
Employment Status by Age in Waterloo
According to the labor force statistics for Waterloo, out of the total population over 16 years of age (52,938), 65.2% or 34,516 individuals are in the labor force, with 7.1% or 2,451 of them unemployed. The age group with the highest labor force participation rate is 25 to 29 years, with 91.6% or 4,465 individuals in the labor force. Within the labor force, the 16 to 19 years age range has the highest percentage of unemployed individuals, with 22.0% or 471 of them being unemployed.
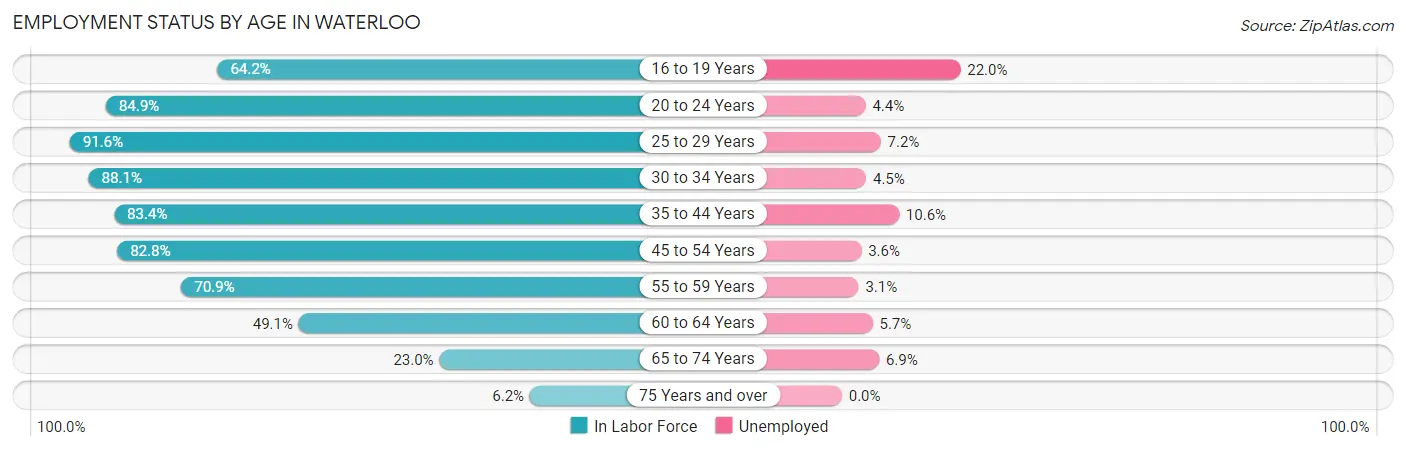
| Age Bracket | In Labor Force | Unemployed |
| 16 to 19 Years | 2,142 (64.2%) | 471 (22.0%) |
| 20 to 24 Years | 4,213 (84.9%) | 185 (4.4%) |
| 25 to 29 Years | 4,465 (91.6%) | 321 (7.2%) |
| 30 to 34 Years | 3,885 (88.1%) | 175 (4.5%) |
| 35 to 44 Years | 7,198 (83.4%) | 763 (10.6%) |
| 45 to 54 Years | 5,862 (82.8%) | 211 (3.6%) |
| 55 to 59 Years | 2,749 (70.9%) | 85 (3.1%) |
| 60 to 64 Years | 2,147 (49.1%) | 122 (5.7%) |
| 65 to 74 Years | 1,542 (23.0%) | 106 (6.9%) |
| 75 Years and over | 291 (6.2%) | 0 (0.0%) |
| Total | 34,516 (65.2%) | 2,451 (7.1%) |
Employment Status by Educational Attainment in Waterloo
According to labor force statistics for Waterloo, 79.1% of individuals (26,296) out of the total population between 25 and 64 years of age (33,244) are in the labor force, with 6.4% or 1,683 of them being unemployed. The group with the highest labor force participation rate are those with the educational attainment of bachelor's degree or higher, with 90.0% or 7,217 individuals in the labor force. Within the labor force, individuals with high school diploma education have the highest percentage of unemployment, with 9.6% or 722 of them being unemployed.
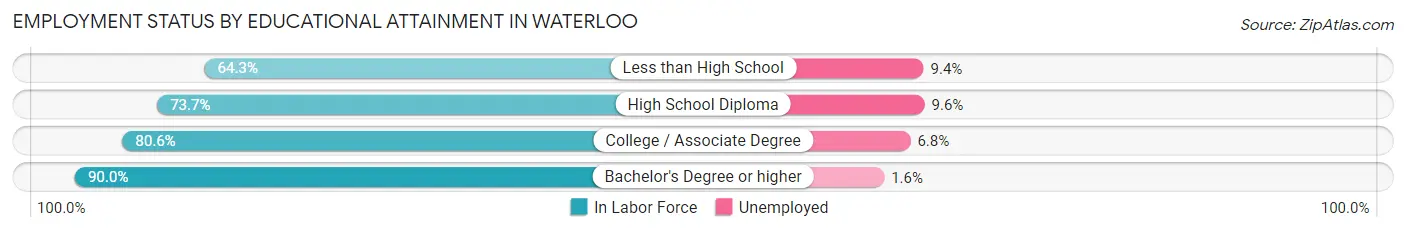
| Educational Attainment | In Labor Force | Unemployed |
| Less than High School | 2,096 (64.3%) | 306 (9.4%) |
| High School Diploma | 7,519 (73.7%) | 979 (9.6%) |
| College / Associate Degree | 9,482 (80.6%) | 800 (6.8%) |
| Bachelor's Degree or higher | 7,217 (90.0%) | 128 (1.6%) |
| Total | 26,296 (79.1%) | 2,128 (6.4%) |
Employment Occupations by Sex in Waterloo
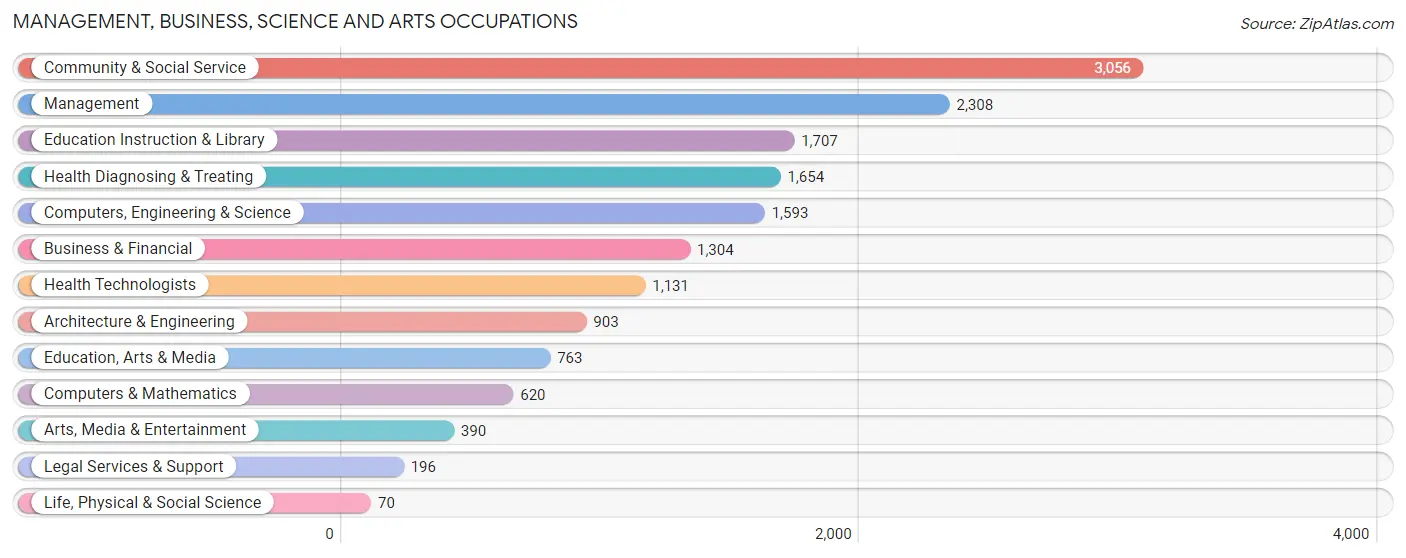
Management, Business, Science and Arts Occupations
The most common Management, Business, Science and Arts occupations in Waterloo are Community & Social Service (3,056 | 9.5%), Management (2,308 | 7.2%), Education Instruction & Library (1,707 | 5.3%), Health Diagnosing & Treating (1,654 | 5.2%), and Computers, Engineering & Science (1,593 | 5.0%).
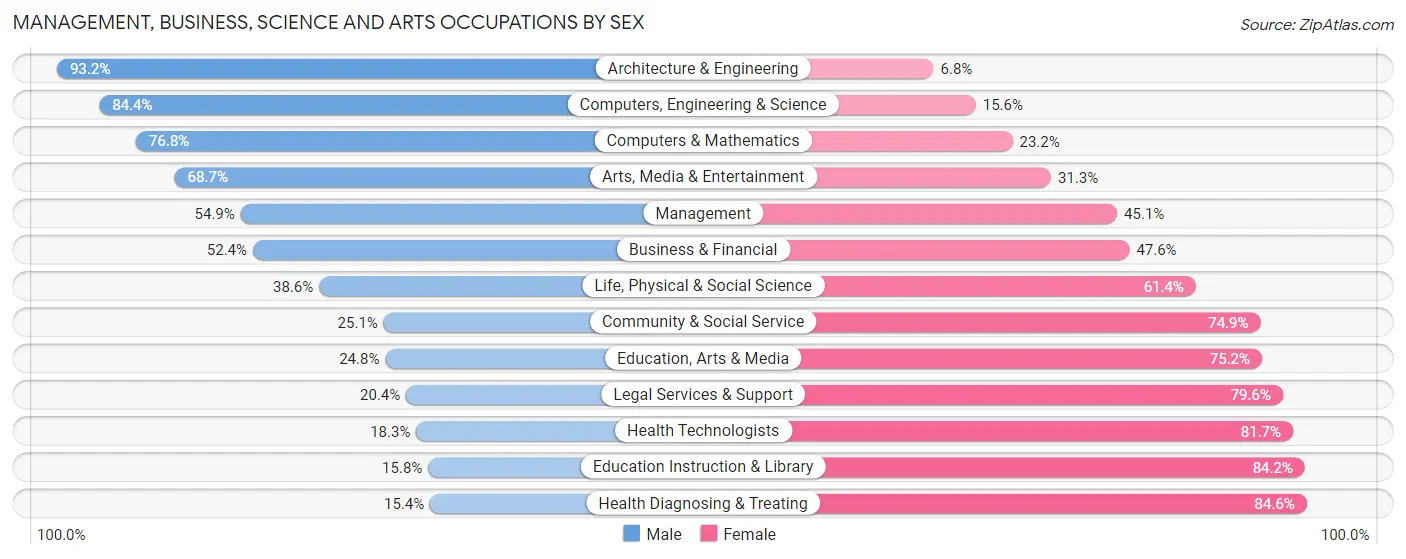
Management, Business, Science and Arts Occupations by Sex
Within the Management, Business, Science and Arts occupations in Waterloo, the most male-oriented occupations are Architecture & Engineering (93.2%), Computers, Engineering & Science (84.4%), and Computers & Mathematics (76.8%), while the most female-oriented occupations are Health Diagnosing & Treating (84.6%), Education Instruction & Library (84.2%), and Health Technologists (81.7%).
| Occupation | Male | Female |
| Management | 1,268 (54.9%) | 1,040 (45.1%) |
| Business & Financial | 683 (52.4%) | 621 (47.6%) |
| Computers, Engineering & Science | 1,345 (84.4%) | 248 (15.6%) |
| Computers & Mathematics | 476 (76.8%) | 144 (23.2%) |
| Architecture & Engineering | 842 (93.2%) | 61 (6.8%) |
| Life, Physical & Social Science | 27 (38.6%) | 43 (61.4%) |
| Community & Social Service | 767 (25.1%) | 2,289 (74.9%) |
| Education, Arts & Media | 189 (24.8%) | 574 (75.2%) |
| Legal Services & Support | 40 (20.4%) | 156 (79.6%) |
| Education Instruction & Library | 270 (15.8%) | 1,437 (84.2%) |
| Arts, Media & Entertainment | 268 (68.7%) | 122 (31.3%) |
| Health Diagnosing & Treating | 255 (15.4%) | 1,399 (84.6%) |
| Health Technologists | 207 (18.3%) | 924 (81.7%) |
| Total (Category) | 4,318 (43.5%) | 5,597 (56.5%) |
| Total (Overall) | 16,760 (52.3%) | 15,275 (47.7%) |
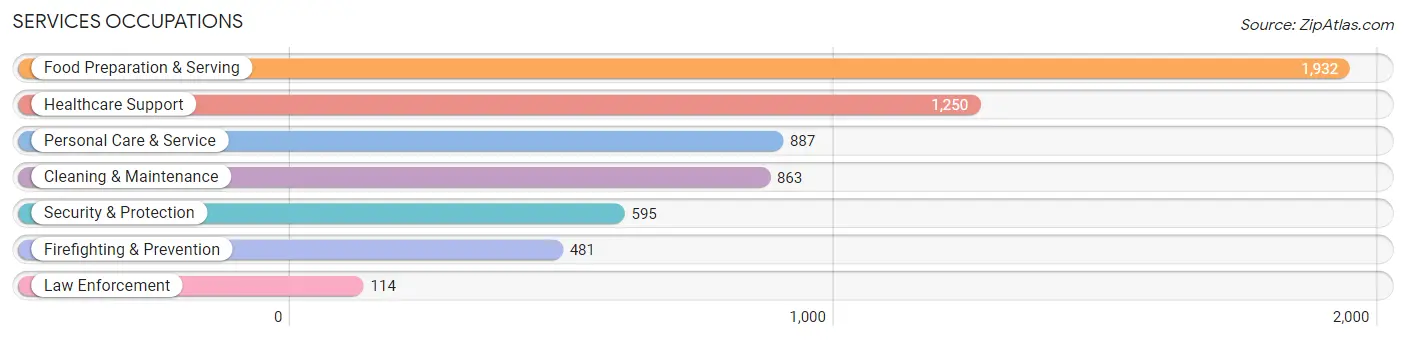
Services Occupations
The most common Services occupations in Waterloo are Food Preparation & Serving (1,932 | 6.0%), Healthcare Support (1,250 | 3.9%), Personal Care & Service (887 | 2.8%), Cleaning & Maintenance (863 | 2.7%), and Security & Protection (595 | 1.9%).
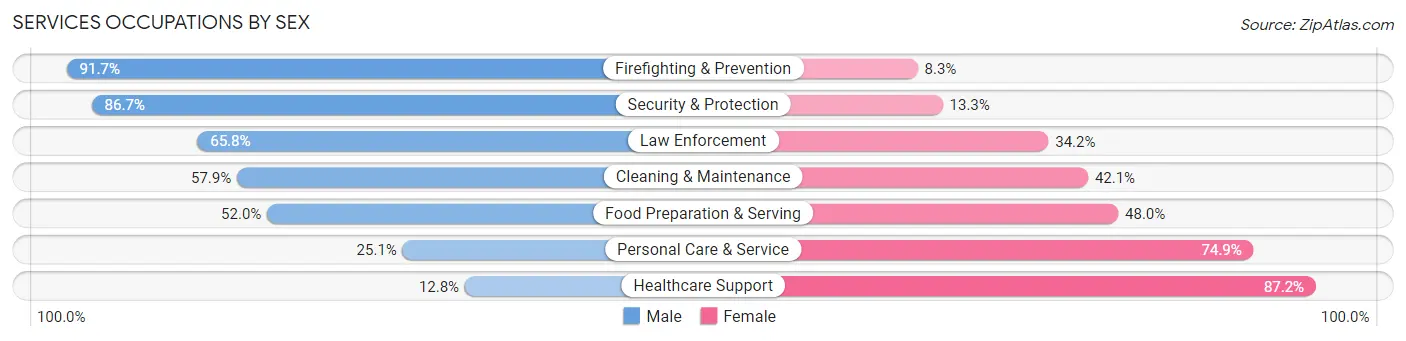
Services Occupations by Sex
Within the Services occupations in Waterloo, the most male-oriented occupations are Firefighting & Prevention (91.7%), Security & Protection (86.7%), and Law Enforcement (65.8%), while the most female-oriented occupations are Healthcare Support (87.2%), Personal Care & Service (74.9%), and Food Preparation & Serving (48.0%).
| Occupation | Male | Female |
| Healthcare Support | 160 (12.8%) | 1,090 (87.2%) |
| Security & Protection | 516 (86.7%) | 79 (13.3%) |
| Firefighting & Prevention | 441 (91.7%) | 40 (8.3%) |
| Law Enforcement | 75 (65.8%) | 39 (34.2%) |
| Food Preparation & Serving | 1,004 (52.0%) | 928 (48.0%) |
| Cleaning & Maintenance | 500 (57.9%) | 363 (42.1%) |
| Personal Care & Service | 223 (25.1%) | 664 (74.9%) |
| Total (Category) | 2,403 (43.5%) | 3,124 (56.5%) |
| Total (Overall) | 16,760 (52.3%) | 15,275 (47.7%) |
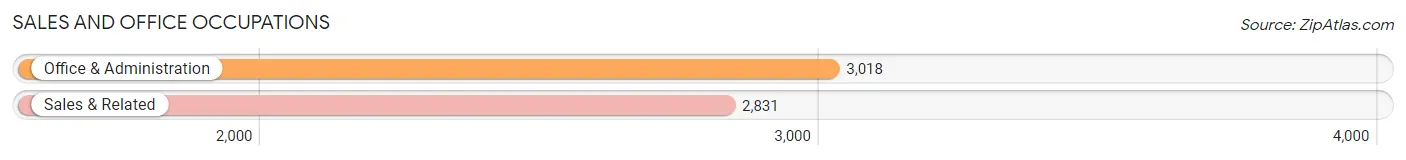
Sales and Office Occupations
The most common Sales and Office occupations in Waterloo are Office & Administration (3,018 | 9.4%), and Sales & Related (2,831 | 8.8%).
Sales and Office Occupations by Sex
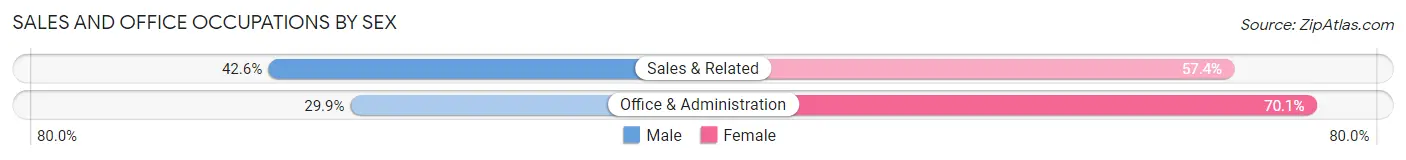
| Occupation | Male | Female |
| Sales & Related | 1,205 (42.6%) | 1,626 (57.4%) |
| Office & Administration | 902 (29.9%) | 2,116 (70.1%) |
| Total (Category) | 2,107 (36.0%) | 3,742 (64.0%) |
| Total (Overall) | 16,760 (52.3%) | 15,275 (47.7%) |
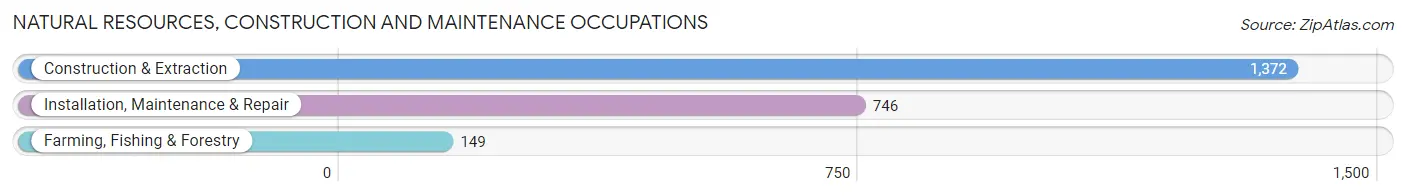
Natural Resources, Construction and Maintenance Occupations
The most common Natural Resources, Construction and Maintenance occupations in Waterloo are Construction & Extraction (1,372 | 4.3%), Installation, Maintenance & Repair (746 | 2.3%), and Farming, Fishing & Forestry (149 | 0.5%).
Natural Resources, Construction and Maintenance Occupations by Sex
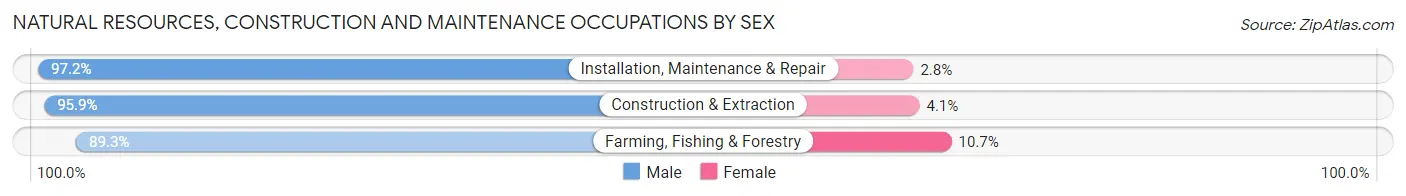
| Occupation | Male | Female |
| Farming, Fishing & Forestry | 133 (89.3%) | 16 (10.7%) |
| Construction & Extraction | 1,316 (95.9%) | 56 (4.1%) |
| Installation, Maintenance & Repair | 725 (97.2%) | 21 (2.8%) |
| Total (Category) | 2,174 (95.9%) | 93 (4.1%) |
| Total (Overall) | 16,760 (52.3%) | 15,275 (47.7%) |
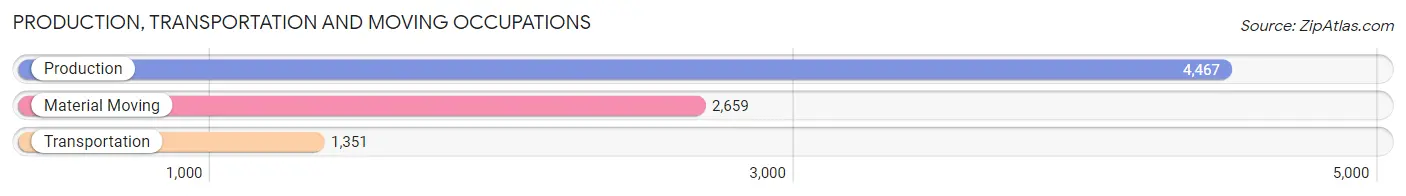
Production, Transportation and Moving Occupations
The most common Production, Transportation and Moving occupations in Waterloo are Production (4,467 | 13.9%), Material Moving (2,659 | 8.3%), and Transportation (1,351 | 4.2%).
Production, Transportation and Moving Occupations by Sex
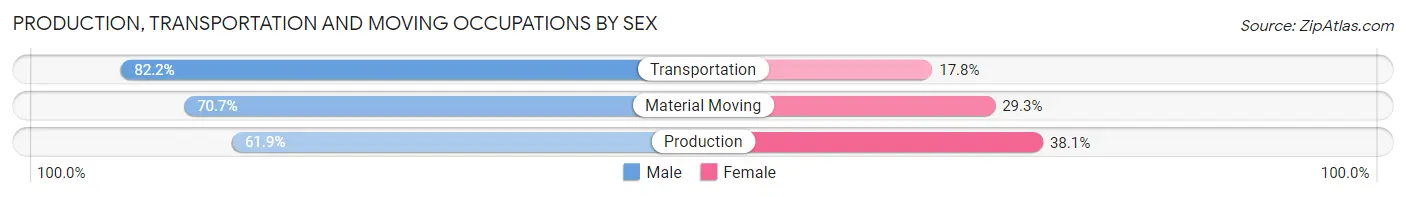
| Occupation | Male | Female |
| Production | 2,767 (61.9%) | 1,700 (38.1%) |
| Transportation | 1,111 (82.2%) | 240 (17.8%) |
| Material Moving | 1,880 (70.7%) | 779 (29.3%) |
| Total (Category) | 5,758 (67.9%) | 2,719 (32.1%) |
| Total (Overall) | 16,760 (52.3%) | 15,275 (47.7%) |
Employment Industries by Sex in Waterloo
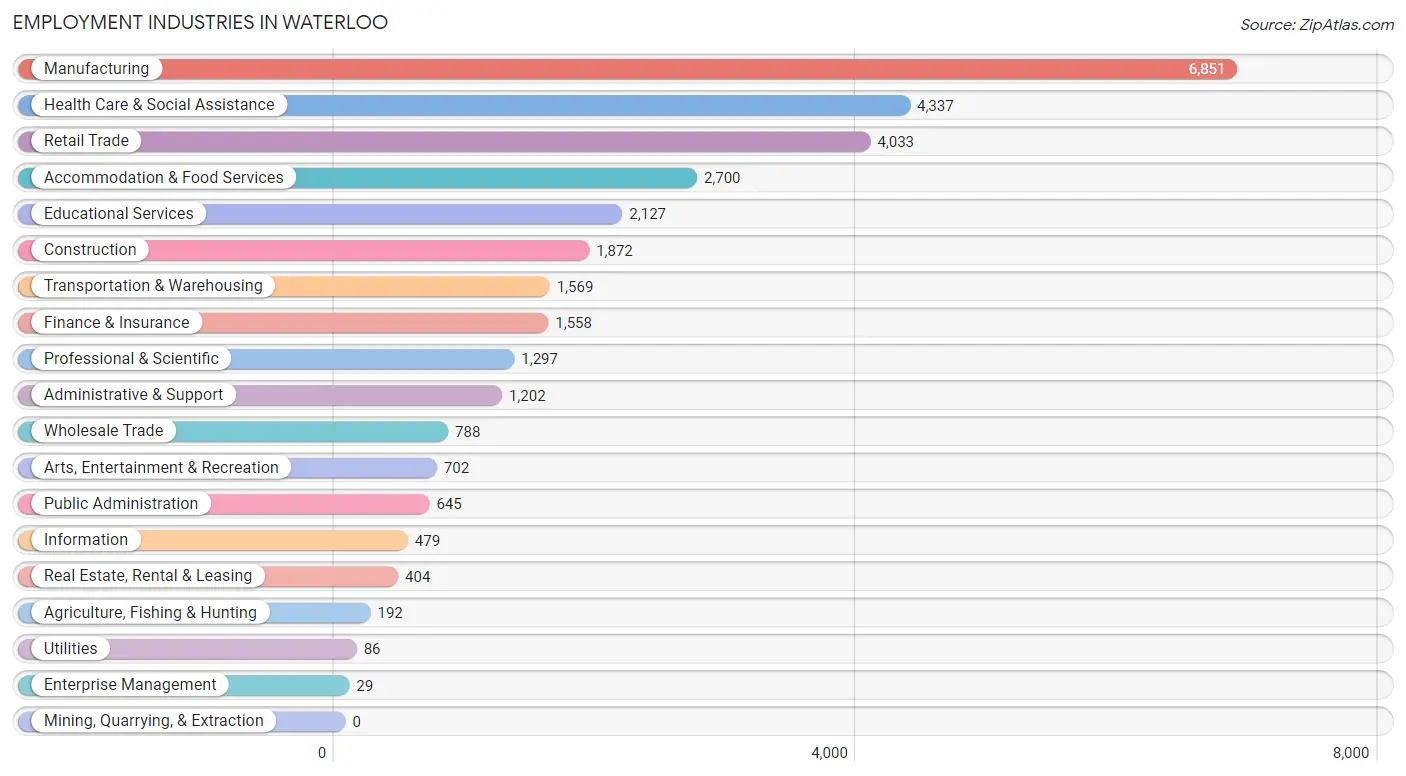
Employment Industries in Waterloo
The major employment industries in Waterloo include Manufacturing (6,851 | 21.4%), Health Care & Social Assistance (4,337 | 13.5%), Retail Trade (4,033 | 12.6%), Accommodation & Food Services (2,700 | 8.4%), and Educational Services (2,127 | 6.6%).
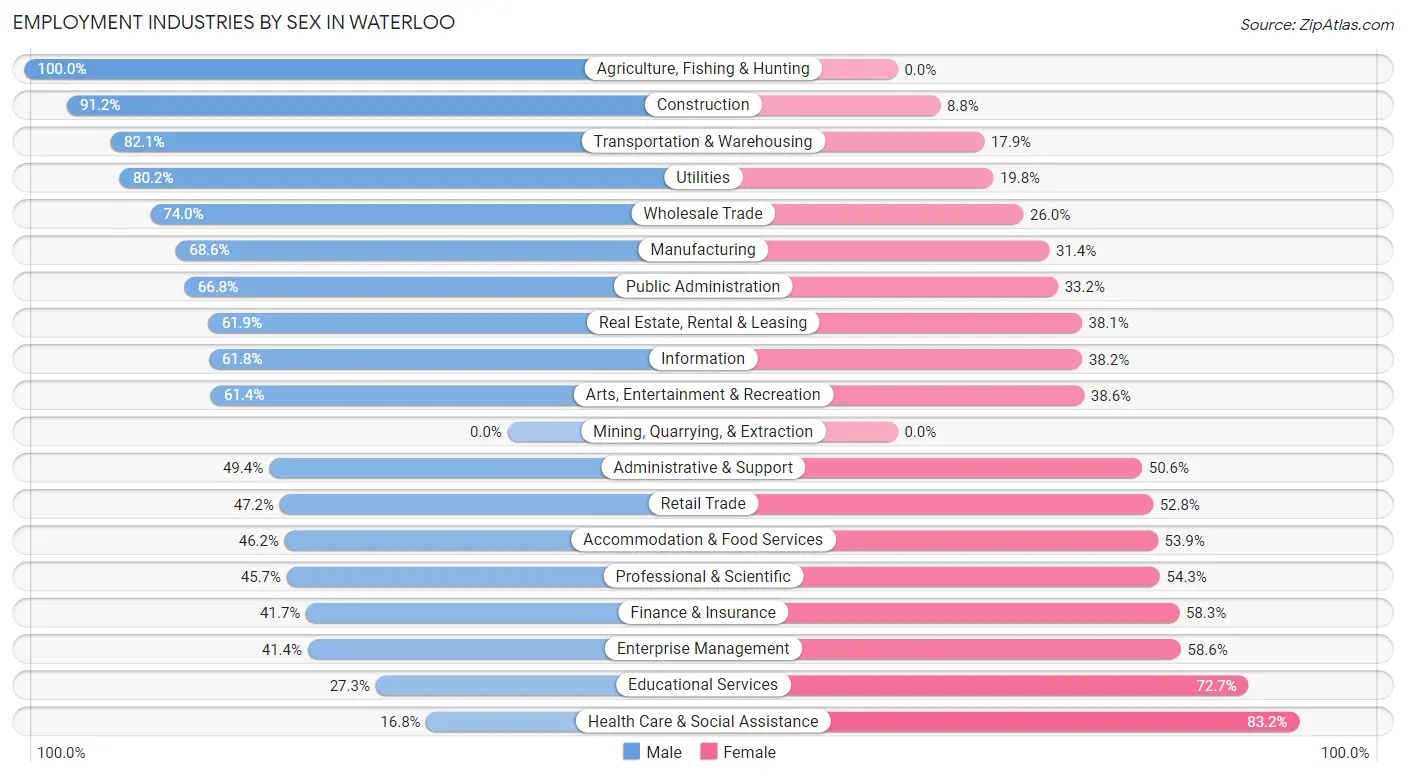
Employment Industries by Sex in Waterloo
The Waterloo industries that see more men than women are Agriculture, Fishing & Hunting (100.0%), Construction (91.2%), and Transportation & Warehousing (82.1%), whereas the industries that tend to have a higher number of women are Health Care & Social Assistance (83.2%), Educational Services (72.7%), and Enterprise Management (58.6%).
| Industry | Male | Female |
| Agriculture, Fishing & Hunting | 192 (100.0%) | 0 (0.0%) |
| Mining, Quarrying, & Extraction | 0 (0.0%) | 0 (0.0%) |
| Construction | 1,707 (91.2%) | 165 (8.8%) |
| Manufacturing | 4,700 (68.6%) | 2,151 (31.4%) |
| Wholesale Trade | 583 (74.0%) | 205 (26.0%) |
| Retail Trade | 1,902 (47.2%) | 2,131 (52.8%) |
| Transportation & Warehousing | 1,288 (82.1%) | 281 (17.9%) |
| Utilities | 69 (80.2%) | 17 (19.8%) |
| Information | 296 (61.8%) | 183 (38.2%) |
| Finance & Insurance | 650 (41.7%) | 908 (58.3%) |
| Real Estate, Rental & Leasing | 250 (61.9%) | 154 (38.1%) |
| Professional & Scientific | 593 (45.7%) | 704 (54.3%) |
| Enterprise Management | 12 (41.4%) | 17 (58.6%) |
| Administrative & Support | 594 (49.4%) | 608 (50.6%) |
| Educational Services | 581 (27.3%) | 1,546 (72.7%) |
| Health Care & Social Assistance | 730 (16.8%) | 3,607 (83.2%) |
| Arts, Entertainment & Recreation | 431 (61.4%) | 271 (38.6%) |
| Accommodation & Food Services | 1,246 (46.2%) | 1,454 (53.8%) |
| Public Administration | 431 (66.8%) | 214 (33.2%) |
| Total | 16,760 (52.3%) | 15,275 (47.7%) |
Education in Waterloo
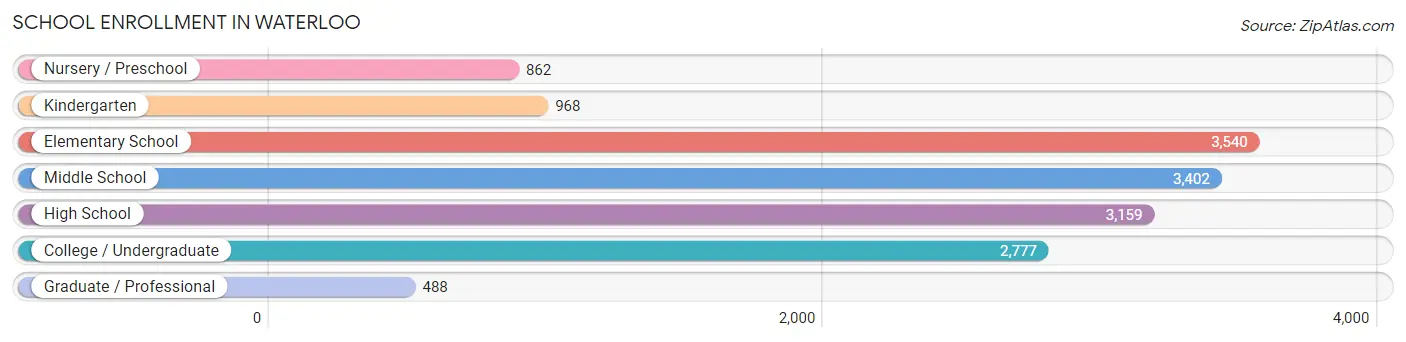
School Enrollment in Waterloo
The most common levels of schooling among the 15,196 students in Waterloo are elementary school (3,540 | 23.3%), middle school (3,402 | 22.4%), and high school (3,159 | 20.8%).
| School Level | # Students | % Students |
| Nursery / Preschool | 862 | 5.7% |
| Kindergarten | 968 | 6.4% |
| Elementary School | 3,540 | 23.3% |
| Middle School | 3,402 | 22.4% |
| High School | 3,159 | 20.8% |
| College / Undergraduate | 2,777 | 18.3% |
| Graduate / Professional | 488 | 3.2% |
| Total | 15,196 | 100.0% |
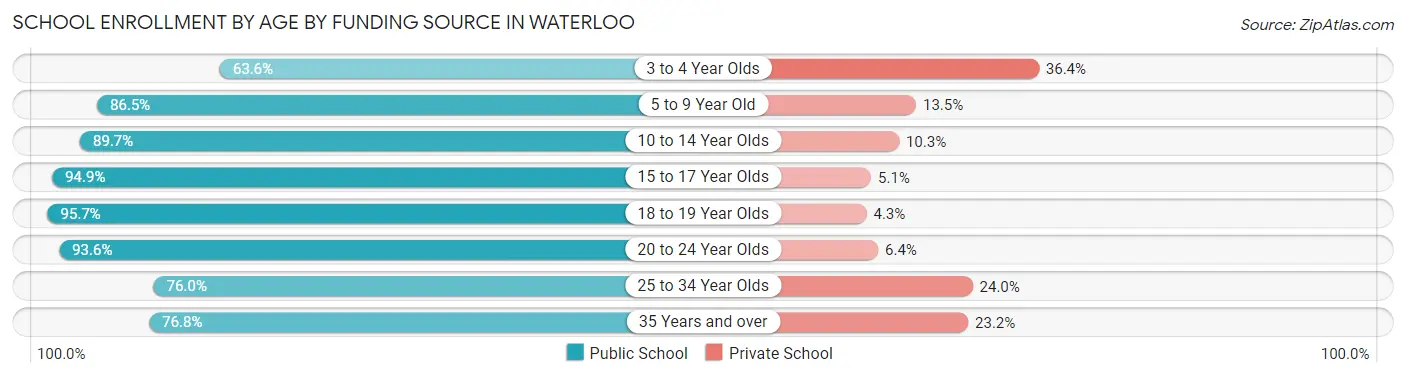
School Enrollment by Age by Funding Source in Waterloo
Out of a total of 15,196 students who are enrolled in schools in Waterloo, 1,854 (12.2%) attend a private institution, while the remaining 13,342 (87.8%) are enrolled in public schools. The age group of 3 to 4 year olds has the highest likelihood of being enrolled in private schools, with 272 (36.4% in the age bracket) enrolled. Conversely, the age group of 18 to 19 year olds has the lowest likelihood of being enrolled in a private school, with 899 (95.7% in the age bracket) attending a public institution.
| Age Bracket | Public School | Private School |
| 3 to 4 Year Olds | 476 (63.6%) | 272 (36.4%) |
| 5 to 9 Year Old | 3,608 (86.5%) | 562 (13.5%) |
| 10 to 14 Year Olds | 3,778 (89.7%) | 434 (10.3%) |
| 15 to 17 Year Olds | 2,321 (94.9%) | 125 (5.1%) |
| 18 to 19 Year Olds | 899 (95.7%) | 40 (4.3%) |
| 20 to 24 Year Olds | 1,168 (93.6%) | 80 (6.4%) |
| 25 to 34 Year Olds | 620 (76.0%) | 196 (24.0%) |
| 35 Years and over | 474 (76.8%) | 143 (23.2%) |
| Total | 13,342 (87.8%) | 1,854 (12.2%) |
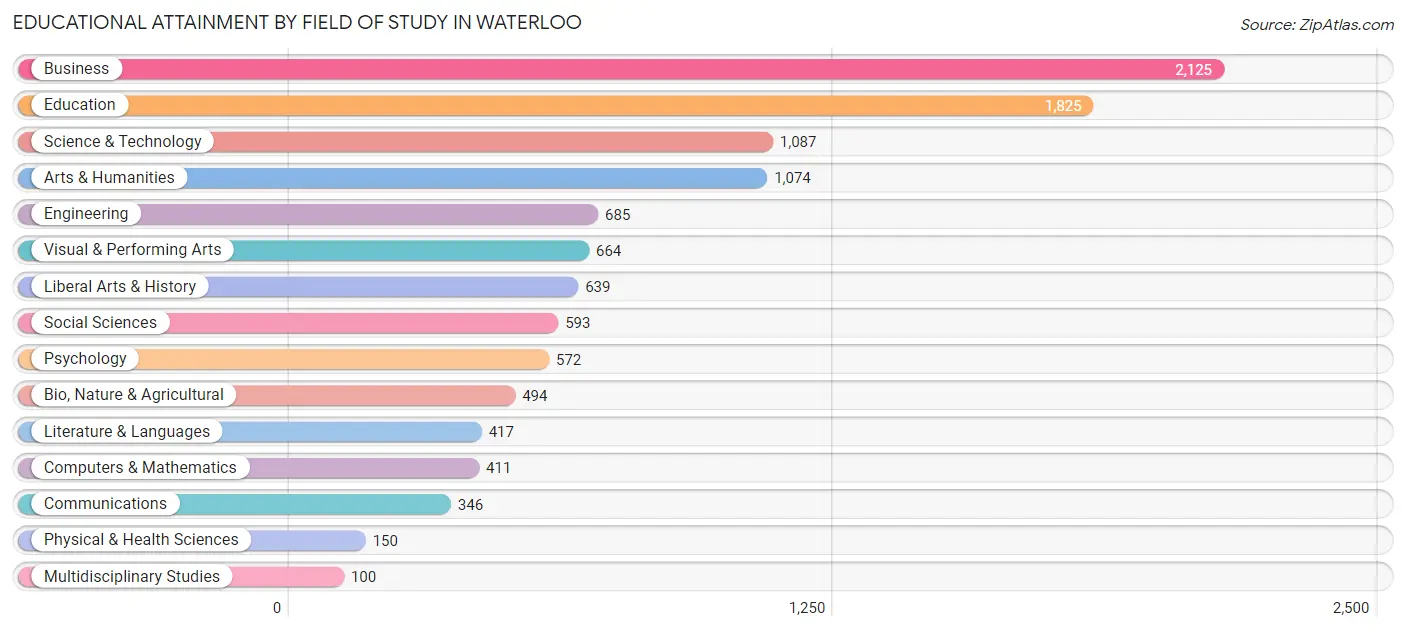
Educational Attainment by Field of Study in Waterloo
Business (2,125 | 19.0%), education (1,825 | 16.3%), science & technology (1,087 | 9.7%), arts & humanities (1,074 | 9.6%), and engineering (685 | 6.1%) are the most common fields of study among 11,182 individuals in Waterloo who have obtained a bachelor's degree or higher.
| Field of Study | # Graduates | % Graduates |
| Computers & Mathematics | 411 | 3.7% |
| Bio, Nature & Agricultural | 494 | 4.4% |
| Physical & Health Sciences | 150 | 1.3% |
| Psychology | 572 | 5.1% |
| Social Sciences | 593 | 5.3% |
| Engineering | 685 | 6.1% |
| Multidisciplinary Studies | 100 | 0.9% |
| Science & Technology | 1,087 | 9.7% |
| Business | 2,125 | 19.0% |
| Education | 1,825 | 16.3% |
| Literature & Languages | 417 | 3.7% |
| Liberal Arts & History | 639 | 5.7% |
| Visual & Performing Arts | 664 | 5.9% |
| Communications | 346 | 3.1% |
| Arts & Humanities | 1,074 | 9.6% |
| Total | 11,182 | 100.0% |
Transportation & Commute in Waterloo
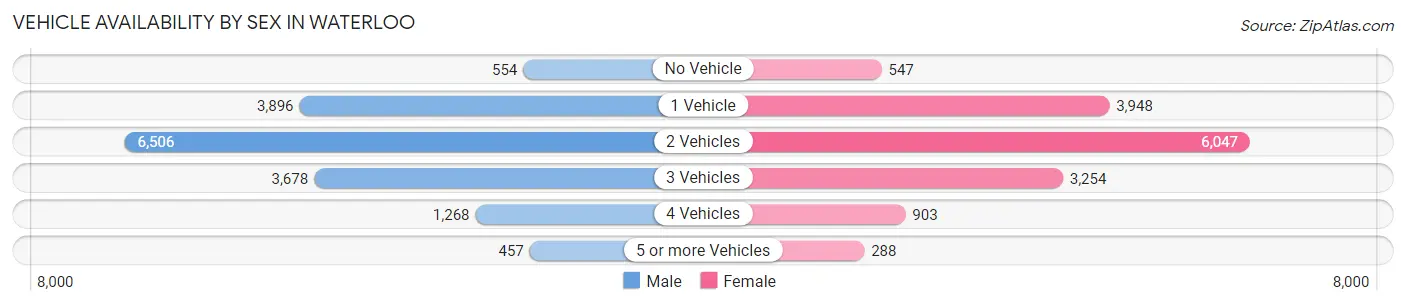
Vehicle Availability by Sex in Waterloo
The most prevalent vehicle ownership categories in Waterloo are males with 2 vehicles (6,506, accounting for 39.8%) and females with 2 vehicles (6,047, making up 43.4%).
| Vehicles Available | Male | Female |
| No Vehicle | 554 (3.4%) | 547 (3.6%) |
| 1 Vehicle | 3,896 (23.8%) | 3,948 (26.3%) |
| 2 Vehicles | 6,506 (39.8%) | 6,047 (40.4%) |
| 3 Vehicles | 3,678 (22.5%) | 3,254 (21.7%) |
| 4 Vehicles | 1,268 (7.7%) | 903 (6.0%) |
| 5 or more Vehicles | 457 (2.8%) | 288 (1.9%) |
| Total | 16,359 (100.0%) | 14,987 (100.0%) |
Commute Time in Waterloo
The most frequently occuring commute durations in Waterloo are 10 to 14 minutes (8,582 commuters, 29.2%), 15 to 19 minutes (7,613 commuters, 25.9%), and 5 to 9 minutes (5,285 commuters, 18.0%).
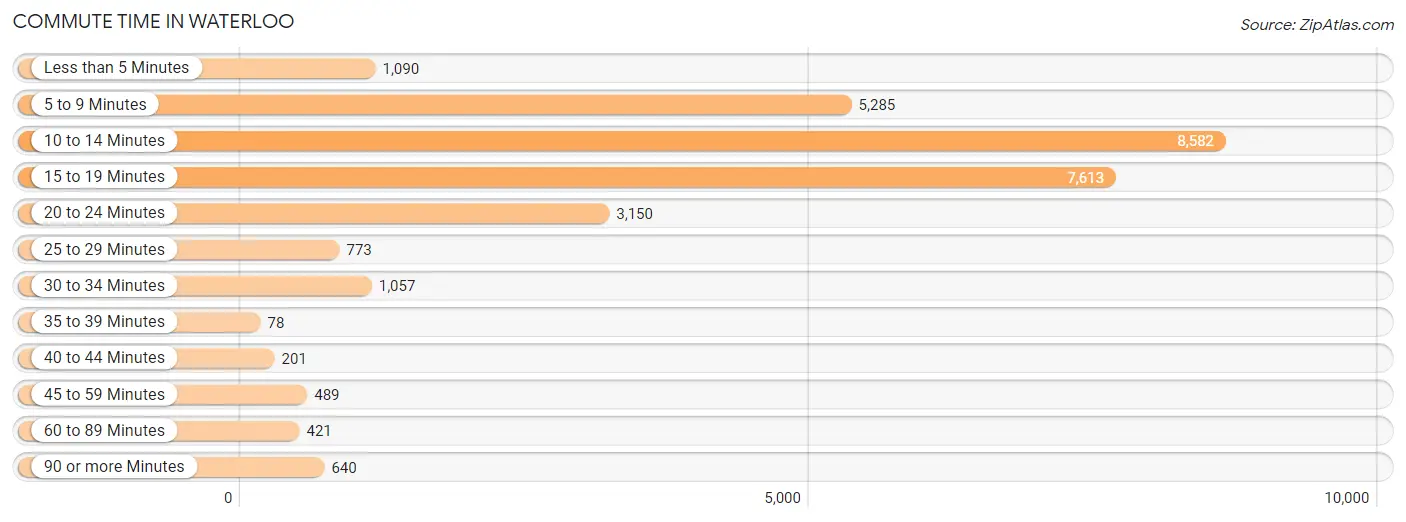
| Commute Time | # Commuters | % Commuters |
| Less than 5 Minutes | 1,090 | 3.7% |
| 5 to 9 Minutes | 5,285 | 18.0% |
| 10 to 14 Minutes | 8,582 | 29.2% |
| 15 to 19 Minutes | 7,613 | 25.9% |
| 20 to 24 Minutes | 3,150 | 10.7% |
| 25 to 29 Minutes | 773 | 2.6% |
| 30 to 34 Minutes | 1,057 | 3.6% |
| 35 to 39 Minutes | 78 | 0.3% |
| 40 to 44 Minutes | 201 | 0.7% |
| 45 to 59 Minutes | 489 | 1.7% |
| 60 to 89 Minutes | 421 | 1.4% |
| 90 or more Minutes | 640 | 2.2% |
Commute Time by Sex in Waterloo
The most common commute times in Waterloo are 10 to 14 minutes (4,255 commuters, 27.5%) for males and 10 to 14 minutes (4,327 commuters, 31.1%) for females.
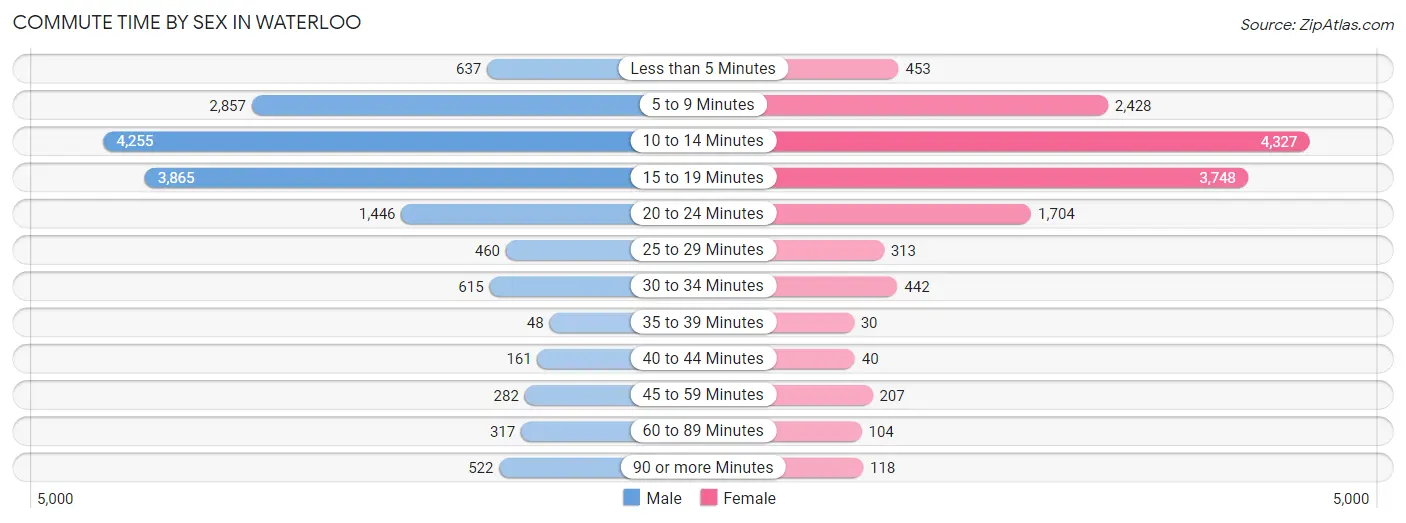
| Commute Time | Male | Female |
| Less than 5 Minutes | 637 (4.1%) | 453 (3.3%) |
| 5 to 9 Minutes | 2,857 (18.5%) | 2,428 (17.4%) |
| 10 to 14 Minutes | 4,255 (27.5%) | 4,327 (31.1%) |
| 15 to 19 Minutes | 3,865 (25.0%) | 3,748 (26.9%) |
| 20 to 24 Minutes | 1,446 (9.3%) | 1,704 (12.2%) |
| 25 to 29 Minutes | 460 (3.0%) | 313 (2.2%) |
| 30 to 34 Minutes | 615 (4.0%) | 442 (3.2%) |
| 35 to 39 Minutes | 48 (0.3%) | 30 (0.2%) |
| 40 to 44 Minutes | 161 (1.0%) | 40 (0.3%) |
| 45 to 59 Minutes | 282 (1.8%) | 207 (1.5%) |
| 60 to 89 Minutes | 317 (2.1%) | 104 (0.7%) |
| 90 or more Minutes | 522 (3.4%) | 118 (0.9%) |
Time of Departure to Work by Sex in Waterloo
The most frequent times of departure to work in Waterloo are 6:30 AM to 6:59 AM (1,990, 12.9%) for males and 7:30 AM to 7:59 AM (2,353, 16.9%) for females.
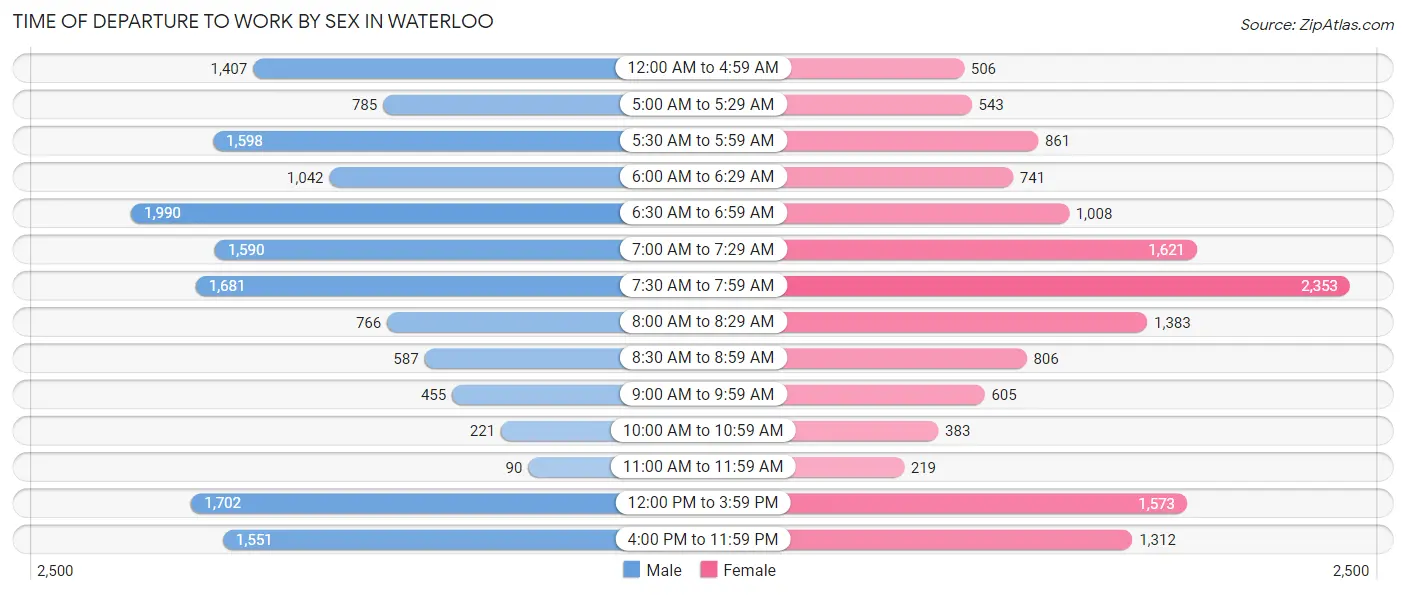
| Time of Departure | Male | Female |
| 12:00 AM to 4:59 AM | 1,407 (9.1%) | 506 (3.6%) |
| 5:00 AM to 5:29 AM | 785 (5.1%) | 543 (3.9%) |
| 5:30 AM to 5:59 AM | 1,598 (10.3%) | 861 (6.2%) |
| 6:00 AM to 6:29 AM | 1,042 (6.7%) | 741 (5.3%) |
| 6:30 AM to 6:59 AM | 1,990 (12.9%) | 1,008 (7.2%) |
| 7:00 AM to 7:29 AM | 1,590 (10.3%) | 1,621 (11.7%) |
| 7:30 AM to 7:59 AM | 1,681 (10.9%) | 2,353 (16.9%) |
| 8:00 AM to 8:29 AM | 766 (5.0%) | 1,383 (9.9%) |
| 8:30 AM to 8:59 AM | 587 (3.8%) | 806 (5.8%) |
| 9:00 AM to 9:59 AM | 455 (2.9%) | 605 (4.3%) |
| 10:00 AM to 10:59 AM | 221 (1.4%) | 383 (2.8%) |
| 11:00 AM to 11:59 AM | 90 (0.6%) | 219 (1.6%) |
| 12:00 PM to 3:59 PM | 1,702 (11.0%) | 1,573 (11.3%) |
| 4:00 PM to 11:59 PM | 1,551 (10.0%) | 1,312 (9.4%) |
| Total | 15,465 (100.0%) | 13,914 (100.0%) |
Housing Occupancy in Waterloo
Occupancy by Ownership in Waterloo
Of the total 28,947 dwellings in Waterloo, owner-occupied units account for 17,598 (60.8%), while renter-occupied units make up 11,349 (39.2%).
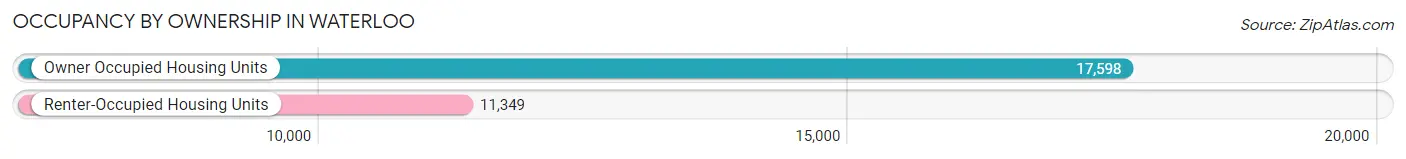
| Occupancy | # Housing Units | % Housing Units |
| Owner Occupied Housing Units | 17,598 | 60.8% |
| Renter-Occupied Housing Units | 11,349 | 39.2% |
| Total Occupied Housing Units | 28,947 | 100.0% |
Occupancy by Household Size in Waterloo
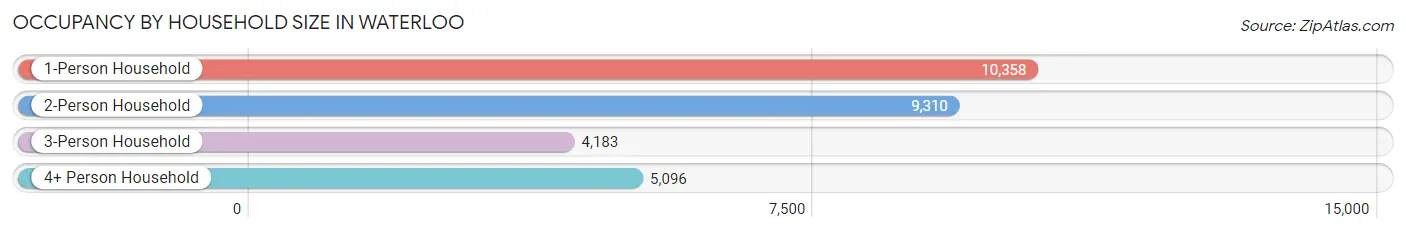
| Household Size | # Housing Units | % Housing Units |
| 1-Person Household | 10,358 | 35.8% |
| 2-Person Household | 9,310 | 32.2% |
| 3-Person Household | 4,183 | 14.4% |
| 4+ Person Household | 5,096 | 17.6% |
| Total Housing Units | 28,947 | 100.0% |
Occupancy by Ownership by Household Size in Waterloo
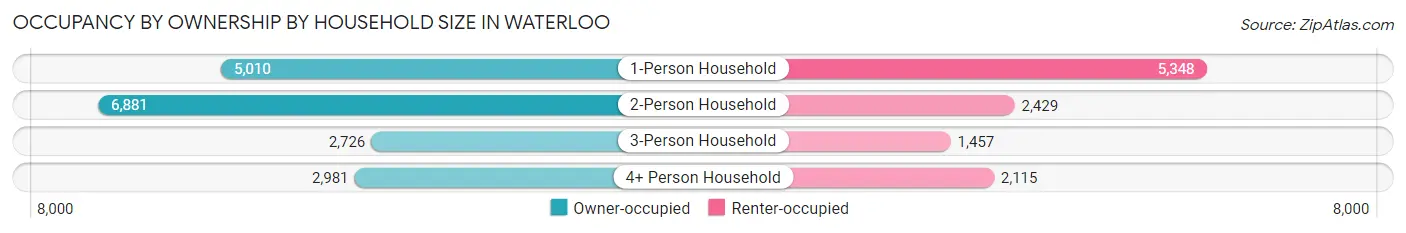
| Household Size | Owner-occupied | Renter-occupied |
| 1-Person Household | 5,010 (48.4%) | 5,348 (51.6%) |
| 2-Person Household | 6,881 (73.9%) | 2,429 (26.1%) |
| 3-Person Household | 2,726 (65.2%) | 1,457 (34.8%) |
| 4+ Person Household | 2,981 (58.5%) | 2,115 (41.5%) |
| Total Housing Units | 17,598 (60.8%) | 11,349 (39.2%) |
Occupancy by Educational Attainment in Waterloo
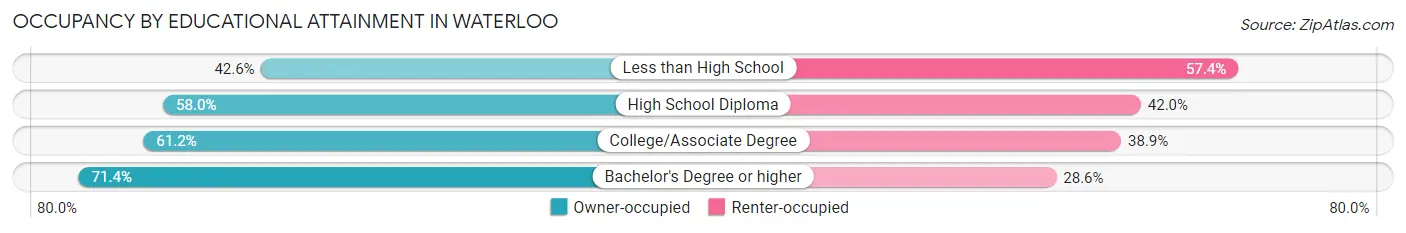
| Household Size | Owner-occupied | Renter-occupied |
| Less than High School | 1,198 (42.6%) | 1,615 (57.4%) |
| High School Diploma | 5,095 (58.0%) | 3,687 (42.0%) |
| College/Associate Degree | 6,481 (61.2%) | 4,117 (38.9%) |
| Bachelor's Degree or higher | 4,824 (71.4%) | 1,930 (28.6%) |
Occupancy by Age of Householder in Waterloo
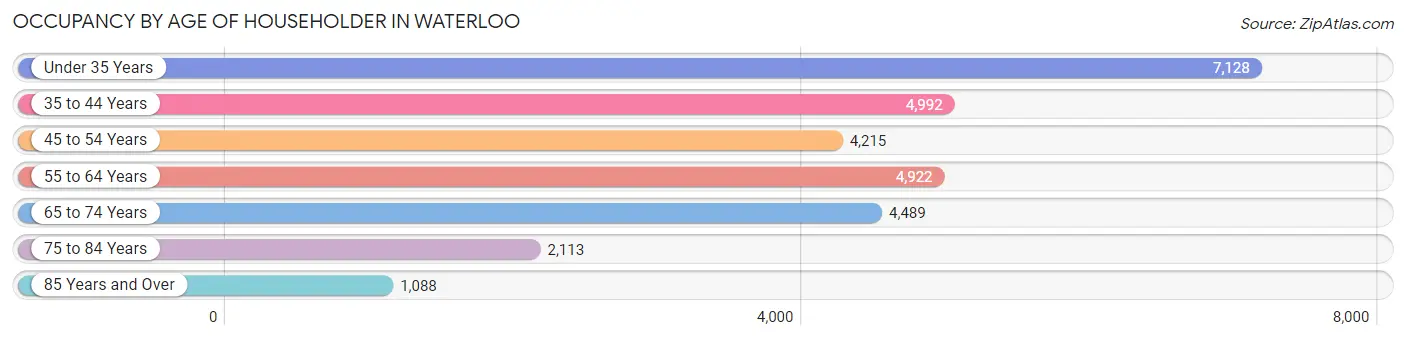
| Age Bracket | # Households | % Households |
| Under 35 Years | 7,128 | 24.6% |
| 35 to 44 Years | 4,992 | 17.2% |
| 45 to 54 Years | 4,215 | 14.6% |
| 55 to 64 Years | 4,922 | 17.0% |
| 65 to 74 Years | 4,489 | 15.5% |
| 75 to 84 Years | 2,113 | 7.3% |
| 85 Years and Over | 1,088 | 3.8% |
| Total | 28,947 | 100.0% |
Housing Finances in Waterloo
Median Income by Occupancy in Waterloo
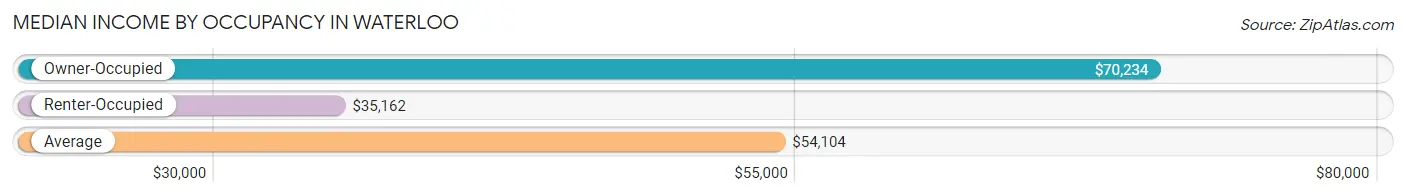
| Occupancy Type | # Households | Median Income |
| Owner-Occupied | 17,598 (60.8%) | $70,234 |
| Renter-Occupied | 11,349 (39.2%) | $35,162 |
| Average | 28,947 (100.0%) | $54,104 |
Occupancy by Householder Income Bracket in Waterloo
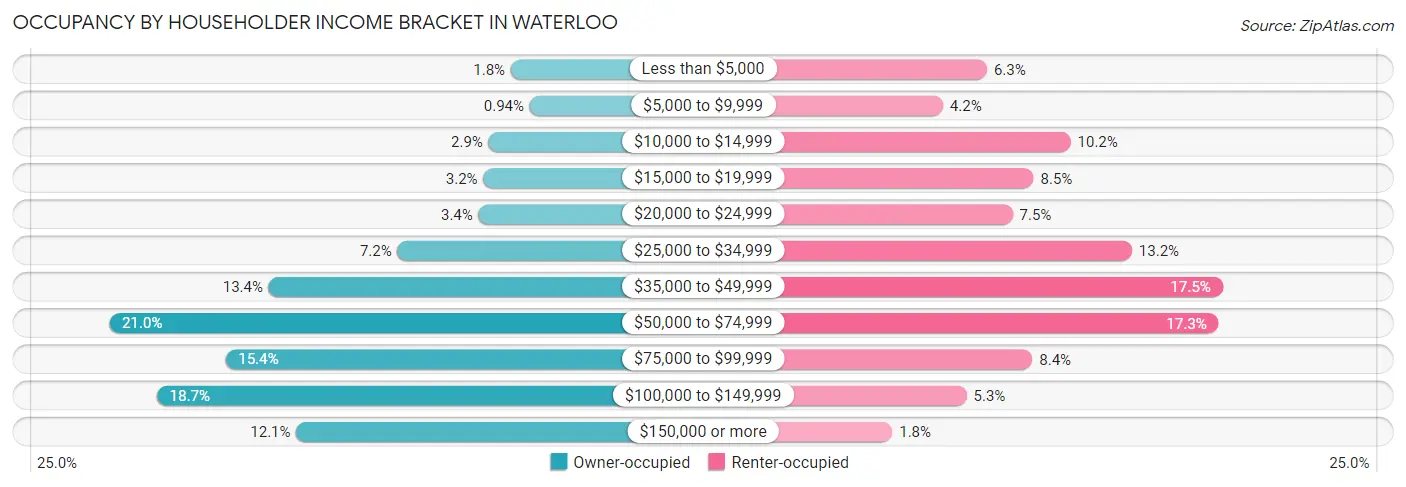
| Income Bracket | Owner-occupied | Renter-occupied |
| Less than $5,000 | 323 (1.8%) | 710 (6.3%) |
| $5,000 to $9,999 | 165 (0.9%) | 472 (4.2%) |
| $10,000 to $14,999 | 510 (2.9%) | 1,162 (10.2%) |
| $15,000 to $19,999 | 555 (3.2%) | 962 (8.5%) |
| $20,000 to $24,999 | 595 (3.4%) | 849 (7.5%) |
| $25,000 to $34,999 | 1,274 (7.2%) | 1,493 (13.2%) |
| $35,000 to $49,999 | 2,352 (13.4%) | 1,984 (17.5%) |
| $50,000 to $74,999 | 3,692 (21.0%) | 1,962 (17.3%) |
| $75,000 to $99,999 | 2,718 (15.4%) | 956 (8.4%) |
| $100,000 to $149,999 | 3,292 (18.7%) | 600 (5.3%) |
| $150,000 or more | 2,122 (12.1%) | 199 (1.8%) |
| Total | 17,598 (100.0%) | 11,349 (100.0%) |
Monthly Housing Cost Tiers in Waterloo
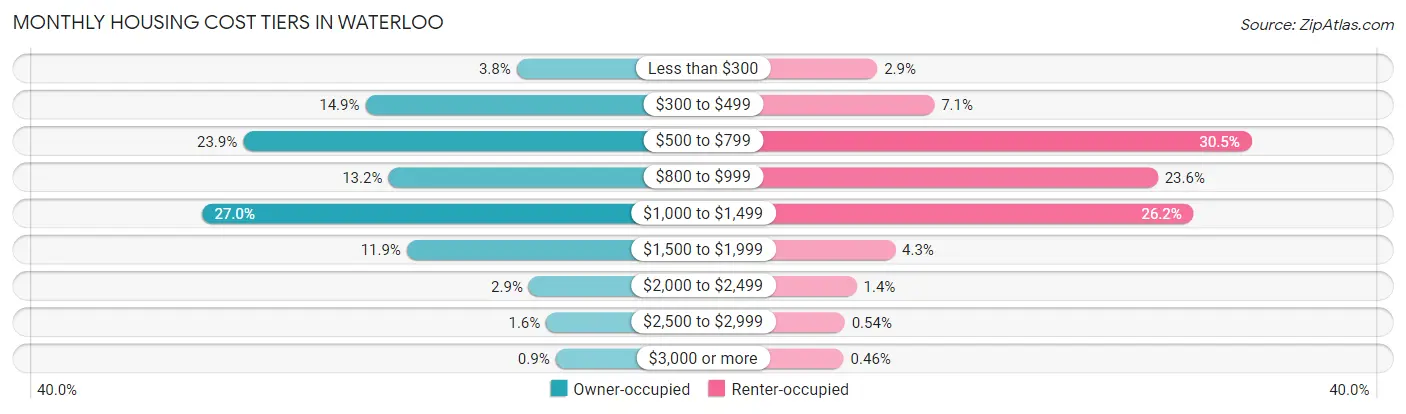
| Monthly Cost | Owner-occupied | Renter-occupied |
| Less than $300 | 663 (3.8%) | 333 (2.9%) |
| $300 to $499 | 2,624 (14.9%) | 809 (7.1%) |
| $500 to $799 | 4,208 (23.9%) | 3,461 (30.5%) |
| $800 to $999 | 2,327 (13.2%) | 2,677 (23.6%) |
| $1,000 to $1,499 | 4,747 (27.0%) | 2,977 (26.2%) |
| $1,500 to $1,999 | 2,087 (11.9%) | 482 (4.3%) |
| $2,000 to $2,499 | 505 (2.9%) | 160 (1.4%) |
| $2,500 to $2,999 | 279 (1.6%) | 61 (0.5%) |
| $3,000 or more | 158 (0.9%) | 52 (0.5%) |
| Total | 17,598 (100.0%) | 11,349 (100.0%) |
Physical Housing Characteristics in Waterloo
Housing Structures in Waterloo
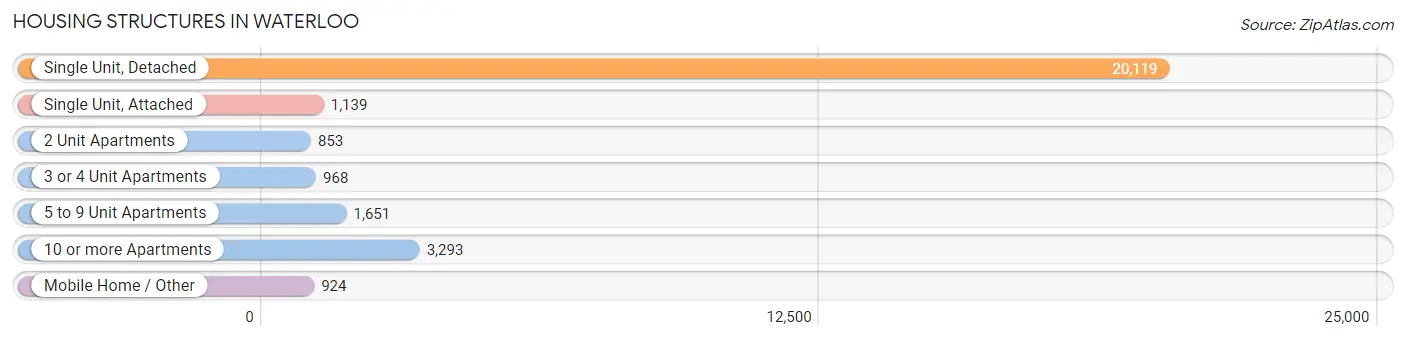
| Structure Type | # Housing Units | % Housing Units |
| Single Unit, Detached | 20,119 | 69.5% |
| Single Unit, Attached | 1,139 | 3.9% |
| 2 Unit Apartments | 853 | 2.9% |
| 3 or 4 Unit Apartments | 968 | 3.3% |
| 5 to 9 Unit Apartments | 1,651 | 5.7% |
| 10 or more Apartments | 3,293 | 11.4% |
| Mobile Home / Other | 924 | 3.2% |
| Total | 28,947 | 100.0% |
Housing Structures by Occupancy in Waterloo
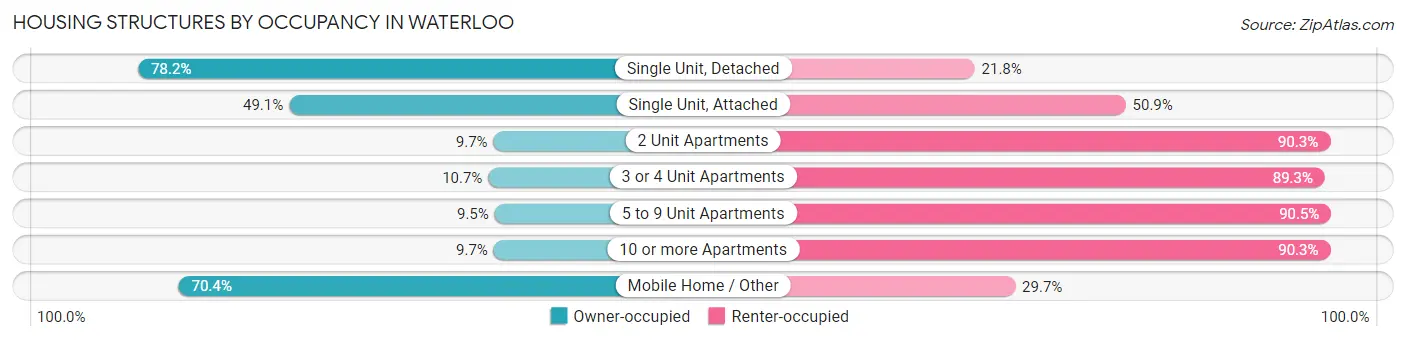
| Structure Type | Owner-occupied | Renter-occupied |
| Single Unit, Detached | 15,726 (78.2%) | 4,393 (21.8%) |
| Single Unit, Attached | 559 (49.1%) | 580 (50.9%) |
| 2 Unit Apartments | 83 (9.7%) | 770 (90.3%) |
| 3 or 4 Unit Apartments | 104 (10.7%) | 864 (89.3%) |
| 5 to 9 Unit Apartments | 157 (9.5%) | 1,494 (90.5%) |
| 10 or more Apartments | 319 (9.7%) | 2,974 (90.3%) |
| Mobile Home / Other | 650 (70.4%) | 274 (29.6%) |
| Total | 17,598 (60.8%) | 11,349 (39.2%) |
Housing Structures by Number of Rooms in Waterloo
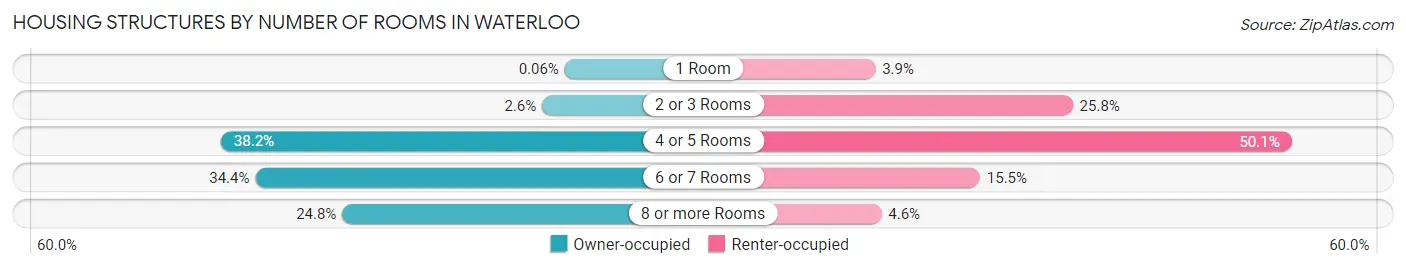
| Number of Rooms | Owner-occupied | Renter-occupied |
| 1 Room | 11 (0.1%) | 445 (3.9%) |
| 2 or 3 Rooms | 453 (2.6%) | 2,932 (25.8%) |
| 4 or 5 Rooms | 6,725 (38.2%) | 5,687 (50.1%) |
| 6 or 7 Rooms | 6,053 (34.4%) | 1,763 (15.5%) |
| 8 or more Rooms | 4,356 (24.7%) | 522 (4.6%) |
| Total | 17,598 (100.0%) | 11,349 (100.0%) |
Housing Structure by Heating Type in Waterloo
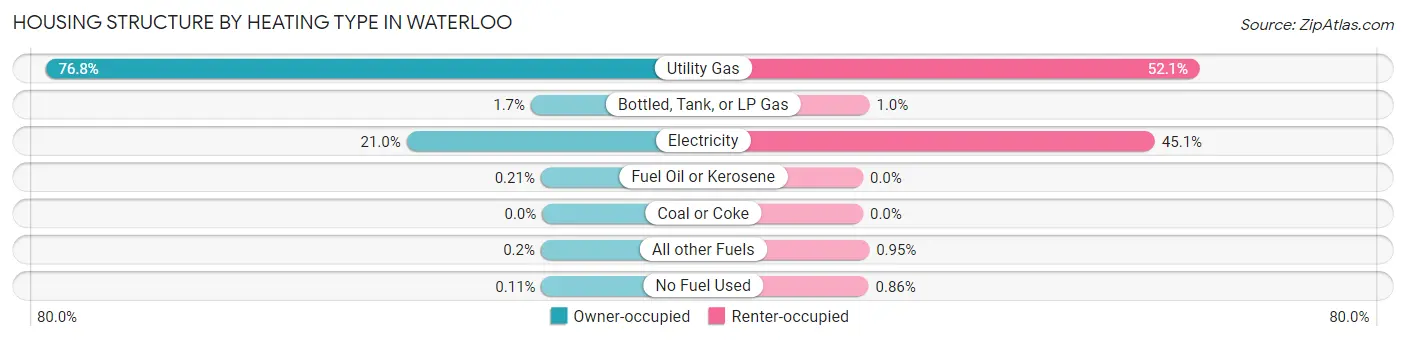
| Heating Type | Owner-occupied | Renter-occupied |
| Utility Gas | 13,511 (76.8%) | 5,908 (52.1%) |
| Bottled, Tank, or LP Gas | 306 (1.7%) | 114 (1.0%) |
| Electricity | 3,689 (21.0%) | 5,121 (45.1%) |
| Fuel Oil or Kerosene | 37 (0.2%) | 0 (0.0%) |
| Coal or Coke | 0 (0.0%) | 0 (0.0%) |
| All other Fuels | 36 (0.2%) | 108 (0.9%) |
| No Fuel Used | 19 (0.1%) | 98 (0.9%) |
| Total | 17,598 (100.0%) | 11,349 (100.0%) |
Household Vehicle Usage in Waterloo
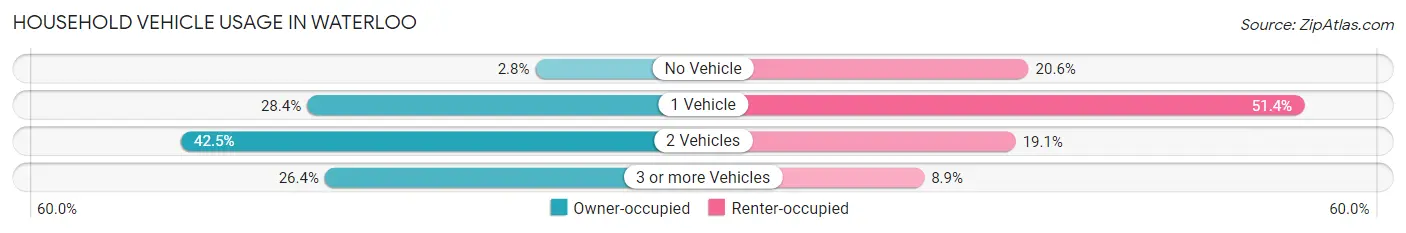
| Vehicles per Household | Owner-occupied | Renter-occupied |
| No Vehicle | 491 (2.8%) | 2,336 (20.6%) |
| 1 Vehicle | 4,992 (28.4%) | 5,834 (51.4%) |
| 2 Vehicles | 7,472 (42.5%) | 2,171 (19.1%) |
| 3 or more Vehicles | 4,643 (26.4%) | 1,008 (8.9%) |
| Total | 17,598 (100.0%) | 11,349 (100.0%) |
Real Estate & Mortgages in Waterloo
Real Estate and Mortgage Overview in Waterloo
| Characteristic | Without Mortgage | With Mortgage |
| Housing Units | 6,792 | 10,806 |
| Median Property Value | $140,600 | $142,500 |
| Median Household Income | $58,276 | $1,442 |
| Monthly Housing Costs | $526 | $158 |
| Real Estate Taxes | $2,402 | $205 |
Property Value by Mortgage Status in Waterloo
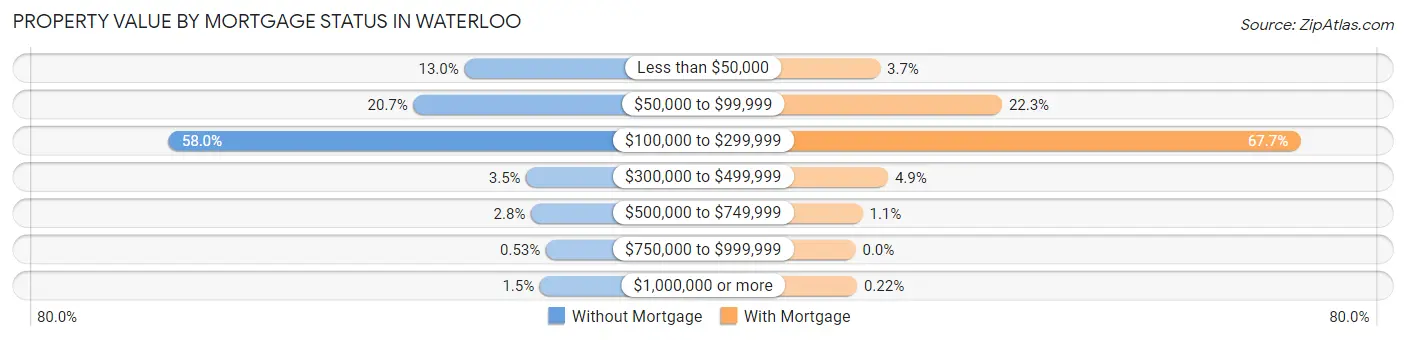
| Property Value | Without Mortgage | With Mortgage |
| Less than $50,000 | 880 (13.0%) | 404 (3.7%) |
| $50,000 to $99,999 | 1,407 (20.7%) | 2,411 (22.3%) |
| $100,000 to $299,999 | 3,940 (58.0%) | 7,318 (67.7%) |
| $300,000 to $499,999 | 240 (3.5%) | 534 (4.9%) |
| $500,000 to $749,999 | 190 (2.8%) | 115 (1.1%) |
| $750,000 to $999,999 | 36 (0.5%) | 0 (0.0%) |
| $1,000,000 or more | 99 (1.5%) | 24 (0.2%) |
| Total | 6,792 (100.0%) | 10,806 (100.0%) |
Household Income by Mortgage Status in Waterloo
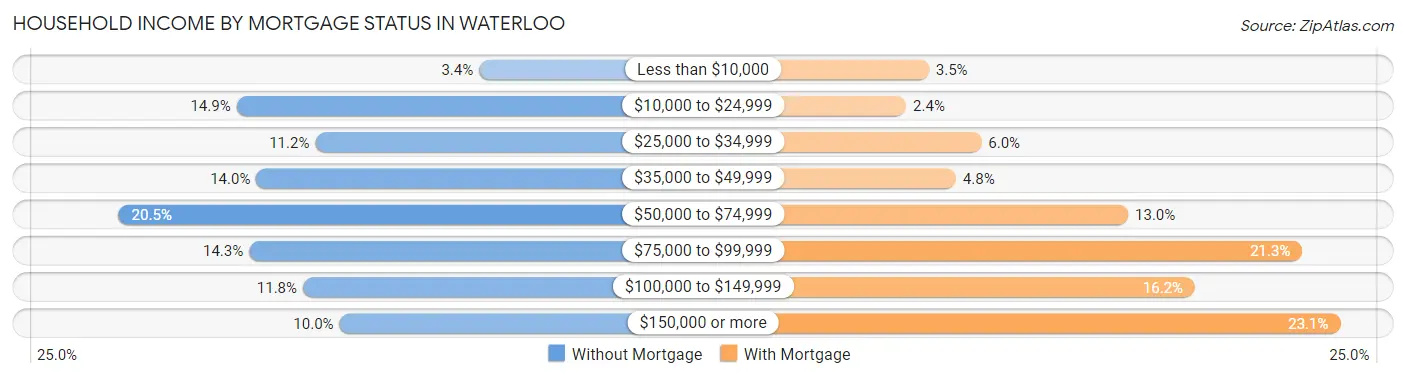
| Household Income | Without Mortgage | With Mortgage |
| Less than $10,000 | 228 (3.4%) | 377 (3.5%) |
| $10,000 to $24,999 | 1,013 (14.9%) | 260 (2.4%) |
| $25,000 to $34,999 | 758 (11.2%) | 647 (6.0%) |
| $35,000 to $49,999 | 949 (14.0%) | 516 (4.8%) |
| $50,000 to $74,999 | 1,394 (20.5%) | 1,403 (13.0%) |
| $75,000 to $99,999 | 972 (14.3%) | 2,298 (21.3%) |
| $100,000 to $149,999 | 798 (11.7%) | 1,746 (16.2%) |
| $150,000 or more | 680 (10.0%) | 2,494 (23.1%) |
| Total | 6,792 (100.0%) | 10,806 (100.0%) |
Property Value to Household Income Ratio in Waterloo
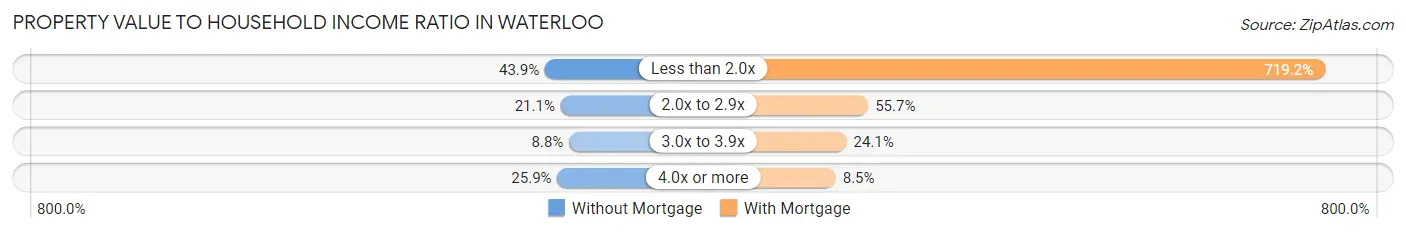
| Value-to-Income Ratio | Without Mortgage | With Mortgage |
| Less than 2.0x | 2,979 (43.9%) | 77,717 (719.2%) |
| 2.0x to 2.9x | 1,430 (21.0%) | 6,019 (55.7%) |
| 3.0x to 3.9x | 599 (8.8%) | 2,608 (24.1%) |
| 4.0x or more | 1,757 (25.9%) | 918 (8.5%) |
| Total | 6,792 (100.0%) | 10,806 (100.0%) |
Real Estate Taxes by Mortgage Status in Waterloo
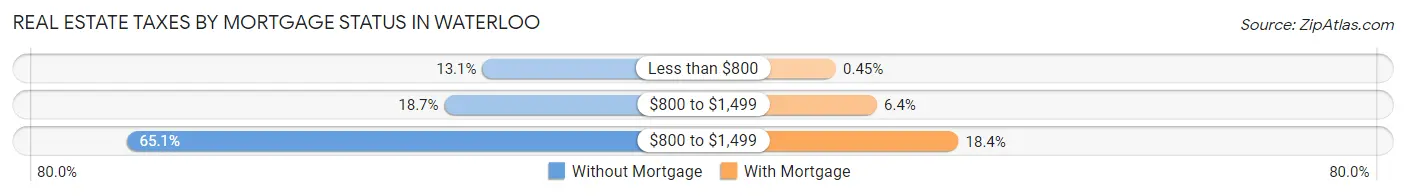
| Property Taxes | Without Mortgage | With Mortgage |
| Less than $800 | 891 (13.1%) | 49 (0.4%) |
| $800 to $1,499 | 1,268 (18.7%) | 696 (6.4%) |
| $800 to $1,499 | 4,421 (65.1%) | 1,983 (18.3%) |
| Total | 6,792 (100.0%) | 10,806 (100.0%) |
Health & Disability in Waterloo
Health Insurance Coverage by Age in Waterloo
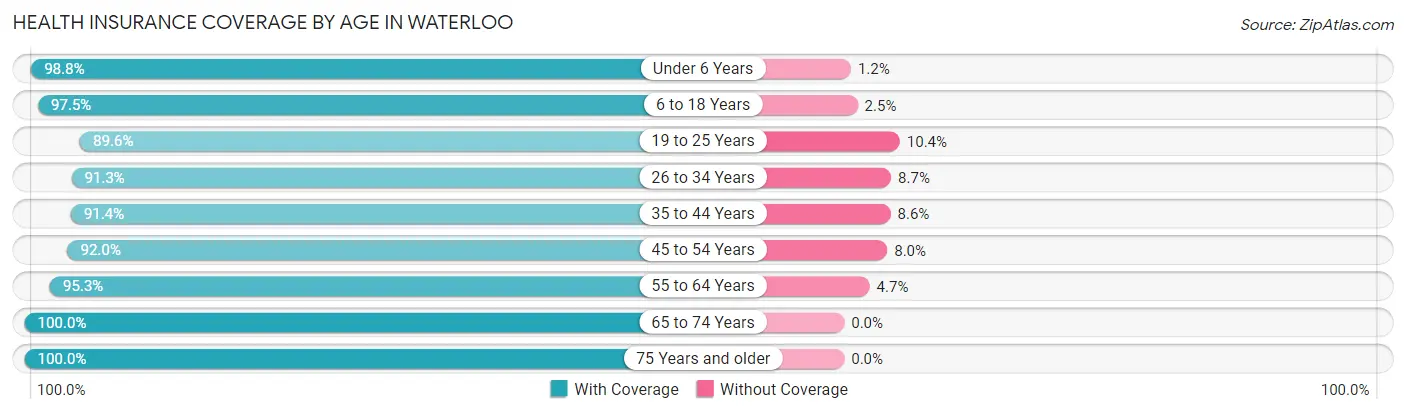
| Age Bracket | With Coverage | Without Coverage |
| Under 6 Years | 5,508 (98.8%) | 69 (1.2%) |
| 6 to 18 Years | 10,986 (97.5%) | 281 (2.5%) |
| 19 to 25 Years | 5,929 (89.6%) | 685 (10.4%) |
| 26 to 34 Years | 7,554 (91.3%) | 723 (8.7%) |
| 35 to 44 Years | 7,799 (91.4%) | 737 (8.6%) |
| 45 to 54 Years | 6,457 (92.0%) | 563 (8.0%) |
| 55 to 64 Years | 7,823 (95.3%) | 388 (4.7%) |
| 65 to 74 Years | 6,588 (100.0%) | 0 (0.0%) |
| 75 Years and older | 4,467 (100.0%) | 0 (0.0%) |
| Total | 63,111 (94.8%) | 3,446 (5.2%) |
Health Insurance Coverage by Citizenship Status in Waterloo
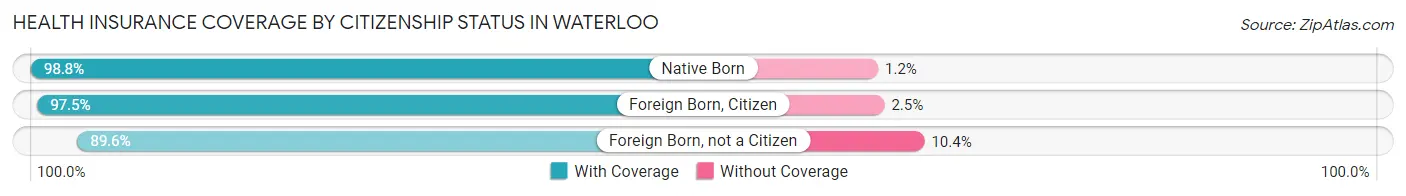
| Citizenship Status | With Coverage | Without Coverage |
| Native Born | 5,508 (98.8%) | 69 (1.2%) |
| Foreign Born, Citizen | 10,986 (97.5%) | 281 (2.5%) |
| Foreign Born, not a Citizen | 5,929 (89.6%) | 685 (10.4%) |
Health Insurance Coverage by Household Income in Waterloo
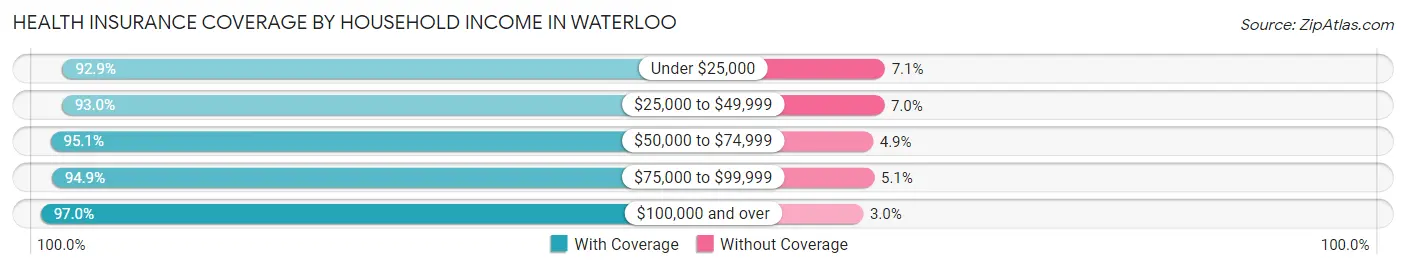
| Household Income | With Coverage | Without Coverage |
| Under $25,000 | 9,735 (92.9%) | 745 (7.1%) |
| $25,000 to $49,999 | 13,018 (93.0%) | 974 (7.0%) |
| $50,000 to $74,999 | 12,937 (95.1%) | 662 (4.9%) |
| $75,000 to $99,999 | 9,313 (94.9%) | 501 (5.1%) |
| $100,000 and over | 17,876 (97.0%) | 558 (3.0%) |
Public vs Private Health Insurance Coverage by Age in Waterloo
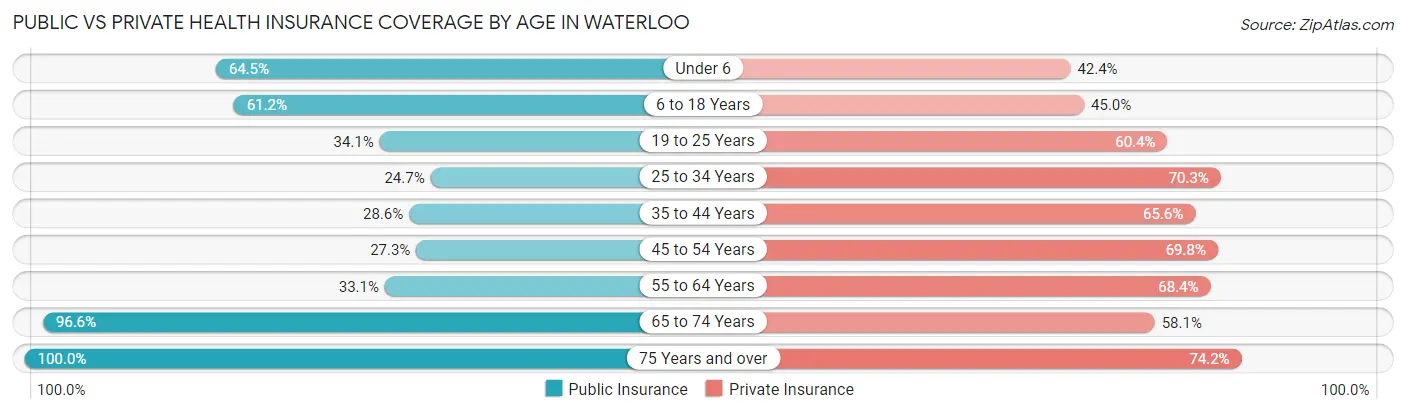
| Age Bracket | Public Insurance | Private Insurance |
| Under 6 | 3,597 (64.5%) | 2,367 (42.4%) |
| 6 to 18 Years | 6,893 (61.2%) | 5,068 (45.0%) |
| 19 to 25 Years | 2,257 (34.1%) | 3,997 (60.4%) |
| 25 to 34 Years | 2,041 (24.7%) | 5,820 (70.3%) |
| 35 to 44 Years | 2,445 (28.6%) | 5,596 (65.6%) |
| 45 to 54 Years | 1,917 (27.3%) | 4,898 (69.8%) |
| 55 to 64 Years | 2,721 (33.1%) | 5,617 (68.4%) |
| 65 to 74 Years | 6,364 (96.6%) | 3,827 (58.1%) |
| 75 Years and over | 4,467 (100.0%) | 3,313 (74.2%) |
| Total | 32,702 (49.1%) | 40,503 (60.9%) |
Disability Status by Sex by Age in Waterloo
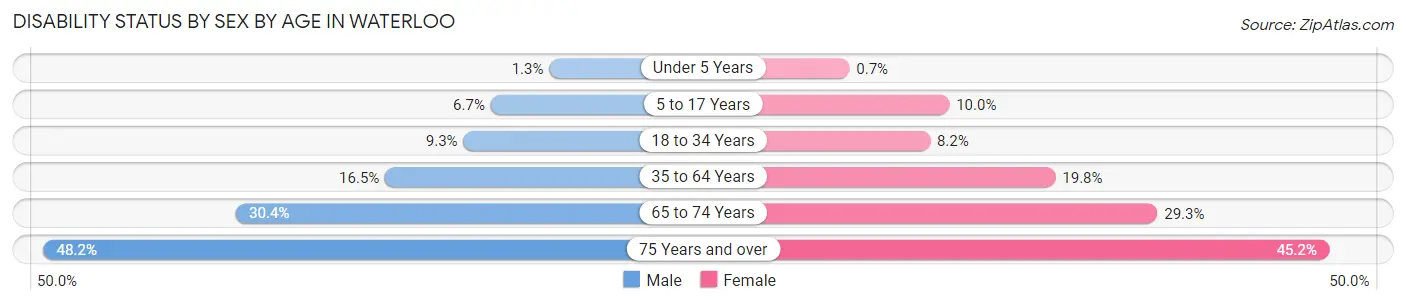
| Age Bracket | Male | Female |
| Under 5 Years | 33 (1.3%) | 16 (0.7%) |
| 5 to 17 Years | 377 (6.7%) | 552 (10.0%) |
| 18 to 34 Years | 746 (9.3%) | 632 (8.2%) |
| 35 to 64 Years | 1,963 (16.5%) | 2,358 (19.8%) |
| 65 to 74 Years | 957 (30.4%) | 1,006 (29.3%) |
| 75 Years and over | 875 (48.2%) | 1,199 (45.2%) |
Disability Class by Sex by Age in Waterloo
Disability Class: Hearing Difficulty
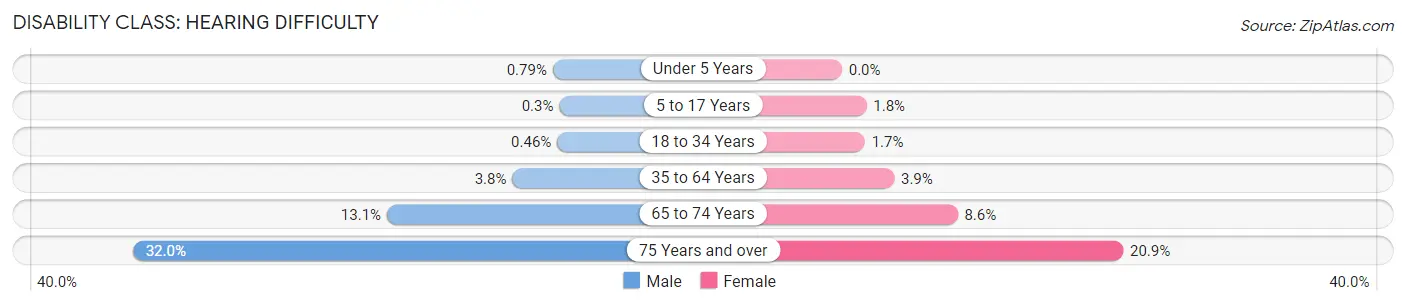
| Age Bracket | Male | Female |
| Under 5 Years | 20 (0.8%) | 0 (0.0%) |
| 5 to 17 Years | 17 (0.3%) | 101 (1.8%) |
| 18 to 34 Years | 37 (0.5%) | 131 (1.7%) |
| 35 to 64 Years | 450 (3.8%) | 462 (3.9%) |
| 65 to 74 Years | 413 (13.1%) | 295 (8.6%) |
| 75 Years and over | 580 (32.0%) | 554 (20.9%) |
Disability Class: Vision Difficulty

| Age Bracket | Male | Female |
| Under 5 Years | 33 (1.3%) | 16 (0.7%) |
| 5 to 17 Years | 21 (0.4%) | 85 (1.5%) |
| 18 to 34 Years | 45 (0.6%) | 80 (1.0%) |
| 35 to 64 Years | 214 (1.8%) | 313 (2.6%) |
| 65 to 74 Years | 147 (4.7%) | 192 (5.6%) |
| 75 Years and over | 111 (6.1%) | 222 (8.4%) |
Disability Class: Cognitive Difficulty
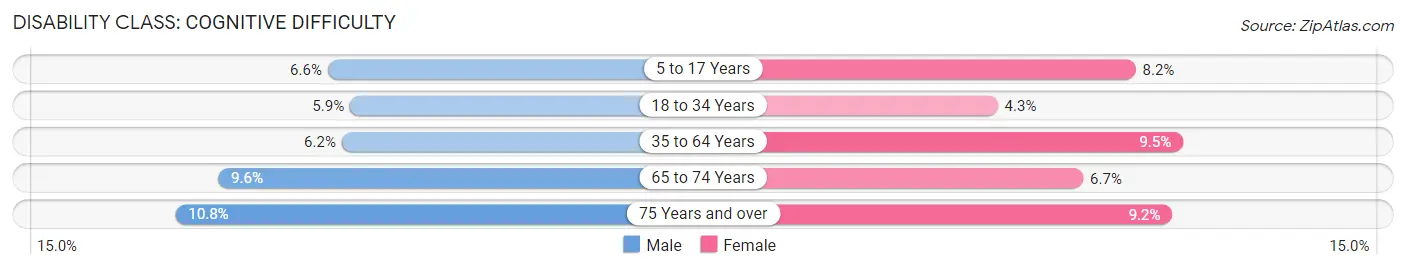
| Age Bracket | Male | Female |
| 5 to 17 Years | 367 (6.6%) | 453 (8.2%) |
| 18 to 34 Years | 478 (5.9%) | 335 (4.3%) |
| 35 to 64 Years | 732 (6.2%) | 1,130 (9.5%) |
| 65 to 74 Years | 303 (9.6%) | 231 (6.7%) |
| 75 Years and over | 196 (10.8%) | 244 (9.2%) |
Disability Class: Ambulatory Difficulty
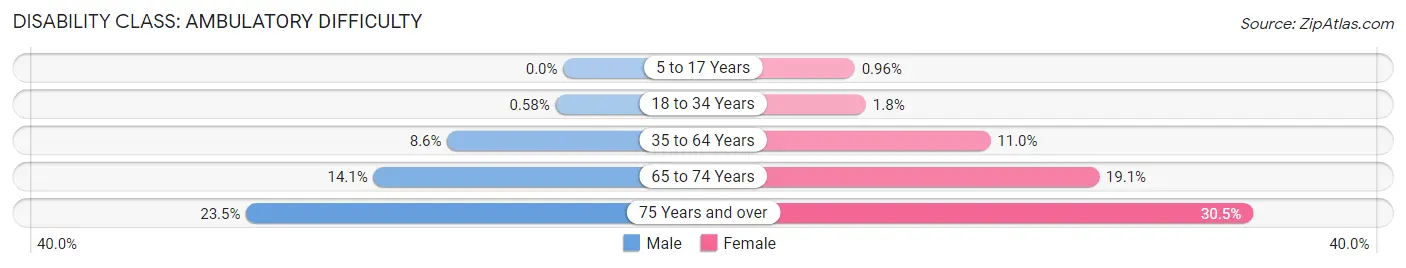
| Age Bracket | Male | Female |
| 5 to 17 Years | 0 (0.0%) | 53 (1.0%) |
| 18 to 34 Years | 47 (0.6%) | 138 (1.8%) |
| 35 to 64 Years | 1,022 (8.6%) | 1,313 (11.0%) |
| 65 to 74 Years | 444 (14.1%) | 656 (19.1%) |
| 75 Years and over | 427 (23.5%) | 810 (30.5%) |
Disability Class: Self-Care Difficulty
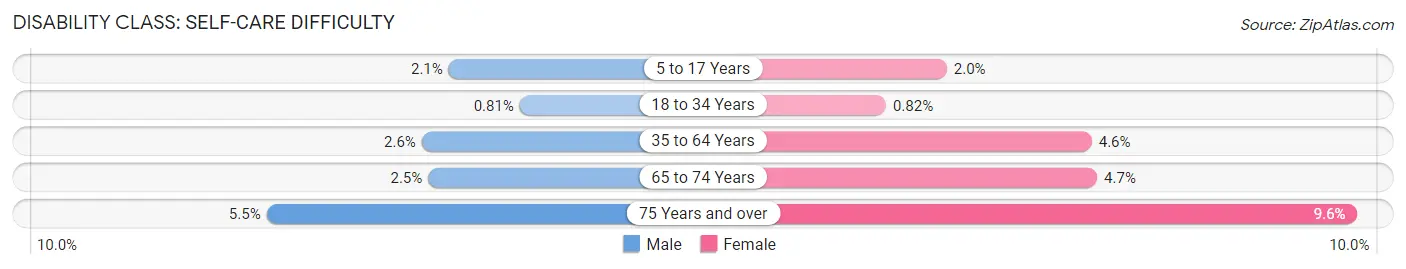
| Age Bracket | Male | Female |
| 5 to 17 Years | 119 (2.1%) | 108 (1.9%) |
| 18 to 34 Years | 65 (0.8%) | 63 (0.8%) |
| 35 to 64 Years | 312 (2.6%) | 552 (4.6%) |
| 65 to 74 Years | 79 (2.5%) | 163 (4.7%) |
| 75 Years and over | 100 (5.5%) | 254 (9.6%) |
Technology Access in Waterloo
Computing Device Access in Waterloo
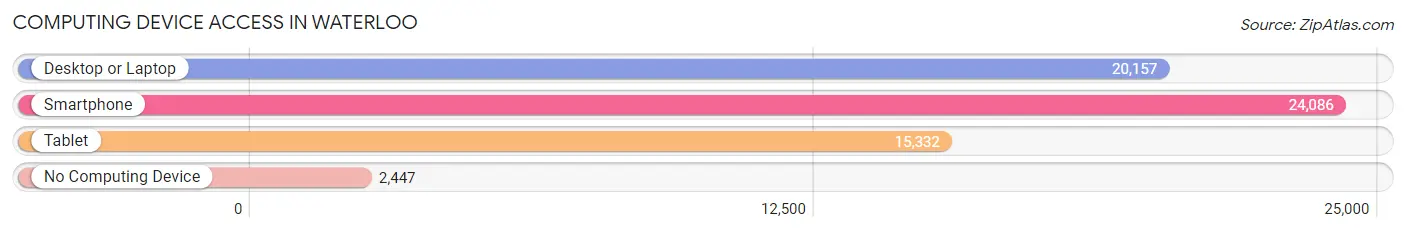
| Device Type | # Households | % Households |
| Desktop or Laptop | 20,157 | 69.6% |
| Smartphone | 24,086 | 83.2% |
| Tablet | 15,332 | 53.0% |
| No Computing Device | 2,447 | 8.5% |
| Total | 28,947 | 100.0% |
Internet Access in Waterloo
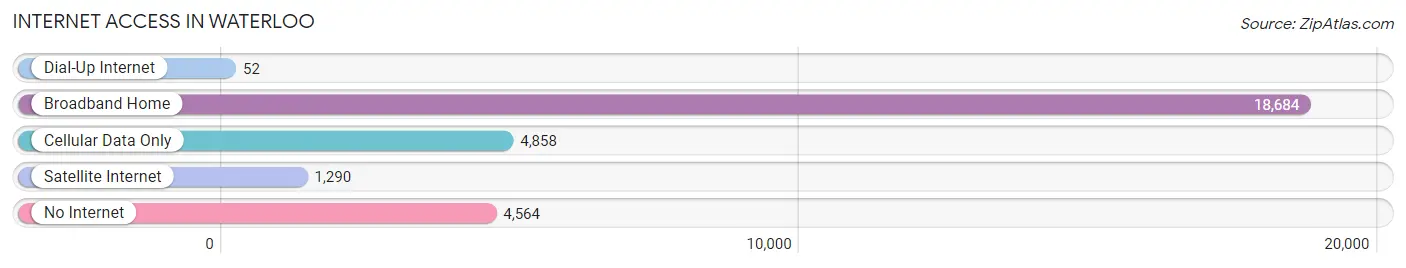
| Internet Type | # Households | % Households |
| Dial-Up Internet | 52 | 0.2% |
| Broadband Home | 18,684 | 64.5% |
| Cellular Data Only | 4,858 | 16.8% |
| Satellite Internet | 1,290 | 4.5% |
| No Internet | 4,564 | 15.8% |
| Total | 28,947 | 100.0% |
Waterloo Summary
Waterloo, Iowa is a city located in Black Hawk County in the northeastern part of the state. It is the county seat and the most populous city in the county. The city is situated along the Cedar River and is part of the Waterloo-Cedar Falls Metropolitan Statistical Area. As of the 2010 census, the city had a population of 68,406, making it the sixth-largest city in Iowa.
History
Waterloo was founded in 1845 by George and Mary Hanna and was originally named Prairie Rapids Crossing. The city was renamed Waterloo in 1851, after the Battle of Waterloo in Belgium. The city was incorporated in 1868 and became the county seat of Black Hawk County in 1872.
In the late 19th century, Waterloo was a major railroad hub and was home to several large manufacturing companies, including John Deere, which opened a factory in the city in 1918. The city also became a major center for the insurance industry, with companies such as John Hancock, Prudential, and Equitable Life establishing offices in the city.
Geography
Waterloo is located at 42°31'N 92°25'W (42.5167, -92.4167). The city is situated along the Cedar River and is part of the Waterloo-Cedar Falls Metropolitan Statistical Area. The city has a total area of 25.2 square miles (65.3 km2), of which 24.9 square miles (64.5 km2) is land and 0.3 square miles (0.8 km2) is water.
Economy
Waterloo has a diversified economy, with a mix of manufacturing, retail, and service industries. The city is home to several large employers, including John Deere, which has a large manufacturing facility in the city, and the University of Northern Iowa, which is located in the city. Other major employers include the Waterloo Community School District, the City of Waterloo, and the Black Hawk County government.
Demographics
As of the 2010 census, there were 68,406 people, 27,845 households, and 16,945 families residing in the city. The population density was 2,743.3 people per square mile (1,061.2/km2). There were 29,945 housing units at an average density of 1,196.3 per square mile (461.9/km2). The racial makeup of the city was 79.2% White, 11.7% African American, 0.4% Native American, 2.2% Asian, 0.1% Pacific Islander, 4.3% from other races, and 2.2% from two or more races. Hispanic or Latino of any race were 8.7% of the population.
The median income for a household in the city was $37,945, and the median income for a family was $48,945. Males had a median income of $35,945 versus $27,945 for females. The per capita income for the city was $20,945. About 11.2% of families and 14.7% of the population were below the poverty line, including 20.2% of those under age 18 and 8.3% of those age 65 or over.
Common Questions
What is Per Capita Income in Waterloo?
Per Capita income in Waterloo is $31,845.
What is the Median Family Income in Waterloo?
Median Family Income in Waterloo is $70,173.
What is the Median Household income in Waterloo?
Median Household Income in Waterloo is $54,104.
What is Income or Wage Gap in Waterloo?
Income or Wage Gap in Waterloo is 22.9%.
Women in Waterloo earn 77.1 cents for every dollar earned by a man.
What is Family Income Deficit in Waterloo?
Family Income Deficit in Waterloo is $9,909.
Families that are below poverty line in Waterloo earn $9,909 less on average than the poverty threshold level.
What is Inequality or Gini Index in Waterloo?
Inequality or Gini Index in Waterloo is 0.46.
What is the Total Population of Waterloo?
Total Population of Waterloo is 67,256.
What is the Total Male Population of Waterloo?
Total Male Population of Waterloo is 33,483.
What is the Total Female Population of Waterloo?
Total Female Population of Waterloo is 33,773.
What is the Ratio of Males per 100 Females in Waterloo?
There are 99.14 Males per 100 Females in Waterloo.
What is the Ratio of Females per 100 Males in Waterloo?
There are 100.87 Females per 100 Males in Waterloo.
What is the Median Population Age in Waterloo?
Median Population Age in Waterloo is 36.7 Years.
What is the Average Family Size in Waterloo
Average Family Size in Waterloo is 3.0 People.
What is the Average Household Size in Waterloo
Average Household Size in Waterloo is 2.3 People.
How Large is the Labor Force in Waterloo?
There are 34,516 People in the Labor Forcein in Waterloo.
What is the Percentage of People in the Labor Force in Waterloo?
65.2% of People are in the Labor Force in Waterloo.
What is the Unemployment Rate in Waterloo?
Unemployment Rate in Waterloo is 7.1%.