Woodbury County, IA Map & Demographics
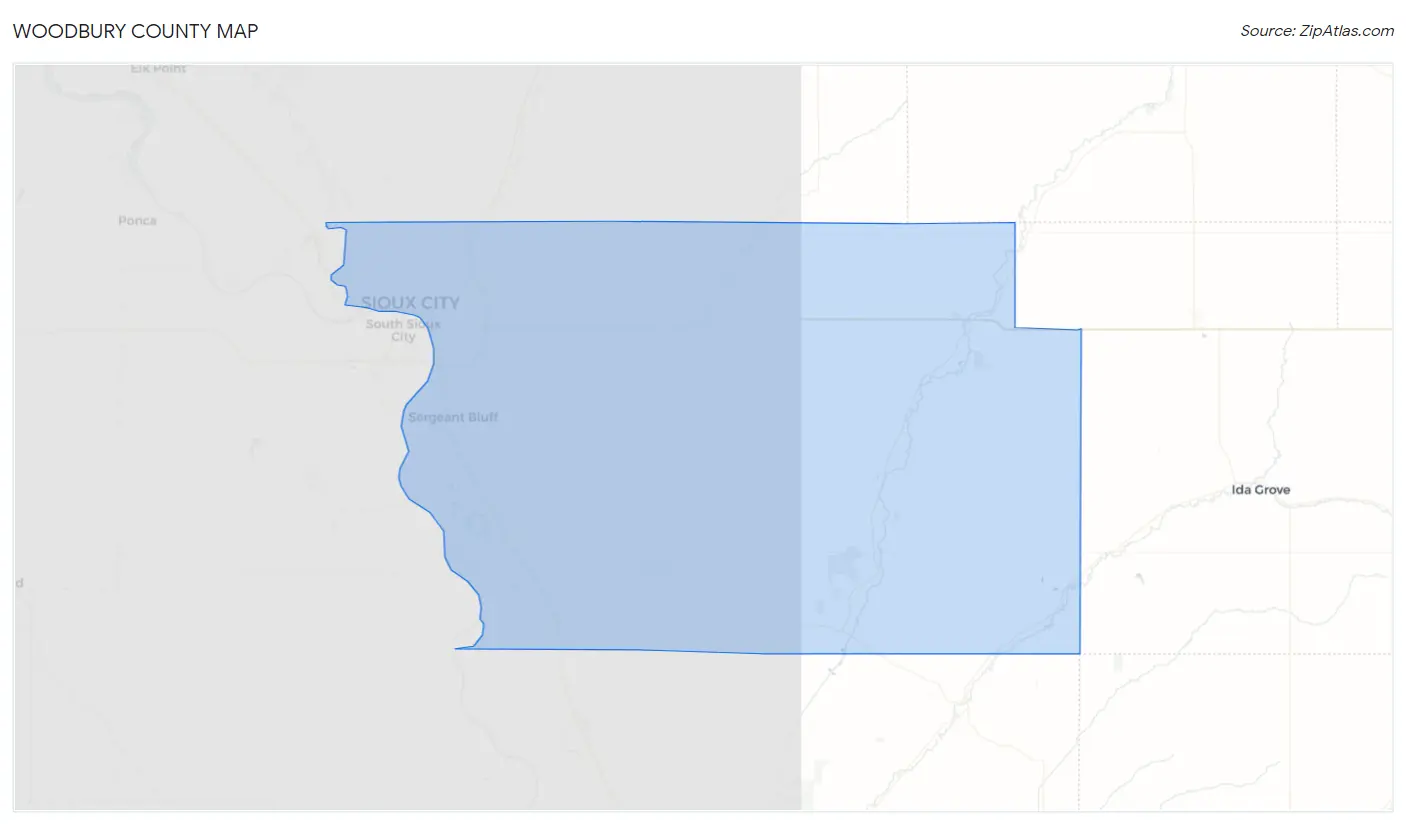
Woodbury County Map
Woodbury County Overview
$33,080
PER CAPITA INCOME
$86,194
AVG FAMILY INCOME
$68,399
AVG HOUSEHOLD INCOME
26.9%
WAGE / INCOME GAP [ % ]
73.1¢/ $1
WAGE / INCOME GAP [ $ ]
$11,076
FAMILY INCOME DEFICIT
0.43
INEQUALITY / GINI INDEX
105,526
TOTAL POPULATION
52,847
MALE POPULATION
52,679
FEMALE POPULATION
100.32
MALES / 100 FEMALES
99.68
FEMALES / 100 MALES
35.9
MEDIAN AGE
3.2
AVG FAMILY SIZE
2.5
AVG HOUSEHOLD SIZE
55,507
LABOR FORCE [ PEOPLE ]
68.2%
PERCENT IN LABOR FORCE
4.5%
UNEMPLOYMENT RATE
Woodbury County Area Codes
Income in Woodbury County
Income Overview in Woodbury County
Per Capita Income in Woodbury County is $33,080, while median incomes of families and households are $86,194 and $68,399 respectively.
| Characteristic | Number | Measure |
| Per Capita Income | 105,526 | $33,080 |
| Median Family Income | 25,848 | $86,194 |
| Mean Family Income | 25,848 | $99,397 |
| Median Household Income | 40,299 | $68,399 |
| Mean Household Income | 40,299 | $85,370 |
| Income Deficit | 25,848 | $11,076 |
| Wage / Income Gap (%) | 105,526 | 26.89% |
| Wage / Income Gap ($) | 105,526 | 73.11¢ per $1 |
| Gini / Inequality Index | 105,526 | 0.43 |
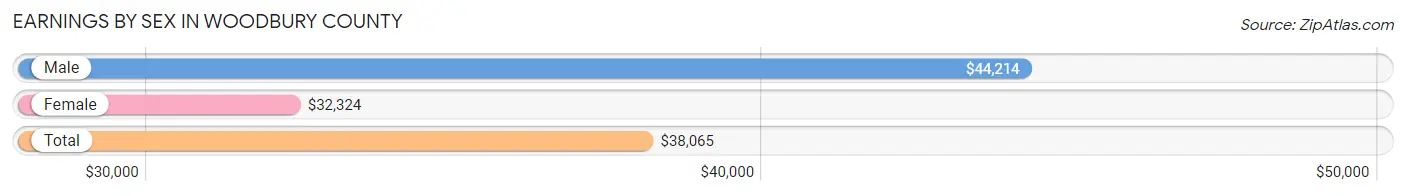
Earnings by Sex in Woodbury County
Average Earnings in Woodbury County are $38,065, $44,214 for men and $32,324 for women, a difference of 26.9%.
| Sex | Number | Average Earnings |
| Male | 30,773 (52.5%) | $44,214 |
| Female | 27,842 (47.5%) | $32,324 |
| Total | 58,615 (100.0%) | $38,065 |
Earnings by Sex by Income Bracket in Woodbury County
The most common earnings brackets in Woodbury County are $75,000 to $99,999 for men (3,622 | 11.8%) and $25,000 to $29,999 for women (2,212 | 7.9%).
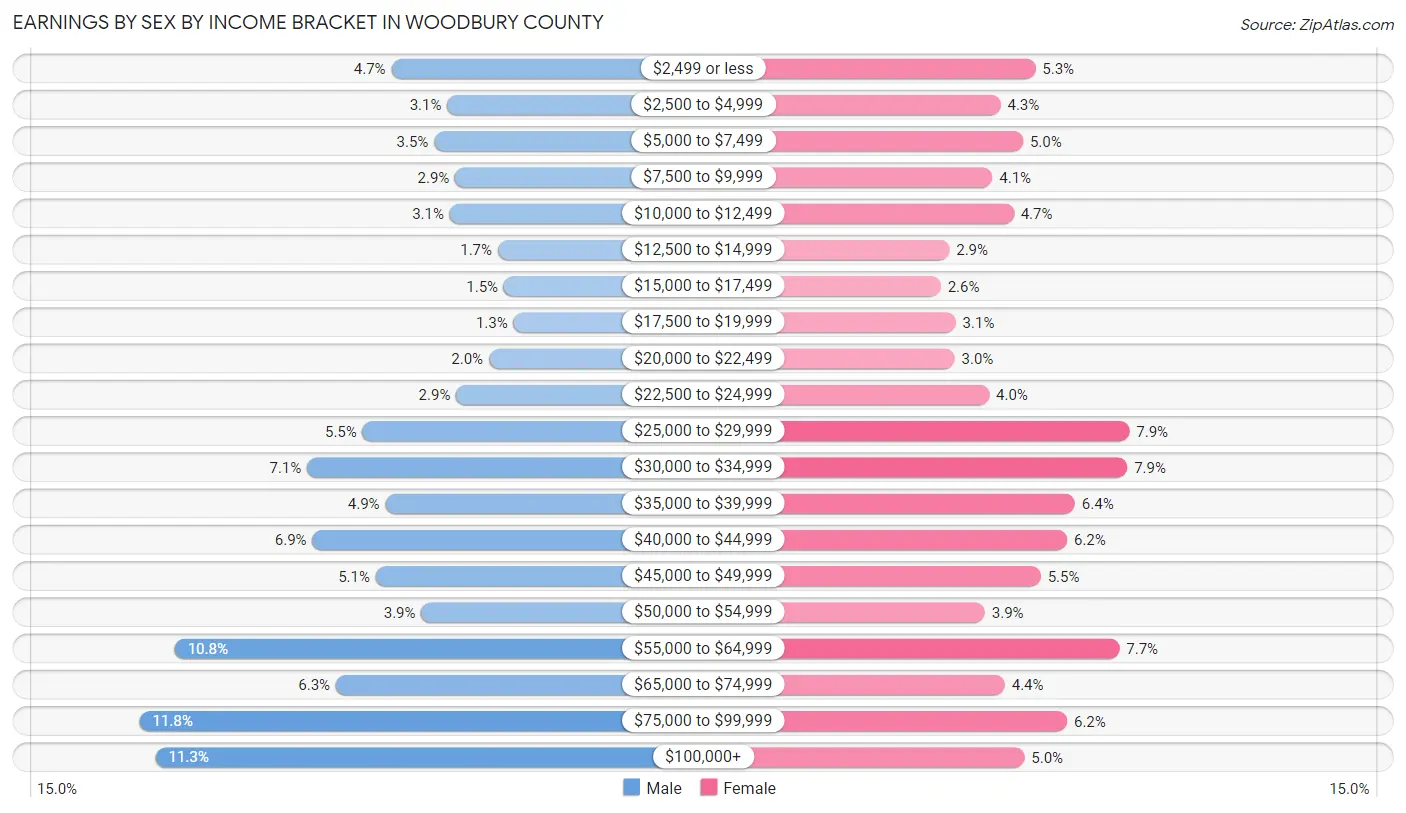
| Income | Male | Female |
| $2,499 or less | 1,444 (4.7%) | 1,475 (5.3%) |
| $2,500 to $4,999 | 959 (3.1%) | 1,202 (4.3%) |
| $5,000 to $7,499 | 1,074 (3.5%) | 1,379 (5.0%) |
| $7,500 to $9,999 | 892 (2.9%) | 1,140 (4.1%) |
| $10,000 to $12,499 | 939 (3.0%) | 1,307 (4.7%) |
| $12,500 to $14,999 | 522 (1.7%) | 802 (2.9%) |
| $15,000 to $17,499 | 470 (1.5%) | 736 (2.6%) |
| $17,500 to $19,999 | 388 (1.3%) | 853 (3.1%) |
| $20,000 to $22,499 | 601 (1.9%) | 843 (3.0%) |
| $22,500 to $24,999 | 884 (2.9%) | 1,113 (4.0%) |
| $25,000 to $29,999 | 1,691 (5.5%) | 2,212 (7.9%) |
| $30,000 to $34,999 | 2,174 (7.1%) | 2,193 (7.9%) |
| $35,000 to $39,999 | 1,497 (4.9%) | 1,784 (6.4%) |
| $40,000 to $44,999 | 2,126 (6.9%) | 1,724 (6.2%) |
| $45,000 to $49,999 | 1,580 (5.1%) | 1,518 (5.4%) |
| $50,000 to $54,999 | 1,185 (3.8%) | 1,080 (3.9%) |
| $55,000 to $64,999 | 3,317 (10.8%) | 2,134 (7.7%) |
| $65,000 to $74,999 | 1,924 (6.2%) | 1,235 (4.4%) |
| $75,000 to $99,999 | 3,622 (11.8%) | 1,723 (6.2%) |
| $100,000+ | 3,484 (11.3%) | 1,389 (5.0%) |
| Total | 30,773 (100.0%) | 27,842 (100.0%) |
Earnings by Sex by Educational Attainment in Woodbury County
Average earnings in Woodbury County are $51,312 for men and $38,007 for women, a difference of 25.9%. Men with an educational attainment of graduate degree enjoy the highest average annual earnings of $90,192, while those with high school diploma education earn the least with $41,543. Women with an educational attainment of graduate degree earn the most with the average annual earnings of $77,580, while those with high school diploma education have the smallest earnings of $29,331.
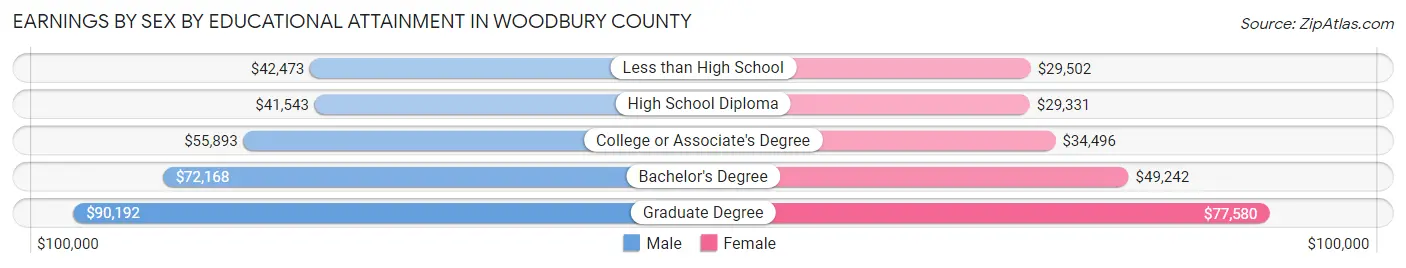
| Educational Attainment | Male Income | Female Income |
| Less than High School | $42,473 | $29,502 |
| High School Diploma | $41,543 | $29,331 |
| College or Associate's Degree | $55,893 | $34,496 |
| Bachelor's Degree | $72,168 | $49,242 |
| Graduate Degree | $90,192 | $77,580 |
| Total | $51,312 | $38,007 |
Family Income in Woodbury County
Family Income Brackets in Woodbury County
According to the Woodbury County family income data, there are 6,410 families falling into the $100,000 to $149,999 income range, which is the most common income bracket and makes up 24.8% of all families. Conversely, the $10,000 to $14,999 income bracket is the least frequent group with only 491 families (1.9%) belonging to this category.
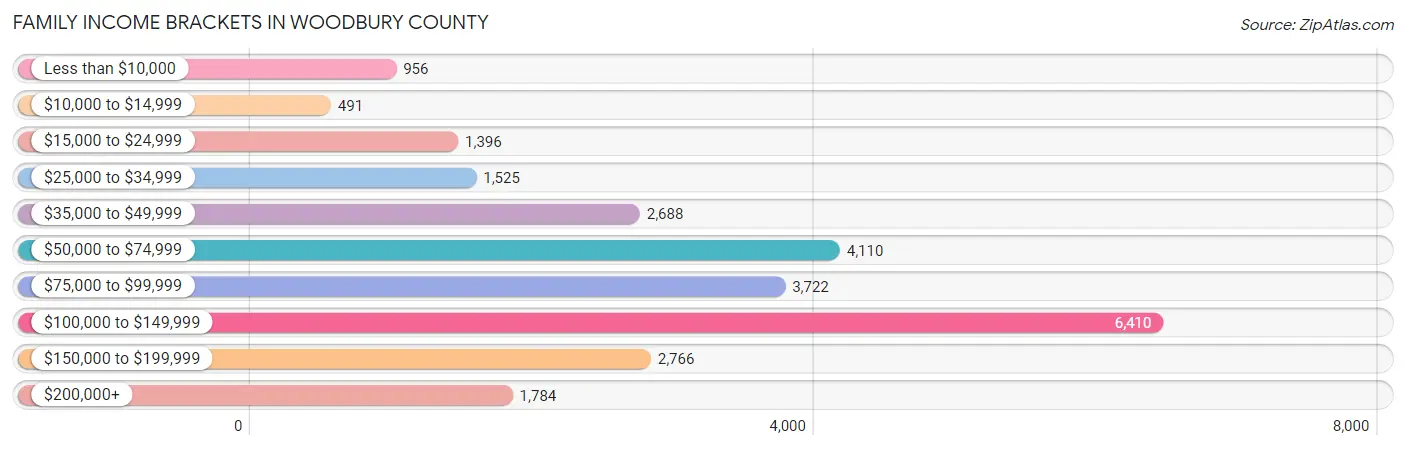
| Income Bracket | # Families | % Families |
| Less than $10,000 | 956 | 3.7% |
| $10,000 to $14,999 | 491 | 1.9% |
| $15,000 to $24,999 | 1,396 | 5.4% |
| $25,000 to $34,999 | 1,525 | 5.9% |
| $35,000 to $49,999 | 2,688 | 10.4% |
| $50,000 to $74,999 | 4,110 | 15.9% |
| $75,000 to $99,999 | 3,722 | 14.4% |
| $100,000 to $149,999 | 6,410 | 24.8% |
| $150,000 to $199,999 | 2,766 | 10.7% |
| $200,000+ | 1,784 | 6.9% |
Family Income by Famaliy Size in Woodbury County
5-person families (2,197 | 8.5%) account for the highest median family income in Woodbury County with $102,652 per family, while 2-person families (11,672 | 45.2%) have the highest median income of $38,840 per family member.
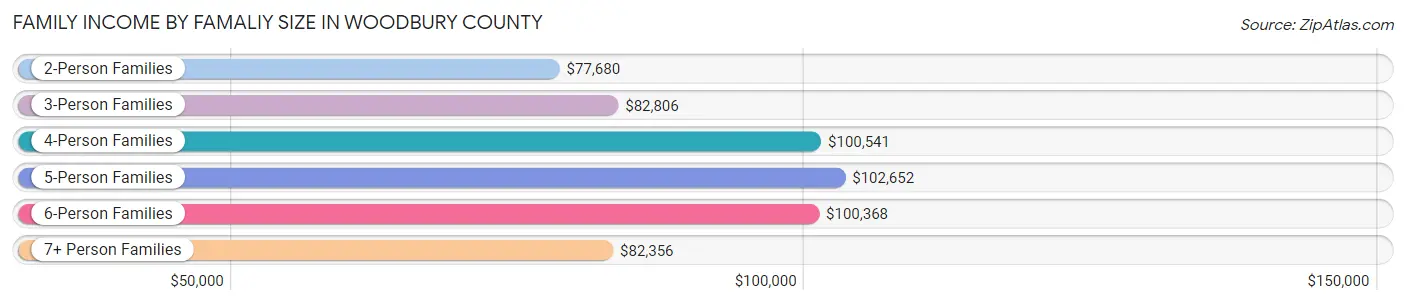
| Income Bracket | # Families | Median Income |
| 2-Person Families | 11,672 (45.2%) | $77,680 |
| 3-Person Families | 5,386 (20.8%) | $82,806 |
| 4-Person Families | 5,356 (20.7%) | $100,541 |
| 5-Person Families | 2,197 (8.5%) | $102,652 |
| 6-Person Families | 825 (3.2%) | $100,368 |
| 7+ Person Families | 412 (1.6%) | $82,356 |
| Total | 25,848 (100.0%) | $86,194 |
Family Income by Number of Earners in Woodbury County
The median family income in Woodbury County is $86,194, with families comprising 3+ earners (3,935) having the highest median family income of $141,808, while families with no earners (3,240) have the lowest median family income of $47,448, accounting for 15.2% and 12.5% of families, respectively.
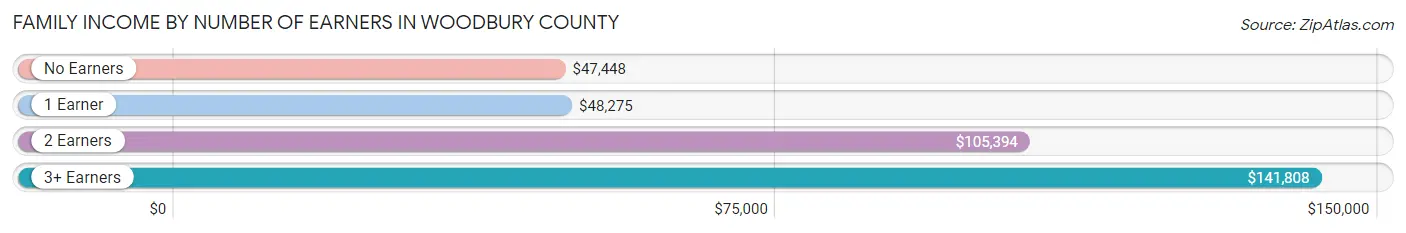
| Number of Earners | # Families | Median Income |
| No Earners | 3,240 (12.5%) | $47,448 |
| 1 Earner | 7,986 (30.9%) | $48,275 |
| 2 Earners | 10,687 (41.3%) | $105,394 |
| 3+ Earners | 3,935 (15.2%) | $141,808 |
| Total | 25,848 (100.0%) | $86,194 |
Household Income in Woodbury County
Household Income Brackets in Woodbury County
With 8,140 households falling in the category, the $100,000 to $149,999 income range is the most frequent in Woodbury County, accounting for 20.2% of all households. In contrast, only 1,652 households (4.1%) fall into the $10,000 to $14,999 income bracket, making it the least populous group.
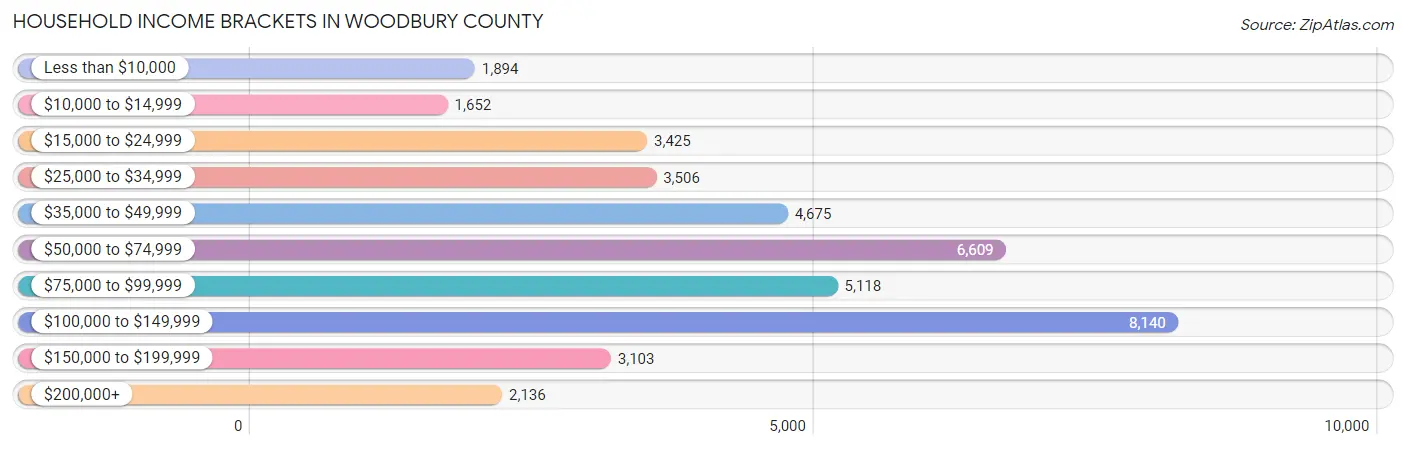
| Income Bracket | # Households | % Households |
| Less than $10,000 | 1,894 | 4.7% |
| $10,000 to $14,999 | 1,652 | 4.1% |
| $15,000 to $24,999 | 3,425 | 8.5% |
| $25,000 to $34,999 | 3,506 | 8.7% |
| $35,000 to $49,999 | 4,675 | 11.6% |
| $50,000 to $74,999 | 6,609 | 16.4% |
| $75,000 to $99,999 | 5,118 | 12.7% |
| $100,000 to $149,999 | 8,140 | 20.2% |
| $150,000 to $199,999 | 3,103 | 7.7% |
| $200,000+ | 2,136 | 5.3% |
Household Income by Householder Age in Woodbury County
The median household income in Woodbury County is $68,399, with the highest median household income of $87,850 found in the 45 to 64 years age bracket for the primary householder. A total of 14,733 households (36.6%) fall into this category. Meanwhile, the 65+ years age bracket for the primary householder has the lowest median household income of $50,838, with 10,398 households (25.8%) in this group.
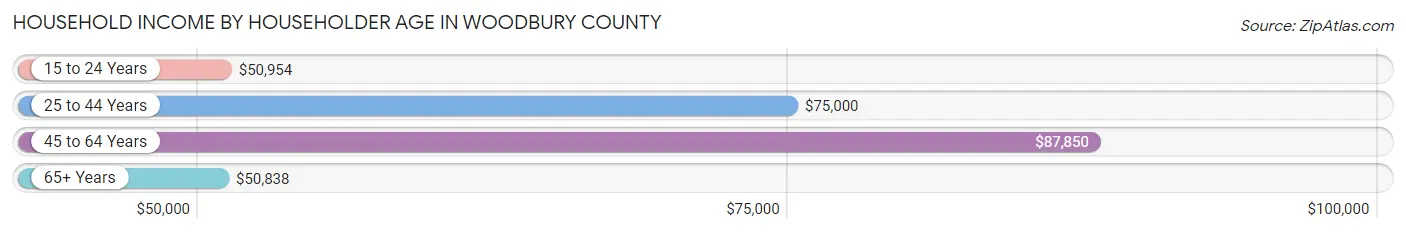
| Income Bracket | # Households | Median Income |
| 15 to 24 Years | 2,126 (5.3%) | $50,954 |
| 25 to 44 Years | 13,042 (32.4%) | $75,000 |
| 45 to 64 Years | 14,733 (36.6%) | $87,850 |
| 65+ Years | 10,398 (25.8%) | $50,838 |
| Total | 40,299 (100.0%) | $68,399 |
Poverty in Woodbury County
Income Below Poverty by Sex and Age in Woodbury County
With 12.2% poverty level for males and 14.8% for females among the residents of Woodbury County, 15 year old males and 18 to 24 year old females are the most vulnerable to poverty, with 276 males (32.2%) and 1,083 females (22.3%) in their respective age groups living below the poverty level.
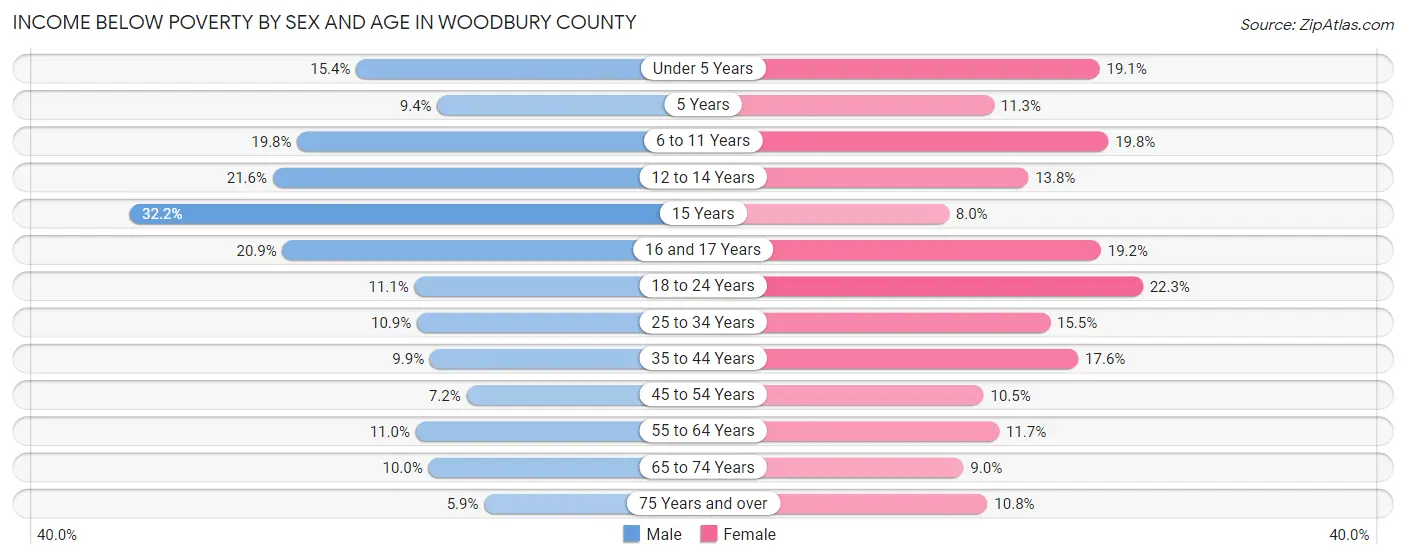
| Age Bracket | Male | Female |
| Under 5 Years | 561 (15.4%) | 656 (19.1%) |
| 5 Years | 80 (9.3%) | 100 (11.3%) |
| 6 to 11 Years | 918 (19.8%) | 872 (19.8%) |
| 12 to 14 Years | 467 (21.6%) | 287 (13.8%) |
| 15 Years | 276 (32.2%) | 64 (8.0%) |
| 16 and 17 Years | 313 (20.8%) | 266 (19.2%) |
| 18 to 24 Years | 525 (11.1%) | 1,083 (22.3%) |
| 25 to 34 Years | 750 (10.9%) | 972 (15.5%) |
| 35 to 44 Years | 641 (9.9%) | 1,066 (17.5%) |
| 45 to 54 Years | 441 (7.2%) | 671 (10.5%) |
| 55 to 64 Years | 693 (11.0%) | 715 (11.7%) |
| 65 to 74 Years | 465 (10.0%) | 449 (9.0%) |
| 75 Years and over | 146 (5.9%) | 399 (10.8%) |
| Total | 6,276 (12.2%) | 7,600 (14.8%) |
Income Above Poverty by Sex and Age in Woodbury County
According to the poverty statistics in Woodbury County, males aged 75 years and over and females aged 15 years are the age groups that are most secure financially, with 94.1% of males and 92.0% of females in these age groups living above the poverty line.
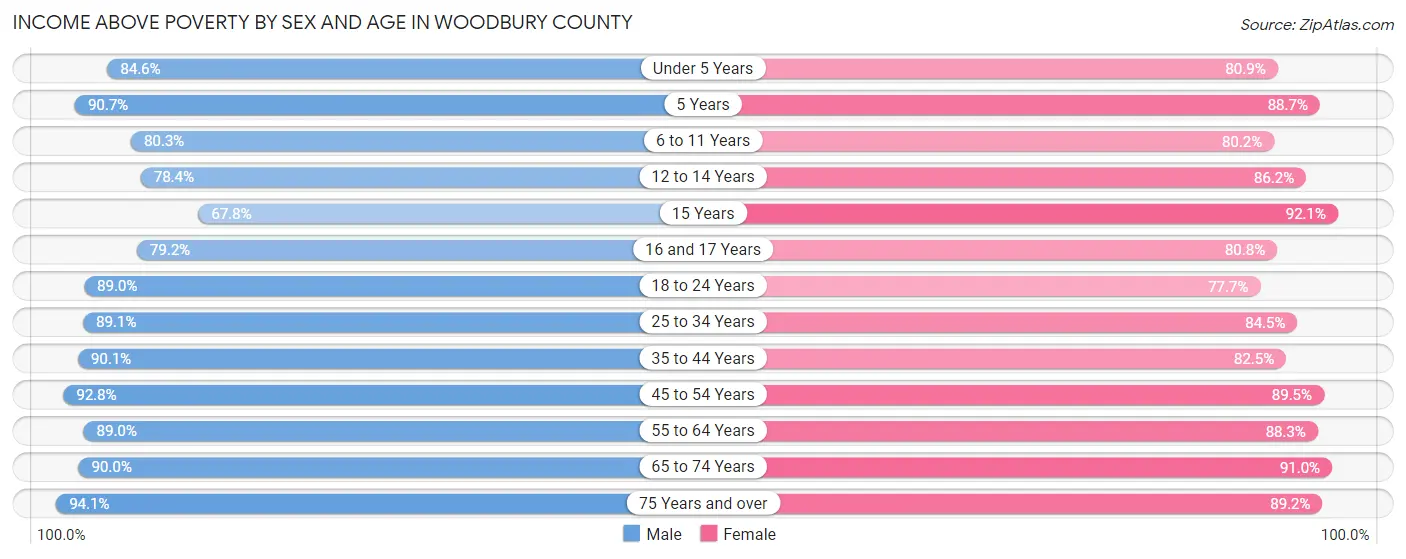
| Age Bracket | Male | Female |
| Under 5 Years | 3,089 (84.6%) | 2,771 (80.9%) |
| 5 Years | 776 (90.6%) | 786 (88.7%) |
| 6 to 11 Years | 3,729 (80.2%) | 3,537 (80.2%) |
| 12 to 14 Years | 1,698 (78.4%) | 1,787 (86.2%) |
| 15 Years | 580 (67.8%) | 741 (92.0%) |
| 16 and 17 Years | 1,188 (79.1%) | 1,117 (80.8%) |
| 18 to 24 Years | 4,225 (88.9%) | 3,764 (77.7%) |
| 25 to 34 Years | 6,156 (89.1%) | 5,314 (84.5%) |
| 35 to 44 Years | 5,833 (90.1%) | 5,007 (82.5%) |
| 45 to 54 Years | 5,689 (92.8%) | 5,700 (89.5%) |
| 55 to 64 Years | 5,630 (89.0%) | 5,414 (88.3%) |
| 65 to 74 Years | 4,179 (90.0%) | 4,521 (91.0%) |
| 75 Years and over | 2,342 (94.1%) | 3,292 (89.2%) |
| Total | 45,114 (87.8%) | 43,751 (85.2%) |
Income Below Poverty Among Married-Couple Families in Woodbury County
The poverty statistics for married-couple families in Woodbury County show that 4.0% or 721 of the total 18,249 families live below the poverty line. Families with 5 or more children have the highest poverty rate of 17.4%, comprising of 45 families. On the other hand, families with 1 or 2 children have the lowest poverty rate of 2.6%, which includes 158 families.
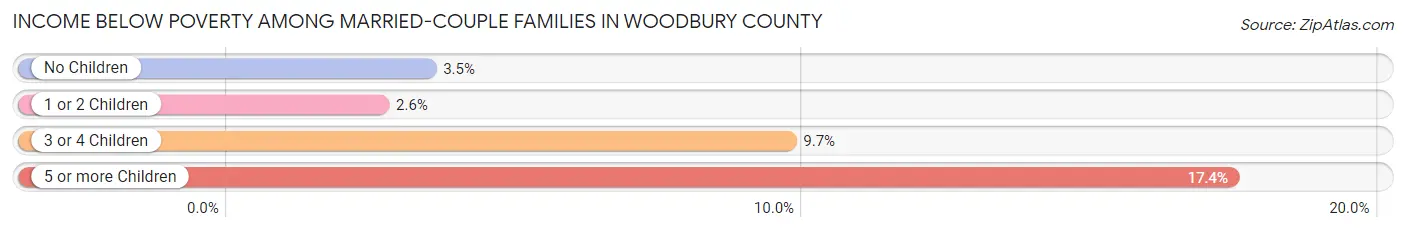
| Children | Above Poverty | Below Poverty |
| No Children | 9,959 (96.6%) | 356 (3.5%) |
| 1 or 2 Children | 5,851 (97.4%) | 158 (2.6%) |
| 3 or 4 Children | 1,505 (90.3%) | 162 (9.7%) |
| 5 or more Children | 213 (82.6%) | 45 (17.4%) |
| Total | 17,528 (96.1%) | 721 (4.0%) |
Income Below Poverty Among Single-Parent Households in Woodbury County
According to the poverty data in Woodbury County, 8.9% or 202 single-father households and 30.8% or 1,642 single-mother households are living below the poverty line. Among single-father households, those with 1 or 2 children have the highest poverty rate, with 137 households (11.0%) experiencing poverty. Likewise, among single-mother households, those with 5 or more children have the highest poverty rate, with 36 households (62.1%) falling below the poverty line.
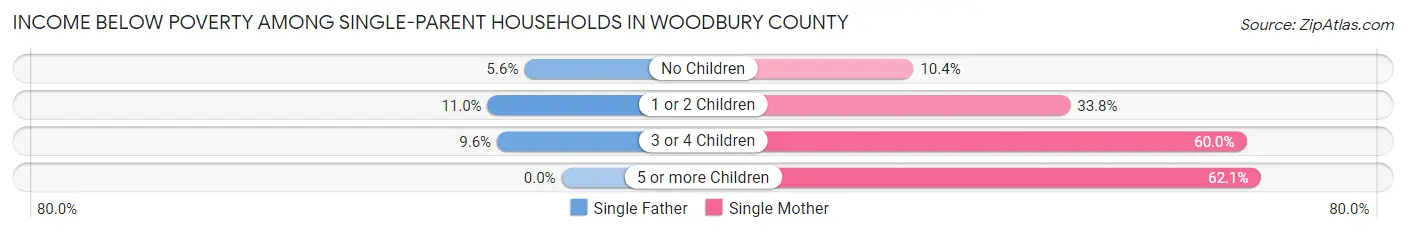
| Children | Single Father | Single Mother |
| No Children | 42 (5.6%) | 167 (10.4%) |
| 1 or 2 Children | 137 (11.0%) | 983 (33.8%) |
| 3 or 4 Children | 23 (9.6%) | 456 (60.0%) |
| 5 or more Children | 0 (0.0%) | 36 (62.1%) |
| Total | 202 (8.9%) | 1,642 (30.8%) |
Income Below Poverty Among Married-Couple vs Single-Parent Households in Woodbury County
The poverty data for Woodbury County shows that 721 of the married-couple family households (4.0%) and 1,844 of the single-parent households (24.3%) are living below the poverty level. Within the married-couple family households, those with 5 or more children have the highest poverty rate, with 45 households (17.4%) falling below the poverty line. Among the single-parent households, those with 3 or 4 children have the highest poverty rate, with 479 household (47.9%) living below poverty.
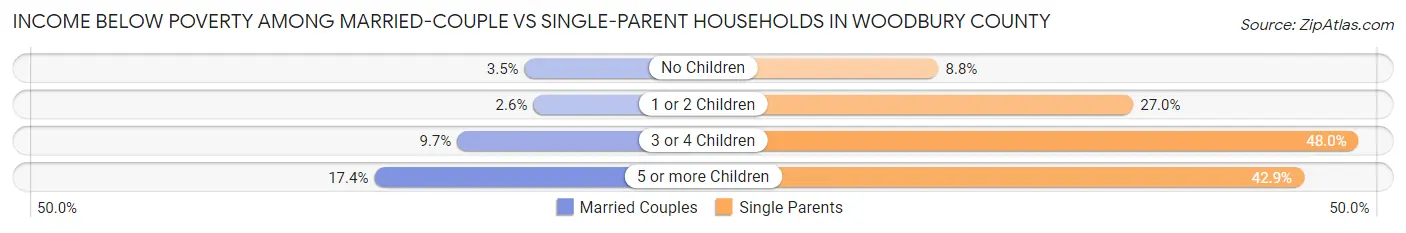
| Children | Married-Couple Families | Single-Parent Households |
| No Children | 356 (3.5%) | 209 (8.8%) |
| 1 or 2 Children | 158 (2.6%) | 1,120 (27.0%) |
| 3 or 4 Children | 162 (9.7%) | 479 (47.9%) |
| 5 or more Children | 45 (17.4%) | 36 (42.9%) |
| Total | 721 (4.0%) | 1,844 (24.3%) |
Race in Woodbury County
The most populous races in Woodbury County are White / Caucasian (81,084 | 76.8%), Hispanic or Latino (19,087 | 18.1%), and Two or more Races (11,521 | 10.9%).
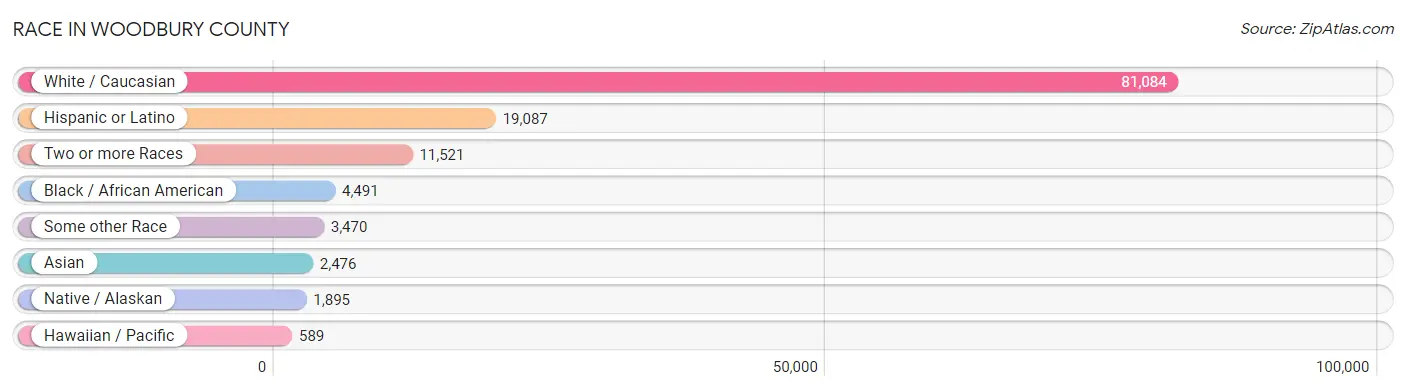
| Race | # Population | % Population |
| Asian | 2,476 | 2.4% |
| Black / African American | 4,491 | 4.3% |
| Hawaiian / Pacific | 589 | 0.6% |
| Hispanic or Latino | 19,087 | 18.1% |
| Native / Alaskan | 1,895 | 1.8% |
| White / Caucasian | 81,084 | 76.8% |
| Two or more Races | 11,521 | 10.9% |
| Some other Race | 3,470 | 3.3% |
| Total | 105,526 | 100.0% |
Ancestry in Woodbury County
The most populous ancestries reported in Woodbury County are German (29,124 | 27.6%), Mexican (13,909 | 13.2%), Irish (12,068 | 11.4%), English (7,439 | 7.0%), and American (5,600 | 5.3%), together accounting for 64.6% of all Woodbury County residents.
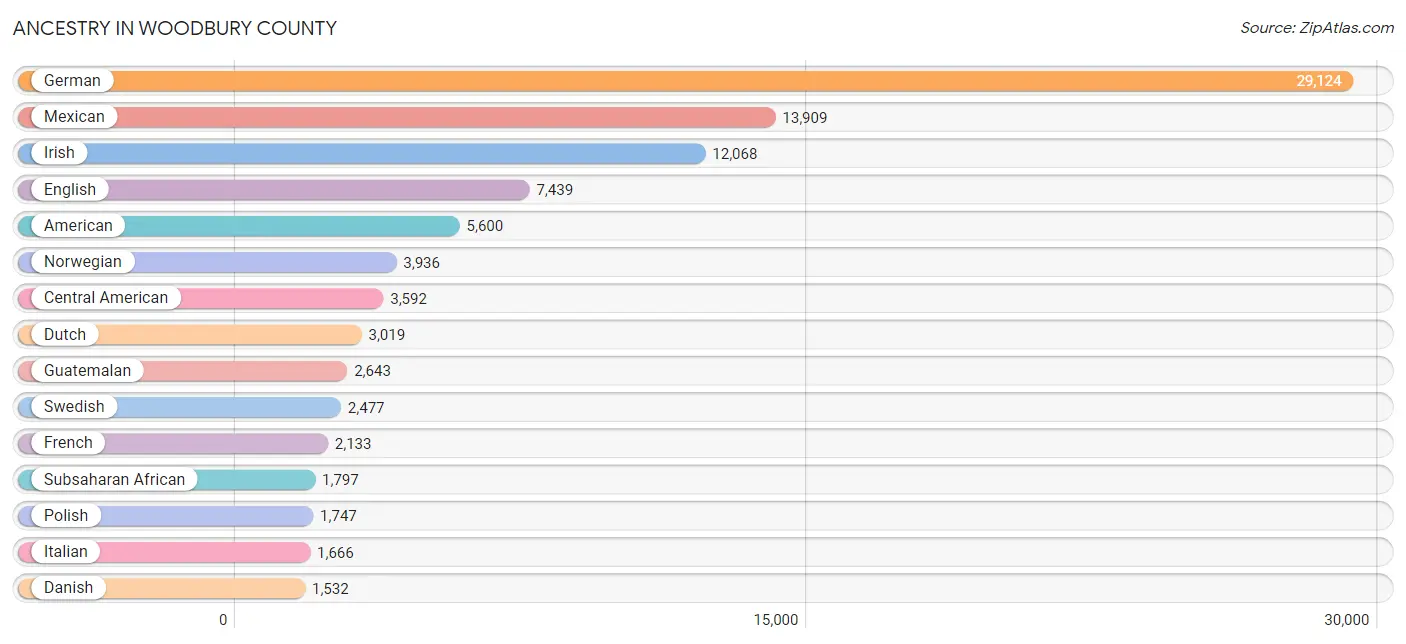
| Ancestry | # Population | % Population |
| Afghan | 130 | 0.1% |
| African | 421 | 0.4% |
| Albanian | 5 | 0.0% |
| American | 5,600 | 5.3% |
| Apache | 1 | 0.0% |
| Arab | 809 | 0.8% |
| Armenian | 37 | 0.0% |
| Austrian | 18 | 0.0% |
| Belgian | 26 | 0.0% |
| Bhutanese | 110 | 0.1% |
| Bolivian | 64 | 0.1% |
| British | 321 | 0.3% |
| Burmese | 308 | 0.3% |
| Cajun | 10 | 0.0% |
| Canadian | 110 | 0.1% |
| Cape Verdean | 5 | 0.0% |
| Celtic | 1 | 0.0% |
| Central American | 3,592 | 3.4% |
| Central American Indian | 25 | 0.0% |
| Cherokee | 56 | 0.1% |
| Cheyenne | 115 | 0.1% |
| Chickasaw | 2 | 0.0% |
| Chilean | 54 | 0.1% |
| Chippewa | 51 | 0.1% |
| Choctaw | 17 | 0.0% |
| Colombian | 53 | 0.1% |
| Comanche | 3 | 0.0% |
| Croatian | 74 | 0.1% |
| Cuban | 86 | 0.1% |
| Cypriot | 11 | 0.0% |
| Czech | 874 | 0.8% |
| Czechoslovakian | 52 | 0.1% |
| Danish | 1,532 | 1.5% |
| Dominican | 85 | 0.1% |
| Dutch | 3,019 | 2.9% |
| Eastern European | 73 | 0.1% |
| Ecuadorian | 31 | 0.0% |
| Egyptian | 11 | 0.0% |
| English | 7,439 | 7.0% |
| Ethiopian | 878 | 0.8% |
| European | 1,506 | 1.4% |
| Finnish | 8 | 0.0% |
| French | 2,133 | 2.0% |
| French Canadian | 414 | 0.4% |
| German | 29,124 | 27.6% |
| German Russian | 16 | 0.0% |
| Greek | 215 | 0.2% |
| Guamanian / Chamorro | 151 | 0.1% |
| Guatemalan | 2,643 | 2.5% |
| Honduran | 136 | 0.1% |
| Hungarian | 40 | 0.0% |
| Icelander | 127 | 0.1% |
| Indian (Asian) | 194 | 0.2% |
| Indonesian | 30 | 0.0% |
| Iranian | 8 | 0.0% |
| Irish | 12,068 | 11.4% |
| Iroquois | 85 | 0.1% |
| Italian | 1,666 | 1.6% |
| Jamaican | 13 | 0.0% |
| Japanese | 158 | 0.2% |
| Jordanian | 57 | 0.1% |
| Korean | 387 | 0.4% |
| Lebanese | 244 | 0.2% |
| Lithuanian | 90 | 0.1% |
| Luxembourger | 153 | 0.1% |
| Malaysian | 623 | 0.6% |
| Mexican | 13,909 | 13.2% |
| Mexican American Indian | 115 | 0.1% |
| Mongolian | 13 | 0.0% |
| Native Hawaiian | 34 | 0.0% |
| Navajo | 82 | 0.1% |
| Nicaraguan | 120 | 0.1% |
| Nigerian | 11 | 0.0% |
| Northern European | 162 | 0.2% |
| Norwegian | 3,936 | 3.7% |
| Pakistani | 23 | 0.0% |
| Panamanian | 17 | 0.0% |
| Pennsylvania German | 33 | 0.0% |
| Peruvian | 29 | 0.0% |
| Polish | 1,747 | 1.7% |
| Portuguese | 50 | 0.1% |
| Puerto Rican | 491 | 0.5% |
| Romanian | 33 | 0.0% |
| Russian | 444 | 0.4% |
| Salvadoran | 575 | 0.5% |
| Samoan | 295 | 0.3% |
| Scandinavian | 378 | 0.4% |
| Scotch-Irish | 623 | 0.6% |
| Scottish | 930 | 0.9% |
| Senegalese | 43 | 0.0% |
| Serbian | 9 | 0.0% |
| Sioux | 820 | 0.8% |
| Slavic | 5 | 0.0% |
| Slovak | 15 | 0.0% |
| Somali | 34 | 0.0% |
| South American | 235 | 0.2% |
| South American Indian | 10 | 0.0% |
| Spaniard | 93 | 0.1% |
| Spanish | 38 | 0.0% |
| Sri Lankan | 1,334 | 1.3% |
| Subsaharan African | 1,797 | 1.7% |
| Sudanese | 33 | 0.0% |
| Swedish | 2,477 | 2.4% |
| Swiss | 188 | 0.2% |
| Syrian | 418 | 0.4% |
| Thai | 75 | 0.1% |
| Turkish | 4 | 0.0% |
| Ukrainian | 42 | 0.0% |
| Venezuelan | 4 | 0.0% |
| Vietnamese | 2 | 0.0% |
| Welsh | 355 | 0.3% |
| West Indian | 118 | 0.1% |
| Yugoslavian | 8 | 0.0% | View All 113 Rows |
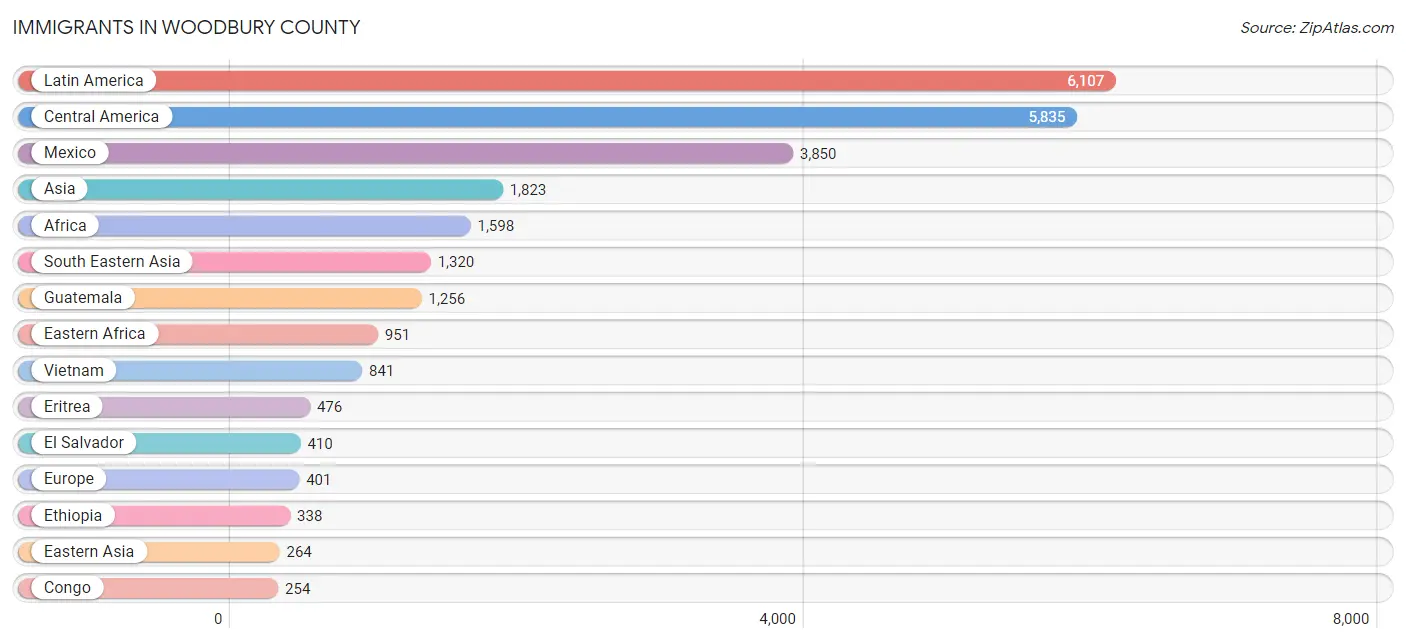
Immigrants in Woodbury County
The most numerous immigrant groups reported in Woodbury County came from Latin America (6,107 | 5.8%), Central America (5,835 | 5.5%), Mexico (3,850 | 3.6%), Asia (1,823 | 1.7%), and Africa (1,598 | 1.5%), together accounting for 18.2% of all Woodbury County residents.
| Immigration Origin | # Population | % Population |
| Afghanistan | 130 | 0.1% |
| Africa | 1,598 | 1.5% |
| Asia | 1,823 | 1.7% |
| Bahamas | 16 | 0.0% |
| Bangladesh | 2 | 0.0% |
| Belgium | 31 | 0.0% |
| Cambodia | 47 | 0.0% |
| Canada | 49 | 0.1% |
| Caribbean | 179 | 0.2% |
| Central America | 5,835 | 5.5% |
| Chile | 10 | 0.0% |
| China | 58 | 0.1% |
| Colombia | 42 | 0.0% |
| Congo | 254 | 0.2% |
| Cuba | 79 | 0.1% |
| Czechoslovakia | 1 | 0.0% |
| Eastern Africa | 951 | 0.9% |
| Eastern Asia | 264 | 0.3% |
| Eastern Europe | 40 | 0.0% |
| El Salvador | 410 | 0.4% |
| Eritrea | 476 | 0.4% |
| Ethiopia | 338 | 0.3% |
| Europe | 401 | 0.4% |
| Germany | 129 | 0.1% |
| Greece | 93 | 0.1% |
| Guatemala | 1,256 | 1.2% |
| Honduras | 51 | 0.1% |
| India | 45 | 0.0% |
| Iran | 8 | 0.0% |
| Ireland | 13 | 0.0% |
| Italy | 5 | 0.0% |
| Japan | 8 | 0.0% |
| Jordan | 43 | 0.0% |
| Kenya | 103 | 0.1% |
| Korea | 198 | 0.2% |
| Laos | 192 | 0.2% |
| Latin America | 6,107 | 5.8% |
| Liberia | 37 | 0.0% |
| Malaysia | 31 | 0.0% |
| Mexico | 3,850 | 3.6% |
| Micronesia | 180 | 0.2% |
| Middle Africa | 254 | 0.2% |
| Netherlands | 9 | 0.0% |
| Nicaragua | 157 | 0.2% |
| Northern Africa | 67 | 0.1% |
| Northern Europe | 90 | 0.1% |
| Oceania | 180 | 0.2% |
| Panama | 17 | 0.0% |
| Peru | 29 | 0.0% |
| Philippines | 137 | 0.1% |
| Poland | 16 | 0.0% |
| Russia | 19 | 0.0% |
| Senegal | 43 | 0.0% |
| Somalia | 34 | 0.0% |
| South America | 93 | 0.1% |
| South Central Asia | 185 | 0.2% |
| South Eastern Asia | 1,320 | 1.3% |
| Southern Europe | 98 | 0.1% |
| Sudan | 67 | 0.1% |
| Sweden | 26 | 0.0% |
| Switzerland | 4 | 0.0% |
| Thailand | 42 | 0.0% |
| Ukraine | 4 | 0.0% |
| Venezuela | 12 | 0.0% |
| Vietnam | 841 | 0.8% |
| West Indies | 84 | 0.1% |
| Western Africa | 178 | 0.2% |
| Western Asia | 54 | 0.1% |
| Western Europe | 173 | 0.2% | View All 69 Rows |
Sex and Age in Woodbury County
Sex and Age in Woodbury County
The most populous age groups in Woodbury County are 15 to 19 Years (4,027 | 7.6%) for men and 5 to 9 Years (3,956 | 7.5%) for women.
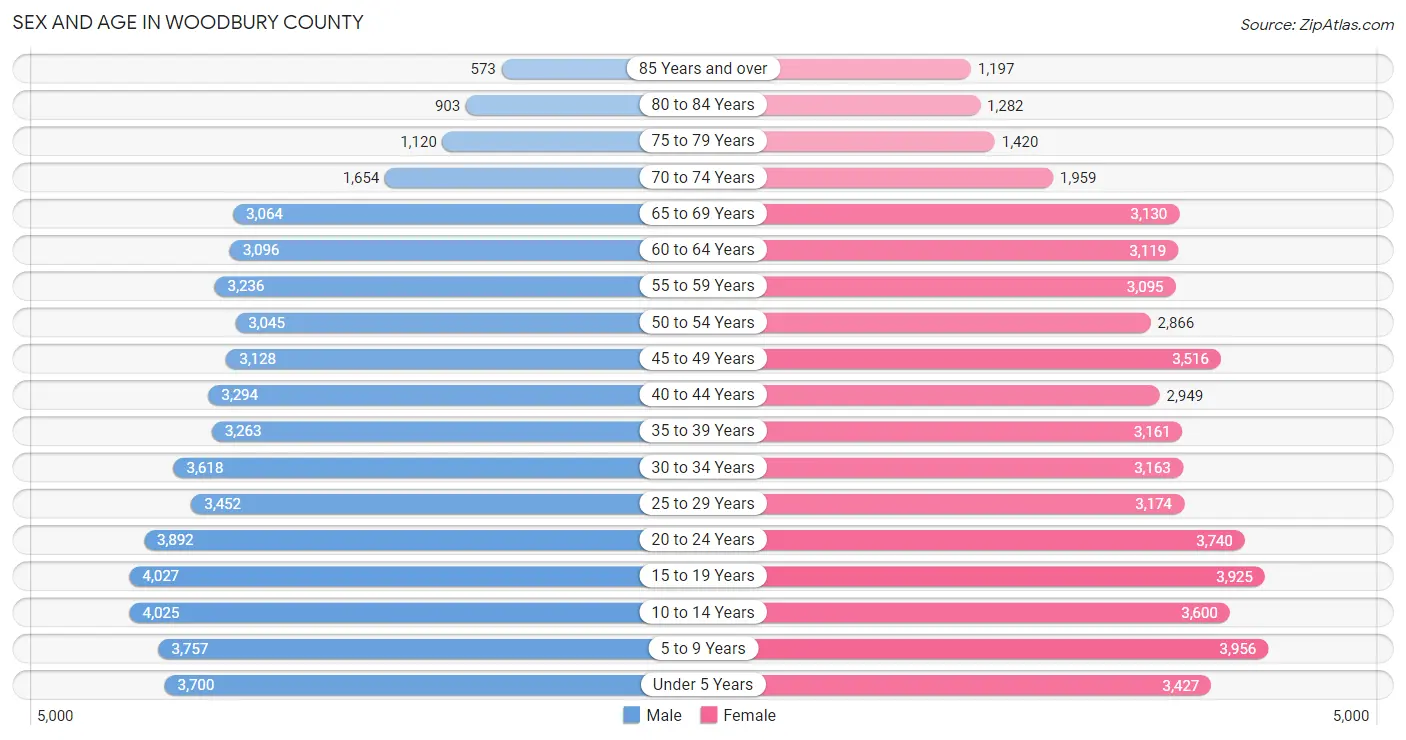
| Age Bracket | Male | Female |
| Under 5 Years | 3,700 (7.0%) | 3,427 (6.5%) |
| 5 to 9 Years | 3,757 (7.1%) | 3,956 (7.5%) |
| 10 to 14 Years | 4,025 (7.6%) | 3,600 (6.8%) |
| 15 to 19 Years | 4,027 (7.6%) | 3,925 (7.4%) |
| 20 to 24 Years | 3,892 (7.4%) | 3,740 (7.1%) |
| 25 to 29 Years | 3,452 (6.5%) | 3,174 (6.0%) |
| 30 to 34 Years | 3,618 (6.9%) | 3,163 (6.0%) |
| 35 to 39 Years | 3,263 (6.2%) | 3,161 (6.0%) |
| 40 to 44 Years | 3,294 (6.2%) | 2,949 (5.6%) |
| 45 to 49 Years | 3,128 (5.9%) | 3,516 (6.7%) |
| 50 to 54 Years | 3,045 (5.8%) | 2,866 (5.4%) |
| 55 to 59 Years | 3,236 (6.1%) | 3,095 (5.9%) |
| 60 to 64 Years | 3,096 (5.9%) | 3,119 (5.9%) |
| 65 to 69 Years | 3,064 (5.8%) | 3,130 (5.9%) |
| 70 to 74 Years | 1,654 (3.1%) | 1,959 (3.7%) |
| 75 to 79 Years | 1,120 (2.1%) | 1,420 (2.7%) |
| 80 to 84 Years | 903 (1.7%) | 1,282 (2.4%) |
| 85 Years and over | 573 (1.1%) | 1,197 (2.3%) |
| Total | 52,847 (100.0%) | 52,679 (100.0%) |
Families and Households in Woodbury County
Median Family Size in Woodbury County
The median family size in Woodbury County is 3.16 persons per family, with married-couple families (18,249 | 70.6%) accounting for the largest median family size of 3.24 persons per family. On the other hand, single male/father families (2,264 | 8.8%) represent the smallest median family size with 2.77 persons per family.
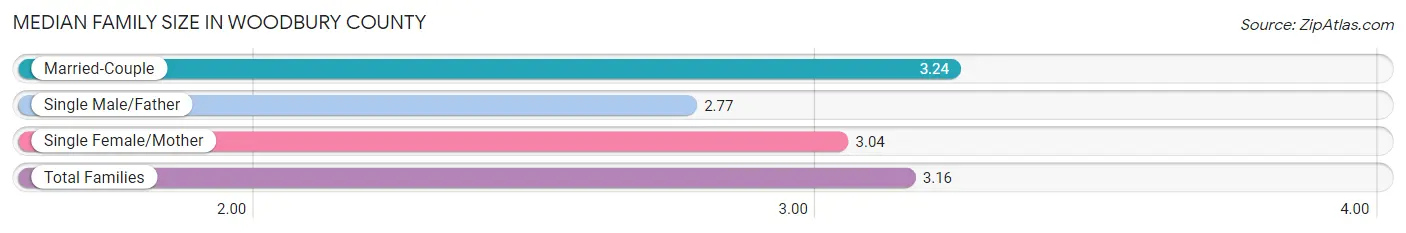
| Family Type | # Families | Family Size |
| Married-Couple | 18,249 (70.6%) | 3.24 |
| Single Male/Father | 2,264 (8.8%) | 2.77 |
| Single Female/Mother | 5,335 (20.6%) | 3.04 |
| Total Families | 25,848 (100.0%) | 3.16 |
Median Household Size in Woodbury County
The median household size in Woodbury County is 2.55 persons per household, with single female/mother households (5,335 | 13.2%) accounting for the largest median household size of 3.28 persons per household. non-family households (14,451 | 35.9%) represent the smallest median household size with 1.28 persons per household.
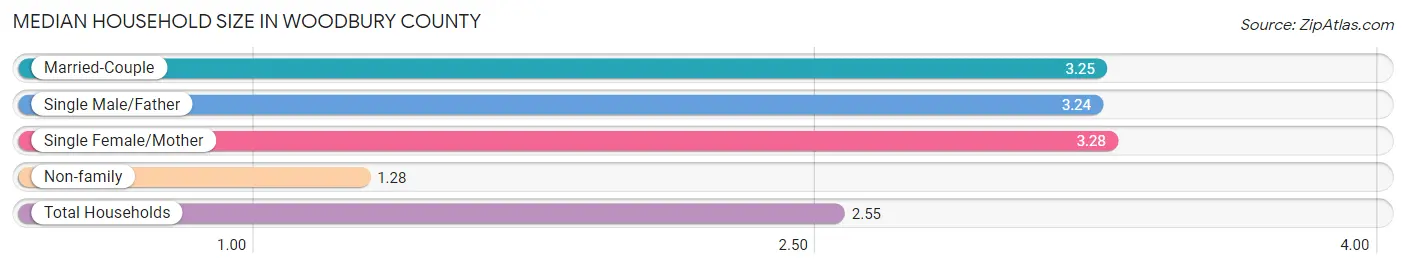
| Household Type | # Households | Household Size |
| Married-Couple | 18,249 (45.3%) | 3.25 |
| Single Male/Father | 2,264 (5.6%) | 3.24 |
| Single Female/Mother | 5,335 (13.2%) | 3.28 |
| Non-family | 14,451 (35.9%) | 1.28 |
| Total Households | 40,299 (100.0%) | 2.55 |
Household Size by Marriage Status in Woodbury County
Out of a total of 40,299 households in Woodbury County, 25,848 (64.1%) are family households, while 14,451 (35.9%) are nonfamily households. The most numerous type of family households are 2-person households, comprising 10,628, and the most common type of nonfamily households are 1-person households, comprising 11,410.
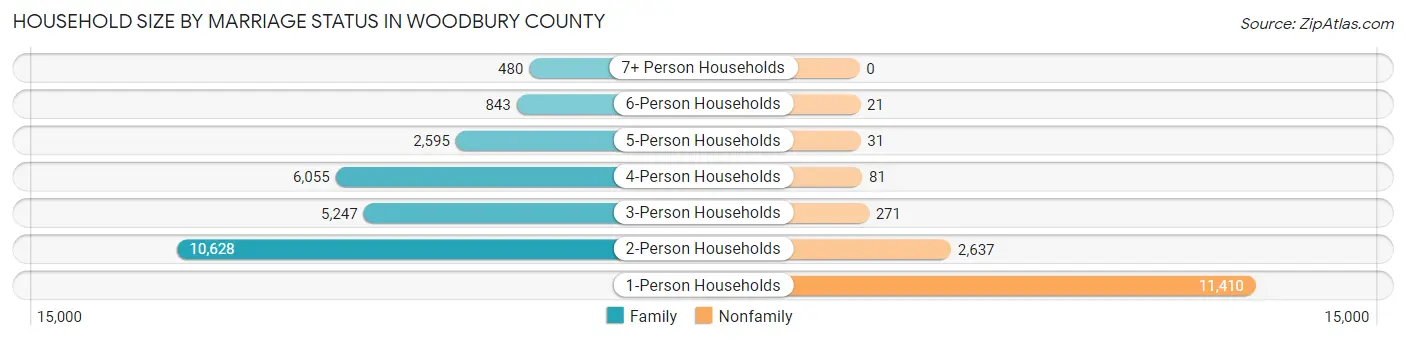
| Household Size | Family Households | Nonfamily Households |
| 1-Person Households | - | 11,410 (28.3%) |
| 2-Person Households | 10,628 (26.4%) | 2,637 (6.5%) |
| 3-Person Households | 5,247 (13.0%) | 271 (0.7%) |
| 4-Person Households | 6,055 (15.0%) | 81 (0.2%) |
| 5-Person Households | 2,595 (6.4%) | 31 (0.1%) |
| 6-Person Households | 843 (2.1%) | 21 (0.1%) |
| 7+ Person Households | 480 (1.2%) | 0 (0.0%) |
| Total | 25,848 (64.1%) | 14,451 (35.9%) |
Female Fertility in Woodbury County
Fertility by Age in Woodbury County
Average fertility rate in Woodbury County is 53.0 births per 1,000 women. Women in the age bracket of 20 to 34 years have the highest fertility rate with 95.0 births per 1,000 women. Women in the age bracket of 20 to 34 years acount for 74.8% of all women with births.
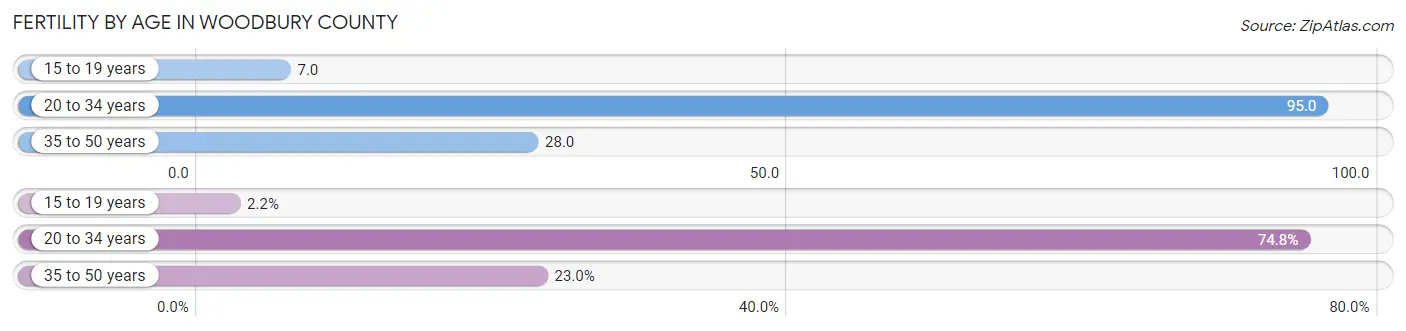
| Age Bracket | Women with Births | Births / 1,000 Women |
| 15 to 19 years | 28 (2.2%) | 7.0 |
| 20 to 34 years | 961 (74.8%) | 95.0 |
| 35 to 50 years | 296 (23.0%) | 28.0 |
| Total | 1,285 (100.0%) | 53.0 |
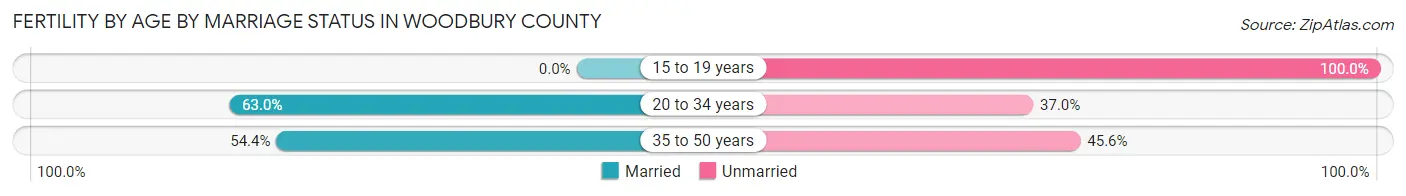
Fertility by Age by Marriage Status in Woodbury County
59.6% of women with births (1,285) in Woodbury County are married. The highest percentage of unmarried women with births falls into 15 to 19 years age bracket with 100.0% of them unmarried at the time of birth, while the lowest percentage of unmarried women with births belong to 20 to 34 years age bracket with 37.0% of them unmarried.
| Age Bracket | Married | Unmarried |
| 15 to 19 years | 0 (0.0%) | 28 (100.0%) |
| 20 to 34 years | 605 (63.0%) | 356 (37.0%) |
| 35 to 50 years | 161 (54.4%) | 135 (45.6%) |
| Total | 766 (59.6%) | 519 (40.4%) |
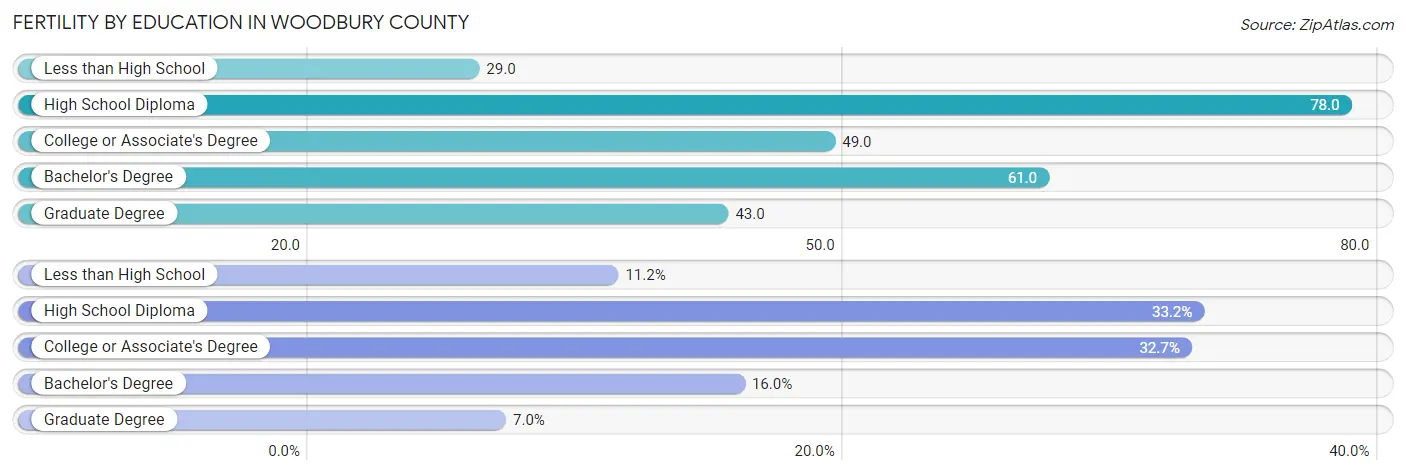
Fertility by Education in Woodbury County
Average fertility rate in Woodbury County is 53.0 births per 1,000 women. Women with the education attainment of high school diploma have the highest fertility rate of 78.0 births per 1,000 women, while women with the education attainment of less than high school have the lowest fertility at 29.0 births per 1,000 women. Women with the education attainment of high school diploma represent 33.2% of all women with births.
| Educational Attainment | Women with Births | Births / 1,000 Women |
| Less than High School | 144 (11.2%) | 29.0 |
| High School Diploma | 426 (33.2%) | 78.0 |
| College or Associate's Degree | 420 (32.7%) | 49.0 |
| Bachelor's Degree | 205 (16.0%) | 61.0 |
| Graduate Degree | 90 (7.0%) | 43.0 |
| Total | 1,285 (100.0%) | 53.0 |
Fertility by Education by Marriage Status in Woodbury County
40.4% of women with births in Woodbury County are unmarried. Women with the educational attainment of graduate degree are most likely to be married with 100.0% of them married at childbirth, while women with the educational attainment of high school diploma are least likely to be married with 52.8% of them unmarried at childbirth.
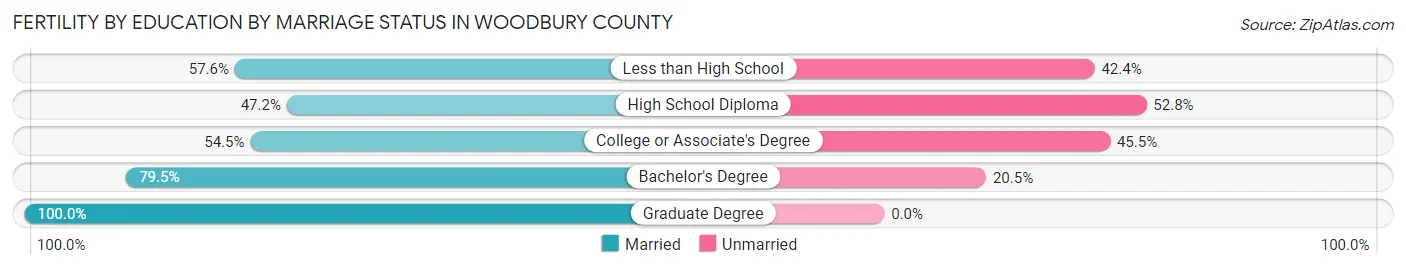
| Educational Attainment | Married | Unmarried |
| Less than High School | 83 (57.6%) | 61 (42.4%) |
| High School Diploma | 201 (47.2%) | 225 (52.8%) |
| College or Associate's Degree | 229 (54.5%) | 191 (45.5%) |
| Bachelor's Degree | 163 (79.5%) | 42 (20.5%) |
| Graduate Degree | 90 (100.0%) | 0 (0.0%) |
| Total | 766 (59.6%) | 519 (40.4%) |
Employment Characteristics in Woodbury County
Employment by Class of Employer in Woodbury County
Among the 52,032 employed individuals in Woodbury County, private company employees (37,726 | 72.5%), not-for-profit organizations (4,764 | 9.2%), and local government employees (3,770 | 7.2%) make up the most common classes of employment.
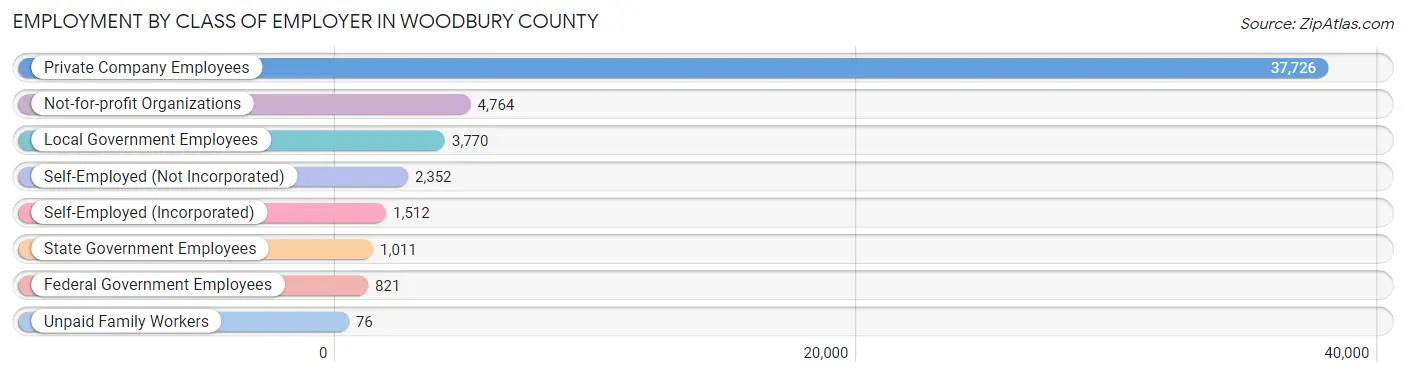
| Employer Class | # Employees | % Employees |
| Private Company Employees | 37,726 | 72.5% |
| Self-Employed (Incorporated) | 1,512 | 2.9% |
| Self-Employed (Not Incorporated) | 2,352 | 4.5% |
| Not-for-profit Organizations | 4,764 | 9.2% |
| Local Government Employees | 3,770 | 7.2% |
| State Government Employees | 1,011 | 1.9% |
| Federal Government Employees | 821 | 1.6% |
| Unpaid Family Workers | 76 | 0.2% |
| Total | 52,032 | 100.0% |
Employment Status by Age in Woodbury County
According to the labor force statistics for Woodbury County, out of the total population over 16 years of age (81,389), 68.2% or 55,507 individuals are in the labor force, with 4.5% or 2,498 of them unemployed. The age group with the highest labor force participation rate is 35 to 44 years, with 88.2% or 11,172 individuals in the labor force. Within the labor force, the 20 to 24 years age range has the highest percentage of unemployed individuals, with 10.9% or 672 of them being unemployed.
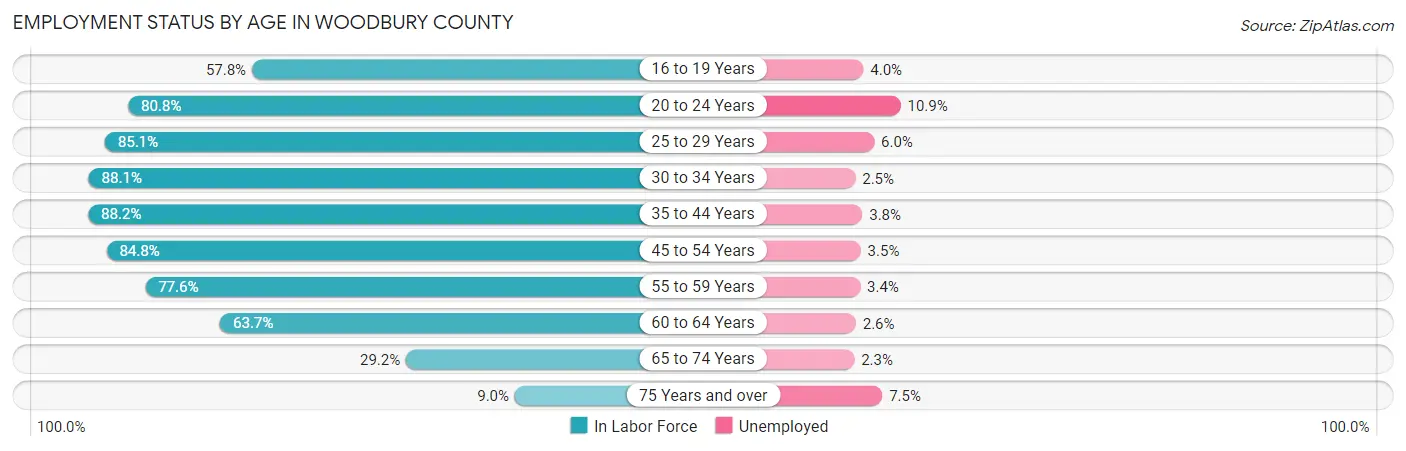
| Age Bracket | In Labor Force | Unemployed |
| 16 to 19 Years | 3,630 (57.8%) | 145 (4.0%) |
| 20 to 24 Years | 6,167 (80.8%) | 672 (10.9%) |
| 25 to 29 Years | 5,639 (85.1%) | 338 (6.0%) |
| 30 to 34 Years | 5,974 (88.1%) | 149 (2.5%) |
| 35 to 44 Years | 11,172 (88.2%) | 425 (3.8%) |
| 45 to 54 Years | 10,647 (84.8%) | 373 (3.5%) |
| 55 to 59 Years | 4,913 (77.6%) | 167 (3.4%) |
| 60 to 64 Years | 3,959 (63.7%) | 103 (2.6%) |
| 65 to 74 Years | 2,864 (29.2%) | 66 (2.3%) |
| 75 Years and over | 585 (9.0%) | 44 (7.5%) |
| Total | 55,507 (68.2%) | 2,498 (4.5%) |
Employment Status by Educational Attainment in Woodbury County
According to labor force statistics for Woodbury County, 82.7% of individuals (42,322) out of the total population between 25 and 64 years of age (51,175) are in the labor force, with 3.7% or 1,566 of them being unemployed. The group with the highest labor force participation rate are those with the educational attainment of bachelor's degree or higher, with 89.8% or 11,374 individuals in the labor force. Within the labor force, individuals with less than high school education have the highest percentage of unemployment, with 5.7% or 274 of them being unemployed.
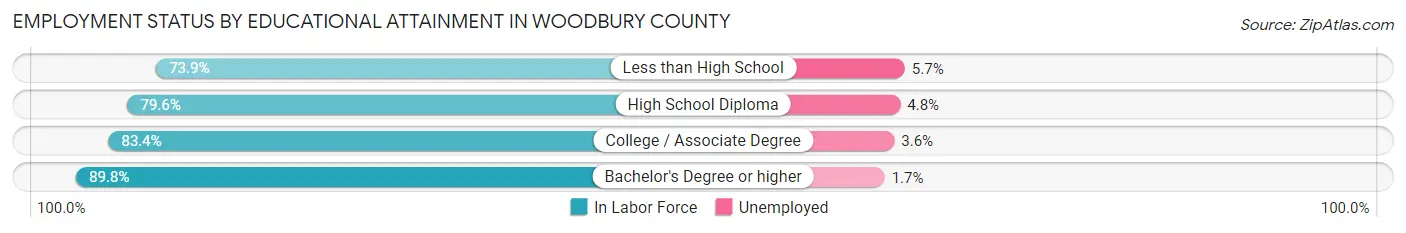
| Educational Attainment | In Labor Force | Unemployed |
| Less than High School | 4,801 (73.9%) | 370 (5.7%) |
| High School Diploma | 12,161 (79.6%) | 733 (4.8%) |
| College / Associate Degree | 13,957 (83.4%) | 602 (3.6%) |
| Bachelor's Degree or higher | 11,374 (89.8%) | 215 (1.7%) |
| Total | 42,322 (82.7%) | 1,893 (3.7%) |
Employment Occupations by Sex in Woodbury County
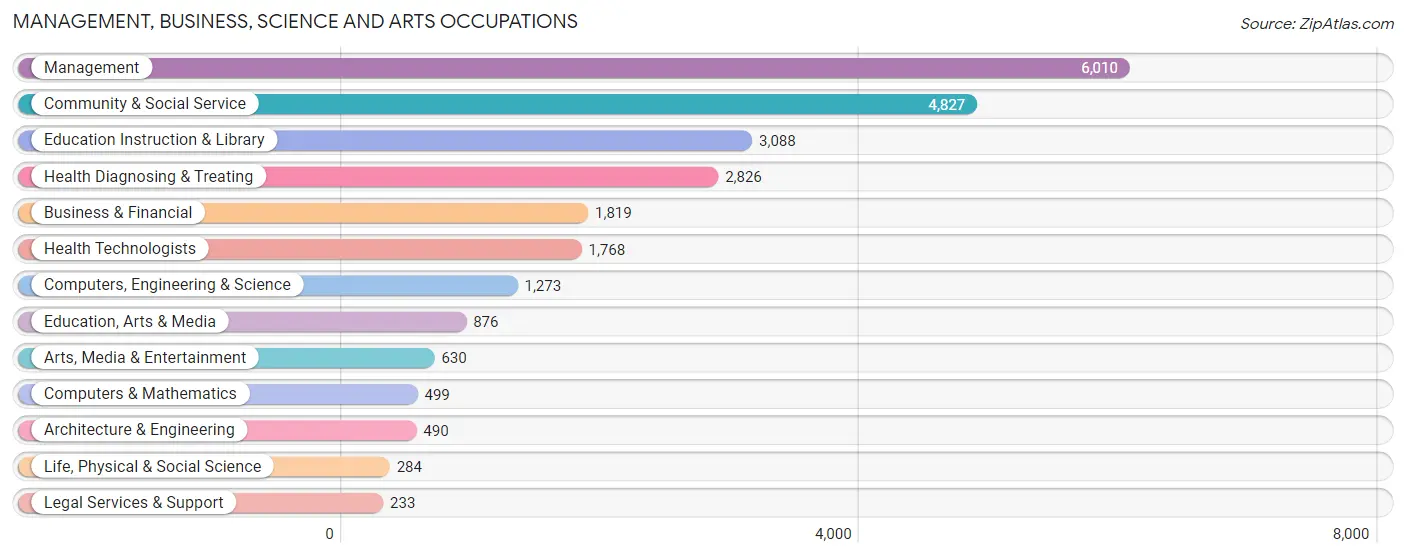
Management, Business, Science and Arts Occupations
The most common Management, Business, Science and Arts occupations in Woodbury County are Management (6,010 | 11.4%), Community & Social Service (4,827 | 9.1%), Education Instruction & Library (3,088 | 5.8%), Health Diagnosing & Treating (2,826 | 5.3%), and Business & Financial (1,819 | 3.4%).
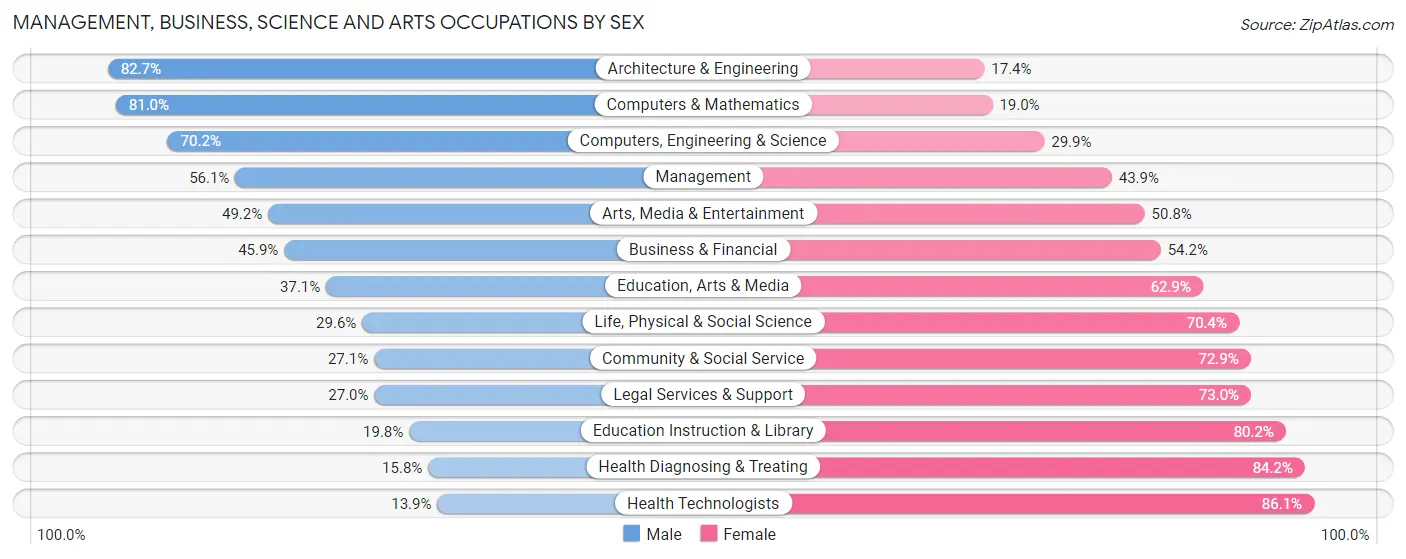
Management, Business, Science and Arts Occupations by Sex
Within the Management, Business, Science and Arts occupations in Woodbury County, the most male-oriented occupations are Architecture & Engineering (82.7%), Computers & Mathematics (81.0%), and Computers, Engineering & Science (70.2%), while the most female-oriented occupations are Health Technologists (86.1%), Health Diagnosing & Treating (84.2%), and Education Instruction & Library (80.2%).
| Occupation | Male | Female |
| Management | 3,370 (56.1%) | 2,640 (43.9%) |
| Business & Financial | 834 (45.9%) | 985 (54.1%) |
| Computers, Engineering & Science | 893 (70.2%) | 380 (29.8%) |
| Computers & Mathematics | 404 (81.0%) | 95 (19.0%) |
| Architecture & Engineering | 405 (82.7%) | 85 (17.3%) |
| Life, Physical & Social Science | 84 (29.6%) | 200 (70.4%) |
| Community & Social Service | 1,309 (27.1%) | 3,518 (72.9%) |
| Education, Arts & Media | 325 (37.1%) | 551 (62.9%) |
| Legal Services & Support | 63 (27.0%) | 170 (73.0%) |
| Education Instruction & Library | 611 (19.8%) | 2,477 (80.2%) |
| Arts, Media & Entertainment | 310 (49.2%) | 320 (50.8%) |
| Health Diagnosing & Treating | 447 (15.8%) | 2,379 (84.2%) |
| Health Technologists | 246 (13.9%) | 1,522 (86.1%) |
| Total (Category) | 6,853 (40.9%) | 9,902 (59.1%) |
| Total (Overall) | 27,952 (52.8%) | 24,969 (47.2%) |
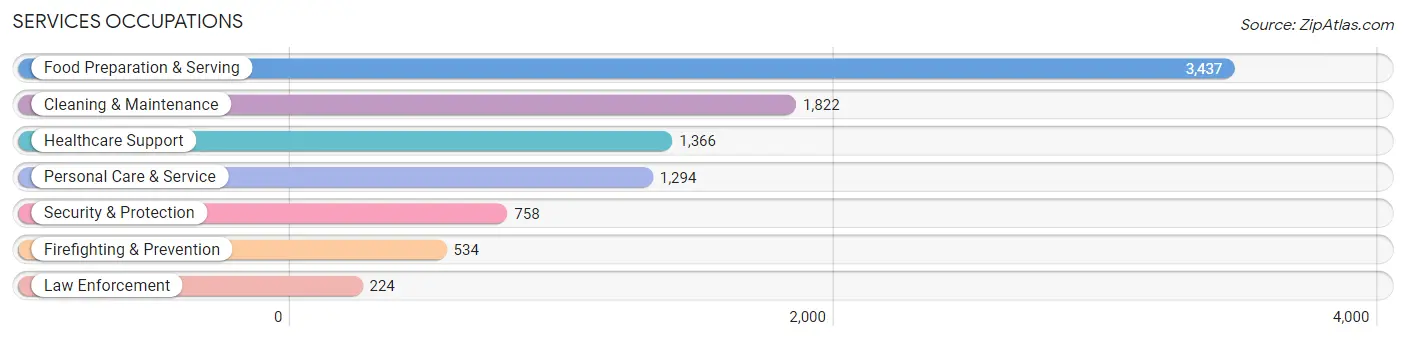
Services Occupations
The most common Services occupations in Woodbury County are Food Preparation & Serving (3,437 | 6.5%), Cleaning & Maintenance (1,822 | 3.4%), Healthcare Support (1,366 | 2.6%), Personal Care & Service (1,294 | 2.5%), and Security & Protection (758 | 1.4%).
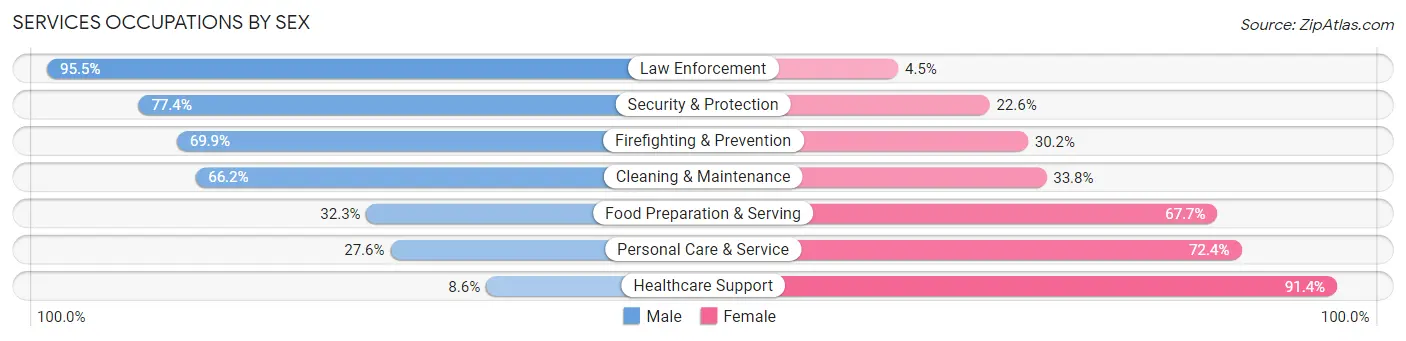
Services Occupations by Sex
Within the Services occupations in Woodbury County, the most male-oriented occupations are Law Enforcement (95.5%), Security & Protection (77.4%), and Firefighting & Prevention (69.9%), while the most female-oriented occupations are Healthcare Support (91.4%), Personal Care & Service (72.4%), and Food Preparation & Serving (67.7%).
| Occupation | Male | Female |
| Healthcare Support | 118 (8.6%) | 1,248 (91.4%) |
| Security & Protection | 587 (77.4%) | 171 (22.6%) |
| Firefighting & Prevention | 373 (69.9%) | 161 (30.1%) |
| Law Enforcement | 214 (95.5%) | 10 (4.5%) |
| Food Preparation & Serving | 1,111 (32.3%) | 2,326 (67.7%) |
| Cleaning & Maintenance | 1,206 (66.2%) | 616 (33.8%) |
| Personal Care & Service | 357 (27.6%) | 937 (72.4%) |
| Total (Category) | 3,379 (38.9%) | 5,298 (61.1%) |
| Total (Overall) | 27,952 (52.8%) | 24,969 (47.2%) |
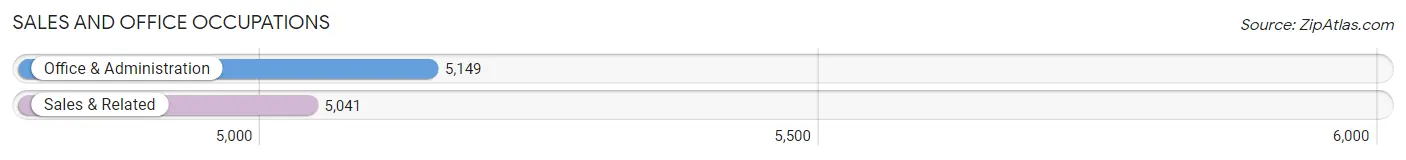
Sales and Office Occupations
The most common Sales and Office occupations in Woodbury County are Office & Administration (5,149 | 9.7%), and Sales & Related (5,041 | 9.5%).
Sales and Office Occupations by Sex
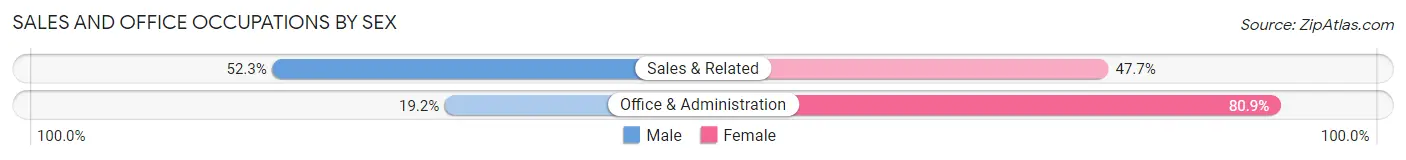
| Occupation | Male | Female |
| Sales & Related | 2,637 (52.3%) | 2,404 (47.7%) |
| Office & Administration | 986 (19.2%) | 4,163 (80.8%) |
| Total (Category) | 3,623 (35.5%) | 6,567 (64.4%) |
| Total (Overall) | 27,952 (52.8%) | 24,969 (47.2%) |
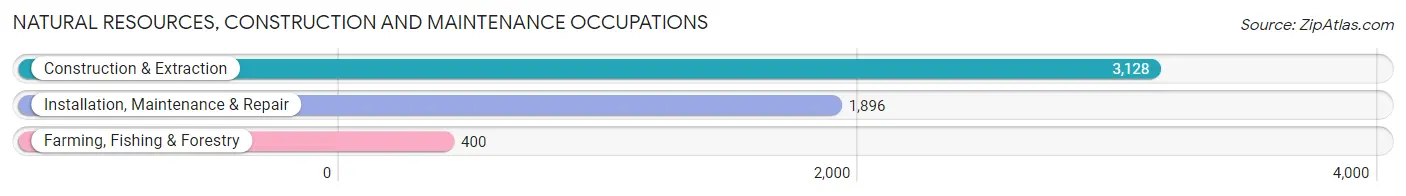
Natural Resources, Construction and Maintenance Occupations
The most common Natural Resources, Construction and Maintenance occupations in Woodbury County are Construction & Extraction (3,128 | 5.9%), Installation, Maintenance & Repair (1,896 | 3.6%), and Farming, Fishing & Forestry (400 | 0.8%).
Natural Resources, Construction and Maintenance Occupations by Sex
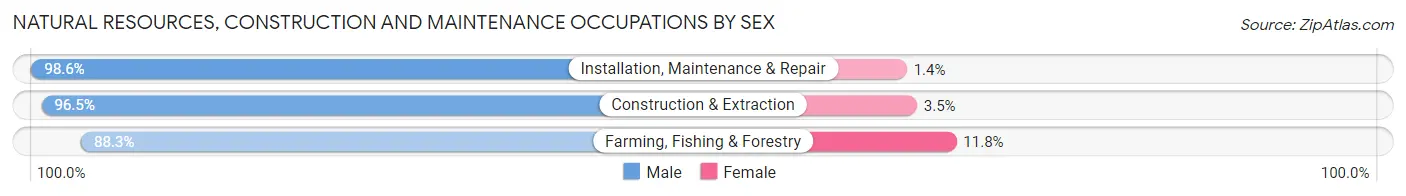
| Occupation | Male | Female |
| Farming, Fishing & Forestry | 353 (88.2%) | 47 (11.7%) |
| Construction & Extraction | 3,018 (96.5%) | 110 (3.5%) |
| Installation, Maintenance & Repair | 1,869 (98.6%) | 27 (1.4%) |
| Total (Category) | 5,240 (96.6%) | 184 (3.4%) |
| Total (Overall) | 27,952 (52.8%) | 24,969 (47.2%) |
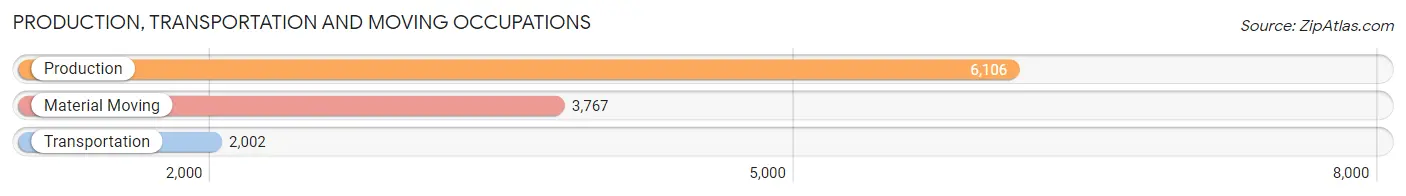
Production, Transportation and Moving Occupations
The most common Production, Transportation and Moving occupations in Woodbury County are Production (6,106 | 11.5%), Material Moving (3,767 | 7.1%), and Transportation (2,002 | 3.8%).
Production, Transportation and Moving Occupations by Sex
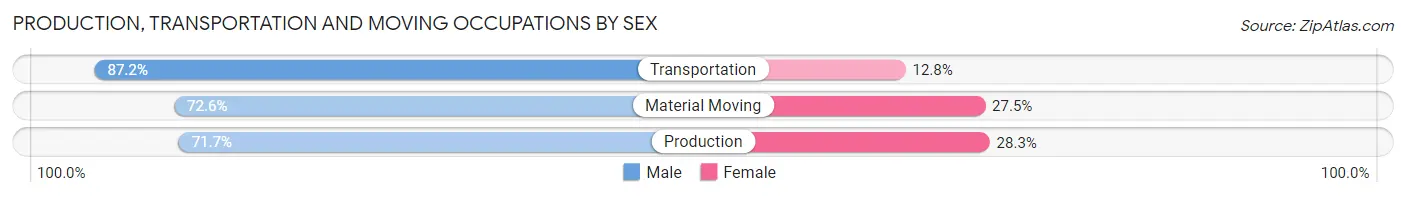
| Occupation | Male | Female |
| Production | 4,379 (71.7%) | 1,727 (28.3%) |
| Transportation | 1,745 (87.2%) | 257 (12.8%) |
| Material Moving | 2,733 (72.6%) | 1,034 (27.5%) |
| Total (Category) | 8,857 (74.6%) | 3,018 (25.4%) |
| Total (Overall) | 27,952 (52.8%) | 24,969 (47.2%) |
Employment Industries by Sex in Woodbury County
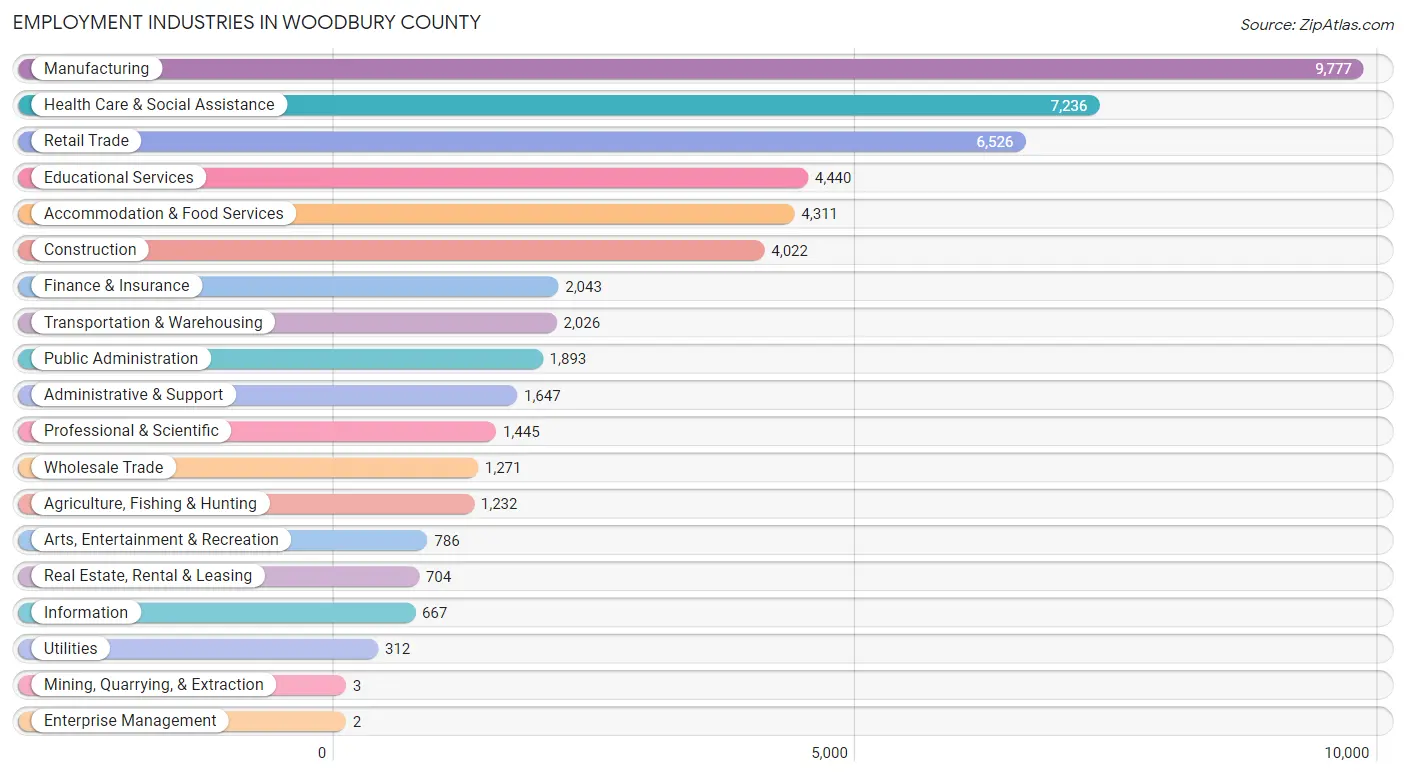
Employment Industries in Woodbury County
The major employment industries in Woodbury County include Manufacturing (9,777 | 18.5%), Health Care & Social Assistance (7,236 | 13.7%), Retail Trade (6,526 | 12.3%), Educational Services (4,440 | 8.4%), and Accommodation & Food Services (4,311 | 8.2%).
Employment Industries by Sex in Woodbury County
The Woodbury County industries that see more men than women are Mining, Quarrying, & Extraction (100.0%), Enterprise Management (100.0%), and Agriculture, Fishing & Hunting (92.9%), whereas the industries that tend to have a higher number of women are Health Care & Social Assistance (85.6%), Finance & Insurance (69.4%), and Educational Services (69.3%).
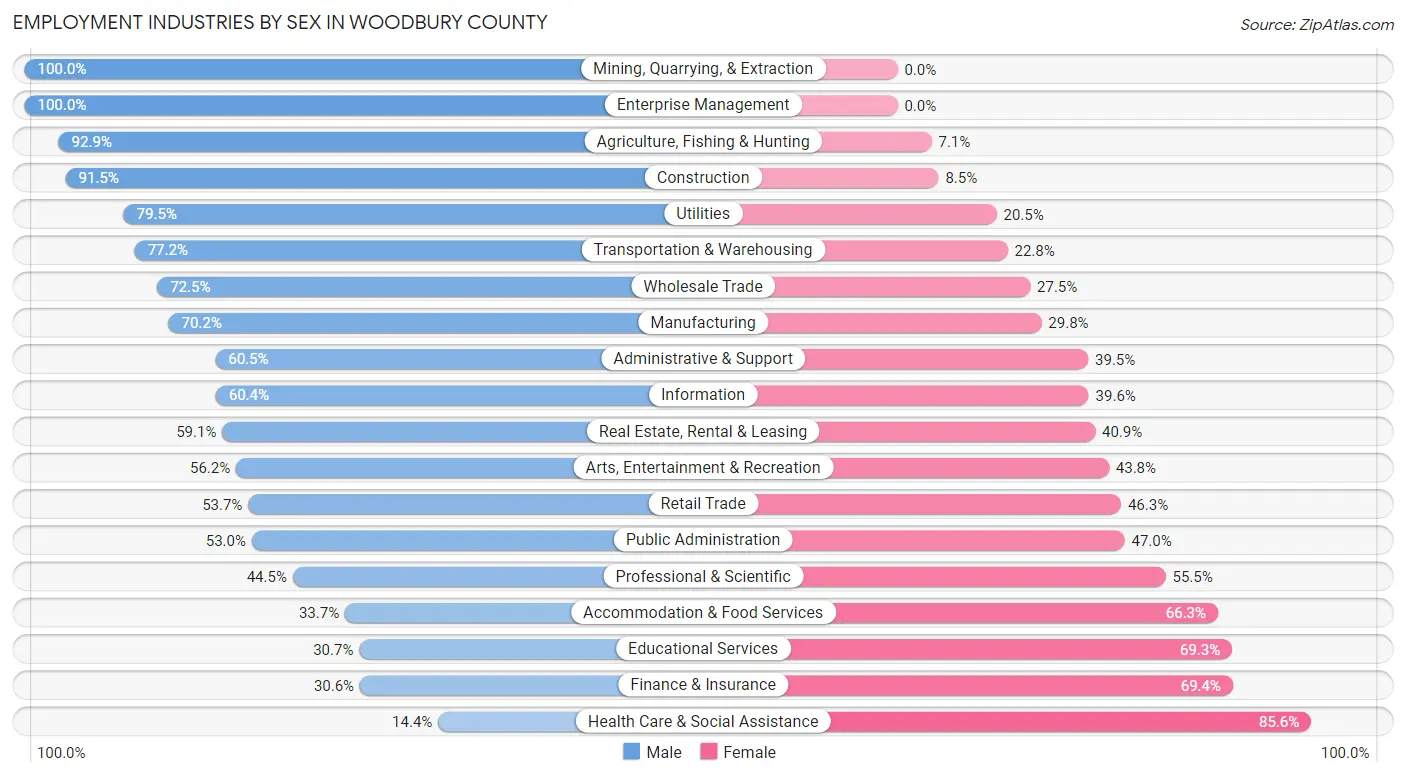
| Industry | Male | Female |
| Agriculture, Fishing & Hunting | 1,145 (92.9%) | 87 (7.1%) |
| Mining, Quarrying, & Extraction | 3 (100.0%) | 0 (0.0%) |
| Construction | 3,680 (91.5%) | 342 (8.5%) |
| Manufacturing | 6,863 (70.2%) | 2,914 (29.8%) |
| Wholesale Trade | 922 (72.5%) | 349 (27.5%) |
| Retail Trade | 3,506 (53.7%) | 3,020 (46.3%) |
| Transportation & Warehousing | 1,564 (77.2%) | 462 (22.8%) |
| Utilities | 248 (79.5%) | 64 (20.5%) |
| Information | 403 (60.4%) | 264 (39.6%) |
| Finance & Insurance | 625 (30.6%) | 1,418 (69.4%) |
| Real Estate, Rental & Leasing | 416 (59.1%) | 288 (40.9%) |
| Professional & Scientific | 643 (44.5%) | 802 (55.5%) |
| Enterprise Management | 2 (100.0%) | 0 (0.0%) |
| Administrative & Support | 997 (60.5%) | 650 (39.5%) |
| Educational Services | 1,365 (30.7%) | 3,075 (69.3%) |
| Health Care & Social Assistance | 1,042 (14.4%) | 6,194 (85.6%) |
| Arts, Entertainment & Recreation | 442 (56.2%) | 344 (43.8%) |
| Accommodation & Food Services | 1,452 (33.7%) | 2,859 (66.3%) |
| Public Administration | 1,003 (53.0%) | 890 (47.0%) |
| Total | 27,952 (52.8%) | 24,969 (47.2%) |
Education in Woodbury County
School Enrollment in Woodbury County
The most common levels of schooling among the 27,626 students in Woodbury County are middle school (6,310 | 22.8%), high school (6,056 | 21.9%), and elementary school (5,771 | 20.9%).
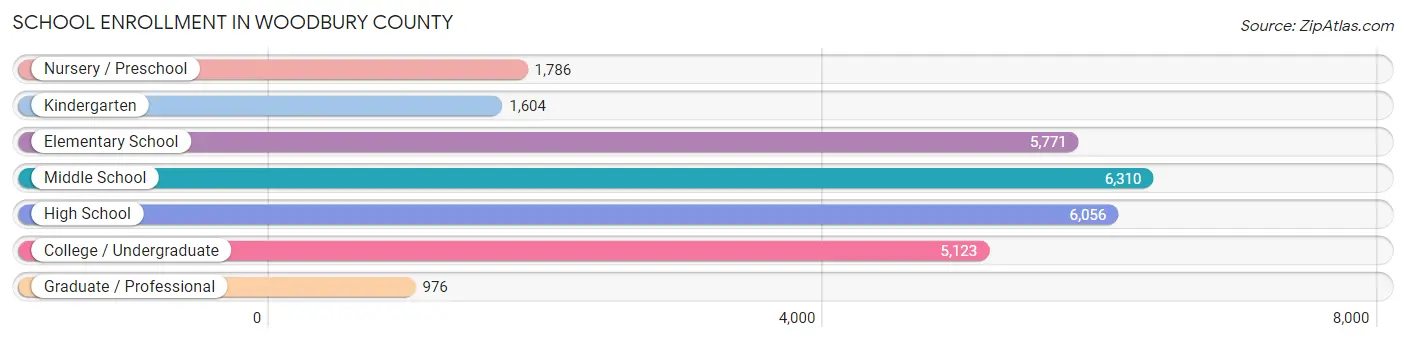
| School Level | # Students | % Students |
| Nursery / Preschool | 1,786 | 6.5% |
| Kindergarten | 1,604 | 5.8% |
| Elementary School | 5,771 | 20.9% |
| Middle School | 6,310 | 22.8% |
| High School | 6,056 | 21.9% |
| College / Undergraduate | 5,123 | 18.5% |
| Graduate / Professional | 976 | 3.5% |
| Total | 27,626 | 100.0% |
School Enrollment by Age by Funding Source in Woodbury County
Out of a total of 27,626 students who are enrolled in schools in Woodbury County, 4,448 (16.1%) attend a private institution, while the remaining 23,178 (83.9%) are enrolled in public schools. The age group of 20 to 24 year olds has the highest likelihood of being enrolled in private schools, with 1,315 (48.6% in the age bracket) enrolled. Conversely, the age group of 5 to 9 year old has the lowest likelihood of being enrolled in a private school, with 6,688 (92.0% in the age bracket) attending a public institution.
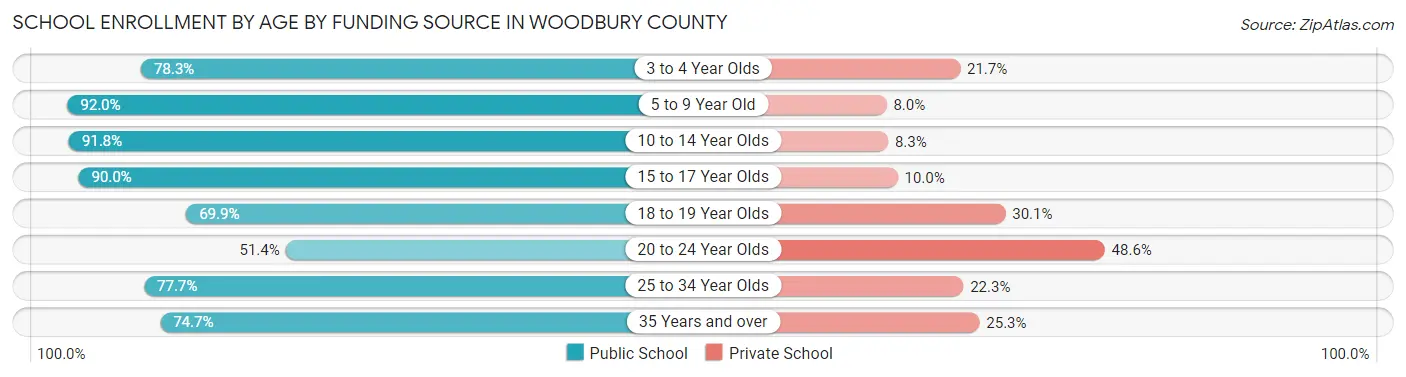
| Age Bracket | Public School | Private School |
| 3 to 4 Year Olds | 1,004 (78.3%) | 278 (21.7%) |
| 5 to 9 Year Old | 6,688 (92.0%) | 579 (8.0%) |
| 10 to 14 Year Olds | 6,862 (91.7%) | 617 (8.3%) |
| 15 to 17 Year Olds | 4,024 (90.0%) | 449 (10.0%) |
| 18 to 19 Year Olds | 1,778 (69.9%) | 766 (30.1%) |
| 20 to 24 Year Olds | 1,390 (51.4%) | 1,315 (48.6%) |
| 25 to 34 Year Olds | 803 (77.7%) | 230 (22.3%) |
| 35 Years and over | 630 (74.7%) | 213 (25.3%) |
| Total | 23,178 (83.9%) | 4,448 (16.1%) |
Educational Attainment by Field of Study in Woodbury County
Business (3,905 | 22.2%), education (3,542 | 20.1%), science & technology (1,819 | 10.3%), arts & humanities (1,490 | 8.5%), and psychology (1,065 | 6.0%) are the most common fields of study among 17,592 individuals in Woodbury County who have obtained a bachelor's degree or higher.
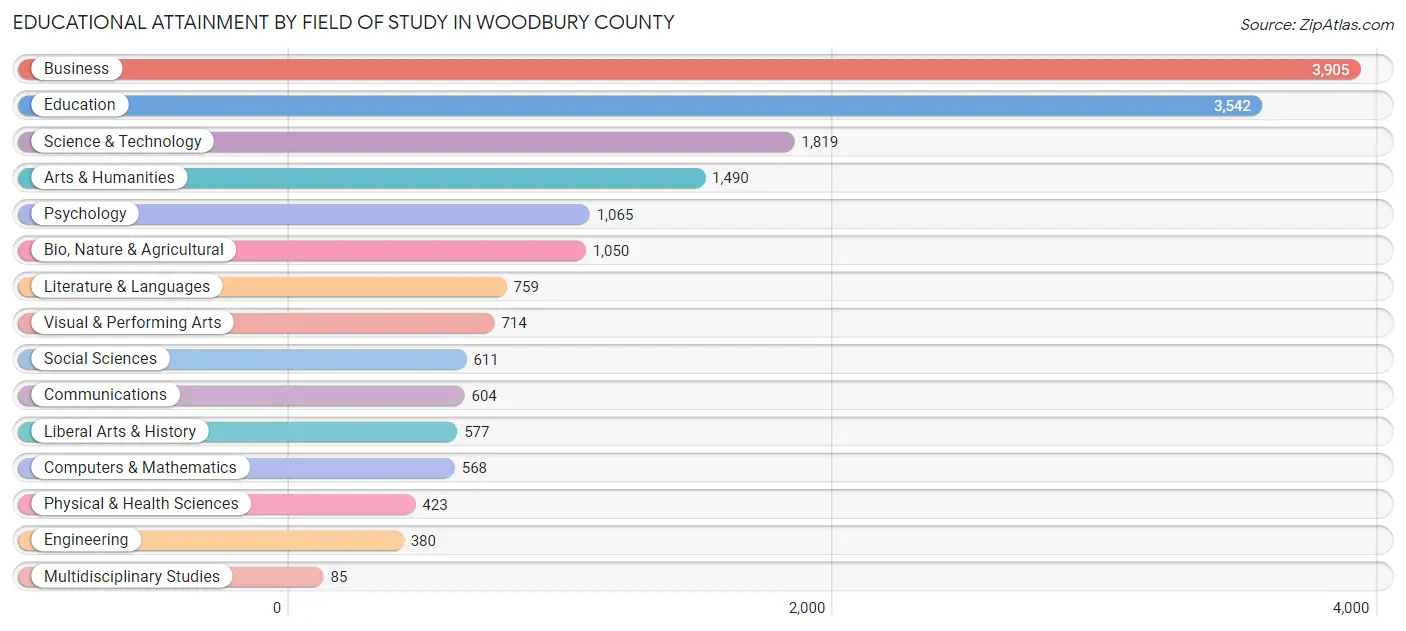
| Field of Study | # Graduates | % Graduates |
| Computers & Mathematics | 568 | 3.2% |
| Bio, Nature & Agricultural | 1,050 | 6.0% |
| Physical & Health Sciences | 423 | 2.4% |
| Psychology | 1,065 | 6.0% |
| Social Sciences | 611 | 3.5% |
| Engineering | 380 | 2.2% |
| Multidisciplinary Studies | 85 | 0.5% |
| Science & Technology | 1,819 | 10.3% |
| Business | 3,905 | 22.2% |
| Education | 3,542 | 20.1% |
| Literature & Languages | 759 | 4.3% |
| Liberal Arts & History | 577 | 3.3% |
| Visual & Performing Arts | 714 | 4.1% |
| Communications | 604 | 3.4% |
| Arts & Humanities | 1,490 | 8.5% |
| Total | 17,592 | 100.0% |
Transportation & Commute in Woodbury County
Vehicle Availability by Sex in Woodbury County
The most prevalent vehicle ownership categories in Woodbury County are males with 2 vehicles (10,035, accounting for 37.0%) and females with 2 vehicles (9,245, making up 41.8%).
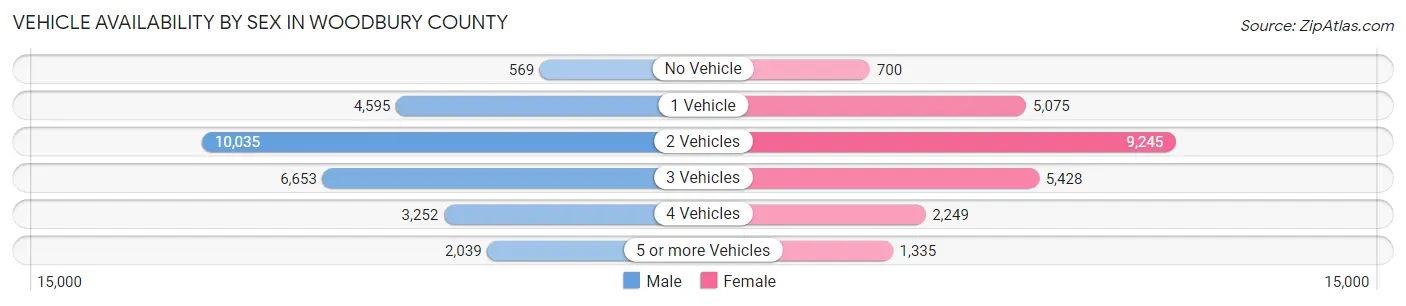
| Vehicles Available | Male | Female |
| No Vehicle | 569 (2.1%) | 700 (2.9%) |
| 1 Vehicle | 4,595 (16.9%) | 5,075 (21.1%) |
| 2 Vehicles | 10,035 (37.0%) | 9,245 (38.5%) |
| 3 Vehicles | 6,653 (24.5%) | 5,428 (22.6%) |
| 4 Vehicles | 3,252 (12.0%) | 2,249 (9.4%) |
| 5 or more Vehicles | 2,039 (7.5%) | 1,335 (5.6%) |
| Total | 27,143 (100.0%) | 24,032 (100.0%) |
Commute Time in Woodbury County
The most frequently occuring commute durations in Woodbury County are 15 to 19 minutes (12,310 commuters, 24.8%), 10 to 14 minutes (11,583 commuters, 23.4%), and 20 to 24 minutes (7,875 commuters, 15.9%).
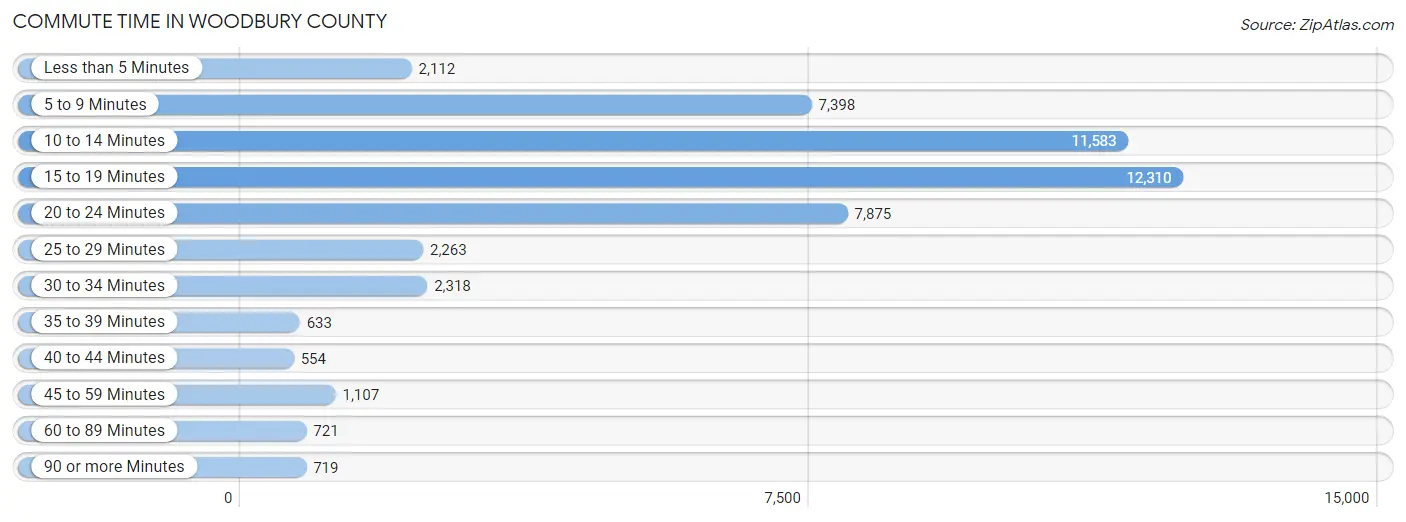
| Commute Time | # Commuters | % Commuters |
| Less than 5 Minutes | 2,112 | 4.3% |
| 5 to 9 Minutes | 7,398 | 14.9% |
| 10 to 14 Minutes | 11,583 | 23.4% |
| 15 to 19 Minutes | 12,310 | 24.8% |
| 20 to 24 Minutes | 7,875 | 15.9% |
| 25 to 29 Minutes | 2,263 | 4.6% |
| 30 to 34 Minutes | 2,318 | 4.7% |
| 35 to 39 Minutes | 633 | 1.3% |
| 40 to 44 Minutes | 554 | 1.1% |
| 45 to 59 Minutes | 1,107 | 2.2% |
| 60 to 89 Minutes | 721 | 1.5% |
| 90 or more Minutes | 719 | 1.5% |
Commute Time by Sex in Woodbury County
The most common commute times in Woodbury County are 15 to 19 minutes (6,610 commuters, 25.0%) for males and 10 to 14 minutes (6,215 commuters, 26.9%) for females.
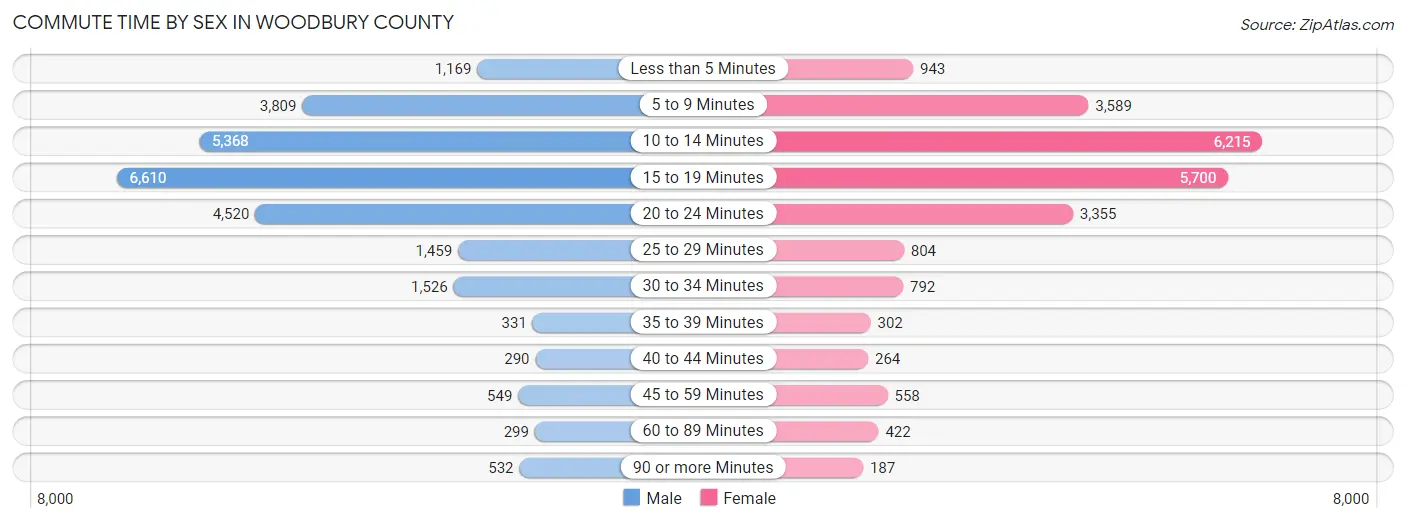
| Commute Time | Male | Female |
| Less than 5 Minutes | 1,169 (4.4%) | 943 (4.1%) |
| 5 to 9 Minutes | 3,809 (14.4%) | 3,589 (15.5%) |
| 10 to 14 Minutes | 5,368 (20.3%) | 6,215 (26.9%) |
| 15 to 19 Minutes | 6,610 (25.0%) | 5,700 (24.6%) |
| 20 to 24 Minutes | 4,520 (17.1%) | 3,355 (14.5%) |
| 25 to 29 Minutes | 1,459 (5.5%) | 804 (3.5%) |
| 30 to 34 Minutes | 1,526 (5.8%) | 792 (3.4%) |
| 35 to 39 Minutes | 331 (1.3%) | 302 (1.3%) |
| 40 to 44 Minutes | 290 (1.1%) | 264 (1.1%) |
| 45 to 59 Minutes | 549 (2.1%) | 558 (2.4%) |
| 60 to 89 Minutes | 299 (1.1%) | 422 (1.8%) |
| 90 or more Minutes | 532 (2.0%) | 187 (0.8%) |
Time of Departure to Work by Sex in Woodbury County
The most frequent times of departure to work in Woodbury County are 7:00 AM to 7:29 AM (4,160, 15.7%) for males and 7:30 AM to 7:59 AM (5,214, 22.5%) for females.
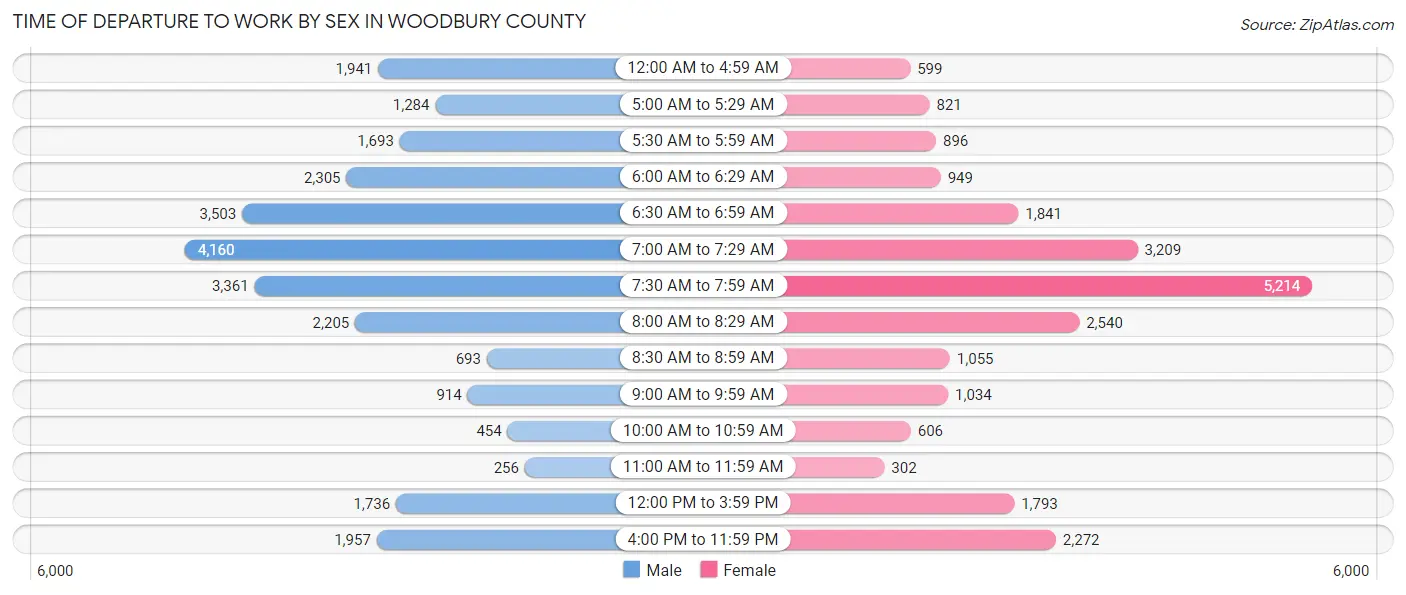
| Time of Departure | Male | Female |
| 12:00 AM to 4:59 AM | 1,941 (7.3%) | 599 (2.6%) |
| 5:00 AM to 5:29 AM | 1,284 (4.9%) | 821 (3.5%) |
| 5:30 AM to 5:59 AM | 1,693 (6.4%) | 896 (3.9%) |
| 6:00 AM to 6:29 AM | 2,305 (8.7%) | 949 (4.1%) |
| 6:30 AM to 6:59 AM | 3,503 (13.2%) | 1,841 (8.0%) |
| 7:00 AM to 7:29 AM | 4,160 (15.7%) | 3,209 (13.9%) |
| 7:30 AM to 7:59 AM | 3,361 (12.7%) | 5,214 (22.5%) |
| 8:00 AM to 8:29 AM | 2,205 (8.3%) | 2,540 (11.0%) |
| 8:30 AM to 8:59 AM | 693 (2.6%) | 1,055 (4.6%) |
| 9:00 AM to 9:59 AM | 914 (3.5%) | 1,034 (4.5%) |
| 10:00 AM to 10:59 AM | 454 (1.7%) | 606 (2.6%) |
| 11:00 AM to 11:59 AM | 256 (1.0%) | 302 (1.3%) |
| 12:00 PM to 3:59 PM | 1,736 (6.6%) | 1,793 (7.7%) |
| 4:00 PM to 11:59 PM | 1,957 (7.4%) | 2,272 (9.8%) |
| Total | 26,462 (100.0%) | 23,131 (100.0%) |
Housing Occupancy in Woodbury County
Occupancy by Ownership in Woodbury County
Of the total 40,299 dwellings in Woodbury County, owner-occupied units account for 27,480 (68.2%), while renter-occupied units make up 12,819 (31.8%).
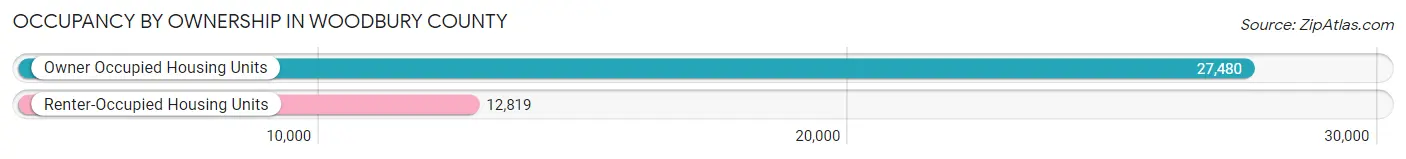
| Occupancy | # Housing Units | % Housing Units |
| Owner Occupied Housing Units | 27,480 | 68.2% |
| Renter-Occupied Housing Units | 12,819 | 31.8% |
| Total Occupied Housing Units | 40,299 | 100.0% |
Occupancy by Household Size in Woodbury County
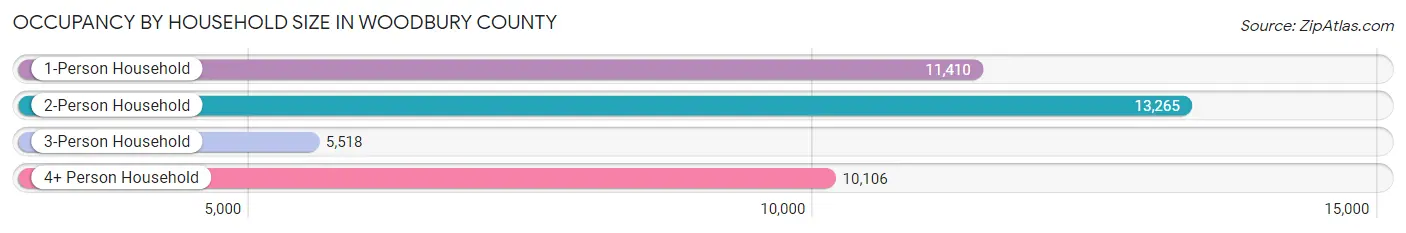
| Household Size | # Housing Units | % Housing Units |
| 1-Person Household | 11,410 | 28.3% |
| 2-Person Household | 13,265 | 32.9% |
| 3-Person Household | 5,518 | 13.7% |
| 4+ Person Household | 10,106 | 25.1% |
| Total Housing Units | 40,299 | 100.0% |
Occupancy by Ownership by Household Size in Woodbury County
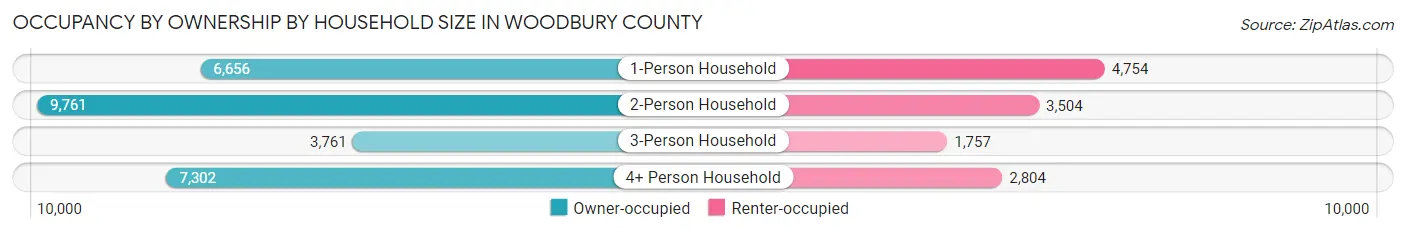
| Household Size | Owner-occupied | Renter-occupied |
| 1-Person Household | 6,656 (58.3%) | 4,754 (41.7%) |
| 2-Person Household | 9,761 (73.6%) | 3,504 (26.4%) |
| 3-Person Household | 3,761 (68.2%) | 1,757 (31.8%) |
| 4+ Person Household | 7,302 (72.3%) | 2,804 (27.8%) |
| Total Housing Units | 27,480 (68.2%) | 12,819 (31.8%) |
Occupancy by Educational Attainment in Woodbury County
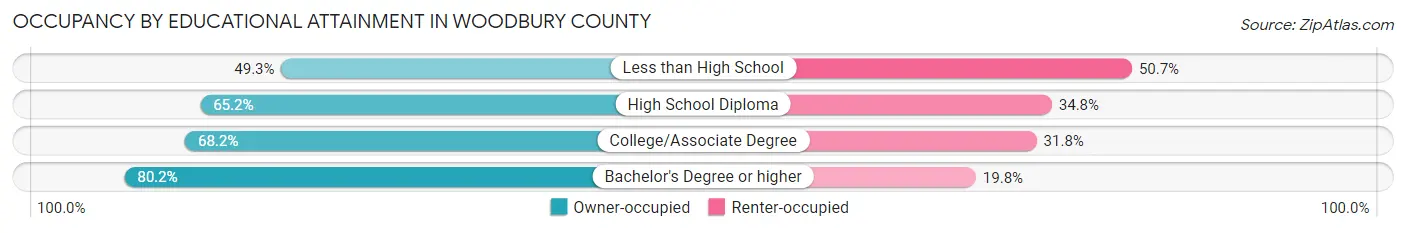
| Household Size | Owner-occupied | Renter-occupied |
| Less than High School | 2,160 (49.3%) | 2,222 (50.7%) |
| High School Diploma | 7,973 (65.2%) | 4,261 (34.8%) |
| College/Associate Degree | 9,356 (68.2%) | 4,366 (31.8%) |
| Bachelor's Degree or higher | 7,991 (80.2%) | 1,970 (19.8%) |
Occupancy by Age of Householder in Woodbury County
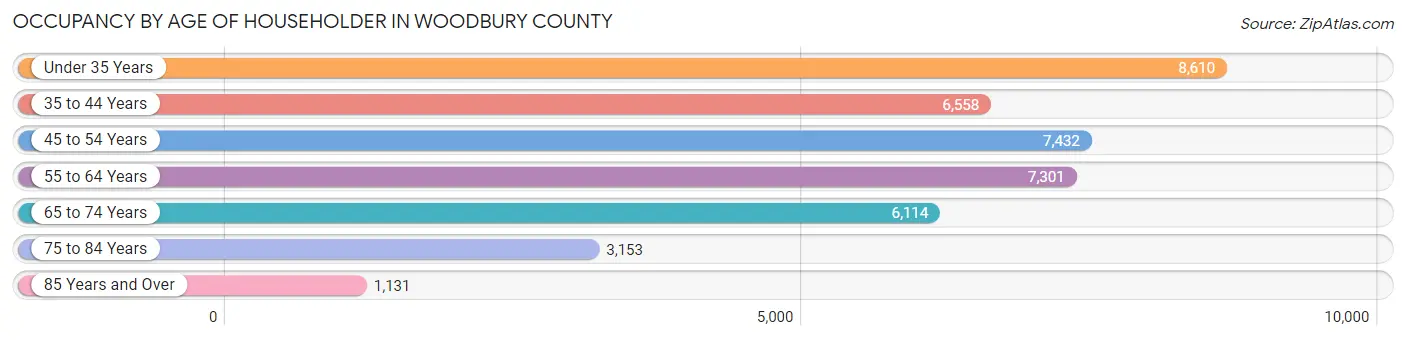
| Age Bracket | # Households | % Households |
| Under 35 Years | 8,610 | 21.4% |
| 35 to 44 Years | 6,558 | 16.3% |
| 45 to 54 Years | 7,432 | 18.4% |
| 55 to 64 Years | 7,301 | 18.1% |
| 65 to 74 Years | 6,114 | 15.2% |
| 75 to 84 Years | 3,153 | 7.8% |
| 85 Years and Over | 1,131 | 2.8% |
| Total | 40,299 | 100.0% |
Housing Finances in Woodbury County
Median Income by Occupancy in Woodbury County
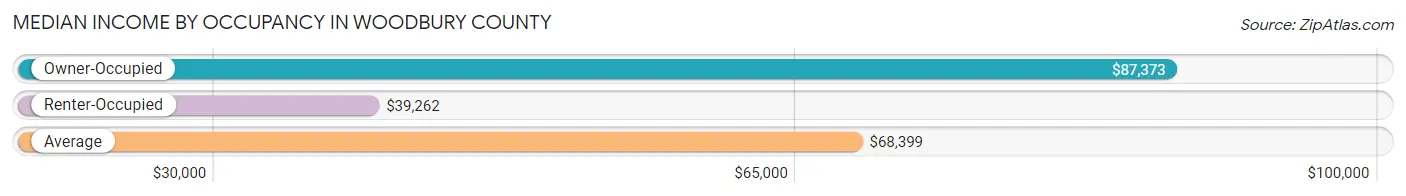
| Occupancy Type | # Households | Median Income |
| Owner-Occupied | 27,480 (68.2%) | $87,373 |
| Renter-Occupied | 12,819 (31.8%) | $39,262 |
| Average | 40,299 (100.0%) | $68,399 |
Occupancy by Householder Income Bracket in Woodbury County
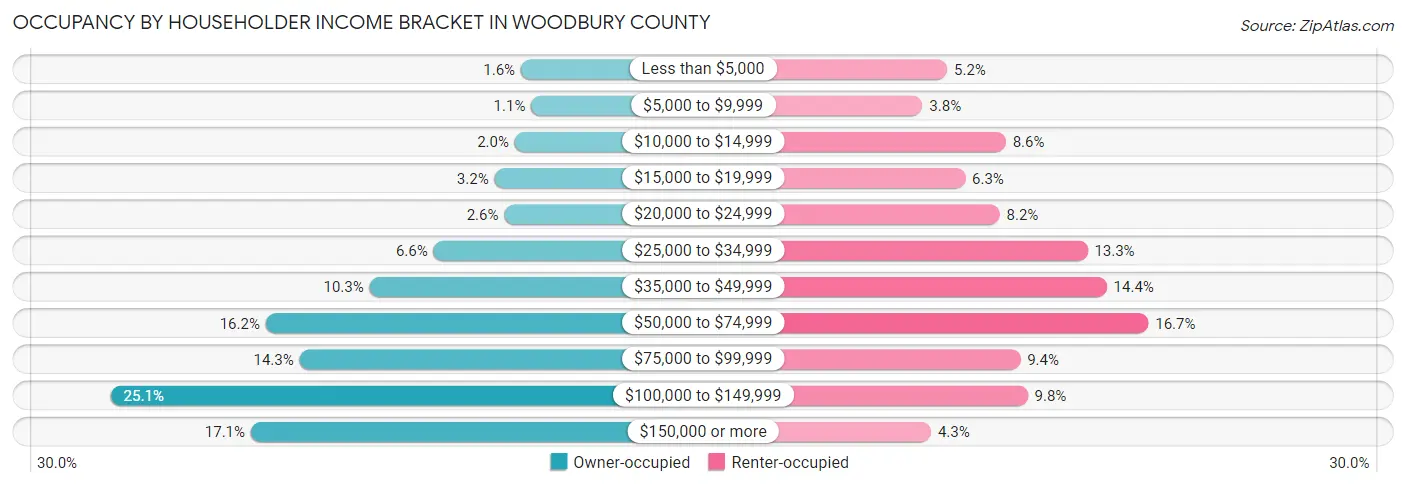
| Income Bracket | Owner-occupied | Renter-occupied |
| Less than $5,000 | 451 (1.6%) | 671 (5.2%) |
| $5,000 to $9,999 | 288 (1.1%) | 490 (3.8%) |
| $10,000 to $14,999 | 548 (2.0%) | 1,100 (8.6%) |
| $15,000 to $19,999 | 866 (3.2%) | 803 (6.3%) |
| $20,000 to $24,999 | 711 (2.6%) | 1,055 (8.2%) |
| $25,000 to $34,999 | 1,823 (6.6%) | 1,698 (13.3%) |
| $35,000 to $49,999 | 2,828 (10.3%) | 1,839 (14.3%) |
| $50,000 to $74,999 | 4,457 (16.2%) | 2,145 (16.7%) |
| $75,000 to $99,999 | 3,926 (14.3%) | 1,206 (9.4%) |
| $100,000 to $149,999 | 6,891 (25.1%) | 1,260 (9.8%) |
| $150,000 or more | 4,691 (17.1%) | 552 (4.3%) |
| Total | 27,480 (100.0%) | 12,819 (100.0%) |
Monthly Housing Cost Tiers in Woodbury County
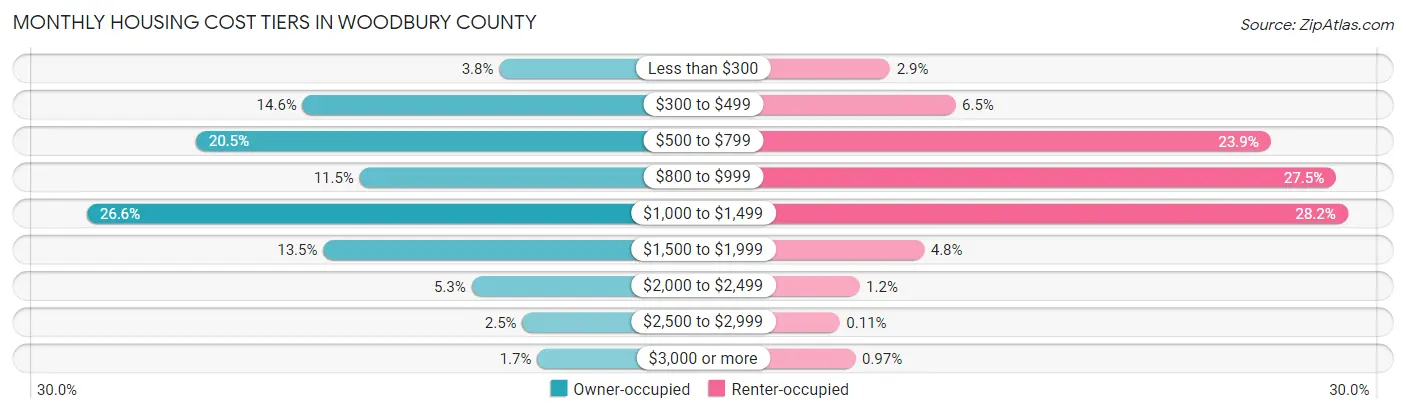
| Monthly Cost | Owner-occupied | Renter-occupied |
| Less than $300 | 1,038 (3.8%) | 370 (2.9%) |
| $300 to $499 | 4,024 (14.6%) | 833 (6.5%) |
| $500 to $799 | 5,644 (20.5%) | 3,066 (23.9%) |
| $800 to $999 | 3,157 (11.5%) | 3,530 (27.5%) |
| $1,000 to $1,499 | 7,299 (26.6%) | 3,612 (28.2%) |
| $1,500 to $1,999 | 3,710 (13.5%) | 611 (4.8%) |
| $2,000 to $2,499 | 1,458 (5.3%) | 154 (1.2%) |
| $2,500 to $2,999 | 688 (2.5%) | 14 (0.1%) |
| $3,000 or more | 462 (1.7%) | 124 (1.0%) |
| Total | 27,480 (100.0%) | 12,819 (100.0%) |
Physical Housing Characteristics in Woodbury County
Housing Structures in Woodbury County
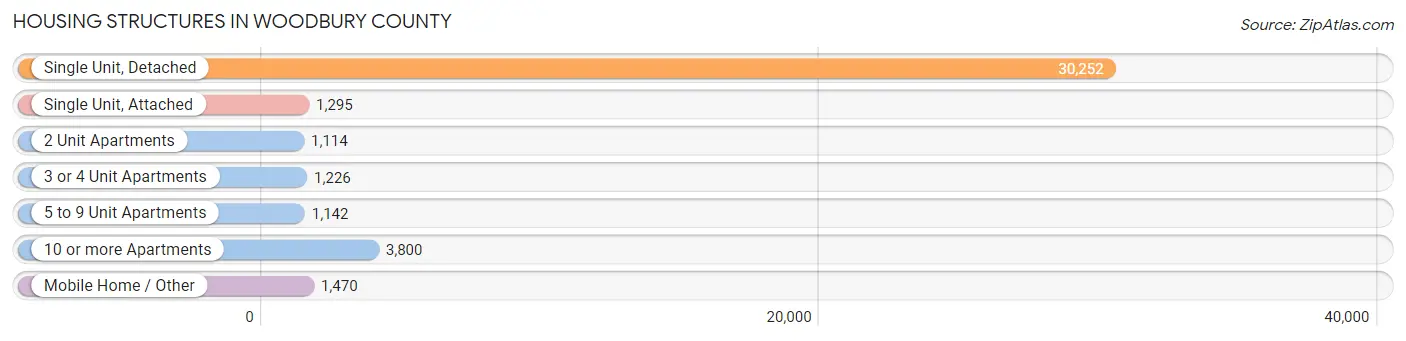
| Structure Type | # Housing Units | % Housing Units |
| Single Unit, Detached | 30,252 | 75.1% |
| Single Unit, Attached | 1,295 | 3.2% |
| 2 Unit Apartments | 1,114 | 2.8% |
| 3 or 4 Unit Apartments | 1,226 | 3.0% |
| 5 to 9 Unit Apartments | 1,142 | 2.8% |
| 10 or more Apartments | 3,800 | 9.4% |
| Mobile Home / Other | 1,470 | 3.6% |
| Total | 40,299 | 100.0% |
Housing Structures by Occupancy in Woodbury County
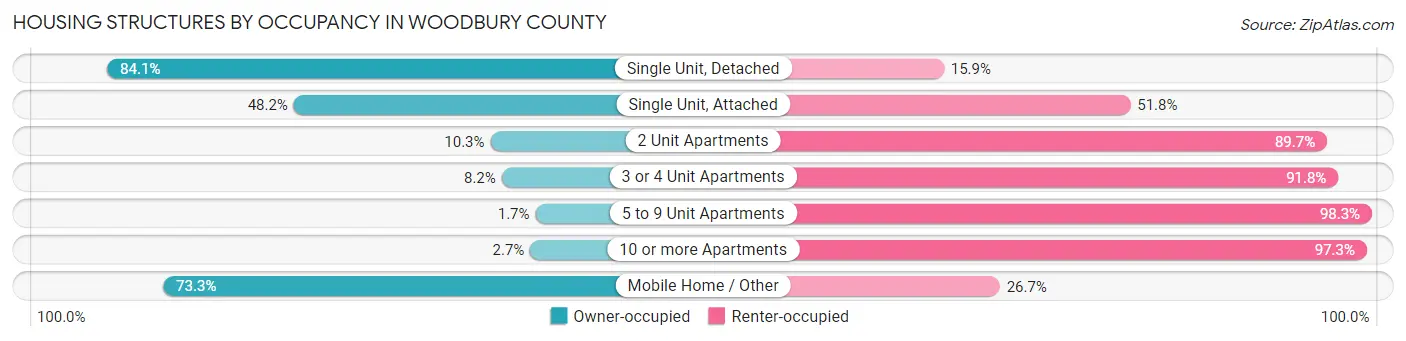
| Structure Type | Owner-occupied | Renter-occupied |
| Single Unit, Detached | 25,443 (84.1%) | 4,809 (15.9%) |
| Single Unit, Attached | 624 (48.2%) | 671 (51.8%) |
| 2 Unit Apartments | 115 (10.3%) | 999 (89.7%) |
| 3 or 4 Unit Apartments | 100 (8.2%) | 1,126 (91.8%) |
| 5 to 9 Unit Apartments | 19 (1.7%) | 1,123 (98.3%) |
| 10 or more Apartments | 101 (2.7%) | 3,699 (97.3%) |
| Mobile Home / Other | 1,078 (73.3%) | 392 (26.7%) |
| Total | 27,480 (68.2%) | 12,819 (31.8%) |
Housing Structures by Number of Rooms in Woodbury County
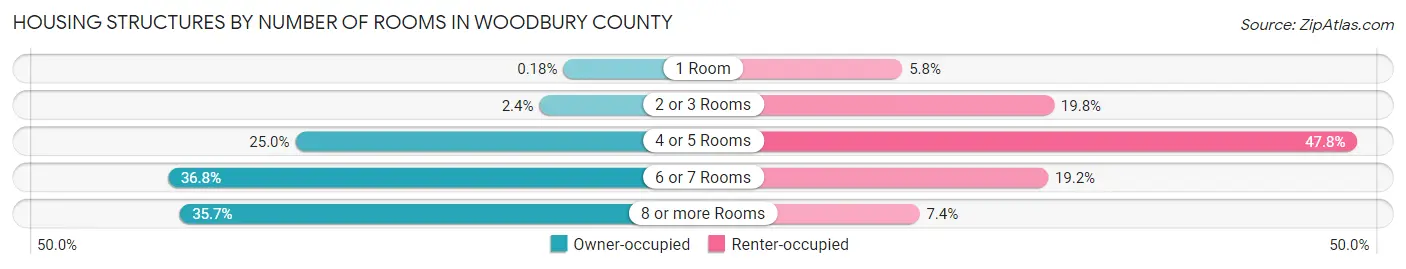
| Number of Rooms | Owner-occupied | Renter-occupied |
| 1 Room | 49 (0.2%) | 739 (5.8%) |
| 2 or 3 Rooms | 659 (2.4%) | 2,537 (19.8%) |
| 4 or 5 Rooms | 6,860 (25.0%) | 6,132 (47.8%) |
| 6 or 7 Rooms | 10,102 (36.8%) | 2,467 (19.2%) |
| 8 or more Rooms | 9,810 (35.7%) | 944 (7.4%) |
| Total | 27,480 (100.0%) | 12,819 (100.0%) |
Housing Structure by Heating Type in Woodbury County
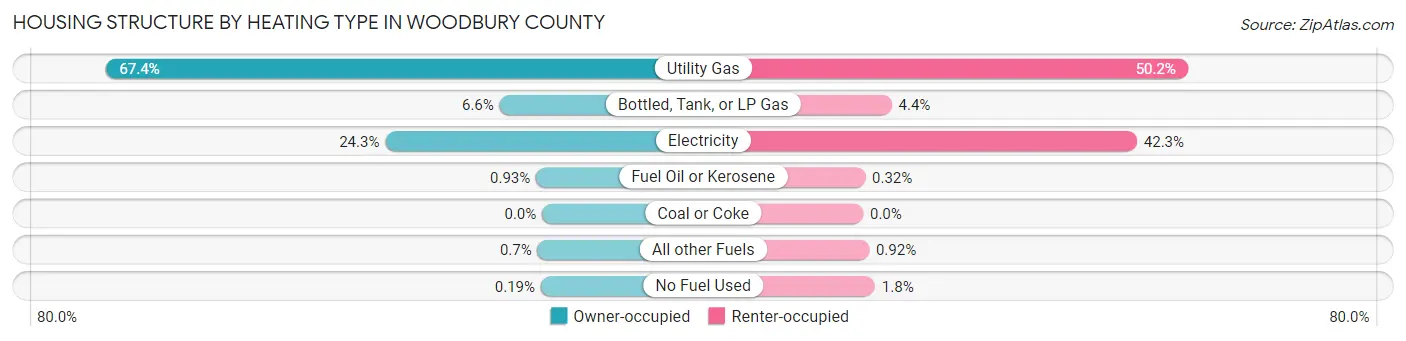
| Heating Type | Owner-occupied | Renter-occupied |
| Utility Gas | 18,509 (67.3%) | 6,433 (50.2%) |
| Bottled, Tank, or LP Gas | 1,806 (6.6%) | 567 (4.4%) |
| Electricity | 6,664 (24.2%) | 5,426 (42.3%) |
| Fuel Oil or Kerosene | 255 (0.9%) | 41 (0.3%) |
| Coal or Coke | 0 (0.0%) | 0 (0.0%) |
| All other Fuels | 193 (0.7%) | 118 (0.9%) |
| No Fuel Used | 53 (0.2%) | 234 (1.8%) |
| Total | 27,480 (100.0%) | 12,819 (100.0%) |
Household Vehicle Usage in Woodbury County
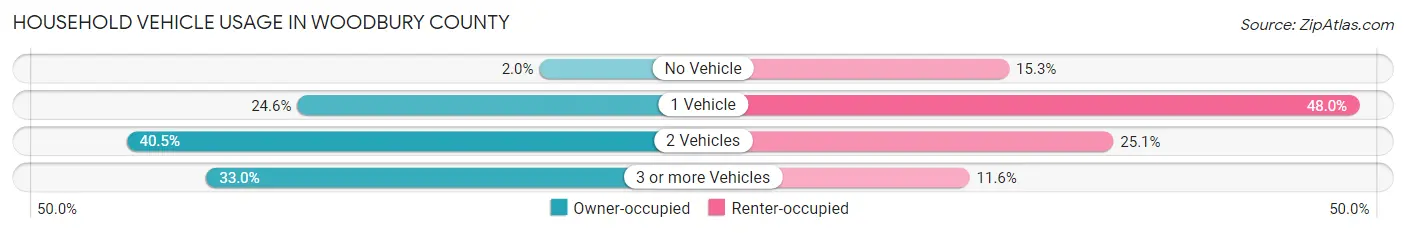
| Vehicles per Household | Owner-occupied | Renter-occupied |
| No Vehicle | 535 (1.9%) | 1,965 (15.3%) |
| 1 Vehicle | 6,745 (24.5%) | 6,150 (48.0%) |
| 2 Vehicles | 11,124 (40.5%) | 3,212 (25.1%) |
| 3 or more Vehicles | 9,076 (33.0%) | 1,492 (11.6%) |
| Total | 27,480 (100.0%) | 12,819 (100.0%) |
Real Estate & Mortgages in Woodbury County
Real Estate and Mortgage Overview in Woodbury County
| Characteristic | Without Mortgage | With Mortgage |
| Housing Units | 10,934 | 16,546 |
| Median Property Value | $136,000 | $167,900 |
| Median Household Income | $64,707 | $3,450 |
| Monthly Housing Costs | $525 | $456 |
| Real Estate Taxes | $2,315 | $163 |
Property Value by Mortgage Status in Woodbury County
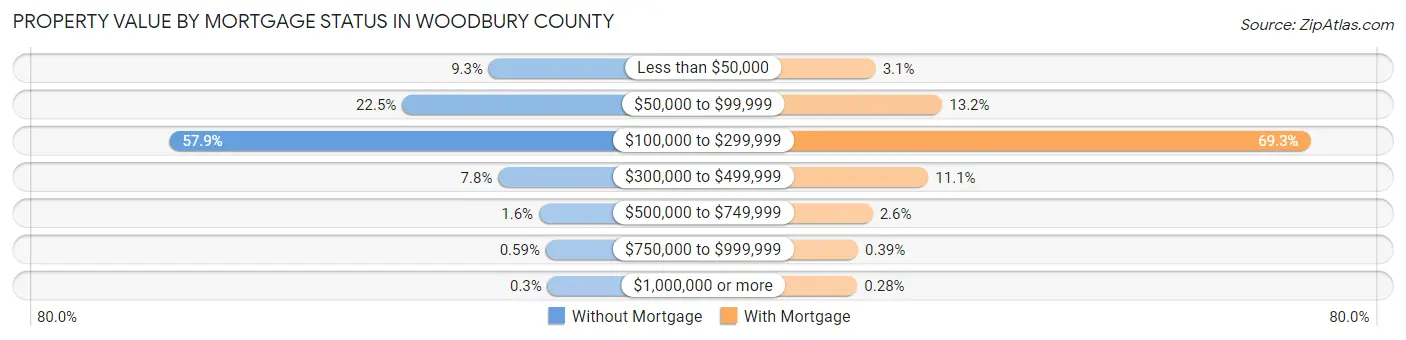
| Property Value | Without Mortgage | With Mortgage |
| Less than $50,000 | 1,013 (9.3%) | 509 (3.1%) |
| $50,000 to $99,999 | 2,457 (22.5%) | 2,189 (13.2%) |
| $100,000 to $299,999 | 6,334 (57.9%) | 11,468 (69.3%) |
| $300,000 to $499,999 | 856 (7.8%) | 1,837 (11.1%) |
| $500,000 to $749,999 | 177 (1.6%) | 433 (2.6%) |
| $750,000 to $999,999 | 64 (0.6%) | 64 (0.4%) |
| $1,000,000 or more | 33 (0.3%) | 46 (0.3%) |
| Total | 10,934 (100.0%) | 16,546 (100.0%) |
Household Income by Mortgage Status in Woodbury County
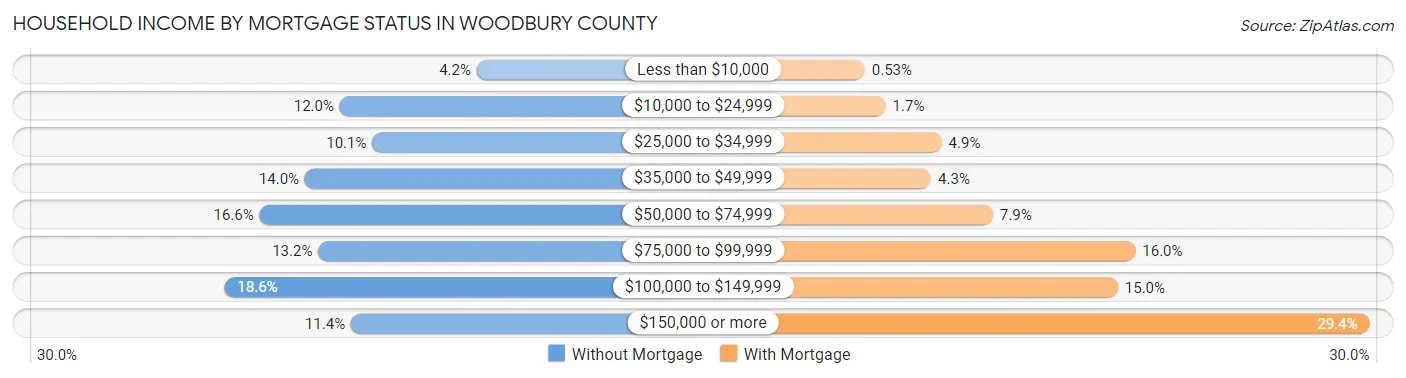
| Household Income | Without Mortgage | With Mortgage |
| Less than $10,000 | 455 (4.2%) | 88 (0.5%) |
| $10,000 to $24,999 | 1,311 (12.0%) | 284 (1.7%) |
| $25,000 to $34,999 | 1,108 (10.1%) | 814 (4.9%) |
| $35,000 to $49,999 | 1,529 (14.0%) | 715 (4.3%) |
| $50,000 to $74,999 | 1,812 (16.6%) | 1,299 (7.9%) |
| $75,000 to $99,999 | 1,446 (13.2%) | 2,645 (16.0%) |
| $100,000 to $149,999 | 2,032 (18.6%) | 2,480 (15.0%) |
| $150,000 or more | 1,241 (11.4%) | 4,859 (29.4%) |
| Total | 10,934 (100.0%) | 16,546 (100.0%) |
Property Value to Household Income Ratio in Woodbury County
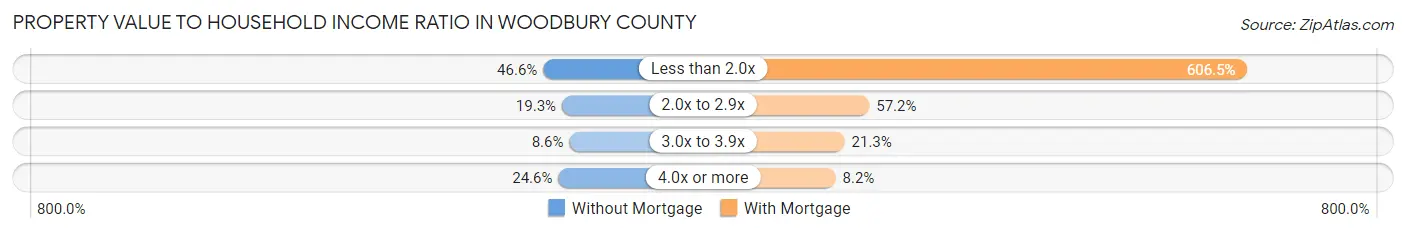
| Value-to-Income Ratio | Without Mortgage | With Mortgage |
| Less than 2.0x | 5,093 (46.6%) | 100,349 (606.5%) |
| 2.0x to 2.9x | 2,113 (19.3%) | 9,470 (57.2%) |
| 3.0x to 3.9x | 940 (8.6%) | 3,531 (21.3%) |
| 4.0x or more | 2,688 (24.6%) | 1,358 (8.2%) |
| Total | 10,934 (100.0%) | 16,546 (100.0%) |
Real Estate Taxes by Mortgage Status in Woodbury County
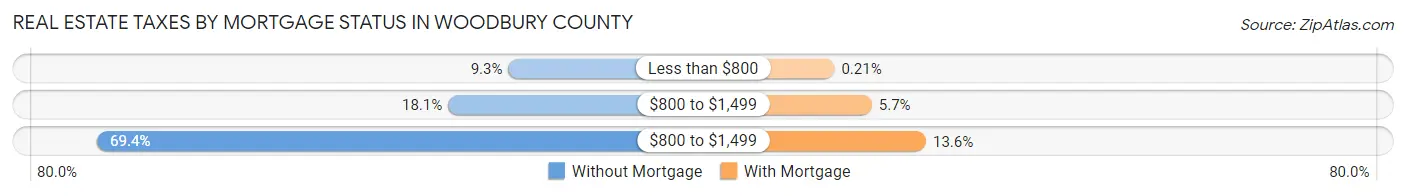
| Property Taxes | Without Mortgage | With Mortgage |
| Less than $800 | 1,019 (9.3%) | 34 (0.2%) |
| $800 to $1,499 | 1,982 (18.1%) | 938 (5.7%) |
| $800 to $1,499 | 7,587 (69.4%) | 2,248 (13.6%) |
| Total | 10,934 (100.0%) | 16,546 (100.0%) |
Health & Disability in Woodbury County
Health Insurance Coverage by Age in Woodbury County
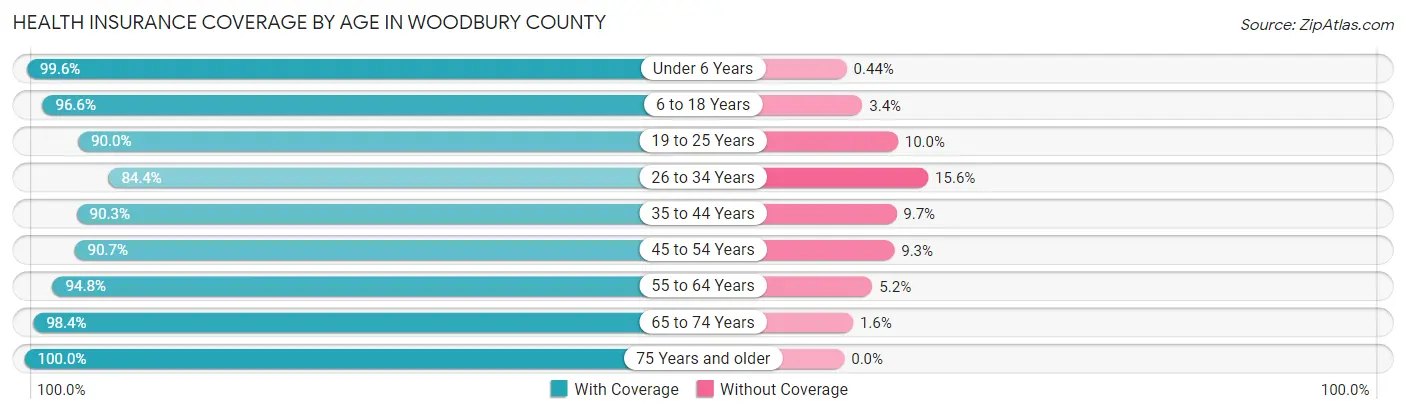
| Age Bracket | With Coverage | Without Coverage |
| Under 6 Years | 8,864 (99.6%) | 39 (0.4%) |
| 6 to 18 Years | 19,217 (96.6%) | 669 (3.4%) |
| 19 to 25 Years | 9,398 (90.0%) | 1,042 (10.0%) |
| 26 to 34 Years | 10,024 (84.4%) | 1,859 (15.6%) |
| 35 to 44 Years | 11,339 (90.3%) | 1,219 (9.7%) |
| 45 to 54 Years | 11,307 (90.7%) | 1,162 (9.3%) |
| 55 to 64 Years | 11,794 (94.8%) | 652 (5.2%) |
| 65 to 74 Years | 9,459 (98.4%) | 155 (1.6%) |
| 75 Years and older | 6,179 (100.0%) | 0 (0.0%) |
| Total | 97,581 (93.5%) | 6,797 (6.5%) |
Health Insurance Coverage by Citizenship Status in Woodbury County
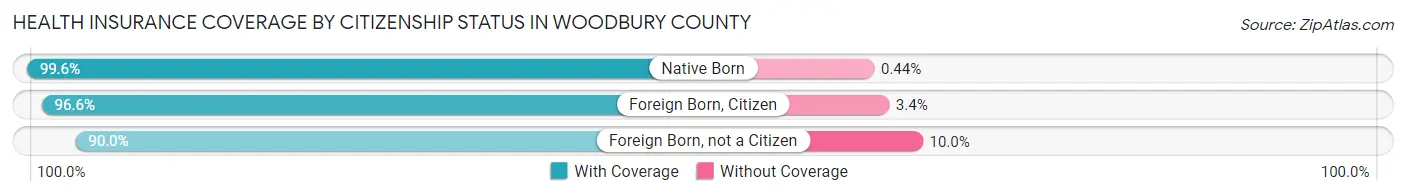
| Citizenship Status | With Coverage | Without Coverage |
| Native Born | 8,864 (99.6%) | 39 (0.4%) |
| Foreign Born, Citizen | 19,217 (96.6%) | 669 (3.4%) |
| Foreign Born, not a Citizen | 9,398 (90.0%) | 1,042 (10.0%) |
Health Insurance Coverage by Household Income in Woodbury County
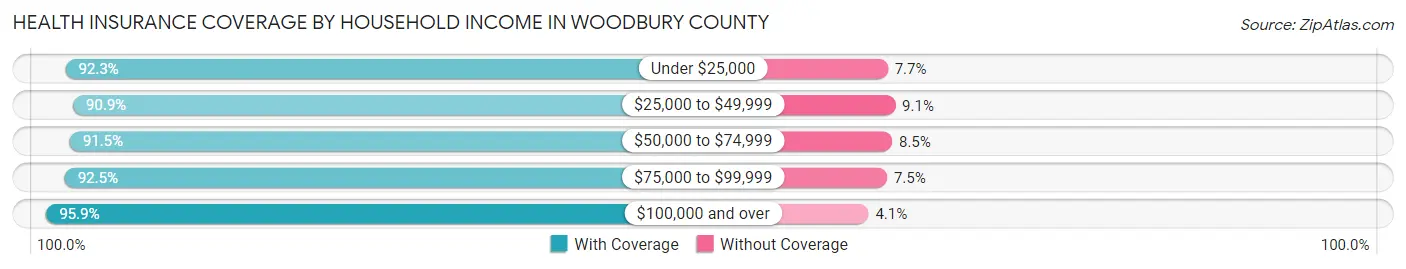
| Household Income | With Coverage | Without Coverage |
| Under $25,000 | 10,760 (92.3%) | 893 (7.7%) |
| $25,000 to $49,999 | 16,215 (90.9%) | 1,616 (9.1%) |
| $50,000 to $74,999 | 14,401 (91.5%) | 1,335 (8.5%) |
| $75,000 to $99,999 | 14,669 (92.5%) | 1,195 (7.5%) |
| $100,000 and over | 39,821 (95.9%) | 1,684 (4.1%) |
Public vs Private Health Insurance Coverage by Age in Woodbury County
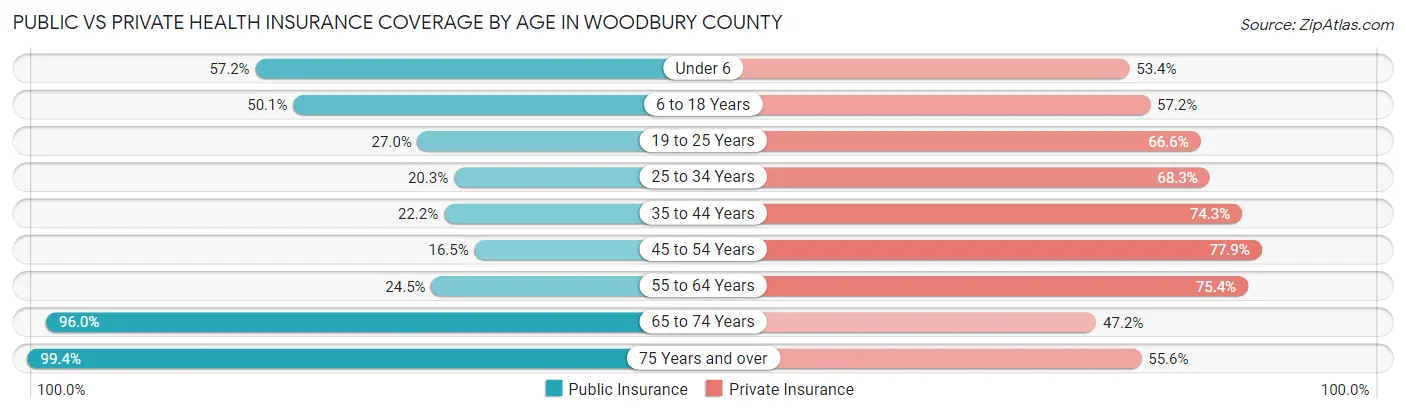
| Age Bracket | Public Insurance | Private Insurance |
| Under 6 | 5,088 (57.2%) | 4,751 (53.4%) |
| 6 to 18 Years | 9,966 (50.1%) | 11,379 (57.2%) |
| 19 to 25 Years | 2,823 (27.0%) | 6,950 (66.6%) |
| 25 to 34 Years | 2,412 (20.3%) | 8,113 (68.3%) |
| 35 to 44 Years | 2,781 (22.2%) | 9,329 (74.3%) |
| 45 to 54 Years | 2,056 (16.5%) | 9,713 (77.9%) |
| 55 to 64 Years | 3,048 (24.5%) | 9,382 (75.4%) |
| 65 to 74 Years | 9,229 (96.0%) | 4,539 (47.2%) |
| 75 Years and over | 6,144 (99.4%) | 3,435 (55.6%) |
| Total | 43,547 (41.7%) | 67,591 (64.8%) |
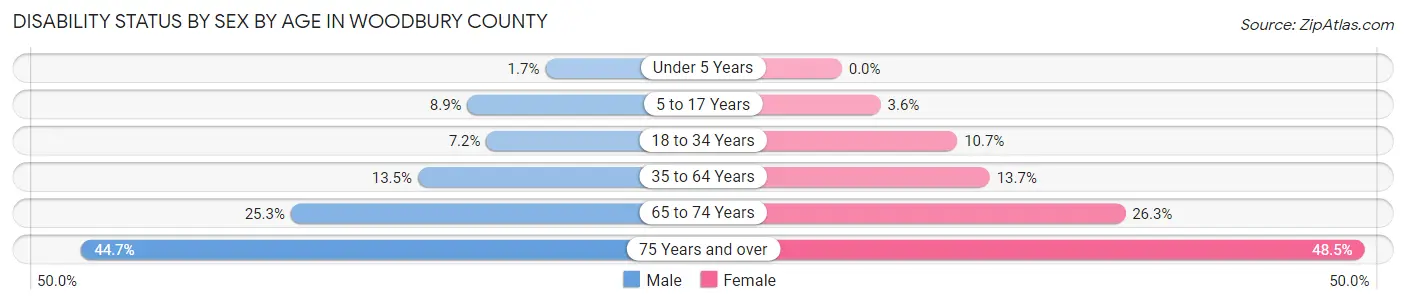
Disability Status by Sex by Age in Woodbury County
| Age Bracket | Male | Female |
| Under 5 Years | 62 (1.7%) | 0 (0.0%) |
| 5 to 17 Years | 902 (8.9%) | 351 (3.6%) |
| 18 to 34 Years | 883 (7.1%) | 1,260 (10.7%) |
| 35 to 64 Years | 2,550 (13.5%) | 2,553 (13.7%) |
| 65 to 74 Years | 1,175 (25.3%) | 1,307 (26.3%) |
| 75 Years and over | 1,113 (44.7%) | 1,790 (48.5%) |
Disability Class by Sex by Age in Woodbury County
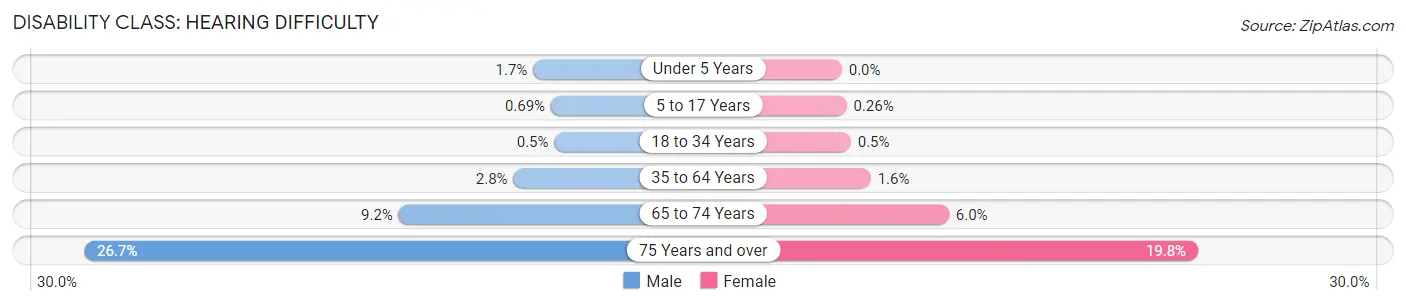
Disability Class: Hearing Difficulty
| Age Bracket | Male | Female |
| Under 5 Years | 62 (1.7%) | 0 (0.0%) |
| 5 to 17 Years | 70 (0.7%) | 25 (0.3%) |
| 18 to 34 Years | 62 (0.5%) | 59 (0.5%) |
| 35 to 64 Years | 524 (2.8%) | 299 (1.6%) |
| 65 to 74 Years | 426 (9.2%) | 296 (6.0%) |
| 75 Years and over | 664 (26.7%) | 732 (19.8%) |
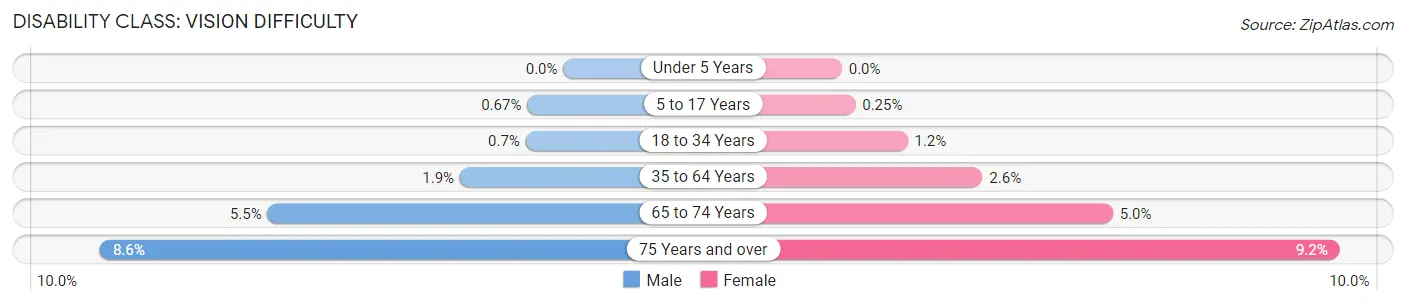
Disability Class: Vision Difficulty
| Age Bracket | Male | Female |
| Under 5 Years | 0 (0.0%) | 0 (0.0%) |
| 5 to 17 Years | 68 (0.7%) | 24 (0.3%) |
| 18 to 34 Years | 87 (0.7%) | 143 (1.2%) |
| 35 to 64 Years | 362 (1.9%) | 485 (2.6%) |
| 65 to 74 Years | 255 (5.5%) | 250 (5.0%) |
| 75 Years and over | 214 (8.6%) | 341 (9.2%) |
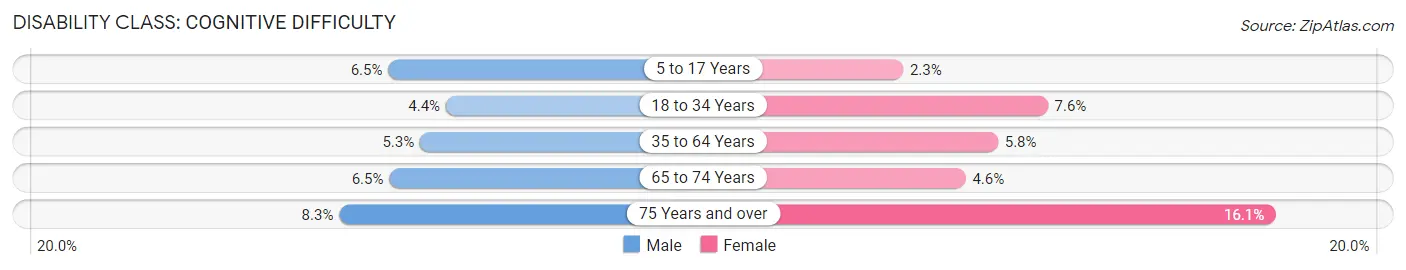
Disability Class: Cognitive Difficulty
| Age Bracket | Male | Female |
| 5 to 17 Years | 659 (6.5%) | 221 (2.3%) |
| 18 to 34 Years | 538 (4.4%) | 899 (7.6%) |
| 35 to 64 Years | 1,004 (5.3%) | 1,077 (5.8%) |
| 65 to 74 Years | 300 (6.5%) | 228 (4.6%) |
| 75 Years and over | 207 (8.3%) | 595 (16.1%) |
Disability Class: Ambulatory Difficulty
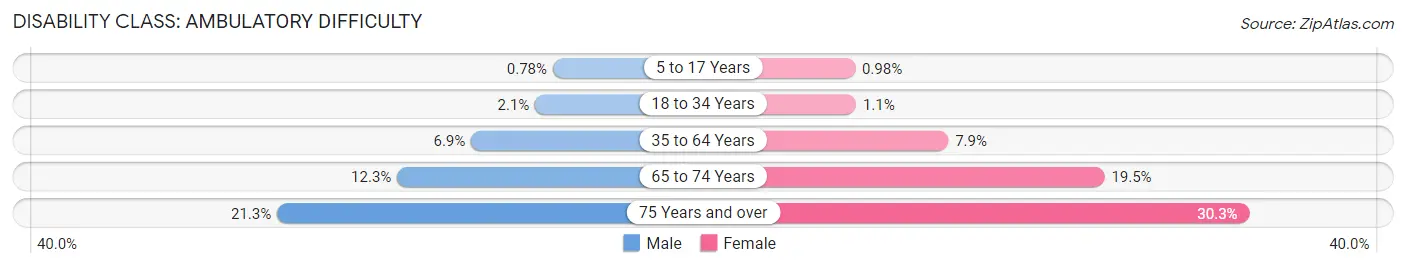
| Age Bracket | Male | Female |
| 5 to 17 Years | 79 (0.8%) | 95 (1.0%) |
| 18 to 34 Years | 258 (2.1%) | 124 (1.1%) |
| 35 to 64 Years | 1,293 (6.9%) | 1,470 (7.9%) |
| 65 to 74 Years | 573 (12.3%) | 969 (19.5%) |
| 75 Years and over | 529 (21.3%) | 1,117 (30.3%) |
Disability Class: Self-Care Difficulty
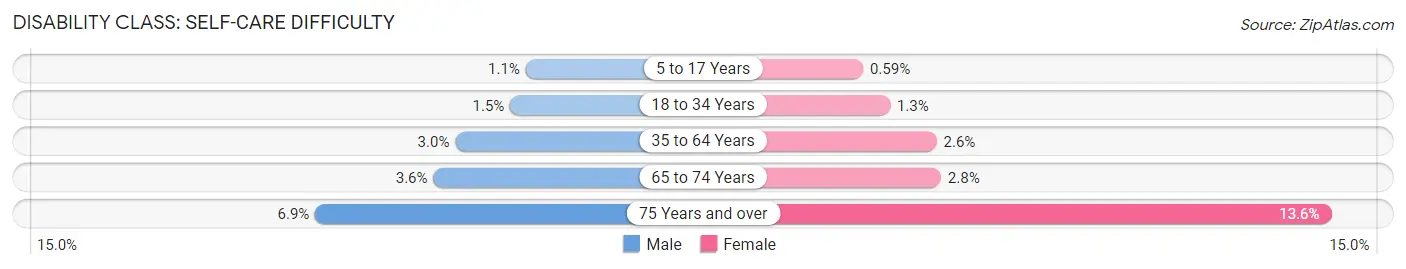
| Age Bracket | Male | Female |
| 5 to 17 Years | 106 (1.1%) | 57 (0.6%) |
| 18 to 34 Years | 183 (1.5%) | 158 (1.3%) |
| 35 to 64 Years | 568 (3.0%) | 491 (2.6%) |
| 65 to 74 Years | 168 (3.6%) | 137 (2.8%) |
| 75 Years and over | 172 (6.9%) | 503 (13.6%) |
Technology Access in Woodbury County
Computing Device Access in Woodbury County
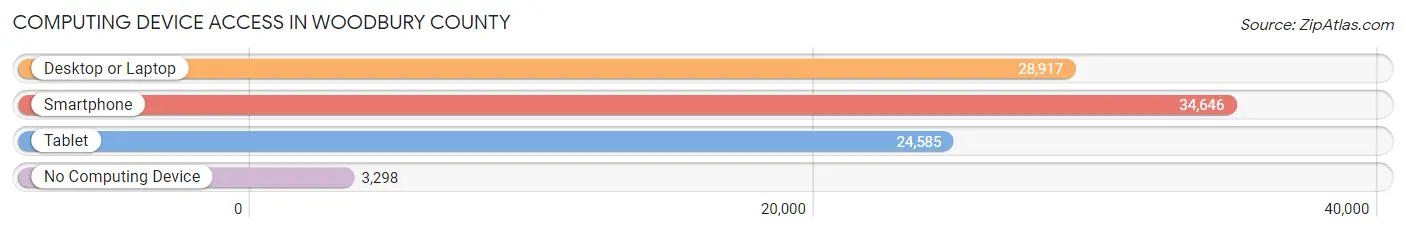
| Device Type | # Households | % Households |
| Desktop or Laptop | 28,917 | 71.8% |
| Smartphone | 34,646 | 86.0% |
| Tablet | 24,585 | 61.0% |
| No Computing Device | 3,298 | 8.2% |
| Total | 40,299 | 100.0% |
Internet Access in Woodbury County
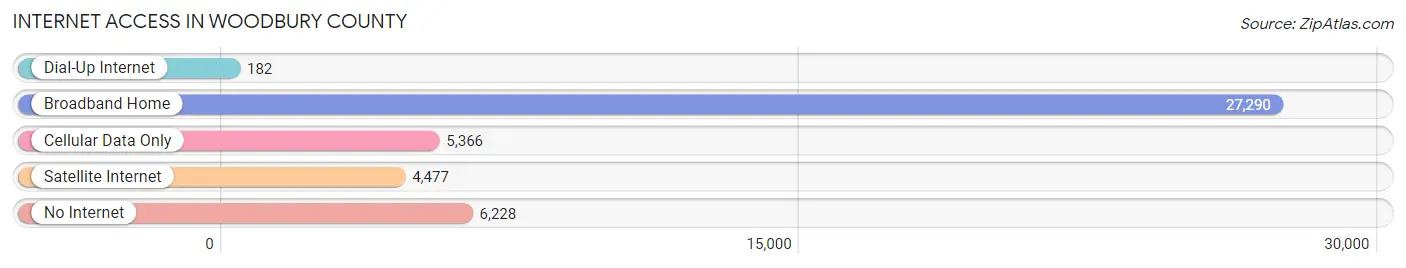
| Internet Type | # Households | % Households |
| Dial-Up Internet | 182 | 0.4% |
| Broadband Home | 27,290 | 67.7% |
| Cellular Data Only | 5,366 | 13.3% |
| Satellite Internet | 4,477 | 11.1% |
| No Internet | 6,228 | 15.4% |
| Total | 40,299 | 100.0% |
Woodbury County Summary
Woodbury County is located in the northwest corner of Iowa, and is the fourth most populous county in the state. It is bordered by Plymouth County to the north, Sioux County to the west, Monona County to the east, and Ida County to the south. The county seat is Sioux City, which is also the largest city in the county. Woodbury County is part of the Sioux City, IA-NE-SD Metropolitan Statistical Area.
History
Woodbury County was established in 1853, and was named after Levi Woodbury, a former U.S. Senator from New Hampshire. The county was originally part of the Nebraska Territory, and was part of the Dakota Territory from 1861 to 1864. The county was organized in 1857, and Sioux City was established as the county seat.
The county was home to several Native American tribes, including the Omaha, Ponca, and Sioux. The first white settlers arrived in the area in the 1840s, and the county was officially organized in 1857.
The county was an important transportation hub in the late 19th century, with the completion of the Union Pacific Railroad in 1867. The railroad connected Sioux City to the rest of the country, and the city quickly became a major trading center.
Geography
Woodbury County covers an area of 1,072 square miles, and is located in the northwest corner of Iowa. The county is bordered by Plymouth County to the north, Sioux County to the west, Monona County to the east, and Ida County to the south.
The county is mostly flat, with some rolling hills in the western part of the county. The Floyd River runs through the county, and the Big Sioux River forms the county's western border. The county is home to several lakes, including Lake Manawa, Little Sioux Lake, and Big Sioux Lake.
Economy
Woodbury County has a diverse economy, with a mix of manufacturing, agriculture, and services. The county is home to several major employers, including Tyson Foods, Wells Enterprises, and Sioux City Foundry.
Agriculture is an important part of the county's economy, with corn, soybeans, and hogs being the main crops. The county is also home to several livestock operations, including cattle, sheep, and poultry.
The county is home to several major industries, including food processing, manufacturing, and transportation. The county is also home to several major retail centers, including the Southern Hills Mall and the Sioux City Convention Center.
Demographics
As of the 2010 census, Woodbury County had a population of 102,172. The population was spread out, with 24.7% under the age of 18, 10.2% from 18 to 24, 28.2% from 25 to 44, 22.7% from 45 to 64, and 14.2% who were 65 years of age or older. The median age was 36.4 years.
The racial makeup of the county was 87.2% White, 5.3% African American, 0.7% Native American, 2.2% Asian, 0.1% Pacific Islander, 2.2% from other races, and 2.3% from two or more races. Hispanic or Latino of any race were 6.2% of the population.
The median income for a household in the county was $45,945, and the median income for a family was $54,945. The per capita income for the county was $22,945. About 8.2% of families and 11.2% of the population were below the poverty line, including 15.2% of those under age 18 and 6.2% of those age 65 or over.
Common Questions
What is Per Capita Income in Woodbury County?
Per Capita income in Woodbury County is $33,080.
What is the Median Family Income in Woodbury County?
Median Family Income in Woodbury County is $86,194.
What is the Median Household income in Woodbury County?
Median Household Income in Woodbury County is $68,399.
What is Income or Wage Gap in Woodbury County?
Income or Wage Gap in Woodbury County is 26.9%.
Women in Woodbury County earn 73.1 cents for every dollar earned by a man.
What is Family Income Deficit in Woodbury County?
Family Income Deficit in Woodbury County is $11,076.
Families that are below poverty line in Woodbury County earn $11,076 less on average than the poverty threshold level.
What is Inequality or Gini Index in Woodbury County?
Inequality or Gini Index in Woodbury County is 0.43.
What is the Total Population of Woodbury County?
Total Population of Woodbury County is 105,526.
What is the Total Male Population of Woodbury County?
Total Male Population of Woodbury County is 52,847.
What is the Total Female Population of Woodbury County?
Total Female Population of Woodbury County is 52,679.
What is the Ratio of Males per 100 Females in Woodbury County?
There are 100.32 Males per 100 Females in Woodbury County.
What is the Ratio of Females per 100 Males in Woodbury County?
There are 99.68 Females per 100 Males in Woodbury County.
What is the Median Population Age in Woodbury County?
Median Population Age in Woodbury County is 35.9 Years.
What is the Average Family Size in Woodbury County
Average Family Size in Woodbury County is 3.2 People.
What is the Average Household Size in Woodbury County
Average Household Size in Woodbury County is 2.5 People.
How Large is the Labor Force in Woodbury County?
There are 55,507 People in the Labor Forcein in Woodbury County.
What is the Percentage of People in the Labor Force in Woodbury County?
68.2% of People are in the Labor Force in Woodbury County.
What is the Unemployment Rate in Woodbury County?
Unemployment Rate in Woodbury County is 4.5%.