Clinton, IA Map & Demographics
Clinton Map
Clinton Overview
$31,275
PER CAPITA INCOME
$68,580
AVG FAMILY INCOME
$55,196
AVG HOUSEHOLD INCOME
38.0%
WAGE / INCOME GAP [ % ]
62.0¢/ $1
WAGE / INCOME GAP [ $ ]
$10,656
FAMILY INCOME DEFICIT
0.44
INEQUALITY / GINI INDEX
24,524
TOTAL POPULATION
12,084
MALE POPULATION
12,440
FEMALE POPULATION
97.14
MALES / 100 FEMALES
102.95
FEMALES / 100 MALES
42.8
MEDIAN AGE
2.9
AVG FAMILY SIZE
2.3
AVG HOUSEHOLD SIZE
11,536
LABOR FORCE [ PEOPLE ]
57.3%
PERCENT IN LABOR FORCE
5.2%
UNEMPLOYMENT RATE
Clinton Zip Codes
Clinton Area Codes
Income in Clinton
Income Overview in Clinton
Per Capita Income in Clinton is $31,275, while median incomes of families and households are $68,580 and $55,196 respectively.
| Characteristic | Number | Measure |
| Per Capita Income | 24,524 | $31,275 |
| Median Family Income | 6,099 | $68,580 |
| Mean Family Income | 6,099 | $85,988 |
| Median Household Income | 10,500 | $55,196 |
| Mean Household Income | 10,500 | $71,522 |
| Income Deficit | 6,099 | $10,656 |
| Wage / Income Gap (%) | 24,524 | 38.03% |
| Wage / Income Gap ($) | 24,524 | 61.97¢ per $1 |
| Gini / Inequality Index | 24,524 | 0.44 |
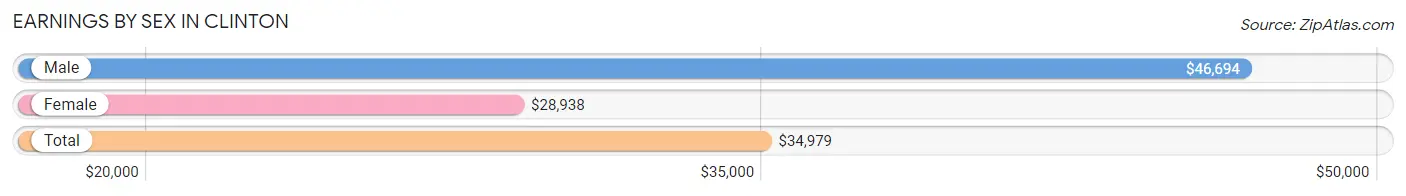
Earnings by Sex in Clinton
Average Earnings in Clinton are $34,979, $46,694 for men and $28,938 for women, a difference of 38.0%.
| Sex | Number | Average Earnings |
| Male | 5,954 (50.1%) | $46,694 |
| Female | 5,938 (49.9%) | $28,938 |
| Total | 11,892 (100.0%) | $34,979 |
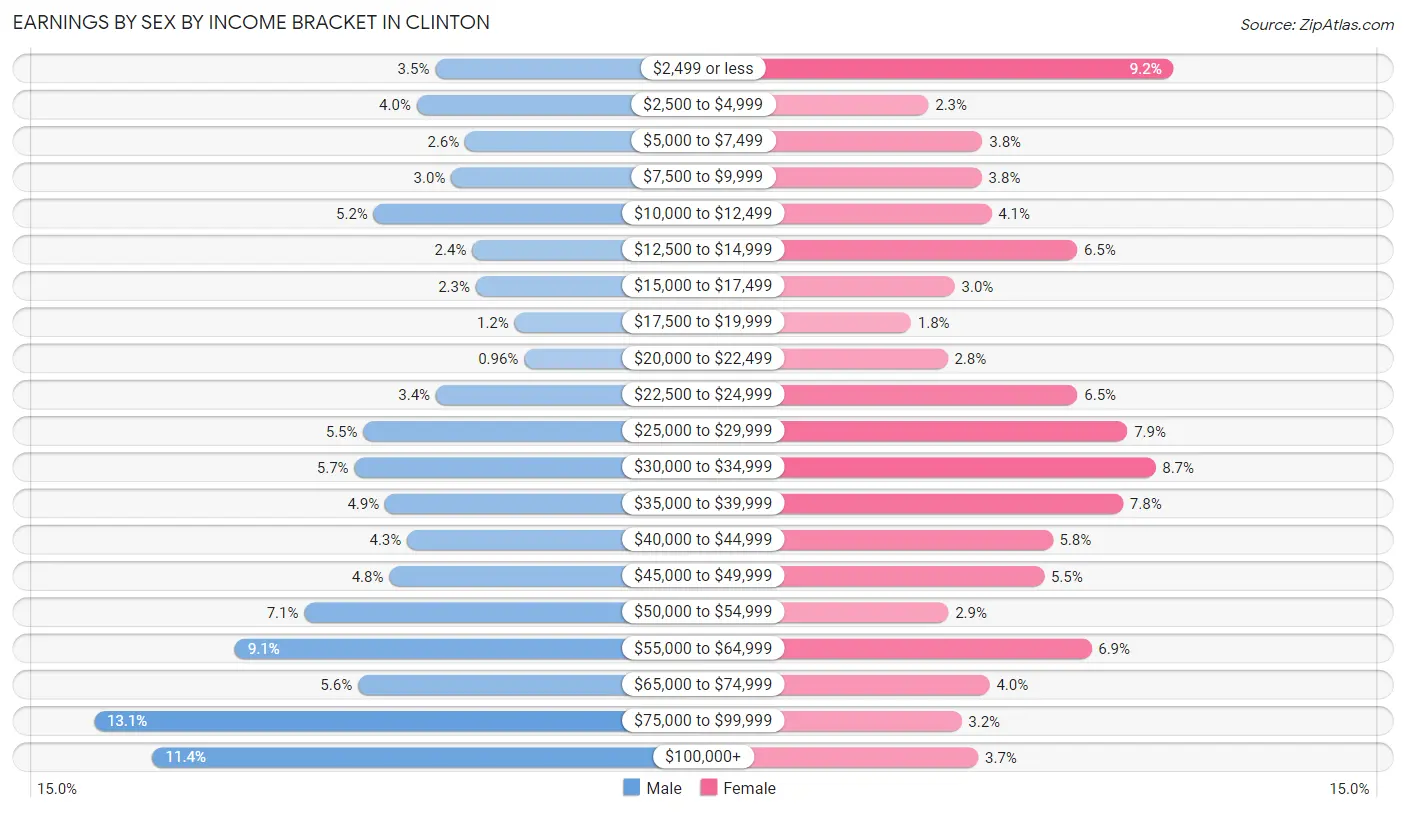
Earnings by Sex by Income Bracket in Clinton
The most common earnings brackets in Clinton are $75,000 to $99,999 for men (777 | 13.1%) and $2,499 or less for women (545 | 9.2%).
| Income | Male | Female |
| $2,499 or less | 206 (3.5%) | 545 (9.2%) |
| $2,500 to $4,999 | 237 (4.0%) | 136 (2.3%) |
| $5,000 to $7,499 | 156 (2.6%) | 226 (3.8%) |
| $7,500 to $9,999 | 179 (3.0%) | 225 (3.8%) |
| $10,000 to $12,499 | 309 (5.2%) | 241 (4.1%) |
| $12,500 to $14,999 | 144 (2.4%) | 384 (6.5%) |
| $15,000 to $17,499 | 138 (2.3%) | 180 (3.0%) |
| $17,500 to $19,999 | 73 (1.2%) | 107 (1.8%) |
| $20,000 to $22,499 | 57 (1.0%) | 168 (2.8%) |
| $22,500 to $24,999 | 205 (3.4%) | 385 (6.5%) |
| $25,000 to $29,999 | 326 (5.5%) | 468 (7.9%) |
| $30,000 to $34,999 | 341 (5.7%) | 515 (8.7%) |
| $35,000 to $39,999 | 290 (4.9%) | 461 (7.8%) |
| $40,000 to $44,999 | 253 (4.3%) | 343 (5.8%) |
| $45,000 to $49,999 | 283 (4.8%) | 329 (5.5%) |
| $50,000 to $54,999 | 425 (7.1%) | 169 (2.9%) |
| $55,000 to $64,999 | 541 (9.1%) | 408 (6.9%) |
| $65,000 to $74,999 | 335 (5.6%) | 238 (4.0%) |
| $75,000 to $99,999 | 777 (13.1%) | 191 (3.2%) |
| $100,000+ | 679 (11.4%) | 219 (3.7%) |
| Total | 5,954 (100.0%) | 5,938 (100.0%) |
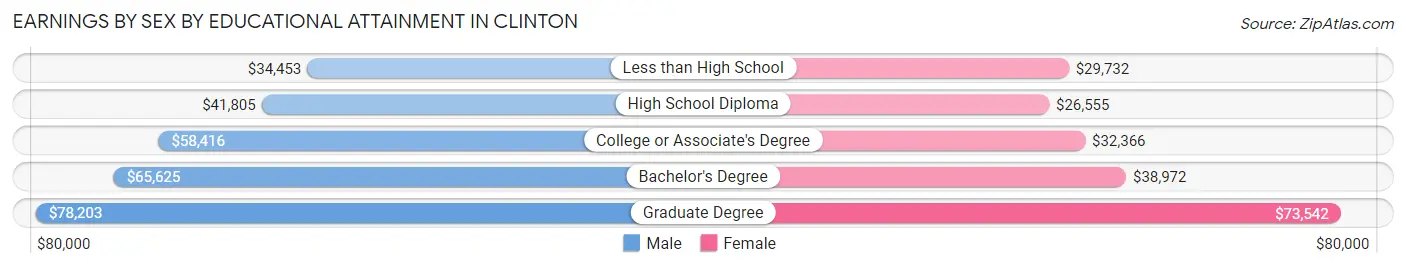
Earnings by Sex by Educational Attainment in Clinton
Average earnings in Clinton are $51,404 for men and $33,575 for women, a difference of 34.7%. Men with an educational attainment of graduate degree enjoy the highest average annual earnings of $78,203, while those with less than high school education earn the least with $34,453. Women with an educational attainment of graduate degree earn the most with the average annual earnings of $73,542, while those with high school diploma education have the smallest earnings of $26,555.
| Educational Attainment | Male Income | Female Income |
| Less than High School | $34,453 | $29,732 |
| High School Diploma | $41,805 | $26,555 |
| College or Associate's Degree | $58,416 | $32,366 |
| Bachelor's Degree | $65,625 | $38,972 |
| Graduate Degree | $78,203 | $73,542 |
| Total | $51,404 | $33,575 |
Family Income in Clinton
Family Income Brackets in Clinton
According to the Clinton family income data, there are 1,226 families falling into the $50,000 to $74,999 income range, which is the most common income bracket and makes up 20.1% of all families. Conversely, the less than $10,000 income bracket is the least frequent group with only 165 families (2.7%) belonging to this category.
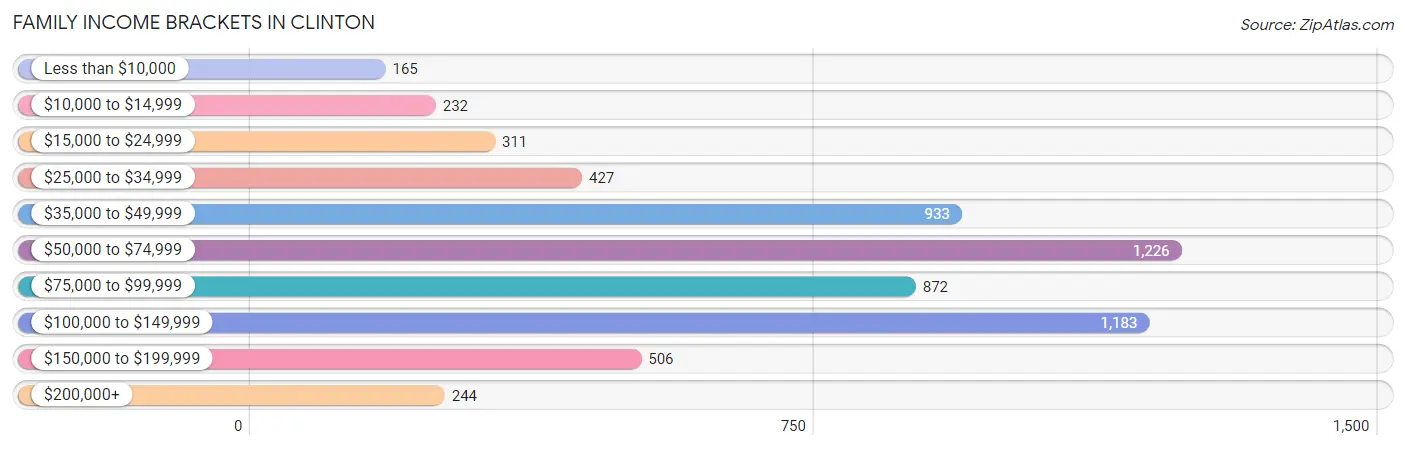
| Income Bracket | # Families | % Families |
| Less than $10,000 | 165 | 2.7% |
| $10,000 to $14,999 | 232 | 3.8% |
| $15,000 to $24,999 | 311 | 5.1% |
| $25,000 to $34,999 | 427 | 7.0% |
| $35,000 to $49,999 | 933 | 15.3% |
| $50,000 to $74,999 | 1,226 | 20.1% |
| $75,000 to $99,999 | 872 | 14.3% |
| $100,000 to $149,999 | 1,183 | 19.4% |
| $150,000 to $199,999 | 506 | 8.3% |
| $200,000+ | 244 | 4.0% |
Family Income by Famaliy Size in Clinton
5-person families (292 | 4.8%) account for the highest median family income in Clinton with $115,833 per family, while 2-person families (3,632 | 59.6%) have the highest median income of $33,697 per family member.
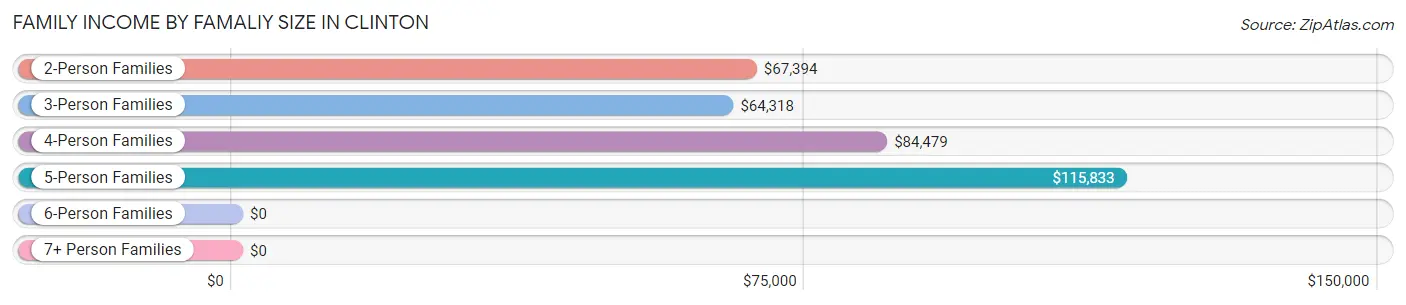
| Income Bracket | # Families | Median Income |
| 2-Person Families | 3,632 (59.6%) | $67,394 |
| 3-Person Families | 960 (15.7%) | $64,318 |
| 4-Person Families | 963 (15.8%) | $84,479 |
| 5-Person Families | 292 (4.8%) | $115,833 |
| 6-Person Families | 102 (1.7%) | $0 |
| 7+ Person Families | 150 (2.5%) | $0 |
| Total | 6,099 (100.0%) | $68,580 |
Family Income by Number of Earners in Clinton
The median family income in Clinton is $68,580, with families comprising 3+ earners (412) having the highest median family income of $104,286, while families with no earners (1,178) have the lowest median family income of $49,618, accounting for 6.8% and 19.3% of families, respectively.
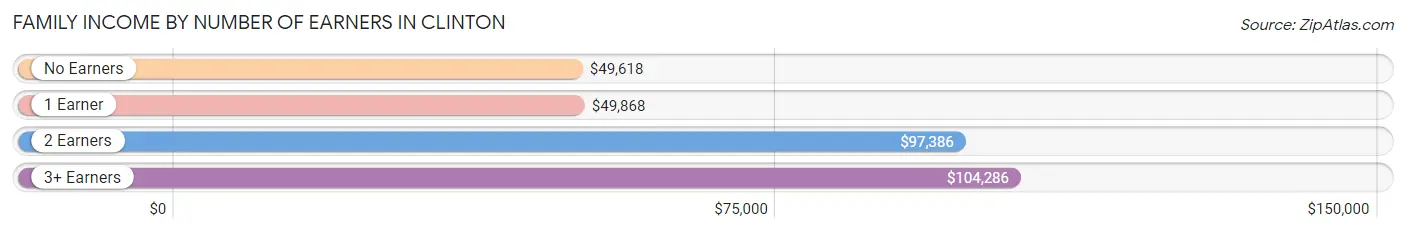
| Number of Earners | # Families | Median Income |
| No Earners | 1,178 (19.3%) | $49,618 |
| 1 Earner | 2,190 (35.9%) | $49,868 |
| 2 Earners | 2,319 (38.0%) | $97,386 |
| 3+ Earners | 412 (6.8%) | $104,286 |
| Total | 6,099 (100.0%) | $68,580 |
Household Income in Clinton
Household Income Brackets in Clinton
With 2,058 households falling in the category, the $50,000 to $74,999 income range is the most frequent in Clinton, accounting for 19.6% of all households. In contrast, only 294 households (2.8%) fall into the $200,000+ income bracket, making it the least populous group.
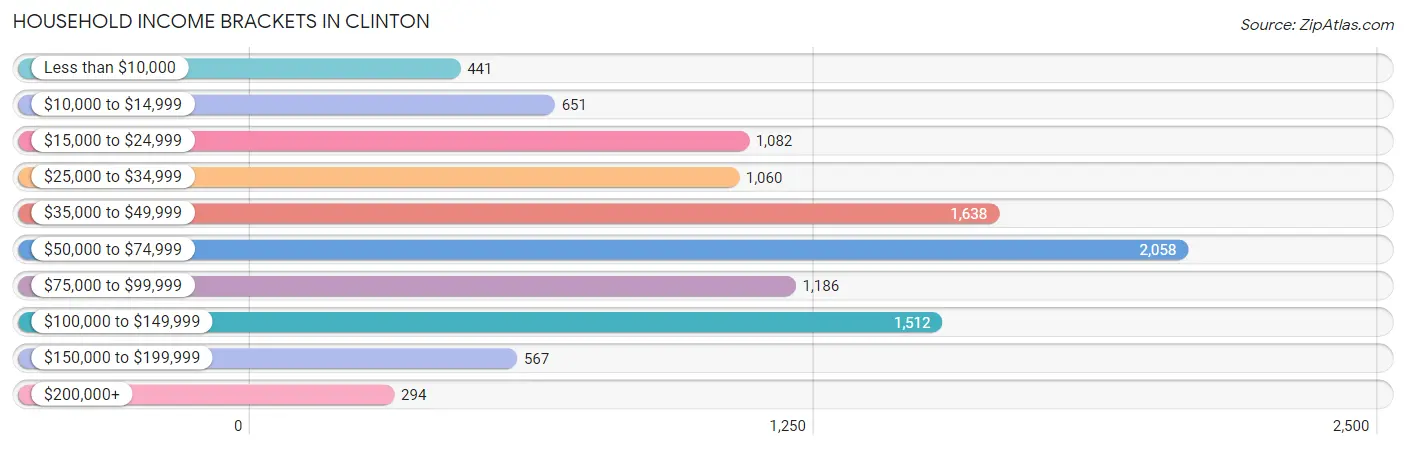
| Income Bracket | # Households | % Households |
| Less than $10,000 | 441 | 4.2% |
| $10,000 to $14,999 | 651 | 6.2% |
| $15,000 to $24,999 | 1,082 | 10.3% |
| $25,000 to $34,999 | 1,060 | 10.1% |
| $35,000 to $49,999 | 1,638 | 15.6% |
| $50,000 to $74,999 | 2,058 | 19.6% |
| $75,000 to $99,999 | 1,186 | 11.3% |
| $100,000 to $149,999 | 1,512 | 14.4% |
| $150,000 to $199,999 | 567 | 5.4% |
| $200,000+ | 294 | 2.8% |
Household Income by Householder Age in Clinton
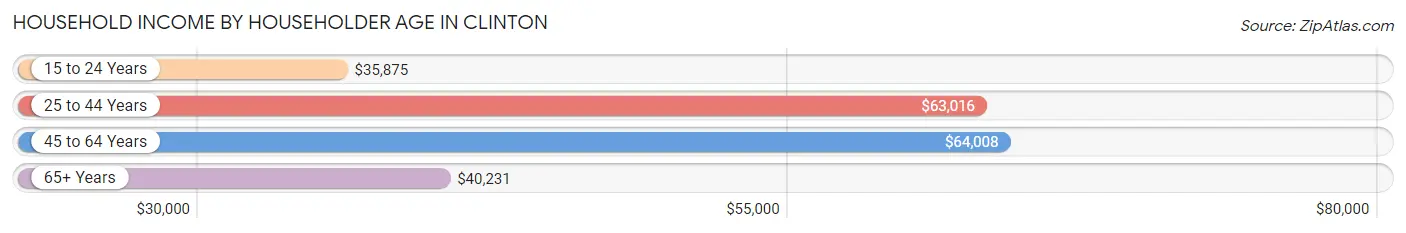
The median household income in Clinton is $55,196, with the highest median household income of $64,008 found in the 45 to 64 years age bracket for the primary householder. A total of 3,879 households (36.9%) fall into this category. Meanwhile, the 15 to 24 years age bracket for the primary householder has the lowest median household income of $35,875, with 421 households (4.0%) in this group.
| Income Bracket | # Households | Median Income |
| 15 to 24 Years | 421 (4.0%) | $35,875 |
| 25 to 44 Years | 2,922 (27.8%) | $63,016 |
| 45 to 64 Years | 3,879 (36.9%) | $64,008 |
| 65+ Years | 3,278 (31.2%) | $40,231 |
| Total | 10,500 (100.0%) | $55,196 |
Poverty in Clinton
Income Below Poverty by Sex and Age in Clinton
With 14.6% poverty level for males and 19.4% for females among the residents of Clinton, 5 year old males and 12 to 14 year old females are the most vulnerable to poverty, with 56 males (56.6%) and 164 females (37.7%) in their respective age groups living below the poverty level.
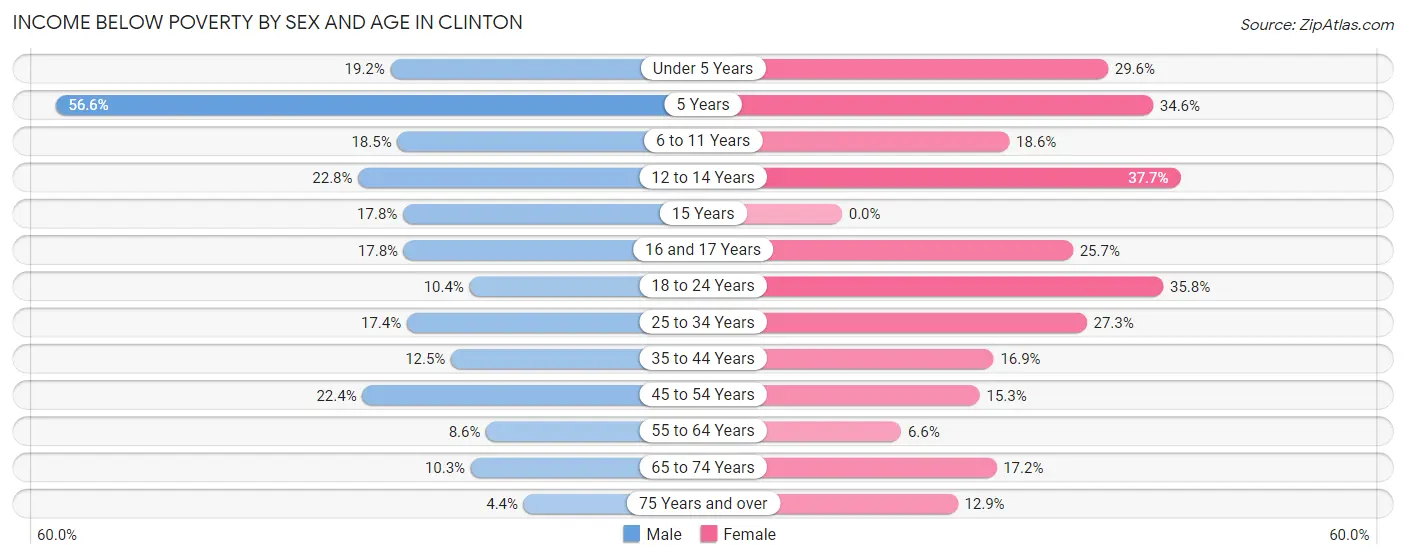
| Age Bracket | Male | Female |
| Under 5 Years | 131 (19.2%) | 197 (29.6%) |
| 5 Years | 56 (56.6%) | 62 (34.6%) |
| 6 to 11 Years | 138 (18.5%) | 129 (18.6%) |
| 12 to 14 Years | 87 (22.8%) | 164 (37.7%) |
| 15 Years | 38 (17.8%) | 0 (0.0%) |
| 16 and 17 Years | 54 (17.8%) | 80 (25.7%) |
| 18 to 24 Years | 92 (10.4%) | 317 (35.8%) |
| 25 to 34 Years | 253 (17.4%) | 432 (27.3%) |
| 35 to 44 Years | 202 (12.5%) | 219 (16.9%) |
| 45 to 54 Years | 357 (22.4%) | 201 (15.3%) |
| 55 to 64 Years | 152 (8.6%) | 135 (6.6%) |
| 65 to 74 Years | 131 (10.3%) | 232 (17.2%) |
| 75 Years and over | 37 (4.4%) | 151 (12.9%) |
| Total | 1,728 (14.6%) | 2,319 (19.4%) |
Income Above Poverty by Sex and Age in Clinton
According to the poverty statistics in Clinton, males aged 75 years and over and females aged 15 years are the age groups that are most secure financially, with 95.6% of males and 100.0% of females in these age groups living above the poverty line.
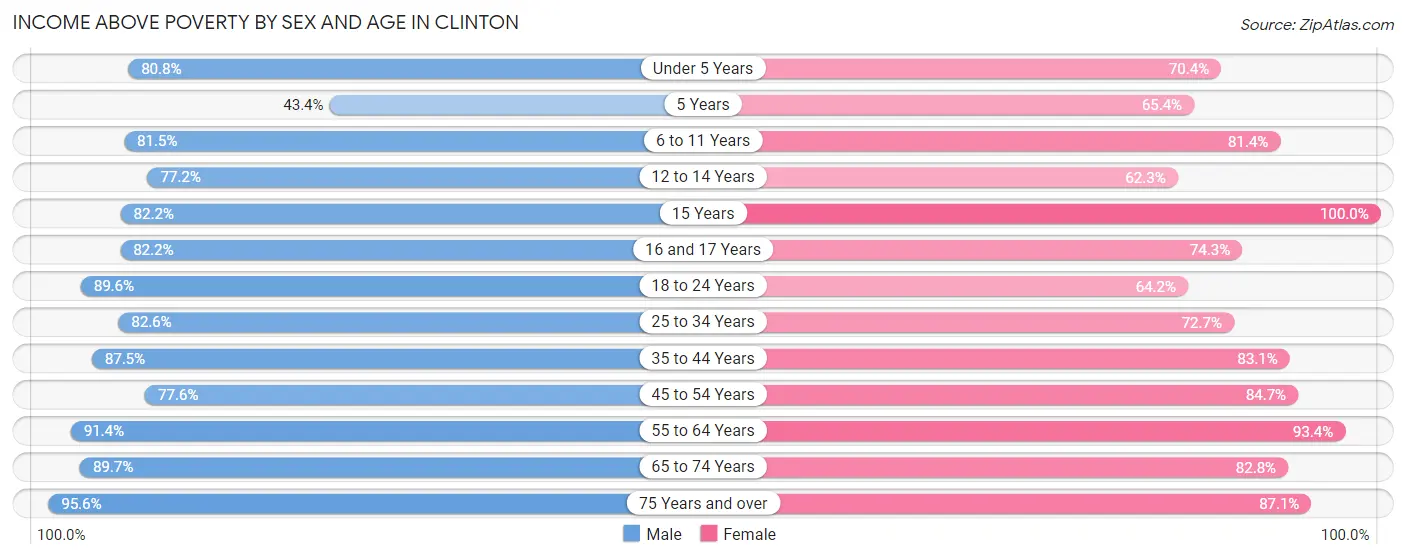
| Age Bracket | Male | Female |
| Under 5 Years | 550 (80.8%) | 468 (70.4%) |
| 5 Years | 43 (43.4%) | 117 (65.4%) |
| 6 to 11 Years | 609 (81.5%) | 563 (81.4%) |
| 12 to 14 Years | 294 (77.2%) | 271 (62.3%) |
| 15 Years | 175 (82.2%) | 53 (100.0%) |
| 16 and 17 Years | 250 (82.2%) | 231 (74.3%) |
| 18 to 24 Years | 790 (89.6%) | 569 (64.2%) |
| 25 to 34 Years | 1,200 (82.6%) | 1,153 (72.7%) |
| 35 to 44 Years | 1,415 (87.5%) | 1,078 (83.1%) |
| 45 to 54 Years | 1,239 (77.6%) | 1,109 (84.7%) |
| 55 to 64 Years | 1,620 (91.4%) | 1,913 (93.4%) |
| 65 to 74 Years | 1,142 (89.7%) | 1,117 (82.8%) |
| 75 Years and over | 803 (95.6%) | 1,021 (87.1%) |
| Total | 10,130 (85.4%) | 9,663 (80.6%) |
Income Below Poverty Among Married-Couple Families in Clinton
The poverty statistics for married-couple families in Clinton show that 3.3% or 140 of the total 4,244 families live below the poverty line. Families with 5 or more children have the highest poverty rate of 8.6%, comprising of 3 families. On the other hand, families with no children have the lowest poverty rate of 3.0%, which includes 88 families.
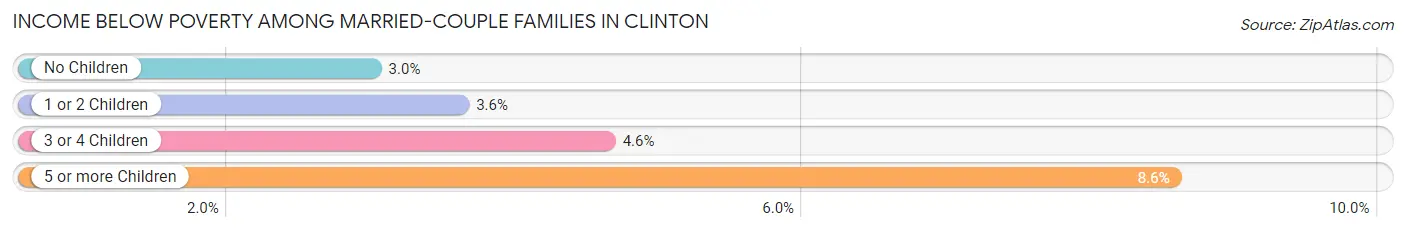
| Children | Above Poverty | Below Poverty |
| No Children | 2,844 (97.0%) | 88 (3.0%) |
| 1 or 2 Children | 960 (96.4%) | 36 (3.6%) |
| 3 or 4 Children | 268 (95.4%) | 13 (4.6%) |
| 5 or more Children | 32 (91.4%) | 3 (8.6%) |
| Total | 4,104 (96.7%) | 140 (3.3%) |
Income Below Poverty Among Single-Parent Households in Clinton
According to the poverty data in Clinton, 9.4% or 52 single-father households and 40.1% or 523 single-mother households are living below the poverty line. Among single-father households, those with 5 or more children have the highest poverty rate, with 30 households (100.0%) experiencing poverty. Likewise, among single-mother households, those with 5 or more children have the highest poverty rate, with 64 households (100.0%) falling below the poverty line.
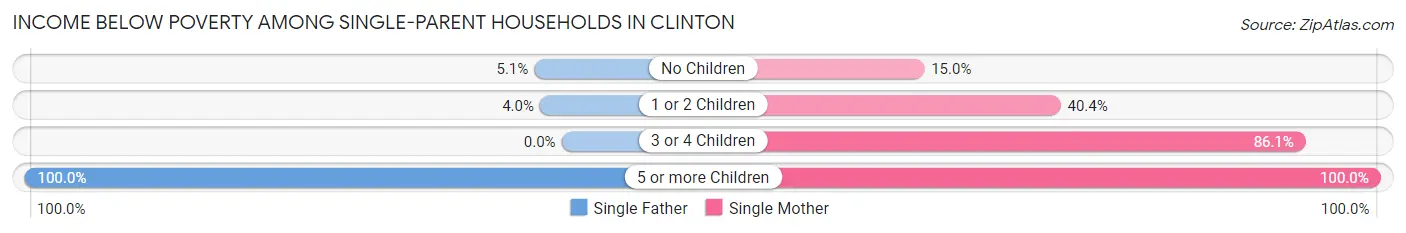
| Children | Single Father | Single Mother |
| No Children | 11 (5.1%) | 71 (15.0%) |
| 1 or 2 Children | 11 (4.0%) | 240 (40.4%) |
| 3 or 4 Children | 0 (0.0%) | 148 (86.1%) |
| 5 or more Children | 30 (100.0%) | 64 (100.0%) |
| Total | 52 (9.4%) | 523 (40.1%) |
Income Below Poverty Among Married-Couple vs Single-Parent Households in Clinton
The poverty data for Clinton shows that 140 of the married-couple family households (3.3%) and 575 of the single-parent households (31.0%) are living below the poverty level. Within the married-couple family households, those with 5 or more children have the highest poverty rate, with 3 households (8.6%) falling below the poverty line. Among the single-parent households, those with 5 or more children have the highest poverty rate, with 94 household (100.0%) living below poverty.
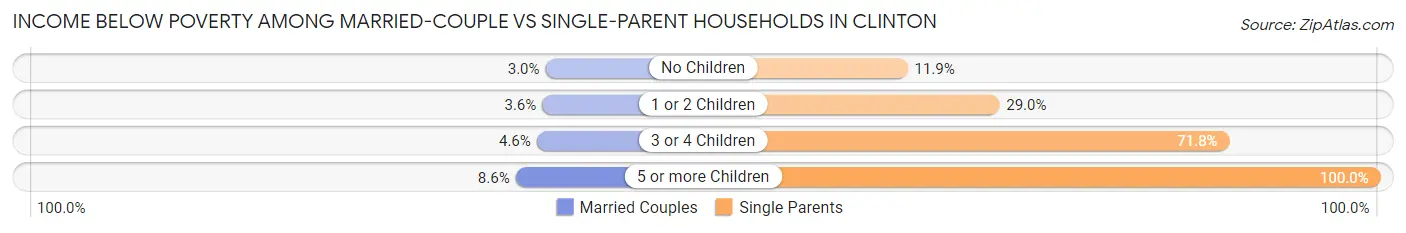
| Children | Married-Couple Families | Single-Parent Households |
| No Children | 88 (3.0%) | 82 (11.9%) |
| 1 or 2 Children | 36 (3.6%) | 251 (29.0%) |
| 3 or 4 Children | 13 (4.6%) | 148 (71.8%) |
| 5 or more Children | 3 (8.6%) | 94 (100.0%) |
| Total | 140 (3.3%) | 575 (31.0%) |
Race in Clinton
The most populous races in Clinton are White / Caucasian (21,836 | 89.0%), Black / African American (1,277 | 5.2%), and Hispanic or Latino (1,174 | 4.8%).
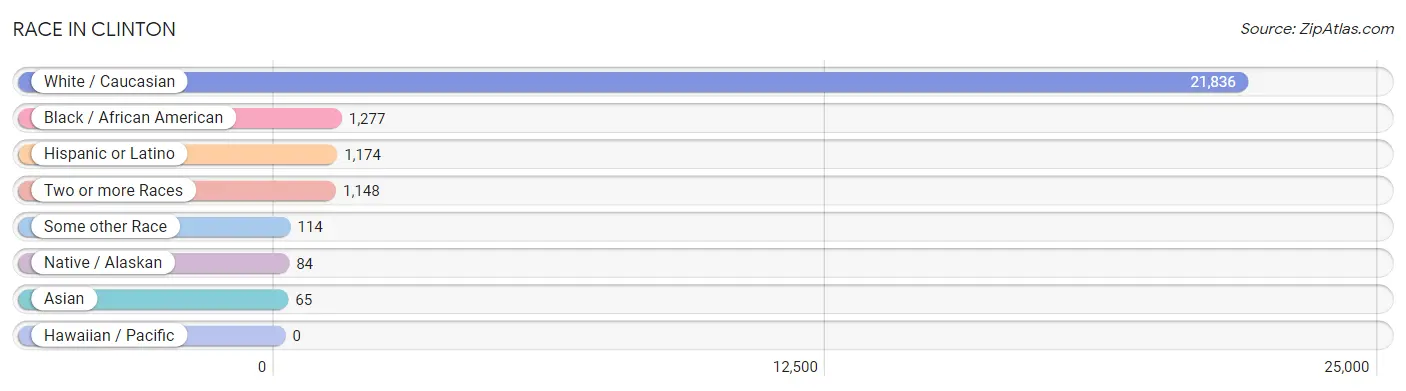
| Race | # Population | % Population |
| Asian | 65 | 0.3% |
| Black / African American | 1,277 | 5.2% |
| Hawaiian / Pacific | 0 | 0.0% |
| Hispanic or Latino | 1,174 | 4.8% |
| Native / Alaskan | 84 | 0.3% |
| White / Caucasian | 21,836 | 89.0% |
| Two or more Races | 1,148 | 4.7% |
| Some other Race | 114 | 0.5% |
| Total | 24,524 | 100.0% |
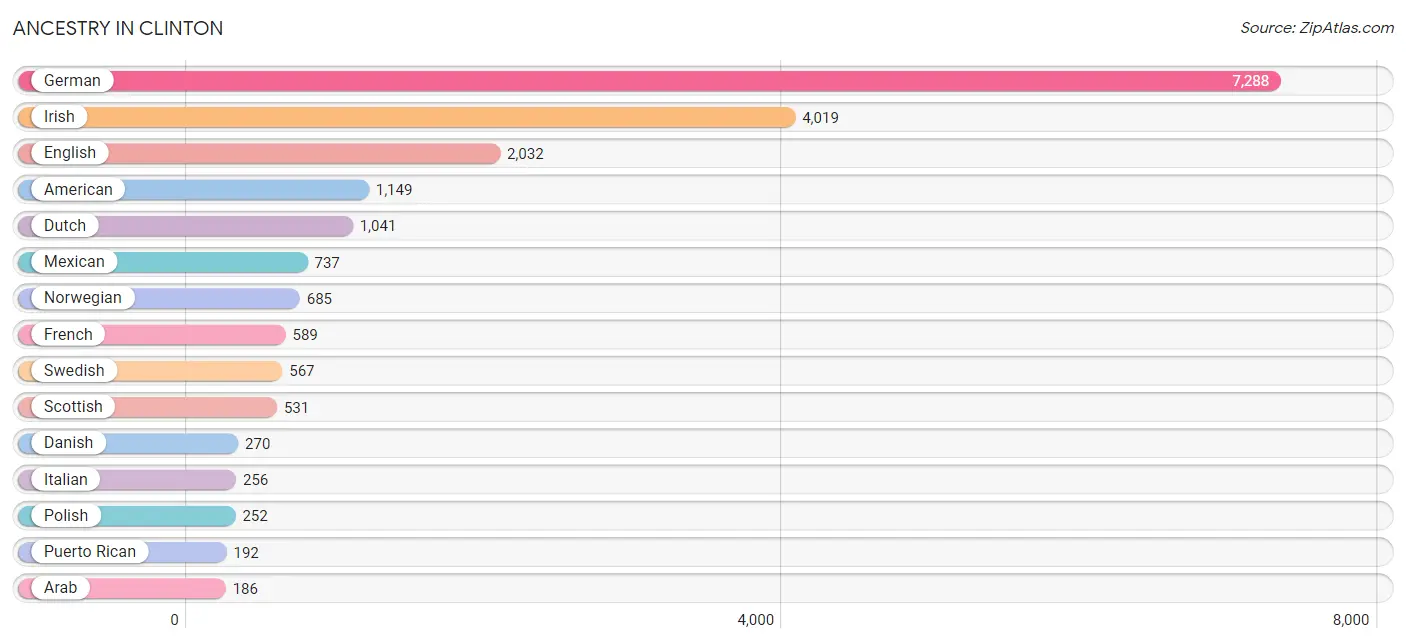
Ancestry in Clinton
The most populous ancestries reported in Clinton are German (7,288 | 29.7%), Irish (4,019 | 16.4%), English (2,032 | 8.3%), American (1,149 | 4.7%), and Dutch (1,041 | 4.2%), together accounting for 63.3% of all Clinton residents.
| Ancestry | # Population | % Population |
| American | 1,149 | 4.7% |
| Apache | 9 | 0.0% |
| Arab | 186 | 0.8% |
| Austrian | 39 | 0.2% |
| Belgian | 85 | 0.4% |
| Bhutanese | 2 | 0.0% |
| Blackfeet | 66 | 0.3% |
| British | 110 | 0.4% |
| Burmese | 30 | 0.1% |
| Canadian | 24 | 0.1% |
| Central American | 17 | 0.1% |
| Central American Indian | 4 | 0.0% |
| Cherokee | 44 | 0.2% |
| Choctaw | 11 | 0.0% |
| Costa Rican | 17 | 0.1% |
| Croatian | 7 | 0.0% |
| Cuban | 55 | 0.2% |
| Czech | 116 | 0.5% |
| Danish | 270 | 1.1% |
| Dutch | 1,041 | 4.2% |
| Egyptian | 150 | 0.6% |
| English | 2,032 | 8.3% |
| European | 161 | 0.7% |
| Finnish | 14 | 0.1% |
| French | 589 | 2.4% |
| French Canadian | 102 | 0.4% |
| German | 7,288 | 29.7% |
| Greek | 11 | 0.0% |
| Hungarian | 5 | 0.0% |
| Indian (Asian) | 7 | 0.0% |
| Iranian | 18 | 0.1% |
| Iraqi | 36 | 0.2% |
| Irish | 4,019 | 16.4% |
| Italian | 256 | 1.0% |
| Korean | 25 | 0.1% |
| Luxembourger | 11 | 0.0% |
| Menominee | 32 | 0.1% |
| Mexican | 737 | 3.0% |
| Mexican American Indian | 4 | 0.0% |
| Native Hawaiian | 5 | 0.0% |
| Norwegian | 685 | 2.8% |
| Pennsylvania German | 36 | 0.2% |
| Polish | 252 | 1.0% |
| Puerto Rican | 192 | 0.8% |
| Romanian | 41 | 0.2% |
| Russian | 100 | 0.4% |
| Samoan | 12 | 0.1% |
| Scandinavian | 33 | 0.1% |
| Scotch-Irish | 120 | 0.5% |
| Scottish | 531 | 2.2% |
| Serbian | 28 | 0.1% |
| Sioux | 22 | 0.1% |
| Spaniard | 98 | 0.4% |
| Sri Lankan | 2 | 0.0% |
| Swedish | 567 | 2.3% |
| Swiss | 64 | 0.3% |
| Trinidadian and Tobagonian | 18 | 0.1% |
| Ukrainian | 5 | 0.0% |
| Welsh | 102 | 0.4% | View All 59 Rows |
Immigrants in Clinton
The most numerous immigrant groups reported in Clinton came from Latin America (181 | 0.7%), Central America (141 | 0.6%), Africa (139 | 0.6%), Mexico (124 | 0.5%), and Egypt (119 | 0.5%), together accounting for 2.9% of all Clinton residents.
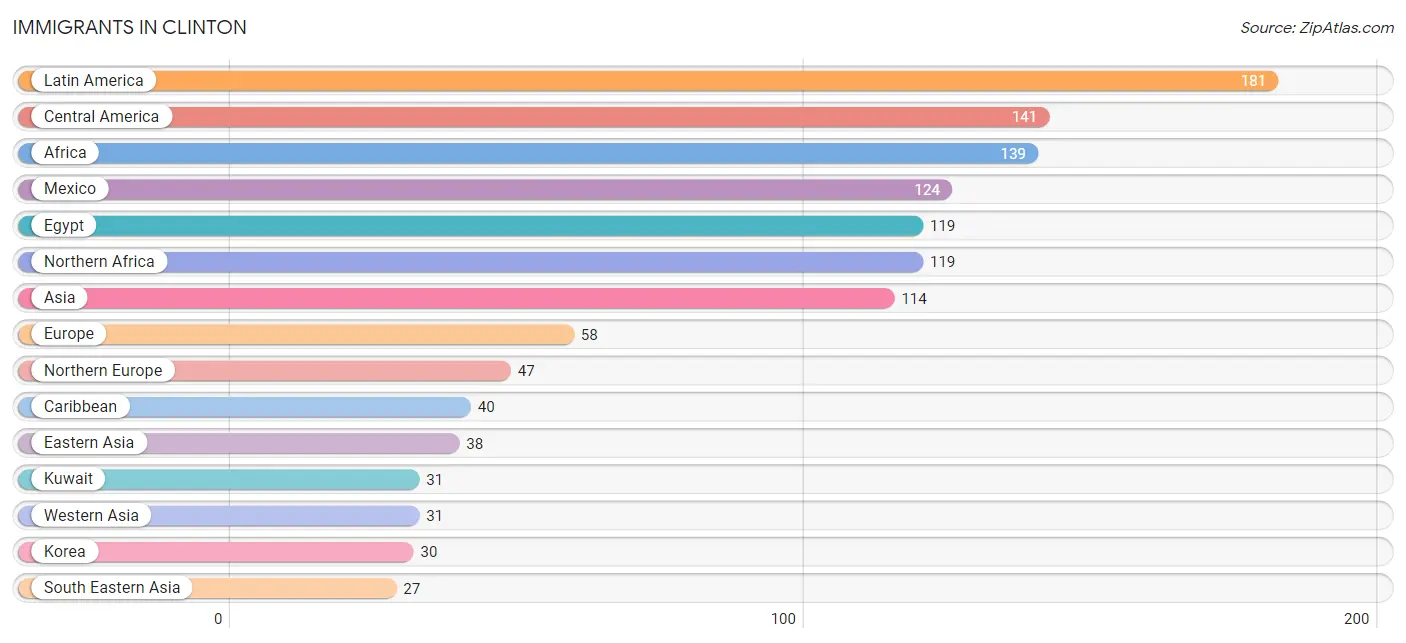
| Immigration Origin | # Population | % Population |
| Africa | 139 | 0.6% |
| Asia | 114 | 0.5% |
| Canada | 9 | 0.0% |
| Caribbean | 40 | 0.2% |
| Central America | 141 | 0.6% |
| China | 6 | 0.0% |
| Eastern Africa | 20 | 0.1% |
| Eastern Asia | 38 | 0.2% |
| Eastern Europe | 5 | 0.0% |
| Egypt | 119 | 0.5% |
| England | 24 | 0.1% |
| Eritrea | 20 | 0.1% |
| Europe | 58 | 0.2% |
| Guatemala | 17 | 0.1% |
| Iran | 18 | 0.1% |
| Japan | 2 | 0.0% |
| Korea | 30 | 0.1% |
| Kuwait | 31 | 0.1% |
| Latin America | 181 | 0.7% |
| Mexico | 124 | 0.5% |
| Netherlands | 6 | 0.0% |
| Northern Africa | 119 | 0.5% |
| Northern Europe | 47 | 0.2% |
| Norway | 23 | 0.1% |
| Philippines | 25 | 0.1% |
| South Central Asia | 18 | 0.1% |
| South Eastern Asia | 27 | 0.1% |
| Taiwan | 2 | 0.0% |
| Ukraine | 5 | 0.0% |
| Vietnam | 2 | 0.0% |
| Western Asia | 31 | 0.1% |
| Western Europe | 6 | 0.0% | View All 32 Rows |
Sex and Age in Clinton
Sex and Age in Clinton
The most populous age groups in Clinton are 50 to 54 Years (917 | 7.6%) for men and 60 to 64 Years (1,041 | 8.4%) for women.
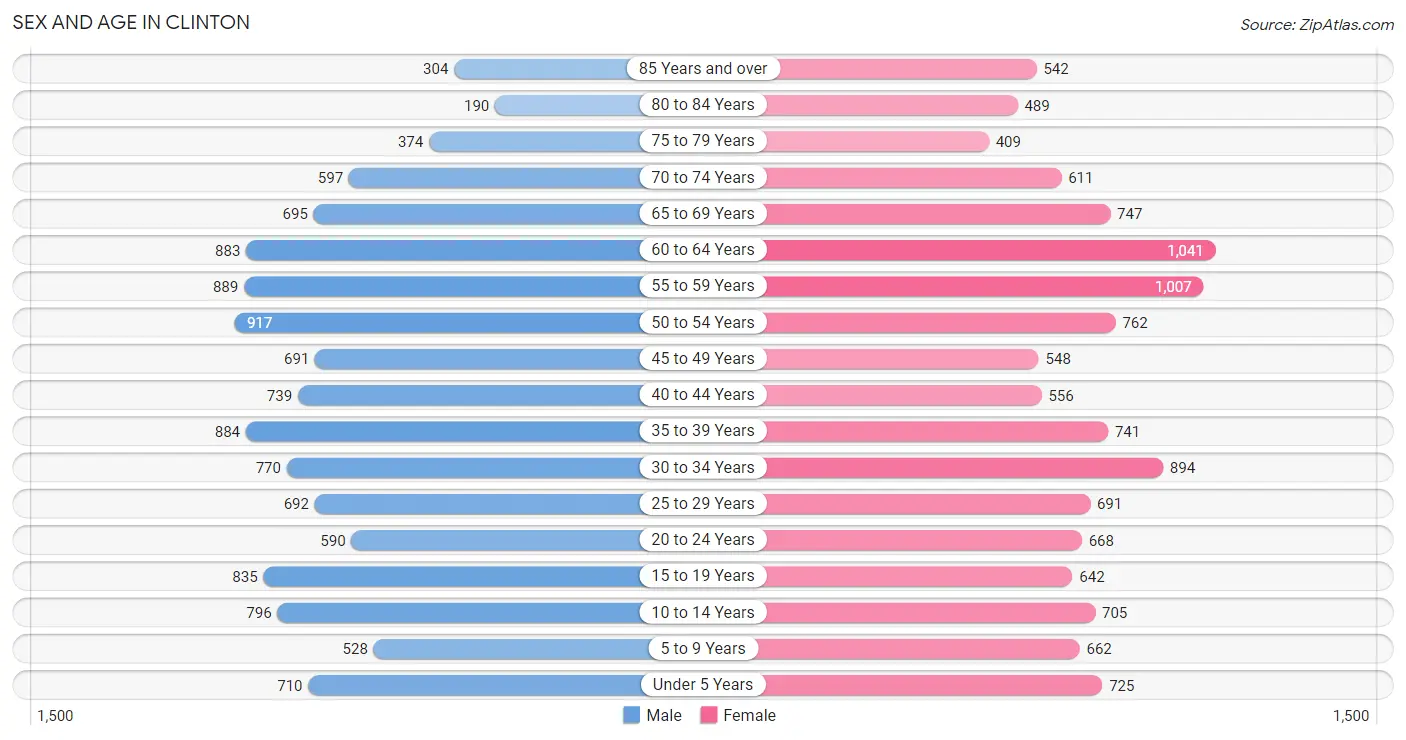
| Age Bracket | Male | Female |
| Under 5 Years | 710 (5.9%) | 725 (5.8%) |
| 5 to 9 Years | 528 (4.4%) | 662 (5.3%) |
| 10 to 14 Years | 796 (6.6%) | 705 (5.7%) |
| 15 to 19 Years | 835 (6.9%) | 642 (5.2%) |
| 20 to 24 Years | 590 (4.9%) | 668 (5.4%) |
| 25 to 29 Years | 692 (5.7%) | 691 (5.6%) |
| 30 to 34 Years | 770 (6.4%) | 894 (7.2%) |
| 35 to 39 Years | 884 (7.3%) | 741 (6.0%) |
| 40 to 44 Years | 739 (6.1%) | 556 (4.5%) |
| 45 to 49 Years | 691 (5.7%) | 548 (4.4%) |
| 50 to 54 Years | 917 (7.6%) | 762 (6.1%) |
| 55 to 59 Years | 889 (7.4%) | 1,007 (8.1%) |
| 60 to 64 Years | 883 (7.3%) | 1,041 (8.4%) |
| 65 to 69 Years | 695 (5.8%) | 747 (6.0%) |
| 70 to 74 Years | 597 (4.9%) | 611 (4.9%) |
| 75 to 79 Years | 374 (3.1%) | 409 (3.3%) |
| 80 to 84 Years | 190 (1.6%) | 489 (3.9%) |
| 85 Years and over | 304 (2.5%) | 542 (4.4%) |
| Total | 12,084 (100.0%) | 12,440 (100.0%) |
Families and Households in Clinton
Median Family Size in Clinton
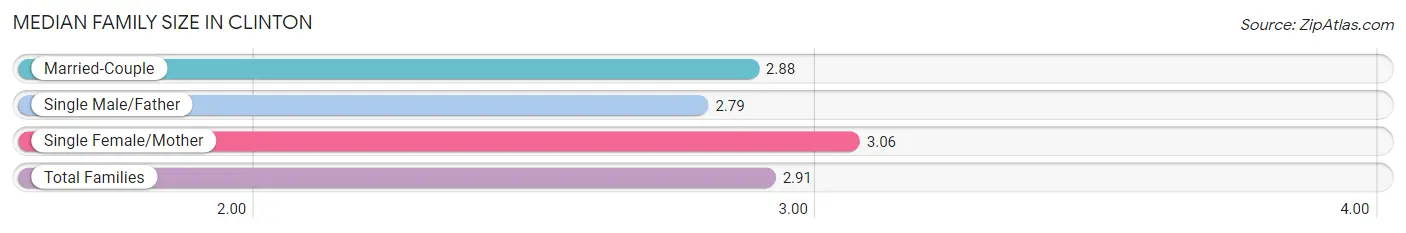
The median family size in Clinton is 2.91 persons per family, with single female/mother families (1,303 | 21.4%) accounting for the largest median family size of 3.06 persons per family. On the other hand, single male/father families (552 | 9.0%) represent the smallest median family size with 2.79 persons per family.
| Family Type | # Families | Family Size |
| Married-Couple | 4,244 (69.6%) | 2.88 |
| Single Male/Father | 552 (9.0%) | 2.79 |
| Single Female/Mother | 1,303 (21.4%) | 3.06 |
| Total Families | 6,099 (100.0%) | 2.91 |
Median Household Size in Clinton
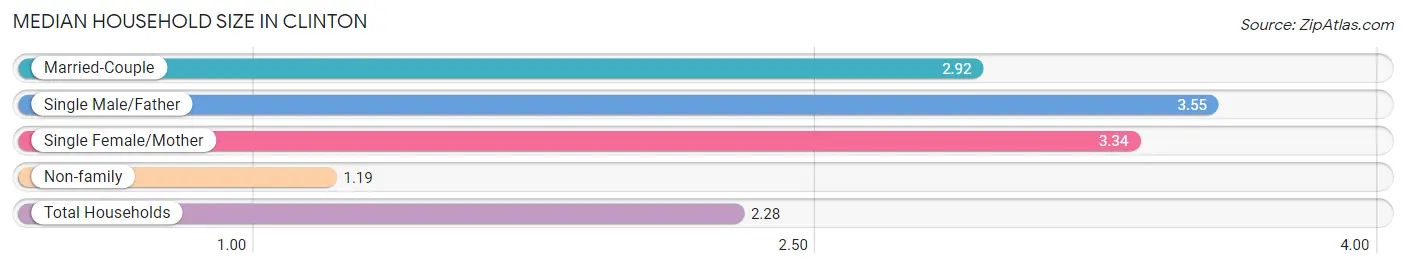
The median household size in Clinton is 2.28 persons per household, with single male/father households (552 | 5.3%) accounting for the largest median household size of 3.55 persons per household. non-family households (4,401 | 41.9%) represent the smallest median household size with 1.19 persons per household.
| Household Type | # Households | Household Size |
| Married-Couple | 4,244 (40.4%) | 2.92 |
| Single Male/Father | 552 (5.3%) | 3.55 |
| Single Female/Mother | 1,303 (12.4%) | 3.34 |
| Non-family | 4,401 (41.9%) | 1.19 |
| Total Households | 10,500 (100.0%) | 2.28 |
Household Size by Marriage Status in Clinton
Out of a total of 10,500 households in Clinton, 6,099 (58.1%) are family households, while 4,401 (41.9%) are nonfamily households. The most numerous type of family households are 2-person households, comprising 3,245, and the most common type of nonfamily households are 1-person households, comprising 3,756.
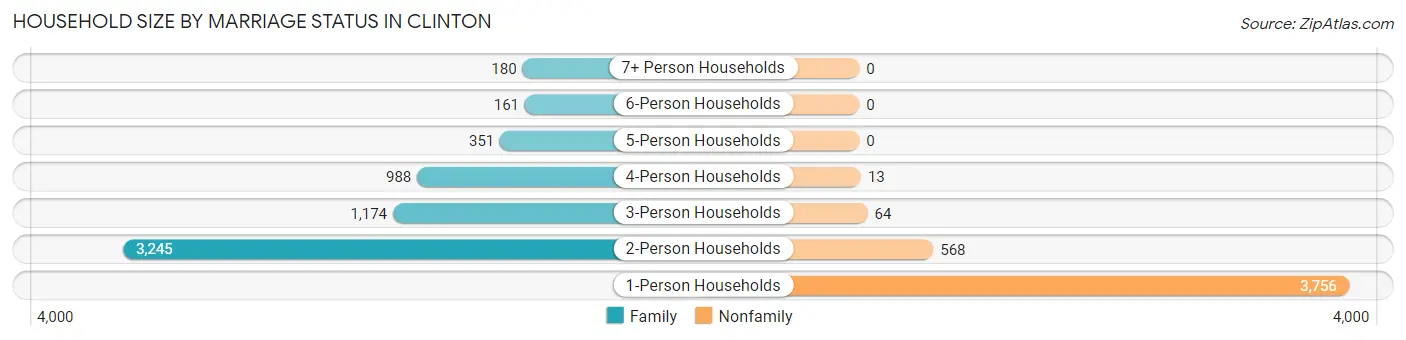
| Household Size | Family Households | Nonfamily Households |
| 1-Person Households | - | 3,756 (35.8%) |
| 2-Person Households | 3,245 (30.9%) | 568 (5.4%) |
| 3-Person Households | 1,174 (11.2%) | 64 (0.6%) |
| 4-Person Households | 988 (9.4%) | 13 (0.1%) |
| 5-Person Households | 351 (3.3%) | 0 (0.0%) |
| 6-Person Households | 161 (1.5%) | 0 (0.0%) |
| 7+ Person Households | 180 (1.7%) | 0 (0.0%) |
| Total | 6,099 (58.1%) | 4,401 (41.9%) |
Female Fertility in Clinton
Fertility by Age in Clinton
Average fertility rate in Clinton is 81.0 births per 1,000 women. Women in the age bracket of 20 to 34 years have the highest fertility rate with 170.0 births per 1,000 women. Women in the age bracket of 20 to 34 years acount for 96.5% of all women with births.
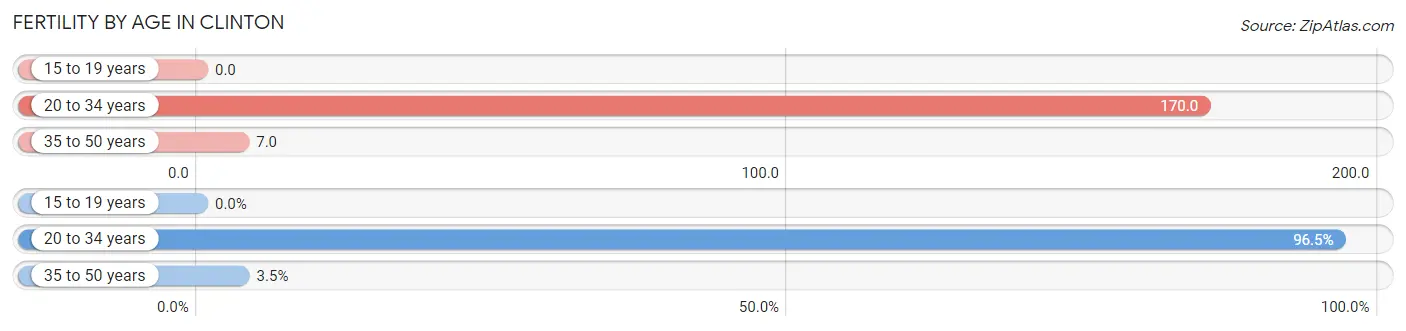
| Age Bracket | Women with Births | Births / 1,000 Women |
| 15 to 19 years | 0 (0.0%) | 0.0 |
| 20 to 34 years | 383 (96.5%) | 170.0 |
| 35 to 50 years | 14 (3.5%) | 7.0 |
| Total | 397 (100.0%) | 81.0 |
Fertility by Age by Marriage Status in Clinton
70.5% of women with births (397) in Clinton are married. The highest percentage of unmarried women with births falls into 20 to 34 years age bracket with 30.5% of them unmarried at the time of birth, while the lowest percentage of unmarried women with births belong to 35 to 50 years age bracket with 0.0% of them unmarried.
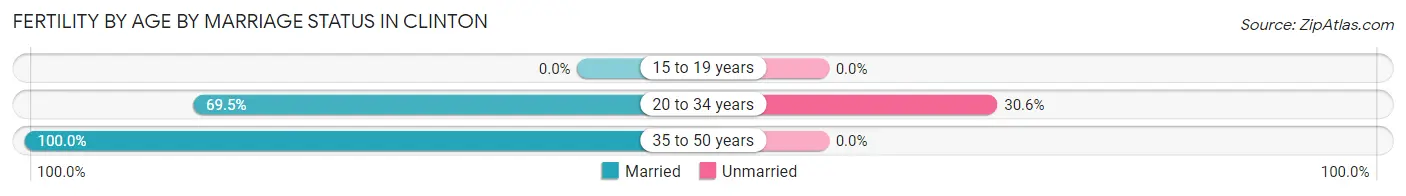
| Age Bracket | Married | Unmarried |
| 15 to 19 years | 0 (0.0%) | 0 (0.0%) |
| 20 to 34 years | 266 (69.5%) | 117 (30.5%) |
| 35 to 50 years | 14 (100.0%) | 0 (0.0%) |
| Total | 280 (70.5%) | 117 (29.5%) |
Fertility by Education in Clinton
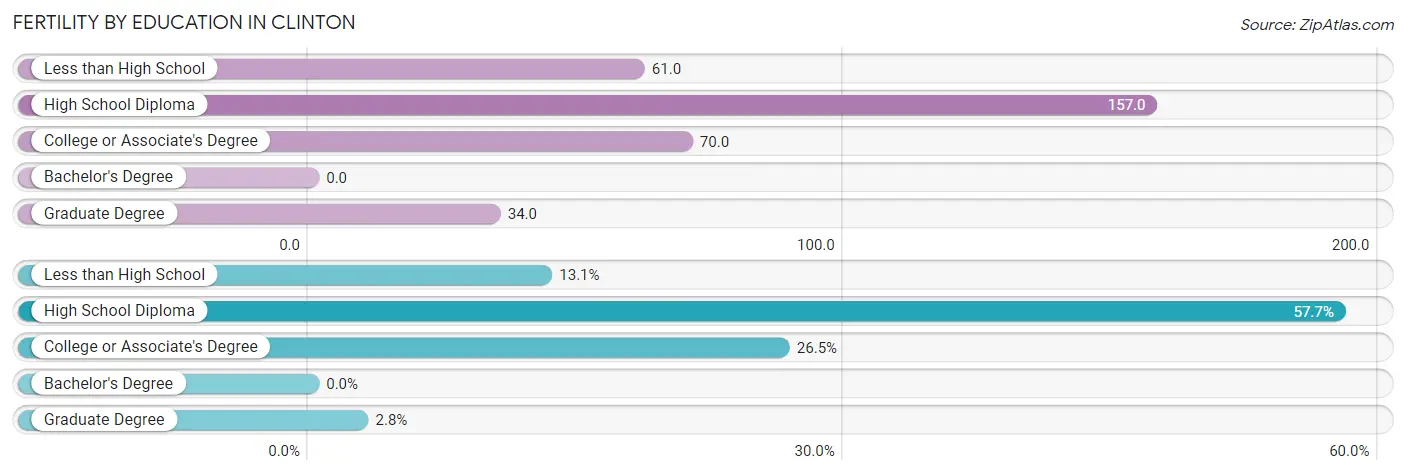
| Educational Attainment | Women with Births | Births / 1,000 Women |
| Less than High School | 52 (13.1%) | 61.0 |
| High School Diploma | 229 (57.7%) | 157.0 |
| College or Associate's Degree | 105 (26.5%) | 70.0 |
| Bachelor's Degree | 0 (0.0%) | 0.0 |
| Graduate Degree | 11 (2.8%) | 34.0 |
| Total | 397 (100.0%) | 81.0 |
Fertility by Education by Marriage Status in Clinton
29.5% of women with births in Clinton are unmarried. Women with the educational attainment of less than high school are most likely to be married with 100.0% of them married at childbirth, while women with the educational attainment of high school diploma are least likely to be married with 42.8% of them unmarried at childbirth.
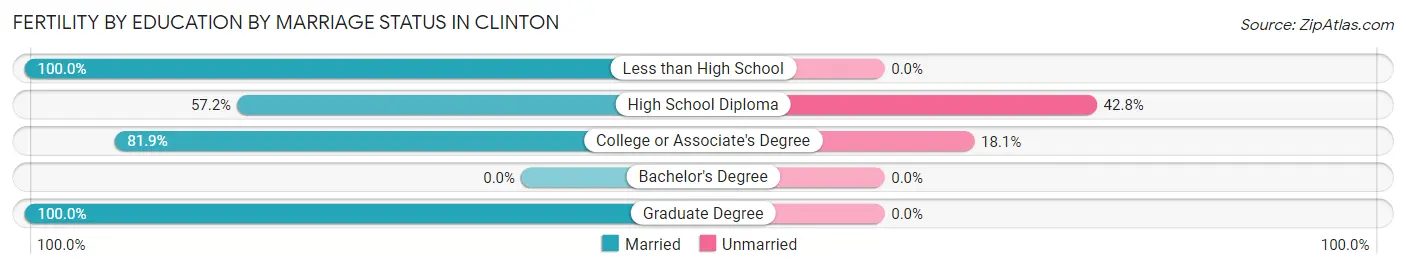
| Educational Attainment | Married | Unmarried |
| Less than High School | 52 (100.0%) | 0 (0.0%) |
| High School Diploma | 131 (57.2%) | 98 (42.8%) |
| College or Associate's Degree | 86 (81.9%) | 19 (18.1%) |
| Bachelor's Degree | 0 (0.0%) | 0 (0.0%) |
| Graduate Degree | 11 (100.0%) | 0 (0.0%) |
| Total | 280 (70.5%) | 117 (29.5%) |
Employment Characteristics in Clinton
Employment by Class of Employer in Clinton
Among the 10,625 employed individuals in Clinton, private company employees (7,662 | 72.1%), not-for-profit organizations (1,130 | 10.6%), and local government employees (762 | 7.2%) make up the most common classes of employment.
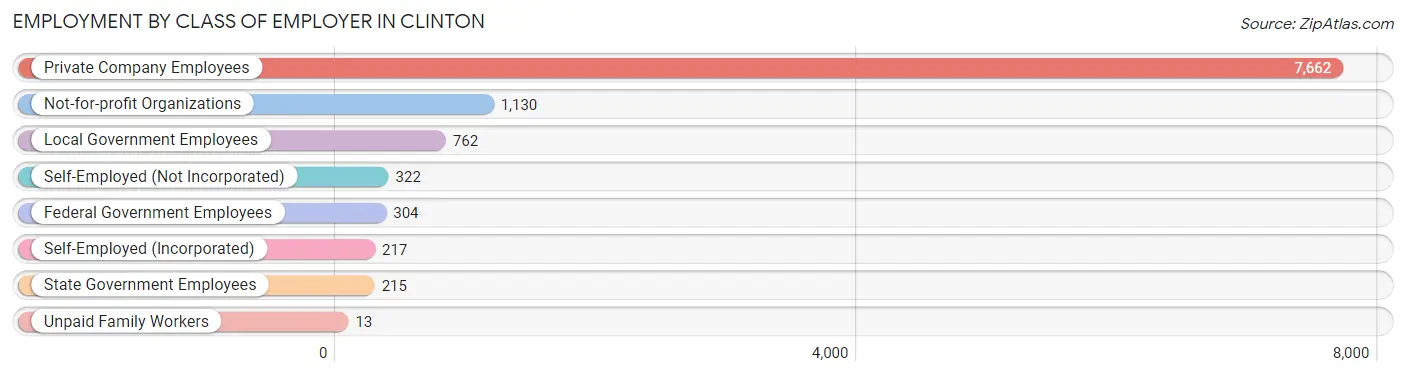
| Employer Class | # Employees | % Employees |
| Private Company Employees | 7,662 | 72.1% |
| Self-Employed (Incorporated) | 217 | 2.0% |
| Self-Employed (Not Incorporated) | 322 | 3.0% |
| Not-for-profit Organizations | 1,130 | 10.6% |
| Local Government Employees | 762 | 7.2% |
| State Government Employees | 215 | 2.0% |
| Federal Government Employees | 304 | 2.9% |
| Unpaid Family Workers | 13 | 0.1% |
| Total | 10,625 | 100.0% |
Employment Status by Age in Clinton
According to the labor force statistics for Clinton, out of the total population over 16 years of age (20,132), 57.3% or 11,536 individuals are in the labor force, with 5.2% or 600 of them unemployed. The age group with the highest labor force participation rate is 20 to 24 years, with 85.6% or 1,077 individuals in the labor force. Within the labor force, the 16 to 19 years age range has the highest percentage of unemployed individuals, with 19.1% or 94 of them being unemployed.
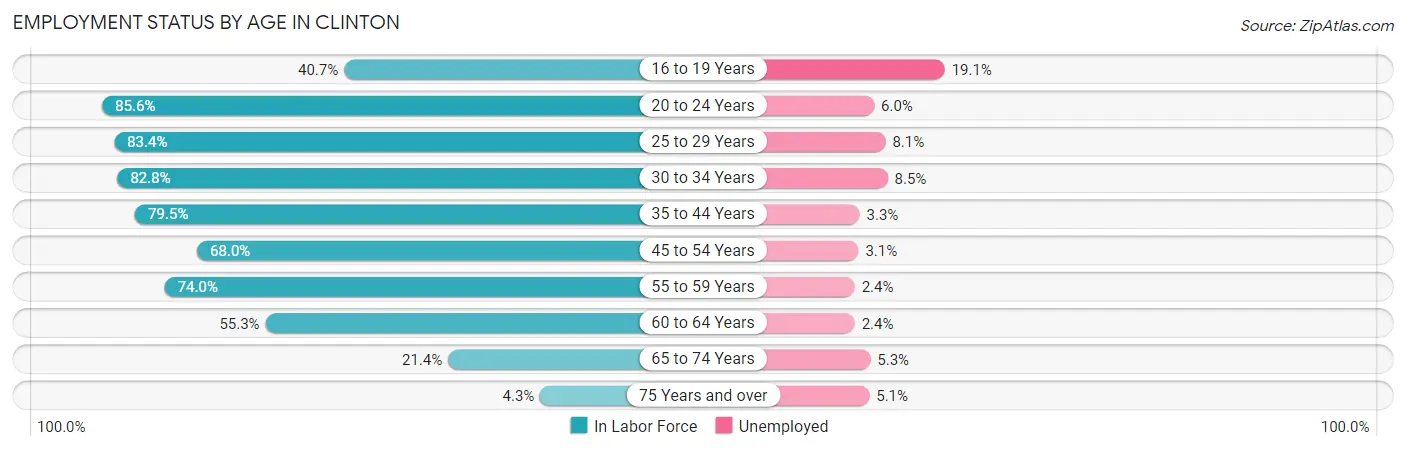
| Age Bracket | In Labor Force | Unemployed |
| 16 to 19 Years | 493 (40.7%) | 94 (19.1%) |
| 20 to 24 Years | 1,077 (85.6%) | 65 (6.0%) |
| 25 to 29 Years | 1,153 (83.4%) | 93 (8.1%) |
| 30 to 34 Years | 1,378 (82.8%) | 117 (8.5%) |
| 35 to 44 Years | 2,321 (79.5%) | 77 (3.3%) |
| 45 to 54 Years | 1,984 (68.0%) | 62 (3.1%) |
| 55 to 59 Years | 1,403 (74.0%) | 34 (2.4%) |
| 60 to 64 Years | 1,064 (55.3%) | 26 (2.4%) |
| 65 to 74 Years | 567 (21.4%) | 30 (5.3%) |
| 75 Years and over | 99 (4.3%) | 5 (5.1%) |
| Total | 11,536 (57.3%) | 600 (5.2%) |
Employment Status by Educational Attainment in Clinton
According to labor force statistics for Clinton, 73.2% of individuals (9,300) out of the total population between 25 and 64 years of age (12,705) are in the labor force, with 4.4% or 409 of them being unemployed. The group with the highest labor force participation rate are those with the educational attainment of college / associate degree, with 80.3% or 3,433 individuals in the labor force. Within the labor force, individuals with less than high school education have the highest percentage of unemployment, with 15.3% or 85 of them being unemployed.
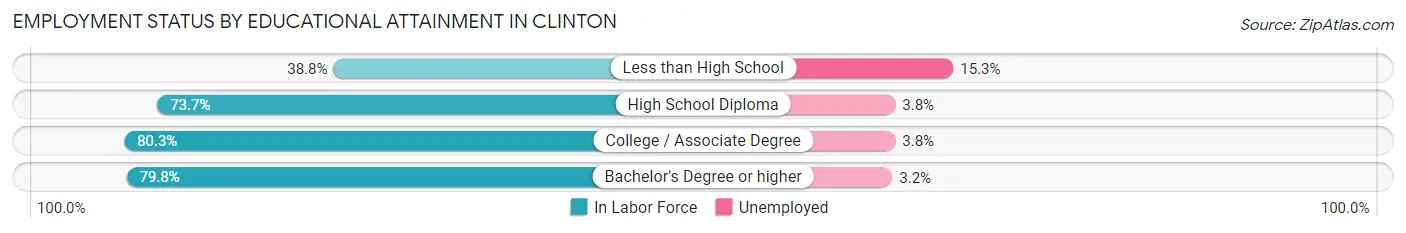
| Educational Attainment | In Labor Force | Unemployed |
| Less than High School | 556 (38.8%) | 219 (15.3%) |
| High School Diploma | 3,272 (73.7%) | 169 (3.8%) |
| College / Associate Degree | 3,433 (80.3%) | 162 (3.8%) |
| Bachelor's Degree or higher | 2,040 (79.8%) | 82 (3.2%) |
| Total | 9,300 (73.2%) | 559 (4.4%) |
Employment Occupations by Sex in Clinton
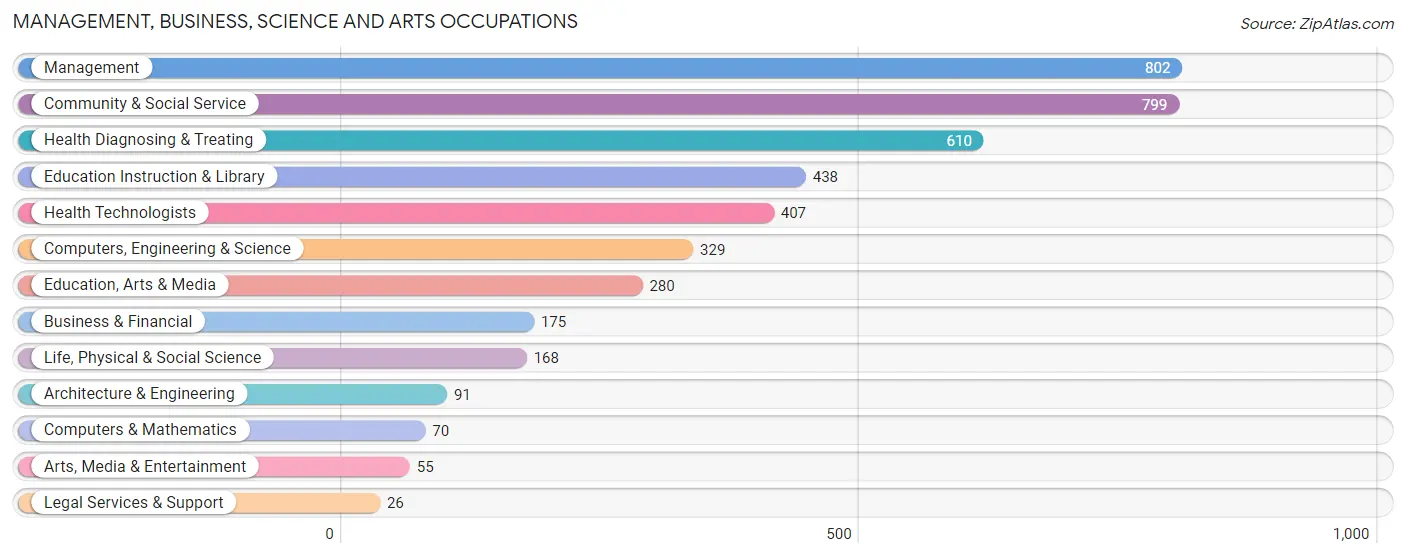
Management, Business, Science and Arts Occupations
The most common Management, Business, Science and Arts occupations in Clinton are Management (802 | 7.4%), Community & Social Service (799 | 7.4%), Health Diagnosing & Treating (610 | 5.6%), Education Instruction & Library (438 | 4.0%), and Health Technologists (407 | 3.7%).
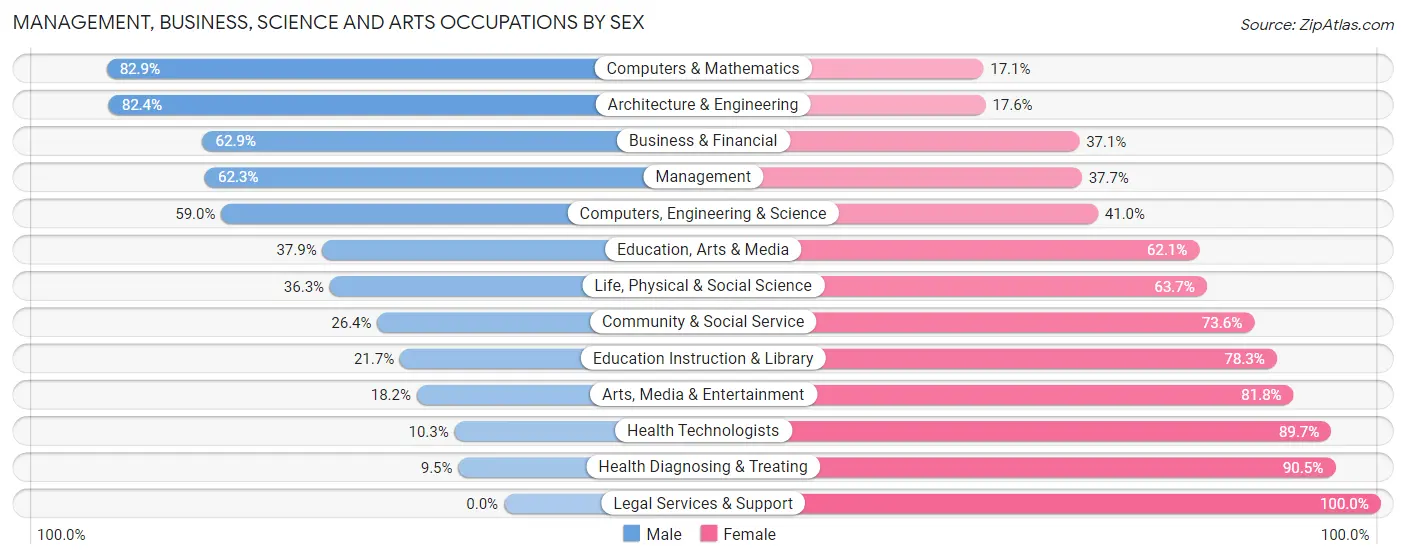
Management, Business, Science and Arts Occupations by Sex
Within the Management, Business, Science and Arts occupations in Clinton, the most male-oriented occupations are Computers & Mathematics (82.9%), Architecture & Engineering (82.4%), and Business & Financial (62.9%), while the most female-oriented occupations are Legal Services & Support (100.0%), Health Diagnosing & Treating (90.5%), and Health Technologists (89.7%).
| Occupation | Male | Female |
| Management | 500 (62.3%) | 302 (37.7%) |
| Business & Financial | 110 (62.9%) | 65 (37.1%) |
| Computers, Engineering & Science | 194 (59.0%) | 135 (41.0%) |
| Computers & Mathematics | 58 (82.9%) | 12 (17.1%) |
| Architecture & Engineering | 75 (82.4%) | 16 (17.6%) |
| Life, Physical & Social Science | 61 (36.3%) | 107 (63.7%) |
| Community & Social Service | 211 (26.4%) | 588 (73.6%) |
| Education, Arts & Media | 106 (37.9%) | 174 (62.1%) |
| Legal Services & Support | 0 (0.0%) | 26 (100.0%) |
| Education Instruction & Library | 95 (21.7%) | 343 (78.3%) |
| Arts, Media & Entertainment | 10 (18.2%) | 45 (81.8%) |
| Health Diagnosing & Treating | 58 (9.5%) | 552 (90.5%) |
| Health Technologists | 42 (10.3%) | 365 (89.7%) |
| Total (Category) | 1,073 (39.5%) | 1,642 (60.5%) |
| Total (Overall) | 5,476 (50.4%) | 5,379 (49.5%) |
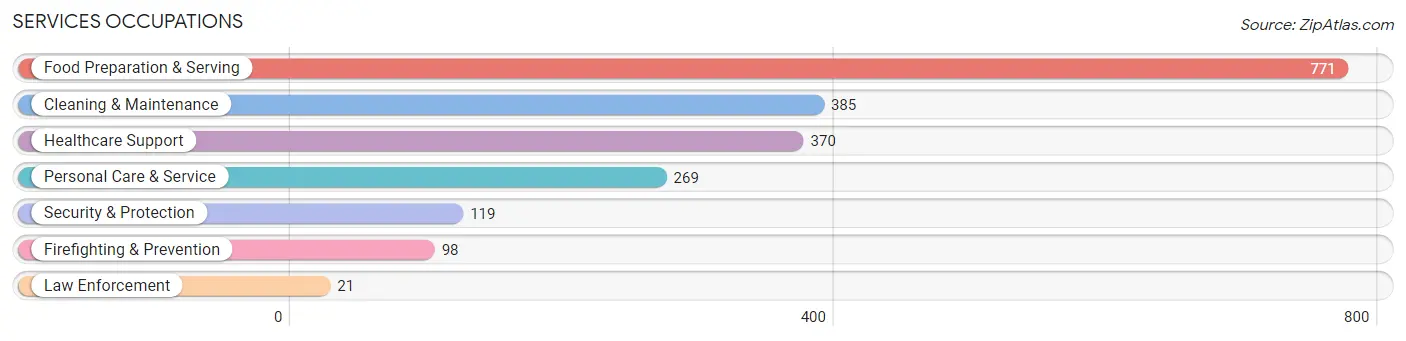
Services Occupations
The most common Services occupations in Clinton are Food Preparation & Serving (771 | 7.1%), Cleaning & Maintenance (385 | 3.5%), Healthcare Support (370 | 3.4%), Personal Care & Service (269 | 2.5%), and Security & Protection (119 | 1.1%).
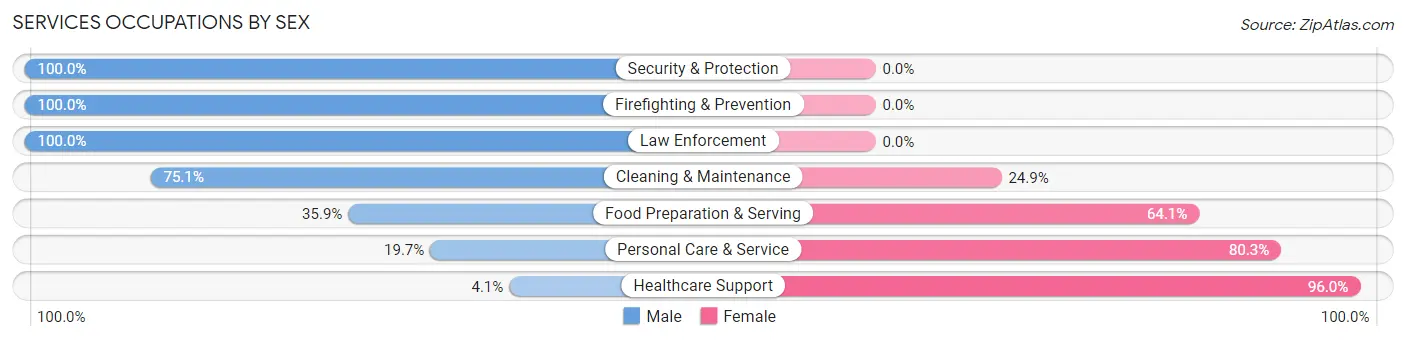
Services Occupations by Sex
Within the Services occupations in Clinton, the most male-oriented occupations are Security & Protection (100.0%), Firefighting & Prevention (100.0%), and Law Enforcement (100.0%), while the most female-oriented occupations are Healthcare Support (96.0%), Personal Care & Service (80.3%), and Food Preparation & Serving (64.1%).
| Occupation | Male | Female |
| Healthcare Support | 15 (4.1%) | 355 (96.0%) |
| Security & Protection | 119 (100.0%) | 0 (0.0%) |
| Firefighting & Prevention | 98 (100.0%) | 0 (0.0%) |
| Law Enforcement | 21 (100.0%) | 0 (0.0%) |
| Food Preparation & Serving | 277 (35.9%) | 494 (64.1%) |
| Cleaning & Maintenance | 289 (75.1%) | 96 (24.9%) |
| Personal Care & Service | 53 (19.7%) | 216 (80.3%) |
| Total (Category) | 753 (39.3%) | 1,161 (60.7%) |
| Total (Overall) | 5,476 (50.4%) | 5,379 (49.5%) |
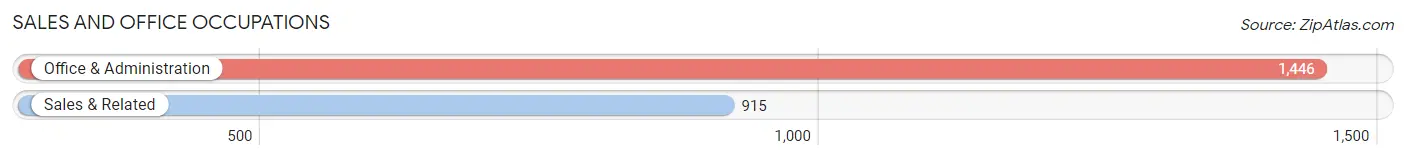
Sales and Office Occupations
The most common Sales and Office occupations in Clinton are Office & Administration (1,446 | 13.3%), and Sales & Related (915 | 8.4%).
Sales and Office Occupations by Sex
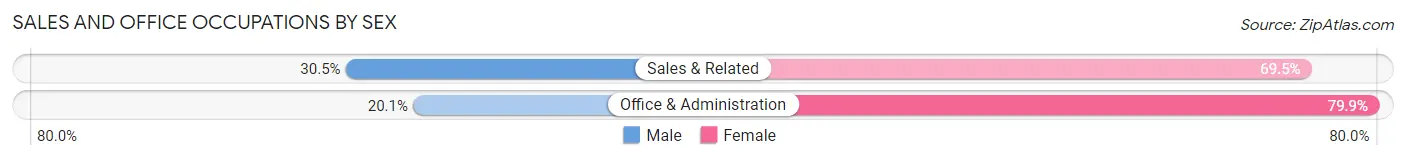
| Occupation | Male | Female |
| Sales & Related | 279 (30.5%) | 636 (69.5%) |
| Office & Administration | 291 (20.1%) | 1,155 (79.9%) |
| Total (Category) | 570 (24.1%) | 1,791 (75.9%) |
| Total (Overall) | 5,476 (50.4%) | 5,379 (49.5%) |
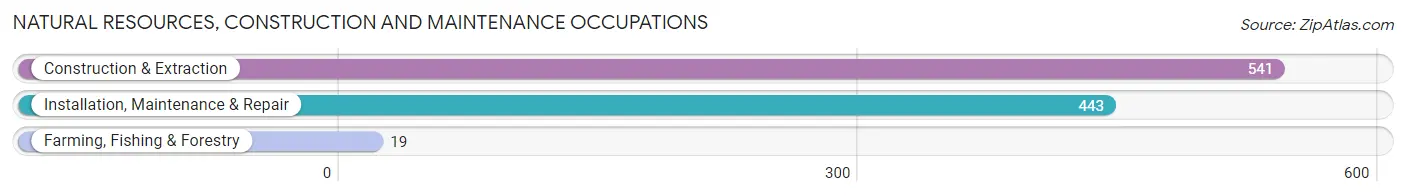
Natural Resources, Construction and Maintenance Occupations
The most common Natural Resources, Construction and Maintenance occupations in Clinton are Construction & Extraction (541 | 5.0%), Installation, Maintenance & Repair (443 | 4.1%), and Farming, Fishing & Forestry (19 | 0.2%).
Natural Resources, Construction and Maintenance Occupations by Sex
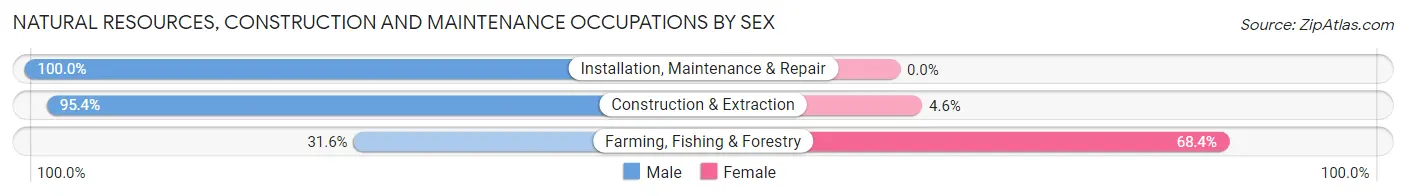
| Occupation | Male | Female |
| Farming, Fishing & Forestry | 6 (31.6%) | 13 (68.4%) |
| Construction & Extraction | 516 (95.4%) | 25 (4.6%) |
| Installation, Maintenance & Repair | 443 (100.0%) | 0 (0.0%) |
| Total (Category) | 965 (96.2%) | 38 (3.8%) |
| Total (Overall) | 5,476 (50.4%) | 5,379 (49.5%) |
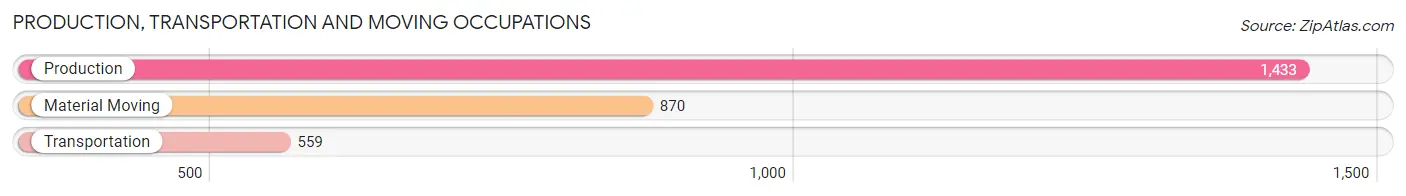
Production, Transportation and Moving Occupations
The most common Production, Transportation and Moving occupations in Clinton are Production (1,433 | 13.2%), Material Moving (870 | 8.0%), and Transportation (559 | 5.1%).
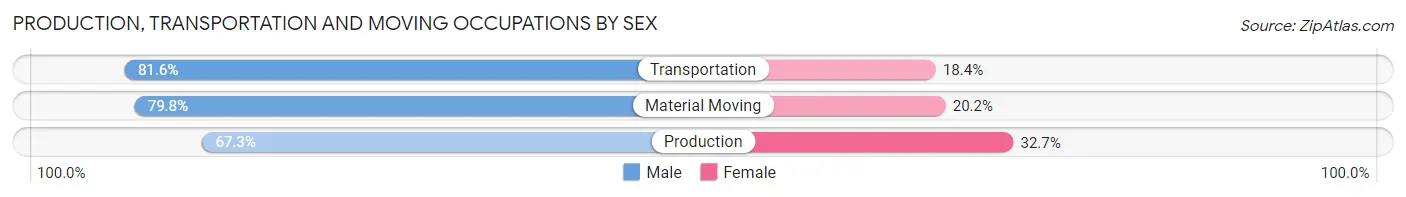
Production, Transportation and Moving Occupations by Sex
| Occupation | Male | Female |
| Production | 965 (67.3%) | 468 (32.7%) |
| Transportation | 456 (81.6%) | 103 (18.4%) |
| Material Moving | 694 (79.8%) | 176 (20.2%) |
| Total (Category) | 2,115 (73.9%) | 747 (26.1%) |
| Total (Overall) | 5,476 (50.4%) | 5,379 (49.5%) |
Employment Industries by Sex in Clinton
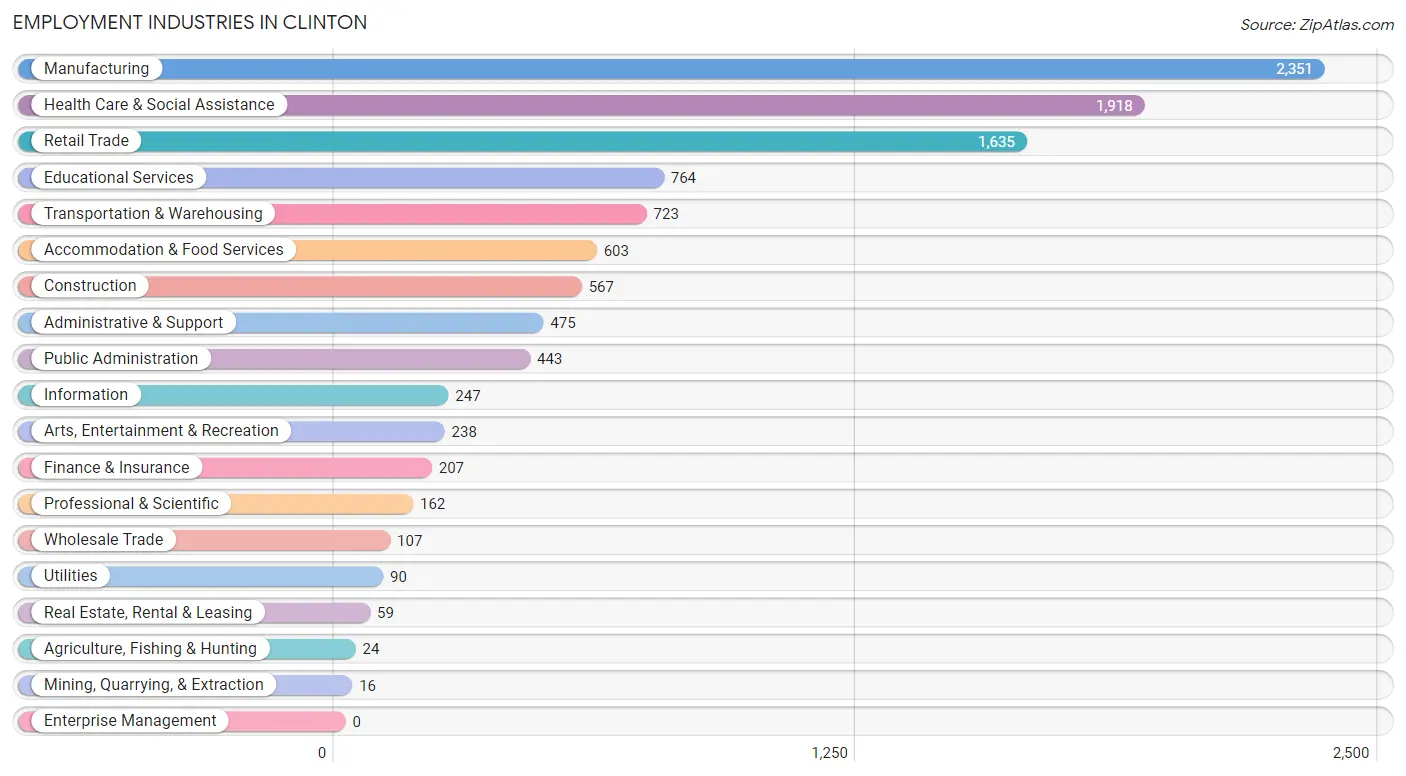
Employment Industries in Clinton
The major employment industries in Clinton include Manufacturing (2,351 | 21.7%), Health Care & Social Assistance (1,918 | 17.7%), Retail Trade (1,635 | 15.1%), Educational Services (764 | 7.0%), and Transportation & Warehousing (723 | 6.7%).
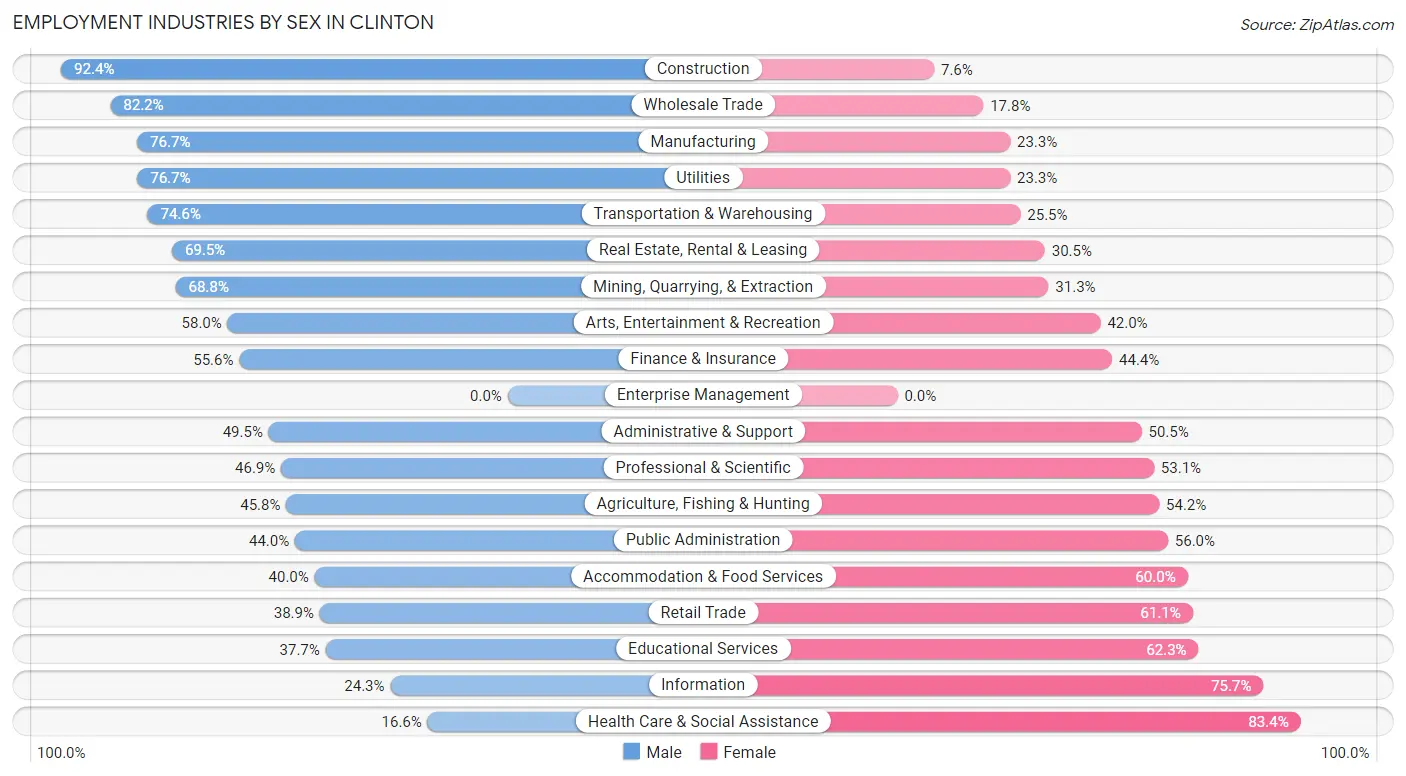
Employment Industries by Sex in Clinton
The Clinton industries that see more men than women are Construction (92.4%), Wholesale Trade (82.2%), and Manufacturing (76.7%), whereas the industries that tend to have a higher number of women are Health Care & Social Assistance (83.4%), Information (75.7%), and Educational Services (62.3%).
| Industry | Male | Female |
| Agriculture, Fishing & Hunting | 11 (45.8%) | 13 (54.2%) |
| Mining, Quarrying, & Extraction | 11 (68.8%) | 5 (31.2%) |
| Construction | 524 (92.4%) | 43 (7.6%) |
| Manufacturing | 1,803 (76.7%) | 548 (23.3%) |
| Wholesale Trade | 88 (82.2%) | 19 (17.8%) |
| Retail Trade | 636 (38.9%) | 999 (61.1%) |
| Transportation & Warehousing | 539 (74.6%) | 184 (25.5%) |
| Utilities | 69 (76.7%) | 21 (23.3%) |
| Information | 60 (24.3%) | 187 (75.7%) |
| Finance & Insurance | 115 (55.6%) | 92 (44.4%) |
| Real Estate, Rental & Leasing | 41 (69.5%) | 18 (30.5%) |
| Professional & Scientific | 76 (46.9%) | 86 (53.1%) |
| Enterprise Management | 0 (0.0%) | 0 (0.0%) |
| Administrative & Support | 235 (49.5%) | 240 (50.5%) |
| Educational Services | 288 (37.7%) | 476 (62.3%) |
| Health Care & Social Assistance | 318 (16.6%) | 1,600 (83.4%) |
| Arts, Entertainment & Recreation | 138 (58.0%) | 100 (42.0%) |
| Accommodation & Food Services | 241 (40.0%) | 362 (60.0%) |
| Public Administration | 195 (44.0%) | 248 (56.0%) |
| Total | 5,476 (50.4%) | 5,379 (49.5%) |
Education in Clinton
School Enrollment in Clinton
The most common levels of schooling among the 4,573 students in Clinton are middle school (1,131 | 24.7%), high school (1,122 | 24.5%), and elementary school (987 | 21.6%).
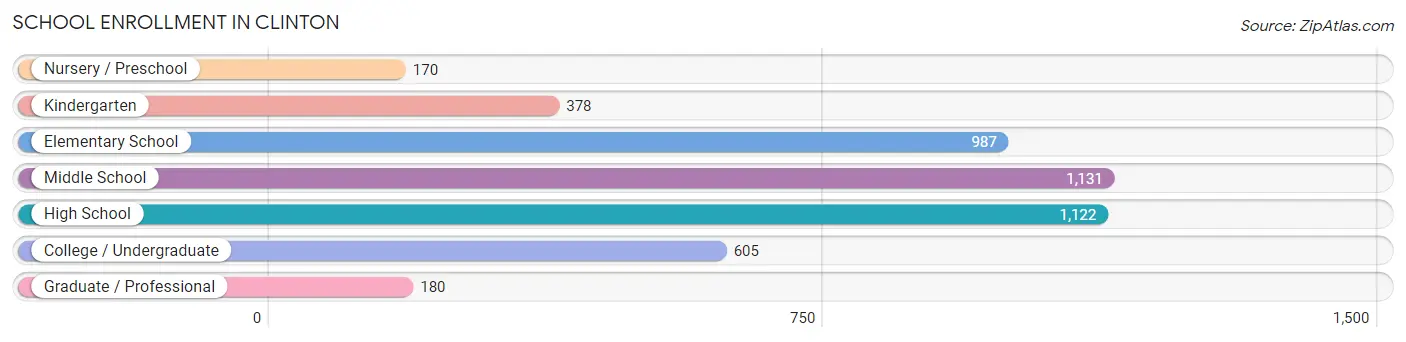
| School Level | # Students | % Students |
| Nursery / Preschool | 170 | 3.7% |
| Kindergarten | 378 | 8.3% |
| Elementary School | 987 | 21.6% |
| Middle School | 1,131 | 24.7% |
| High School | 1,122 | 24.5% |
| College / Undergraduate | 605 | 13.2% |
| Graduate / Professional | 180 | 3.9% |
| Total | 4,573 | 100.0% |
School Enrollment by Age by Funding Source in Clinton
Out of a total of 4,573 students who are enrolled in schools in Clinton, 453 (9.9%) attend a private institution, while the remaining 4,120 (90.1%) are enrolled in public schools. The age group of 20 to 24 year olds has the highest likelihood of being enrolled in private schools, with 53 (33.1% in the age bracket) enrolled. Conversely, the age group of 5 to 9 year old has the lowest likelihood of being enrolled in a private school, with 1,105 (96.7% in the age bracket) attending a public institution.
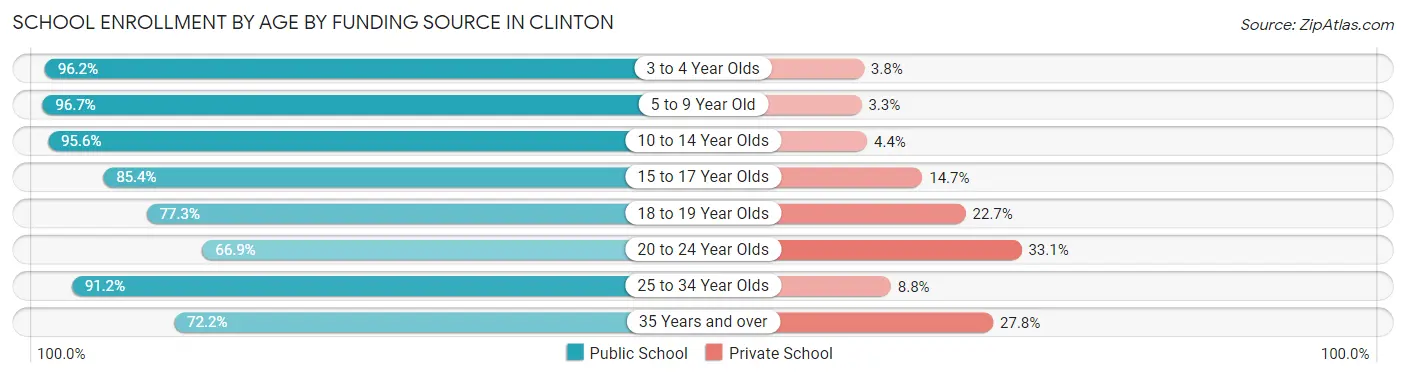
| Age Bracket | Public School | Private School |
| 3 to 4 Year Olds | 102 (96.2%) | 4 (3.8%) |
| 5 to 9 Year Old | 1,105 (96.7%) | 38 (3.3%) |
| 10 to 14 Year Olds | 1,427 (95.6%) | 65 (4.4%) |
| 15 to 17 Year Olds | 734 (85.4%) | 126 (14.6%) |
| 18 to 19 Year Olds | 337 (77.3%) | 99 (22.7%) |
| 20 to 24 Year Olds | 107 (66.9%) | 53 (33.1%) |
| 25 to 34 Year Olds | 166 (91.2%) | 16 (8.8%) |
| 35 Years and over | 140 (72.2%) | 54 (27.8%) |
| Total | 4,120 (90.1%) | 453 (9.9%) |
Educational Attainment by Field of Study in Clinton
Education (770 | 19.5%), business (715 | 18.1%), bio, nature & agricultural (455 | 11.5%), psychology (346 | 8.8%), and arts & humanities (284 | 7.2%) are the most common fields of study among 3,952 individuals in Clinton who have obtained a bachelor's degree or higher.
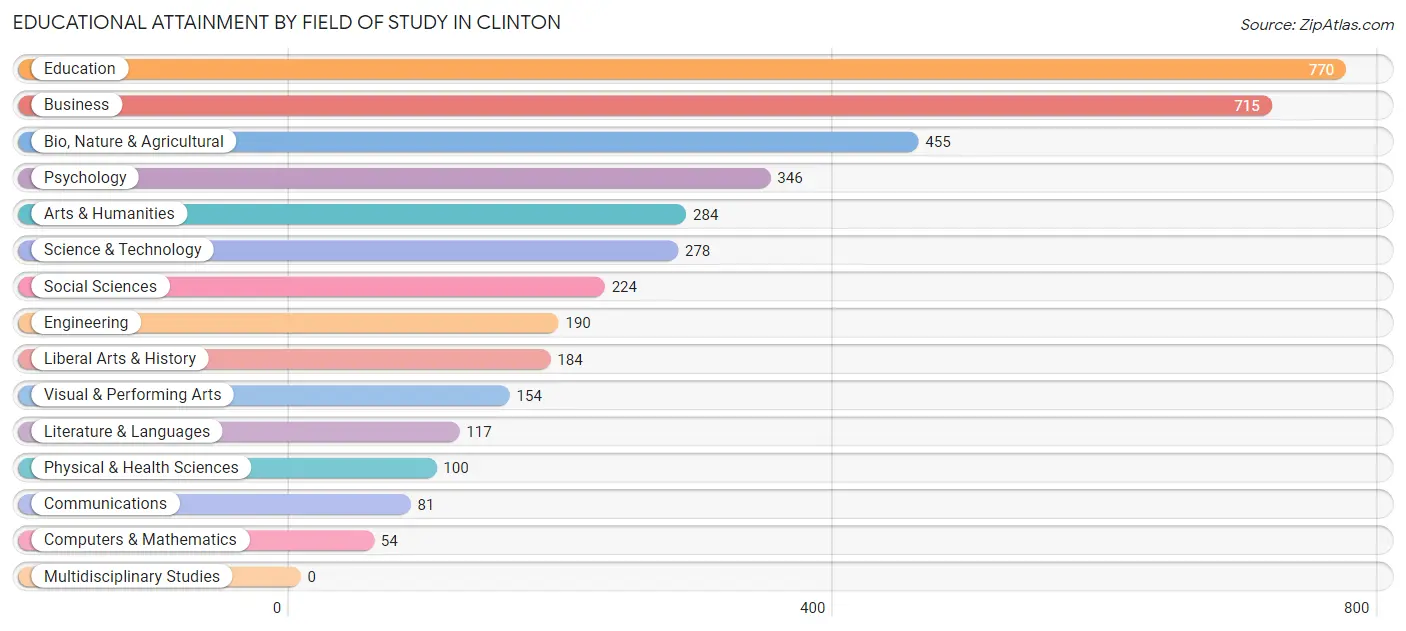
| Field of Study | # Graduates | % Graduates |
| Computers & Mathematics | 54 | 1.4% |
| Bio, Nature & Agricultural | 455 | 11.5% |
| Physical & Health Sciences | 100 | 2.5% |
| Psychology | 346 | 8.8% |
| Social Sciences | 224 | 5.7% |
| Engineering | 190 | 4.8% |
| Multidisciplinary Studies | 0 | 0.0% |
| Science & Technology | 278 | 7.0% |
| Business | 715 | 18.1% |
| Education | 770 | 19.5% |
| Literature & Languages | 117 | 3.0% |
| Liberal Arts & History | 184 | 4.7% |
| Visual & Performing Arts | 154 | 3.9% |
| Communications | 81 | 2.1% |
| Arts & Humanities | 284 | 7.2% |
| Total | 3,952 | 100.0% |
Transportation & Commute in Clinton
Vehicle Availability by Sex in Clinton
The most prevalent vehicle ownership categories in Clinton are males with 2 vehicles (2,198, accounting for 40.3%) and females with 2 vehicles (1,951, making up 42.8%).
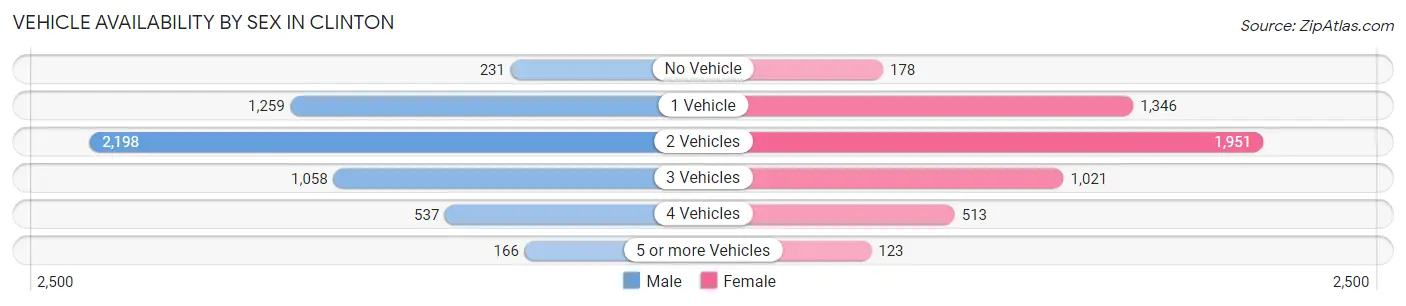
| Vehicles Available | Male | Female |
| No Vehicle | 231 (4.2%) | 178 (3.5%) |
| 1 Vehicle | 1,259 (23.1%) | 1,346 (26.2%) |
| 2 Vehicles | 2,198 (40.3%) | 1,951 (38.0%) |
| 3 Vehicles | 1,058 (19.4%) | 1,021 (19.9%) |
| 4 Vehicles | 537 (9.9%) | 513 (10.0%) |
| 5 or more Vehicles | 166 (3.0%) | 123 (2.4%) |
| Total | 5,449 (100.0%) | 5,132 (100.0%) |
Commute Time in Clinton
The most frequently occuring commute durations in Clinton are 5 to 9 minutes (2,832 commuters, 27.7%), 10 to 14 minutes (2,444 commuters, 23.9%), and 15 to 19 minutes (1,420 commuters, 13.9%).
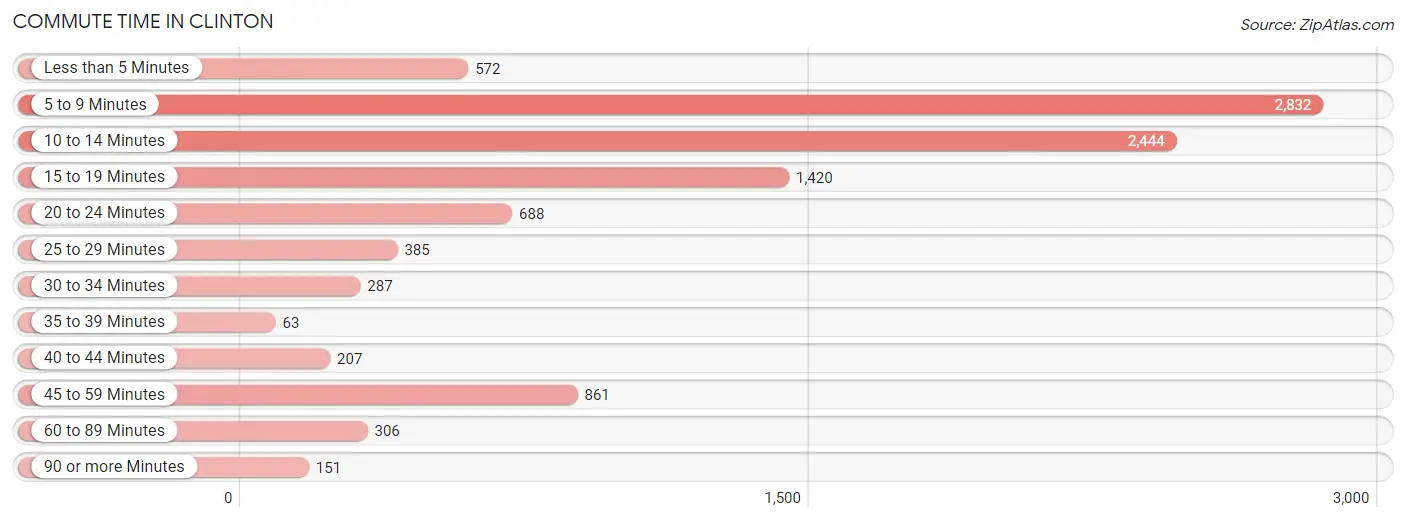
| Commute Time | # Commuters | % Commuters |
| Less than 5 Minutes | 572 | 5.6% |
| 5 to 9 Minutes | 2,832 | 27.7% |
| 10 to 14 Minutes | 2,444 | 23.9% |
| 15 to 19 Minutes | 1,420 | 13.9% |
| 20 to 24 Minutes | 688 | 6.7% |
| 25 to 29 Minutes | 385 | 3.8% |
| 30 to 34 Minutes | 287 | 2.8% |
| 35 to 39 Minutes | 63 | 0.6% |
| 40 to 44 Minutes | 207 | 2.0% |
| 45 to 59 Minutes | 861 | 8.4% |
| 60 to 89 Minutes | 306 | 3.0% |
| 90 or more Minutes | 151 | 1.5% |
Commute Time by Sex in Clinton
The most common commute times in Clinton are 5 to 9 minutes (1,413 commuters, 26.8%) for males and 5 to 9 minutes (1,419 commuters, 28.7%) for females.
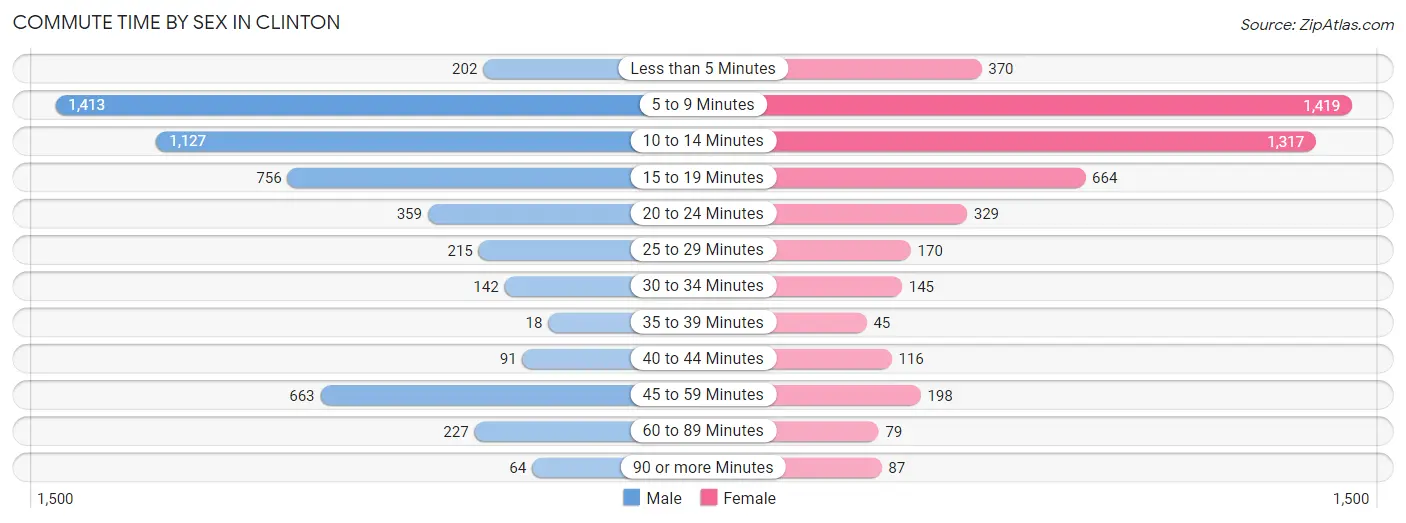
| Commute Time | Male | Female |
| Less than 5 Minutes | 202 (3.8%) | 370 (7.5%) |
| 5 to 9 Minutes | 1,413 (26.8%) | 1,419 (28.7%) |
| 10 to 14 Minutes | 1,127 (21.4%) | 1,317 (26.7%) |
| 15 to 19 Minutes | 756 (14.3%) | 664 (13.4%) |
| 20 to 24 Minutes | 359 (6.8%) | 329 (6.7%) |
| 25 to 29 Minutes | 215 (4.1%) | 170 (3.4%) |
| 30 to 34 Minutes | 142 (2.7%) | 145 (2.9%) |
| 35 to 39 Minutes | 18 (0.3%) | 45 (0.9%) |
| 40 to 44 Minutes | 91 (1.7%) | 116 (2.4%) |
| 45 to 59 Minutes | 663 (12.6%) | 198 (4.0%) |
| 60 to 89 Minutes | 227 (4.3%) | 79 (1.6%) |
| 90 or more Minutes | 64 (1.2%) | 87 (1.8%) |
Time of Departure to Work by Sex in Clinton
The most frequent times of departure to work in Clinton are 12:00 PM to 3:59 PM (837, 15.9%) for males and 7:30 AM to 7:59 AM (680, 13.8%) for females.
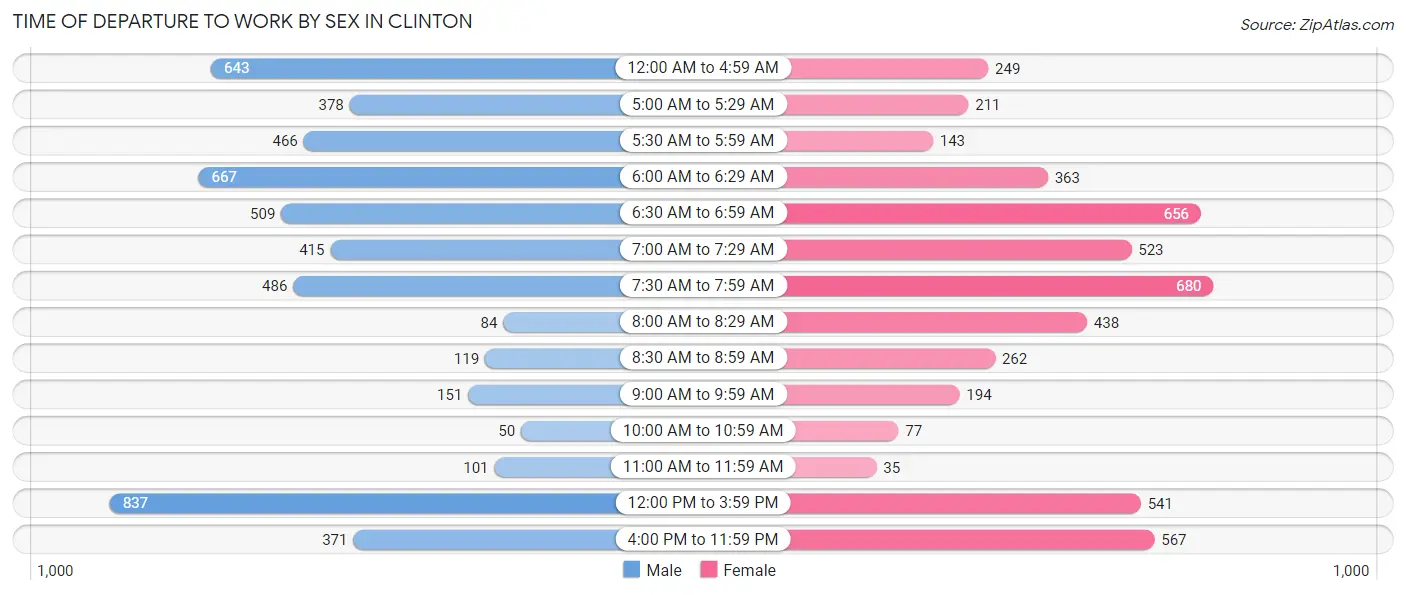
| Time of Departure | Male | Female |
| 12:00 AM to 4:59 AM | 643 (12.2%) | 249 (5.0%) |
| 5:00 AM to 5:29 AM | 378 (7.2%) | 211 (4.3%) |
| 5:30 AM to 5:59 AM | 466 (8.8%) | 143 (2.9%) |
| 6:00 AM to 6:29 AM | 667 (12.6%) | 363 (7.3%) |
| 6:30 AM to 6:59 AM | 509 (9.7%) | 656 (13.3%) |
| 7:00 AM to 7:29 AM | 415 (7.9%) | 523 (10.6%) |
| 7:30 AM to 7:59 AM | 486 (9.2%) | 680 (13.8%) |
| 8:00 AM to 8:29 AM | 84 (1.6%) | 438 (8.9%) |
| 8:30 AM to 8:59 AM | 119 (2.3%) | 262 (5.3%) |
| 9:00 AM to 9:59 AM | 151 (2.9%) | 194 (3.9%) |
| 10:00 AM to 10:59 AM | 50 (0.9%) | 77 (1.6%) |
| 11:00 AM to 11:59 AM | 101 (1.9%) | 35 (0.7%) |
| 12:00 PM to 3:59 PM | 837 (15.9%) | 541 (11.0%) |
| 4:00 PM to 11:59 PM | 371 (7.0%) | 567 (11.5%) |
| Total | 5,277 (100.0%) | 4,939 (100.0%) |
Housing Occupancy in Clinton
Occupancy by Ownership in Clinton
Of the total 10,500 dwellings in Clinton, owner-occupied units account for 7,134 (67.9%), while renter-occupied units make up 3,366 (32.1%).
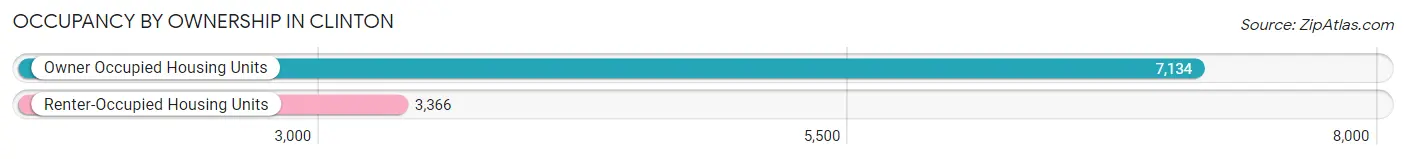
| Occupancy | # Housing Units | % Housing Units |
| Owner Occupied Housing Units | 7,134 | 67.9% |
| Renter-Occupied Housing Units | 3,366 | 32.1% |
| Total Occupied Housing Units | 10,500 | 100.0% |
Occupancy by Household Size in Clinton
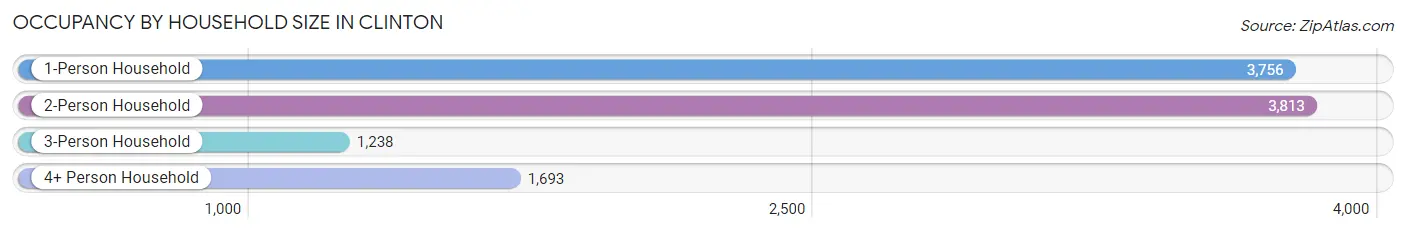
| Household Size | # Housing Units | % Housing Units |
| 1-Person Household | 3,756 | 35.8% |
| 2-Person Household | 3,813 | 36.3% |
| 3-Person Household | 1,238 | 11.8% |
| 4+ Person Household | 1,693 | 16.1% |
| Total Housing Units | 10,500 | 100.0% |
Occupancy by Ownership by Household Size in Clinton
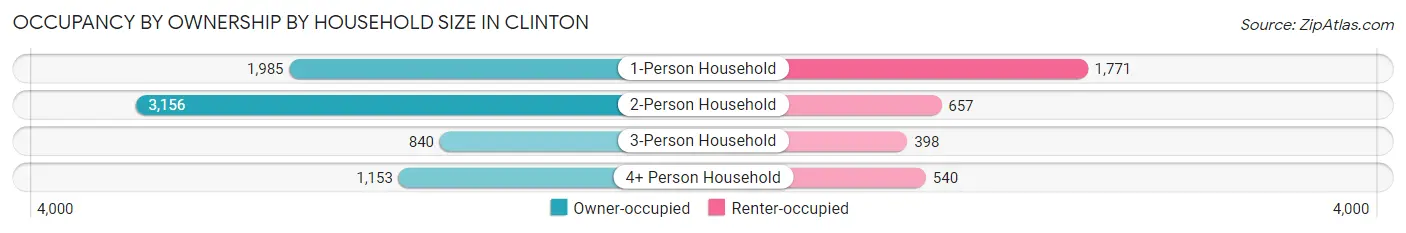
| Household Size | Owner-occupied | Renter-occupied |
| 1-Person Household | 1,985 (52.8%) | 1,771 (47.1%) |
| 2-Person Household | 3,156 (82.8%) | 657 (17.2%) |
| 3-Person Household | 840 (67.8%) | 398 (32.2%) |
| 4+ Person Household | 1,153 (68.1%) | 540 (31.9%) |
| Total Housing Units | 7,134 (67.9%) | 3,366 (32.1%) |
Occupancy by Educational Attainment in Clinton
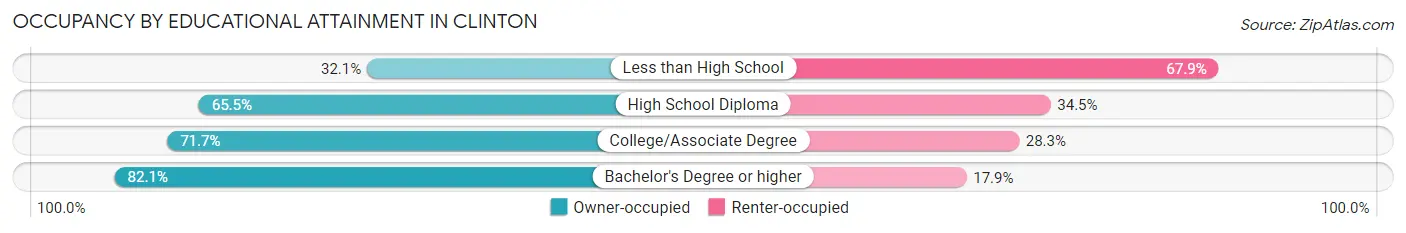
| Household Size | Owner-occupied | Renter-occupied |
| Less than High School | 298 (32.1%) | 630 (67.9%) |
| High School Diploma | 2,500 (65.5%) | 1,319 (34.5%) |
| College/Associate Degree | 2,680 (71.7%) | 1,057 (28.3%) |
| Bachelor's Degree or higher | 1,656 (82.1%) | 360 (17.9%) |
Occupancy by Age of Householder in Clinton
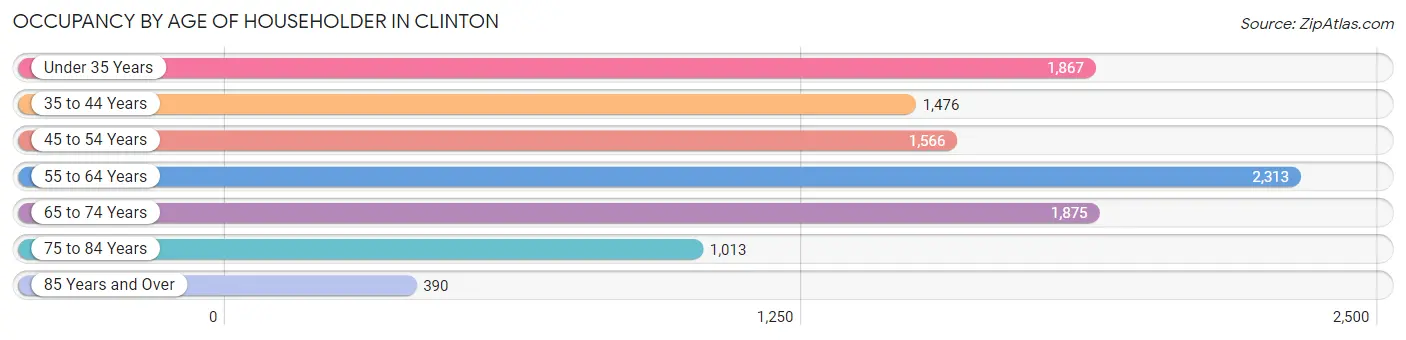
| Age Bracket | # Households | % Households |
| Under 35 Years | 1,867 | 17.8% |
| 35 to 44 Years | 1,476 | 14.1% |
| 45 to 54 Years | 1,566 | 14.9% |
| 55 to 64 Years | 2,313 | 22.0% |
| 65 to 74 Years | 1,875 | 17.9% |
| 75 to 84 Years | 1,013 | 9.7% |
| 85 Years and Over | 390 | 3.7% |
| Total | 10,500 | 100.0% |
Housing Finances in Clinton
Median Income by Occupancy in Clinton
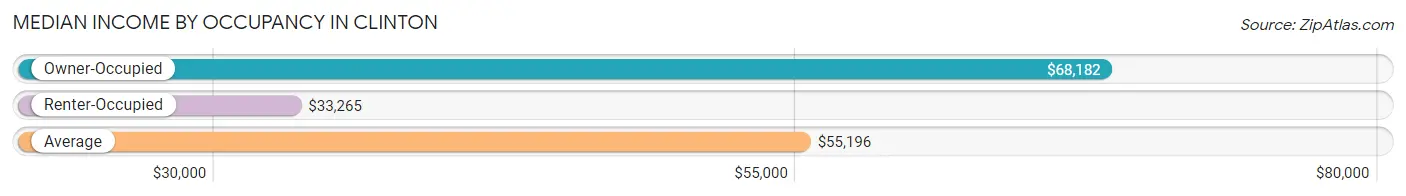
| Occupancy Type | # Households | Median Income |
| Owner-Occupied | 7,134 (67.9%) | $68,182 |
| Renter-Occupied | 3,366 (32.1%) | $33,265 |
| Average | 10,500 (100.0%) | $55,196 |
Occupancy by Householder Income Bracket in Clinton
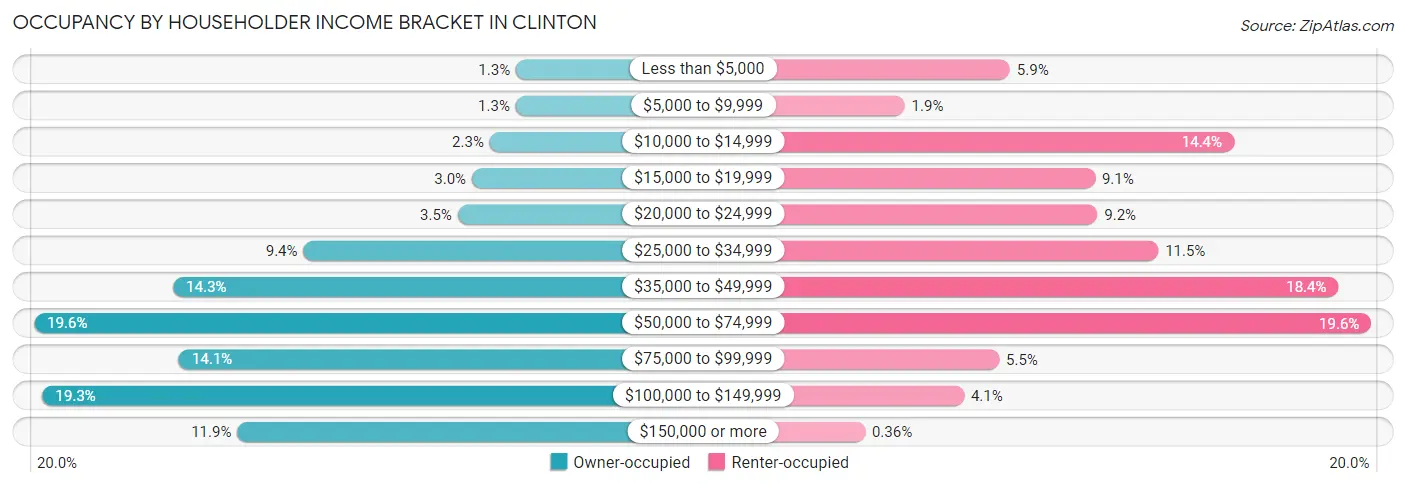
| Income Bracket | Owner-occupied | Renter-occupied |
| Less than $5,000 | 91 (1.3%) | 198 (5.9%) |
| $5,000 to $9,999 | 92 (1.3%) | 63 (1.9%) |
| $10,000 to $14,999 | 163 (2.3%) | 485 (14.4%) |
| $15,000 to $19,999 | 211 (3.0%) | 307 (9.1%) |
| $20,000 to $24,999 | 250 (3.5%) | 310 (9.2%) |
| $25,000 to $34,999 | 669 (9.4%) | 388 (11.5%) |
| $35,000 to $49,999 | 1,023 (14.3%) | 619 (18.4%) |
| $50,000 to $74,999 | 1,401 (19.6%) | 661 (19.6%) |
| $75,000 to $99,999 | 1,007 (14.1%) | 184 (5.5%) |
| $100,000 to $149,999 | 1,378 (19.3%) | 139 (4.1%) |
| $150,000 or more | 849 (11.9%) | 12 (0.4%) |
| Total | 7,134 (100.0%) | 3,366 (100.0%) |
Monthly Housing Cost Tiers in Clinton
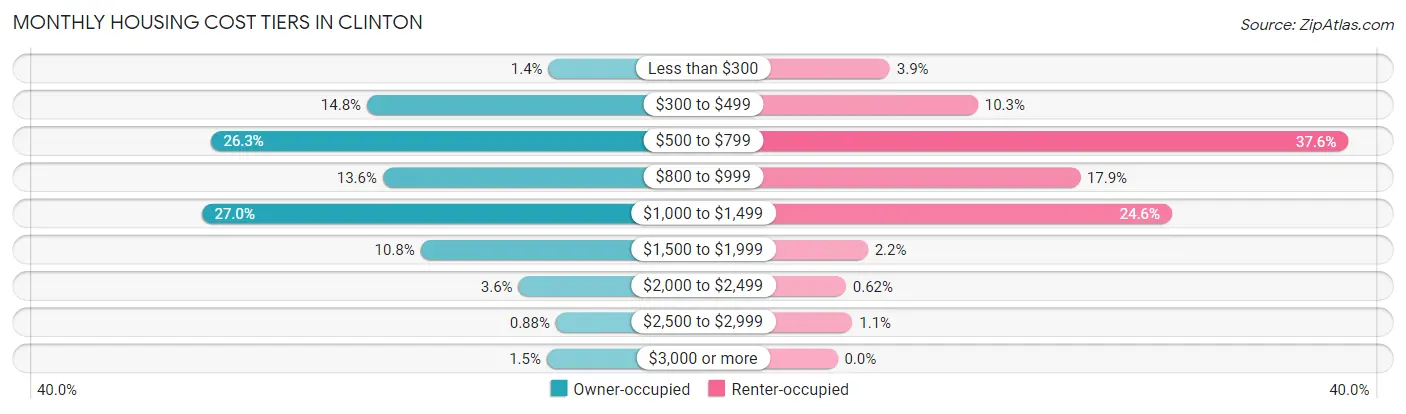
| Monthly Cost | Owner-occupied | Renter-occupied |
| Less than $300 | 101 (1.4%) | 130 (3.9%) |
| $300 to $499 | 1,055 (14.8%) | 348 (10.3%) |
| $500 to $799 | 1,877 (26.3%) | 1,266 (37.6%) |
| $800 to $999 | 972 (13.6%) | 601 (17.9%) |
| $1,000 to $1,499 | 1,924 (27.0%) | 829 (24.6%) |
| $1,500 to $1,999 | 773 (10.8%) | 75 (2.2%) |
| $2,000 to $2,499 | 259 (3.6%) | 21 (0.6%) |
| $2,500 to $2,999 | 63 (0.9%) | 37 (1.1%) |
| $3,000 or more | 110 (1.5%) | 0 (0.0%) |
| Total | 7,134 (100.0%) | 3,366 (100.0%) |
Physical Housing Characteristics in Clinton
Housing Structures in Clinton
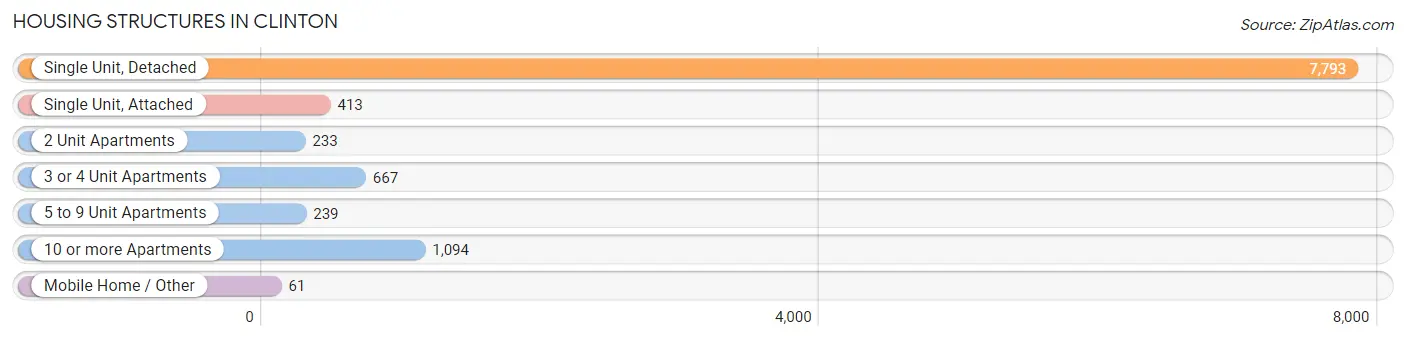
| Structure Type | # Housing Units | % Housing Units |
| Single Unit, Detached | 7,793 | 74.2% |
| Single Unit, Attached | 413 | 3.9% |
| 2 Unit Apartments | 233 | 2.2% |
| 3 or 4 Unit Apartments | 667 | 6.4% |
| 5 to 9 Unit Apartments | 239 | 2.3% |
| 10 or more Apartments | 1,094 | 10.4% |
| Mobile Home / Other | 61 | 0.6% |
| Total | 10,500 | 100.0% |
Housing Structures by Occupancy in Clinton
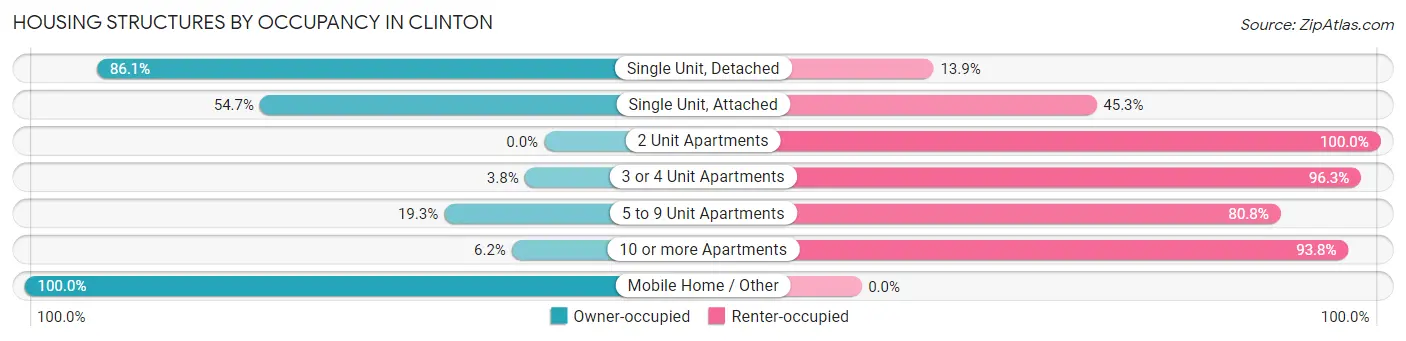
| Structure Type | Owner-occupied | Renter-occupied |
| Single Unit, Detached | 6,708 (86.1%) | 1,085 (13.9%) |
| Single Unit, Attached | 226 (54.7%) | 187 (45.3%) |
| 2 Unit Apartments | 0 (0.0%) | 233 (100.0%) |
| 3 or 4 Unit Apartments | 25 (3.7%) | 642 (96.3%) |
| 5 to 9 Unit Apartments | 46 (19.3%) | 193 (80.7%) |
| 10 or more Apartments | 68 (6.2%) | 1,026 (93.8%) |
| Mobile Home / Other | 61 (100.0%) | 0 (0.0%) |
| Total | 7,134 (67.9%) | 3,366 (32.1%) |
Housing Structures by Number of Rooms in Clinton
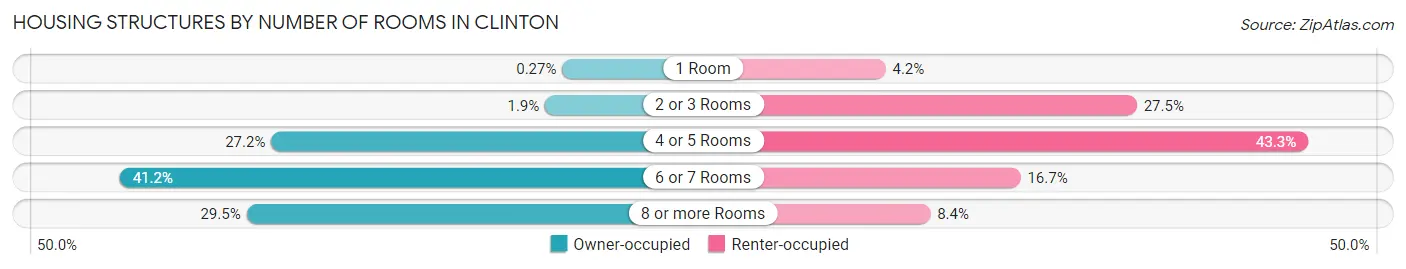
| Number of Rooms | Owner-occupied | Renter-occupied |
| 1 Room | 19 (0.3%) | 142 (4.2%) |
| 2 or 3 Rooms | 133 (1.9%) | 924 (27.5%) |
| 4 or 5 Rooms | 1,940 (27.2%) | 1,457 (43.3%) |
| 6 or 7 Rooms | 2,939 (41.2%) | 562 (16.7%) |
| 8 or more Rooms | 2,103 (29.5%) | 281 (8.4%) |
| Total | 7,134 (100.0%) | 3,366 (100.0%) |
Housing Structure by Heating Type in Clinton
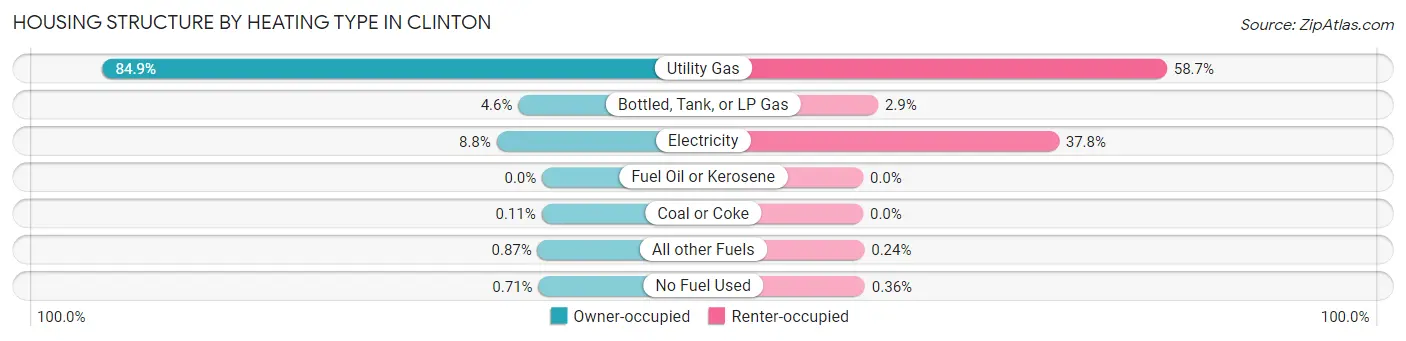
| Heating Type | Owner-occupied | Renter-occupied |
| Utility Gas | 6,058 (84.9%) | 1,976 (58.7%) |
| Bottled, Tank, or LP Gas | 328 (4.6%) | 97 (2.9%) |
| Electricity | 627 (8.8%) | 1,273 (37.8%) |
| Fuel Oil or Kerosene | 0 (0.0%) | 0 (0.0%) |
| Coal or Coke | 8 (0.1%) | 0 (0.0%) |
| All other Fuels | 62 (0.9%) | 8 (0.2%) |
| No Fuel Used | 51 (0.7%) | 12 (0.4%) |
| Total | 7,134 (100.0%) | 3,366 (100.0%) |
Household Vehicle Usage in Clinton
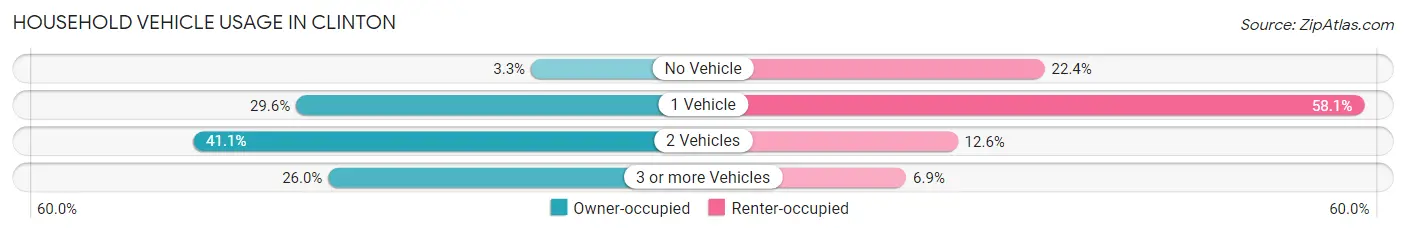
| Vehicles per Household | Owner-occupied | Renter-occupied |
| No Vehicle | 234 (3.3%) | 753 (22.4%) |
| 1 Vehicle | 2,112 (29.6%) | 1,957 (58.1%) |
| 2 Vehicles | 2,934 (41.1%) | 425 (12.6%) |
| 3 or more Vehicles | 1,854 (26.0%) | 231 (6.9%) |
| Total | 7,134 (100.0%) | 3,366 (100.0%) |
Real Estate & Mortgages in Clinton
Real Estate and Mortgage Overview in Clinton
| Characteristic | Without Mortgage | With Mortgage |
| Housing Units | 2,819 | 4,315 |
| Median Property Value | $108,000 | $115,300 |
| Median Household Income | $51,919 | $648 |
| Monthly Housing Costs | $553 | $102 |
| Real Estate Taxes | $2,002 | $148 |
Property Value by Mortgage Status in Clinton
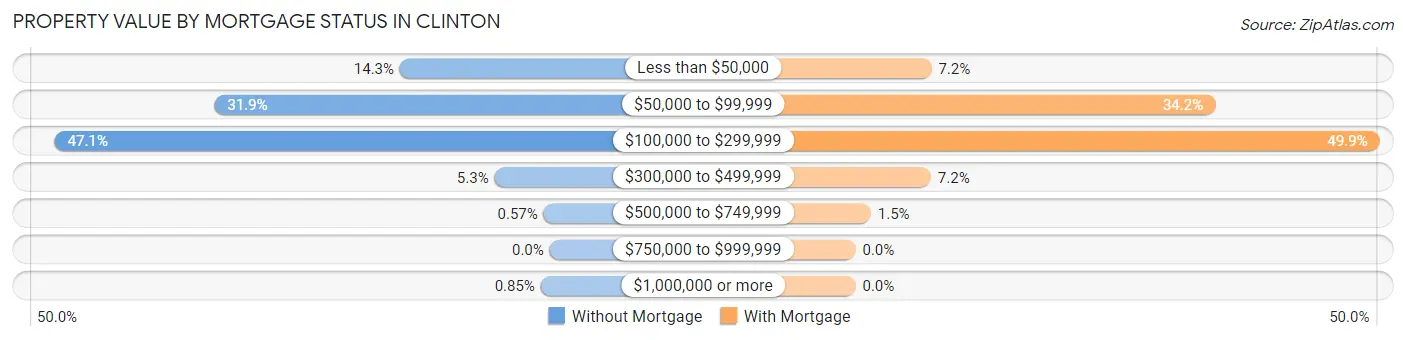
| Property Value | Without Mortgage | With Mortgage |
| Less than $50,000 | 402 (14.3%) | 312 (7.2%) |
| $50,000 to $99,999 | 900 (31.9%) | 1,477 (34.2%) |
| $100,000 to $299,999 | 1,329 (47.1%) | 2,153 (49.9%) |
| $300,000 to $499,999 | 148 (5.2%) | 310 (7.2%) |
| $500,000 to $749,999 | 16 (0.6%) | 63 (1.5%) |
| $750,000 to $999,999 | 0 (0.0%) | 0 (0.0%) |
| $1,000,000 or more | 24 (0.9%) | 0 (0.0%) |
| Total | 2,819 (100.0%) | 4,315 (100.0%) |
Household Income by Mortgage Status in Clinton
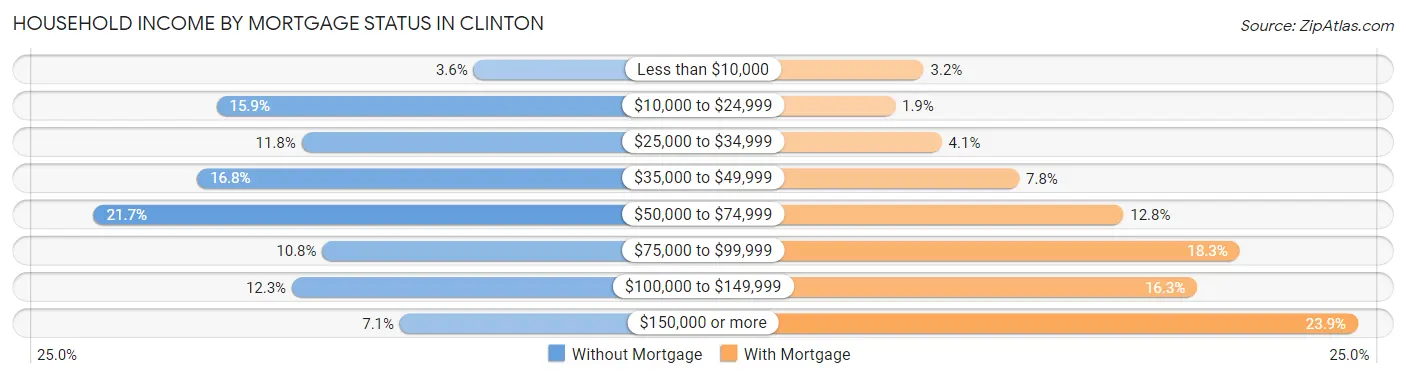
| Household Income | Without Mortgage | With Mortgage |
| Less than $10,000 | 102 (3.6%) | 140 (3.2%) |
| $10,000 to $24,999 | 447 (15.9%) | 81 (1.9%) |
| $25,000 to $34,999 | 333 (11.8%) | 177 (4.1%) |
| $35,000 to $49,999 | 473 (16.8%) | 336 (7.8%) |
| $50,000 to $74,999 | 612 (21.7%) | 550 (12.8%) |
| $75,000 to $99,999 | 305 (10.8%) | 789 (18.3%) |
| $100,000 to $149,999 | 346 (12.3%) | 702 (16.3%) |
| $150,000 or more | 201 (7.1%) | 1,032 (23.9%) |
| Total | 2,819 (100.0%) | 4,315 (100.0%) |
Property Value to Household Income Ratio in Clinton
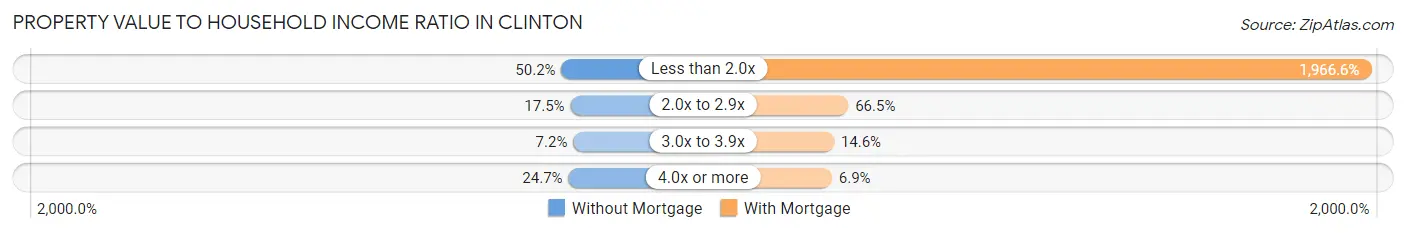
| Value-to-Income Ratio | Without Mortgage | With Mortgage |
| Less than 2.0x | 1,414 (50.2%) | 84,858 (1,966.6%) |
| 2.0x to 2.9x | 494 (17.5%) | 2,870 (66.5%) |
| 3.0x to 3.9x | 203 (7.2%) | 628 (14.5%) |
| 4.0x or more | 696 (24.7%) | 298 (6.9%) |
| Total | 2,819 (100.0%) | 4,315 (100.0%) |
Real Estate Taxes by Mortgage Status in Clinton
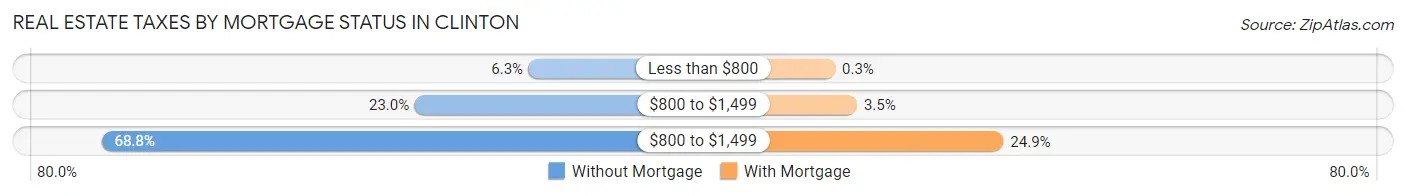
| Property Taxes | Without Mortgage | With Mortgage |
| Less than $800 | 178 (6.3%) | 13 (0.3%) |
| $800 to $1,499 | 647 (23.0%) | 151 (3.5%) |
| $800 to $1,499 | 1,938 (68.8%) | 1,074 (24.9%) |
| Total | 2,819 (100.0%) | 4,315 (100.0%) |
Health & Disability in Clinton
Health Insurance Coverage by Age in Clinton
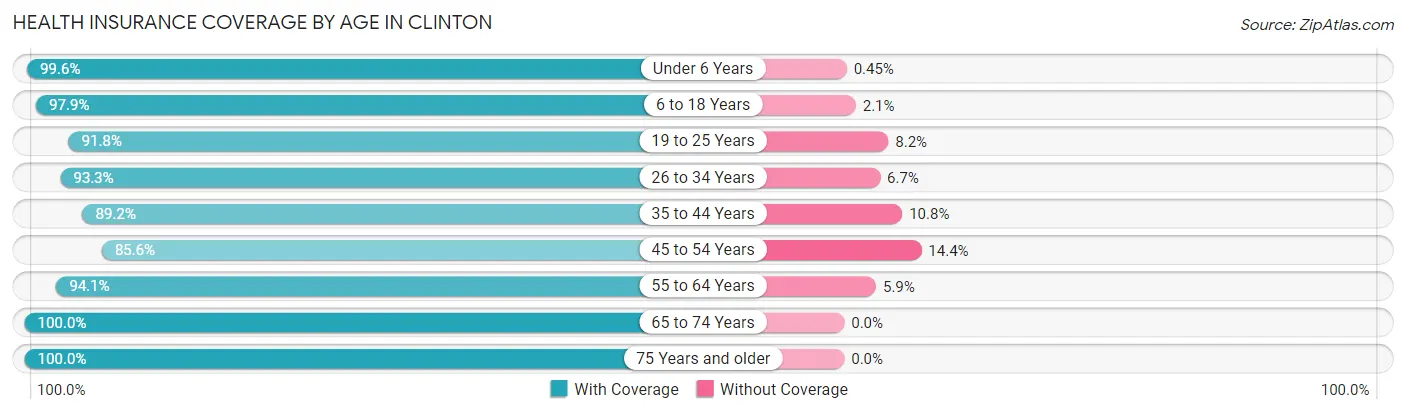
| Age Bracket | With Coverage | Without Coverage |
| Under 6 Years | 1,764 (99.6%) | 8 (0.4%) |
| 6 to 18 Years | 3,513 (97.9%) | 77 (2.1%) |
| 19 to 25 Years | 1,655 (91.8%) | 148 (8.2%) |
| 26 to 34 Years | 2,489 (93.3%) | 178 (6.7%) |
| 35 to 44 Years | 2,577 (89.2%) | 312 (10.8%) |
| 45 to 54 Years | 2,488 (85.6%) | 418 (14.4%) |
| 55 to 64 Years | 3,594 (94.1%) | 226 (5.9%) |
| 65 to 74 Years | 2,622 (100.0%) | 0 (0.0%) |
| 75 Years and older | 2,012 (100.0%) | 0 (0.0%) |
| Total | 22,714 (94.3%) | 1,367 (5.7%) |
Health Insurance Coverage by Citizenship Status in Clinton
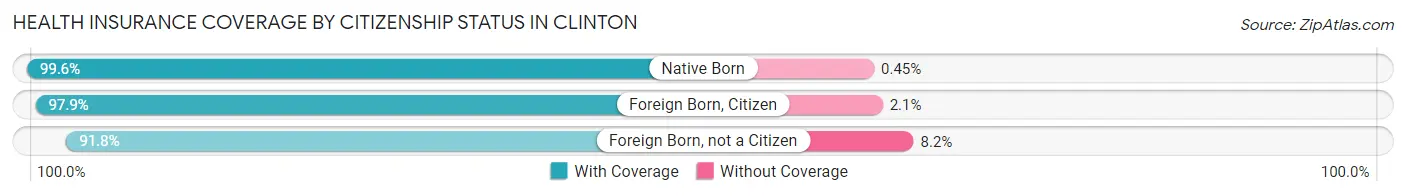
| Citizenship Status | With Coverage | Without Coverage |
| Native Born | 1,764 (99.6%) | 8 (0.4%) |
| Foreign Born, Citizen | 3,513 (97.9%) | 77 (2.1%) |
| Foreign Born, not a Citizen | 1,655 (91.8%) | 148 (8.2%) |
Health Insurance Coverage by Household Income in Clinton
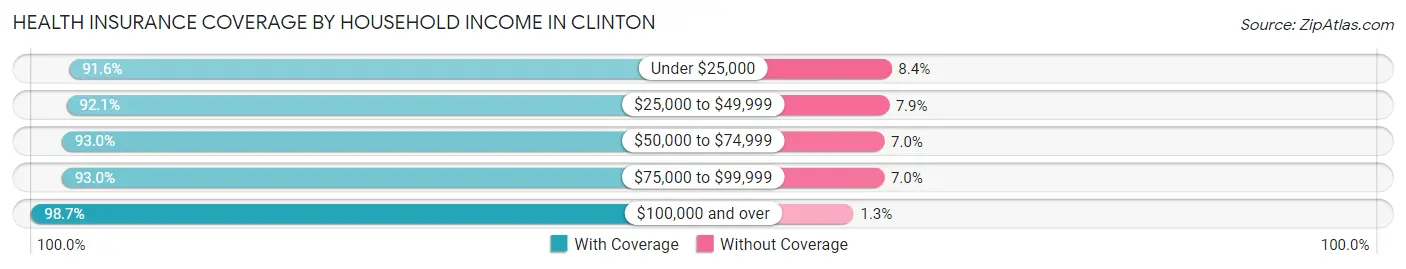
| Household Income | With Coverage | Without Coverage |
| Under $25,000 | 3,454 (91.6%) | 315 (8.4%) |
| $25,000 to $49,999 | 5,042 (92.1%) | 430 (7.9%) |
| $50,000 to $74,999 | 4,404 (93.0%) | 331 (7.0%) |
| $75,000 to $99,999 | 2,594 (93.0%) | 194 (7.0%) |
| $100,000 and over | 6,988 (98.7%) | 89 (1.3%) |
Public vs Private Health Insurance Coverage by Age in Clinton
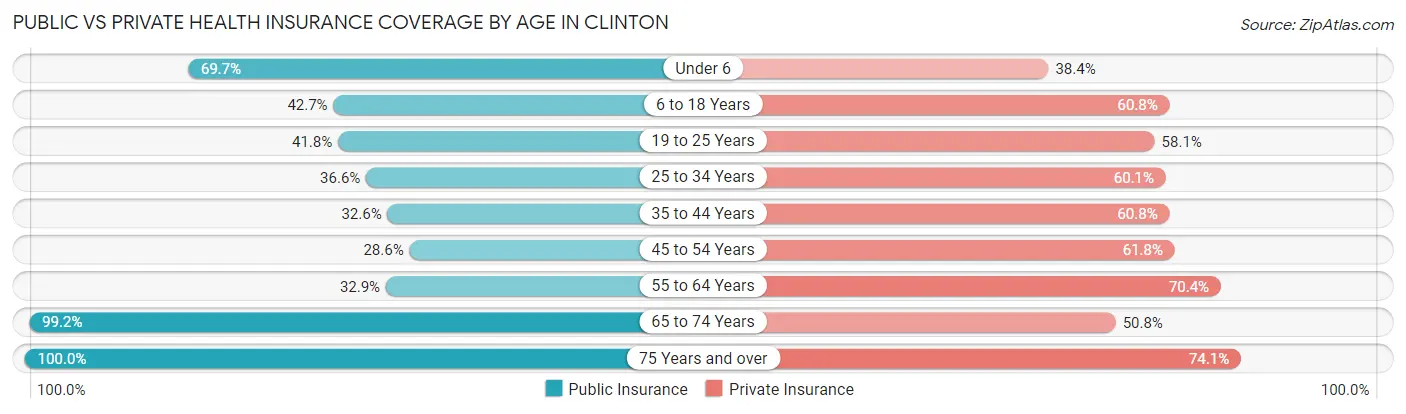
| Age Bracket | Public Insurance | Private Insurance |
| Under 6 | 1,235 (69.7%) | 680 (38.4%) |
| 6 to 18 Years | 1,532 (42.7%) | 2,184 (60.8%) |
| 19 to 25 Years | 754 (41.8%) | 1,047 (58.1%) |
| 25 to 34 Years | 976 (36.6%) | 1,604 (60.1%) |
| 35 to 44 Years | 943 (32.6%) | 1,757 (60.8%) |
| 45 to 54 Years | 830 (28.6%) | 1,796 (61.8%) |
| 55 to 64 Years | 1,258 (32.9%) | 2,688 (70.4%) |
| 65 to 74 Years | 2,600 (99.2%) | 1,333 (50.8%) |
| 75 Years and over | 2,012 (100.0%) | 1,491 (74.1%) |
| Total | 12,140 (50.4%) | 14,580 (60.6%) |
Disability Status by Sex by Age in Clinton
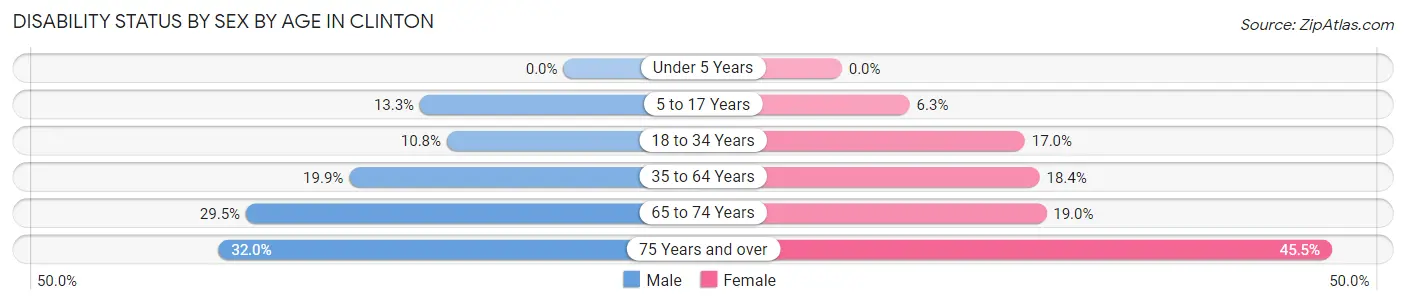
| Age Bracket | Male | Female |
| Under 5 Years | 0 (0.0%) | 0 (0.0%) |
| 5 to 17 Years | 245 (13.3%) | 109 (6.3%) |
| 18 to 34 Years | 248 (10.8%) | 430 (17.0%) |
| 35 to 64 Years | 986 (19.9%) | 854 (18.3%) |
| 65 to 74 Years | 375 (29.5%) | 256 (19.0%) |
| 75 Years and over | 269 (32.0%) | 533 (45.5%) |
Disability Class by Sex by Age in Clinton
Disability Class: Hearing Difficulty
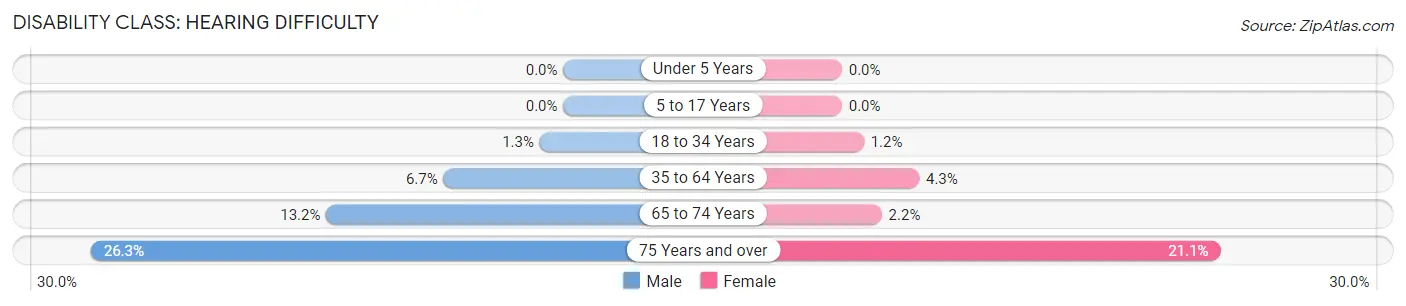
| Age Bracket | Male | Female |
| Under 5 Years | 0 (0.0%) | 0 (0.0%) |
| 5 to 17 Years | 0 (0.0%) | 0 (0.0%) |
| 18 to 34 Years | 30 (1.3%) | 31 (1.2%) |
| 35 to 64 Years | 331 (6.7%) | 200 (4.3%) |
| 65 to 74 Years | 168 (13.2%) | 30 (2.2%) |
| 75 Years and over | 221 (26.3%) | 247 (21.1%) |
Disability Class: Vision Difficulty
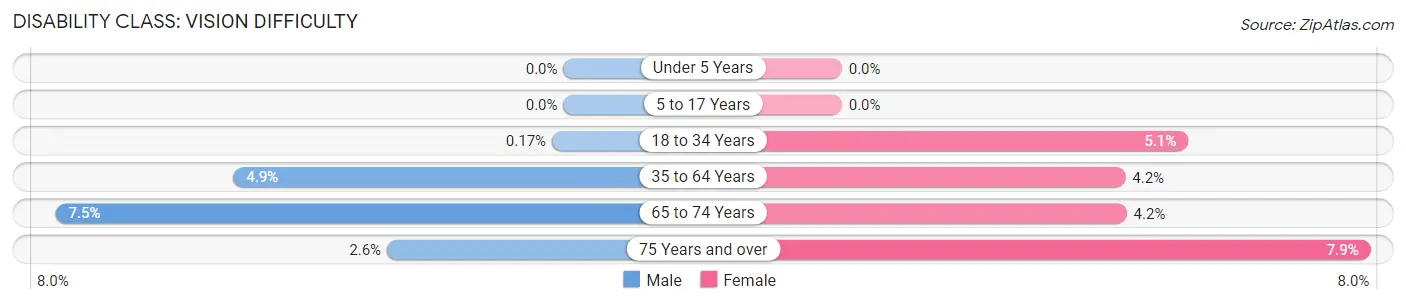
| Age Bracket | Male | Female |
| Under 5 Years | 0 (0.0%) | 0 (0.0%) |
| 5 to 17 Years | 0 (0.0%) | 0 (0.0%) |
| 18 to 34 Years | 4 (0.2%) | 130 (5.1%) |
| 35 to 64 Years | 243 (4.9%) | 196 (4.2%) |
| 65 to 74 Years | 96 (7.5%) | 57 (4.2%) |
| 75 Years and over | 22 (2.6%) | 92 (7.9%) |
Disability Class: Cognitive Difficulty
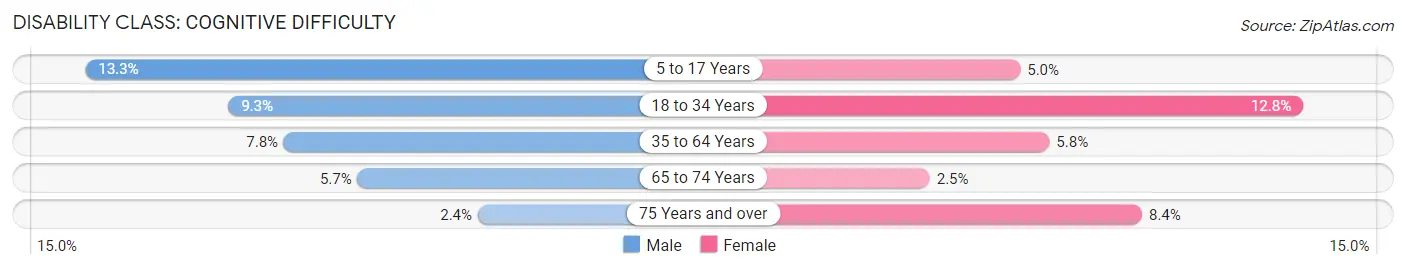
| Age Bracket | Male | Female |
| 5 to 17 Years | 245 (13.3%) | 86 (5.0%) |
| 18 to 34 Years | 214 (9.3%) | 325 (12.8%) |
| 35 to 64 Years | 386 (7.8%) | 269 (5.8%) |
| 65 to 74 Years | 73 (5.7%) | 33 (2.5%) |
| 75 Years and over | 20 (2.4%) | 98 (8.4%) |
Disability Class: Ambulatory Difficulty
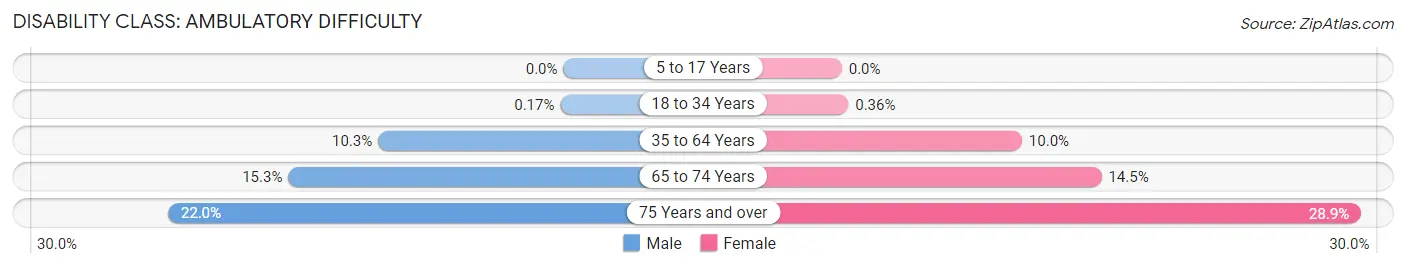
| Age Bracket | Male | Female |
| 5 to 17 Years | 0 (0.0%) | 0 (0.0%) |
| 18 to 34 Years | 4 (0.2%) | 9 (0.4%) |
| 35 to 64 Years | 512 (10.3%) | 467 (10.0%) |
| 65 to 74 Years | 195 (15.3%) | 195 (14.5%) |
| 75 Years and over | 185 (22.0%) | 339 (28.9%) |
Disability Class: Self-Care Difficulty
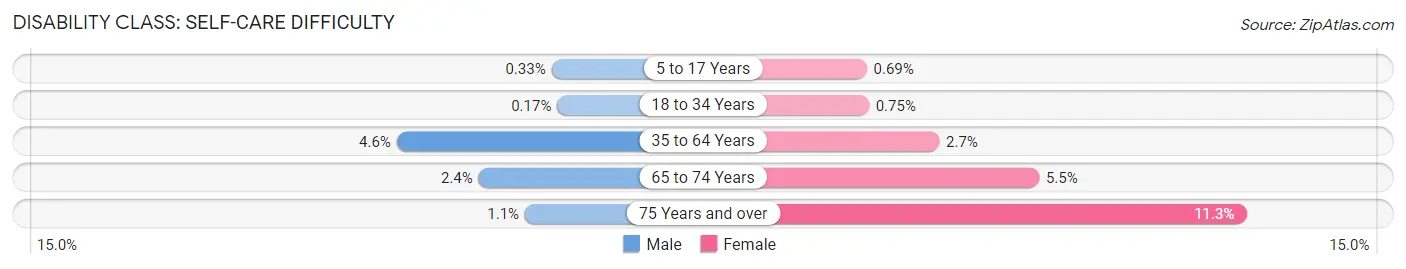
| Age Bracket | Male | Female |
| 5 to 17 Years | 6 (0.3%) | 12 (0.7%) |
| 18 to 34 Years | 4 (0.2%) | 19 (0.7%) |
| 35 to 64 Years | 230 (4.6%) | 126 (2.7%) |
| 65 to 74 Years | 30 (2.4%) | 74 (5.5%) |
| 75 Years and over | 9 (1.1%) | 132 (11.3%) |
Technology Access in Clinton
Computing Device Access in Clinton
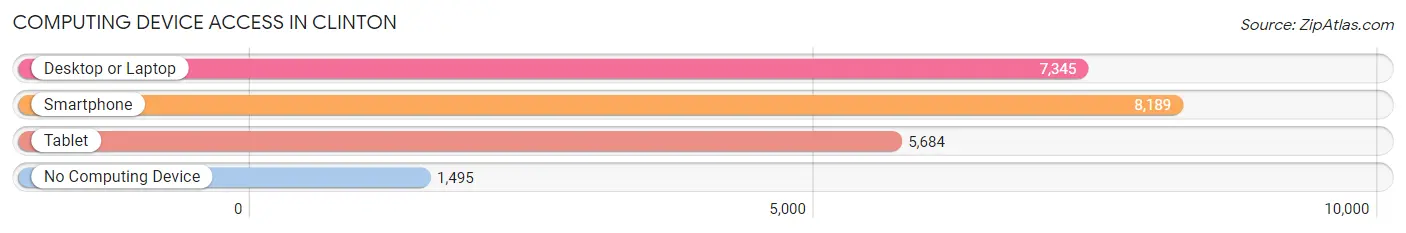
| Device Type | # Households | % Households |
| Desktop or Laptop | 7,345 | 70.0% |
| Smartphone | 8,189 | 78.0% |
| Tablet | 5,684 | 54.1% |
| No Computing Device | 1,495 | 14.2% |
| Total | 10,500 | 100.0% |
Internet Access in Clinton
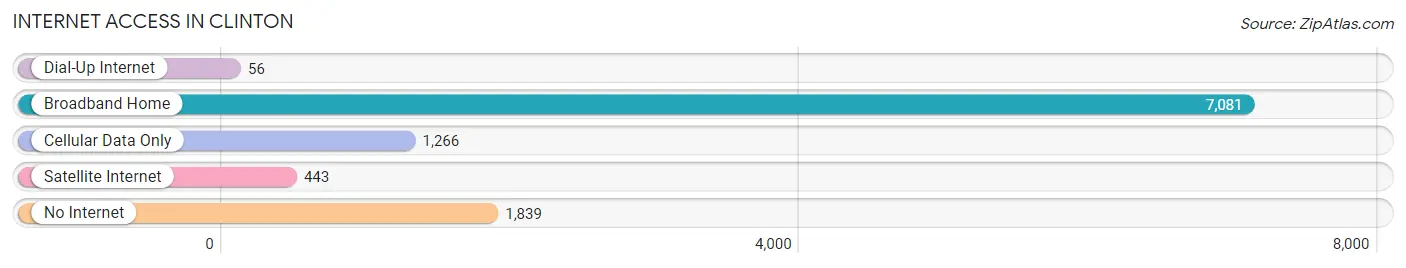
| Internet Type | # Households | % Households |
| Dial-Up Internet | 56 | 0.5% |
| Broadband Home | 7,081 | 67.4% |
| Cellular Data Only | 1,266 | 12.1% |
| Satellite Internet | 443 | 4.2% |
| No Internet | 1,839 | 17.5% |
| Total | 10,500 | 100.0% |
Clinton Summary
Clinton, Iowa is a city located in Clinton County, Iowa, United States. It is situated along the Mississippi River, and is the county seat of Clinton County. The city is located in the eastern part of the state, and is part of the Quad Cities metropolitan area. As of the 2010 census, the city had a population of 26,885.
History
The area that is now Clinton was first settled in 1835 by settlers from New York. The city was named after DeWitt Clinton, the seventh Governor of New York. The city was incorporated in 1857, and was designated as the county seat of Clinton County.
In the late 19th century, Clinton became an important industrial center, with several factories and mills located in the city. The city was also home to the Clinton Bridge, which was the first bridge to span the Mississippi River. The bridge was completed in 1868, and was the longest bridge in the world at the time.
Geography
Clinton is located at 41°45'N 90°13'W (41.75, -90.22). According to the United States Census Bureau, the city has a total area of 11.2 square miles (29.0 km2), of which 10.9 square miles (28.2 km2) is land and 0.3 square miles (0.8 km2) is water.
Economy
Clinton is a major industrial center, with several factories and mills located in the city. The city is home to the Clinton Corn Processing Company, which is the largest corn processing plant in the world. The plant produces ethanol, corn syrup, and other corn-based products. The city is also home to several other manufacturing companies, including the Clinton Foundry, the Clinton Machine Works, and the Clinton Paper Company.
The city is also home to several retail stores, restaurants, and other businesses. The city is served by the Clinton Municipal Airport, which is located just outside of the city limits.
Demographics
As of the 2010 census, there were 26,885 people, 10,845 households, and 6,845 families residing in the city. The population density was 2,457.3 people per square mile (948.7/km2). There were 11,845 housing units at an average density of 1,082.3 per square mile (417.9/km2). The racial makeup of the city was 92.2% White, 3.2% African American, 0.3% Native American, 0.9% Asian, 0.1% Pacific Islander, 1.7% from other races, and 1.6% from two or more races. Hispanic or Latino of any race were 4.2% of the population.
There were 10,845 households, out of which 28.7% had children under the age of 18 living with them, 44.2% were married couples living together, 13.2% had a female householder with no husband present, and 37.7% were non-families. 32.2% of all households were made up of individuals, and 14.2% had someone living alone who was 65 years of age or older. The average household size was 2.37 and the average family size was 2.97.
In the city, the population was spread out, with 23.7% under the age of 18, 8.7% from 18 to 24, 26.2% from 25 to 44, 23.3% from 45 to 64, and 18.1% who were 65 years of age or older. The median age was 39 years. For every 100 females, there were 91.2 males. For every 100 females age 18 and over, there were 87.3 males.
The median income for a household in the city was $37,890, and the median income for a family was $45,945. Males had a median income of $35,945 versus $25,945 for females. The per capita income for the city was $19,945. About 8.2% of families and 10.7% of the population were below the poverty line, including 15.2% of those under age 18 and 8.2% of those age 65 or over.
Common Questions
What is Per Capita Income in Clinton?
Per Capita income in Clinton is $31,275.
What is the Median Family Income in Clinton?
Median Family Income in Clinton is $68,580.
What is the Median Household income in Clinton?
Median Household Income in Clinton is $55,196.
What is Income or Wage Gap in Clinton?
Income or Wage Gap in Clinton is 38.0%.
Women in Clinton earn 62.0 cents for every dollar earned by a man.
What is Family Income Deficit in Clinton?
Family Income Deficit in Clinton is $10,656.
Families that are below poverty line in Clinton earn $10,656 less on average than the poverty threshold level.
What is Inequality or Gini Index in Clinton?
Inequality or Gini Index in Clinton is 0.44.
What is the Total Population of Clinton?
Total Population of Clinton is 24,524.
What is the Total Male Population of Clinton?
Total Male Population of Clinton is 12,084.
What is the Total Female Population of Clinton?
Total Female Population of Clinton is 12,440.
What is the Ratio of Males per 100 Females in Clinton?
There are 97.14 Males per 100 Females in Clinton.
What is the Ratio of Females per 100 Males in Clinton?
There are 102.95 Females per 100 Males in Clinton.
What is the Median Population Age in Clinton?
Median Population Age in Clinton is 42.8 Years.
What is the Average Family Size in Clinton
Average Family Size in Clinton is 2.9 People.
What is the Average Household Size in Clinton
Average Household Size in Clinton is 2.3 People.
How Large is the Labor Force in Clinton?
There are 11,536 People in the Labor Forcein in Clinton.
What is the Percentage of People in the Labor Force in Clinton?
57.3% of People are in the Labor Force in Clinton.
What is the Unemployment Rate in Clinton?
Unemployment Rate in Clinton is 5.2%.