Black Hawk County, IA Map & Demographics
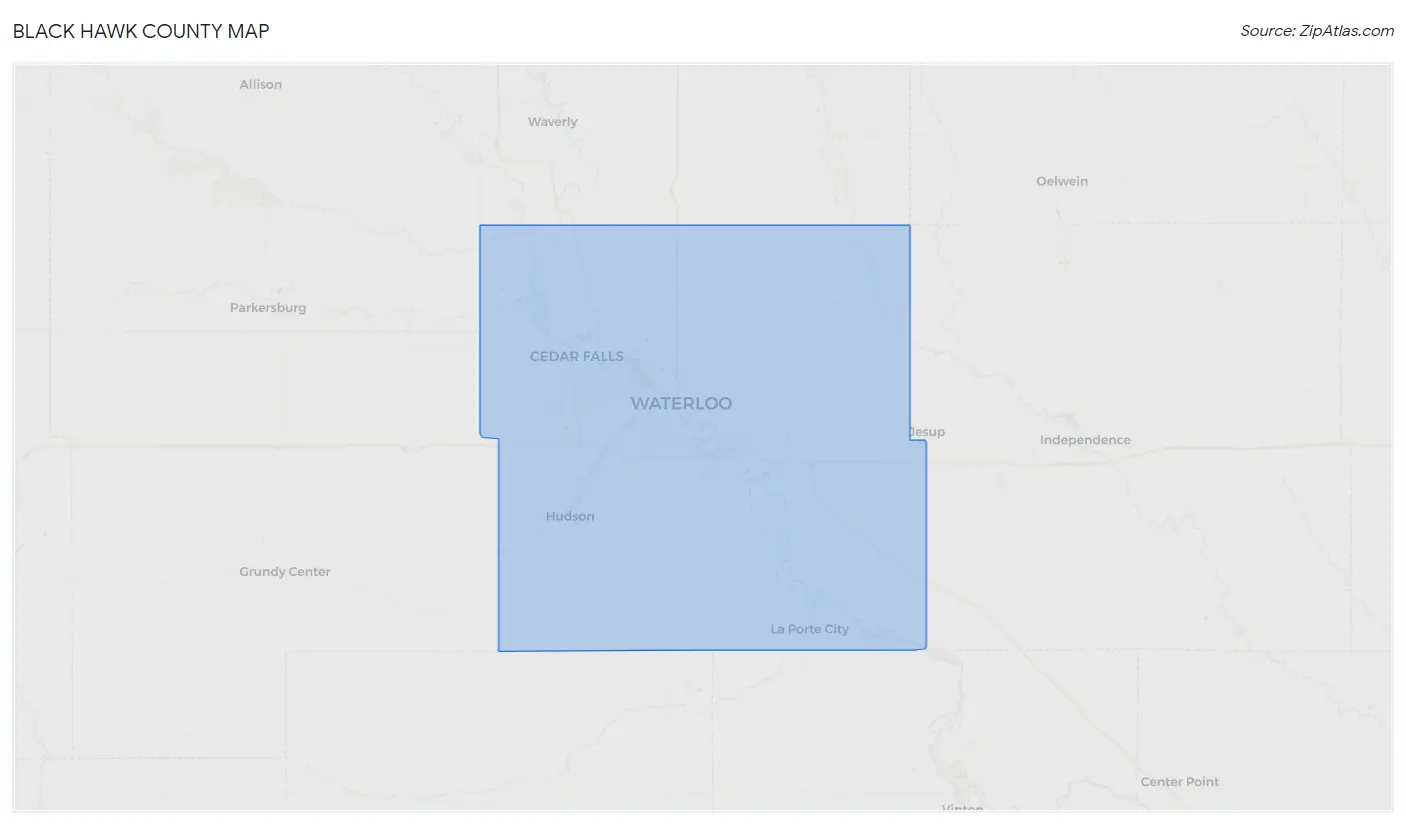
Black Hawk County Map
Black Hawk County Overview
$35,400
PER CAPITA INCOME
$83,292
AVG FAMILY INCOME
$62,329
AVG HOUSEHOLD INCOME
32.7%
WAGE / INCOME GAP [ % ]
67.3¢/ $1
WAGE / INCOME GAP [ $ ]
$9,642
FAMILY INCOME DEFICIT
0.46
INEQUALITY / GINI INDEX
131,041
TOTAL POPULATION
64,632
MALE POPULATION
66,409
FEMALE POPULATION
97.32
MALES / 100 FEMALES
102.75
FEMALES / 100 MALES
35.5
MEDIAN AGE
3.0
AVG FAMILY SIZE
2.4
AVG HOUSEHOLD SIZE
70,301
LABOR FORCE [ PEOPLE ]
66.5%
PERCENT IN LABOR FORCE
5.2%
UNEMPLOYMENT RATE
Black Hawk County Area Codes
Income in Black Hawk County
Income Overview in Black Hawk County
Per Capita Income in Black Hawk County is $35,400, while median incomes of families and households are $83,292 and $62,329 respectively.
| Characteristic | Number | Measure |
| Per Capita Income | 131,041 | $35,400 |
| Median Family Income | 31,278 | $83,292 |
| Mean Family Income | 31,278 | $106,700 |
| Median Household Income | 53,691 | $62,329 |
| Mean Household Income | 53,691 | $85,130 |
| Income Deficit | 31,278 | $9,642 |
| Wage / Income Gap (%) | 131,041 | 32.74% |
| Wage / Income Gap ($) | 131,041 | 67.26¢ per $1 |
| Gini / Inequality Index | 131,041 | 0.46 |
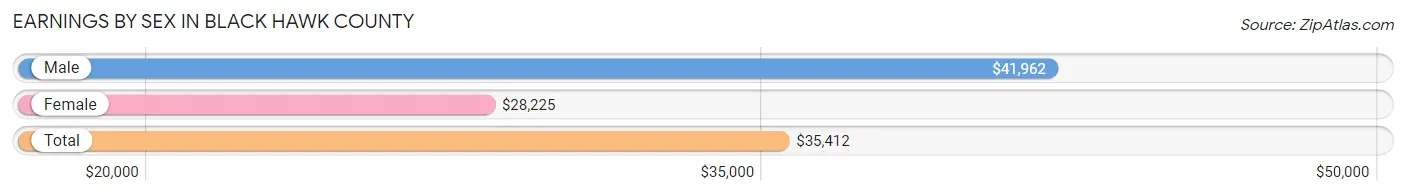
Earnings by Sex in Black Hawk County
Average Earnings in Black Hawk County are $35,412, $41,962 for men and $28,225 for women, a difference of 32.7%.
| Sex | Number | Average Earnings |
| Male | 38,420 (51.8%) | $41,962 |
| Female | 35,677 (48.1%) | $28,225 |
| Total | 74,097 (100.0%) | $35,412 |
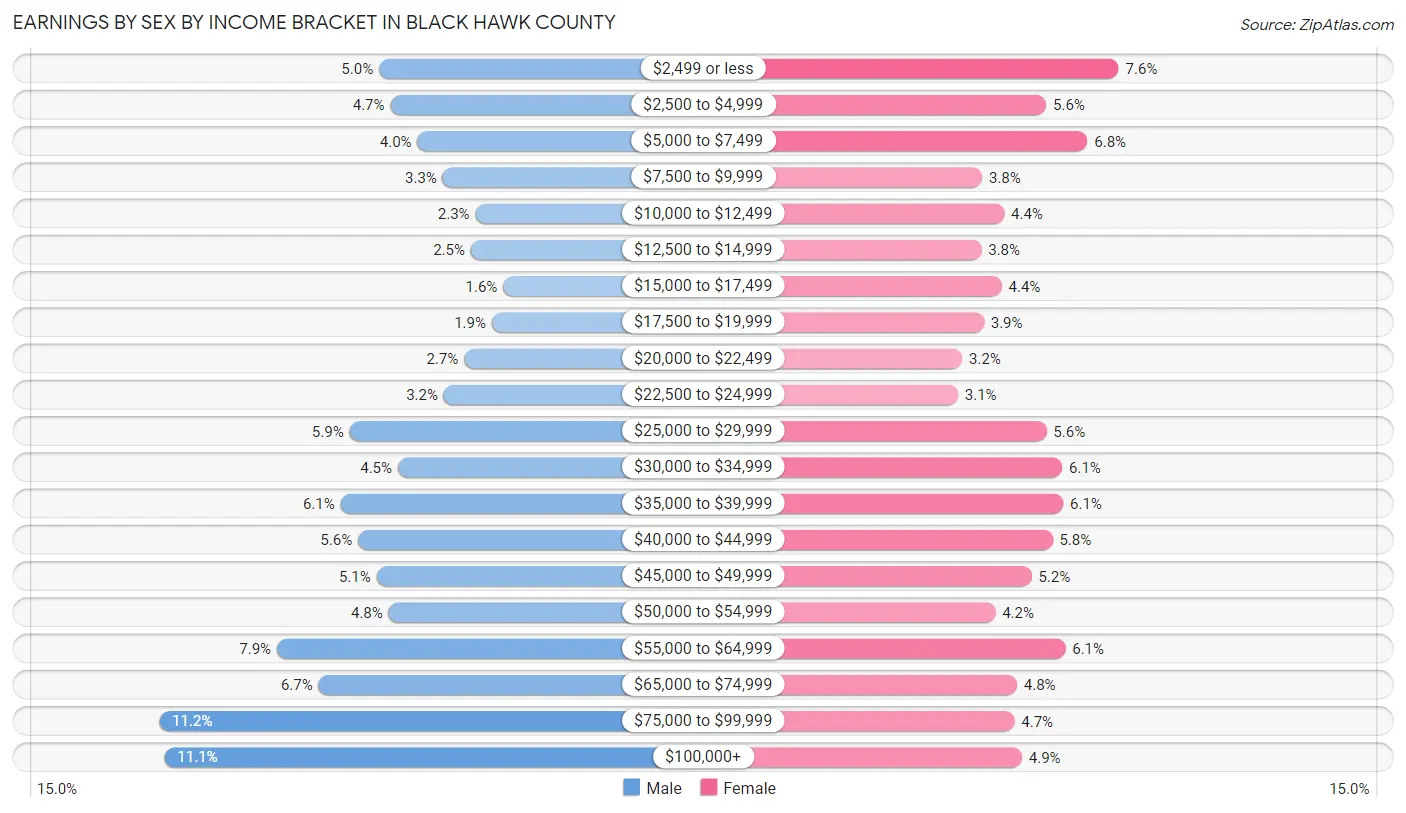
Earnings by Sex by Income Bracket in Black Hawk County
The most common earnings brackets in Black Hawk County are $75,000 to $99,999 for men (4,310 | 11.2%) and $2,499 or less for women (2,727 | 7.6%).
| Income | Male | Female |
| $2,499 or less | 1,936 (5.0%) | 2,727 (7.6%) |
| $2,500 to $4,999 | 1,812 (4.7%) | 1,998 (5.6%) |
| $5,000 to $7,499 | 1,523 (4.0%) | 2,413 (6.8%) |
| $7,500 to $9,999 | 1,249 (3.3%) | 1,357 (3.8%) |
| $10,000 to $12,499 | 897 (2.3%) | 1,578 (4.4%) |
| $12,500 to $14,999 | 946 (2.5%) | 1,348 (3.8%) |
| $15,000 to $17,499 | 596 (1.5%) | 1,553 (4.3%) |
| $17,500 to $19,999 | 717 (1.9%) | 1,372 (3.8%) |
| $20,000 to $22,499 | 1,018 (2.6%) | 1,156 (3.2%) |
| $22,500 to $24,999 | 1,237 (3.2%) | 1,112 (3.1%) |
| $25,000 to $29,999 | 2,256 (5.9%) | 2,000 (5.6%) |
| $30,000 to $34,999 | 1,733 (4.5%) | 2,159 (6.0%) |
| $35,000 to $39,999 | 2,352 (6.1%) | 2,168 (6.1%) |
| $40,000 to $44,999 | 2,162 (5.6%) | 2,063 (5.8%) |
| $45,000 to $49,999 | 1,964 (5.1%) | 1,852 (5.2%) |
| $50,000 to $54,999 | 1,833 (4.8%) | 1,489 (4.2%) |
| $55,000 to $64,999 | 3,038 (7.9%) | 2,191 (6.1%) |
| $65,000 to $74,999 | 2,588 (6.7%) | 1,704 (4.8%) |
| $75,000 to $99,999 | 4,310 (11.2%) | 1,681 (4.7%) |
| $100,000+ | 4,253 (11.1%) | 1,756 (4.9%) |
| Total | 38,420 (100.0%) | 35,677 (100.0%) |
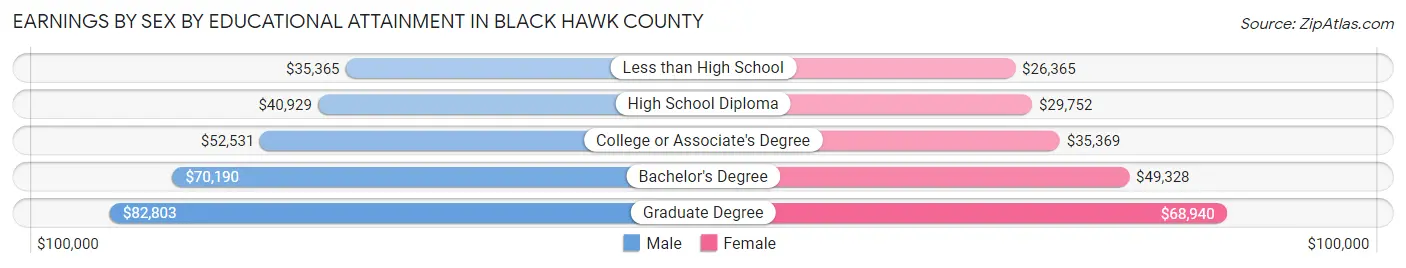
Earnings by Sex by Educational Attainment in Black Hawk County
Average earnings in Black Hawk County are $52,125 for men and $38,790 for women, a difference of 25.6%. Men with an educational attainment of graduate degree enjoy the highest average annual earnings of $82,803, while those with less than high school education earn the least with $35,365. Women with an educational attainment of graduate degree earn the most with the average annual earnings of $68,940, while those with less than high school education have the smallest earnings of $26,365.
| Educational Attainment | Male Income | Female Income |
| Less than High School | $35,365 | $26,365 |
| High School Diploma | $40,929 | $29,752 |
| College or Associate's Degree | $52,531 | $35,369 |
| Bachelor's Degree | $70,190 | $49,328 |
| Graduate Degree | $82,803 | $68,940 |
| Total | $52,125 | $38,790 |
Family Income in Black Hawk County
Family Income Brackets in Black Hawk County
According to the Black Hawk County family income data, there are 6,850 families falling into the $100,000 to $149,999 income range, which is the most common income bracket and makes up 21.9% of all families. Conversely, the $10,000 to $14,999 income bracket is the least frequent group with only 688 families (2.2%) belonging to this category.
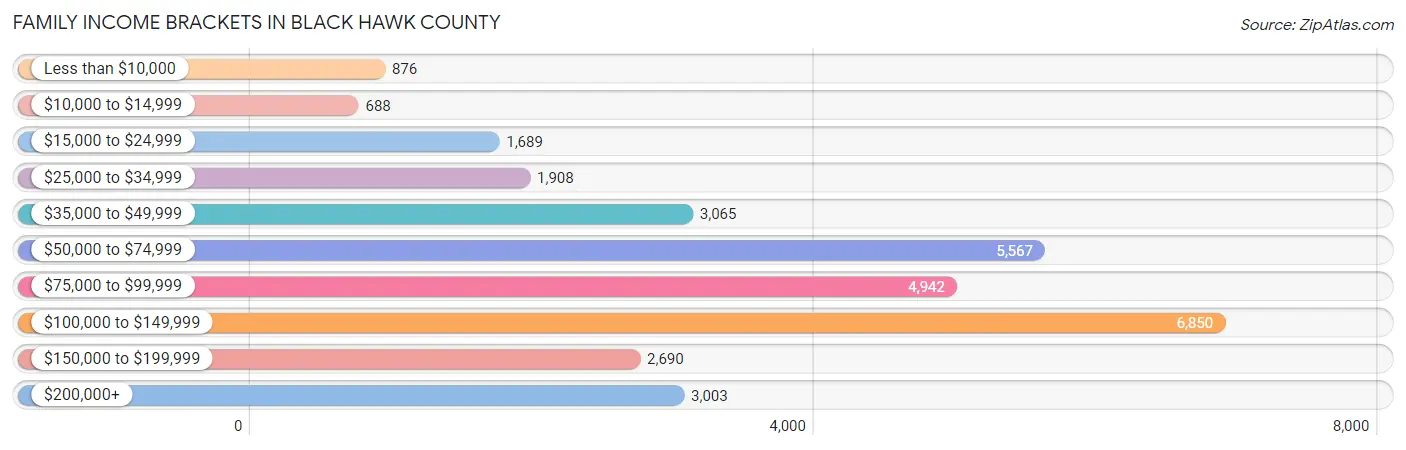
| Income Bracket | # Families | % Families |
| Less than $10,000 | 876 | 2.8% |
| $10,000 to $14,999 | 688 | 2.2% |
| $15,000 to $24,999 | 1,689 | 5.4% |
| $25,000 to $34,999 | 1,908 | 6.1% |
| $35,000 to $49,999 | 3,065 | 9.8% |
| $50,000 to $74,999 | 5,567 | 17.8% |
| $75,000 to $99,999 | 4,942 | 15.8% |
| $100,000 to $149,999 | 6,850 | 21.9% |
| $150,000 to $199,999 | 2,690 | 8.6% |
| $200,000+ | 3,003 | 9.6% |
Family Income by Famaliy Size in Black Hawk County
7+ person families (357 | 1.1%) account for the highest median family income in Black Hawk County with $108,417 per family, while 2-person families (16,628 | 53.2%) have the highest median income of $38,436 per family member.
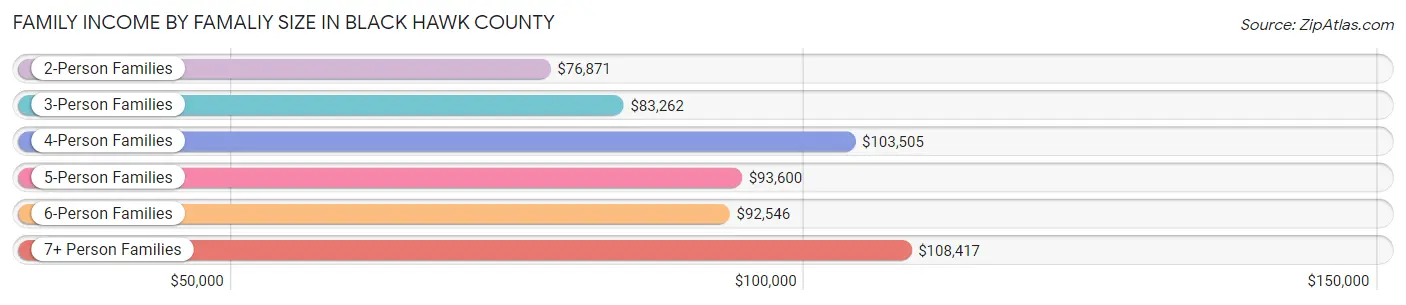
| Income Bracket | # Families | Median Income |
| 2-Person Families | 16,628 (53.2%) | $76,871 |
| 3-Person Families | 6,372 (20.4%) | $83,262 |
| 4-Person Families | 4,612 (14.7%) | $103,505 |
| 5-Person Families | 2,182 (7.0%) | $93,600 |
| 6-Person Families | 1,127 (3.6%) | $92,546 |
| 7+ Person Families | 357 (1.1%) | $108,417 |
| Total | 31,278 (100.0%) | $83,292 |
Family Income by Number of Earners in Black Hawk County
The median family income in Black Hawk County is $83,292, with families comprising 3+ earners (3,143) having the highest median family income of $135,693, while families with 1 earner (9,158) have the lowest median family income of $53,007, accounting for 10.1% and 29.3% of families, respectively.
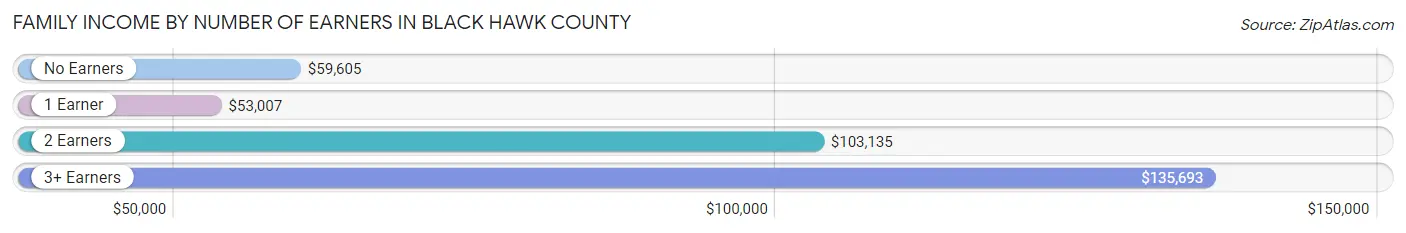
| Number of Earners | # Families | Median Income |
| No Earners | 5,563 (17.8%) | $59,605 |
| 1 Earner | 9,158 (29.3%) | $53,007 |
| 2 Earners | 13,414 (42.9%) | $103,135 |
| 3+ Earners | 3,143 (10.1%) | $135,693 |
| Total | 31,278 (100.0%) | $83,292 |
Household Income in Black Hawk County
Household Income Brackets in Black Hawk County
With 9,825 households falling in the category, the $50,000 to $74,999 income range is the most frequent in Black Hawk County, accounting for 18.3% of all households. In contrast, only 2,631 households (4.9%) fall into the $10,000 to $14,999 income bracket, making it the least populous group.
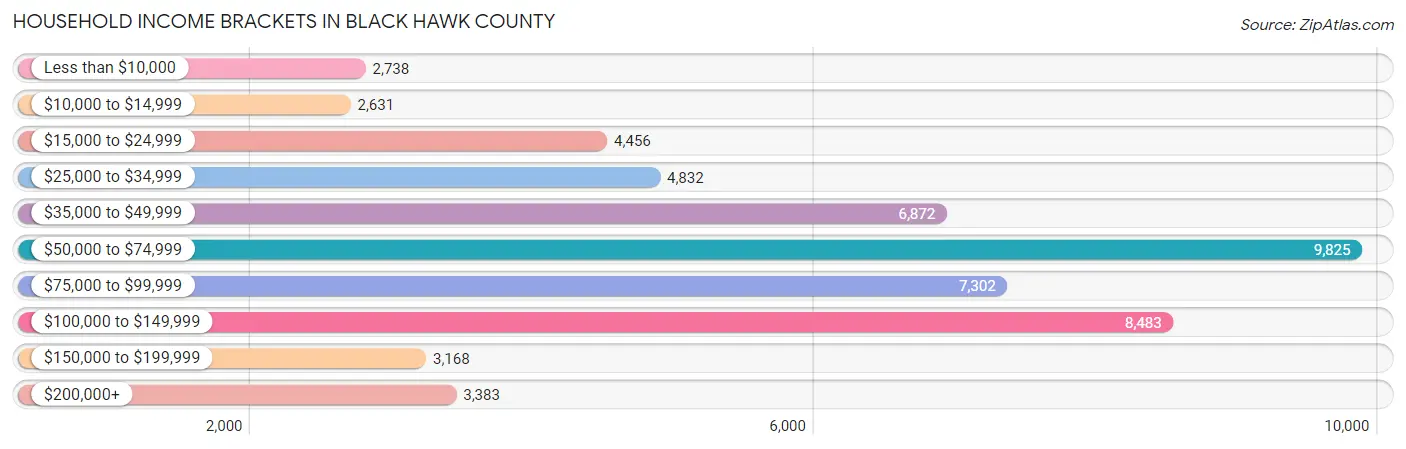
| Income Bracket | # Households | % Households |
| Less than $10,000 | 2,738 | 5.1% |
| $10,000 to $14,999 | 2,631 | 4.9% |
| $15,000 to $24,999 | 4,456 | 8.3% |
| $25,000 to $34,999 | 4,832 | 9.0% |
| $35,000 to $49,999 | 6,872 | 12.8% |
| $50,000 to $74,999 | 9,825 | 18.3% |
| $75,000 to $99,999 | 7,302 | 13.6% |
| $100,000 to $149,999 | 8,483 | 15.8% |
| $150,000 to $199,999 | 3,168 | 5.9% |
| $200,000+ | 3,383 | 6.3% |
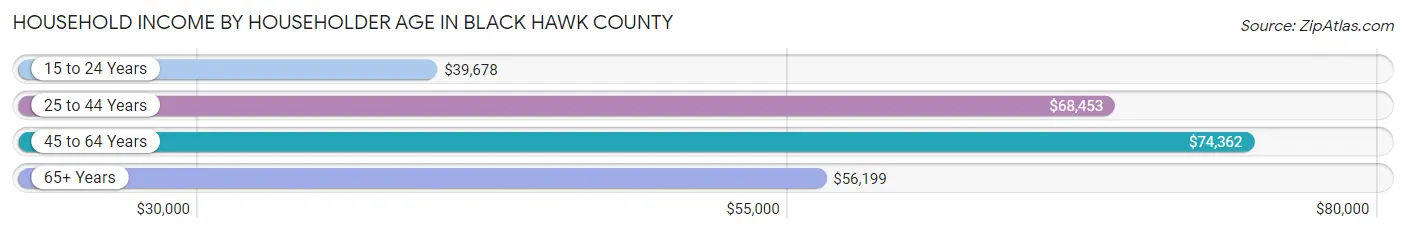
Household Income by Householder Age in Black Hawk County
The median household income in Black Hawk County is $62,329, with the highest median household income of $74,362 found in the 45 to 64 years age bracket for the primary householder. A total of 16,173 households (30.1%) fall into this category. Meanwhile, the 15 to 24 years age bracket for the primary householder has the lowest median household income of $39,678, with 4,882 households (9.1%) in this group.
| Income Bracket | # Households | Median Income |
| 15 to 24 Years | 4,882 (9.1%) | $39,678 |
| 25 to 44 Years | 17,950 (33.4%) | $68,453 |
| 45 to 64 Years | 16,173 (30.1%) | $74,362 |
| 65+ Years | 14,686 (27.4%) | $56,199 |
| Total | 53,691 (100.0%) | $62,329 |
Poverty in Black Hawk County
Income Below Poverty by Sex and Age in Black Hawk County
With 13.2% poverty level for males and 18.2% for females among the residents of Black Hawk County, 18 to 24 year old males and 18 to 24 year old females are the most vulnerable to poverty, with 2,453 males (28.6%) and 3,951 females (48.8%) in their respective age groups living below the poverty level.
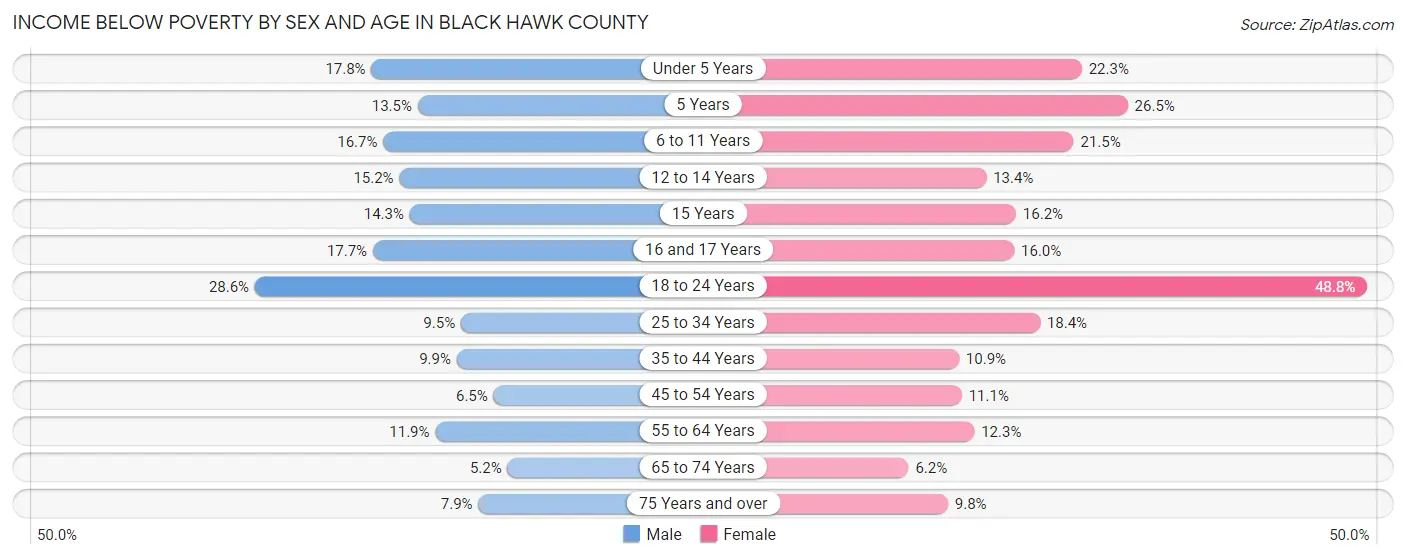
| Age Bracket | Male | Female |
| Under 5 Years | 729 (17.8%) | 856 (22.3%) |
| 5 Years | 104 (13.5%) | 143 (26.5%) |
| 6 to 11 Years | 818 (16.7%) | 1,009 (21.5%) |
| 12 to 14 Years | 324 (15.2%) | 295 (13.4%) |
| 15 Years | 102 (14.2%) | 138 (16.2%) |
| 16 and 17 Years | 284 (17.7%) | 231 (16.0%) |
| 18 to 24 Years | 2,453 (28.6%) | 3,951 (48.8%) |
| 25 to 34 Years | 796 (9.5%) | 1,457 (18.4%) |
| 35 to 44 Years | 788 (9.9%) | 824 (10.9%) |
| 45 to 54 Years | 428 (6.5%) | 722 (11.1%) |
| 55 to 64 Years | 867 (11.9%) | 955 (12.3%) |
| 65 to 74 Years | 317 (5.2%) | 415 (6.2%) |
| 75 Years and over | 285 (7.9%) | 517 (9.8%) |
| Total | 8,295 (13.2%) | 11,513 (18.2%) |
Income Above Poverty by Sex and Age in Black Hawk County
According to the poverty statistics in Black Hawk County, males aged 65 to 74 years and females aged 65 to 74 years are the age groups that are most secure financially, with 94.8% of males and 93.8% of females in these age groups living above the poverty line.
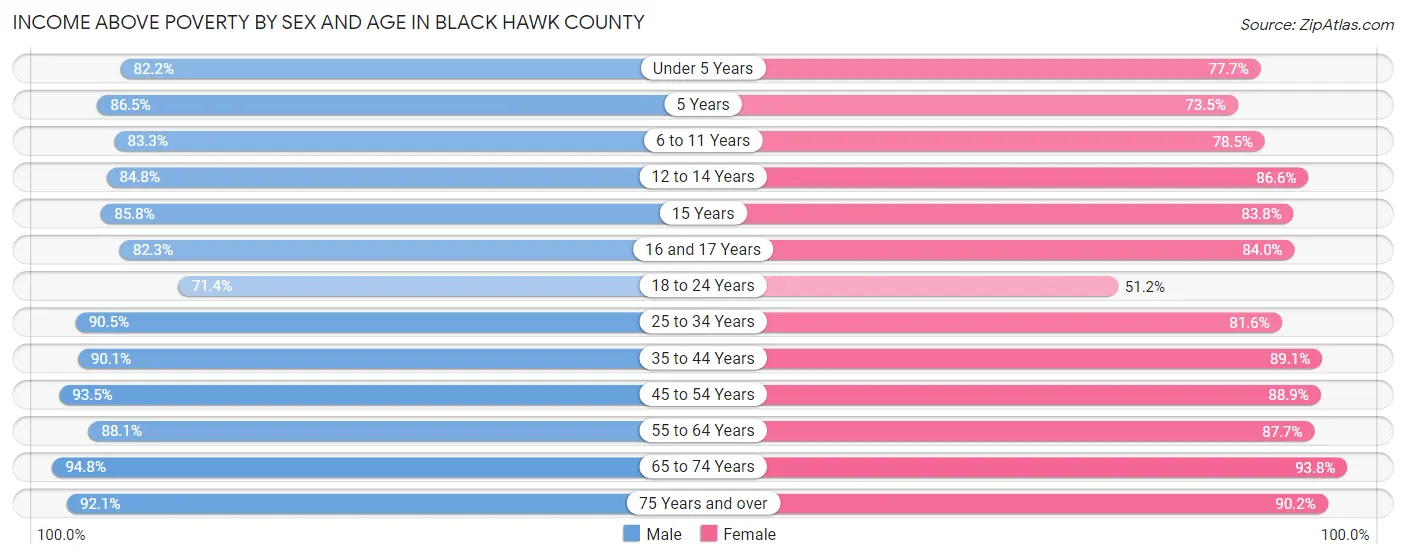
| Age Bracket | Male | Female |
| Under 5 Years | 3,364 (82.2%) | 2,988 (77.7%) |
| 5 Years | 666 (86.5%) | 396 (73.5%) |
| 6 to 11 Years | 4,078 (83.3%) | 3,682 (78.5%) |
| 12 to 14 Years | 1,806 (84.8%) | 1,906 (86.6%) |
| 15 Years | 614 (85.8%) | 716 (83.8%) |
| 16 and 17 Years | 1,323 (82.3%) | 1,214 (84.0%) |
| 18 to 24 Years | 6,117 (71.4%) | 4,152 (51.2%) |
| 25 to 34 Years | 7,587 (90.5%) | 6,465 (81.6%) |
| 35 to 44 Years | 7,178 (90.1%) | 6,754 (89.1%) |
| 45 to 54 Years | 6,189 (93.5%) | 5,763 (88.9%) |
| 55 to 64 Years | 6,434 (88.1%) | 6,818 (87.7%) |
| 65 to 74 Years | 5,800 (94.8%) | 6,286 (93.8%) |
| 75 Years and over | 3,331 (92.1%) | 4,739 (90.2%) |
| Total | 54,487 (86.8%) | 51,879 (81.8%) |
Income Below Poverty Among Married-Couple Families in Black Hawk County
The poverty statistics for married-couple families in Black Hawk County show that 3.1% or 716 of the total 23,323 families live below the poverty line. Families with 3 or 4 children have the highest poverty rate of 8.1%, comprising of 181 families. On the other hand, families with 5 or more children have the lowest poverty rate of 0.0%, which includes 0 families.
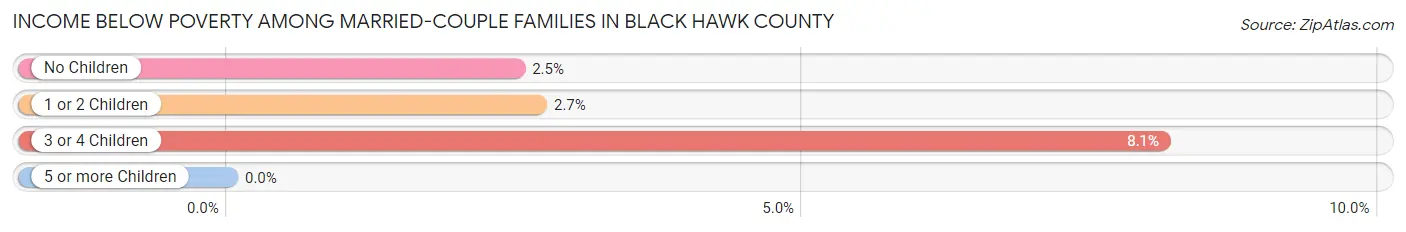
| Children | Above Poverty | Below Poverty |
| No Children | 14,324 (97.5%) | 367 (2.5%) |
| 1 or 2 Children | 6,069 (97.3%) | 168 (2.7%) |
| 3 or 4 Children | 2,049 (91.9%) | 181 (8.1%) |
| 5 or more Children | 165 (100.0%) | 0 (0.0%) |
| Total | 22,607 (96.9%) | 716 (3.1%) |
Income Below Poverty Among Single-Parent Households in Black Hawk County
According to the poverty data in Black Hawk County, 17.5% or 424 single-father households and 32.9% or 1,820 single-mother households are living below the poverty line. Among single-father households, those with 5 or more children have the highest poverty rate, with 11 households (47.8%) experiencing poverty. Likewise, among single-mother households, those with 5 or more children have the highest poverty rate, with 39 households (76.5%) falling below the poverty line.
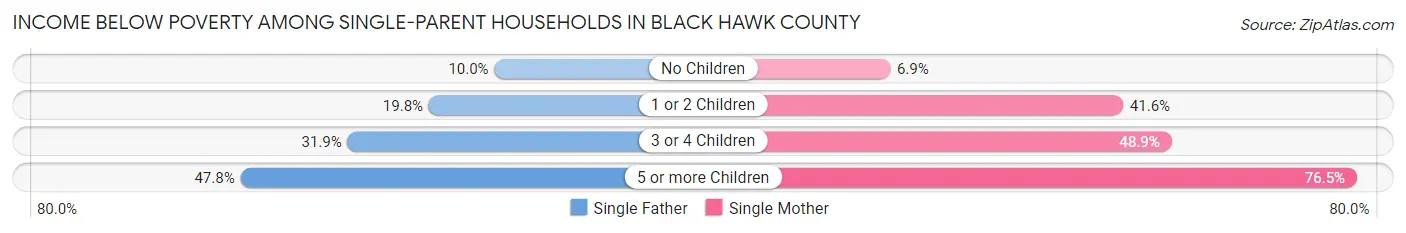
| Children | Single Father | Single Mother |
| No Children | 92 (10.0%) | 112 (6.9%) |
| 1 or 2 Children | 248 (19.8%) | 1,220 (41.6%) |
| 3 or 4 Children | 73 (31.9%) | 449 (48.9%) |
| 5 or more Children | 11 (47.8%) | 39 (76.5%) |
| Total | 424 (17.5%) | 1,820 (32.9%) |
Income Below Poverty Among Married-Couple vs Single-Parent Households in Black Hawk County
The poverty data for Black Hawk County shows that 716 of the married-couple family households (3.1%) and 2,244 of the single-parent households (28.2%) are living below the poverty level. Within the married-couple family households, those with 3 or 4 children have the highest poverty rate, with 181 households (8.1%) falling below the poverty line. Among the single-parent households, those with 5 or more children have the highest poverty rate, with 50 household (67.6%) living below poverty.
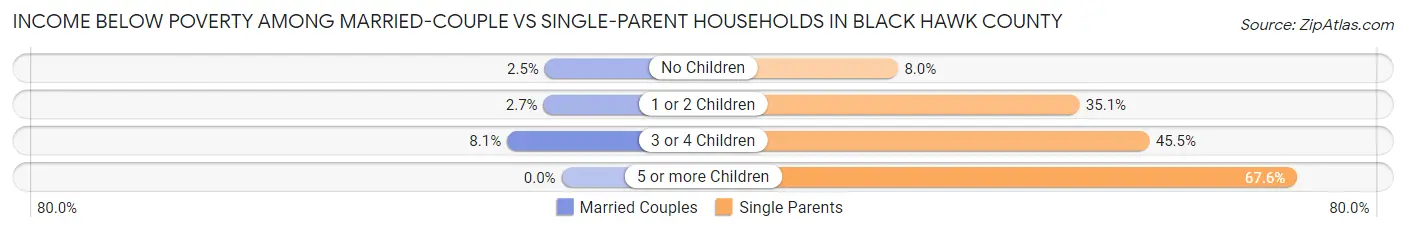
| Children | Married-Couple Families | Single-Parent Households |
| No Children | 367 (2.5%) | 204 (8.0%) |
| 1 or 2 Children | 168 (2.7%) | 1,468 (35.0%) |
| 3 or 4 Children | 181 (8.1%) | 522 (45.5%) |
| 5 or more Children | 0 (0.0%) | 50 (67.6%) |
| Total | 716 (3.1%) | 2,244 (28.2%) |
Race in Black Hawk County
The most populous races in Black Hawk County are White / Caucasian (106,818 | 81.5%), Black / African American (12,800 | 9.8%), and Hispanic or Latino (6,217 | 4.7%).
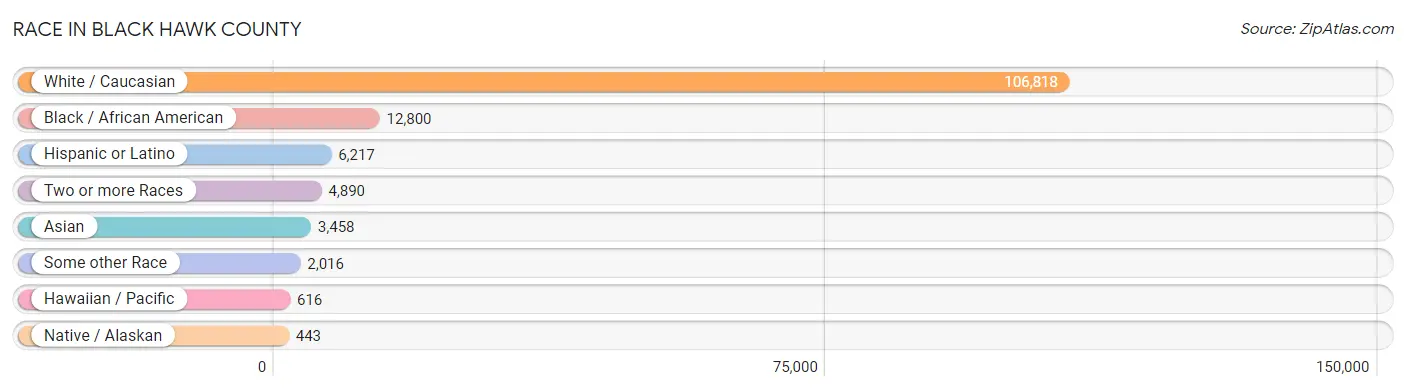
| Race | # Population | % Population |
| Asian | 3,458 | 2.6% |
| Black / African American | 12,800 | 9.8% |
| Hawaiian / Pacific | 616 | 0.5% |
| Hispanic or Latino | 6,217 | 4.7% |
| Native / Alaskan | 443 | 0.3% |
| White / Caucasian | 106,818 | 81.5% |
| Two or more Races | 4,890 | 3.7% |
| Some other Race | 2,016 | 1.5% |
| Total | 131,041 | 100.0% |
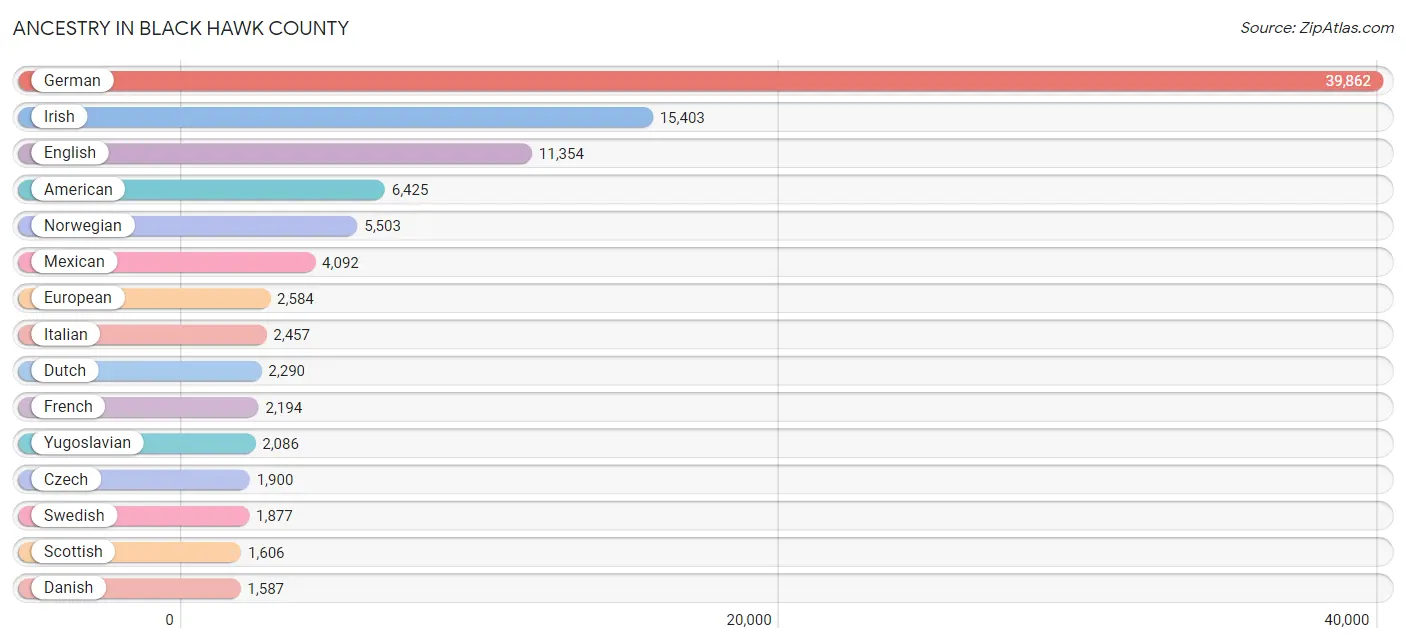
Ancestry in Black Hawk County
The most populous ancestries reported in Black Hawk County are German (39,862 | 30.4%), Irish (15,403 | 11.7%), English (11,354 | 8.7%), American (6,425 | 4.9%), and Norwegian (5,503 | 4.2%), together accounting for 59.9% of all Black Hawk County residents.
| Ancestry | # Population | % Population |
| African | 815 | 0.6% |
| Alaskan Athabascan | 10 | 0.0% |
| Albanian | 51 | 0.0% |
| American | 6,425 | 4.9% |
| Apache | 107 | 0.1% |
| Arab | 305 | 0.2% |
| Australian | 6 | 0.0% |
| Austrian | 175 | 0.1% |
| Belgian | 263 | 0.2% |
| Bhutanese | 404 | 0.3% |
| Blackfeet | 13 | 0.0% |
| Brazilian | 37 | 0.0% |
| British | 399 | 0.3% |
| Bulgarian | 83 | 0.1% |
| Burmese | 522 | 0.4% |
| Cajun | 12 | 0.0% |
| Cambodian | 8 | 0.0% |
| Canadian | 98 | 0.1% |
| Celtic | 14 | 0.0% |
| Central American | 907 | 0.7% |
| Central American Indian | 45 | 0.0% |
| Cherokee | 362 | 0.3% |
| Chilean | 6 | 0.0% |
| Chippewa | 13 | 0.0% |
| Choctaw | 15 | 0.0% |
| Colombian | 80 | 0.1% |
| Costa Rican | 10 | 0.0% |
| Croatian | 125 | 0.1% |
| Cuban | 105 | 0.1% |
| Czech | 1,900 | 1.5% |
| Czechoslovakian | 197 | 0.2% |
| Danish | 1,587 | 1.2% |
| Dominican | 125 | 0.1% |
| Dutch | 2,290 | 1.8% |
| Eastern European | 224 | 0.2% |
| English | 11,354 | 8.7% |
| Ethiopian | 12 | 0.0% |
| European | 2,584 | 2.0% |
| Fijian | 187 | 0.1% |
| Filipino | 46 | 0.0% |
| Finnish | 106 | 0.1% |
| French | 2,194 | 1.7% |
| French American Indian | 3 | 0.0% |
| French Canadian | 327 | 0.3% |
| German | 39,862 | 30.4% |
| German Russian | 5 | 0.0% |
| Ghanaian | 27 | 0.0% |
| Greek | 201 | 0.2% |
| Guamanian / Chamorro | 56 | 0.0% |
| Guatemalan | 407 | 0.3% |
| Guyanese | 9 | 0.0% |
| Haitian | 199 | 0.2% |
| Honduran | 55 | 0.0% |
| Hungarian | 115 | 0.1% |
| Indian (Asian) | 350 | 0.3% |
| Indonesian | 725 | 0.5% |
| Inupiat | 149 | 0.1% |
| Iranian | 199 | 0.2% |
| Irish | 15,403 | 11.7% |
| Iroquois | 1 | 0.0% |
| Italian | 2,457 | 1.9% |
| Jamaican | 147 | 0.1% |
| Japanese | 21 | 0.0% |
| Korean | 299 | 0.2% |
| Lebanese | 166 | 0.1% |
| Liberian | 254 | 0.2% |
| Lithuanian | 25 | 0.0% |
| Luxembourger | 162 | 0.1% |
| Malaysian | 156 | 0.1% |
| Mexican | 4,092 | 3.1% |
| Mexican American Indian | 243 | 0.2% |
| Moroccan | 103 | 0.1% |
| Native Hawaiian | 49 | 0.0% |
| Navajo | 22 | 0.0% |
| Nigerian | 2 | 0.0% |
| Northern European | 365 | 0.3% |
| Norwegian | 5,503 | 4.2% |
| Paiute | 6 | 0.0% |
| Pakistani | 354 | 0.3% |
| Panamanian | 170 | 0.1% |
| Pennsylvania German | 69 | 0.1% |
| Peruvian | 129 | 0.1% |
| Polish | 1,042 | 0.8% |
| Portuguese | 15 | 0.0% |
| Puerto Rican | 552 | 0.4% |
| Puget Sound Salish | 7 | 0.0% |
| Romanian | 15 | 0.0% |
| Russian | 178 | 0.1% |
| Salvadoran | 265 | 0.2% |
| Samoan | 20 | 0.0% |
| Scandinavian | 698 | 0.5% |
| Scotch-Irish | 933 | 0.7% |
| Scottish | 1,606 | 1.2% |
| Seminole | 20 | 0.0% |
| Serbian | 122 | 0.1% |
| Sioux | 81 | 0.1% |
| Slavic | 92 | 0.1% |
| Slovak | 58 | 0.0% |
| Slovene | 5 | 0.0% |
| Somali | 15 | 0.0% |
| South African | 46 | 0.0% |
| South American | 298 | 0.2% |
| Spaniard | 24 | 0.0% |
| Spanish | 56 | 0.0% |
| Sri Lankan | 287 | 0.2% |
| Subsaharan African | 1,493 | 1.1% |
| Sudanese | 21 | 0.0% |
| Swedish | 1,877 | 1.4% |
| Swiss | 655 | 0.5% |
| Thai | 626 | 0.5% |
| Trinidadian and Tobagonian | 22 | 0.0% |
| Turkish | 14 | 0.0% |
| Ukrainian | 19 | 0.0% |
| Venezuelan | 83 | 0.1% |
| Vietnamese | 12 | 0.0% |
| Welsh | 663 | 0.5% |
| Yaqui | 7 | 0.0% |
| Yugoslavian | 2,086 | 1.6% | View All 118 Rows |
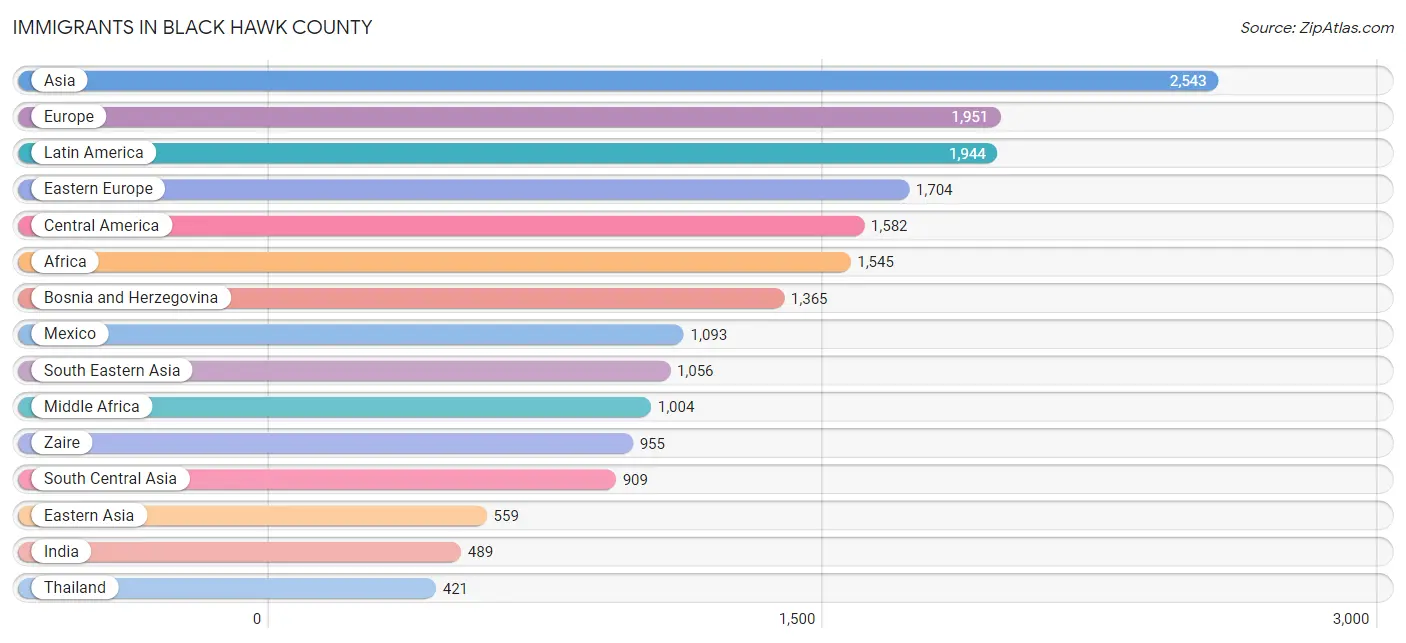
Immigrants in Black Hawk County
The most numerous immigrant groups reported in Black Hawk County came from Asia (2,543 | 1.9%), Europe (1,951 | 1.5%), Latin America (1,944 | 1.5%), Eastern Europe (1,704 | 1.3%), and Central America (1,582 | 1.2%), together accounting for 7.4% of all Black Hawk County residents.
| Immigration Origin | # Population | % Population |
| Africa | 1,545 | 1.2% |
| Albania | 7 | 0.0% |
| Argentina | 11 | 0.0% |
| Asia | 2,543 | 1.9% |
| Austria | 9 | 0.0% |
| Bangladesh | 12 | 0.0% |
| Belgium | 14 | 0.0% |
| Bosnia and Herzegovina | 1,365 | 1.0% |
| Brazil | 40 | 0.0% |
| Bulgaria | 33 | 0.0% |
| Cambodia | 5 | 0.0% |
| Canada | 121 | 0.1% |
| Caribbean | 171 | 0.1% |
| Central America | 1,582 | 1.2% |
| Chile | 6 | 0.0% |
| China | 246 | 0.2% |
| Colombia | 74 | 0.1% |
| Congo | 49 | 0.0% |
| Costa Rica | 10 | 0.0% |
| Croatia | 62 | 0.1% |
| Denmark | 20 | 0.0% |
| Dominican Republic | 4 | 0.0% |
| Eastern Africa | 48 | 0.0% |
| Eastern Asia | 559 | 0.4% |
| Eastern Europe | 1,704 | 1.3% |
| Egypt | 16 | 0.0% |
| El Salvador | 148 | 0.1% |
| England | 17 | 0.0% |
| Eritrea | 1 | 0.0% |
| Ethiopia | 11 | 0.0% |
| Europe | 1,951 | 1.5% |
| Germany | 61 | 0.1% |
| Ghana | 5 | 0.0% |
| Greece | 6 | 0.0% |
| Guatemala | 112 | 0.1% |
| Guyana | 9 | 0.0% |
| Haiti | 155 | 0.1% |
| Honduras | 49 | 0.0% |
| India | 489 | 0.4% |
| Iran | 53 | 0.0% |
| Italy | 7 | 0.0% |
| Jamaica | 12 | 0.0% |
| Japan | 62 | 0.1% |
| Kenya | 12 | 0.0% |
| Korea | 243 | 0.2% |
| Laos | 5 | 0.0% |
| Latin America | 1,944 | 1.5% |
| Lebanon | 2 | 0.0% |
| Liberia | 279 | 0.2% |
| Malaysia | 24 | 0.0% |
| Mexico | 1,093 | 0.8% |
| Micronesia | 270 | 0.2% |
| Middle Africa | 1,004 | 0.8% |
| Morocco | 61 | 0.1% |
| Netherlands | 3 | 0.0% |
| Northern Africa | 77 | 0.1% |
| Northern Europe | 147 | 0.1% |
| Norway | 11 | 0.0% |
| Oceania | 337 | 0.3% |
| Pakistan | 355 | 0.3% |
| Panama | 170 | 0.1% |
| Peru | 51 | 0.0% |
| Philippines | 60 | 0.1% |
| Poland | 22 | 0.0% |
| Russia | 88 | 0.1% |
| Serbia | 58 | 0.0% |
| Singapore | 10 | 0.0% |
| Somalia | 15 | 0.0% |
| South Africa | 46 | 0.0% |
| South America | 191 | 0.2% |
| South Central Asia | 909 | 0.7% |
| South Eastern Asia | 1,056 | 0.8% |
| Southern Europe | 13 | 0.0% |
| Sweden | 73 | 0.1% |
| Taiwan | 59 | 0.1% |
| Thailand | 421 | 0.3% |
| Turkey | 9 | 0.0% |
| Vietnam | 123 | 0.1% |
| Western Africa | 284 | 0.2% |
| Western Asia | 19 | 0.0% |
| Western Europe | 87 | 0.1% |
| Zaire | 955 | 0.7% | View All 82 Rows |
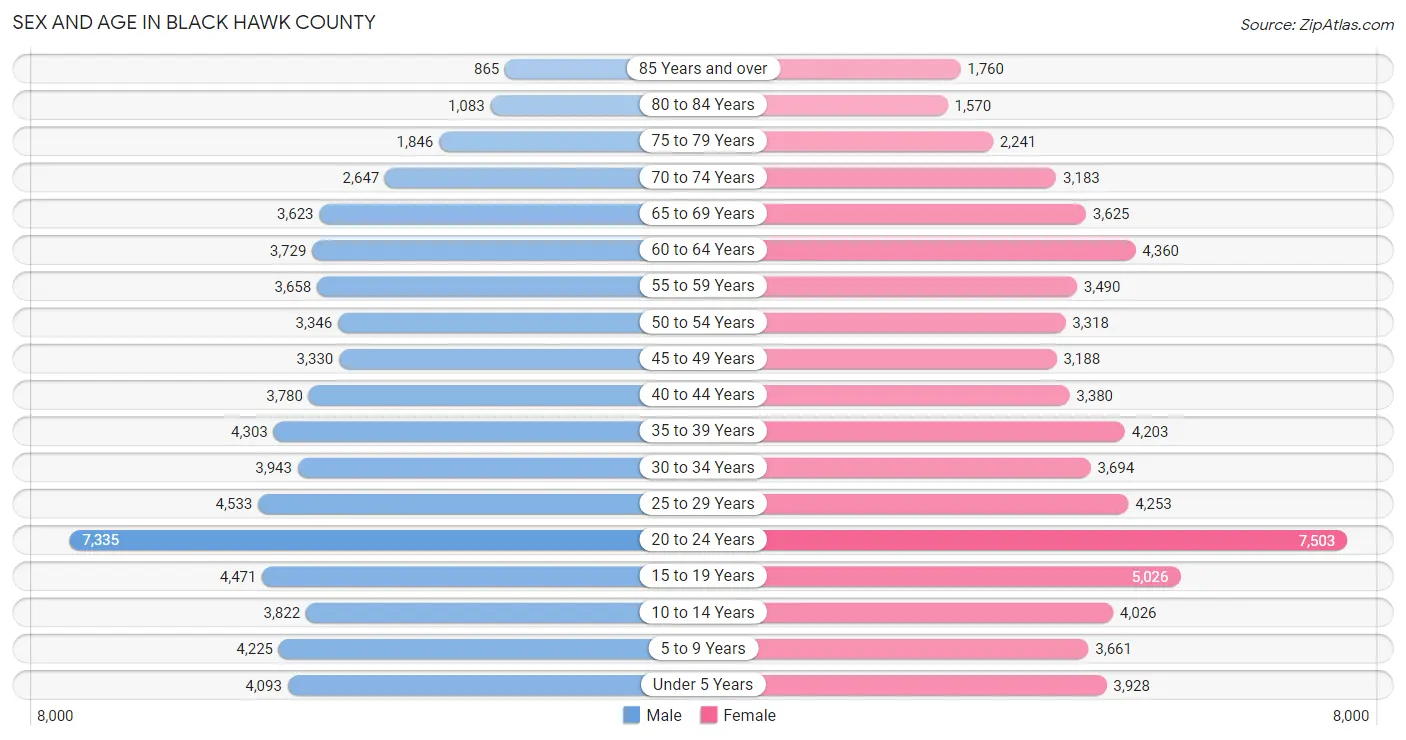
Sex and Age in Black Hawk County
Sex and Age in Black Hawk County
The most populous age groups in Black Hawk County are 20 to 24 Years (7,335 | 11.4%) for men and 20 to 24 Years (7,503 | 11.3%) for women.
| Age Bracket | Male | Female |
| Under 5 Years | 4,093 (6.3%) | 3,928 (5.9%) |
| 5 to 9 Years | 4,225 (6.5%) | 3,661 (5.5%) |
| 10 to 14 Years | 3,822 (5.9%) | 4,026 (6.1%) |
| 15 to 19 Years | 4,471 (6.9%) | 5,026 (7.6%) |
| 20 to 24 Years | 7,335 (11.4%) | 7,503 (11.3%) |
| 25 to 29 Years | 4,533 (7.0%) | 4,253 (6.4%) |
| 30 to 34 Years | 3,943 (6.1%) | 3,694 (5.6%) |
| 35 to 39 Years | 4,303 (6.7%) | 4,203 (6.3%) |
| 40 to 44 Years | 3,780 (5.9%) | 3,380 (5.1%) |
| 45 to 49 Years | 3,330 (5.1%) | 3,188 (4.8%) |
| 50 to 54 Years | 3,346 (5.2%) | 3,318 (5.0%) |
| 55 to 59 Years | 3,658 (5.7%) | 3,490 (5.3%) |
| 60 to 64 Years | 3,729 (5.8%) | 4,360 (6.6%) |
| 65 to 69 Years | 3,623 (5.6%) | 3,625 (5.5%) |
| 70 to 74 Years | 2,647 (4.1%) | 3,183 (4.8%) |
| 75 to 79 Years | 1,846 (2.9%) | 2,241 (3.4%) |
| 80 to 84 Years | 1,083 (1.7%) | 1,570 (2.4%) |
| 85 Years and over | 865 (1.3%) | 1,760 (2.6%) |
| Total | 64,632 (100.0%) | 66,409 (100.0%) |
Families and Households in Black Hawk County
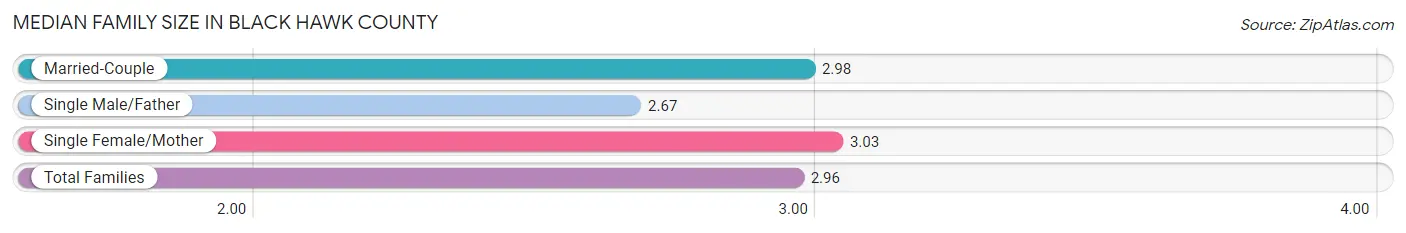
Median Family Size in Black Hawk County
The median family size in Black Hawk County is 2.96 persons per family, with single female/mother families (5,526 | 17.7%) accounting for the largest median family size of 3.03 persons per family. On the other hand, single male/father families (2,429 | 7.8%) represent the smallest median family size with 2.67 persons per family.
| Family Type | # Families | Family Size |
| Married-Couple | 23,323 (74.6%) | 2.98 |
| Single Male/Father | 2,429 (7.8%) | 2.67 |
| Single Female/Mother | 5,526 (17.7%) | 3.03 |
| Total Families | 31,278 (100.0%) | 2.96 |
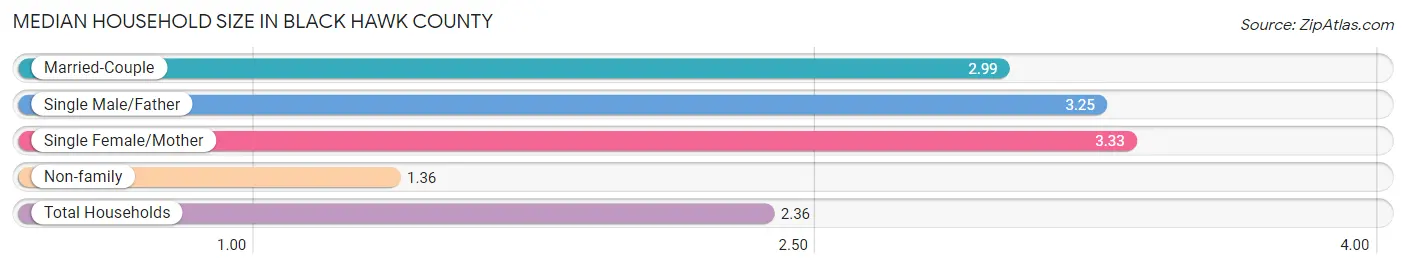
Median Household Size in Black Hawk County
The median household size in Black Hawk County is 2.36 persons per household, with single female/mother households (5,526 | 10.3%) accounting for the largest median household size of 3.33 persons per household. non-family households (22,413 | 41.7%) represent the smallest median household size with 1.36 persons per household.
| Household Type | # Households | Household Size |
| Married-Couple | 23,323 (43.4%) | 2.99 |
| Single Male/Father | 2,429 (4.5%) | 3.25 |
| Single Female/Mother | 5,526 (10.3%) | 3.33 |
| Non-family | 22,413 (41.7%) | 1.36 |
| Total Households | 53,691 (100.0%) | 2.36 |
Household Size by Marriage Status in Black Hawk County
Out of a total of 53,691 households in Black Hawk County, 31,278 (58.3%) are family households, while 22,413 (41.7%) are nonfamily households. The most numerous type of family households are 2-person households, comprising 15,065, and the most common type of nonfamily households are 1-person households, comprising 17,202.
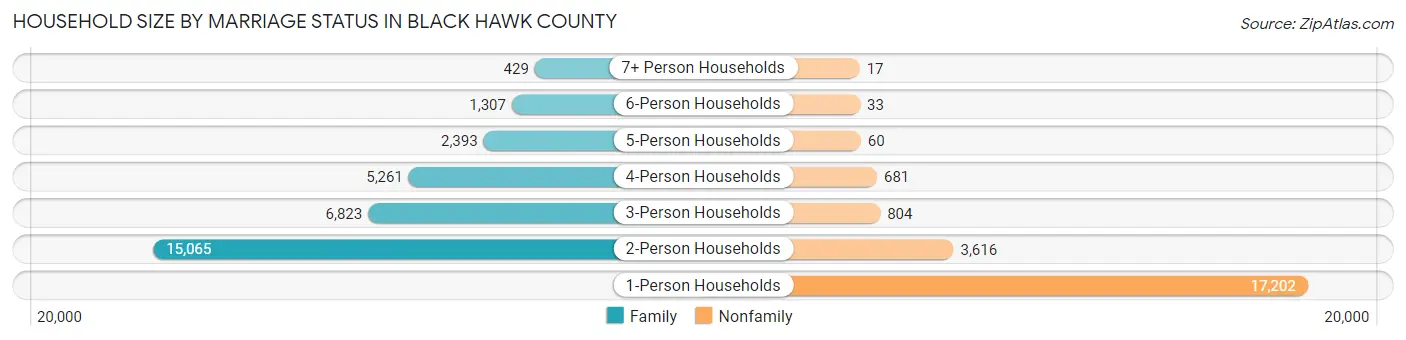
| Household Size | Family Households | Nonfamily Households |
| 1-Person Households | - | 17,202 (32.0%) |
| 2-Person Households | 15,065 (28.1%) | 3,616 (6.7%) |
| 3-Person Households | 6,823 (12.7%) | 804 (1.5%) |
| 4-Person Households | 5,261 (9.8%) | 681 (1.3%) |
| 5-Person Households | 2,393 (4.5%) | 60 (0.1%) |
| 6-Person Households | 1,307 (2.4%) | 33 (0.1%) |
| 7+ Person Households | 429 (0.8%) | 17 (0.0%) |
| Total | 31,278 (58.3%) | 22,413 (41.7%) |
Female Fertility in Black Hawk County
Fertility by Age in Black Hawk County
Average fertility rate in Black Hawk County is 62.0 births per 1,000 women. Women in the age bracket of 20 to 34 years have the highest fertility rate with 100.0 births per 1,000 women. Women in the age bracket of 20 to 34 years acount for 77.9% of all women with births.
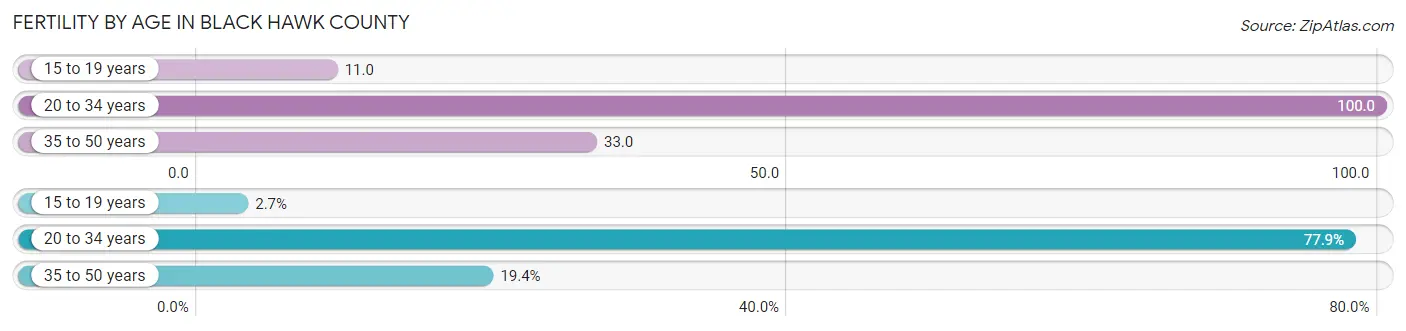
| Age Bracket | Women with Births | Births / 1,000 Women |
| 15 to 19 years | 54 (2.7%) | 11.0 |
| 20 to 34 years | 1,540 (77.9%) | 100.0 |
| 35 to 50 years | 383 (19.4%) | 33.0 |
| Total | 1,977 (100.0%) | 62.0 |
Fertility by Age by Marriage Status in Black Hawk County
60.3% of women with births (1,977) in Black Hawk County are married. The highest percentage of unmarried women with births falls into 15 to 19 years age bracket with 85.2% of them unmarried at the time of birth, while the lowest percentage of unmarried women with births belong to 35 to 50 years age bracket with 26.6% of them unmarried.
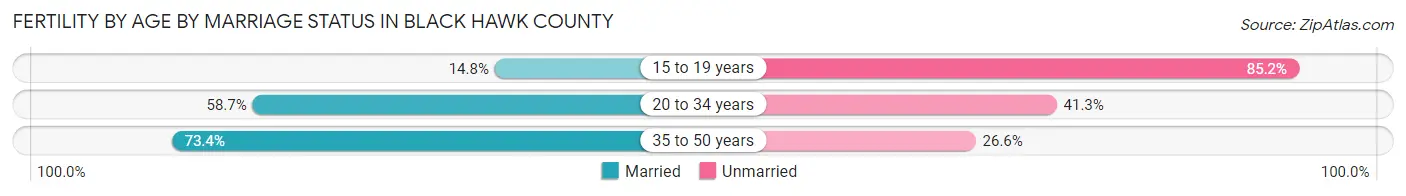
| Age Bracket | Married | Unmarried |
| 15 to 19 years | 8 (14.8%) | 46 (85.2%) |
| 20 to 34 years | 904 (58.7%) | 636 (41.3%) |
| 35 to 50 years | 281 (73.4%) | 102 (26.6%) |
| Total | 1,192 (60.3%) | 785 (39.7%) |
Fertility by Education in Black Hawk County
Average fertility rate in Black Hawk County is 62.0 births per 1,000 women. Women with the education attainment of bachelor's degree have the highest fertility rate of 95.0 births per 1,000 women, while women with the education attainment of college or associate's degree have the lowest fertility at 32.0 births per 1,000 women. Women with the education attainment of bachelor's degree represent 28.1% of all women with births.
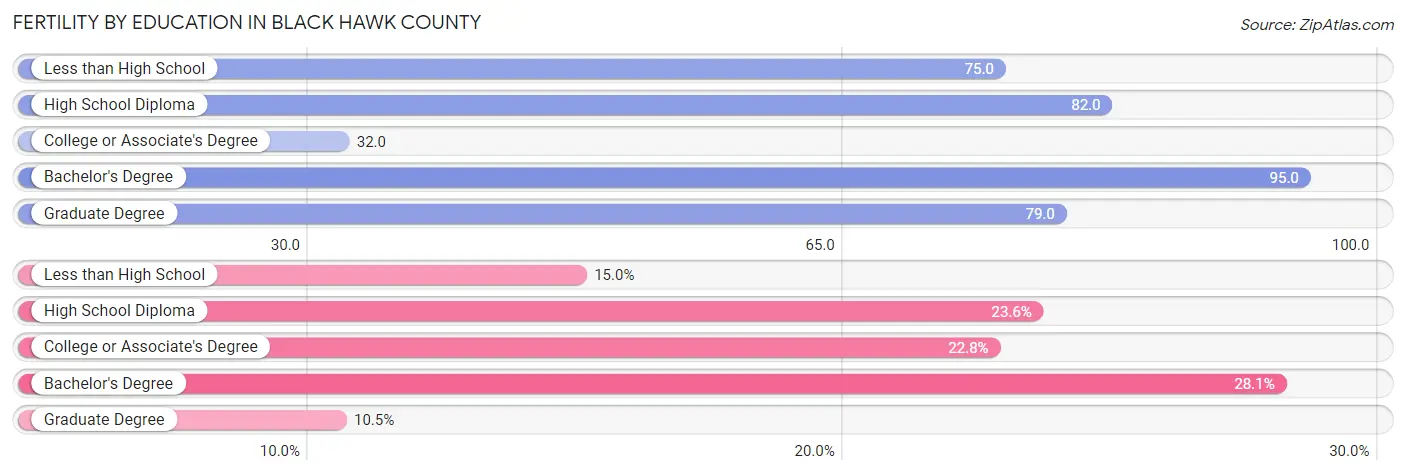
| Educational Attainment | Women with Births | Births / 1,000 Women |
| Less than High School | 297 (15.0%) | 75.0 |
| High School Diploma | 466 (23.6%) | 82.0 |
| College or Associate's Degree | 450 (22.8%) | 32.0 |
| Bachelor's Degree | 556 (28.1%) | 95.0 |
| Graduate Degree | 208 (10.5%) | 79.0 |
| Total | 1,977 (100.0%) | 62.0 |
Fertility by Education by Marriage Status in Black Hawk County
39.7% of women with births in Black Hawk County are unmarried. Women with the educational attainment of graduate degree are most likely to be married with 100.0% of them married at childbirth, while women with the educational attainment of high school diploma are least likely to be married with 76.0% of them unmarried at childbirth.
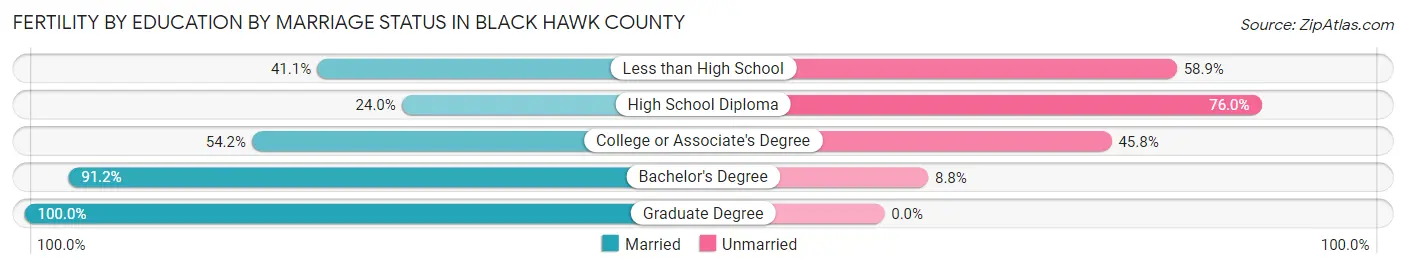
| Educational Attainment | Married | Unmarried |
| Less than High School | 122 (41.1%) | 175 (58.9%) |
| High School Diploma | 112 (24.0%) | 354 (76.0%) |
| College or Associate's Degree | 244 (54.2%) | 206 (45.8%) |
| Bachelor's Degree | 507 (91.2%) | 49 (8.8%) |
| Graduate Degree | 208 (100.0%) | 0 (0.0%) |
| Total | 1,192 (60.3%) | 785 (39.7%) |
Employment Characteristics in Black Hawk County
Employment by Class of Employer in Black Hawk County
Among the 65,260 employed individuals in Black Hawk County, private company employees (44,983 | 68.9%), not-for-profit organizations (6,499 | 10.0%), and local government employees (4,180 | 6.4%) make up the most common classes of employment.
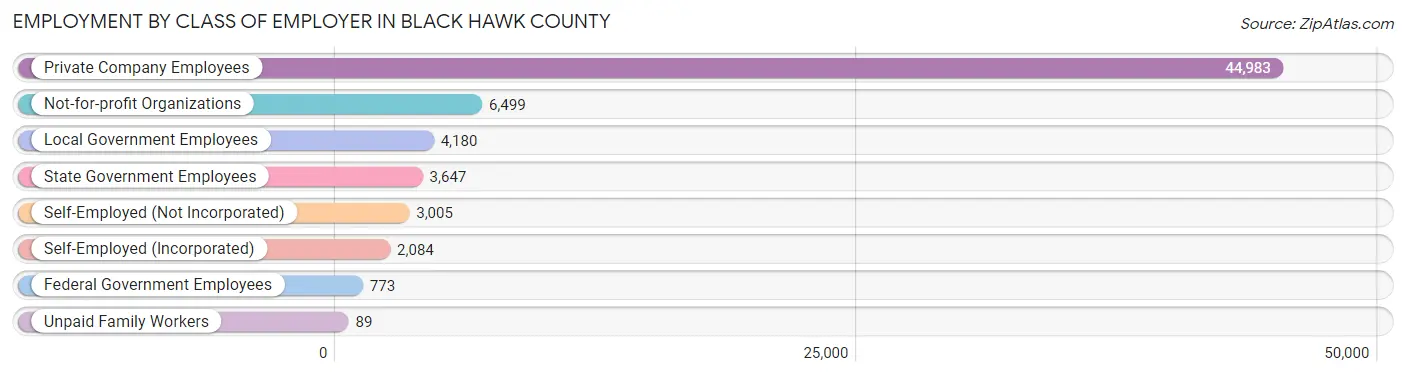
| Employer Class | # Employees | % Employees |
| Private Company Employees | 44,983 | 68.9% |
| Self-Employed (Incorporated) | 2,084 | 3.2% |
| Self-Employed (Not Incorporated) | 3,005 | 4.6% |
| Not-for-profit Organizations | 6,499 | 10.0% |
| Local Government Employees | 4,180 | 6.4% |
| State Government Employees | 3,647 | 5.6% |
| Federal Government Employees | 773 | 1.2% |
| Unpaid Family Workers | 89 | 0.1% |
| Total | 65,260 | 100.0% |
Employment Status by Age in Black Hawk County
According to the labor force statistics for Black Hawk County, out of the total population over 16 years of age (105,716), 66.5% or 70,301 individuals are in the labor force, with 5.2% or 3,656 of them unemployed. The age group with the highest labor force participation rate is 25 to 29 years, with 92.2% or 8,101 individuals in the labor force. Within the labor force, the 16 to 19 years age range has the highest percentage of unemployed individuals, with 17.2% or 862 of them being unemployed.
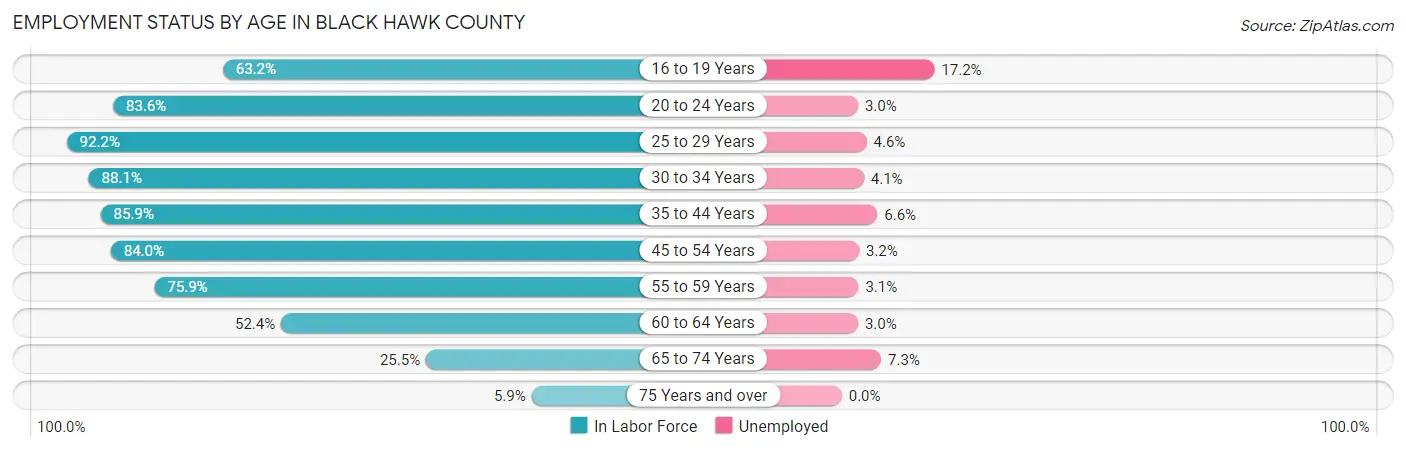
| Age Bracket | In Labor Force | Unemployed |
| 16 to 19 Years | 5,010 (63.2%) | 862 (17.2%) |
| 20 to 24 Years | 12,405 (83.6%) | 372 (3.0%) |
| 25 to 29 Years | 8,101 (92.2%) | 373 (4.6%) |
| 30 to 34 Years | 6,728 (88.1%) | 276 (4.1%) |
| 35 to 44 Years | 13,457 (85.9%) | 888 (6.6%) |
| 45 to 54 Years | 11,073 (84.0%) | 354 (3.2%) |
| 55 to 59 Years | 5,425 (75.9%) | 168 (3.1%) |
| 60 to 64 Years | 4,239 (52.4%) | 127 (3.0%) |
| 65 to 74 Years | 3,335 (25.5%) | 243 (7.3%) |
| 75 Years and over | 553 (5.9%) | 0 (0.0%) |
| Total | 70,301 (66.5%) | 3,656 (5.2%) |
Employment Status by Educational Attainment in Black Hawk County
According to labor force statistics for Black Hawk County, 81.0% of individuals (49,011) out of the total population between 25 and 64 years of age (60,508) are in the labor force, with 4.5% or 2,205 of them being unemployed. The group with the highest labor force participation rate are those with the educational attainment of bachelor's degree or higher, with 88.8% or 16,612 individuals in the labor force. Within the labor force, individuals with high school diploma education have the highest percentage of unemployment, with 8.0% or 957 of them being unemployed.
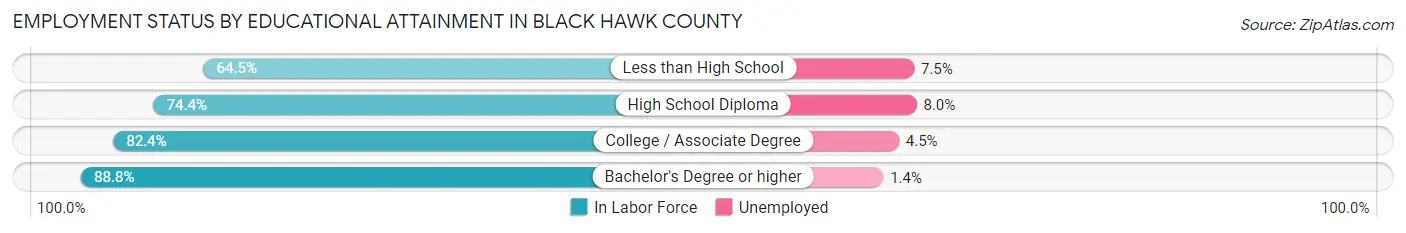
| Educational Attainment | In Labor Force | Unemployed |
| Less than High School | 2,700 (64.5%) | 314 (7.5%) |
| High School Diploma | 11,958 (74.4%) | 1,286 (8.0%) |
| College / Associate Degree | 17,751 (82.4%) | 969 (4.5%) |
| Bachelor's Degree or higher | 16,612 (88.8%) | 262 (1.4%) |
| Total | 49,011 (81.0%) | 2,723 (4.5%) |
Employment Occupations by Sex in Black Hawk County
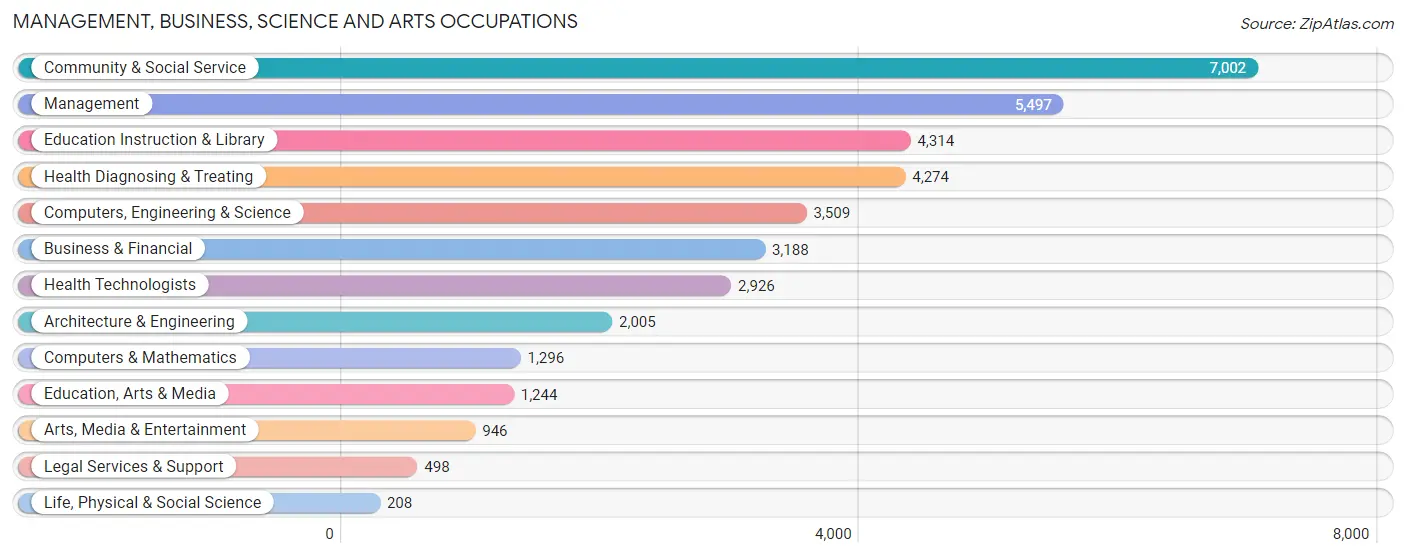
Management, Business, Science and Arts Occupations
The most common Management, Business, Science and Arts occupations in Black Hawk County are Community & Social Service (7,002 | 10.5%), Management (5,497 | 8.3%), Education Instruction & Library (4,314 | 6.5%), Health Diagnosing & Treating (4,274 | 6.4%), and Computers, Engineering & Science (3,509 | 5.3%).
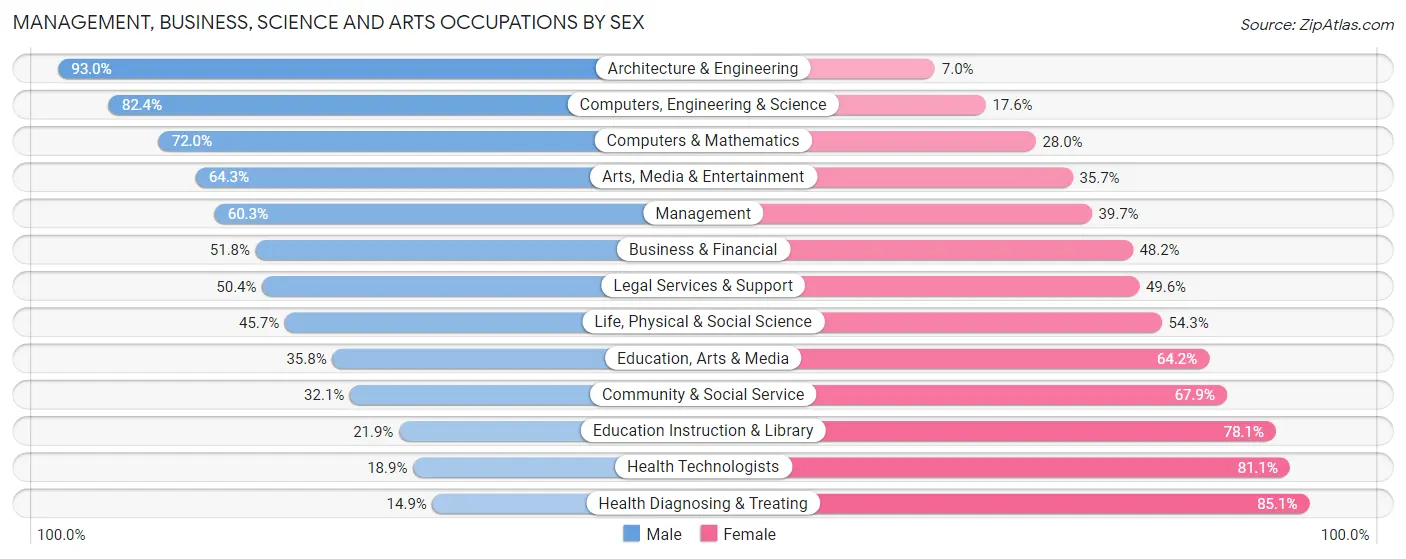
Management, Business, Science and Arts Occupations by Sex
Within the Management, Business, Science and Arts occupations in Black Hawk County, the most male-oriented occupations are Architecture & Engineering (93.0%), Computers, Engineering & Science (82.4%), and Computers & Mathematics (72.0%), while the most female-oriented occupations are Health Diagnosing & Treating (85.1%), Health Technologists (81.1%), and Education Instruction & Library (78.1%).
| Occupation | Male | Female |
| Management | 3,315 (60.3%) | 2,182 (39.7%) |
| Business & Financial | 1,650 (51.8%) | 1,538 (48.2%) |
| Computers, Engineering & Science | 2,892 (82.4%) | 617 (17.6%) |
| Computers & Mathematics | 933 (72.0%) | 363 (28.0%) |
| Architecture & Engineering | 1,864 (93.0%) | 141 (7.0%) |
| Life, Physical & Social Science | 95 (45.7%) | 113 (54.3%) |
| Community & Social Service | 2,247 (32.1%) | 4,755 (67.9%) |
| Education, Arts & Media | 445 (35.8%) | 799 (64.2%) |
| Legal Services & Support | 251 (50.4%) | 247 (49.6%) |
| Education Instruction & Library | 943 (21.9%) | 3,371 (78.1%) |
| Arts, Media & Entertainment | 608 (64.3%) | 338 (35.7%) |
| Health Diagnosing & Treating | 636 (14.9%) | 3,638 (85.1%) |
| Health Technologists | 554 (18.9%) | 2,372 (81.1%) |
| Total (Category) | 10,740 (45.8%) | 12,730 (54.2%) |
| Total (Overall) | 34,486 (51.8%) | 32,133 (48.2%) |
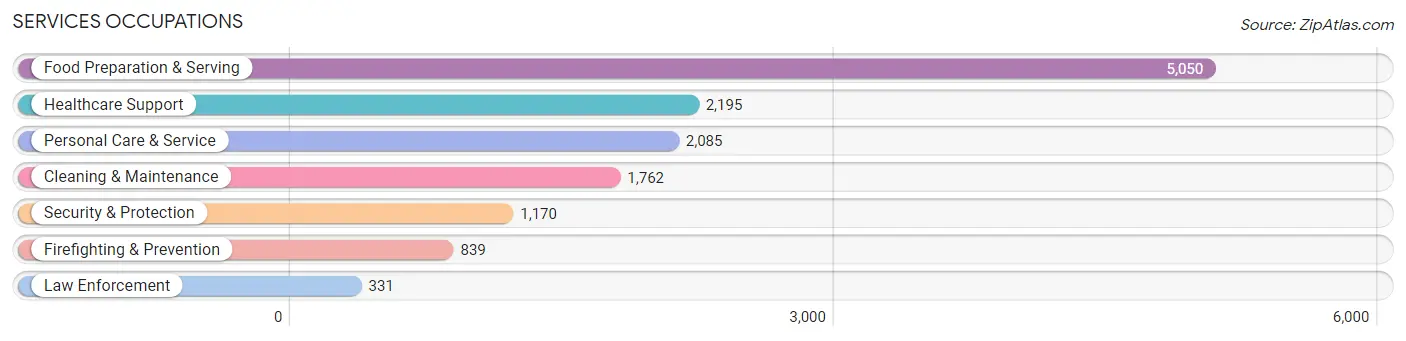
Services Occupations
The most common Services occupations in Black Hawk County are Food Preparation & Serving (5,050 | 7.6%), Healthcare Support (2,195 | 3.3%), Personal Care & Service (2,085 | 3.1%), Cleaning & Maintenance (1,762 | 2.6%), and Security & Protection (1,170 | 1.8%).
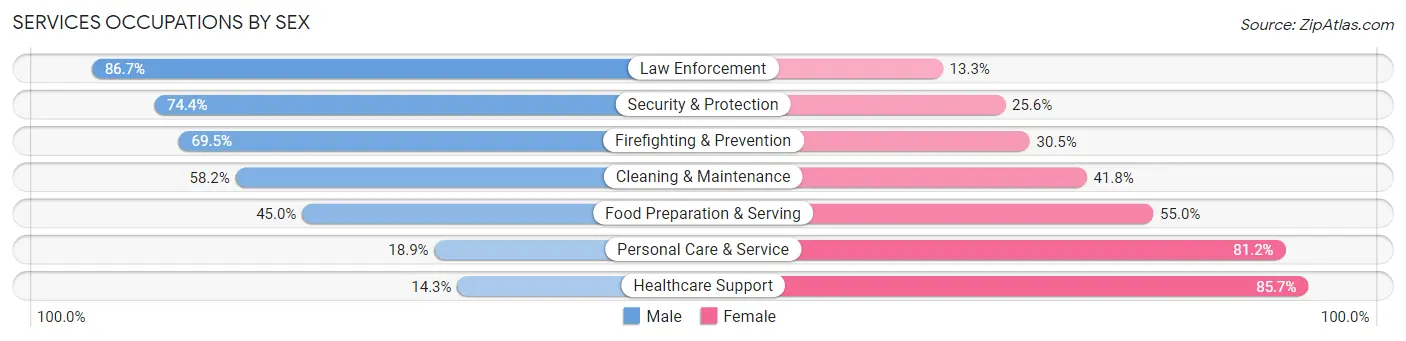
Services Occupations by Sex
Within the Services occupations in Black Hawk County, the most male-oriented occupations are Law Enforcement (86.7%), Security & Protection (74.4%), and Firefighting & Prevention (69.5%), while the most female-oriented occupations are Healthcare Support (85.7%), Personal Care & Service (81.1%), and Food Preparation & Serving (55.0%).
| Occupation | Male | Female |
| Healthcare Support | 314 (14.3%) | 1,881 (85.7%) |
| Security & Protection | 870 (74.4%) | 300 (25.6%) |
| Firefighting & Prevention | 583 (69.5%) | 256 (30.5%) |
| Law Enforcement | 287 (86.7%) | 44 (13.3%) |
| Food Preparation & Serving | 2,274 (45.0%) | 2,776 (55.0%) |
| Cleaning & Maintenance | 1,026 (58.2%) | 736 (41.8%) |
| Personal Care & Service | 393 (18.9%) | 1,692 (81.1%) |
| Total (Category) | 4,877 (39.8%) | 7,385 (60.2%) |
| Total (Overall) | 34,486 (51.8%) | 32,133 (48.2%) |
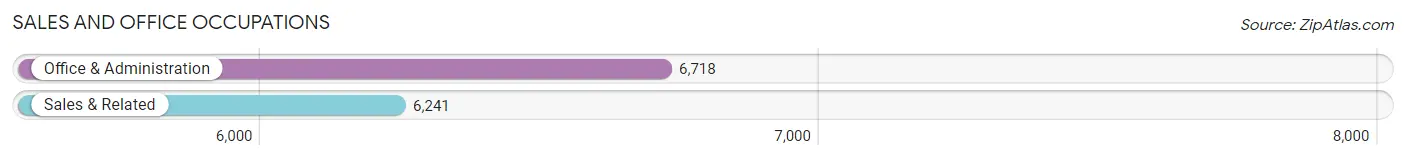
Sales and Office Occupations
The most common Sales and Office occupations in Black Hawk County are Office & Administration (6,718 | 10.1%), and Sales & Related (6,241 | 9.4%).
Sales and Office Occupations by Sex
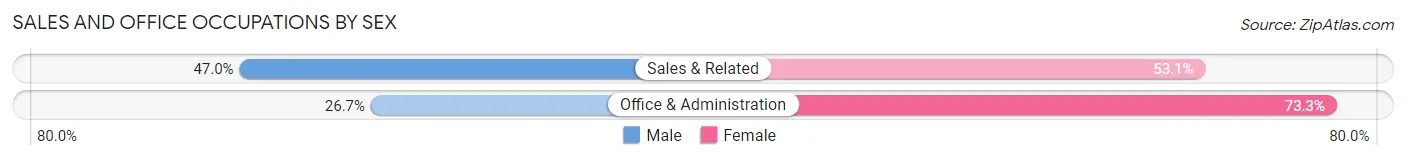
| Occupation | Male | Female |
| Sales & Related | 2,930 (46.9%) | 3,311 (53.0%) |
| Office & Administration | 1,796 (26.7%) | 4,922 (73.3%) |
| Total (Category) | 4,726 (36.5%) | 8,233 (63.5%) |
| Total (Overall) | 34,486 (51.8%) | 32,133 (48.2%) |
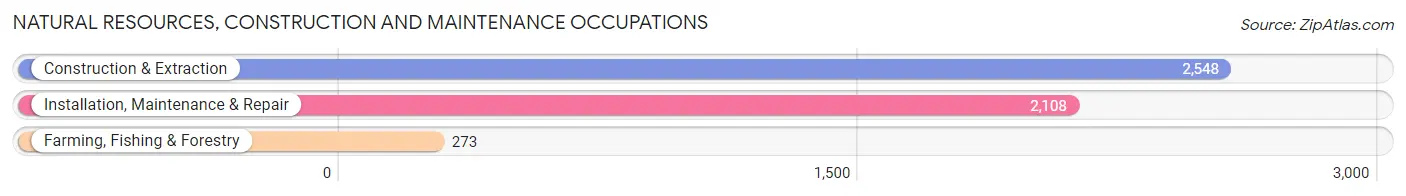
Natural Resources, Construction and Maintenance Occupations
The most common Natural Resources, Construction and Maintenance occupations in Black Hawk County are Construction & Extraction (2,548 | 3.8%), Installation, Maintenance & Repair (2,108 | 3.2%), and Farming, Fishing & Forestry (273 | 0.4%).
Natural Resources, Construction and Maintenance Occupations by Sex
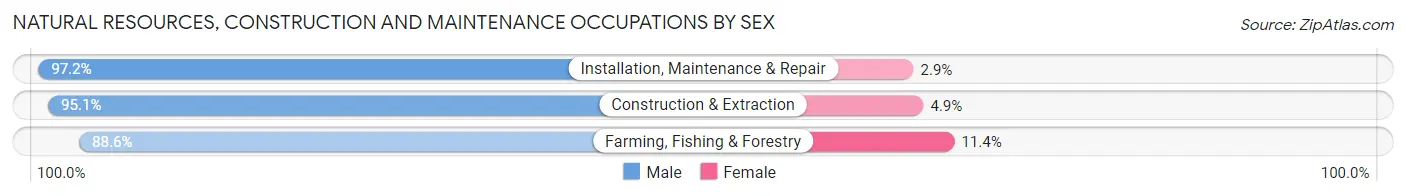
| Occupation | Male | Female |
| Farming, Fishing & Forestry | 242 (88.6%) | 31 (11.4%) |
| Construction & Extraction | 2,423 (95.1%) | 125 (4.9%) |
| Installation, Maintenance & Repair | 2,048 (97.2%) | 60 (2.9%) |
| Total (Category) | 4,713 (95.6%) | 216 (4.4%) |
| Total (Overall) | 34,486 (51.8%) | 32,133 (48.2%) |
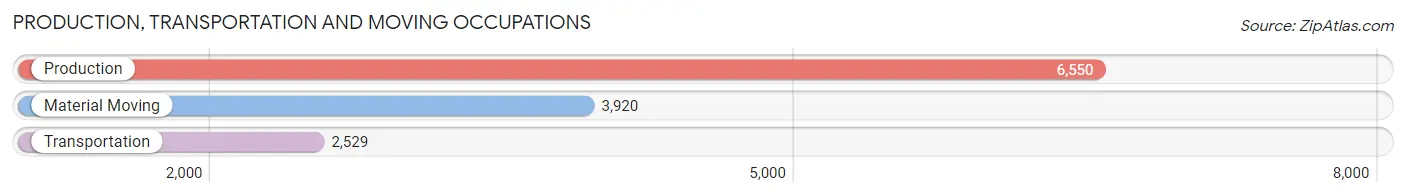
Production, Transportation and Moving Occupations
The most common Production, Transportation and Moving occupations in Black Hawk County are Production (6,550 | 9.8%), Material Moving (3,920 | 5.9%), and Transportation (2,529 | 3.8%).
Production, Transportation and Moving Occupations by Sex
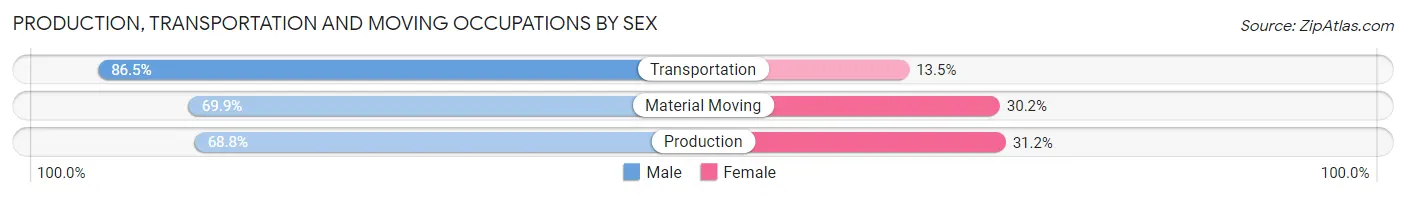
| Occupation | Male | Female |
| Production | 4,505 (68.8%) | 2,045 (31.2%) |
| Transportation | 2,187 (86.5%) | 342 (13.5%) |
| Material Moving | 2,738 (69.9%) | 1,182 (30.1%) |
| Total (Category) | 9,430 (72.5%) | 3,569 (27.5%) |
| Total (Overall) | 34,486 (51.8%) | 32,133 (48.2%) |
Employment Industries by Sex in Black Hawk County
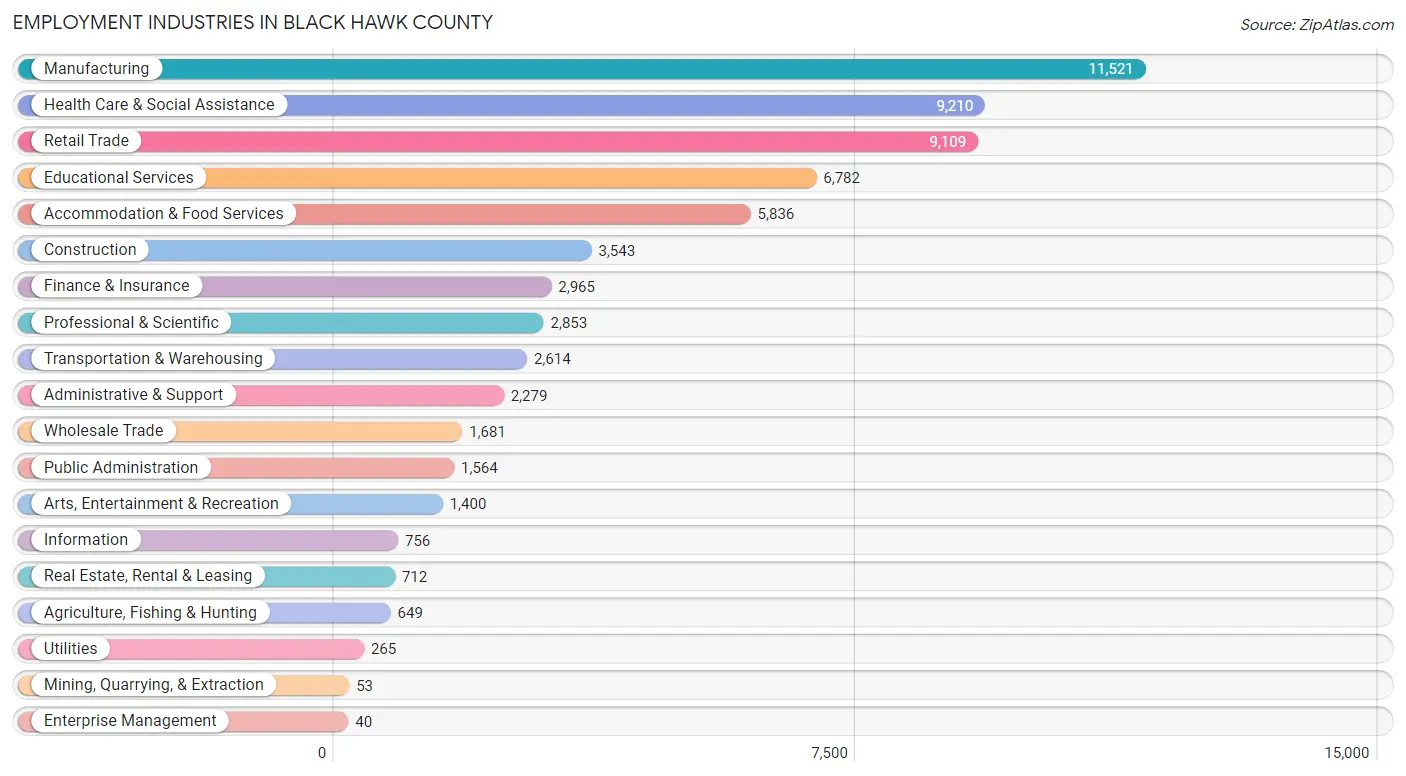
Employment Industries in Black Hawk County
The major employment industries in Black Hawk County include Manufacturing (11,521 | 17.3%), Health Care & Social Assistance (9,210 | 13.8%), Retail Trade (9,109 | 13.7%), Educational Services (6,782 | 10.2%), and Accommodation & Food Services (5,836 | 8.8%).
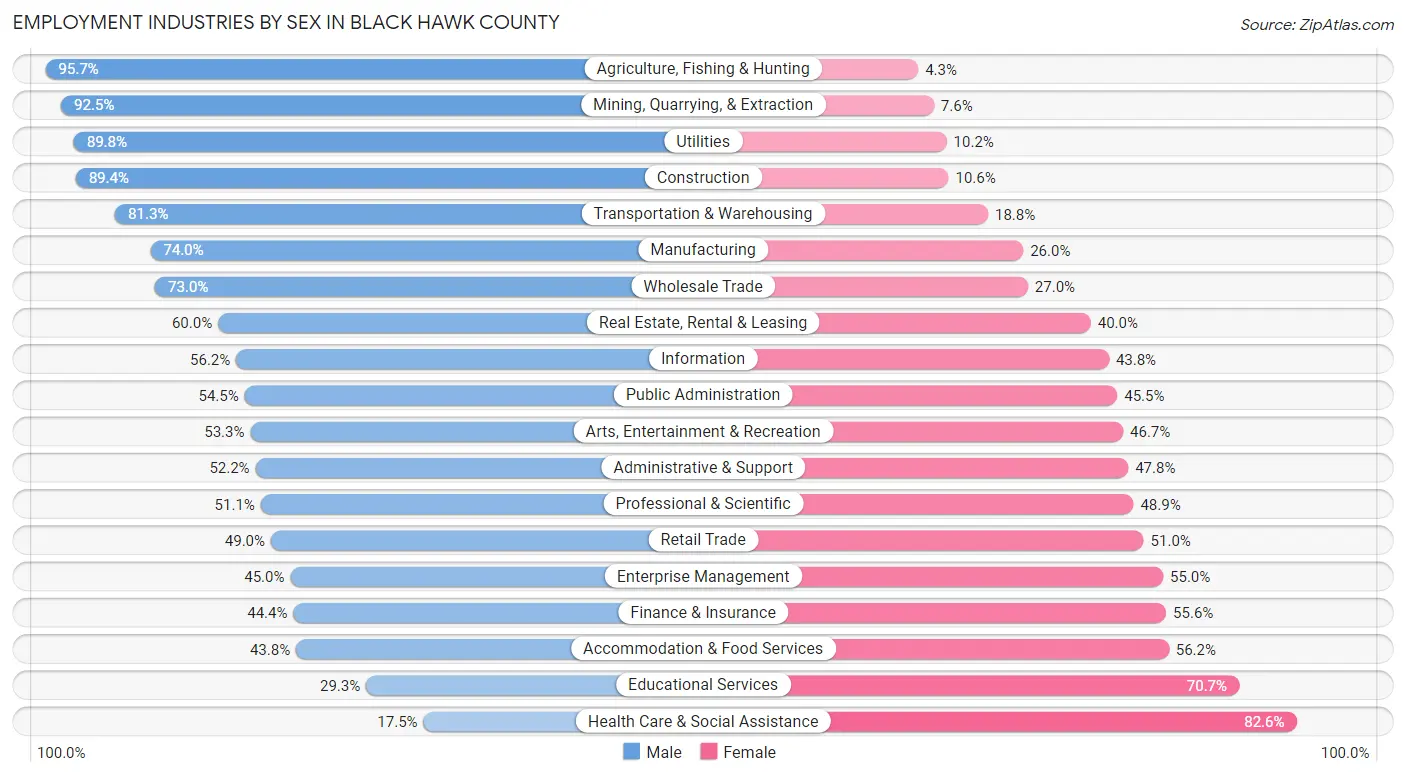
Employment Industries by Sex in Black Hawk County
The Black Hawk County industries that see more men than women are Agriculture, Fishing & Hunting (95.7%), Mining, Quarrying, & Extraction (92.4%), and Utilities (89.8%), whereas the industries that tend to have a higher number of women are Health Care & Social Assistance (82.6%), Educational Services (70.7%), and Accommodation & Food Services (56.2%).
| Industry | Male | Female |
| Agriculture, Fishing & Hunting | 621 (95.7%) | 28 (4.3%) |
| Mining, Quarrying, & Extraction | 49 (92.4%) | 4 (7.5%) |
| Construction | 3,168 (89.4%) | 375 (10.6%) |
| Manufacturing | 8,521 (74.0%) | 3,000 (26.0%) |
| Wholesale Trade | 1,227 (73.0%) | 454 (27.0%) |
| Retail Trade | 4,466 (49.0%) | 4,643 (51.0%) |
| Transportation & Warehousing | 2,124 (81.2%) | 490 (18.8%) |
| Utilities | 238 (89.8%) | 27 (10.2%) |
| Information | 425 (56.2%) | 331 (43.8%) |
| Finance & Insurance | 1,316 (44.4%) | 1,649 (55.6%) |
| Real Estate, Rental & Leasing | 427 (60.0%) | 285 (40.0%) |
| Professional & Scientific | 1,459 (51.1%) | 1,394 (48.9%) |
| Enterprise Management | 18 (45.0%) | 22 (55.0%) |
| Administrative & Support | 1,190 (52.2%) | 1,089 (47.8%) |
| Educational Services | 1,989 (29.3%) | 4,793 (70.7%) |
| Health Care & Social Assistance | 1,607 (17.4%) | 7,603 (82.6%) |
| Arts, Entertainment & Recreation | 746 (53.3%) | 654 (46.7%) |
| Accommodation & Food Services | 2,558 (43.8%) | 3,278 (56.2%) |
| Public Administration | 852 (54.5%) | 712 (45.5%) |
| Total | 34,486 (51.8%) | 32,133 (48.2%) |
Education in Black Hawk County
School Enrollment in Black Hawk County
The most common levels of schooling among the 36,034 students in Black Hawk County are college / undergraduate (12,804 | 35.5%), middle school (6,226 | 17.3%), and elementary school (6,218 | 17.3%).
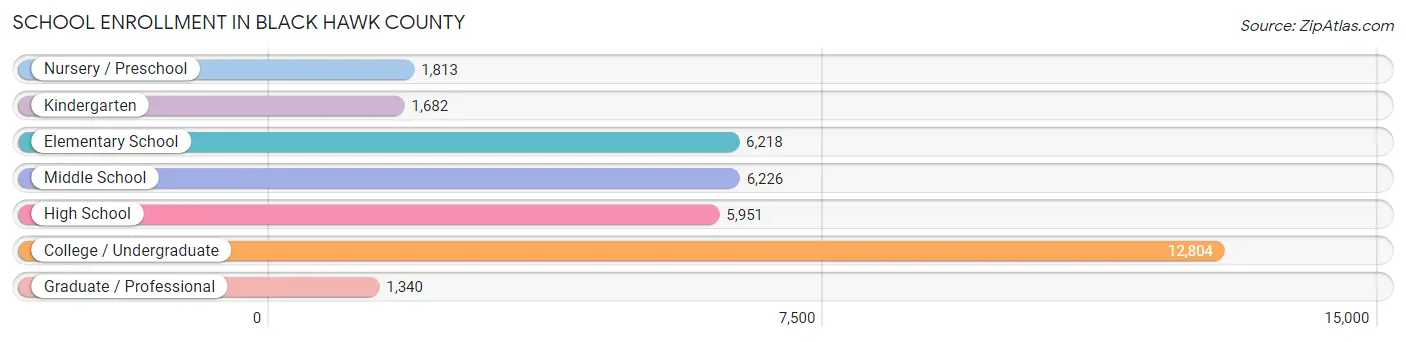
| School Level | # Students | % Students |
| Nursery / Preschool | 1,813 | 5.0% |
| Kindergarten | 1,682 | 4.7% |
| Elementary School | 6,218 | 17.3% |
| Middle School | 6,226 | 17.3% |
| High School | 5,951 | 16.5% |
| College / Undergraduate | 12,804 | 35.5% |
| Graduate / Professional | 1,340 | 3.7% |
| Total | 36,034 | 100.0% |
School Enrollment by Age by Funding Source in Black Hawk County
Out of a total of 36,034 students who are enrolled in schools in Black Hawk County, 4,000 (11.1%) attend a private institution, while the remaining 32,034 (88.9%) are enrolled in public schools. The age group of 3 to 4 year olds has the highest likelihood of being enrolled in private schools, with 612 (44.0% in the age bracket) enrolled. Conversely, the age group of 18 to 19 year olds has the lowest likelihood of being enrolled in a private school, with 3,808 (98.0% in the age bracket) attending a public institution.
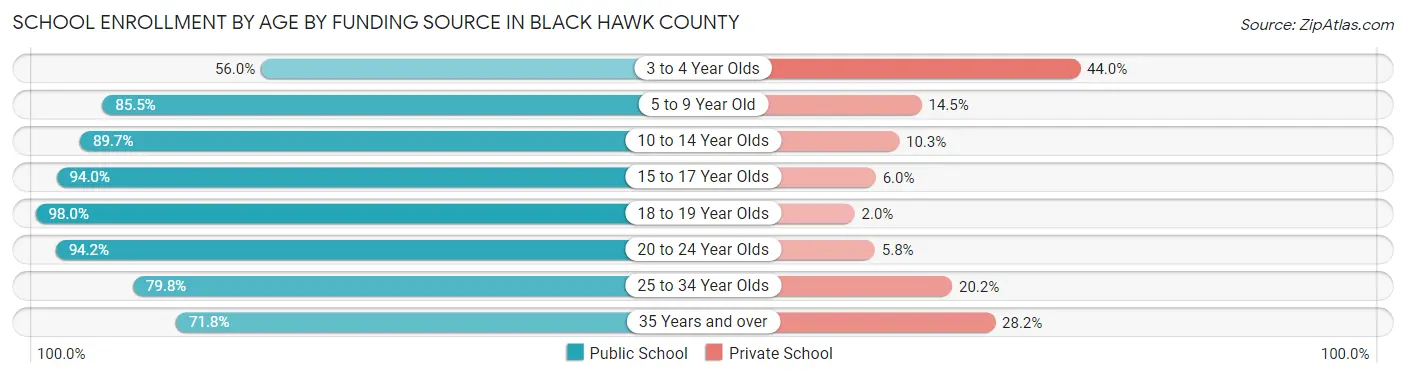
| Age Bracket | Public School | Private School |
| 3 to 4 Year Olds | 778 (56.0%) | 612 (44.0%) |
| 5 to 9 Year Old | 6,491 (85.5%) | 1,101 (14.5%) |
| 10 to 14 Year Olds | 6,931 (89.7%) | 798 (10.3%) |
| 15 to 17 Year Olds | 4,267 (94.0%) | 271 (6.0%) |
| 18 to 19 Year Olds | 3,808 (98.0%) | 79 (2.0%) |
| 20 to 24 Year Olds | 7,719 (94.2%) | 475 (5.8%) |
| 25 to 34 Year Olds | 1,131 (79.8%) | 286 (20.2%) |
| 35 Years and over | 924 (71.8%) | 363 (28.2%) |
| Total | 32,034 (88.9%) | 4,000 (11.1%) |
Educational Attainment by Field of Study in Black Hawk County
Education (4,998 | 18.3%), business (4,869 | 17.9%), science & technology (2,791 | 10.2%), arts & humanities (2,081 | 7.6%), and engineering (2,004 | 7.3%) are the most common fields of study among 27,265 individuals in Black Hawk County who have obtained a bachelor's degree or higher.
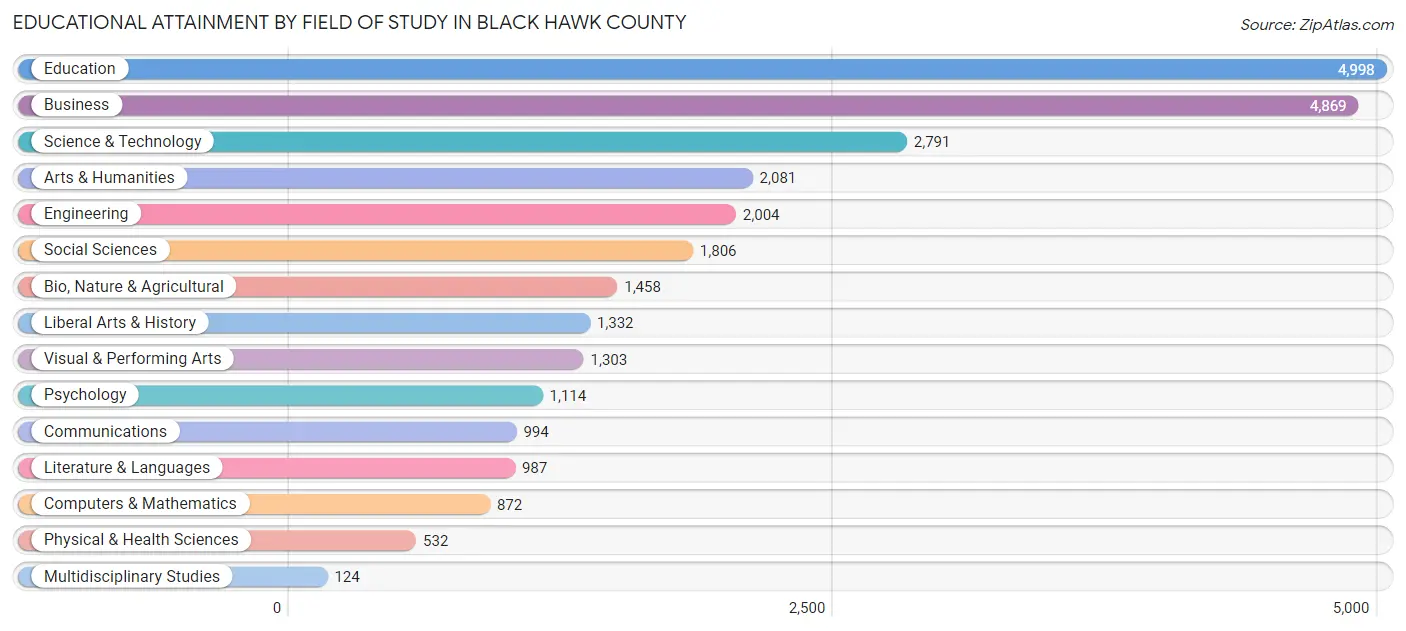
| Field of Study | # Graduates | % Graduates |
| Computers & Mathematics | 872 | 3.2% |
| Bio, Nature & Agricultural | 1,458 | 5.3% |
| Physical & Health Sciences | 532 | 1.9% |
| Psychology | 1,114 | 4.1% |
| Social Sciences | 1,806 | 6.6% |
| Engineering | 2,004 | 7.3% |
| Multidisciplinary Studies | 124 | 0.4% |
| Science & Technology | 2,791 | 10.2% |
| Business | 4,869 | 17.9% |
| Education | 4,998 | 18.3% |
| Literature & Languages | 987 | 3.6% |
| Liberal Arts & History | 1,332 | 4.9% |
| Visual & Performing Arts | 1,303 | 4.8% |
| Communications | 994 | 3.6% |
| Arts & Humanities | 2,081 | 7.6% |
| Total | 27,265 | 100.0% |
Transportation & Commute in Black Hawk County
Vehicle Availability by Sex in Black Hawk County
The most prevalent vehicle ownership categories in Black Hawk County are males with 2 vehicles (13,467, accounting for 40.1%) and females with 2 vehicles (11,332, making up 45.2%).
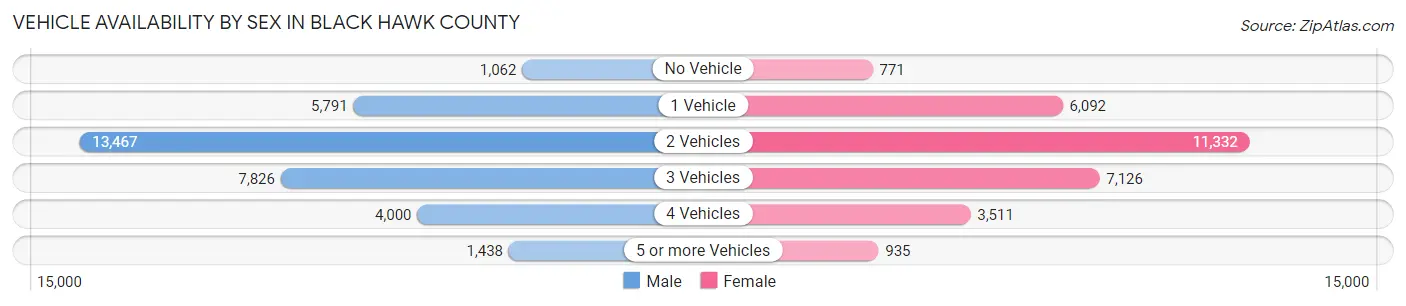
| Vehicles Available | Male | Female |
| No Vehicle | 1,062 (3.2%) | 771 (2.6%) |
| 1 Vehicle | 5,791 (17.2%) | 6,092 (20.5%) |
| 2 Vehicles | 13,467 (40.1%) | 11,332 (38.1%) |
| 3 Vehicles | 7,826 (23.3%) | 7,126 (23.9%) |
| 4 Vehicles | 4,000 (11.9%) | 3,511 (11.8%) |
| 5 or more Vehicles | 1,438 (4.3%) | 935 (3.1%) |
| Total | 33,584 (100.0%) | 29,767 (100.0%) |
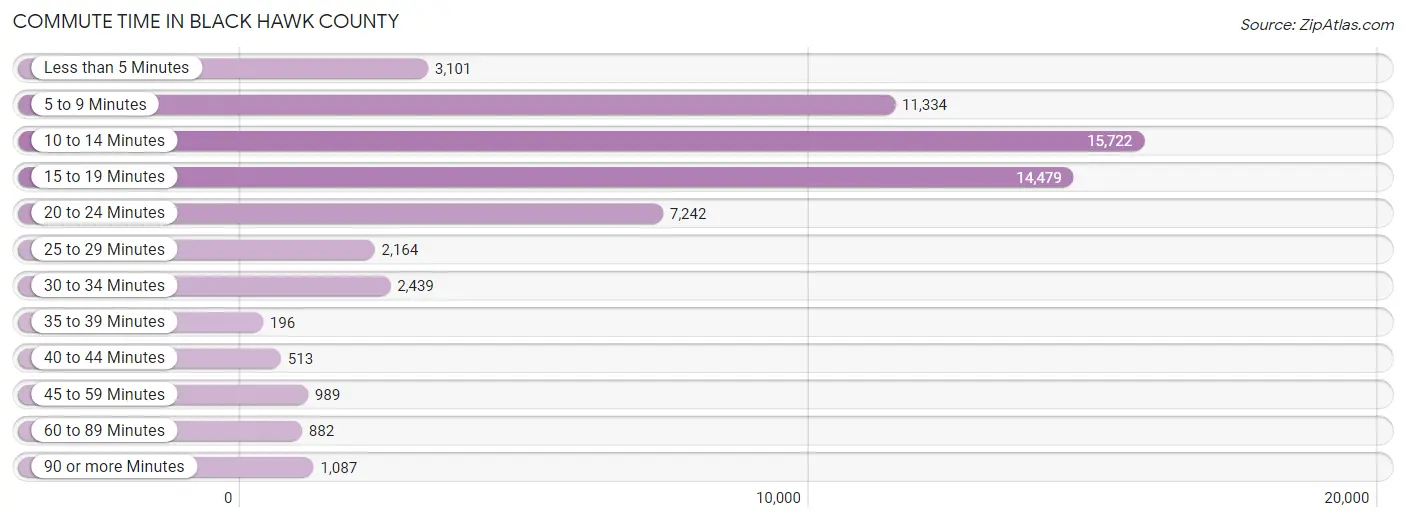
Commute Time in Black Hawk County
The most frequently occuring commute durations in Black Hawk County are 10 to 14 minutes (15,722 commuters, 26.1%), 15 to 19 minutes (14,479 commuters, 24.1%), and 5 to 9 minutes (11,334 commuters, 18.8%).
| Commute Time | # Commuters | % Commuters |
| Less than 5 Minutes | 3,101 | 5.2% |
| 5 to 9 Minutes | 11,334 | 18.8% |
| 10 to 14 Minutes | 15,722 | 26.1% |
| 15 to 19 Minutes | 14,479 | 24.1% |
| 20 to 24 Minutes | 7,242 | 12.0% |
| 25 to 29 Minutes | 2,164 | 3.6% |
| 30 to 34 Minutes | 2,439 | 4.1% |
| 35 to 39 Minutes | 196 | 0.3% |
| 40 to 44 Minutes | 513 | 0.9% |
| 45 to 59 Minutes | 989 | 1.6% |
| 60 to 89 Minutes | 882 | 1.5% |
| 90 or more Minutes | 1,087 | 1.8% |
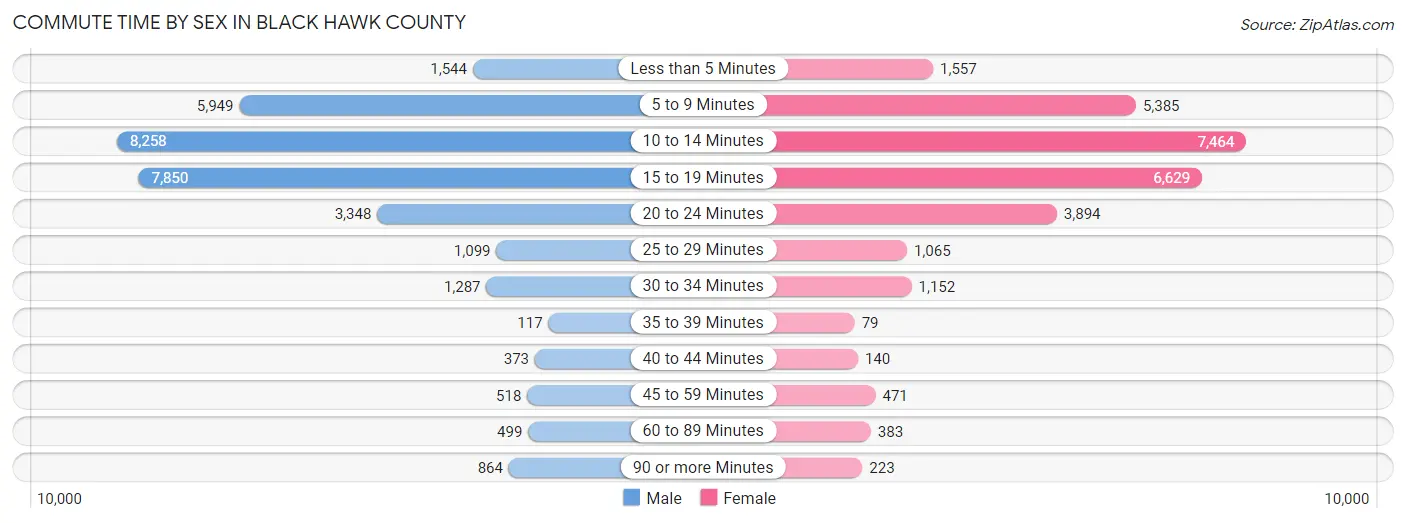
Commute Time by Sex in Black Hawk County
The most common commute times in Black Hawk County are 10 to 14 minutes (8,258 commuters, 26.1%) for males and 10 to 14 minutes (7,464 commuters, 26.2%) for females.
| Commute Time | Male | Female |
| Less than 5 Minutes | 1,544 (4.9%) | 1,557 (5.5%) |
| 5 to 9 Minutes | 5,949 (18.8%) | 5,385 (18.9%) |
| 10 to 14 Minutes | 8,258 (26.1%) | 7,464 (26.2%) |
| 15 to 19 Minutes | 7,850 (24.8%) | 6,629 (23.3%) |
| 20 to 24 Minutes | 3,348 (10.6%) | 3,894 (13.7%) |
| 25 to 29 Minutes | 1,099 (3.5%) | 1,065 (3.7%) |
| 30 to 34 Minutes | 1,287 (4.1%) | 1,152 (4.1%) |
| 35 to 39 Minutes | 117 (0.4%) | 79 (0.3%) |
| 40 to 44 Minutes | 373 (1.2%) | 140 (0.5%) |
| 45 to 59 Minutes | 518 (1.6%) | 471 (1.7%) |
| 60 to 89 Minutes | 499 (1.6%) | 383 (1.3%) |
| 90 or more Minutes | 864 (2.7%) | 223 (0.8%) |
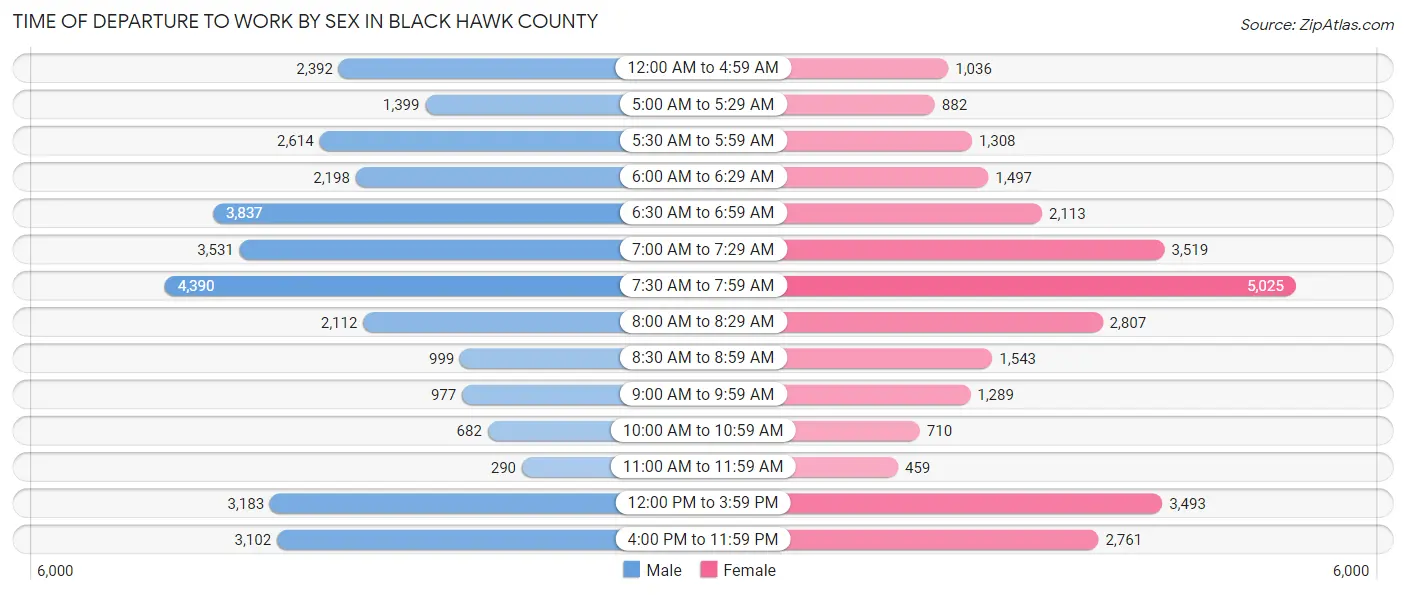
Time of Departure to Work by Sex in Black Hawk County
The most frequent times of departure to work in Black Hawk County are 7:30 AM to 7:59 AM (4,390, 13.9%) for males and 7:30 AM to 7:59 AM (5,025, 17.7%) for females.
| Time of Departure | Male | Female |
| 12:00 AM to 4:59 AM | 2,392 (7.5%) | 1,036 (3.6%) |
| 5:00 AM to 5:29 AM | 1,399 (4.4%) | 882 (3.1%) |
| 5:30 AM to 5:59 AM | 2,614 (8.2%) | 1,308 (4.6%) |
| 6:00 AM to 6:29 AM | 2,198 (6.9%) | 1,497 (5.3%) |
| 6:30 AM to 6:59 AM | 3,837 (12.1%) | 2,113 (7.4%) |
| 7:00 AM to 7:29 AM | 3,531 (11.1%) | 3,519 (12.4%) |
| 7:30 AM to 7:59 AM | 4,390 (13.9%) | 5,025 (17.7%) |
| 8:00 AM to 8:29 AM | 2,112 (6.7%) | 2,807 (9.9%) |
| 8:30 AM to 8:59 AM | 999 (3.2%) | 1,543 (5.4%) |
| 9:00 AM to 9:59 AM | 977 (3.1%) | 1,289 (4.5%) |
| 10:00 AM to 10:59 AM | 682 (2.1%) | 710 (2.5%) |
| 11:00 AM to 11:59 AM | 290 (0.9%) | 459 (1.6%) |
| 12:00 PM to 3:59 PM | 3,183 (10.0%) | 3,493 (12.3%) |
| 4:00 PM to 11:59 PM | 3,102 (9.8%) | 2,761 (9.7%) |
| Total | 31,706 (100.0%) | 28,442 (100.0%) |
Housing Occupancy in Black Hawk County
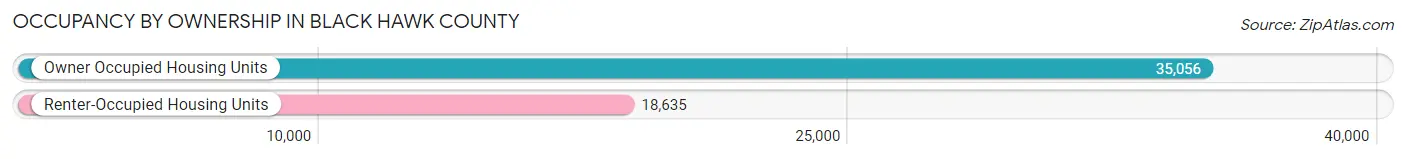
Occupancy by Ownership in Black Hawk County
Of the total 53,691 dwellings in Black Hawk County, owner-occupied units account for 35,056 (65.3%), while renter-occupied units make up 18,635 (34.7%).
| Occupancy | # Housing Units | % Housing Units |
| Owner Occupied Housing Units | 35,056 | 65.3% |
| Renter-Occupied Housing Units | 18,635 | 34.7% |
| Total Occupied Housing Units | 53,691 | 100.0% |
Occupancy by Household Size in Black Hawk County
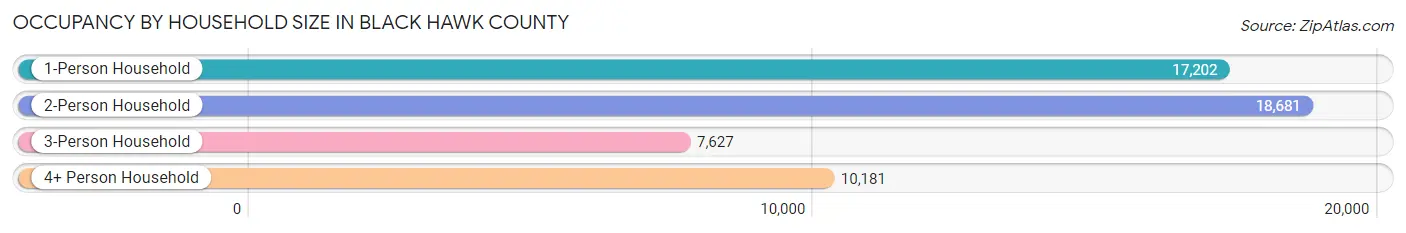
| Household Size | # Housing Units | % Housing Units |
| 1-Person Household | 17,202 | 32.0% |
| 2-Person Household | 18,681 | 34.8% |
| 3-Person Household | 7,627 | 14.2% |
| 4+ Person Household | 10,181 | 19.0% |
| Total Housing Units | 53,691 | 100.0% |
Occupancy by Ownership by Household Size in Black Hawk County
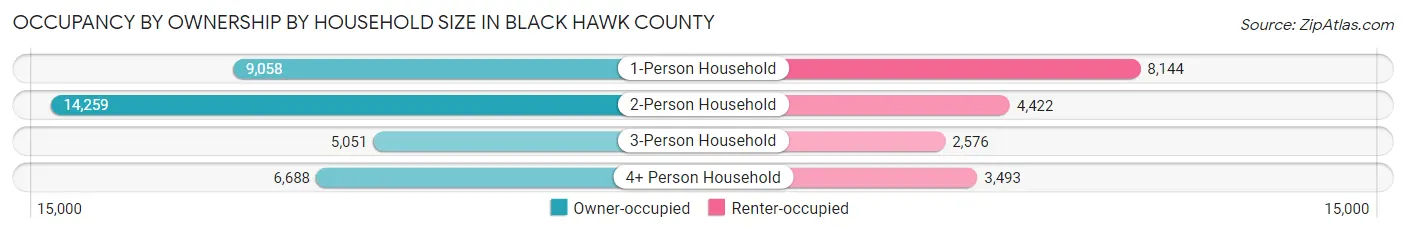
| Household Size | Owner-occupied | Renter-occupied |
| 1-Person Household | 9,058 (52.7%) | 8,144 (47.3%) |
| 2-Person Household | 14,259 (76.3%) | 4,422 (23.7%) |
| 3-Person Household | 5,051 (66.2%) | 2,576 (33.8%) |
| 4+ Person Household | 6,688 (65.7%) | 3,493 (34.3%) |
| Total Housing Units | 35,056 (65.3%) | 18,635 (34.7%) |
Occupancy by Educational Attainment in Black Hawk County
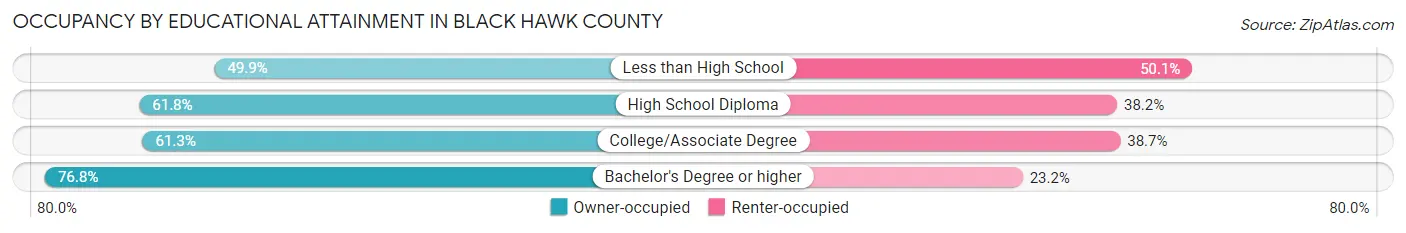
| Household Size | Owner-occupied | Renter-occupied |
| Less than High School | 1,832 (49.9%) | 1,841 (50.1%) |
| High School Diploma | 8,764 (61.8%) | 5,419 (38.2%) |
| College/Associate Degree | 12,059 (61.3%) | 7,620 (38.7%) |
| Bachelor's Degree or higher | 12,401 (76.8%) | 3,755 (23.2%) |
Occupancy by Age of Householder in Black Hawk County
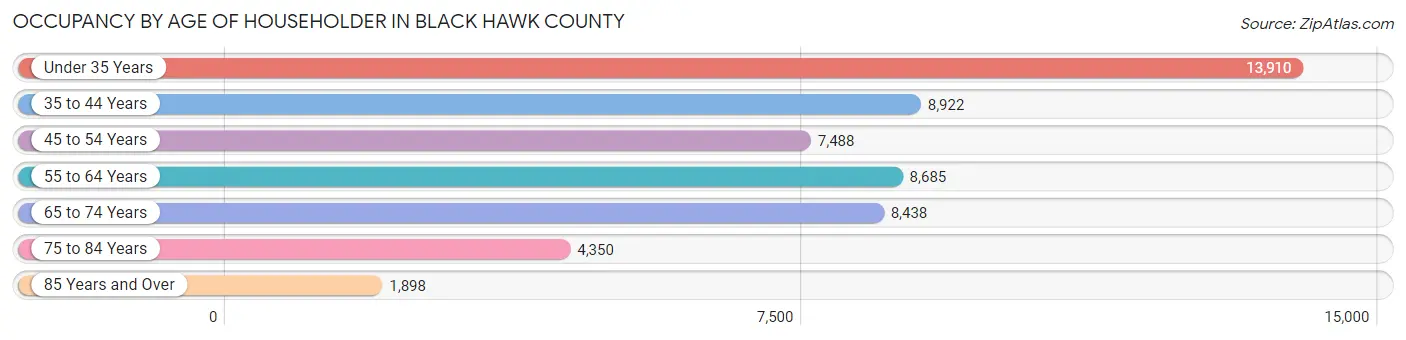
| Age Bracket | # Households | % Households |
| Under 35 Years | 13,910 | 25.9% |
| 35 to 44 Years | 8,922 | 16.6% |
| 45 to 54 Years | 7,488 | 14.0% |
| 55 to 64 Years | 8,685 | 16.2% |
| 65 to 74 Years | 8,438 | 15.7% |
| 75 to 84 Years | 4,350 | 8.1% |
| 85 Years and Over | 1,898 | 3.5% |
| Total | 53,691 | 100.0% |
Housing Finances in Black Hawk County
Median Income by Occupancy in Black Hawk County
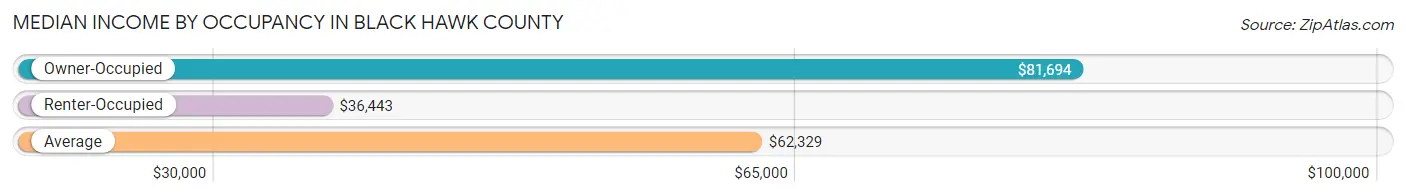
| Occupancy Type | # Households | Median Income |
| Owner-Occupied | 35,056 (65.3%) | $81,694 |
| Renter-Occupied | 18,635 (34.7%) | $36,443 |
| Average | 53,691 (100.0%) | $62,329 |
Occupancy by Householder Income Bracket in Black Hawk County
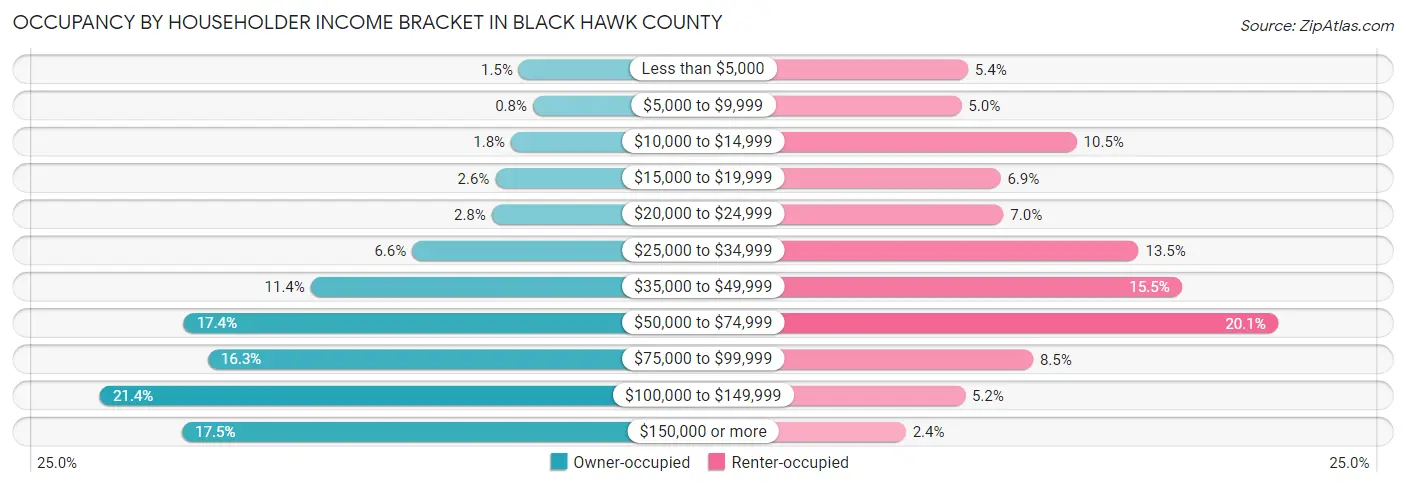
| Income Bracket | Owner-occupied | Renter-occupied |
| Less than $5,000 | 514 (1.5%) | 997 (5.3%) |
| $5,000 to $9,999 | 280 (0.8%) | 939 (5.0%) |
| $10,000 to $14,999 | 646 (1.8%) | 1,962 (10.5%) |
| $15,000 to $19,999 | 909 (2.6%) | 1,285 (6.9%) |
| $20,000 to $24,999 | 968 (2.8%) | 1,312 (7.0%) |
| $25,000 to $34,999 | 2,297 (6.6%) | 2,512 (13.5%) |
| $35,000 to $49,999 | 3,988 (11.4%) | 2,893 (15.5%) |
| $50,000 to $74,999 | 6,106 (17.4%) | 3,744 (20.1%) |
| $75,000 to $99,999 | 5,705 (16.3%) | 1,575 (8.5%) |
| $100,000 to $149,999 | 7,507 (21.4%) | 971 (5.2%) |
| $150,000 or more | 6,136 (17.5%) | 445 (2.4%) |
| Total | 35,056 (100.0%) | 18,635 (100.0%) |
Monthly Housing Cost Tiers in Black Hawk County
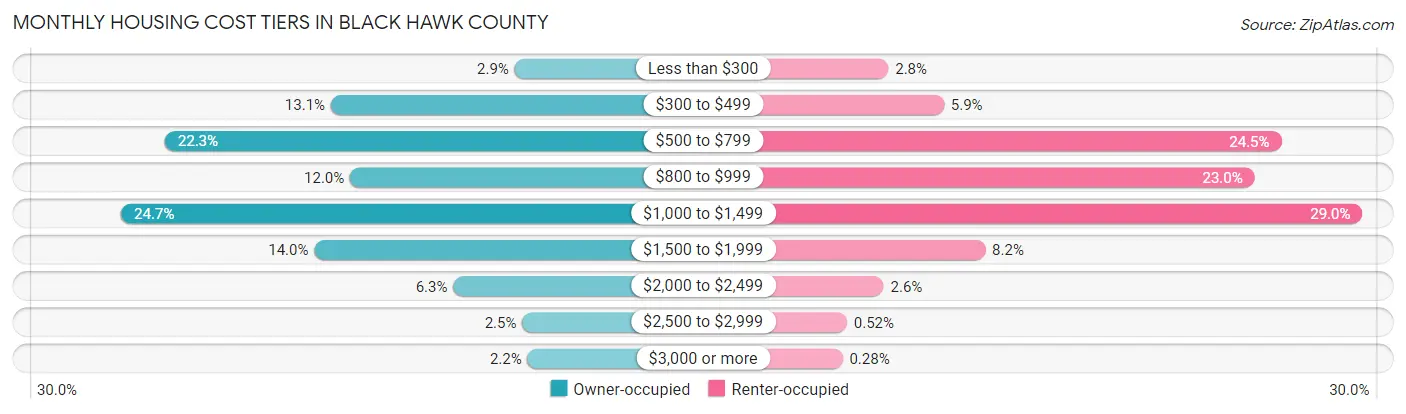
| Monthly Cost | Owner-occupied | Renter-occupied |
| Less than $300 | 1,028 (2.9%) | 523 (2.8%) |
| $300 to $499 | 4,585 (13.1%) | 1,096 (5.9%) |
| $500 to $799 | 7,801 (22.3%) | 4,569 (24.5%) |
| $800 to $999 | 4,212 (12.0%) | 4,294 (23.0%) |
| $1,000 to $1,499 | 8,648 (24.7%) | 5,403 (29.0%) |
| $1,500 to $1,999 | 4,909 (14.0%) | 1,520 (8.2%) |
| $2,000 to $2,499 | 2,214 (6.3%) | 475 (2.5%) |
| $2,500 to $2,999 | 881 (2.5%) | 97 (0.5%) |
| $3,000 or more | 778 (2.2%) | 52 (0.3%) |
| Total | 35,056 (100.0%) | 18,635 (100.0%) |
Physical Housing Characteristics in Black Hawk County
Housing Structures in Black Hawk County
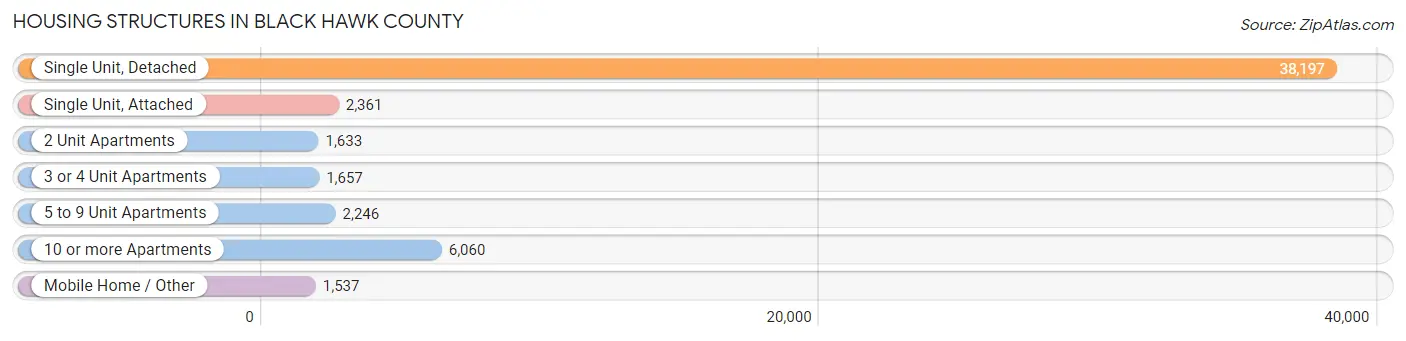
| Structure Type | # Housing Units | % Housing Units |
| Single Unit, Detached | 38,197 | 71.1% |
| Single Unit, Attached | 2,361 | 4.4% |
| 2 Unit Apartments | 1,633 | 3.0% |
| 3 or 4 Unit Apartments | 1,657 | 3.1% |
| 5 to 9 Unit Apartments | 2,246 | 4.2% |
| 10 or more Apartments | 6,060 | 11.3% |
| Mobile Home / Other | 1,537 | 2.9% |
| Total | 53,691 | 100.0% |
Housing Structures by Occupancy in Black Hawk County
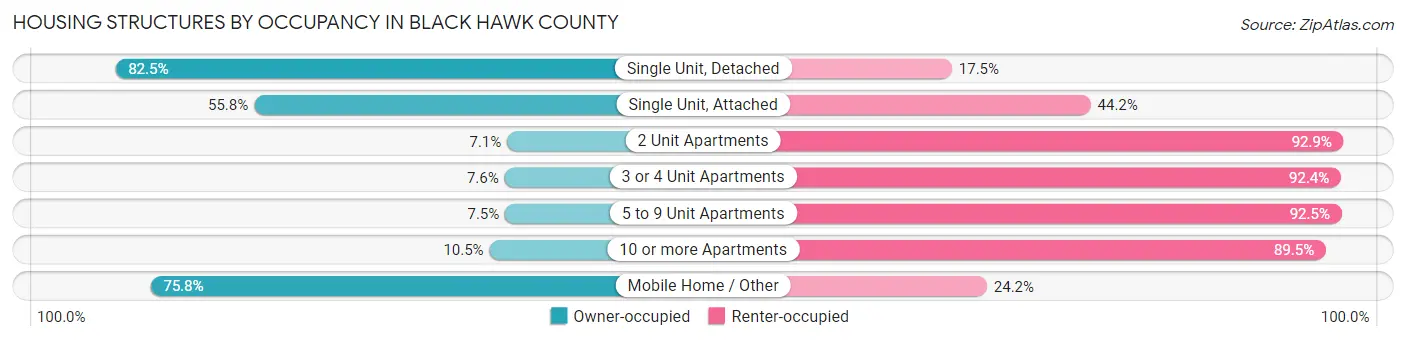
| Structure Type | Owner-occupied | Renter-occupied |
| Single Unit, Detached | 31,527 (82.5%) | 6,670 (17.5%) |
| Single Unit, Attached | 1,318 (55.8%) | 1,043 (44.2%) |
| 2 Unit Apartments | 116 (7.1%) | 1,517 (92.9%) |
| 3 or 4 Unit Apartments | 126 (7.6%) | 1,531 (92.4%) |
| 5 to 9 Unit Apartments | 168 (7.5%) | 2,078 (92.5%) |
| 10 or more Apartments | 636 (10.5%) | 5,424 (89.5%) |
| Mobile Home / Other | 1,165 (75.8%) | 372 (24.2%) |
| Total | 35,056 (65.3%) | 18,635 (34.7%) |
Housing Structures by Number of Rooms in Black Hawk County
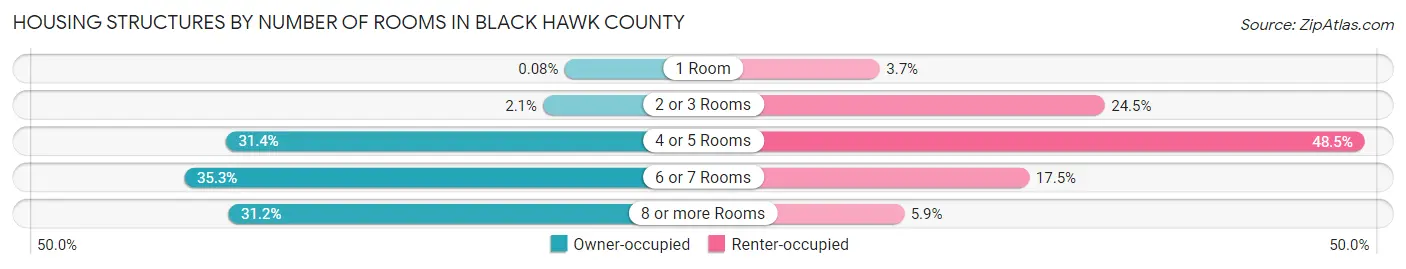
| Number of Rooms | Owner-occupied | Renter-occupied |
| 1 Room | 28 (0.1%) | 680 (3.6%) |
| 2 or 3 Rooms | 725 (2.1%) | 4,556 (24.4%) |
| 4 or 5 Rooms | 11,013 (31.4%) | 9,042 (48.5%) |
| 6 or 7 Rooms | 12,359 (35.3%) | 3,257 (17.5%) |
| 8 or more Rooms | 10,931 (31.2%) | 1,100 (5.9%) |
| Total | 35,056 (100.0%) | 18,635 (100.0%) |
Housing Structure by Heating Type in Black Hawk County
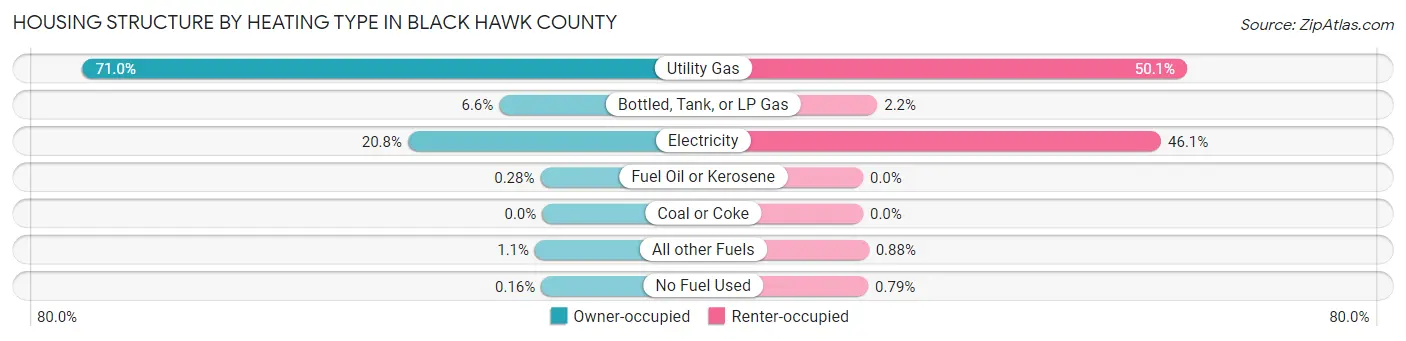
| Heating Type | Owner-occupied | Renter-occupied |
| Utility Gas | 24,904 (71.0%) | 9,326 (50.0%) |
| Bottled, Tank, or LP Gas | 2,329 (6.6%) | 410 (2.2%) |
| Electricity | 7,276 (20.8%) | 8,587 (46.1%) |
| Fuel Oil or Kerosene | 99 (0.3%) | 0 (0.0%) |
| Coal or Coke | 0 (0.0%) | 0 (0.0%) |
| All other Fuels | 391 (1.1%) | 164 (0.9%) |
| No Fuel Used | 57 (0.2%) | 148 (0.8%) |
| Total | 35,056 (100.0%) | 18,635 (100.0%) |
Household Vehicle Usage in Black Hawk County
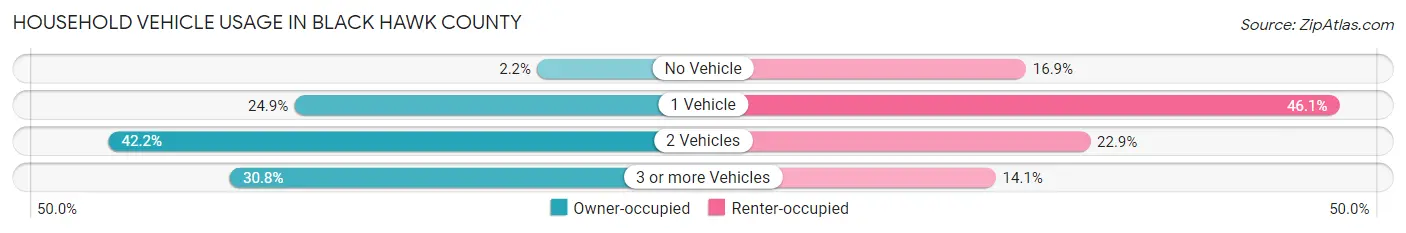
| Vehicles per Household | Owner-occupied | Renter-occupied |
| No Vehicle | 765 (2.2%) | 3,148 (16.9%) |
| 1 Vehicle | 8,710 (24.8%) | 8,599 (46.1%) |
| 2 Vehicles | 14,776 (42.1%) | 4,266 (22.9%) |
| 3 or more Vehicles | 10,805 (30.8%) | 2,622 (14.1%) |
| Total | 35,056 (100.0%) | 18,635 (100.0%) |
Real Estate & Mortgages in Black Hawk County
Real Estate and Mortgage Overview in Black Hawk County
| Characteristic | Without Mortgage | With Mortgage |
| Housing Units | 13,566 | 21,490 |
| Median Property Value | $168,900 | $174,600 |
| Median Household Income | $66,192 | $4,275 |
| Monthly Housing Costs | $559 | $760 |
| Real Estate Taxes | $2,734 | $403 |
Property Value by Mortgage Status in Black Hawk County
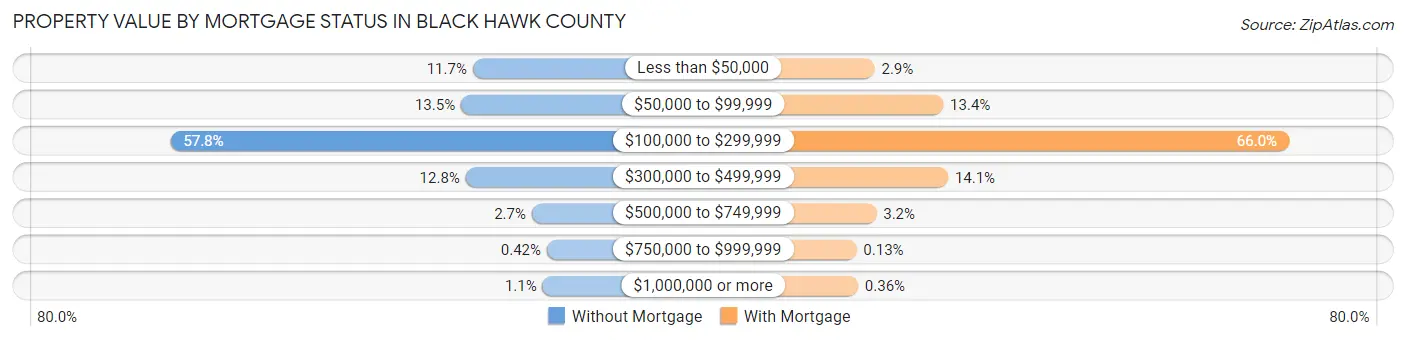
| Property Value | Without Mortgage | With Mortgage |
| Less than $50,000 | 1,589 (11.7%) | 620 (2.9%) |
| $50,000 to $99,999 | 1,832 (13.5%) | 2,869 (13.4%) |
| $100,000 to $299,999 | 7,838 (57.8%) | 14,190 (66.0%) |
| $300,000 to $499,999 | 1,735 (12.8%) | 3,026 (14.1%) |
| $500,000 to $749,999 | 368 (2.7%) | 679 (3.2%) |
| $750,000 to $999,999 | 57 (0.4%) | 28 (0.1%) |
| $1,000,000 or more | 147 (1.1%) | 78 (0.4%) |
| Total | 13,566 (100.0%) | 21,490 (100.0%) |
Household Income by Mortgage Status in Black Hawk County
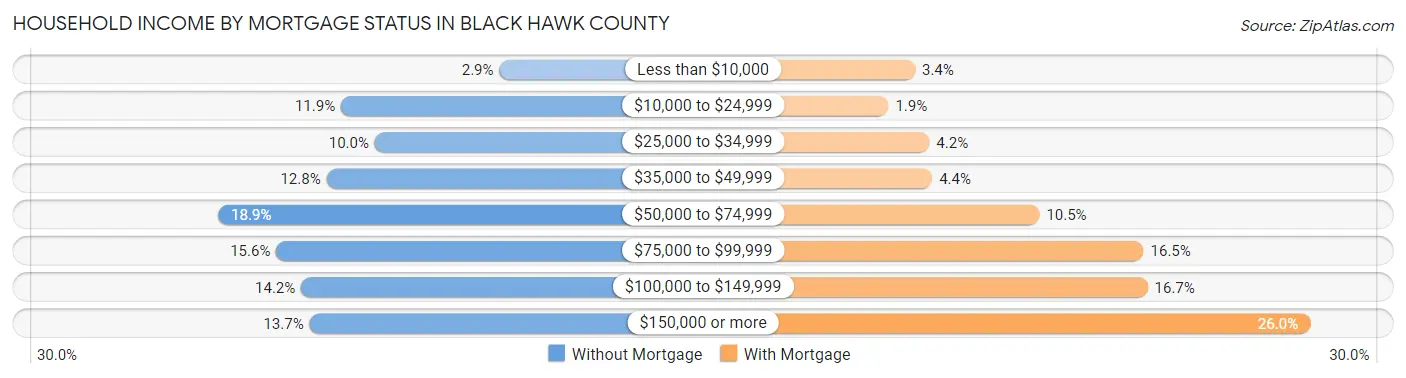
| Household Income | Without Mortgage | With Mortgage |
| Less than $10,000 | 389 (2.9%) | 731 (3.4%) |
| $10,000 to $24,999 | 1,617 (11.9%) | 405 (1.9%) |
| $25,000 to $34,999 | 1,355 (10.0%) | 906 (4.2%) |
| $35,000 to $49,999 | 1,729 (12.8%) | 942 (4.4%) |
| $50,000 to $74,999 | 2,569 (18.9%) | 2,259 (10.5%) |
| $75,000 to $99,999 | 2,119 (15.6%) | 3,537 (16.5%) |
| $100,000 to $149,999 | 1,927 (14.2%) | 3,586 (16.7%) |
| $150,000 or more | 1,861 (13.7%) | 5,580 (26.0%) |
| Total | 13,566 (100.0%) | 21,490 (100.0%) |
Property Value to Household Income Ratio in Black Hawk County
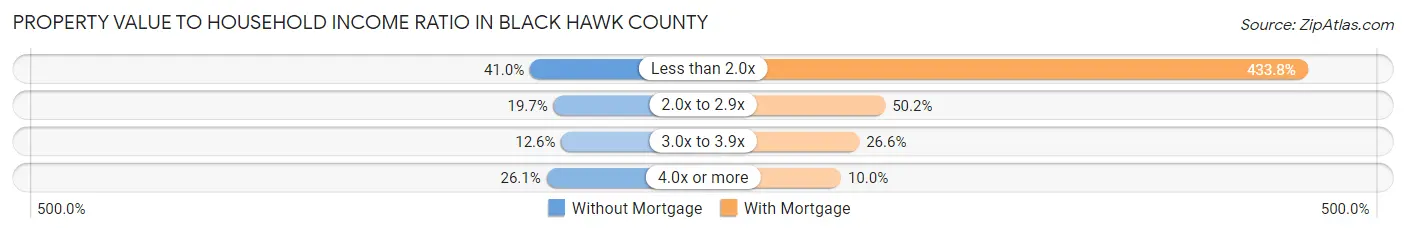
| Value-to-Income Ratio | Without Mortgage | With Mortgage |
| Less than 2.0x | 5,568 (41.0%) | 93,220 (433.8%) |
| 2.0x to 2.9x | 2,674 (19.7%) | 10,795 (50.2%) |
| 3.0x to 3.9x | 1,715 (12.6%) | 5,718 (26.6%) |
| 4.0x or more | 3,535 (26.1%) | 2,156 (10.0%) |
| Total | 13,566 (100.0%) | 21,490 (100.0%) |
Real Estate Taxes by Mortgage Status in Black Hawk County
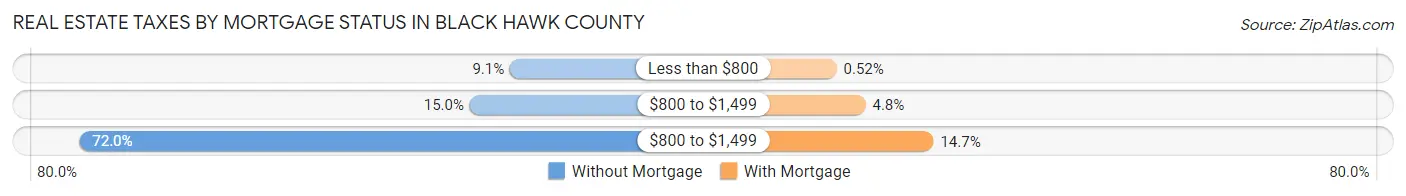
| Property Taxes | Without Mortgage | With Mortgage |
| Less than $800 | 1,230 (9.1%) | 111 (0.5%) |
| $800 to $1,499 | 2,028 (14.9%) | 1,020 (4.8%) |
| $800 to $1,499 | 9,766 (72.0%) | 3,154 (14.7%) |
| Total | 13,566 (100.0%) | 21,490 (100.0%) |
Health & Disability in Black Hawk County
Health Insurance Coverage by Age in Black Hawk County
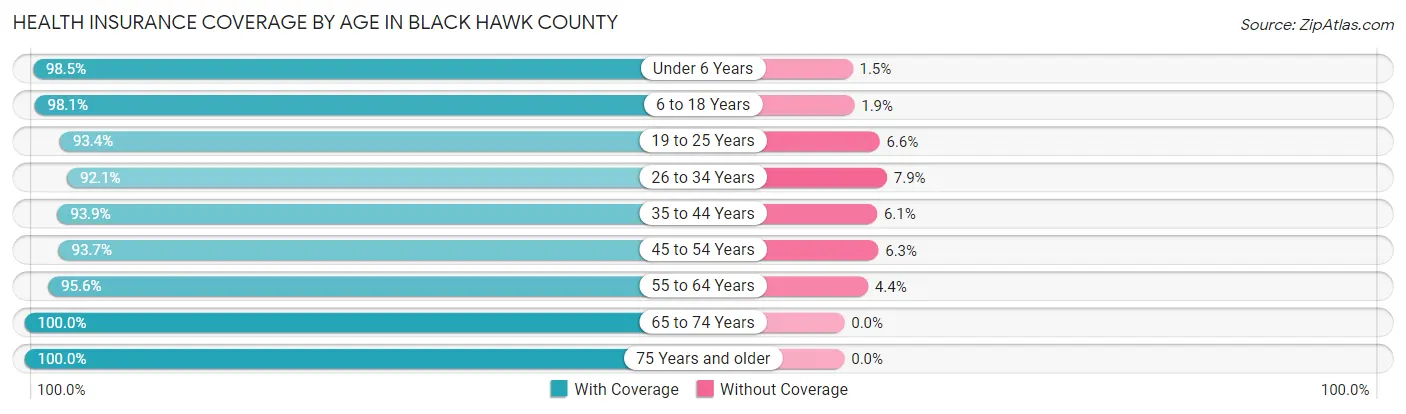
| Age Bracket | With Coverage | Without Coverage |
| Under 6 Years | 9,198 (98.5%) | 143 (1.5%) |
| 6 to 18 Years | 20,929 (98.1%) | 397 (1.9%) |
| 19 to 25 Years | 17,997 (93.4%) | 1,266 (6.6%) |
| 26 to 34 Years | 13,227 (92.1%) | 1,141 (7.9%) |
| 35 to 44 Years | 14,573 (93.9%) | 947 (6.1%) |
| 45 to 54 Years | 12,271 (93.7%) | 831 (6.3%) |
| 55 to 64 Years | 14,411 (95.6%) | 663 (4.4%) |
| 65 to 74 Years | 12,818 (100.0%) | 0 (0.0%) |
| 75 Years and older | 8,872 (100.0%) | 0 (0.0%) |
| Total | 124,296 (95.9%) | 5,388 (4.2%) |
Health Insurance Coverage by Citizenship Status in Black Hawk County
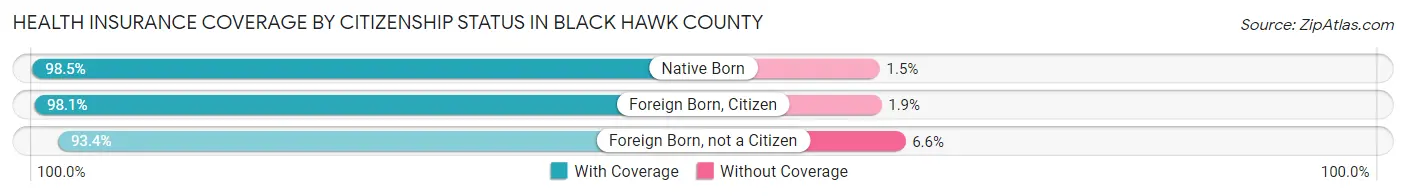
| Citizenship Status | With Coverage | Without Coverage |
| Native Born | 9,198 (98.5%) | 143 (1.5%) |
| Foreign Born, Citizen | 20,929 (98.1%) | 397 (1.9%) |
| Foreign Born, not a Citizen | 17,997 (93.4%) | 1,266 (6.6%) |
Health Insurance Coverage by Household Income in Black Hawk County
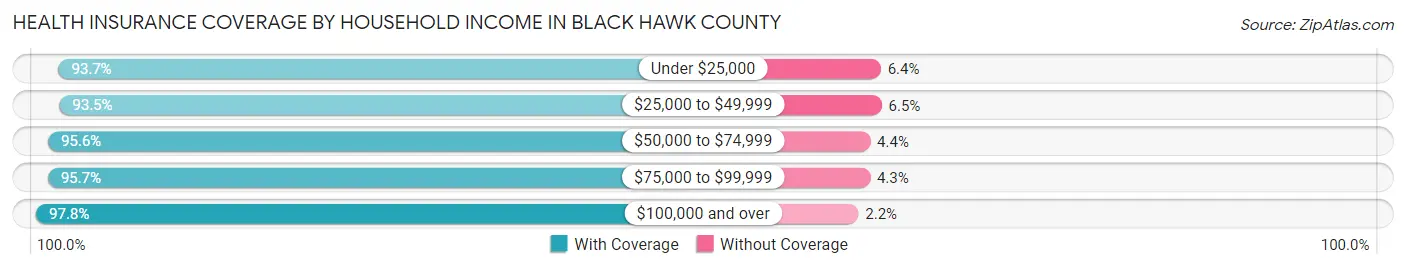
| Household Income | With Coverage | Without Coverage |
| Under $25,000 | 15,538 (93.6%) | 1,054 (6.4%) |
| $25,000 to $49,999 | 21,309 (93.5%) | 1,487 (6.5%) |
| $50,000 to $74,999 | 22,104 (95.6%) | 1,013 (4.4%) |
| $75,000 to $99,999 | 17,877 (95.7%) | 811 (4.3%) |
| $100,000 and over | 44,237 (97.8%) | 977 (2.2%) |
Public vs Private Health Insurance Coverage by Age in Black Hawk County
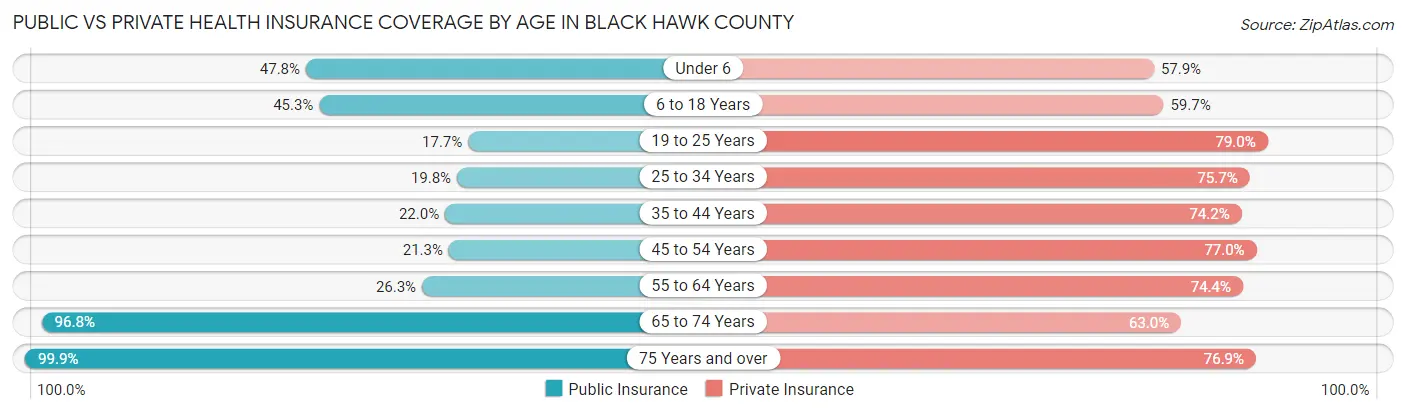
| Age Bracket | Public Insurance | Private Insurance |
| Under 6 | 4,464 (47.8%) | 5,412 (57.9%) |
| 6 to 18 Years | 9,665 (45.3%) | 12,733 (59.7%) |
| 19 to 25 Years | 3,405 (17.7%) | 15,221 (79.0%) |
| 25 to 34 Years | 2,838 (19.8%) | 10,872 (75.7%) |
| 35 to 44 Years | 3,409 (22.0%) | 11,512 (74.2%) |
| 45 to 54 Years | 2,785 (21.3%) | 10,083 (77.0%) |
| 55 to 64 Years | 3,957 (26.3%) | 11,219 (74.4%) |
| 65 to 74 Years | 12,412 (96.8%) | 8,070 (63.0%) |
| 75 Years and over | 8,862 (99.9%) | 6,818 (76.8%) |
| Total | 51,797 (39.9%) | 91,940 (70.9%) |
Disability Status by Sex by Age in Black Hawk County
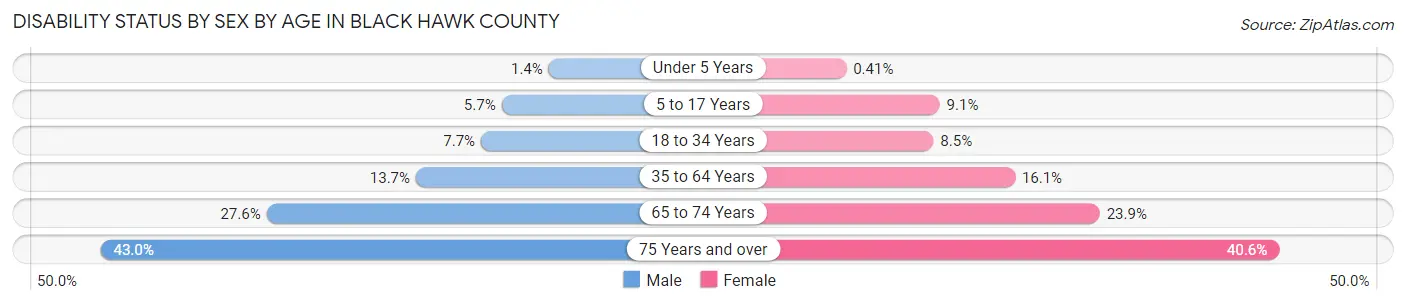
| Age Bracket | Male | Female |
| Under 5 Years | 56 (1.4%) | 16 (0.4%) |
| 5 to 17 Years | 595 (5.7%) | 906 (9.1%) |
| 18 to 34 Years | 1,362 (7.6%) | 1,542 (8.5%) |
| 35 to 64 Years | 2,993 (13.7%) | 3,509 (16.1%) |
| 65 to 74 Years | 1,685 (27.6%) | 1,604 (23.9%) |
| 75 Years and over | 1,553 (42.9%) | 2,133 (40.6%) |
Disability Class by Sex by Age in Black Hawk County
Disability Class: Hearing Difficulty
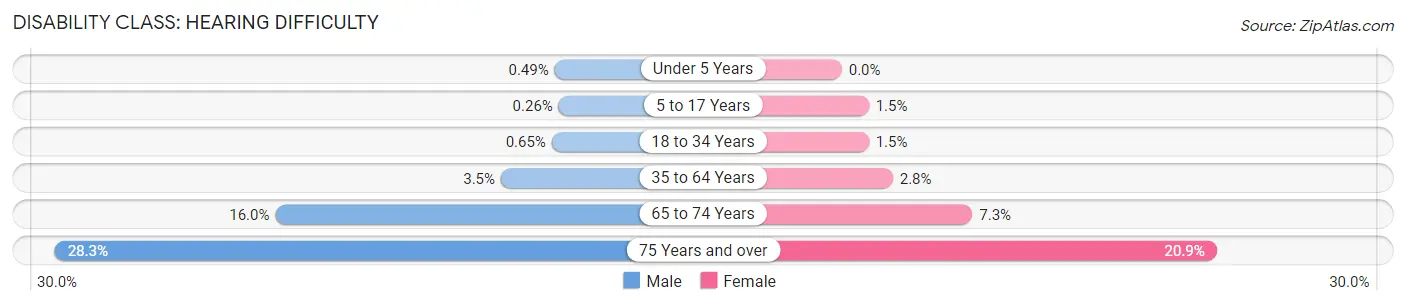
| Age Bracket | Male | Female |
| Under 5 Years | 20 (0.5%) | 0 (0.0%) |
| 5 to 17 Years | 27 (0.3%) | 150 (1.5%) |
| 18 to 34 Years | 116 (0.6%) | 272 (1.5%) |
| 35 to 64 Years | 761 (3.5%) | 620 (2.8%) |
| 65 to 74 Years | 981 (16.0%) | 487 (7.3%) |
| 75 Years and over | 1,024 (28.3%) | 1,097 (20.9%) |
Disability Class: Vision Difficulty
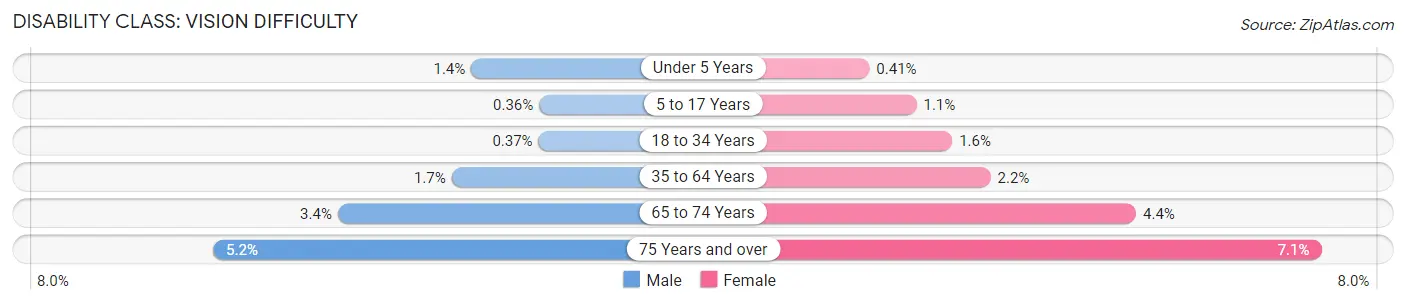
| Age Bracket | Male | Female |
| Under 5 Years | 56 (1.4%) | 16 (0.4%) |
| 5 to 17 Years | 37 (0.4%) | 111 (1.1%) |
| 18 to 34 Years | 65 (0.4%) | 298 (1.6%) |
| 35 to 64 Years | 363 (1.7%) | 483 (2.2%) |
| 65 to 74 Years | 205 (3.4%) | 293 (4.4%) |
| 75 Years and over | 188 (5.2%) | 374 (7.1%) |
Disability Class: Cognitive Difficulty
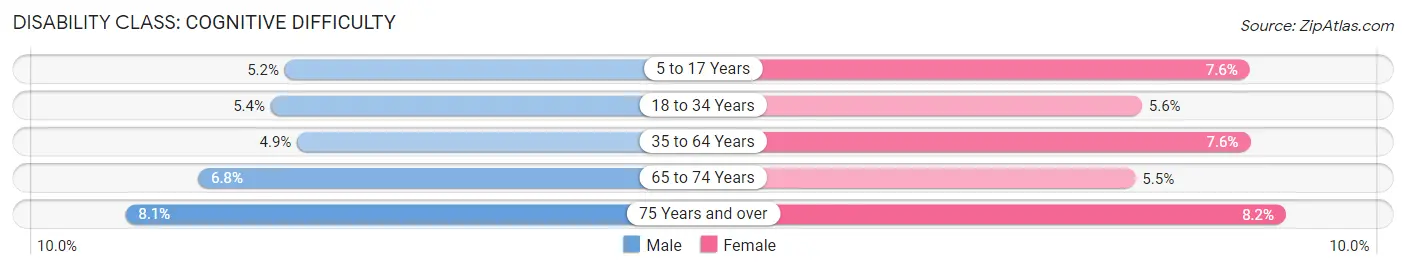
| Age Bracket | Male | Female |
| 5 to 17 Years | 536 (5.2%) | 755 (7.6%) |
| 18 to 34 Years | 967 (5.4%) | 1,010 (5.6%) |
| 35 to 64 Years | 1,079 (4.9%) | 1,655 (7.6%) |
| 65 to 74 Years | 415 (6.8%) | 365 (5.4%) |
| 75 Years and over | 294 (8.1%) | 433 (8.2%) |
Disability Class: Ambulatory Difficulty
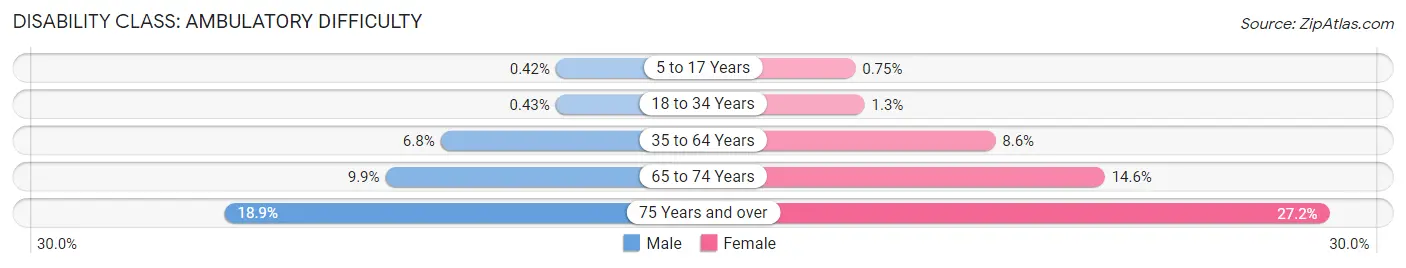
| Age Bracket | Male | Female |
| 5 to 17 Years | 43 (0.4%) | 75 (0.7%) |
| 18 to 34 Years | 76 (0.4%) | 231 (1.3%) |
| 35 to 64 Years | 1,496 (6.8%) | 1,866 (8.6%) |
| 65 to 74 Years | 606 (9.9%) | 981 (14.6%) |
| 75 Years and over | 682 (18.9%) | 1,427 (27.2%) |
Disability Class: Self-Care Difficulty
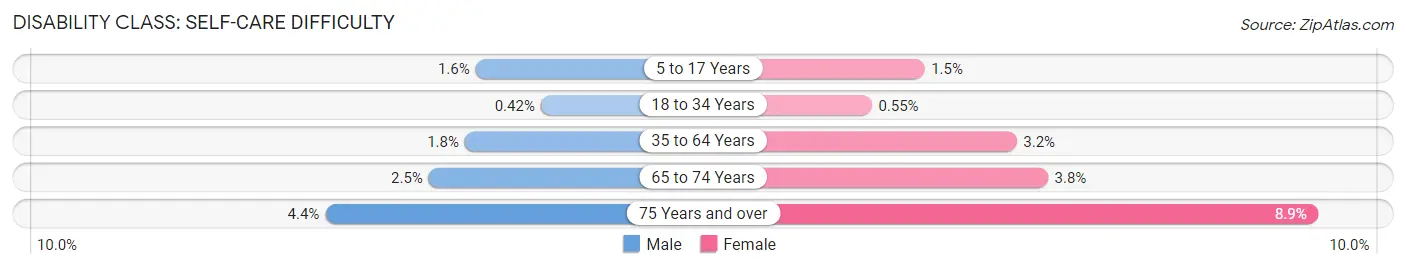
| Age Bracket | Male | Female |
| 5 to 17 Years | 169 (1.6%) | 153 (1.5%) |
| 18 to 34 Years | 74 (0.4%) | 99 (0.5%) |
| 35 to 64 Years | 401 (1.8%) | 708 (3.2%) |
| 65 to 74 Years | 153 (2.5%) | 256 (3.8%) |
| 75 Years and over | 160 (4.4%) | 465 (8.8%) |
Technology Access in Black Hawk County
Computing Device Access in Black Hawk County
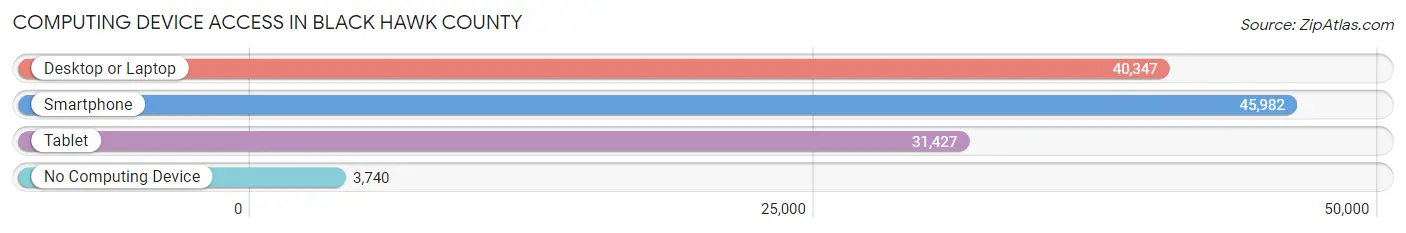
| Device Type | # Households | % Households |
| Desktop or Laptop | 40,347 | 75.1% |
| Smartphone | 45,982 | 85.6% |
| Tablet | 31,427 | 58.5% |
| No Computing Device | 3,740 | 7.0% |
| Total | 53,691 | 100.0% |
Internet Access in Black Hawk County
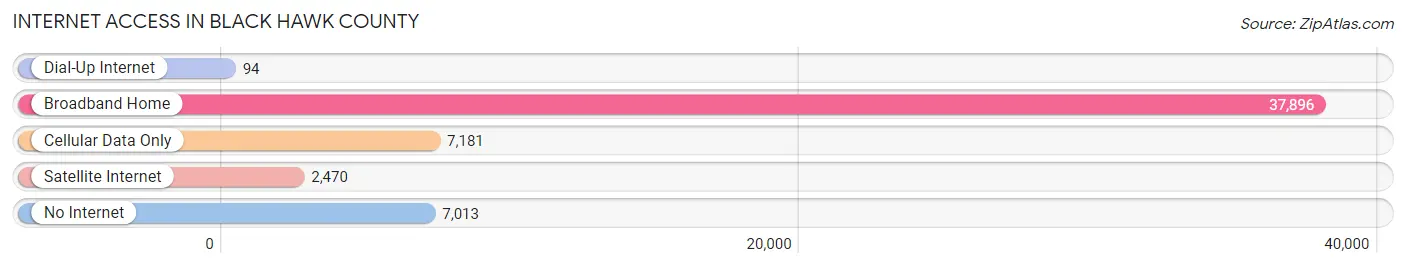
| Internet Type | # Households | % Households |
| Dial-Up Internet | 94 | 0.2% |
| Broadband Home | 37,896 | 70.6% |
| Cellular Data Only | 7,181 | 13.4% |
| Satellite Internet | 2,470 | 4.6% |
| No Internet | 7,013 | 13.1% |
| Total | 53,691 | 100.0% |
Black Hawk County Summary
Black Hawk County, Iowa is located in the northeastern part of the state and is bordered by Bremer, Buchanan, Fayette, Grundy, and Tama counties. The county seat is Waterloo, and the largest city is Cedar Falls. The county was named after the Sauk leader Black Hawk, who fought against the United States in the Black Hawk War of 1832. As of the 2010 census, the population of Black Hawk County was 131,090, making it the fourth most populous county in Iowa.
Geography
Black Hawk County covers an area of 743 square miles and is located in the Driftless Area of Iowa. The county is mostly flat, with some rolling hills in the western part of the county. The Cedar River flows through the county, and the county is home to several lakes, including George Wyth Lake, Lake of the Hills, and Lake Ponderosa. The county is also home to several state parks, including George Wyth State Park, Pine Lake State Park, and Big Woods State Park.
Economy
Black Hawk County has a diverse economy, with a mix of manufacturing, agriculture, and services. The county is home to several large employers, including John Deere, Tyson Foods, and the University of Northern Iowa. Agriculture is a major part of the economy, with corn, soybeans, and hogs being the main crops. Manufacturing is also a major part of the economy, with John Deere and Tyson Foods being the two largest employers. The service sector is also important, with the University of Northern Iowa, healthcare, and retail being the main employers.
Demographics
As of the 2010 census, the population of Black Hawk County was 131,090, with a population density of 176 people per square mile. The racial makeup of the county was 90.2% White, 4.2% African American, 0.7% Native American, 2.2% Asian, 0.3% Pacific Islander, and 2.4% from other races. Hispanic or Latino of any race were 5.2% of the population.
The median income for a household in the county was $48,945, and the median income for a family was $60,945. The per capita income for the county was $24,845. About 8.2% of families and 11.7% of the population were below the poverty line, including 15.2% of those under age 18 and 6.2% of those age 65 or over.
Conclusion
Black Hawk County, Iowa is a diverse county with a mix of manufacturing, agriculture, and services. The county is home to several large employers, including John Deere, Tyson Foods, and the University of Northern Iowa. The population of the county is mostly white, with a small percentage of African Americans, Native Americans, Asians, and Pacific Islanders. The median income for a household in the county is $48,945, and the per capita income is $24,845.
Common Questions
What is Per Capita Income in Black Hawk County?
Per Capita income in Black Hawk County is $35,400.
What is the Median Family Income in Black Hawk County?
Median Family Income in Black Hawk County is $83,292.
What is the Median Household income in Black Hawk County?
Median Household Income in Black Hawk County is $62,329.
What is Income or Wage Gap in Black Hawk County?
Income or Wage Gap in Black Hawk County is 32.7%.
Women in Black Hawk County earn 67.3 cents for every dollar earned by a man.
What is Family Income Deficit in Black Hawk County?
Family Income Deficit in Black Hawk County is $9,642.
Families that are below poverty line in Black Hawk County earn $9,642 less on average than the poverty threshold level.
What is Inequality or Gini Index in Black Hawk County?
Inequality or Gini Index in Black Hawk County is 0.46.
What is the Total Population of Black Hawk County?
Total Population of Black Hawk County is 131,041.
What is the Total Male Population of Black Hawk County?
Total Male Population of Black Hawk County is 64,632.
What is the Total Female Population of Black Hawk County?
Total Female Population of Black Hawk County is 66,409.
What is the Ratio of Males per 100 Females in Black Hawk County?
There are 97.32 Males per 100 Females in Black Hawk County.
What is the Ratio of Females per 100 Males in Black Hawk County?
There are 102.75 Females per 100 Males in Black Hawk County.
What is the Median Population Age in Black Hawk County?
Median Population Age in Black Hawk County is 35.5 Years.
What is the Average Family Size in Black Hawk County
Average Family Size in Black Hawk County is 3.0 People.
What is the Average Household Size in Black Hawk County
Average Household Size in Black Hawk County is 2.4 People.
How Large is the Labor Force in Black Hawk County?
There are 70,301 People in the Labor Forcein in Black Hawk County.
What is the Percentage of People in the Labor Force in Black Hawk County?
66.5% of People are in the Labor Force in Black Hawk County.
What is the Unemployment Rate in Black Hawk County?
Unemployment Rate in Black Hawk County is 5.2%.