Cerro Gordo County, IA Map & Demographics
Cerro Gordo County Map
Cerro Gordo County Overview
$38,377
PER CAPITA INCOME
$85,924
AVG FAMILY INCOME
$63,149
AVG HOUSEHOLD INCOME
32.0%
WAGE / INCOME GAP [ % ]
68.0¢/ $1
WAGE / INCOME GAP [ $ ]
$10,203
FAMILY INCOME DEFICIT
0.45
INEQUALITY / GINI INDEX
42,979
TOTAL POPULATION
21,433
MALE POPULATION
21,546
FEMALE POPULATION
99.48
MALES / 100 FEMALES
100.53
FEMALES / 100 MALES
44.3
MEDIAN AGE
2.8
AVG FAMILY SIZE
2.1
AVG HOUSEHOLD SIZE
22,682
LABOR FORCE [ PEOPLE ]
64.6%
PERCENT IN LABOR FORCE
3.0%
UNEMPLOYMENT RATE
Cerro Gordo County Area Codes
Income in Cerro Gordo County
Income Overview in Cerro Gordo County
Per Capita Income in Cerro Gordo County is $38,377, while median incomes of families and households are $85,924 and $63,149 respectively.
| Characteristic | Number | Measure |
| Per Capita Income | 42,979 | $38,377 |
| Median Family Income | 11,247 | $85,924 |
| Mean Family Income | 11,247 | $108,977 |
| Median Household Income | 19,450 | $63,149 |
| Mean Household Income | 19,450 | $85,095 |
| Income Deficit | 11,247 | $10,203 |
| Wage / Income Gap (%) | 42,979 | 32.03% |
| Wage / Income Gap ($) | 42,979 | 67.97¢ per $1 |
| Gini / Inequality Index | 42,979 | 0.45 |
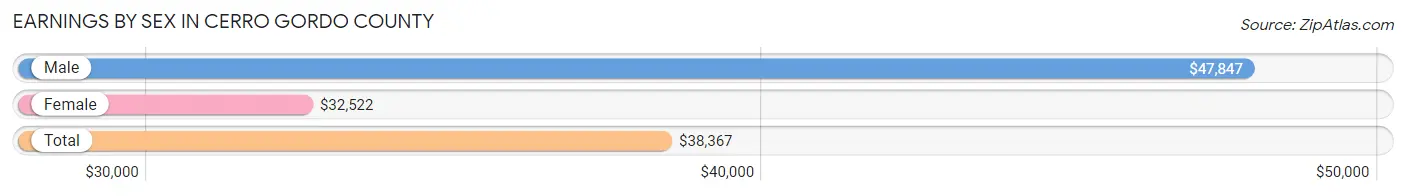
Earnings by Sex in Cerro Gordo County
Average Earnings in Cerro Gordo County are $38,367, $47,847 for men and $32,522 for women, a difference of 32.0%.
| Sex | Number | Average Earnings |
| Male | 12,669 (52.6%) | $47,847 |
| Female | 11,427 (47.4%) | $32,522 |
| Total | 24,096 (100.0%) | $38,367 |
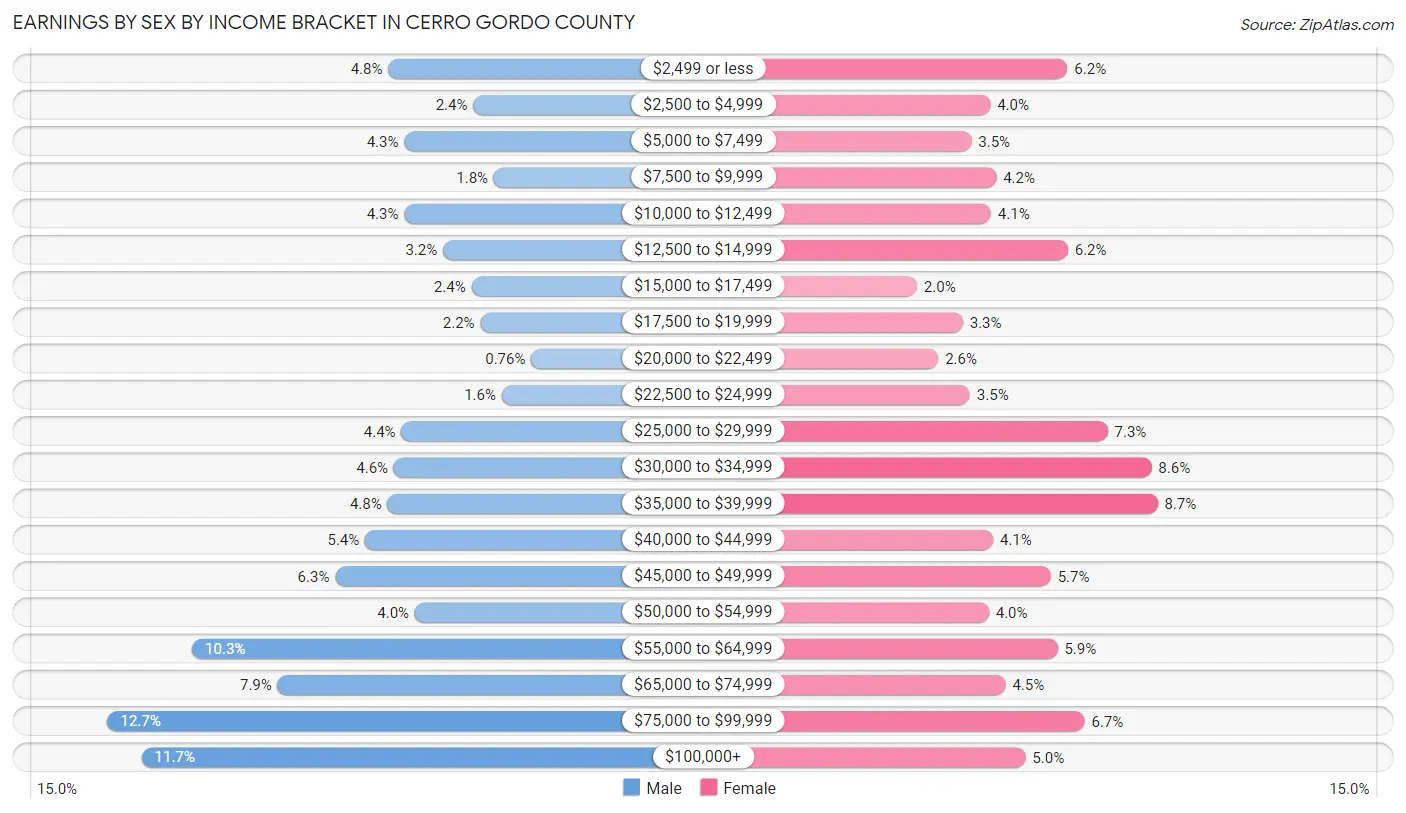
Earnings by Sex by Income Bracket in Cerro Gordo County
The most common earnings brackets in Cerro Gordo County are $75,000 to $99,999 for men (1,605 | 12.7%) and $35,000 to $39,999 for women (998 | 8.7%).
| Income | Male | Female |
| $2,499 or less | 606 (4.8%) | 709 (6.2%) |
| $2,500 to $4,999 | 303 (2.4%) | 460 (4.0%) |
| $5,000 to $7,499 | 549 (4.3%) | 400 (3.5%) |
| $7,500 to $9,999 | 229 (1.8%) | 480 (4.2%) |
| $10,000 to $12,499 | 549 (4.3%) | 463 (4.1%) |
| $12,500 to $14,999 | 411 (3.2%) | 710 (6.2%) |
| $15,000 to $17,499 | 309 (2.4%) | 225 (2.0%) |
| $17,500 to $19,999 | 278 (2.2%) | 373 (3.3%) |
| $20,000 to $22,499 | 96 (0.8%) | 294 (2.6%) |
| $22,500 to $24,999 | 202 (1.6%) | 395 (3.5%) |
| $25,000 to $29,999 | 559 (4.4%) | 838 (7.3%) |
| $30,000 to $34,999 | 585 (4.6%) | 978 (8.6%) |
| $35,000 to $39,999 | 608 (4.8%) | 998 (8.7%) |
| $40,000 to $44,999 | 688 (5.4%) | 470 (4.1%) |
| $45,000 to $49,999 | 794 (6.3%) | 655 (5.7%) |
| $50,000 to $54,999 | 511 (4.0%) | 456 (4.0%) |
| $55,000 to $64,999 | 1,304 (10.3%) | 676 (5.9%) |
| $65,000 to $74,999 | 999 (7.9%) | 510 (4.5%) |
| $75,000 to $99,999 | 1,605 (12.7%) | 763 (6.7%) |
| $100,000+ | 1,484 (11.7%) | 574 (5.0%) |
| Total | 12,669 (100.0%) | 11,427 (100.0%) |
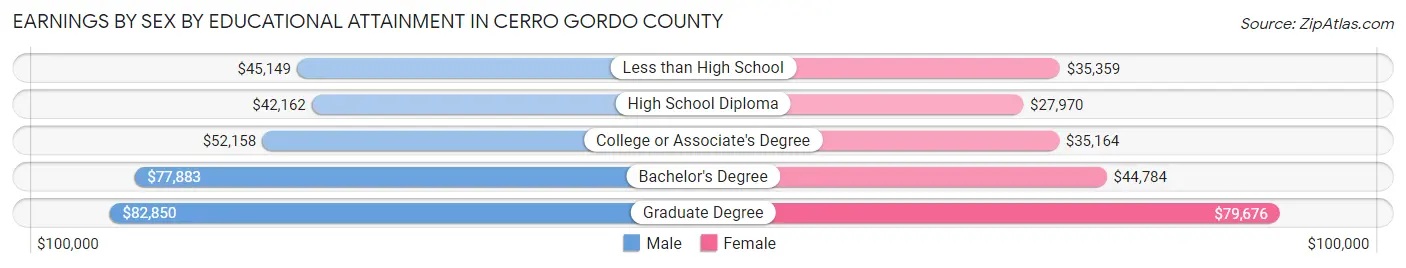
Earnings by Sex by Educational Attainment in Cerro Gordo County
Average earnings in Cerro Gordo County are $53,037 for men and $35,845 for women, a difference of 32.4%. Men with an educational attainment of graduate degree enjoy the highest average annual earnings of $82,850, while those with high school diploma education earn the least with $42,162. Women with an educational attainment of graduate degree earn the most with the average annual earnings of $79,676, while those with high school diploma education have the smallest earnings of $27,970.
| Educational Attainment | Male Income | Female Income |
| Less than High School | $45,149 | $35,359 |
| High School Diploma | $42,162 | $27,970 |
| College or Associate's Degree | $52,158 | $35,164 |
| Bachelor's Degree | $77,883 | $44,784 |
| Graduate Degree | $82,850 | $79,676 |
| Total | $53,037 | $35,845 |
Family Income in Cerro Gordo County
Family Income Brackets in Cerro Gordo County
According to the Cerro Gordo County family income data, there are 2,373 families falling into the $100,000 to $149,999 income range, which is the most common income bracket and makes up 21.1% of all families. Conversely, the $10,000 to $14,999 income bracket is the least frequent group with only 112 families (1.0%) belonging to this category.
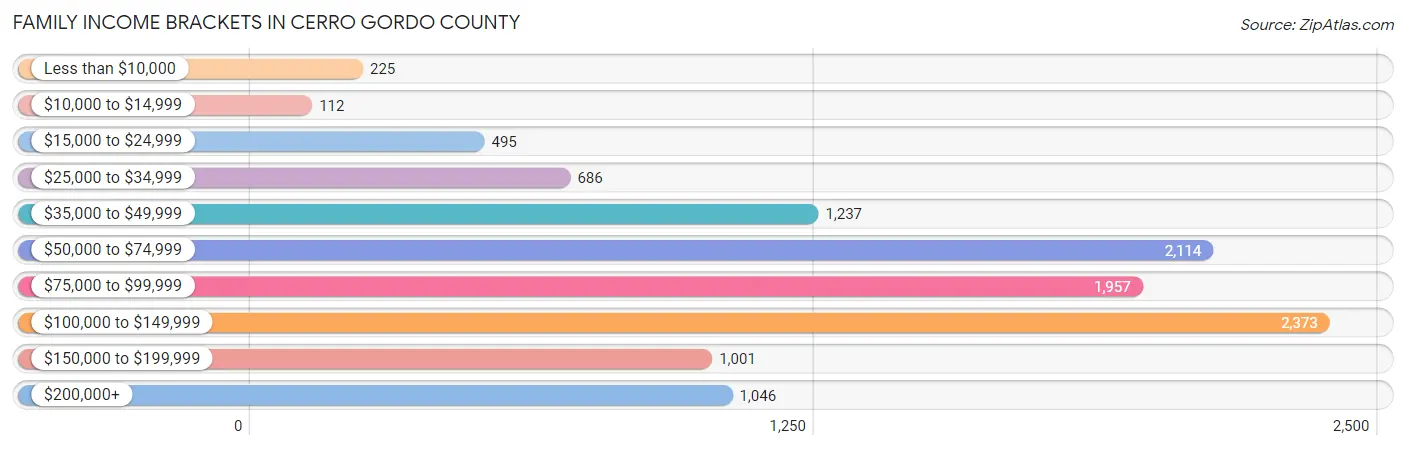
| Income Bracket | # Families | % Families |
| Less than $10,000 | 225 | 2.0% |
| $10,000 to $14,999 | 112 | 1.0% |
| $15,000 to $24,999 | 495 | 4.4% |
| $25,000 to $34,999 | 686 | 6.1% |
| $35,000 to $49,999 | 1,237 | 11.0% |
| $50,000 to $74,999 | 2,114 | 18.8% |
| $75,000 to $99,999 | 1,957 | 17.4% |
| $100,000 to $149,999 | 2,373 | 21.1% |
| $150,000 to $199,999 | 1,001 | 8.9% |
| $200,000+ | 1,046 | 9.3% |
Family Income by Famaliy Size in Cerro Gordo County
6-person families (113 | 1.0%) account for the highest median family income in Cerro Gordo County with $116,607 per family, while 2-person families (6,606 | 58.7%) have the highest median income of $37,769 per family member.
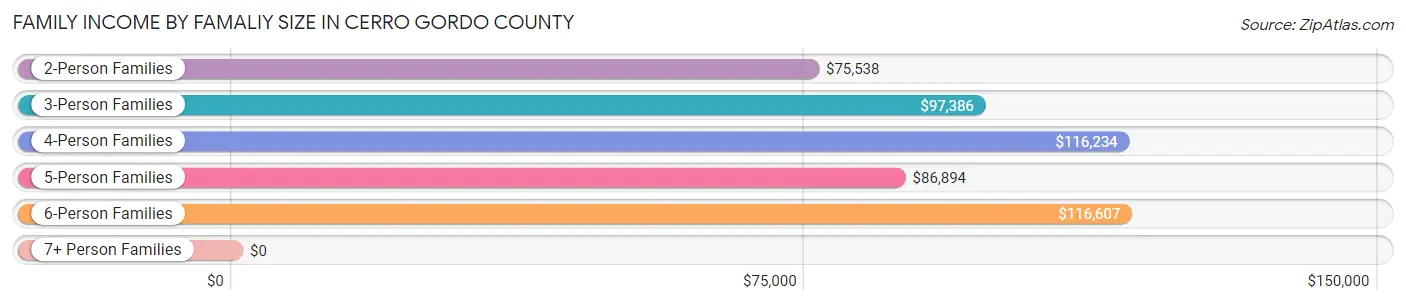
| Income Bracket | # Families | Median Income |
| 2-Person Families | 6,606 (58.7%) | $75,538 |
| 3-Person Families | 1,886 (16.8%) | $97,386 |
| 4-Person Families | 1,601 (14.2%) | $116,234 |
| 5-Person Families | 938 (8.3%) | $86,894 |
| 6-Person Families | 113 (1.0%) | $116,607 |
| 7+ Person Families | 103 (0.9%) | $0 |
| Total | 11,247 (100.0%) | $85,924 |
Family Income by Number of Earners in Cerro Gordo County
The median family income in Cerro Gordo County is $85,924, with families comprising 3+ earners (1,066) having the highest median family income of $141,875, while families with no earners (2,004) have the lowest median family income of $51,887, accounting for 9.5% and 17.8% of families, respectively.
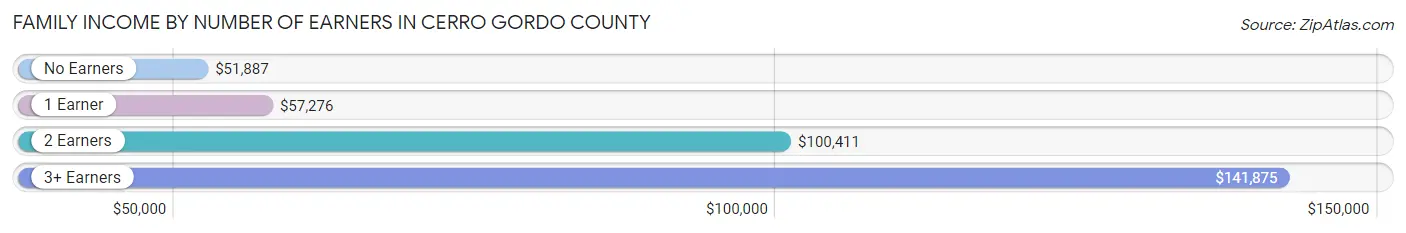
| Number of Earners | # Families | Median Income |
| No Earners | 2,004 (17.8%) | $51,887 |
| 1 Earner | 2,806 (24.9%) | $57,276 |
| 2 Earners | 5,371 (47.7%) | $100,411 |
| 3+ Earners | 1,066 (9.5%) | $141,875 |
| Total | 11,247 (100.0%) | $85,924 |
Household Income in Cerro Gordo County
Household Income Brackets in Cerro Gordo County
With 3,734 households falling in the category, the $50,000 to $74,999 income range is the most frequent in Cerro Gordo County, accounting for 19.2% of all households. In contrast, only 681 households (3.5%) fall into the less than $10,000 income bracket, making it the least populous group.
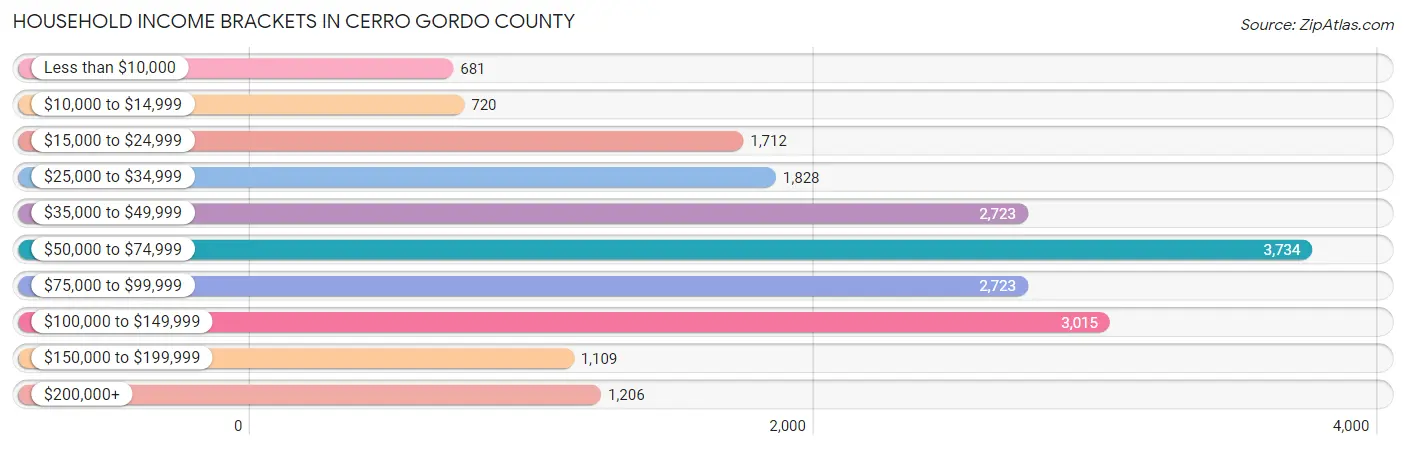
| Income Bracket | # Households | % Households |
| Less than $10,000 | 681 | 3.5% |
| $10,000 to $14,999 | 720 | 3.7% |
| $15,000 to $24,999 | 1,712 | 8.8% |
| $25,000 to $34,999 | 1,828 | 9.4% |
| $35,000 to $49,999 | 2,723 | 14.0% |
| $50,000 to $74,999 | 3,734 | 19.2% |
| $75,000 to $99,999 | 2,723 | 14.0% |
| $100,000 to $149,999 | 3,015 | 15.5% |
| $150,000 to $199,999 | 1,109 | 5.7% |
| $200,000+ | 1,206 | 6.2% |
Household Income by Householder Age in Cerro Gordo County
The median household income in Cerro Gordo County is $63,149, with the highest median household income of $76,471 found in the 25 to 44 years age bracket for the primary householder. A total of 5,178 households (26.6%) fall into this category. Meanwhile, the 15 to 24 years age bracket for the primary householder has the lowest median household income of $43,063, with 1,053 households (5.4%) in this group.
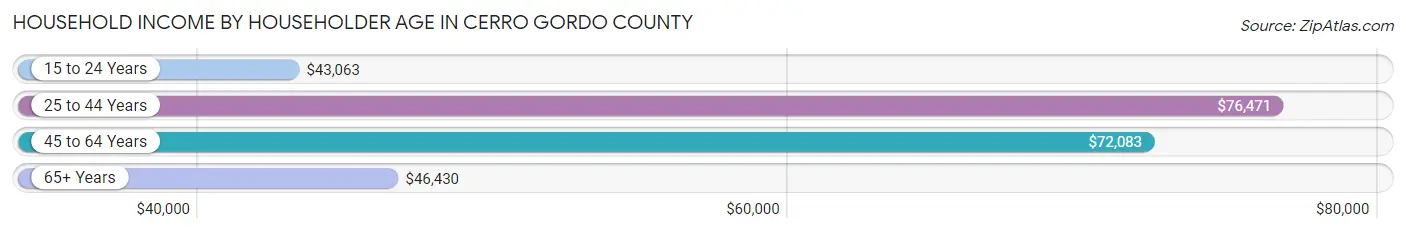
| Income Bracket | # Households | Median Income |
| 15 to 24 Years | 1,053 (5.4%) | $43,063 |
| 25 to 44 Years | 5,178 (26.6%) | $76,471 |
| 45 to 64 Years | 7,143 (36.7%) | $72,083 |
| 65+ Years | 6,076 (31.2%) | $46,430 |
| Total | 19,450 (100.0%) | $63,149 |
Poverty in Cerro Gordo County
Income Below Poverty by Sex and Age in Cerro Gordo County
With 8.0% poverty level for males and 10.6% for females among the residents of Cerro Gordo County, 5 year old males and 5 year old females are the most vulnerable to poverty, with 63 males (18.5%) and 71 females (34.1%) in their respective age groups living below the poverty level.
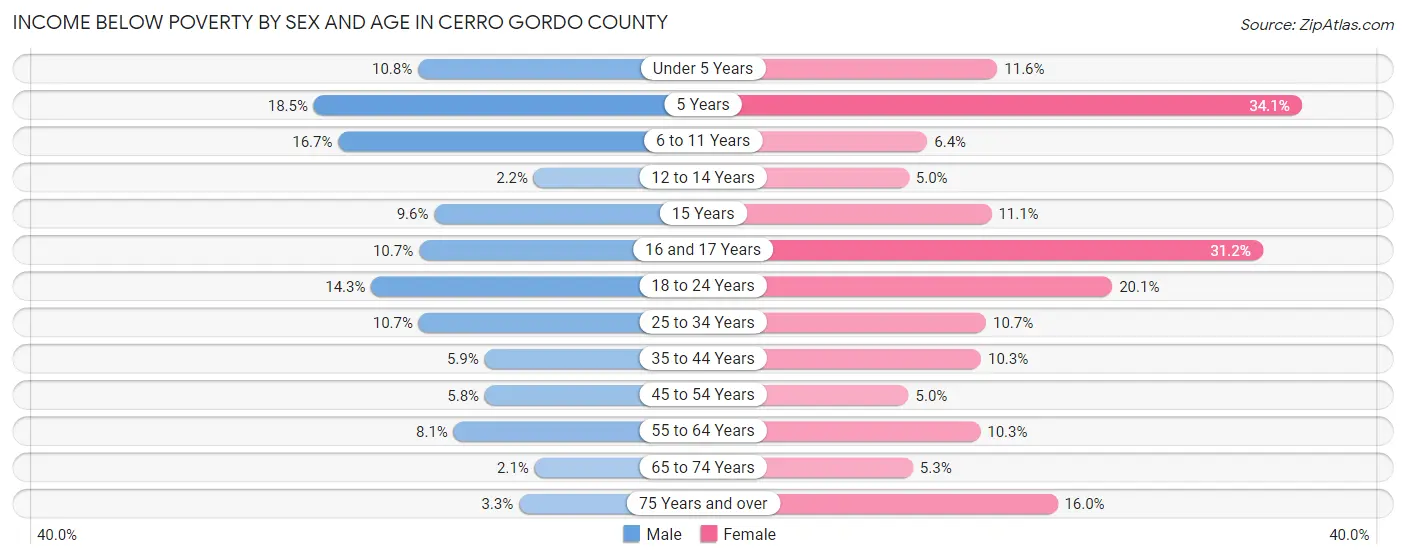
| Age Bracket | Male | Female |
| Under 5 Years | 129 (10.8%) | 116 (11.6%) |
| 5 Years | 63 (18.5%) | 71 (34.1%) |
| 6 to 11 Years | 239 (16.7%) | 85 (6.4%) |
| 12 to 14 Years | 19 (2.2%) | 44 (5.0%) |
| 15 Years | 23 (9.6%) | 36 (11.1%) |
| 16 and 17 Years | 70 (10.7%) | 124 (31.2%) |
| 18 to 24 Years | 218 (14.3%) | 300 (20.1%) |
| 25 to 34 Years | 267 (10.7%) | 256 (10.7%) |
| 35 to 44 Years | 147 (5.9%) | 228 (10.3%) |
| 45 to 54 Years | 133 (5.8%) | 121 (5.0%) |
| 55 to 64 Years | 275 (8.1%) | 347 (10.3%) |
| 65 to 74 Years | 55 (2.1%) | 146 (5.3%) |
| 75 Years and over | 49 (3.3%) | 368 (16.0%) |
| Total | 1,687 (8.0%) | 2,242 (10.6%) |
Income Above Poverty by Sex and Age in Cerro Gordo County
According to the poverty statistics in Cerro Gordo County, males aged 65 to 74 years and females aged 45 to 54 years are the age groups that are most secure financially, with 97.9% of males and 95.0% of females in these age groups living above the poverty line.
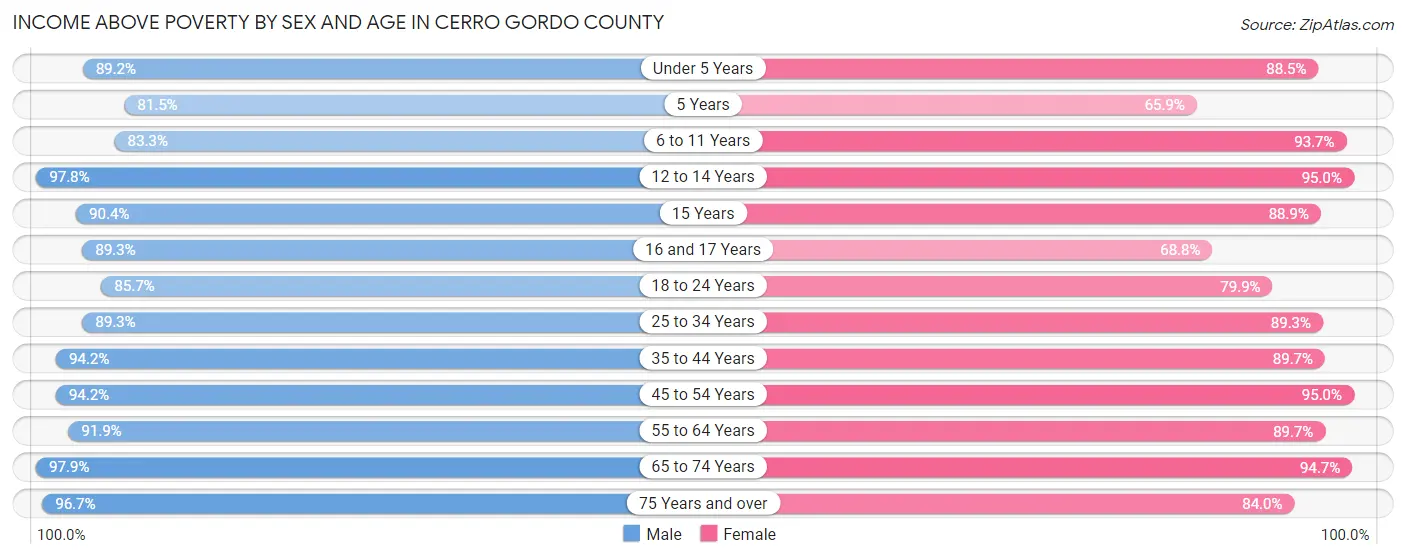
| Age Bracket | Male | Female |
| Under 5 Years | 1,067 (89.2%) | 888 (88.4%) |
| 5 Years | 277 (81.5%) | 137 (65.9%) |
| 6 to 11 Years | 1,191 (83.3%) | 1,253 (93.6%) |
| 12 to 14 Years | 847 (97.8%) | 839 (95.0%) |
| 15 Years | 217 (90.4%) | 288 (88.9%) |
| 16 and 17 Years | 583 (89.3%) | 273 (68.8%) |
| 18 to 24 Years | 1,311 (85.7%) | 1,194 (79.9%) |
| 25 to 34 Years | 2,222 (89.3%) | 2,134 (89.3%) |
| 35 to 44 Years | 2,366 (94.2%) | 1,977 (89.7%) |
| 45 to 54 Years | 2,153 (94.2%) | 2,320 (95.0%) |
| 55 to 64 Years | 3,103 (91.9%) | 3,028 (89.7%) |
| 65 to 74 Years | 2,529 (97.9%) | 2,620 (94.7%) |
| 75 Years and over | 1,441 (96.7%) | 1,931 (84.0%) |
| Total | 19,307 (92.0%) | 18,882 (89.4%) |
Income Below Poverty Among Married-Couple Families in Cerro Gordo County
The poverty statistics for married-couple families in Cerro Gordo County show that 1.8% or 163 of the total 8,939 families live below the poverty line. Families with 5 or more children have the highest poverty rate of 9.3%, comprising of 5 families. On the other hand, families with 1 or 2 children have the lowest poverty rate of 1.3%, which includes 28 families.
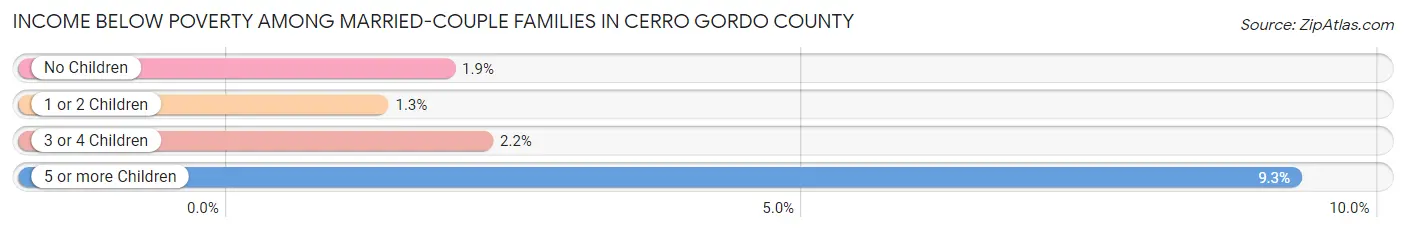
| Children | Above Poverty | Below Poverty |
| No Children | 5,916 (98.1%) | 114 (1.9%) |
| 1 or 2 Children | 2,107 (98.7%) | 28 (1.3%) |
| 3 or 4 Children | 704 (97.8%) | 16 (2.2%) |
| 5 or more Children | 49 (90.7%) | 5 (9.3%) |
| Total | 8,776 (98.2%) | 163 (1.8%) |
Income Below Poverty Among Single-Parent Households in Cerro Gordo County
According to the poverty data in Cerro Gordo County, 10.2% or 80 single-father households and 24.6% or 376 single-mother households are living below the poverty line. Among single-father households, those with 3 or 4 children have the highest poverty rate, with 13 households (29.5%) experiencing poverty. Likewise, among single-mother households, those with 3 or 4 children have the highest poverty rate, with 160 households (59.7%) falling below the poverty line.
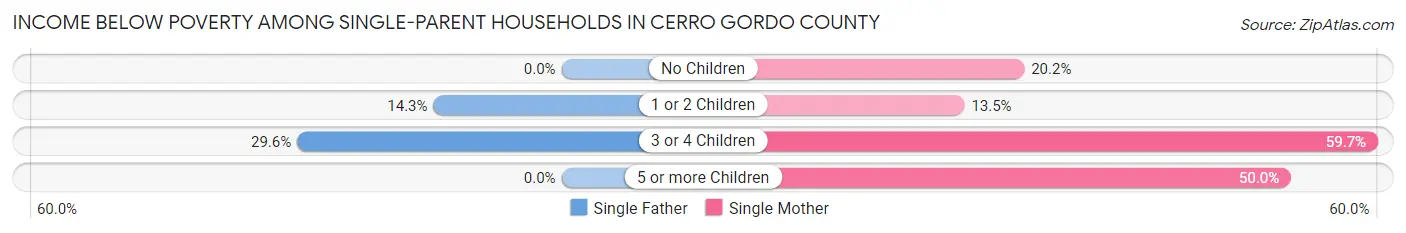
| Children | Single Father | Single Mother |
| No Children | 0 (0.0%) | 113 (20.2%) |
| 1 or 2 Children | 67 (14.3%) | 91 (13.5%) |
| 3 or 4 Children | 13 (29.5%) | 160 (59.7%) |
| 5 or more Children | 0 (0.0%) | 12 (50.0%) |
| Total | 80 (10.2%) | 376 (24.6%) |
Income Below Poverty Among Married-Couple vs Single-Parent Households in Cerro Gordo County
The poverty data for Cerro Gordo County shows that 163 of the married-couple family households (1.8%) and 456 of the single-parent households (19.8%) are living below the poverty level. Within the married-couple family households, those with 5 or more children have the highest poverty rate, with 5 households (9.3%) falling below the poverty line. Among the single-parent households, those with 3 or 4 children have the highest poverty rate, with 173 household (55.4%) living below poverty.
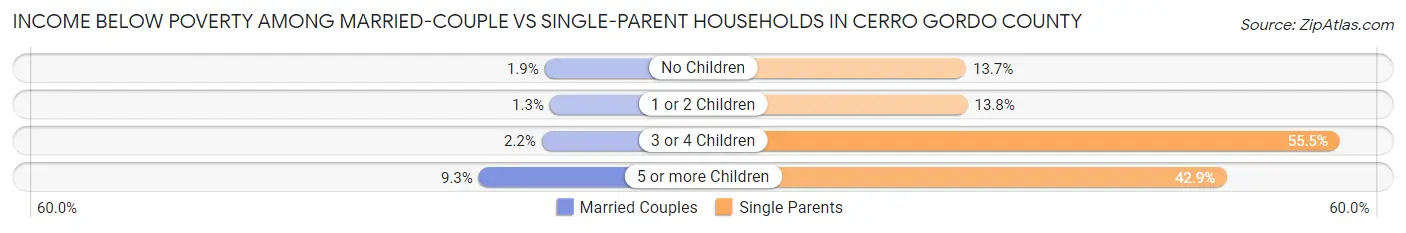
| Children | Married-Couple Families | Single-Parent Households |
| No Children | 114 (1.9%) | 113 (13.7%) |
| 1 or 2 Children | 28 (1.3%) | 158 (13.8%) |
| 3 or 4 Children | 16 (2.2%) | 173 (55.4%) |
| 5 or more Children | 5 (9.3%) | 12 (42.9%) |
| Total | 163 (1.8%) | 456 (19.8%) |
Race in Cerro Gordo County
The most populous races in Cerro Gordo County are White / Caucasian (39,583 | 92.1%), Hispanic or Latino (2,309 | 5.4%), and Two or more Races (1,610 | 3.7%).
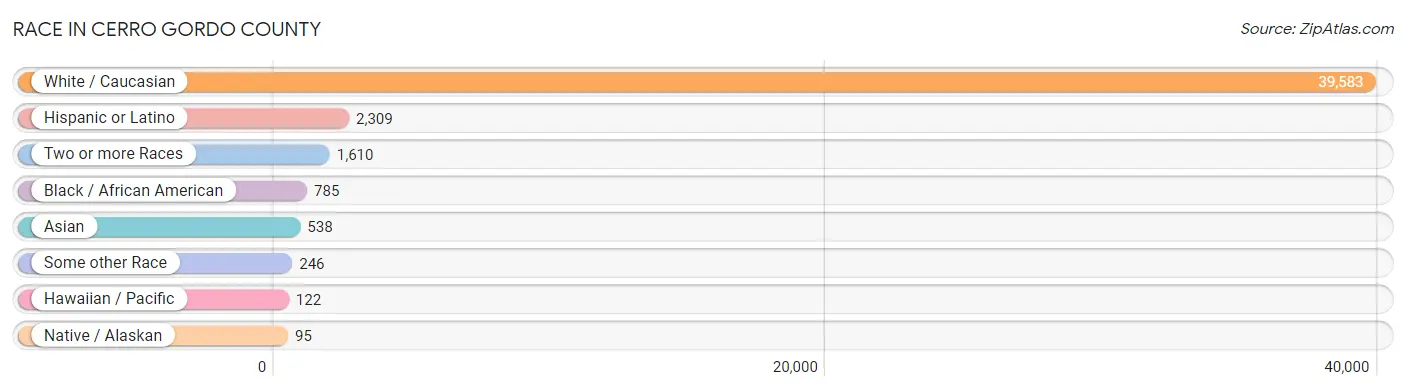
| Race | # Population | % Population |
| Asian | 538 | 1.3% |
| Black / African American | 785 | 1.8% |
| Hawaiian / Pacific | 122 | 0.3% |
| Hispanic or Latino | 2,309 | 5.4% |
| Native / Alaskan | 95 | 0.2% |
| White / Caucasian | 39,583 | 92.1% |
| Two or more Races | 1,610 | 3.7% |
| Some other Race | 246 | 0.6% |
| Total | 42,979 | 100.0% |
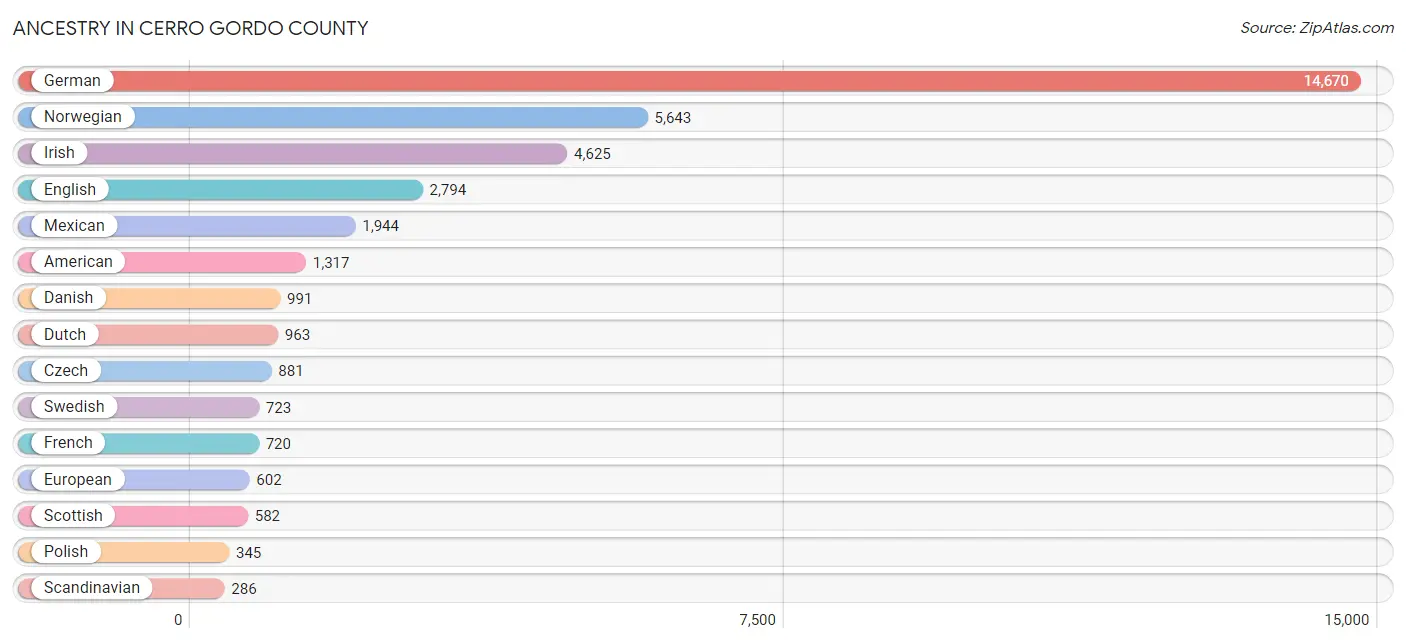
Ancestry in Cerro Gordo County
The most populous ancestries reported in Cerro Gordo County are German (14,670 | 34.1%), Norwegian (5,643 | 13.1%), Irish (4,625 | 10.8%), English (2,794 | 6.5%), and Mexican (1,944 | 4.5%), together accounting for 69.0% of all Cerro Gordo County residents.
| Ancestry | # Population | % Population |
| African | 41 | 0.1% |
| American | 1,317 | 3.1% |
| Arab | 169 | 0.4% |
| Australian | 5 | 0.0% |
| Austrian | 33 | 0.1% |
| Belgian | 67 | 0.2% |
| Bhutanese | 11 | 0.0% |
| Bolivian | 112 | 0.3% |
| British | 66 | 0.2% |
| Burmese | 66 | 0.2% |
| Canadian | 46 | 0.1% |
| Central American | 24 | 0.1% |
| Central American Indian | 23 | 0.1% |
| Cherokee | 60 | 0.1% |
| Croatian | 10 | 0.0% |
| Czech | 881 | 2.1% |
| Czechoslovakian | 26 | 0.1% |
| Danish | 991 | 2.3% |
| Dutch | 963 | 2.2% |
| Eastern European | 36 | 0.1% |
| English | 2,794 | 6.5% |
| European | 602 | 1.4% |
| Finnish | 32 | 0.1% |
| French | 720 | 1.7% |
| French Canadian | 74 | 0.2% |
| German | 14,670 | 34.1% |
| Ghanaian | 6 | 0.0% |
| Greek | 205 | 0.5% |
| Guamanian / Chamorro | 1 | 0.0% |
| Guatemalan | 11 | 0.0% |
| Honduran | 4 | 0.0% |
| Hungarian | 39 | 0.1% |
| Icelander | 52 | 0.1% |
| Indian (Asian) | 203 | 0.5% |
| Irish | 4,625 | 10.8% |
| Italian | 261 | 0.6% |
| Kenyan | 7 | 0.0% |
| Korean | 33 | 0.1% |
| Laotian | 4 | 0.0% |
| Lebanese | 12 | 0.0% |
| Lithuanian | 28 | 0.1% |
| Macedonian | 12 | 0.0% |
| Malaysian | 141 | 0.3% |
| Mexican | 1,944 | 4.5% |
| Moroccan | 45 | 0.1% |
| Native Hawaiian | 10 | 0.0% |
| Northern European | 57 | 0.1% |
| Norwegian | 5,643 | 13.1% |
| Pakistani | 1 | 0.0% |
| Pennsylvania German | 24 | 0.1% |
| Polish | 345 | 0.8% |
| Portuguese | 35 | 0.1% |
| Puerto Rican | 162 | 0.4% |
| Russian | 215 | 0.5% |
| Salvadoran | 9 | 0.0% |
| Scandinavian | 286 | 0.7% |
| Scotch-Irish | 228 | 0.5% |
| Scottish | 582 | 1.3% |
| Serbian | 25 | 0.1% |
| Sioux | 26 | 0.1% |
| Slovak | 14 | 0.0% |
| South American | 112 | 0.3% |
| Spaniard | 51 | 0.1% |
| Sri Lankan | 170 | 0.4% |
| Subsaharan African | 68 | 0.2% |
| Swedish | 723 | 1.7% |
| Swiss | 91 | 0.2% |
| Syrian | 49 | 0.1% |
| Ukrainian | 50 | 0.1% |
| Welsh | 285 | 0.7% |
| Yugoslavian | 14 | 0.0% | View All 71 Rows |
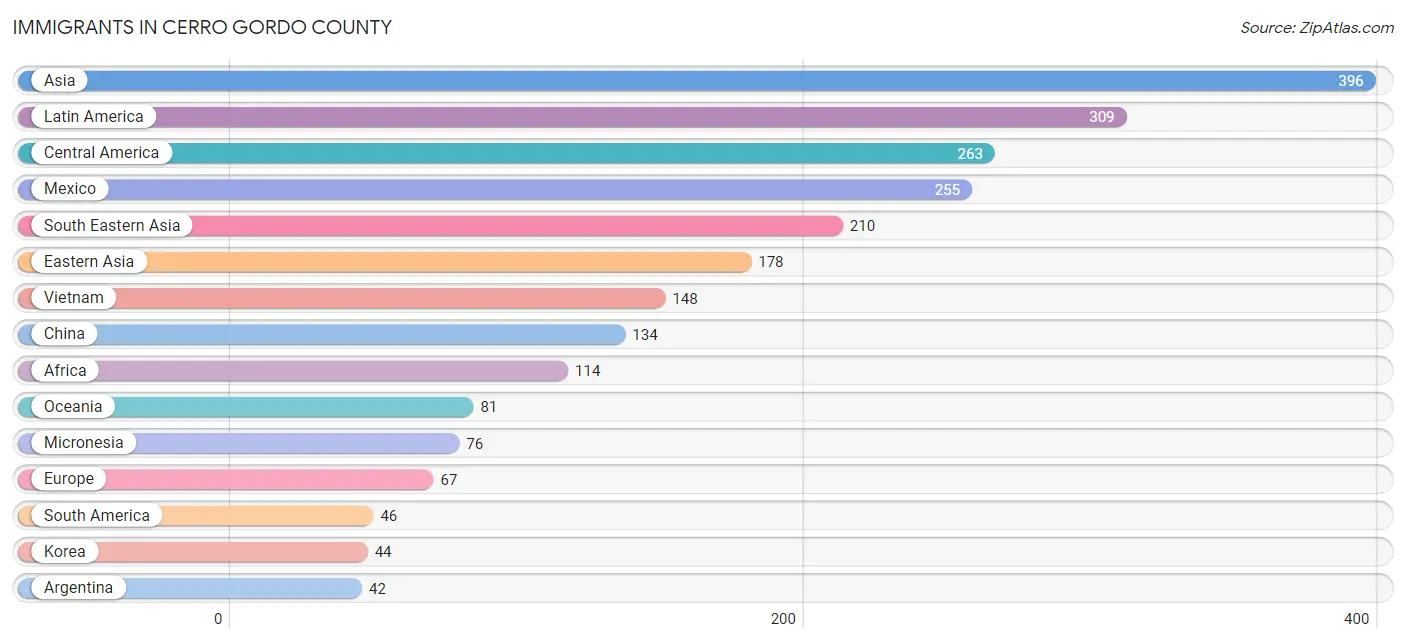
Immigrants in Cerro Gordo County
The most numerous immigrant groups reported in Cerro Gordo County came from Asia (396 | 0.9%), Latin America (309 | 0.7%), Central America (263 | 0.6%), Mexico (255 | 0.6%), and South Eastern Asia (210 | 0.5%), together accounting for 3.3% of all Cerro Gordo County residents.
| Immigration Origin | # Population | % Population |
| Africa | 114 | 0.3% |
| Argentina | 42 | 0.1% |
| Asia | 396 | 0.9% |
| Australia | 5 | 0.0% |
| Bosnia and Herzegovina | 14 | 0.0% |
| Central America | 263 | 0.6% |
| China | 134 | 0.3% |
| Colombia | 4 | 0.0% |
| Eastern Africa | 7 | 0.0% |
| Eastern Asia | 178 | 0.4% |
| Eastern Europe | 29 | 0.1% |
| England | 28 | 0.1% |
| Europe | 67 | 0.2% |
| Germany | 10 | 0.0% |
| Ghana | 6 | 0.0% |
| Guatemala | 6 | 0.0% |
| Honduras | 2 | 0.0% |
| Indonesia | 11 | 0.0% |
| Kenya | 7 | 0.0% |
| Korea | 44 | 0.1% |
| Laos | 25 | 0.1% |
| Latin America | 309 | 0.7% |
| Mexico | 255 | 0.6% |
| Micronesia | 76 | 0.2% |
| Middle Africa | 31 | 0.1% |
| Morocco | 29 | 0.1% |
| Northern Africa | 29 | 0.1% |
| Northern Europe | 28 | 0.1% |
| Oceania | 81 | 0.2% |
| Pakistan | 8 | 0.0% |
| Philippines | 25 | 0.1% |
| Russia | 15 | 0.0% |
| South America | 46 | 0.1% |
| South Central Asia | 8 | 0.0% |
| South Eastern Asia | 210 | 0.5% |
| Thailand | 1 | 0.0% |
| Vietnam | 148 | 0.3% |
| Western Africa | 20 | 0.1% |
| Western Europe | 10 | 0.0% |
| Zaire | 31 | 0.1% | View All 40 Rows |
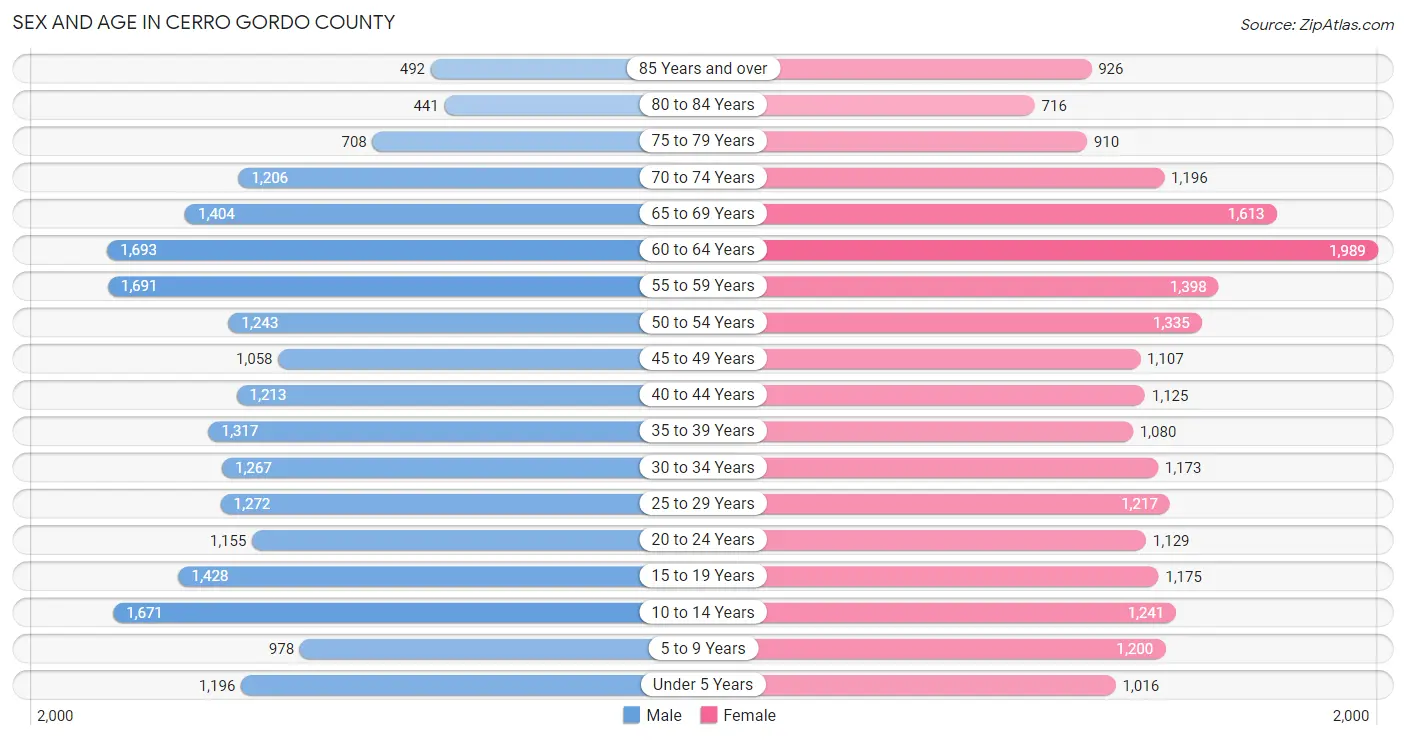
Sex and Age in Cerro Gordo County
Sex and Age in Cerro Gordo County
The most populous age groups in Cerro Gordo County are 60 to 64 Years (1,693 | 7.9%) for men and 60 to 64 Years (1,989 | 9.2%) for women.
| Age Bracket | Male | Female |
| Under 5 Years | 1,196 (5.6%) | 1,016 (4.7%) |
| 5 to 9 Years | 978 (4.6%) | 1,200 (5.6%) |
| 10 to 14 Years | 1,671 (7.8%) | 1,241 (5.8%) |
| 15 to 19 Years | 1,428 (6.7%) | 1,175 (5.4%) |
| 20 to 24 Years | 1,155 (5.4%) | 1,129 (5.2%) |
| 25 to 29 Years | 1,272 (5.9%) | 1,217 (5.7%) |
| 30 to 34 Years | 1,267 (5.9%) | 1,173 (5.4%) |
| 35 to 39 Years | 1,317 (6.1%) | 1,080 (5.0%) |
| 40 to 44 Years | 1,213 (5.7%) | 1,125 (5.2%) |
| 45 to 49 Years | 1,058 (4.9%) | 1,107 (5.1%) |
| 50 to 54 Years | 1,243 (5.8%) | 1,335 (6.2%) |
| 55 to 59 Years | 1,691 (7.9%) | 1,398 (6.5%) |
| 60 to 64 Years | 1,693 (7.9%) | 1,989 (9.2%) |
| 65 to 69 Years | 1,404 (6.6%) | 1,613 (7.5%) |
| 70 to 74 Years | 1,206 (5.6%) | 1,196 (5.6%) |
| 75 to 79 Years | 708 (3.3%) | 910 (4.2%) |
| 80 to 84 Years | 441 (2.1%) | 716 (3.3%) |
| 85 Years and over | 492 (2.3%) | 926 (4.3%) |
| Total | 21,433 (100.0%) | 21,546 (100.0%) |
Families and Households in Cerro Gordo County
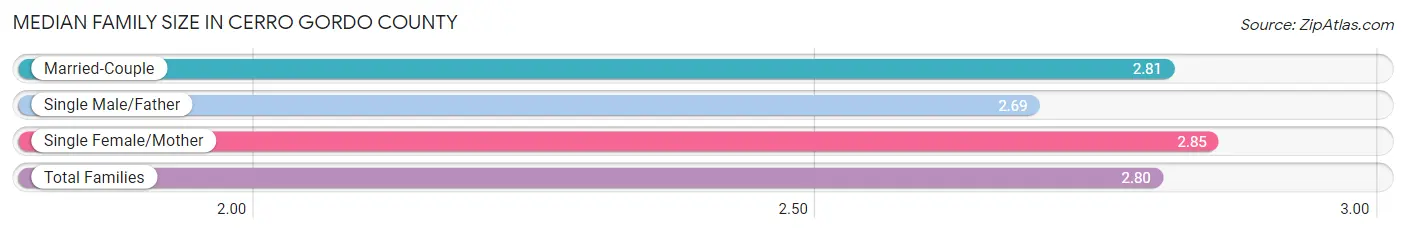
Median Family Size in Cerro Gordo County
The median family size in Cerro Gordo County is 2.80 persons per family, with single female/mother families (1,526 | 13.6%) accounting for the largest median family size of 2.85 persons per family. On the other hand, single male/father families (782 | 7.0%) represent the smallest median family size with 2.69 persons per family.
| Family Type | # Families | Family Size |
| Married-Couple | 8,939 (79.5%) | 2.81 |
| Single Male/Father | 782 (7.0%) | 2.69 |
| Single Female/Mother | 1,526 (13.6%) | 2.85 |
| Total Families | 11,247 (100.0%) | 2.80 |
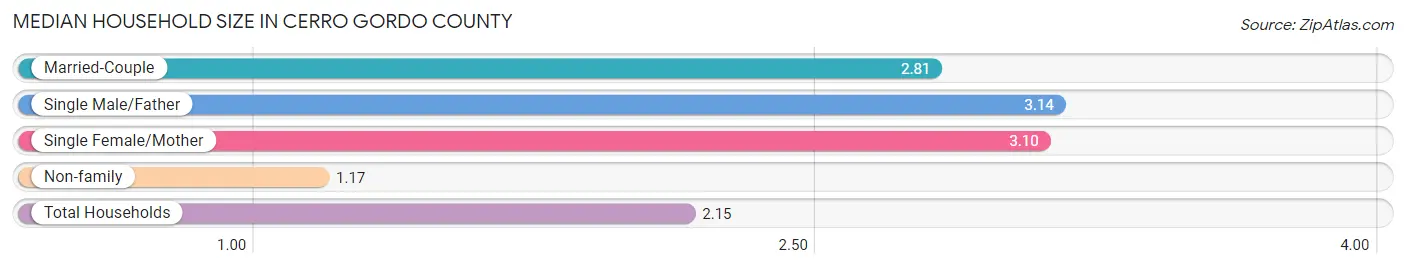
Median Household Size in Cerro Gordo County
The median household size in Cerro Gordo County is 2.15 persons per household, with single male/father households (782 | 4.0%) accounting for the largest median household size of 3.14 persons per household. non-family households (8,203 | 42.2%) represent the smallest median household size with 1.17 persons per household.
| Household Type | # Households | Household Size |
| Married-Couple | 8,939 (46.0%) | 2.81 |
| Single Male/Father | 782 (4.0%) | 3.14 |
| Single Female/Mother | 1,526 (7.9%) | 3.10 |
| Non-family | 8,203 (42.2%) | 1.17 |
| Total Households | 19,450 (100.0%) | 2.15 |
Household Size by Marriage Status in Cerro Gordo County
Out of a total of 19,450 households in Cerro Gordo County, 11,247 (57.8%) are family households, while 8,203 (42.2%) are nonfamily households. The most numerous type of family households are 2-person households, comprising 6,201, and the most common type of nonfamily households are 1-person households, comprising 6,942.
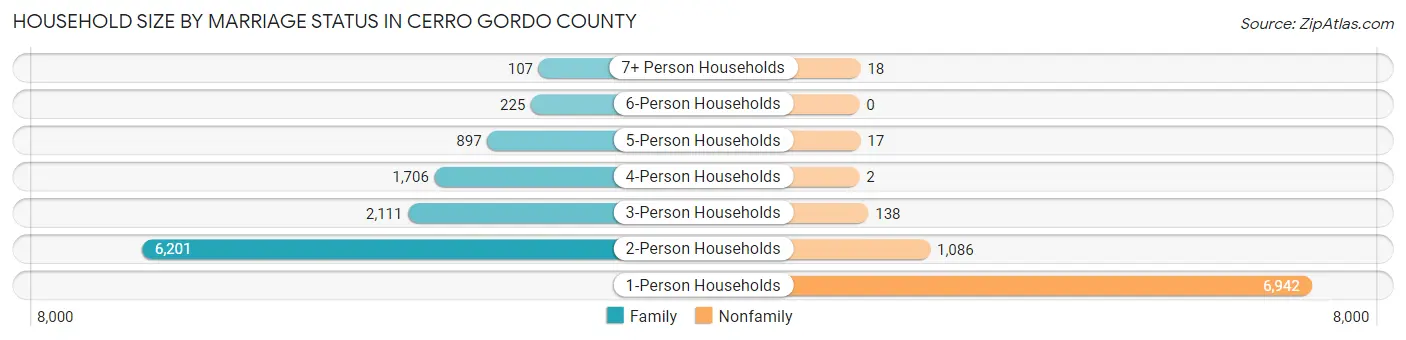
| Household Size | Family Households | Nonfamily Households |
| 1-Person Households | - | 6,942 (35.7%) |
| 2-Person Households | 6,201 (31.9%) | 1,086 (5.6%) |
| 3-Person Households | 2,111 (10.8%) | 138 (0.7%) |
| 4-Person Households | 1,706 (8.8%) | 2 (0.0%) |
| 5-Person Households | 897 (4.6%) | 17 (0.1%) |
| 6-Person Households | 225 (1.2%) | 0 (0.0%) |
| 7+ Person Households | 107 (0.5%) | 18 (0.1%) |
| Total | 11,247 (57.8%) | 8,203 (42.2%) |
Female Fertility in Cerro Gordo County
Fertility by Age in Cerro Gordo County
Average fertility rate in Cerro Gordo County is 106.0 births per 1,000 women. Women in the age bracket of 20 to 34 years have the highest fertility rate with 178.0 births per 1,000 women. Women in the age bracket of 20 to 34 years acount for 71.8% of all women with births.
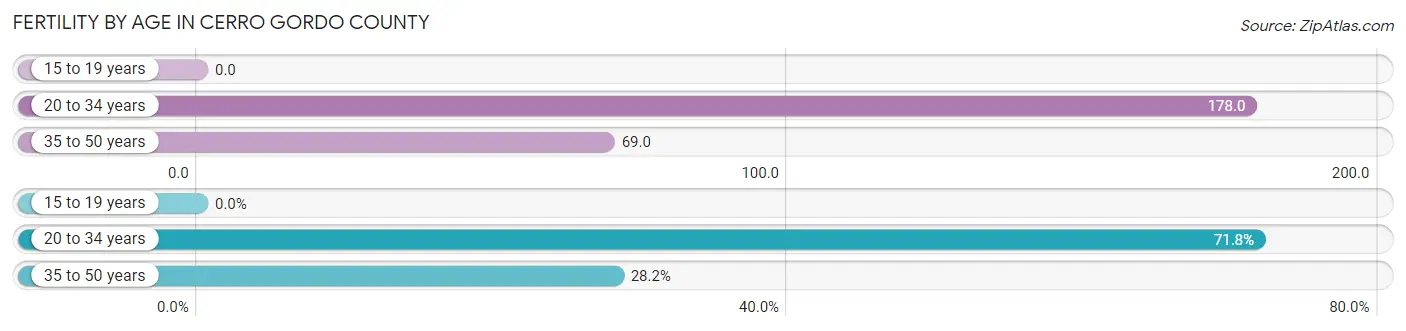
| Age Bracket | Women with Births | Births / 1,000 Women |
| 15 to 19 years | 0 (0.0%) | 0.0 |
| 20 to 34 years | 626 (71.8%) | 178.0 |
| 35 to 50 years | 246 (28.2%) | 69.0 |
| Total | 872 (100.0%) | 106.0 |
Fertility by Age by Marriage Status in Cerro Gordo County
70.1% of women with births (872) in Cerro Gordo County are married. The highest percentage of unmarried women with births falls into 20 to 34 years age bracket with 38.3% of them unmarried at the time of birth, while the lowest percentage of unmarried women with births belong to 35 to 50 years age bracket with 8.5% of them unmarried.
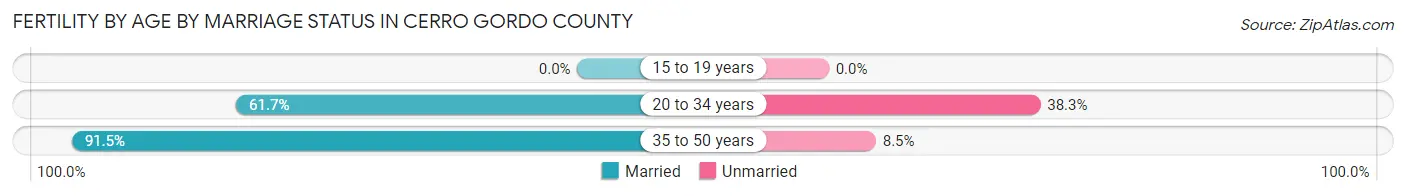
| Age Bracket | Married | Unmarried |
| 15 to 19 years | 0 (0.0%) | 0 (0.0%) |
| 20 to 34 years | 386 (61.7%) | 240 (38.3%) |
| 35 to 50 years | 225 (91.5%) | 21 (8.5%) |
| Total | 611 (70.1%) | 261 (29.9%) |
Fertility by Education in Cerro Gordo County
Average fertility rate in Cerro Gordo County is 106.0 births per 1,000 women. Women with the education attainment of less than high school have the highest fertility rate of 158.0 births per 1,000 women, while women with the education attainment of high school diploma have the lowest fertility at 75.0 births per 1,000 women. Women with the education attainment of college or associate's degree represent 38.9% of all women with births.
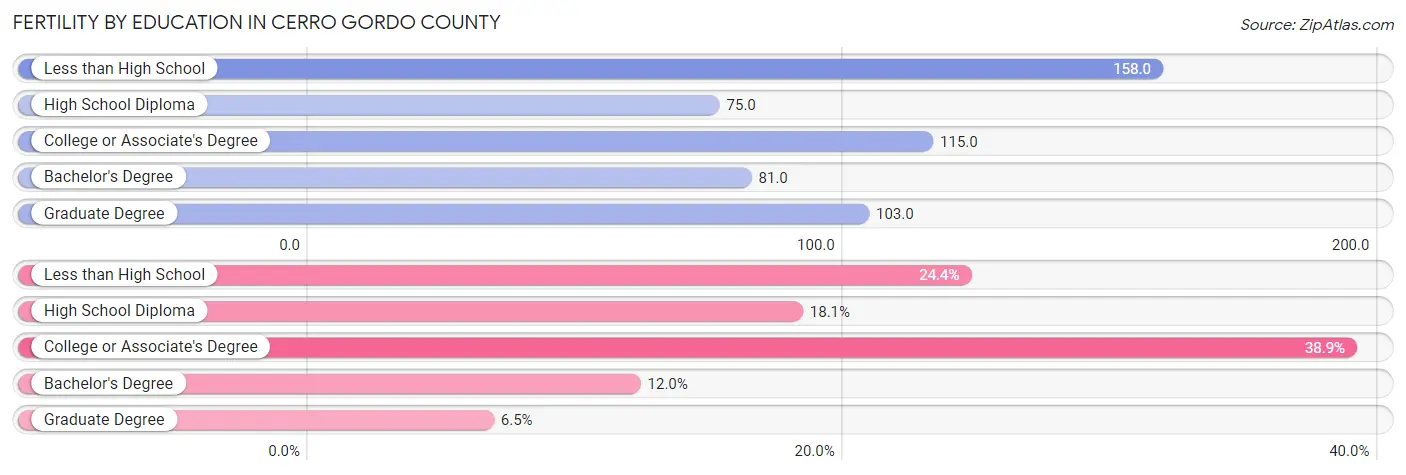
| Educational Attainment | Women with Births | Births / 1,000 Women |
| Less than High School | 213 (24.4%) | 158.0 |
| High School Diploma | 158 (18.1%) | 75.0 |
| College or Associate's Degree | 339 (38.9%) | 115.0 |
| Bachelor's Degree | 105 (12.0%) | 81.0 |
| Graduate Degree | 57 (6.5%) | 103.0 |
| Total | 872 (100.0%) | 106.0 |
Fertility by Education by Marriage Status in Cerro Gordo County
29.9% of women with births in Cerro Gordo County are unmarried. Women with the educational attainment of bachelor's degree are most likely to be married with 100.0% of them married at childbirth, while women with the educational attainment of high school diploma are least likely to be married with 41.8% of them unmarried at childbirth.
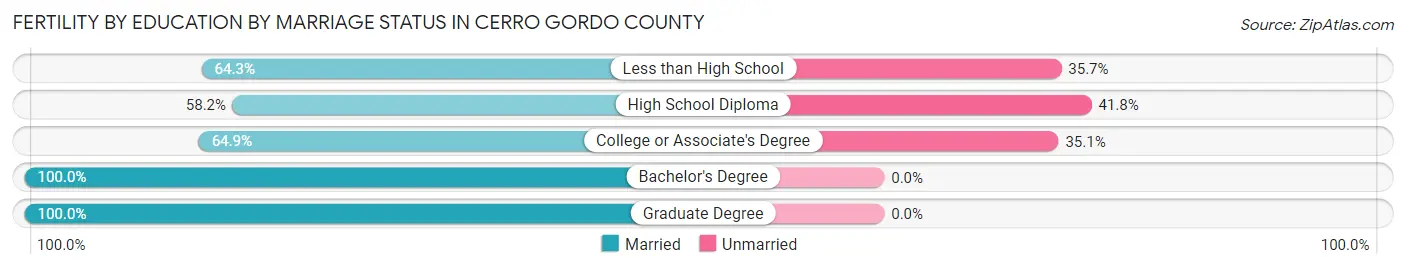
| Educational Attainment | Married | Unmarried |
| Less than High School | 137 (64.3%) | 76 (35.7%) |
| High School Diploma | 92 (58.2%) | 66 (41.8%) |
| College or Associate's Degree | 220 (64.9%) | 119 (35.1%) |
| Bachelor's Degree | 105 (100.0%) | 0 (0.0%) |
| Graduate Degree | 57 (100.0%) | 0 (0.0%) |
| Total | 611 (70.1%) | 261 (29.9%) |
Employment Characteristics in Cerro Gordo County
Employment by Class of Employer in Cerro Gordo County
Among the 21,675 employed individuals in Cerro Gordo County, private company employees (14,753 | 68.1%), not-for-profit organizations (2,041 | 9.4%), and local government employees (1,669 | 7.7%) make up the most common classes of employment.
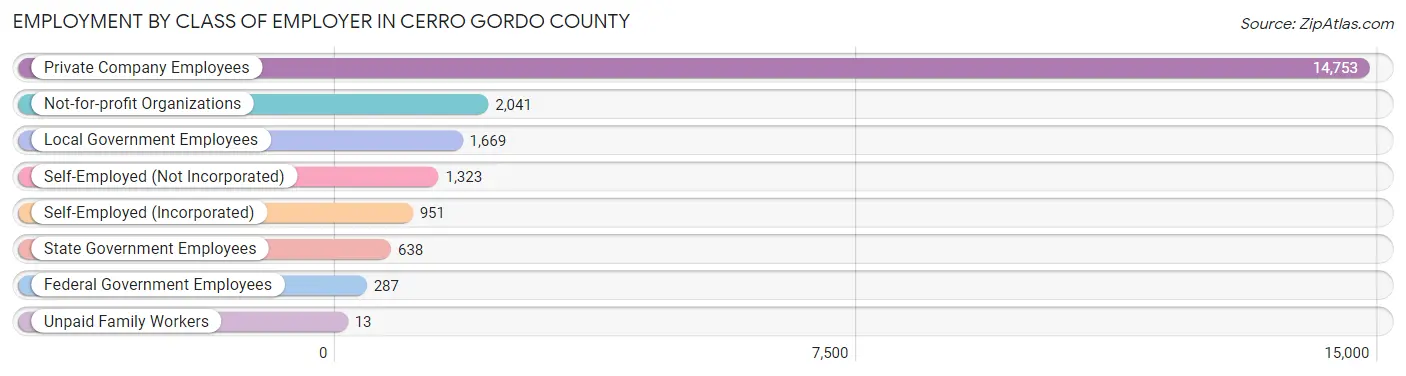
| Employer Class | # Employees | % Employees |
| Private Company Employees | 14,753 | 68.1% |
| Self-Employed (Incorporated) | 951 | 4.4% |
| Self-Employed (Not Incorporated) | 1,323 | 6.1% |
| Not-for-profit Organizations | 2,041 | 9.4% |
| Local Government Employees | 1,669 | 7.7% |
| State Government Employees | 638 | 2.9% |
| Federal Government Employees | 287 | 1.3% |
| Unpaid Family Workers | 13 | 0.1% |
| Total | 21,675 | 100.0% |
Employment Status by Age in Cerro Gordo County
According to the labor force statistics for Cerro Gordo County, out of the total population over 16 years of age (35,112), 64.6% or 22,682 individuals are in the labor force, with 3.0% or 680 of them unemployed. The age group with the highest labor force participation rate is 45 to 54 years, with 90.9% or 4,311 individuals in the labor force. Within the labor force, the 16 to 19 years age range has the highest percentage of unemployed individuals, with 9.4% or 121 of them being unemployed.
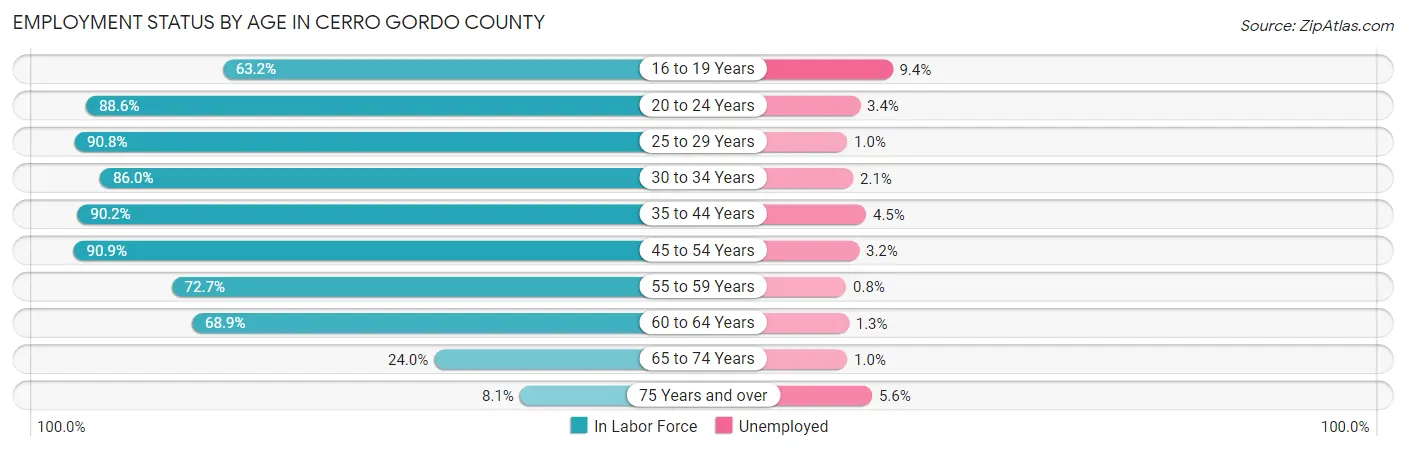
| Age Bracket | In Labor Force | Unemployed |
| 16 to 19 Years | 1,288 (63.2%) | 121 (9.4%) |
| 20 to 24 Years | 2,024 (88.6%) | 69 (3.4%) |
| 25 to 29 Years | 2,260 (90.8%) | 23 (1.0%) |
| 30 to 34 Years | 2,098 (86.0%) | 44 (2.1%) |
| 35 to 44 Years | 4,271 (90.2%) | 192 (4.5%) |
| 45 to 54 Years | 4,311 (90.9%) | 138 (3.2%) |
| 55 to 59 Years | 2,246 (72.7%) | 18 (0.8%) |
| 60 to 64 Years | 2,537 (68.9%) | 33 (1.3%) |
| 65 to 74 Years | 1,301 (24.0%) | 13 (1.0%) |
| 75 Years and over | 340 (8.1%) | 19 (5.6%) |
| Total | 22,682 (64.6%) | 680 (3.0%) |
Employment Status by Educational Attainment in Cerro Gordo County
According to labor force statistics for Cerro Gordo County, 83.7% of individuals (17,726) out of the total population between 25 and 64 years of age (21,178) are in the labor force, with 2.5% or 443 of them being unemployed. The group with the highest labor force participation rate are those with the educational attainment of bachelor's degree or higher, with 89.7% or 4,752 individuals in the labor force. Within the labor force, individuals with college / associate degree education have the highest percentage of unemployment, with 4.2% or 271 of them being unemployed.
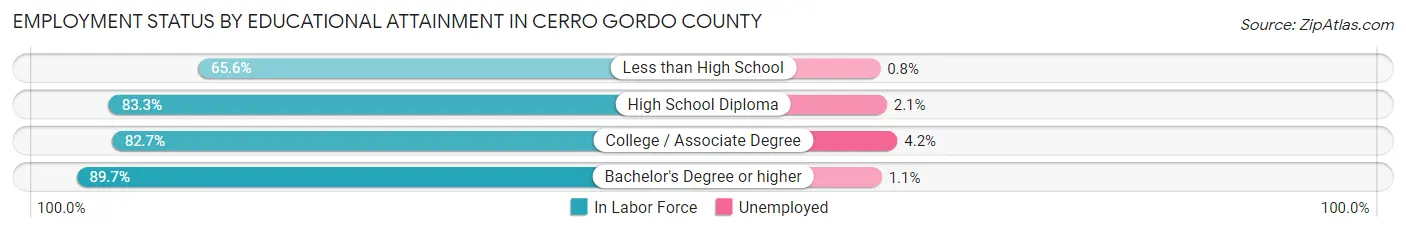
| Educational Attainment | In Labor Force | Unemployed |
| Less than High School | 761 (65.6%) | 9 (0.8%) |
| High School Diploma | 5,751 (83.3%) | 145 (2.1%) |
| College / Associate Degree | 6,464 (82.7%) | 328 (4.2%) |
| Bachelor's Degree or higher | 4,752 (89.7%) | 58 (1.1%) |
| Total | 17,726 (83.7%) | 529 (2.5%) |
Employment Occupations by Sex in Cerro Gordo County
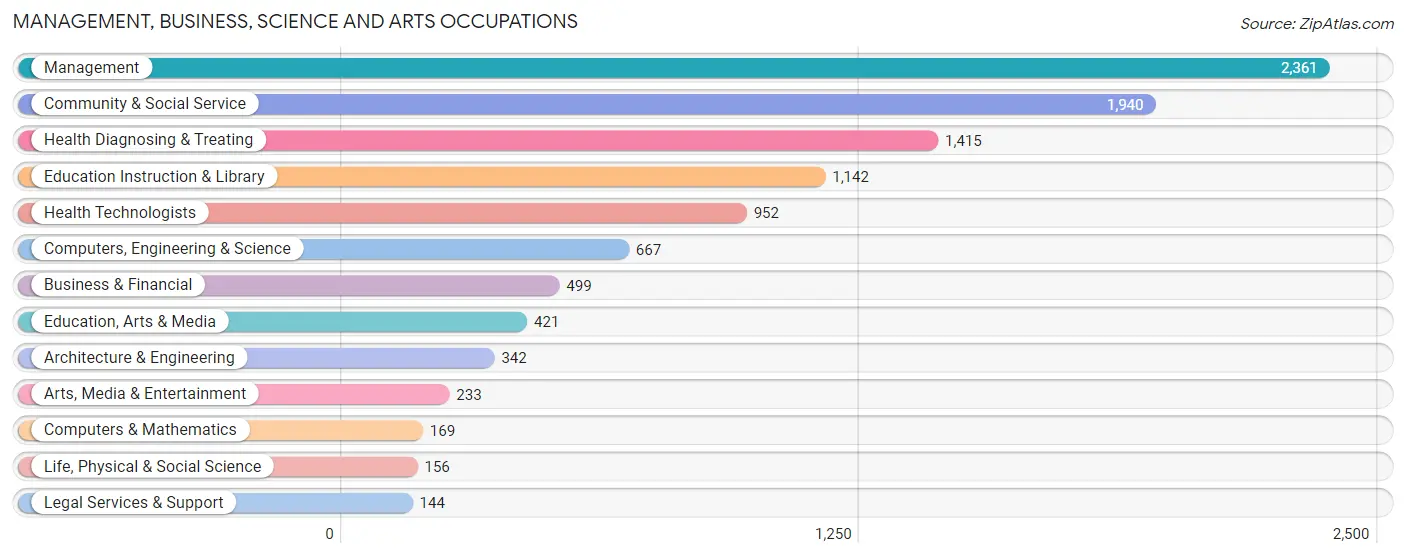
Management, Business, Science and Arts Occupations
The most common Management, Business, Science and Arts occupations in Cerro Gordo County are Management (2,361 | 10.7%), Community & Social Service (1,940 | 8.8%), Health Diagnosing & Treating (1,415 | 6.4%), Education Instruction & Library (1,142 | 5.2%), and Health Technologists (952 | 4.3%).
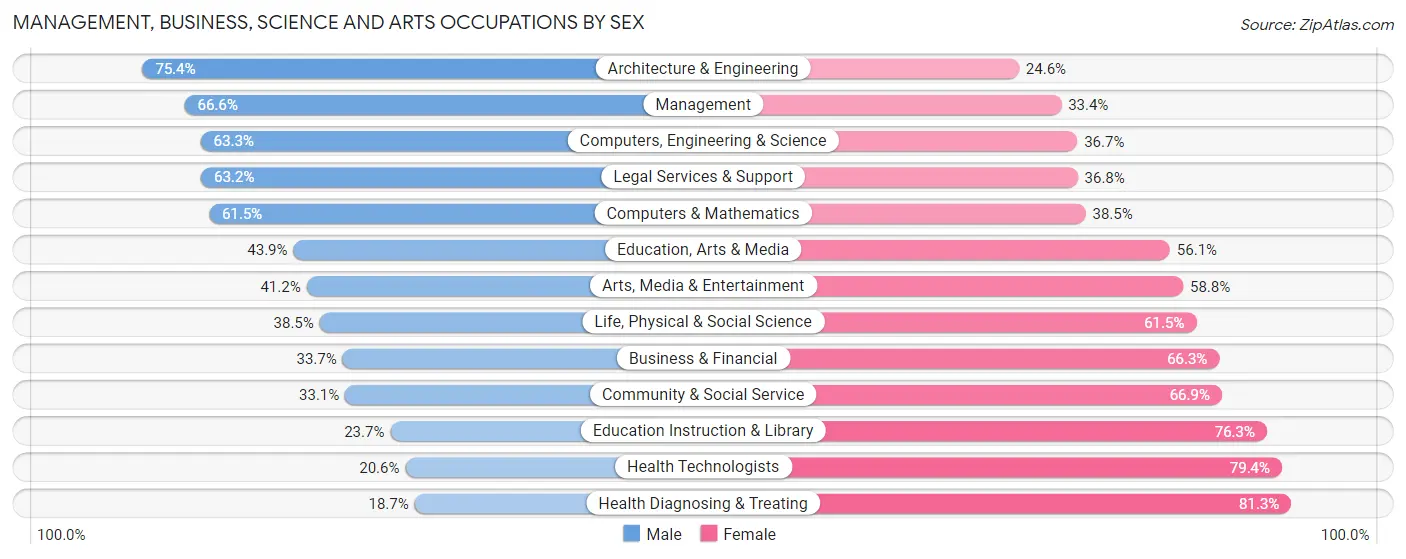
Management, Business, Science and Arts Occupations by Sex
Within the Management, Business, Science and Arts occupations in Cerro Gordo County, the most male-oriented occupations are Architecture & Engineering (75.4%), Management (66.6%), and Computers, Engineering & Science (63.3%), while the most female-oriented occupations are Health Diagnosing & Treating (81.3%), Health Technologists (79.4%), and Education Instruction & Library (76.3%).
| Occupation | Male | Female |
| Management | 1,573 (66.6%) | 788 (33.4%) |
| Business & Financial | 168 (33.7%) | 331 (66.3%) |
| Computers, Engineering & Science | 422 (63.3%) | 245 (36.7%) |
| Computers & Mathematics | 104 (61.5%) | 65 (38.5%) |
| Architecture & Engineering | 258 (75.4%) | 84 (24.6%) |
| Life, Physical & Social Science | 60 (38.5%) | 96 (61.5%) |
| Community & Social Service | 643 (33.1%) | 1,297 (66.9%) |
| Education, Arts & Media | 185 (43.9%) | 236 (56.1%) |
| Legal Services & Support | 91 (63.2%) | 53 (36.8%) |
| Education Instruction & Library | 271 (23.7%) | 871 (76.3%) |
| Arts, Media & Entertainment | 96 (41.2%) | 137 (58.8%) |
| Health Diagnosing & Treating | 264 (18.7%) | 1,151 (81.3%) |
| Health Technologists | 196 (20.6%) | 756 (79.4%) |
| Total (Category) | 3,070 (44.6%) | 3,812 (55.4%) |
| Total (Overall) | 11,427 (52.0%) | 10,562 (48.0%) |
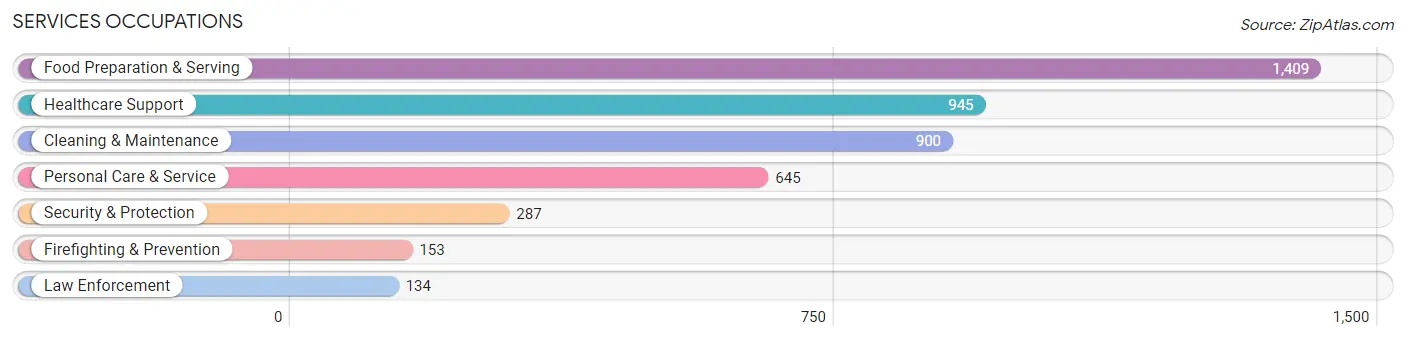
Services Occupations
The most common Services occupations in Cerro Gordo County are Food Preparation & Serving (1,409 | 6.4%), Healthcare Support (945 | 4.3%), Cleaning & Maintenance (900 | 4.1%), Personal Care & Service (645 | 2.9%), and Security & Protection (287 | 1.3%).
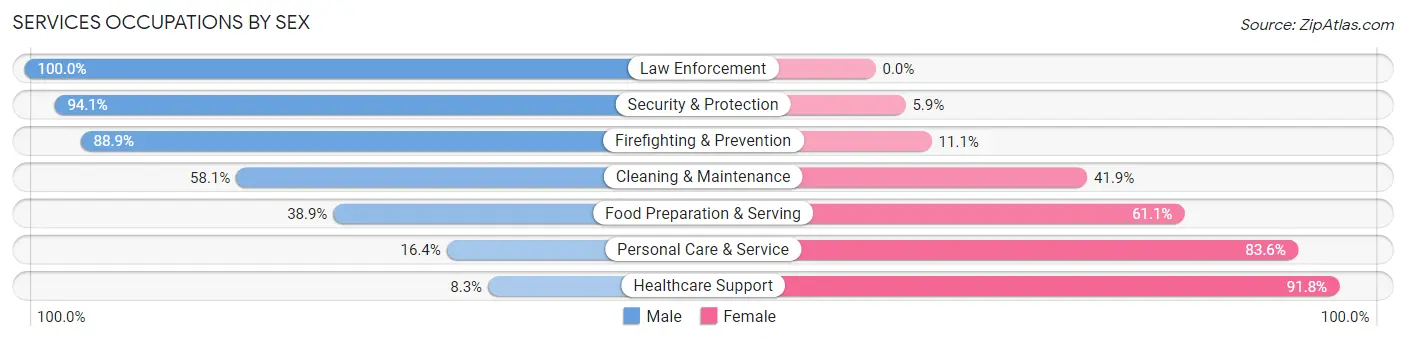
Services Occupations by Sex
Within the Services occupations in Cerro Gordo County, the most male-oriented occupations are Law Enforcement (100.0%), Security & Protection (94.1%), and Firefighting & Prevention (88.9%), while the most female-oriented occupations are Healthcare Support (91.7%), Personal Care & Service (83.6%), and Food Preparation & Serving (61.1%).
| Occupation | Male | Female |
| Healthcare Support | 78 (8.3%) | 867 (91.7%) |
| Security & Protection | 270 (94.1%) | 17 (5.9%) |
| Firefighting & Prevention | 136 (88.9%) | 17 (11.1%) |
| Law Enforcement | 134 (100.0%) | 0 (0.0%) |
| Food Preparation & Serving | 548 (38.9%) | 861 (61.1%) |
| Cleaning & Maintenance | 523 (58.1%) | 377 (41.9%) |
| Personal Care & Service | 106 (16.4%) | 539 (83.6%) |
| Total (Category) | 1,525 (36.4%) | 2,661 (63.6%) |
| Total (Overall) | 11,427 (52.0%) | 10,562 (48.0%) |
Sales and Office Occupations
The most common Sales and Office occupations in Cerro Gordo County are Sales & Related (2,796 | 12.7%), and Office & Administration (1,810 | 8.2%).

Sales and Office Occupations by Sex

| Occupation | Male | Female |
| Sales & Related | 1,345 (48.1%) | 1,451 (51.9%) |
| Office & Administration | 319 (17.6%) | 1,491 (82.4%) |
| Total (Category) | 1,664 (36.1%) | 2,942 (63.9%) |
| Total (Overall) | 11,427 (52.0%) | 10,562 (48.0%) |
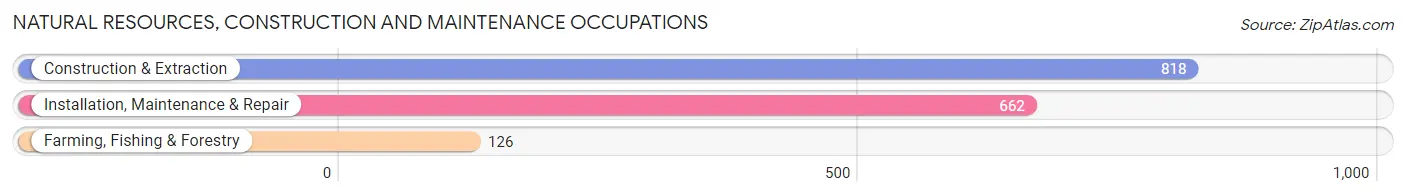
Natural Resources, Construction and Maintenance Occupations
The most common Natural Resources, Construction and Maintenance occupations in Cerro Gordo County are Construction & Extraction (818 | 3.7%), Installation, Maintenance & Repair (662 | 3.0%), and Farming, Fishing & Forestry (126 | 0.6%).
Natural Resources, Construction and Maintenance Occupations by Sex
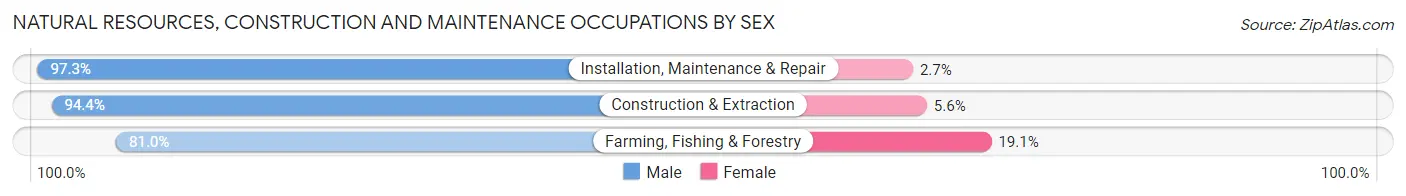
| Occupation | Male | Female |
| Farming, Fishing & Forestry | 102 (80.9%) | 24 (19.1%) |
| Construction & Extraction | 772 (94.4%) | 46 (5.6%) |
| Installation, Maintenance & Repair | 644 (97.3%) | 18 (2.7%) |
| Total (Category) | 1,518 (94.5%) | 88 (5.5%) |
| Total (Overall) | 11,427 (52.0%) | 10,562 (48.0%) |
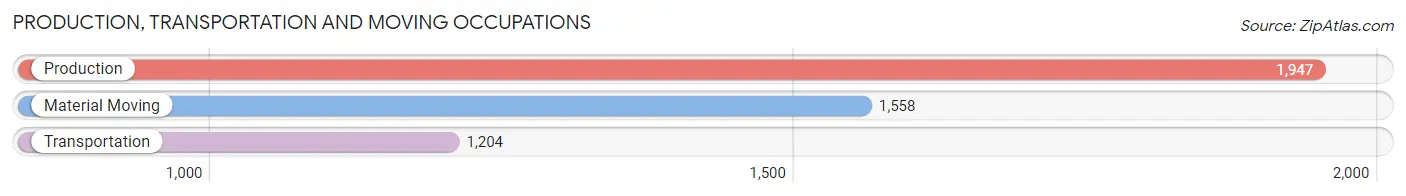
Production, Transportation and Moving Occupations
The most common Production, Transportation and Moving occupations in Cerro Gordo County are Production (1,947 | 8.8%), Material Moving (1,558 | 7.1%), and Transportation (1,204 | 5.5%).
Production, Transportation and Moving Occupations by Sex
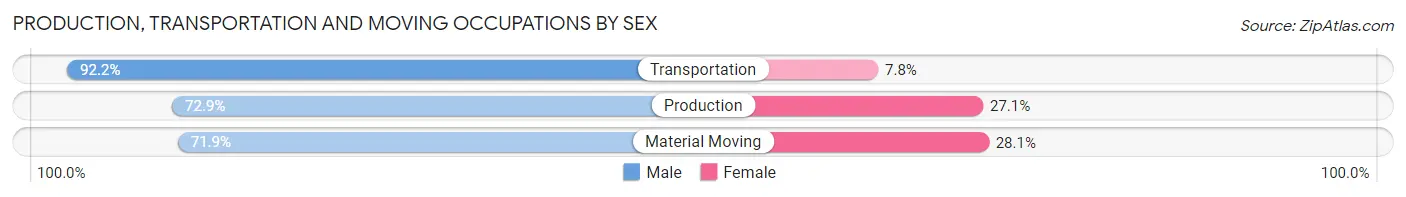
| Occupation | Male | Female |
| Production | 1,420 (72.9%) | 527 (27.1%) |
| Transportation | 1,110 (92.2%) | 94 (7.8%) |
| Material Moving | 1,120 (71.9%) | 438 (28.1%) |
| Total (Category) | 3,650 (77.5%) | 1,059 (22.5%) |
| Total (Overall) | 11,427 (52.0%) | 10,562 (48.0%) |
Employment Industries by Sex in Cerro Gordo County
Employment Industries in Cerro Gordo County
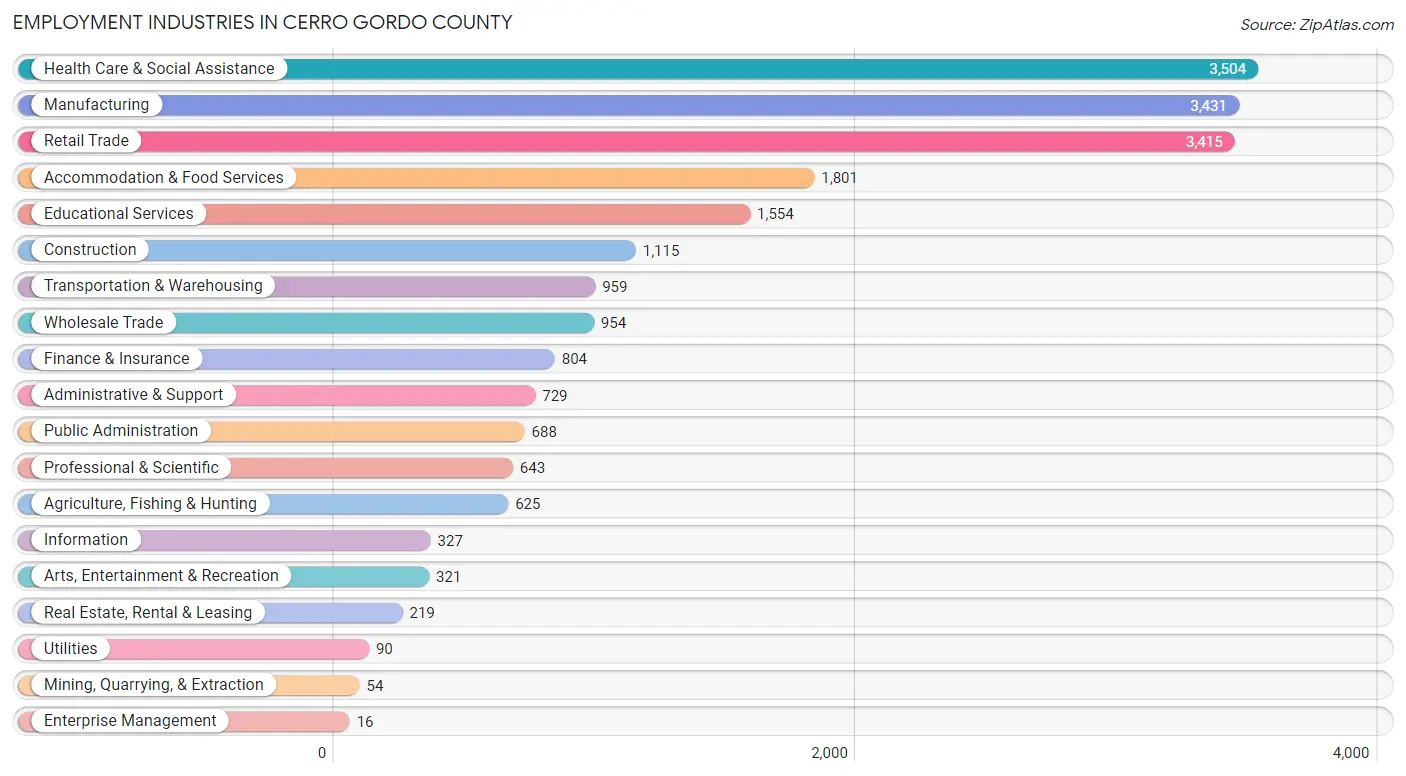
The major employment industries in Cerro Gordo County include Health Care & Social Assistance (3,504 | 15.9%), Manufacturing (3,431 | 15.6%), Retail Trade (3,415 | 15.5%), Accommodation & Food Services (1,801 | 8.2%), and Educational Services (1,554 | 7.1%).
Employment Industries by Sex in Cerro Gordo County
The Cerro Gordo County industries that see more men than women are Utilities (100.0%), Enterprise Management (100.0%), and Mining, Quarrying, & Extraction (96.3%), whereas the industries that tend to have a higher number of women are Health Care & Social Assistance (87.8%), Educational Services (70.1%), and Finance & Insurance (65.0%).
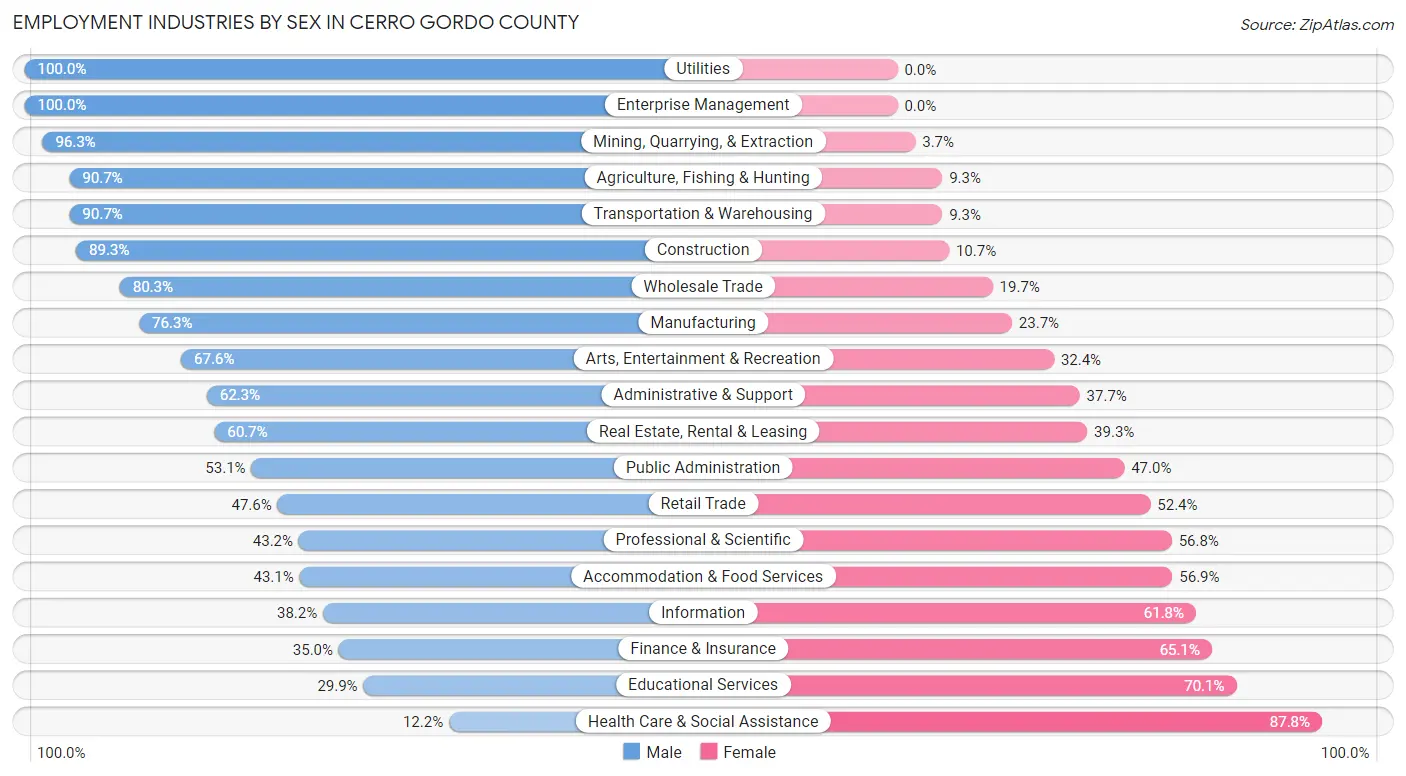
| Industry | Male | Female |
| Agriculture, Fishing & Hunting | 567 (90.7%) | 58 (9.3%) |
| Mining, Quarrying, & Extraction | 52 (96.3%) | 2 (3.7%) |
| Construction | 996 (89.3%) | 119 (10.7%) |
| Manufacturing | 2,618 (76.3%) | 813 (23.7%) |
| Wholesale Trade | 766 (80.3%) | 188 (19.7%) |
| Retail Trade | 1,627 (47.6%) | 1,788 (52.4%) |
| Transportation & Warehousing | 870 (90.7%) | 89 (9.3%) |
| Utilities | 90 (100.0%) | 0 (0.0%) |
| Information | 125 (38.2%) | 202 (61.8%) |
| Finance & Insurance | 281 (34.9%) | 523 (65.0%) |
| Real Estate, Rental & Leasing | 133 (60.7%) | 86 (39.3%) |
| Professional & Scientific | 278 (43.2%) | 365 (56.8%) |
| Enterprise Management | 16 (100.0%) | 0 (0.0%) |
| Administrative & Support | 454 (62.3%) | 275 (37.7%) |
| Educational Services | 464 (29.9%) | 1,090 (70.1%) |
| Health Care & Social Assistance | 426 (12.2%) | 3,078 (87.8%) |
| Arts, Entertainment & Recreation | 217 (67.6%) | 104 (32.4%) |
| Accommodation & Food Services | 776 (43.1%) | 1,025 (56.9%) |
| Public Administration | 365 (53.0%) | 323 (46.9%) |
| Total | 11,427 (52.0%) | 10,562 (48.0%) |
Education in Cerro Gordo County
School Enrollment in Cerro Gordo County
The most common levels of schooling among the 8,755 students in Cerro Gordo County are middle school (2,301 | 26.3%), high school (2,165 | 24.7%), and elementary school (1,673 | 19.1%).
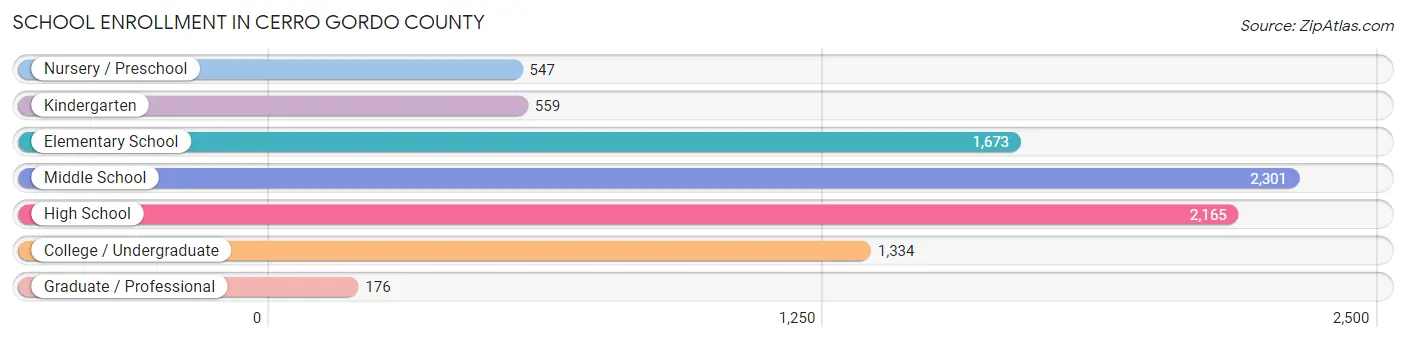
| School Level | # Students | % Students |
| Nursery / Preschool | 547 | 6.2% |
| Kindergarten | 559 | 6.4% |
| Elementary School | 1,673 | 19.1% |
| Middle School | 2,301 | 26.3% |
| High School | 2,165 | 24.7% |
| College / Undergraduate | 1,334 | 15.2% |
| Graduate / Professional | 176 | 2.0% |
| Total | 8,755 | 100.0% |
School Enrollment by Age by Funding Source in Cerro Gordo County
Out of a total of 8,755 students who are enrolled in schools in Cerro Gordo County, 1,243 (14.2%) attend a private institution, while the remaining 7,512 (85.8%) are enrolled in public schools. The age group of 35 years and over has the highest likelihood of being enrolled in private schools, with 160 (40.4% in the age bracket) enrolled. Conversely, the age group of 3 to 4 year olds has the lowest likelihood of being enrolled in a private school, with 324 (93.6% in the age bracket) attending a public institution.
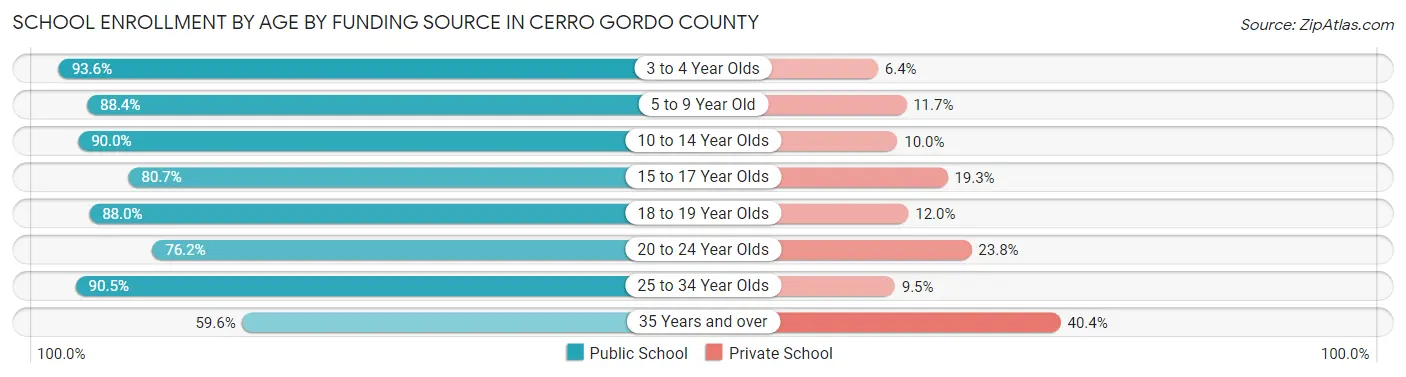
| Age Bracket | Public School | Private School |
| 3 to 4 Year Olds | 324 (93.6%) | 22 (6.4%) |
| 5 to 9 Year Old | 1,865 (88.3%) | 246 (11.7%) |
| 10 to 14 Year Olds | 2,621 (90.0%) | 291 (10.0%) |
| 15 to 17 Year Olds | 1,198 (80.7%) | 287 (19.3%) |
| 18 to 19 Year Olds | 592 (88.0%) | 81 (12.0%) |
| 20 to 24 Year Olds | 426 (76.2%) | 133 (23.8%) |
| 25 to 34 Year Olds | 247 (90.5%) | 26 (9.5%) |
| 35 Years and over | 236 (59.6%) | 160 (40.4%) |
| Total | 7,512 (85.8%) | 1,243 (14.2%) |
Educational Attainment by Field of Study in Cerro Gordo County
Education (1,586 | 19.3%), business (1,578 | 19.2%), science & technology (1,003 | 12.2%), arts & humanities (724 | 8.8%), and bio, nature & agricultural (717 | 8.7%) are the most common fields of study among 8,201 individuals in Cerro Gordo County who have obtained a bachelor's degree or higher.
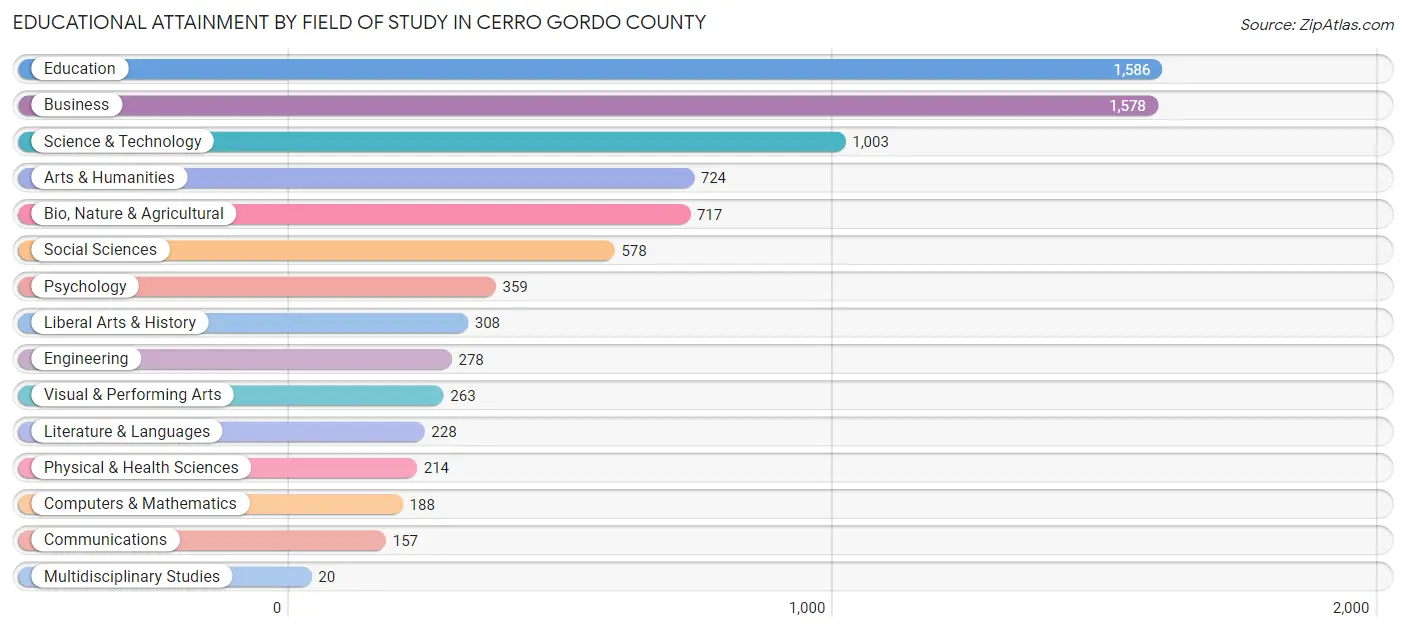
| Field of Study | # Graduates | % Graduates |
| Computers & Mathematics | 188 | 2.3% |
| Bio, Nature & Agricultural | 717 | 8.7% |
| Physical & Health Sciences | 214 | 2.6% |
| Psychology | 359 | 4.4% |
| Social Sciences | 578 | 7.0% |
| Engineering | 278 | 3.4% |
| Multidisciplinary Studies | 20 | 0.2% |
| Science & Technology | 1,003 | 12.2% |
| Business | 1,578 | 19.2% |
| Education | 1,586 | 19.3% |
| Literature & Languages | 228 | 2.8% |
| Liberal Arts & History | 308 | 3.8% |
| Visual & Performing Arts | 263 | 3.2% |
| Communications | 157 | 1.9% |
| Arts & Humanities | 724 | 8.8% |
| Total | 8,201 | 100.0% |
Transportation & Commute in Cerro Gordo County
Vehicle Availability by Sex in Cerro Gordo County
The most prevalent vehicle ownership categories in Cerro Gordo County are males with 2 vehicles (5,175, accounting for 46.1%) and females with 2 vehicles (4,783, making up 50.3%).
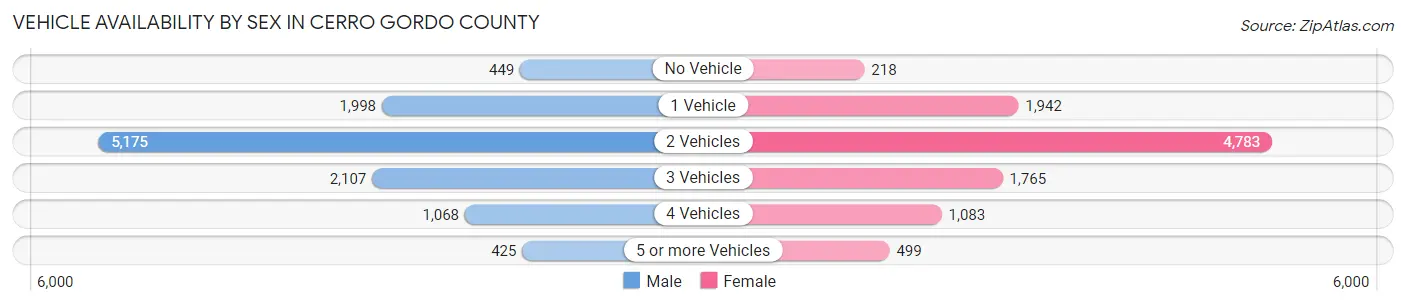
| Vehicles Available | Male | Female |
| No Vehicle | 449 (4.0%) | 218 (2.1%) |
| 1 Vehicle | 1,998 (17.8%) | 1,942 (18.9%) |
| 2 Vehicles | 5,175 (46.1%) | 4,783 (46.5%) |
| 3 Vehicles | 2,107 (18.8%) | 1,765 (17.2%) |
| 4 Vehicles | 1,068 (9.5%) | 1,083 (10.5%) |
| 5 or more Vehicles | 425 (3.8%) | 499 (4.9%) |
| Total | 11,222 (100.0%) | 10,290 (100.0%) |
Commute Time in Cerro Gordo County
The most frequently occuring commute durations in Cerro Gordo County are 5 to 9 minutes (5,025 commuters, 24.9%), 10 to 14 minutes (4,711 commuters, 23.4%), and 15 to 19 minutes (3,175 commuters, 15.8%).
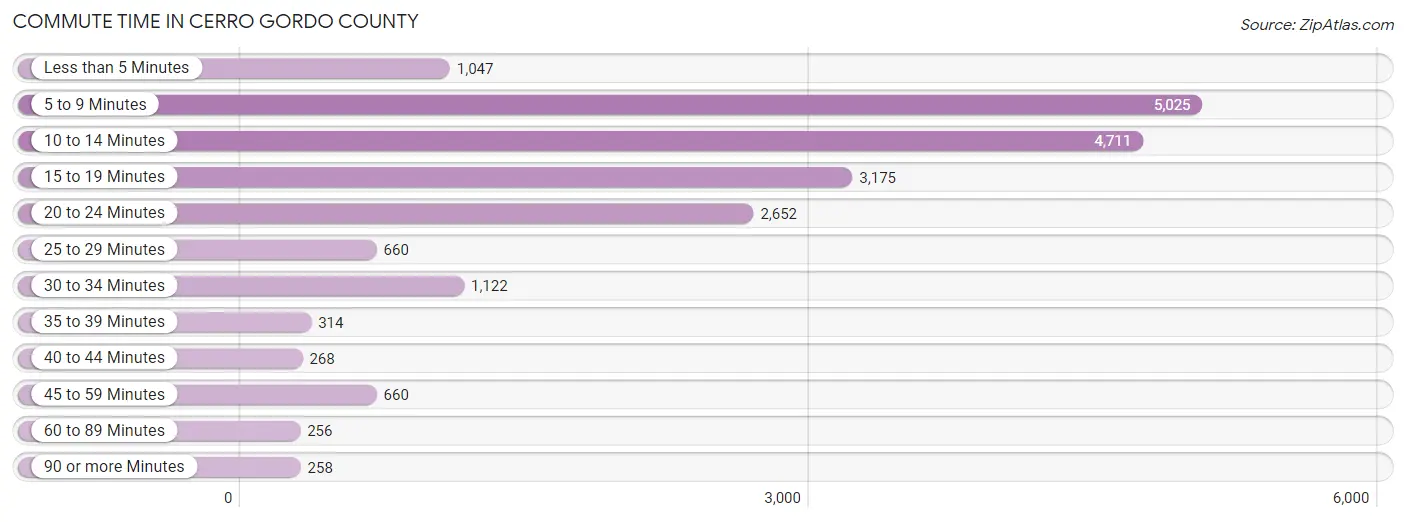
| Commute Time | # Commuters | % Commuters |
| Less than 5 Minutes | 1,047 | 5.2% |
| 5 to 9 Minutes | 5,025 | 24.9% |
| 10 to 14 Minutes | 4,711 | 23.4% |
| 15 to 19 Minutes | 3,175 | 15.8% |
| 20 to 24 Minutes | 2,652 | 13.2% |
| 25 to 29 Minutes | 660 | 3.3% |
| 30 to 34 Minutes | 1,122 | 5.6% |
| 35 to 39 Minutes | 314 | 1.6% |
| 40 to 44 Minutes | 268 | 1.3% |
| 45 to 59 Minutes | 660 | 3.3% |
| 60 to 89 Minutes | 256 | 1.3% |
| 90 or more Minutes | 258 | 1.3% |
Commute Time by Sex in Cerro Gordo County
The most common commute times in Cerro Gordo County are 5 to 9 minutes (2,500 commuters, 24.0%) for males and 5 to 9 minutes (2,525 commuters, 26.0%) for females.
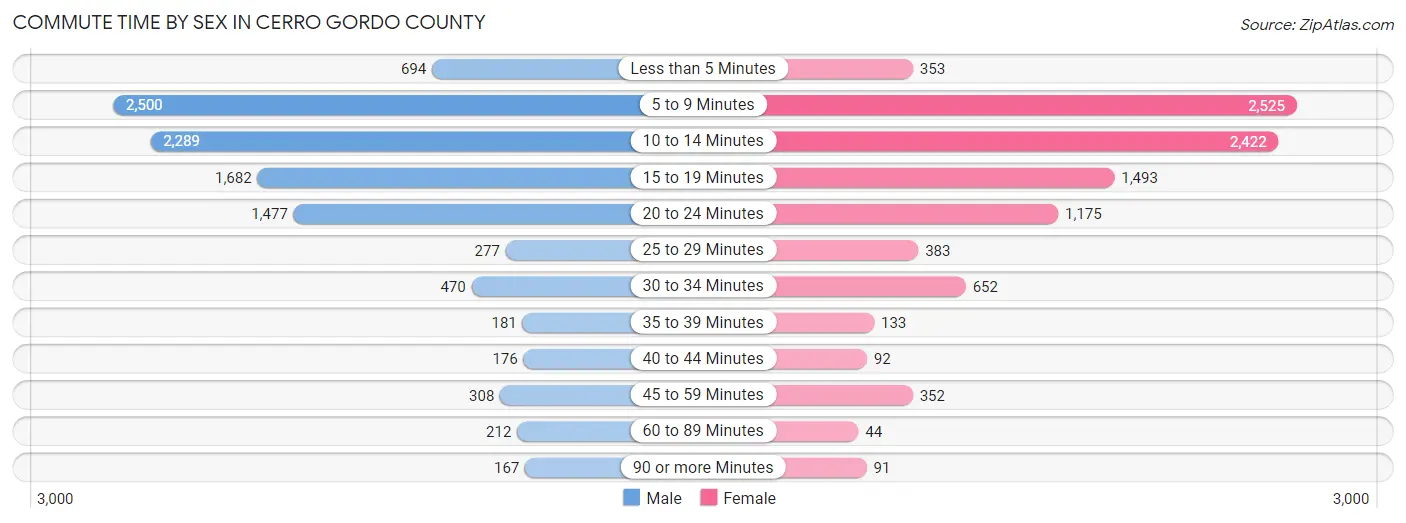
| Commute Time | Male | Female |
| Less than 5 Minutes | 694 (6.7%) | 353 (3.6%) |
| 5 to 9 Minutes | 2,500 (24.0%) | 2,525 (26.0%) |
| 10 to 14 Minutes | 2,289 (21.9%) | 2,422 (24.9%) |
| 15 to 19 Minutes | 1,682 (16.1%) | 1,493 (15.4%) |
| 20 to 24 Minutes | 1,477 (14.2%) | 1,175 (12.1%) |
| 25 to 29 Minutes | 277 (2.7%) | 383 (3.9%) |
| 30 to 34 Minutes | 470 (4.5%) | 652 (6.7%) |
| 35 to 39 Minutes | 181 (1.7%) | 133 (1.4%) |
| 40 to 44 Minutes | 176 (1.7%) | 92 (0.9%) |
| 45 to 59 Minutes | 308 (2.9%) | 352 (3.6%) |
| 60 to 89 Minutes | 212 (2.0%) | 44 (0.4%) |
| 90 or more Minutes | 167 (1.6%) | 91 (0.9%) |
Time of Departure to Work by Sex in Cerro Gordo County
The most frequent times of departure to work in Cerro Gordo County are 6:30 AM to 6:59 AM (1,574, 15.1%) for males and 7:30 AM to 7:59 AM (1,531, 15.8%) for females.
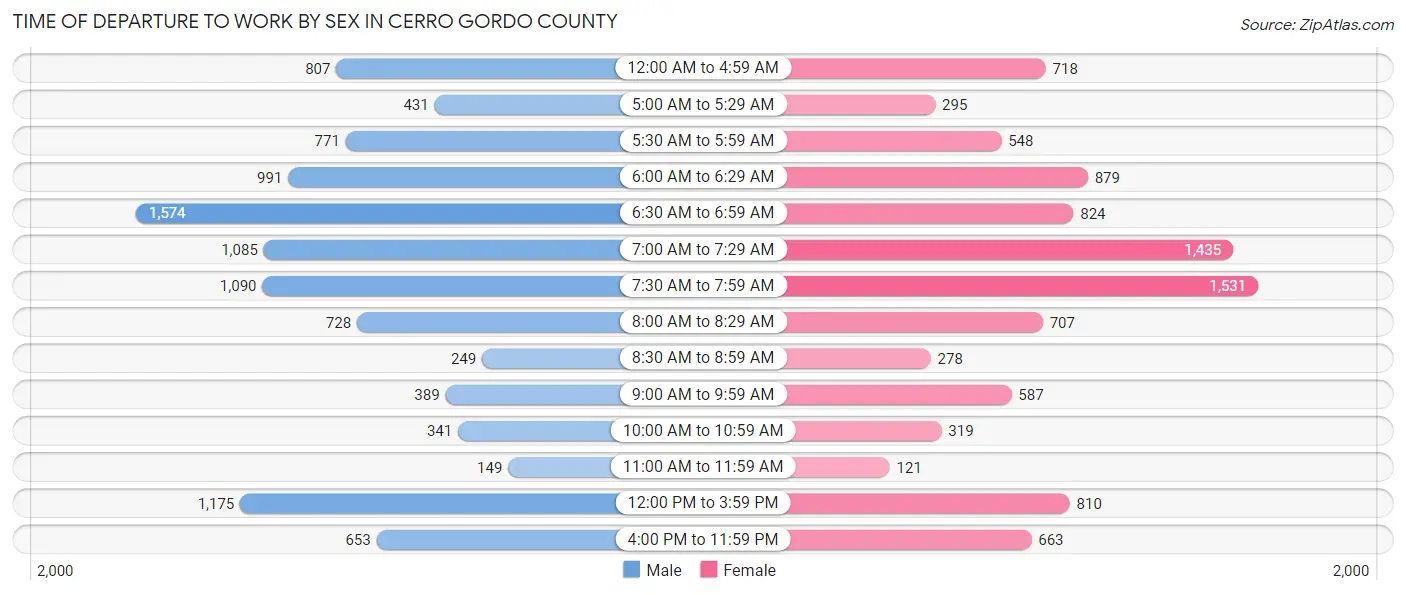
| Time of Departure | Male | Female |
| 12:00 AM to 4:59 AM | 807 (7.7%) | 718 (7.4%) |
| 5:00 AM to 5:29 AM | 431 (4.1%) | 295 (3.0%) |
| 5:30 AM to 5:59 AM | 771 (7.4%) | 548 (5.6%) |
| 6:00 AM to 6:29 AM | 991 (9.5%) | 879 (9.0%) |
| 6:30 AM to 6:59 AM | 1,574 (15.1%) | 824 (8.5%) |
| 7:00 AM to 7:29 AM | 1,085 (10.4%) | 1,435 (14.8%) |
| 7:30 AM to 7:59 AM | 1,090 (10.4%) | 1,531 (15.8%) |
| 8:00 AM to 8:29 AM | 728 (7.0%) | 707 (7.3%) |
| 8:30 AM to 8:59 AM | 249 (2.4%) | 278 (2.9%) |
| 9:00 AM to 9:59 AM | 389 (3.7%) | 587 (6.0%) |
| 10:00 AM to 10:59 AM | 341 (3.3%) | 319 (3.3%) |
| 11:00 AM to 11:59 AM | 149 (1.4%) | 121 (1.3%) |
| 12:00 PM to 3:59 PM | 1,175 (11.3%) | 810 (8.3%) |
| 4:00 PM to 11:59 PM | 653 (6.3%) | 663 (6.8%) |
| Total | 10,433 (100.0%) | 9,715 (100.0%) |
Housing Occupancy in Cerro Gordo County
Occupancy by Ownership in Cerro Gordo County
Of the total 19,450 dwellings in Cerro Gordo County, owner-occupied units account for 13,931 (71.6%), while renter-occupied units make up 5,519 (28.4%).
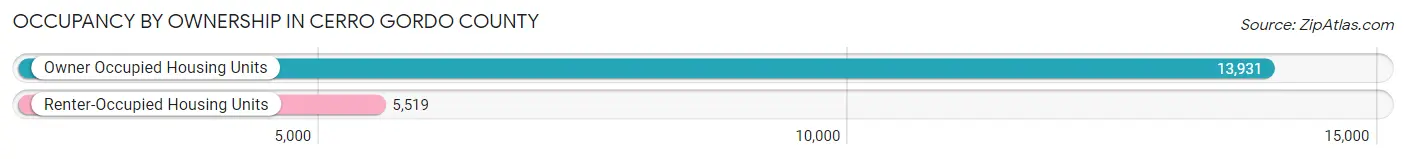
| Occupancy | # Housing Units | % Housing Units |
| Owner Occupied Housing Units | 13,931 | 71.6% |
| Renter-Occupied Housing Units | 5,519 | 28.4% |
| Total Occupied Housing Units | 19,450 | 100.0% |
Occupancy by Household Size in Cerro Gordo County
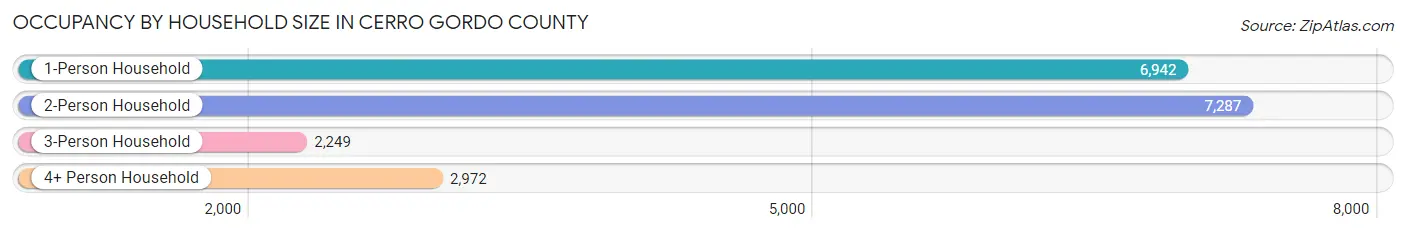
| Household Size | # Housing Units | % Housing Units |
| 1-Person Household | 6,942 | 35.7% |
| 2-Person Household | 7,287 | 37.5% |
| 3-Person Household | 2,249 | 11.6% |
| 4+ Person Household | 2,972 | 15.3% |
| Total Housing Units | 19,450 | 100.0% |
Occupancy by Ownership by Household Size in Cerro Gordo County
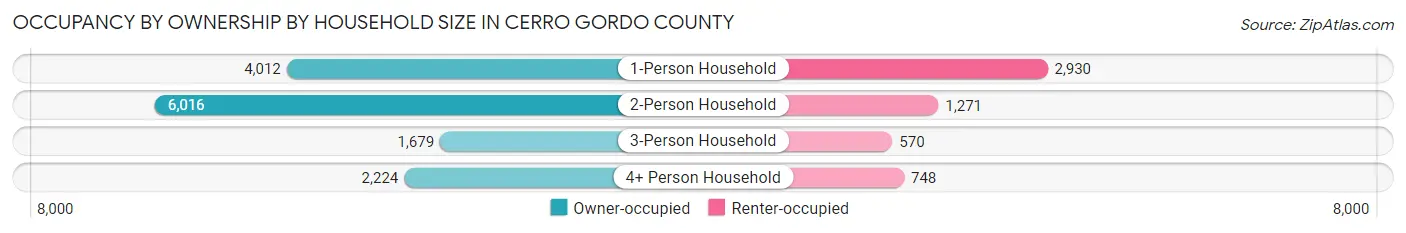
| Household Size | Owner-occupied | Renter-occupied |
| 1-Person Household | 4,012 (57.8%) | 2,930 (42.2%) |
| 2-Person Household | 6,016 (82.6%) | 1,271 (17.4%) |
| 3-Person Household | 1,679 (74.7%) | 570 (25.3%) |
| 4+ Person Household | 2,224 (74.8%) | 748 (25.2%) |
| Total Housing Units | 13,931 (71.6%) | 5,519 (28.4%) |
Occupancy by Educational Attainment in Cerro Gordo County
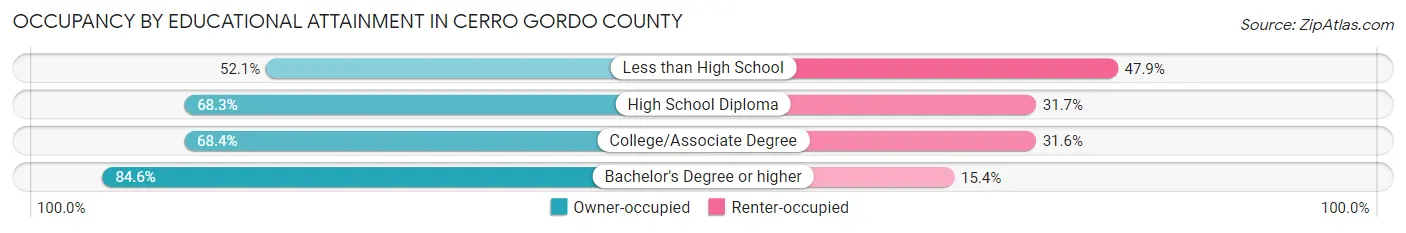
| Household Size | Owner-occupied | Renter-occupied |
| Less than High School | 489 (52.1%) | 449 (47.9%) |
| High School Diploma | 4,328 (68.3%) | 2,005 (31.7%) |
| College/Associate Degree | 5,000 (68.4%) | 2,314 (31.6%) |
| Bachelor's Degree or higher | 4,114 (84.6%) | 751 (15.4%) |
Occupancy by Age of Householder in Cerro Gordo County
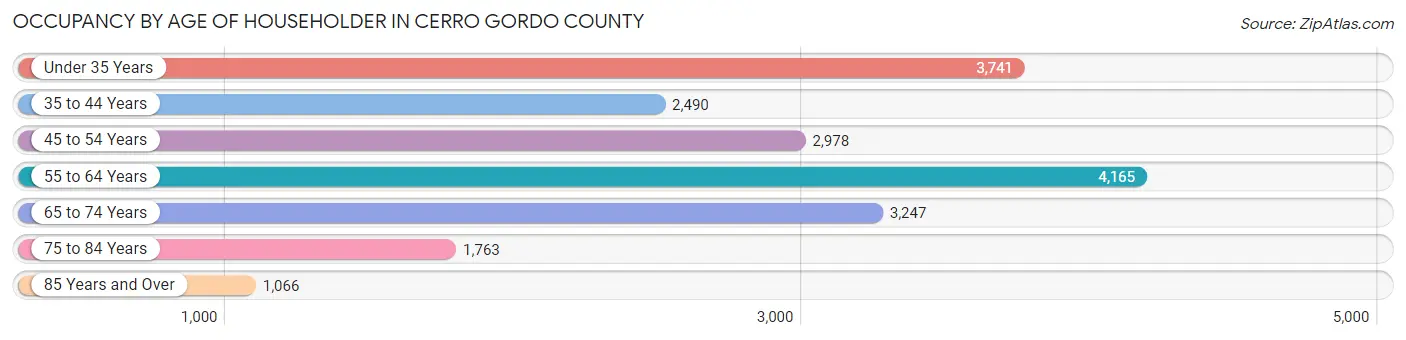
| Age Bracket | # Households | % Households |
| Under 35 Years | 3,741 | 19.2% |
| 35 to 44 Years | 2,490 | 12.8% |
| 45 to 54 Years | 2,978 | 15.3% |
| 55 to 64 Years | 4,165 | 21.4% |
| 65 to 74 Years | 3,247 | 16.7% |
| 75 to 84 Years | 1,763 | 9.1% |
| 85 Years and Over | 1,066 | 5.5% |
| Total | 19,450 | 100.0% |
Housing Finances in Cerro Gordo County
Median Income by Occupancy in Cerro Gordo County
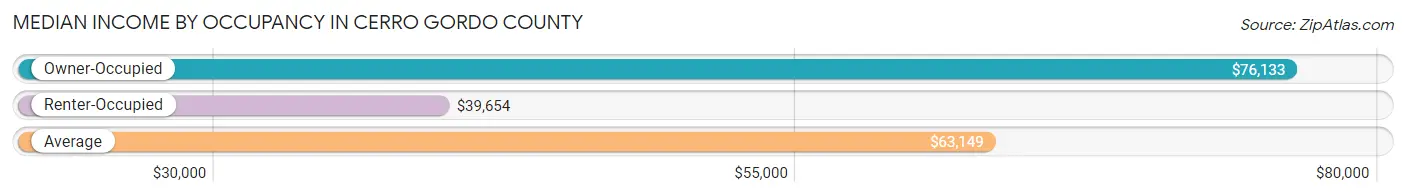
| Occupancy Type | # Households | Median Income |
| Owner-Occupied | 13,931 (71.6%) | $76,133 |
| Renter-Occupied | 5,519 (28.4%) | $39,654 |
| Average | 19,450 (100.0%) | $63,149 |
Occupancy by Householder Income Bracket in Cerro Gordo County
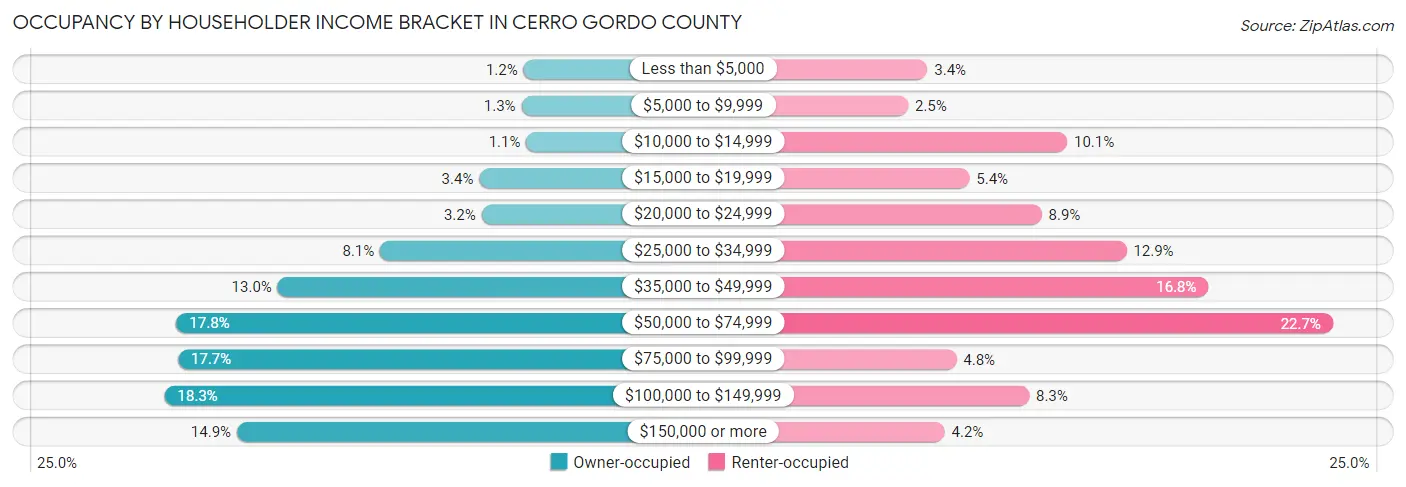
| Income Bracket | Owner-occupied | Renter-occupied |
| Less than $5,000 | 173 (1.2%) | 189 (3.4%) |
| $5,000 to $9,999 | 186 (1.3%) | 138 (2.5%) |
| $10,000 to $14,999 | 155 (1.1%) | 556 (10.1%) |
| $15,000 to $19,999 | 467 (3.4%) | 299 (5.4%) |
| $20,000 to $24,999 | 451 (3.2%) | 489 (8.9%) |
| $25,000 to $34,999 | 1,124 (8.1%) | 712 (12.9%) |
| $35,000 to $49,999 | 1,804 (13.0%) | 927 (16.8%) |
| $50,000 to $74,999 | 2,475 (17.8%) | 1,254 (22.7%) |
| $75,000 to $99,999 | 2,466 (17.7%) | 265 (4.8%) |
| $100,000 to $149,999 | 2,555 (18.3%) | 456 (8.3%) |
| $150,000 or more | 2,075 (14.9%) | 234 (4.2%) |
| Total | 13,931 (100.0%) | 5,519 (100.0%) |
Monthly Housing Cost Tiers in Cerro Gordo County
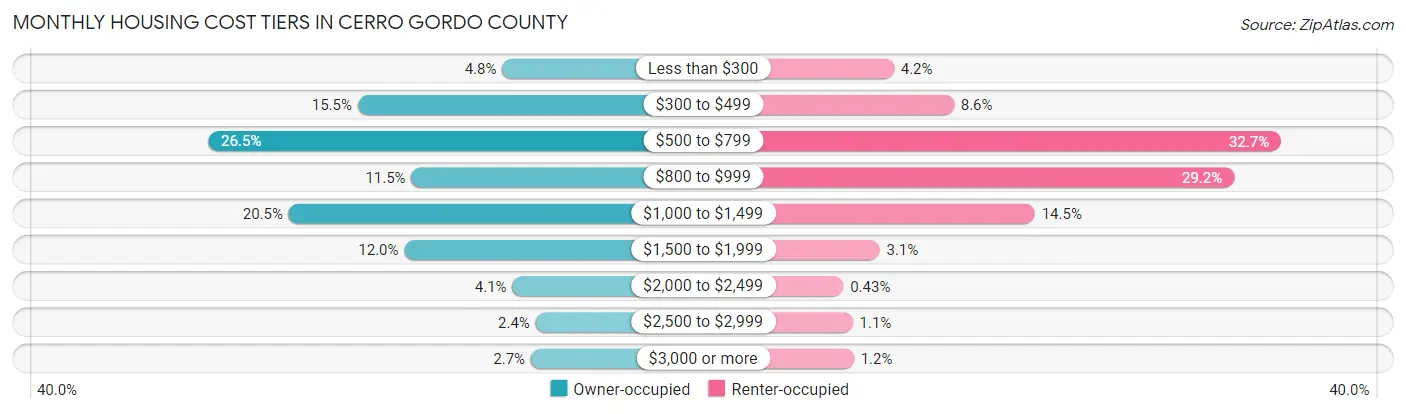
| Monthly Cost | Owner-occupied | Renter-occupied |
| Less than $300 | 671 (4.8%) | 229 (4.2%) |
| $300 to $499 | 2,154 (15.5%) | 473 (8.6%) |
| $500 to $799 | 3,691 (26.5%) | 1,803 (32.7%) |
| $800 to $999 | 1,604 (11.5%) | 1,612 (29.2%) |
| $1,000 to $1,499 | 2,861 (20.5%) | 802 (14.5%) |
| $1,500 to $1,999 | 1,676 (12.0%) | 171 (3.1%) |
| $2,000 to $2,499 | 567 (4.1%) | 24 (0.4%) |
| $2,500 to $2,999 | 329 (2.4%) | 62 (1.1%) |
| $3,000 or more | 378 (2.7%) | 66 (1.2%) |
| Total | 13,931 (100.0%) | 5,519 (100.0%) |
Physical Housing Characteristics in Cerro Gordo County
Housing Structures in Cerro Gordo County
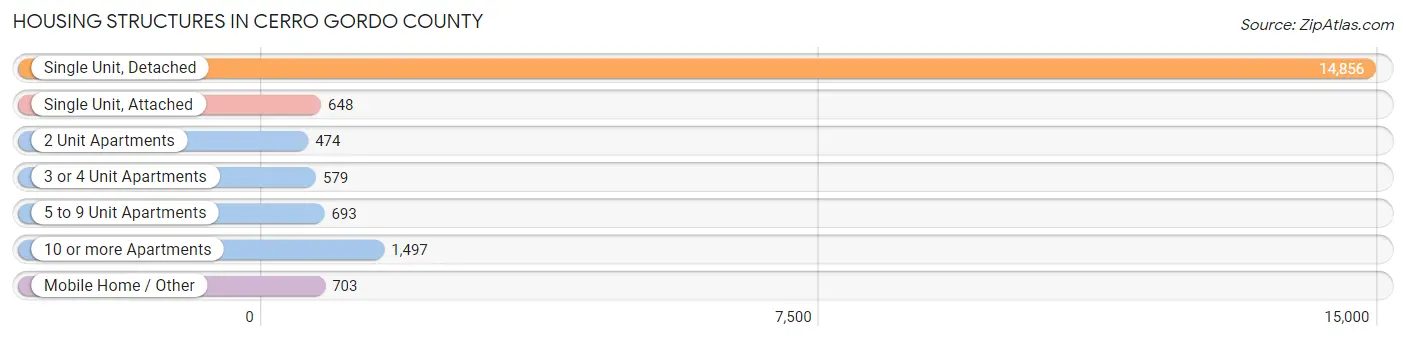
| Structure Type | # Housing Units | % Housing Units |
| Single Unit, Detached | 14,856 | 76.4% |
| Single Unit, Attached | 648 | 3.3% |
| 2 Unit Apartments | 474 | 2.4% |
| 3 or 4 Unit Apartments | 579 | 3.0% |
| 5 to 9 Unit Apartments | 693 | 3.6% |
| 10 or more Apartments | 1,497 | 7.7% |
| Mobile Home / Other | 703 | 3.6% |
| Total | 19,450 | 100.0% |
Housing Structures by Occupancy in Cerro Gordo County
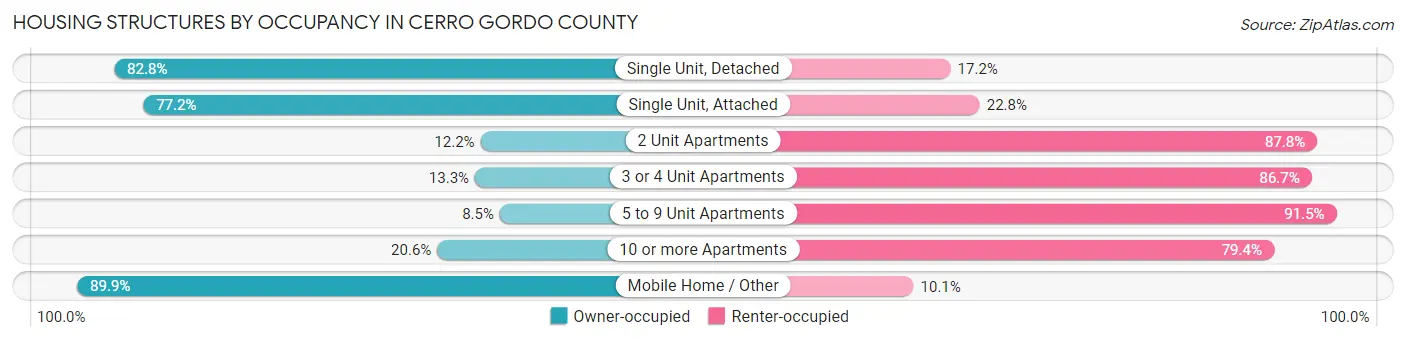
| Structure Type | Owner-occupied | Renter-occupied |
| Single Unit, Detached | 12,297 (82.8%) | 2,559 (17.2%) |
| Single Unit, Attached | 500 (77.2%) | 148 (22.8%) |
| 2 Unit Apartments | 58 (12.2%) | 416 (87.8%) |
| 3 or 4 Unit Apartments | 77 (13.3%) | 502 (86.7%) |
| 5 to 9 Unit Apartments | 59 (8.5%) | 634 (91.5%) |
| 10 or more Apartments | 308 (20.6%) | 1,189 (79.4%) |
| Mobile Home / Other | 632 (89.9%) | 71 (10.1%) |
| Total | 13,931 (71.6%) | 5,519 (28.4%) |
Housing Structures by Number of Rooms in Cerro Gordo County
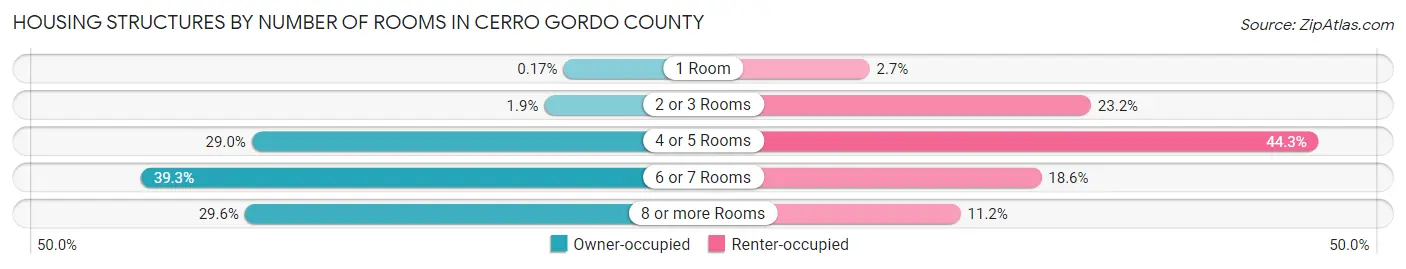
| Number of Rooms | Owner-occupied | Renter-occupied |
| 1 Room | 24 (0.2%) | 151 (2.7%) |
| 2 or 3 Rooms | 270 (1.9%) | 1,281 (23.2%) |
| 4 or 5 Rooms | 4,040 (29.0%) | 2,443 (44.3%) |
| 6 or 7 Rooms | 5,468 (39.3%) | 1,028 (18.6%) |
| 8 or more Rooms | 4,129 (29.6%) | 616 (11.2%) |
| Total | 13,931 (100.0%) | 5,519 (100.0%) |
Housing Structure by Heating Type in Cerro Gordo County
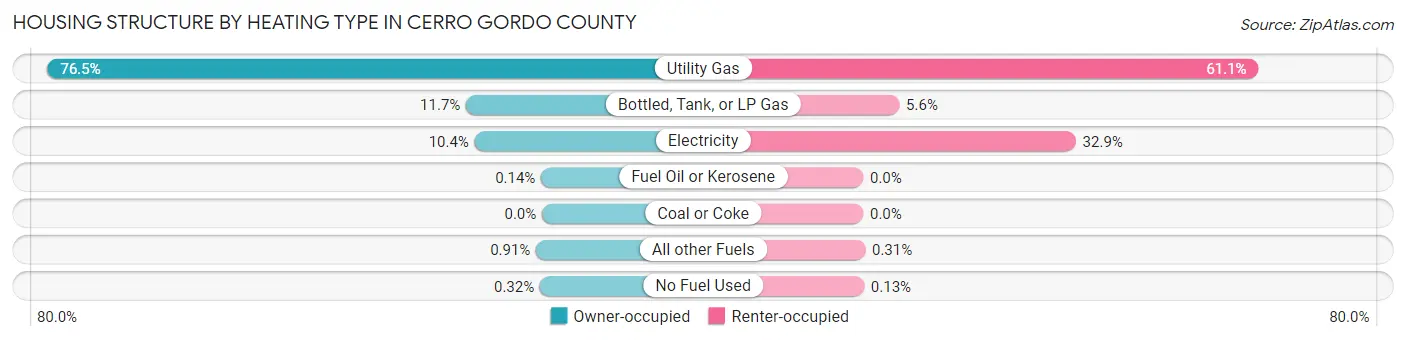
| Heating Type | Owner-occupied | Renter-occupied |
| Utility Gas | 10,654 (76.5%) | 3,373 (61.1%) |
| Bottled, Tank, or LP Gas | 1,635 (11.7%) | 308 (5.6%) |
| Electricity | 1,451 (10.4%) | 1,814 (32.9%) |
| Fuel Oil or Kerosene | 20 (0.1%) | 0 (0.0%) |
| Coal or Coke | 0 (0.0%) | 0 (0.0%) |
| All other Fuels | 127 (0.9%) | 17 (0.3%) |
| No Fuel Used | 44 (0.3%) | 7 (0.1%) |
| Total | 13,931 (100.0%) | 5,519 (100.0%) |
Household Vehicle Usage in Cerro Gordo County
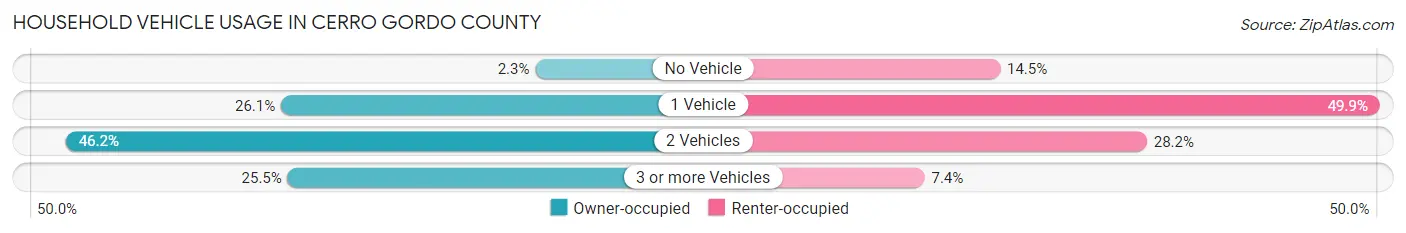
| Vehicles per Household | Owner-occupied | Renter-occupied |
| No Vehicle | 325 (2.3%) | 799 (14.5%) |
| 1 Vehicle | 3,630 (26.1%) | 2,755 (49.9%) |
| 2 Vehicles | 6,430 (46.2%) | 1,555 (28.2%) |
| 3 or more Vehicles | 3,546 (25.5%) | 410 (7.4%) |
| Total | 13,931 (100.0%) | 5,519 (100.0%) |
Real Estate & Mortgages in Cerro Gordo County
Real Estate and Mortgage Overview in Cerro Gordo County
| Characteristic | Without Mortgage | With Mortgage |
| Housing Units | 6,294 | 7,637 |
| Median Property Value | $139,100 | $151,300 |
| Median Household Income | $56,836 | $1,461 |
| Monthly Housing Costs | $536 | $361 |
| Real Estate Taxes | $2,100 | $154 |
Property Value by Mortgage Status in Cerro Gordo County
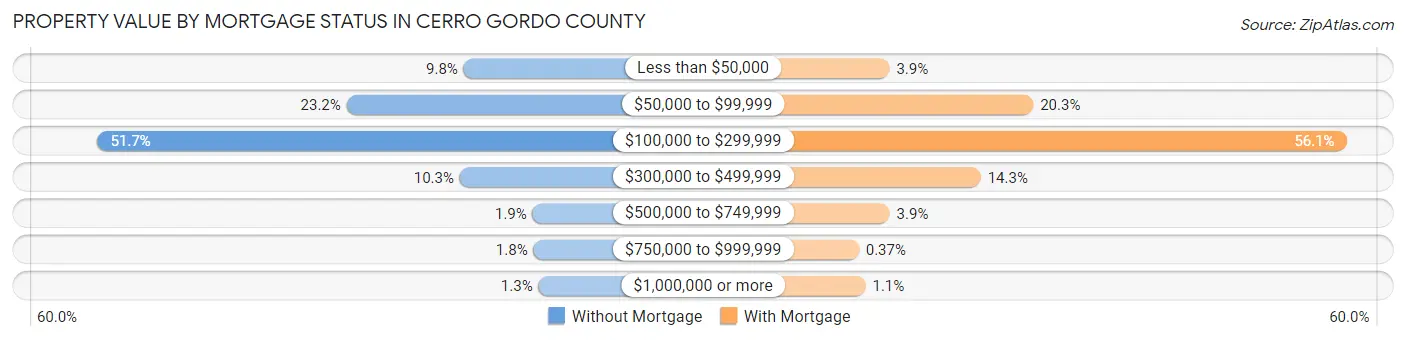
| Property Value | Without Mortgage | With Mortgage |
| Less than $50,000 | 618 (9.8%) | 296 (3.9%) |
| $50,000 to $99,999 | 1,460 (23.2%) | 1,551 (20.3%) |
| $100,000 to $299,999 | 3,252 (51.7%) | 4,284 (56.1%) |
| $300,000 to $499,999 | 646 (10.3%) | 1,093 (14.3%) |
| $500,000 to $749,999 | 122 (1.9%) | 298 (3.9%) |
| $750,000 to $999,999 | 116 (1.8%) | 28 (0.4%) |
| $1,000,000 or more | 80 (1.3%) | 87 (1.1%) |
| Total | 6,294 (100.0%) | 7,637 (100.0%) |
Household Income by Mortgage Status in Cerro Gordo County
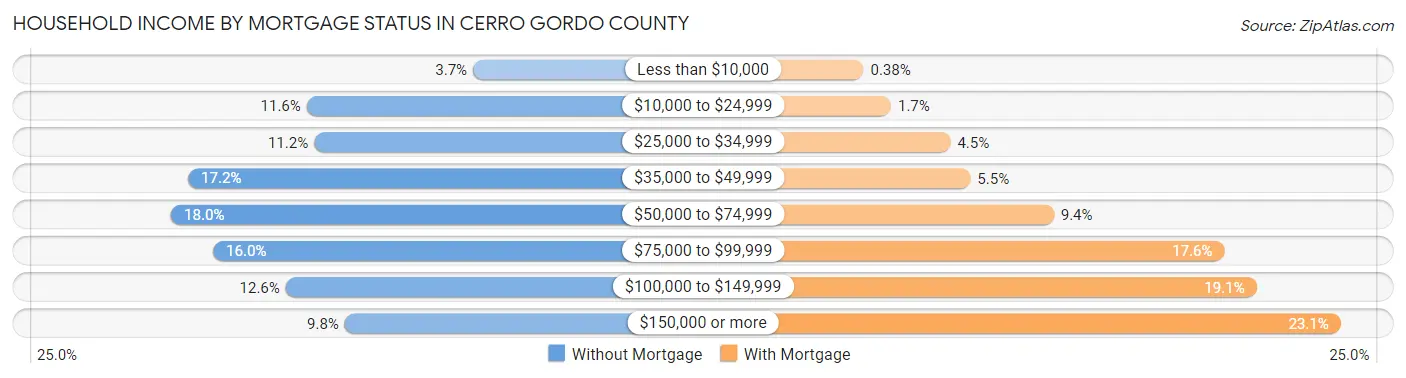
| Household Income | Without Mortgage | With Mortgage |
| Less than $10,000 | 230 (3.6%) | 29 (0.4%) |
| $10,000 to $24,999 | 728 (11.6%) | 129 (1.7%) |
| $25,000 to $34,999 | 706 (11.2%) | 345 (4.5%) |
| $35,000 to $49,999 | 1,083 (17.2%) | 418 (5.5%) |
| $50,000 to $74,999 | 1,134 (18.0%) | 721 (9.4%) |
| $75,000 to $99,999 | 1,008 (16.0%) | 1,341 (17.6%) |
| $100,000 to $149,999 | 791 (12.6%) | 1,458 (19.1%) |
| $150,000 or more | 614 (9.8%) | 1,764 (23.1%) |
| Total | 6,294 (100.0%) | 7,637 (100.0%) |
Property Value to Household Income Ratio in Cerro Gordo County
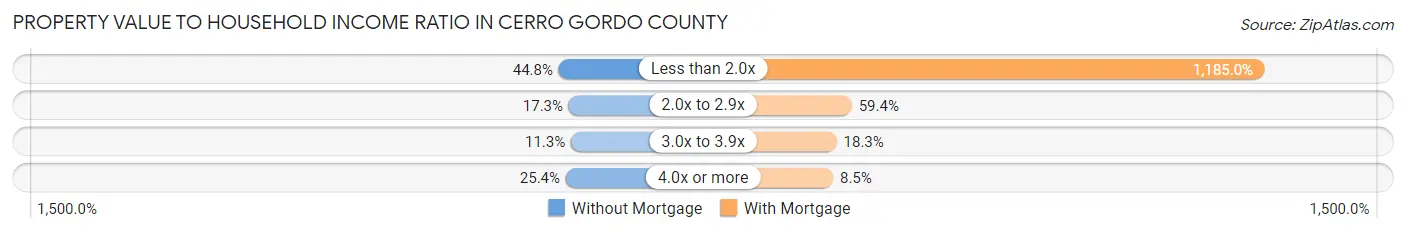
| Value-to-Income Ratio | Without Mortgage | With Mortgage |
| Less than 2.0x | 2,819 (44.8%) | 90,498 (1,185.0%) |
| 2.0x to 2.9x | 1,090 (17.3%) | 4,539 (59.4%) |
| 3.0x to 3.9x | 713 (11.3%) | 1,394 (18.2%) |
| 4.0x or more | 1,601 (25.4%) | 652 (8.5%) |
| Total | 6,294 (100.0%) | 7,637 (100.0%) |
Real Estate Taxes by Mortgage Status in Cerro Gordo County
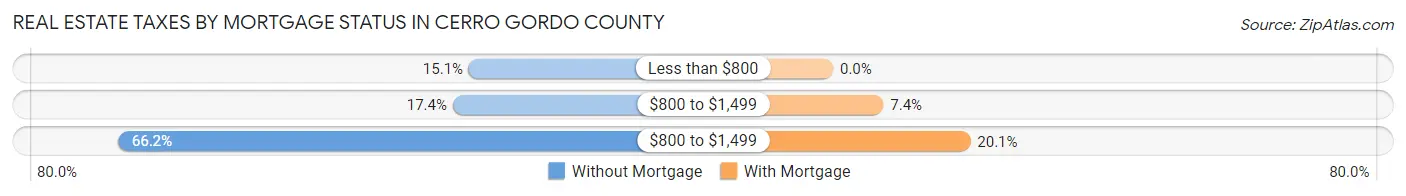
| Property Taxes | Without Mortgage | With Mortgage |
| Less than $800 | 949 (15.1%) | 0 (0.0%) |
| $800 to $1,499 | 1,097 (17.4%) | 561 (7.3%) |
| $800 to $1,499 | 4,168 (66.2%) | 1,532 (20.1%) |
| Total | 6,294 (100.0%) | 7,637 (100.0%) |
Health & Disability in Cerro Gordo County
Health Insurance Coverage by Age in Cerro Gordo County
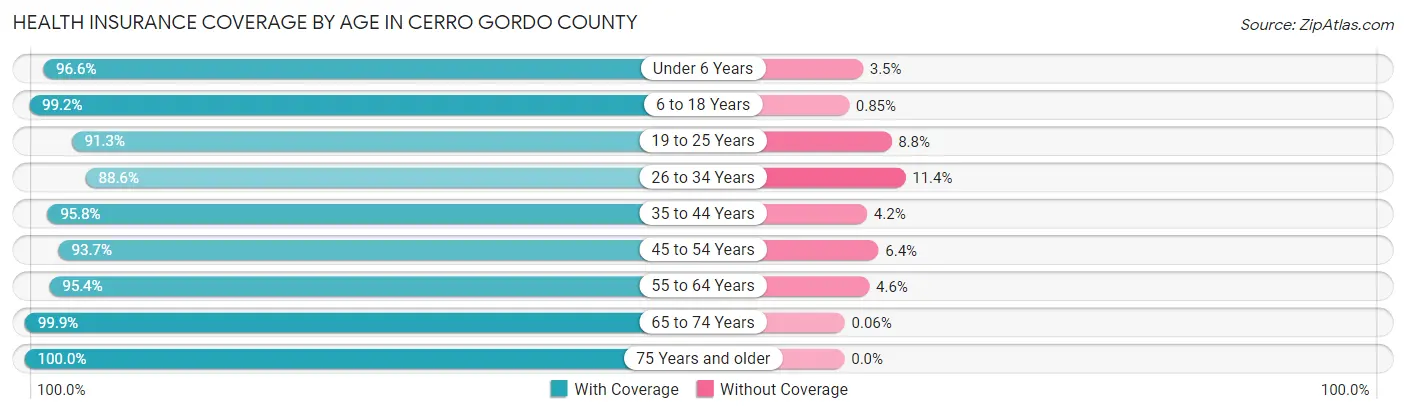
| Age Bracket | With Coverage | Without Coverage |
| Under 6 Years | 2,683 (96.6%) | 96 (3.5%) |
| 6 to 18 Years | 6,744 (99.2%) | 58 (0.9%) |
| 19 to 25 Years | 2,795 (91.2%) | 268 (8.7%) |
| 26 to 34 Years | 3,893 (88.6%) | 500 (11.4%) |
| 35 to 44 Years | 4,519 (95.8%) | 199 (4.2%) |
| 45 to 54 Years | 4,427 (93.6%) | 300 (6.4%) |
| 55 to 64 Years | 6,441 (95.4%) | 312 (4.6%) |
| 65 to 74 Years | 5,347 (99.9%) | 3 (0.1%) |
| 75 Years and older | 3,789 (100.0%) | 0 (0.0%) |
| Total | 40,638 (95.9%) | 1,736 (4.1%) |
Health Insurance Coverage by Citizenship Status in Cerro Gordo County
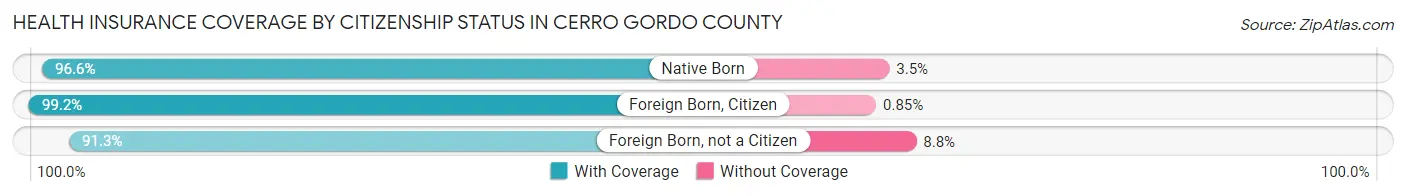
| Citizenship Status | With Coverage | Without Coverage |
| Native Born | 2,683 (96.6%) | 96 (3.5%) |
| Foreign Born, Citizen | 6,744 (99.2%) | 58 (0.9%) |
| Foreign Born, not a Citizen | 2,795 (91.2%) | 268 (8.7%) |
Health Insurance Coverage by Household Income in Cerro Gordo County
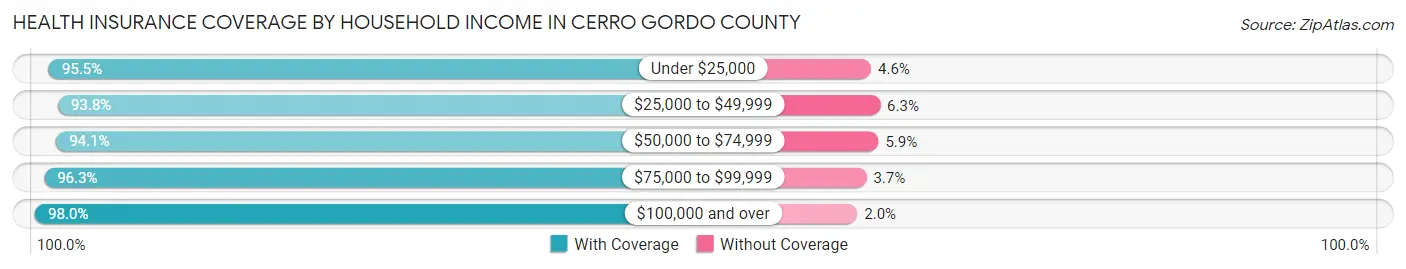
| Household Income | With Coverage | Without Coverage |
| Under $25,000 | 3,985 (95.5%) | 190 (4.5%) |
| $25,000 to $49,999 | 7,288 (93.8%) | 486 (6.2%) |
| $50,000 to $74,999 | 7,296 (94.1%) | 460 (5.9%) |
| $75,000 to $99,999 | 6,382 (96.3%) | 244 (3.7%) |
| $100,000 and over | 15,247 (98.0%) | 307 (2.0%) |
Public vs Private Health Insurance Coverage by Age in Cerro Gordo County
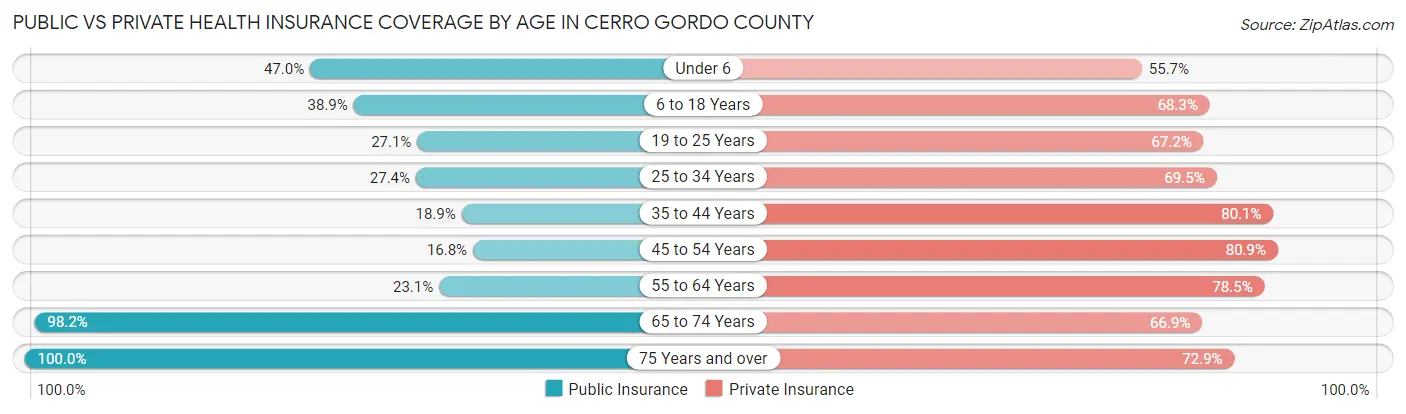
| Age Bracket | Public Insurance | Private Insurance |
| Under 6 | 1,307 (47.0%) | 1,548 (55.7%) |
| 6 to 18 Years | 2,648 (38.9%) | 4,645 (68.3%) |
| 19 to 25 Years | 831 (27.1%) | 2,057 (67.2%) |
| 25 to 34 Years | 1,203 (27.4%) | 3,055 (69.5%) |
| 35 to 44 Years | 891 (18.9%) | 3,779 (80.1%) |
| 45 to 54 Years | 793 (16.8%) | 3,825 (80.9%) |
| 55 to 64 Years | 1,558 (23.1%) | 5,298 (78.4%) |
| 65 to 74 Years | 5,252 (98.2%) | 3,578 (66.9%) |
| 75 Years and over | 3,789 (100.0%) | 2,761 (72.9%) |
| Total | 18,272 (43.1%) | 30,546 (72.1%) |
Disability Status by Sex by Age in Cerro Gordo County
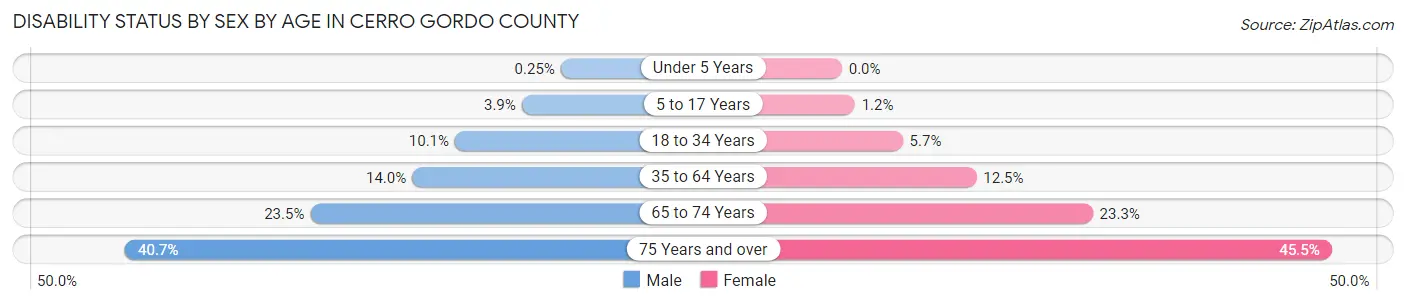
| Age Bracket | Male | Female |
| Under 5 Years | 3 (0.3%) | 0 (0.0%) |
| 5 to 17 Years | 137 (3.9%) | 38 (1.2%) |
| 18 to 34 Years | 419 (10.1%) | 224 (5.7%) |
| 35 to 64 Years | 1,148 (14.0%) | 1,002 (12.5%) |
| 65 to 74 Years | 607 (23.5%) | 644 (23.3%) |
| 75 Years and over | 606 (40.7%) | 1,045 (45.5%) |
Disability Class by Sex by Age in Cerro Gordo County
Disability Class: Hearing Difficulty
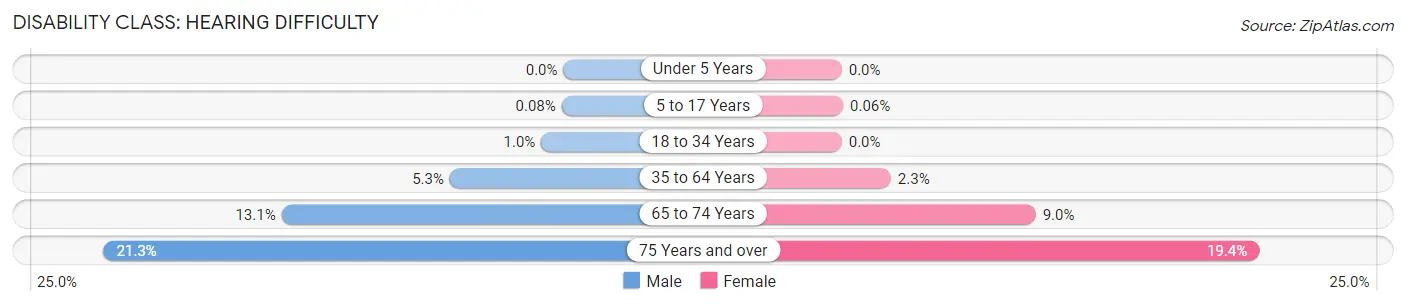
| Age Bracket | Male | Female |
| Under 5 Years | 0 (0.0%) | 0 (0.0%) |
| 5 to 17 Years | 3 (0.1%) | 2 (0.1%) |
| 18 to 34 Years | 43 (1.0%) | 0 (0.0%) |
| 35 to 64 Years | 431 (5.3%) | 183 (2.3%) |
| 65 to 74 Years | 338 (13.1%) | 249 (9.0%) |
| 75 Years and over | 318 (21.3%) | 445 (19.4%) |
Disability Class: Vision Difficulty
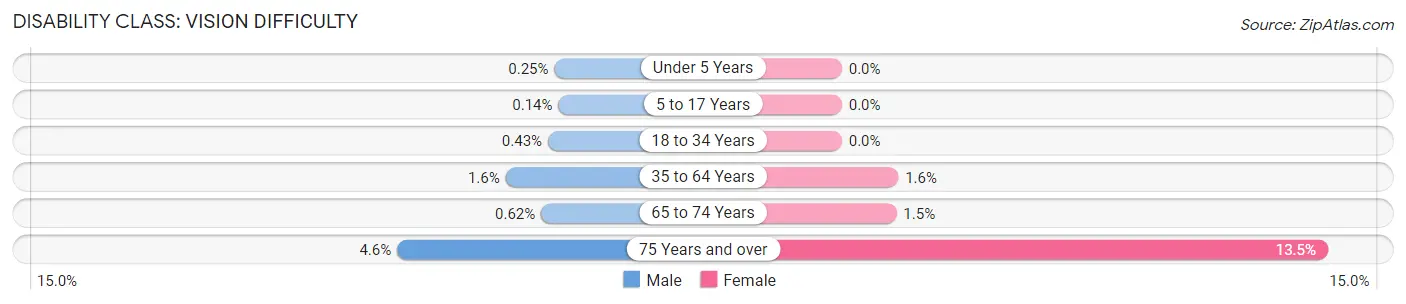
| Age Bracket | Male | Female |
| Under 5 Years | 3 (0.3%) | 0 (0.0%) |
| 5 to 17 Years | 5 (0.1%) | 0 (0.0%) |
| 18 to 34 Years | 18 (0.4%) | 0 (0.0%) |
| 35 to 64 Years | 132 (1.6%) | 126 (1.6%) |
| 65 to 74 Years | 16 (0.6%) | 42 (1.5%) |
| 75 Years and over | 69 (4.6%) | 311 (13.5%) |
Disability Class: Cognitive Difficulty
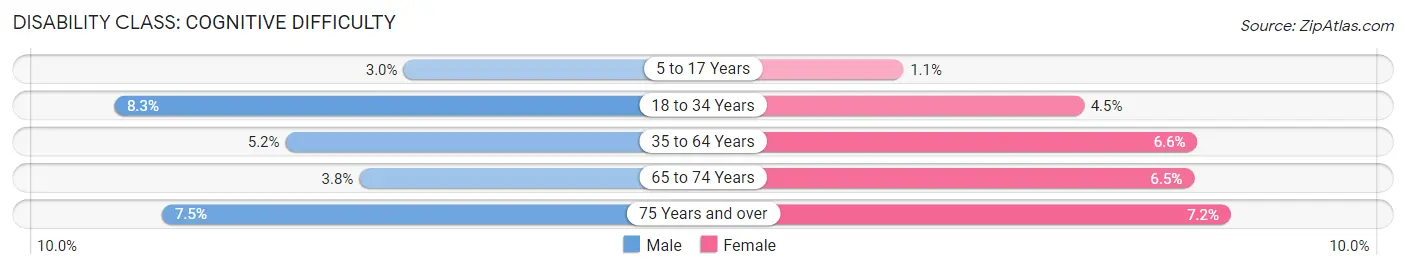
| Age Bracket | Male | Female |
| 5 to 17 Years | 105 (3.0%) | 36 (1.1%) |
| 18 to 34 Years | 347 (8.3%) | 178 (4.5%) |
| 35 to 64 Years | 422 (5.2%) | 529 (6.6%) |
| 65 to 74 Years | 98 (3.8%) | 181 (6.5%) |
| 75 Years and over | 111 (7.4%) | 166 (7.2%) |
Disability Class: Ambulatory Difficulty
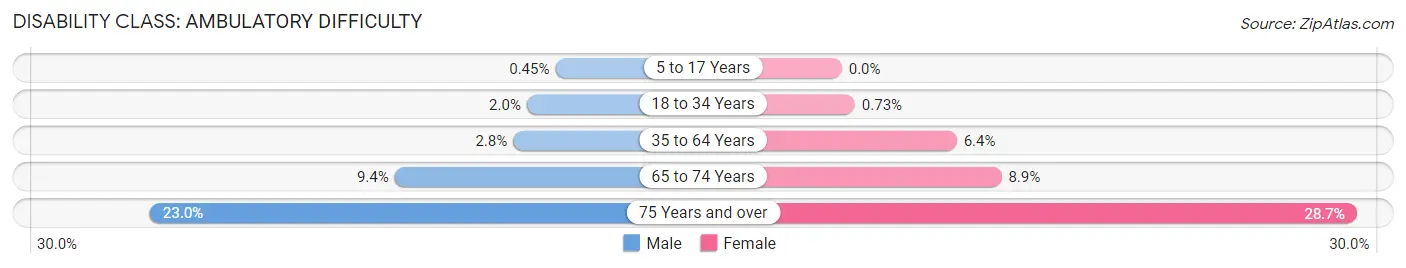
| Age Bracket | Male | Female |
| 5 to 17 Years | 16 (0.4%) | 0 (0.0%) |
| 18 to 34 Years | 85 (2.0%) | 29 (0.7%) |
| 35 to 64 Years | 229 (2.8%) | 513 (6.4%) |
| 65 to 74 Years | 243 (9.4%) | 246 (8.9%) |
| 75 Years and over | 343 (23.0%) | 659 (28.7%) |
Disability Class: Self-Care Difficulty
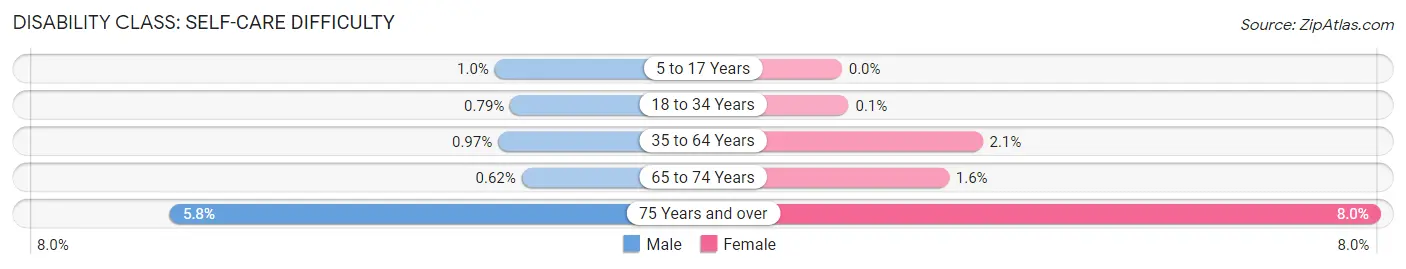
| Age Bracket | Male | Female |
| 5 to 17 Years | 36 (1.0%) | 0 (0.0%) |
| 18 to 34 Years | 33 (0.8%) | 4 (0.1%) |
| 35 to 64 Years | 79 (1.0%) | 168 (2.1%) |
| 65 to 74 Years | 16 (0.6%) | 44 (1.6%) |
| 75 Years and over | 87 (5.8%) | 184 (8.0%) |
Technology Access in Cerro Gordo County
Computing Device Access in Cerro Gordo County
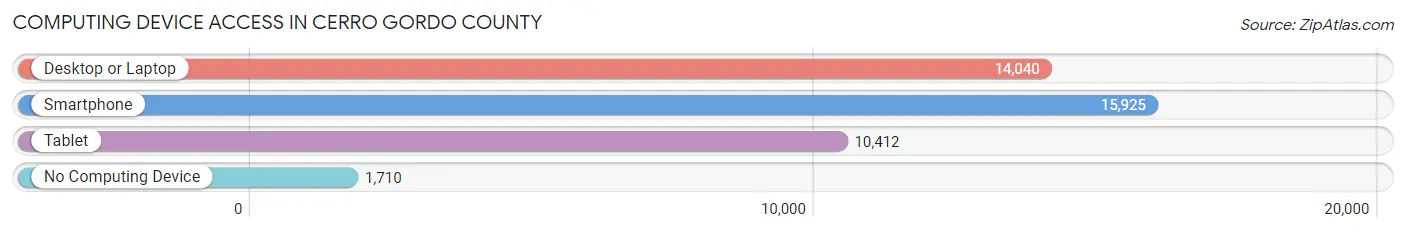
| Device Type | # Households | % Households |
| Desktop or Laptop | 14,040 | 72.2% |
| Smartphone | 15,925 | 81.9% |
| Tablet | 10,412 | 53.5% |
| No Computing Device | 1,710 | 8.8% |
| Total | 19,450 | 100.0% |
Internet Access in Cerro Gordo County
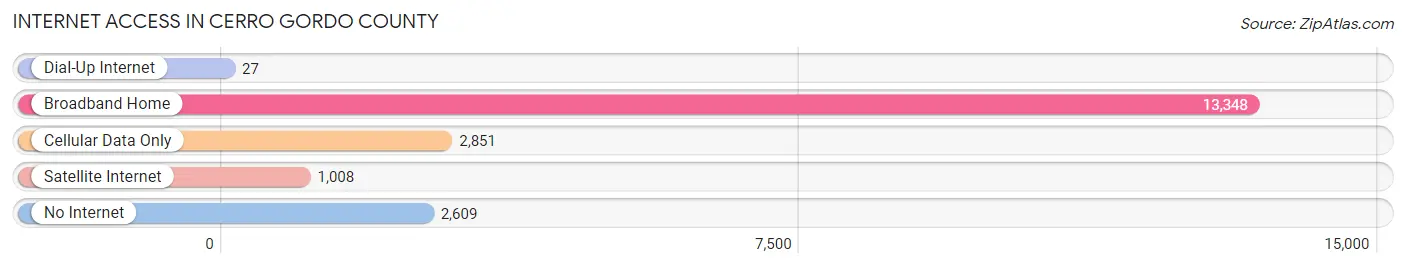
| Internet Type | # Households | % Households |
| Dial-Up Internet | 27 | 0.1% |
| Broadband Home | 13,348 | 68.6% |
| Cellular Data Only | 2,851 | 14.7% |
| Satellite Internet | 1,008 | 5.2% |
| No Internet | 2,609 | 13.4% |
| Total | 19,450 | 100.0% |
Cerro Gordo County Summary
Cerro Gordo County is located in the north-central part of the state of Iowa, in the United States. It is bordered by Worth County to the north, Hancock County to the east, Franklin County to the south, and Floyd County to the west. The county seat is Mason City, which is also the largest city in the county. The county was named after the Battle of Cerro Gordo, which was fought during the Mexican-American War.
Geography
Cerro Gordo County covers an area of 576 square miles, making it the 33rd largest county in Iowa. The county is located in the Driftless Area, which is characterized by rolling hills and valleys. The county is drained by the Winnebago River, which flows through the county from north to south. The county is also home to several small lakes, including Clear Lake, which is the largest natural lake in the state.
The county is mostly rural, with the majority of the population living in small towns and villages. The largest city in the county is Mason City, which is located in the center of the county. Other cities in the county include Clear Lake, Rockwell, and Dougherty.
Demographics
As of the 2010 census, there were 44,151 people, 17,845 households, and 11,845 families living in the county. The population density was 77.2 people per square mile. The racial makeup of the county was 94.2% White, 1.2% African American, 0.4% Native American, 1.7% Asian, 0.1% Pacific Islander, 1.2% from other races, and 1.2% from two or more races. Hispanic or Latino of any race were 3.3% of the population.
The median income for a household in the county was $45,945, and the median income for a family was $54,945. The per capita income for the county was $22,945. About 6.2% of families and 8.7% of the population were below the poverty line, including 11.2% of those under age 18 and 6.2% of those age 65 or over.
Economy
Cerro Gordo County is largely agricultural, with corn, soybeans, and oats being the main crops. The county is also home to several large manufacturing companies, including Winnebago Industries, which produces recreational vehicles, and Hormel Foods, which produces a variety of food products. The county is also home to several large retail stores, including Walmart and Target.
The county is served by two airports, Mason City Municipal Airport and Clear Lake Municipal Airport. The county is also served by several major highways, including Interstate 35, U.S. Route 18, and U.S. Route 65.
Conclusion
Cerro Gordo County is a rural county located in the north-central part of Iowa. The county is largely agricultural, with corn, soybeans, and oats being the main crops. The county is also home to several large manufacturing companies and retail stores. The county is served by two airports and several major highways. The population of the county is 44,151, with the median income for a household being $45,945.
Common Questions
What is Per Capita Income in Cerro Gordo County?
Per Capita income in Cerro Gordo County is $38,377.
What is the Median Family Income in Cerro Gordo County?
Median Family Income in Cerro Gordo County is $85,924.
What is the Median Household income in Cerro Gordo County?
Median Household Income in Cerro Gordo County is $63,149.
What is Income or Wage Gap in Cerro Gordo County?
Income or Wage Gap in Cerro Gordo County is 32.0%.
Women in Cerro Gordo County earn 68.0 cents for every dollar earned by a man.
What is Family Income Deficit in Cerro Gordo County?
Family Income Deficit in Cerro Gordo County is $10,203.
Families that are below poverty line in Cerro Gordo County earn $10,203 less on average than the poverty threshold level.
What is Inequality or Gini Index in Cerro Gordo County?
Inequality or Gini Index in Cerro Gordo County is 0.45.
What is the Total Population of Cerro Gordo County?
Total Population of Cerro Gordo County is 42,979.
What is the Total Male Population of Cerro Gordo County?
Total Male Population of Cerro Gordo County is 21,433.
What is the Total Female Population of Cerro Gordo County?
Total Female Population of Cerro Gordo County is 21,546.
What is the Ratio of Males per 100 Females in Cerro Gordo County?
There are 99.48 Males per 100 Females in Cerro Gordo County.
What is the Ratio of Females per 100 Males in Cerro Gordo County?
There are 100.53 Females per 100 Males in Cerro Gordo County.
What is the Median Population Age in Cerro Gordo County?
Median Population Age in Cerro Gordo County is 44.3 Years.
What is the Average Family Size in Cerro Gordo County
Average Family Size in Cerro Gordo County is 2.8 People.
What is the Average Household Size in Cerro Gordo County
Average Household Size in Cerro Gordo County is 2.1 People.
How Large is the Labor Force in Cerro Gordo County?
There are 22,682 People in the Labor Forcein in Cerro Gordo County.
What is the Percentage of People in the Labor Force in Cerro Gordo County?
64.6% of People are in the Labor Force in Cerro Gordo County.
What is the Unemployment Rate in Cerro Gordo County?
Unemployment Rate in Cerro Gordo County is 3.0%.