Area Code 712 Map & Demographics
Area Code 712 Map
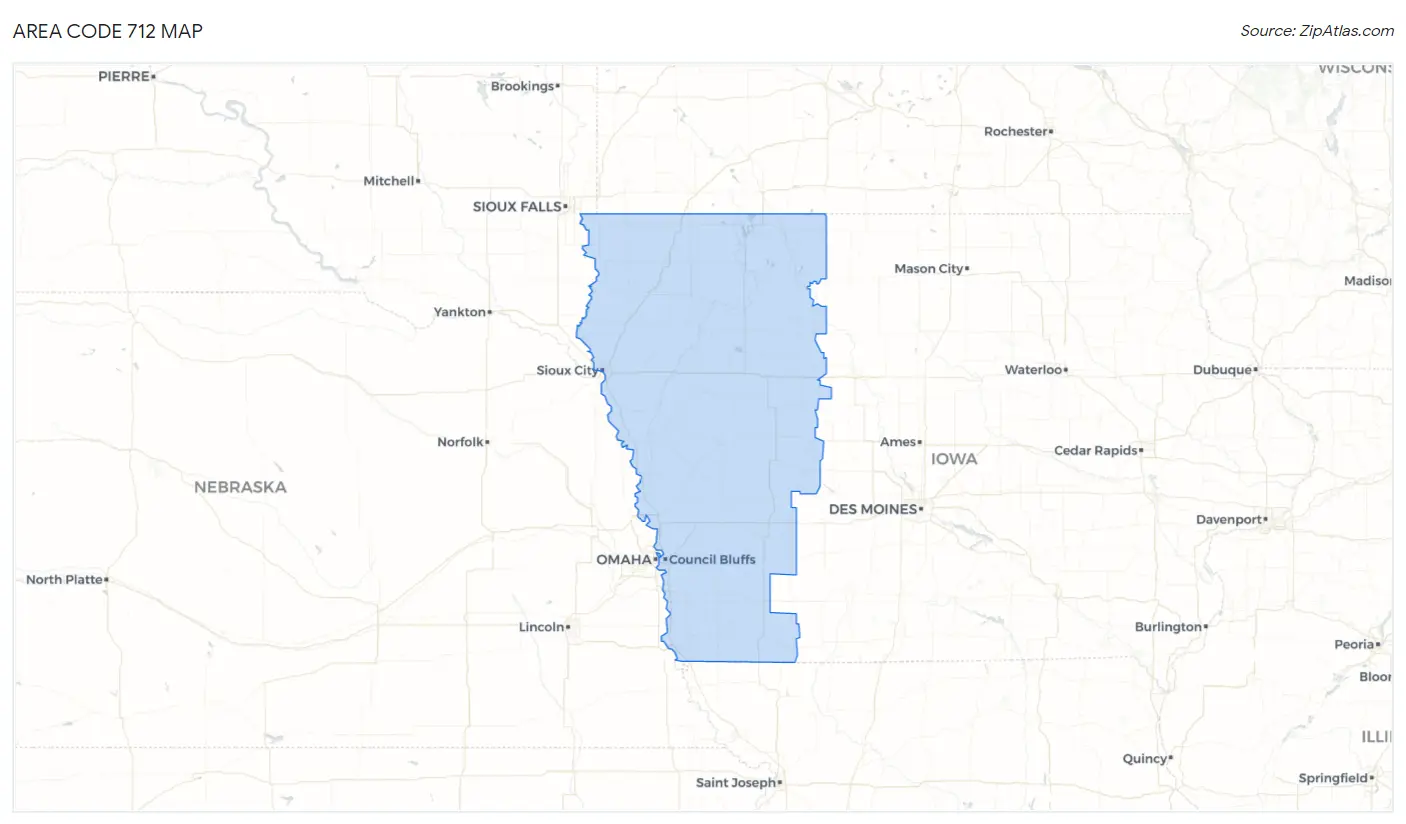
Area Code 712 Overview
$35,530
PER CAPITA INCOME
$85,256
AVG FAMILY INCOME
$69,799
AVG HOUSEHOLD INCOME
31.5%
WAGE / INCOME GAP [ % ]
68.5¢/ $1
WAGE / INCOME GAP [ $ ]
$9,024
FAMILY INCOME DEFICIT
102.16
INEQUALITY / GINI INDEX
552,635
TOTAL POPULATION
277,405
MALE POPULATION
275,230
FEMALE POPULATION
100.79
MALES / 100 FEMALES
99.22
FEMALES / 100 MALES
44.6
MEDIAN AGE
3.0
AVG FAMILY SIZE
2.4
AVG HOUSEHOLD SIZE
280,820
LABOR FORCE [ PEOPLE ]
64.3%
PERCENT IN LABOR FORCE
3.5%
UNEMPLOYMENT RATE
Income in Area Code 712
Income Overview in Area Code 712
Per Capita Income in Area Code 712 is $35,530, while median incomes of families and households are $85,256 and $69,799 respectively.
| Characteristic | Number | Measure |
| Per Capita Income | 552,635 | $35,530 |
| Median Family Income | 141,116 | $85,256 |
| Mean Family Income | 141,116 | $25,652,421 |
| Median Household Income | 221,016 | $69,799 |
| Mean Household Income | 221,016 | $21,924,235 |
| Income Deficit | 141,116 | $9,024 |
| Wage / Income Gap (%) | 552,635 | 31.55% |
| Wage / Income Gap ($) | 552,635 | 68.45¢ per $1 |
| Gini / Inequality Index | 552,635 | 102.16 |
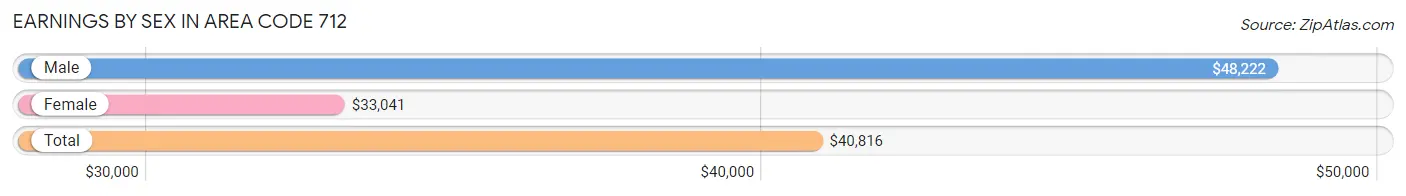
Earnings by Sex in Area Code 712
Average Earnings in Area Code 712 are $40,816, $48,222 for men and $33,041 for women, a difference of 31.5%.
| Sex | Number | Average Earnings |
| Male | 162,405 (53.5%) | $48,222 |
| Female | 141,315 (46.5%) | $33,041 |
| Total | 303,720 (100.0%) | $40,816 |
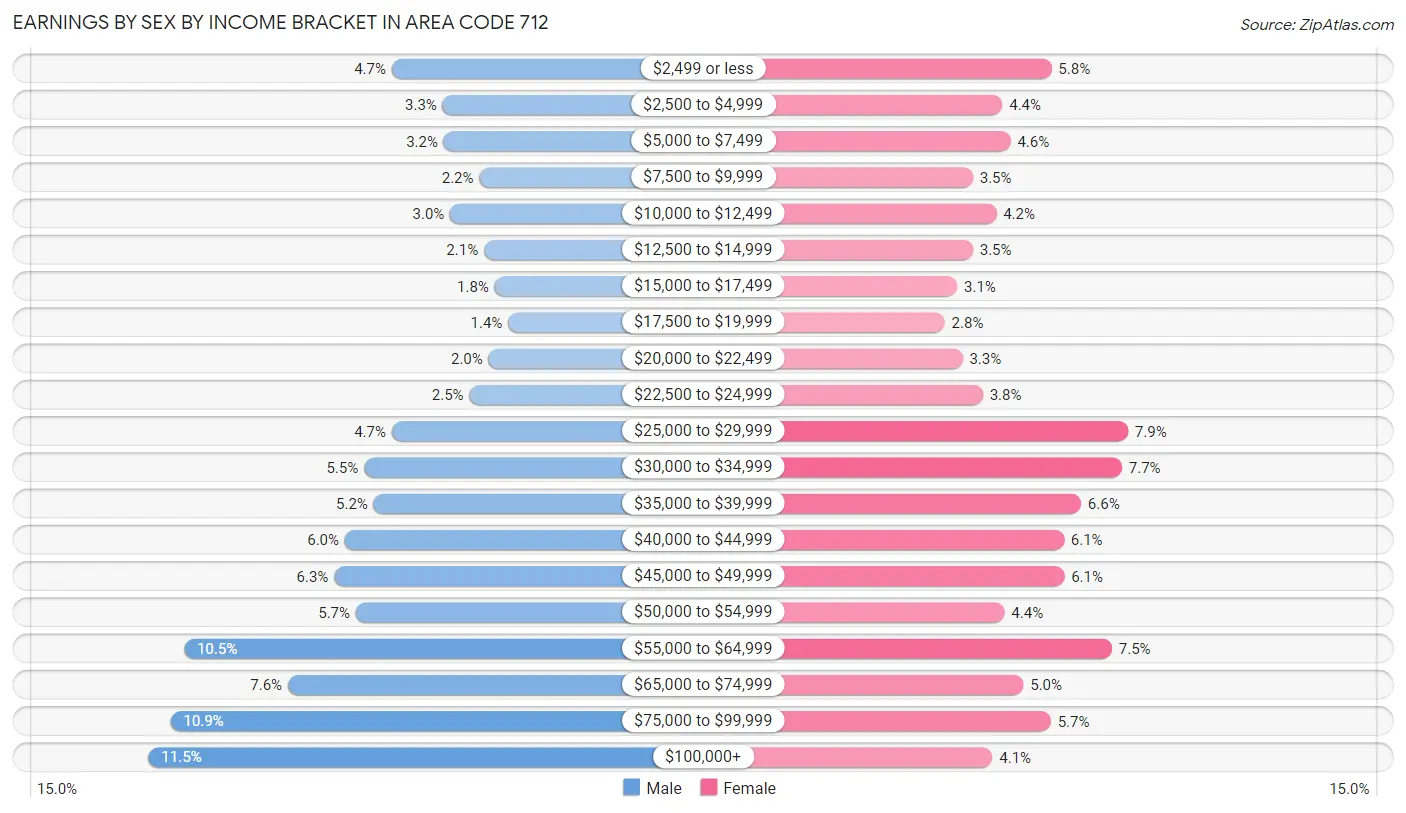
Earnings by Sex by Income Bracket in Area Code 712
The most common earnings brackets in Area Code 712 are $100,000+ for men (18,702 | 11.5%) and $25,000 to $29,999 for women (11,159 | 7.9%).
| Income | Male | Female |
| $2,499 or less | 7,594 (4.7%) | 8,122 (5.8%) |
| $2,500 to $4,999 | 5,286 (3.3%) | 6,172 (4.4%) |
| $5,000 to $7,499 | 5,225 (3.2%) | 6,501 (4.6%) |
| $7,500 to $9,999 | 3,604 (2.2%) | 4,998 (3.5%) |
| $10,000 to $12,499 | 4,930 (3.0%) | 5,930 (4.2%) |
| $12,500 to $14,999 | 3,401 (2.1%) | 5,007 (3.5%) |
| $15,000 to $17,499 | 2,915 (1.8%) | 4,377 (3.1%) |
| $17,500 to $19,999 | 2,284 (1.4%) | 3,885 (2.8%) |
| $20,000 to $22,499 | 3,190 (2.0%) | 4,595 (3.3%) |
| $22,500 to $24,999 | 4,066 (2.5%) | 5,405 (3.8%) |
| $25,000 to $29,999 | 7,595 (4.7%) | 11,159 (7.9%) |
| $30,000 to $34,999 | 8,863 (5.5%) | 10,929 (7.7%) |
| $35,000 to $39,999 | 8,423 (5.2%) | 9,299 (6.6%) |
| $40,000 to $44,999 | 9,742 (6.0%) | 8,622 (6.1%) |
| $45,000 to $49,999 | 10,224 (6.3%) | 8,638 (6.1%) |
| $50,000 to $54,999 | 9,242 (5.7%) | 6,265 (4.4%) |
| $55,000 to $64,999 | 17,089 (10.5%) | 10,523 (7.4%) |
| $65,000 to $74,999 | 12,335 (7.6%) | 7,009 (5.0%) |
| $75,000 to $99,999 | 17,695 (10.9%) | 8,102 (5.7%) |
| $100,000+ | 18,702 (11.5%) | 5,777 (4.1%) |
| Total | 162,405 (100.0%) | 141,315 (100.0%) |
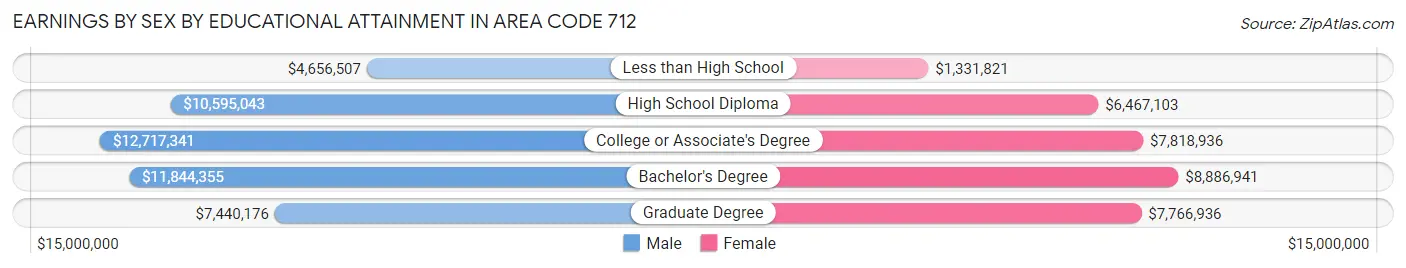
Earnings by Sex by Educational Attainment in Area Code 712
Average earnings in Area Code 712 are $12,607,074 for men and $8,687,703 for women, a difference of 31.1%. Men with an educational attainment of college or associate's degree enjoy the highest average annual earnings of $12,717,341, while those with less than high school education earn the least with $4,656,507. Women with an educational attainment of bachelor's degree earn the most with the average annual earnings of $8,886,941, while those with less than high school education have the smallest earnings of $1,331,821.
| Educational Attainment | Male Income | Female Income |
| Less than High School | $4,656,507 | $1,331,821 |
| High School Diploma | $10,595,043 | $6,467,103 |
| College or Associate's Degree | $12,717,341 | $7,818,936 |
| Bachelor's Degree | $11,844,355 | $8,886,941 |
| Graduate Degree | $7,440,176 | $7,766,936 |
| Total | $12,607,074 | $8,687,703 |
Family Income in Area Code 712
Family Income Brackets in Area Code 712
According to the Area Code 712 family income data, there are 8,622,611 families falling into the $100,000 to $149,999 income range, which is the most common income bracket and makes up 6,110.3% of all families. Conversely, the $10,000 to $14,999 income bracket is the least frequent group with only 544,708 families (386.0%) belonging to this category.
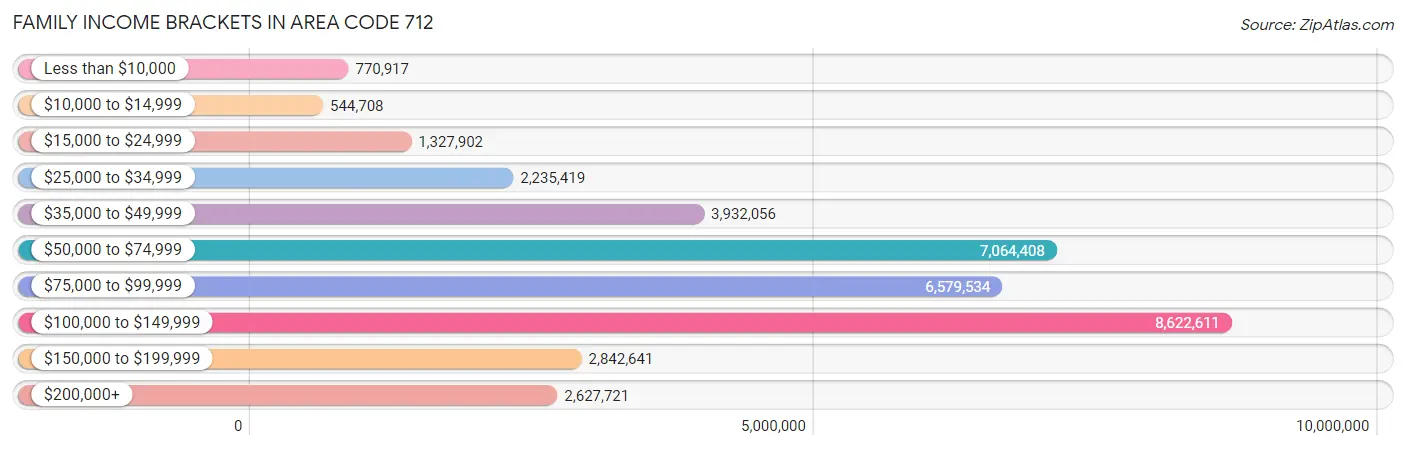
| Income Bracket | # Families | % Families |
| Less than $10,000 | 770,917 | 546.3% |
| $10,000 to $14,999 | 544,708 | 386.0% |
| $15,000 to $24,999 | 1,327,902 | 941.0% |
| $25,000 to $34,999 | 2,235,419 | 1,584.1% |
| $35,000 to $49,999 | 3,932,056 | 2,786.4% |
| $50,000 to $74,999 | 7,064,408 | 5,006.1% |
| $75,000 to $99,999 | 6,579,534 | 4,662.5% |
| $100,000 to $149,999 | 8,622,611 | 6,110.3% |
| $150,000 to $199,999 | 2,842,641 | 2,014.4% |
| $200,000+ | 2,627,721 | 1,862.1% |
Family Income by Famaliy Size in Area Code 712
7+ person families (1,957 | 1.4%) account for the highest median family income in Area Code 712 with $115,182 per family, while 2-person families (74,179 | 52.6%) have the highest median income of $39,520 per family member.
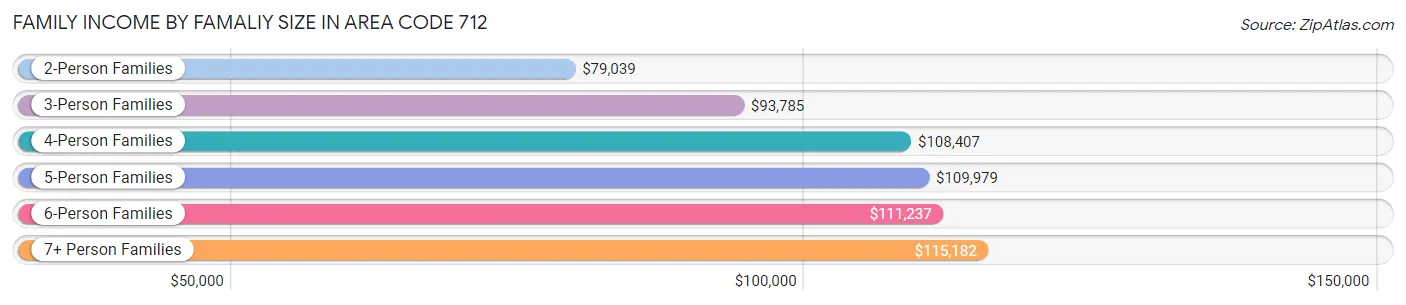
| Income Bracket | # Families | Median Income |
| 2-Person Families | 74,179 (52.6%) | $79,039 |
| 3-Person Families | 25,763 (18.3%) | $93,785 |
| 4-Person Families | 23,030 (16.3%) | $108,407 |
| 5-Person Families | 11,934 (8.5%) | $109,979 |
| 6-Person Families | 4,253 (3.0%) | $111,237 |
| 7+ Person Families | 1,957 (1.4%) | $115,182 |
| Total | 141,116 (100.0%) | $85,256 |
Family Income by Number of Earners in Area Code 712
The median family income in Area Code 712 is $85,256, with families comprising 3+ earners (16,225) having the highest median family income of $136,089, while families with no earners (20,808) have the lowest median family income of $52,786, accounting for 11.5% and 14.7% of families, respectively.
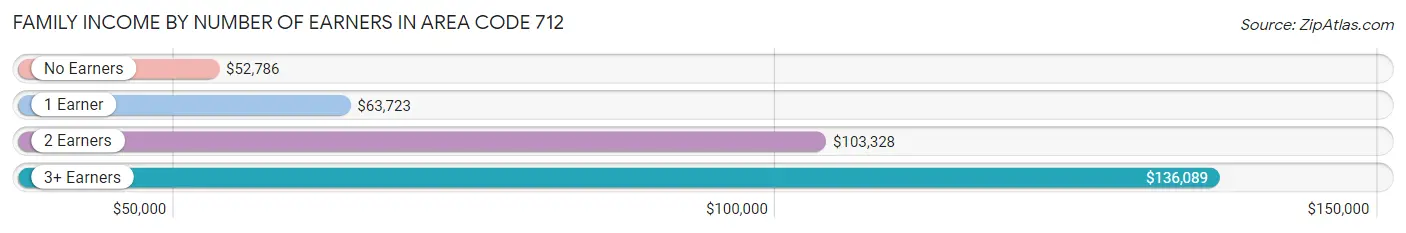
| Number of Earners | # Families | Median Income |
| No Earners | 20,808 (14.7%) | $52,786 |
| 1 Earner | 38,749 (27.5%) | $63,723 |
| 2 Earners | 65,334 (46.3%) | $103,328 |
| 3+ Earners | 16,225 (11.5%) | $136,089 |
| Total | 141,116 (100.0%) | $85,256 |
Household Income in Area Code 712
Household Income Brackets in Area Code 712
With 10,973,002 households falling in the category, the $50,000 to $74,999 income range is the most frequent in Area Code 712, accounting for 4,964.8% of all households. In contrast, only 1,909,578 households (864.0%) fall into the $10,000 to $14,999 income bracket, making it the least populous group.
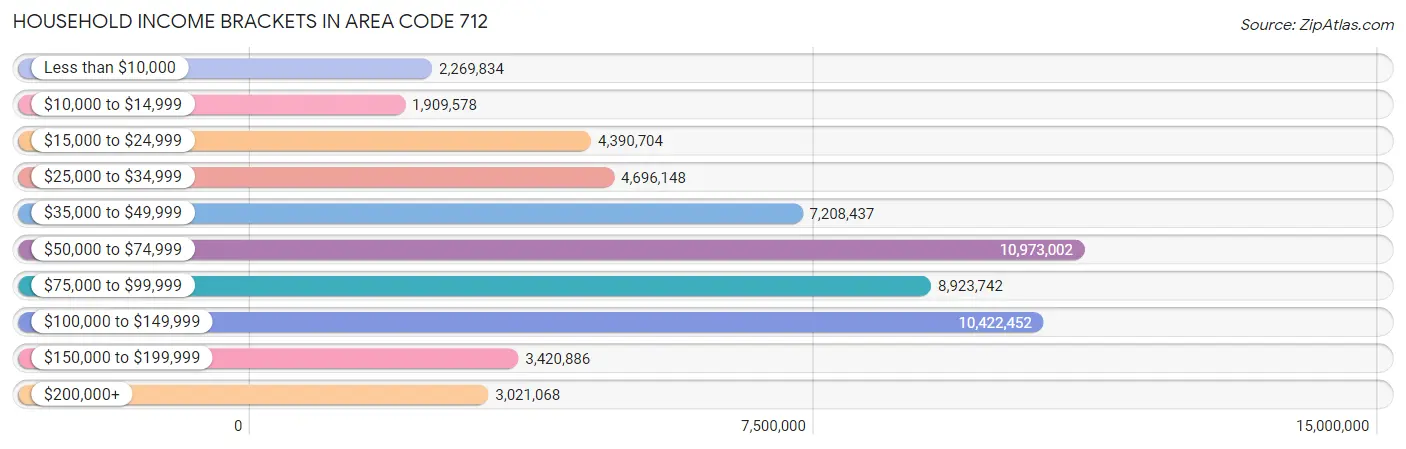
| Income Bracket | # Households | % Households |
| Less than $10,000 | 2,269,834 | 1,027.0% |
| $10,000 to $14,999 | 1,909,578 | 864.0% |
| $15,000 to $24,999 | 4,390,704 | 1,986.6% |
| $25,000 to $34,999 | 4,696,148 | 2,124.8% |
| $35,000 to $49,999 | 7,208,437 | 3,261.5% |
| $50,000 to $74,999 | 10,973,002 | 4,964.8% |
| $75,000 to $99,999 | 8,923,742 | 4,037.6% |
| $100,000 to $149,999 | 10,422,452 | 4,715.7% |
| $150,000 to $199,999 | 3,420,886 | 1,547.8% |
| $200,000+ | 3,021,068 | 1,366.9% |
Household Income by Householder Age in Area Code 712
The median household income in Area Code 712 is $69,799, with the highest median household income of $83,502 found in the 45 to 64 years age bracket for the primary householder. A total of 79,877 households (36.1%) fall into this category. Meanwhile, the 65+ years age bracket for the primary householder has the lowest median household income of $53,157, with 66,702 households (30.2%) in this group.
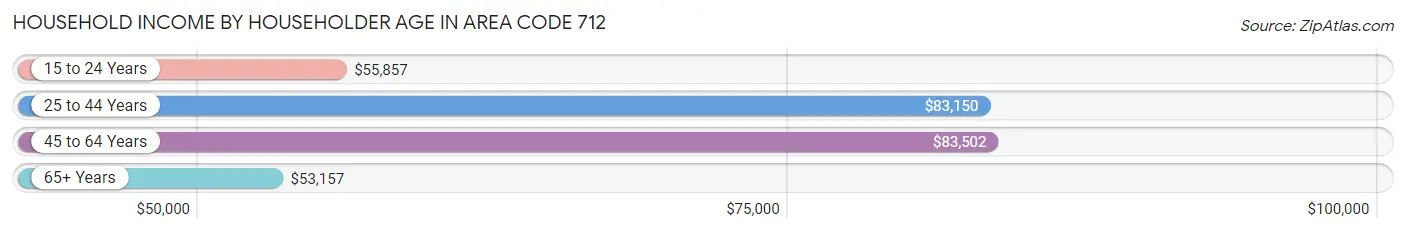
| Income Bracket | # Households | Median Income |
| 15 to 24 Years | 10,308 (4.7%) | $55,857 |
| 25 to 44 Years | 64,129 (29.0%) | $83,150 |
| 45 to 64 Years | 79,877 (36.1%) | $83,502 |
| 65+ Years | 66,702 (30.2%) | $53,157 |
| Total | 221,016 (100.0%) | $69,799 |
Poverty in Area Code 712
Income Below Poverty by Sex and Age in Area Code 712
With 9.3% poverty level for males and 11.9% for females among the residents of Area Code 712, 15 year old males and 18 to 24 year old females are the most vulnerable to poverty, with 734 males (17.0%) and 3,495 females (16.9%) in their respective age groups living below the poverty level.
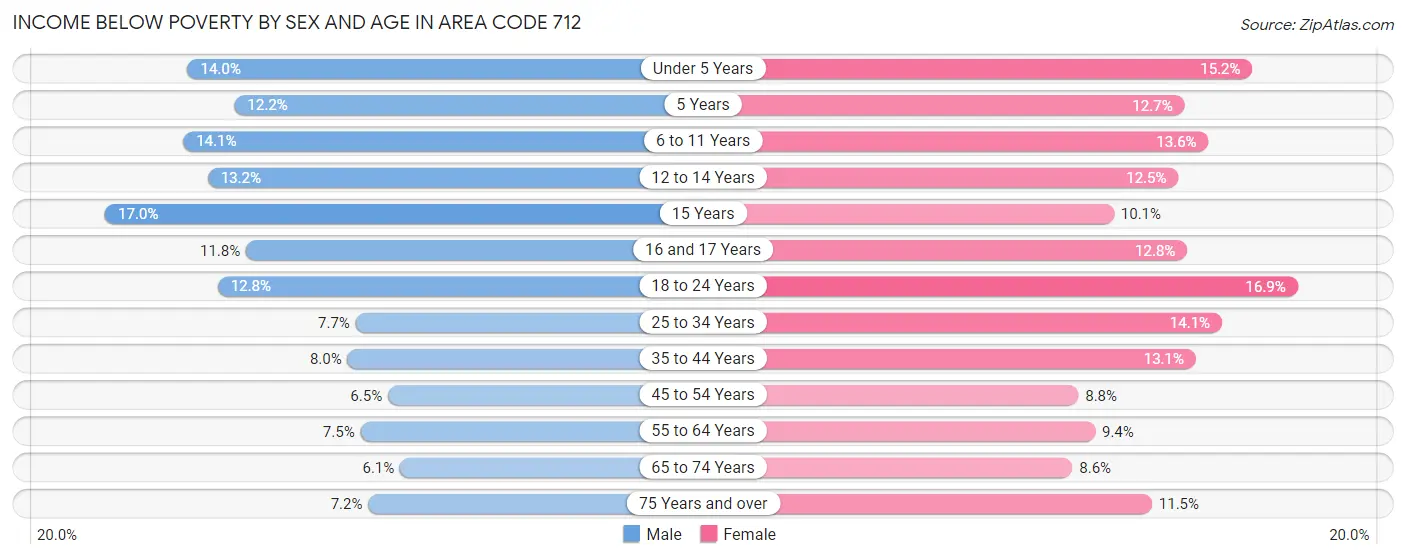
| Age Bracket | Male | Female |
| Under 5 Years | 2,332 (14.0%) | 2,407 (15.2%) |
| 5 Years | 459 (12.2%) | 483 (12.7%) |
| 6 to 11 Years | 3,229 (14.1%) | 2,865 (13.6%) |
| 12 to 14 Years | 1,489 (13.2%) | 1,375 (12.5%) |
| 15 Years | 734 (17.0%) | 365 (10.1%) |
| 16 and 17 Years | 935 (11.8%) | 953 (12.8%) |
| 18 to 24 Years | 2,825 (12.8%) | 3,495 (16.9%) |
| 25 to 34 Years | 2,420 (7.7%) | 4,183 (14.1%) |
| 35 to 44 Years | 2,616 (8.0%) | 4,149 (13.1%) |
| 45 to 54 Years | 2,055 (6.5%) | 2,682 (8.8%) |
| 55 to 64 Years | 2,848 (7.5%) | 3,543 (9.4%) |
| 65 to 74 Years | 1,772 (6.1%) | 2,562 (8.6%) |
| 75 Years and over | 1,280 (7.2%) | 2,850 (11.5%) |
| Total | 24,994 (9.3%) | 31,912 (11.9%) |
Income Above Poverty by Sex and Age in Area Code 712
According to the poverty statistics in Area Code 712, males aged 65 to 74 years and females aged 65 to 74 years are the age groups that are most secure financially, with 93.9% of males and 91.4% of females in these age groups living above the poverty line.
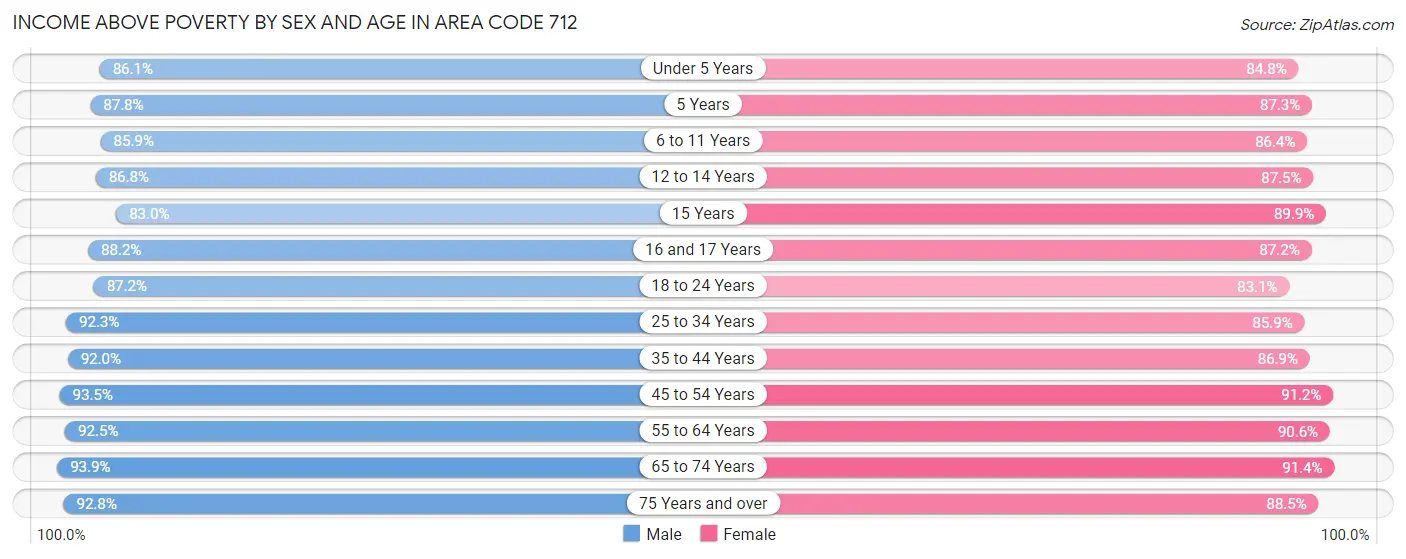
| Age Bracket | Male | Female |
| Under 5 Years | 14,384 (86.1%) | 13,384 (84.8%) |
| 5 Years | 3,299 (87.8%) | 3,313 (87.3%) |
| 6 to 11 Years | 19,651 (85.9%) | 18,185 (86.4%) |
| 12 to 14 Years | 9,795 (86.8%) | 9,633 (87.5%) |
| 15 Years | 3,580 (83.0%) | 3,250 (89.9%) |
| 16 and 17 Years | 6,999 (88.2%) | 6,478 (87.2%) |
| 18 to 24 Years | 19,191 (87.2%) | 17,163 (83.1%) |
| 25 to 34 Years | 28,976 (92.3%) | 25,459 (85.9%) |
| 35 to 44 Years | 30,057 (92.0%) | 27,417 (86.9%) |
| 45 to 54 Years | 29,512 (93.5%) | 27,852 (91.2%) |
| 55 to 64 Years | 34,971 (92.5%) | 34,161 (90.6%) |
| 65 to 74 Years | 27,449 (93.9%) | 27,351 (91.4%) |
| 75 Years and over | 16,410 (92.8%) | 21,921 (88.5%) |
| Total | 244,274 (90.7%) | 235,567 (88.1%) |
Income Below Poverty Among Married-Couple Families in Area Code 712
The poverty statistics for married-couple families in Area Code 712 show that 3.2% or 3,560 of the total 110,809 families live below the poverty line. Families with 5 or more children have the highest poverty rate of 19.2%, comprising of 192 families. On the other hand, families with 1 or 2 children have the lowest poverty rate of 2.4%, which includes 694 families.
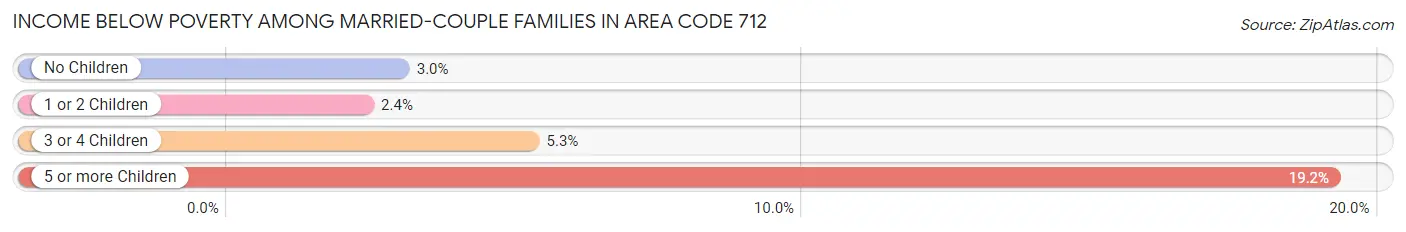
| Children | Above Poverty | Below Poverty |
| No Children | 66,868 (97.0%) | 2,063 (3.0%) |
| 1 or 2 Children | 28,552 (97.6%) | 694 (2.4%) |
| 3 or 4 Children | 11,021 (94.8%) | 611 (5.2%) |
| 5 or more Children | 808 (80.8%) | 192 (19.2%) |
| Total | 107,249 (96.8%) | 3,560 (3.2%) |
Income Below Poverty Among Single-Parent Households in Area Code 712
According to the poverty data in Area Code 712, 10.3% or 984 single-father households and 27.7% or 5,756 single-mother households are living below the poverty line. Among single-father households, those with 3 or 4 children have the highest poverty rate, with 230 households (23.1%) experiencing poverty. Likewise, among single-mother households, those with 3 or 4 children have the highest poverty rate, with 1,719 households (57.9%) falling below the poverty line.
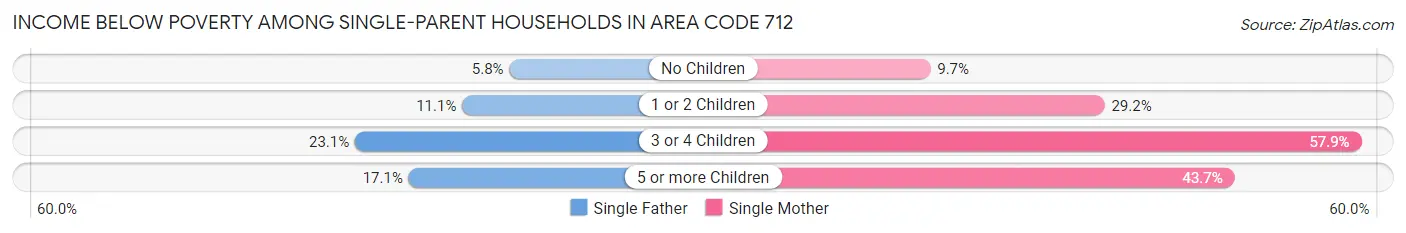
| Children | Single Father | Single Mother |
| No Children | 218 (5.8%) | 586 (9.7%) |
| 1 or 2 Children | 522 (11.1%) | 3,375 (29.1%) |
| 3 or 4 Children | 230 (23.1%) | 1,719 (57.9%) |
| 5 or more Children | 14 (17.1%) | 76 (43.7%) |
| Total | 984 (10.3%) | 5,756 (27.7%) |
Income Below Poverty Among Married-Couple vs Single-Parent Households in Area Code 712
The poverty data for Area Code 712 shows that 3,560 of the married-couple family households (3.2%) and 6,740 of the single-parent households (22.2%) are living below the poverty level. Within the married-couple family households, those with 5 or more children have the highest poverty rate, with 192 households (19.2%) falling below the poverty line. Among the single-parent households, those with 3 or 4 children have the highest poverty rate, with 1,949 household (49.1%) living below poverty.
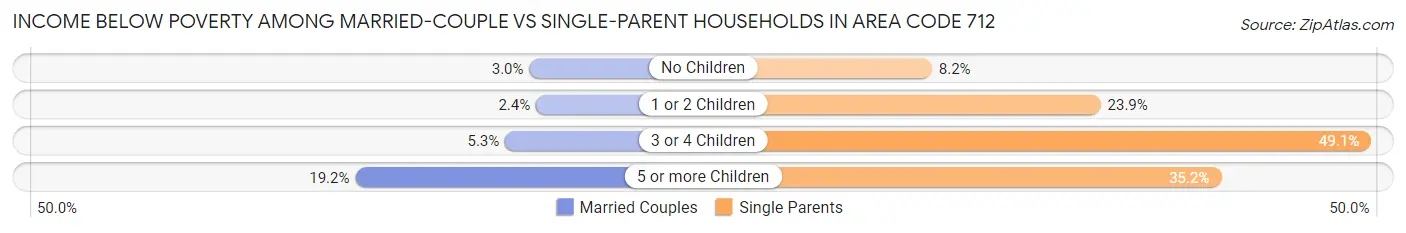
| Children | Married-Couple Families | Single-Parent Households |
| No Children | 2,063 (3.0%) | 804 (8.2%) |
| 1 or 2 Children | 694 (2.4%) | 3,897 (23.9%) |
| 3 or 4 Children | 611 (5.2%) | 1,949 (49.1%) |
| 5 or more Children | 192 (19.2%) | 90 (35.2%) |
| Total | 3,560 (3.2%) | 6,740 (22.2%) |
Race in Area Code 712
The most populous races in Area Code 712 are White / Caucasian (487,760 | 88.3%), Hispanic or Latino (52,168 | 9.4%), and Two or more Races (31,127 | 5.6%).
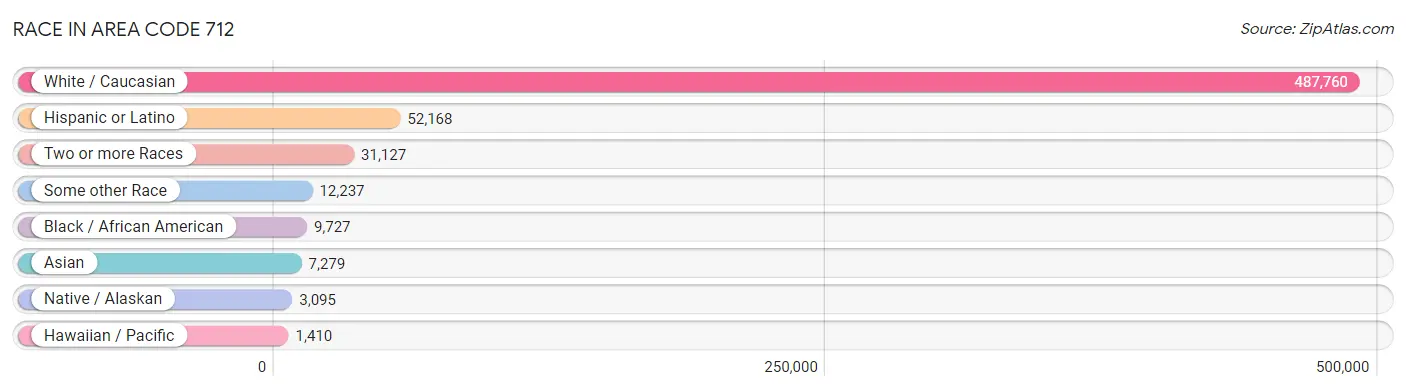
| Race | # Population | % Population |
| Asian | 7,279 | 1.3% |
| Black / African American | 9,727 | 1.8% |
| Hawaiian / Pacific | 1,410 | 0.3% |
| Hispanic or Latino | 52,168 | 9.4% |
| Native / Alaskan | 3,095 | 0.6% |
| White / Caucasian | 487,760 | 88.3% |
| Two or more Races | 31,127 | 5.6% |
| Some other Race | 12,237 | 2.2% |
| Total | 552,635 | 100.0% |
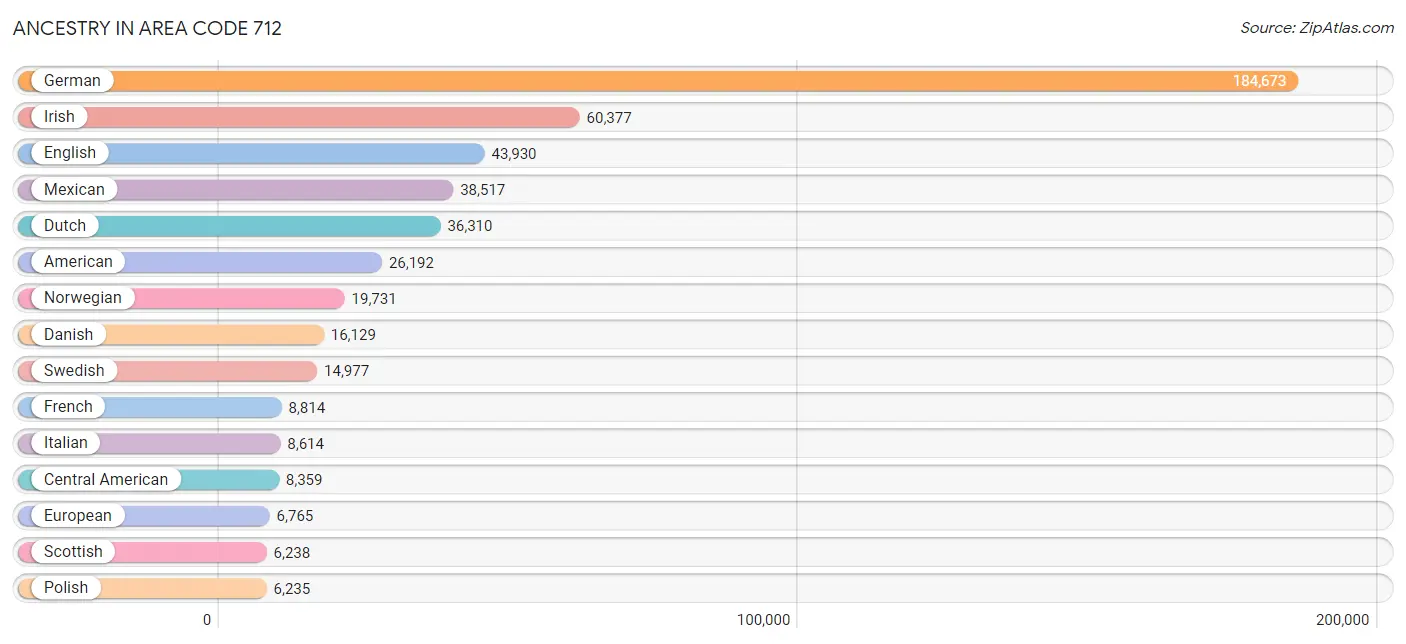
Ancestry in Area Code 712
The most populous ancestries reported in Area Code 712 are German (184,673 | 33.4%), Irish (60,377 | 10.9%), English (43,930 | 8.0%), Mexican (38,517 | 7.0%), and Dutch (36,310 | 6.6%), together accounting for 65.8% of all Area Code 712 residents.
| Ancestry | # Population | % Population |
| Afghan | 130 | 0.0% |
| African | 1,285 | 0.2% |
| Alaska Native | 20 | 0.0% |
| Alaskan Athabascan | 2 | 0.0% |
| Albanian | 10 | 0.0% |
| Alsatian | 6 | 0.0% |
| American | 26,192 | 4.7% |
| Apache | 69 | 0.0% |
| Arab | 997 | 0.2% |
| Argentinean | 11 | 0.0% |
| Armenian | 46 | 0.0% |
| Australian | 103 | 0.0% |
| Austrian | 353 | 0.1% |
| Bangladeshi | 865 | 0.2% |
| Basque | 15 | 0.0% |
| Belgian | 279 | 0.1% |
| Bhutanese | 716 | 0.1% |
| Blackfeet | 65 | 0.0% |
| Bolivian | 89 | 0.0% |
| Brazilian | 133 | 0.0% |
| British | 1,443 | 0.3% |
| Bulgarian | 80 | 0.0% |
| Burmese | 1,089 | 0.2% |
| Cajun | 31 | 0.0% |
| Canadian | 417 | 0.1% |
| Cape Verdean | 5 | 0.0% |
| Celtic | 167 | 0.0% |
| Central American | 8,359 | 1.5% |
| Central American Indian | 160 | 0.0% |
| Cherokee | 782 | 0.1% |
| Cheyenne | 161 | 0.0% |
| Chickasaw | 15 | 0.0% |
| Chilean | 72 | 0.0% |
| Chippewa | 230 | 0.0% |
| Choctaw | 88 | 0.0% |
| Colombian | 158 | 0.0% |
| Comanche | 34 | 0.0% |
| Costa Rican | 19 | 0.0% |
| Cree | 19 | 0.0% |
| Creek | 31 | 0.0% |
| Croatian | 236 | 0.0% |
| Crow | 3 | 0.0% |
| Cuban | 915 | 0.2% |
| Cypriot | 11 | 0.0% |
| Czech | 5,518 | 1.0% |
| Czechoslovakian | 698 | 0.1% |
| Danish | 16,129 | 2.9% |
| Delaware | 9 | 0.0% |
| Dominican | 149 | 0.0% |
| Dutch | 36,310 | 6.6% |
| Dutch West Indian | 5 | 0.0% |
| Eastern European | 517 | 0.1% |
| Ecuadorian | 31 | 0.0% |
| Egyptian | 24 | 0.0% |
| English | 43,930 | 8.0% |
| Estonian | 19 | 0.0% |
| Ethiopian | 1,054 | 0.2% |
| European | 6,765 | 1.2% |
| Fijian | 74 | 0.0% |
| Filipino | 50 | 0.0% |
| Finnish | 237 | 0.0% |
| French | 8,814 | 1.6% |
| French American Indian | 15 | 0.0% |
| French Canadian | 1,518 | 0.3% |
| German | 184,673 | 33.4% |
| German Russian | 48 | 0.0% |
| Ghanaian | 62 | 0.0% |
| Greek | 561 | 0.1% |
| Guamanian / Chamorro | 193 | 0.0% |
| Guatemalan | 4,785 | 0.9% |
| Haitian | 15 | 0.0% |
| Honduran | 697 | 0.1% |
| Hopi | 6 | 0.0% |
| Hungarian | 319 | 0.1% |
| Icelander | 243 | 0.0% |
| Indian (Asian) | 879 | 0.2% |
| Indonesian | 513 | 0.1% |
| Inupiat | 22 | 0.0% |
| Iranian | 31 | 0.0% |
| Irish | 60,377 | 10.9% |
| Iroquois | 112 | 0.0% |
| Italian | 8,614 | 1.6% |
| Jamaican | 150 | 0.0% |
| Japanese | 159 | 0.0% |
| Jordanian | 57 | 0.0% |
| Kenyan | 14 | 0.0% |
| Kiowa | 14 | 0.0% |
| Korean | 1,676 | 0.3% |
| Laotian | 5 | 0.0% |
| Latvian | 23 | 0.0% |
| Lebanese | 344 | 0.1% |
| Liberian | 29 | 0.0% |
| Lithuanian | 356 | 0.1% |
| Luxembourger | 1,309 | 0.2% |
| Macedonian | 5 | 0.0% |
| Malaysian | 1,475 | 0.3% |
| Mexican | 38,517 | 7.0% |
| Mexican American Indian | 404 | 0.1% |
| Mongolian | 21 | 0.0% |
| Moroccan | 12 | 0.0% |
| Native Hawaiian | 341 | 0.1% |
| Navajo | 137 | 0.0% |
| Nicaraguan | 123 | 0.0% |
| Nigerian | 70 | 0.0% |
| Northern European | 594 | 0.1% |
| Norwegian | 19,731 | 3.6% |
| Osage | 20 | 0.0% |
| Ottawa | 22 | 0.0% |
| Paiute | 30 | 0.0% |
| Pakistani | 409 | 0.1% |
| Panamanian | 29 | 0.0% |
| Paraguayan | 13 | 0.0% |
| Pennsylvania German | 376 | 0.1% |
| Peruvian | 85 | 0.0% |
| Polish | 6,235 | 1.1% |
| Portuguese | 255 | 0.1% |
| Potawatomi | 51 | 0.0% |
| Puerto Rican | 1,230 | 0.2% |
| Romanian | 117 | 0.0% |
| Russian | 1,103 | 0.2% |
| Salvadoran | 2,604 | 0.5% |
| Samoan | 407 | 0.1% |
| Scandinavian | 2,506 | 0.4% |
| Scotch-Irish | 2,986 | 0.5% |
| Scottish | 6,238 | 1.1% |
| Seminole | 1 | 0.0% |
| Senegalese | 43 | 0.0% |
| Serbian | 106 | 0.0% |
| Sierra Leonean | 29 | 0.0% |
| Sioux | 1,434 | 0.3% |
| Slavic | 41 | 0.0% |
| Slovak | 85 | 0.0% |
| Slovene | 17 | 0.0% |
| Somali | 43 | 0.0% |
| South African | 83 | 0.0% |
| South American | 476 | 0.1% |
| South American Indian | 27 | 0.0% |
| Spaniard | 520 | 0.1% |
| Spanish | 447 | 0.1% |
| Spanish American | 5 | 0.0% |
| Sri Lankan | 1,822 | 0.3% |
| Subsaharan African | 3,438 | 0.6% |
| Sudanese | 507 | 0.1% |
| Swedish | 14,977 | 2.7% |
| Swiss | 1,620 | 0.3% |
| Syrian | 474 | 0.1% |
| Thai | 365 | 0.1% |
| Tohono O'Odham | 4 | 0.0% |
| Tongan | 23 | 0.0% |
| Turkish | 17 | 0.0% |
| Ukrainian | 252 | 0.1% |
| Ute | 25 | 0.0% |
| Venezuelan | 17 | 0.0% |
| Vietnamese | 19 | 0.0% |
| Welsh | 2,197 | 0.4% |
| West Indian | 126 | 0.0% |
| Yugoslavian | 18 | 0.0% | View All 157 Rows |
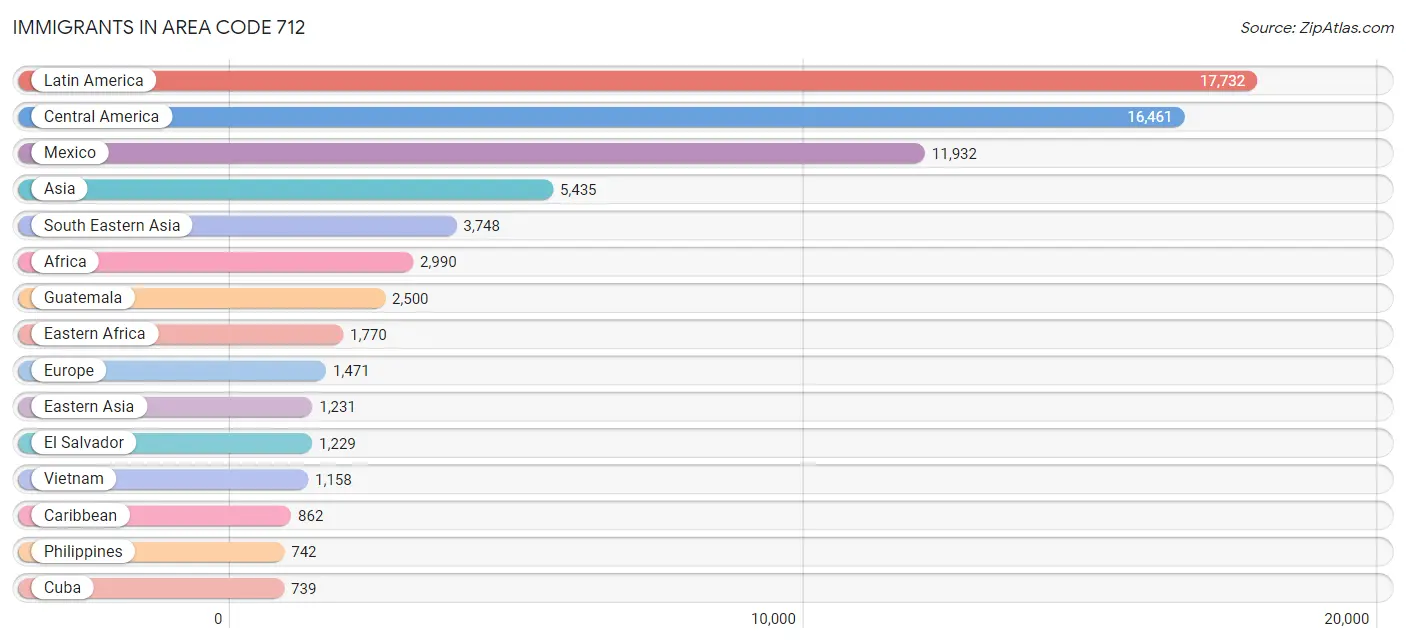
Immigrants in Area Code 712
The most numerous immigrant groups reported in Area Code 712 came from Latin America (17,732 | 3.2%), Central America (16,461 | 3.0%), Mexico (11,932 | 2.2%), Asia (5,435 | 1.0%), and South Eastern Asia (3,748 | 0.7%), together accounting for 10.0% of all Area Code 712 residents.
| Immigration Origin | # Population | % Population |
| Afghanistan | 130 | 0.0% |
| Africa | 2,990 | 0.5% |
| Argentina | 4 | 0.0% |
| Asia | 5,435 | 1.0% |
| Australia | 37 | 0.0% |
| Austria | 28 | 0.0% |
| Azores | 4 | 0.0% |
| Bahamas | 16 | 0.0% |
| Bangladesh | 22 | 0.0% |
| Belgium | 33 | 0.0% |
| Belize | 2 | 0.0% |
| Bolivia | 8 | 0.0% |
| Bosnia and Herzegovina | 12 | 0.0% |
| Brazil | 124 | 0.0% |
| Bulgaria | 42 | 0.0% |
| Cambodia | 130 | 0.0% |
| Canada | 407 | 0.1% |
| Caribbean | 862 | 0.2% |
| Central America | 16,461 | 3.0% |
| Chile | 10 | 0.0% |
| China | 433 | 0.1% |
| Colombia | 130 | 0.0% |
| Congo | 260 | 0.1% |
| Costa Rica | 18 | 0.0% |
| Cuba | 739 | 0.1% |
| Czechoslovakia | 23 | 0.0% |
| Denmark | 7 | 0.0% |
| Dominican Republic | 13 | 0.0% |
| Eastern Africa | 1,770 | 0.3% |
| Eastern Asia | 1,231 | 0.2% |
| Eastern Europe | 283 | 0.1% |
| Ecuador | 14 | 0.0% |
| Egypt | 2 | 0.0% |
| El Salvador | 1,229 | 0.2% |
| England | 69 | 0.0% |
| Eritrea | 489 | 0.1% |
| Ethiopia | 627 | 0.1% |
| Europe | 1,471 | 0.3% |
| France | 6 | 0.0% |
| Germany | 432 | 0.1% |
| Ghana | 62 | 0.0% |
| Greece | 116 | 0.0% |
| Guatemala | 2,500 | 0.4% |
| Haiti | 8 | 0.0% |
| Honduras | 491 | 0.1% |
| Hong Kong | 21 | 0.0% |
| India | 201 | 0.0% |
| Indonesia | 36 | 0.0% |
| Iran | 8 | 0.0% |
| Ireland | 18 | 0.0% |
| Italy | 10 | 0.0% |
| Japan | 119 | 0.0% |
| Jordan | 43 | 0.0% |
| Kazakhstan | 1 | 0.0% |
| Kenya | 240 | 0.0% |
| Korea | 679 | 0.1% |
| Laos | 645 | 0.1% |
| Latin America | 17,732 | 3.2% |
| Latvia | 2 | 0.0% |
| Liberia | 66 | 0.0% |
| Lithuania | 23 | 0.0% |
| Malaysia | 39 | 0.0% |
| Mexico | 11,932 | 2.2% |
| Micronesia | 481 | 0.1% |
| Middle Africa | 260 | 0.1% |
| Morocco | 12 | 0.0% |
| Netherlands | 159 | 0.0% |
| Nicaragua | 160 | 0.0% |
| Nigeria | 44 | 0.0% |
| North Macedonia | 11 | 0.0% |
| Northern Africa | 328 | 0.1% |
| Northern Europe | 298 | 0.1% |
| Norway | 22 | 0.0% |
| Oceania | 587 | 0.1% |
| Pakistan | 19 | 0.0% |
| Panama | 35 | 0.0% |
| Peru | 85 | 0.0% |
| Philippines | 742 | 0.1% |
| Poland | 16 | 0.0% |
| Portugal | 4 | 0.0% |
| Romania | 32 | 0.0% |
| Russia | 47 | 0.0% |
| Scotland | 7 | 0.0% |
| Senegal | 43 | 0.0% |
| Somalia | 39 | 0.0% |
| South Africa | 54 | 0.0% |
| South America | 409 | 0.1% |
| South Central Asia | 386 | 0.1% |
| South Eastern Asia | 3,748 | 0.7% |
| Southern Europe | 227 | 0.0% |
| Spain | 97 | 0.0% |
| Sri Lanka | 5 | 0.0% |
| Sudan | 314 | 0.1% |
| Sweden | 27 | 0.0% |
| Switzerland | 5 | 0.0% |
| Taiwan | 43 | 0.0% |
| Thailand | 631 | 0.1% |
| Trinidad and Tobago | 2 | 0.0% |
| Turkey | 13 | 0.0% |
| Ukraine | 61 | 0.0% |
| Venezuela | 25 | 0.0% |
| Vietnam | 1,158 | 0.2% |
| West Indies | 84 | 0.0% |
| Western Africa | 327 | 0.1% |
| Western Asia | 70 | 0.0% |
| Western Europe | 663 | 0.1% | View All 106 Rows |
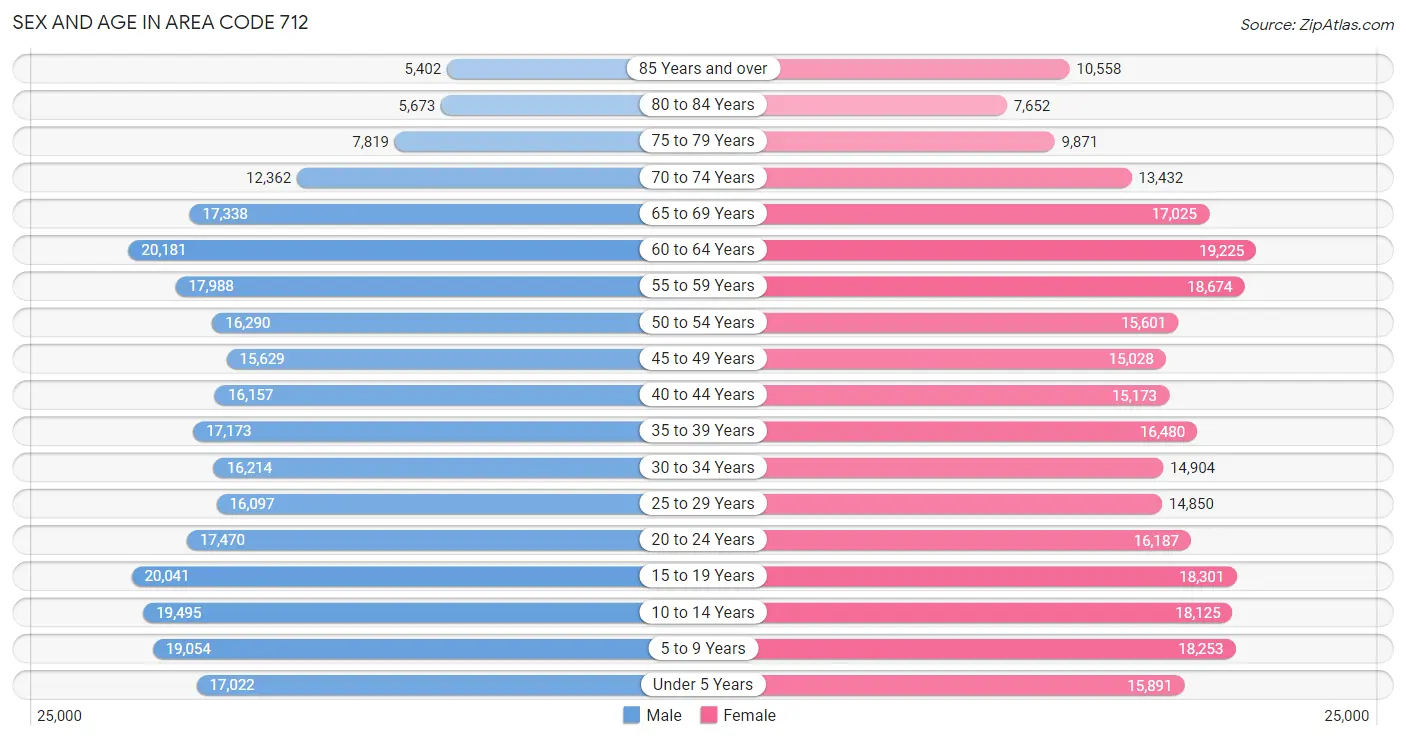
Sex and Age in Area Code 712
Sex and Age in Area Code 712
The most populous age groups in Area Code 712 are 60 to 64 Years (20,181 | 7.3%) for men and 60 to 64 Years (19,225 | 7.0%) for women.
| Age Bracket | Male | Female |
| Under 5 Years | 17,022 (6.1%) | 15,891 (5.8%) |
| 5 to 9 Years | 19,054 (6.9%) | 18,253 (6.6%) |
| 10 to 14 Years | 19,495 (7.0%) | 18,125 (6.6%) |
| 15 to 19 Years | 20,041 (7.2%) | 18,301 (6.7%) |
| 20 to 24 Years | 17,470 (6.3%) | 16,187 (5.9%) |
| 25 to 29 Years | 16,097 (5.8%) | 14,850 (5.4%) |
| 30 to 34 Years | 16,214 (5.8%) | 14,904 (5.4%) |
| 35 to 39 Years | 17,173 (6.2%) | 16,480 (6.0%) |
| 40 to 44 Years | 16,157 (5.8%) | 15,173 (5.5%) |
| 45 to 49 Years | 15,629 (5.6%) | 15,028 (5.5%) |
| 50 to 54 Years | 16,290 (5.9%) | 15,601 (5.7%) |
| 55 to 59 Years | 17,988 (6.5%) | 18,674 (6.8%) |
| 60 to 64 Years | 20,181 (7.3%) | 19,225 (7.0%) |
| 65 to 69 Years | 17,338 (6.2%) | 17,025 (6.2%) |
| 70 to 74 Years | 12,362 (4.5%) | 13,432 (4.9%) |
| 75 to 79 Years | 7,819 (2.8%) | 9,871 (3.6%) |
| 80 to 84 Years | 5,673 (2.1%) | 7,652 (2.8%) |
| 85 Years and over | 5,402 (1.9%) | 10,558 (3.8%) |
| Total | 277,405 (100.0%) | 275,230 (100.0%) |
Families and Households in Area Code 712
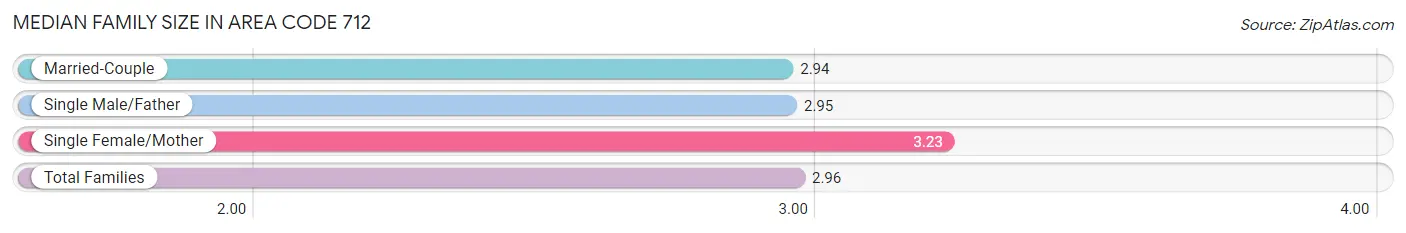
Median Family Size in Area Code 712
The median family size in Area Code 712 is 2.96 persons per family, with single female/mother families (20,774 | 14.7%) accounting for the largest median family size of 3.22915 persons per family. On the other hand, married-couple families (110,809 | 78.5%) represent the smallest median family size with 2.94 persons per family.
| Family Type | # Families | Family Size |
| Married-Couple | 110,809 (78.5%) | 2.94 |
| Single Male/Father | 9,533 (6.8%) | 2.95 |
| Single Female/Mother | 20,774 (14.7%) | 3.23 |
| Total Families | 141,116 (100.0%) | 2.96 |
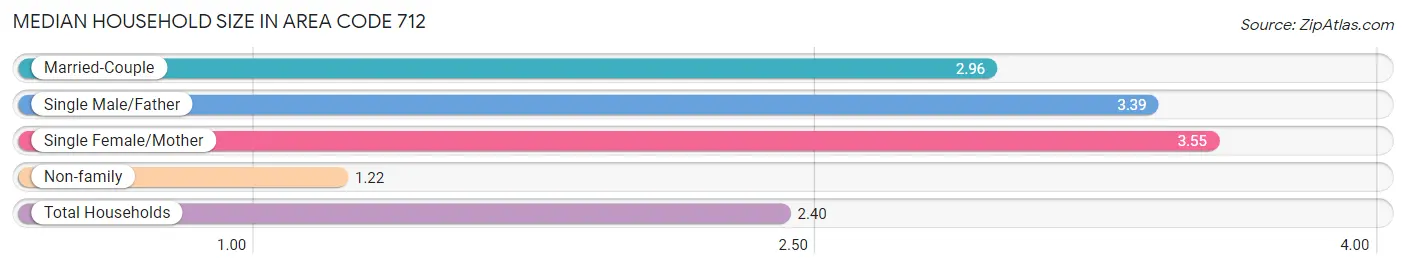
Median Household Size in Area Code 712
The median household size in Area Code 712 is 2.40 persons per household, with single female/mother households (20,774 | 9.4%) accounting for the largest median household size of 3.55036 persons per household. non-family households (79,900 | 36.1%) represent the smallest median household size with 1.22 persons per household.
| Household Type | # Households | Household Size |
| Married-Couple | 110,809 (50.1%) | 2.96 |
| Single Male/Father | 9,533 (4.3%) | 3.39 |
| Single Female/Mother | 20,774 (9.4%) | 3.55 |
| Non-family | 79,900 (36.1%) | 1.22 |
| Total Households | 221,016 (100.0%) | 2.40 |
Household Size by Marriage Status in Area Code 712
Out of a total of 221,016 households in Area Code 712, 141,116 (63.8%) are family households, while 79,900 (36.1%) are nonfamily households. The most numerous type of family households are 2-person households, comprising 69,628, and the most common type of nonfamily households are 1-person households, comprising 66,800.
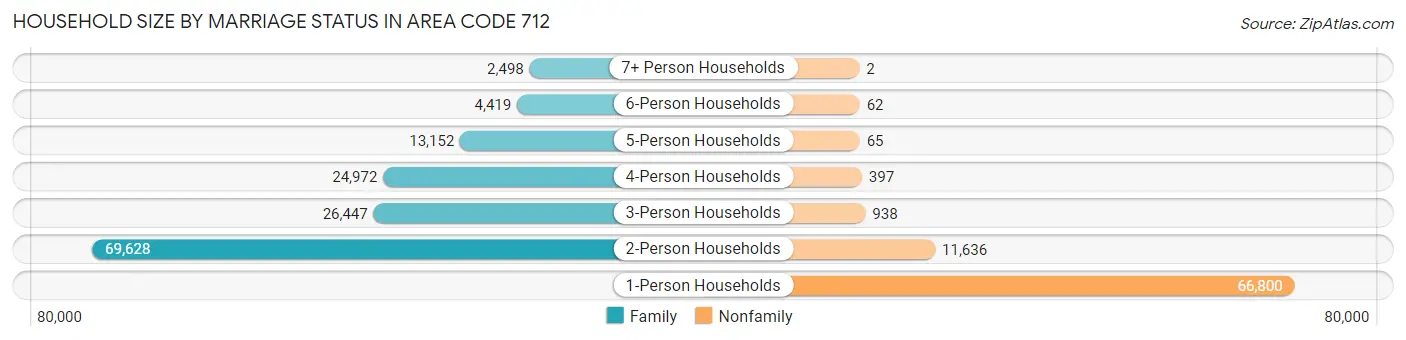
| Household Size | Family Households | Nonfamily Households |
| 1-Person Households | - | 66,800 (30.2%) |
| 2-Person Households | 69,628 (31.5%) | 11,636 (5.3%) |
| 3-Person Households | 26,447 (12.0%) | 938 (0.4%) |
| 4-Person Households | 24,972 (11.3%) | 397 (0.2%) |
| 5-Person Households | 13,152 (5.9%) | 65 (0.0%) |
| 6-Person Households | 4,419 (2.0%) | 62 (0.0%) |
| 7+ Person Households | 2,498 (1.1%) | 2 (0.0%) |
| Total | 141,116 (63.8%) | 79,900 (36.1%) |
Female Fertility in Area Code 712
Fertility by Age in Area Code 712
Average fertility rate in Area Code 712 is 91.6 births per 1,000 women. Women in the age bracket of 20 to 34 years have the highest fertility rate with 183.4 births per 1,000 women. Women in the age bracket of 20 to 34 years acount for 80.2% of all women with births.
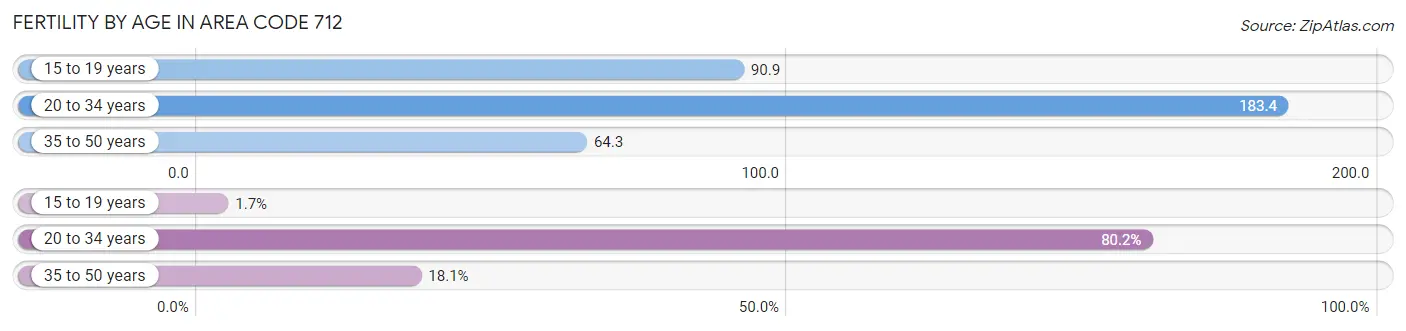
| Age Bracket | Women with Births | Births / 1,000 Women |
| 15 to 19 years | 120 (1.7%) | 90.9 |
| 20 to 34 years | 5,586 (80.2%) | 183.4 |
| 35 to 50 years | 1,261 (18.1%) | 64.3 |
| Total | 6,967 (100.0%) | 91.6 |
Fertility by Age by Marriage Status in Area Code 712
53.8% of women with births (6,967) in Area Code 712 are married. The highest percentage of unmarried women with births falls into 15 to 19 years age bracket with 100.0% of them unmarried at the time of birth, while the lowest percentage of unmarried women with births belong to 20 to 34 years age bracket with 52.3% of them unmarried.
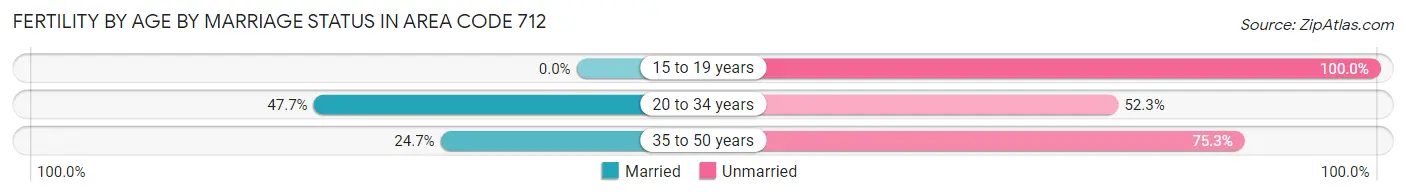
| Age Bracket | Married | Unmarried |
| 15 to 19 years | 0 (0.0%) | 120 (100.0%) |
| 20 to 34 years | 2,663 (47.7%) | 2,923 (52.3%) |
| 35 to 50 years | 311 (24.7%) | 950 (75.3%) |
| Total | 3,749 (53.8%) | 3,218 (46.2%) |
Fertility by Education in Area Code 712
Average fertility rate in Area Code 712 is 91.6 births per 1,000 women. Women with the education attainment of graduate degree have the highest fertility rate of 299.6 births per 1,000 women, while women with the education attainment of college or associate's degree have the lowest fertility at 132.3 births per 1,000 women. Women with the education attainment of college or associate's degree represent 34.4% of all women with births.
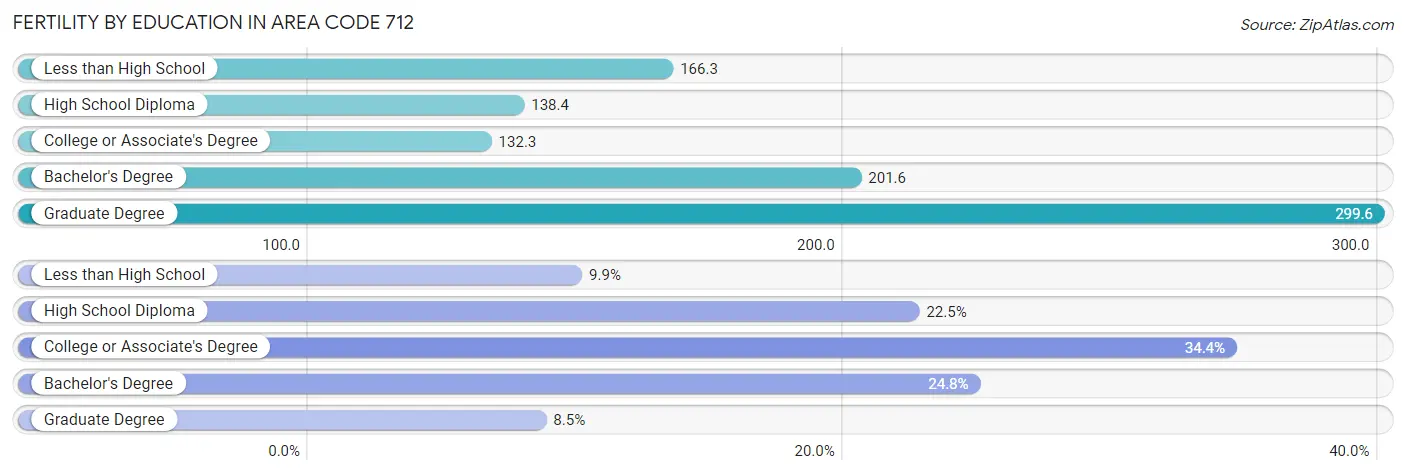
| Educational Attainment | Women with Births | Births / 1,000 Women |
| Less than High School | 686 (9.9%) | 166.3 |
| High School Diploma | 1,567 (22.5%) | 138.4 |
| College or Associate's Degree | 2,395 (34.4%) | 132.3 |
| Bachelor's Degree | 1,726 (24.8%) | 201.6 |
| Graduate Degree | 593 (8.5%) | 299.6 |
| Total | 6,967 (100.0%) | 91.6 |
Fertility by Education by Marriage Status in Area Code 712
46.2% of women with births in Area Code 712 are unmarried. Women with the educational attainment of bachelor's degree are most likely to be married with 35.2% of them married at childbirth, while women with the educational attainment of graduate degree are least likely to be married with 100.0% of them unmarried at childbirth.
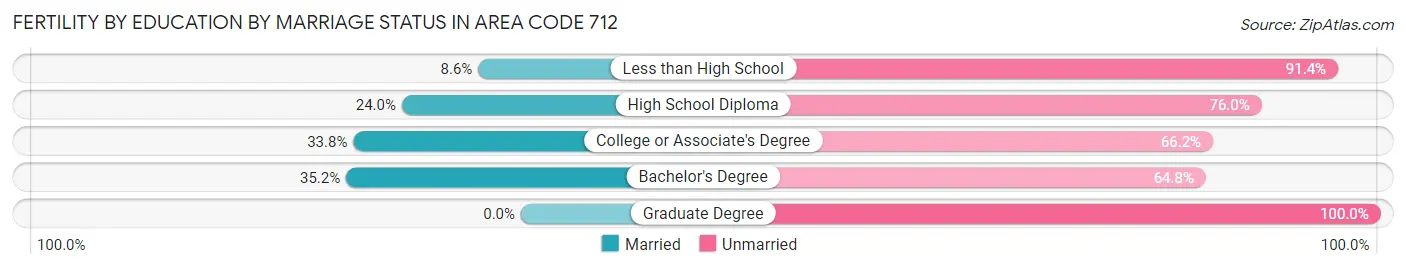
| Educational Attainment | Married | Unmarried |
| Less than High School | 59 (8.6%) | 627 (91.4%) |
| High School Diploma | 376 (24.0%) | 1,191 (76.0%) |
| College or Associate's Degree | 809 (33.8%) | 1,586 (66.2%) |
| Bachelor's Degree | 608 (35.2%) | 1,118 (64.8%) |
| Graduate Degree | 0 (0.0%) | 593 (100.0%) |
| Total | 3,749 (53.8%) | 3,218 (46.2%) |
Employment Characteristics in Area Code 712
Employment by Class of Employer in Area Code 712
Among the 271,568 employed individuals in Area Code 712, private company employees (179,528 | 66.1%), not-for-profit organizations (24,228 | 8.9%), and self-employed (not incorporated) (21,486 | 7.9%) make up the most common classes of employment.
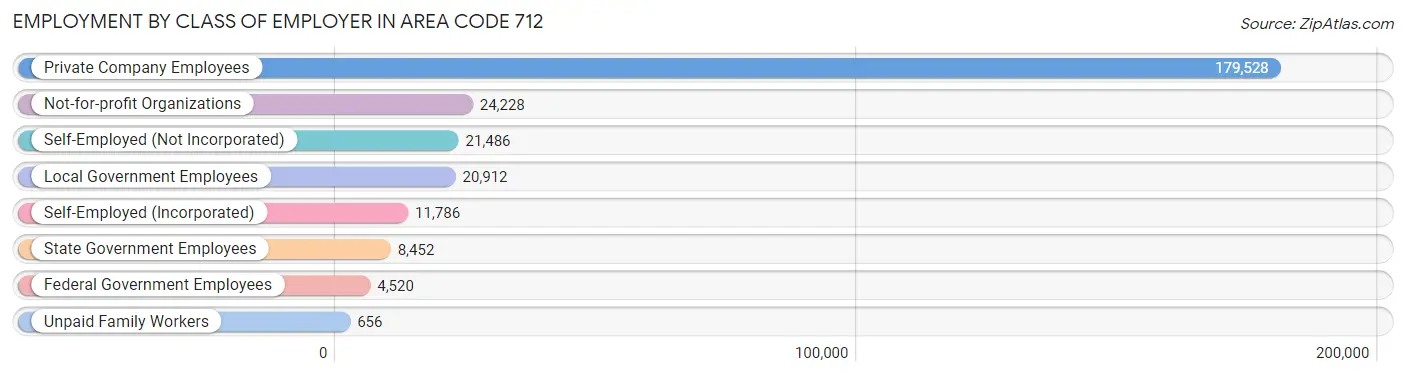
| Employer Class | # Employees | % Employees |
| Private Company Employees | 179,528 | 66.1% |
| Self-Employed (Incorporated) | 11,786 | 4.3% |
| Self-Employed (Not Incorporated) | 21,486 | 7.9% |
| Not-for-profit Organizations | 24,228 | 8.9% |
| Local Government Employees | 20,912 | 7.7% |
| State Government Employees | 8,452 | 3.1% |
| Federal Government Employees | 4,520 | 1.7% |
| Unpaid Family Workers | 656 | 0.2% |
| Total | 271,568 | 100.0% |
Employment Status by Age in Area Code 712
According to the labor force statistics for Area Code 712, out of the total population over 16 years of age (436,787), 64.3% or 280,810 individuals are in the labor force, with 3.5% or 9,885 of them unemployed. The age group with the highest labor force participation rate is 30 to 34 years, with 89.2% or 27,760 individuals in the labor force. Within the labor force, the 16 to 19 years age range has the highest percentage of unemployed individuals, with 2,214.1% or 352,064 of them being unemployed.
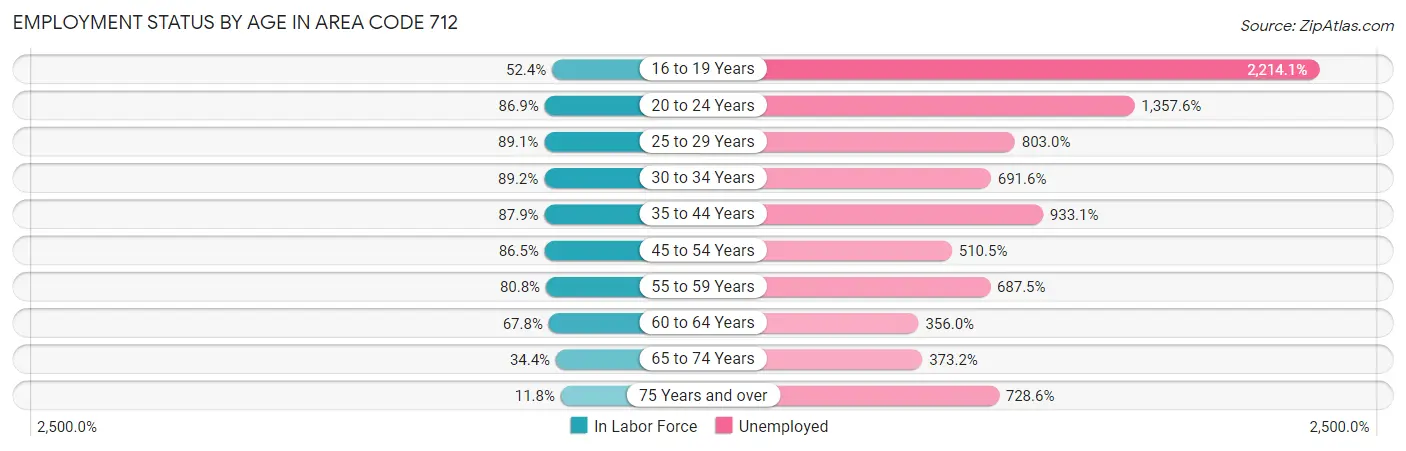
| Age Bracket | In Labor Force | Unemployed |
| 16 to 19 Years | 15,900 (52.4%) | 352,064 (2,214.1%) |
| 20 to 24 Years | 29,238 (86.9%) | 396,935 (1,357.6%) |
| 25 to 29 Years | 27,570 (89.1%) | 221,395 (803.0%) |
| 30 to 34 Years | 27,762 (89.2%) | 191,988 (691.6%) |
| 35 to 44 Years | 57,089 (87.8%) | 532,688 (933.1%) |
| 45 to 54 Years | 54,131 (86.5%) | 276,329 (510.5%) |
| 55 to 59 Years | 29,619 (80.8%) | 203,631 (687.5%) |
| 60 to 64 Years | 26,735 (67.8%) | 95,169 (356.0%) |
| 65 to 74 Years | 20,712 (34.4%) | 77,297 (373.2%) |
| 75 Years and over | 5,533 (11.8%) | 40,321 (728.6%) |
| Total | 280,820 (64.3%) | 9,877 (3.5%) |
Employment Status by Educational Attainment in Area Code 712
According to labor force statistics for Area Code 712, 82.4% of individuals (218,774) out of the total population between 25 and 64 years of age (265,664) are in the labor force, with 666.7% or 1,458,566 of them being unemployed. The group with the highest labor force participation rate are those with the educational attainment of bachelor's degree or higher, with 90.8% or 58,633 individuals in the labor force. Within the labor force, individuals with less than high school education have the highest percentage of unemployment, with 1,124.8% or 196,593 of them being unemployed.
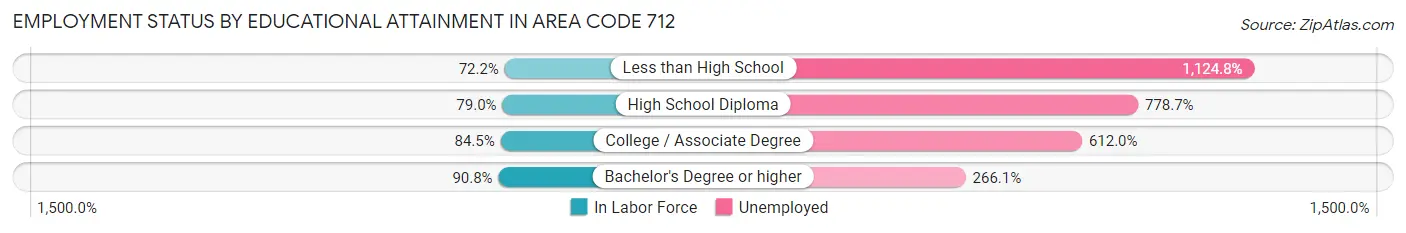
| Educational Attainment | In Labor Force | Unemployed |
| Less than High School | 17,478 (72.2%) | 272,472 (1,124.8%) |
| High School Diploma | 63,527 (79.0%) | 626,347 (778.7%) |
| College / Associate Degree | 81,508 (84.5%) | 590,243 (612.0%) |
| Bachelor's Degree or higher | 58,632 (90.8%) | 171,794 (266.1%) |
| Total | 218,785 (82.4%) | 1,771,182 (666.7%) |
Employment Occupations by Sex in Area Code 712
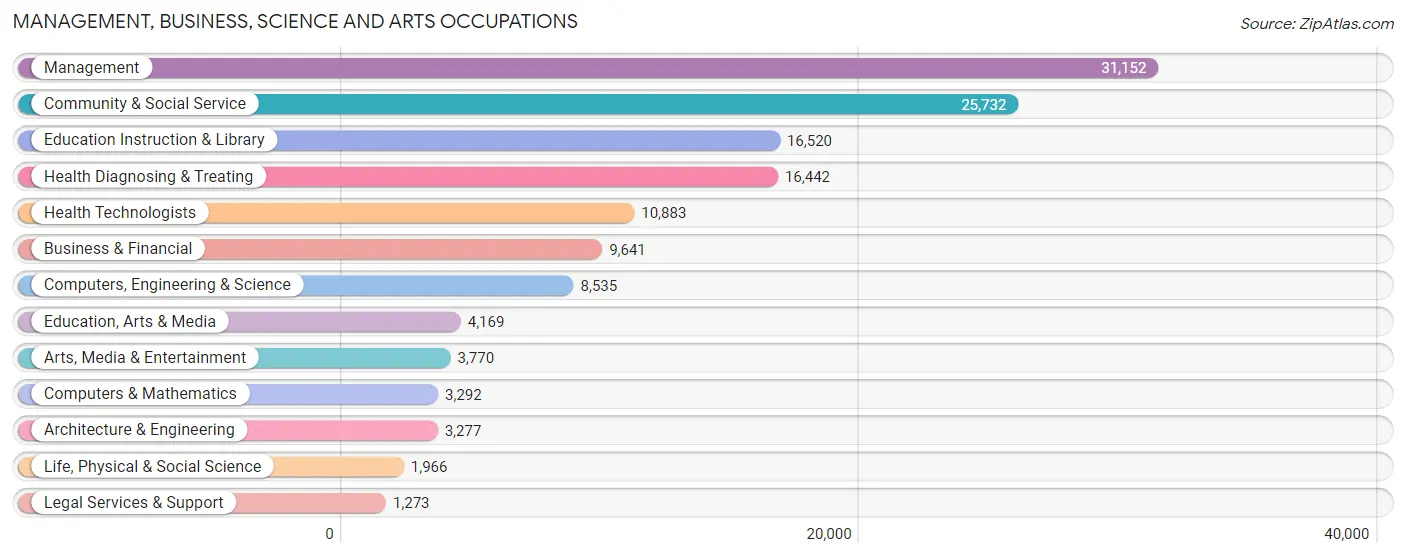
Management, Business, Science and Arts Occupations
The most common Management, Business, Science and Arts occupations in Area Code 712 are Management (31,152 | 11.3%), Community & Social Service (25,732 | 9.3%), Education Instruction & Library (16,520 | 6.0%), Health Diagnosing & Treating (16,442 | 6.0%), and Health Technologists (10,883 | 4.0%).
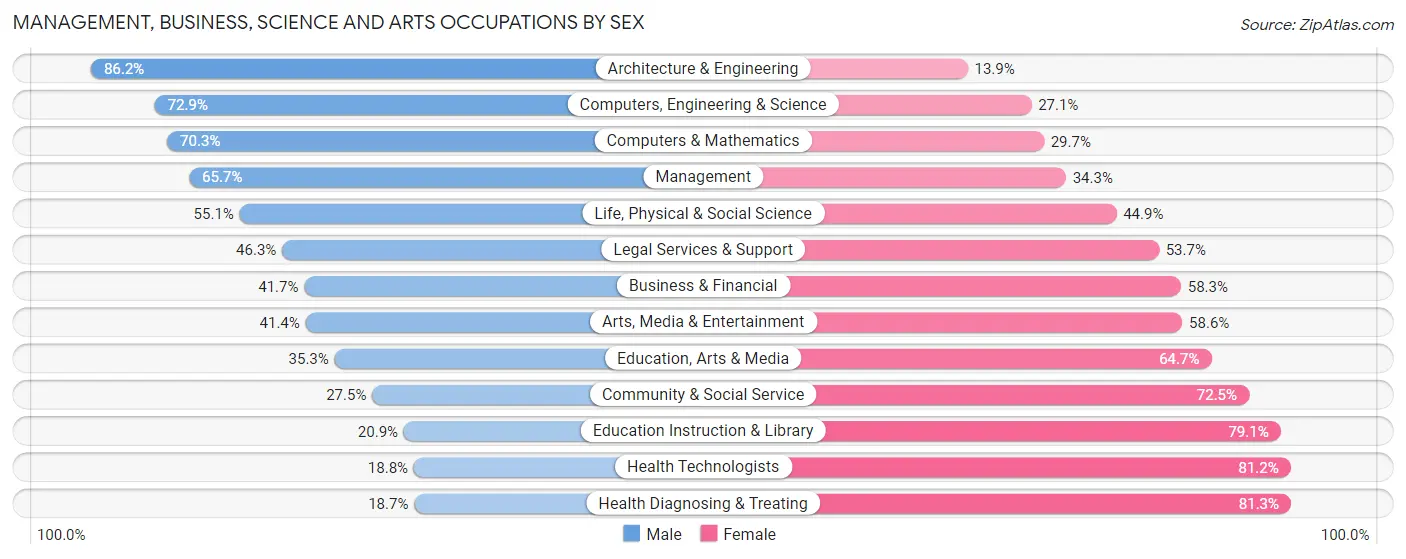
Management, Business, Science and Arts Occupations by Sex
Within the Management, Business, Science and Arts occupations in Area Code 712, the most male-oriented occupations are Architecture & Engineering (86.2%), Computers, Engineering & Science (72.9%), and Computers & Mathematics (70.3%), while the most female-oriented occupations are Health Diagnosing & Treating (81.3%), Health Technologists (81.2%), and Education Instruction & Library (79.1%).
| Occupation | Male | Female |
| Management | 20,458 (65.7%) | 10,694 (34.3%) |
| Business & Financial | 4,016 (41.7%) | 5,625 (58.3%) |
| Computers, Engineering & Science | 6,220 (72.9%) | 2,315 (27.1%) |
| Computers & Mathematics | 2,313 (70.3%) | 979 (29.7%) |
| Architecture & Engineering | 2,823 (86.2%) | 454 (13.9%) |
| Life, Physical & Social Science | 1,084 (55.1%) | 882 (44.9%) |
| Community & Social Service | 7,071 (27.5%) | 18,661 (72.5%) |
| Education, Arts & Media | 1,473 (35.3%) | 2,696 (64.7%) |
| Legal Services & Support | 589 (46.3%) | 684 (53.7%) |
| Education Instruction & Library | 3,449 (20.9%) | 13,071 (79.1%) |
| Arts, Media & Entertainment | 1,560 (41.4%) | 2,210 (58.6%) |
| Health Diagnosing & Treating | 3,078 (18.7%) | 13,364 (81.3%) |
| Health Technologists | 2,045 (18.8%) | 8,838 (81.2%) |
| Total (Category) | 40,843 (44.6%) | 50,659 (55.4%) |
| Total (Overall) | 147,597 (53.5%) | 128,063 (46.5%) |
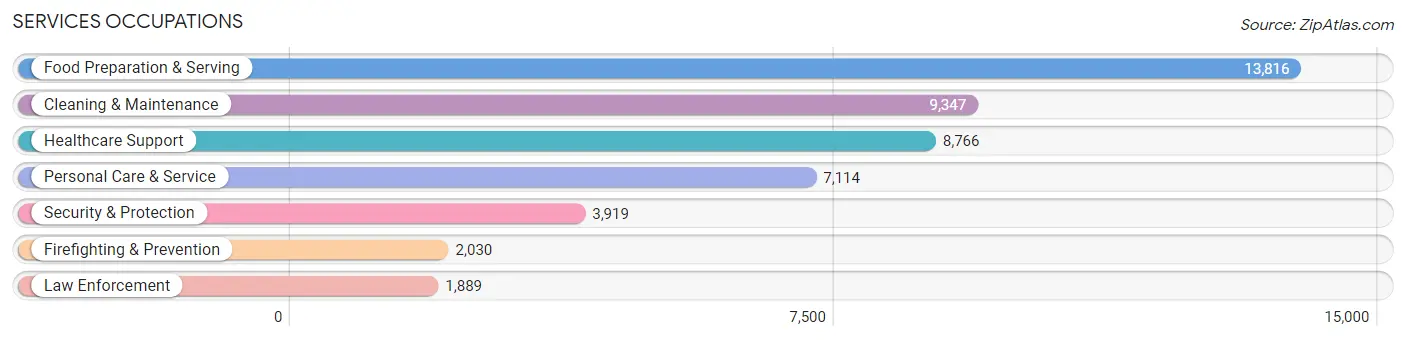
Services Occupations
The most common Services occupations in Area Code 712 are Food Preparation & Serving (13,816 | 5.0%), Cleaning & Maintenance (9,347 | 3.4%), Healthcare Support (8,766 | 3.2%), Personal Care & Service (7,114 | 2.6%), and Security & Protection (3,919 | 1.4%).
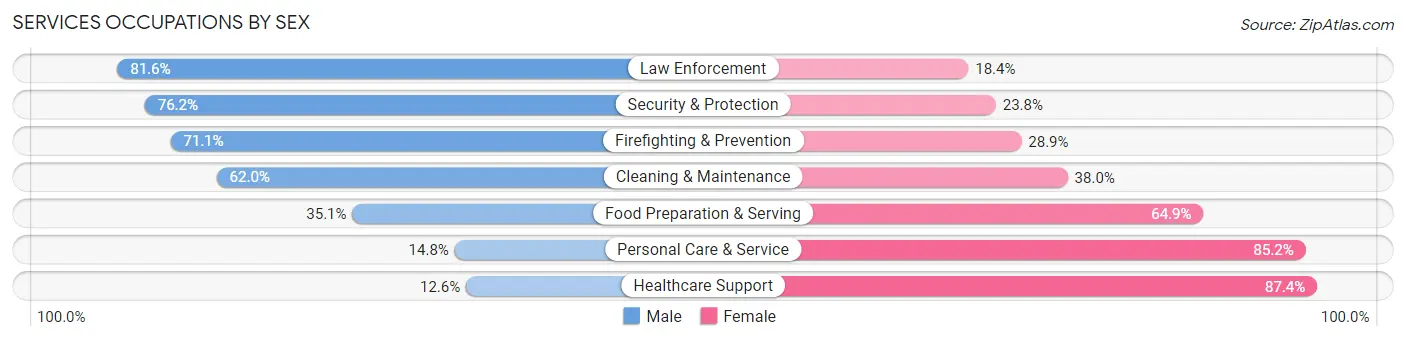
Services Occupations by Sex
Within the Services occupations in Area Code 712, the most male-oriented occupations are Law Enforcement (81.6%), Security & Protection (76.2%), and Firefighting & Prevention (71.1%), while the most female-oriented occupations are Healthcare Support (87.4%), Personal Care & Service (85.2%), and Food Preparation & Serving (64.9%).
| Occupation | Male | Female |
| Healthcare Support | 1,103 (12.6%) | 7,663 (87.4%) |
| Security & Protection | 2,986 (76.2%) | 933 (23.8%) |
| Firefighting & Prevention | 1,444 (71.1%) | 586 (28.9%) |
| Law Enforcement | 1,542 (81.6%) | 347 (18.4%) |
| Food Preparation & Serving | 4,850 (35.1%) | 8,966 (64.9%) |
| Cleaning & Maintenance | 5,791 (62.0%) | 3,556 (38.0%) |
| Personal Care & Service | 1,056 (14.8%) | 6,058 (85.2%) |
| Total (Category) | 15,786 (36.7%) | 27,176 (63.3%) |
| Total (Overall) | 147,597 (53.5%) | 128,063 (46.5%) |
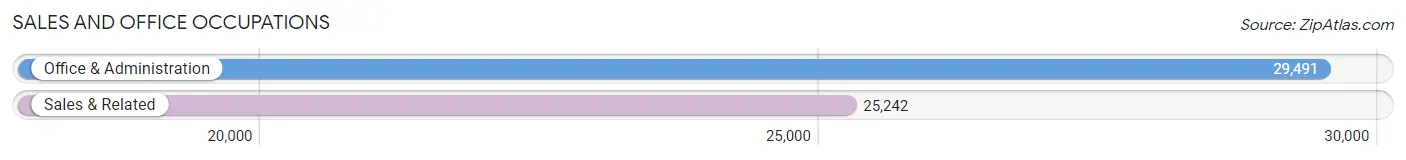
Sales and Office Occupations
The most common Sales and Office occupations in Area Code 712 are Office & Administration (29,491 | 10.7%), and Sales & Related (25,242 | 9.2%).
Sales and Office Occupations by Sex
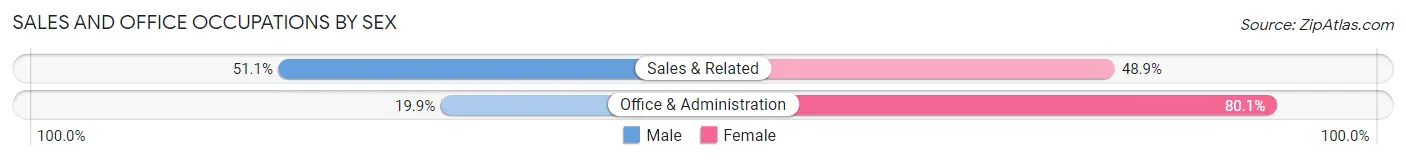
| Occupation | Male | Female |
| Sales & Related | 12,900 (51.1%) | 12,342 (48.9%) |
| Office & Administration | 5,874 (19.9%) | 23,617 (80.1%) |
| Total (Category) | 18,774 (34.3%) | 35,959 (65.7%) |
| Total (Overall) | 147,597 (53.5%) | 128,063 (46.5%) |
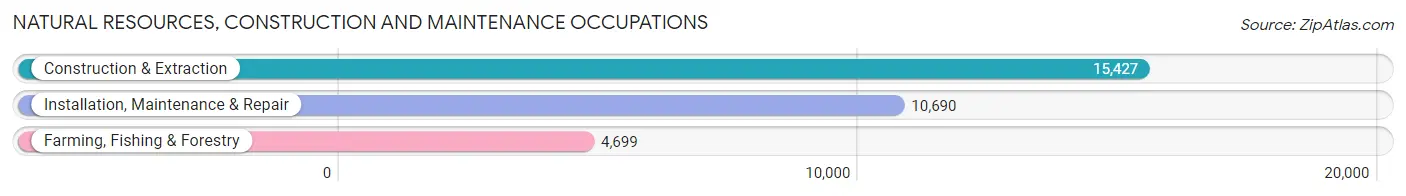
Natural Resources, Construction and Maintenance Occupations
The most common Natural Resources, Construction and Maintenance occupations in Area Code 712 are Construction & Extraction (15,427 | 5.6%), Installation, Maintenance & Repair (10,690 | 3.9%), and Farming, Fishing & Forestry (4,699 | 1.7%).
Natural Resources, Construction and Maintenance Occupations by Sex
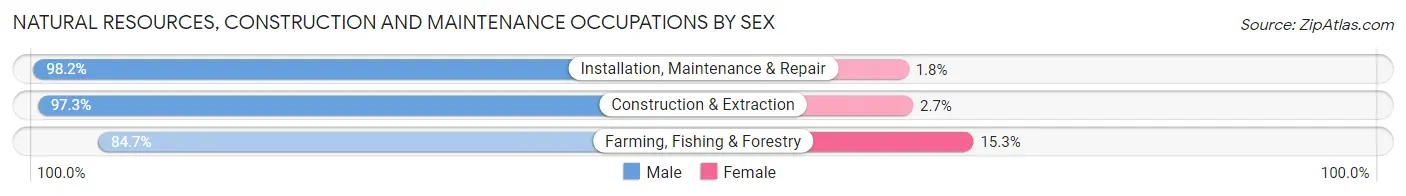
| Occupation | Male | Female |
| Farming, Fishing & Forestry | 3,980 (84.7%) | 719 (15.3%) |
| Construction & Extraction | 15,005 (97.3%) | 422 (2.7%) |
| Installation, Maintenance & Repair | 10,494 (98.2%) | 196 (1.8%) |
| Total (Category) | 29,479 (95.7%) | 1,337 (4.3%) |
| Total (Overall) | 147,597 (53.5%) | 128,063 (46.5%) |
Production, Transportation and Moving Occupations
The most common Production, Transportation and Moving occupations in Area Code 712 are Production (25,991 | 9.4%), Material Moving (16,029 | 5.8%), and Transportation (13,627 | 4.9%).
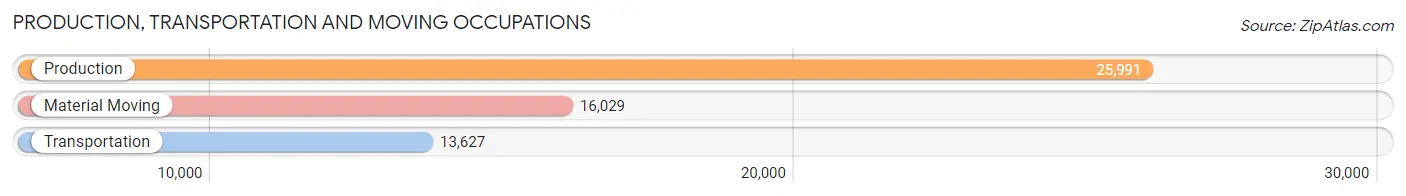
Production, Transportation and Moving Occupations by Sex
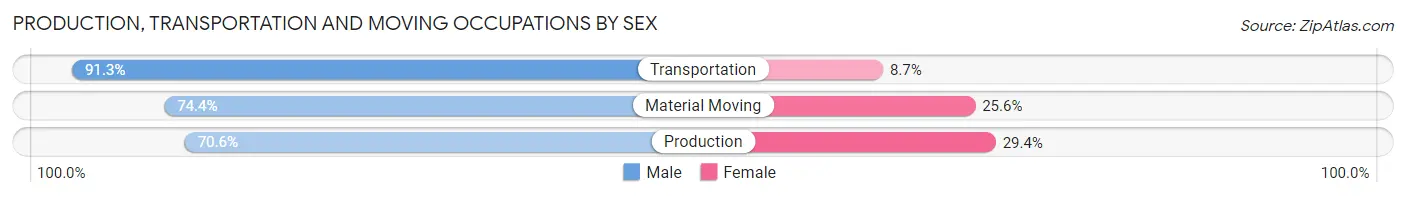
| Occupation | Male | Female |
| Production | 18,353 (70.6%) | 7,638 (29.4%) |
| Transportation | 12,441 (91.3%) | 1,186 (8.7%) |
| Material Moving | 11,921 (74.4%) | 4,108 (25.6%) |
| Total (Category) | 42,715 (76.8%) | 12,932 (23.2%) |
| Total (Overall) | 147,597 (53.5%) | 128,063 (46.5%) |
Employment Industries by Sex in Area Code 712
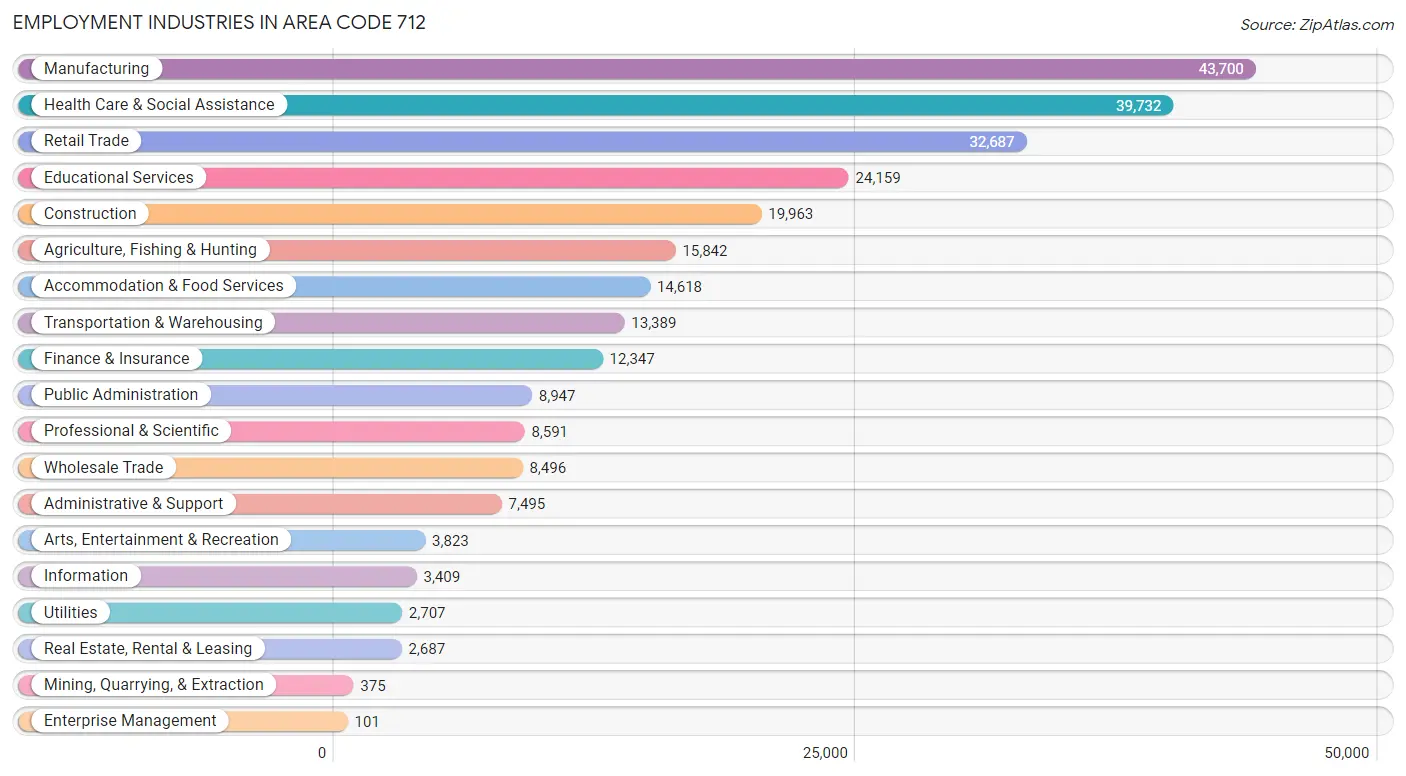
Employment Industries in Area Code 712
The major employment industries in Area Code 712 include Manufacturing (43,700 | 15.9%), Health Care & Social Assistance (39,732 | 14.4%), Retail Trade (32,687 | 11.9%), Educational Services (24,159 | 8.8%), and Construction (19,963 | 7.2%).
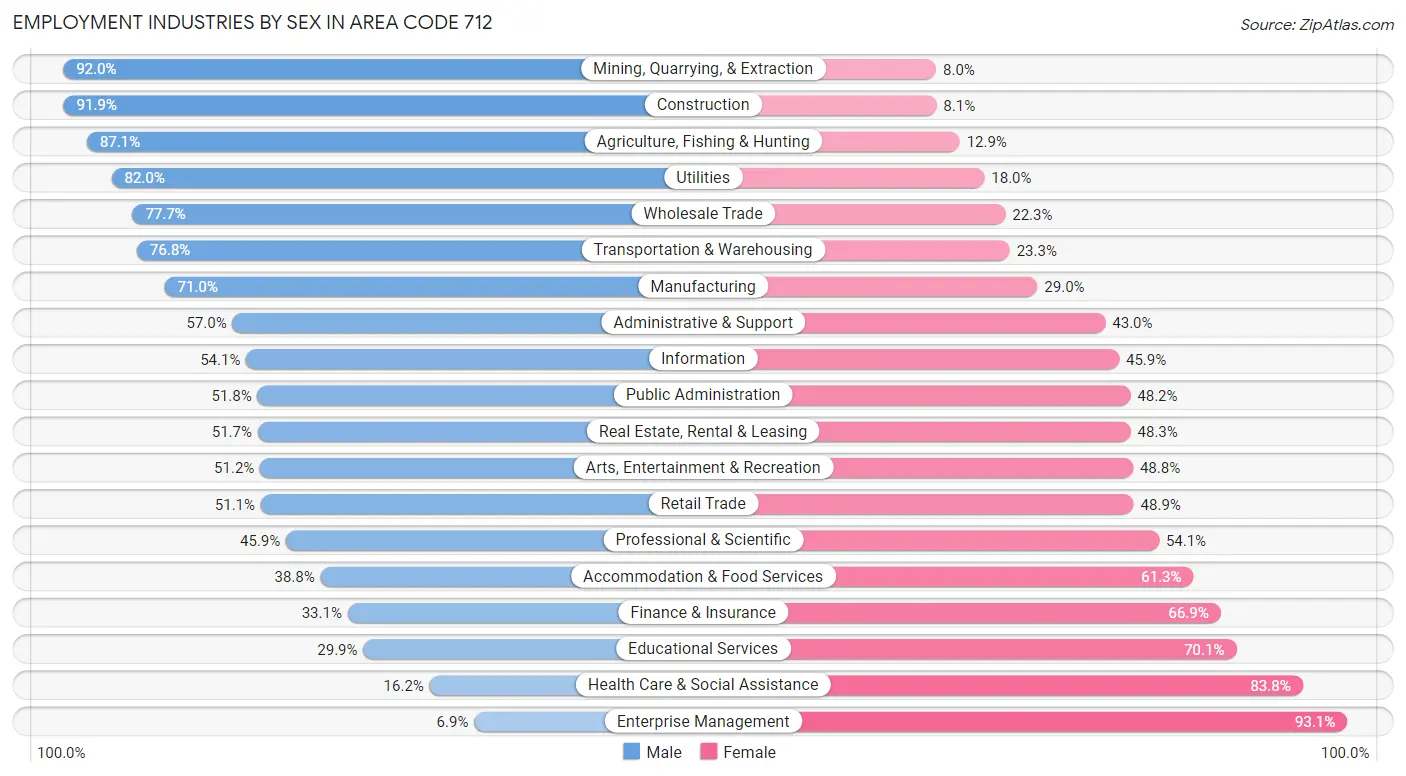
Employment Industries by Sex in Area Code 712
The Area Code 712 industries that see more men than women are Mining, Quarrying, & Extraction (92.0%), Construction (91.9%), and Agriculture, Fishing & Hunting (87.1%), whereas the industries that tend to have a higher number of women are Enterprise Management (93.1%), Health Care & Social Assistance (83.8%), and Educational Services (70.1%).
| Industry | Male | Female |
| Agriculture, Fishing & Hunting | 13,800 (87.1%) | 2,042 (12.9%) |
| Mining, Quarrying, & Extraction | 345 (92.0%) | 30 (8.0%) |
| Construction | 18,351 (91.9%) | 1,612 (8.1%) |
| Manufacturing | 31,041 (71.0%) | 12,659 (29.0%) |
| Wholesale Trade | 6,599 (77.7%) | 1,897 (22.3%) |
| Retail Trade | 16,703 (51.1%) | 15,984 (48.9%) |
| Transportation & Warehousing | 10,276 (76.7%) | 3,113 (23.3%) |
| Utilities | 2,220 (82.0%) | 487 (18.0%) |
| Information | 1,845 (54.1%) | 1,564 (45.9%) |
| Finance & Insurance | 4,088 (33.1%) | 8,259 (66.9%) |
| Real Estate, Rental & Leasing | 1,390 (51.7%) | 1,297 (48.3%) |
| Professional & Scientific | 3,941 (45.9%) | 4,650 (54.1%) |
| Enterprise Management | 7 (6.9%) | 94 (93.1%) |
| Administrative & Support | 4,269 (57.0%) | 3,226 (43.0%) |
| Educational Services | 7,219 (29.9%) | 16,940 (70.1%) |
| Health Care & Social Assistance | 6,421 (16.2%) | 33,311 (83.8%) |
| Arts, Entertainment & Recreation | 1,959 (51.2%) | 1,864 (48.8%) |
| Accommodation & Food Services | 5,664 (38.8%) | 8,954 (61.3%) |
| Public Administration | 4,633 (51.8%) | 4,314 (48.2%) |
| Total | 147,597 (53.5%) | 128,063 (46.5%) |
Education in Area Code 712
School Enrollment in Area Code 712
The most common levels of schooling among the 130,839 students in Area Code 712 are high school (31,050 | 23.7%), middle school (29,562 | 22.6%), and elementary school (28,329 | 21.6%).
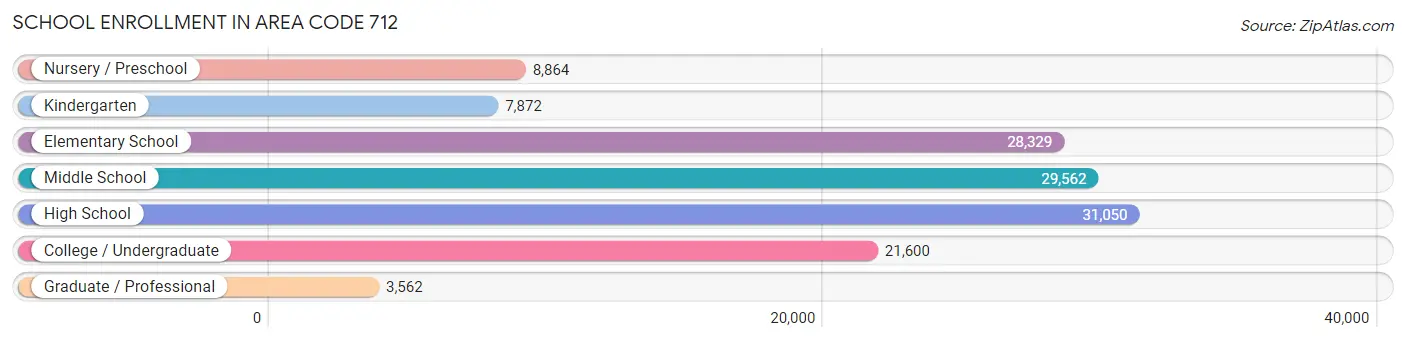
| School Level | # Students | % Students |
| Nursery / Preschool | 8,864 | 6.8% |
| Kindergarten | 7,872 | 6.0% |
| Elementary School | 28,329 | 21.6% |
| Middle School | 29,562 | 22.6% |
| High School | 31,050 | 23.7% |
| College / Undergraduate | 21,600 | 16.5% |
| Graduate / Professional | 3,562 | 2.7% |
| Total | 130,839 | 100.0% |
School Enrollment by Age by Funding Source in Area Code 712
Out of a total of 130,839 students who are enrolled in schools in Area Code 712, 20,060 (15.3%) attend a private institution, while the remaining 110,779 (84.7%) are enrolled in public schools. The age group of 20 to 24 year olds has the highest likelihood of being enrolled in private schools, with 3,957 (37.3% in the age bracket) enrolled. Conversely, the age group of 15 to 17 year olds has the lowest likelihood of being enrolled in a private school, with 20,790 (91.2% in the age bracket) attending a public institution.
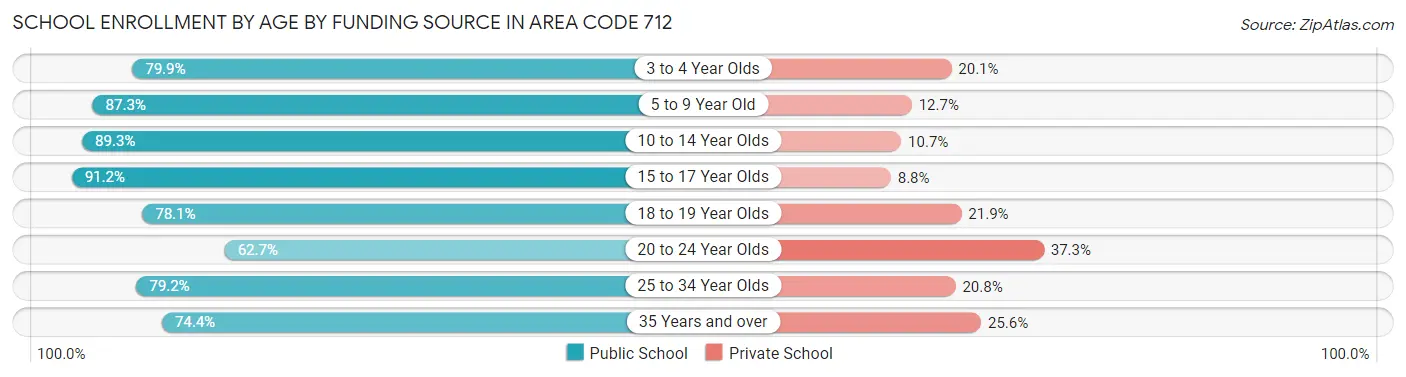
| Age Bracket | Public School | Private School |
| 3 to 4 Year Olds | 4,838 (79.9%) | 1,214 (20.1%) |
| 5 to 9 Year Old | 30,682 (87.3%) | 4,457 (12.7%) |
| 10 to 14 Year Olds | 32,212 (89.3%) | 3,864 (10.7%) |
| 15 to 17 Year Olds | 20,790 (91.2%) | 2,002 (8.8%) |
| 18 to 19 Year Olds | 8,666 (78.1%) | 2,435 (21.9%) |
| 20 to 24 Year Olds | 6,658 (62.7%) | 3,957 (37.3%) |
| 25 to 34 Year Olds | 3,287 (79.2%) | 865 (20.8%) |
| 35 Years and over | 3,655 (74.4%) | 1,257 (25.6%) |
| Total | 110,779 (84.7%) | 20,060 (15.3%) |
Educational Attainment by Field of Study in Area Code 712
Education (20,267 | 21.8%), business (19,132 | 20.6%), science & technology (10,282 | 11.1%), bio, nature & agricultural (9,146 | 9.8%), and arts & humanities (7,036 | 7.6%) are the most common fields of study among 92,961 individuals in Area Code 712 who have obtained a bachelor's degree or higher.
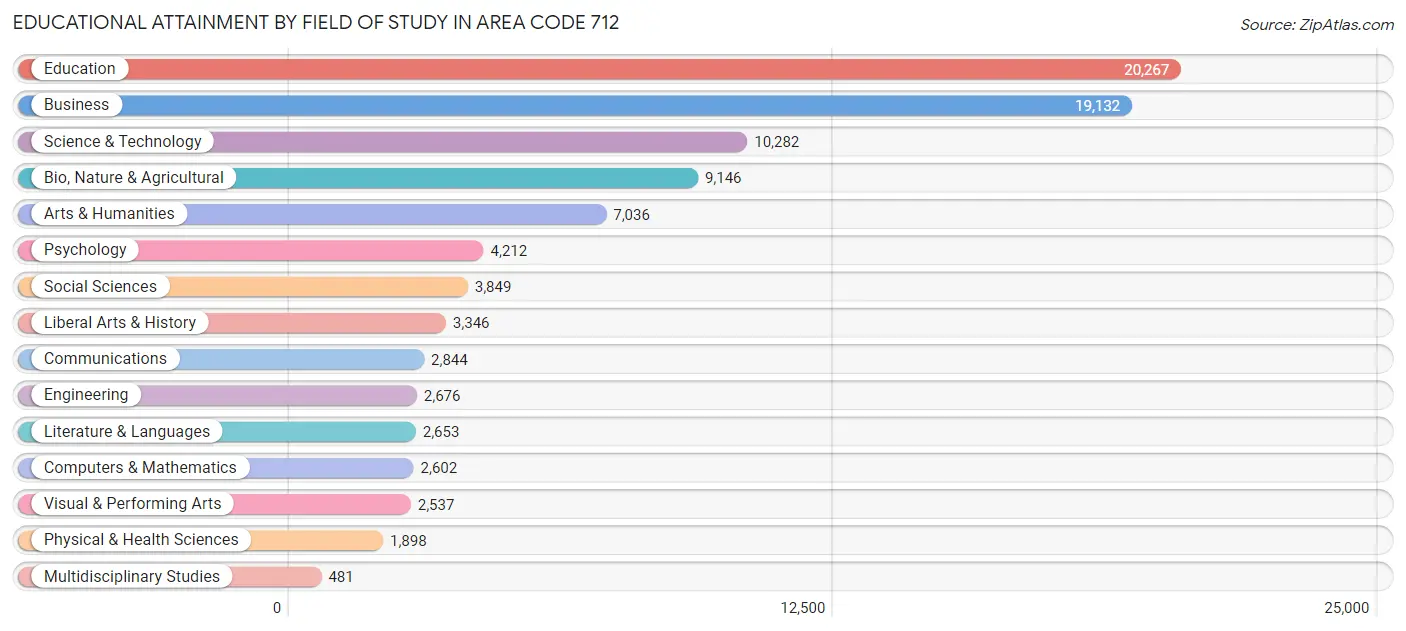
| Field of Study | # Graduates | % Graduates |
| Computers & Mathematics | 2,602 | 2.8% |
| Bio, Nature & Agricultural | 9,146 | 9.8% |
| Physical & Health Sciences | 1,898 | 2.0% |
| Psychology | 4,212 | 4.5% |
| Social Sciences | 3,849 | 4.1% |
| Engineering | 2,676 | 2.9% |
| Multidisciplinary Studies | 481 | 0.5% |
| Science & Technology | 10,282 | 11.1% |
| Business | 19,132 | 20.6% |
| Education | 20,267 | 21.8% |
| Literature & Languages | 2,653 | 2.9% |
| Liberal Arts & History | 3,346 | 3.6% |
| Visual & Performing Arts | 2,537 | 2.7% |
| Communications | 2,844 | 3.1% |
| Arts & Humanities | 7,036 | 7.6% |
| Total | 92,961 | 100.0% |
Transportation & Commute in Area Code 712
Vehicle Availability by Sex in Area Code 712
The most prevalent vehicle ownership categories in Area Code 712 are males with 2 vehicles (56,803, accounting for 39.4%) and females with 2 vehicles (47,092, making up 45.8%).
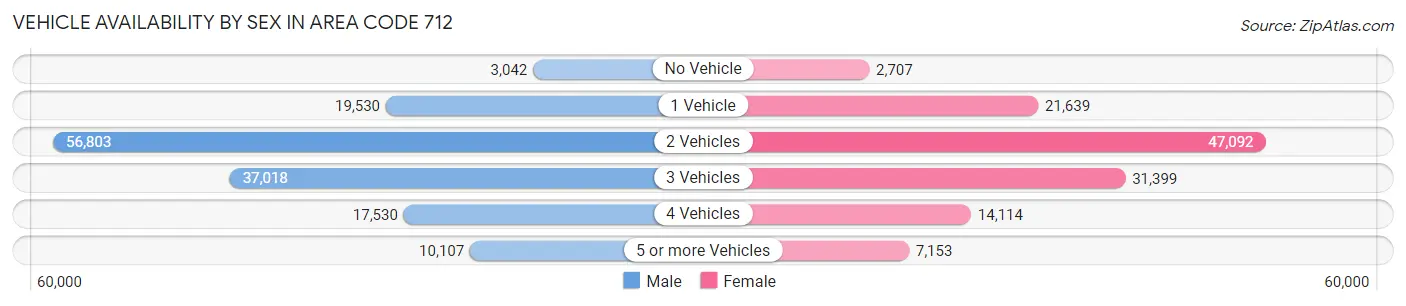
| Vehicles Available | Male | Female |
| No Vehicle | 3,042 (2.1%) | 2,707 (2.2%) |
| 1 Vehicle | 19,530 (13.6%) | 21,639 (17.4%) |
| 2 Vehicles | 56,803 (39.4%) | 47,092 (38.0%) |
| 3 Vehicles | 37,018 (25.7%) | 31,399 (25.3%) |
| 4 Vehicles | 17,530 (12.2%) | 14,114 (11.4%) |
| 5 or more Vehicles | 10,107 (7.0%) | 7,153 (5.8%) |
| Total | 144,030 (100.0%) | 124,104 (100.0%) |
Commute Time in Area Code 712
The most frequently occuring commute durations in Area Code 712 are 5 to 9 minutes (52,553 commuters, 20.9%), 10 to 14 minutes (42,243 commuters, 16.8%), and 15 to 19 minutes (36,912 commuters, 14.7%).
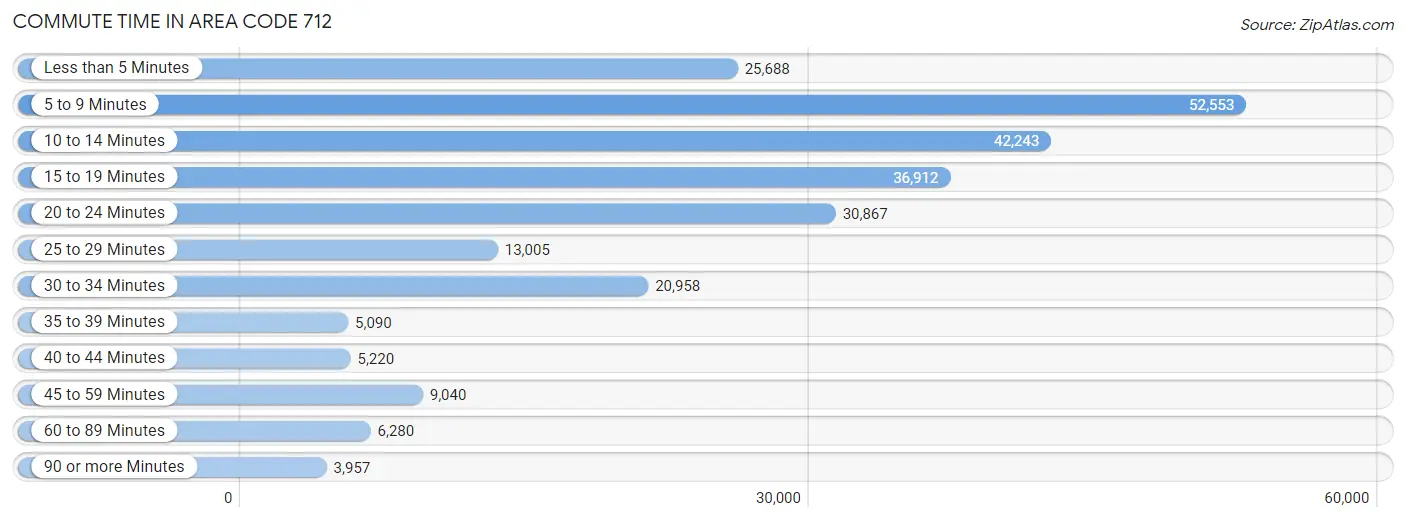
| Commute Time | # Commuters | % Commuters |
| Less than 5 Minutes | 25,688 | 10.2% |
| 5 to 9 Minutes | 52,553 | 20.9% |
| 10 to 14 Minutes | 42,243 | 16.8% |
| 15 to 19 Minutes | 36,912 | 14.7% |
| 20 to 24 Minutes | 30,867 | 12.3% |
| 25 to 29 Minutes | 13,005 | 5.2% |
| 30 to 34 Minutes | 20,958 | 8.3% |
| 35 to 39 Minutes | 5,090 | 2.0% |
| 40 to 44 Minutes | 5,220 | 2.1% |
| 45 to 59 Minutes | 9,040 | 3.6% |
| 60 to 89 Minutes | 6,280 | 2.5% |
| 90 or more Minutes | 3,957 | 1.6% |
Commute Time by Sex in Area Code 712
The most common commute times in Area Code 712 are 5 to 9 minutes (27,207 commuters, 20.0%) for males and 5 to 9 minutes (25,346 commuters, 21.9%) for females.
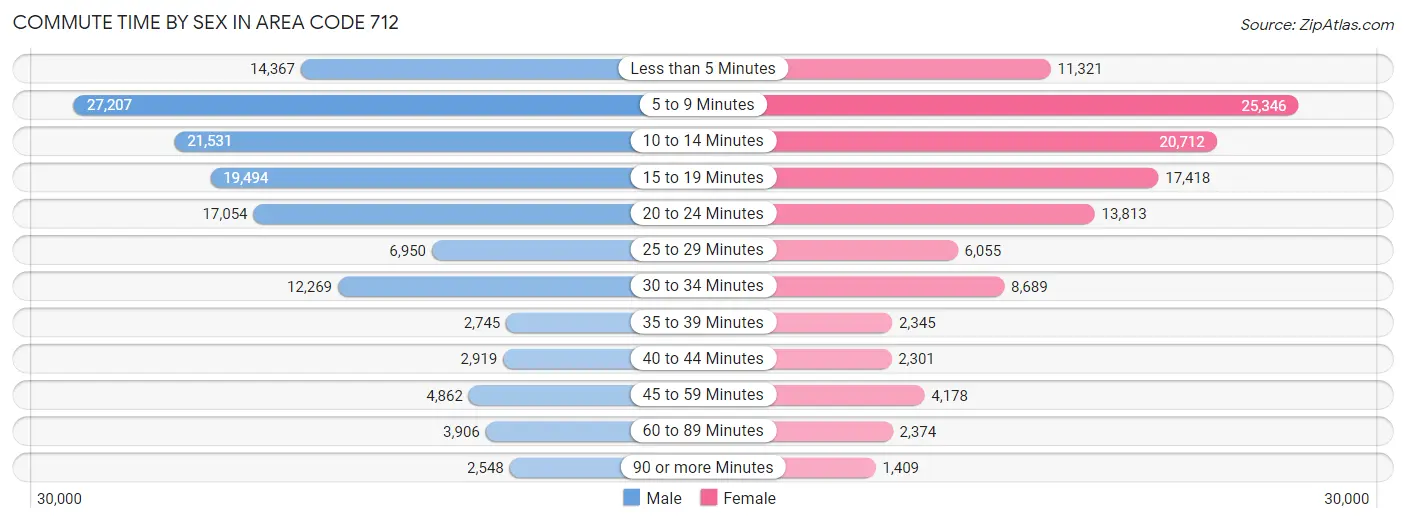
| Commute Time | Male | Female |
| Less than 5 Minutes | 14,367 (10.6%) | 11,321 (9.8%) |
| 5 to 9 Minutes | 27,207 (20.0%) | 25,346 (21.9%) |
| 10 to 14 Minutes | 21,531 (15.9%) | 20,712 (17.9%) |
| 15 to 19 Minutes | 19,494 (14.3%) | 17,418 (15.0%) |
| 20 to 24 Minutes | 17,054 (12.6%) | 13,813 (11.9%) |
| 25 to 29 Minutes | 6,950 (5.1%) | 6,055 (5.2%) |
| 30 to 34 Minutes | 12,269 (9.0%) | 8,689 (7.5%) |
| 35 to 39 Minutes | 2,745 (2.0%) | 2,345 (2.0%) |
| 40 to 44 Minutes | 2,919 (2.1%) | 2,301 (2.0%) |
| 45 to 59 Minutes | 4,862 (3.6%) | 4,178 (3.6%) |
| 60 to 89 Minutes | 3,906 (2.9%) | 2,374 (2.1%) |
| 90 or more Minutes | 2,548 (1.9%) | 1,409 (1.2%) |
Time of Departure to Work by Sex in Area Code 712
The most frequent times of departure to work in Area Code 712 are 7:00 AM to 7:29 AM (21,544, 15.9%) for males and 7:30 AM to 7:59 AM (23,783, 20.5%) for females.
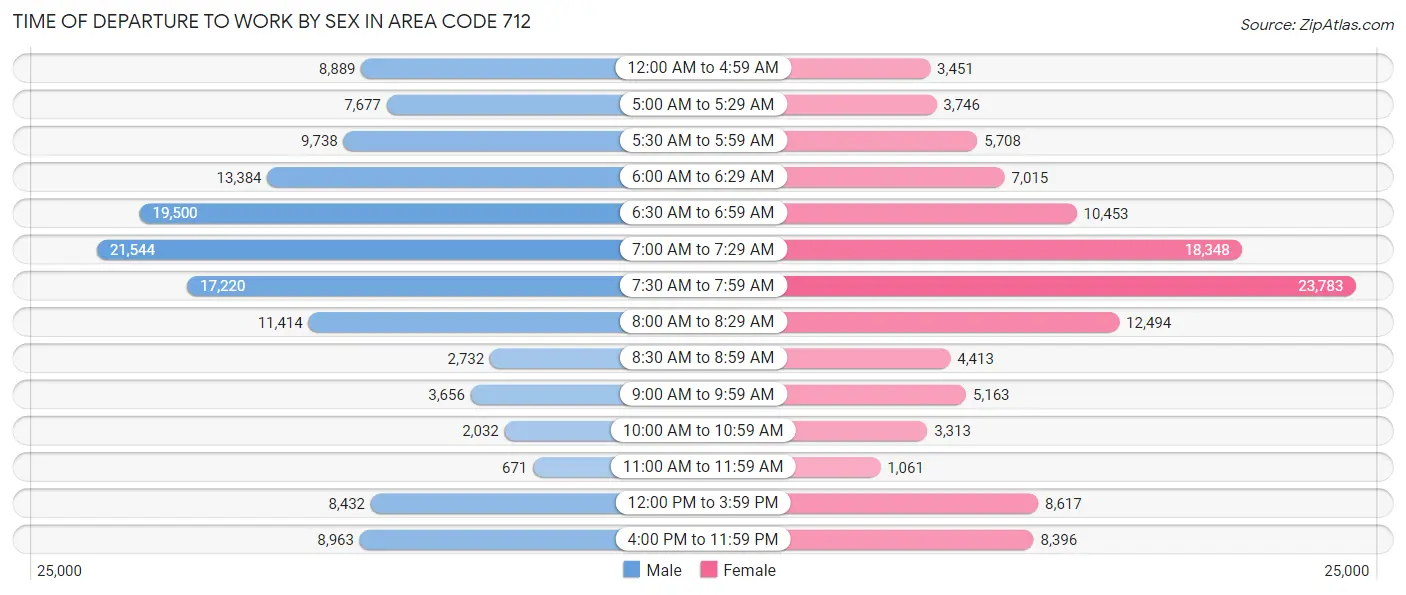
| Time of Departure | Male | Female |
| 12:00 AM to 4:59 AM | 8,889 (6.5%) | 3,451 (3.0%) |
| 5:00 AM to 5:29 AM | 7,677 (5.7%) | 3,746 (3.2%) |
| 5:30 AM to 5:59 AM | 9,738 (7.2%) | 5,708 (4.9%) |
| 6:00 AM to 6:29 AM | 13,384 (9.9%) | 7,015 (6.0%) |
| 6:30 AM to 6:59 AM | 19,500 (14.3%) | 10,453 (9.0%) |
| 7:00 AM to 7:29 AM | 21,544 (15.9%) | 18,348 (15.8%) |
| 7:30 AM to 7:59 AM | 17,220 (12.7%) | 23,783 (20.5%) |
| 8:00 AM to 8:29 AM | 11,414 (8.4%) | 12,494 (10.8%) |
| 8:30 AM to 8:59 AM | 2,732 (2.0%) | 4,413 (3.8%) |
| 9:00 AM to 9:59 AM | 3,656 (2.7%) | 5,163 (4.4%) |
| 10:00 AM to 10:59 AM | 2,032 (1.5%) | 3,313 (2.9%) |
| 11:00 AM to 11:59 AM | 671 (0.5%) | 1,061 (0.9%) |
| 12:00 PM to 3:59 PM | 8,432 (6.2%) | 8,617 (7.4%) |
| 4:00 PM to 11:59 PM | 8,963 (6.6%) | 8,396 (7.2%) |
| Total | 135,852 (100.0%) | 115,961 (100.0%) |
Housing Occupancy in Area Code 712
Occupancy by Ownership in Area Code 712
Of the total 221,016 dwellings in Area Code 712, owner-occupied units account for 162,665 (73.6%), while renter-occupied units make up 58,351 (26.4%).
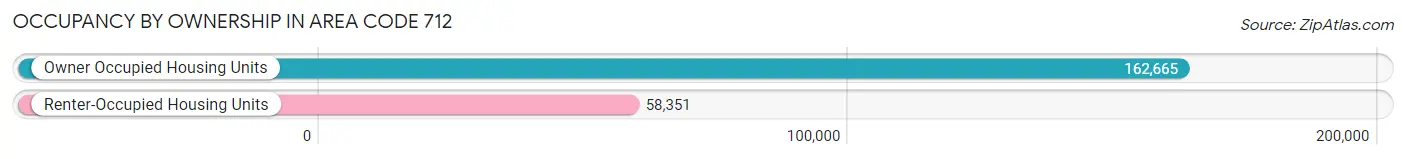
| Occupancy | # Housing Units | % Housing Units |
| Owner Occupied Housing Units | 162,665 | 73.6% |
| Renter-Occupied Housing Units | 58,351 | 26.4% |
| Total Occupied Housing Units | 221,016 | 100.0% |
Occupancy by Household Size in Area Code 712
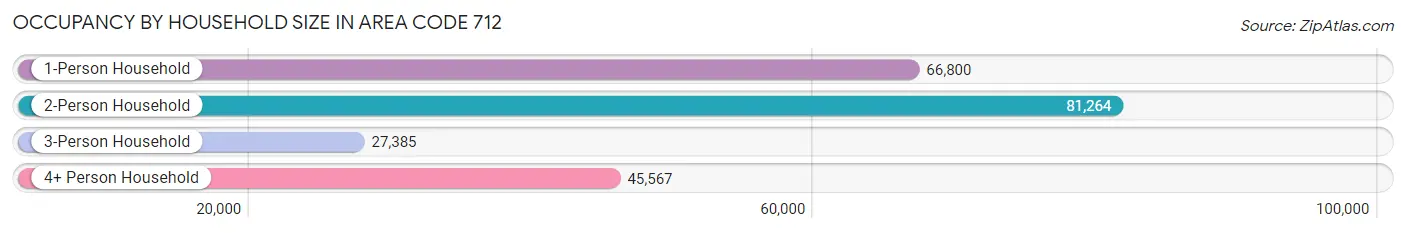
| Household Size | # Housing Units | % Housing Units |
| 1-Person Household | 66,800 | 30.2% |
| 2-Person Household | 81,264 | 36.8% |
| 3-Person Household | 27,385 | 12.4% |
| 4+ Person Household | 45,567 | 20.6% |
| Total Housing Units | 221,016 | 100.0% |
Occupancy by Ownership by Household Size in Area Code 712
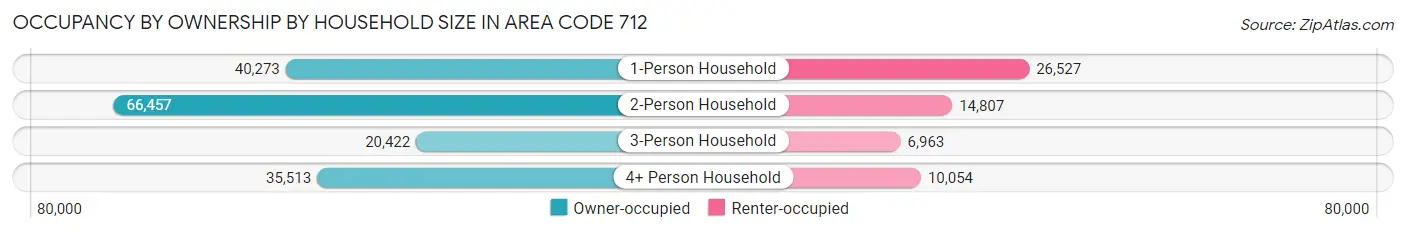
| Household Size | Owner-occupied | Renter-occupied |
| 1-Person Household | 40,273 (60.3%) | 26,527 (39.7%) |
| 2-Person Household | 66,457 (81.8%) | 14,807 (18.2%) |
| 3-Person Household | 20,422 (74.6%) | 6,963 (25.4%) |
| 4+ Person Household | 35,513 (77.9%) | 10,054 (22.1%) |
| Total Housing Units | 162,665 (73.6%) | 58,351 (26.4%) |
Occupancy by Educational Attainment in Area Code 712
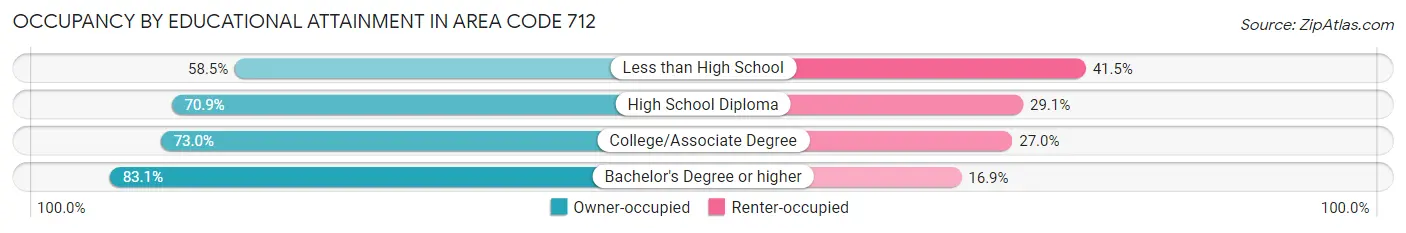
| Household Size | Owner-occupied | Renter-occupied |
| Less than High School | 10,177 (58.5%) | 7,231 (41.5%) |
| High School Diploma | 50,462 (70.9%) | 20,729 (29.1%) |
| College/Associate Degree | 58,038 (73.0%) | 21,452 (27.0%) |
| Bachelor's Degree or higher | 43,988 (83.1%) | 8,939 (16.9%) |
Occupancy by Age of Householder in Area Code 712
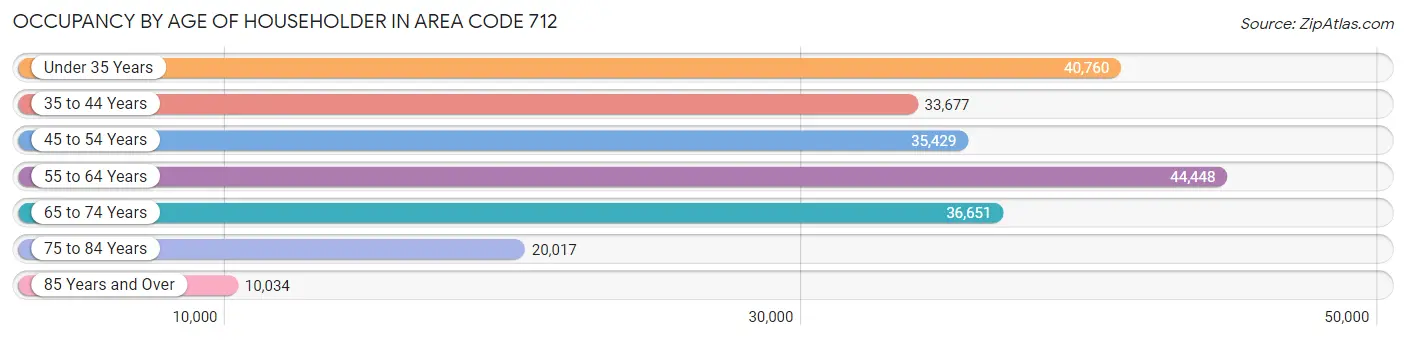
| Age Bracket | # Households | % Households |
| Under 35 Years | 40,760 | 18.4% |
| 35 to 44 Years | 33,677 | 15.2% |
| 45 to 54 Years | 35,429 | 16.0% |
| 55 to 64 Years | 44,448 | 20.1% |
| 65 to 74 Years | 36,651 | 16.6% |
| 75 to 84 Years | 20,017 | 9.1% |
| 85 Years and Over | 10,034 | 4.5% |
| Total | 221,016 | 100.0% |
Housing Finances in Area Code 712
Median Income by Occupancy in Area Code 712
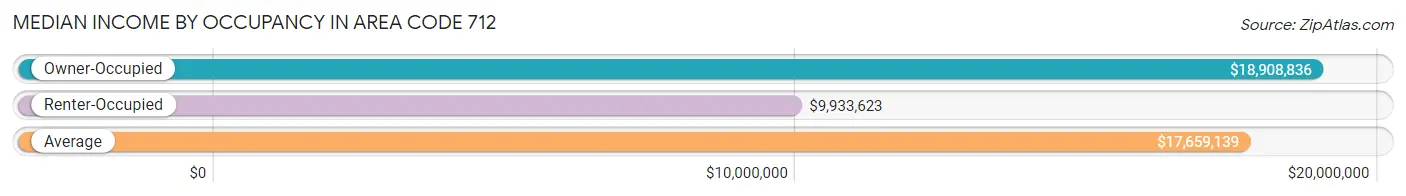
| Occupancy Type | # Households | Median Income |
| Owner-Occupied | 162,665 (73.6%) | $18,908,836 |
| Renter-Occupied | 58,351 (26.4%) | $9,933,623 |
| Average | 221,016 (100.0%) | $17,659,139 |
Occupancy by Householder Income Bracket in Area Code 712
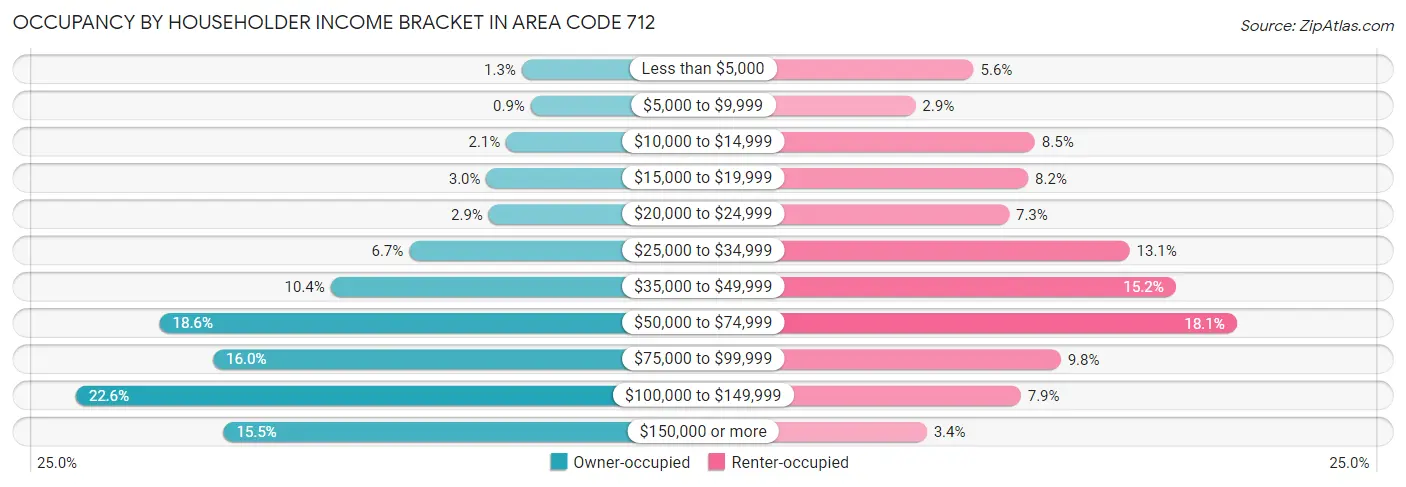
| Income Bracket | Owner-occupied | Renter-occupied |
| Less than $5,000 | 2,157 (1.3%) | 3,282 (5.6%) |
| $5,000 to $9,999 | 1,460 (0.9%) | 1,662 (2.9%) |
| $10,000 to $14,999 | 3,361 (2.1%) | 4,986 (8.5%) |
| $15,000 to $19,999 | 4,900 (3.0%) | 4,799 (8.2%) |
| $20,000 to $24,999 | 4,722 (2.9%) | 4,266 (7.3%) |
| $25,000 to $34,999 | 10,884 (6.7%) | 7,614 (13.1%) |
| $35,000 to $49,999 | 16,971 (10.4%) | 8,891 (15.2%) |
| $50,000 to $74,999 | 30,201 (18.6%) | 10,584 (18.1%) |
| $75,000 to $99,999 | 26,062 (16.0%) | 5,698 (9.8%) |
| $100,000 to $149,999 | 36,693 (22.6%) | 4,593 (7.9%) |
| $150,000 or more | 25,254 (15.5%) | 1,976 (3.4%) |
| Total | 162,665 (100.0%) | 58,351 (100.0%) |
Monthly Housing Cost Tiers in Area Code 712
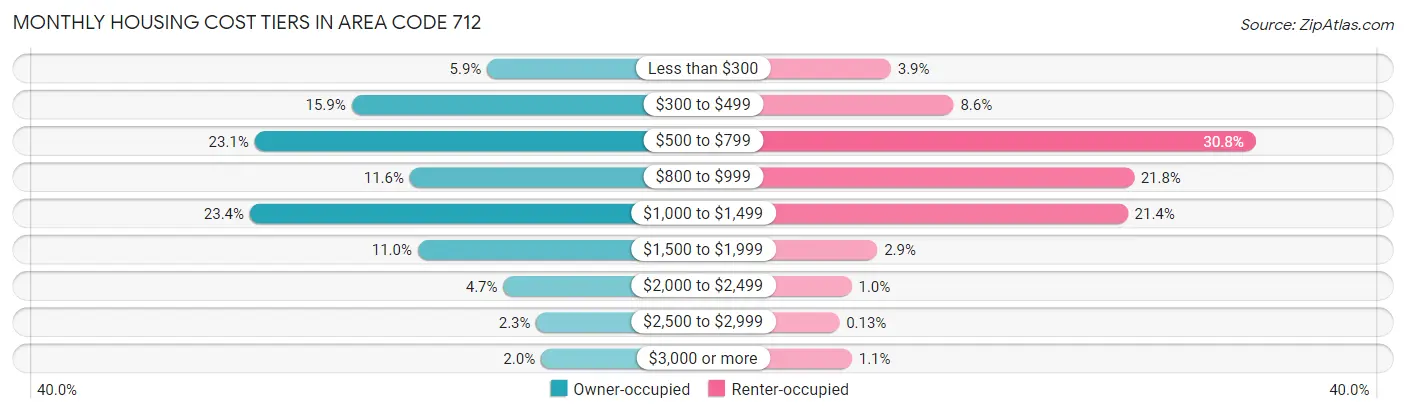
| Monthly Cost | Owner-occupied | Renter-occupied |
| Less than $300 | 9,644 (5.9%) | 2,294 (3.9%) |
| $300 to $499 | 25,891 (15.9%) | 4,990 (8.6%) |
| $500 to $799 | 37,506 (23.1%) | 17,973 (30.8%) |
| $800 to $999 | 18,920 (11.6%) | 12,735 (21.8%) |
| $1,000 to $1,499 | 38,080 (23.4%) | 12,467 (21.4%) |
| $1,500 to $1,999 | 17,960 (11.0%) | 1,712 (2.9%) |
| $2,000 to $2,499 | 7,708 (4.7%) | 606 (1.0%) |
| $2,500 to $2,999 | 3,750 (2.3%) | 77 (0.1%) |
| $3,000 or more | 3,206 (2.0%) | 620 (1.1%) |
| Total | 162,665 (100.0%) | 58,351 (100.0%) |
Physical Housing Characteristics in Area Code 712
Housing Structures in Area Code 712
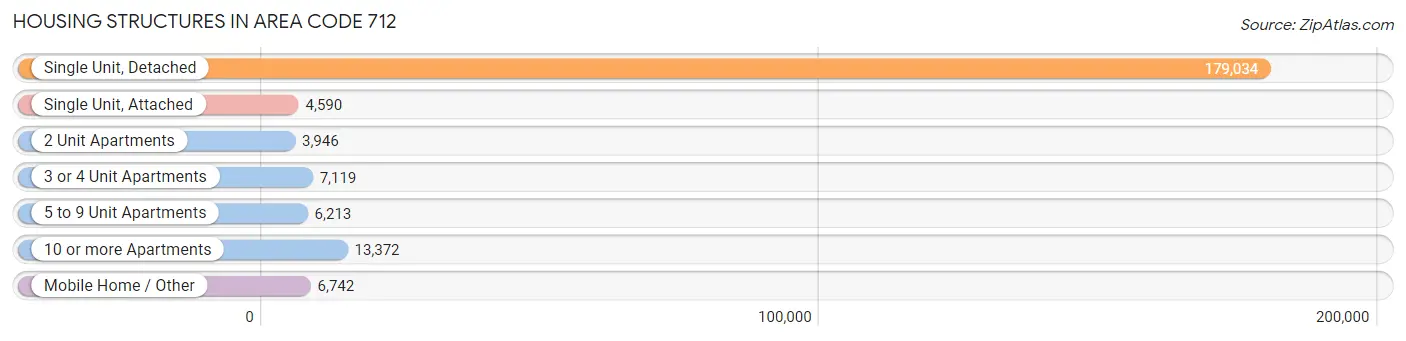
| Structure Type | # Housing Units | % Housing Units |
| Single Unit, Detached | 179,034 | 81.0% |
| Single Unit, Attached | 4,590 | 2.1% |
| 2 Unit Apartments | 3,946 | 1.8% |
| 3 or 4 Unit Apartments | 7,119 | 3.2% |
| 5 to 9 Unit Apartments | 6,213 | 2.8% |
| 10 or more Apartments | 13,372 | 6.0% |
| Mobile Home / Other | 6,742 | 3.0% |
| Total | 221,016 | 100.0% |
Housing Structures by Occupancy in Area Code 712
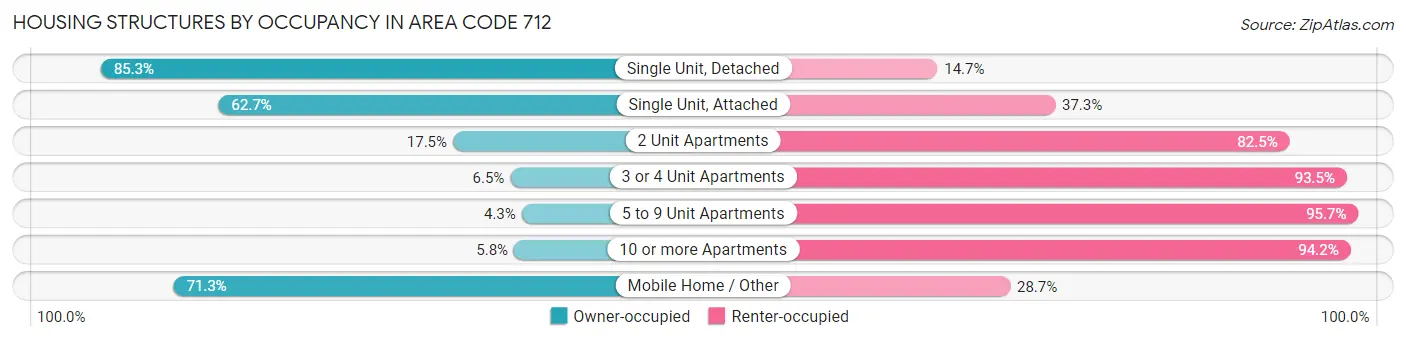
| Structure Type | Owner-occupied | Renter-occupied |
| Single Unit, Detached | 152,784 (85.3%) | 26,250 (14.7%) |
| Single Unit, Attached | 2,877 (62.7%) | 1,713 (37.3%) |
| 2 Unit Apartments | 692 (17.5%) | 3,254 (82.5%) |
| 3 or 4 Unit Apartments | 463 (6.5%) | 6,656 (93.5%) |
| 5 to 9 Unit Apartments | 267 (4.3%) | 5,946 (95.7%) |
| 10 or more Apartments | 773 (5.8%) | 12,599 (94.2%) |
| Mobile Home / Other | 4,809 (71.3%) | 1,933 (28.7%) |
| Total | 162,665 (73.6%) | 58,351 (26.4%) |
Housing Structures by Number of Rooms in Area Code 712
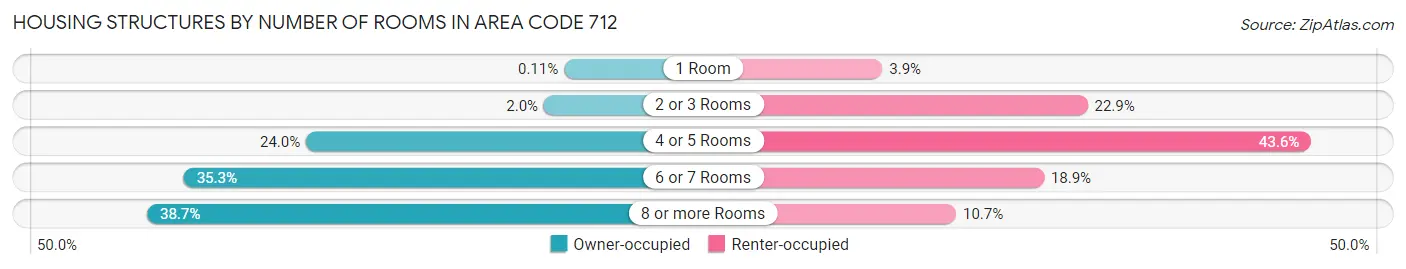
| Number of Rooms | Owner-occupied | Renter-occupied |
| 1 Room | 185 (0.1%) | 2,286 (3.9%) |
| 2 or 3 Rooms | 3,199 (2.0%) | 13,363 (22.9%) |
| 4 or 5 Rooms | 38,992 (24.0%) | 25,430 (43.6%) |
| 6 or 7 Rooms | 57,394 (35.3%) | 11,008 (18.9%) |
| 8 or more Rooms | 62,895 (38.7%) | 6,264 (10.7%) |
| Total | 162,665 (100.0%) | 58,351 (100.0%) |
Housing Structure by Heating Type in Area Code 712
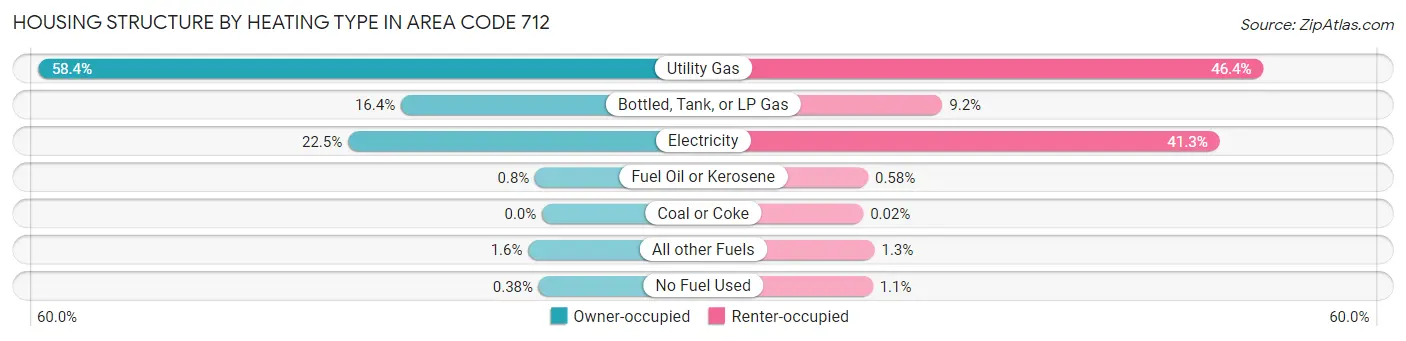
| Heating Type | Owner-occupied | Renter-occupied |
| Utility Gas | 94,930 (58.4%) | 27,085 (46.4%) |
| Bottled, Tank, or LP Gas | 26,614 (16.4%) | 5,364 (9.2%) |
| Electricity | 36,601 (22.5%) | 24,121 (41.3%) |
| Fuel Oil or Kerosene | 1,299 (0.8%) | 338 (0.6%) |
| Coal or Coke | 0 (0.0%) | 12 (0.0%) |
| All other Fuels | 2,608 (1.6%) | 775 (1.3%) |
| No Fuel Used | 613 (0.4%) | 656 (1.1%) |
| Total | 162,665 (100.0%) | 58,351 (100.0%) |
Household Vehicle Usage in Area Code 712
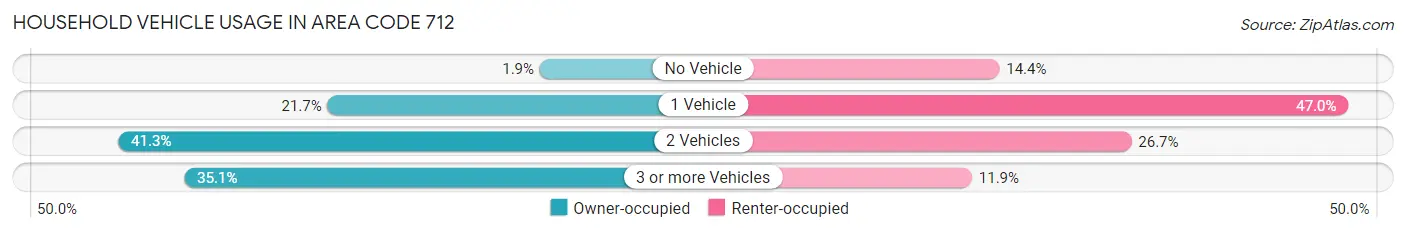
| Vehicles per Household | Owner-occupied | Renter-occupied |
| No Vehicle | 3,098 (1.9%) | 8,408 (14.4%) |
| 1 Vehicle | 35,328 (21.7%) | 27,422 (47.0%) |
| 2 Vehicles | 67,131 (41.3%) | 15,605 (26.7%) |
| 3 or more Vehicles | 57,108 (35.1%) | 6,916 (11.8%) |
| Total | 162,665 (100.0%) | 58,351 (100.0%) |
Real Estate & Mortgages in Area Code 712
Real Estate and Mortgage Overview in Area Code 712
| Characteristic | Without Mortgage | With Mortgage |
| Housing Units | 74,569 | 88,096 |
| Median Property Value | $32,170,800 | $35,412,900 |
| Median Household Income | $16,088,365 | $16,692 |
| Monthly Housing Costs | $125,857 | $3,136 |
| Real Estate Taxes | $387,978 | $1,223 |
Property Value by Mortgage Status in Area Code 712
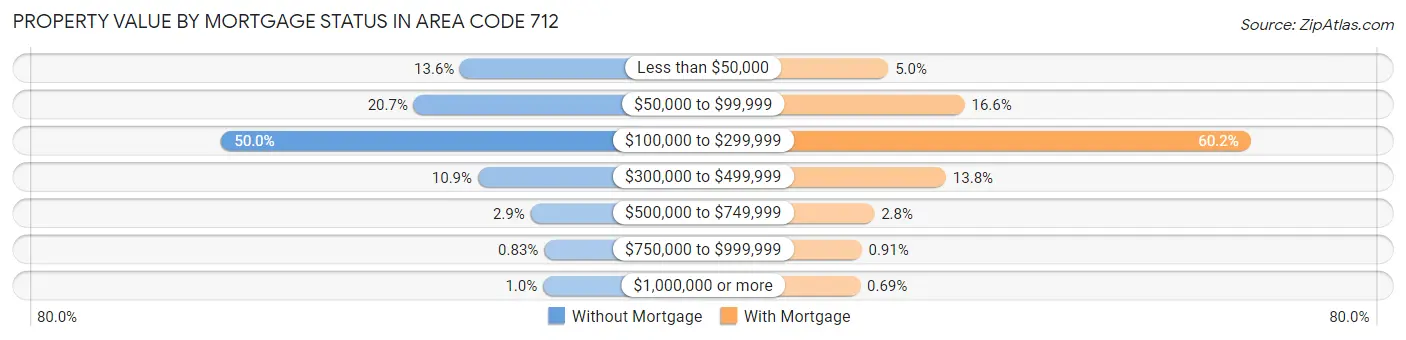
| Property Value | Without Mortgage | With Mortgage |
| Less than $50,000 | 10,164 (13.6%) | 4,386 (5.0%) |
| $50,000 to $99,999 | 15,438 (20.7%) | 14,637 (16.6%) |
| $100,000 to $299,999 | 37,291 (50.0%) | 53,029 (60.2%) |
| $300,000 to $499,999 | 8,151 (10.9%) | 12,135 (13.8%) |
| $500,000 to $749,999 | 2,162 (2.9%) | 2,503 (2.8%) |
| $750,000 to $999,999 | 617 (0.8%) | 799 (0.9%) |
| $1,000,000 or more | 746 (1.0%) | 607 (0.7%) |
| Total | 74,569 (100.0%) | 88,096 (100.0%) |
Household Income by Mortgage Status in Area Code 712
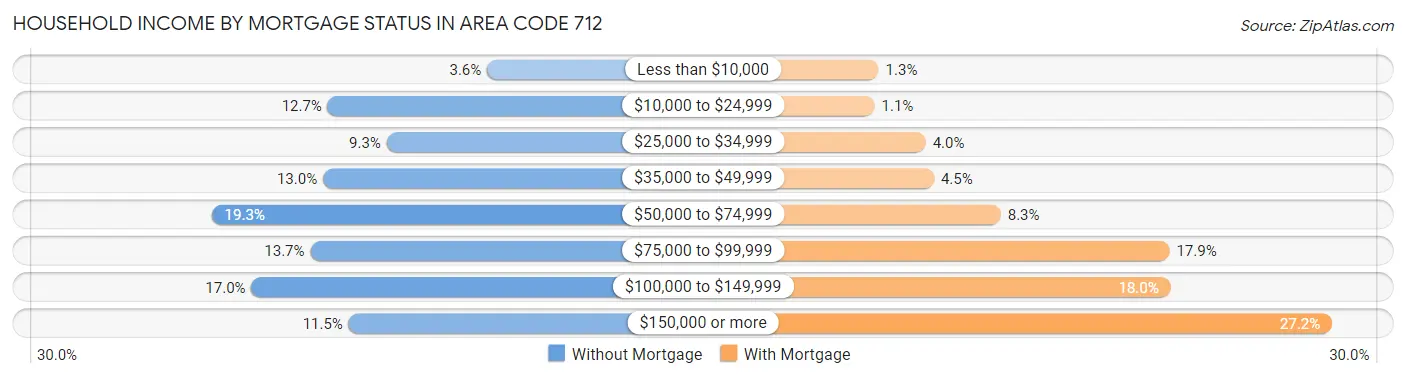
| Household Income | Without Mortgage | With Mortgage |
| Less than $10,000 | 2,660 (3.6%) | 1,162 (1.3%) |
| $10,000 to $24,999 | 9,452 (12.7%) | 957 (1.1%) |
| $25,000 to $34,999 | 6,941 (9.3%) | 3,531 (4.0%) |
| $35,000 to $49,999 | 9,656 (13.0%) | 3,943 (4.5%) |
| $50,000 to $74,999 | 14,400 (19.3%) | 7,315 (8.3%) |
| $75,000 to $99,999 | 10,193 (13.7%) | 15,801 (17.9%) |
| $100,000 to $149,999 | 12,705 (17.0%) | 15,869 (18.0%) |
| $150,000 or more | 8,562 (11.5%) | 23,988 (27.2%) |
| Total | 74,569 (100.0%) | 88,096 (100.0%) |
Property Value to Household Income Ratio in Area Code 712
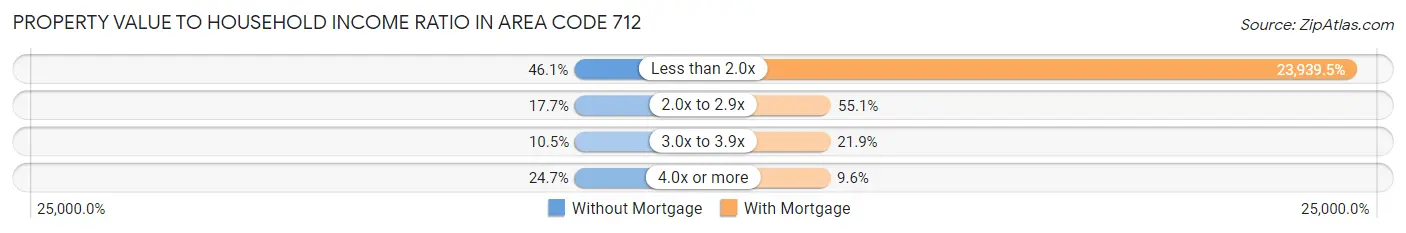
| Value-to-Income Ratio | Without Mortgage | With Mortgage |
| Less than 2.0x | 34,394 (46.1%) | 21,089,731 (23,939.5%) |
| 2.0x to 2.9x | 13,223 (17.7%) | 48,512 (55.1%) |
| 3.0x to 3.9x | 7,847 (10.5%) | 19,254 (21.9%) |
| 4.0x or more | 18,430 (24.7%) | 8,433 (9.6%) |
| Total | 74,569 (100.0%) | 88,096 (100.0%) |
Real Estate Taxes by Mortgage Status in Area Code 712
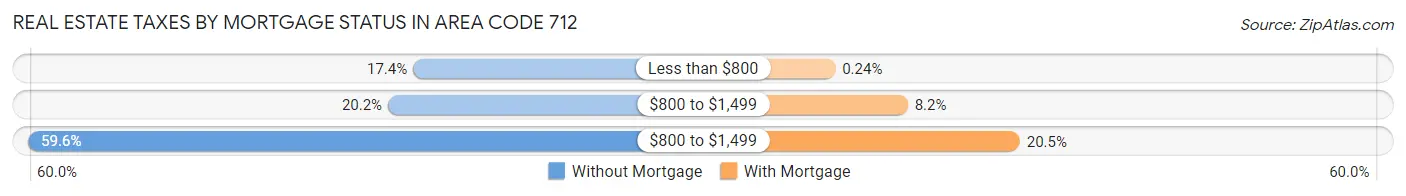
| Property Taxes | Without Mortgage | With Mortgage |
| Less than $800 | 12,994 (17.4%) | 209 (0.2%) |
| $800 to $1,499 | 15,049 (20.2%) | 7,205 (8.2%) |
| $800 to $1,499 | 44,450 (59.6%) | 18,033 (20.5%) |
| Total | 74,569 (100.0%) | 88,096 (100.0%) |
Health & Disability in Area Code 712
Health Insurance Coverage by Age in Area Code 712
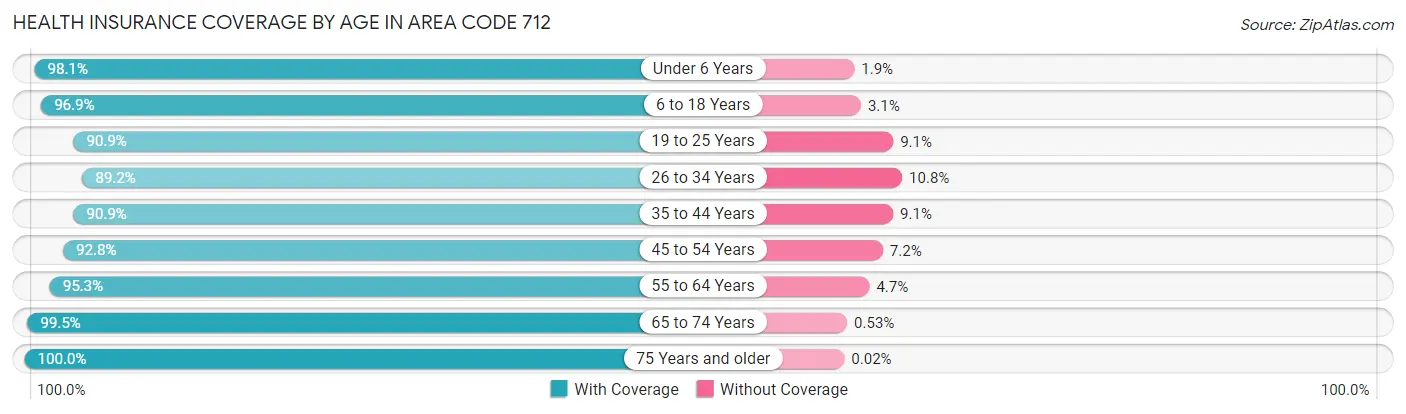
| Age Bracket | With Coverage | Without Coverage |
| Under 6 Years | 39,809 (98.1%) | 759 (1.9%) |
| 6 to 18 Years | 95,636 (96.9%) | 3,074 (3.1%) |
| 19 to 25 Years | 41,268 (90.9%) | 4,141 (9.1%) |
| 26 to 34 Years | 49,280 (89.2%) | 5,961 (10.8%) |
| 35 to 44 Years | 58,347 (90.9%) | 5,847 (9.1%) |
| 45 to 54 Years | 57,571 (92.8%) | 4,468 (7.2%) |
| 55 to 64 Years | 71,965 (95.3%) | 3,552 (4.7%) |
| 65 to 74 Years | 58,823 (99.5%) | 311 (0.5%) |
| 75 Years and older | 42,453 (100.0%) | 8 (0.0%) |
| Total | 515,152 (94.8%) | 28,121 (5.2%) |
Health Insurance Coverage by Citizenship Status in Area Code 712
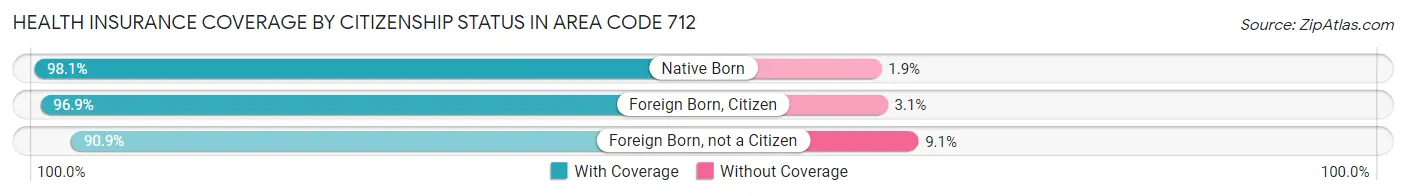
| Citizenship Status | With Coverage | Without Coverage |
| Native Born | 39,809 (98.1%) | 759 (1.9%) |
| Foreign Born, Citizen | 95,636 (96.9%) | 3,074 (3.1%) |
| Foreign Born, not a Citizen | 41,268 (90.9%) | 4,141 (9.1%) |
Health Insurance Coverage by Household Income in Area Code 712
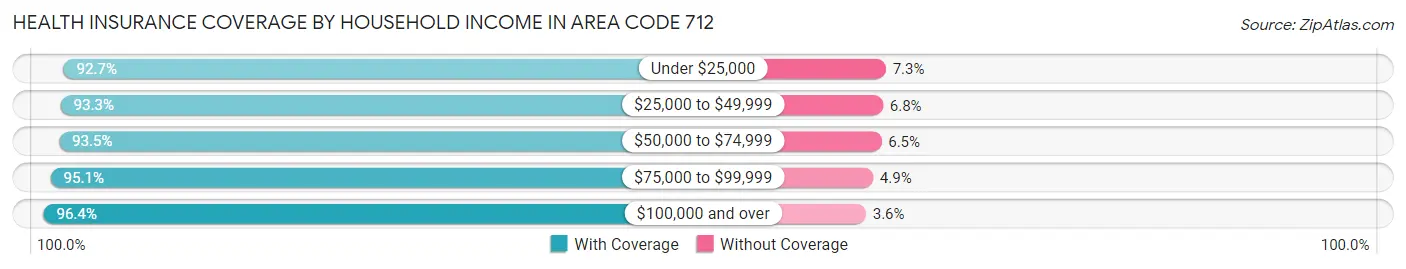
| Household Income | With Coverage | Without Coverage |
| Under $25,000 | 50,839 (92.7%) | 4,004 (7.3%) |
| $25,000 to $49,999 | 80,730 (93.2%) | 5,842 (6.8%) |
| $50,000 to $74,999 | 90,350 (93.5%) | 6,236 (6.5%) |
| $75,000 to $99,999 | 81,294 (95.1%) | 4,177 (4.9%) |
| $100,000 and over | 204,481 (96.4%) | 7,558 (3.6%) |
Public vs Private Health Insurance Coverage by Age in Area Code 712
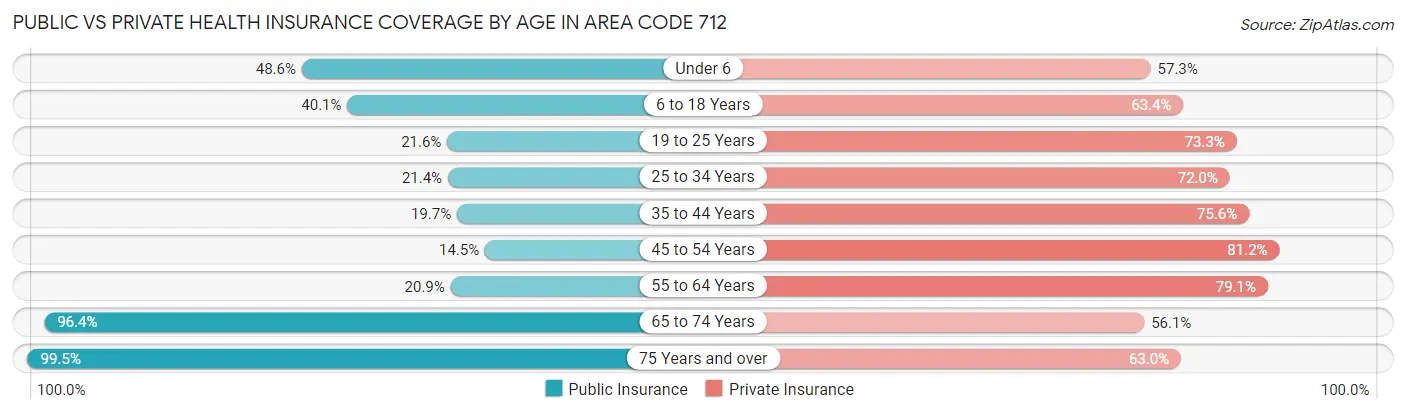
| Age Bracket | Public Insurance | Private Insurance |
| Under 6 | 19,697 (48.5%) | 23,253 (57.3%) |
| 6 to 18 Years | 39,572 (40.1%) | 62,591 (63.4%) |
| 19 to 25 Years | 9,792 (21.6%) | 33,281 (73.3%) |
| 25 to 34 Years | 11,832 (21.4%) | 39,781 (72.0%) |
| 35 to 44 Years | 12,673 (19.7%) | 48,531 (75.6%) |
| 45 to 54 Years | 9,012 (14.5%) | 50,386 (81.2%) |
| 55 to 64 Years | 15,806 (20.9%) | 59,709 (79.1%) |
| 65 to 74 Years | 56,979 (96.4%) | 33,191 (56.1%) |
| 75 Years and over | 42,233 (99.5%) | 26,739 (63.0%) |
| Total | 217,596 (40.1%) | 377,462 (69.5%) |
Disability Status by Sex by Age in Area Code 712
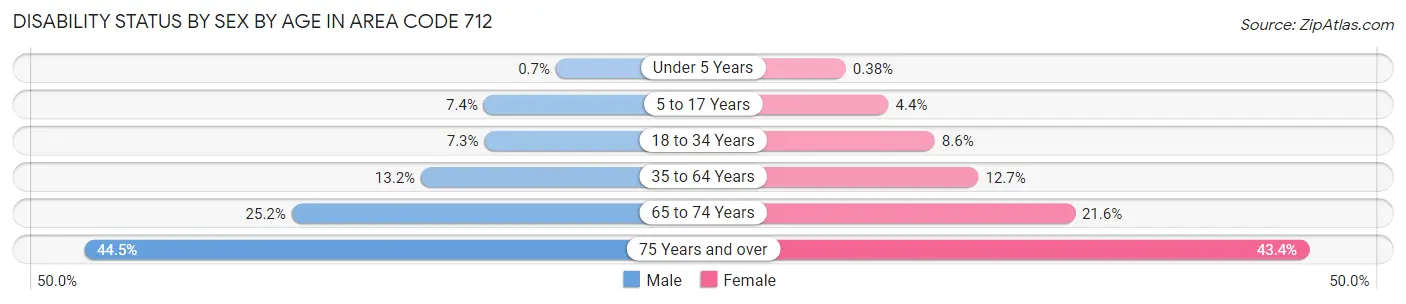
| Age Bracket | Male | Female |
| Under 5 Years | 120 (0.7%) | 60 (0.4%) |
| 5 to 17 Years | 3,748 (7.4%) | 2,062 (4.3%) |
| 18 to 34 Years | 4,108 (7.3%) | 4,565 (8.6%) |
| 35 to 64 Years | 13,475 (13.2%) | 12,665 (12.7%) |
| 65 to 74 Years | 7,369 (25.2%) | 6,474 (21.6%) |
| 75 Years and over | 7,871 (44.5%) | 10,738 (43.3%) |
Disability Class by Sex by Age in Area Code 712
Disability Class: Hearing Difficulty
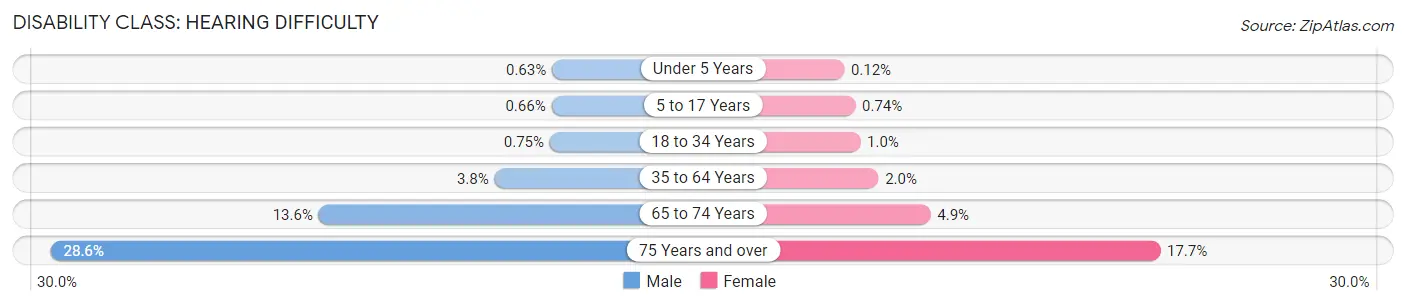
| Age Bracket | Male | Female |
| Under 5 Years | 108 (0.6%) | 19 (0.1%) |
| 5 to 17 Years | 334 (0.7%) | 351 (0.7%) |
| 18 to 34 Years | 418 (0.7%) | 538 (1.0%) |
| 35 to 64 Years | 3,907 (3.8%) | 2,023 (2.0%) |
| 65 to 74 Years | 3,981 (13.6%) | 1,476 (4.9%) |
| 75 Years and over | 5,051 (28.5%) | 4,389 (17.7%) |
Disability Class: Vision Difficulty
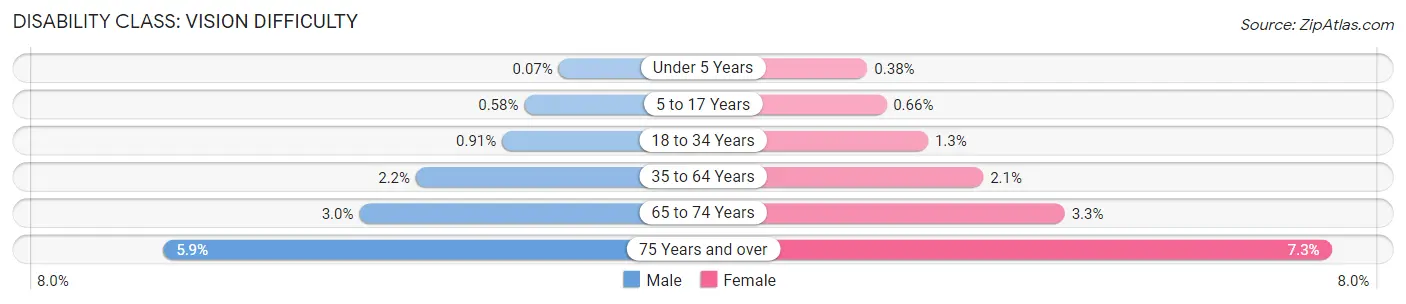
| Age Bracket | Male | Female |
| Under 5 Years | 12 (0.1%) | 60 (0.4%) |
| 5 to 17 Years | 292 (0.6%) | 311 (0.7%) |
| 18 to 34 Years | 508 (0.9%) | 677 (1.3%) |
| 35 to 64 Years | 2,237 (2.2%) | 2,101 (2.1%) |
| 65 to 74 Years | 884 (3.0%) | 989 (3.3%) |
| 75 Years and over | 1,050 (5.9%) | 1,801 (7.3%) |
Disability Class: Cognitive Difficulty
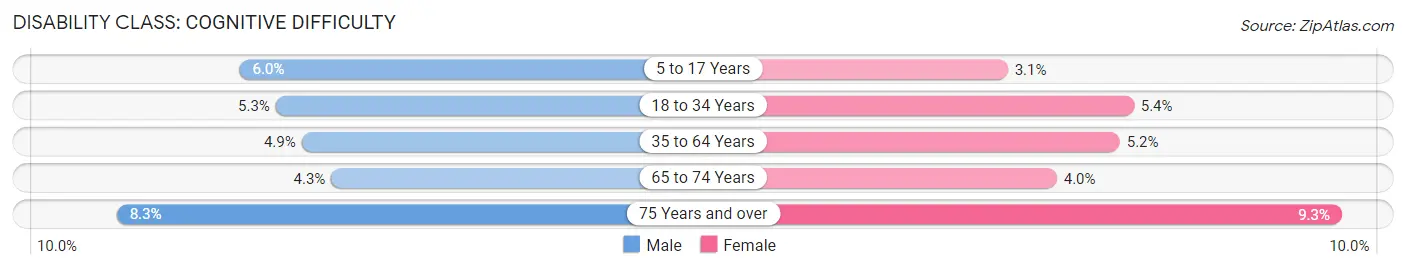
| Age Bracket | Male | Female |
| 5 to 17 Years | 3,048 (6.0%) | 1,461 (3.1%) |
| 18 to 34 Years | 2,991 (5.3%) | 2,866 (5.4%) |
| 35 to 64 Years | 4,954 (4.9%) | 5,153 (5.2%) |
| 65 to 74 Years | 1,259 (4.3%) | 1,195 (4.0%) |
| 75 Years and over | 1,467 (8.3%) | 2,299 (9.3%) |
Disability Class: Ambulatory Difficulty
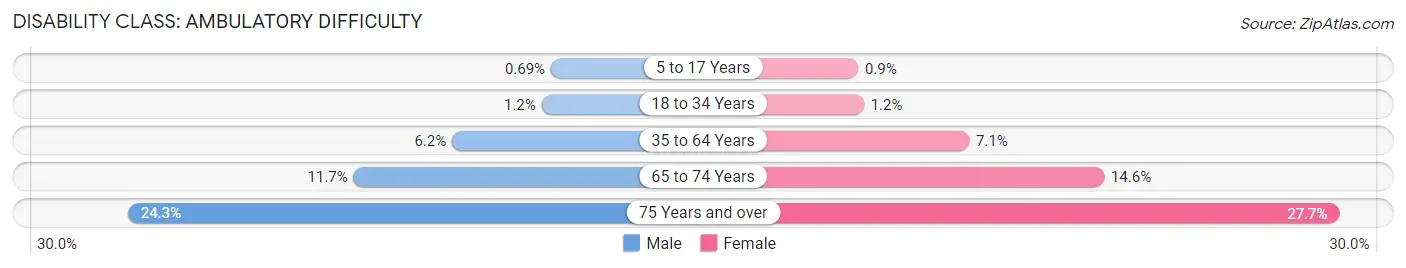
| Age Bracket | Male | Female |
| 5 to 17 Years | 352 (0.7%) | 427 (0.9%) |
| 18 to 34 Years | 676 (1.2%) | 646 (1.2%) |
| 35 to 64 Years | 6,317 (6.2%) | 7,077 (7.1%) |
| 65 to 74 Years | 3,412 (11.7%) | 4,366 (14.6%) |
| 75 Years and over | 4,289 (24.2%) | 6,862 (27.7%) |
Disability Class: Self-Care Difficulty
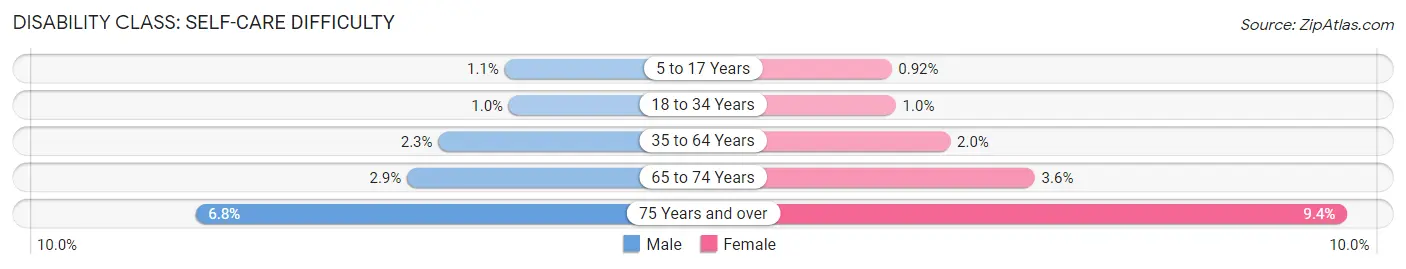
| Age Bracket | Male | Female |
| 5 to 17 Years | 555 (1.1%) | 435 (0.9%) |
| 18 to 34 Years | 565 (1.0%) | 529 (1.0%) |
| 35 to 64 Years | 2,363 (2.3%) | 2,008 (2.0%) |
| 65 to 74 Years | 847 (2.9%) | 1,070 (3.6%) |
| 75 Years and over | 1,208 (6.8%) | 2,323 (9.4%) |
Technology Access in Area Code 712
Computing Device Access in Area Code 712
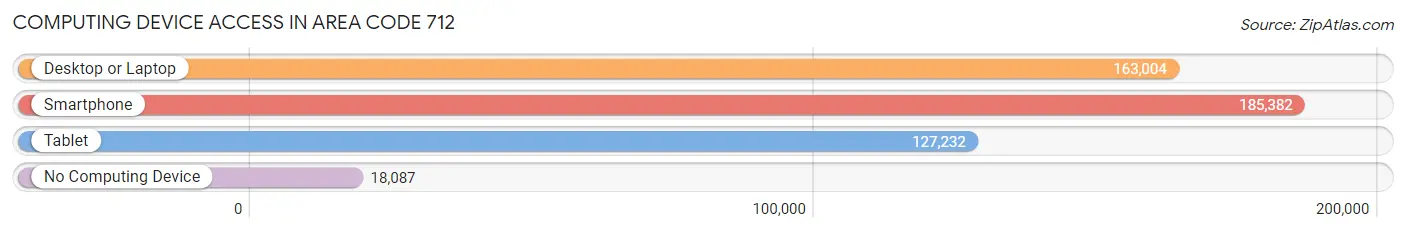
| Device Type | # Households | % Households |
| Desktop or Laptop | 163,004 | 73.8% |
| Smartphone | 185,382 | 83.9% |
| Tablet | 127,232 | 57.6% |
| No Computing Device | 18,087 | 8.2% |
| Total | 221,016 | 100.0% |
Internet Access in Area Code 712
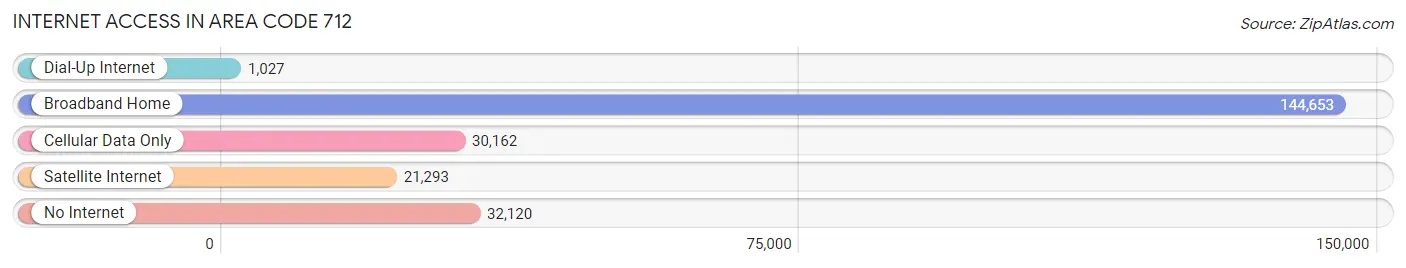
| Internet Type | # Households | % Households |
| Dial-Up Internet | 1,027 | 0.5% |
| Broadband Home | 144,653 | 65.4% |
| Cellular Data Only | 30,162 | 13.7% |
| Satellite Internet | 21,293 | 9.6% |
| No Internet | 32,120 | 14.5% |
| Total | 221,016 | 100.0% |
Area Code 712 Summary
Geography
Area code 712 is located in the Midwestern United States, covering the state of Iowa. It is bordered by area codes 515 to the north, 402 to the east, 563 to the south, and 641 to the west.
Social
Area code 712 is home to a variety of communities, including the cities of Sioux City, Council Bluffs, and Sioux Center. It is also home to a number of rural towns and villages, as well as the Winnebago and Sioux Native American tribes.
Economics
Area code 712 is a major agricultural and industrial center, with a strong manufacturing base and a large agricultural sector. It is also home to a number of universities and colleges, including the University of Iowa, Iowa State University, and the University of Northern Iowa.
Demographics
Area code 712 is home to a diverse population, with a median age of 38.5 years. The population is predominantly white, with a small percentage of African Americans, Hispanics, and Asians. The median household income is $50,845, and the median home value is $133,400.
Common Questions
What is Per Capita Income in Area Code 712?
Per Capita income in Area Code 712 is $35,530.
What is the Median Family Income in Area Code 712?
Median Family Income in Area Code 712 is $85,256.
What is the Median Household income in Area Code 712?
Median Household Income in Area Code 712 is $69,799.
What is Income or Wage Gap in Area Code 712?
Income or Wage Gap in Area Code 712 is 31.5%.
Women in Area Code 712 earn 68.5 cents for every dollar earned by a man.
What is Family Income Deficit in Area Code 712?
Family Income Deficit in Area Code 712 is $9,024.
Families that are below poverty line in Area Code 712 earn $9,024 less on average than the poverty threshold level.
What is Inequality or Gini Index in Area Code 712?
Inequality or Gini Index in Area Code 712 is 102.16.
What is the Total Population of Area Code 712?
Total Population of Area Code 712 is 552,635.
What is the Total Male Population of Area Code 712?
Total Male Population of Area Code 712 is 277,405.
What is the Total Female Population of Area Code 712?
Total Female Population of Area Code 712 is 275,230.
What is the Ratio of Males per 100 Females in Area Code 712?
There are 100.79 Males per 100 Females in Area Code 712.
What is the Ratio of Females per 100 Males in Area Code 712?
There are 99.22 Females per 100 Males in Area Code 712.
What is the Median Population Age in Area Code 712?
Median Population Age in Area Code 712 is 44.6 Years.
What is the Average Family Size in Area Code 712
Average Family Size in Area Code 712 is 3.0 People.
What is the Average Household Size in Area Code 712
Average Household Size in Area Code 712 is 2.4 People.
How Large is the Labor Force in Area Code 712?
There are 280,820 People in the Labor Forcein in Area Code 712.
What is the Percentage of People in the Labor Force in Area Code 712?
64.3% of People are in the Labor Force in Area Code 712.
What is the Unemployment Rate in Area Code 712?
Unemployment Rate in Area Code 712 is 3.5%.