Mahaska County, IA Map & Demographics
Mahaska County Map
Mahaska County Overview
$33,812
PER CAPITA INCOME
$81,257
AVG FAMILY INCOME
$65,200
AVG HOUSEHOLD INCOME
37.3%
WAGE / INCOME GAP [ % ]
62.7¢/ $1
WAGE / INCOME GAP [ $ ]
$8,895
FAMILY INCOME DEFICIT
0.43
INEQUALITY / GINI INDEX
22,059
TOTAL POPULATION
11,202
MALE POPULATION
10,857
FEMALE POPULATION
103.18
MALES / 100 FEMALES
96.92
FEMALES / 100 MALES
39.6
MEDIAN AGE
2.9
AVG FAMILY SIZE
2.4
AVG HOUSEHOLD SIZE
11,481
LABOR FORCE [ PEOPLE ]
65.8%
PERCENT IN LABOR FORCE
3.3%
UNEMPLOYMENT RATE
Mahaska County Area Codes
Income in Mahaska County
Income Overview in Mahaska County
Per Capita Income in Mahaska County is $33,812, while median incomes of families and households are $81,257 and $65,200 respectively.
| Characteristic | Number | Measure |
| Per Capita Income | 22,059 | $33,812 |
| Median Family Income | 5,795 | $81,257 |
| Mean Family Income | 5,795 | $97,711 |
| Median Household Income | 8,873 | $65,200 |
| Mean Household Income | 8,873 | $81,121 |
| Income Deficit | 5,795 | $8,895 |
| Wage / Income Gap (%) | 22,059 | 37.33% |
| Wage / Income Gap ($) | 22,059 | 62.67¢ per $1 |
| Gini / Inequality Index | 22,059 | 0.43 |
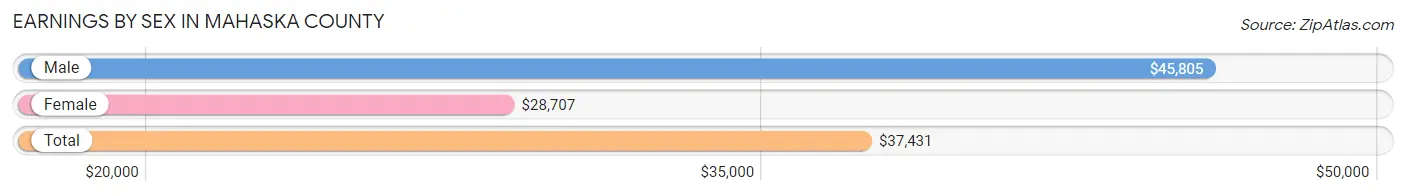
Earnings by Sex in Mahaska County
Average Earnings in Mahaska County are $37,431, $45,805 for men and $28,707 for women, a difference of 37.3%.
| Sex | Number | Average Earnings |
| Male | 6,738 (55.0%) | $45,805 |
| Female | 5,514 (45.0%) | $28,707 |
| Total | 12,252 (100.0%) | $37,431 |
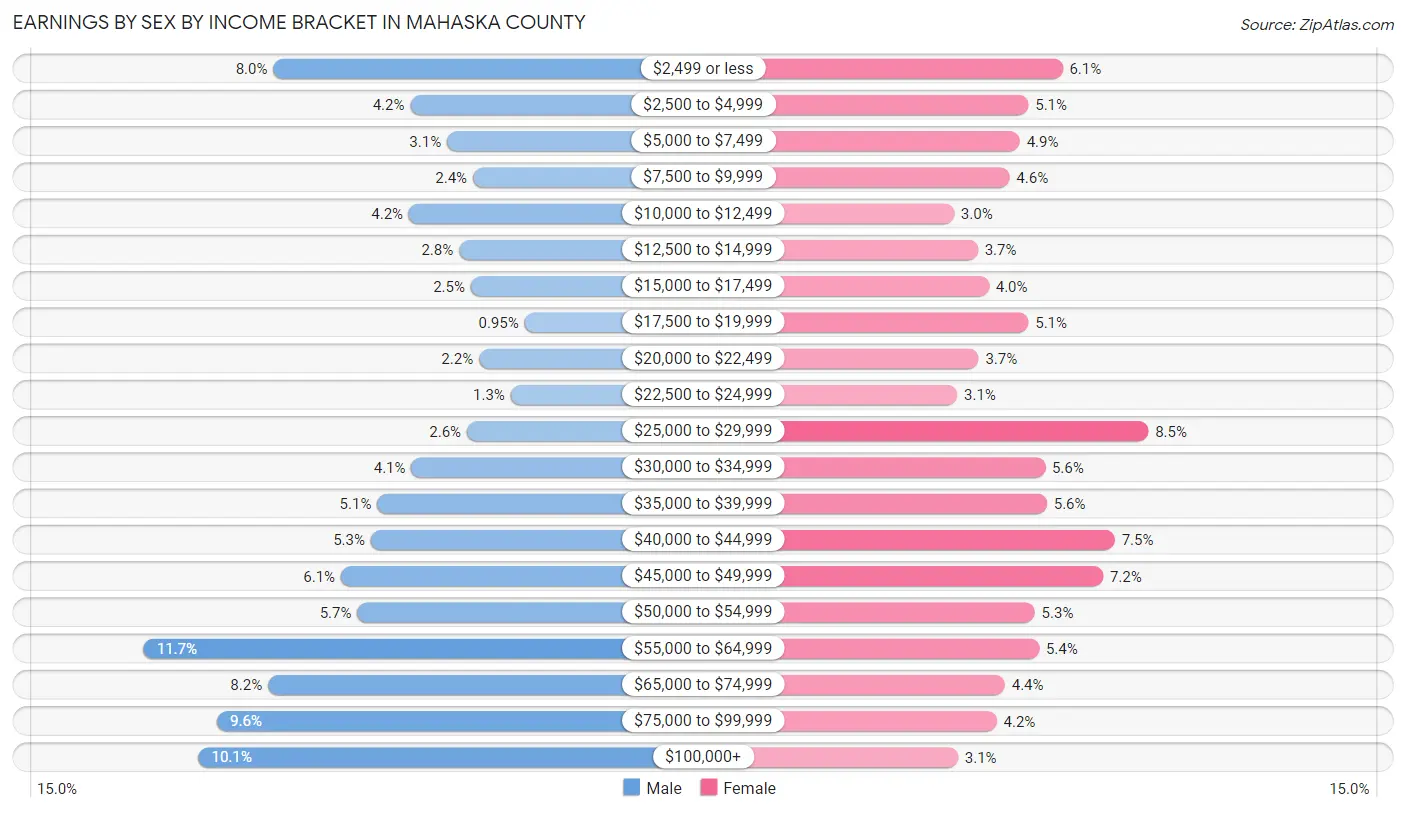
Earnings by Sex by Income Bracket in Mahaska County
The most common earnings brackets in Mahaska County are $55,000 to $64,999 for men (785 | 11.7%) and $25,000 to $29,999 for women (467 | 8.5%).
| Income | Male | Female |
| $2,499 or less | 540 (8.0%) | 334 (6.1%) |
| $2,500 to $4,999 | 280 (4.2%) | 281 (5.1%) |
| $5,000 to $7,499 | 211 (3.1%) | 268 (4.9%) |
| $7,500 to $9,999 | 162 (2.4%) | 252 (4.6%) |
| $10,000 to $12,499 | 283 (4.2%) | 166 (3.0%) |
| $12,500 to $14,999 | 188 (2.8%) | 203 (3.7%) |
| $15,000 to $17,499 | 166 (2.5%) | 220 (4.0%) |
| $17,500 to $19,999 | 64 (0.9%) | 281 (5.1%) |
| $20,000 to $22,499 | 150 (2.2%) | 204 (3.7%) |
| $22,500 to $24,999 | 90 (1.3%) | 171 (3.1%) |
| $25,000 to $29,999 | 173 (2.6%) | 467 (8.5%) |
| $30,000 to $34,999 | 278 (4.1%) | 307 (5.6%) |
| $35,000 to $39,999 | 343 (5.1%) | 310 (5.6%) |
| $40,000 to $44,999 | 355 (5.3%) | 415 (7.5%) |
| $45,000 to $49,999 | 412 (6.1%) | 397 (7.2%) |
| $50,000 to $54,999 | 381 (5.7%) | 291 (5.3%) |
| $55,000 to $64,999 | 785 (11.7%) | 298 (5.4%) |
| $65,000 to $74,999 | 550 (8.2%) | 245 (4.4%) |
| $75,000 to $99,999 | 646 (9.6%) | 232 (4.2%) |
| $100,000+ | 681 (10.1%) | 172 (3.1%) |
| Total | 6,738 (100.0%) | 5,514 (100.0%) |
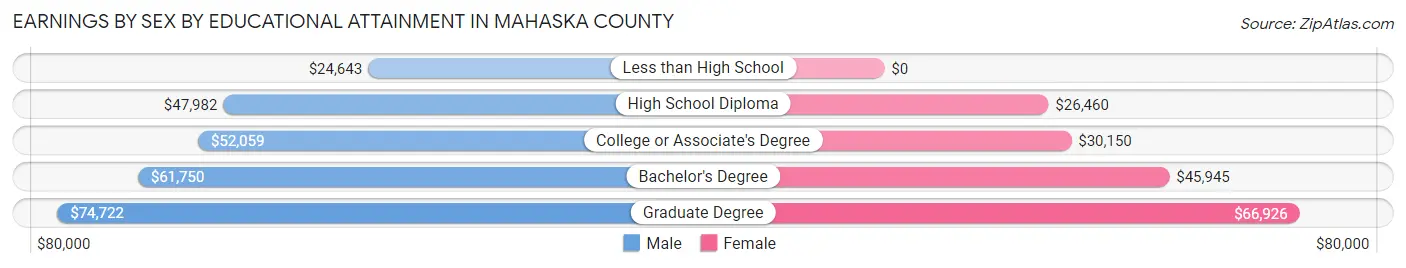
Earnings by Sex by Educational Attainment in Mahaska County
Average earnings in Mahaska County are $51,526 for men and $33,750 for women, a difference of 34.5%. Men with an educational attainment of graduate degree enjoy the highest average annual earnings of $74,722, while those with less than high school education earn the least with $24,643. Women with an educational attainment of graduate degree earn the most with the average annual earnings of $66,926, while those with high school diploma education have the smallest earnings of $26,460.
| Educational Attainment | Male Income | Female Income |
| Less than High School | $24,643 | $0 |
| High School Diploma | $47,982 | $26,460 |
| College or Associate's Degree | $52,059 | $30,150 |
| Bachelor's Degree | $61,750 | $45,945 |
| Graduate Degree | $74,722 | $66,926 |
| Total | $51,526 | $33,750 |
Family Income in Mahaska County
Family Income Brackets in Mahaska County
According to the Mahaska County family income data, there are 1,217 families falling into the $100,000 to $149,999 income range, which is the most common income bracket and makes up 21.0% of all families. Conversely, the $10,000 to $14,999 income bracket is the least frequent group with only 87 families (1.5%) belonging to this category.
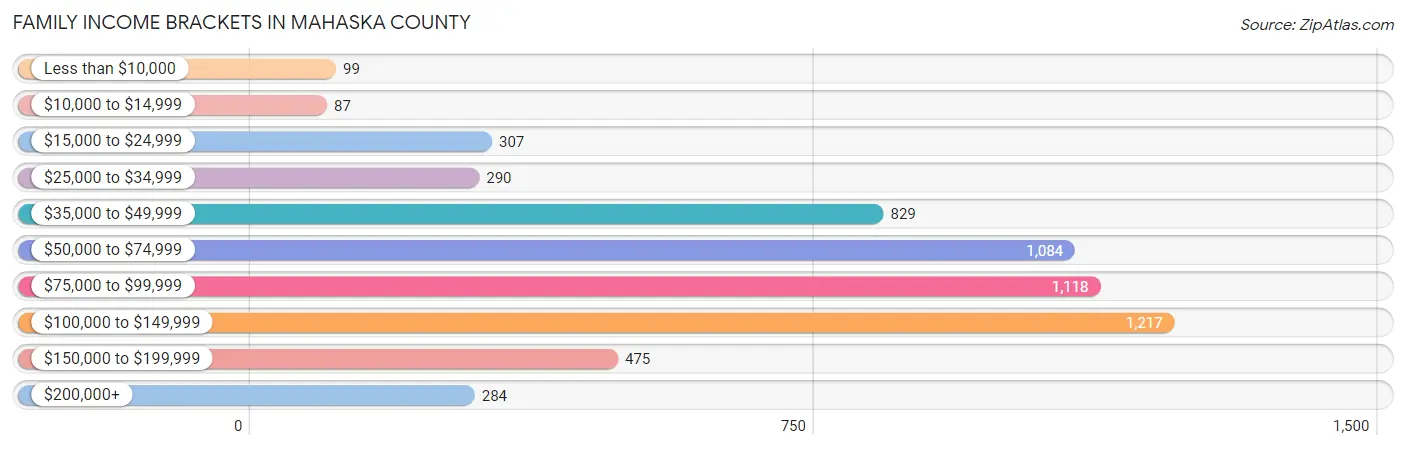
| Income Bracket | # Families | % Families |
| Less than $10,000 | 99 | 1.7% |
| $10,000 to $14,999 | 87 | 1.5% |
| $15,000 to $24,999 | 307 | 5.3% |
| $25,000 to $34,999 | 290 | 5.0% |
| $35,000 to $49,999 | 829 | 14.3% |
| $50,000 to $74,999 | 1,084 | 18.7% |
| $75,000 to $99,999 | 1,118 | 19.3% |
| $100,000 to $149,999 | 1,217 | 21.0% |
| $150,000 to $199,999 | 475 | 8.2% |
| $200,000+ | 284 | 4.9% |
Family Income by Famaliy Size in Mahaska County
7+ person families (91 | 1.6%) account for the highest median family income in Mahaska County with $144,205 per family, while 2-person families (2,899 | 50.0%) have the highest median income of $37,578 per family member.
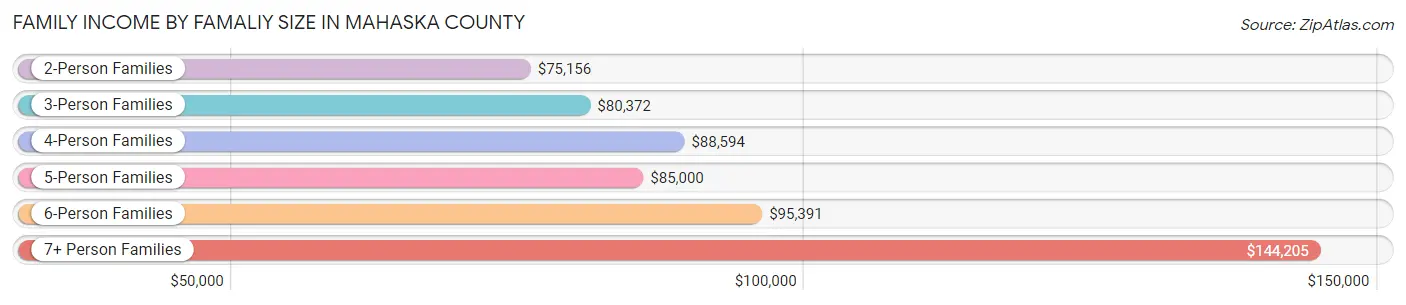
| Income Bracket | # Families | Median Income |
| 2-Person Families | 2,899 (50.0%) | $75,156 |
| 3-Person Families | 1,209 (20.9%) | $80,372 |
| 4-Person Families | 959 (16.6%) | $88,594 |
| 5-Person Families | 430 (7.4%) | $85,000 |
| 6-Person Families | 207 (3.6%) | $95,391 |
| 7+ Person Families | 91 (1.6%) | $144,205 |
| Total | 5,795 (100.0%) | $81,257 |
Family Income by Number of Earners in Mahaska County
The median family income in Mahaska County is $81,257, with families comprising 3+ earners (719) having the highest median family income of $132,909, while families with no earners (756) have the lowest median family income of $48,472, accounting for 12.4% and 13.1% of families, respectively.
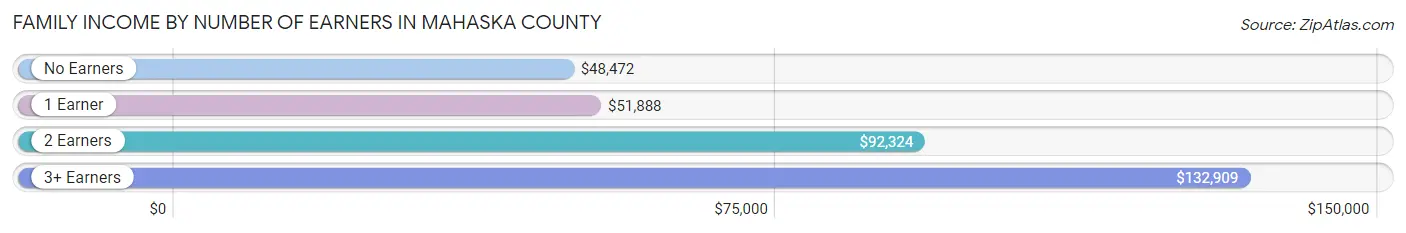
| Number of Earners | # Families | Median Income |
| No Earners | 756 (13.1%) | $48,472 |
| 1 Earner | 1,792 (30.9%) | $51,888 |
| 2 Earners | 2,528 (43.6%) | $92,324 |
| 3+ Earners | 719 (12.4%) | $132,909 |
| Total | 5,795 (100.0%) | $81,257 |
Household Income in Mahaska County
Household Income Brackets in Mahaska County
With 1,801 households falling in the category, the $50,000 to $74,999 income range is the most frequent in Mahaska County, accounting for 20.3% of all households. In contrast, only 302 households (3.4%) fall into the $200,000+ income bracket, making it the least populous group.
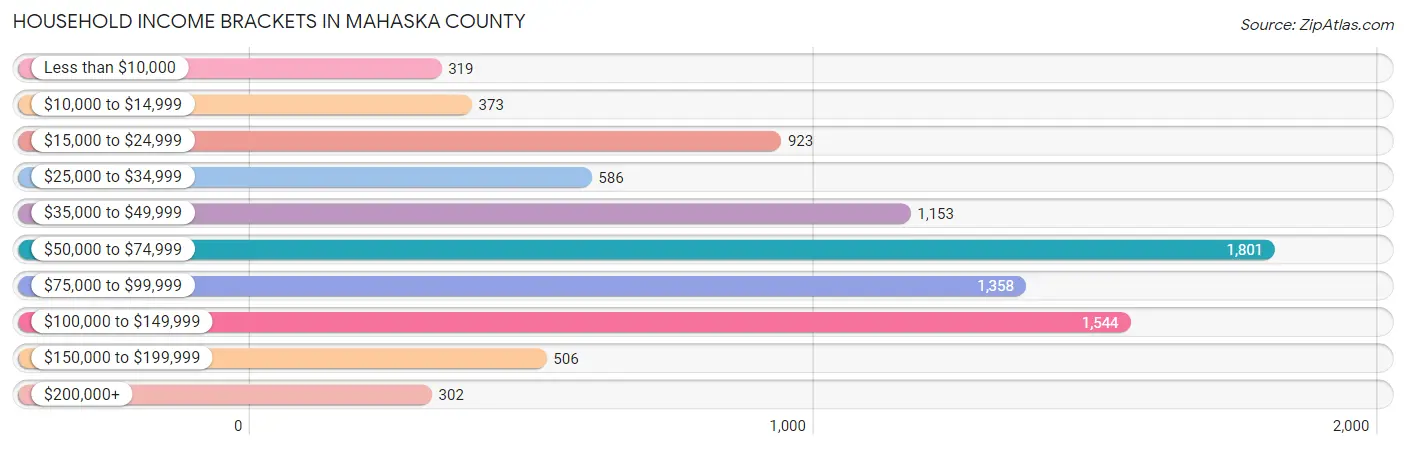
| Income Bracket | # Households | % Households |
| Less than $10,000 | 319 | 3.6% |
| $10,000 to $14,999 | 373 | 4.2% |
| $15,000 to $24,999 | 923 | 10.4% |
| $25,000 to $34,999 | 586 | 6.6% |
| $35,000 to $49,999 | 1,153 | 13.0% |
| $50,000 to $74,999 | 1,801 | 20.3% |
| $75,000 to $99,999 | 1,358 | 15.3% |
| $100,000 to $149,999 | 1,544 | 17.4% |
| $150,000 to $199,999 | 506 | 5.7% |
| $200,000+ | 302 | 3.4% |
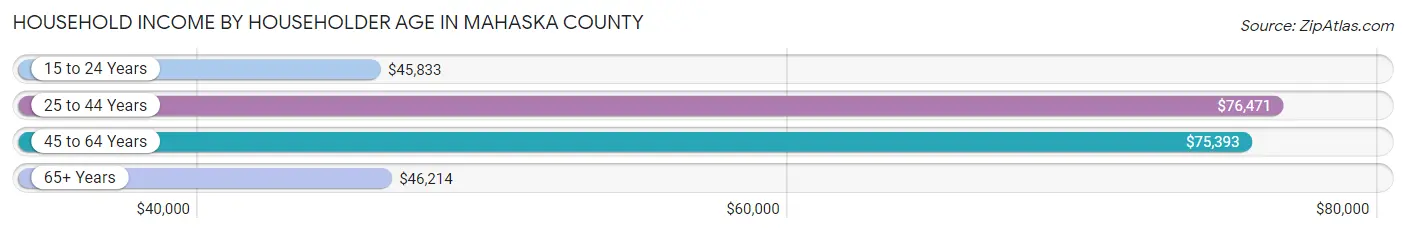
Household Income by Householder Age in Mahaska County
The median household income in Mahaska County is $65,200, with the highest median household income of $76,471 found in the 25 to 44 years age bracket for the primary householder. A total of 2,702 households (30.4%) fall into this category. Meanwhile, the 15 to 24 years age bracket for the primary householder has the lowest median household income of $45,833, with 598 households (6.7%) in this group.
| Income Bracket | # Households | Median Income |
| 15 to 24 Years | 598 (6.7%) | $45,833 |
| 25 to 44 Years | 2,702 (30.4%) | $76,471 |
| 45 to 64 Years | 3,021 (34.1%) | $75,393 |
| 65+ Years | 2,552 (28.8%) | $46,214 |
| Total | 8,873 (100.0%) | $65,200 |
Poverty in Mahaska County
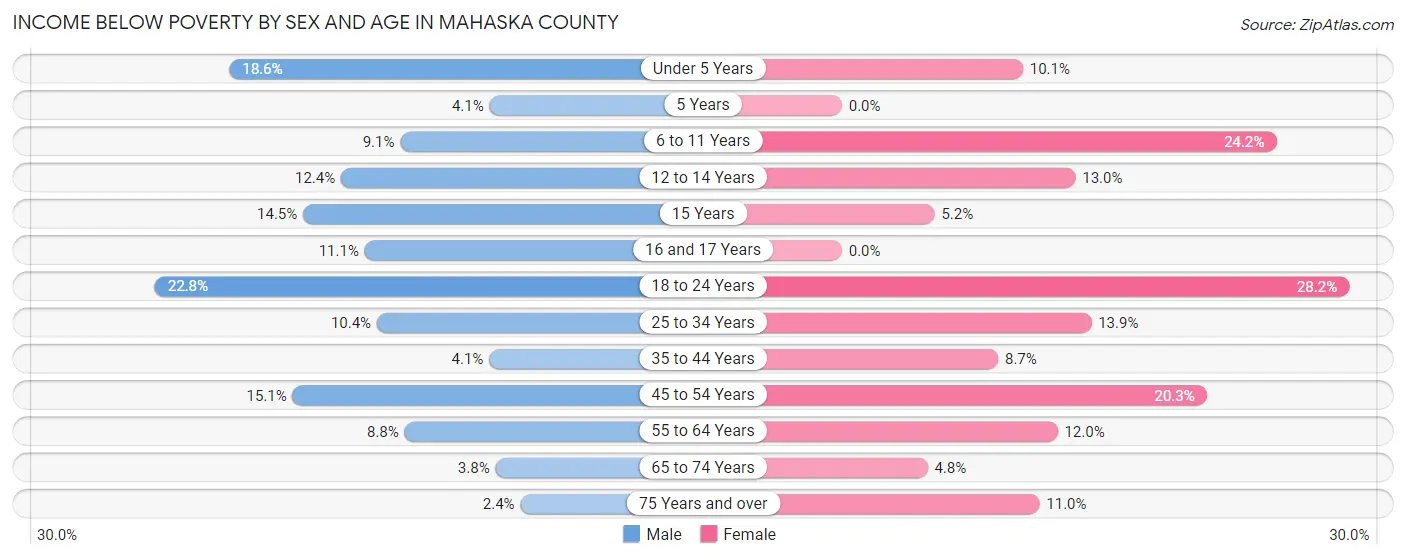
Income Below Poverty by Sex and Age in Mahaska County
With 10.3% poverty level for males and 13.7% for females among the residents of Mahaska County, 18 to 24 year old males and 18 to 24 year old females are the most vulnerable to poverty, with 215 males (22.8%) and 233 females (28.2%) in their respective age groups living below the poverty level.
| Age Bracket | Male | Female |
| Under 5 Years | 128 (18.6%) | 65 (10.1%) |
| 5 Years | 6 (4.1%) | 0 (0.0%) |
| 6 to 11 Years | 79 (9.1%) | 209 (24.2%) |
| 12 to 14 Years | 65 (12.4%) | 58 (13.0%) |
| 15 Years | 10 (14.5%) | 8 (5.2%) |
| 16 and 17 Years | 44 (11.1%) | 0 (0.0%) |
| 18 to 24 Years | 215 (22.8%) | 233 (28.2%) |
| 25 to 34 Years | 128 (10.4%) | 171 (13.9%) |
| 35 to 44 Years | 55 (4.1%) | 108 (8.7%) |
| 45 to 54 Years | 192 (15.1%) | 250 (20.3%) |
| 55 to 64 Years | 136 (8.8%) | 170 (12.0%) |
| 65 to 74 Years | 44 (3.8%) | 55 (4.8%) |
| 75 Years and over | 15 (2.4%) | 108 (11.0%) |
| Total | 1,117 (10.3%) | 1,435 (13.7%) |
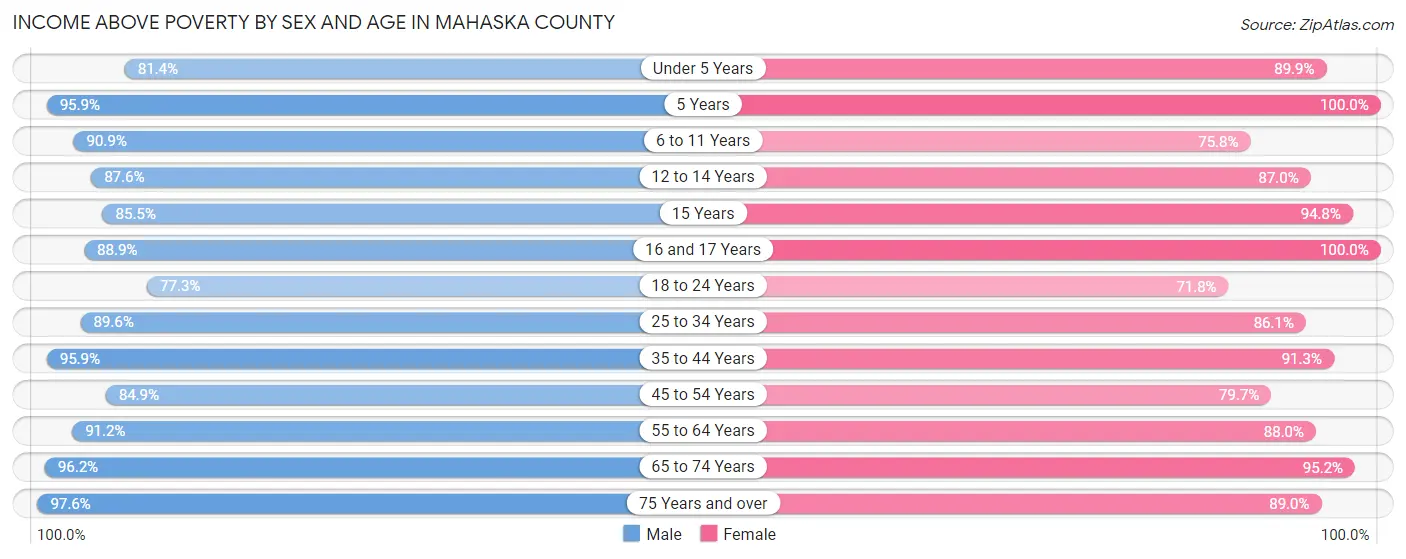
Income Above Poverty by Sex and Age in Mahaska County
According to the poverty statistics in Mahaska County, males aged 75 years and over and females aged 5 years are the age groups that are most secure financially, with 97.6% of males and 100.0% of females in these age groups living above the poverty line.
| Age Bracket | Male | Female |
| Under 5 Years | 560 (81.4%) | 580 (89.9%) |
| 5 Years | 140 (95.9%) | 83 (100.0%) |
| 6 to 11 Years | 791 (90.9%) | 655 (75.8%) |
| 12 to 14 Years | 460 (87.6%) | 388 (87.0%) |
| 15 Years | 59 (85.5%) | 147 (94.8%) |
| 16 and 17 Years | 354 (88.9%) | 239 (100.0%) |
| 18 to 24 Years | 730 (77.2%) | 592 (71.8%) |
| 25 to 34 Years | 1,105 (89.6%) | 1,060 (86.1%) |
| 35 to 44 Years | 1,276 (95.9%) | 1,133 (91.3%) |
| 45 to 54 Years | 1,081 (84.9%) | 981 (79.7%) |
| 55 to 64 Years | 1,402 (91.2%) | 1,246 (88.0%) |
| 65 to 74 Years | 1,121 (96.2%) | 1,099 (95.2%) |
| 75 Years and over | 612 (97.6%) | 874 (89.0%) |
| Total | 9,691 (89.7%) | 9,077 (86.4%) |
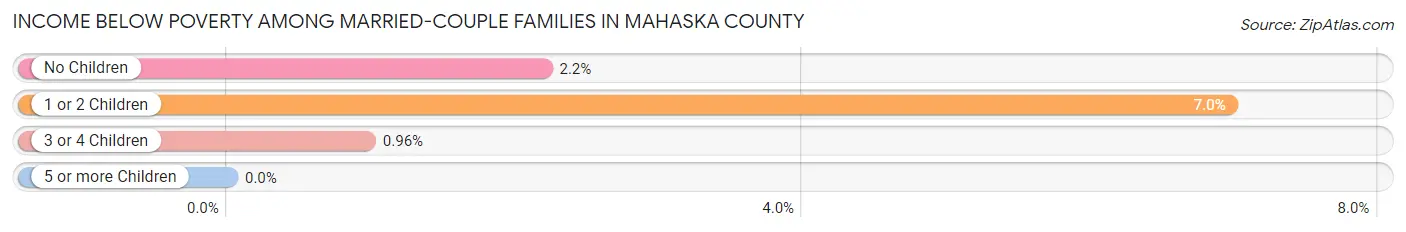
Income Below Poverty Among Married-Couple Families in Mahaska County
The poverty statistics for married-couple families in Mahaska County show that 3.2% or 146 of the total 4,505 families live below the poverty line. Families with 1 or 2 children have the highest poverty rate of 7.0%, comprising of 80 families. On the other hand, families with 5 or more children have the lowest poverty rate of 0.0%, which includes 0 families.
| Children | Above Poverty | Below Poverty |
| No Children | 2,723 (97.8%) | 61 (2.2%) |
| 1 or 2 Children | 1,070 (93.0%) | 80 (7.0%) |
| 3 or 4 Children | 517 (99.0%) | 5 (1.0%) |
| 5 or more Children | 49 (100.0%) | 0 (0.0%) |
| Total | 4,359 (96.8%) | 146 (3.2%) |
Income Below Poverty Among Single-Parent Households in Mahaska County
According to the poverty data in Mahaska County, 12.4% or 45 single-father households and 24.8% or 230 single-mother households are living below the poverty line. Among single-father households, those with 3 or 4 children have the highest poverty rate, with 33 households (41.2%) experiencing poverty. Likewise, among single-mother households, those with 5 or more children have the highest poverty rate, with 27 households (84.4%) falling below the poverty line.
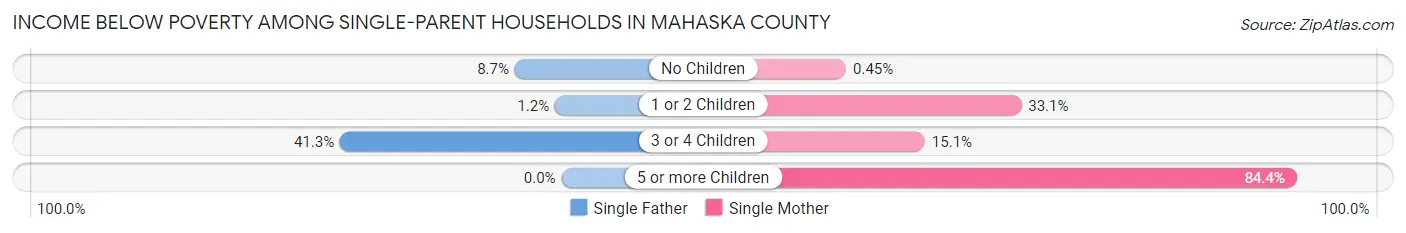
| Children | Single Father | Single Mother |
| No Children | 10 (8.7%) | 1 (0.4%) |
| 1 or 2 Children | 2 (1.2%) | 184 (33.1%) |
| 3 or 4 Children | 33 (41.2%) | 18 (15.1%) |
| 5 or more Children | 0 (0.0%) | 27 (84.4%) |
| Total | 45 (12.4%) | 230 (24.8%) |
Income Below Poverty Among Married-Couple vs Single-Parent Households in Mahaska County
The poverty data for Mahaska County shows that 146 of the married-couple family households (3.2%) and 275 of the single-parent households (21.3%) are living below the poverty level. Within the married-couple family households, those with 1 or 2 children have the highest poverty rate, with 80 households (7.0%) falling below the poverty line. Among the single-parent households, those with 5 or more children have the highest poverty rate, with 27 household (84.4%) living below poverty.
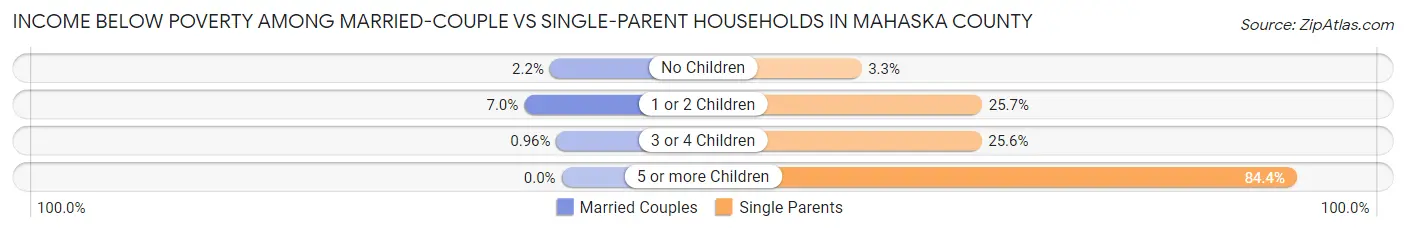
| Children | Married-Couple Families | Single-Parent Households |
| No Children | 61 (2.2%) | 11 (3.3%) |
| 1 or 2 Children | 80 (7.0%) | 186 (25.7%) |
| 3 or 4 Children | 5 (1.0%) | 51 (25.6%) |
| 5 or more Children | 0 (0.0%) | 27 (84.4%) |
| Total | 146 (3.2%) | 275 (21.3%) |
Race in Mahaska County
The most populous races in Mahaska County are White / Caucasian (20,657 | 93.6%), Two or more Races (672 | 3.0%), and Hispanic or Latino (533 | 2.4%).
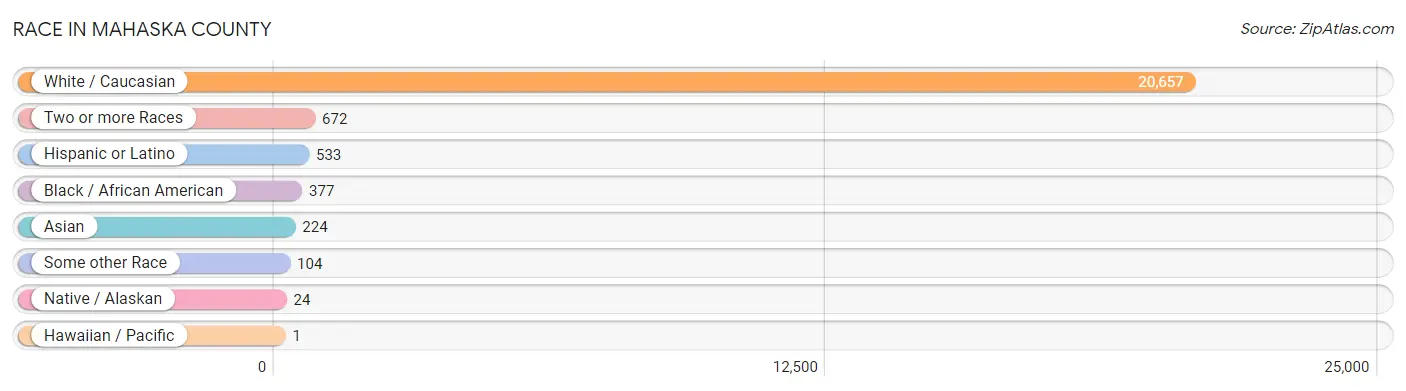
| Race | # Population | % Population |
| Asian | 224 | 1.0% |
| Black / African American | 377 | 1.7% |
| Hawaiian / Pacific | 1 | 0.0% |
| Hispanic or Latino | 533 | 2.4% |
| Native / Alaskan | 24 | 0.1% |
| White / Caucasian | 20,657 | 93.6% |
| Two or more Races | 672 | 3.0% |
| Some other Race | 104 | 0.5% |
| Total | 22,059 | 100.0% |
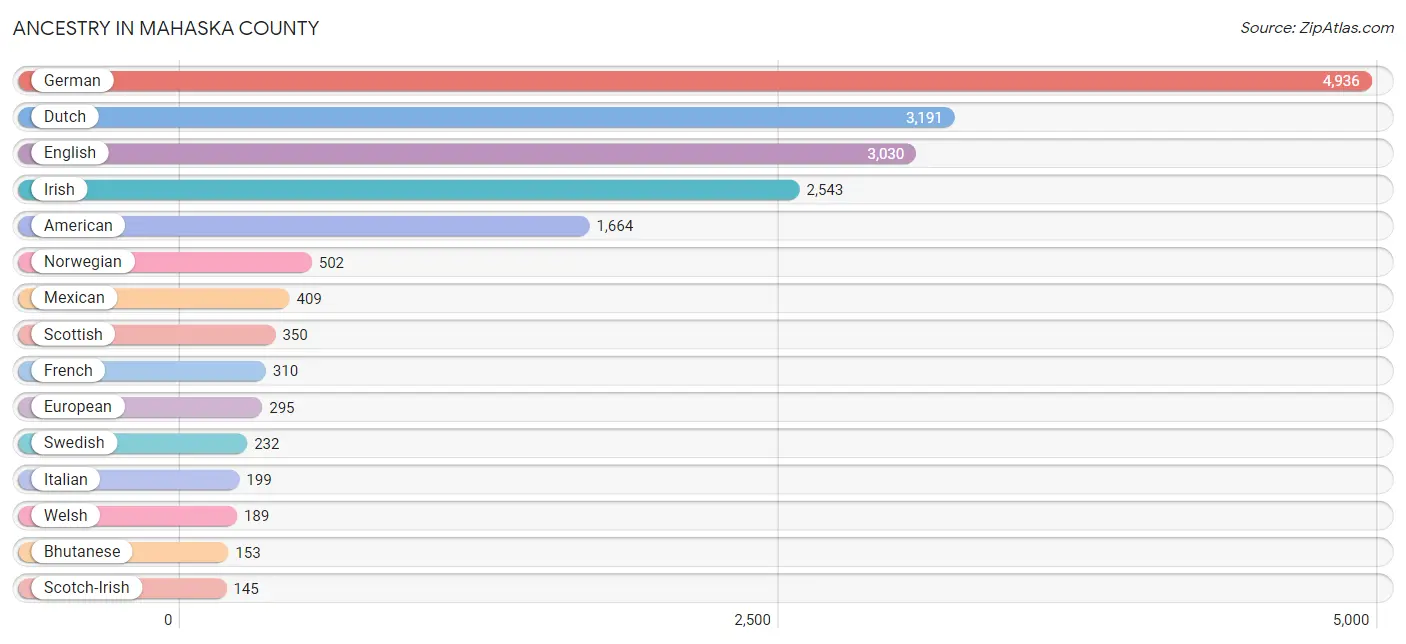
Ancestry in Mahaska County
The most populous ancestries reported in Mahaska County are German (4,936 | 22.4%), Dutch (3,191 | 14.5%), English (3,030 | 13.7%), Irish (2,543 | 11.5%), and American (1,664 | 7.5%), together accounting for 69.7% of all Mahaska County residents.
| Ancestry | # Population | % Population |
| African | 11 | 0.1% |
| American | 1,664 | 7.5% |
| Apache | 2 | 0.0% |
| Arab | 30 | 0.1% |
| Armenian | 1 | 0.0% |
| Austrian | 9 | 0.0% |
| Bahamian | 11 | 0.1% |
| Belgian | 23 | 0.1% |
| Bhutanese | 153 | 0.7% |
| Blackfeet | 4 | 0.0% |
| British | 23 | 0.1% |
| British West Indian | 5 | 0.0% |
| Bulgarian | 41 | 0.2% |
| Burmese | 67 | 0.3% |
| Canadian | 23 | 0.1% |
| Central American | 5 | 0.0% |
| Cherokee | 10 | 0.1% |
| Croatian | 13 | 0.1% |
| Cuban | 19 | 0.1% |
| Czech | 100 | 0.4% |
| Czechoslovakian | 41 | 0.2% |
| Danish | 83 | 0.4% |
| Dutch | 3,191 | 14.5% |
| Eastern European | 3 | 0.0% |
| English | 3,030 | 13.7% |
| European | 295 | 1.3% |
| Fijian | 1 | 0.0% |
| Finnish | 23 | 0.1% |
| French | 310 | 1.4% |
| German | 4,936 | 22.4% |
| Greek | 64 | 0.3% |
| Guamanian / Chamorro | 1 | 0.0% |
| Guatemalan | 5 | 0.0% |
| Hopi | 1 | 0.0% |
| Hungarian | 84 | 0.4% |
| Indian (Asian) | 1 | 0.0% |
| Iranian | 25 | 0.1% |
| Irish | 2,543 | 11.5% |
| Italian | 199 | 0.9% |
| Jamaican | 58 | 0.3% |
| Japanese | 27 | 0.1% |
| Korean | 116 | 0.5% |
| Laotian | 5 | 0.0% |
| Lebanese | 11 | 0.1% |
| Luxembourger | 11 | 0.1% |
| Malaysian | 60 | 0.3% |
| Mexican | 409 | 1.8% |
| Moroccan | 4 | 0.0% |
| Native Hawaiian | 3 | 0.0% |
| Nigerian | 5 | 0.0% |
| Northern European | 64 | 0.3% |
| Norwegian | 502 | 2.3% |
| Pakistani | 18 | 0.1% |
| Pennsylvania German | 11 | 0.1% |
| Polish | 132 | 0.6% |
| Portuguese | 20 | 0.1% |
| Puerto Rican | 38 | 0.2% |
| Romanian | 4 | 0.0% |
| Russian | 18 | 0.1% |
| Scandinavian | 15 | 0.1% |
| Scotch-Irish | 145 | 0.7% |
| Scottish | 350 | 1.6% |
| Seminole | 35 | 0.2% |
| Serbian | 8 | 0.0% |
| Sioux | 9 | 0.0% |
| Slavic | 10 | 0.1% |
| Slovak | 30 | 0.1% |
| Somali | 1 | 0.0% |
| Spaniard | 56 | 0.3% |
| Spanish American Indian | 11 | 0.1% |
| Subsaharan African | 29 | 0.1% |
| Swedish | 232 | 1.1% |
| Swiss | 26 | 0.1% |
| Syrian | 15 | 0.1% |
| Ukrainian | 33 | 0.2% |
| Welsh | 189 | 0.9% | View All 76 Rows |
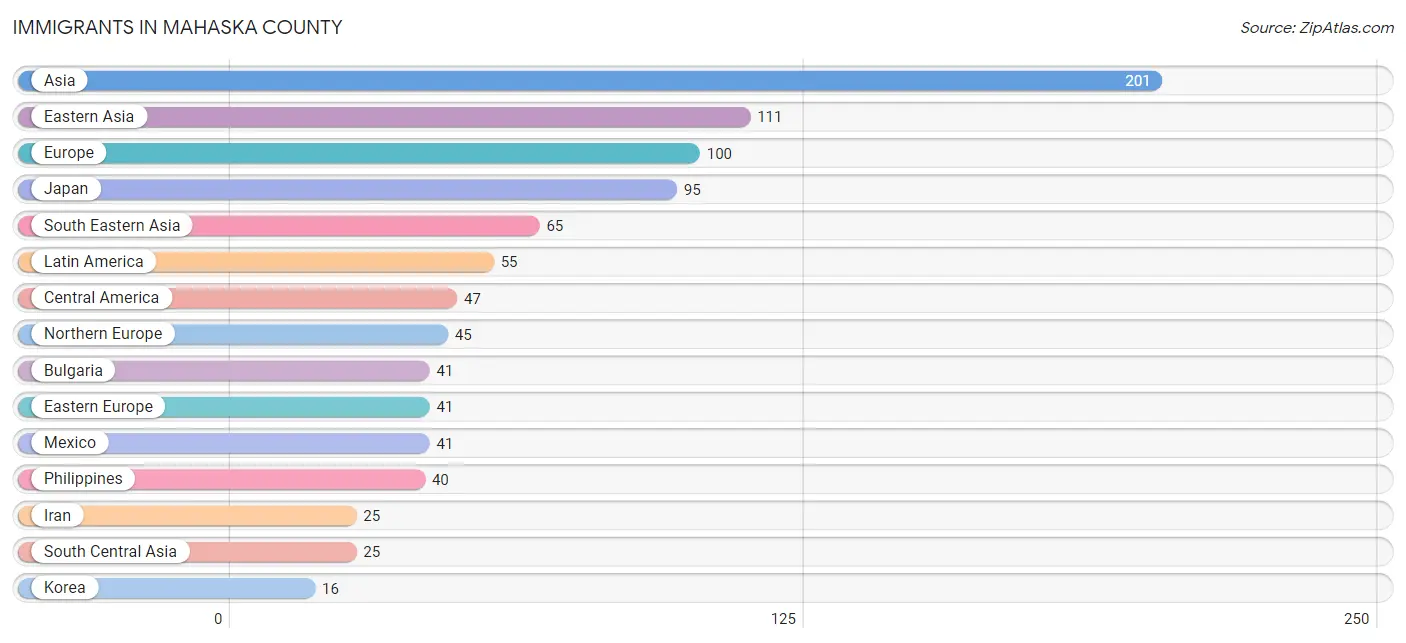
Immigrants in Mahaska County
The most numerous immigrant groups reported in Mahaska County came from Asia (201 | 0.9%), Eastern Asia (111 | 0.5%), Europe (100 | 0.4%), Japan (95 | 0.4%), and South Eastern Asia (65 | 0.3%), together accounting for 2.6% of all Mahaska County residents.
| Immigration Origin | # Population | % Population |
| Africa | 13 | 0.1% |
| Asia | 201 | 0.9% |
| Bulgaria | 41 | 0.2% |
| Cameroon | 12 | 0.1% |
| Canada | 1 | 0.0% |
| Caribbean | 4 | 0.0% |
| Central America | 47 | 0.2% |
| Eastern Asia | 111 | 0.5% |
| Eastern Europe | 41 | 0.2% |
| El Salvador | 5 | 0.0% |
| Europe | 100 | 0.4% |
| Germany | 10 | 0.1% |
| Guatemala | 1 | 0.0% |
| Indonesia | 5 | 0.0% |
| Iran | 25 | 0.1% |
| Japan | 95 | 0.4% |
| Korea | 16 | 0.1% |
| Laos | 6 | 0.0% |
| Latin America | 55 | 0.3% |
| Mexico | 41 | 0.2% |
| Middle Africa | 12 | 0.1% |
| Netherlands | 4 | 0.0% |
| Northern Africa | 1 | 0.0% |
| Northern Europe | 45 | 0.2% |
| Philippines | 40 | 0.2% |
| South America | 4 | 0.0% |
| South Central Asia | 25 | 0.1% |
| South Eastern Asia | 65 | 0.3% |
| Sudan | 1 | 0.0% |
| Thailand | 10 | 0.1% |
| Venezuela | 4 | 0.0% |
| Western Europe | 14 | 0.1% | View All 32 Rows |
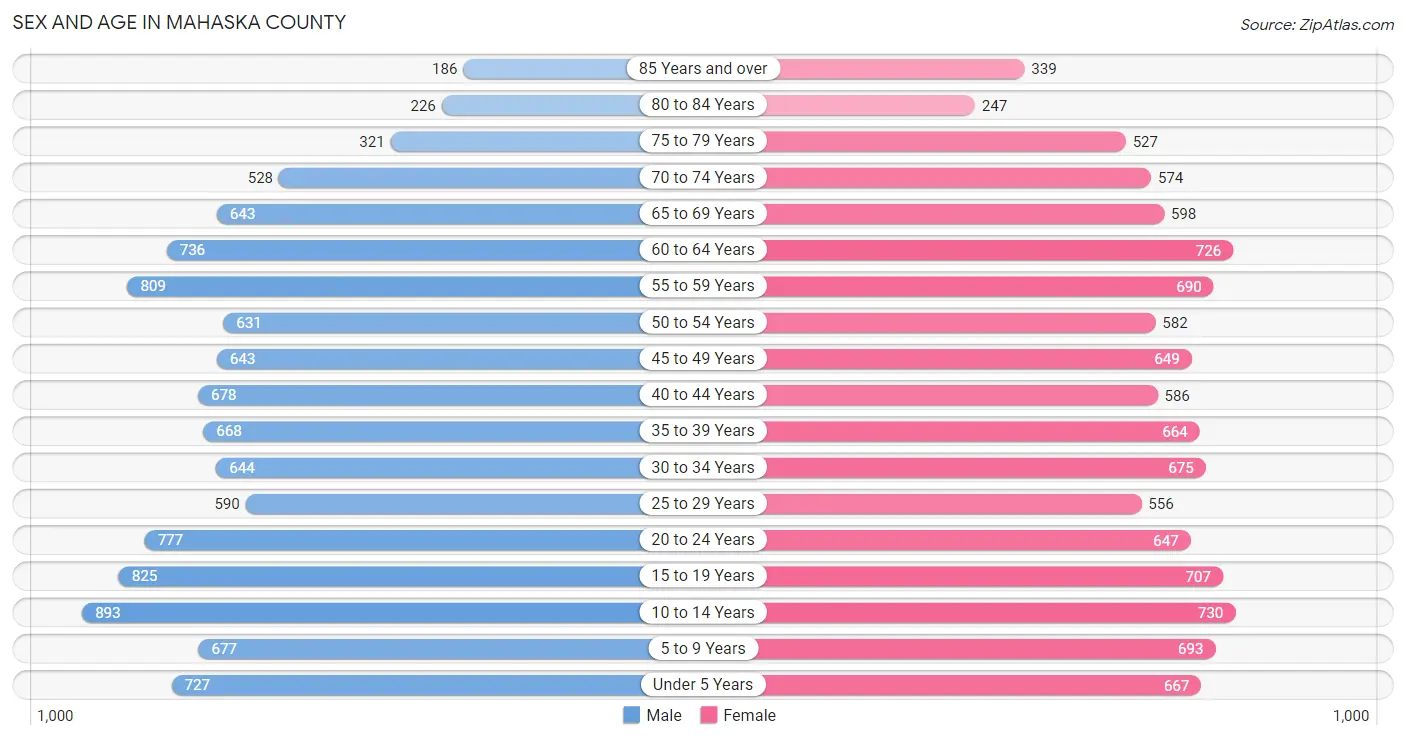
Sex and Age in Mahaska County
Sex and Age in Mahaska County
The most populous age groups in Mahaska County are 10 to 14 Years (893 | 8.0%) for men and 10 to 14 Years (730 | 6.7%) for women.
| Age Bracket | Male | Female |
| Under 5 Years | 727 (6.5%) | 667 (6.1%) |
| 5 to 9 Years | 677 (6.0%) | 693 (6.4%) |
| 10 to 14 Years | 893 (8.0%) | 730 (6.7%) |
| 15 to 19 Years | 825 (7.4%) | 707 (6.5%) |
| 20 to 24 Years | 777 (6.9%) | 647 (6.0%) |
| 25 to 29 Years | 590 (5.3%) | 556 (5.1%) |
| 30 to 34 Years | 644 (5.8%) | 675 (6.2%) |
| 35 to 39 Years | 668 (6.0%) | 664 (6.1%) |
| 40 to 44 Years | 678 (6.0%) | 586 (5.4%) |
| 45 to 49 Years | 643 (5.7%) | 649 (6.0%) |
| 50 to 54 Years | 631 (5.6%) | 582 (5.4%) |
| 55 to 59 Years | 809 (7.2%) | 690 (6.4%) |
| 60 to 64 Years | 736 (6.6%) | 726 (6.7%) |
| 65 to 69 Years | 643 (5.7%) | 598 (5.5%) |
| 70 to 74 Years | 528 (4.7%) | 574 (5.3%) |
| 75 to 79 Years | 321 (2.9%) | 527 (4.9%) |
| 80 to 84 Years | 226 (2.0%) | 247 (2.3%) |
| 85 Years and over | 186 (1.7%) | 339 (3.1%) |
| Total | 11,202 (100.0%) | 10,857 (100.0%) |
Families and Households in Mahaska County
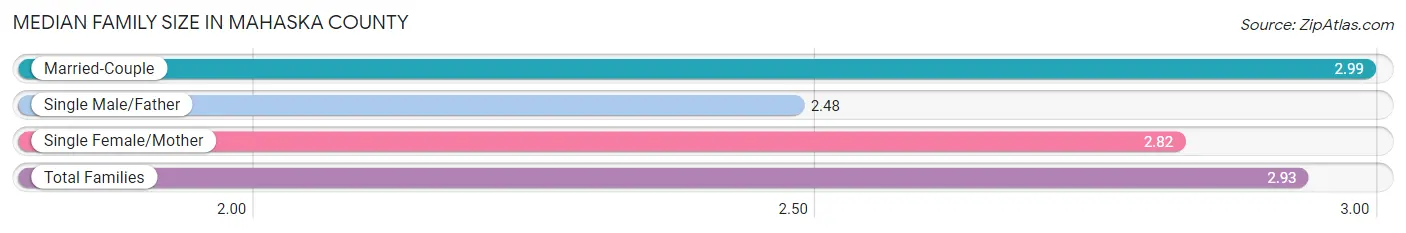
Median Family Size in Mahaska County
The median family size in Mahaska County is 2.93 persons per family, with married-couple families (4,505 | 77.7%) accounting for the largest median family size of 2.99 persons per family. On the other hand, single male/father families (362 | 6.2%) represent the smallest median family size with 2.48 persons per family.
| Family Type | # Families | Family Size |
| Married-Couple | 4,505 (77.7%) | 2.99 |
| Single Male/Father | 362 (6.2%) | 2.48 |
| Single Female/Mother | 928 (16.0%) | 2.82 |
| Total Families | 5,795 (100.0%) | 2.93 |
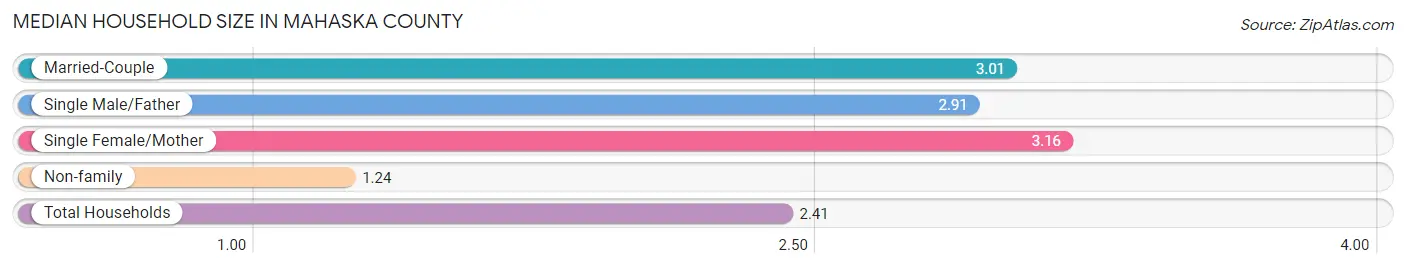
Median Household Size in Mahaska County
The median household size in Mahaska County is 2.41 persons per household, with single female/mother households (928 | 10.5%) accounting for the largest median household size of 3.16 persons per household. non-family households (3,078 | 34.7%) represent the smallest median household size with 1.24 persons per household.
| Household Type | # Households | Household Size |
| Married-Couple | 4,505 (50.8%) | 3.01 |
| Single Male/Father | 362 (4.1%) | 2.91 |
| Single Female/Mother | 928 (10.5%) | 3.16 |
| Non-family | 3,078 (34.7%) | 1.24 |
| Total Households | 8,873 (100.0%) | 2.41 |
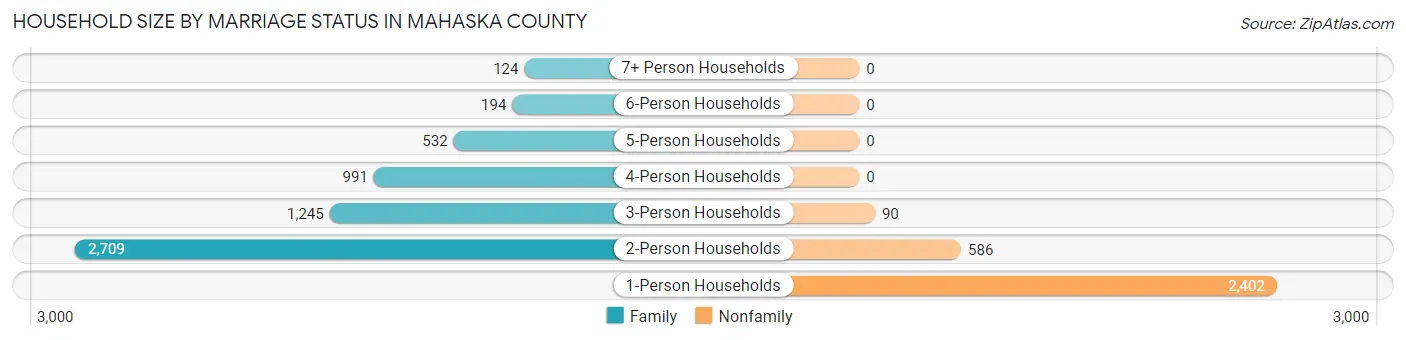
Household Size by Marriage Status in Mahaska County
Out of a total of 8,873 households in Mahaska County, 5,795 (65.3%) are family households, while 3,078 (34.7%) are nonfamily households. The most numerous type of family households are 2-person households, comprising 2,709, and the most common type of nonfamily households are 1-person households, comprising 2,402.
| Household Size | Family Households | Nonfamily Households |
| 1-Person Households | - | 2,402 (27.1%) |
| 2-Person Households | 2,709 (30.5%) | 586 (6.6%) |
| 3-Person Households | 1,245 (14.0%) | 90 (1.0%) |
| 4-Person Households | 991 (11.2%) | 0 (0.0%) |
| 5-Person Households | 532 (6.0%) | 0 (0.0%) |
| 6-Person Households | 194 (2.2%) | 0 (0.0%) |
| 7+ Person Households | 124 (1.4%) | 0 (0.0%) |
| Total | 5,795 (65.3%) | 3,078 (34.7%) |
Female Fertility in Mahaska County
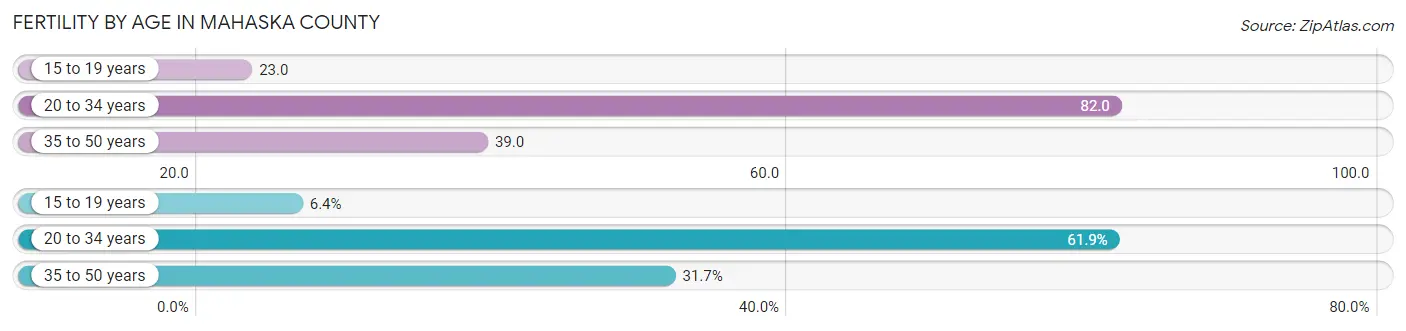
Fertility by Age in Mahaska County
Average fertility rate in Mahaska County is 54.0 births per 1,000 women. Women in the age bracket of 20 to 34 years have the highest fertility rate with 82.0 births per 1,000 women. Women in the age bracket of 20 to 34 years acount for 61.9% of all women with births.
| Age Bracket | Women with Births | Births / 1,000 Women |
| 15 to 19 years | 16 (6.4%) | 23.0 |
| 20 to 34 years | 154 (61.9%) | 82.0 |
| 35 to 50 years | 79 (31.7%) | 39.0 |
| Total | 249 (100.0%) | 54.0 |
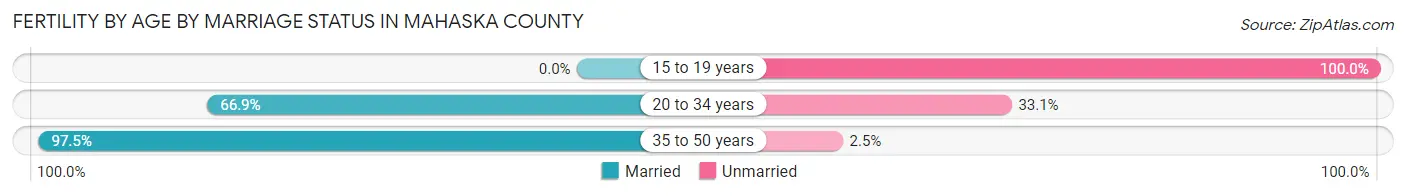
Fertility by Age by Marriage Status in Mahaska County
72.3% of women with births (249) in Mahaska County are married. The highest percentage of unmarried women with births falls into 15 to 19 years age bracket with 100.0% of them unmarried at the time of birth, while the lowest percentage of unmarried women with births belong to 35 to 50 years age bracket with 2.5% of them unmarried.
| Age Bracket | Married | Unmarried |
| 15 to 19 years | 0 (0.0%) | 16 (100.0%) |
| 20 to 34 years | 103 (66.9%) | 51 (33.1%) |
| 35 to 50 years | 77 (97.5%) | 2 (2.5%) |
| Total | 180 (72.3%) | 69 (27.7%) |
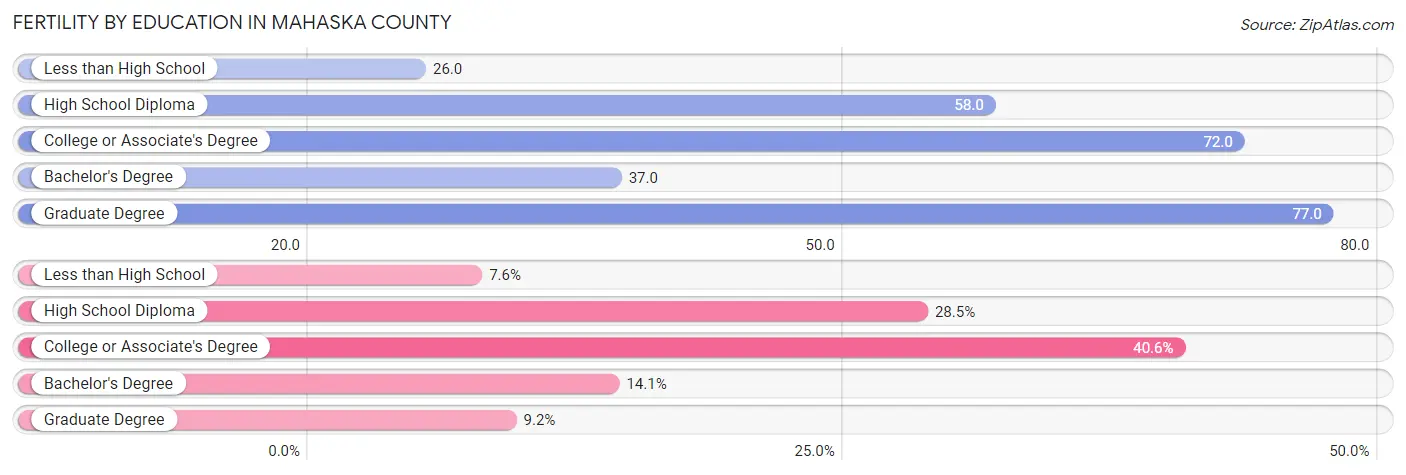
Fertility by Education in Mahaska County
Average fertility rate in Mahaska County is 54.0 births per 1,000 women. Women with the education attainment of graduate degree have the highest fertility rate of 77.0 births per 1,000 women, while women with the education attainment of less than high school have the lowest fertility at 26.0 births per 1,000 women. Women with the education attainment of college or associate's degree represent 40.6% of all women with births.
| Educational Attainment | Women with Births | Births / 1,000 Women |
| Less than High School | 19 (7.6%) | 26.0 |
| High School Diploma | 71 (28.5%) | 58.0 |
| College or Associate's Degree | 101 (40.6%) | 72.0 |
| Bachelor's Degree | 35 (14.1%) | 37.0 |
| Graduate Degree | 23 (9.2%) | 77.0 |
| Total | 249 (100.0%) | 54.0 |
Fertility by Education by Marriage Status in Mahaska County
27.7% of women with births in Mahaska County are unmarried. Women with the educational attainment of bachelor's degree are most likely to be married with 100.0% of them married at childbirth, while women with the educational attainment of less than high school are least likely to be married with 89.5% of them unmarried at childbirth.
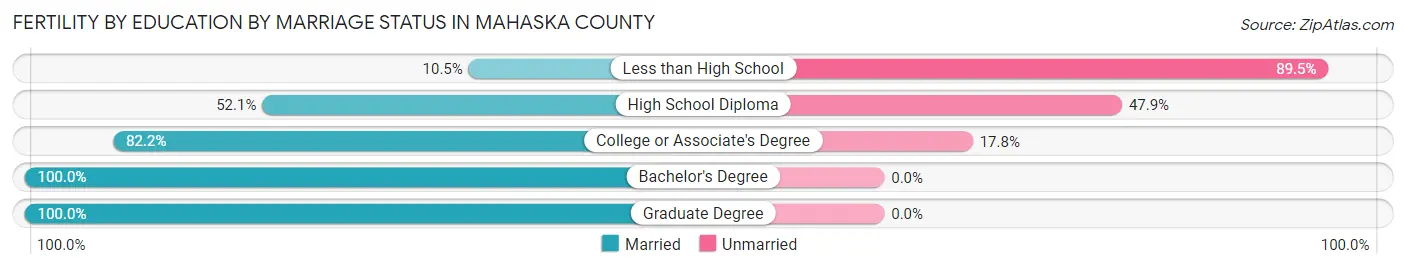
| Educational Attainment | Married | Unmarried |
| Less than High School | 2 (10.5%) | 17 (89.5%) |
| High School Diploma | 37 (52.1%) | 34 (47.9%) |
| College or Associate's Degree | 83 (82.2%) | 18 (17.8%) |
| Bachelor's Degree | 35 (100.0%) | 0 (0.0%) |
| Graduate Degree | 23 (100.0%) | 0 (0.0%) |
| Total | 180 (72.3%) | 69 (27.7%) |
Employment Characteristics in Mahaska County
Employment by Class of Employer in Mahaska County
Among the 11,000 employed individuals in Mahaska County, private company employees (7,481 | 68.0%), self-employed (not incorporated) (1,023 | 9.3%), and not-for-profit organizations (887 | 8.1%) make up the most common classes of employment.
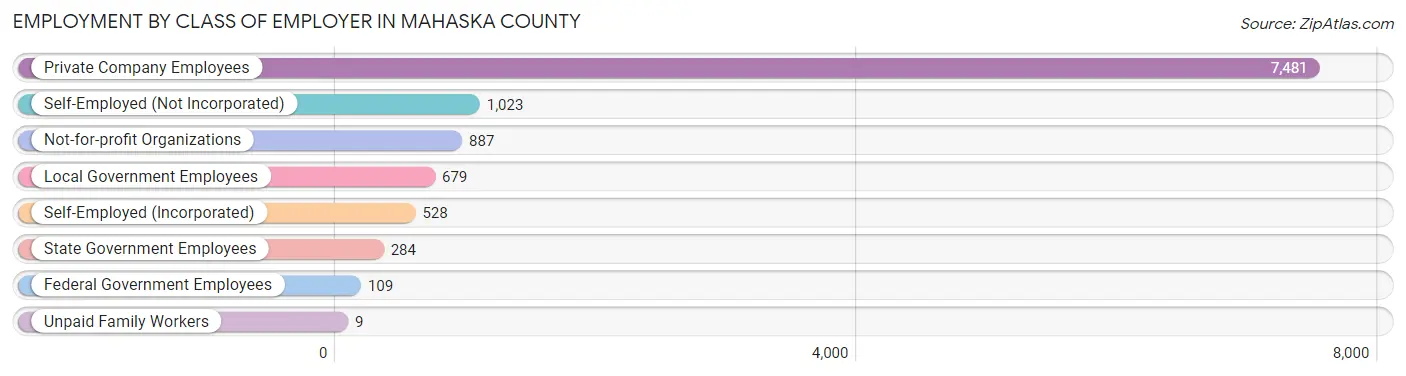
| Employer Class | # Employees | % Employees |
| Private Company Employees | 7,481 | 68.0% |
| Self-Employed (Incorporated) | 528 | 4.8% |
| Self-Employed (Not Incorporated) | 1,023 | 9.3% |
| Not-for-profit Organizations | 887 | 8.1% |
| Local Government Employees | 679 | 6.2% |
| State Government Employees | 284 | 2.6% |
| Federal Government Employees | 109 | 1.0% |
| Unpaid Family Workers | 9 | 0.1% |
| Total | 11,000 | 100.0% |
Employment Status by Age in Mahaska County
According to the labor force statistics for Mahaska County, out of the total population over 16 years of age (17,448), 65.8% or 11,481 individuals are in the labor force, with 3.3% or 379 of them unemployed. The age group with the highest labor force participation rate is 25 to 29 years, with 88.9% or 1,019 individuals in the labor force. Within the labor force, the 16 to 19 years age range has the highest percentage of unemployed individuals, with 14.3% or 99 of them being unemployed.
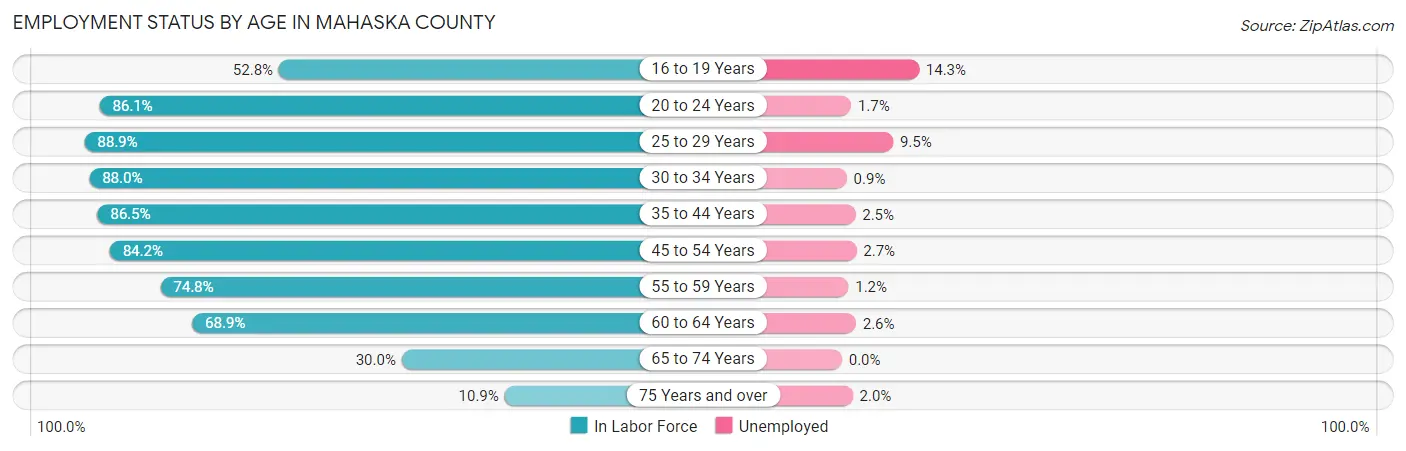
| Age Bracket | In Labor Force | Unemployed |
| 16 to 19 Years | 691 (52.8%) | 99 (14.3%) |
| 20 to 24 Years | 1,226 (86.1%) | 21 (1.7%) |
| 25 to 29 Years | 1,019 (88.9%) | 97 (9.5%) |
| 30 to 34 Years | 1,161 (88.0%) | 10 (0.9%) |
| 35 to 44 Years | 2,246 (86.5%) | 56 (2.5%) |
| 45 to 54 Years | 2,109 (84.2%) | 57 (2.7%) |
| 55 to 59 Years | 1,121 (74.8%) | 13 (1.2%) |
| 60 to 64 Years | 1,007 (68.9%) | 26 (2.6%) |
| 65 to 74 Years | 703 (30.0%) | 0 (0.0%) |
| 75 Years and over | 201 (10.9%) | 4 (2.0%) |
| Total | 11,481 (65.8%) | 379 (3.3%) |
Employment Status by Educational Attainment in Mahaska County
According to labor force statistics for Mahaska County, 82.3% of individuals (8,664) out of the total population between 25 and 64 years of age (10,527) are in the labor force, with 3.0% or 260 of them being unemployed. The group with the highest labor force participation rate are those with the educational attainment of bachelor's degree or higher, with 87.0% or 2,195 individuals in the labor force. Within the labor force, individuals with less than high school education have the highest percentage of unemployment, with 5.8% or 25 of them being unemployed.
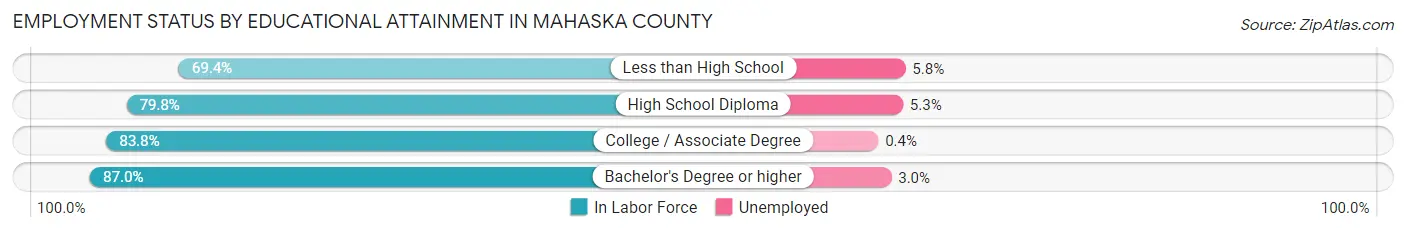
| Educational Attainment | In Labor Force | Unemployed |
| Less than High School | 429 (69.4%) | 36 (5.8%) |
| High School Diploma | 2,989 (79.8%) | 199 (5.3%) |
| College / Associate Degree | 3,050 (83.8%) | 15 (0.4%) |
| Bachelor's Degree or higher | 2,195 (87.0%) | 76 (3.0%) |
| Total | 8,664 (82.3%) | 316 (3.0%) |
Employment Occupations by Sex in Mahaska County
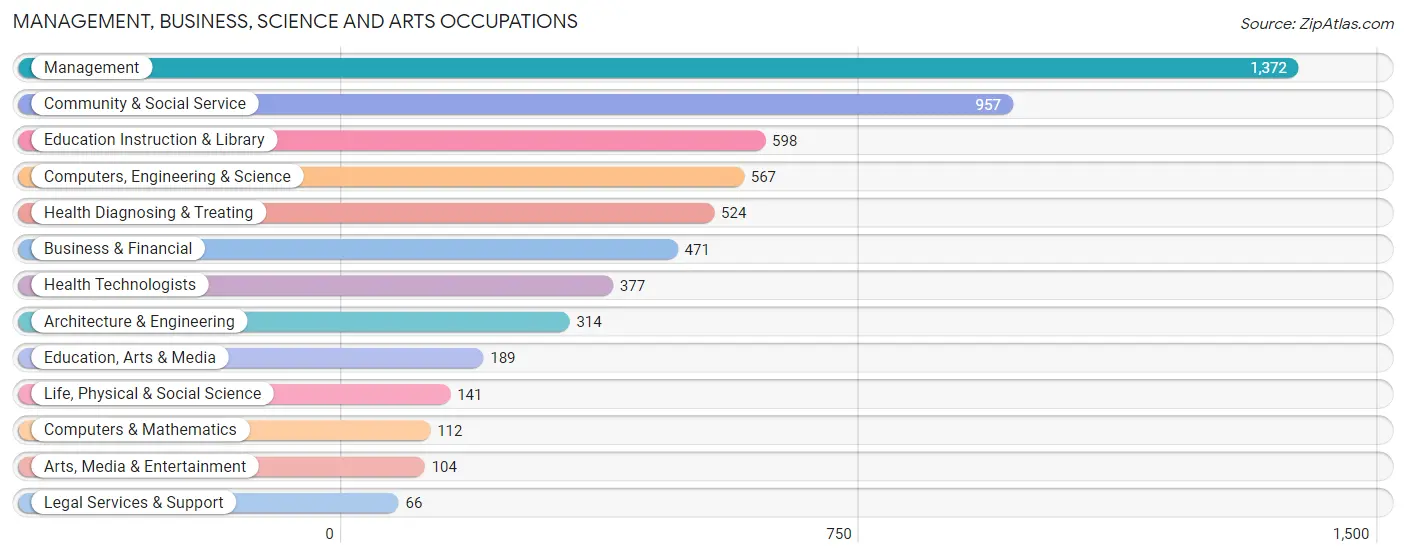
Management, Business, Science and Arts Occupations
The most common Management, Business, Science and Arts occupations in Mahaska County are Management (1,372 | 12.4%), Community & Social Service (957 | 8.6%), Education Instruction & Library (598 | 5.4%), Computers, Engineering & Science (567 | 5.1%), and Health Diagnosing & Treating (524 | 4.7%).
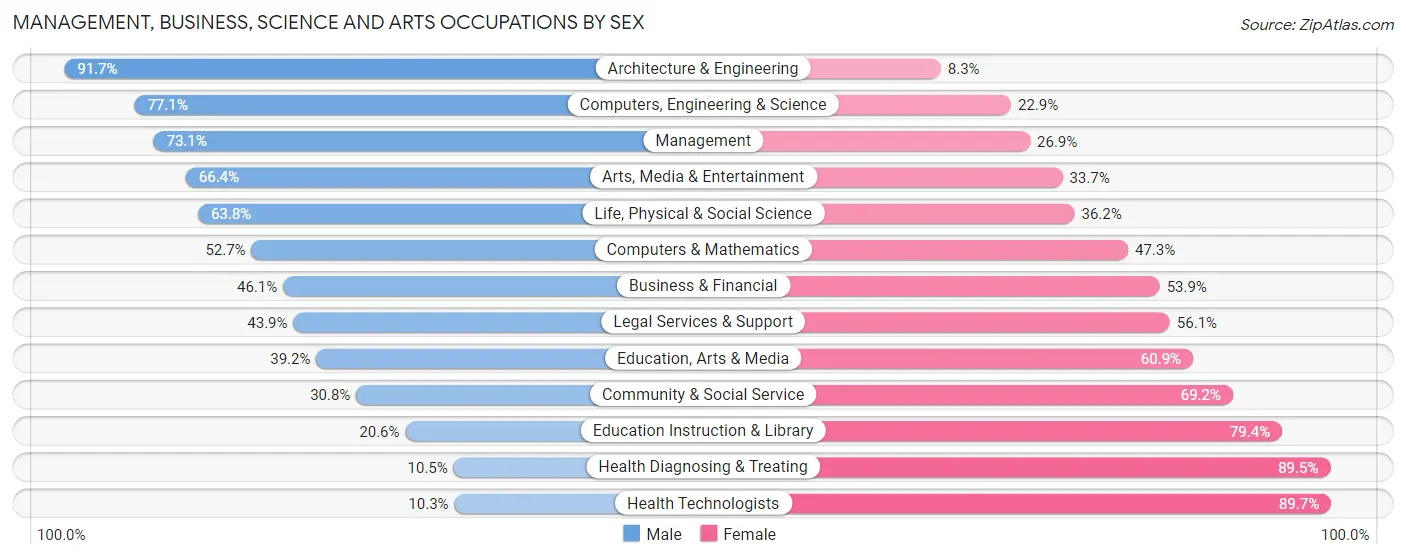
Management, Business, Science and Arts Occupations by Sex
Within the Management, Business, Science and Arts occupations in Mahaska County, the most male-oriented occupations are Architecture & Engineering (91.7%), Computers, Engineering & Science (77.1%), and Management (73.1%), while the most female-oriented occupations are Health Technologists (89.7%), Health Diagnosing & Treating (89.5%), and Education Instruction & Library (79.4%).
| Occupation | Male | Female |
| Management | 1,003 (73.1%) | 369 (26.9%) |
| Business & Financial | 217 (46.1%) | 254 (53.9%) |
| Computers, Engineering & Science | 437 (77.1%) | 130 (22.9%) |
| Computers & Mathematics | 59 (52.7%) | 53 (47.3%) |
| Architecture & Engineering | 288 (91.7%) | 26 (8.3%) |
| Life, Physical & Social Science | 90 (63.8%) | 51 (36.2%) |
| Community & Social Service | 295 (30.8%) | 662 (69.2%) |
| Education, Arts & Media | 74 (39.2%) | 115 (60.9%) |
| Legal Services & Support | 29 (43.9%) | 37 (56.1%) |
| Education Instruction & Library | 123 (20.6%) | 475 (79.4%) |
| Arts, Media & Entertainment | 69 (66.3%) | 35 (33.7%) |
| Health Diagnosing & Treating | 55 (10.5%) | 469 (89.5%) |
| Health Technologists | 39 (10.3%) | 338 (89.7%) |
| Total (Category) | 2,007 (51.6%) | 1,884 (48.4%) |
| Total (Overall) | 6,200 (55.8%) | 4,901 (44.2%) |
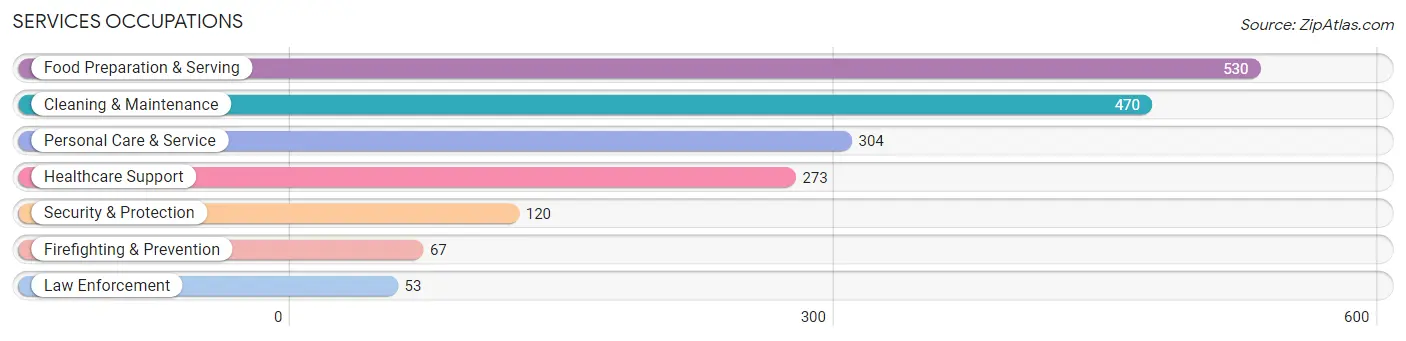
Services Occupations
The most common Services occupations in Mahaska County are Food Preparation & Serving (530 | 4.8%), Cleaning & Maintenance (470 | 4.2%), Personal Care & Service (304 | 2.7%), Healthcare Support (273 | 2.5%), and Security & Protection (120 | 1.1%).
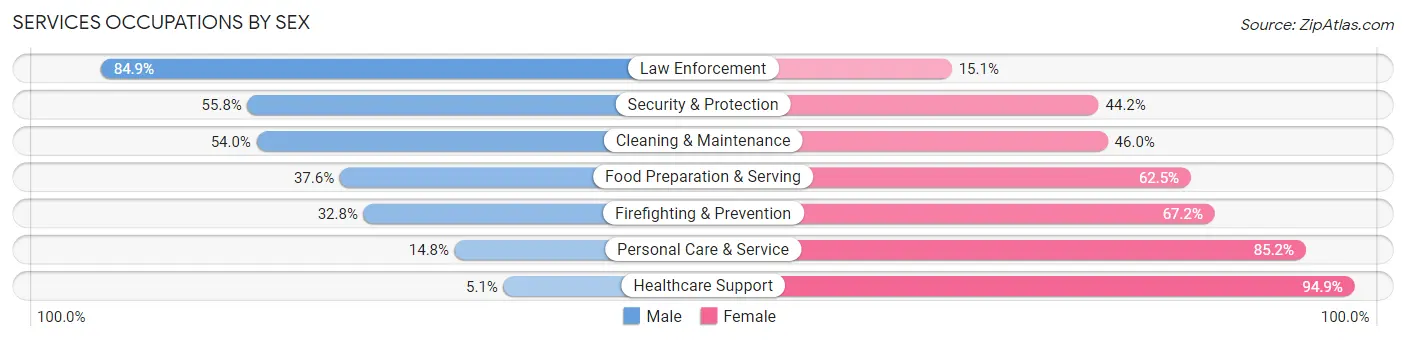
Services Occupations by Sex
Within the Services occupations in Mahaska County, the most male-oriented occupations are Law Enforcement (84.9%), Security & Protection (55.8%), and Cleaning & Maintenance (54.0%), while the most female-oriented occupations are Healthcare Support (94.9%), Personal Care & Service (85.2%), and Firefighting & Prevention (67.2%).
| Occupation | Male | Female |
| Healthcare Support | 14 (5.1%) | 259 (94.9%) |
| Security & Protection | 67 (55.8%) | 53 (44.2%) |
| Firefighting & Prevention | 22 (32.8%) | 45 (67.2%) |
| Law Enforcement | 45 (84.9%) | 8 (15.1%) |
| Food Preparation & Serving | 199 (37.6%) | 331 (62.5%) |
| Cleaning & Maintenance | 254 (54.0%) | 216 (46.0%) |
| Personal Care & Service | 45 (14.8%) | 259 (85.2%) |
| Total (Category) | 579 (34.1%) | 1,118 (65.9%) |
| Total (Overall) | 6,200 (55.8%) | 4,901 (44.2%) |
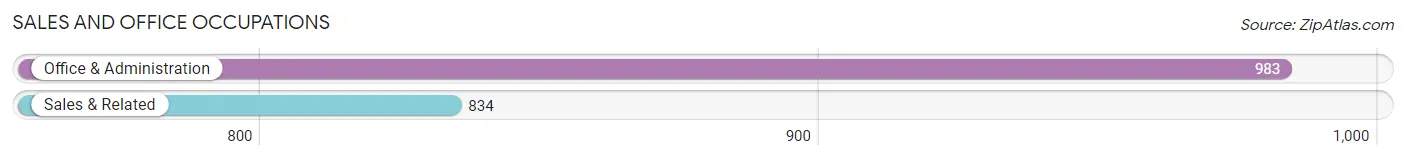
Sales and Office Occupations
The most common Sales and Office occupations in Mahaska County are Office & Administration (983 | 8.9%), and Sales & Related (834 | 7.5%).
Sales and Office Occupations by Sex
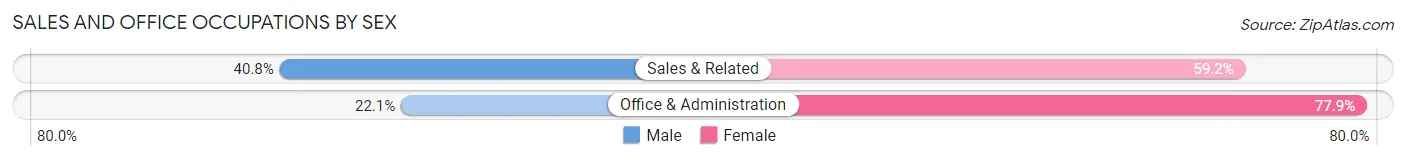
| Occupation | Male | Female |
| Sales & Related | 340 (40.8%) | 494 (59.2%) |
| Office & Administration | 217 (22.1%) | 766 (77.9%) |
| Total (Category) | 557 (30.6%) | 1,260 (69.4%) |
| Total (Overall) | 6,200 (55.8%) | 4,901 (44.2%) |
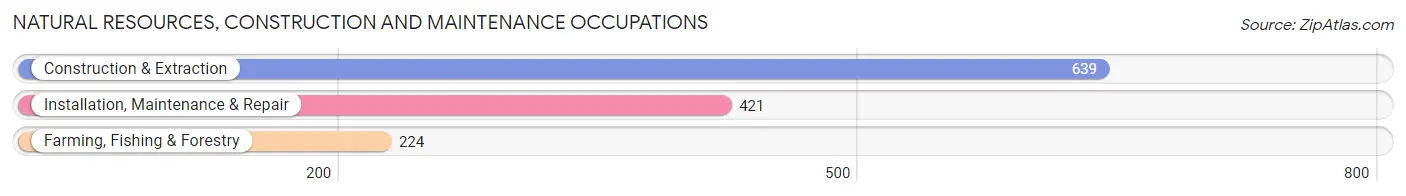
Natural Resources, Construction and Maintenance Occupations
The most common Natural Resources, Construction and Maintenance occupations in Mahaska County are Construction & Extraction (639 | 5.8%), Installation, Maintenance & Repair (421 | 3.8%), and Farming, Fishing & Forestry (224 | 2.0%).
Natural Resources, Construction and Maintenance Occupations by Sex
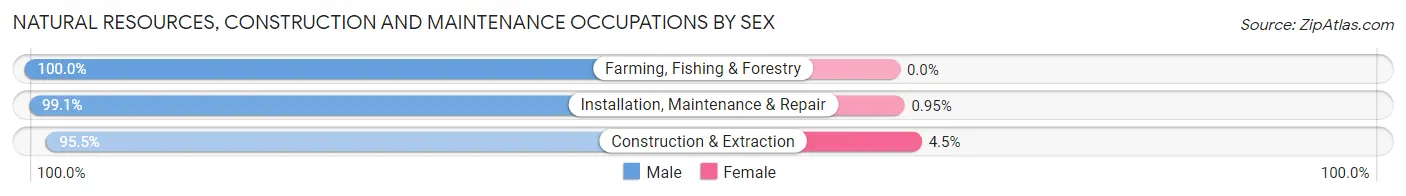
| Occupation | Male | Female |
| Farming, Fishing & Forestry | 224 (100.0%) | 0 (0.0%) |
| Construction & Extraction | 610 (95.5%) | 29 (4.5%) |
| Installation, Maintenance & Repair | 417 (99.1%) | 4 (0.9%) |
| Total (Category) | 1,251 (97.4%) | 33 (2.6%) |
| Total (Overall) | 6,200 (55.8%) | 4,901 (44.2%) |
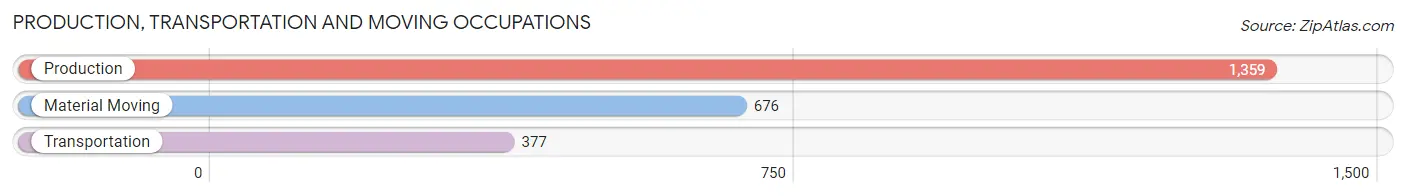
Production, Transportation and Moving Occupations
The most common Production, Transportation and Moving occupations in Mahaska County are Production (1,359 | 12.2%), Material Moving (676 | 6.1%), and Transportation (377 | 3.4%).
Production, Transportation and Moving Occupations by Sex
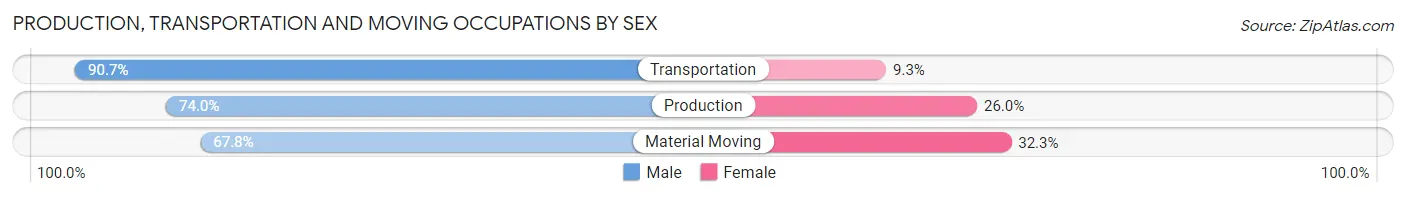
| Occupation | Male | Female |
| Production | 1,006 (74.0%) | 353 (26.0%) |
| Transportation | 342 (90.7%) | 35 (9.3%) |
| Material Moving | 458 (67.7%) | 218 (32.3%) |
| Total (Category) | 1,806 (74.9%) | 606 (25.1%) |
| Total (Overall) | 6,200 (55.8%) | 4,901 (44.2%) |
Employment Industries by Sex in Mahaska County
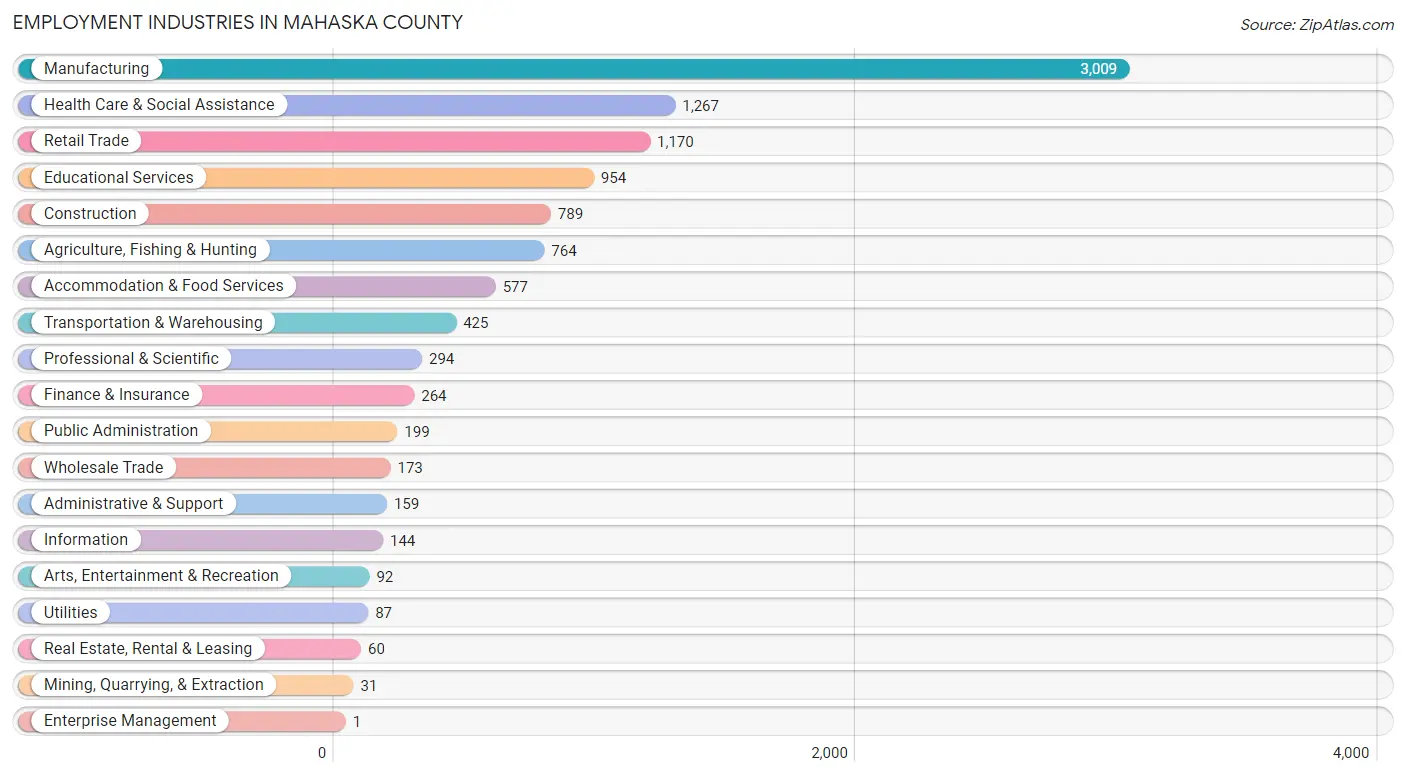
Employment Industries in Mahaska County
The major employment industries in Mahaska County include Manufacturing (3,009 | 27.1%), Health Care & Social Assistance (1,267 | 11.4%), Retail Trade (1,170 | 10.5%), Educational Services (954 | 8.6%), and Construction (789 | 7.1%).
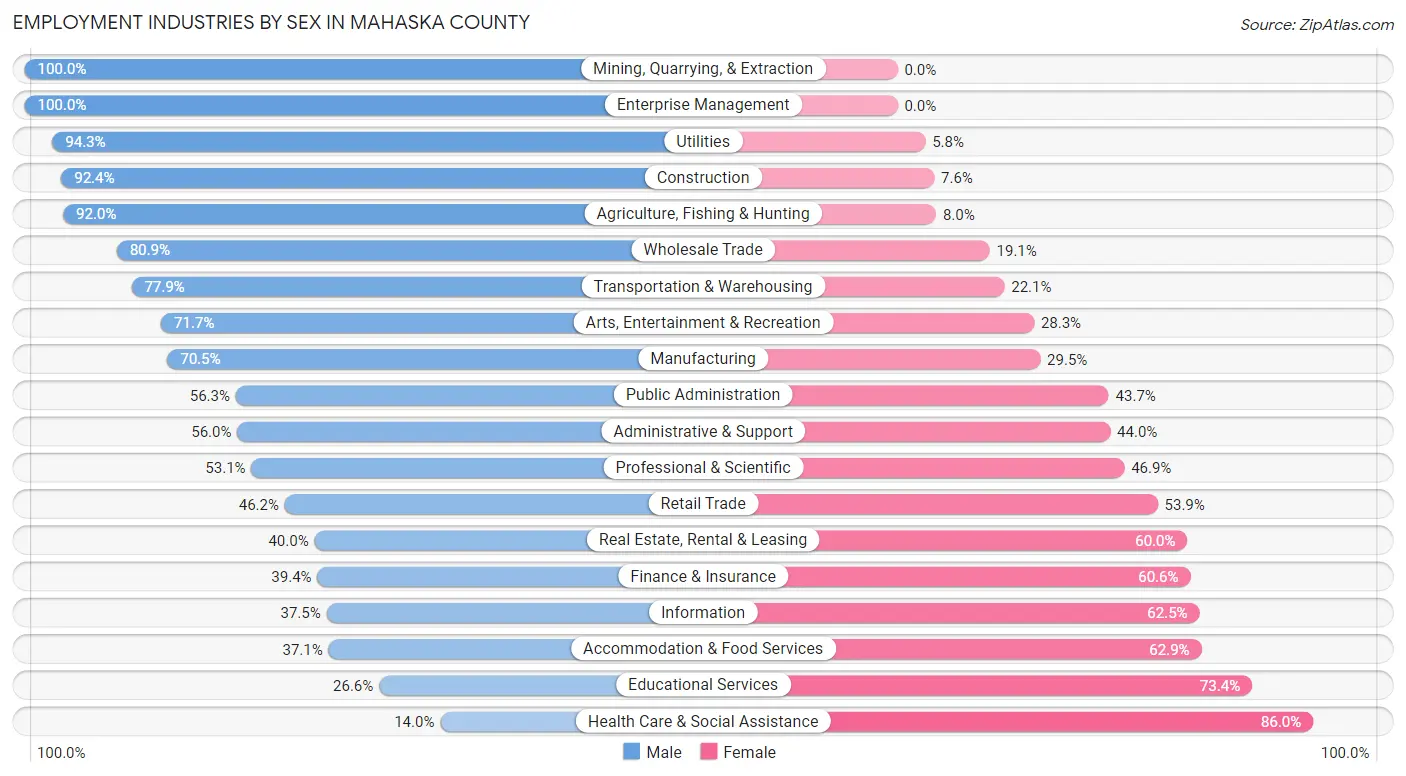
Employment Industries by Sex in Mahaska County
The Mahaska County industries that see more men than women are Mining, Quarrying, & Extraction (100.0%), Enterprise Management (100.0%), and Utilities (94.3%), whereas the industries that tend to have a higher number of women are Health Care & Social Assistance (86.0%), Educational Services (73.4%), and Accommodation & Food Services (62.9%).
| Industry | Male | Female |
| Agriculture, Fishing & Hunting | 703 (92.0%) | 61 (8.0%) |
| Mining, Quarrying, & Extraction | 31 (100.0%) | 0 (0.0%) |
| Construction | 729 (92.4%) | 60 (7.6%) |
| Manufacturing | 2,120 (70.5%) | 889 (29.5%) |
| Wholesale Trade | 140 (80.9%) | 33 (19.1%) |
| Retail Trade | 540 (46.2%) | 630 (53.8%) |
| Transportation & Warehousing | 331 (77.9%) | 94 (22.1%) |
| Utilities | 82 (94.3%) | 5 (5.8%) |
| Information | 54 (37.5%) | 90 (62.5%) |
| Finance & Insurance | 104 (39.4%) | 160 (60.6%) |
| Real Estate, Rental & Leasing | 24 (40.0%) | 36 (60.0%) |
| Professional & Scientific | 156 (53.1%) | 138 (46.9%) |
| Enterprise Management | 1 (100.0%) | 0 (0.0%) |
| Administrative & Support | 89 (56.0%) | 70 (44.0%) |
| Educational Services | 254 (26.6%) | 700 (73.4%) |
| Health Care & Social Assistance | 177 (14.0%) | 1,090 (86.0%) |
| Arts, Entertainment & Recreation | 66 (71.7%) | 26 (28.3%) |
| Accommodation & Food Services | 214 (37.1%) | 363 (62.9%) |
| Public Administration | 112 (56.3%) | 87 (43.7%) |
| Total | 6,200 (55.8%) | 4,901 (44.2%) |
Education in Mahaska County
School Enrollment in Mahaska County
The most common levels of schooling among the 5,267 students in Mahaska County are middle school (1,238 | 23.5%), elementary school (1,177 | 22.4%), and high school (1,140 | 21.6%).
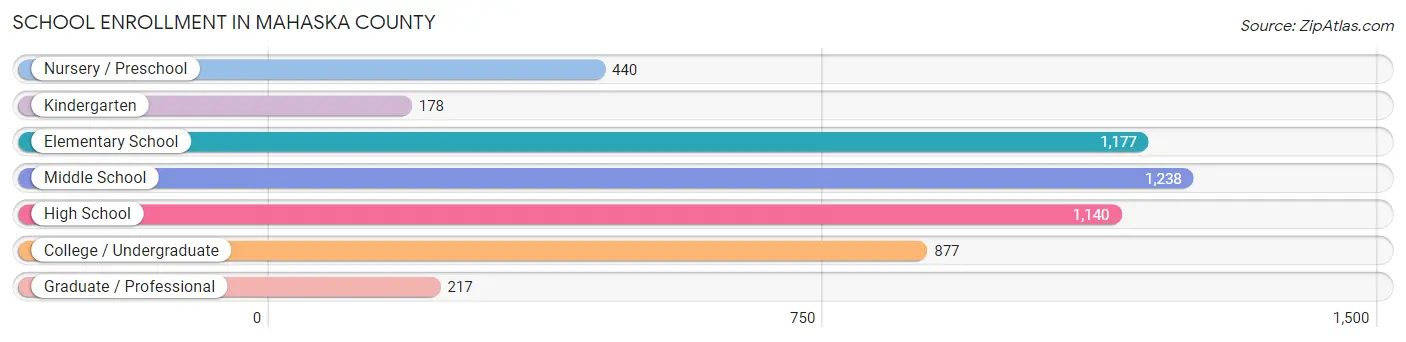
| School Level | # Students | % Students |
| Nursery / Preschool | 440 | 8.4% |
| Kindergarten | 178 | 3.4% |
| Elementary School | 1,177 | 22.4% |
| Middle School | 1,238 | 23.5% |
| High School | 1,140 | 21.6% |
| College / Undergraduate | 877 | 16.7% |
| Graduate / Professional | 217 | 4.1% |
| Total | 5,267 | 100.0% |
School Enrollment by Age by Funding Source in Mahaska County
Out of a total of 5,267 students who are enrolled in schools in Mahaska County, 859 (16.3%) attend a private institution, while the remaining 4,408 (83.7%) are enrolled in public schools. The age group of 20 to 24 year olds has the highest likelihood of being enrolled in private schools, with 213 (45.2% in the age bracket) enrolled. Conversely, the age group of 5 to 9 year old has the lowest likelihood of being enrolled in a private school, with 1,177 (90.3% in the age bracket) attending a public institution.
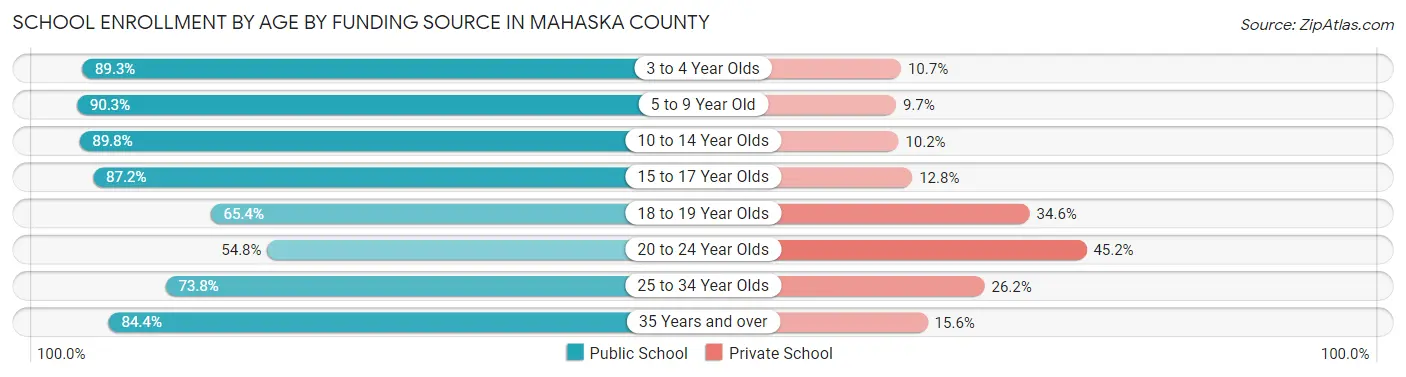
| Age Bracket | Public School | Private School |
| 3 to 4 Year Olds | 276 (89.3%) | 33 (10.7%) |
| 5 to 9 Year Old | 1,177 (90.3%) | 127 (9.7%) |
| 10 to 14 Year Olds | 1,408 (89.8%) | 160 (10.2%) |
| 15 to 17 Year Olds | 724 (87.2%) | 106 (12.8%) |
| 18 to 19 Year Olds | 283 (65.4%) | 150 (34.6%) |
| 20 to 24 Year Olds | 258 (54.8%) | 213 (45.2%) |
| 25 to 34 Year Olds | 104 (73.8%) | 37 (26.2%) |
| 35 Years and over | 178 (84.4%) | 33 (15.6%) |
| Total | 4,408 (83.7%) | 859 (16.3%) |
Educational Attainment by Field of Study in Mahaska County
Education (840 | 23.4%), business (683 | 19.0%), bio, nature & agricultural (416 | 11.6%), arts & humanities (324 | 9.0%), and science & technology (297 | 8.3%) are the most common fields of study among 3,588 individuals in Mahaska County who have obtained a bachelor's degree or higher.
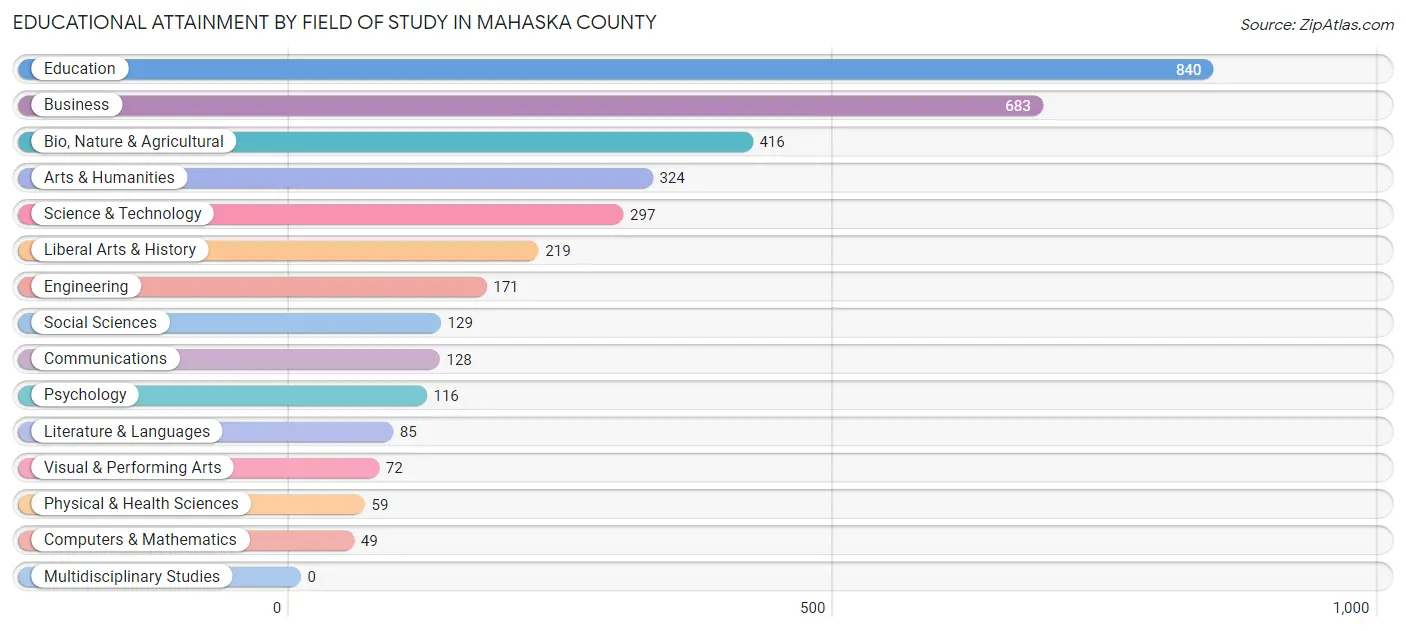
| Field of Study | # Graduates | % Graduates |
| Computers & Mathematics | 49 | 1.4% |
| Bio, Nature & Agricultural | 416 | 11.6% |
| Physical & Health Sciences | 59 | 1.6% |
| Psychology | 116 | 3.2% |
| Social Sciences | 129 | 3.6% |
| Engineering | 171 | 4.8% |
| Multidisciplinary Studies | 0 | 0.0% |
| Science & Technology | 297 | 8.3% |
| Business | 683 | 19.0% |
| Education | 840 | 23.4% |
| Literature & Languages | 85 | 2.4% |
| Liberal Arts & History | 219 | 6.1% |
| Visual & Performing Arts | 72 | 2.0% |
| Communications | 128 | 3.6% |
| Arts & Humanities | 324 | 9.0% |
| Total | 3,588 | 100.0% |
Transportation & Commute in Mahaska County
Vehicle Availability by Sex in Mahaska County
The most prevalent vehicle ownership categories in Mahaska County are males with 2 vehicles (2,350, accounting for 38.6%) and females with 2 vehicles (1,752, making up 49.3%).
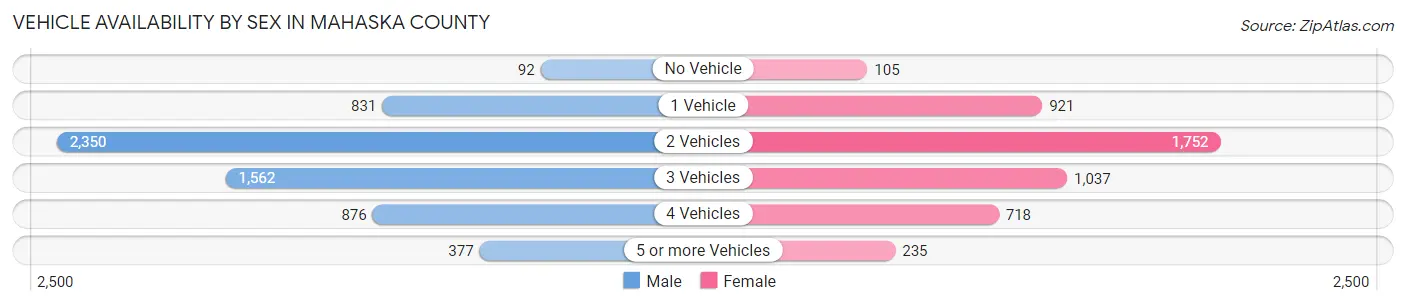
| Vehicles Available | Male | Female |
| No Vehicle | 92 (1.5%) | 105 (2.2%) |
| 1 Vehicle | 831 (13.7%) | 921 (19.3%) |
| 2 Vehicles | 2,350 (38.6%) | 1,752 (36.7%) |
| 3 Vehicles | 1,562 (25.7%) | 1,037 (21.7%) |
| 4 Vehicles | 876 (14.4%) | 718 (15.1%) |
| 5 or more Vehicles | 377 (6.2%) | 235 (4.9%) |
| Total | 6,088 (100.0%) | 4,768 (100.0%) |
Commute Time in Mahaska County
The most frequently occuring commute durations in Mahaska County are 5 to 9 minutes (2,811 commuters, 27.2%), 20 to 24 minutes (1,398 commuters, 13.5%), and 15 to 19 minutes (1,327 commuters, 12.8%).
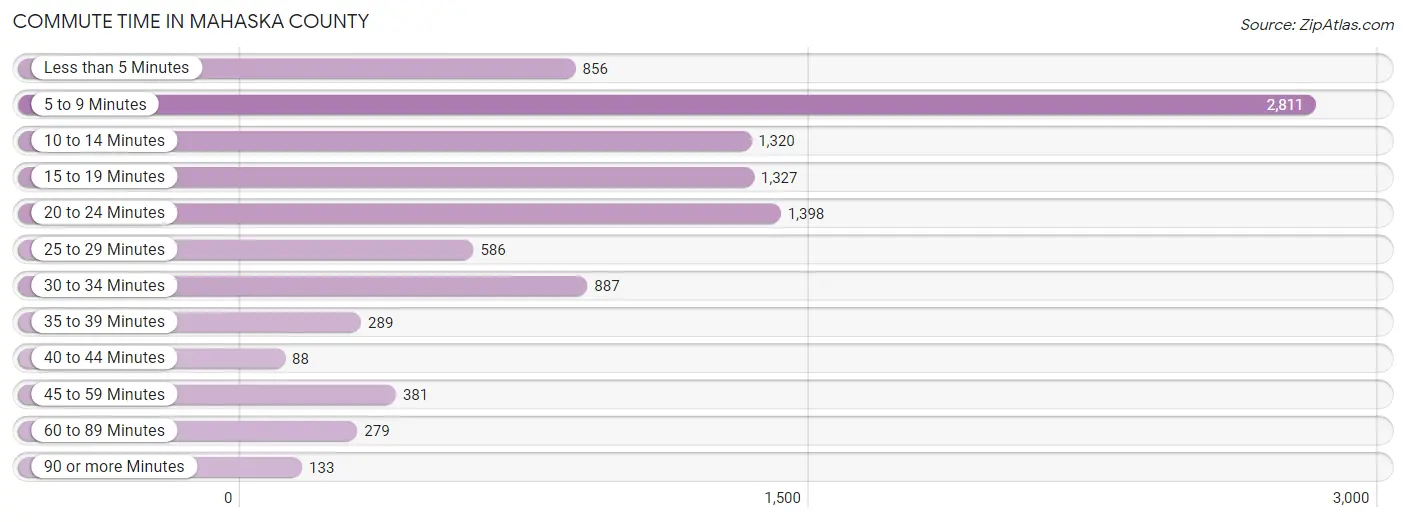
| Commute Time | # Commuters | % Commuters |
| Less than 5 Minutes | 856 | 8.3% |
| 5 to 9 Minutes | 2,811 | 27.2% |
| 10 to 14 Minutes | 1,320 | 12.8% |
| 15 to 19 Minutes | 1,327 | 12.8% |
| 20 to 24 Minutes | 1,398 | 13.5% |
| 25 to 29 Minutes | 586 | 5.7% |
| 30 to 34 Minutes | 887 | 8.6% |
| 35 to 39 Minutes | 289 | 2.8% |
| 40 to 44 Minutes | 88 | 0.9% |
| 45 to 59 Minutes | 381 | 3.7% |
| 60 to 89 Minutes | 279 | 2.7% |
| 90 or more Minutes | 133 | 1.3% |
Commute Time by Sex in Mahaska County
The most common commute times in Mahaska County are 5 to 9 minutes (1,627 commuters, 28.1%) for males and 5 to 9 minutes (1,184 commuters, 26.0%) for females.
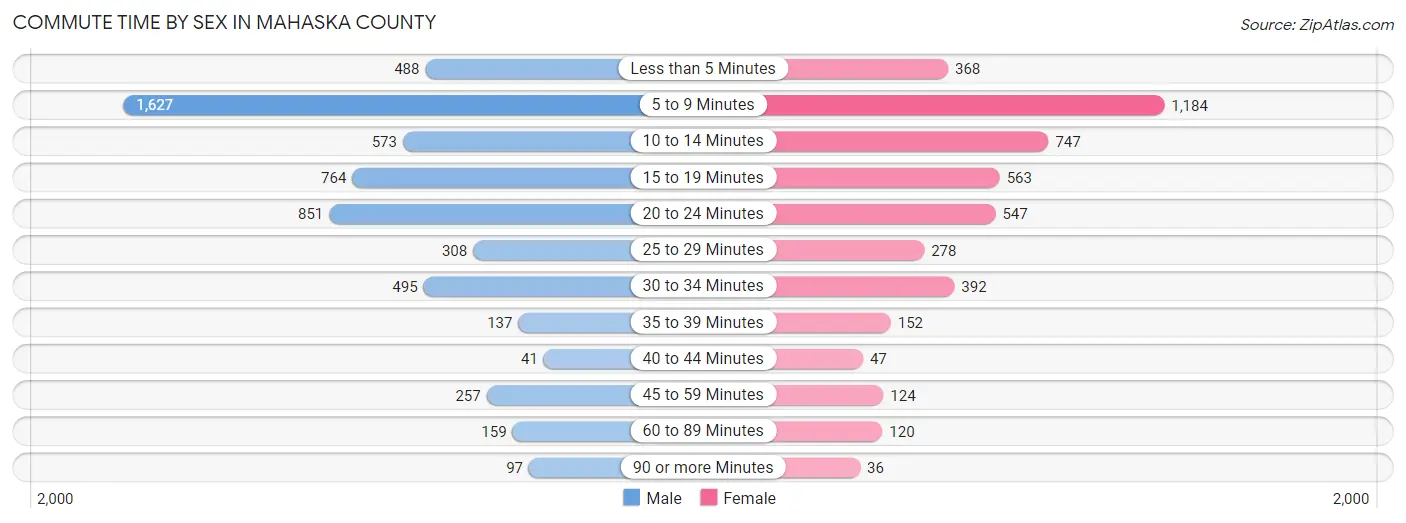
| Commute Time | Male | Female |
| Less than 5 Minutes | 488 (8.4%) | 368 (8.1%) |
| 5 to 9 Minutes | 1,627 (28.1%) | 1,184 (26.0%) |
| 10 to 14 Minutes | 573 (9.9%) | 747 (16.4%) |
| 15 to 19 Minutes | 764 (13.2%) | 563 (12.3%) |
| 20 to 24 Minutes | 851 (14.7%) | 547 (12.0%) |
| 25 to 29 Minutes | 308 (5.3%) | 278 (6.1%) |
| 30 to 34 Minutes | 495 (8.5%) | 392 (8.6%) |
| 35 to 39 Minutes | 137 (2.4%) | 152 (3.3%) |
| 40 to 44 Minutes | 41 (0.7%) | 47 (1.0%) |
| 45 to 59 Minutes | 257 (4.4%) | 124 (2.7%) |
| 60 to 89 Minutes | 159 (2.7%) | 120 (2.6%) |
| 90 or more Minutes | 97 (1.7%) | 36 (0.8%) |
Time of Departure to Work by Sex in Mahaska County
The most frequent times of departure to work in Mahaska County are 7:30 AM to 7:59 AM (718, 12.4%) for males and 7:30 AM to 7:59 AM (1,055, 23.2%) for females.
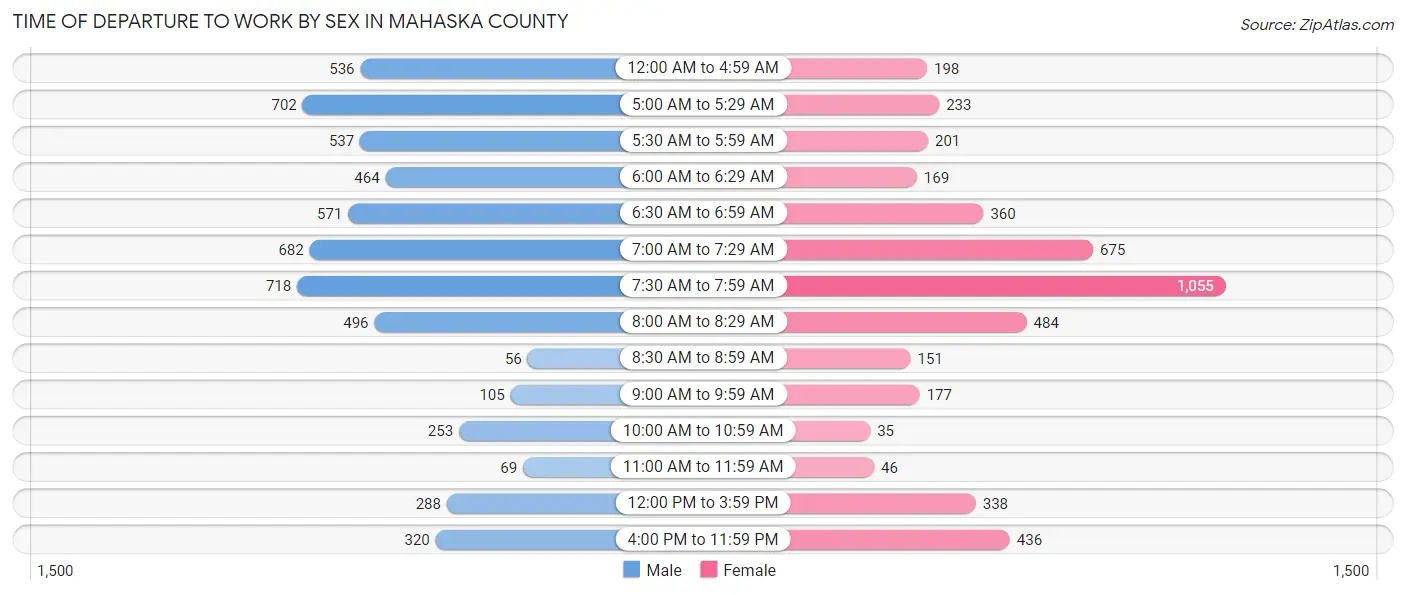
| Time of Departure | Male | Female |
| 12:00 AM to 4:59 AM | 536 (9.2%) | 198 (4.3%) |
| 5:00 AM to 5:29 AM | 702 (12.1%) | 233 (5.1%) |
| 5:30 AM to 5:59 AM | 537 (9.3%) | 201 (4.4%) |
| 6:00 AM to 6:29 AM | 464 (8.0%) | 169 (3.7%) |
| 6:30 AM to 6:59 AM | 571 (9.9%) | 360 (7.9%) |
| 7:00 AM to 7:29 AM | 682 (11.8%) | 675 (14.8%) |
| 7:30 AM to 7:59 AM | 718 (12.4%) | 1,055 (23.2%) |
| 8:00 AM to 8:29 AM | 496 (8.6%) | 484 (10.6%) |
| 8:30 AM to 8:59 AM | 56 (1.0%) | 151 (3.3%) |
| 9:00 AM to 9:59 AM | 105 (1.8%) | 177 (3.9%) |
| 10:00 AM to 10:59 AM | 253 (4.4%) | 35 (0.8%) |
| 11:00 AM to 11:59 AM | 69 (1.2%) | 46 (1.0%) |
| 12:00 PM to 3:59 PM | 288 (5.0%) | 338 (7.4%) |
| 4:00 PM to 11:59 PM | 320 (5.5%) | 436 (9.6%) |
| Total | 5,797 (100.0%) | 4,558 (100.0%) |
Housing Occupancy in Mahaska County
Occupancy by Ownership in Mahaska County
Of the total 8,873 dwellings in Mahaska County, owner-occupied units account for 6,006 (67.7%), while renter-occupied units make up 2,867 (32.3%).
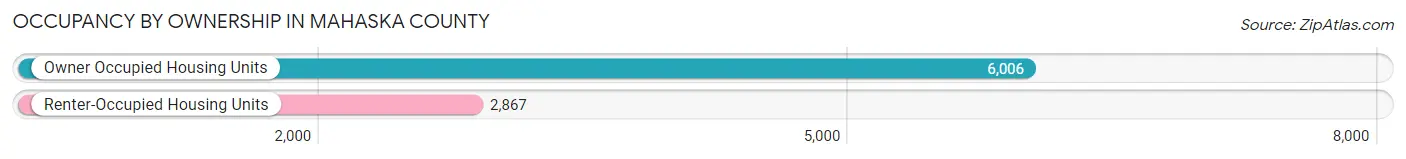
| Occupancy | # Housing Units | % Housing Units |
| Owner Occupied Housing Units | 6,006 | 67.7% |
| Renter-Occupied Housing Units | 2,867 | 32.3% |
| Total Occupied Housing Units | 8,873 | 100.0% |
Occupancy by Household Size in Mahaska County
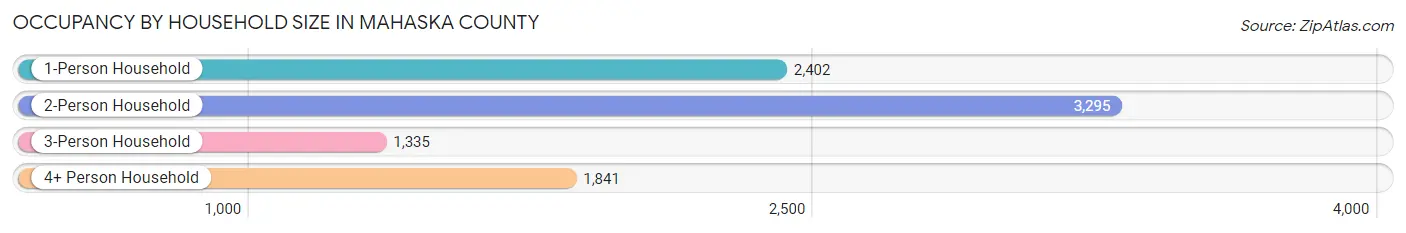
| Household Size | # Housing Units | % Housing Units |
| 1-Person Household | 2,402 | 27.1% |
| 2-Person Household | 3,295 | 37.1% |
| 3-Person Household | 1,335 | 15.0% |
| 4+ Person Household | 1,841 | 20.7% |
| Total Housing Units | 8,873 | 100.0% |
Occupancy by Ownership by Household Size in Mahaska County
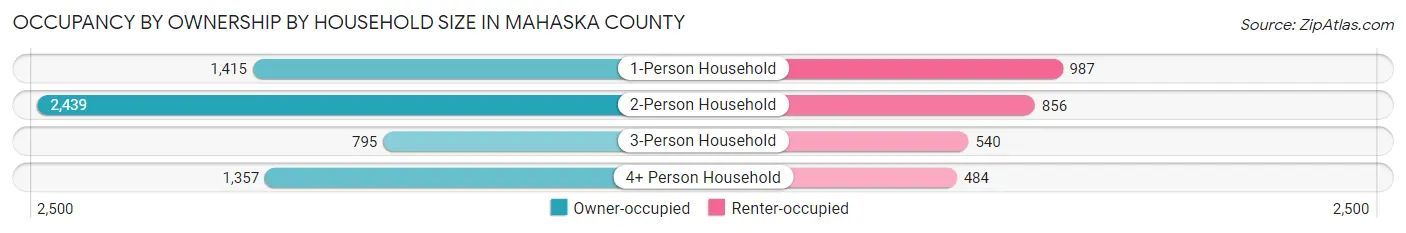
| Household Size | Owner-occupied | Renter-occupied |
| 1-Person Household | 1,415 (58.9%) | 987 (41.1%) |
| 2-Person Household | 2,439 (74.0%) | 856 (26.0%) |
| 3-Person Household | 795 (59.6%) | 540 (40.5%) |
| 4+ Person Household | 1,357 (73.7%) | 484 (26.3%) |
| Total Housing Units | 6,006 (67.7%) | 2,867 (32.3%) |
Occupancy by Educational Attainment in Mahaska County
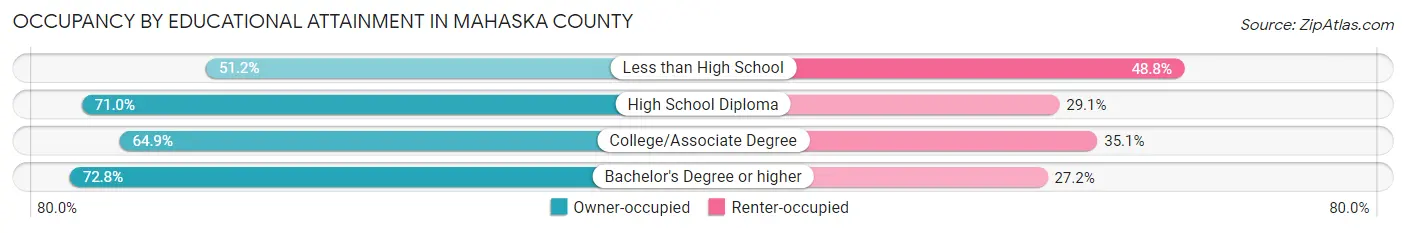
| Household Size | Owner-occupied | Renter-occupied |
| Less than High School | 316 (51.2%) | 301 (48.8%) |
| High School Diploma | 2,044 (71.0%) | 837 (29.0%) |
| College/Associate Degree | 2,204 (64.9%) | 1,191 (35.1%) |
| Bachelor's Degree or higher | 1,442 (72.8%) | 538 (27.2%) |
Occupancy by Age of Householder in Mahaska County
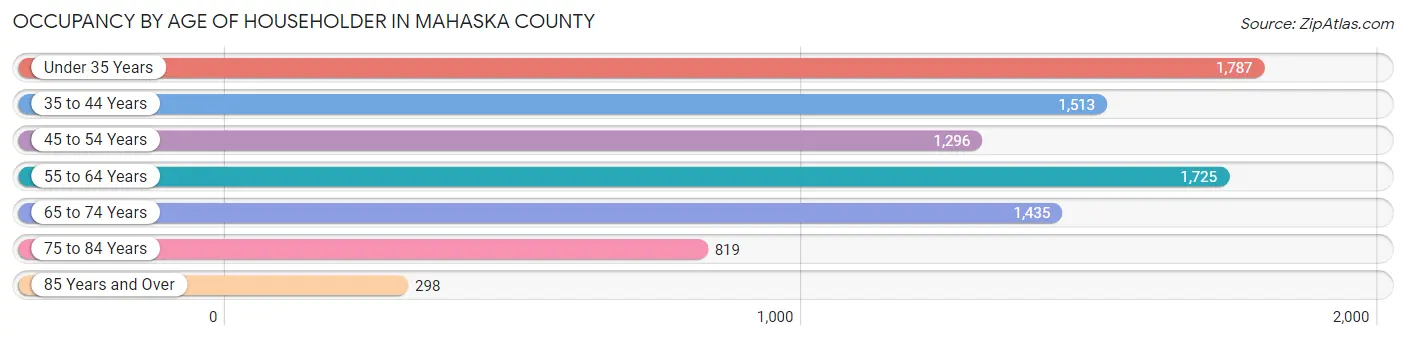
| Age Bracket | # Households | % Households |
| Under 35 Years | 1,787 | 20.1% |
| 35 to 44 Years | 1,513 | 17.1% |
| 45 to 54 Years | 1,296 | 14.6% |
| 55 to 64 Years | 1,725 | 19.4% |
| 65 to 74 Years | 1,435 | 16.2% |
| 75 to 84 Years | 819 | 9.2% |
| 85 Years and Over | 298 | 3.4% |
| Total | 8,873 | 100.0% |
Housing Finances in Mahaska County
Median Income by Occupancy in Mahaska County
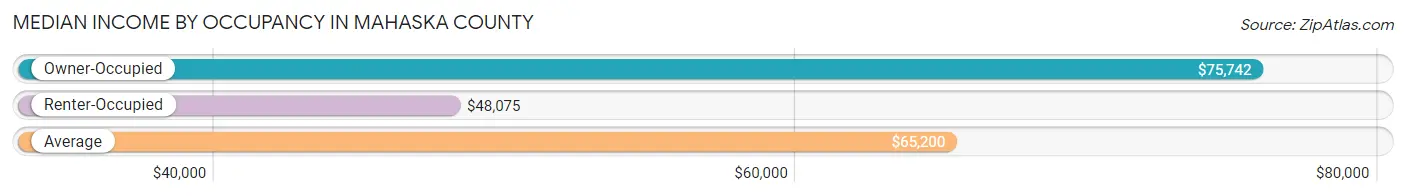
| Occupancy Type | # Households | Median Income |
| Owner-Occupied | 6,006 (67.7%) | $75,742 |
| Renter-Occupied | 2,867 (32.3%) | $48,075 |
| Average | 8,873 (100.0%) | $65,200 |
Occupancy by Householder Income Bracket in Mahaska County
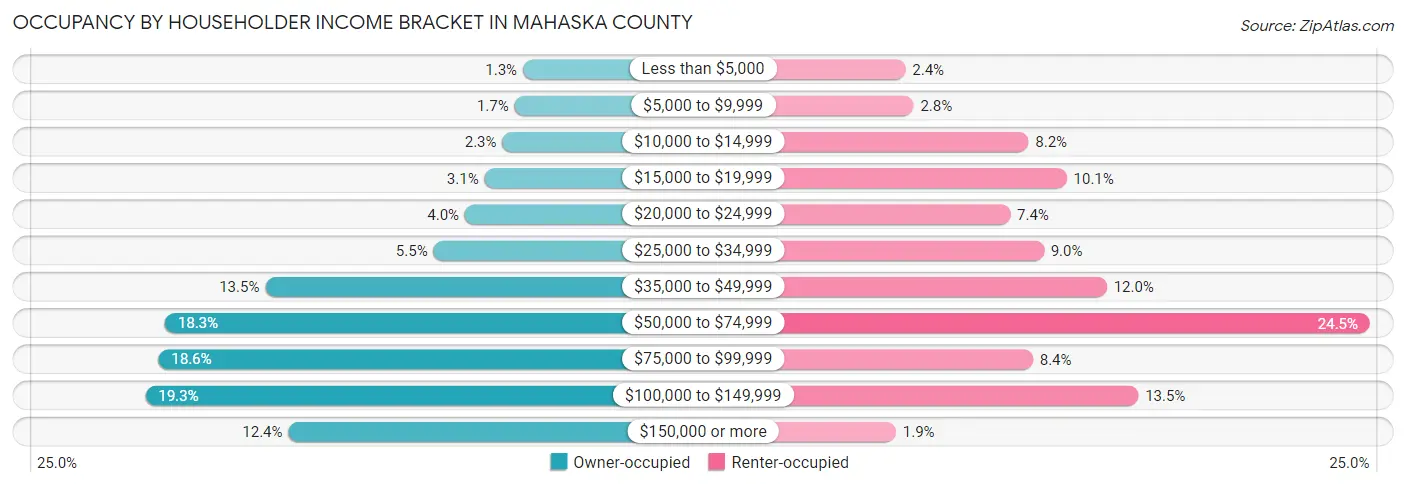
| Income Bracket | Owner-occupied | Renter-occupied |
| Less than $5,000 | 76 (1.3%) | 68 (2.4%) |
| $5,000 to $9,999 | 100 (1.7%) | 79 (2.8%) |
| $10,000 to $14,999 | 135 (2.2%) | 236 (8.2%) |
| $15,000 to $19,999 | 186 (3.1%) | 288 (10.1%) |
| $20,000 to $24,999 | 242 (4.0%) | 211 (7.4%) |
| $25,000 to $34,999 | 332 (5.5%) | 257 (9.0%) |
| $35,000 to $49,999 | 813 (13.5%) | 343 (12.0%) |
| $50,000 to $74,999 | 1,100 (18.3%) | 702 (24.5%) |
| $75,000 to $99,999 | 1,119 (18.6%) | 242 (8.4%) |
| $100,000 to $149,999 | 1,156 (19.3%) | 386 (13.5%) |
| $150,000 or more | 747 (12.4%) | 55 (1.9%) |
| Total | 6,006 (100.0%) | 2,867 (100.0%) |
Monthly Housing Cost Tiers in Mahaska County
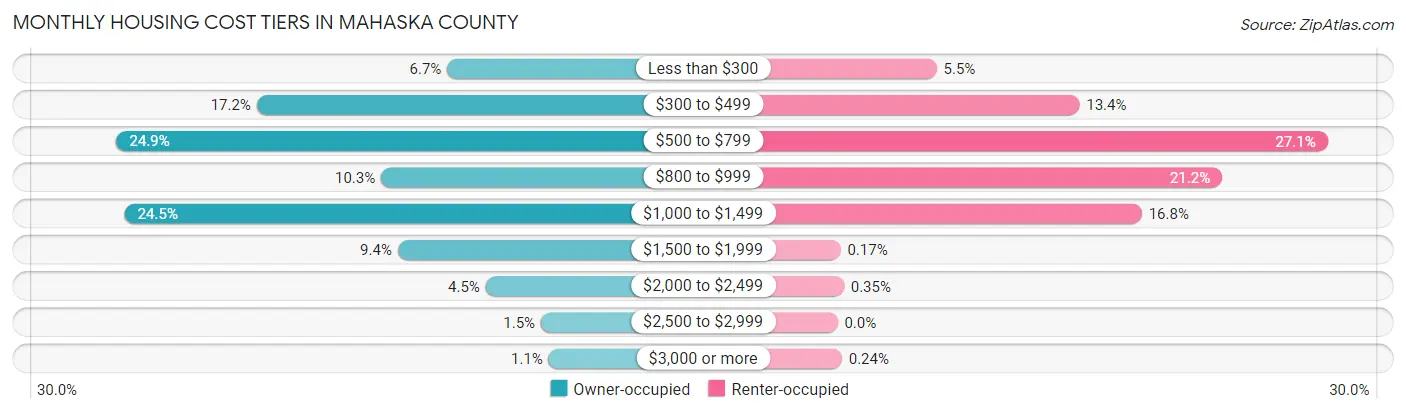
| Monthly Cost | Owner-occupied | Renter-occupied |
| Less than $300 | 400 (6.7%) | 157 (5.5%) |
| $300 to $499 | 1,032 (17.2%) | 383 (13.4%) |
| $500 to $799 | 1,497 (24.9%) | 776 (27.1%) |
| $800 to $999 | 619 (10.3%) | 609 (21.2%) |
| $1,000 to $1,499 | 1,470 (24.5%) | 482 (16.8%) |
| $1,500 to $1,999 | 564 (9.4%) | 5 (0.2%) |
| $2,000 to $2,499 | 272 (4.5%) | 10 (0.4%) |
| $2,500 to $2,999 | 89 (1.5%) | 0 (0.0%) |
| $3,000 or more | 63 (1.1%) | 7 (0.2%) |
| Total | 6,006 (100.0%) | 2,867 (100.0%) |
Physical Housing Characteristics in Mahaska County
Housing Structures in Mahaska County
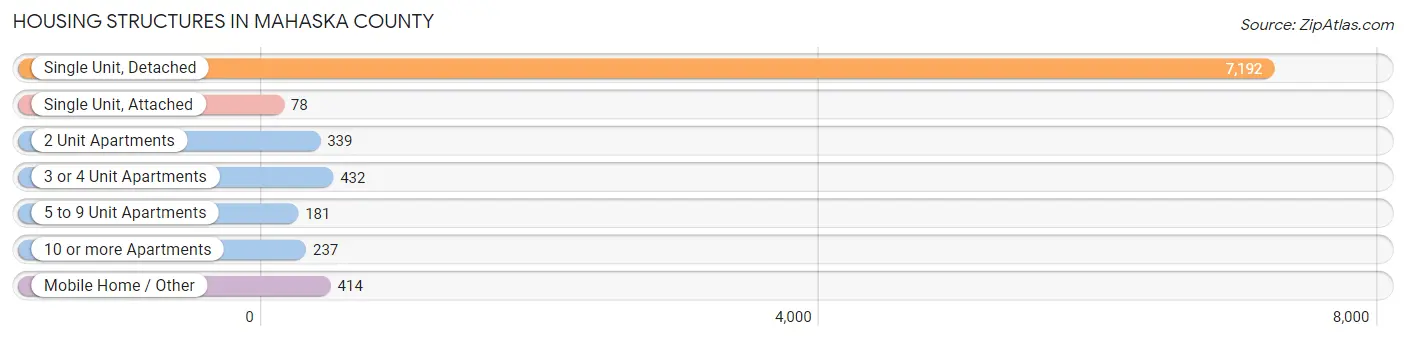
| Structure Type | # Housing Units | % Housing Units |
| Single Unit, Detached | 7,192 | 81.0% |
| Single Unit, Attached | 78 | 0.9% |
| 2 Unit Apartments | 339 | 3.8% |
| 3 or 4 Unit Apartments | 432 | 4.9% |
| 5 to 9 Unit Apartments | 181 | 2.0% |
| 10 or more Apartments | 237 | 2.7% |
| Mobile Home / Other | 414 | 4.7% |
| Total | 8,873 | 100.0% |
Housing Structures by Occupancy in Mahaska County
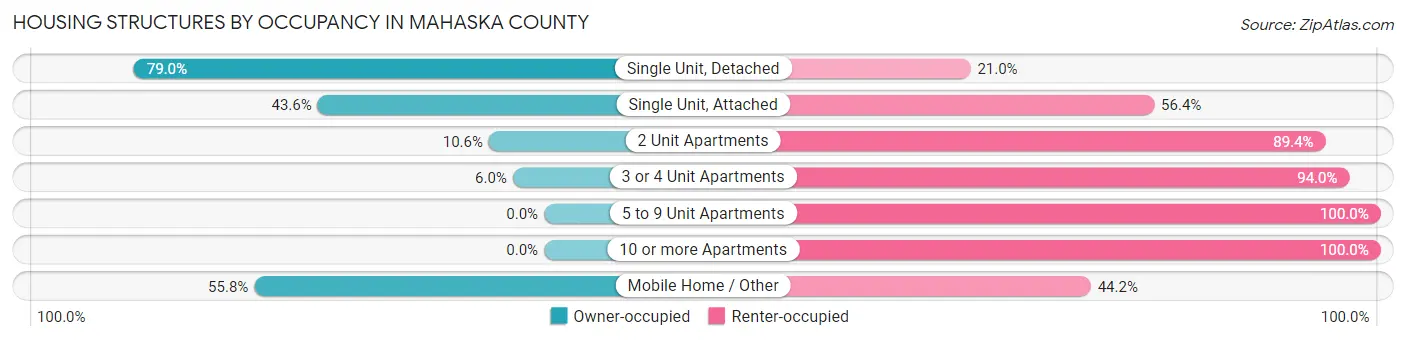
| Structure Type | Owner-occupied | Renter-occupied |
| Single Unit, Detached | 5,679 (79.0%) | 1,513 (21.0%) |
| Single Unit, Attached | 34 (43.6%) | 44 (56.4%) |
| 2 Unit Apartments | 36 (10.6%) | 303 (89.4%) |
| 3 or 4 Unit Apartments | 26 (6.0%) | 406 (94.0%) |
| 5 to 9 Unit Apartments | 0 (0.0%) | 181 (100.0%) |
| 10 or more Apartments | 0 (0.0%) | 237 (100.0%) |
| Mobile Home / Other | 231 (55.8%) | 183 (44.2%) |
| Total | 6,006 (67.7%) | 2,867 (32.3%) |
Housing Structures by Number of Rooms in Mahaska County
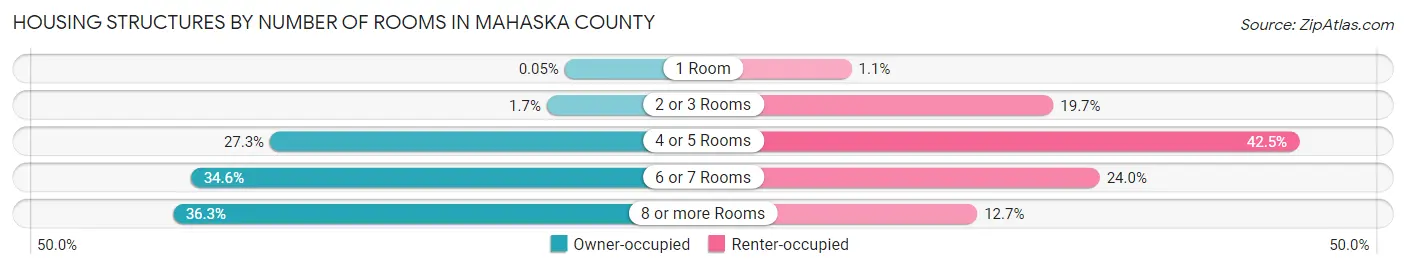
| Number of Rooms | Owner-occupied | Renter-occupied |
| 1 Room | 3 (0.1%) | 31 (1.1%) |
| 2 or 3 Rooms | 103 (1.7%) | 566 (19.7%) |
| 4 or 5 Rooms | 1,640 (27.3%) | 1,217 (42.4%) |
| 6 or 7 Rooms | 2,080 (34.6%) | 689 (24.0%) |
| 8 or more Rooms | 2,180 (36.3%) | 364 (12.7%) |
| Total | 6,006 (100.0%) | 2,867 (100.0%) |
Housing Structure by Heating Type in Mahaska County
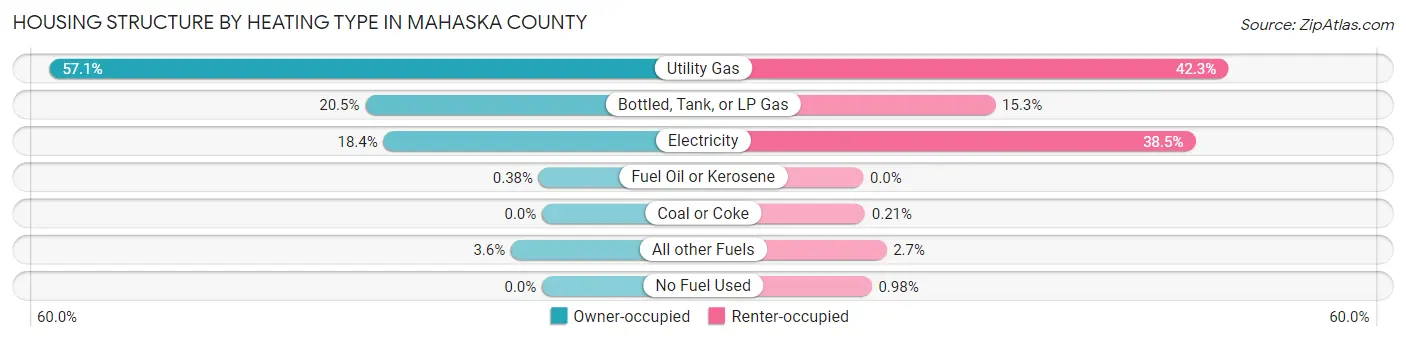
| Heating Type | Owner-occupied | Renter-occupied |
| Utility Gas | 3,432 (57.1%) | 1,213 (42.3%) |
| Bottled, Tank, or LP Gas | 1,231 (20.5%) | 439 (15.3%) |
| Electricity | 1,104 (18.4%) | 1,104 (38.5%) |
| Fuel Oil or Kerosene | 23 (0.4%) | 0 (0.0%) |
| Coal or Coke | 0 (0.0%) | 6 (0.2%) |
| All other Fuels | 216 (3.6%) | 77 (2.7%) |
| No Fuel Used | 0 (0.0%) | 28 (1.0%) |
| Total | 6,006 (100.0%) | 2,867 (100.0%) |
Household Vehicle Usage in Mahaska County
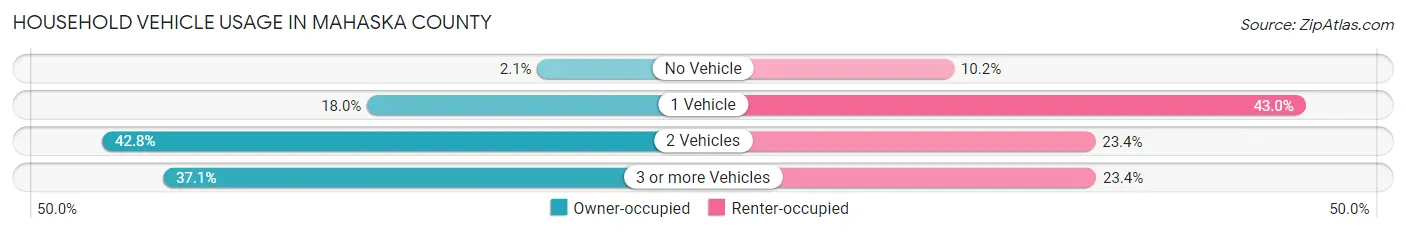
| Vehicles per Household | Owner-occupied | Renter-occupied |
| No Vehicle | 128 (2.1%) | 292 (10.2%) |
| 1 Vehicle | 1,082 (18.0%) | 1,233 (43.0%) |
| 2 Vehicles | 2,569 (42.8%) | 670 (23.4%) |
| 3 or more Vehicles | 2,227 (37.1%) | 672 (23.4%) |
| Total | 6,006 (100.0%) | 2,867 (100.0%) |
Real Estate & Mortgages in Mahaska County
Real Estate and Mortgage Overview in Mahaska County
| Characteristic | Without Mortgage | With Mortgage |
| Housing Units | 2,777 | 3,229 |
| Median Property Value | $114,200 | $153,400 |
| Median Household Income | $55,063 | $501 |
| Monthly Housing Costs | $509 | $63 |
| Real Estate Taxes | $1,564 | $139 |
Property Value by Mortgage Status in Mahaska County
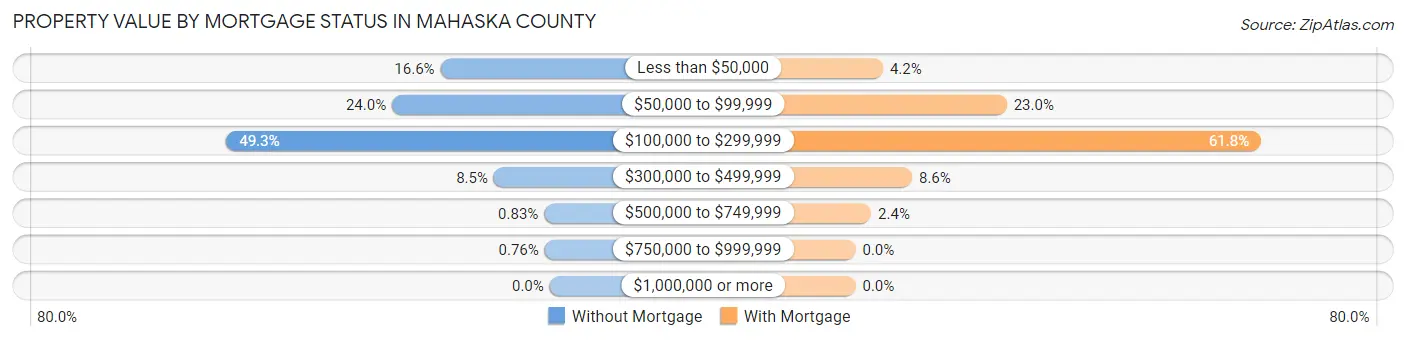
| Property Value | Without Mortgage | With Mortgage |
| Less than $50,000 | 462 (16.6%) | 135 (4.2%) |
| $50,000 to $99,999 | 667 (24.0%) | 744 (23.0%) |
| $100,000 to $299,999 | 1,368 (49.3%) | 1,995 (61.8%) |
| $300,000 to $499,999 | 236 (8.5%) | 278 (8.6%) |
| $500,000 to $749,999 | 23 (0.8%) | 77 (2.4%) |
| $750,000 to $999,999 | 21 (0.8%) | 0 (0.0%) |
| $1,000,000 or more | 0 (0.0%) | 0 (0.0%) |
| Total | 2,777 (100.0%) | 3,229 (100.0%) |
Household Income by Mortgage Status in Mahaska County
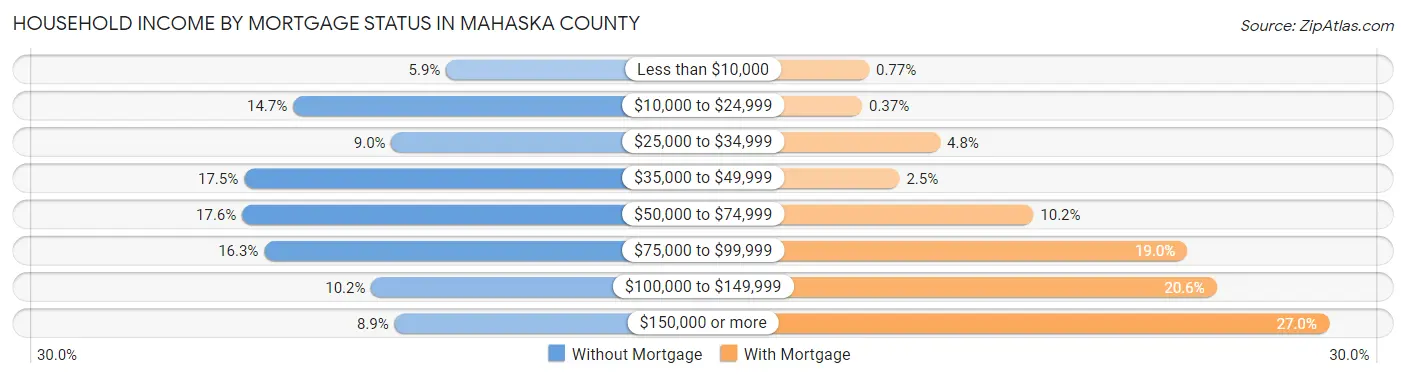
| Household Income | Without Mortgage | With Mortgage |
| Less than $10,000 | 164 (5.9%) | 25 (0.8%) |
| $10,000 to $24,999 | 407 (14.7%) | 12 (0.4%) |
| $25,000 to $34,999 | 251 (9.0%) | 156 (4.8%) |
| $35,000 to $49,999 | 485 (17.5%) | 81 (2.5%) |
| $50,000 to $74,999 | 488 (17.6%) | 328 (10.2%) |
| $75,000 to $99,999 | 453 (16.3%) | 612 (19.0%) |
| $100,000 to $149,999 | 283 (10.2%) | 666 (20.6%) |
| $150,000 or more | 246 (8.9%) | 873 (27.0%) |
| Total | 2,777 (100.0%) | 3,229 (100.0%) |
Property Value to Household Income Ratio in Mahaska County
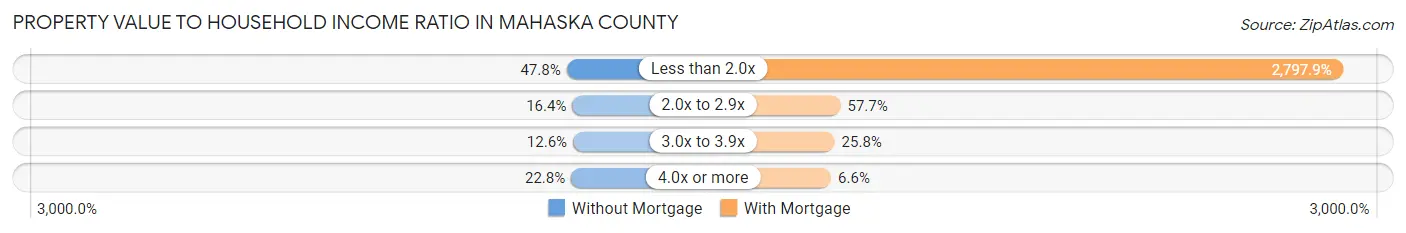
| Value-to-Income Ratio | Without Mortgage | With Mortgage |
| Less than 2.0x | 1,326 (47.7%) | 90,344 (2,797.9%) |
| 2.0x to 2.9x | 454 (16.4%) | 1,863 (57.7%) |
| 3.0x to 3.9x | 350 (12.6%) | 833 (25.8%) |
| 4.0x or more | 633 (22.8%) | 213 (6.6%) |
| Total | 2,777 (100.0%) | 3,229 (100.0%) |
Real Estate Taxes by Mortgage Status in Mahaska County
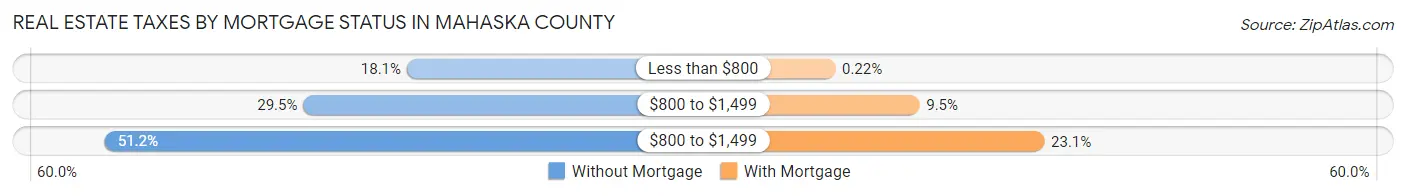
| Property Taxes | Without Mortgage | With Mortgage |
| Less than $800 | 503 (18.1%) | 7 (0.2%) |
| $800 to $1,499 | 818 (29.5%) | 305 (9.5%) |
| $800 to $1,499 | 1,422 (51.2%) | 747 (23.1%) |
| Total | 2,777 (100.0%) | 3,229 (100.0%) |
Health & Disability in Mahaska County
Health Insurance Coverage by Age in Mahaska County
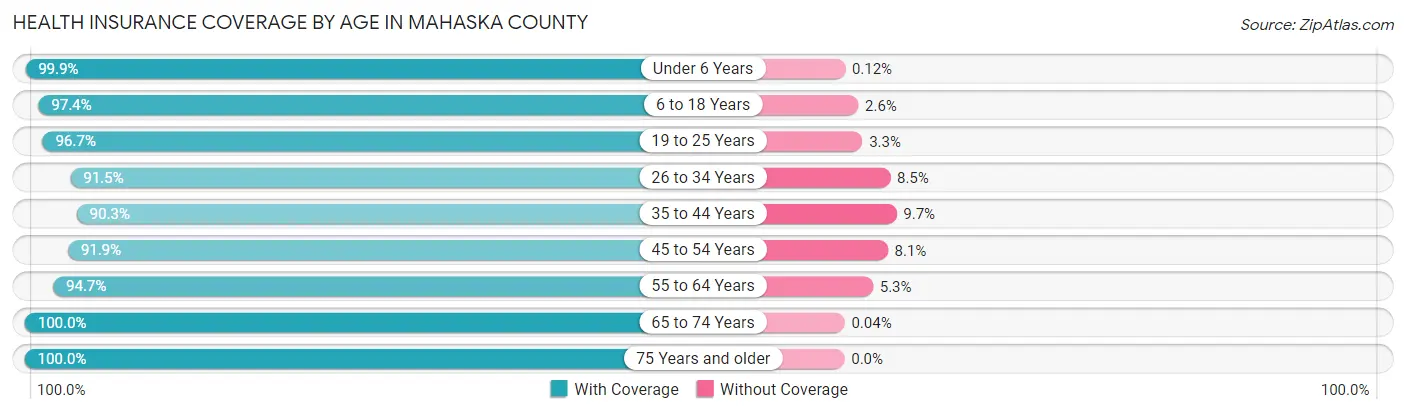
| Age Bracket | With Coverage | Without Coverage |
| Under 6 Years | 1,636 (99.9%) | 2 (0.1%) |
| 6 to 18 Years | 3,899 (97.4%) | 103 (2.6%) |
| 19 to 25 Years | 1,792 (96.7%) | 62 (3.3%) |
| 26 to 34 Years | 2,112 (91.5%) | 197 (8.5%) |
| 35 to 44 Years | 2,328 (90.3%) | 250 (9.7%) |
| 45 to 54 Years | 2,302 (91.9%) | 202 (8.1%) |
| 55 to 64 Years | 2,797 (94.7%) | 157 (5.3%) |
| 65 to 74 Years | 2,318 (100.0%) | 1 (0.0%) |
| 75 Years and older | 1,609 (100.0%) | 0 (0.0%) |
| Total | 20,793 (95.5%) | 974 (4.5%) |
Health Insurance Coverage by Citizenship Status in Mahaska County
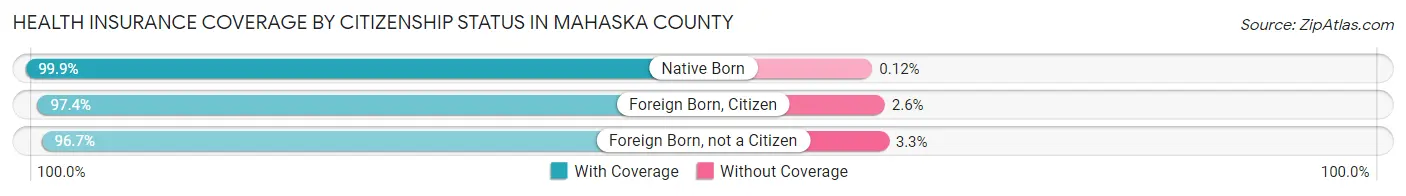
| Citizenship Status | With Coverage | Without Coverage |
| Native Born | 1,636 (99.9%) | 2 (0.1%) |
| Foreign Born, Citizen | 3,899 (97.4%) | 103 (2.6%) |
| Foreign Born, not a Citizen | 1,792 (96.7%) | 62 (3.3%) |
Health Insurance Coverage by Household Income in Mahaska County
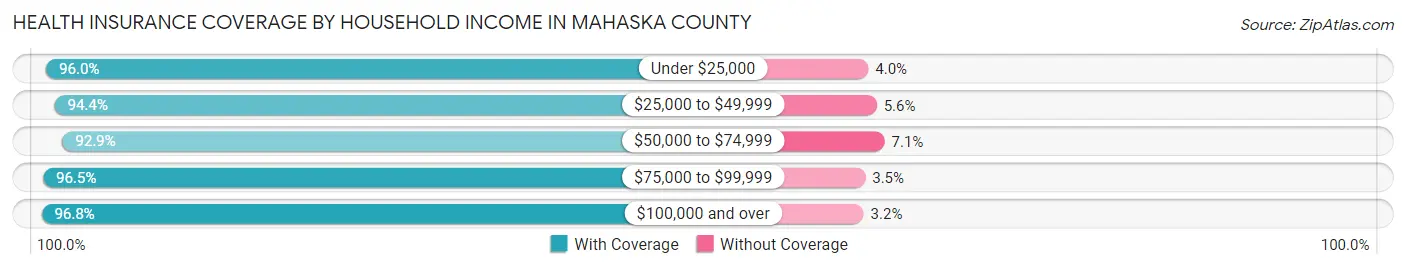
| Household Income | With Coverage | Without Coverage |
| Under $25,000 | 2,448 (96.0%) | 103 (4.0%) |
| $25,000 to $49,999 | 3,632 (94.4%) | 216 (5.6%) |
| $50,000 to $74,999 | 3,964 (92.9%) | 302 (7.1%) |
| $75,000 to $99,999 | 3,266 (96.5%) | 117 (3.5%) |
| $100,000 and over | 7,070 (96.8%) | 231 (3.2%) |
Public vs Private Health Insurance Coverage by Age in Mahaska County
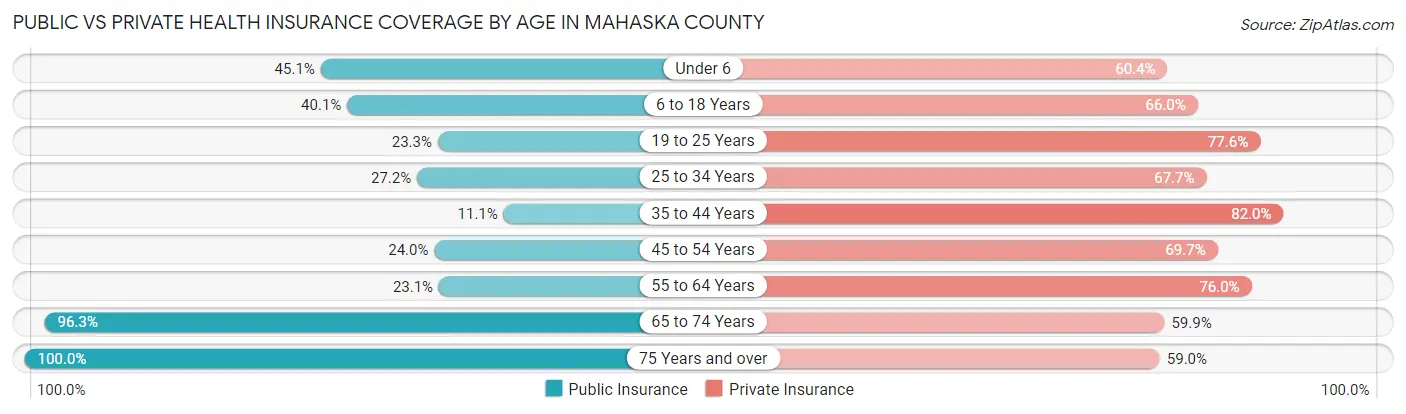
| Age Bracket | Public Insurance | Private Insurance |
| Under 6 | 738 (45.1%) | 990 (60.4%) |
| 6 to 18 Years | 1,606 (40.1%) | 2,643 (66.0%) |
| 19 to 25 Years | 432 (23.3%) | 1,439 (77.6%) |
| 25 to 34 Years | 627 (27.2%) | 1,562 (67.6%) |
| 35 to 44 Years | 286 (11.1%) | 2,113 (82.0%) |
| 45 to 54 Years | 600 (24.0%) | 1,746 (69.7%) |
| 55 to 64 Years | 682 (23.1%) | 2,246 (76.0%) |
| 65 to 74 Years | 2,233 (96.3%) | 1,389 (59.9%) |
| 75 Years and over | 1,609 (100.0%) | 950 (59.0%) |
| Total | 8,813 (40.5%) | 15,078 (69.3%) |
Disability Status by Sex by Age in Mahaska County
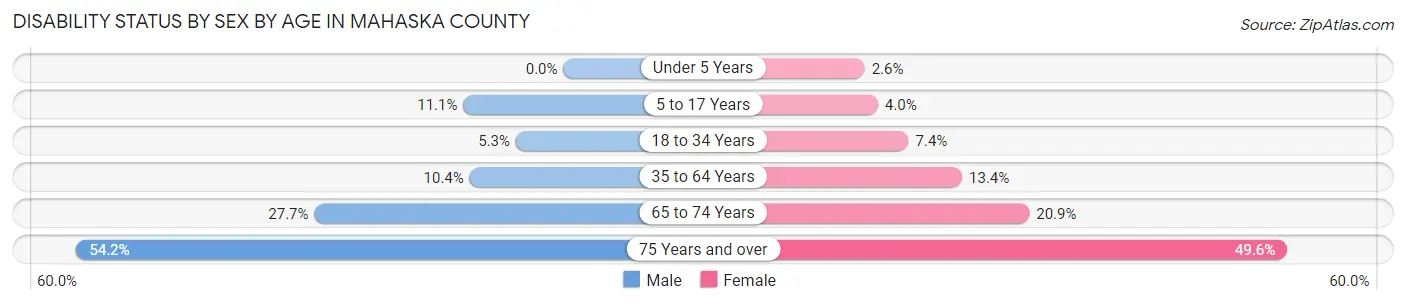
| Age Bracket | Male | Female |
| Under 5 Years | 0 (0.0%) | 17 (2.5%) |
| 5 to 17 Years | 227 (11.1%) | 73 (4.0%) |
| 18 to 34 Years | 125 (5.3%) | 163 (7.4%) |
| 35 to 64 Years | 433 (10.4%) | 521 (13.4%) |
| 65 to 74 Years | 323 (27.7%) | 241 (20.9%) |
| 75 Years and over | 340 (54.2%) | 487 (49.6%) |
Disability Class by Sex by Age in Mahaska County
Disability Class: Hearing Difficulty
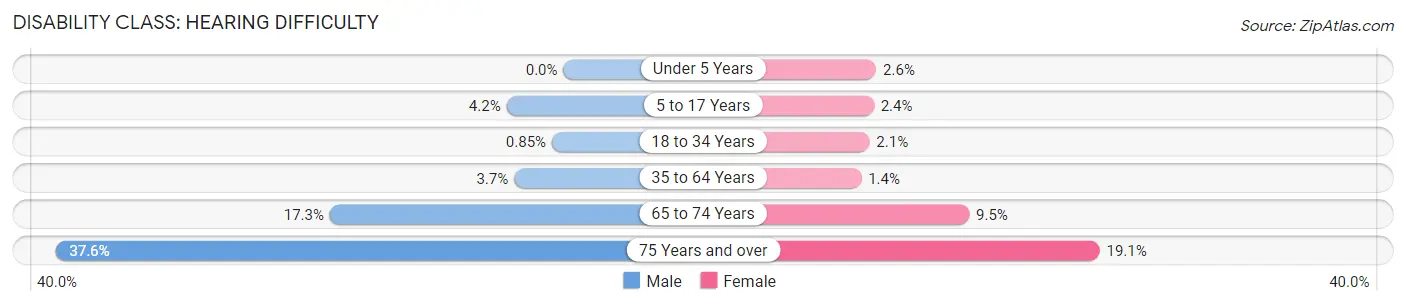
| Age Bracket | Male | Female |
| Under 5 Years | 0 (0.0%) | 17 (2.5%) |
| 5 to 17 Years | 86 (4.2%) | 43 (2.4%) |
| 18 to 34 Years | 20 (0.9%) | 45 (2.1%) |
| 35 to 64 Years | 152 (3.7%) | 56 (1.4%) |
| 65 to 74 Years | 202 (17.3%) | 109 (9.5%) |
| 75 Years and over | 236 (37.6%) | 188 (19.1%) |
Disability Class: Vision Difficulty
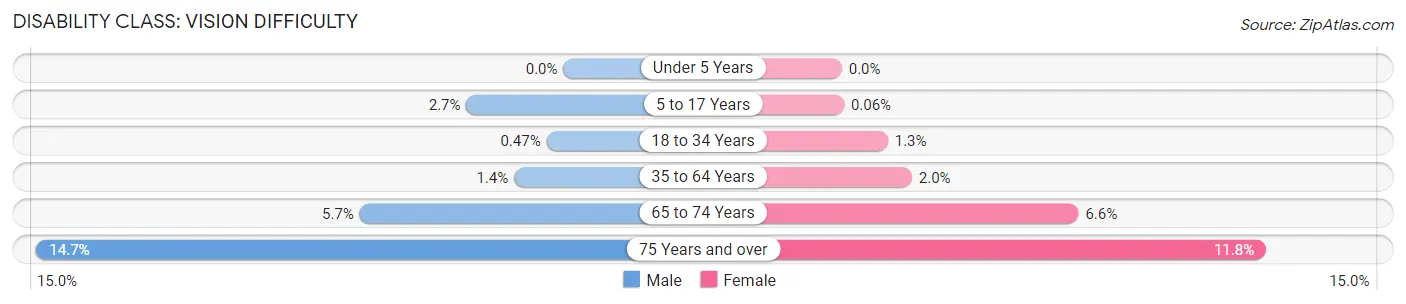
| Age Bracket | Male | Female |
| Under 5 Years | 0 (0.0%) | 0 (0.0%) |
| 5 to 17 Years | 55 (2.7%) | 1 (0.1%) |
| 18 to 34 Years | 11 (0.5%) | 28 (1.3%) |
| 35 to 64 Years | 57 (1.4%) | 76 (1.9%) |
| 65 to 74 Years | 66 (5.7%) | 76 (6.6%) |
| 75 Years and over | 92 (14.7%) | 116 (11.8%) |
Disability Class: Cognitive Difficulty
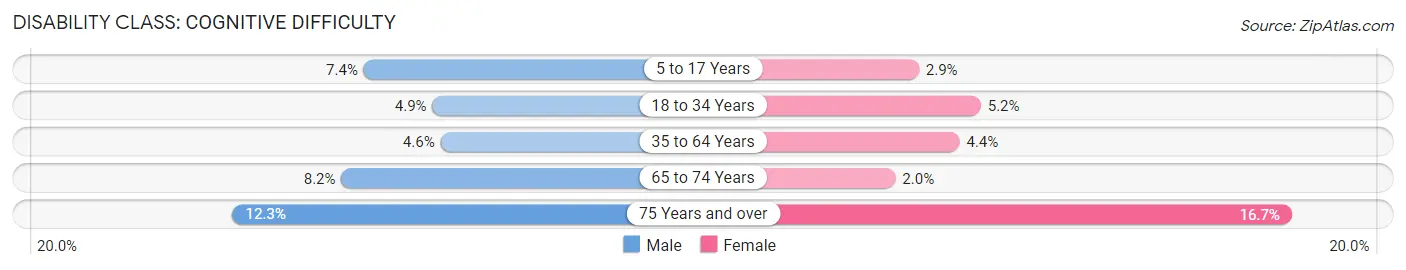
| Age Bracket | Male | Female |
| 5 to 17 Years | 151 (7.4%) | 52 (2.9%) |
| 18 to 34 Years | 115 (4.9%) | 113 (5.2%) |
| 35 to 64 Years | 189 (4.6%) | 170 (4.4%) |
| 65 to 74 Years | 96 (8.2%) | 23 (2.0%) |
| 75 Years and over | 77 (12.3%) | 164 (16.7%) |
Disability Class: Ambulatory Difficulty
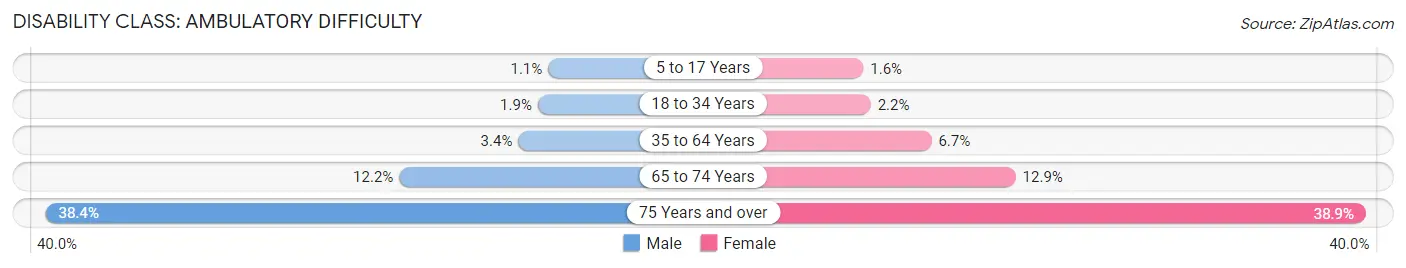
| Age Bracket | Male | Female |
| 5 to 17 Years | 23 (1.1%) | 29 (1.6%) |
| 18 to 34 Years | 45 (1.9%) | 47 (2.1%) |
| 35 to 64 Years | 139 (3.4%) | 259 (6.7%) |
| 65 to 74 Years | 142 (12.2%) | 149 (12.9%) |
| 75 Years and over | 241 (38.4%) | 382 (38.9%) |
Disability Class: Self-Care Difficulty
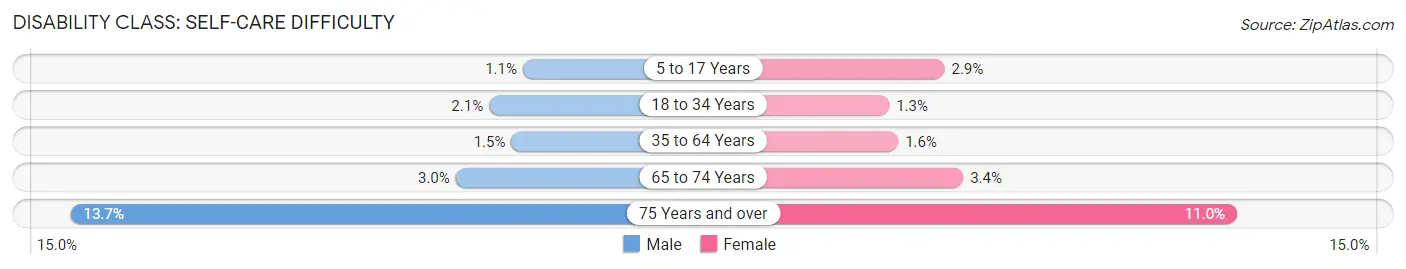
| Age Bracket | Male | Female |
| 5 to 17 Years | 23 (1.1%) | 52 (2.9%) |
| 18 to 34 Years | 49 (2.1%) | 29 (1.3%) |
| 35 to 64 Years | 60 (1.5%) | 61 (1.6%) |
| 65 to 74 Years | 35 (3.0%) | 39 (3.4%) |
| 75 Years and over | 86 (13.7%) | 108 (11.0%) |
Technology Access in Mahaska County
Computing Device Access in Mahaska County
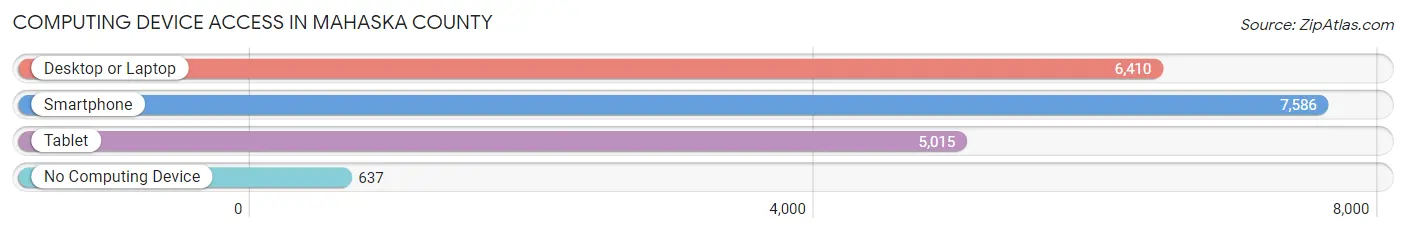
| Device Type | # Households | % Households |
| Desktop or Laptop | 6,410 | 72.2% |
| Smartphone | 7,586 | 85.5% |
| Tablet | 5,015 | 56.5% |
| No Computing Device | 637 | 7.2% |
| Total | 8,873 | 100.0% |
Internet Access in Mahaska County
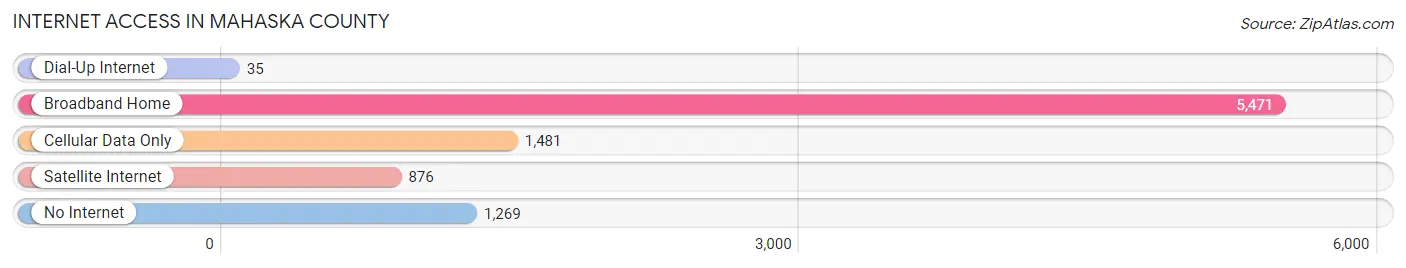
| Internet Type | # Households | % Households |
| Dial-Up Internet | 35 | 0.4% |
| Broadband Home | 5,471 | 61.7% |
| Cellular Data Only | 1,481 | 16.7% |
| Satellite Internet | 876 | 9.9% |
| No Internet | 1,269 | 14.3% |
| Total | 8,873 | 100.0% |
Mahaska County Summary
Mahaaska County is located in the south-central part of the state of Iowa, in the United States. It is bordered by Keokuk County to the north, Wapello County to the east, Appanoose County to the south, and Poweshiek County to the west. The county seat is Oskaloosa, and the largest city is also Oskaloosa. The county was established in 1843 and named after the Mahaska Native American tribe.
Geography
Mahaska County covers an area of 576 square miles, of which 574 square miles is land and 2 square miles is water. The county is located in the Des Moines River Valley, and is drained by the Des Moines River and its tributaries. The highest point in the county is located in the northwest corner, at an elevation of 1,068 feet. The county is mostly flat, with rolling hills in the northwest corner. The soil is mostly loam, with some clay and sand.
The county is home to several parks and recreational areas, including Lake Keomah State Park, Lake Red Rock, and the Des Moines River Wildlife Area.
Demographics
As of the 2010 census, Mahaska County had a population of 22,141. The racial makeup of the county was 95.2% White, 1.2% African American, 0.4% Native American, 0.6% Asian, 0.1% Pacific Islander, 1.3% from other races, and 1.2% from two or more races. Hispanic or Latino of any race were 3.2% of the population.
The median income for a household in the county was $45,845, and the median income for a family was $54,845. The per capita income for the county was $21,845. About 8.2% of families and 11.2% of the population were below the poverty line, including 15.2% of those under age 18 and 8.2% of those age 65 or over.
Economy
The economy of Mahaska County is largely based on agriculture, with corn, soybeans, and hogs being the main crops. The county is also home to several manufacturing companies, including John Deere, Pella Corporation, and Vermeer Manufacturing.
The county is served by two airports, Oskaloosa Municipal Airport and Pella Municipal Airport. The county is also served by two railroads, the Iowa Interstate Railroad and the Union Pacific Railroad.
History
Mahaska County was established in 1843 and named after the Mahaska Native American tribe. The county seat was originally located in the town of Mahaska, but was moved to Oskaloosa in 1847.
The county was home to several Native American tribes, including the Mahaska, Sauk, Fox, and Ioway. The first white settlers arrived in the area in the 1830s, and the county was officially organized in 1843.
The county was an important agricultural center during the 19th century, and the first railroad line was built in 1867. The county was also home to several coal mines, which were in operation until the early 20th century.
In the early 20th century, the county was home to several large manufacturing companies, including John Deere, Pella Corporation, and Vermeer Manufacturing. The county also became an important center for education, with several colleges and universities located in the area.
Today, Mahaska County is a largely rural area, with agriculture and manufacturing being the main industries. The county is also home to several parks and recreational areas, and is served by two airports and two railroads.
Common Questions
What is Per Capita Income in Mahaska County?
Per Capita income in Mahaska County is $33,812.
What is the Median Family Income in Mahaska County?
Median Family Income in Mahaska County is $81,257.
What is the Median Household income in Mahaska County?
Median Household Income in Mahaska County is $65,200.
What is Income or Wage Gap in Mahaska County?
Income or Wage Gap in Mahaska County is 37.3%.
Women in Mahaska County earn 62.7 cents for every dollar earned by a man.
What is Family Income Deficit in Mahaska County?
Family Income Deficit in Mahaska County is $8,895.
Families that are below poverty line in Mahaska County earn $8,895 less on average than the poverty threshold level.
What is Inequality or Gini Index in Mahaska County?
Inequality or Gini Index in Mahaska County is 0.43.
What is the Total Population of Mahaska County?
Total Population of Mahaska County is 22,059.
What is the Total Male Population of Mahaska County?
Total Male Population of Mahaska County is 11,202.
What is the Total Female Population of Mahaska County?
Total Female Population of Mahaska County is 10,857.
What is the Ratio of Males per 100 Females in Mahaska County?
There are 103.18 Males per 100 Females in Mahaska County.
What is the Ratio of Females per 100 Males in Mahaska County?
There are 96.92 Females per 100 Males in Mahaska County.
What is the Median Population Age in Mahaska County?
Median Population Age in Mahaska County is 39.6 Years.
What is the Average Family Size in Mahaska County
Average Family Size in Mahaska County is 2.9 People.
What is the Average Household Size in Mahaska County
Average Household Size in Mahaska County is 2.4 People.
How Large is the Labor Force in Mahaska County?
There are 11,481 People in the Labor Forcein in Mahaska County.
What is the Percentage of People in the Labor Force in Mahaska County?
65.8% of People are in the Labor Force in Mahaska County.
What is the Unemployment Rate in Mahaska County?
Unemployment Rate in Mahaska County is 3.3%.