Ames, IA Map & Demographics
Ames Map
Ames Overview
$31,050
PER CAPITA INCOME
$101,500
AVG FAMILY INCOME
$57,428
AVG HOUSEHOLD INCOME
20.7%
WAGE / INCOME GAP [ % ]
79.3¢/ $1
WAGE / INCOME GAP [ $ ]
$8,259
FAMILY INCOME DEFICIT
0.49
INEQUALITY / GINI INDEX
66,265
TOTAL POPULATION
35,527
MALE POPULATION
30,738
FEMALE POPULATION
115.58
MALES / 100 FEMALES
86.52
FEMALES / 100 MALES
23.0
MEDIAN AGE
2.8
AVG FAMILY SIZE
2.2
AVG HOUSEHOLD SIZE
39,309
LABOR FORCE [ PEOPLE ]
65.5%
PERCENT IN LABOR FORCE
7.1%
UNEMPLOYMENT RATE
Ames Area Codes
Income in Ames
Income Overview in Ames
Per Capita Income in Ames is $31,050, while median incomes of families and households are $101,500 and $57,428 respectively.
| Characteristic | Number | Measure |
| Per Capita Income | 66,265 | $31,050 |
| Median Family Income | 10,030 | $101,500 |
| Mean Family Income | 10,030 | $127,494 |
| Median Household Income | 25,140 | $57,428 |
| Mean Household Income | 25,140 | $77,909 |
| Income Deficit | 10,030 | $8,259 |
| Wage / Income Gap (%) | 66,265 | 20.66% |
| Wage / Income Gap ($) | 66,265 | 79.34¢ per $1 |
| Gini / Inequality Index | 66,265 | 0.49 |
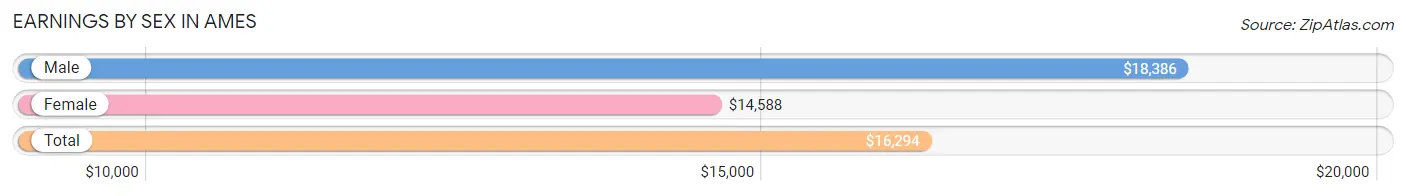
Earnings by Sex in Ames
Average Earnings in Ames are $16,294, $18,386 for men and $14,588 for women, a difference of 20.7%.
| Sex | Number | Average Earnings |
| Male | 26,587 (55.4%) | $18,386 |
| Female | 21,419 (44.6%) | $14,588 |
| Total | 48,006 (100.0%) | $16,294 |
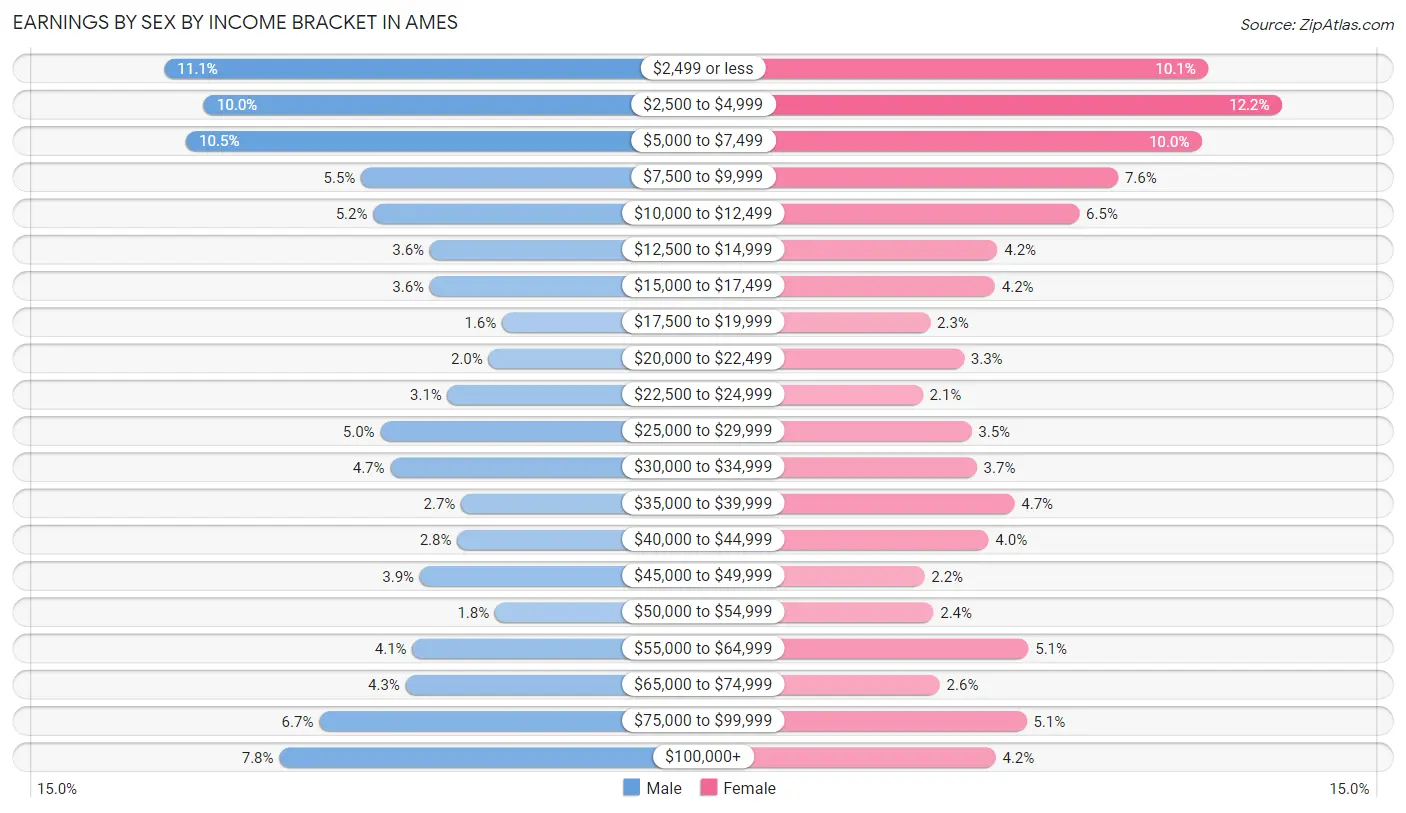
Earnings by Sex by Income Bracket in Ames
The most common earnings brackets in Ames are $2,499 or less for men (2,943 | 11.1%) and $2,500 to $4,999 for women (2,616 | 12.2%).
| Income | Male | Female |
| $2,499 or less | 2,943 (11.1%) | 2,171 (10.1%) |
| $2,500 to $4,999 | 2,648 (10.0%) | 2,616 (12.2%) |
| $5,000 to $7,499 | 2,780 (10.5%) | 2,134 (10.0%) |
| $7,500 to $9,999 | 1,473 (5.5%) | 1,633 (7.6%) |
| $10,000 to $12,499 | 1,382 (5.2%) | 1,398 (6.5%) |
| $12,500 to $14,999 | 960 (3.6%) | 907 (4.2%) |
| $15,000 to $17,499 | 959 (3.6%) | 892 (4.2%) |
| $17,500 to $19,999 | 419 (1.6%) | 501 (2.3%) |
| $20,000 to $22,499 | 522 (2.0%) | 704 (3.3%) |
| $22,500 to $24,999 | 828 (3.1%) | 457 (2.1%) |
| $25,000 to $29,999 | 1,330 (5.0%) | 749 (3.5%) |
| $30,000 to $34,999 | 1,254 (4.7%) | 782 (3.6%) |
| $35,000 to $39,999 | 725 (2.7%) | 1,009 (4.7%) |
| $40,000 to $44,999 | 756 (2.8%) | 852 (4.0%) |
| $45,000 to $49,999 | 1,033 (3.9%) | 467 (2.2%) |
| $50,000 to $54,999 | 474 (1.8%) | 520 (2.4%) |
| $55,000 to $64,999 | 1,090 (4.1%) | 1,092 (5.1%) |
| $65,000 to $74,999 | 1,141 (4.3%) | 559 (2.6%) |
| $75,000 to $99,999 | 1,786 (6.7%) | 1,081 (5.1%) |
| $100,000+ | 2,084 (7.8%) | 895 (4.2%) |
| Total | 26,587 (100.0%) | 21,419 (100.0%) |
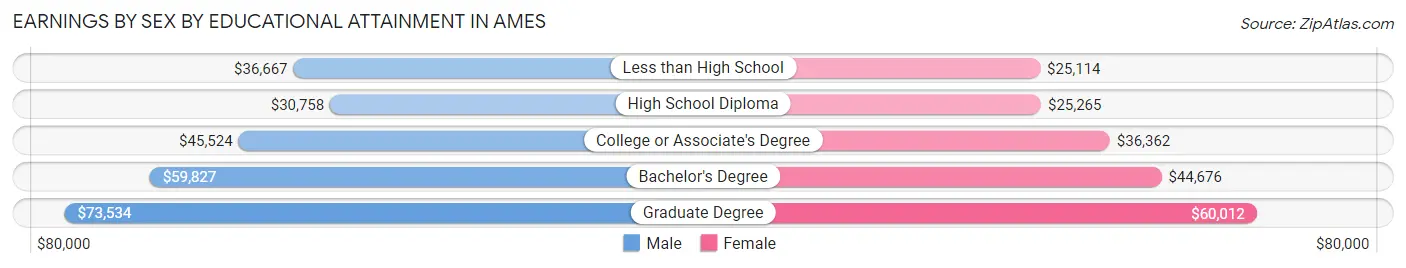
Earnings by Sex by Educational Attainment in Ames
Average earnings in Ames are $51,898 for men and $42,116 for women, a difference of 18.9%. Men with an educational attainment of graduate degree enjoy the highest average annual earnings of $73,534, while those with high school diploma education earn the least with $30,758. Women with an educational attainment of graduate degree earn the most with the average annual earnings of $60,012, while those with less than high school education have the smallest earnings of $25,114.
| Educational Attainment | Male Income | Female Income |
| Less than High School | $36,667 | $25,114 |
| High School Diploma | $30,758 | $25,265 |
| College or Associate's Degree | $45,524 | $36,362 |
| Bachelor's Degree | $59,827 | $44,676 |
| Graduate Degree | $73,534 | $60,012 |
| Total | $51,898 | $42,116 |
Family Income in Ames
Family Income Brackets in Ames
According to the Ames family income data, there are 2,247 families falling into the $100,000 to $149,999 income range, which is the most common income bracket and makes up 22.4% of all families. Conversely, the less than $10,000 income bracket is the least frequent group with only 150 families (1.5%) belonging to this category.
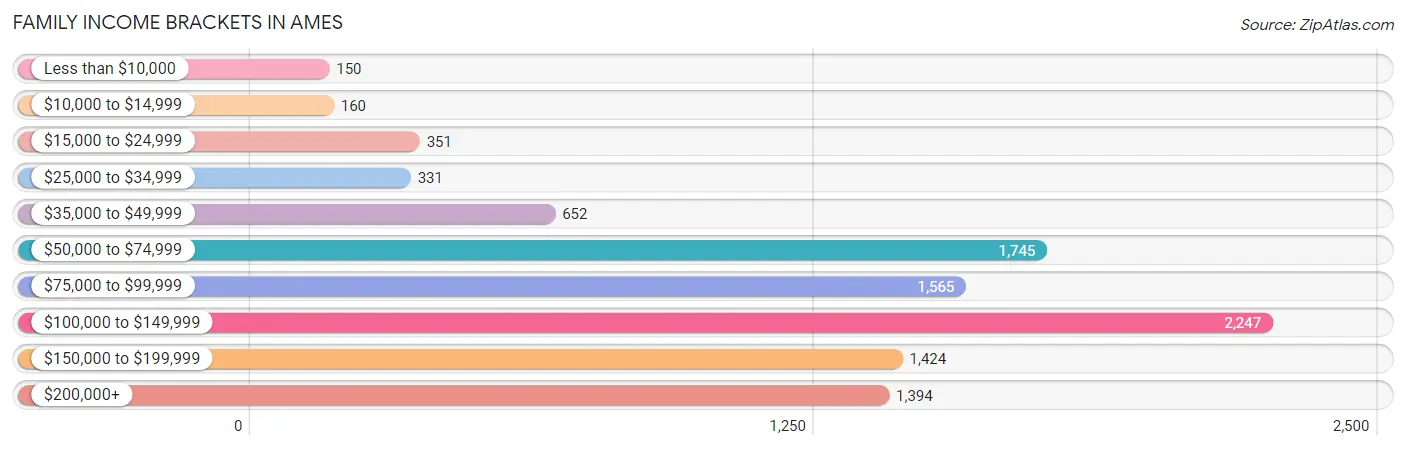
| Income Bracket | # Families | % Families |
| Less than $10,000 | 150 | 1.5% |
| $10,000 to $14,999 | 160 | 1.6% |
| $15,000 to $24,999 | 351 | 3.5% |
| $25,000 to $34,999 | 331 | 3.3% |
| $35,000 to $49,999 | 652 | 6.5% |
| $50,000 to $74,999 | 1,745 | 17.4% |
| $75,000 to $99,999 | 1,565 | 15.6% |
| $100,000 to $149,999 | 2,247 | 22.4% |
| $150,000 to $199,999 | 1,424 | 14.2% |
| $200,000+ | 1,394 | 13.9% |
Family Income by Famaliy Size in Ames
4-person families (1,474 | 14.7%) account for the highest median family income in Ames with $145,395 per family, while 2-person families (5,679 | 56.6%) have the highest median income of $45,682 per family member.
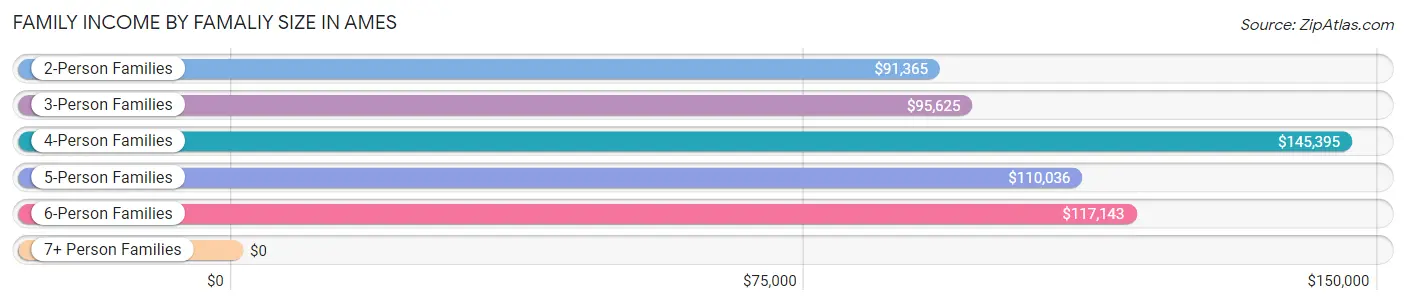
| Income Bracket | # Families | Median Income |
| 2-Person Families | 5,679 (56.6%) | $91,365 |
| 3-Person Families | 2,144 (21.4%) | $95,625 |
| 4-Person Families | 1,474 (14.7%) | $145,395 |
| 5-Person Families | 597 (5.9%) | $110,036 |
| 6-Person Families | 124 (1.2%) | $117,143 |
| 7+ Person Families | 12 (0.1%) | $0 |
| Total | 10,030 (100.0%) | $101,500 |
Family Income by Number of Earners in Ames
The median family income in Ames is $101,500, with families comprising 3+ earners (681) having the highest median family income of $154,583, while families with 1 earner (2,492) have the lowest median family income of $73,580, accounting for 6.8% and 24.8% of families, respectively.
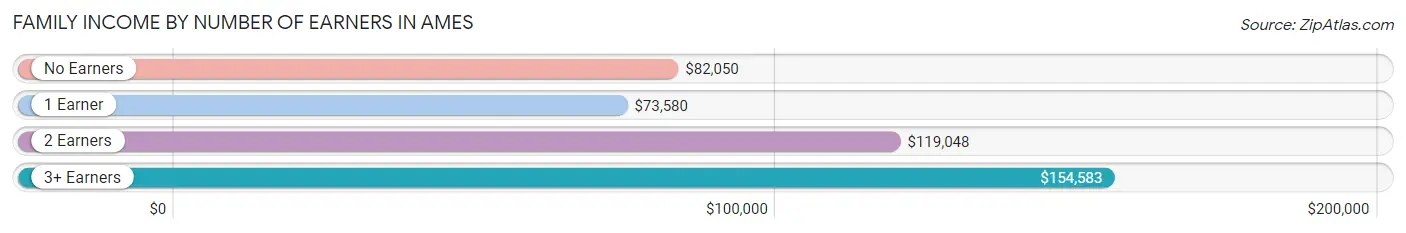
| Number of Earners | # Families | Median Income |
| No Earners | 1,519 (15.1%) | $82,050 |
| 1 Earner | 2,492 (24.8%) | $73,580 |
| 2 Earners | 5,338 (53.2%) | $119,048 |
| 3+ Earners | 681 (6.8%) | $154,583 |
| Total | 10,030 (100.0%) | $101,500 |
Household Income in Ames
Household Income Brackets in Ames
With 4,802 households falling in the category, the $50,000 to $74,999 income range is the most frequent in Ames, accounting for 19.1% of all households. In contrast, only 1,332 households (5.3%) fall into the $10,000 to $14,999 income bracket, making it the least populous group.
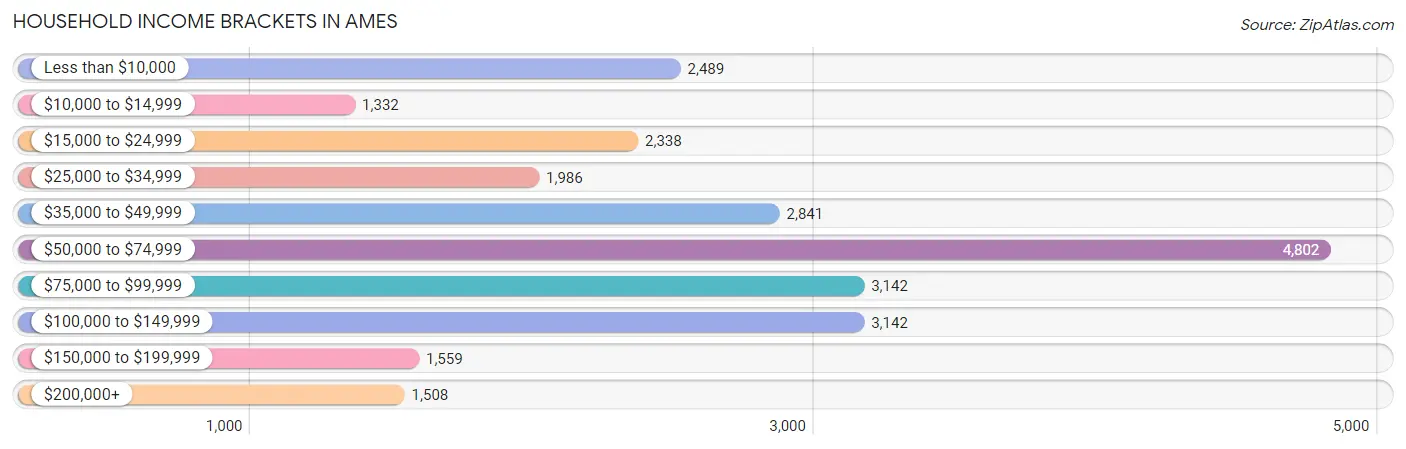
| Income Bracket | # Households | % Households |
| Less than $10,000 | 2,489 | 9.9% |
| $10,000 to $14,999 | 1,332 | 5.3% |
| $15,000 to $24,999 | 2,338 | 9.3% |
| $25,000 to $34,999 | 1,986 | 7.9% |
| $35,000 to $49,999 | 2,841 | 11.3% |
| $50,000 to $74,999 | 4,802 | 19.1% |
| $75,000 to $99,999 | 3,142 | 12.5% |
| $100,000 to $149,999 | 3,142 | 12.5% |
| $150,000 to $199,999 | 1,559 | 6.2% |
| $200,000+ | 1,508 | 6.0% |
Household Income by Householder Age in Ames
The median household income in Ames is $57,428, with the highest median household income of $91,489 found in the 45 to 64 years age bracket for the primary householder. A total of 5,042 households (20.1%) fall into this category. Meanwhile, the 15 to 24 years age bracket for the primary householder has the lowest median household income of $25,849, with 7,346 households (29.2%) in this group.
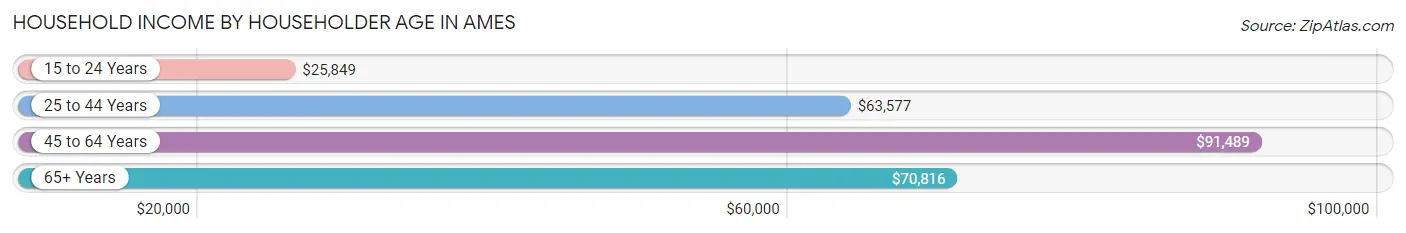
| Income Bracket | # Households | Median Income |
| 15 to 24 Years | 7,346 (29.2%) | $25,849 |
| 25 to 44 Years | 8,224 (32.7%) | $63,577 |
| 45 to 64 Years | 5,042 (20.1%) | $91,489 |
| 65+ Years | 4,528 (18.0%) | $70,816 |
| Total | 25,140 (100.0%) | $57,428 |
Poverty in Ames
Income Below Poverty by Sex and Age in Ames
With 27.7% poverty level for males and 25.8% for females among the residents of Ames, 18 to 24 year old males and 18 to 24 year old females are the most vulnerable to poverty, with 6,614 males (63.6%) and 4,824 females (60.4%) in their respective age groups living below the poverty level.
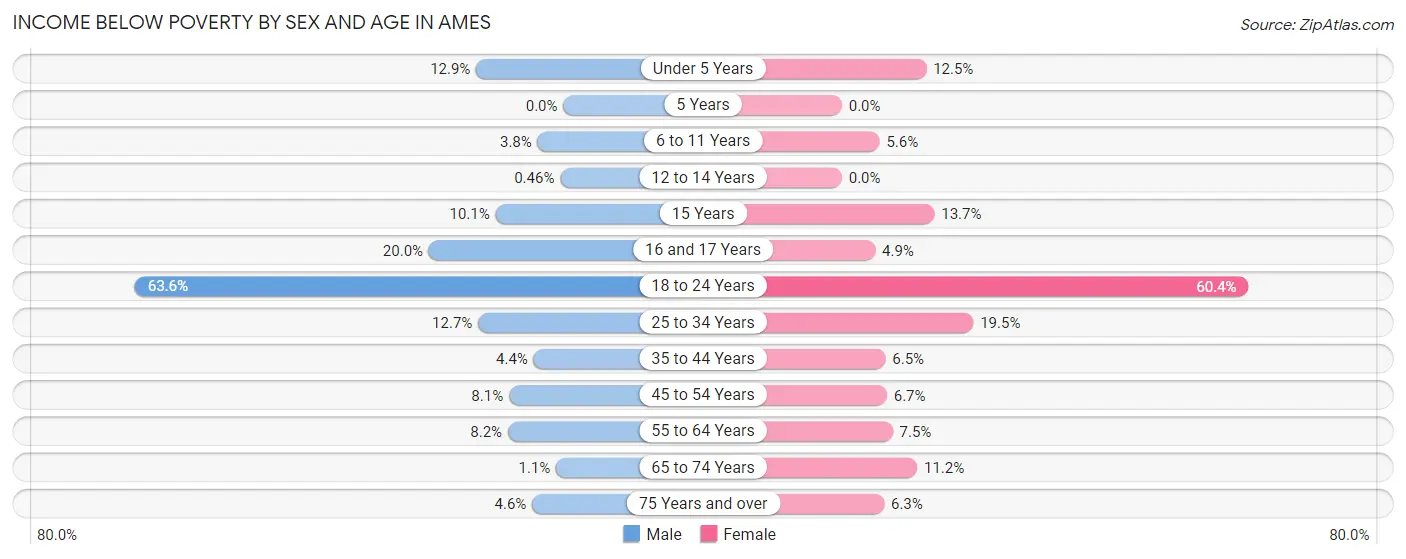
| Age Bracket | Male | Female |
| Under 5 Years | 139 (12.9%) | 122 (12.5%) |
| 5 Years | 0 (0.0%) | 0 (0.0%) |
| 6 to 11 Years | 38 (3.8%) | 61 (5.6%) |
| 12 to 14 Years | 3 (0.5%) | 0 (0.0%) |
| 15 Years | 27 (10.1%) | 18 (13.7%) |
| 16 and 17 Years | 97 (20.0%) | 23 (4.9%) |
| 18 to 24 Years | 6,614 (63.6%) | 4,824 (60.4%) |
| 25 to 34 Years | 619 (12.7%) | 670 (19.5%) |
| 35 to 44 Years | 129 (4.4%) | 161 (6.5%) |
| 45 to 54 Years | 173 (8.1%) | 125 (6.7%) |
| 55 to 64 Years | 177 (8.2%) | 173 (7.5%) |
| 65 to 74 Years | 19 (1.1%) | 237 (11.2%) |
| 75 Years and over | 59 (4.6%) | 102 (6.3%) |
| Total | 8,094 (27.7%) | 6,516 (25.8%) |
Income Above Poverty by Sex and Age in Ames
According to the poverty statistics in Ames, males aged 5 years and females aged 5 years are the age groups that are most secure financially, with 100.0% of males and 100.0% of females in these age groups living above the poverty line.
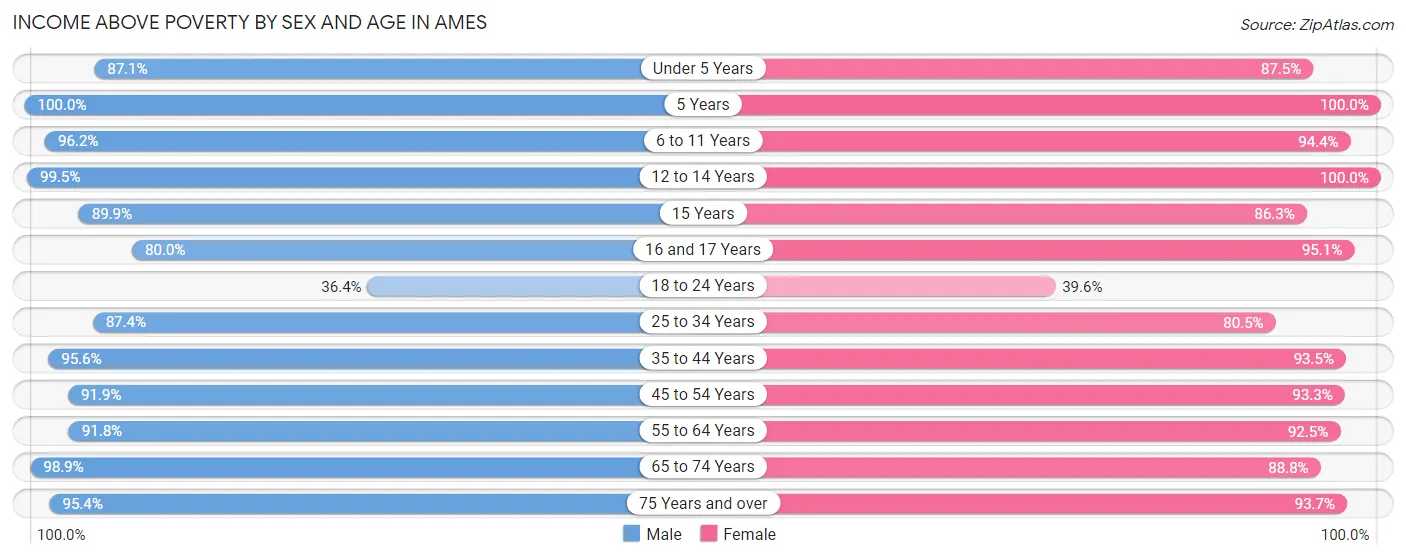
| Age Bracket | Male | Female |
| Under 5 Years | 935 (87.1%) | 852 (87.5%) |
| 5 Years | 194 (100.0%) | 312 (100.0%) |
| 6 to 11 Years | 956 (96.2%) | 1,029 (94.4%) |
| 12 to 14 Years | 656 (99.5%) | 477 (100.0%) |
| 15 Years | 241 (89.9%) | 113 (86.3%) |
| 16 and 17 Years | 389 (80.0%) | 443 (95.1%) |
| 18 to 24 Years | 3,780 (36.4%) | 3,166 (39.6%) |
| 25 to 34 Years | 4,276 (87.4%) | 2,762 (80.5%) |
| 35 to 44 Years | 2,796 (95.6%) | 2,328 (93.5%) |
| 45 to 54 Years | 1,971 (91.9%) | 1,747 (93.3%) |
| 55 to 64 Years | 1,974 (91.8%) | 2,121 (92.5%) |
| 65 to 74 Years | 1,751 (98.9%) | 1,884 (88.8%) |
| 75 Years and over | 1,215 (95.4%) | 1,526 (93.7%) |
| Total | 21,134 (72.3%) | 18,760 (74.2%) |
Income Below Poverty Among Married-Couple Families in Ames
The poverty statistics for married-couple families in Ames show that 2.1% or 170 of the total 8,006 families live below the poverty line. Families with 1 or 2 children have the highest poverty rate of 2.7%, comprising of 65 families. On the other hand, families with 3 or 4 children have the lowest poverty rate of 0.0%, which includes 0 families.
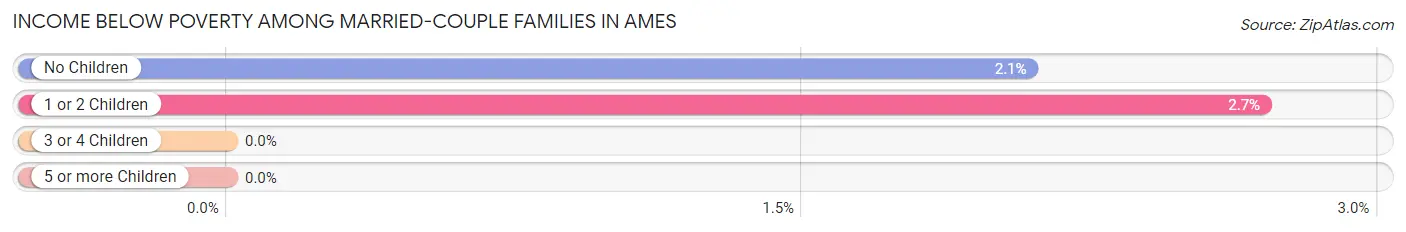
| Children | Above Poverty | Below Poverty |
| No Children | 4,929 (97.9%) | 105 (2.1%) |
| 1 or 2 Children | 2,345 (97.3%) | 65 (2.7%) |
| 3 or 4 Children | 550 (100.0%) | 0 (0.0%) |
| 5 or more Children | 12 (100.0%) | 0 (0.0%) |
| Total | 7,836 (97.9%) | 170 (2.1%) |
Income Below Poverty Among Single-Parent Households in Ames
According to the poverty data in Ames, 13.4% or 96 single-father households and 24.1% or 315 single-mother households are living below the poverty line. Among single-father households, those with no children have the highest poverty rate, with 83 households (17.7%) experiencing poverty. Likewise, among single-mother households, those with 1 or 2 children have the highest poverty rate, with 251 households (33.1%) falling below the poverty line.
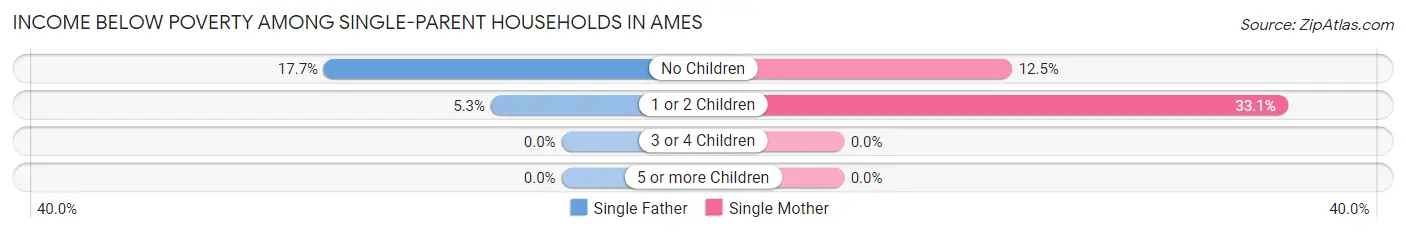
| Children | Single Father | Single Mother |
| No Children | 83 (17.7%) | 64 (12.5%) |
| 1 or 2 Children | 13 (5.3%) | 251 (33.1%) |
| 3 or 4 Children | 0 (0.0%) | 0 (0.0%) |
| 5 or more Children | 0 (0.0%) | 0 (0.0%) |
| Total | 96 (13.4%) | 315 (24.1%) |
Income Below Poverty Among Married-Couple vs Single-Parent Households in Ames
The poverty data for Ames shows that 170 of the married-couple family households (2.1%) and 411 of the single-parent households (20.3%) are living below the poverty level. Within the married-couple family households, those with 1 or 2 children have the highest poverty rate, with 65 households (2.7%) falling below the poverty line. Among the single-parent households, those with 1 or 2 children have the highest poverty rate, with 264 household (26.2%) living below poverty.
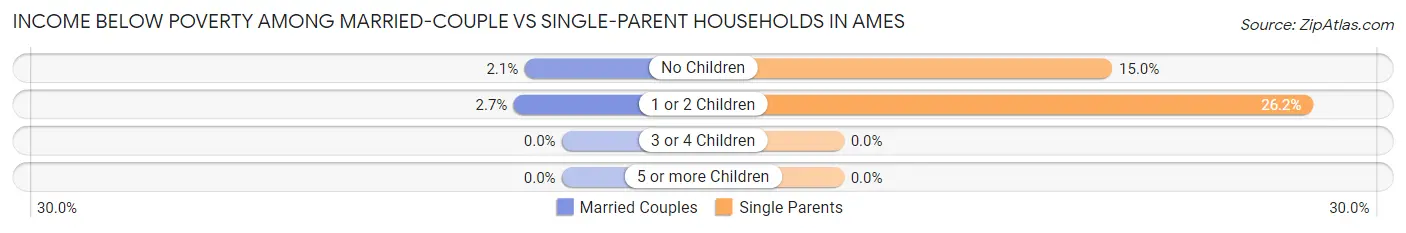
| Children | Married-Couple Families | Single-Parent Households |
| No Children | 105 (2.1%) | 147 (15.0%) |
| 1 or 2 Children | 65 (2.7%) | 264 (26.2%) |
| 3 or 4 Children | 0 (0.0%) | 0 (0.0%) |
| 5 or more Children | 0 (0.0%) | 0 (0.0%) |
| Total | 170 (2.1%) | 411 (20.3%) |
Race in Ames
The most populous races in Ames are White / Caucasian (52,818 | 79.7%), Asian (6,690 | 10.1%), and Two or more Races (3,350 | 5.1%).
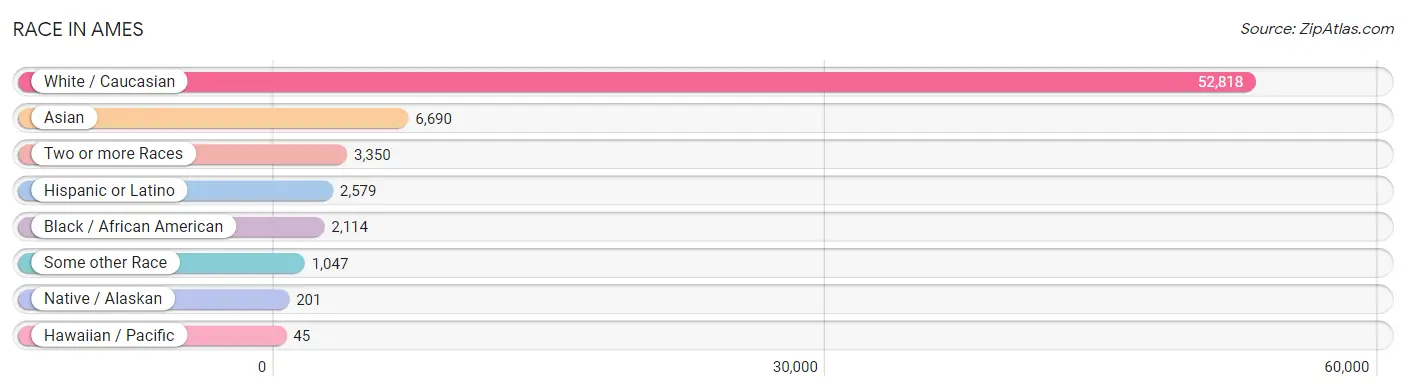
| Race | # Population | % Population |
| Asian | 6,690 | 10.1% |
| Black / African American | 2,114 | 3.2% |
| Hawaiian / Pacific | 45 | 0.1% |
| Hispanic or Latino | 2,579 | 3.9% |
| Native / Alaskan | 201 | 0.3% |
| White / Caucasian | 52,818 | 79.7% |
| Two or more Races | 3,350 | 5.1% |
| Some other Race | 1,047 | 1.6% |
| Total | 66,265 | 100.0% |
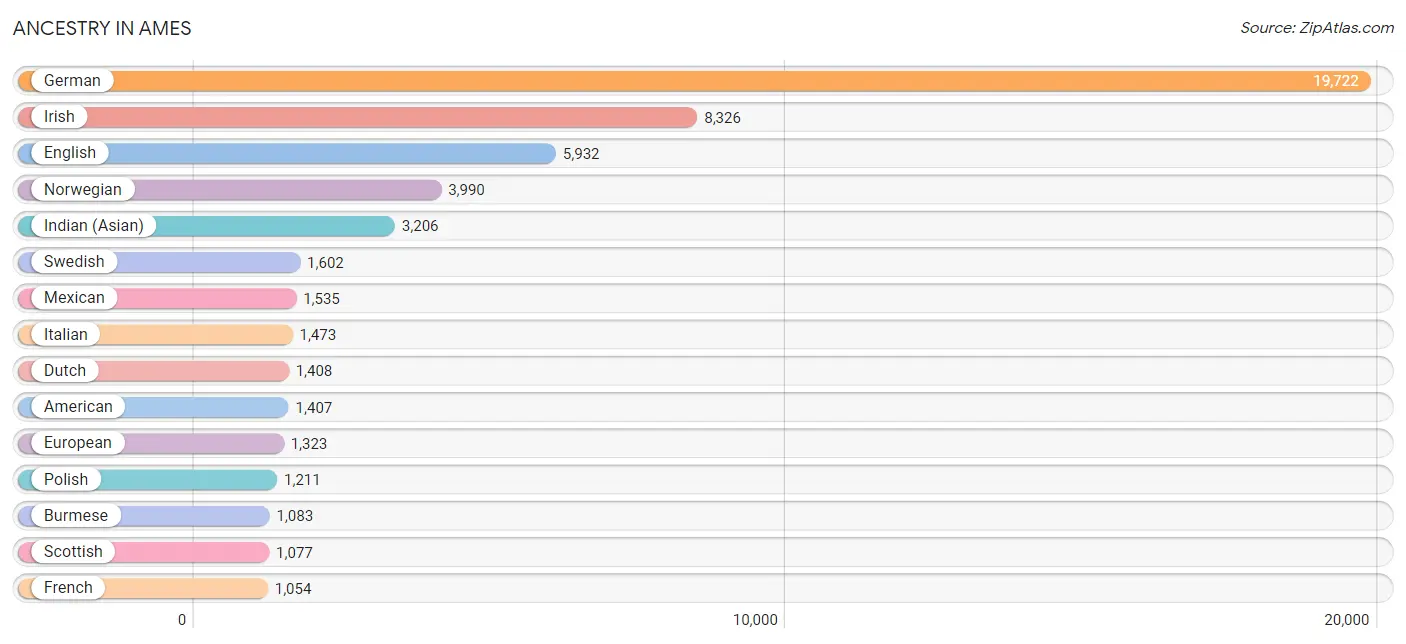
Ancestry in Ames
The most populous ancestries reported in Ames are German (19,722 | 29.8%), Irish (8,326 | 12.6%), English (5,932 | 8.9%), Norwegian (3,990 | 6.0%), and Indian (Asian) (3,206 | 4.8%), together accounting for 62.1% of all Ames residents.
| Ancestry | # Population | % Population |
| African | 393 | 0.6% |
| American | 1,407 | 2.1% |
| Arab | 221 | 0.3% |
| Argentinean | 26 | 0.0% |
| Armenian | 30 | 0.1% |
| Australian | 3 | 0.0% |
| Austrian | 225 | 0.3% |
| Bahamian | 6 | 0.0% |
| Bangladeshi | 61 | 0.1% |
| Barbadian | 17 | 0.0% |
| Belgian | 223 | 0.3% |
| Bhutanese | 331 | 0.5% |
| Blackfeet | 10 | 0.0% |
| Bolivian | 10 | 0.0% |
| Brazilian | 411 | 0.6% |
| British | 759 | 1.1% |
| Bulgarian | 33 | 0.1% |
| Burmese | 1,083 | 1.6% |
| Cambodian | 78 | 0.1% |
| Canadian | 175 | 0.3% |
| Central American | 198 | 0.3% |
| Central American Indian | 27 | 0.0% |
| Cherokee | 137 | 0.2% |
| Chickasaw | 7 | 0.0% |
| Chilean | 10 | 0.0% |
| Chippewa | 11 | 0.0% |
| Choctaw | 5 | 0.0% |
| Colombian | 23 | 0.0% |
| Comanche | 11 | 0.0% |
| Costa Rican | 13 | 0.0% |
| Cree | 6 | 0.0% |
| Croatian | 35 | 0.1% |
| Cuban | 41 | 0.1% |
| Cypriot | 20 | 0.0% |
| Czech | 627 | 0.9% |
| Czechoslovakian | 212 | 0.3% |
| Danish | 1,002 | 1.5% |
| Dutch | 1,408 | 2.1% |
| Eastern European | 93 | 0.1% |
| Egyptian | 7 | 0.0% |
| English | 5,932 | 8.9% |
| European | 1,323 | 2.0% |
| Filipino | 11 | 0.0% |
| Finnish | 101 | 0.2% |
| French | 1,054 | 1.6% |
| French American Indian | 3 | 0.0% |
| French Canadian | 165 | 0.3% |
| German | 19,722 | 29.8% |
| Ghanaian | 8 | 0.0% |
| Greek | 105 | 0.2% |
| Guamanian / Chamorro | 10 | 0.0% |
| Guatemalan | 81 | 0.1% |
| Honduran | 36 | 0.1% |
| Hopi | 4 | 0.0% |
| Hungarian | 140 | 0.2% |
| Icelander | 6 | 0.0% |
| Indian (Asian) | 3,206 | 4.8% |
| Iranian | 348 | 0.5% |
| Irish | 8,326 | 12.6% |
| Iroquois | 29 | 0.0% |
| Israeli | 16 | 0.0% |
| Italian | 1,473 | 2.2% |
| Jamaican | 11 | 0.0% |
| Kenyan | 11 | 0.0% |
| Korean | 736 | 1.1% |
| Laotian | 93 | 0.1% |
| Latvian | 9 | 0.0% |
| Lebanese | 96 | 0.1% |
| Lithuanian | 115 | 0.2% |
| Luxembourger | 15 | 0.0% |
| Malaysian | 114 | 0.2% |
| Mexican | 1,535 | 2.3% |
| Mexican American Indian | 36 | 0.1% |
| Mongolian | 174 | 0.3% |
| Native Hawaiian | 52 | 0.1% |
| Navajo | 4 | 0.0% |
| Nigerian | 116 | 0.2% |
| Northern European | 252 | 0.4% |
| Norwegian | 3,990 | 6.0% |
| Pakistani | 59 | 0.1% |
| Palestinian | 19 | 0.0% |
| Panamanian | 37 | 0.1% |
| Peruvian | 24 | 0.0% |
| Polish | 1,211 | 1.8% |
| Portuguese | 28 | 0.0% |
| Puerto Rican | 150 | 0.2% |
| Romanian | 9 | 0.0% |
| Russian | 247 | 0.4% |
| Salvadoran | 31 | 0.1% |
| Scandinavian | 625 | 0.9% |
| Scotch-Irish | 508 | 0.8% |
| Scottish | 1,077 | 1.6% |
| Serbian | 24 | 0.0% |
| Sioux | 26 | 0.0% |
| Slavic | 31 | 0.1% |
| Slovak | 22 | 0.0% |
| Slovene | 31 | 0.1% |
| Somali | 38 | 0.1% |
| South African | 16 | 0.0% |
| South American | 221 | 0.3% |
| South American Indian | 5 | 0.0% |
| Spaniard | 73 | 0.1% |
| Spanish | 97 | 0.2% |
| Sri Lankan | 663 | 1.0% |
| Subsaharan African | 1,010 | 1.5% |
| Sudanese | 311 | 0.5% |
| Swedish | 1,602 | 2.4% |
| Swiss | 286 | 0.4% |
| Thai | 815 | 1.2% |
| Tongan | 12 | 0.0% |
| Turkish | 73 | 0.1% |
| Ugandan | 34 | 0.1% |
| Ukrainian | 100 | 0.2% |
| Uruguayan | 19 | 0.0% |
| Venezuelan | 109 | 0.2% |
| Vietnamese | 189 | 0.3% |
| Welsh | 389 | 0.6% |
| Yaqui | 30 | 0.1% |
| Yugoslavian | 9 | 0.0% | View All 119 Rows |
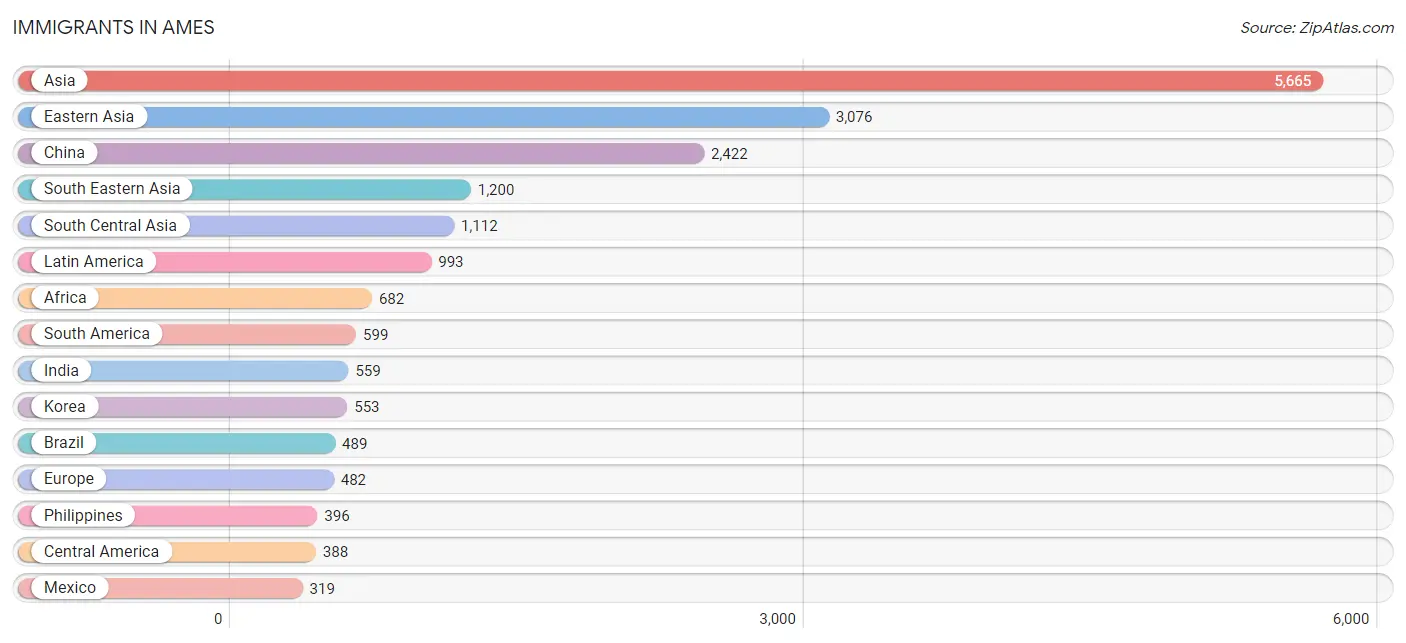
Immigrants in Ames
The most numerous immigrant groups reported in Ames came from Asia (5,665 | 8.6%), Eastern Asia (3,076 | 4.6%), China (2,422 | 3.7%), South Eastern Asia (1,200 | 1.8%), and South Central Asia (1,112 | 1.7%), together accounting for 20.3% of all Ames residents.
| Immigration Origin | # Population | % Population |
| Africa | 682 | 1.0% |
| Argentina | 9 | 0.0% |
| Asia | 5,665 | 8.6% |
| Bahamas | 6 | 0.0% |
| Bangladesh | 179 | 0.3% |
| Brazil | 489 | 0.7% |
| Bulgaria | 33 | 0.1% |
| Canada | 85 | 0.1% |
| Caribbean | 6 | 0.0% |
| Central America | 388 | 0.6% |
| Chile | 5 | 0.0% |
| China | 2,422 | 3.7% |
| Colombia | 23 | 0.0% |
| Denmark | 5 | 0.0% |
| Eastern Africa | 302 | 0.5% |
| Eastern Asia | 3,076 | 4.6% |
| Eastern Europe | 152 | 0.2% |
| Egypt | 42 | 0.1% |
| England | 20 | 0.0% |
| Ethiopia | 110 | 0.2% |
| Europe | 482 | 0.7% |
| France | 17 | 0.0% |
| Germany | 132 | 0.2% |
| Ghana | 6 | 0.0% |
| Guatemala | 57 | 0.1% |
| Honduras | 12 | 0.0% |
| Hong Kong | 41 | 0.1% |
| Hungary | 17 | 0.0% |
| India | 559 | 0.8% |
| Indonesia | 171 | 0.3% |
| Iran | 231 | 0.4% |
| Iraq | 86 | 0.1% |
| Ireland | 9 | 0.0% |
| Italy | 52 | 0.1% |
| Japan | 23 | 0.0% |
| Kazakhstan | 21 | 0.0% |
| Kenya | 28 | 0.0% |
| Korea | 553 | 0.8% |
| Laos | 33 | 0.1% |
| Latin America | 993 | 1.5% |
| Latvia | 20 | 0.0% |
| Lebanon | 81 | 0.1% |
| Lithuania | 5 | 0.0% |
| Malaysia | 209 | 0.3% |
| Mexico | 319 | 0.5% |
| Morocco | 9 | 0.0% |
| Nepal | 73 | 0.1% |
| Netherlands | 10 | 0.0% |
| Nigeria | 131 | 0.2% |
| Northern Africa | 171 | 0.3% |
| Northern Europe | 78 | 0.1% |
| Norway | 5 | 0.0% |
| Pakistan | 42 | 0.1% |
| Peru | 7 | 0.0% |
| Philippines | 396 | 0.6% |
| Russia | 33 | 0.1% |
| Saudi Arabia | 25 | 0.0% |
| Senegal | 30 | 0.1% |
| Singapore | 55 | 0.1% |
| Somalia | 16 | 0.0% |
| South Africa | 16 | 0.0% |
| South America | 599 | 0.9% |
| South Central Asia | 1,112 | 1.7% |
| South Eastern Asia | 1,200 | 1.8% |
| Southern Europe | 93 | 0.1% |
| Spain | 41 | 0.1% |
| Sri Lanka | 7 | 0.0% |
| Sudan | 120 | 0.2% |
| Sweden | 10 | 0.0% |
| Taiwan | 141 | 0.2% |
| Thailand | 27 | 0.0% |
| Turkey | 65 | 0.1% |
| Uganda | 63 | 0.1% |
| Ukraine | 38 | 0.1% |
| Uruguay | 19 | 0.0% |
| Venezuela | 47 | 0.1% |
| Vietnam | 309 | 0.5% |
| Western Africa | 170 | 0.3% |
| Western Asia | 277 | 0.4% |
| Western Europe | 159 | 0.2% | View All 80 Rows |
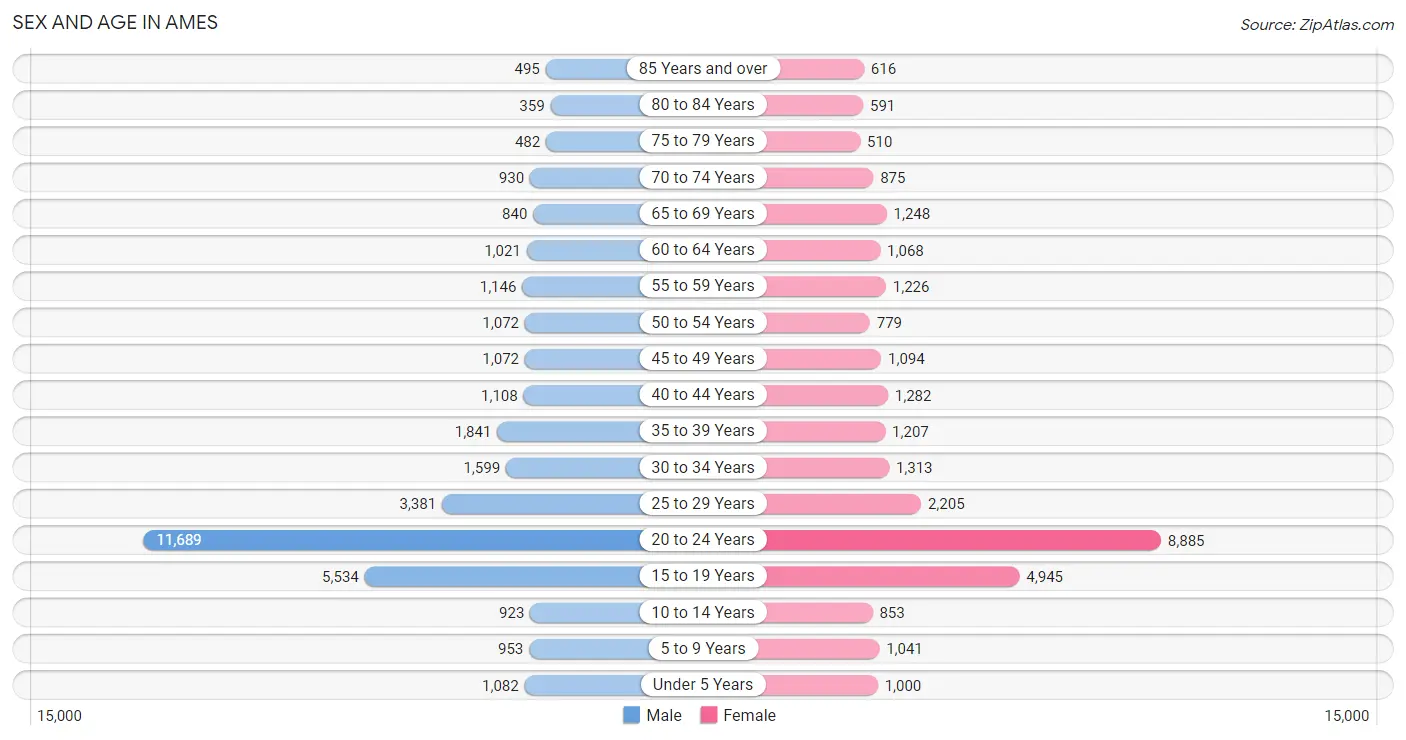
Sex and Age in Ames
Sex and Age in Ames
The most populous age groups in Ames are 20 to 24 Years (11,689 | 32.9%) for men and 20 to 24 Years (8,885 | 28.9%) for women.
| Age Bracket | Male | Female |
| Under 5 Years | 1,082 (3.0%) | 1,000 (3.3%) |
| 5 to 9 Years | 953 (2.7%) | 1,041 (3.4%) |
| 10 to 14 Years | 923 (2.6%) | 853 (2.8%) |
| 15 to 19 Years | 5,534 (15.6%) | 4,945 (16.1%) |
| 20 to 24 Years | 11,689 (32.9%) | 8,885 (28.9%) |
| 25 to 29 Years | 3,381 (9.5%) | 2,205 (7.2%) |
| 30 to 34 Years | 1,599 (4.5%) | 1,313 (4.3%) |
| 35 to 39 Years | 1,841 (5.2%) | 1,207 (3.9%) |
| 40 to 44 Years | 1,108 (3.1%) | 1,282 (4.2%) |
| 45 to 49 Years | 1,072 (3.0%) | 1,094 (3.6%) |
| 50 to 54 Years | 1,072 (3.0%) | 779 (2.5%) |
| 55 to 59 Years | 1,146 (3.2%) | 1,226 (4.0%) |
| 60 to 64 Years | 1,021 (2.9%) | 1,068 (3.5%) |
| 65 to 69 Years | 840 (2.4%) | 1,248 (4.1%) |
| 70 to 74 Years | 930 (2.6%) | 875 (2.9%) |
| 75 to 79 Years | 482 (1.4%) | 510 (1.7%) |
| 80 to 84 Years | 359 (1.0%) | 591 (1.9%) |
| 85 Years and over | 495 (1.4%) | 616 (2.0%) |
| Total | 35,527 (100.0%) | 30,738 (100.0%) |
Families and Households in Ames
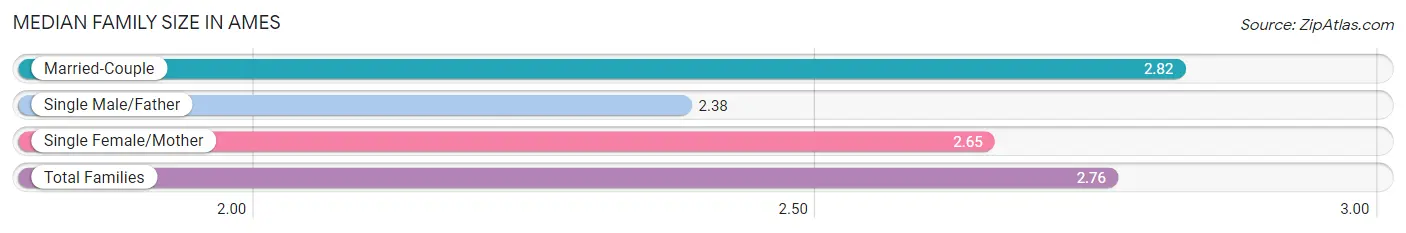
Median Family Size in Ames
The median family size in Ames is 2.76 persons per family, with married-couple families (8,006 | 79.8%) accounting for the largest median family size of 2.82 persons per family. On the other hand, single male/father families (716 | 7.1%) represent the smallest median family size with 2.38 persons per family.
| Family Type | # Families | Family Size |
| Married-Couple | 8,006 (79.8%) | 2.82 |
| Single Male/Father | 716 (7.1%) | 2.38 |
| Single Female/Mother | 1,308 (13.0%) | 2.65 |
| Total Families | 10,030 (100.0%) | 2.76 |
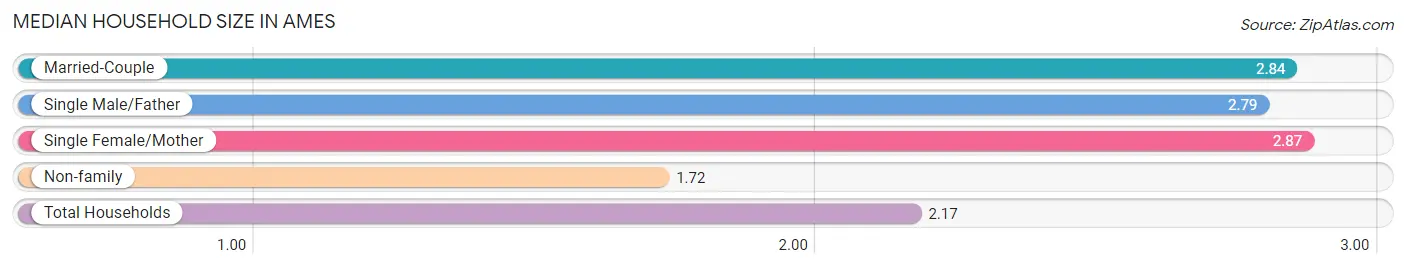
Median Household Size in Ames
The median household size in Ames is 2.17 persons per household, with single female/mother households (1,308 | 5.2%) accounting for the largest median household size of 2.87 persons per household. non-family households (15,110 | 60.1%) represent the smallest median household size with 1.72 persons per household.
| Household Type | # Households | Household Size |
| Married-Couple | 8,006 (31.9%) | 2.84 |
| Single Male/Father | 716 (2.9%) | 2.79 |
| Single Female/Mother | 1,308 (5.2%) | 2.87 |
| Non-family | 15,110 (60.1%) | 1.72 |
| Total Households | 25,140 (100.0%) | 2.17 |
Household Size by Marriage Status in Ames
Out of a total of 25,140 households in Ames, 10,030 (39.9%) are family households, while 15,110 (60.1%) are nonfamily households. The most numerous type of family households are 2-person households, comprising 5,264, and the most common type of nonfamily households are 1-person households, comprising 8,830.
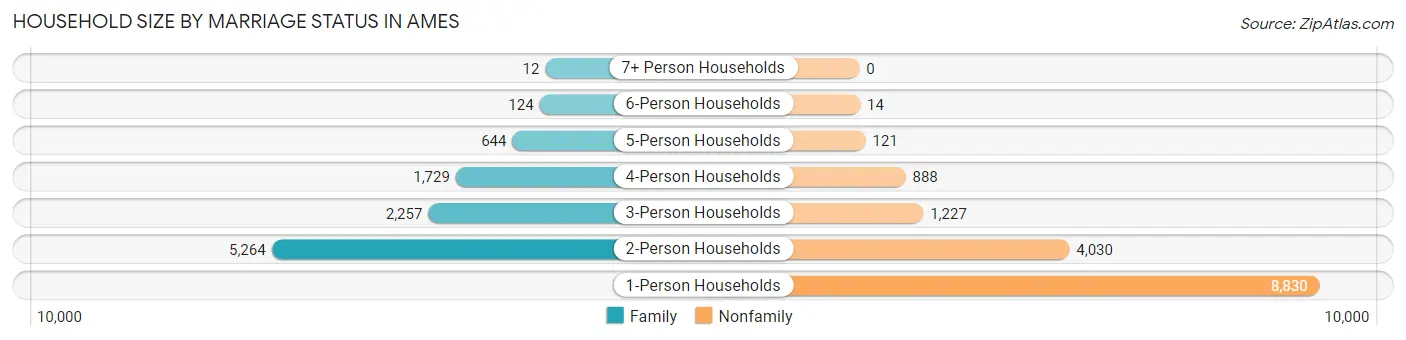
| Household Size | Family Households | Nonfamily Households |
| 1-Person Households | - | 8,830 (35.1%) |
| 2-Person Households | 5,264 (20.9%) | 4,030 (16.0%) |
| 3-Person Households | 2,257 (9.0%) | 1,227 (4.9%) |
| 4-Person Households | 1,729 (6.9%) | 888 (3.5%) |
| 5-Person Households | 644 (2.6%) | 121 (0.5%) |
| 6-Person Households | 124 (0.5%) | 14 (0.1%) |
| 7+ Person Households | 12 (0.1%) | 0 (0.0%) |
| Total | 10,030 (39.9%) | 15,110 (60.1%) |
Female Fertility in Ames
Fertility by Age in Ames
Average fertility rate in Ames is 20.0 births per 1,000 women. Women in the age bracket of 35 to 50 years have the highest fertility rate with 34.0 births per 1,000 women. Women in the age bracket of 20 to 34 years acount for 69.7% of all women with births.
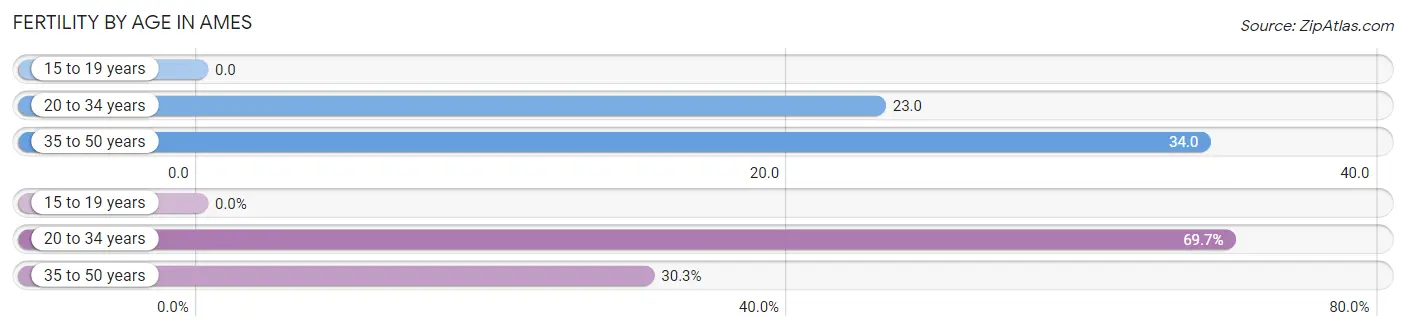
| Age Bracket | Women with Births | Births / 1,000 Women |
| 15 to 19 years | 0 (0.0%) | 0.0 |
| 20 to 34 years | 290 (69.7%) | 23.0 |
| 35 to 50 years | 126 (30.3%) | 34.0 |
| Total | 416 (100.0%) | 20.0 |
Fertility by Age by Marriage Status in Ames
85.6% of women with births (416) in Ames are married. The highest percentage of unmarried women with births falls into 20 to 34 years age bracket with 17.6% of them unmarried at the time of birth, while the lowest percentage of unmarried women with births belong to 35 to 50 years age bracket with 7.1% of them unmarried.
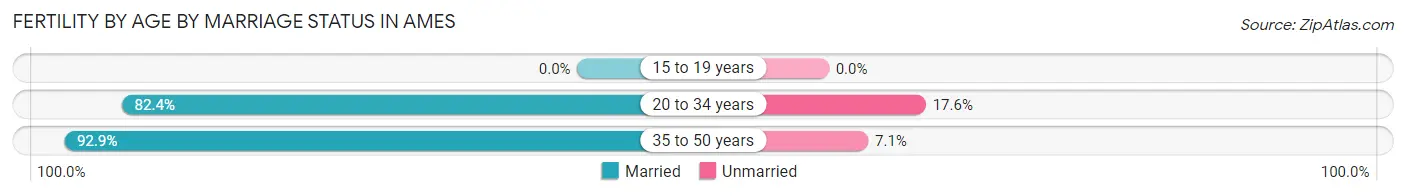
| Age Bracket | Married | Unmarried |
| 15 to 19 years | 0 (0.0%) | 0 (0.0%) |
| 20 to 34 years | 239 (82.4%) | 51 (17.6%) |
| 35 to 50 years | 117 (92.9%) | 9 (7.1%) |
| Total | 356 (85.6%) | 60 (14.4%) |
Fertility by Education in Ames
Average fertility rate in Ames is 20.0 births per 1,000 women. Women with the education attainment of graduate degree have the highest fertility rate of 64.0 births per 1,000 women, while women with the education attainment of college or associate's degree have the lowest fertility at 6.0 births per 1,000 women. Women with the education attainment of graduate degree represent 36.8% of all women with births.
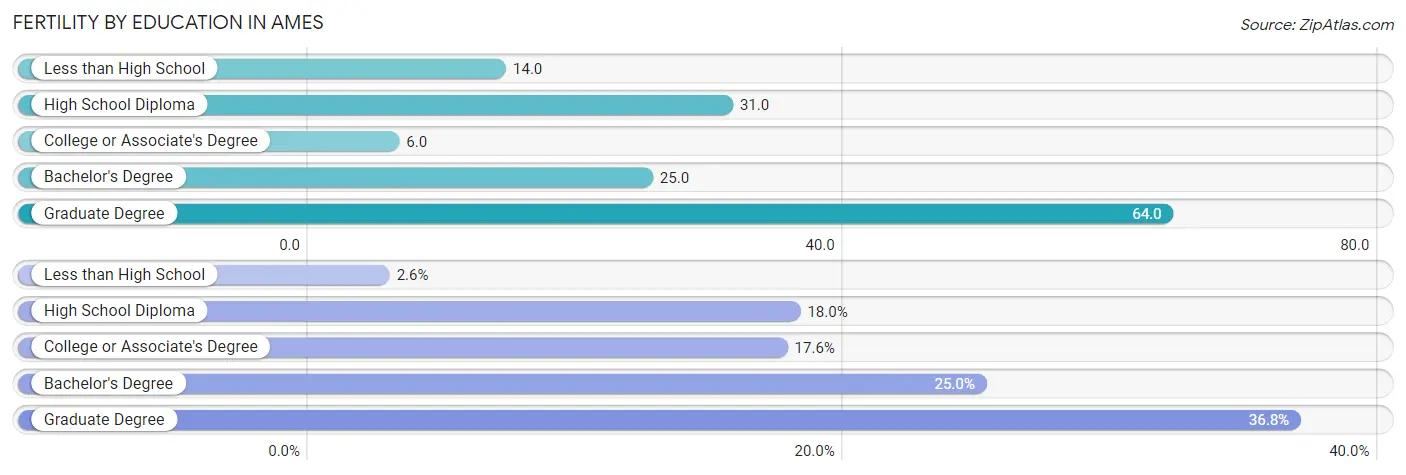
| Educational Attainment | Women with Births | Births / 1,000 Women |
| Less than High School | 11 (2.6%) | 14.0 |
| High School Diploma | 75 (18.0%) | 31.0 |
| College or Associate's Degree | 73 (17.5%) | 6.0 |
| Bachelor's Degree | 104 (25.0%) | 25.0 |
| Graduate Degree | 153 (36.8%) | 64.0 |
| Total | 416 (100.0%) | 20.0 |
Fertility by Education by Marriage Status in Ames
14.4% of women with births in Ames are unmarried. Women with the educational attainment of less than high school are most likely to be married with 100.0% of them married at childbirth, while women with the educational attainment of high school diploma are least likely to be married with 68.0% of them unmarried at childbirth.
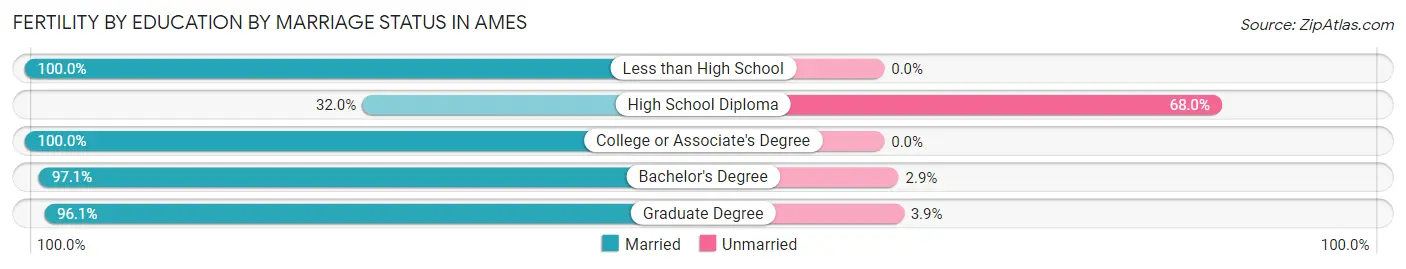
| Educational Attainment | Married | Unmarried |
| Less than High School | 11 (100.0%) | 0 (0.0%) |
| High School Diploma | 24 (32.0%) | 51 (68.0%) |
| College or Associate's Degree | 73 (100.0%) | 0 (0.0%) |
| Bachelor's Degree | 101 (97.1%) | 3 (2.9%) |
| Graduate Degree | 147 (96.1%) | 6 (3.9%) |
| Total | 356 (85.6%) | 60 (14.4%) |
Employment Characteristics in Ames
Employment by Class of Employer in Ames
Among the 35,017 employed individuals in Ames, private company employees (18,250 | 52.1%), state government employees (9,237 | 26.4%), and not-for-profit organizations (2,812 | 8.0%) make up the most common classes of employment.
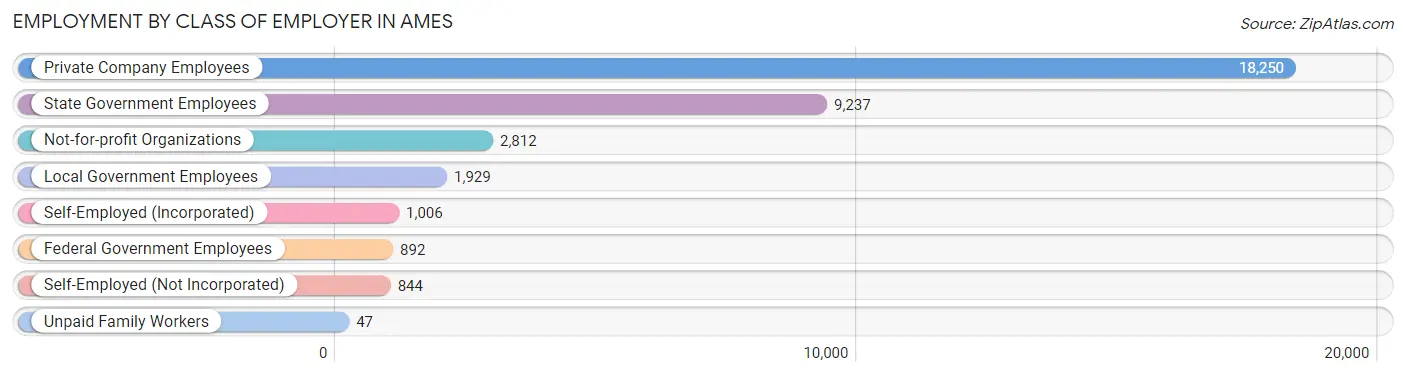
| Employer Class | # Employees | % Employees |
| Private Company Employees | 18,250 | 52.1% |
| Self-Employed (Incorporated) | 1,006 | 2.9% |
| Self-Employed (Not Incorporated) | 844 | 2.4% |
| Not-for-profit Organizations | 2,812 | 8.0% |
| Local Government Employees | 1,929 | 5.5% |
| State Government Employees | 9,237 | 26.4% |
| Federal Government Employees | 892 | 2.5% |
| Unpaid Family Workers | 47 | 0.1% |
| Total | 35,017 | 100.0% |
Employment Status by Age in Ames
According to the labor force statistics for Ames, out of the total population over 16 years of age (60,014), 65.5% or 39,309 individuals are in the labor force, with 7.1% or 2,791 of them unemployed. The age group with the highest labor force participation rate is 25 to 29 years, with 87.2% or 4,871 individuals in the labor force. Within the labor force, the 20 to 24 years age range has the highest percentage of unemployed individuals, with 11.9% or 1,692 of them being unemployed.
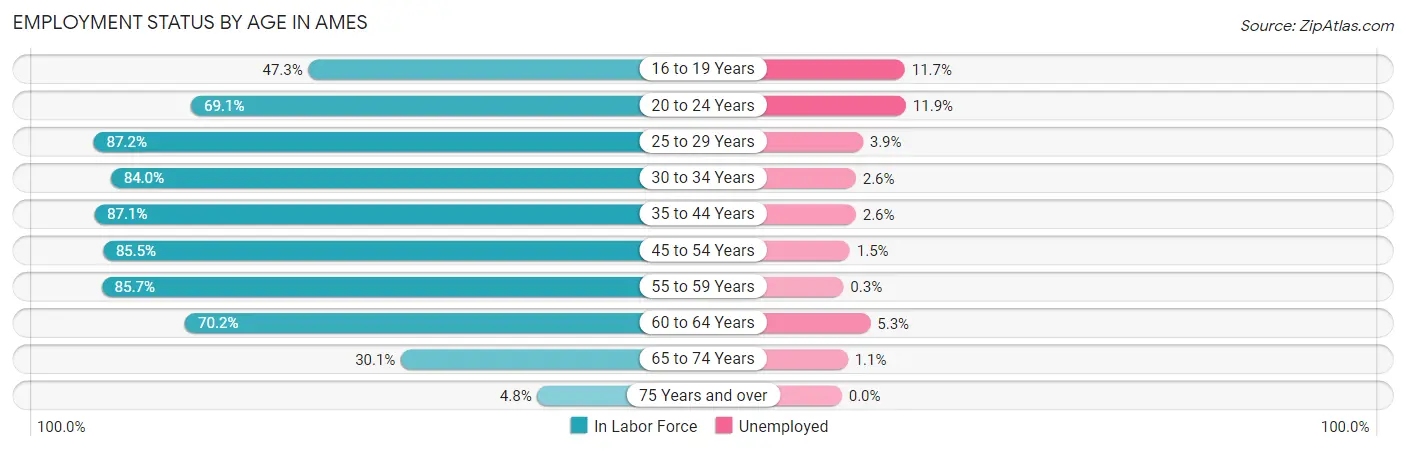
| Age Bracket | In Labor Force | Unemployed |
| 16 to 19 Years | 4,768 (47.3%) | 558 (11.7%) |
| 20 to 24 Years | 14,217 (69.1%) | 1,692 (11.9%) |
| 25 to 29 Years | 4,871 (87.2%) | 190 (3.9%) |
| 30 to 34 Years | 2,446 (84.0%) | 64 (2.6%) |
| 35 to 44 Years | 4,736 (87.1%) | 123 (2.6%) |
| 45 to 54 Years | 3,435 (85.5%) | 52 (1.5%) |
| 55 to 59 Years | 2,033 (85.7%) | 6 (0.3%) |
| 60 to 64 Years | 1,466 (70.2%) | 78 (5.3%) |
| 65 to 74 Years | 1,172 (30.1%) | 13 (1.1%) |
| 75 Years and over | 147 (4.8%) | 0 (0.0%) |
| Total | 39,309 (65.5%) | 2,791 (7.1%) |
Employment Status by Educational Attainment in Ames
According to labor force statistics for Ames, 84.7% of individuals (18,985) out of the total population between 25 and 64 years of age (22,414) are in the labor force, with 2.7% or 513 of them being unemployed. The group with the highest labor force participation rate are those with the educational attainment of bachelor's degree or higher, with 87.3% or 12,543 individuals in the labor force. Within the labor force, individuals with high school diploma education have the highest percentage of unemployment, with 8.0% or 144 of them being unemployed.
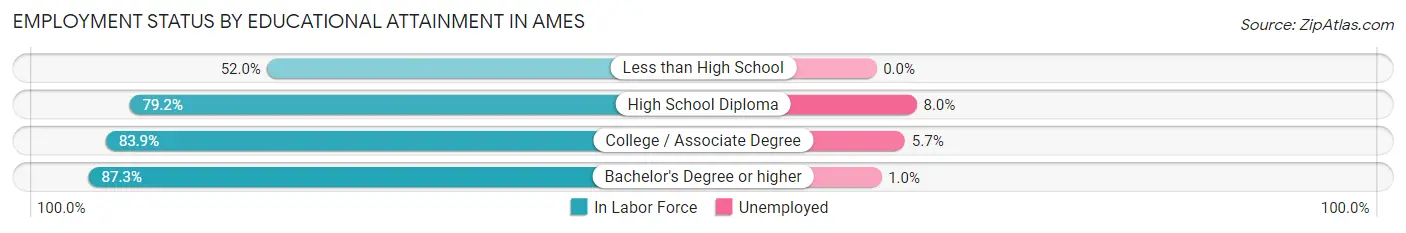
| Educational Attainment | In Labor Force | Unemployed |
| Less than High School | 321 (52.0%) | 0 (0.0%) |
| High School Diploma | 1,797 (79.2%) | 182 (8.0%) |
| College / Associate Degree | 4,329 (83.9%) | 294 (5.7%) |
| Bachelor's Degree or higher | 12,543 (87.3%) | 144 (1.0%) |
| Total | 18,985 (84.7%) | 605 (2.7%) |
Employment Occupations by Sex in Ames
Management, Business, Science and Arts Occupations
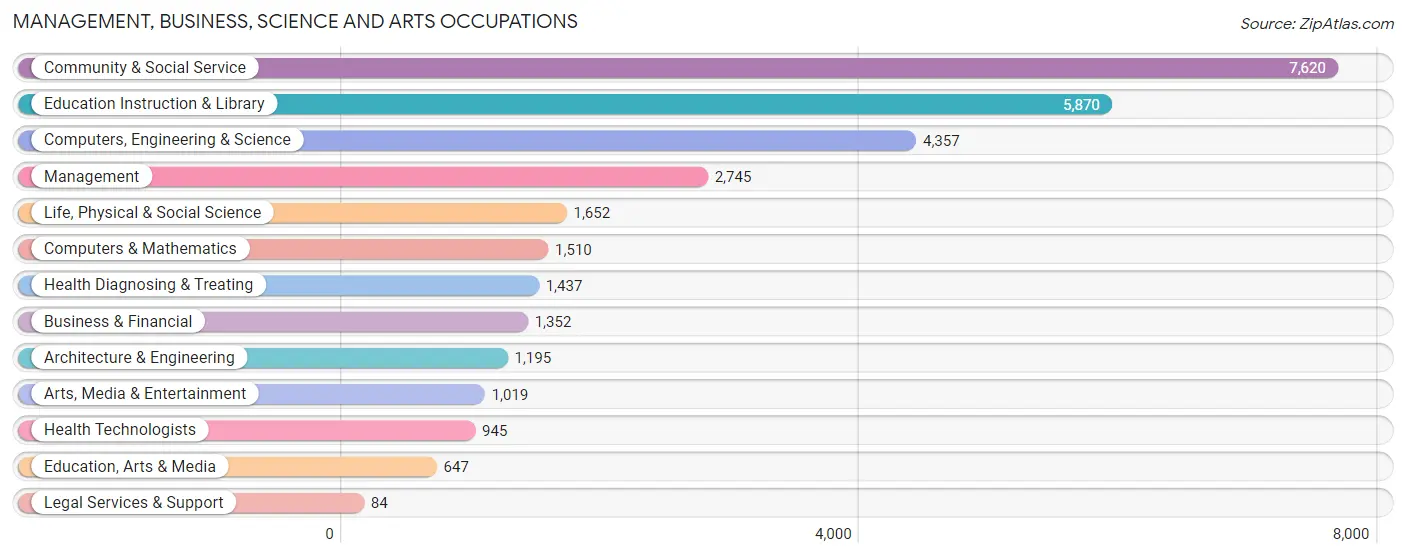
The most common Management, Business, Science and Arts occupations in Ames are Community & Social Service (7,620 | 20.9%), Education Instruction & Library (5,870 | 16.1%), Computers, Engineering & Science (4,357 | 11.9%), Management (2,745 | 7.5%), and Life, Physical & Social Science (1,652 | 4.5%).
Management, Business, Science and Arts Occupations by Sex
Within the Management, Business, Science and Arts occupations in Ames, the most male-oriented occupations are Computers & Mathematics (86.0%), Architecture & Engineering (79.6%), and Computers, Engineering & Science (73.7%), while the most female-oriented occupations are Legal Services & Support (91.7%), Health Diagnosing & Treating (73.4%), and Health Technologists (67.9%).
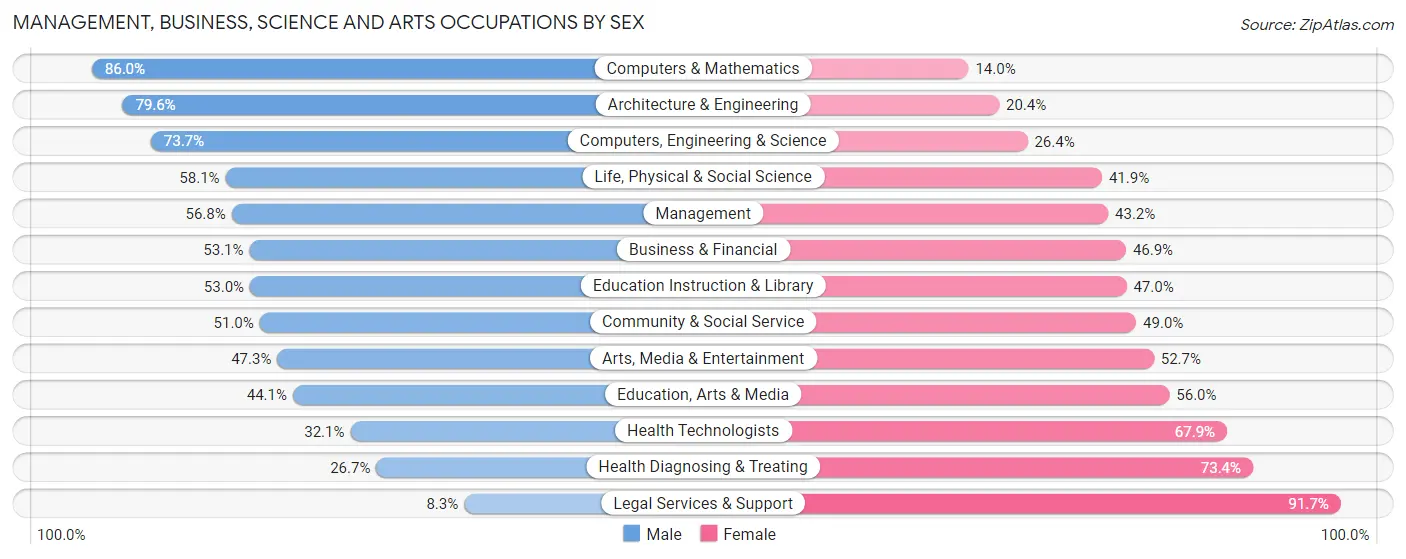
| Occupation | Male | Female |
| Management | 1,560 (56.8%) | 1,185 (43.2%) |
| Business & Financial | 718 (53.1%) | 634 (46.9%) |
| Computers, Engineering & Science | 3,209 (73.7%) | 1,148 (26.4%) |
| Computers & Mathematics | 1,298 (86.0%) | 212 (14.0%) |
| Architecture & Engineering | 951 (79.6%) | 244 (20.4%) |
| Life, Physical & Social Science | 960 (58.1%) | 692 (41.9%) |
| Community & Social Service | 3,885 (51.0%) | 3,735 (49.0%) |
| Education, Arts & Media | 285 (44.1%) | 362 (55.9%) |
| Legal Services & Support | 7 (8.3%) | 77 (91.7%) |
| Education Instruction & Library | 3,111 (53.0%) | 2,759 (47.0%) |
| Arts, Media & Entertainment | 482 (47.3%) | 537 (52.7%) |
| Health Diagnosing & Treating | 383 (26.7%) | 1,054 (73.4%) |
| Health Technologists | 303 (32.1%) | 642 (67.9%) |
| Total (Category) | 9,755 (55.7%) | 7,756 (44.3%) |
| Total (Overall) | 19,805 (54.3%) | 16,659 (45.7%) |
Services Occupations
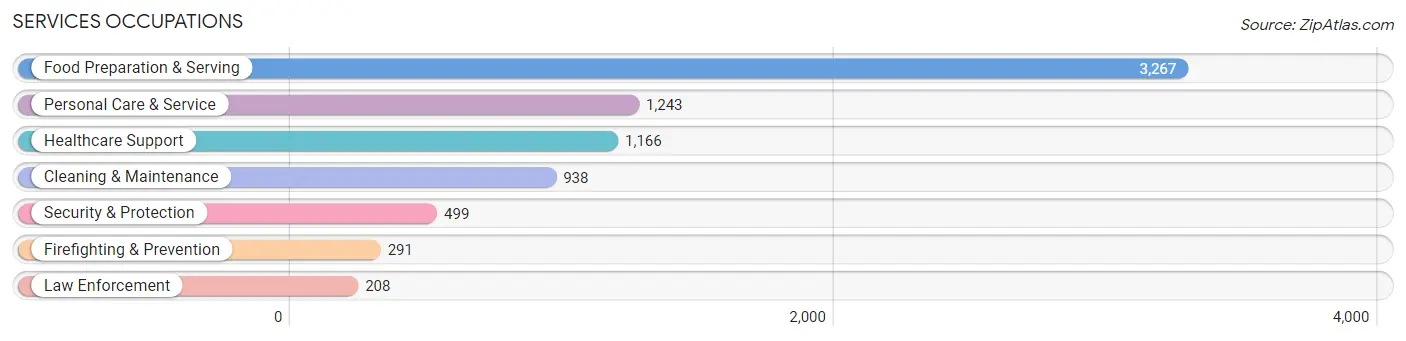
The most common Services occupations in Ames are Food Preparation & Serving (3,267 | 9.0%), Personal Care & Service (1,243 | 3.4%), Healthcare Support (1,166 | 3.2%), Cleaning & Maintenance (938 | 2.6%), and Security & Protection (499 | 1.4%).
Services Occupations by Sex
Within the Services occupations in Ames, the most male-oriented occupations are Cleaning & Maintenance (60.7%), Law Enforcement (42.8%), and Food Preparation & Serving (41.8%), while the most female-oriented occupations are Healthcare Support (91.8%), Personal Care & Service (80.8%), and Firefighting & Prevention (64.6%).
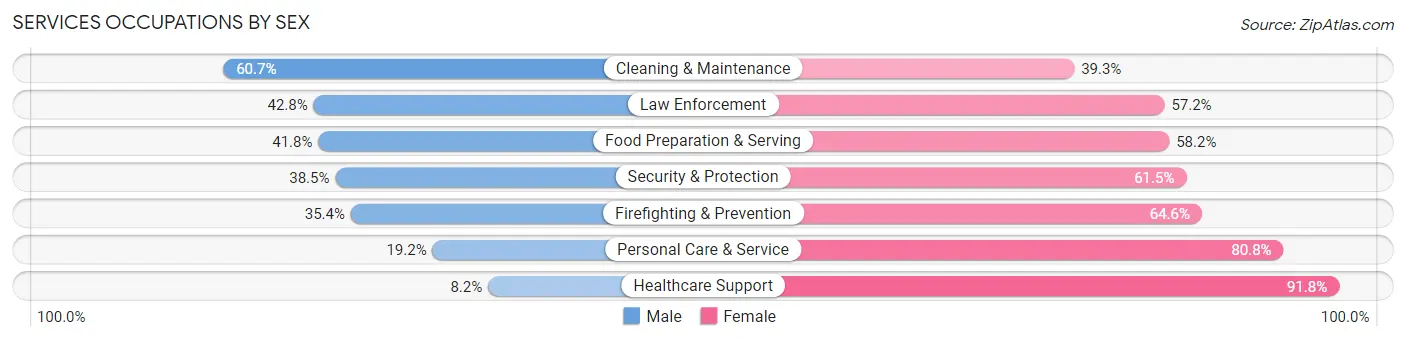
| Occupation | Male | Female |
| Healthcare Support | 96 (8.2%) | 1,070 (91.8%) |
| Security & Protection | 192 (38.5%) | 307 (61.5%) |
| Firefighting & Prevention | 103 (35.4%) | 188 (64.6%) |
| Law Enforcement | 89 (42.8%) | 119 (57.2%) |
| Food Preparation & Serving | 1,367 (41.8%) | 1,900 (58.2%) |
| Cleaning & Maintenance | 569 (60.7%) | 369 (39.3%) |
| Personal Care & Service | 239 (19.2%) | 1,004 (80.8%) |
| Total (Category) | 2,463 (34.6%) | 4,650 (65.4%) |
| Total (Overall) | 19,805 (54.3%) | 16,659 (45.7%) |
Sales and Office Occupations
The most common Sales and Office occupations in Ames are Sales & Related (3,164 | 8.7%), and Office & Administration (3,052 | 8.4%).
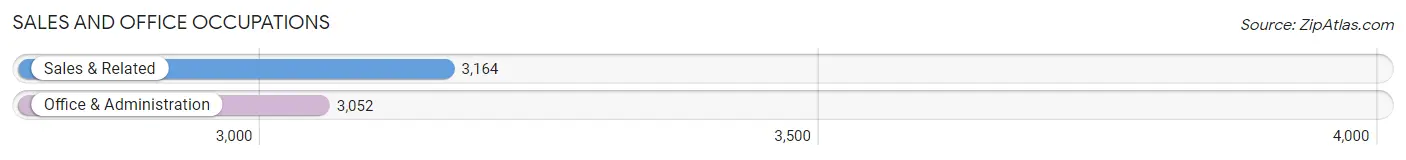
Sales and Office Occupations by Sex
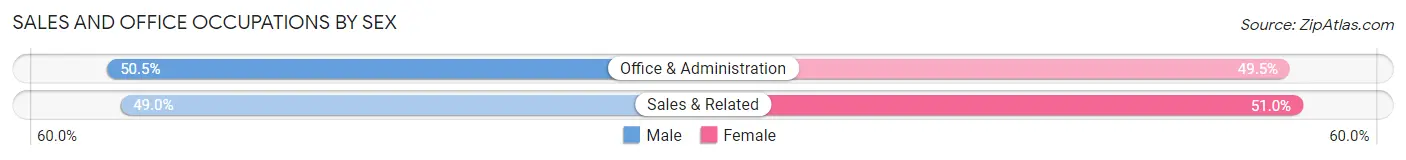
| Occupation | Male | Female |
| Sales & Related | 1,549 (49.0%) | 1,615 (51.0%) |
| Office & Administration | 1,540 (50.5%) | 1,512 (49.5%) |
| Total (Category) | 3,089 (49.7%) | 3,127 (50.3%) |
| Total (Overall) | 19,805 (54.3%) | 16,659 (45.7%) |
Natural Resources, Construction and Maintenance Occupations
The most common Natural Resources, Construction and Maintenance occupations in Ames are Construction & Extraction (934 | 2.6%), Installation, Maintenance & Repair (773 | 2.1%), and Farming, Fishing & Forestry (328 | 0.9%).
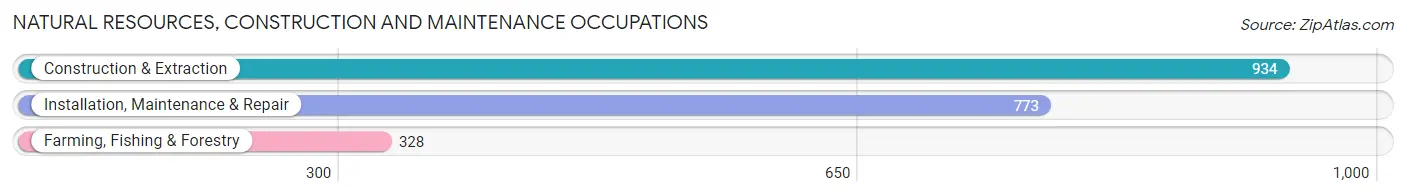
Natural Resources, Construction and Maintenance Occupations by Sex
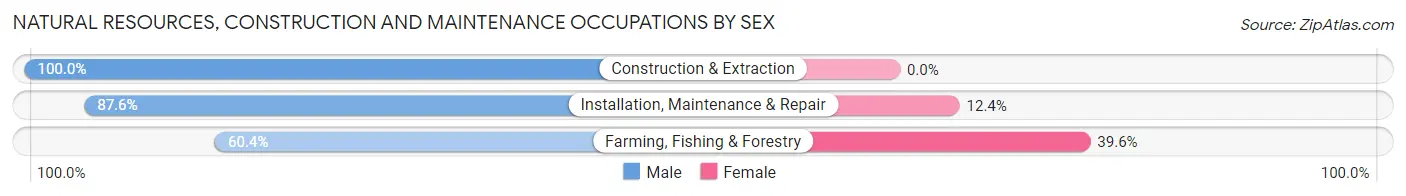
| Occupation | Male | Female |
| Farming, Fishing & Forestry | 198 (60.4%) | 130 (39.6%) |
| Construction & Extraction | 934 (100.0%) | 0 (0.0%) |
| Installation, Maintenance & Repair | 677 (87.6%) | 96 (12.4%) |
| Total (Category) | 1,809 (88.9%) | 226 (11.1%) |
| Total (Overall) | 19,805 (54.3%) | 16,659 (45.7%) |
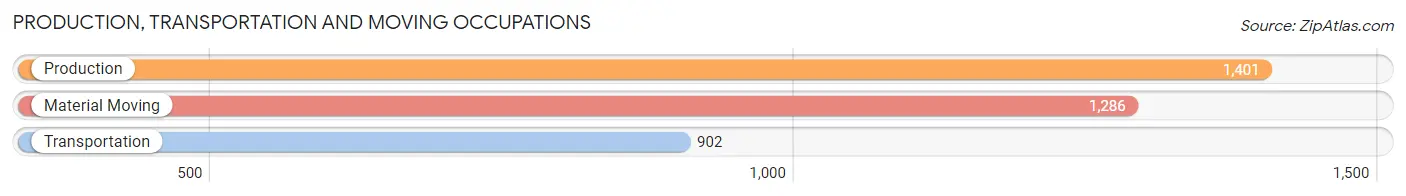
Production, Transportation and Moving Occupations
The most common Production, Transportation and Moving occupations in Ames are Production (1,401 | 3.8%), Material Moving (1,286 | 3.5%), and Transportation (902 | 2.5%).
Production, Transportation and Moving Occupations by Sex
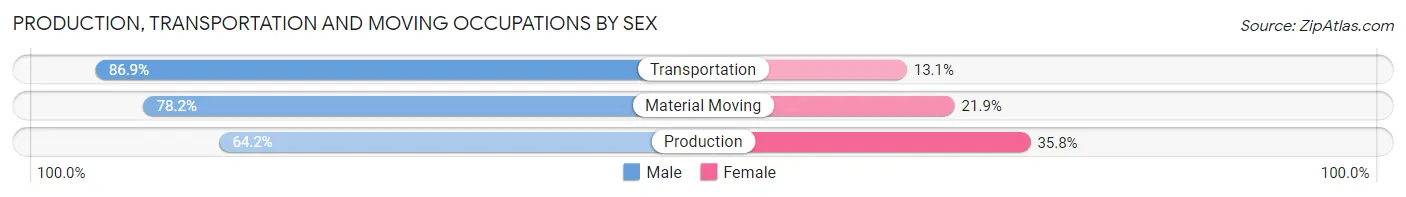
| Occupation | Male | Female |
| Production | 900 (64.2%) | 501 (35.8%) |
| Transportation | 784 (86.9%) | 118 (13.1%) |
| Material Moving | 1,005 (78.1%) | 281 (21.8%) |
| Total (Category) | 2,689 (74.9%) | 900 (25.1%) |
| Total (Overall) | 19,805 (54.3%) | 16,659 (45.7%) |
Employment Industries by Sex in Ames
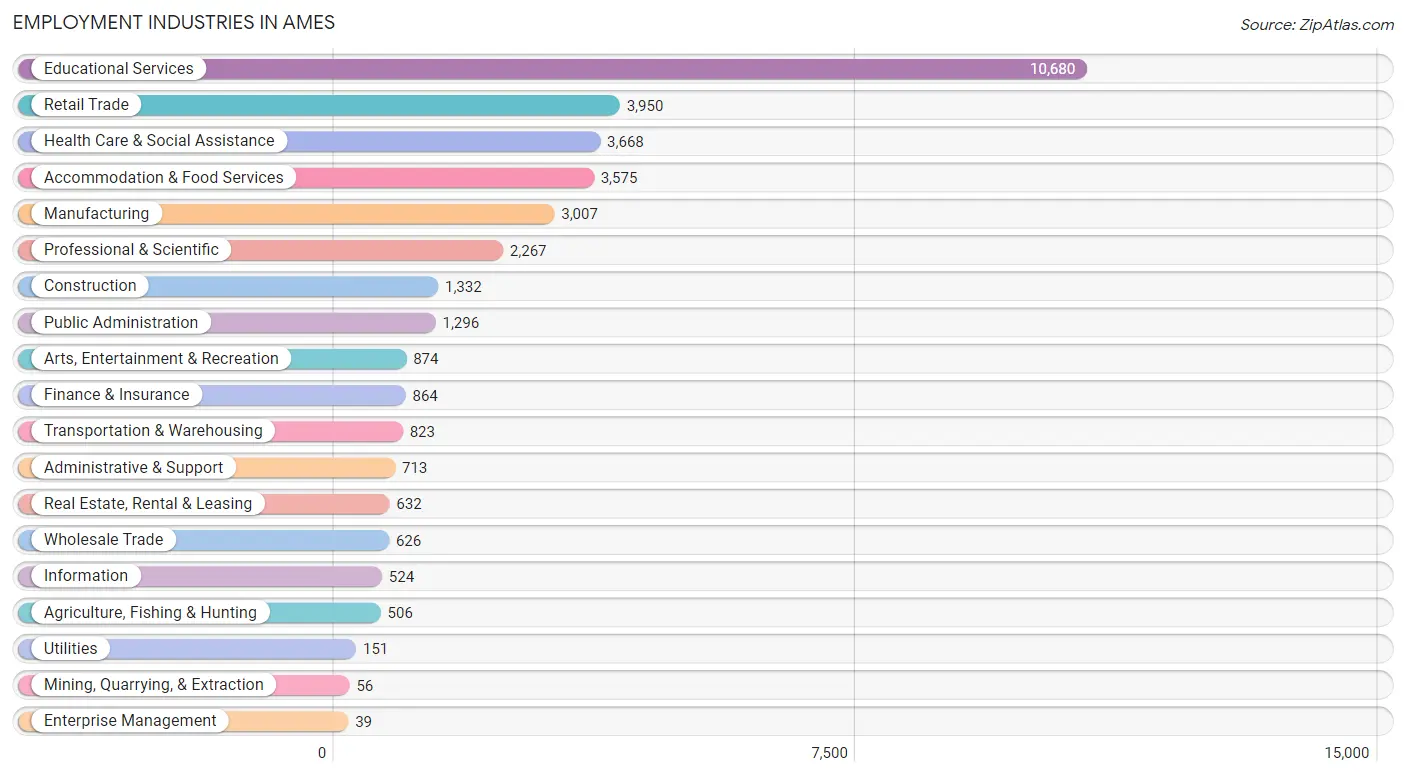
Employment Industries in Ames
The major employment industries in Ames include Educational Services (10,680 | 29.3%), Retail Trade (3,950 | 10.8%), Health Care & Social Assistance (3,668 | 10.1%), Accommodation & Food Services (3,575 | 9.8%), and Manufacturing (3,007 | 8.3%).
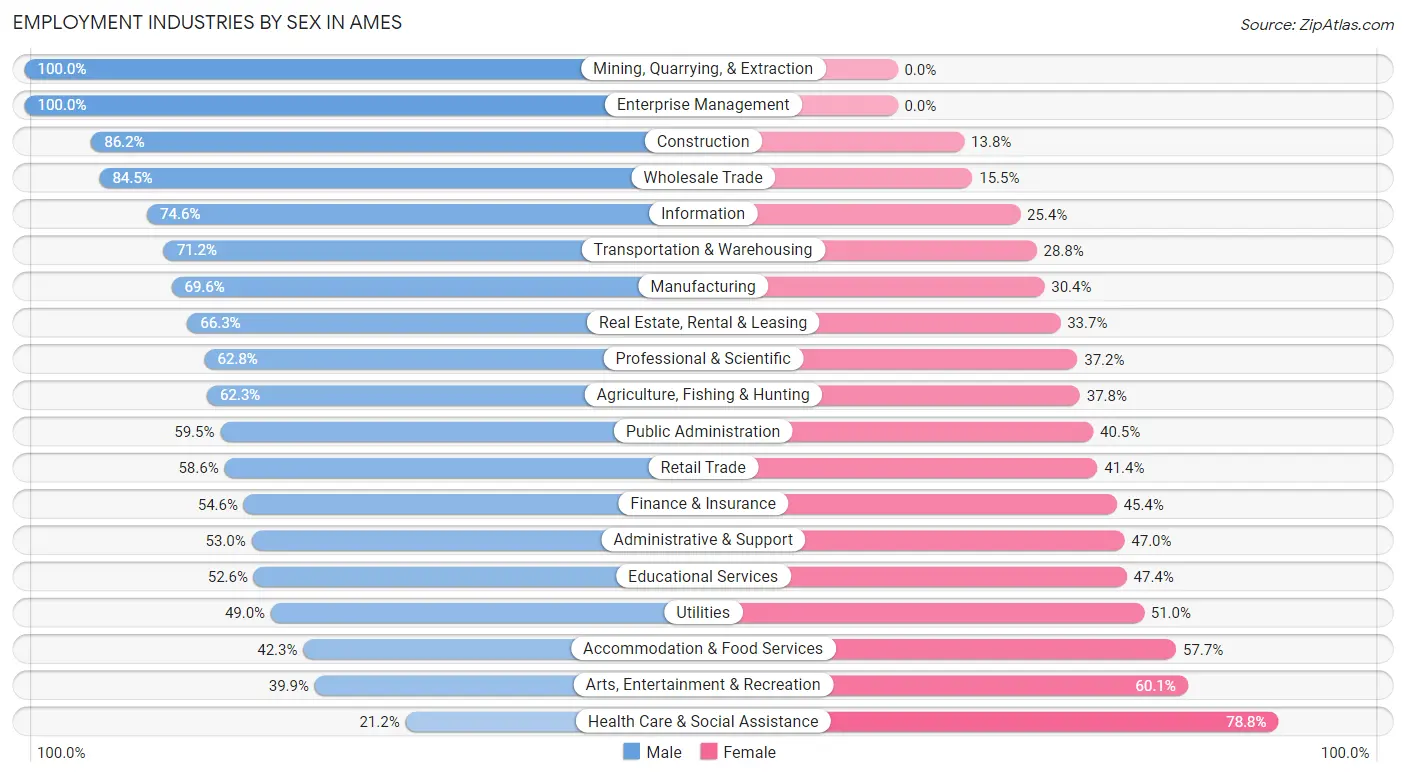
Employment Industries by Sex in Ames
The Ames industries that see more men than women are Mining, Quarrying, & Extraction (100.0%), Enterprise Management (100.0%), and Construction (86.2%), whereas the industries that tend to have a higher number of women are Health Care & Social Assistance (78.8%), Arts, Entertainment & Recreation (60.1%), and Accommodation & Food Services (57.7%).
| Industry | Male | Female |
| Agriculture, Fishing & Hunting | 315 (62.3%) | 191 (37.8%) |
| Mining, Quarrying, & Extraction | 56 (100.0%) | 0 (0.0%) |
| Construction | 1,148 (86.2%) | 184 (13.8%) |
| Manufacturing | 2,093 (69.6%) | 914 (30.4%) |
| Wholesale Trade | 529 (84.5%) | 97 (15.5%) |
| Retail Trade | 2,316 (58.6%) | 1,634 (41.4%) |
| Transportation & Warehousing | 586 (71.2%) | 237 (28.8%) |
| Utilities | 74 (49.0%) | 77 (51.0%) |
| Information | 391 (74.6%) | 133 (25.4%) |
| Finance & Insurance | 472 (54.6%) | 392 (45.4%) |
| Real Estate, Rental & Leasing | 419 (66.3%) | 213 (33.7%) |
| Professional & Scientific | 1,423 (62.8%) | 844 (37.2%) |
| Enterprise Management | 39 (100.0%) | 0 (0.0%) |
| Administrative & Support | 378 (53.0%) | 335 (47.0%) |
| Educational Services | 5,613 (52.6%) | 5,067 (47.4%) |
| Health Care & Social Assistance | 776 (21.2%) | 2,892 (78.8%) |
| Arts, Entertainment & Recreation | 349 (39.9%) | 525 (60.1%) |
| Accommodation & Food Services | 1,513 (42.3%) | 2,062 (57.7%) |
| Public Administration | 771 (59.5%) | 525 (40.5%) |
| Total | 19,805 (54.3%) | 16,659 (45.7%) |
Education in Ames
School Enrollment in Ames
The most common levels of schooling among the 34,950 students in Ames are college / undergraduate (25,486 | 72.9%), graduate / professional (3,857 | 11.0%), and high school (1,783 | 5.1%).
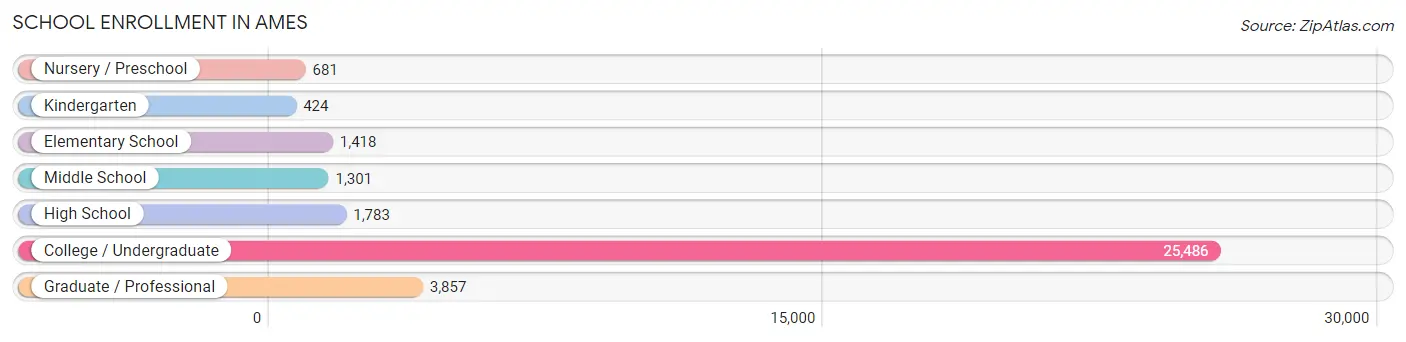
| School Level | # Students | % Students |
| Nursery / Preschool | 681 | 1.9% |
| Kindergarten | 424 | 1.2% |
| Elementary School | 1,418 | 4.1% |
| Middle School | 1,301 | 3.7% |
| High School | 1,783 | 5.1% |
| College / Undergraduate | 25,486 | 72.9% |
| Graduate / Professional | 3,857 | 11.0% |
| Total | 34,950 | 100.0% |
School Enrollment by Age by Funding Source in Ames
Out of a total of 34,950 students who are enrolled in schools in Ames, 1,153 (3.3%) attend a private institution, while the remaining 33,797 (96.7%) are enrolled in public schools. The age group of 3 to 4 year olds has the highest likelihood of being enrolled in private schools, with 88 (26.0% in the age bracket) enrolled. Conversely, the age group of 18 to 19 year olds has the lowest likelihood of being enrolled in a private school, with 8,877 (99.7% in the age bracket) attending a public institution.
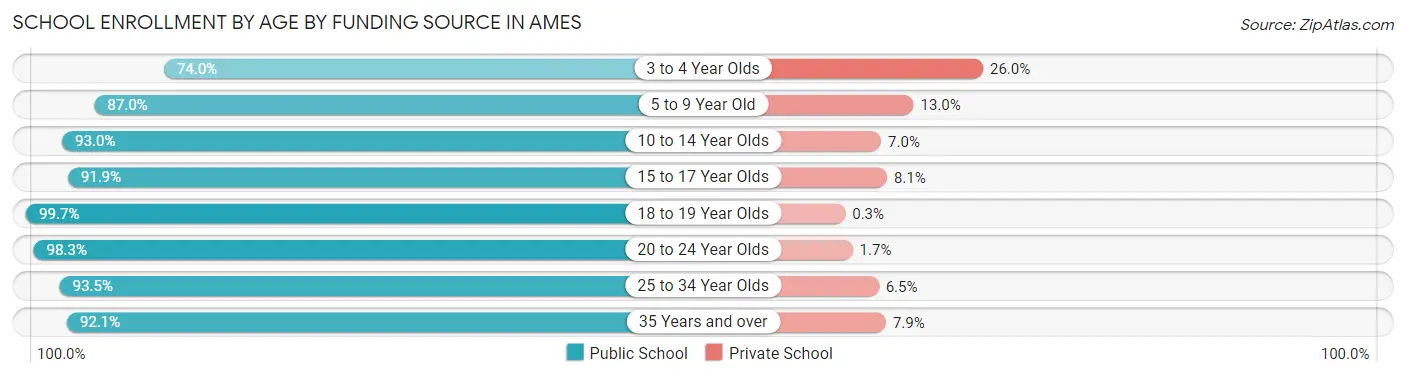
| Age Bracket | Public School | Private School |
| 3 to 4 Year Olds | 251 (74.0%) | 88 (26.0%) |
| 5 to 9 Year Old | 1,692 (87.0%) | 253 (13.0%) |
| 10 to 14 Year Olds | 1,640 (93.0%) | 123 (7.0%) |
| 15 to 17 Year Olds | 1,278 (91.9%) | 112 (8.1%) |
| 18 to 19 Year Olds | 8,877 (99.7%) | 27 (0.3%) |
| 20 to 24 Year Olds | 16,440 (98.3%) | 280 (1.7%) |
| 25 to 34 Year Olds | 2,852 (93.5%) | 199 (6.5%) |
| 35 Years and over | 772 (92.1%) | 66 (7.9%) |
| Total | 33,797 (96.7%) | 1,153 (3.3%) |
Educational Attainment by Field of Study in Ames
Bio, nature & agricultural (3,027 | 14.8%), business (2,445 | 11.9%), engineering (2,243 | 11.0%), education (2,162 | 10.6%), and science & technology (1,447 | 7.1%) are the most common fields of study among 20,468 individuals in Ames who have obtained a bachelor's degree or higher.
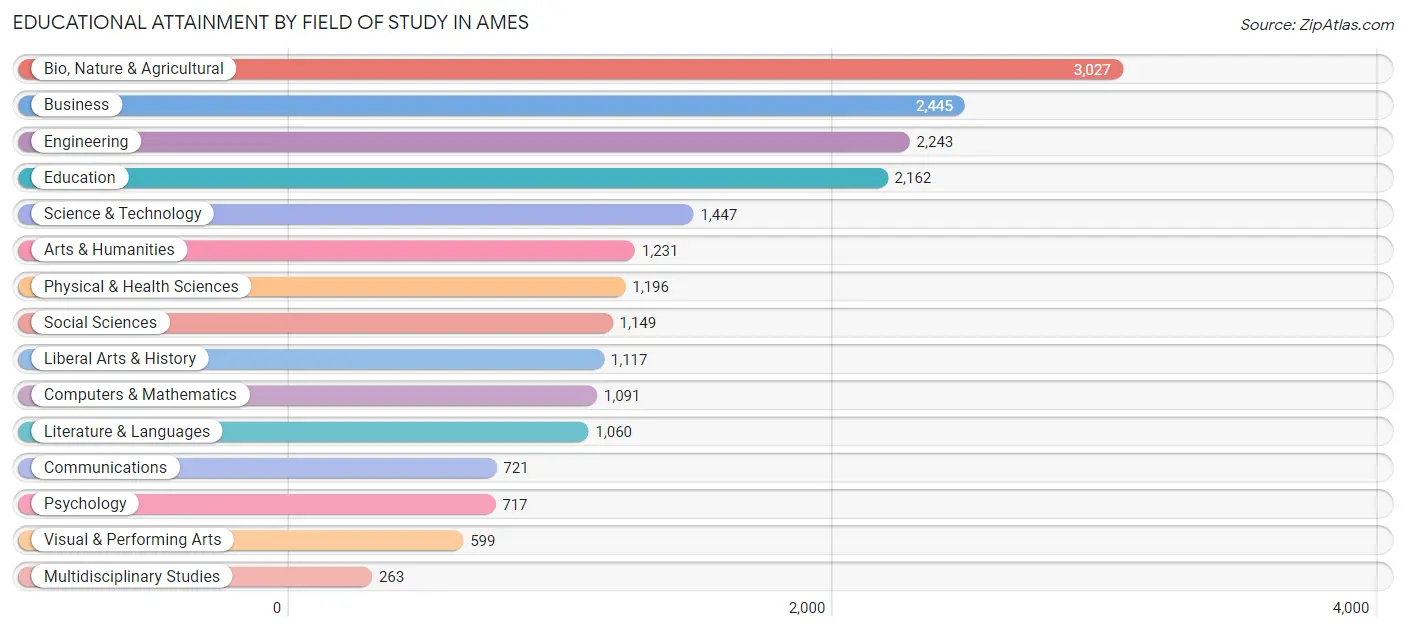
| Field of Study | # Graduates | % Graduates |
| Computers & Mathematics | 1,091 | 5.3% |
| Bio, Nature & Agricultural | 3,027 | 14.8% |
| Physical & Health Sciences | 1,196 | 5.8% |
| Psychology | 717 | 3.5% |
| Social Sciences | 1,149 | 5.6% |
| Engineering | 2,243 | 11.0% |
| Multidisciplinary Studies | 263 | 1.3% |
| Science & Technology | 1,447 | 7.1% |
| Business | 2,445 | 11.9% |
| Education | 2,162 | 10.6% |
| Literature & Languages | 1,060 | 5.2% |
| Liberal Arts & History | 1,117 | 5.5% |
| Visual & Performing Arts | 599 | 2.9% |
| Communications | 721 | 3.5% |
| Arts & Humanities | 1,231 | 6.0% |
| Total | 20,468 | 100.0% |
Transportation & Commute in Ames
Vehicle Availability by Sex in Ames
The most prevalent vehicle ownership categories in Ames are males with 2 vehicles (6,942, accounting for 41.9%) and females with 2 vehicles (6,191, making up 49.3%).
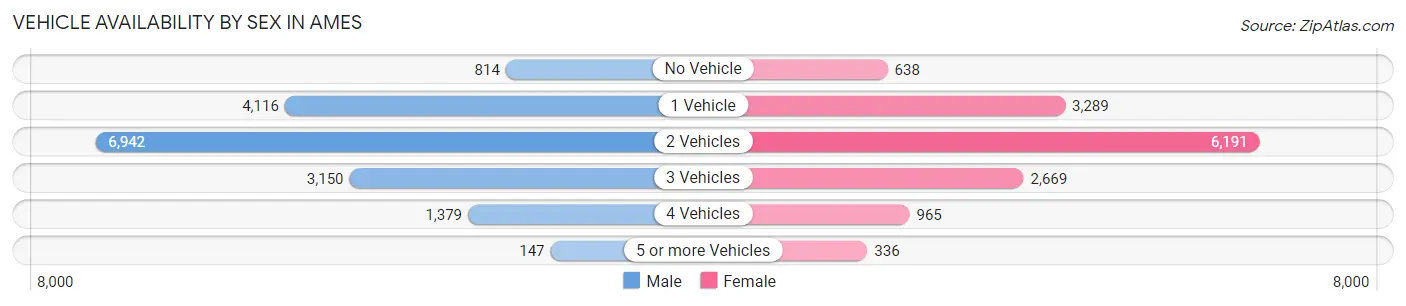
| Vehicles Available | Male | Female |
| No Vehicle | 814 (4.9%) | 638 (4.5%) |
| 1 Vehicle | 4,116 (24.9%) | 3,289 (23.4%) |
| 2 Vehicles | 6,942 (41.9%) | 6,191 (44.0%) |
| 3 Vehicles | 3,150 (19.0%) | 2,669 (19.0%) |
| 4 Vehicles | 1,379 (8.3%) | 965 (6.9%) |
| 5 or more Vehicles | 147 (0.9%) | 336 (2.4%) |
| Total | 16,548 (100.0%) | 14,088 (100.0%) |
Commute Time in Ames
The most frequently occuring commute durations in Ames are 10 to 14 minutes (9,405 commuters, 29.9%), 5 to 9 minutes (6,992 commuters, 22.2%), and 15 to 19 minutes (6,098 commuters, 19.4%).
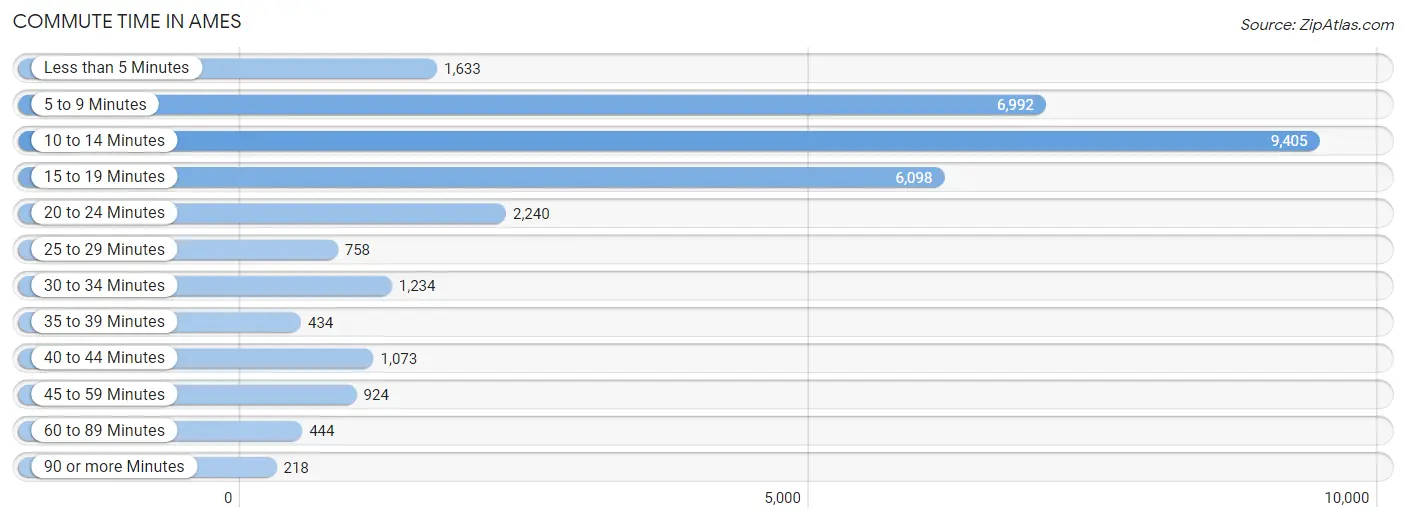
| Commute Time | # Commuters | % Commuters |
| Less than 5 Minutes | 1,633 | 5.2% |
| 5 to 9 Minutes | 6,992 | 22.2% |
| 10 to 14 Minutes | 9,405 | 29.9% |
| 15 to 19 Minutes | 6,098 | 19.4% |
| 20 to 24 Minutes | 2,240 | 7.1% |
| 25 to 29 Minutes | 758 | 2.4% |
| 30 to 34 Minutes | 1,234 | 3.9% |
| 35 to 39 Minutes | 434 | 1.4% |
| 40 to 44 Minutes | 1,073 | 3.4% |
| 45 to 59 Minutes | 924 | 2.9% |
| 60 to 89 Minutes | 444 | 1.4% |
| 90 or more Minutes | 218 | 0.7% |
Commute Time by Sex in Ames
The most common commute times in Ames are 10 to 14 minutes (5,587 commuters, 33.1%) for males and 10 to 14 minutes (3,818 commuters, 26.2%) for females.
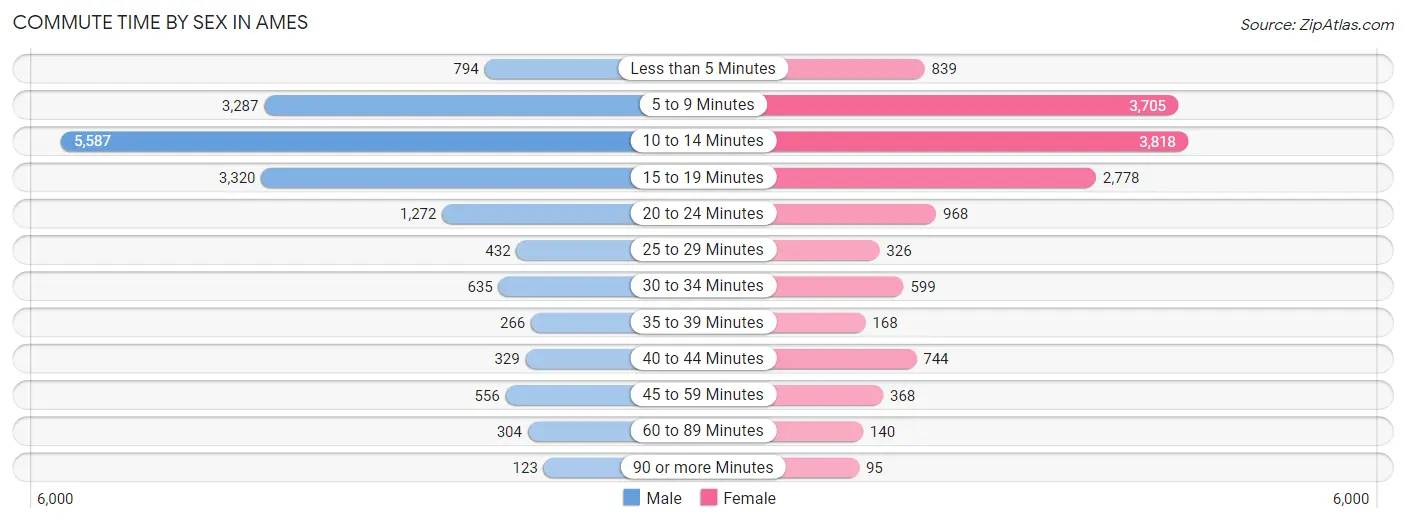
| Commute Time | Male | Female |
| Less than 5 Minutes | 794 (4.7%) | 839 (5.8%) |
| 5 to 9 Minutes | 3,287 (19.4%) | 3,705 (25.5%) |
| 10 to 14 Minutes | 5,587 (33.1%) | 3,818 (26.2%) |
| 15 to 19 Minutes | 3,320 (19.6%) | 2,778 (19.1%) |
| 20 to 24 Minutes | 1,272 (7.5%) | 968 (6.7%) |
| 25 to 29 Minutes | 432 (2.6%) | 326 (2.2%) |
| 30 to 34 Minutes | 635 (3.8%) | 599 (4.1%) |
| 35 to 39 Minutes | 266 (1.6%) | 168 (1.1%) |
| 40 to 44 Minutes | 329 (1.9%) | 744 (5.1%) |
| 45 to 59 Minutes | 556 (3.3%) | 368 (2.5%) |
| 60 to 89 Minutes | 304 (1.8%) | 140 (1.0%) |
| 90 or more Minutes | 123 (0.7%) | 95 (0.6%) |
Time of Departure to Work by Sex in Ames
The most frequent times of departure to work in Ames are 7:30 AM to 7:59 AM (2,785, 16.5%) for males and 7:30 AM to 7:59 AM (2,230, 15.3%) for females.
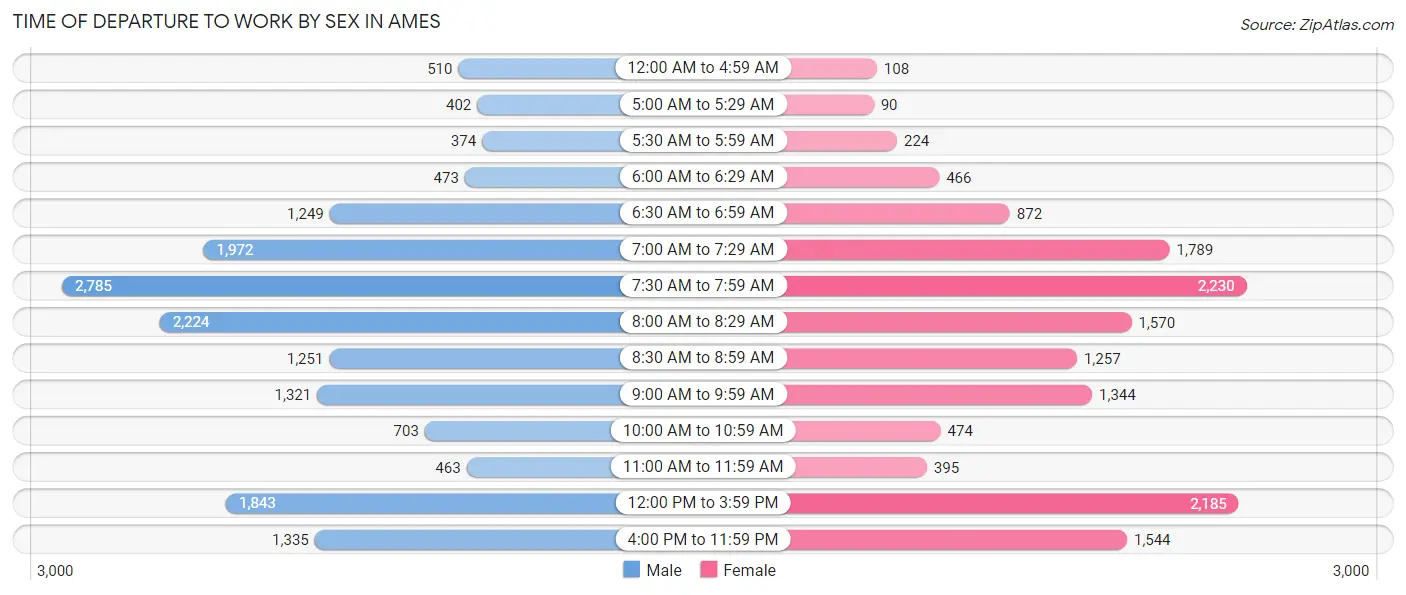
| Time of Departure | Male | Female |
| 12:00 AM to 4:59 AM | 510 (3.0%) | 108 (0.7%) |
| 5:00 AM to 5:29 AM | 402 (2.4%) | 90 (0.6%) |
| 5:30 AM to 5:59 AM | 374 (2.2%) | 224 (1.5%) |
| 6:00 AM to 6:29 AM | 473 (2.8%) | 466 (3.2%) |
| 6:30 AM to 6:59 AM | 1,249 (7.4%) | 872 (6.0%) |
| 7:00 AM to 7:29 AM | 1,972 (11.7%) | 1,789 (12.3%) |
| 7:30 AM to 7:59 AM | 2,785 (16.5%) | 2,230 (15.3%) |
| 8:00 AM to 8:29 AM | 2,224 (13.2%) | 1,570 (10.8%) |
| 8:30 AM to 8:59 AM | 1,251 (7.4%) | 1,257 (8.6%) |
| 9:00 AM to 9:59 AM | 1,321 (7.8%) | 1,344 (9.2%) |
| 10:00 AM to 10:59 AM | 703 (4.2%) | 474 (3.3%) |
| 11:00 AM to 11:59 AM | 463 (2.7%) | 395 (2.7%) |
| 12:00 PM to 3:59 PM | 1,843 (10.9%) | 2,185 (15.0%) |
| 4:00 PM to 11:59 PM | 1,335 (7.9%) | 1,544 (10.6%) |
| Total | 16,905 (100.0%) | 14,548 (100.0%) |
Housing Occupancy in Ames
Occupancy by Ownership in Ames
Of the total 25,140 dwellings in Ames, owner-occupied units account for 10,553 (42.0%), while renter-occupied units make up 14,587 (58.0%).
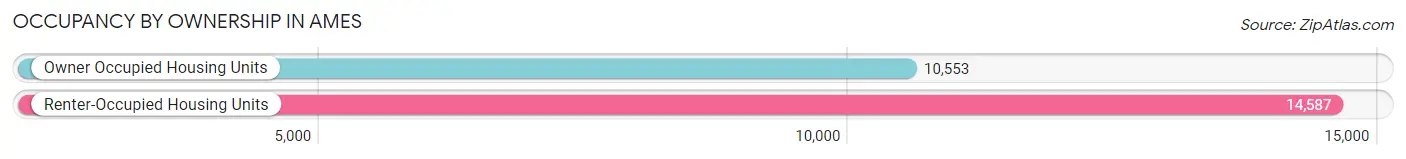
| Occupancy | # Housing Units | % Housing Units |
| Owner Occupied Housing Units | 10,553 | 42.0% |
| Renter-Occupied Housing Units | 14,587 | 58.0% |
| Total Occupied Housing Units | 25,140 | 100.0% |
Occupancy by Household Size in Ames
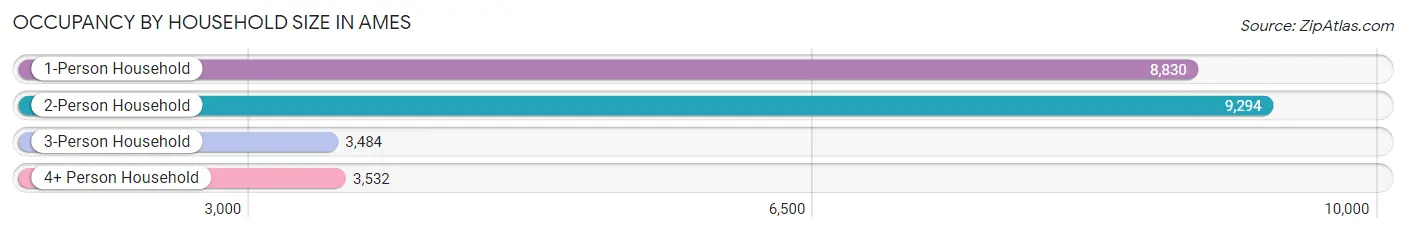
| Household Size | # Housing Units | % Housing Units |
| 1-Person Household | 8,830 | 35.1% |
| 2-Person Household | 9,294 | 37.0% |
| 3-Person Household | 3,484 | 13.9% |
| 4+ Person Household | 3,532 | 14.1% |
| Total Housing Units | 25,140 | 100.0% |
Occupancy by Ownership by Household Size in Ames
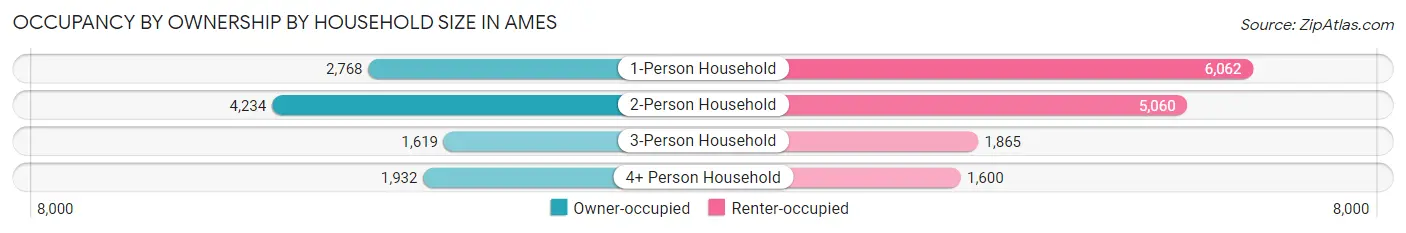
| Household Size | Owner-occupied | Renter-occupied |
| 1-Person Household | 2,768 (31.4%) | 6,062 (68.6%) |
| 2-Person Household | 4,234 (45.6%) | 5,060 (54.4%) |
| 3-Person Household | 1,619 (46.5%) | 1,865 (53.5%) |
| 4+ Person Household | 1,932 (54.7%) | 1,600 (45.3%) |
| Total Housing Units | 10,553 (42.0%) | 14,587 (58.0%) |
Occupancy by Educational Attainment in Ames
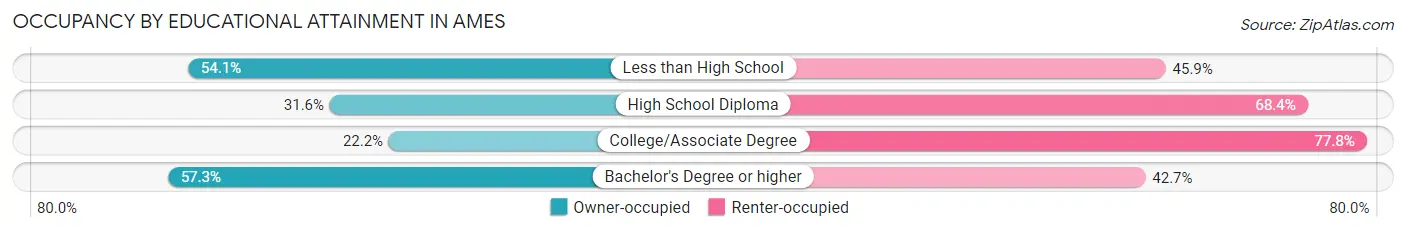
| Household Size | Owner-occupied | Renter-occupied |
| Less than High School | 139 (54.1%) | 118 (45.9%) |
| High School Diploma | 871 (31.6%) | 1,887 (68.4%) |
| College/Associate Degree | 1,984 (22.2%) | 6,950 (77.8%) |
| Bachelor's Degree or higher | 7,559 (57.3%) | 5,632 (42.7%) |
Occupancy by Age of Householder in Ames
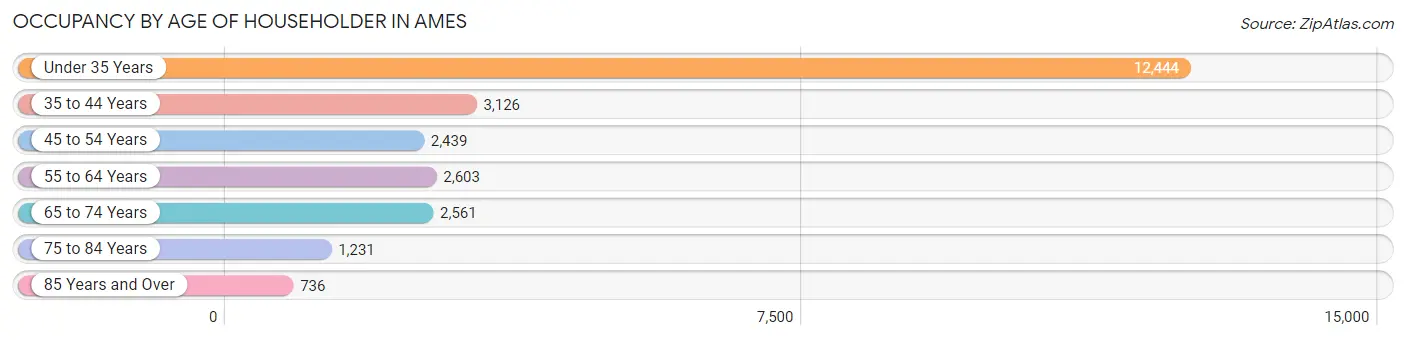
| Age Bracket | # Households | % Households |
| Under 35 Years | 12,444 | 49.5% |
| 35 to 44 Years | 3,126 | 12.4% |
| 45 to 54 Years | 2,439 | 9.7% |
| 55 to 64 Years | 2,603 | 10.3% |
| 65 to 74 Years | 2,561 | 10.2% |
| 75 to 84 Years | 1,231 | 4.9% |
| 85 Years and Over | 736 | 2.9% |
| Total | 25,140 | 100.0% |
Housing Finances in Ames
Median Income by Occupancy in Ames
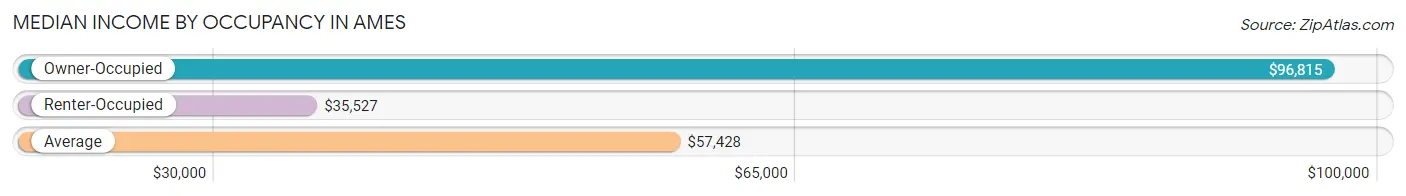
| Occupancy Type | # Households | Median Income |
| Owner-Occupied | 10,553 (42.0%) | $96,815 |
| Renter-Occupied | 14,587 (58.0%) | $35,527 |
| Average | 25,140 (100.0%) | $57,428 |
Occupancy by Householder Income Bracket in Ames
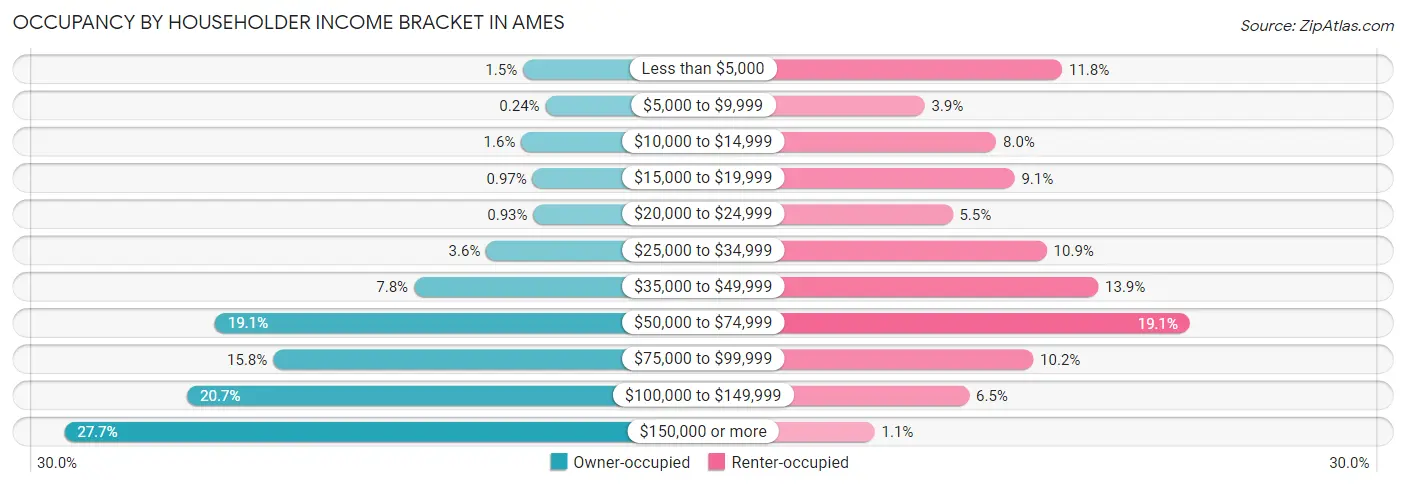
| Income Bracket | Owner-occupied | Renter-occupied |
| Less than $5,000 | 160 (1.5%) | 1,721 (11.8%) |
| $5,000 to $9,999 | 25 (0.2%) | 575 (3.9%) |
| $10,000 to $14,999 | 171 (1.6%) | 1,172 (8.0%) |
| $15,000 to $19,999 | 102 (1.0%) | 1,325 (9.1%) |
| $20,000 to $24,999 | 98 (0.9%) | 808 (5.5%) |
| $25,000 to $34,999 | 382 (3.6%) | 1,593 (10.9%) |
| $35,000 to $49,999 | 818 (7.7%) | 2,022 (13.9%) |
| $50,000 to $74,999 | 2,019 (19.1%) | 2,786 (19.1%) |
| $75,000 to $99,999 | 1,667 (15.8%) | 1,480 (10.2%) |
| $100,000 to $149,999 | 2,185 (20.7%) | 946 (6.5%) |
| $150,000 or more | 2,926 (27.7%) | 159 (1.1%) |
| Total | 10,553 (100.0%) | 14,587 (100.0%) |
Monthly Housing Cost Tiers in Ames
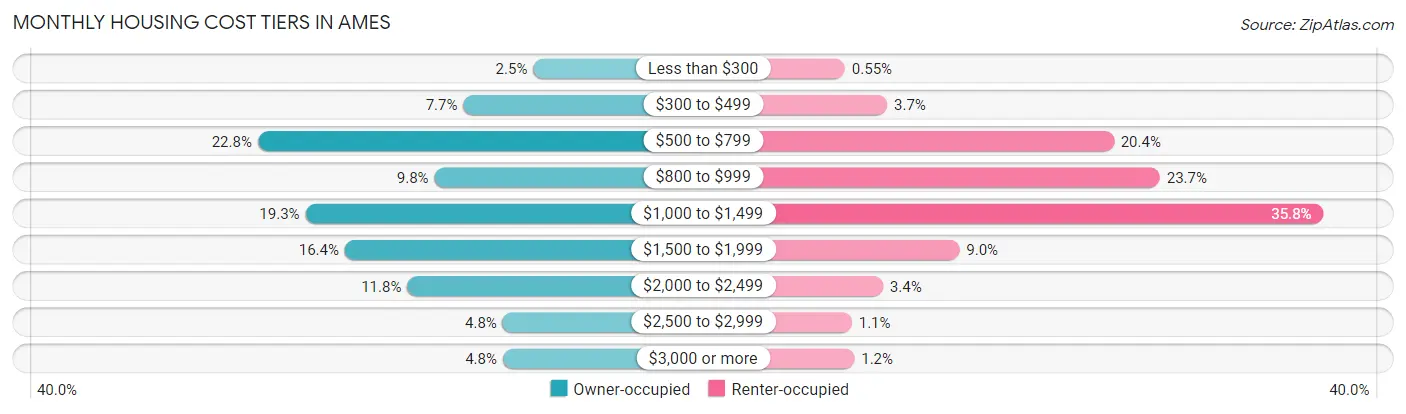
| Monthly Cost | Owner-occupied | Renter-occupied |
| Less than $300 | 268 (2.5%) | 80 (0.5%) |
| $300 to $499 | 812 (7.7%) | 534 (3.7%) |
| $500 to $799 | 2,409 (22.8%) | 2,969 (20.3%) |
| $800 to $999 | 1,036 (9.8%) | 3,463 (23.7%) |
| $1,000 to $1,499 | 2,039 (19.3%) | 5,221 (35.8%) |
| $1,500 to $1,999 | 1,733 (16.4%) | 1,310 (9.0%) |
| $2,000 to $2,499 | 1,247 (11.8%) | 489 (3.4%) |
| $2,500 to $2,999 | 505 (4.8%) | 154 (1.1%) |
| $3,000 or more | 504 (4.8%) | 181 (1.2%) |
| Total | 10,553 (100.0%) | 14,587 (100.0%) |
Physical Housing Characteristics in Ames
Housing Structures in Ames
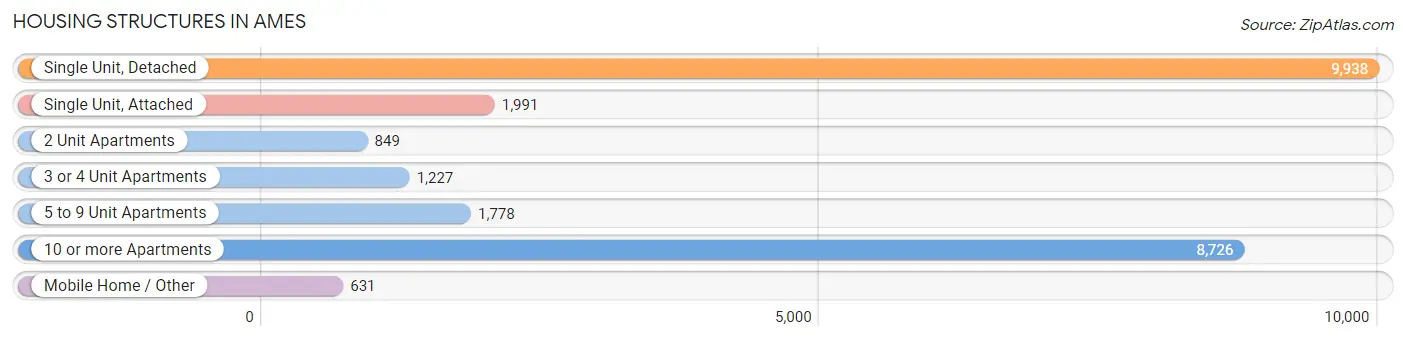
| Structure Type | # Housing Units | % Housing Units |
| Single Unit, Detached | 9,938 | 39.5% |
| Single Unit, Attached | 1,991 | 7.9% |
| 2 Unit Apartments | 849 | 3.4% |
| 3 or 4 Unit Apartments | 1,227 | 4.9% |
| 5 to 9 Unit Apartments | 1,778 | 7.1% |
| 10 or more Apartments | 8,726 | 34.7% |
| Mobile Home / Other | 631 | 2.5% |
| Total | 25,140 | 100.0% |
Housing Structures by Occupancy in Ames
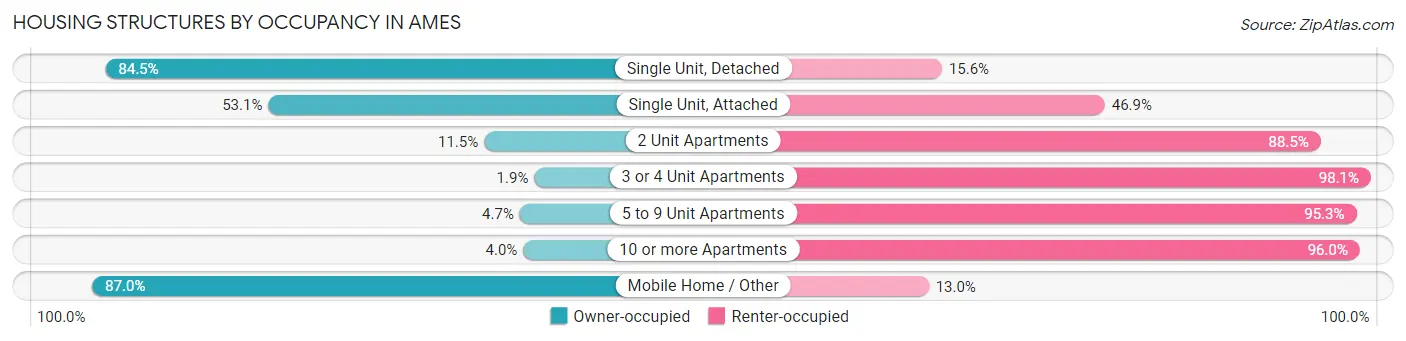
| Structure Type | Owner-occupied | Renter-occupied |
| Single Unit, Detached | 8,393 (84.5%) | 1,545 (15.5%) |
| Single Unit, Attached | 1,057 (53.1%) | 934 (46.9%) |
| 2 Unit Apartments | 98 (11.5%) | 751 (88.5%) |
| 3 or 4 Unit Apartments | 23 (1.9%) | 1,204 (98.1%) |
| 5 to 9 Unit Apartments | 83 (4.7%) | 1,695 (95.3%) |
| 10 or more Apartments | 350 (4.0%) | 8,376 (96.0%) |
| Mobile Home / Other | 549 (87.0%) | 82 (13.0%) |
| Total | 10,553 (42.0%) | 14,587 (58.0%) |
Housing Structures by Number of Rooms in Ames
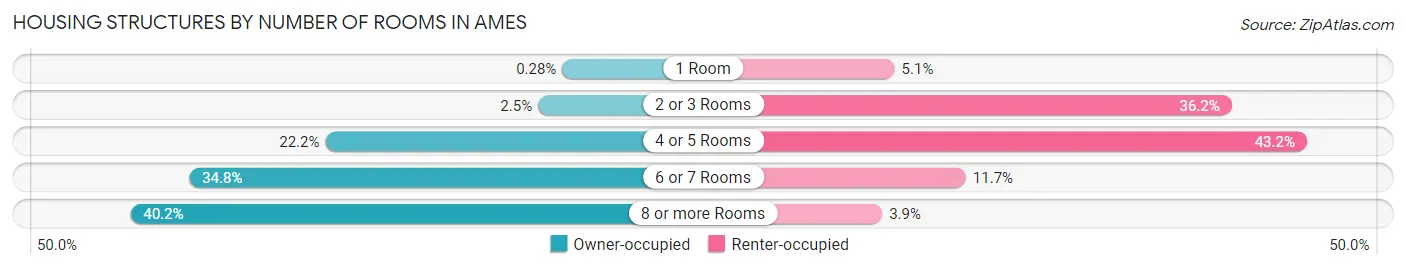
| Number of Rooms | Owner-occupied | Renter-occupied |
| 1 Room | 30 (0.3%) | 738 (5.1%) |
| 2 or 3 Rooms | 266 (2.5%) | 5,283 (36.2%) |
| 4 or 5 Rooms | 2,342 (22.2%) | 6,297 (43.2%) |
| 6 or 7 Rooms | 3,671 (34.8%) | 1,699 (11.7%) |
| 8 or more Rooms | 4,244 (40.2%) | 570 (3.9%) |
| Total | 10,553 (100.0%) | 14,587 (100.0%) |
Housing Structure by Heating Type in Ames
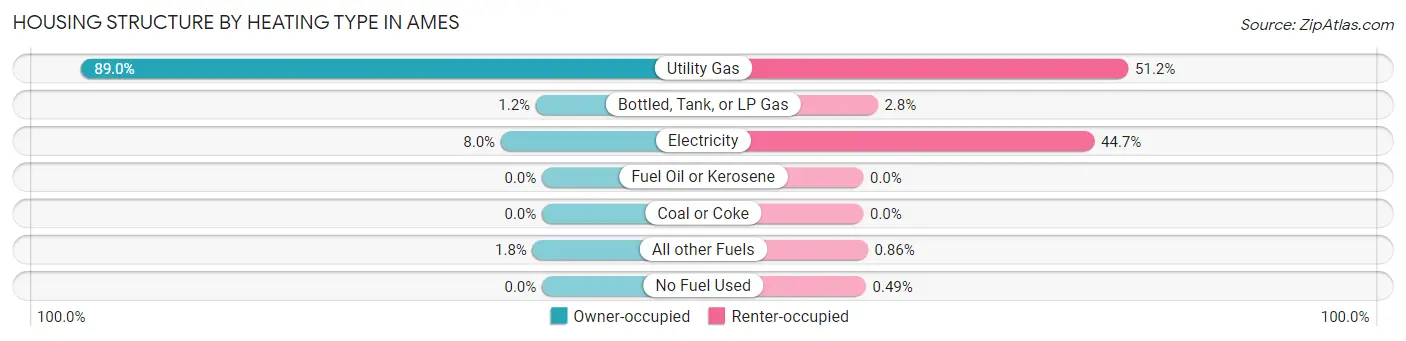
| Heating Type | Owner-occupied | Renter-occupied |
| Utility Gas | 9,396 (89.0%) | 7,471 (51.2%) |
| Bottled, Tank, or LP Gas | 126 (1.2%) | 405 (2.8%) |
| Electricity | 839 (8.0%) | 6,513 (44.7%) |
| Fuel Oil or Kerosene | 0 (0.0%) | 0 (0.0%) |
| Coal or Coke | 0 (0.0%) | 0 (0.0%) |
| All other Fuels | 192 (1.8%) | 126 (0.9%) |
| No Fuel Used | 0 (0.0%) | 72 (0.5%) |
| Total | 10,553 (100.0%) | 14,587 (100.0%) |
Household Vehicle Usage in Ames
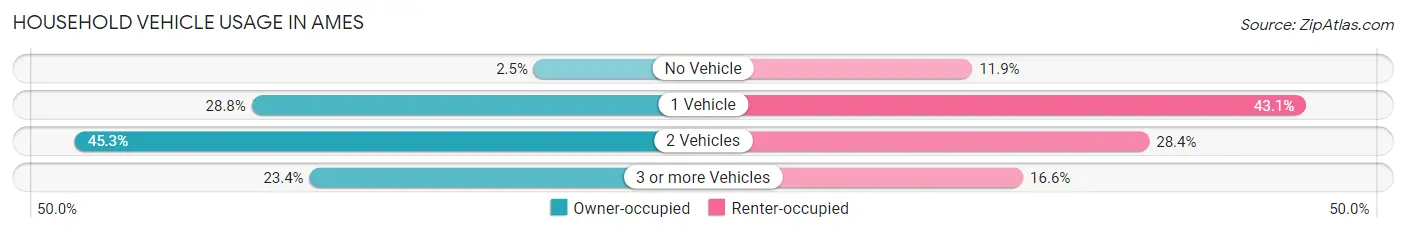
| Vehicles per Household | Owner-occupied | Renter-occupied |
| No Vehicle | 261 (2.5%) | 1,736 (11.9%) |
| 1 Vehicle | 3,040 (28.8%) | 6,280 (43.0%) |
| 2 Vehicles | 4,782 (45.3%) | 4,144 (28.4%) |
| 3 or more Vehicles | 2,470 (23.4%) | 2,427 (16.6%) |
| Total | 10,553 (100.0%) | 14,587 (100.0%) |
Real Estate & Mortgages in Ames
Real Estate and Mortgage Overview in Ames
| Characteristic | Without Mortgage | With Mortgage |
| Housing Units | 4,499 | 6,054 |
| Median Property Value | $234,100 | $260,200 |
| Median Household Income | $80,809 | $1,946 |
| Monthly Housing Costs | $638 | $504 |
| Real Estate Taxes | $3,675 | $123 |
Property Value by Mortgage Status in Ames
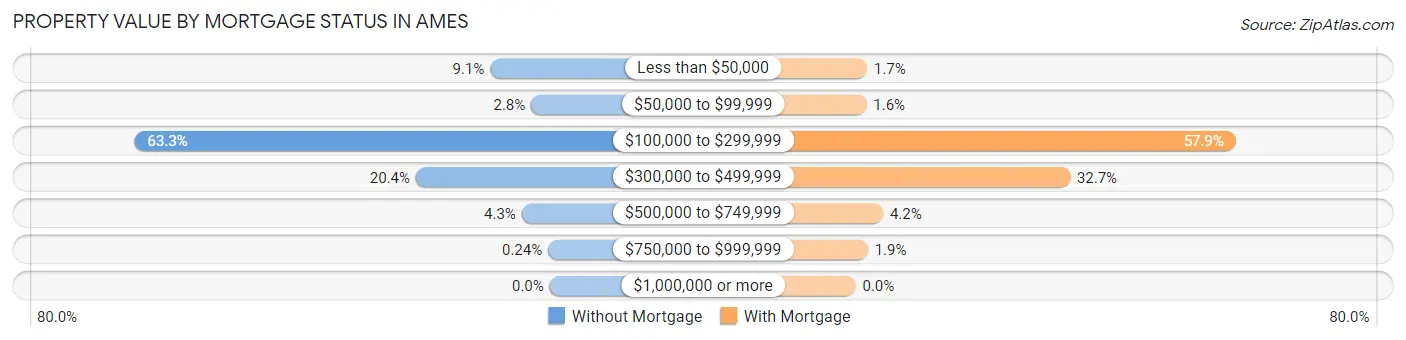
| Property Value | Without Mortgage | With Mortgage |
| Less than $50,000 | 407 (9.0%) | 105 (1.7%) |
| $50,000 to $99,999 | 127 (2.8%) | 99 (1.6%) |
| $100,000 to $299,999 | 2,846 (63.3%) | 3,507 (57.9%) |
| $300,000 to $499,999 | 917 (20.4%) | 1,978 (32.7%) |
| $500,000 to $749,999 | 191 (4.3%) | 253 (4.2%) |
| $750,000 to $999,999 | 11 (0.2%) | 112 (1.8%) |
| $1,000,000 or more | 0 (0.0%) | 0 (0.0%) |
| Total | 4,499 (100.0%) | 6,054 (100.0%) |
Household Income by Mortgage Status in Ames
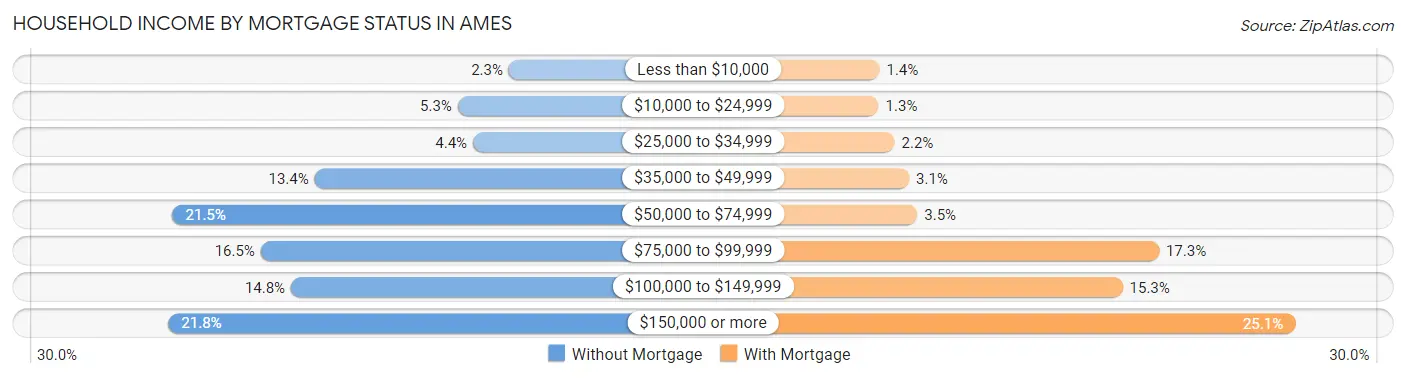
| Household Income | Without Mortgage | With Mortgage |
| Less than $10,000 | 105 (2.3%) | 83 (1.4%) |
| $10,000 to $24,999 | 236 (5.2%) | 80 (1.3%) |
| $25,000 to $34,999 | 197 (4.4%) | 135 (2.2%) |
| $35,000 to $49,999 | 604 (13.4%) | 185 (3.1%) |
| $50,000 to $74,999 | 969 (21.5%) | 214 (3.5%) |
| $75,000 to $99,999 | 743 (16.5%) | 1,050 (17.3%) |
| $100,000 to $149,999 | 665 (14.8%) | 924 (15.3%) |
| $150,000 or more | 980 (21.8%) | 1,520 (25.1%) |
| Total | 4,499 (100.0%) | 6,054 (100.0%) |
Property Value to Household Income Ratio in Ames
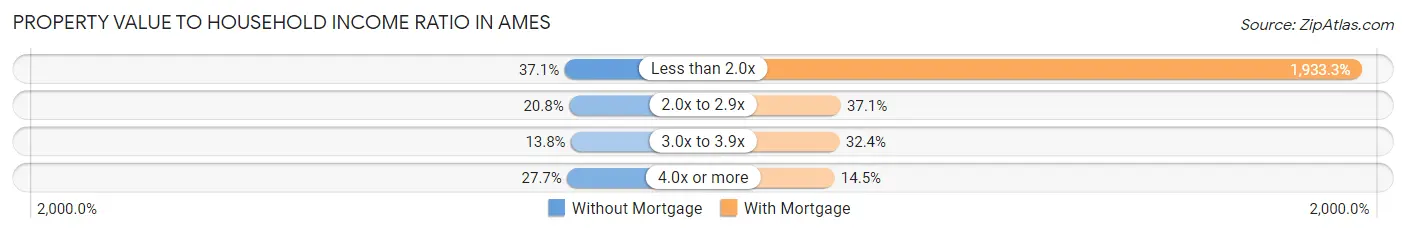
| Value-to-Income Ratio | Without Mortgage | With Mortgage |
| Less than 2.0x | 1,670 (37.1%) | 117,041 (1,933.3%) |
| 2.0x to 2.9x | 936 (20.8%) | 2,246 (37.1%) |
| 3.0x to 3.9x | 619 (13.8%) | 1,959 (32.4%) |
| 4.0x or more | 1,244 (27.7%) | 875 (14.4%) |
| Total | 4,499 (100.0%) | 6,054 (100.0%) |
Real Estate Taxes by Mortgage Status in Ames
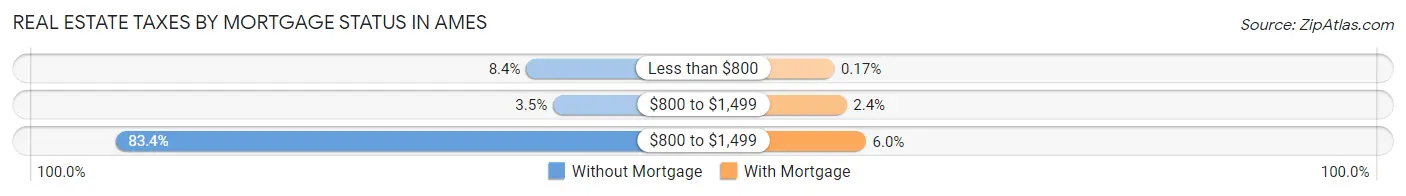
| Property Taxes | Without Mortgage | With Mortgage |
| Less than $800 | 376 (8.4%) | 10 (0.2%) |
| $800 to $1,499 | 157 (3.5%) | 147 (2.4%) |
| $800 to $1,499 | 3,753 (83.4%) | 360 (5.9%) |
| Total | 4,499 (100.0%) | 6,054 (100.0%) |
Health & Disability in Ames
Health Insurance Coverage by Age in Ames
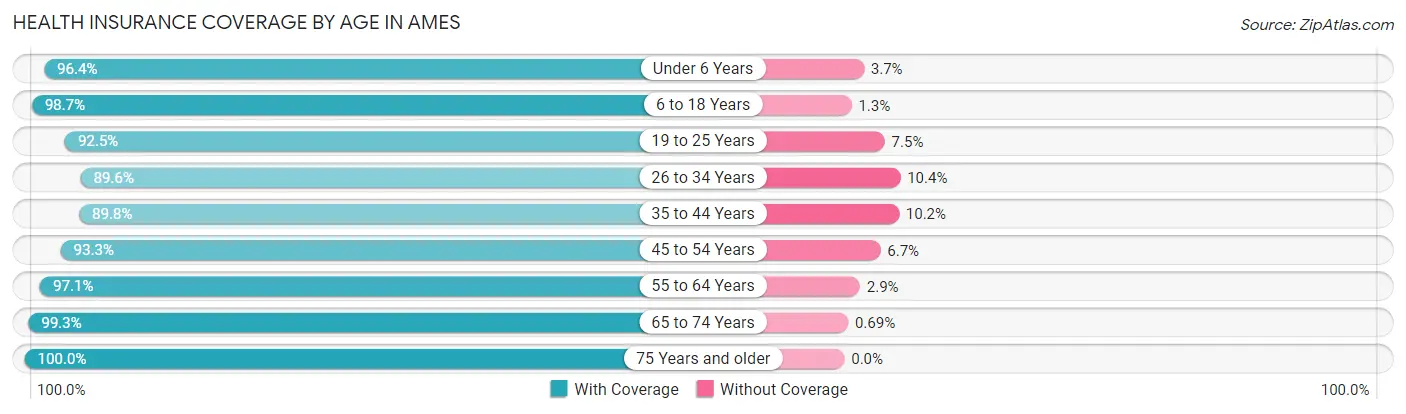
| Age Bracket | With Coverage | Without Coverage |
| Under 6 Years | 2,506 (96.4%) | 95 (3.6%) |
| 6 to 18 Years | 8,240 (98.7%) | 112 (1.3%) |
| 19 to 25 Years | 25,231 (92.5%) | 2,054 (7.5%) |
| 26 to 34 Years | 6,314 (89.6%) | 735 (10.4%) |
| 35 to 44 Years | 4,867 (89.8%) | 551 (10.2%) |
| 45 to 54 Years | 3,746 (93.3%) | 270 (6.7%) |
| 55 to 64 Years | 4,316 (97.1%) | 129 (2.9%) |
| 65 to 74 Years | 3,864 (99.3%) | 27 (0.7%) |
| 75 Years and older | 2,902 (100.0%) | 0 (0.0%) |
| Total | 61,986 (94.0%) | 3,973 (6.0%) |
Health Insurance Coverage by Citizenship Status in Ames
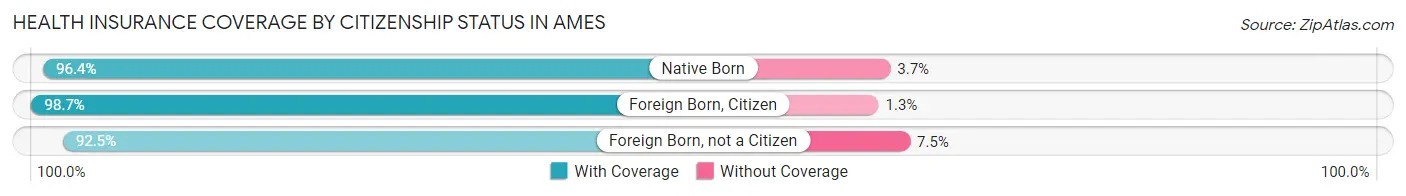
| Citizenship Status | With Coverage | Without Coverage |
| Native Born | 2,506 (96.4%) | 95 (3.6%) |
| Foreign Born, Citizen | 8,240 (98.7%) | 112 (1.3%) |
| Foreign Born, not a Citizen | 25,231 (92.5%) | 2,054 (7.5%) |
Health Insurance Coverage by Household Income in Ames
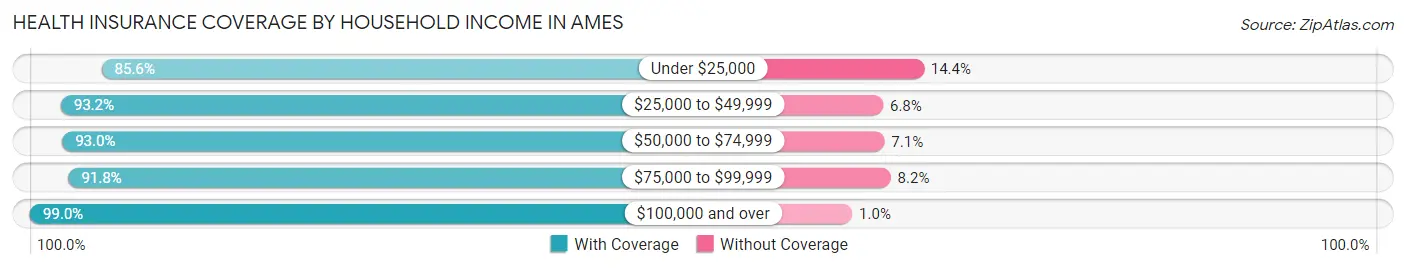
| Household Income | With Coverage | Without Coverage |
| Under $25,000 | 9,319 (85.6%) | 1,572 (14.4%) |
| $25,000 to $49,999 | 8,678 (93.2%) | 632 (6.8%) |
| $50,000 to $74,999 | 9,171 (92.9%) | 696 (7.0%) |
| $75,000 to $99,999 | 6,424 (91.8%) | 575 (8.2%) |
| $100,000 and over | 17,179 (99.0%) | 173 (1.0%) |
Public vs Private Health Insurance Coverage by Age in Ames
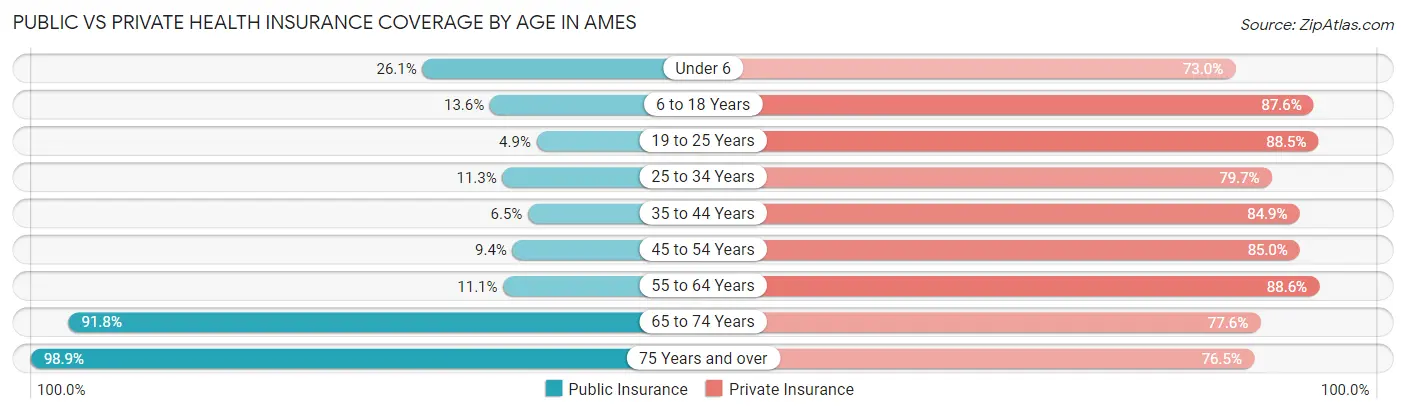
| Age Bracket | Public Insurance | Private Insurance |
| Under 6 | 680 (26.1%) | 1,898 (73.0%) |
| 6 to 18 Years | 1,136 (13.6%) | 7,313 (87.6%) |
| 19 to 25 Years | 1,348 (4.9%) | 24,133 (88.4%) |
| 25 to 34 Years | 795 (11.3%) | 5,621 (79.7%) |
| 35 to 44 Years | 354 (6.5%) | 4,601 (84.9%) |
| 45 to 54 Years | 378 (9.4%) | 3,413 (85.0%) |
| 55 to 64 Years | 495 (11.1%) | 3,936 (88.5%) |
| 65 to 74 Years | 3,573 (91.8%) | 3,021 (77.6%) |
| 75 Years and over | 2,869 (98.9%) | 2,219 (76.5%) |
| Total | 11,628 (17.6%) | 56,155 (85.1%) |
Disability Status by Sex by Age in Ames
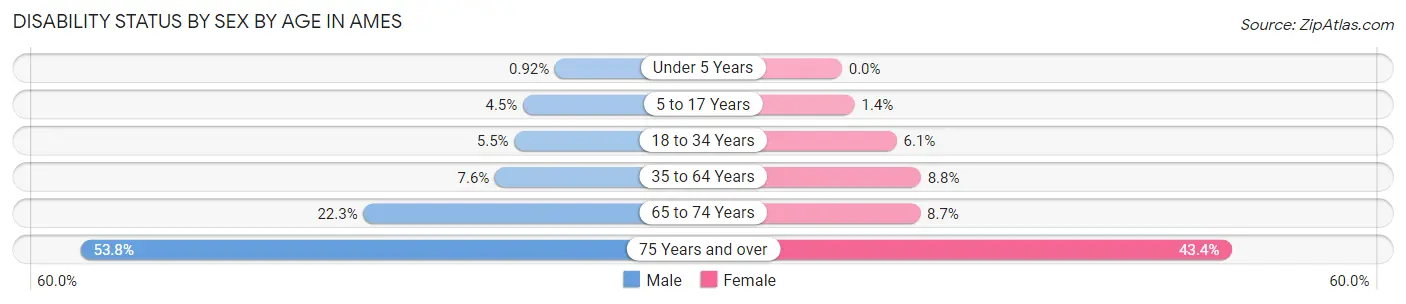
| Age Bracket | Male | Female |
| Under 5 Years | 10 (0.9%) | 0 (0.0%) |
| 5 to 17 Years | 117 (4.5%) | 36 (1.4%) |
| 18 to 34 Years | 1,166 (5.4%) | 1,015 (6.1%) |
| 35 to 64 Years | 548 (7.6%) | 585 (8.8%) |
| 65 to 74 Years | 394 (22.3%) | 185 (8.7%) |
| 75 Years and over | 685 (53.8%) | 706 (43.4%) |
Disability Class by Sex by Age in Ames
Disability Class: Hearing Difficulty
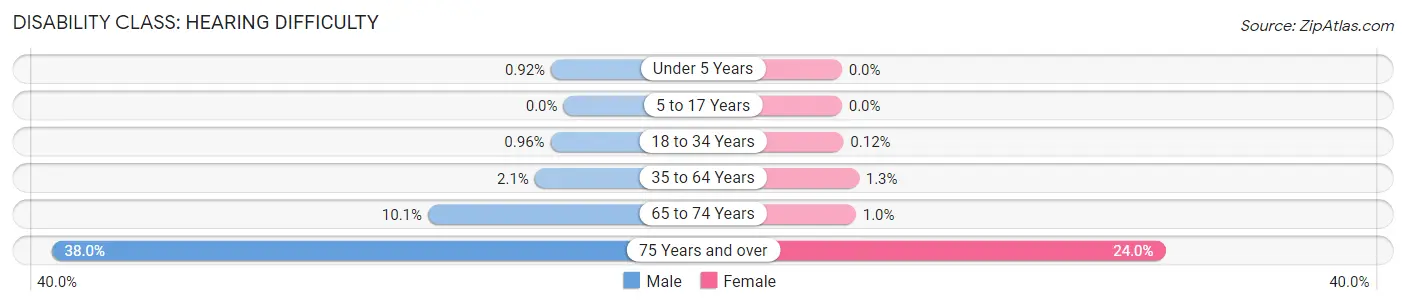
| Age Bracket | Male | Female |
| Under 5 Years | 10 (0.9%) | 0 (0.0%) |
| 5 to 17 Years | 0 (0.0%) | 0 (0.0%) |
| 18 to 34 Years | 206 (1.0%) | 20 (0.1%) |
| 35 to 64 Years | 154 (2.1%) | 84 (1.3%) |
| 65 to 74 Years | 178 (10.1%) | 22 (1.0%) |
| 75 Years and over | 484 (38.0%) | 391 (24.0%) |
Disability Class: Vision Difficulty
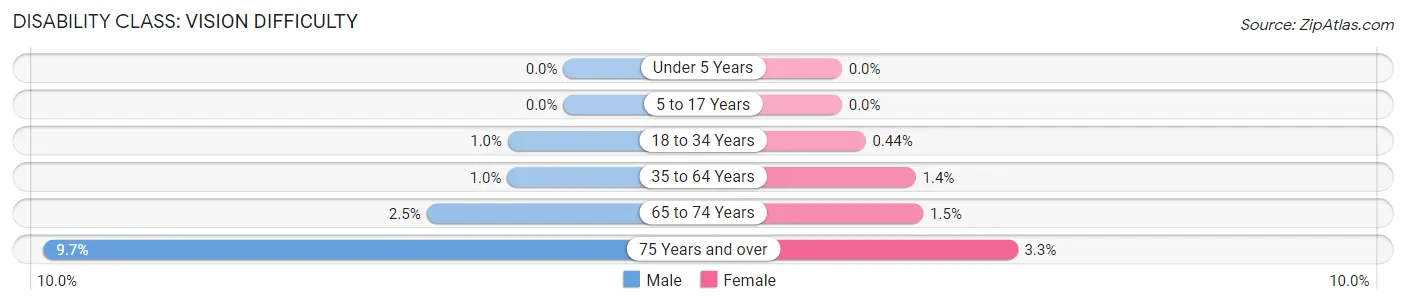
| Age Bracket | Male | Female |
| Under 5 Years | 0 (0.0%) | 0 (0.0%) |
| 5 to 17 Years | 0 (0.0%) | 0 (0.0%) |
| 18 to 34 Years | 220 (1.0%) | 74 (0.4%) |
| 35 to 64 Years | 75 (1.0%) | 91 (1.4%) |
| 65 to 74 Years | 45 (2.5%) | 32 (1.5%) |
| 75 Years and over | 123 (9.7%) | 53 (3.3%) |
Disability Class: Cognitive Difficulty
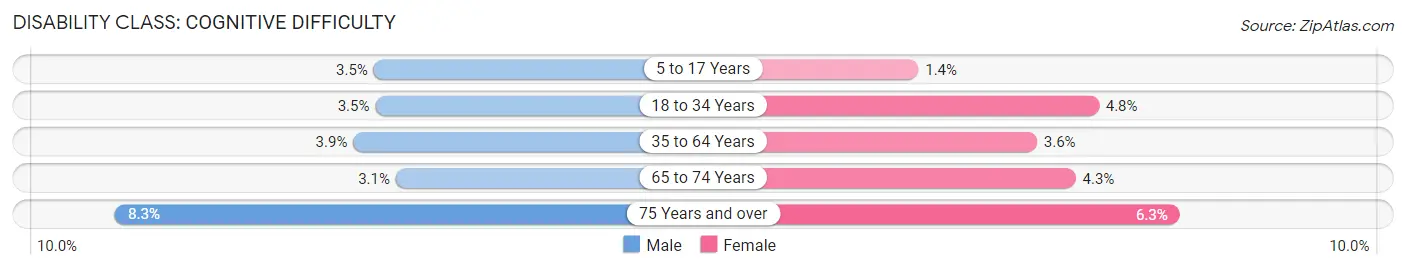
| Age Bracket | Male | Female |
| 5 to 17 Years | 92 (3.5%) | 36 (1.4%) |
| 18 to 34 Years | 746 (3.5%) | 794 (4.8%) |
| 35 to 64 Years | 282 (3.9%) | 241 (3.6%) |
| 65 to 74 Years | 55 (3.1%) | 92 (4.3%) |
| 75 Years and over | 106 (8.3%) | 102 (6.3%) |
Disability Class: Ambulatory Difficulty
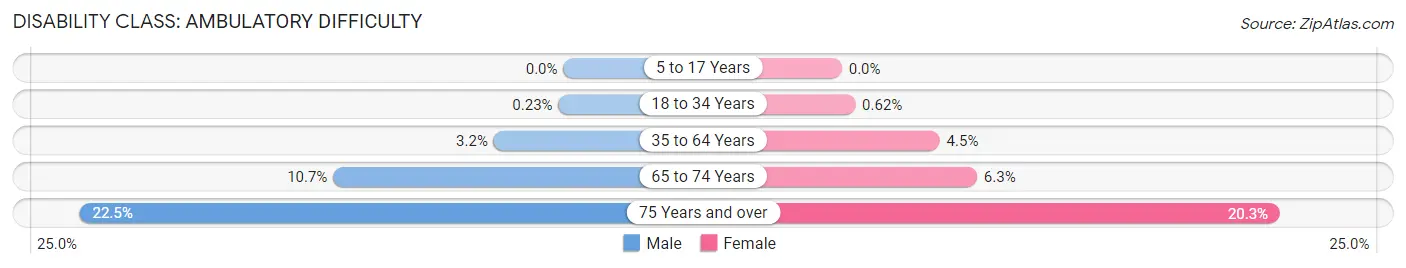
| Age Bracket | Male | Female |
| 5 to 17 Years | 0 (0.0%) | 0 (0.0%) |
| 18 to 34 Years | 50 (0.2%) | 103 (0.6%) |
| 35 to 64 Years | 233 (3.2%) | 302 (4.5%) |
| 65 to 74 Years | 189 (10.7%) | 133 (6.3%) |
| 75 Years and over | 286 (22.5%) | 331 (20.3%) |
Disability Class: Self-Care Difficulty
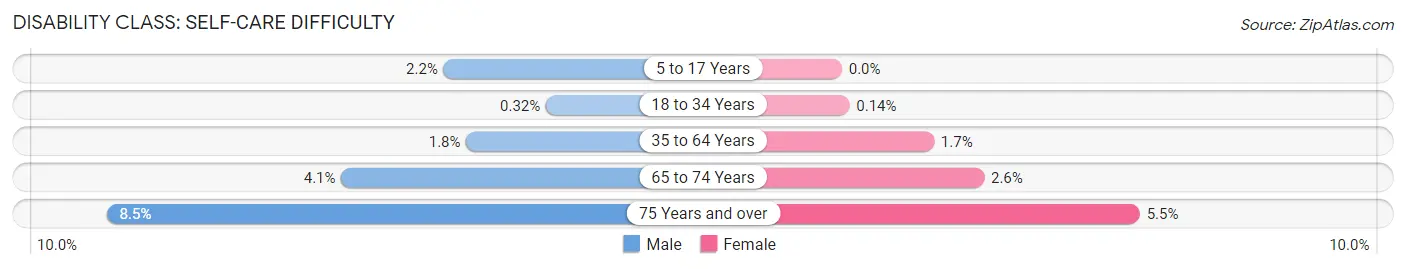
| Age Bracket | Male | Female |
| 5 to 17 Years | 58 (2.2%) | 0 (0.0%) |
| 18 to 34 Years | 69 (0.3%) | 23 (0.1%) |
| 35 to 64 Years | 130 (1.8%) | 114 (1.7%) |
| 65 to 74 Years | 73 (4.1%) | 56 (2.6%) |
| 75 Years and over | 108 (8.5%) | 90 (5.5%) |
Technology Access in Ames
Computing Device Access in Ames
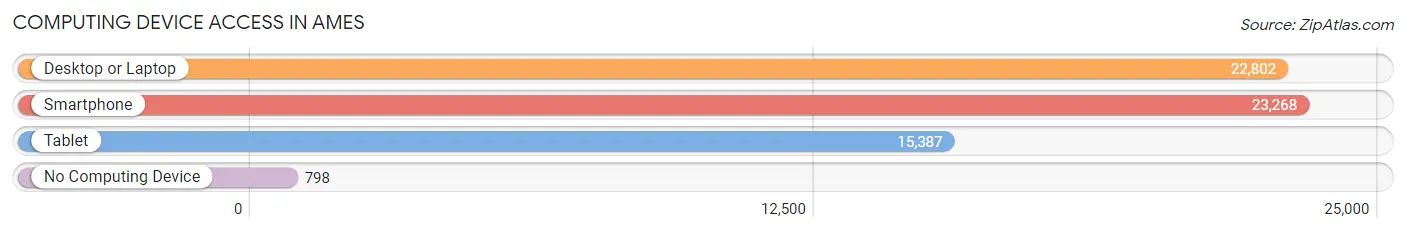
| Device Type | # Households | % Households |
| Desktop or Laptop | 22,802 | 90.7% |
| Smartphone | 23,268 | 92.5% |
| Tablet | 15,387 | 61.2% |
| No Computing Device | 798 | 3.2% |
| Total | 25,140 | 100.0% |
Internet Access in Ames
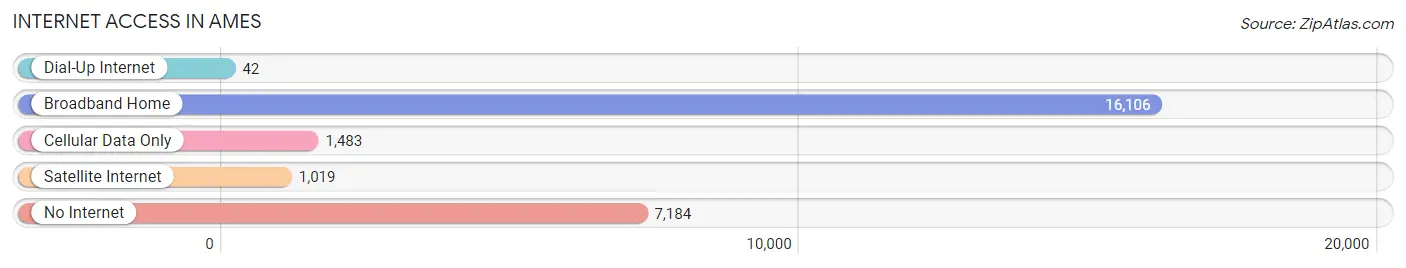
| Internet Type | # Households | % Households |
| Dial-Up Internet | 42 | 0.2% |
| Broadband Home | 16,106 | 64.1% |
| Cellular Data Only | 1,483 | 5.9% |
| Satellite Internet | 1,019 | 4.1% |
| No Internet | 7,184 | 28.6% |
| Total | 25,140 | 100.0% |
Ames Summary
Ames, Iowa is a city located in the central part of the state, in Story County. It is the county seat and the largest city in the county. The city is located approximately 30 miles north of Des Moines, the state capital. As of the 2010 census, the population of Ames was 58,965, making it the ninth largest city in the state.
History
The area that is now Ames was first settled in the 1840s by settlers from the east. The city was originally known as College Station, due to its proximity to Iowa State University. The city was officially incorporated in 1864, and the name was changed to Ames in honor of Oakes Ames, a prominent railroad official.
In the late 19th century, Ames was a major center for the agricultural industry, with several large grain elevators and a number of other businesses related to the industry. The city was also home to several large manufacturing companies, including the Maytag Corporation.
Geography
Ames is located in central Iowa, in Story County. The city is situated on the banks of the South Skunk River, and is surrounded by rolling hills and farmland. The city is located approximately 30 miles north of Des Moines, the state capital.
The city has a total area of 24.3 square miles, of which 24.2 square miles is land and 0.1 square miles is water. The city is located at an elevation of 945 feet above sea level.
Economy
Ames is a major economic center in the state of Iowa. The city is home to Iowa State University, which is the largest employer in the city. Other major employers in the city include the Maytag Corporation, the U.S. Department of Agriculture, and the Mary Greeley Medical Center.
The city is also home to a number of technology companies, including the software company Workiva, the software company AgriSync, and the software company AgriTech.
Demographics
As of the 2010 census, the population of Ames was 58,965. The racial makeup of the city was 84.2% White, 5.7% African American, 0.3% Native American, 5.7% Asian, 0.1% Pacific Islander, 1.7% from other races, and 2.4% from two or more races. Hispanic or Latino of any race were 4.3% of the population.
The median income for a household in the city was $45,919, and the median income for a family was $60,945. The per capita income for the city was $23,837. About 8.3% of families and 17.2% of the population were below the poverty line, including 11.2% of those under age 18 and 4.3% of those age 65 or over.
Common Questions
What is Per Capita Income in Ames?
Per Capita income in Ames is $31,050.
What is the Median Family Income in Ames?
Median Family Income in Ames is $101,500.
What is the Median Household income in Ames?
Median Household Income in Ames is $57,428.
What is Income or Wage Gap in Ames?
Income or Wage Gap in Ames is 20.7%.
Women in Ames earn 79.3 cents for every dollar earned by a man.
What is Family Income Deficit in Ames?
Family Income Deficit in Ames is $8,259.
Families that are below poverty line in Ames earn $8,259 less on average than the poverty threshold level.
What is Inequality or Gini Index in Ames?
Inequality or Gini Index in Ames is 0.49.
What is the Total Population of Ames?
Total Population of Ames is 66,265.
What is the Total Male Population of Ames?
Total Male Population of Ames is 35,527.
What is the Total Female Population of Ames?
Total Female Population of Ames is 30,738.
What is the Ratio of Males per 100 Females in Ames?
There are 115.58 Males per 100 Females in Ames.
What is the Ratio of Females per 100 Males in Ames?
There are 86.52 Females per 100 Males in Ames.
What is the Median Population Age in Ames?
Median Population Age in Ames is 23.0 Years.
What is the Average Family Size in Ames
Average Family Size in Ames is 2.8 People.
What is the Average Household Size in Ames
Average Household Size in Ames is 2.2 People.
How Large is the Labor Force in Ames?
There are 39,309 People in the Labor Forcein in Ames.
What is the Percentage of People in the Labor Force in Ames?
65.5% of People are in the Labor Force in Ames.
What is the Unemployment Rate in Ames?
Unemployment Rate in Ames is 7.1%.