Sioux County, IA Map & Demographics
Sioux County Overview
$34,914
PER CAPITA INCOME
$95,737
AVG FAMILY INCOME
$81,914
AVG HOUSEHOLD INCOME
44.4%
WAGE / INCOME GAP [ % ]
55.6¢/ $1
WAGE / INCOME GAP [ $ ]
0.41
INEQUALITY / GINI INDEX
35,815
TOTAL POPULATION
18,140
MALE POPULATION
17,675
FEMALE POPULATION
102.63
MALES / 100 FEMALES
97.44
FEMALES / 100 MALES
34.4
MEDIAN AGE
3.2
AVG FAMILY SIZE
2.7
AVG HOUSEHOLD SIZE
19,568
LABOR FORCE [ PEOPLE ]
71.9%
PERCENT IN LABOR FORCE
2.3%
UNEMPLOYMENT RATE
Sioux County Area Codes
Income in Sioux County
Income Overview in Sioux County
Per Capita Income in Sioux County is $34,914, while median incomes of families and households are $95,737 and $81,914 respectively.
| Characteristic | Number | Measure |
| Per Capita Income | 35,815 | $34,914 |
| Median Family Income | 8,916 | $95,737 |
| Mean Family Income | 8,916 | $115,400 |
| Median Household Income | 12,462 | $81,914 |
| Mean Household Income | 12,462 | $98,083 |
| Income Deficit | 8,916 | $0 |
| Wage / Income Gap (%) | 35,815 | 44.37% |
| Wage / Income Gap ($) | 35,815 | 55.63¢ per $1 |
| Gini / Inequality Index | 35,815 | 0.41 |
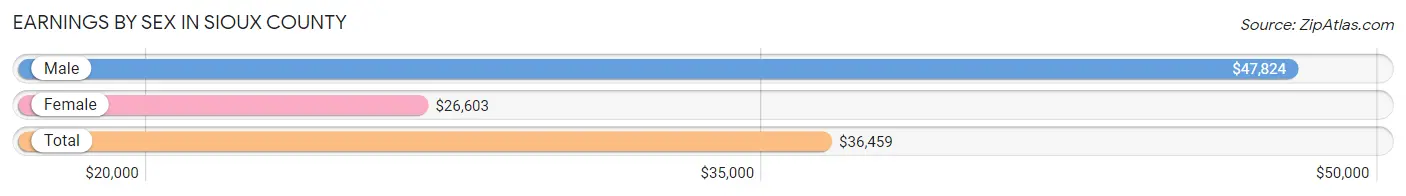
Earnings by Sex in Sioux County
Average Earnings in Sioux County are $36,459, $47,824 for men and $26,603 for women, a difference of 44.4%.
| Sex | Number | Average Earnings |
| Male | 11,524 (54.4%) | $47,824 |
| Female | 9,639 (45.6%) | $26,603 |
| Total | 21,163 (100.0%) | $36,459 |
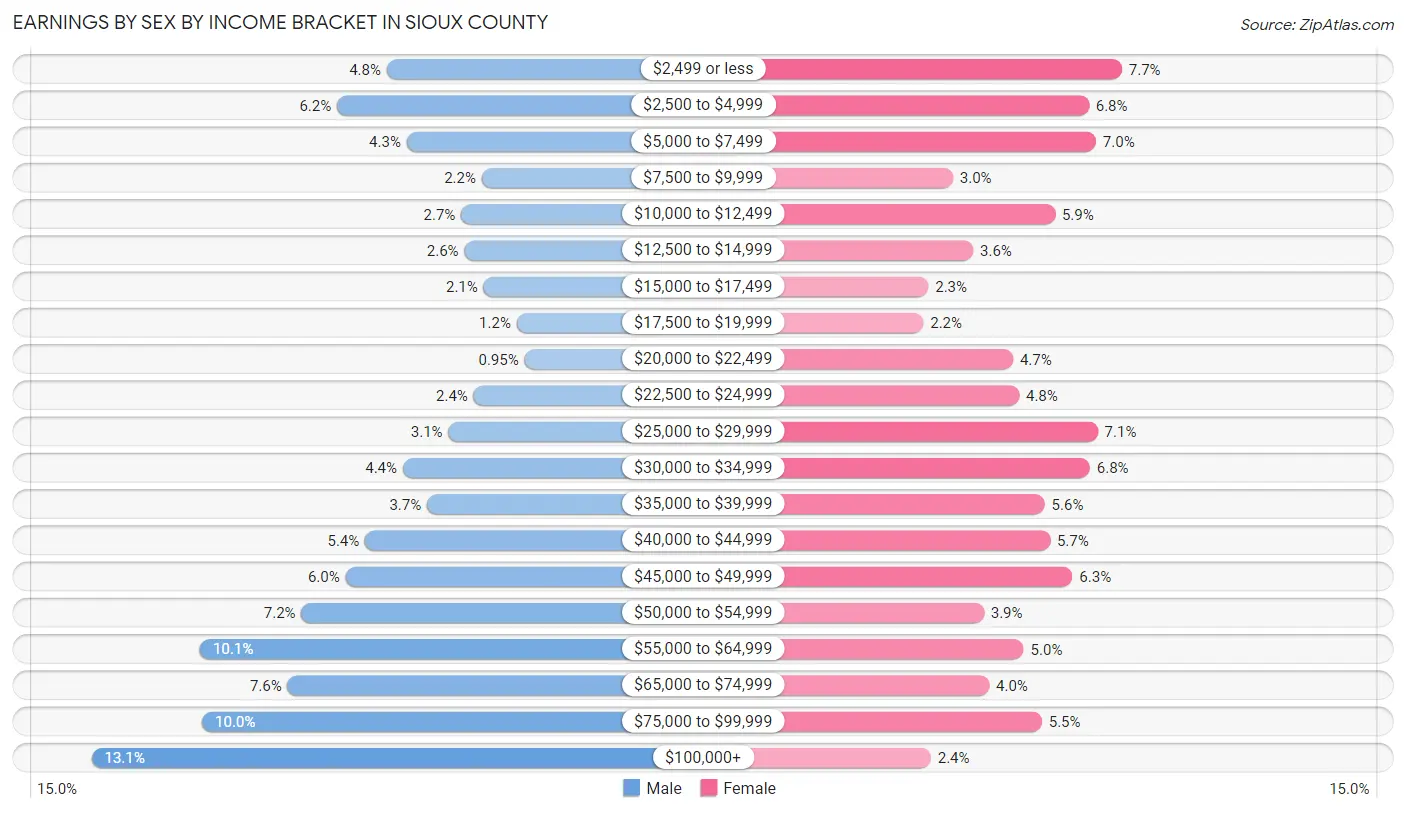
Earnings by Sex by Income Bracket in Sioux County
The most common earnings brackets in Sioux County are $100,000+ for men (1,512 | 13.1%) and $2,499 or less for women (745 | 7.7%).
| Income | Male | Female |
| $2,499 or less | 555 (4.8%) | 745 (7.7%) |
| $2,500 to $4,999 | 717 (6.2%) | 655 (6.8%) |
| $5,000 to $7,499 | 491 (4.3%) | 675 (7.0%) |
| $7,500 to $9,999 | 248 (2.1%) | 287 (3.0%) |
| $10,000 to $12,499 | 315 (2.7%) | 564 (5.9%) |
| $12,500 to $14,999 | 304 (2.6%) | 342 (3.5%) |
| $15,000 to $17,499 | 242 (2.1%) | 221 (2.3%) |
| $17,500 to $19,999 | 135 (1.2%) | 207 (2.1%) |
| $20,000 to $22,499 | 109 (0.9%) | 450 (4.7%) |
| $22,500 to $24,999 | 274 (2.4%) | 467 (4.8%) |
| $25,000 to $29,999 | 356 (3.1%) | 680 (7.0%) |
| $30,000 to $34,999 | 504 (4.4%) | 658 (6.8%) |
| $35,000 to $39,999 | 425 (3.7%) | 536 (5.6%) |
| $40,000 to $44,999 | 626 (5.4%) | 550 (5.7%) |
| $45,000 to $49,999 | 689 (6.0%) | 611 (6.3%) |
| $50,000 to $54,999 | 832 (7.2%) | 371 (3.8%) |
| $55,000 to $64,999 | 1,160 (10.1%) | 479 (5.0%) |
| $65,000 to $74,999 | 877 (7.6%) | 386 (4.0%) |
| $75,000 to $99,999 | 1,153 (10.0%) | 528 (5.5%) |
| $100,000+ | 1,512 (13.1%) | 227 (2.4%) |
| Total | 11,524 (100.0%) | 9,639 (100.0%) |
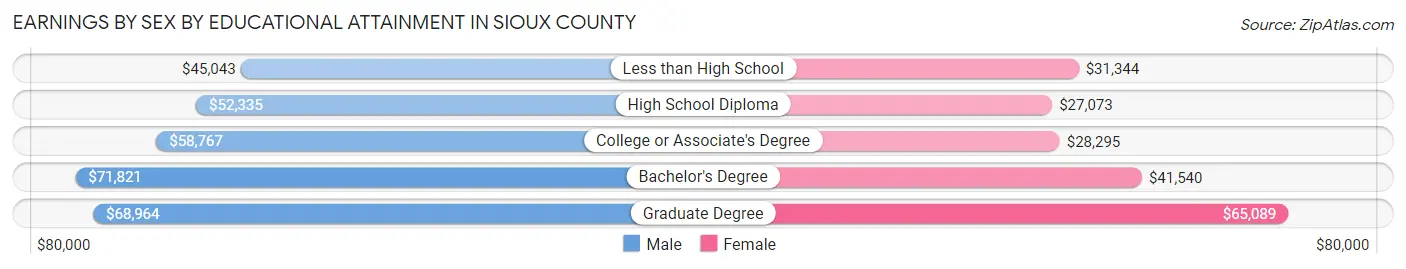
Earnings by Sex by Educational Attainment in Sioux County
Average earnings in Sioux County are $56,179 for men and $34,131 for women, a difference of 39.3%. Men with an educational attainment of bachelor's degree enjoy the highest average annual earnings of $71,821, while those with less than high school education earn the least with $45,043. Women with an educational attainment of graduate degree earn the most with the average annual earnings of $65,089, while those with high school diploma education have the smallest earnings of $27,073.
| Educational Attainment | Male Income | Female Income |
| Less than High School | $45,043 | $31,344 |
| High School Diploma | $52,335 | $27,073 |
| College or Associate's Degree | $58,767 | $28,295 |
| Bachelor's Degree | $71,821 | $41,540 |
| Graduate Degree | $68,964 | $65,089 |
| Total | $56,179 | $34,131 |
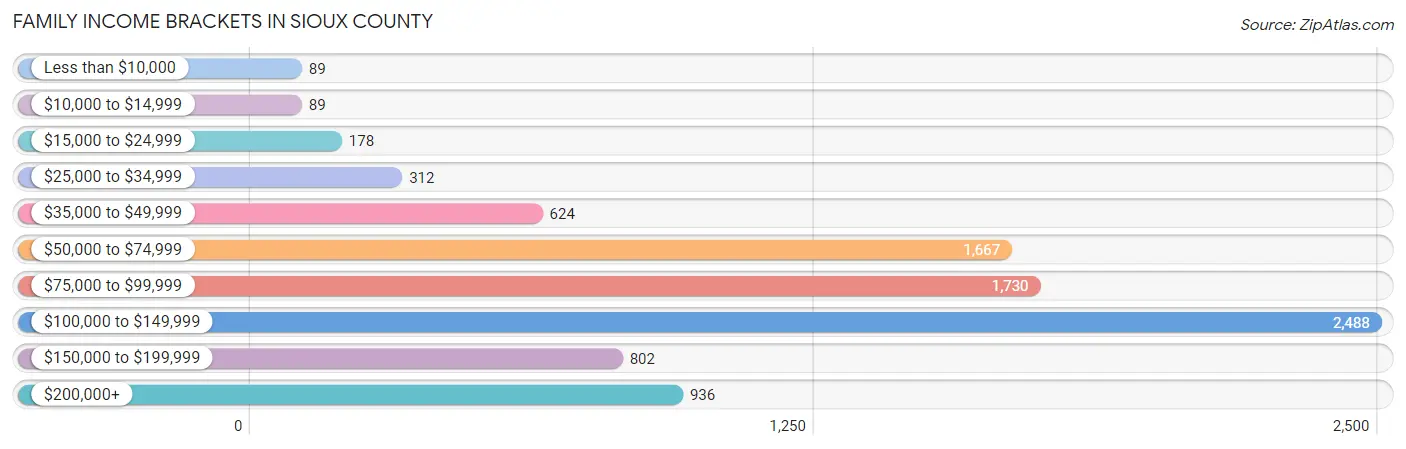
Family Income in Sioux County
Family Income Brackets in Sioux County
According to the Sioux County family income data, there are 2,488 families falling into the $100,000 to $149,999 income range, which is the most common income bracket and makes up 27.9% of all families. Conversely, the less than $10,000 income bracket is the least frequent group with only 89 families (1.0%) belonging to this category.
| Income Bracket | # Families | % Families |
| Less than $10,000 | 89 | 1.0% |
| $10,000 to $14,999 | 89 | 1.0% |
| $15,000 to $24,999 | 178 | 2.0% |
| $25,000 to $34,999 | 312 | 3.5% |
| $35,000 to $49,999 | 624 | 7.0% |
| $50,000 to $74,999 | 1,667 | 18.7% |
| $75,000 to $99,999 | 1,730 | 19.4% |
| $100,000 to $149,999 | 2,488 | 27.9% |
| $150,000 to $199,999 | 802 | 9.0% |
| $200,000+ | 936 | 10.5% |
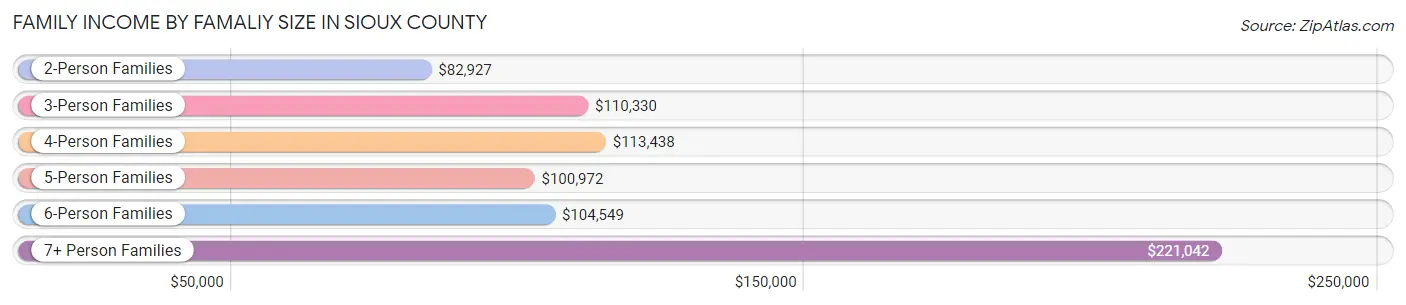
Family Income by Famaliy Size in Sioux County
7+ person families (88 | 1.0%) account for the highest median family income in Sioux County with $221,042 per family, while 2-person families (4,212 | 47.2%) have the highest median income of $41,464 per family member.
| Income Bracket | # Families | Median Income |
| 2-Person Families | 4,212 (47.2%) | $82,927 |
| 3-Person Families | 1,482 (16.6%) | $110,330 |
| 4-Person Families | 1,292 (14.5%) | $113,438 |
| 5-Person Families | 1,206 (13.5%) | $100,972 |
| 6-Person Families | 636 (7.1%) | $104,549 |
| 7+ Person Families | 88 (1.0%) | $221,042 |
| Total | 8,916 (100.0%) | $95,737 |
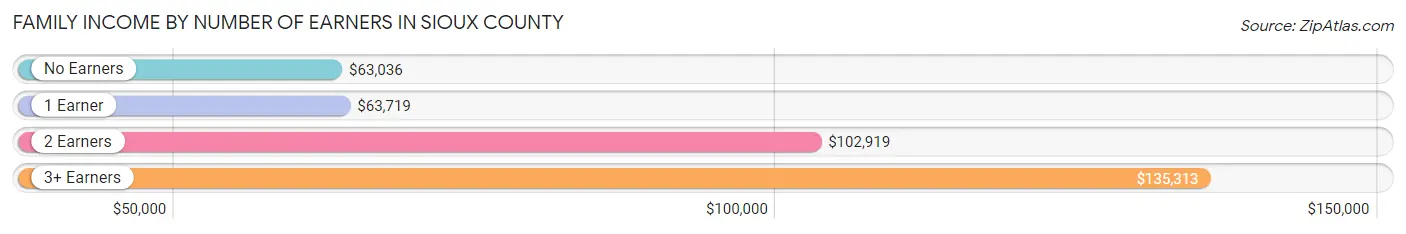
Family Income by Number of Earners in Sioux County
The median family income in Sioux County is $95,737, with families comprising 3+ earners (1,431) having the highest median family income of $135,313, while families with no earners (882) have the lowest median family income of $63,036, accounting for 16.1% and 9.9% of families, respectively.
| Number of Earners | # Families | Median Income |
| No Earners | 882 (9.9%) | $63,036 |
| 1 Earner | 1,844 (20.7%) | $63,719 |
| 2 Earners | 4,759 (53.4%) | $102,919 |
| 3+ Earners | 1,431 (16.1%) | $135,313 |
| Total | 8,916 (100.0%) | $95,737 |
Household Income in Sioux County
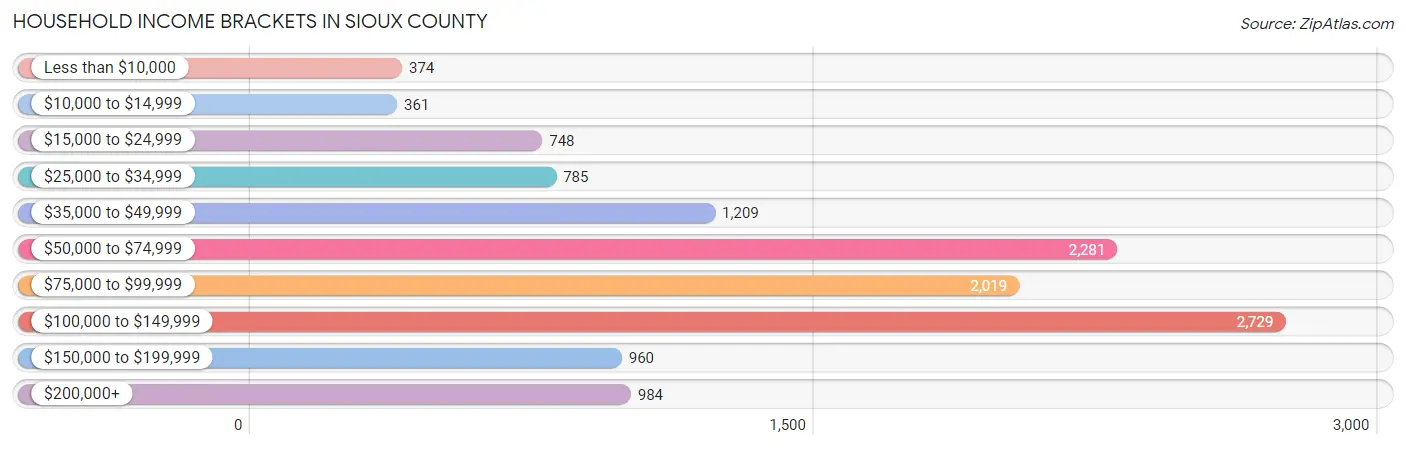
Household Income Brackets in Sioux County
With 2,729 households falling in the category, the $100,000 to $149,999 income range is the most frequent in Sioux County, accounting for 21.9% of all households. In contrast, only 361 households (2.9%) fall into the $10,000 to $14,999 income bracket, making it the least populous group.
| Income Bracket | # Households | % Households |
| Less than $10,000 | 374 | 3.0% |
| $10,000 to $14,999 | 361 | 2.9% |
| $15,000 to $24,999 | 748 | 6.0% |
| $25,000 to $34,999 | 785 | 6.3% |
| $35,000 to $49,999 | 1,209 | 9.7% |
| $50,000 to $74,999 | 2,281 | 18.3% |
| $75,000 to $99,999 | 2,019 | 16.2% |
| $100,000 to $149,999 | 2,729 | 21.9% |
| $150,000 to $199,999 | 960 | 7.7% |
| $200,000+ | 984 | 7.9% |
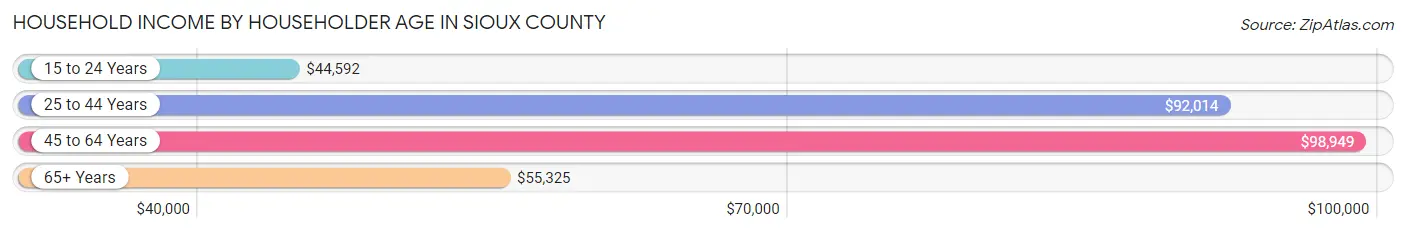
Household Income by Householder Age in Sioux County
The median household income in Sioux County is $81,914, with the highest median household income of $98,949 found in the 45 to 64 years age bracket for the primary householder. A total of 4,117 households (33.0%) fall into this category. Meanwhile, the 15 to 24 years age bracket for the primary householder has the lowest median household income of $44,592, with 764 households (6.1%) in this group.
| Income Bracket | # Households | Median Income |
| 15 to 24 Years | 764 (6.1%) | $44,592 |
| 25 to 44 Years | 3,966 (31.8%) | $92,014 |
| 45 to 64 Years | 4,117 (33.0%) | $98,949 |
| 65+ Years | 3,615 (29.0%) | $55,325 |
| Total | 12,462 (100.0%) | $81,914 |
Poverty in Sioux County
Income Below Poverty by Sex and Age in Sioux County
With 5.4% poverty level for males and 6.7% for females among the residents of Sioux County, 75 year old and over males and 75 year old and over females are the most vulnerable to poverty, with 116 males (11.7%) and 210 females (13.5%) in their respective age groups living below the poverty level.
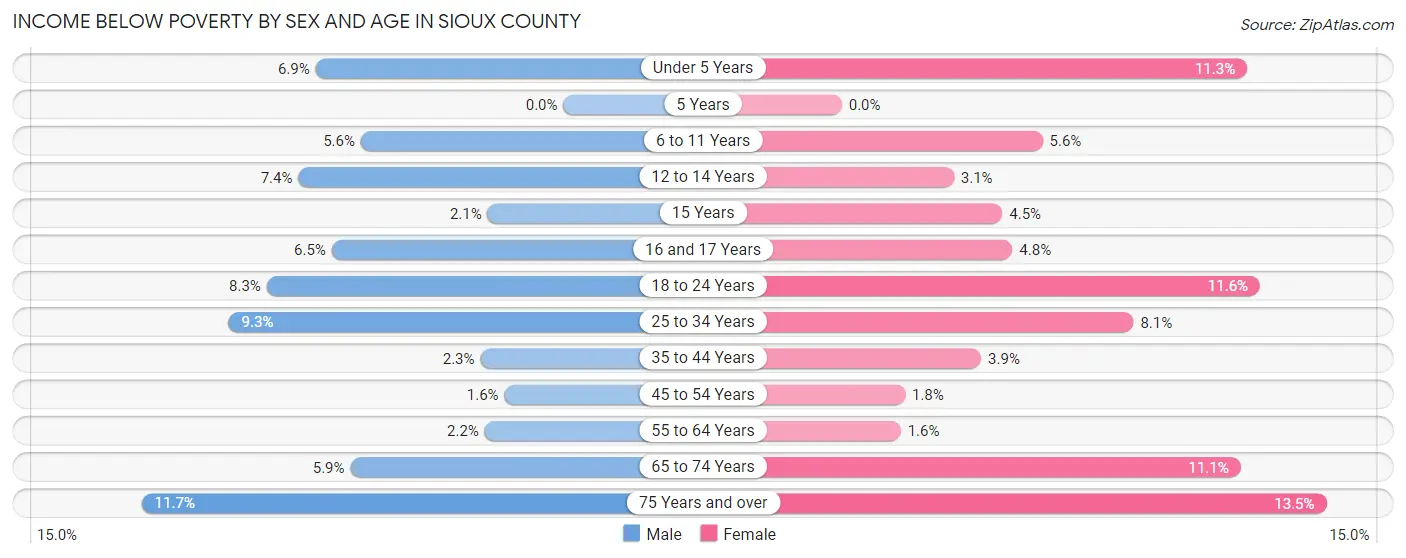
| Age Bracket | Male | Female |
| Under 5 Years | 86 (6.9%) | 137 (11.3%) |
| 5 Years | 0 (0.0%) | 0 (0.0%) |
| 6 to 11 Years | 94 (5.6%) | 88 (5.6%) |
| 12 to 14 Years | 66 (7.4%) | 28 (3.1%) |
| 15 Years | 8 (2.1%) | 11 (4.5%) |
| 16 and 17 Years | 33 (6.5%) | 25 (4.8%) |
| 18 to 24 Years | 131 (8.3%) | 165 (11.6%) |
| 25 to 34 Years | 178 (9.3%) | 145 (8.1%) |
| 35 to 44 Years | 53 (2.3%) | 78 (3.9%) |
| 45 to 54 Years | 29 (1.6%) | 29 (1.8%) |
| 55 to 64 Years | 46 (2.2%) | 33 (1.6%) |
| 65 to 74 Years | 89 (5.9%) | 161 (11.1%) |
| 75 Years and over | 116 (11.7%) | 210 (13.5%) |
| Total | 929 (5.4%) | 1,110 (6.7%) |
Income Above Poverty by Sex and Age in Sioux County
According to the poverty statistics in Sioux County, males aged 5 years and females aged 5 years are the age groups that are most secure financially, with 100.0% of males and 100.0% of females in these age groups living above the poverty line.
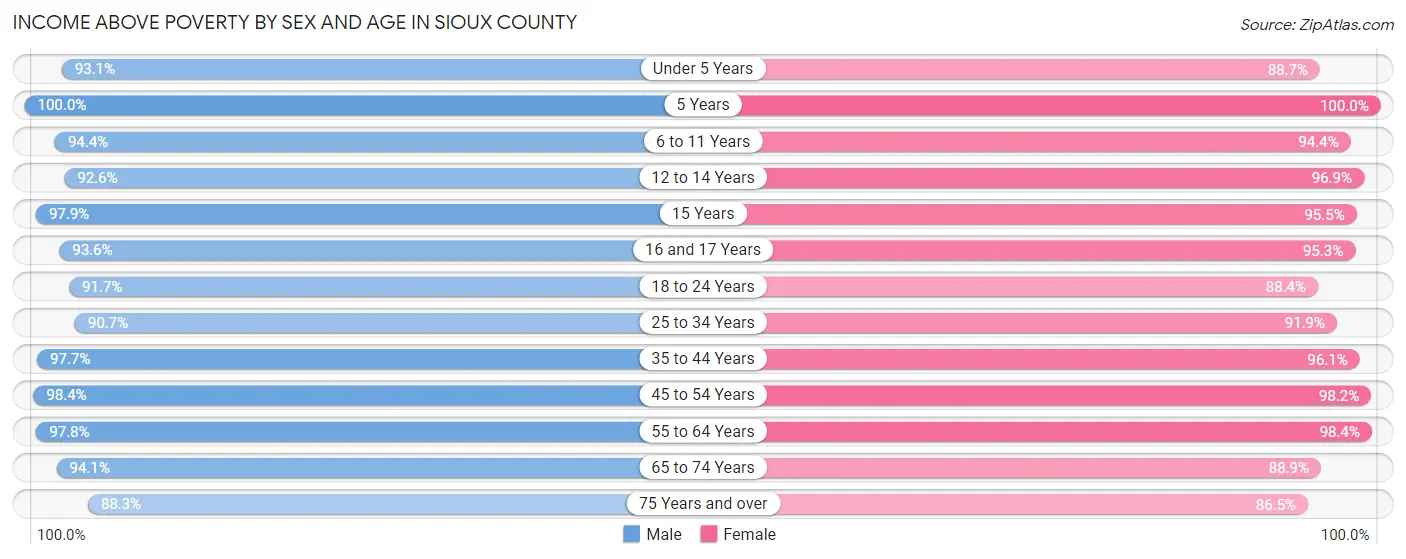
| Age Bracket | Male | Female |
| Under 5 Years | 1,161 (93.1%) | 1,078 (88.7%) |
| 5 Years | 195 (100.0%) | 176 (100.0%) |
| 6 to 11 Years | 1,574 (94.4%) | 1,486 (94.4%) |
| 12 to 14 Years | 828 (92.6%) | 870 (96.9%) |
| 15 Years | 372 (97.9%) | 235 (95.5%) |
| 16 and 17 Years | 479 (93.5%) | 501 (95.3%) |
| 18 to 24 Years | 1,454 (91.7%) | 1,253 (88.4%) |
| 25 to 34 Years | 1,731 (90.7%) | 1,640 (91.9%) |
| 35 to 44 Years | 2,238 (97.7%) | 1,930 (96.1%) |
| 45 to 54 Years | 1,740 (98.4%) | 1,617 (98.2%) |
| 55 to 64 Years | 2,050 (97.8%) | 1,980 (98.4%) |
| 65 to 74 Years | 1,412 (94.1%) | 1,289 (88.9%) |
| 75 Years and over | 872 (88.3%) | 1,347 (86.5%) |
| Total | 16,106 (94.6%) | 15,402 (93.3%) |
Income Below Poverty Among Married-Couple Families in Sioux County
The poverty statistics for married-couple families in Sioux County show that 2.1% or 172 of the total 8,052 families live below the poverty line. Families with 5 or more children have the highest poverty rate of 39.1%, comprising of 9 families. On the other hand, families with 1 or 2 children have the lowest poverty rate of 0.9%, which includes 20 families.
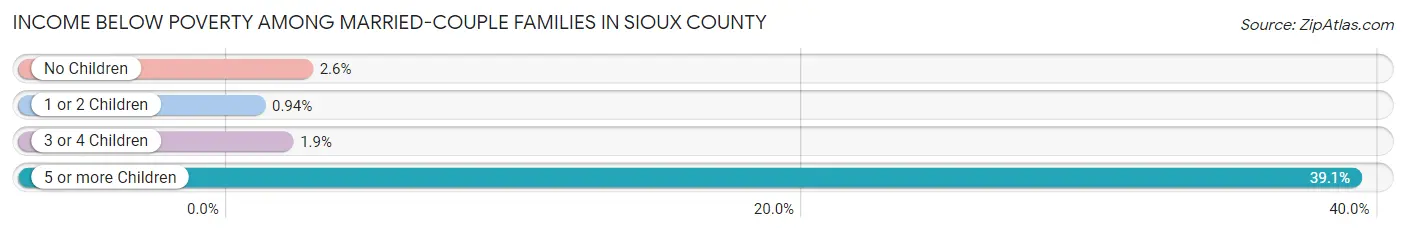
| Children | Above Poverty | Below Poverty |
| No Children | 4,271 (97.4%) | 114 (2.6%) |
| 1 or 2 Children | 2,116 (99.1%) | 20 (0.9%) |
| 3 or 4 Children | 1,479 (98.1%) | 29 (1.9%) |
| 5 or more Children | 14 (60.9%) | 9 (39.1%) |
| Total | 7,880 (97.9%) | 172 (2.1%) |
Income Below Poverty Among Single-Parent Households in Sioux County
According to the poverty data in Sioux County, 6.1% or 17 single-father households and 18.6% or 109 single-mother households are living below the poverty line. Among single-father households, those with 3 or 4 children have the highest poverty rate, with 12 households (30.8%) experiencing poverty. Likewise, among single-mother households, those with 3 or 4 children have the highest poverty rate, with 69 households (61.6%) falling below the poverty line.
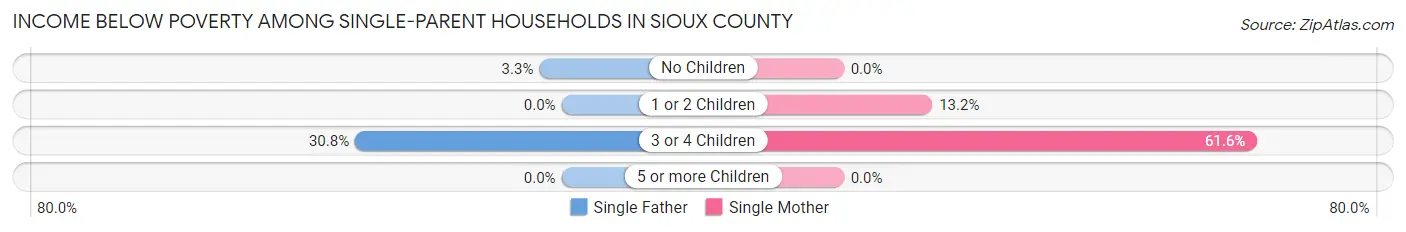
| Children | Single Father | Single Mother |
| No Children | 5 (3.3%) | 0 (0.0%) |
| 1 or 2 Children | 0 (0.0%) | 40 (13.2%) |
| 3 or 4 Children | 12 (30.8%) | 69 (61.6%) |
| 5 or more Children | 0 (0.0%) | 0 (0.0%) |
| Total | 17 (6.1%) | 109 (18.6%) |
Income Below Poverty Among Married-Couple vs Single-Parent Households in Sioux County
The poverty data for Sioux County shows that 172 of the married-couple family households (2.1%) and 126 of the single-parent households (14.6%) are living below the poverty level. Within the married-couple family households, those with 5 or more children have the highest poverty rate, with 9 households (39.1%) falling below the poverty line. Among the single-parent households, those with 3 or 4 children have the highest poverty rate, with 81 household (53.6%) living below poverty.
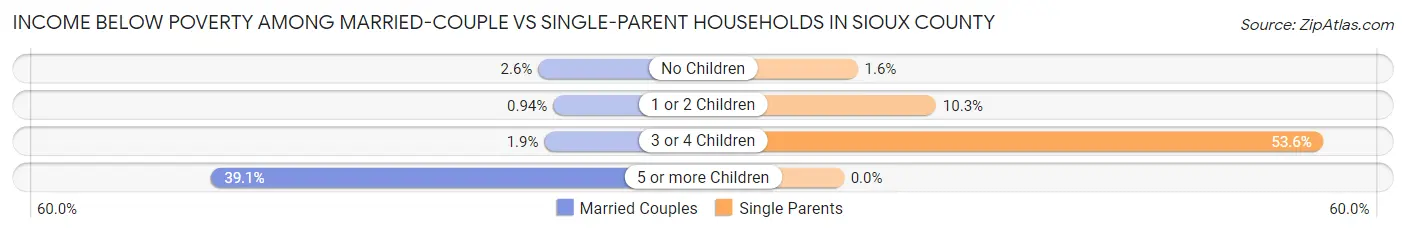
| Children | Married-Couple Families | Single-Parent Households |
| No Children | 114 (2.6%) | 5 (1.6%) |
| 1 or 2 Children | 20 (0.9%) | 40 (10.3%) |
| 3 or 4 Children | 29 (1.9%) | 81 (53.6%) |
| 5 or more Children | 9 (39.1%) | 0 (0.0%) |
| Total | 172 (2.1%) | 126 (14.6%) |
Race in Sioux County
The most populous races in Sioux County are White / Caucasian (32,394 | 90.4%), Hispanic or Latino (4,088 | 11.4%), and Two or more Races (1,601 | 4.5%).
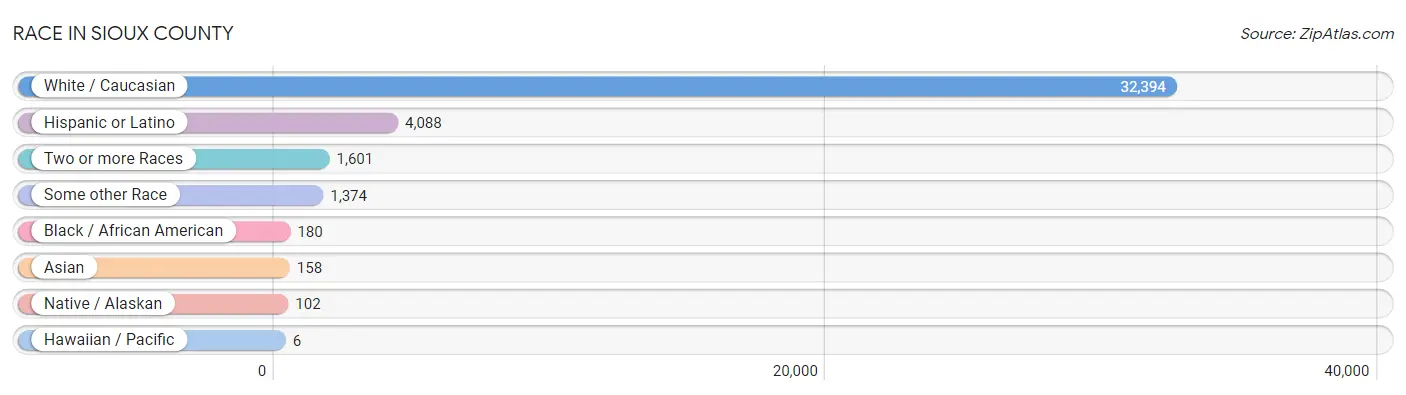
| Race | # Population | % Population |
| Asian | 158 | 0.4% |
| Black / African American | 180 | 0.5% |
| Hawaiian / Pacific | 6 | 0.0% |
| Hispanic or Latino | 4,088 | 11.4% |
| Native / Alaskan | 102 | 0.3% |
| White / Caucasian | 32,394 | 90.4% |
| Two or more Races | 1,601 | 4.5% |
| Some other Race | 1,374 | 3.8% |
| Total | 35,815 | 100.0% |
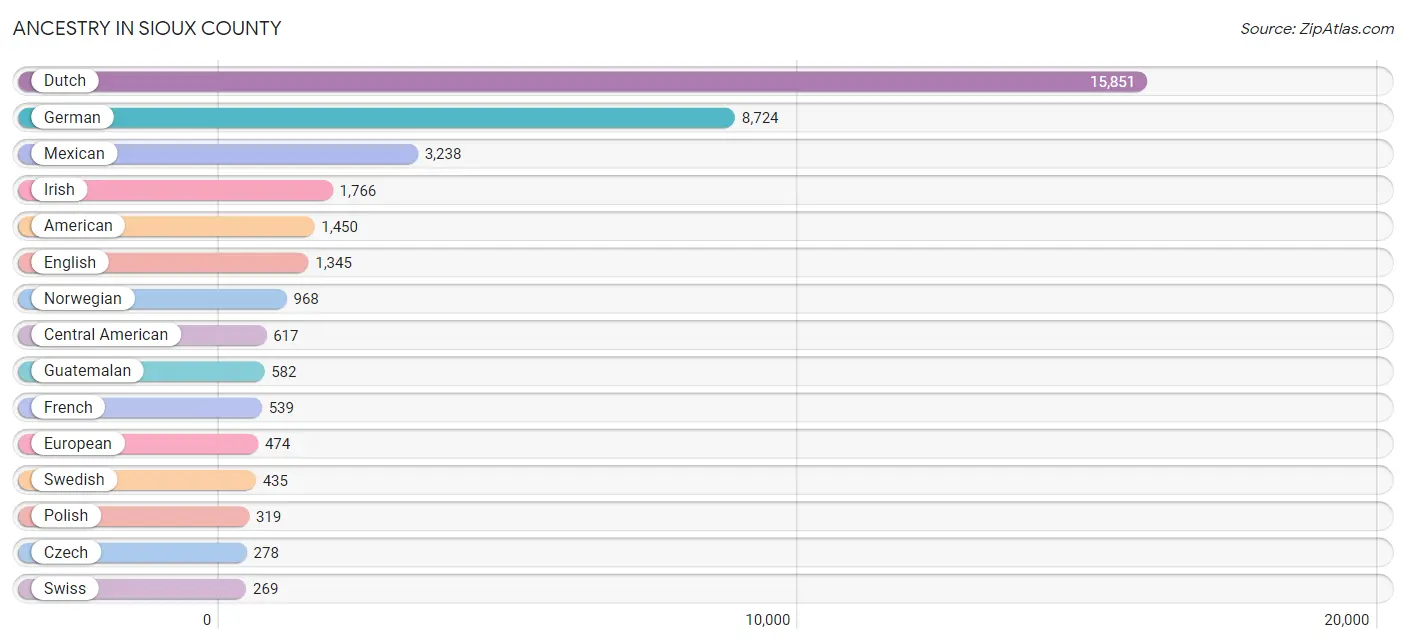
Ancestry in Sioux County
The most populous ancestries reported in Sioux County are Dutch (15,851 | 44.3%), German (8,724 | 24.4%), Mexican (3,238 | 9.0%), Irish (1,766 | 4.9%), and American (1,450 | 4.1%), together accounting for 86.6% of all Sioux County residents.
| Ancestry | # Population | % Population |
| African | 23 | 0.1% |
| Albanian | 3 | 0.0% |
| American | 1,450 | 4.1% |
| Apache | 17 | 0.1% |
| Arab | 24 | 0.1% |
| Australian | 15 | 0.0% |
| Austrian | 35 | 0.1% |
| Belgian | 1 | 0.0% |
| Bhutanese | 101 | 0.3% |
| British | 62 | 0.2% |
| Bulgarian | 26 | 0.1% |
| Burmese | 10 | 0.0% |
| Canadian | 45 | 0.1% |
| Central American | 617 | 1.7% |
| Cherokee | 14 | 0.0% |
| Cheyenne | 12 | 0.0% |
| Chippewa | 18 | 0.1% |
| Colombian | 22 | 0.1% |
| Comanche | 7 | 0.0% |
| Cree | 17 | 0.1% |
| Czech | 278 | 0.8% |
| Czechoslovakian | 10 | 0.0% |
| Danish | 263 | 0.7% |
| Dutch | 15,851 | 44.3% |
| Eastern European | 9 | 0.0% |
| English | 1,345 | 3.8% |
| Ethiopian | 3 | 0.0% |
| European | 474 | 1.3% |
| French | 539 | 1.5% |
| French Canadian | 64 | 0.2% |
| German | 8,724 | 24.4% |
| Greek | 4 | 0.0% |
| Guatemalan | 582 | 1.6% |
| Honduran | 35 | 0.1% |
| Indian (Asian) | 31 | 0.1% |
| Irish | 1,766 | 4.9% |
| Italian | 85 | 0.2% |
| Korean | 62 | 0.2% |
| Laotian | 5 | 0.0% |
| Lebanese | 21 | 0.1% |
| Lithuanian | 12 | 0.0% |
| Luxembourger | 175 | 0.5% |
| Malaysian | 9 | 0.0% |
| Mexican | 3,238 | 9.0% |
| Mexican American Indian | 55 | 0.2% |
| Northern European | 117 | 0.3% |
| Norwegian | 968 | 2.7% |
| Polish | 319 | 0.9% |
| Portuguese | 2 | 0.0% |
| Puerto Rican | 19 | 0.1% |
| Romanian | 3 | 0.0% |
| Russian | 28 | 0.1% |
| Samoan | 18 | 0.1% |
| Scandinavian | 48 | 0.1% |
| Scotch-Irish | 249 | 0.7% |
| Scottish | 161 | 0.4% |
| Serbian | 1 | 0.0% |
| Sioux | 5 | 0.0% |
| South American | 22 | 0.1% |
| Spaniard | 66 | 0.2% |
| Spanish | 52 | 0.2% |
| Sri Lankan | 18 | 0.1% |
| Subsaharan African | 26 | 0.1% |
| Swedish | 435 | 1.2% |
| Swiss | 269 | 0.7% |
| Syrian | 3 | 0.0% |
| Thai | 98 | 0.3% |
| Tongan | 23 | 0.1% |
| Vietnamese | 10 | 0.0% |
| Welsh | 48 | 0.1% |
| West Indian | 8 | 0.0% | View All 71 Rows |
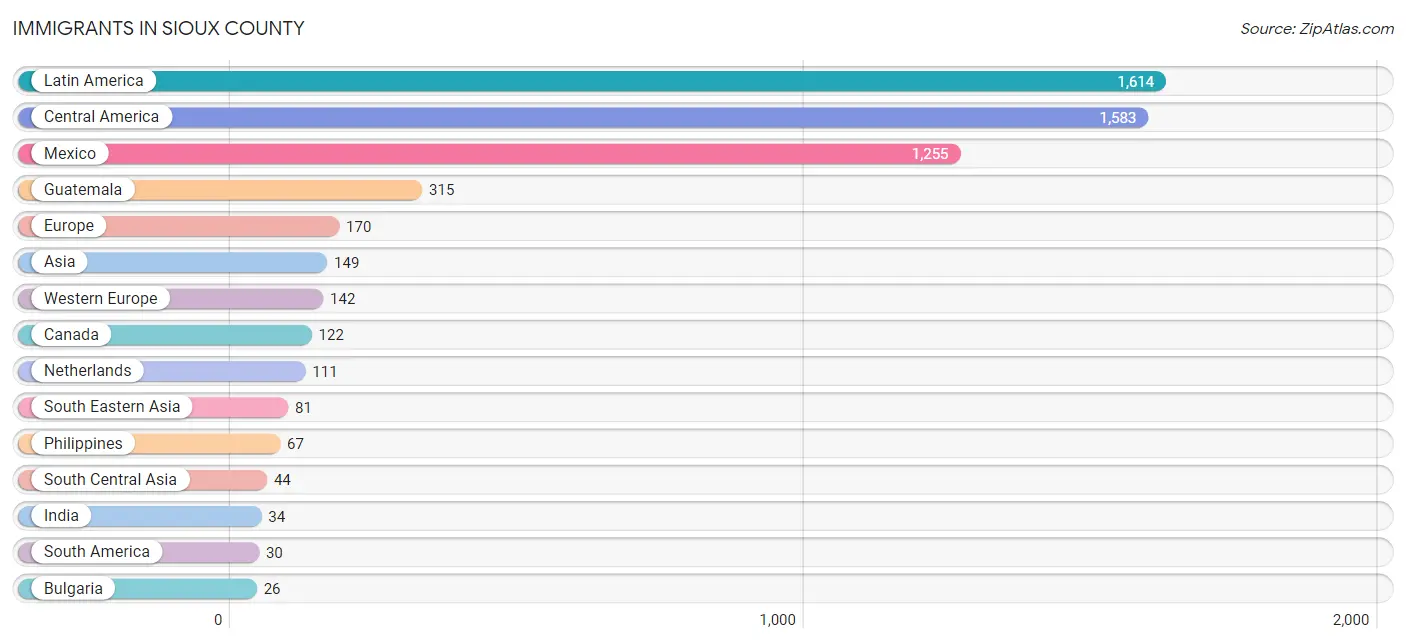
Immigrants in Sioux County
The most numerous immigrant groups reported in Sioux County came from Latin America (1,614 | 4.5%), Central America (1,583 | 4.4%), Mexico (1,255 | 3.5%), Guatemala (315 | 0.9%), and Europe (170 | 0.5%), together accounting for 13.8% of all Sioux County residents.
| Immigration Origin | # Population | % Population |
| Africa | 2 | 0.0% |
| Asia | 149 | 0.4% |
| Austria | 15 | 0.0% |
| Bangladesh | 10 | 0.0% |
| Bulgaria | 26 | 0.1% |
| Canada | 122 | 0.3% |
| Caribbean | 1 | 0.0% |
| Central America | 1,583 | 4.4% |
| China | 19 | 0.1% |
| Colombia | 16 | 0.0% |
| Cuba | 1 | 0.0% |
| Eastern Africa | 2 | 0.0% |
| Eastern Asia | 24 | 0.1% |
| Eastern Europe | 26 | 0.1% |
| Ecuador | 14 | 0.0% |
| Ethiopia | 2 | 0.0% |
| Europe | 170 | 0.5% |
| Germany | 16 | 0.0% |
| Guatemala | 315 | 0.9% |
| Honduras | 13 | 0.0% |
| India | 34 | 0.1% |
| Indonesia | 5 | 0.0% |
| Japan | 5 | 0.0% |
| Latin America | 1,614 | 4.5% |
| Mexico | 1,255 | 3.5% |
| Netherlands | 111 | 0.3% |
| Northern Europe | 2 | 0.0% |
| Oceania | 4 | 0.0% |
| Philippines | 67 | 0.2% |
| South America | 30 | 0.1% |
| South Central Asia | 44 | 0.1% |
| South Eastern Asia | 81 | 0.2% |
| Vietnam | 9 | 0.0% |
| Western Europe | 142 | 0.4% | View All 34 Rows |
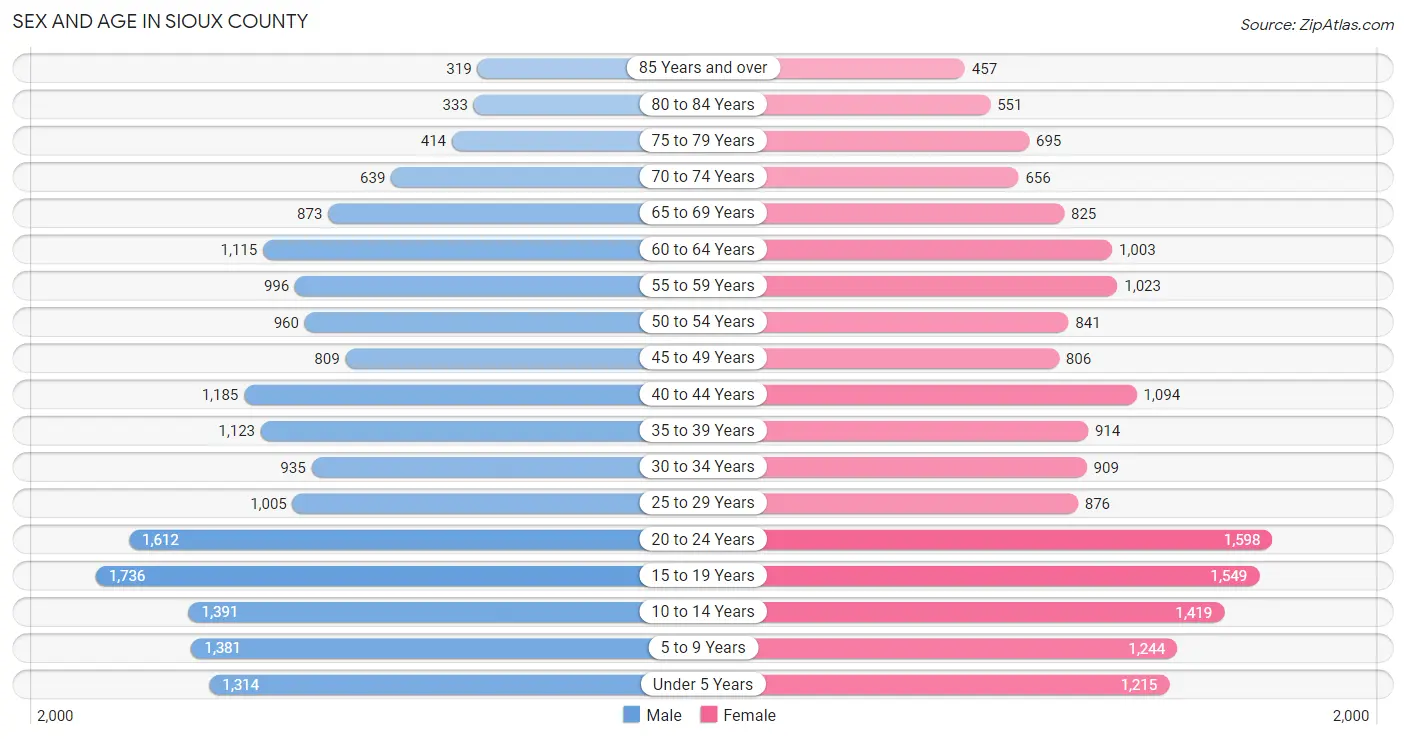
Sex and Age in Sioux County
Sex and Age in Sioux County
The most populous age groups in Sioux County are 15 to 19 Years (1,736 | 9.6%) for men and 20 to 24 Years (1,598 | 9.0%) for women.
| Age Bracket | Male | Female |
| Under 5 Years | 1,314 (7.2%) | 1,215 (6.9%) |
| 5 to 9 Years | 1,381 (7.6%) | 1,244 (7.0%) |
| 10 to 14 Years | 1,391 (7.7%) | 1,419 (8.0%) |
| 15 to 19 Years | 1,736 (9.6%) | 1,549 (8.8%) |
| 20 to 24 Years | 1,612 (8.9%) | 1,598 (9.0%) |
| 25 to 29 Years | 1,005 (5.5%) | 876 (5.0%) |
| 30 to 34 Years | 935 (5.1%) | 909 (5.1%) |
| 35 to 39 Years | 1,123 (6.2%) | 914 (5.2%) |
| 40 to 44 Years | 1,185 (6.5%) | 1,094 (6.2%) |
| 45 to 49 Years | 809 (4.5%) | 806 (4.6%) |
| 50 to 54 Years | 960 (5.3%) | 841 (4.8%) |
| 55 to 59 Years | 996 (5.5%) | 1,023 (5.8%) |
| 60 to 64 Years | 1,115 (6.1%) | 1,003 (5.7%) |
| 65 to 69 Years | 873 (4.8%) | 825 (4.7%) |
| 70 to 74 Years | 639 (3.5%) | 656 (3.7%) |
| 75 to 79 Years | 414 (2.3%) | 695 (3.9%) |
| 80 to 84 Years | 333 (1.8%) | 551 (3.1%) |
| 85 Years and over | 319 (1.8%) | 457 (2.6%) |
| Total | 18,140 (100.0%) | 17,675 (100.0%) |
Families and Households in Sioux County
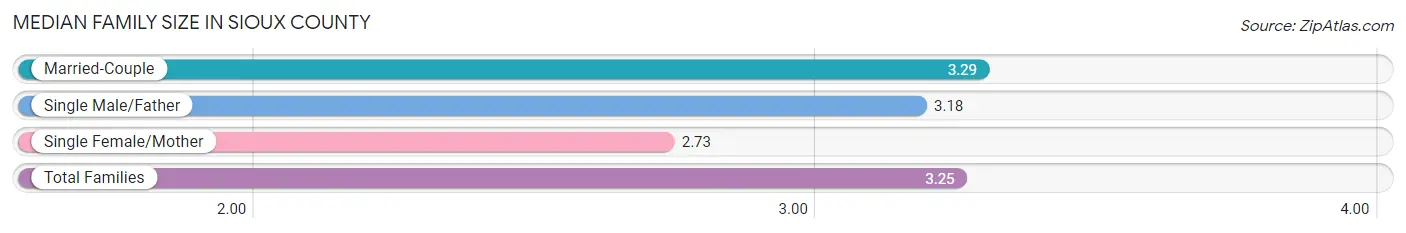
Median Family Size in Sioux County
The median family size in Sioux County is 3.25 persons per family, with married-couple families (8,052 | 90.3%) accounting for the largest median family size of 3.29 persons per family. On the other hand, single female/mother families (586 | 6.6%) represent the smallest median family size with 2.73 persons per family.
| Family Type | # Families | Family Size |
| Married-Couple | 8,052 (90.3%) | 3.29 |
| Single Male/Father | 278 (3.1%) | 3.18 |
| Single Female/Mother | 586 (6.6%) | 2.73 |
| Total Families | 8,916 (100.0%) | 3.25 |
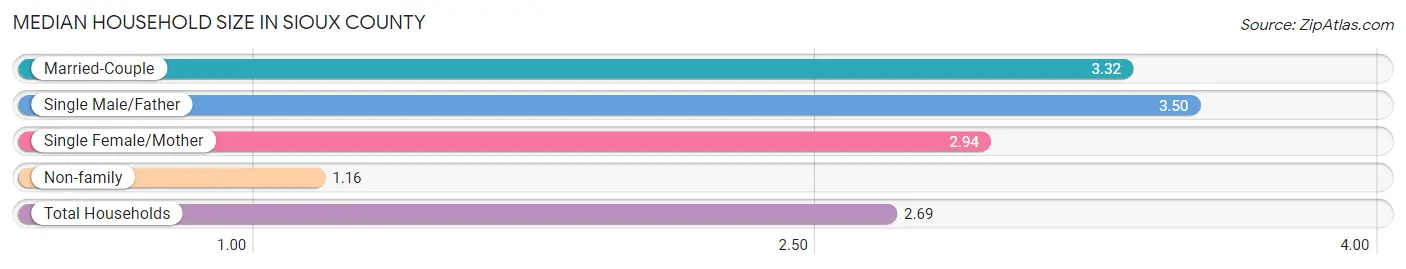
Median Household Size in Sioux County
The median household size in Sioux County is 2.69 persons per household, with single male/father households (278 | 2.2%) accounting for the largest median household size of 3.5 persons per household. non-family households (3,546 | 28.4%) represent the smallest median household size with 1.16 persons per household.
| Household Type | # Households | Household Size |
| Married-Couple | 8,052 (64.6%) | 3.32 |
| Single Male/Father | 278 (2.2%) | 3.50 |
| Single Female/Mother | 586 (4.7%) | 2.94 |
| Non-family | 3,546 (28.4%) | 1.16 |
| Total Households | 12,462 (100.0%) | 2.69 |
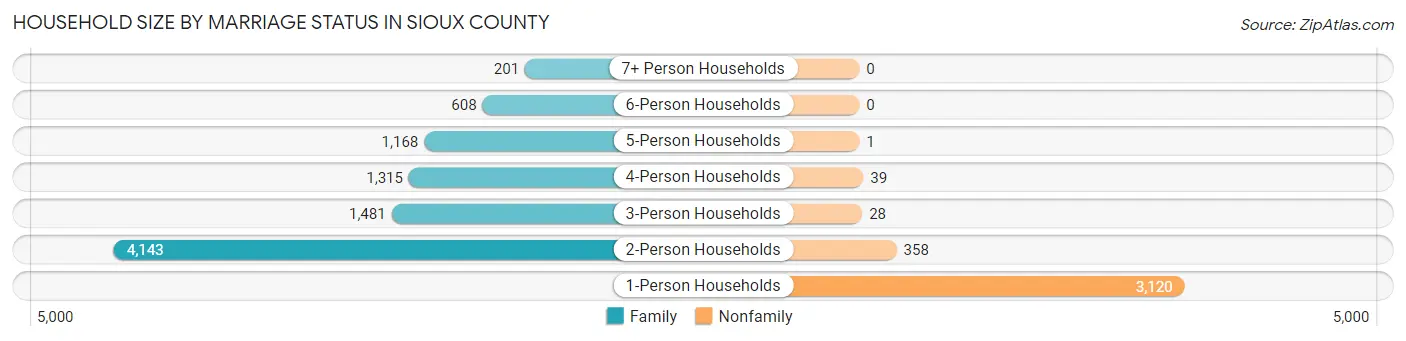
Household Size by Marriage Status in Sioux County
Out of a total of 12,462 households in Sioux County, 8,916 (71.6%) are family households, while 3,546 (28.4%) are nonfamily households. The most numerous type of family households are 2-person households, comprising 4,143, and the most common type of nonfamily households are 1-person households, comprising 3,120.
| Household Size | Family Households | Nonfamily Households |
| 1-Person Households | - | 3,120 (25.0%) |
| 2-Person Households | 4,143 (33.3%) | 358 (2.9%) |
| 3-Person Households | 1,481 (11.9%) | 28 (0.2%) |
| 4-Person Households | 1,315 (10.5%) | 39 (0.3%) |
| 5-Person Households | 1,168 (9.4%) | 1 (0.0%) |
| 6-Person Households | 608 (4.9%) | 0 (0.0%) |
| 7+ Person Households | 201 (1.6%) | 0 (0.0%) |
| Total | 8,916 (71.6%) | 3,546 (28.4%) |
Female Fertility in Sioux County
Fertility by Age in Sioux County
Average fertility rate in Sioux County is 92.0 births per 1,000 women. Women in the age bracket of 20 to 34 years have the highest fertility rate with 156.0 births per 1,000 women. Women in the age bracket of 20 to 34 years acount for 73.1% of all women with births.
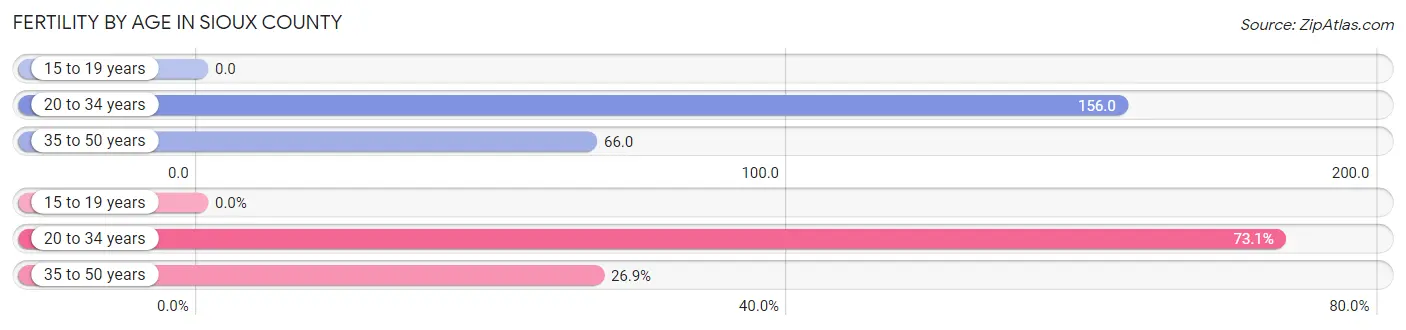
| Age Bracket | Women with Births | Births / 1,000 Women |
| 15 to 19 years | 0 (0.0%) | 0.0 |
| 20 to 34 years | 528 (73.1%) | 156.0 |
| 35 to 50 years | 194 (26.9%) | 66.0 |
| Total | 722 (100.0%) | 92.0 |
Fertility by Age by Marriage Status in Sioux County
86.1% of women with births (722) in Sioux County are married. The highest percentage of unmarried women with births falls into 20 to 34 years age bracket with 14.2% of them unmarried at the time of birth, while the lowest percentage of unmarried women with births belong to 35 to 50 years age bracket with 12.9% of them unmarried.
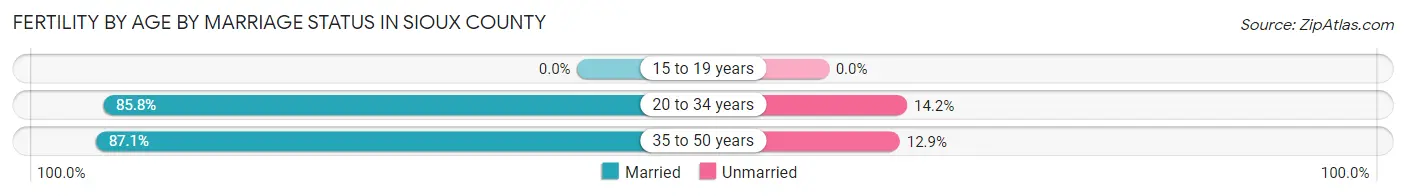
| Age Bracket | Married | Unmarried |
| 15 to 19 years | 0 (0.0%) | 0 (0.0%) |
| 20 to 34 years | 453 (85.8%) | 75 (14.2%) |
| 35 to 50 years | 169 (87.1%) | 25 (12.9%) |
| Total | 622 (86.2%) | 100 (13.9%) |
Fertility by Education in Sioux County
Average fertility rate in Sioux County is 92.0 births per 1,000 women. Women with the education attainment of graduate degree have the highest fertility rate of 166.0 births per 1,000 women, while women with the education attainment of high school diploma have the lowest fertility at 63.0 births per 1,000 women. Women with the education attainment of college or associate's degree represent 33.4% of all women with births.
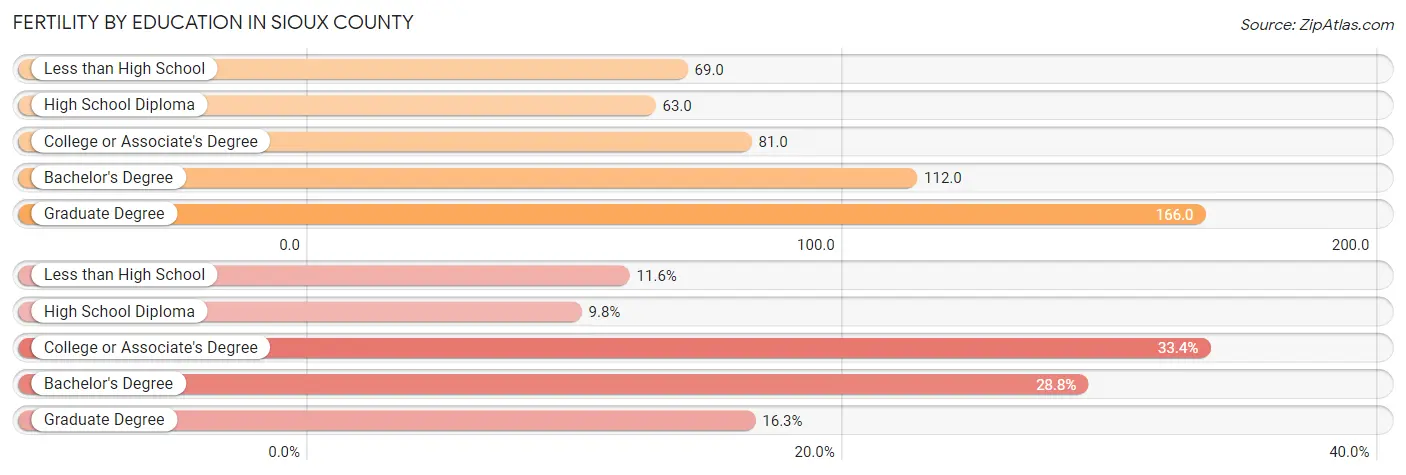
| Educational Attainment | Women with Births | Births / 1,000 Women |
| Less than High School | 84 (11.6%) | 69.0 |
| High School Diploma | 71 (9.8%) | 63.0 |
| College or Associate's Degree | 241 (33.4%) | 81.0 |
| Bachelor's Degree | 208 (28.8%) | 112.0 |
| Graduate Degree | 118 (16.3%) | 166.0 |
| Total | 722 (100.0%) | 92.0 |
Fertility by Education by Marriage Status in Sioux County
13.9% of women with births in Sioux County are unmarried. Women with the educational attainment of bachelor's degree are most likely to be married with 100.0% of them married at childbirth, while women with the educational attainment of high school diploma are least likely to be married with 33.8% of them unmarried at childbirth.
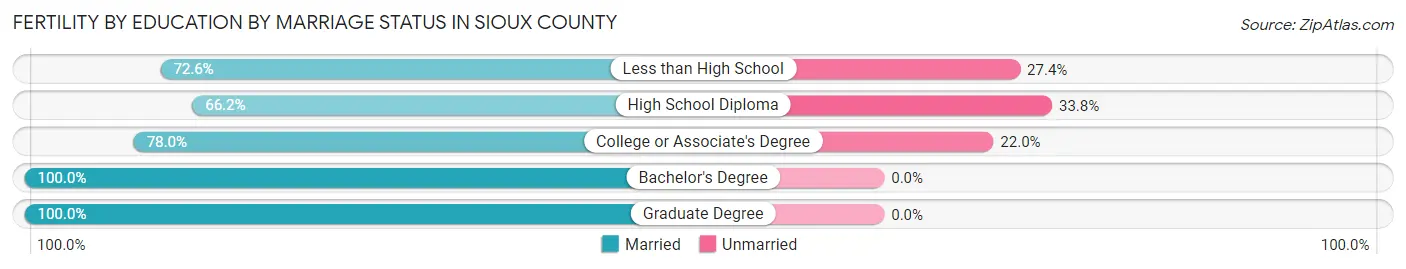
| Educational Attainment | Married | Unmarried |
| Less than High School | 61 (72.6%) | 23 (27.4%) |
| High School Diploma | 47 (66.2%) | 24 (33.8%) |
| College or Associate's Degree | 188 (78.0%) | 53 (22.0%) |
| Bachelor's Degree | 208 (100.0%) | 0 (0.0%) |
| Graduate Degree | 118 (100.0%) | 0 (0.0%) |
| Total | 622 (86.2%) | 100 (13.9%) |
Employment Characteristics in Sioux County
Employment by Class of Employer in Sioux County
Among the 18,709 employed individuals in Sioux County, private company employees (11,416 | 61.0%), not-for-profit organizations (2,266 | 12.1%), and self-employed (not incorporated) (1,960 | 10.5%) make up the most common classes of employment.
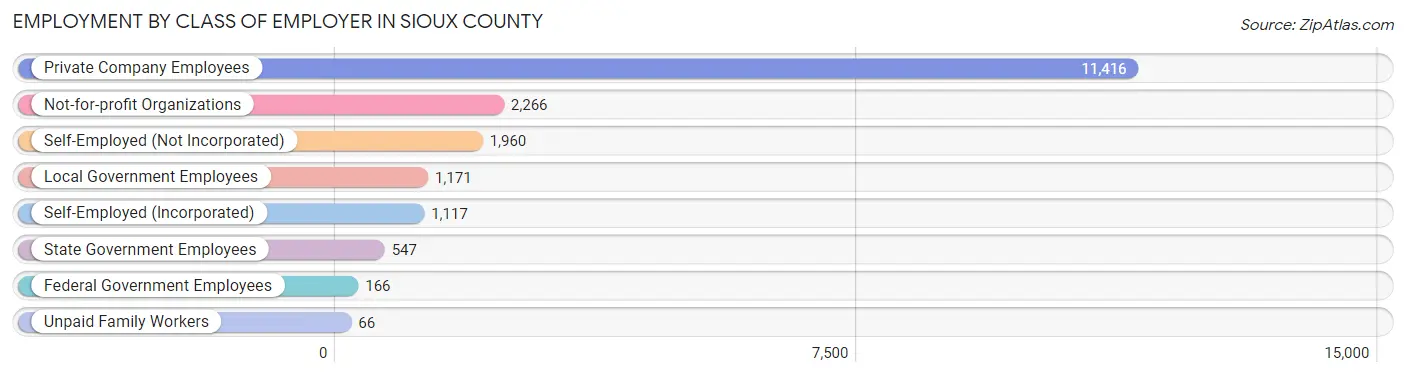
| Employer Class | # Employees | % Employees |
| Private Company Employees | 11,416 | 61.0% |
| Self-Employed (Incorporated) | 1,117 | 6.0% |
| Self-Employed (Not Incorporated) | 1,960 | 10.5% |
| Not-for-profit Organizations | 2,266 | 12.1% |
| Local Government Employees | 1,171 | 6.3% |
| State Government Employees | 547 | 2.9% |
| Federal Government Employees | 166 | 0.9% |
| Unpaid Family Workers | 66 | 0.4% |
| Total | 18,709 | 100.0% |
Employment Status by Age in Sioux County
According to the labor force statistics for Sioux County, out of the total population over 16 years of age (27,216), 71.9% or 19,568 individuals are in the labor force, with 2.3% or 450 of them unemployed. The age group with the highest labor force participation rate is 45 to 54 years, with 93.1% or 3,180 individuals in the labor force. Within the labor force, the 16 to 19 years age range has the highest percentage of unemployed individuals, with 9.8% or 165 of them being unemployed.
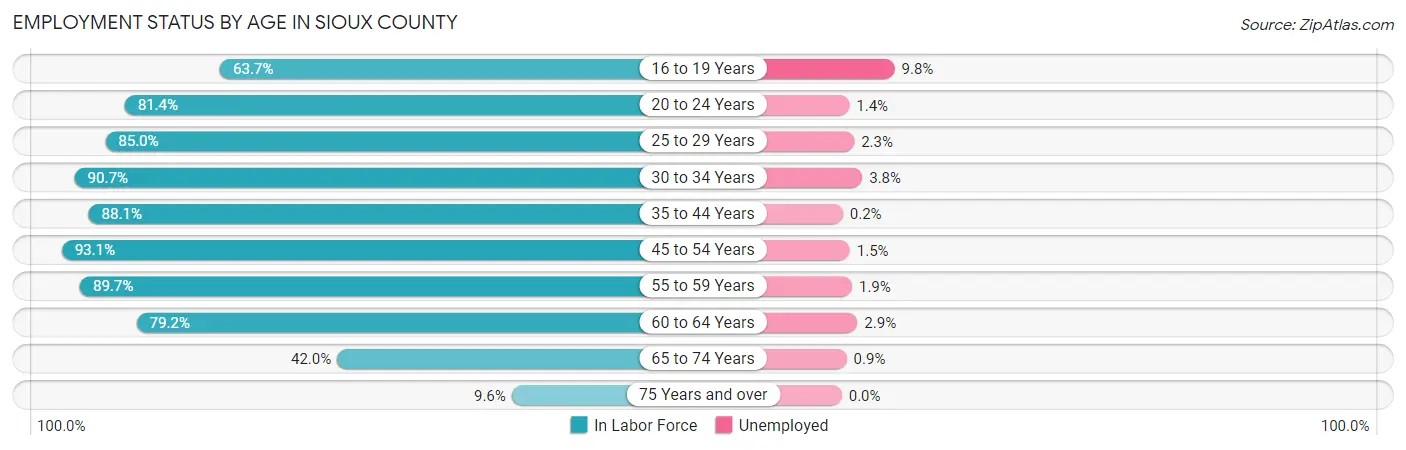
| Age Bracket | In Labor Force | Unemployed |
| 16 to 19 Years | 1,688 (63.7%) | 165 (9.8%) |
| 20 to 24 Years | 2,613 (81.4%) | 37 (1.4%) |
| 25 to 29 Years | 1,599 (85.0%) | 37 (2.3%) |
| 30 to 34 Years | 1,673 (90.7%) | 64 (3.8%) |
| 35 to 44 Years | 3,802 (88.1%) | 8 (0.2%) |
| 45 to 54 Years | 3,180 (93.1%) | 48 (1.5%) |
| 55 to 59 Years | 1,811 (89.7%) | 34 (1.9%) |
| 60 to 64 Years | 1,677 (79.2%) | 49 (2.9%) |
| 65 to 74 Years | 1,257 (42.0%) | 11 (0.9%) |
| 75 Years and over | 266 (9.6%) | 0 (0.0%) |
| Total | 19,568 (71.9%) | 450 (2.3%) |
Employment Status by Educational Attainment in Sioux County
According to labor force statistics for Sioux County, 88.1% of individuals (13,738) out of the total population between 25 and 64 years of age (15,594) are in the labor force, with 1.7% or 234 of them being unemployed. The group with the highest labor force participation rate are those with the educational attainment of bachelor's degree or higher, with 90.7% or 4,920 individuals in the labor force. Within the labor force, individuals with college / associate degree education have the highest percentage of unemployment, with 3.5% or 159 of them being unemployed.
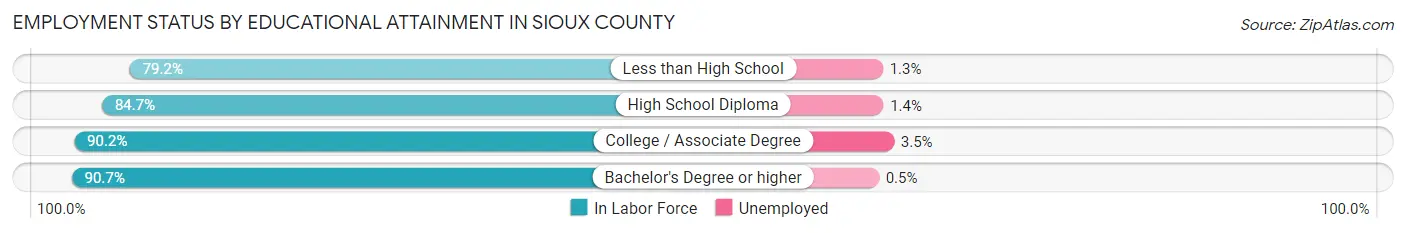
| Educational Attainment | In Labor Force | Unemployed |
| Less than High School | 967 (79.2%) | 16 (1.3%) |
| High School Diploma | 3,308 (84.7%) | 55 (1.4%) |
| College / Associate Degree | 4,549 (90.2%) | 177 (3.5%) |
| Bachelor's Degree or higher | 4,920 (90.7%) | 27 (0.5%) |
| Total | 13,738 (88.1%) | 265 (1.7%) |
Employment Occupations by Sex in Sioux County
Management, Business, Science and Arts Occupations
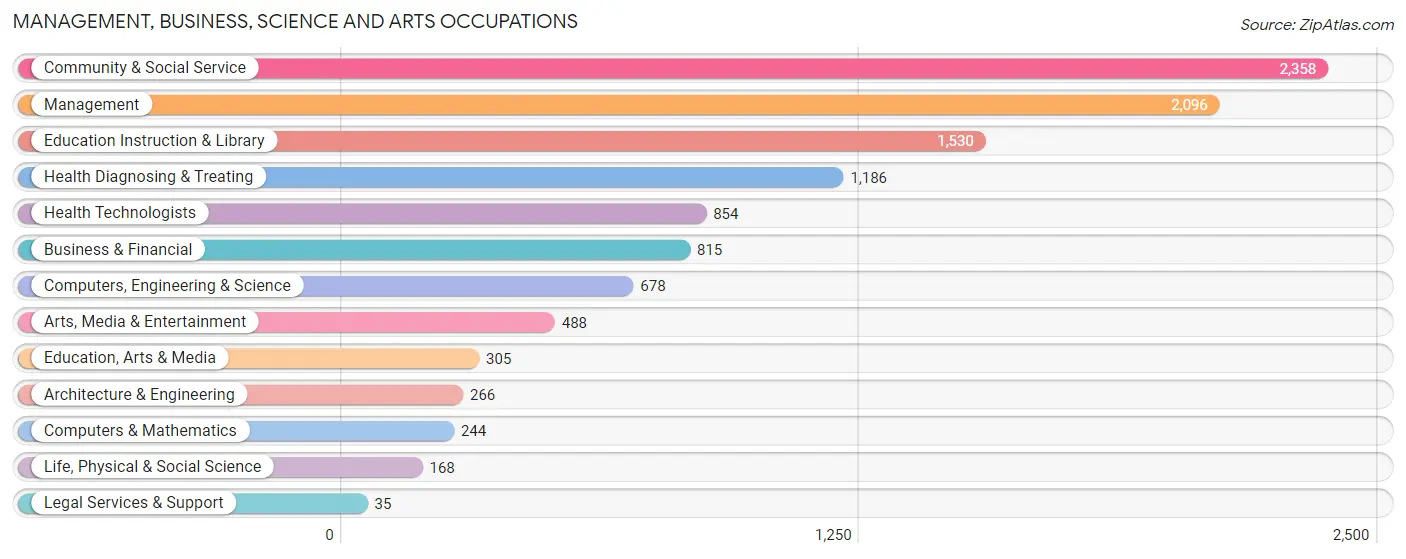
The most common Management, Business, Science and Arts occupations in Sioux County are Community & Social Service (2,358 | 12.4%), Management (2,096 | 11.0%), Education Instruction & Library (1,530 | 8.0%), Health Diagnosing & Treating (1,186 | 6.2%), and Health Technologists (854 | 4.5%).
Management, Business, Science and Arts Occupations by Sex
Within the Management, Business, Science and Arts occupations in Sioux County, the most male-oriented occupations are Architecture & Engineering (94.0%), Life, Physical & Social Science (77.4%), and Management (76.0%), while the most female-oriented occupations are Health Diagnosing & Treating (85.1%), Health Technologists (84.8%), and Education Instruction & Library (75.7%).
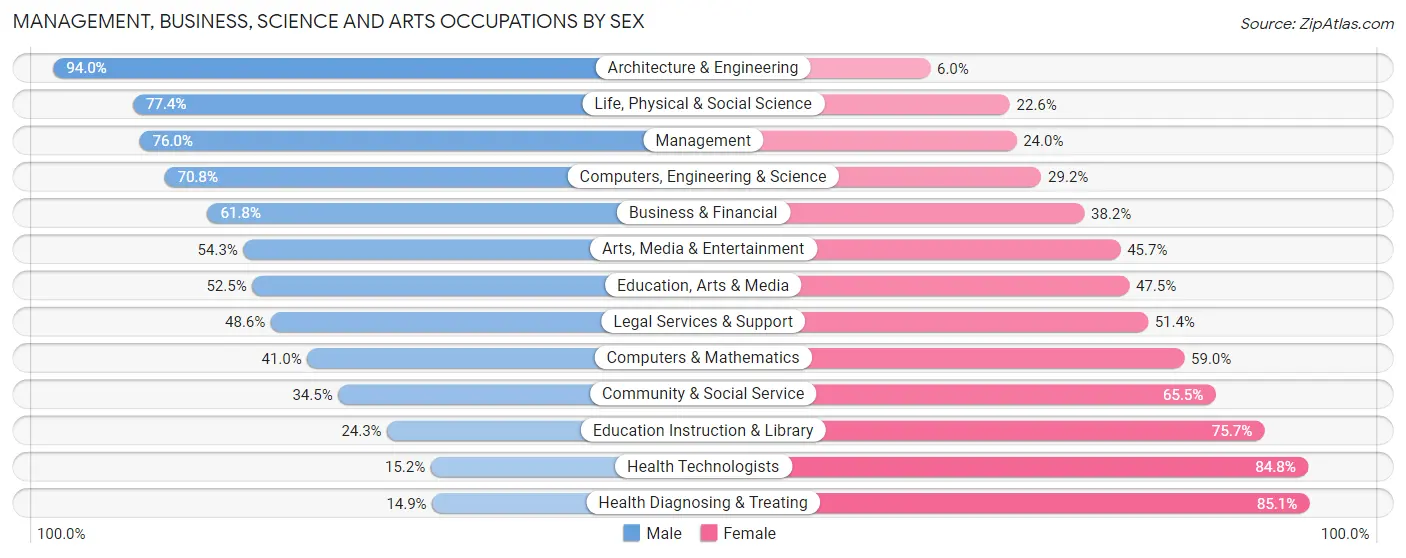
| Occupation | Male | Female |
| Management | 1,593 (76.0%) | 503 (24.0%) |
| Business & Financial | 504 (61.8%) | 311 (38.2%) |
| Computers, Engineering & Science | 480 (70.8%) | 198 (29.2%) |
| Computers & Mathematics | 100 (41.0%) | 144 (59.0%) |
| Architecture & Engineering | 250 (94.0%) | 16 (6.0%) |
| Life, Physical & Social Science | 130 (77.4%) | 38 (22.6%) |
| Community & Social Service | 814 (34.5%) | 1,544 (65.5%) |
| Education, Arts & Media | 160 (52.5%) | 145 (47.5%) |
| Legal Services & Support | 17 (48.6%) | 18 (51.4%) |
| Education Instruction & Library | 372 (24.3%) | 1,158 (75.7%) |
| Arts, Media & Entertainment | 265 (54.3%) | 223 (45.7%) |
| Health Diagnosing & Treating | 177 (14.9%) | 1,009 (85.1%) |
| Health Technologists | 130 (15.2%) | 724 (84.8%) |
| Total (Category) | 3,568 (50.0%) | 3,565 (50.0%) |
| Total (Overall) | 10,363 (54.3%) | 8,718 (45.7%) |
Services Occupations
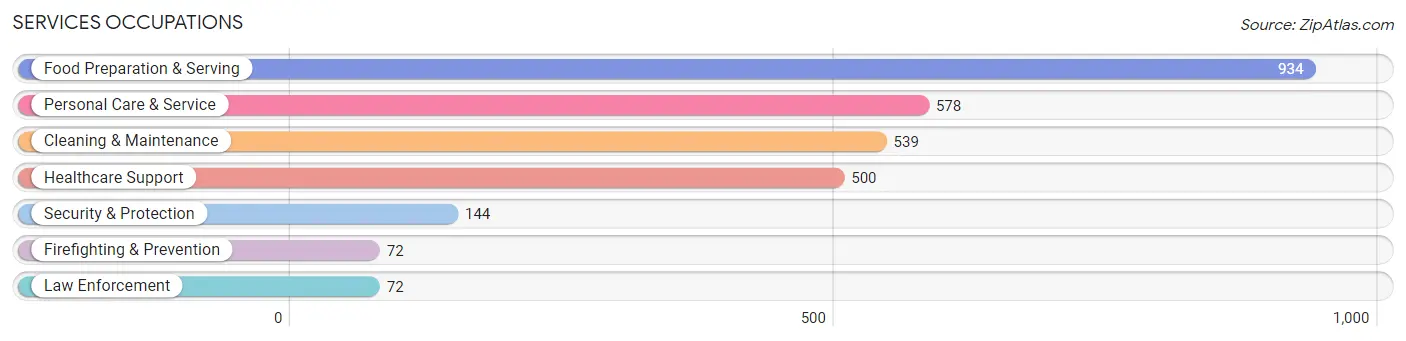
The most common Services occupations in Sioux County are Food Preparation & Serving (934 | 4.9%), Personal Care & Service (578 | 3.0%), Cleaning & Maintenance (539 | 2.8%), Healthcare Support (500 | 2.6%), and Security & Protection (144 | 0.7%).
Services Occupations by Sex
Within the Services occupations in Sioux County, the most male-oriented occupations are Law Enforcement (84.7%), Security & Protection (66.7%), and Cleaning & Maintenance (60.5%), while the most female-oriented occupations are Healthcare Support (88.2%), Personal Care & Service (82.7%), and Food Preparation & Serving (58.7%).
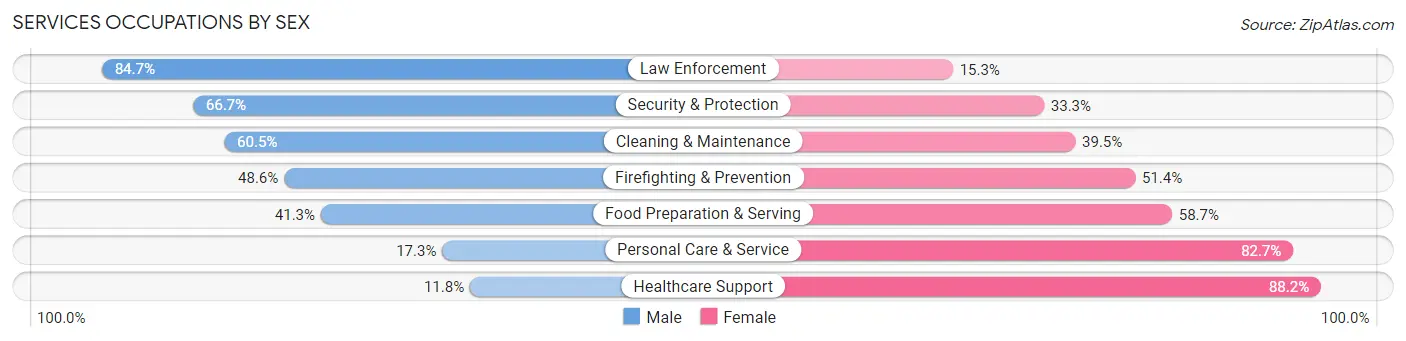
| Occupation | Male | Female |
| Healthcare Support | 59 (11.8%) | 441 (88.2%) |
| Security & Protection | 96 (66.7%) | 48 (33.3%) |
| Firefighting & Prevention | 35 (48.6%) | 37 (51.4%) |
| Law Enforcement | 61 (84.7%) | 11 (15.3%) |
| Food Preparation & Serving | 386 (41.3%) | 548 (58.7%) |
| Cleaning & Maintenance | 326 (60.5%) | 213 (39.5%) |
| Personal Care & Service | 100 (17.3%) | 478 (82.7%) |
| Total (Category) | 967 (35.9%) | 1,728 (64.1%) |
| Total (Overall) | 10,363 (54.3%) | 8,718 (45.7%) |
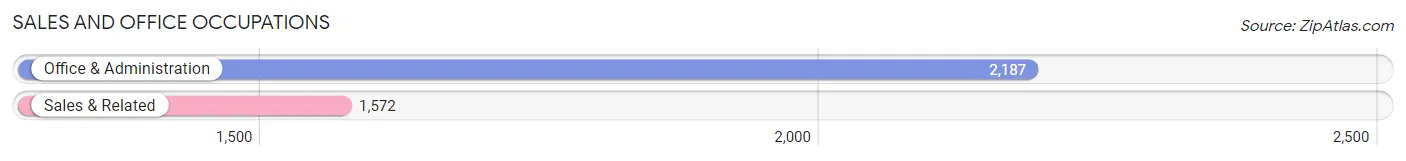
Sales and Office Occupations
The most common Sales and Office occupations in Sioux County are Office & Administration (2,187 | 11.5%), and Sales & Related (1,572 | 8.2%).
Sales and Office Occupations by Sex
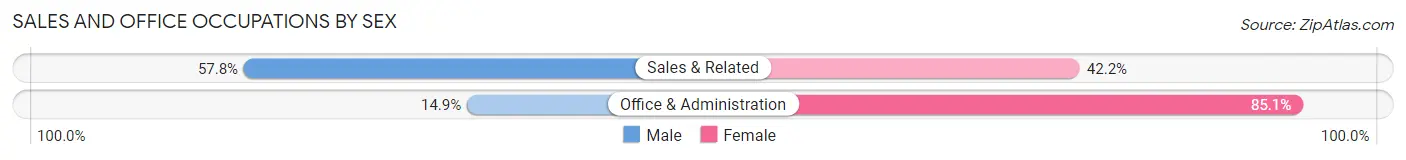
| Occupation | Male | Female |
| Sales & Related | 909 (57.8%) | 663 (42.2%) |
| Office & Administration | 326 (14.9%) | 1,861 (85.1%) |
| Total (Category) | 1,235 (32.9%) | 2,524 (67.1%) |
| Total (Overall) | 10,363 (54.3%) | 8,718 (45.7%) |
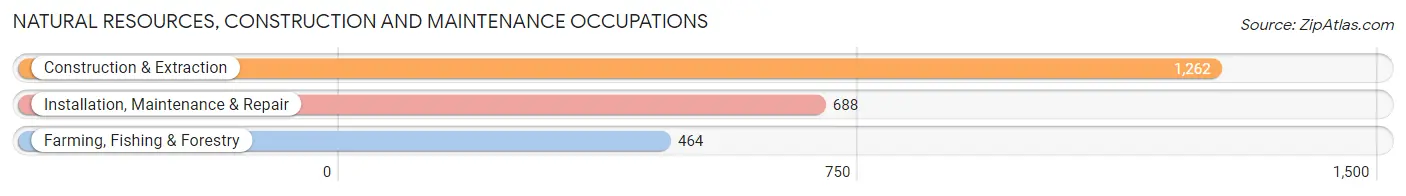
Natural Resources, Construction and Maintenance Occupations
The most common Natural Resources, Construction and Maintenance occupations in Sioux County are Construction & Extraction (1,262 | 6.6%), Installation, Maintenance & Repair (688 | 3.6%), and Farming, Fishing & Forestry (464 | 2.4%).
Natural Resources, Construction and Maintenance Occupations by Sex
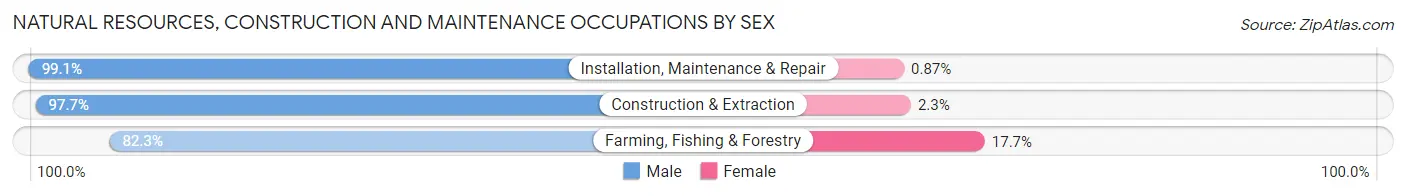
| Occupation | Male | Female |
| Farming, Fishing & Forestry | 382 (82.3%) | 82 (17.7%) |
| Construction & Extraction | 1,233 (97.7%) | 29 (2.3%) |
| Installation, Maintenance & Repair | 682 (99.1%) | 6 (0.9%) |
| Total (Category) | 2,297 (95.2%) | 117 (4.9%) |
| Total (Overall) | 10,363 (54.3%) | 8,718 (45.7%) |
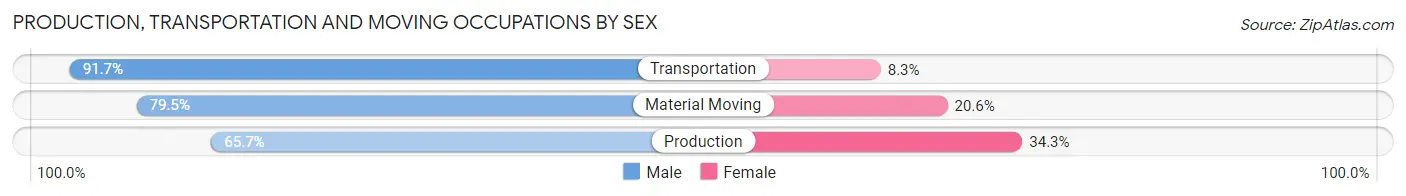
Production, Transportation and Moving Occupations
The most common Production, Transportation and Moving occupations in Sioux County are Production (1,724 | 9.0%), Transportation (699 | 3.7%), and Material Moving (657 | 3.4%).
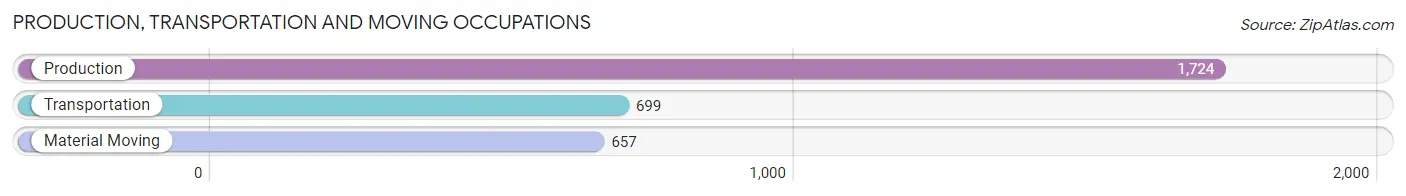
Production, Transportation and Moving Occupations by Sex
| Occupation | Male | Female |
| Production | 1,133 (65.7%) | 591 (34.3%) |
| Transportation | 641 (91.7%) | 58 (8.3%) |
| Material Moving | 522 (79.4%) | 135 (20.5%) |
| Total (Category) | 2,296 (74.6%) | 784 (25.5%) |
| Total (Overall) | 10,363 (54.3%) | 8,718 (45.7%) |
Employment Industries by Sex in Sioux County
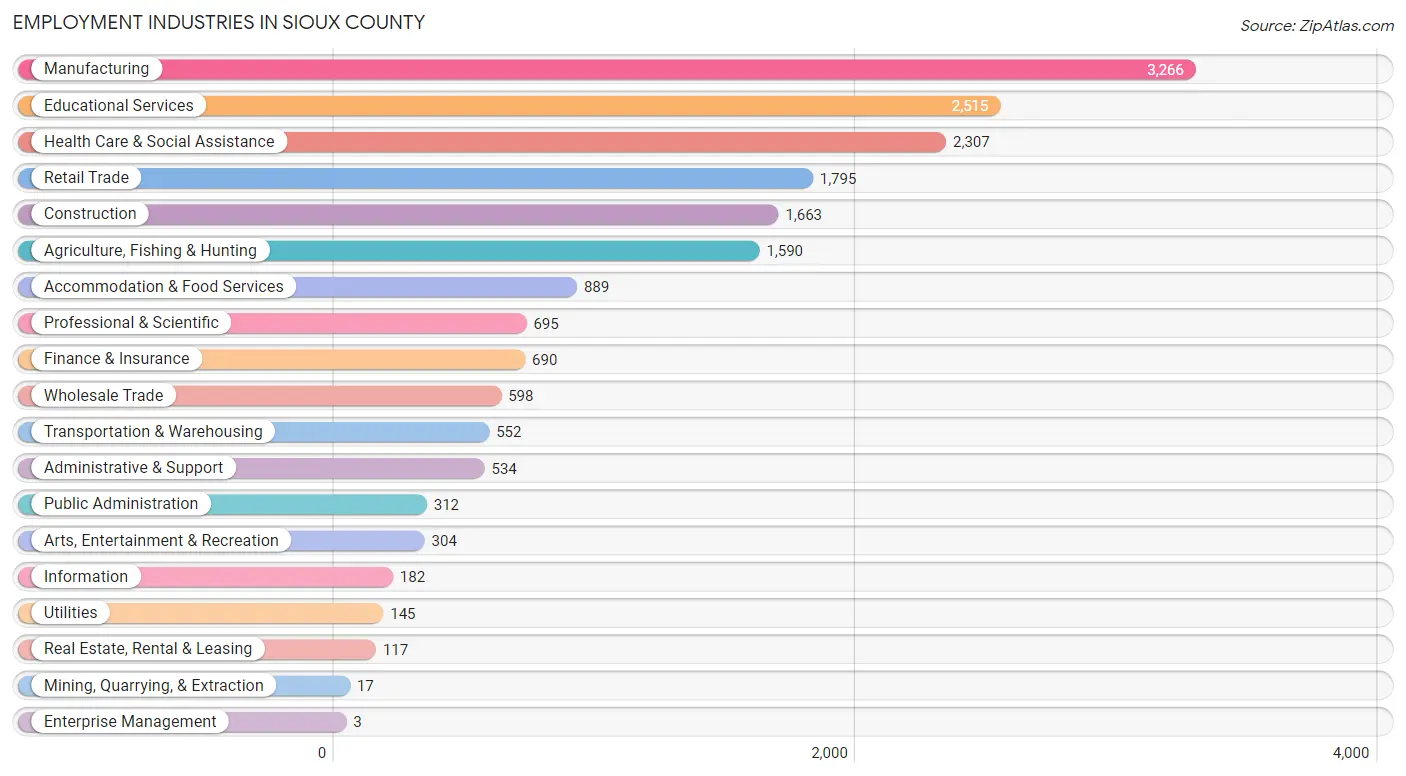
Employment Industries in Sioux County
The major employment industries in Sioux County include Manufacturing (3,266 | 17.1%), Educational Services (2,515 | 13.2%), Health Care & Social Assistance (2,307 | 12.1%), Retail Trade (1,795 | 9.4%), and Construction (1,663 | 8.7%).
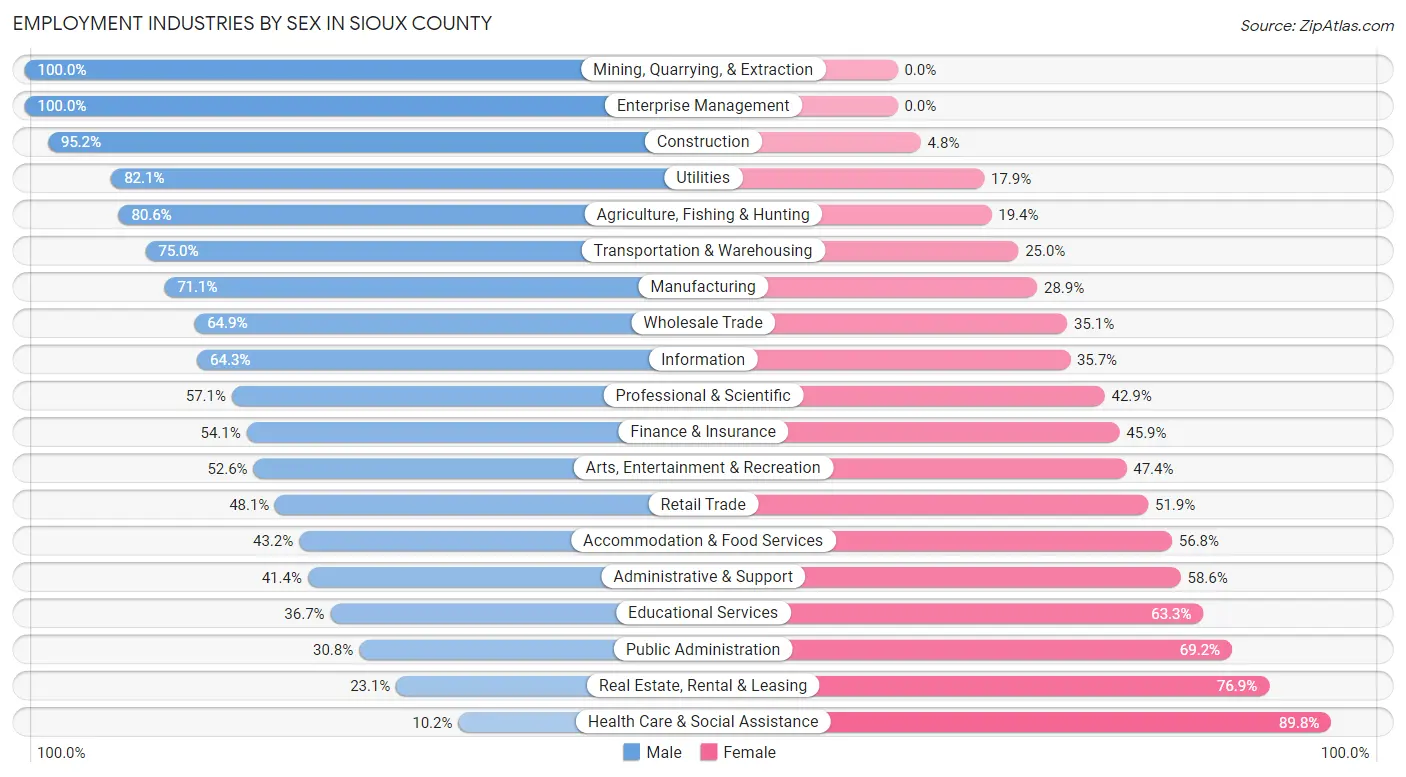
Employment Industries by Sex in Sioux County
The Sioux County industries that see more men than women are Mining, Quarrying, & Extraction (100.0%), Enterprise Management (100.0%), and Construction (95.2%), whereas the industries that tend to have a higher number of women are Health Care & Social Assistance (89.8%), Real Estate, Rental & Leasing (76.9%), and Public Administration (69.2%).
| Industry | Male | Female |
| Agriculture, Fishing & Hunting | 1,281 (80.6%) | 309 (19.4%) |
| Mining, Quarrying, & Extraction | 17 (100.0%) | 0 (0.0%) |
| Construction | 1,583 (95.2%) | 80 (4.8%) |
| Manufacturing | 2,322 (71.1%) | 944 (28.9%) |
| Wholesale Trade | 388 (64.9%) | 210 (35.1%) |
| Retail Trade | 864 (48.1%) | 931 (51.9%) |
| Transportation & Warehousing | 414 (75.0%) | 138 (25.0%) |
| Utilities | 119 (82.1%) | 26 (17.9%) |
| Information | 117 (64.3%) | 65 (35.7%) |
| Finance & Insurance | 373 (54.1%) | 317 (45.9%) |
| Real Estate, Rental & Leasing | 27 (23.1%) | 90 (76.9%) |
| Professional & Scientific | 397 (57.1%) | 298 (42.9%) |
| Enterprise Management | 3 (100.0%) | 0 (0.0%) |
| Administrative & Support | 221 (41.4%) | 313 (58.6%) |
| Educational Services | 923 (36.7%) | 1,592 (63.3%) |
| Health Care & Social Assistance | 236 (10.2%) | 2,071 (89.8%) |
| Arts, Entertainment & Recreation | 160 (52.6%) | 144 (47.4%) |
| Accommodation & Food Services | 384 (43.2%) | 505 (56.8%) |
| Public Administration | 96 (30.8%) | 216 (69.2%) |
| Total | 10,363 (54.3%) | 8,718 (45.7%) |
Education in Sioux County
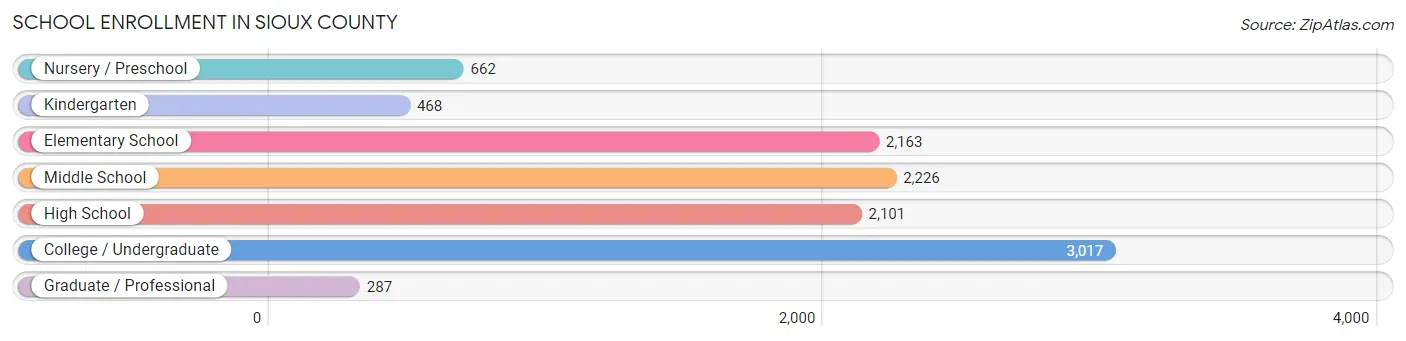
School Enrollment in Sioux County
The most common levels of schooling among the 10,924 students in Sioux County are college / undergraduate (3,017 | 27.6%), middle school (2,226 | 20.4%), and elementary school (2,163 | 19.8%).
| School Level | # Students | % Students |
| Nursery / Preschool | 662 | 6.1% |
| Kindergarten | 468 | 4.3% |
| Elementary School | 2,163 | 19.8% |
| Middle School | 2,226 | 20.4% |
| High School | 2,101 | 19.2% |
| College / Undergraduate | 3,017 | 27.6% |
| Graduate / Professional | 287 | 2.6% |
| Total | 10,924 | 100.0% |
School Enrollment by Age by Funding Source in Sioux County
Out of a total of 10,924 students who are enrolled in schools in Sioux County, 5,222 (47.8%) attend a private institution, while the remaining 5,702 (52.2%) are enrolled in public schools. The age group of 20 to 24 year olds has the highest likelihood of being enrolled in private schools, with 1,422 (80.9% in the age bracket) enrolled. Conversely, the age group of 15 to 17 year olds has the lowest likelihood of being enrolled in a private school, with 1,258 (77.7% in the age bracket) attending a public institution.
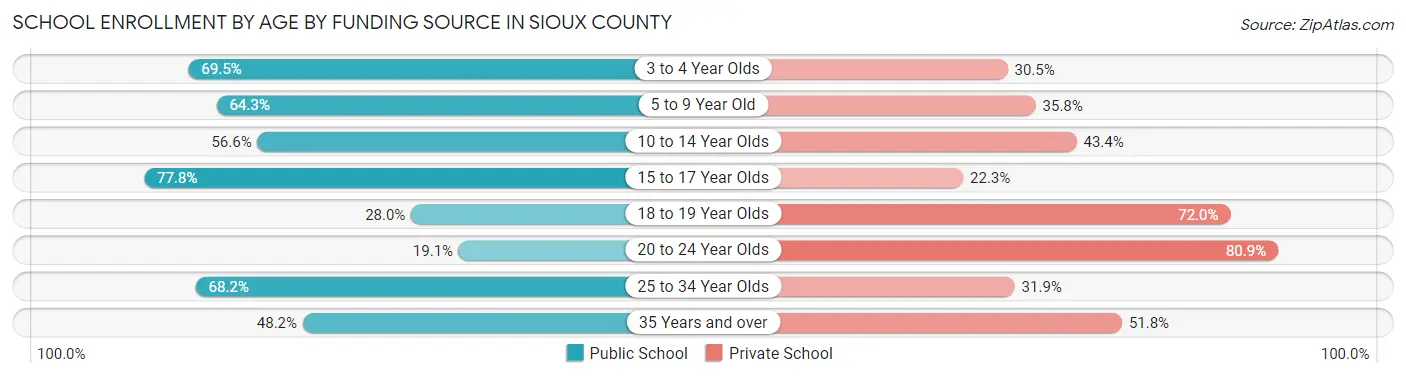
| Age Bracket | Public School | Private School |
| 3 to 4 Year Olds | 337 (69.5%) | 148 (30.5%) |
| 5 to 9 Year Old | 1,580 (64.2%) | 879 (35.7%) |
| 10 to 14 Year Olds | 1,527 (56.6%) | 1,170 (43.4%) |
| 15 to 17 Year Olds | 1,258 (77.7%) | 360 (22.3%) |
| 18 to 19 Year Olds | 398 (28.0%) | 1,024 (72.0%) |
| 20 to 24 Year Olds | 336 (19.1%) | 1,422 (80.9%) |
| 25 to 34 Year Olds | 107 (68.1%) | 50 (31.9%) |
| 35 Years and over | 158 (48.2%) | 170 (51.8%) |
| Total | 5,702 (52.2%) | 5,222 (47.8%) |
Educational Attainment by Field of Study in Sioux County
Education (1,548 | 21.4%), business (1,378 | 19.1%), bio, nature & agricultural (835 | 11.6%), science & technology (699 | 9.7%), and arts & humanities (454 | 6.3%) are the most common fields of study among 7,220 individuals in Sioux County who have obtained a bachelor's degree or higher.
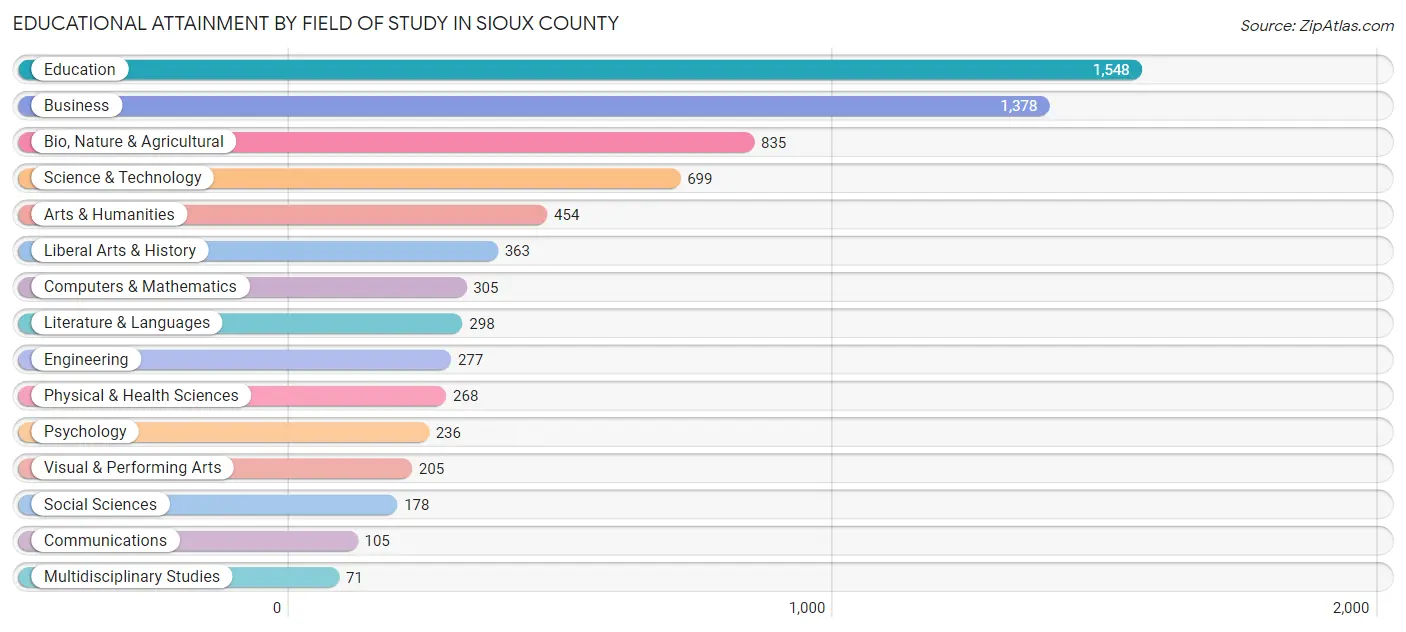
| Field of Study | # Graduates | % Graduates |
| Computers & Mathematics | 305 | 4.2% |
| Bio, Nature & Agricultural | 835 | 11.6% |
| Physical & Health Sciences | 268 | 3.7% |
| Psychology | 236 | 3.3% |
| Social Sciences | 178 | 2.5% |
| Engineering | 277 | 3.8% |
| Multidisciplinary Studies | 71 | 1.0% |
| Science & Technology | 699 | 9.7% |
| Business | 1,378 | 19.1% |
| Education | 1,548 | 21.4% |
| Literature & Languages | 298 | 4.1% |
| Liberal Arts & History | 363 | 5.0% |
| Visual & Performing Arts | 205 | 2.8% |
| Communications | 105 | 1.5% |
| Arts & Humanities | 454 | 6.3% |
| Total | 7,220 | 100.0% |
Transportation & Commute in Sioux County
Vehicle Availability by Sex in Sioux County
The most prevalent vehicle ownership categories in Sioux County are males with 2 vehicles (3,875, accounting for 40.1%) and females with 2 vehicles (3,316, making up 48.3%).
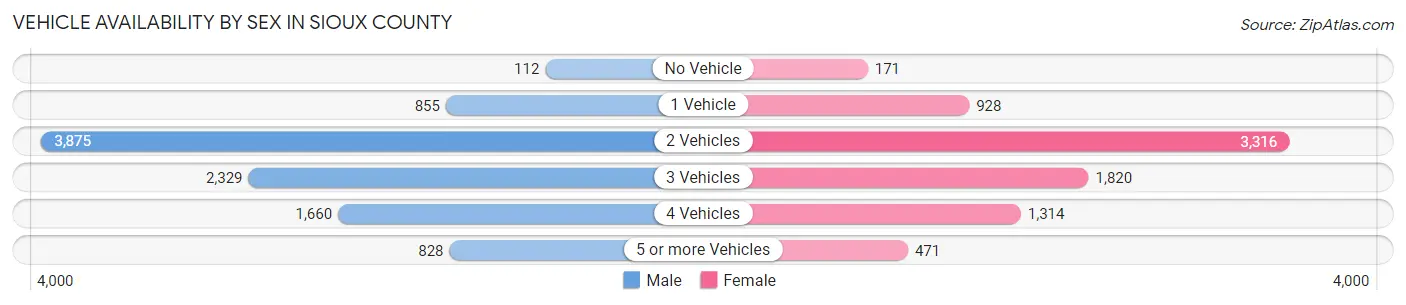
| Vehicles Available | Male | Female |
| No Vehicle | 112 (1.2%) | 171 (2.1%) |
| 1 Vehicle | 855 (8.8%) | 928 (11.6%) |
| 2 Vehicles | 3,875 (40.1%) | 3,316 (41.3%) |
| 3 Vehicles | 2,329 (24.1%) | 1,820 (22.7%) |
| 4 Vehicles | 1,660 (17.2%) | 1,314 (16.4%) |
| 5 or more Vehicles | 828 (8.6%) | 471 (5.9%) |
| Total | 9,659 (100.0%) | 8,020 (100.0%) |
Commute Time in Sioux County
The most frequently occuring commute durations in Sioux County are 5 to 9 minutes (5,166 commuters, 31.6%), less than 5 minutes (3,061 commuters, 18.7%), and 10 to 14 minutes (2,463 commuters, 15.1%).
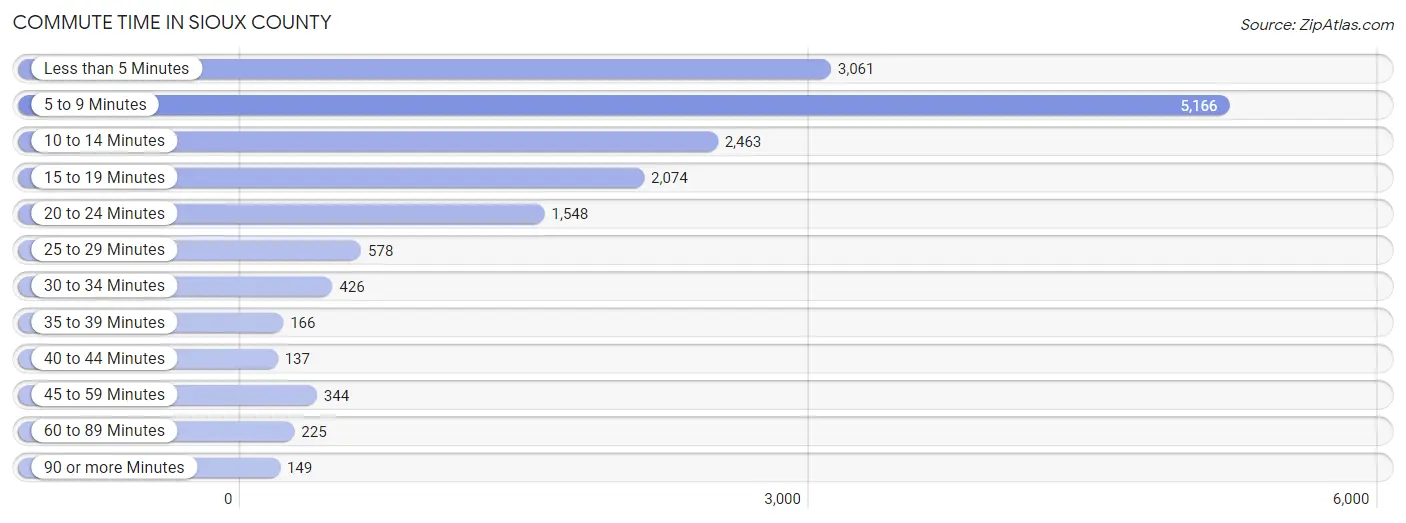
| Commute Time | # Commuters | % Commuters |
| Less than 5 Minutes | 3,061 | 18.7% |
| 5 to 9 Minutes | 5,166 | 31.6% |
| 10 to 14 Minutes | 2,463 | 15.1% |
| 15 to 19 Minutes | 2,074 | 12.7% |
| 20 to 24 Minutes | 1,548 | 9.5% |
| 25 to 29 Minutes | 578 | 3.5% |
| 30 to 34 Minutes | 426 | 2.6% |
| 35 to 39 Minutes | 166 | 1.0% |
| 40 to 44 Minutes | 137 | 0.8% |
| 45 to 59 Minutes | 344 | 2.1% |
| 60 to 89 Minutes | 225 | 1.4% |
| 90 or more Minutes | 149 | 0.9% |
Commute Time by Sex in Sioux County
The most common commute times in Sioux County are 5 to 9 minutes (2,641 commuters, 29.9%) for males and 5 to 9 minutes (2,525 commuters, 33.6%) for females.
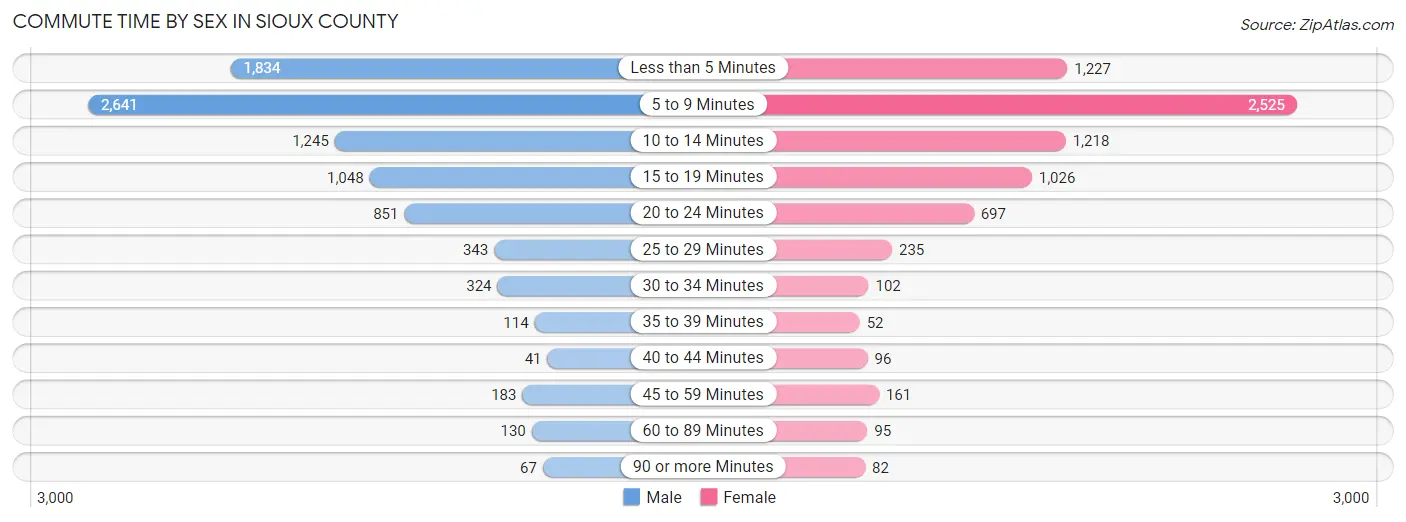
| Commute Time | Male | Female |
| Less than 5 Minutes | 1,834 (20.8%) | 1,227 (16.3%) |
| 5 to 9 Minutes | 2,641 (29.9%) | 2,525 (33.6%) |
| 10 to 14 Minutes | 1,245 (14.1%) | 1,218 (16.2%) |
| 15 to 19 Minutes | 1,048 (11.9%) | 1,026 (13.7%) |
| 20 to 24 Minutes | 851 (9.7%) | 697 (9.3%) |
| 25 to 29 Minutes | 343 (3.9%) | 235 (3.1%) |
| 30 to 34 Minutes | 324 (3.7%) | 102 (1.4%) |
| 35 to 39 Minutes | 114 (1.3%) | 52 (0.7%) |
| 40 to 44 Minutes | 41 (0.5%) | 96 (1.3%) |
| 45 to 59 Minutes | 183 (2.1%) | 161 (2.1%) |
| 60 to 89 Minutes | 130 (1.5%) | 95 (1.3%) |
| 90 or more Minutes | 67 (0.8%) | 82 (1.1%) |
Time of Departure to Work by Sex in Sioux County
The most frequent times of departure to work in Sioux County are 6:30 AM to 6:59 AM (1,973, 22.4%) for males and 7:30 AM to 7:59 AM (1,741, 23.2%) for females.
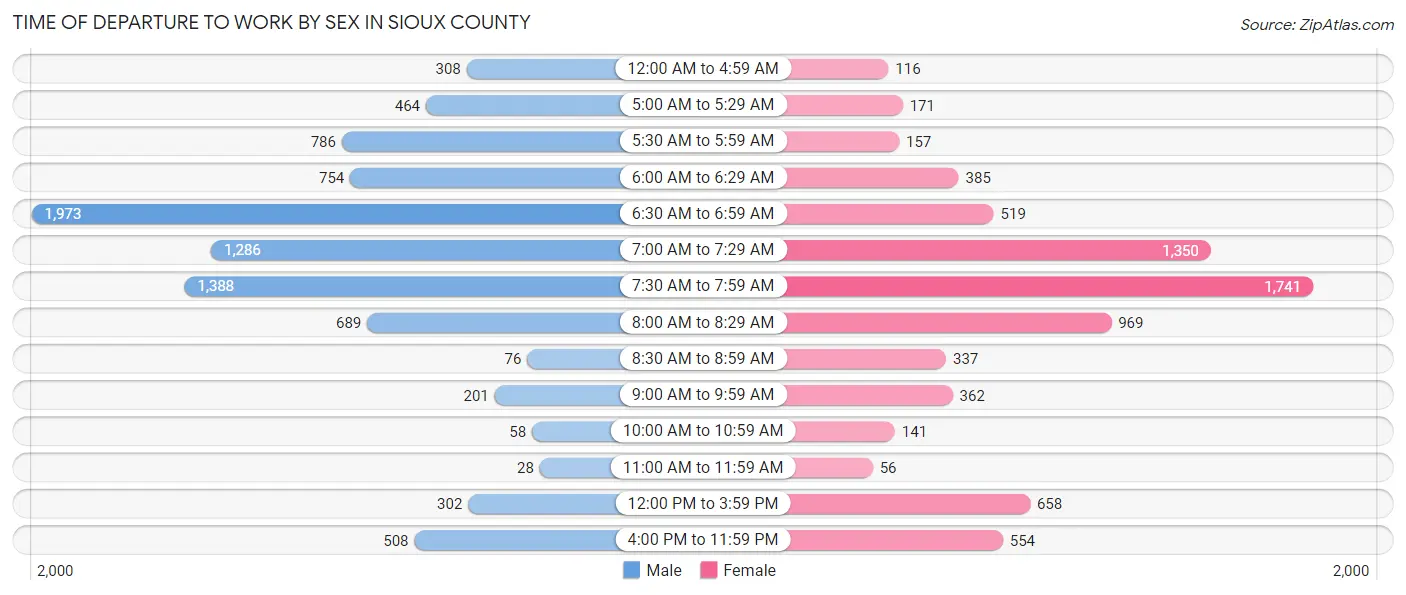
| Time of Departure | Male | Female |
| 12:00 AM to 4:59 AM | 308 (3.5%) | 116 (1.5%) |
| 5:00 AM to 5:29 AM | 464 (5.3%) | 171 (2.3%) |
| 5:30 AM to 5:59 AM | 786 (8.9%) | 157 (2.1%) |
| 6:00 AM to 6:29 AM | 754 (8.6%) | 385 (5.1%) |
| 6:30 AM to 6:59 AM | 1,973 (22.4%) | 519 (6.9%) |
| 7:00 AM to 7:29 AM | 1,286 (14.6%) | 1,350 (18.0%) |
| 7:30 AM to 7:59 AM | 1,388 (15.7%) | 1,741 (23.2%) |
| 8:00 AM to 8:29 AM | 689 (7.8%) | 969 (12.9%) |
| 8:30 AM to 8:59 AM | 76 (0.9%) | 337 (4.5%) |
| 9:00 AM to 9:59 AM | 201 (2.3%) | 362 (4.8%) |
| 10:00 AM to 10:59 AM | 58 (0.7%) | 141 (1.9%) |
| 11:00 AM to 11:59 AM | 28 (0.3%) | 56 (0.7%) |
| 12:00 PM to 3:59 PM | 302 (3.4%) | 658 (8.7%) |
| 4:00 PM to 11:59 PM | 508 (5.8%) | 554 (7.4%) |
| Total | 8,821 (100.0%) | 7,516 (100.0%) |
Housing Occupancy in Sioux County
Occupancy by Ownership in Sioux County
Of the total 12,462 dwellings in Sioux County, owner-occupied units account for 9,870 (79.2%), while renter-occupied units make up 2,592 (20.8%).
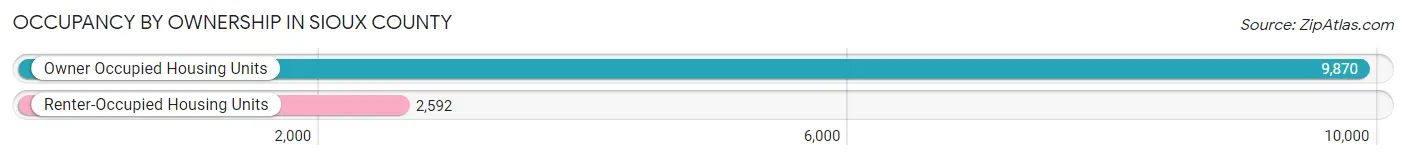
| Occupancy | # Housing Units | % Housing Units |
| Owner Occupied Housing Units | 9,870 | 79.2% |
| Renter-Occupied Housing Units | 2,592 | 20.8% |
| Total Occupied Housing Units | 12,462 | 100.0% |
Occupancy by Household Size in Sioux County
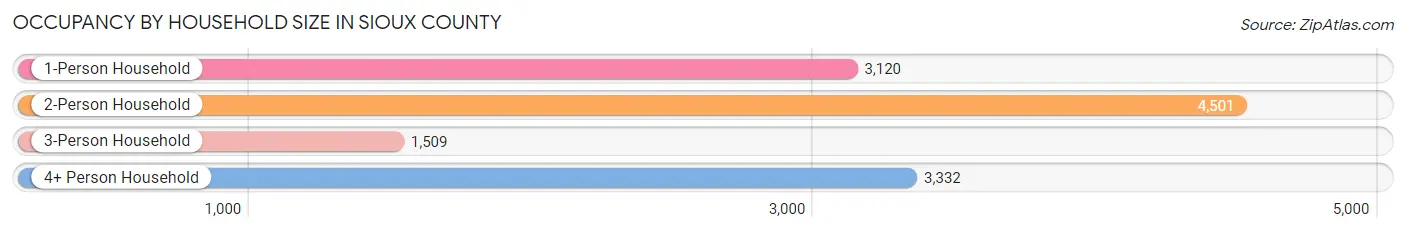
| Household Size | # Housing Units | % Housing Units |
| 1-Person Household | 3,120 | 25.0% |
| 2-Person Household | 4,501 | 36.1% |
| 3-Person Household | 1,509 | 12.1% |
| 4+ Person Household | 3,332 | 26.7% |
| Total Housing Units | 12,462 | 100.0% |
Occupancy by Ownership by Household Size in Sioux County
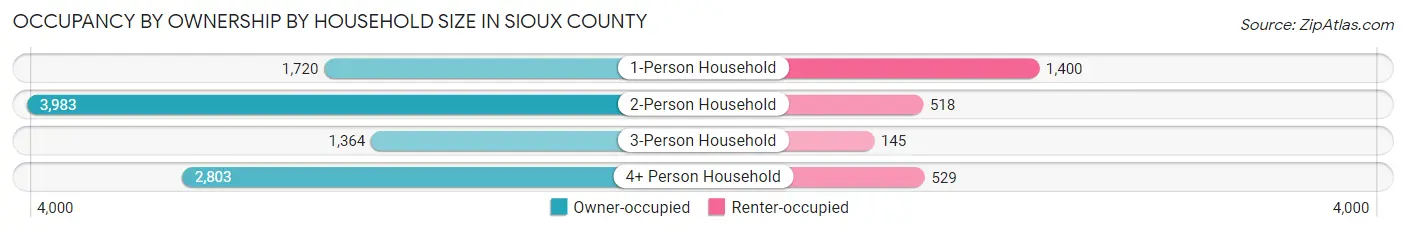
| Household Size | Owner-occupied | Renter-occupied |
| 1-Person Household | 1,720 (55.1%) | 1,400 (44.9%) |
| 2-Person Household | 3,983 (88.5%) | 518 (11.5%) |
| 3-Person Household | 1,364 (90.4%) | 145 (9.6%) |
| 4+ Person Household | 2,803 (84.1%) | 529 (15.9%) |
| Total Housing Units | 9,870 (79.2%) | 2,592 (20.8%) |
Occupancy by Educational Attainment in Sioux County
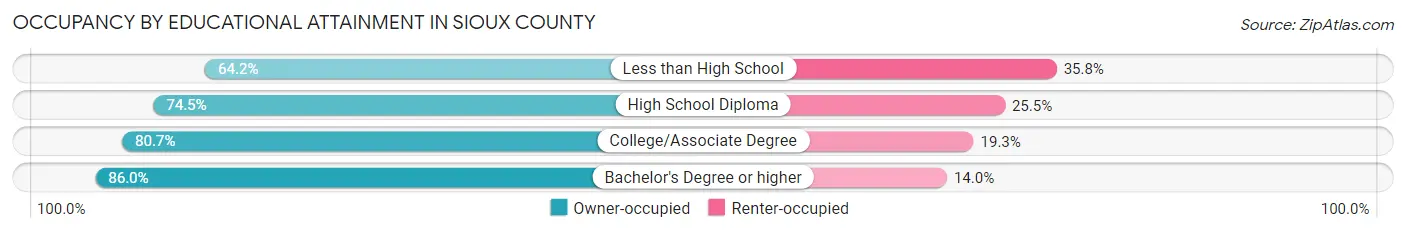
| Household Size | Owner-occupied | Renter-occupied |
| Less than High School | 707 (64.2%) | 394 (35.8%) |
| High School Diploma | 2,533 (74.5%) | 869 (25.5%) |
| College/Associate Degree | 3,237 (80.7%) | 775 (19.3%) |
| Bachelor's Degree or higher | 3,393 (86.0%) | 554 (14.0%) |
Occupancy by Age of Householder in Sioux County
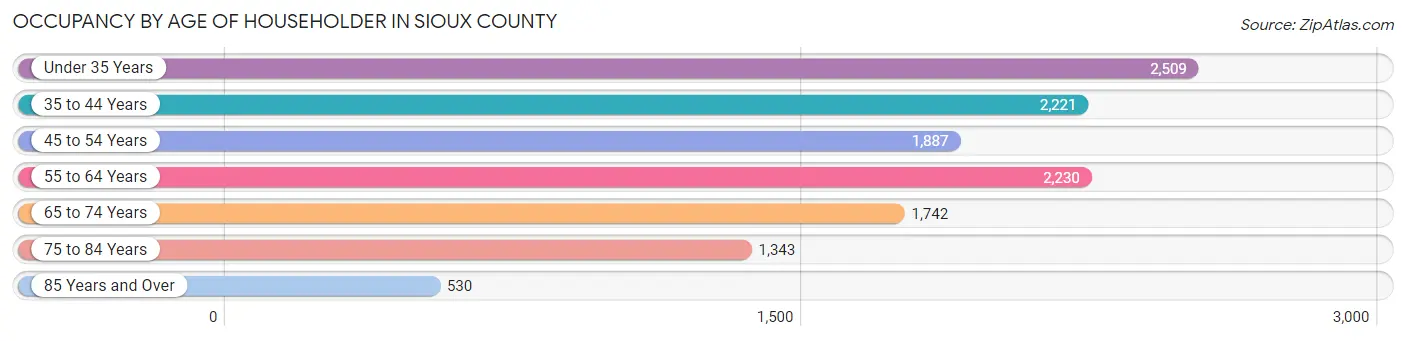
| Age Bracket | # Households | % Households |
| Under 35 Years | 2,509 | 20.1% |
| 35 to 44 Years | 2,221 | 17.8% |
| 45 to 54 Years | 1,887 | 15.1% |
| 55 to 64 Years | 2,230 | 17.9% |
| 65 to 74 Years | 1,742 | 14.0% |
| 75 to 84 Years | 1,343 | 10.8% |
| 85 Years and Over | 530 | 4.3% |
| Total | 12,462 | 100.0% |
Housing Finances in Sioux County
Median Income by Occupancy in Sioux County
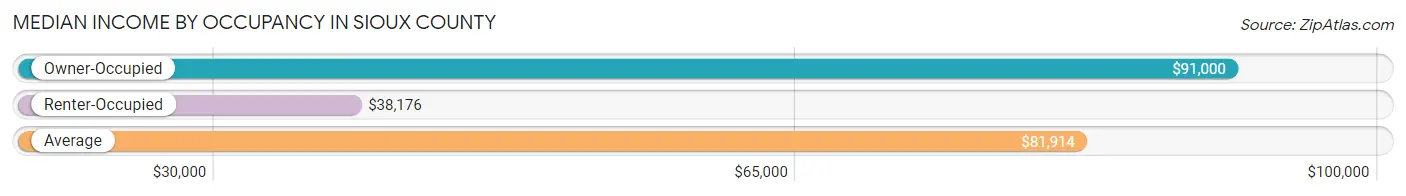
| Occupancy Type | # Households | Median Income |
| Owner-Occupied | 9,870 (79.2%) | $91,000 |
| Renter-Occupied | 2,592 (20.8%) | $38,176 |
| Average | 12,462 (100.0%) | $81,914 |
Occupancy by Householder Income Bracket in Sioux County
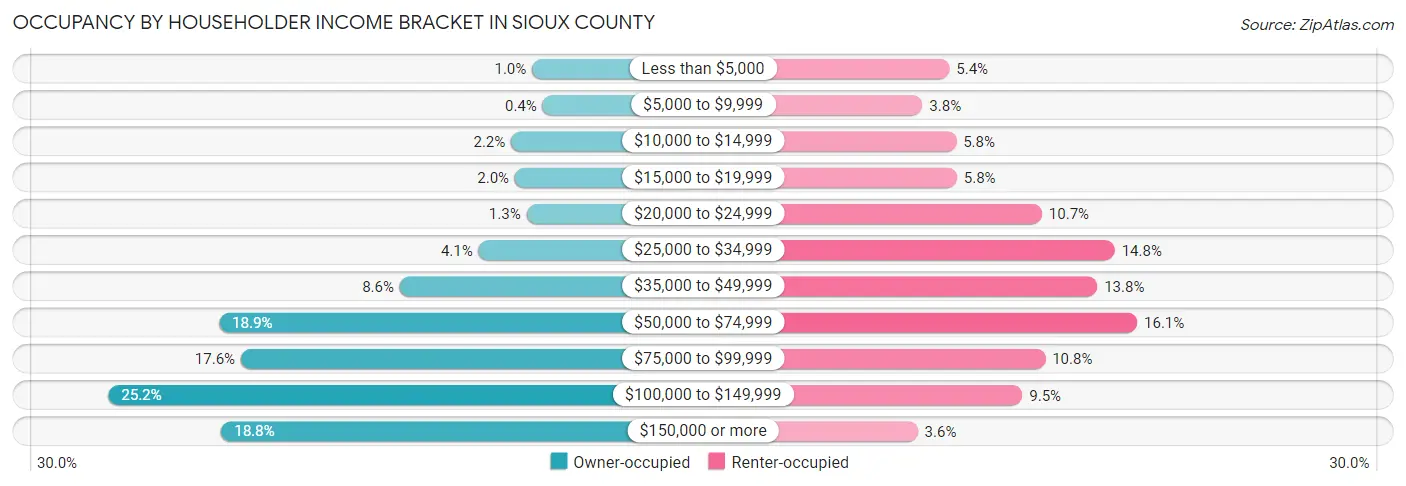
| Income Bracket | Owner-occupied | Renter-occupied |
| Less than $5,000 | 99 (1.0%) | 139 (5.4%) |
| $5,000 to $9,999 | 39 (0.4%) | 99 (3.8%) |
| $10,000 to $14,999 | 217 (2.2%) | 149 (5.8%) |
| $15,000 to $19,999 | 195 (2.0%) | 150 (5.8%) |
| $20,000 to $24,999 | 130 (1.3%) | 276 (10.6%) |
| $25,000 to $34,999 | 401 (4.1%) | 384 (14.8%) |
| $35,000 to $49,999 | 845 (8.6%) | 358 (13.8%) |
| $50,000 to $74,999 | 1,863 (18.9%) | 417 (16.1%) |
| $75,000 to $99,999 | 1,741 (17.6%) | 281 (10.8%) |
| $100,000 to $149,999 | 2,488 (25.2%) | 247 (9.5%) |
| $150,000 or more | 1,852 (18.8%) | 92 (3.5%) |
| Total | 9,870 (100.0%) | 2,592 (100.0%) |
Monthly Housing Cost Tiers in Sioux County
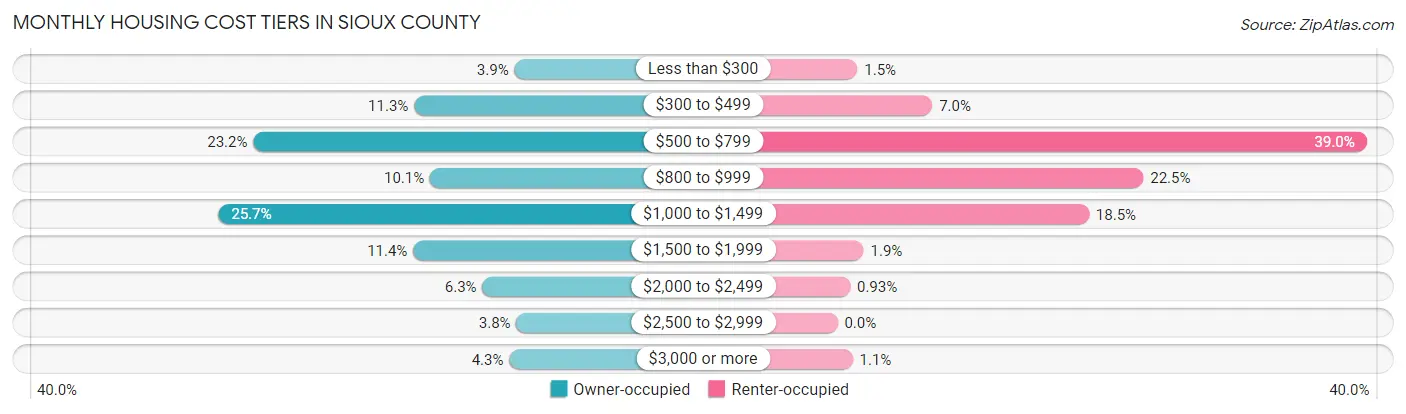
| Monthly Cost | Owner-occupied | Renter-occupied |
| Less than $300 | 387 (3.9%) | 38 (1.5%) |
| $300 to $499 | 1,116 (11.3%) | 181 (7.0%) |
| $500 to $799 | 2,286 (23.2%) | 1,010 (39.0%) |
| $800 to $999 | 1,001 (10.1%) | 584 (22.5%) |
| $1,000 to $1,499 | 2,540 (25.7%) | 480 (18.5%) |
| $1,500 to $1,999 | 1,123 (11.4%) | 50 (1.9%) |
| $2,000 to $2,499 | 620 (6.3%) | 24 (0.9%) |
| $2,500 to $2,999 | 373 (3.8%) | 0 (0.0%) |
| $3,000 or more | 424 (4.3%) | 29 (1.1%) |
| Total | 9,870 (100.0%) | 2,592 (100.0%) |
Physical Housing Characteristics in Sioux County
Housing Structures in Sioux County
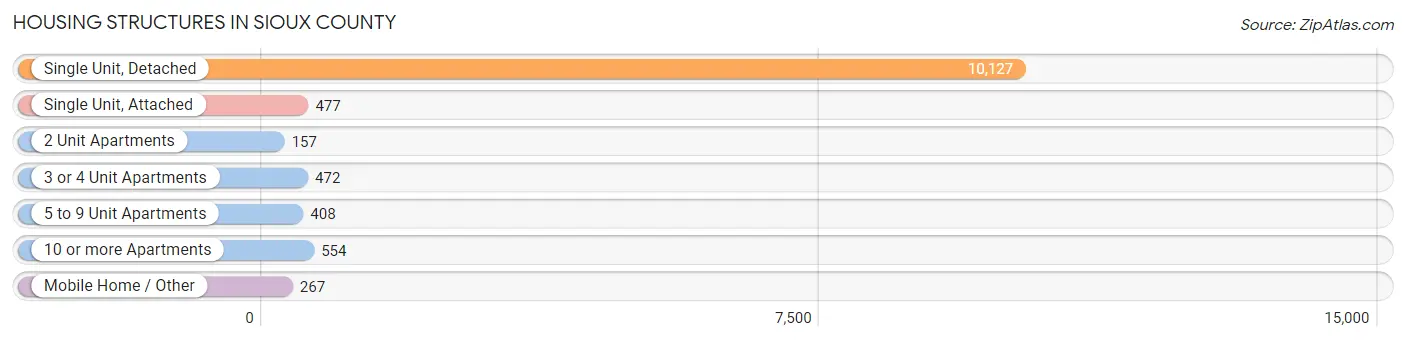
| Structure Type | # Housing Units | % Housing Units |
| Single Unit, Detached | 10,127 | 81.3% |
| Single Unit, Attached | 477 | 3.8% |
| 2 Unit Apartments | 157 | 1.3% |
| 3 or 4 Unit Apartments | 472 | 3.8% |
| 5 to 9 Unit Apartments | 408 | 3.3% |
| 10 or more Apartments | 554 | 4.4% |
| Mobile Home / Other | 267 | 2.1% |
| Total | 12,462 | 100.0% |
Housing Structures by Occupancy in Sioux County
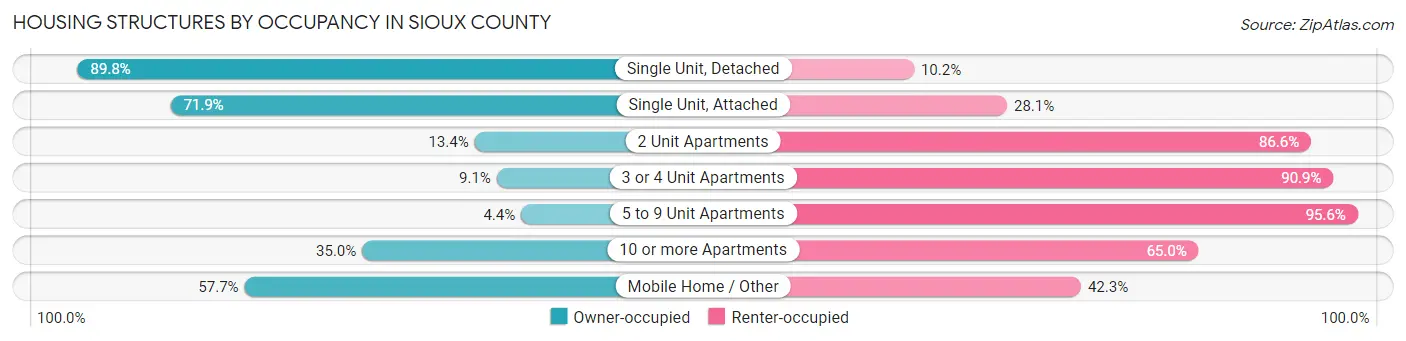
| Structure Type | Owner-occupied | Renter-occupied |
| Single Unit, Detached | 9,097 (89.8%) | 1,030 (10.2%) |
| Single Unit, Attached | 343 (71.9%) | 134 (28.1%) |
| 2 Unit Apartments | 21 (13.4%) | 136 (86.6%) |
| 3 or 4 Unit Apartments | 43 (9.1%) | 429 (90.9%) |
| 5 to 9 Unit Apartments | 18 (4.4%) | 390 (95.6%) |
| 10 or more Apartments | 194 (35.0%) | 360 (65.0%) |
| Mobile Home / Other | 154 (57.7%) | 113 (42.3%) |
| Total | 9,870 (79.2%) | 2,592 (20.8%) |
Housing Structures by Number of Rooms in Sioux County
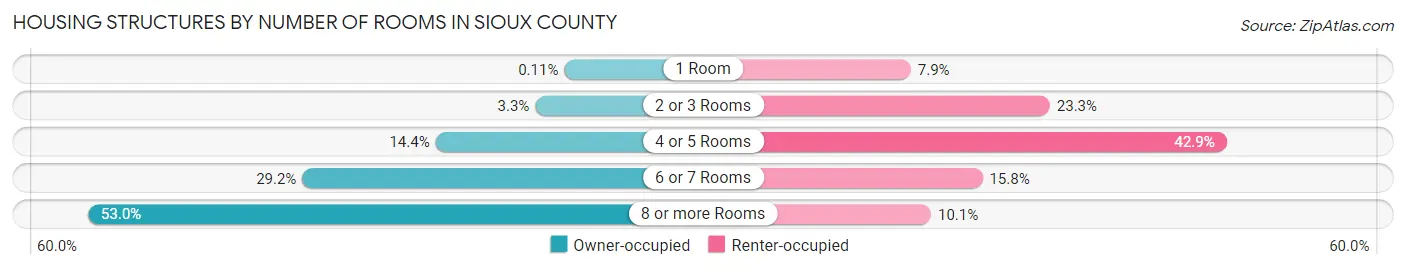
| Number of Rooms | Owner-occupied | Renter-occupied |
| 1 Room | 11 (0.1%) | 204 (7.9%) |
| 2 or 3 Rooms | 329 (3.3%) | 604 (23.3%) |
| 4 or 5 Rooms | 1,421 (14.4%) | 1,112 (42.9%) |
| 6 or 7 Rooms | 2,881 (29.2%) | 410 (15.8%) |
| 8 or more Rooms | 5,228 (53.0%) | 262 (10.1%) |
| Total | 9,870 (100.0%) | 2,592 (100.0%) |
Housing Structure by Heating Type in Sioux County
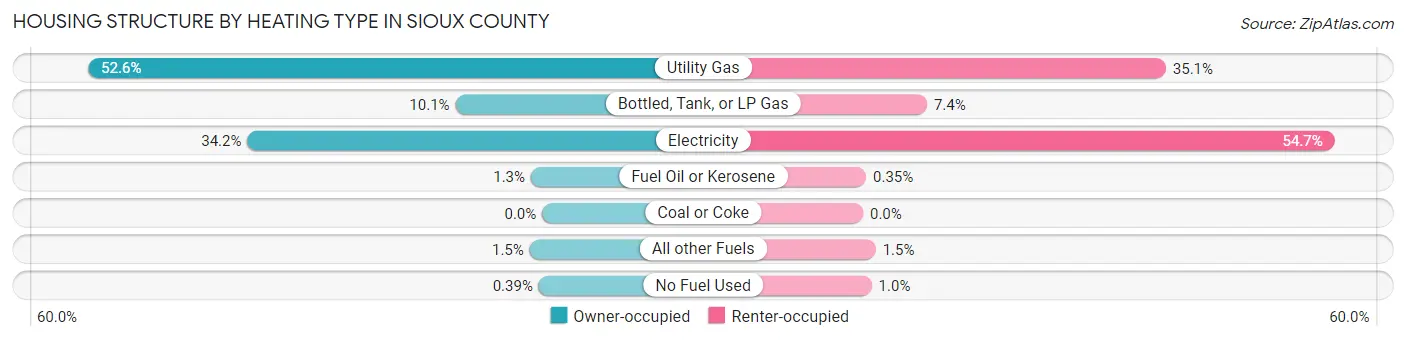
| Heating Type | Owner-occupied | Renter-occupied |
| Utility Gas | 5,195 (52.6%) | 910 (35.1%) |
| Bottled, Tank, or LP Gas | 992 (10.1%) | 192 (7.4%) |
| Electricity | 3,374 (34.2%) | 1,417 (54.7%) |
| Fuel Oil or Kerosene | 128 (1.3%) | 9 (0.4%) |
| Coal or Coke | 0 (0.0%) | 0 (0.0%) |
| All other Fuels | 143 (1.5%) | 38 (1.5%) |
| No Fuel Used | 38 (0.4%) | 26 (1.0%) |
| Total | 9,870 (100.0%) | 2,592 (100.0%) |
Household Vehicle Usage in Sioux County
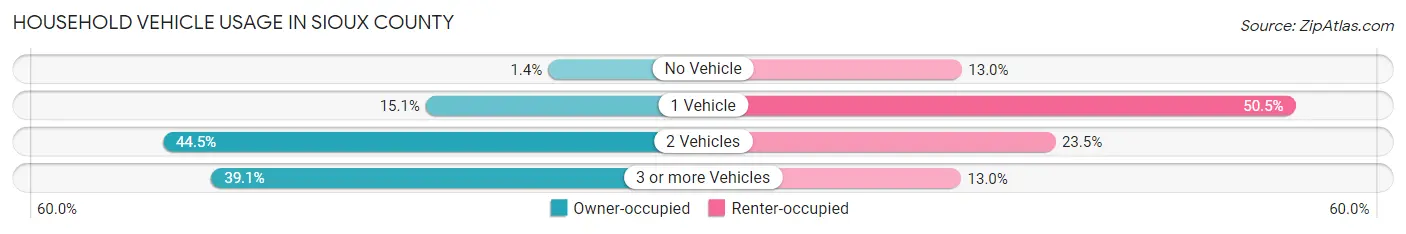
| Vehicles per Household | Owner-occupied | Renter-occupied |
| No Vehicle | 134 (1.4%) | 338 (13.0%) |
| 1 Vehicle | 1,487 (15.1%) | 1,308 (50.5%) |
| 2 Vehicles | 4,392 (44.5%) | 610 (23.5%) |
| 3 or more Vehicles | 3,857 (39.1%) | 336 (13.0%) |
| Total | 9,870 (100.0%) | 2,592 (100.0%) |
Real Estate & Mortgages in Sioux County
Real Estate and Mortgage Overview in Sioux County
| Characteristic | Without Mortgage | With Mortgage |
| Housing Units | 4,405 | 5,465 |
| Median Property Value | $215,400 | $224,700 |
| Median Household Income | $80,083 | $1,185 |
| Monthly Housing Costs | $580 | $424 |
| Real Estate Taxes | $2,694 | $43 |
Property Value by Mortgage Status in Sioux County
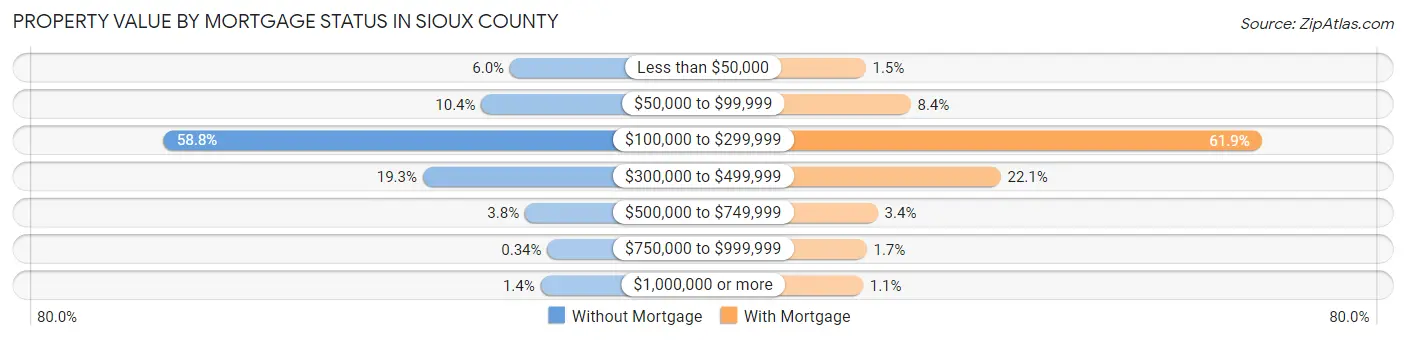
| Property Value | Without Mortgage | With Mortgage |
| Less than $50,000 | 266 (6.0%) | 83 (1.5%) |
| $50,000 to $99,999 | 458 (10.4%) | 458 (8.4%) |
| $100,000 to $299,999 | 2,589 (58.8%) | 3,381 (61.9%) |
| $300,000 to $499,999 | 851 (19.3%) | 1,208 (22.1%) |
| $500,000 to $749,999 | 165 (3.7%) | 184 (3.4%) |
| $750,000 to $999,999 | 15 (0.3%) | 91 (1.7%) |
| $1,000,000 or more | 61 (1.4%) | 60 (1.1%) |
| Total | 4,405 (100.0%) | 5,465 (100.0%) |
Household Income by Mortgage Status in Sioux County
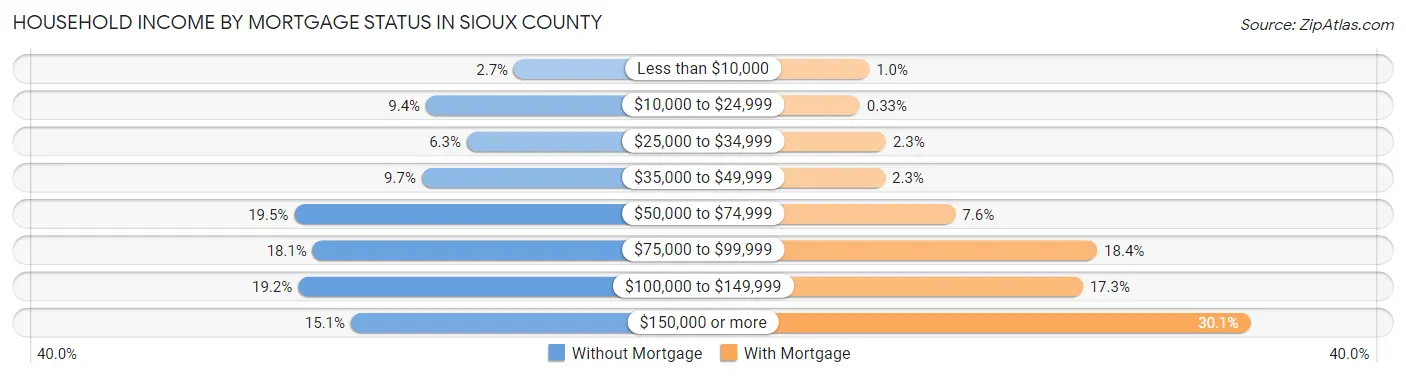
| Household Income | Without Mortgage | With Mortgage |
| Less than $10,000 | 120 (2.7%) | 57 (1.0%) |
| $10,000 to $24,999 | 415 (9.4%) | 18 (0.3%) |
| $25,000 to $34,999 | 278 (6.3%) | 127 (2.3%) |
| $35,000 to $49,999 | 429 (9.7%) | 123 (2.2%) |
| $50,000 to $74,999 | 857 (19.5%) | 416 (7.6%) |
| $75,000 to $99,999 | 795 (18.0%) | 1,006 (18.4%) |
| $100,000 to $149,999 | 844 (19.2%) | 946 (17.3%) |
| $150,000 or more | 667 (15.1%) | 1,644 (30.1%) |
| Total | 4,405 (100.0%) | 5,465 (100.0%) |
Property Value to Household Income Ratio in Sioux County
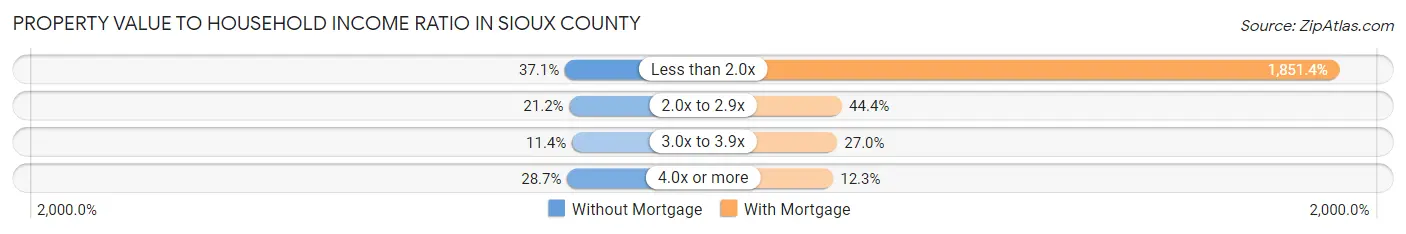
| Value-to-Income Ratio | Without Mortgage | With Mortgage |
| Less than 2.0x | 1,634 (37.1%) | 101,177 (1,851.4%) |
| 2.0x to 2.9x | 934 (21.2%) | 2,426 (44.4%) |
| 3.0x to 3.9x | 502 (11.4%) | 1,478 (27.0%) |
| 4.0x or more | 1,266 (28.7%) | 673 (12.3%) |
| Total | 4,405 (100.0%) | 5,465 (100.0%) |
Real Estate Taxes by Mortgage Status in Sioux County
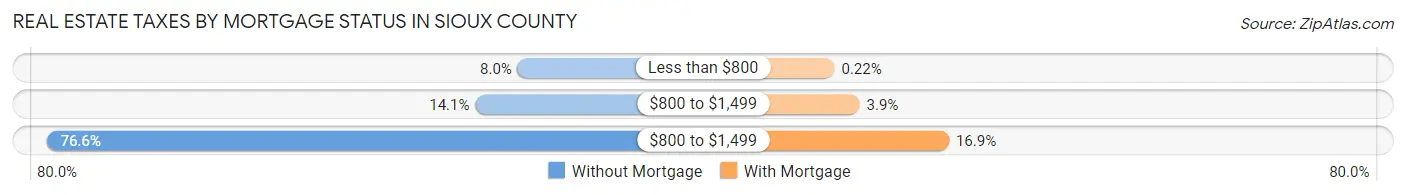
| Property Taxes | Without Mortgage | With Mortgage |
| Less than $800 | 350 (8.0%) | 12 (0.2%) |
| $800 to $1,499 | 623 (14.1%) | 212 (3.9%) |
| $800 to $1,499 | 3,376 (76.6%) | 926 (16.9%) |
| Total | 4,405 (100.0%) | 5,465 (100.0%) |
Health & Disability in Sioux County
Health Insurance Coverage by Age in Sioux County
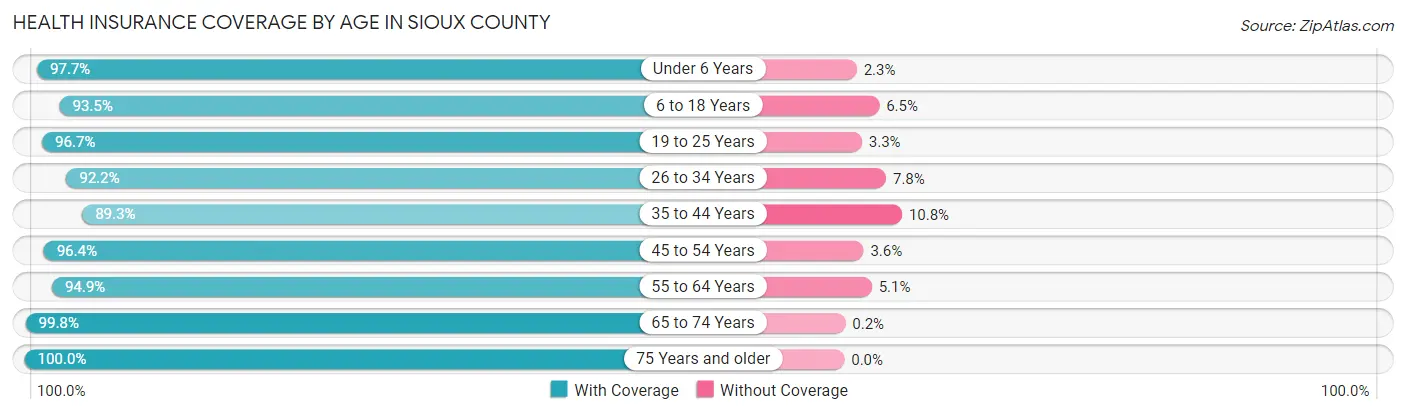
| Age Bracket | With Coverage | Without Coverage |
| Under 6 Years | 2,836 (97.7%) | 67 (2.3%) |
| 6 to 18 Years | 7,019 (93.5%) | 489 (6.5%) |
| 19 to 25 Years | 4,223 (96.7%) | 143 (3.3%) |
| 26 to 34 Years | 3,060 (92.2%) | 258 (7.8%) |
| 35 to 44 Years | 3,834 (89.2%) | 462 (10.7%) |
| 45 to 54 Years | 3,293 (96.4%) | 122 (3.6%) |
| 55 to 64 Years | 3,899 (94.9%) | 210 (5.1%) |
| 65 to 74 Years | 2,945 (99.8%) | 6 (0.2%) |
| 75 Years and older | 2,545 (100.0%) | 0 (0.0%) |
| Total | 33,654 (95.0%) | 1,757 (5.0%) |
Health Insurance Coverage by Citizenship Status in Sioux County
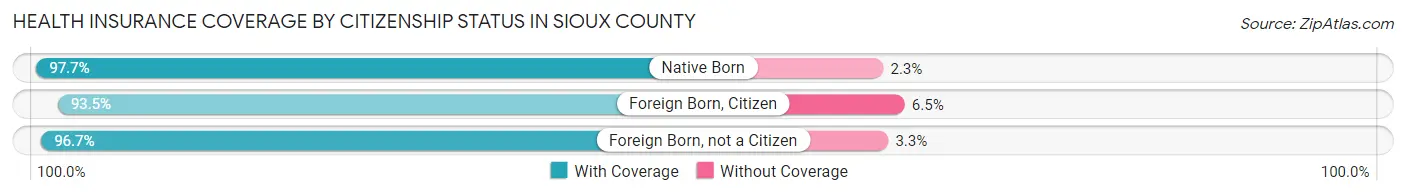
| Citizenship Status | With Coverage | Without Coverage |
| Native Born | 2,836 (97.7%) | 67 (2.3%) |
| Foreign Born, Citizen | 7,019 (93.5%) | 489 (6.5%) |
| Foreign Born, not a Citizen | 4,223 (96.7%) | 143 (3.3%) |
Health Insurance Coverage by Household Income in Sioux County
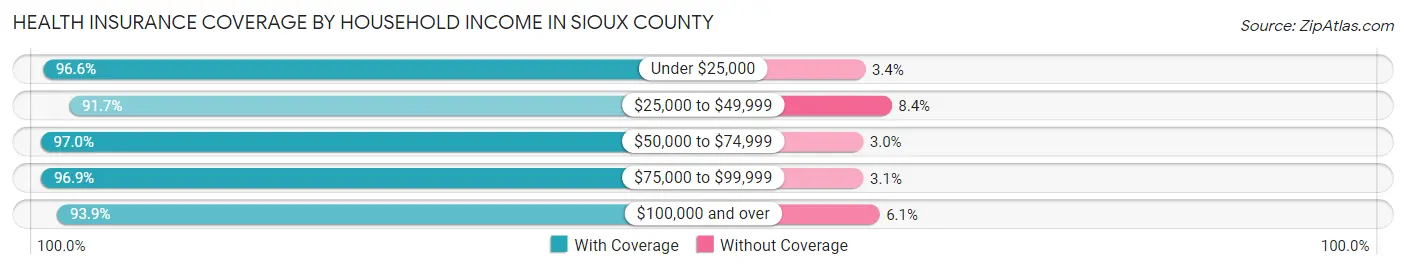
| Household Income | With Coverage | Without Coverage |
| Under $25,000 | 2,045 (96.6%) | 72 (3.4%) |
| $25,000 to $49,999 | 3,174 (91.6%) | 289 (8.4%) |
| $50,000 to $74,999 | 5,736 (97.0%) | 178 (3.0%) |
| $75,000 to $99,999 | 5,300 (96.9%) | 168 (3.1%) |
| $100,000 and over | 15,548 (93.9%) | 1,007 (6.1%) |
Public vs Private Health Insurance Coverage by Age in Sioux County
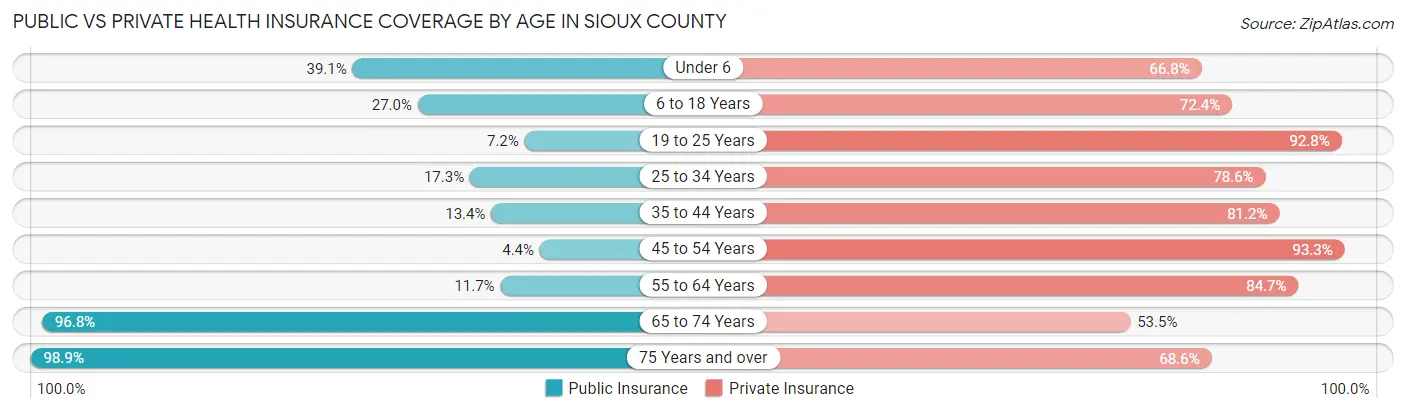
| Age Bracket | Public Insurance | Private Insurance |
| Under 6 | 1,136 (39.1%) | 1,938 (66.8%) |
| 6 to 18 Years | 2,029 (27.0%) | 5,439 (72.4%) |
| 19 to 25 Years | 314 (7.2%) | 4,050 (92.8%) |
| 25 to 34 Years | 575 (17.3%) | 2,609 (78.6%) |
| 35 to 44 Years | 575 (13.4%) | 3,488 (81.2%) |
| 45 to 54 Years | 149 (4.4%) | 3,187 (93.3%) |
| 55 to 64 Years | 480 (11.7%) | 3,481 (84.7%) |
| 65 to 74 Years | 2,856 (96.8%) | 1,580 (53.5%) |
| 75 Years and over | 2,517 (98.9%) | 1,746 (68.6%) |
| Total | 10,631 (30.0%) | 27,518 (77.7%) |
Disability Status by Sex by Age in Sioux County
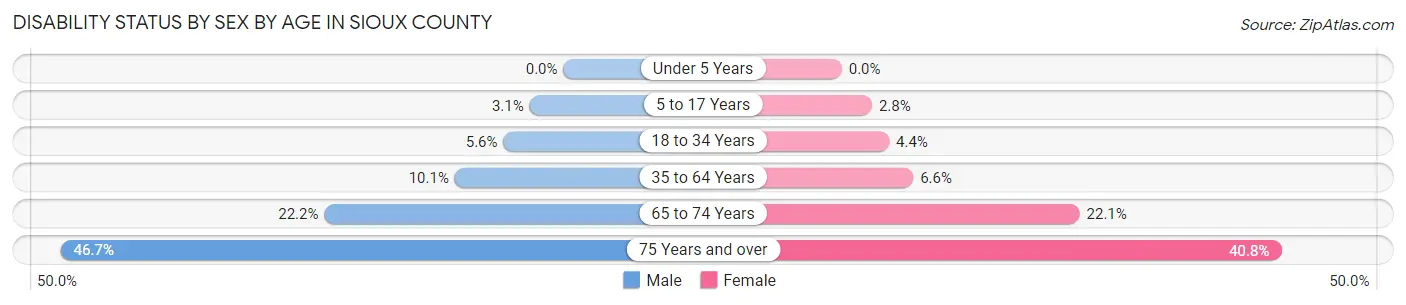
| Age Bracket | Male | Female |
| Under 5 Years | 0 (0.0%) | 0 (0.0%) |
| 5 to 17 Years | 115 (3.1%) | 96 (2.8%) |
| 18 to 34 Years | 241 (5.6%) | 182 (4.4%) |
| 35 to 64 Years | 620 (10.1%) | 376 (6.6%) |
| 65 to 74 Years | 333 (22.2%) | 320 (22.1%) |
| 75 Years and over | 461 (46.7%) | 635 (40.8%) |
Disability Class by Sex by Age in Sioux County
Disability Class: Hearing Difficulty
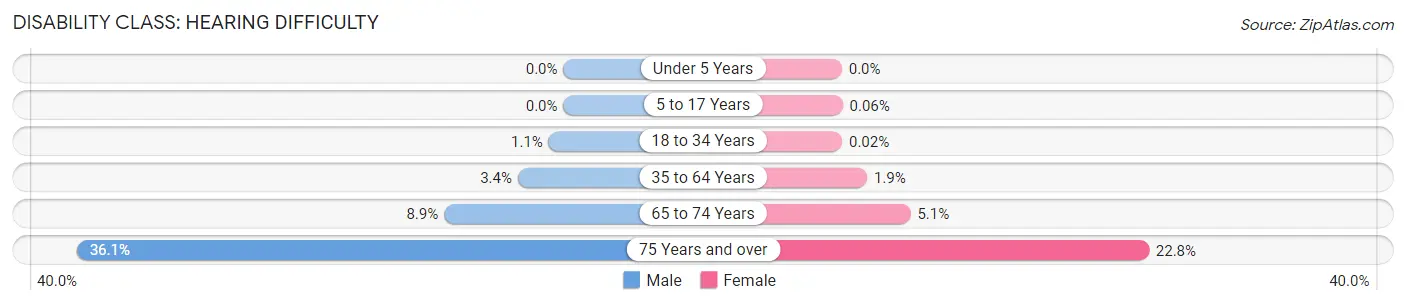
| Age Bracket | Male | Female |
| Under 5 Years | 0 (0.0%) | 0 (0.0%) |
| 5 to 17 Years | 0 (0.0%) | 2 (0.1%) |
| 18 to 34 Years | 47 (1.1%) | 1 (0.0%) |
| 35 to 64 Years | 208 (3.4%) | 106 (1.9%) |
| 65 to 74 Years | 133 (8.9%) | 74 (5.1%) |
| 75 Years and over | 357 (36.1%) | 355 (22.8%) |
Disability Class: Vision Difficulty
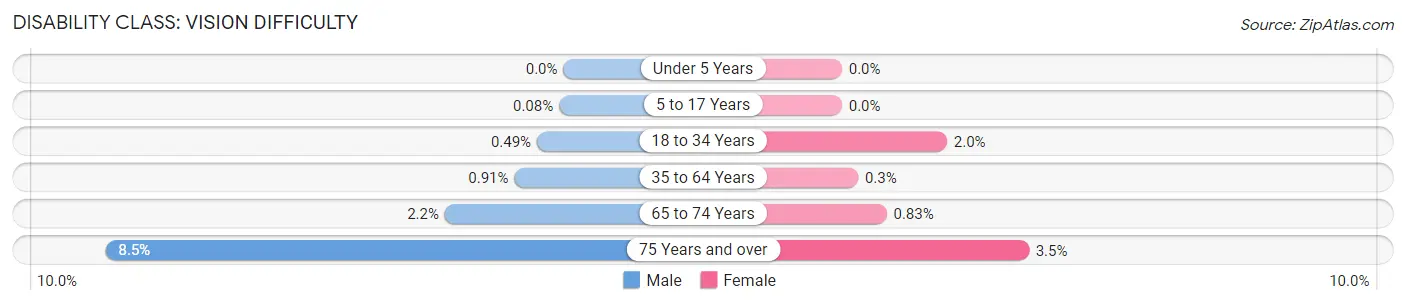
| Age Bracket | Male | Female |
| Under 5 Years | 0 (0.0%) | 0 (0.0%) |
| 5 to 17 Years | 3 (0.1%) | 0 (0.0%) |
| 18 to 34 Years | 21 (0.5%) | 81 (1.9%) |
| 35 to 64 Years | 56 (0.9%) | 17 (0.3%) |
| 65 to 74 Years | 33 (2.2%) | 12 (0.8%) |
| 75 Years and over | 84 (8.5%) | 54 (3.5%) |
Disability Class: Cognitive Difficulty
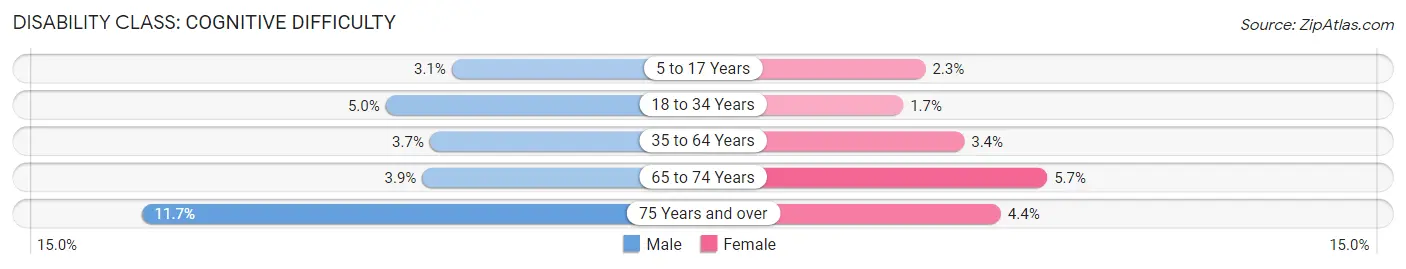
| Age Bracket | Male | Female |
| 5 to 17 Years | 114 (3.1%) | 80 (2.3%) |
| 18 to 34 Years | 214 (5.0%) | 71 (1.7%) |
| 35 to 64 Years | 229 (3.7%) | 193 (3.4%) |
| 65 to 74 Years | 59 (3.9%) | 83 (5.7%) |
| 75 Years and over | 116 (11.7%) | 69 (4.4%) |
Disability Class: Ambulatory Difficulty
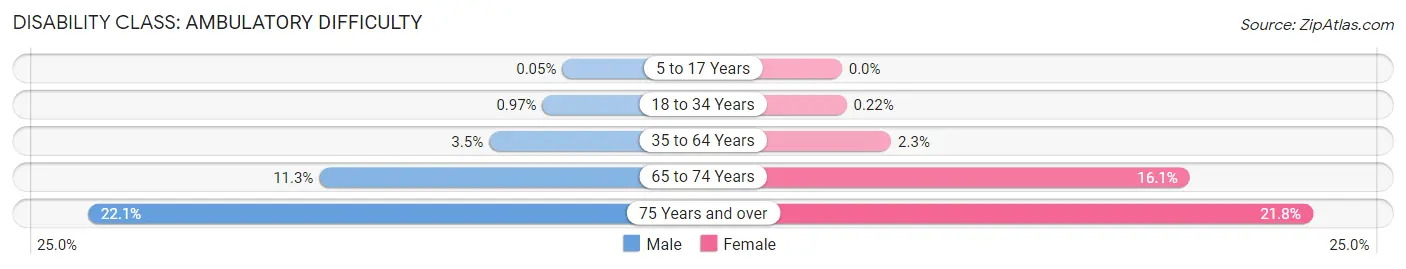
| Age Bracket | Male | Female |
| 5 to 17 Years | 2 (0.1%) | 0 (0.0%) |
| 18 to 34 Years | 42 (1.0%) | 9 (0.2%) |
| 35 to 64 Years | 212 (3.5%) | 130 (2.3%) |
| 65 to 74 Years | 170 (11.3%) | 234 (16.1%) |
| 75 Years and over | 218 (22.1%) | 340 (21.8%) |
Disability Class: Self-Care Difficulty
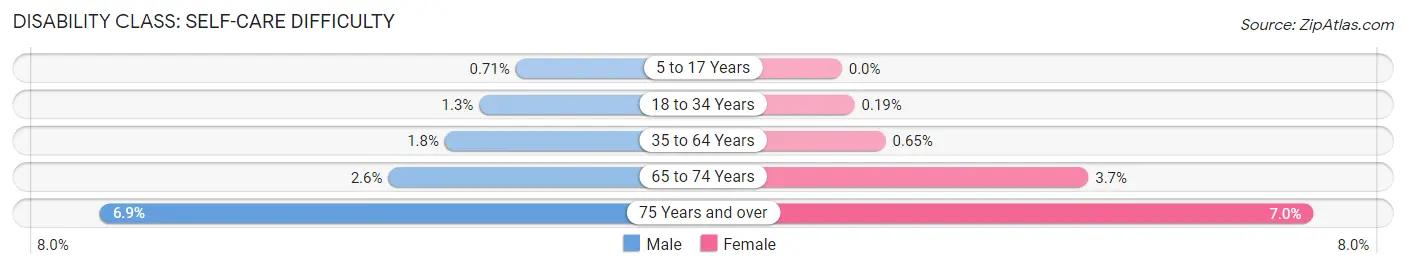
| Age Bracket | Male | Female |
| 5 to 17 Years | 26 (0.7%) | 0 (0.0%) |
| 18 to 34 Years | 54 (1.3%) | 8 (0.2%) |
| 35 to 64 Years | 108 (1.8%) | 37 (0.6%) |
| 65 to 74 Years | 39 (2.6%) | 53 (3.7%) |
| 75 Years and over | 68 (6.9%) | 109 (7.0%) |
Technology Access in Sioux County
Computing Device Access in Sioux County
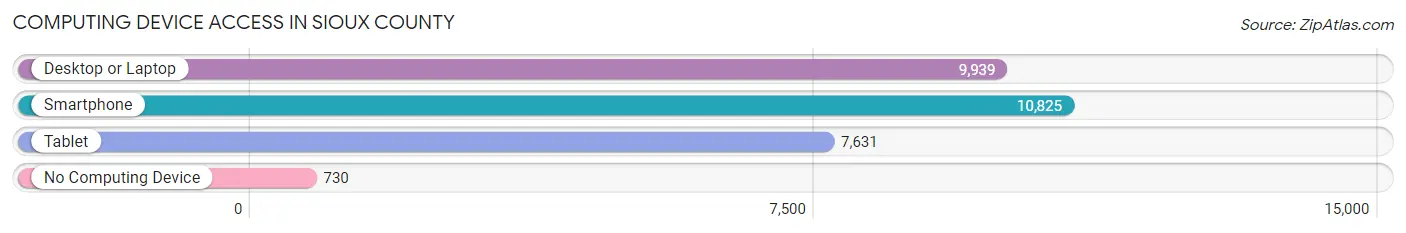
| Device Type | # Households | % Households |
| Desktop or Laptop | 9,939 | 79.7% |
| Smartphone | 10,825 | 86.9% |
| Tablet | 7,631 | 61.2% |
| No Computing Device | 730 | 5.9% |
| Total | 12,462 | 100.0% |
Internet Access in Sioux County
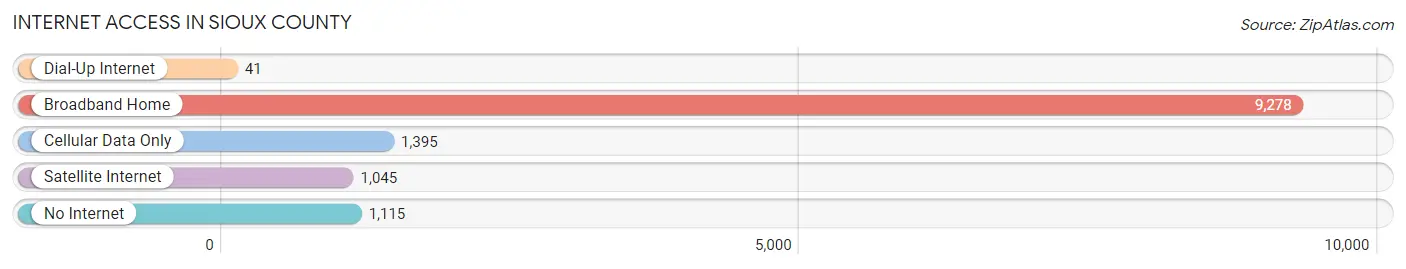
| Internet Type | # Households | % Households |
| Dial-Up Internet | 41 | 0.3% |
| Broadband Home | 9,278 | 74.5% |
| Cellular Data Only | 1,395 | 11.2% |
| Satellite Internet | 1,045 | 8.4% |
| No Internet | 1,115 | 8.9% |
| Total | 12,462 | 100.0% |
Sioux County Summary
Sioux County is located in the northwest corner of Iowa and is bordered by the states of South Dakota and Minnesota. It is the second largest county in the state, with an area of 1,717 square miles. As of the 2010 census, the population was 33,704, making it the fourth most populous county in Iowa.
The county was established in 1851 and was named after the Sioux tribe of Native Americans who lived in the area. The county seat is Orange City, which was founded in 1870.
Geography
Sioux County is located in the northwest corner of Iowa and is bordered by the states of South Dakota and Minnesota. It is the second largest county in the state, with an area of 1,717 square miles. The county is mostly rural, with the majority of the land being used for agricultural purposes. The terrain is mostly flat, with some rolling hills in the northern part of the county. The county is drained by the Big Sioux River, which flows through the county from east to west.
The climate of Sioux County is classified as humid continental, with cold winters and hot, humid summers. The average annual temperature is 48°F, with an average high of 68°F in July and an average low of 28°F in January. The average annual precipitation is 30 inches, with the majority of it falling in the summer months.
Economy
The economy of Sioux County is largely based on agriculture. The county is one of the leading producers of corn, soybeans, and hogs in the state. Other major crops grown in the county include wheat, oats, hay, and potatoes. Livestock production is also important to the county’s economy, with cattle, sheep, and poultry being raised in the area.
In addition to agriculture, Sioux County also has a strong manufacturing sector. The county is home to several large manufacturing companies, including John Deere, Sioux Steel, and Sioux Manufacturing. The county also has a growing tourism industry, with several popular attractions, such as the Sioux County Historical Museum and the Sioux County Fairgrounds.
Demographics
As of the 2010 census, the population of Sioux County was 33,704, making it the fourth most populous county in Iowa. The population is spread out over the county, with the largest cities being Orange City (population 6,735) and Sioux Center (population 5,072). The population is predominantly white (96.3%), with small percentages of African Americans (1.2%), Asians (0.7%), and Native Americans (0.4%).
The median household income in Sioux County is $54,845, which is slightly higher than the state average of $52,229. The median home value is $133,400, which is also slightly higher than the state average of $130,400. The unemployment rate in the county is 3.2%, which is lower than the state average of 3.7%.
Conclusion
Sioux County is located in the northwest corner of Iowa and is bordered by the states of South Dakota and Minnesota. It is the second largest county in the state, with an area of 1,717 square miles. As of the 2010 census, the population was 33,704, making it the fourth most populous county in Iowa. The economy of Sioux County is largely based on agriculture, with corn, soybeans, and hogs being the major crops. The county also has a strong manufacturing sector and a growing tourism industry. The population is predominantly white, with a median household income of $54,845 and a median home value of $133,400.
Common Questions
What is Per Capita Income in Sioux County?
Per Capita income in Sioux County is $34,914.
What is the Median Family Income in Sioux County?
Median Family Income in Sioux County is $95,737.
What is the Median Household income in Sioux County?
Median Household Income in Sioux County is $81,914.
What is Income or Wage Gap in Sioux County?
Income or Wage Gap in Sioux County is 44.4%.
Women in Sioux County earn 55.6 cents for every dollar earned by a man.
What is Inequality or Gini Index in Sioux County?
Inequality or Gini Index in Sioux County is 0.41.
What is the Total Population of Sioux County?
Total Population of Sioux County is 35,815.
What is the Total Male Population of Sioux County?
Total Male Population of Sioux County is 18,140.
What is the Total Female Population of Sioux County?
Total Female Population of Sioux County is 17,675.
What is the Ratio of Males per 100 Females in Sioux County?
There are 102.63 Males per 100 Females in Sioux County.
What is the Ratio of Females per 100 Males in Sioux County?
There are 97.44 Females per 100 Males in Sioux County.
What is the Median Population Age in Sioux County?
Median Population Age in Sioux County is 34.4 Years.
What is the Average Family Size in Sioux County
Average Family Size in Sioux County is 3.2 People.
What is the Average Household Size in Sioux County
Average Household Size in Sioux County is 2.7 People.
How Large is the Labor Force in Sioux County?
There are 19,568 People in the Labor Forcein in Sioux County.
What is the Percentage of People in the Labor Force in Sioux County?
71.9% of People are in the Labor Force in Sioux County.
What is the Unemployment Rate in Sioux County?
Unemployment Rate in Sioux County is 2.3%.