Benton County, IA Map & Demographics
Benton County Map
Benton County Overview
$37,926
PER CAPITA INCOME
$95,589
AVG FAMILY INCOME
$79,444
AVG HOUSEHOLD INCOME
29.5%
WAGE / INCOME GAP [ % ]
70.5¢/ $1
WAGE / INCOME GAP [ $ ]
$8,949
FAMILY INCOME DEFICIT
0.39
INEQUALITY / GINI INDEX
25,652
TOTAL POPULATION
12,934
MALE POPULATION
12,718
FEMALE POPULATION
101.70
MALES / 100 FEMALES
98.33
FEMALES / 100 MALES
43.0
MEDIAN AGE
3.0
AVG FAMILY SIZE
2.5
AVG HOUSEHOLD SIZE
13,519
LABOR FORCE [ PEOPLE ]
66.2%
PERCENT IN LABOR FORCE
2.3%
UNEMPLOYMENT RATE
Benton County Area Codes
Income in Benton County
Income Overview in Benton County
Per Capita Income in Benton County is $37,926, while median incomes of families and households are $95,589 and $79,444 respectively.
| Characteristic | Number | Measure |
| Per Capita Income | 25,652 | $37,926 |
| Median Family Income | 6,897 | $95,589 |
| Mean Family Income | 6,897 | $109,462 |
| Median Household Income | 10,114 | $79,444 |
| Mean Household Income | 10,114 | $92,655 |
| Income Deficit | 6,897 | $8,949 |
| Wage / Income Gap (%) | 25,652 | 29.55% |
| Wage / Income Gap ($) | 25,652 | 70.45¢ per $1 |
| Gini / Inequality Index | 25,652 | 0.39 |
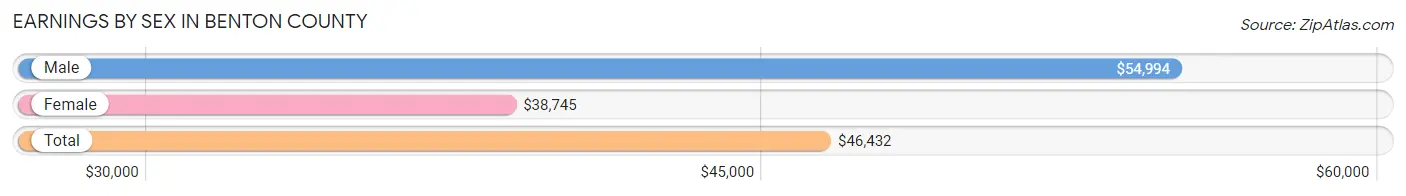
Earnings by Sex in Benton County
Average Earnings in Benton County are $46,432, $54,994 for men and $38,745 for women, a difference of 29.5%.
| Sex | Number | Average Earnings |
| Male | 7,737 (54.3%) | $54,994 |
| Female | 6,516 (45.7%) | $38,745 |
| Total | 14,253 (100.0%) | $46,432 |
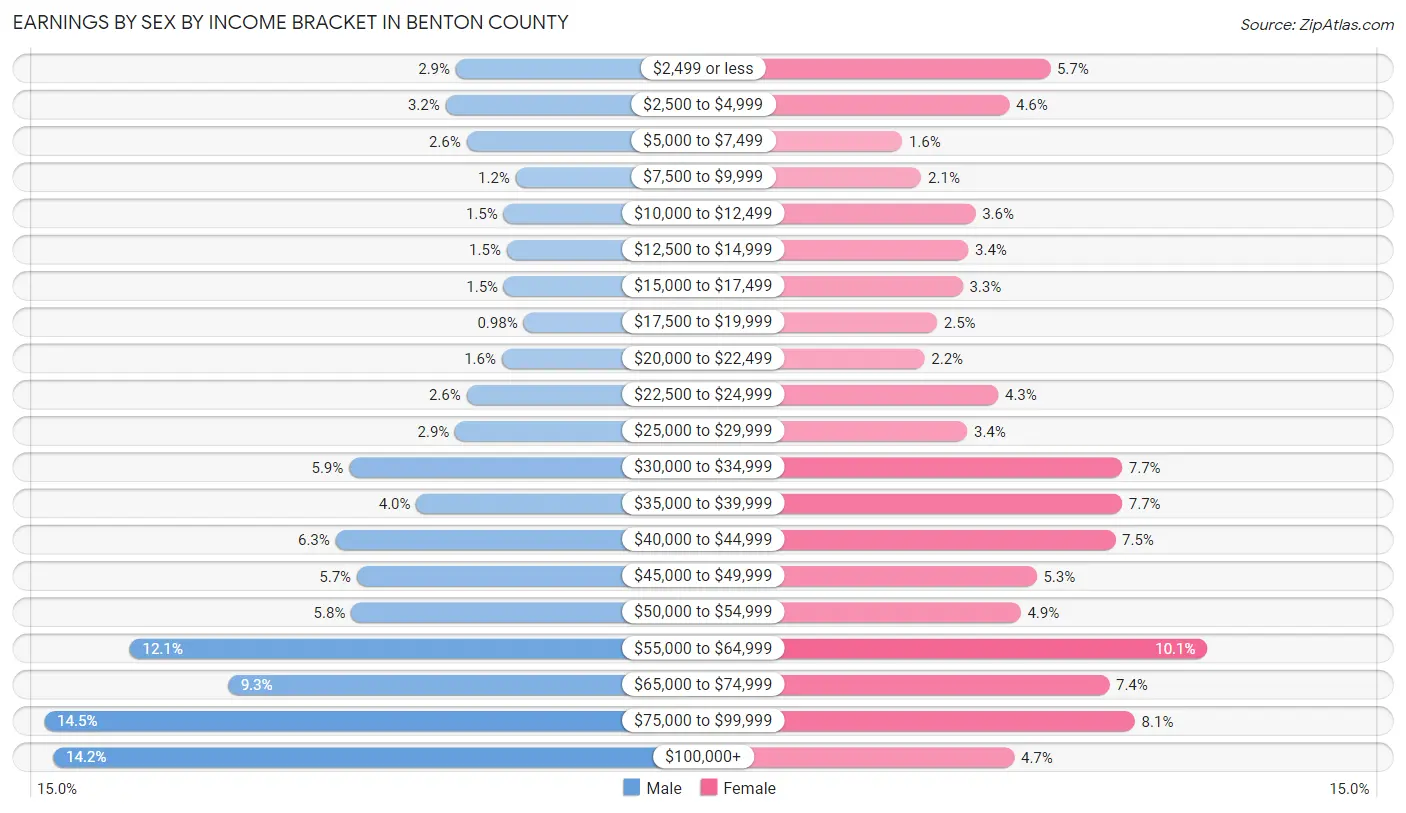
Earnings by Sex by Income Bracket in Benton County
The most common earnings brackets in Benton County are $75,000 to $99,999 for men (1,118 | 14.4%) and $55,000 to $64,999 for women (660 | 10.1%).
| Income | Male | Female |
| $2,499 or less | 223 (2.9%) | 372 (5.7%) |
| $2,500 to $4,999 | 245 (3.2%) | 297 (4.6%) |
| $5,000 to $7,499 | 200 (2.6%) | 101 (1.5%) |
| $7,500 to $9,999 | 93 (1.2%) | 136 (2.1%) |
| $10,000 to $12,499 | 119 (1.5%) | 235 (3.6%) |
| $12,500 to $14,999 | 112 (1.5%) | 222 (3.4%) |
| $15,000 to $17,499 | 118 (1.5%) | 212 (3.3%) |
| $17,500 to $19,999 | 76 (1.0%) | 165 (2.5%) |
| $20,000 to $22,499 | 123 (1.6%) | 142 (2.2%) |
| $22,500 to $24,999 | 200 (2.6%) | 277 (4.3%) |
| $25,000 to $29,999 | 224 (2.9%) | 220 (3.4%) |
| $30,000 to $34,999 | 455 (5.9%) | 504 (7.7%) |
| $35,000 to $39,999 | 309 (4.0%) | 504 (7.7%) |
| $40,000 to $44,999 | 484 (6.3%) | 491 (7.5%) |
| $45,000 to $49,999 | 438 (5.7%) | 347 (5.3%) |
| $50,000 to $54,999 | 450 (5.8%) | 318 (4.9%) |
| $55,000 to $64,999 | 932 (12.0%) | 660 (10.1%) |
| $65,000 to $74,999 | 719 (9.3%) | 480 (7.4%) |
| $75,000 to $99,999 | 1,118 (14.4%) | 527 (8.1%) |
| $100,000+ | 1,099 (14.2%) | 306 (4.7%) |
| Total | 7,737 (100.0%) | 6,516 (100.0%) |
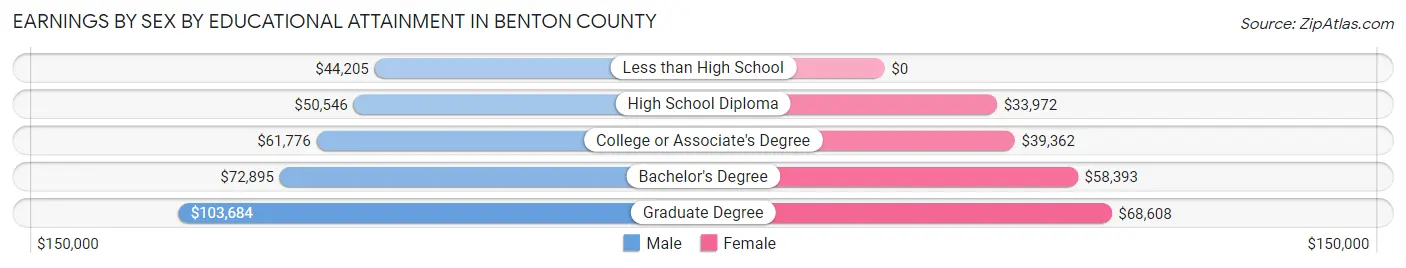
Earnings by Sex by Educational Attainment in Benton County
Average earnings in Benton County are $58,338 for men and $43,312 for women, a difference of 25.8%. Men with an educational attainment of graduate degree enjoy the highest average annual earnings of $103,684, while those with less than high school education earn the least with $44,205. Women with an educational attainment of graduate degree earn the most with the average annual earnings of $68,608, while those with high school diploma education have the smallest earnings of $33,972.
| Educational Attainment | Male Income | Female Income |
| Less than High School | $44,205 | $0 |
| High School Diploma | $50,546 | $33,972 |
| College or Associate's Degree | $61,776 | $39,362 |
| Bachelor's Degree | $72,895 | $58,393 |
| Graduate Degree | $103,684 | $68,608 |
| Total | $58,338 | $43,312 |
Family Income in Benton County
Family Income Brackets in Benton County
According to the Benton County family income data, there are 1,883 families falling into the $100,000 to $149,999 income range, which is the most common income bracket and makes up 27.3% of all families. Conversely, the $10,000 to $14,999 income bracket is the least frequent group with only 41 families (0.6%) belonging to this category.
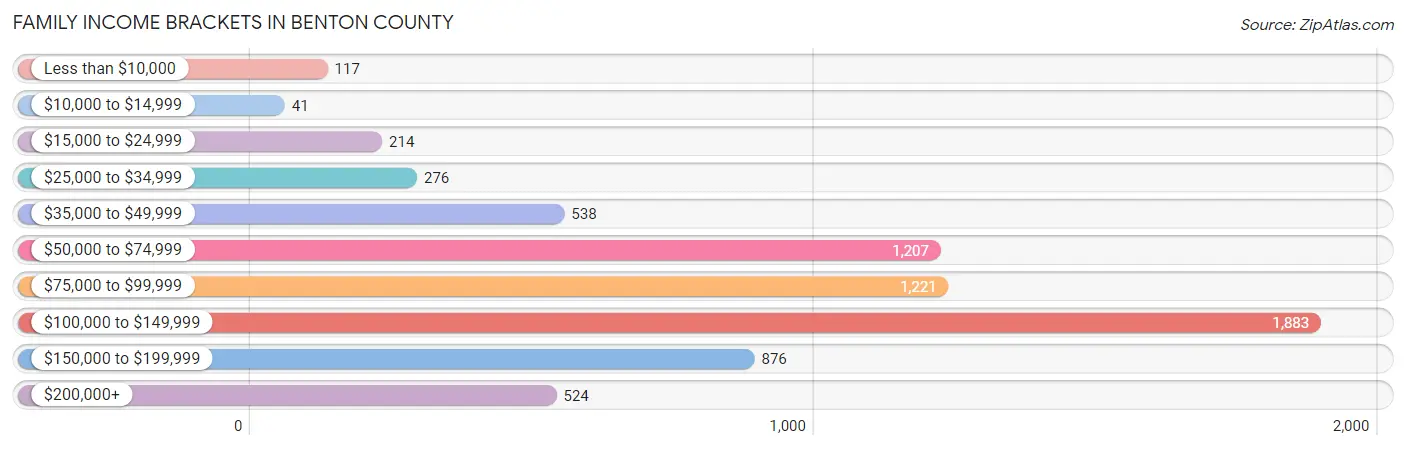
| Income Bracket | # Families | % Families |
| Less than $10,000 | 117 | 1.7% |
| $10,000 to $14,999 | 41 | 0.6% |
| $15,000 to $24,999 | 214 | 3.1% |
| $25,000 to $34,999 | 276 | 4.0% |
| $35,000 to $49,999 | 538 | 7.8% |
| $50,000 to $74,999 | 1,207 | 17.5% |
| $75,000 to $99,999 | 1,221 | 17.7% |
| $100,000 to $149,999 | 1,883 | 27.3% |
| $150,000 to $199,999 | 876 | 12.7% |
| $200,000+ | 524 | 7.6% |
Family Income by Famaliy Size in Benton County
6-person families (107 | 1.5%) account for the highest median family income in Benton County with $140,313 per family, while 2-person families (3,933 | 57.0%) have the highest median income of $40,396 per family member.
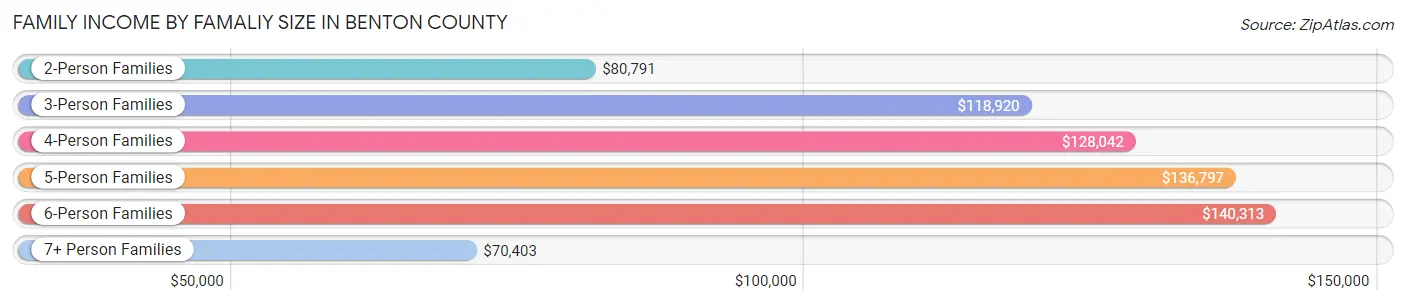
| Income Bracket | # Families | Median Income |
| 2-Person Families | 3,933 (57.0%) | $80,791 |
| 3-Person Families | 959 (13.9%) | $118,920 |
| 4-Person Families | 1,215 (17.6%) | $128,042 |
| 5-Person Families | 599 (8.7%) | $136,797 |
| 6-Person Families | 107 (1.5%) | $140,313 |
| 7+ Person Families | 84 (1.2%) | $70,403 |
| Total | 6,897 (100.0%) | $95,589 |
Family Income by Number of Earners in Benton County
The median family income in Benton County is $95,589, with families comprising 3+ earners (686) having the highest median family income of $146,875, while families with no earners (1,029) have the lowest median family income of $54,712, accounting for 10.0% and 14.9% of families, respectively.
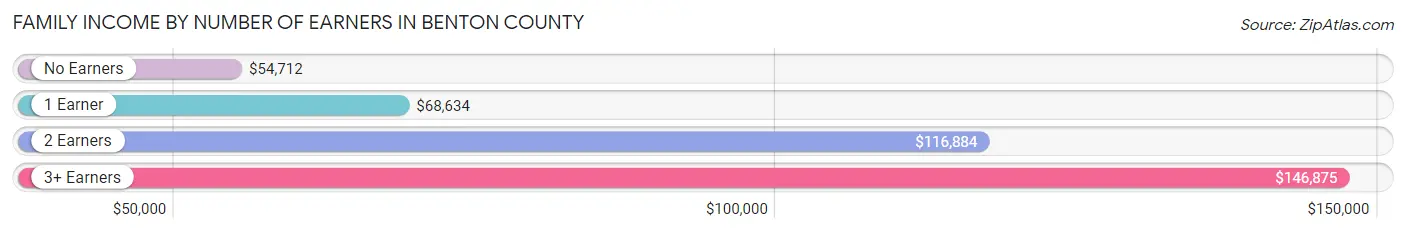
| Number of Earners | # Families | Median Income |
| No Earners | 1,029 (14.9%) | $54,712 |
| 1 Earner | 1,731 (25.1%) | $68,634 |
| 2 Earners | 3,451 (50.0%) | $116,884 |
| 3+ Earners | 686 (10.0%) | $146,875 |
| Total | 6,897 (100.0%) | $95,589 |
Household Income in Benton County
Household Income Brackets in Benton County
With 2,286 households falling in the category, the $100,000 to $149,999 income range is the most frequent in Benton County, accounting for 22.6% of all households. In contrast, only 324 households (3.2%) fall into the $10,000 to $14,999 income bracket, making it the least populous group.
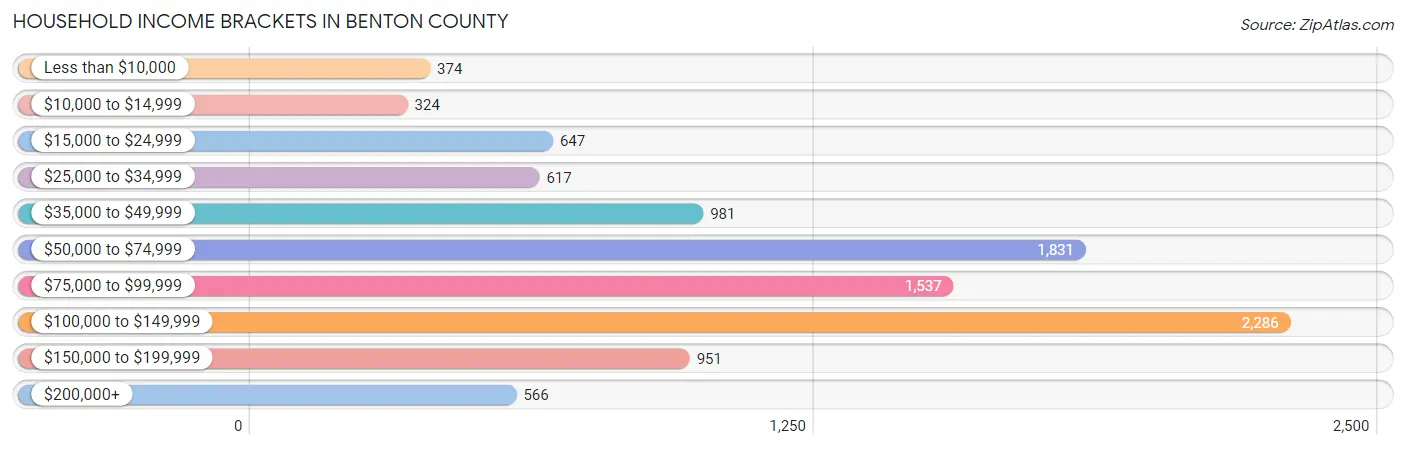
| Income Bracket | # Households | % Households |
| Less than $10,000 | 374 | 3.7% |
| $10,000 to $14,999 | 324 | 3.2% |
| $15,000 to $24,999 | 647 | 6.4% |
| $25,000 to $34,999 | 617 | 6.1% |
| $35,000 to $49,999 | 981 | 9.7% |
| $50,000 to $74,999 | 1,831 | 18.1% |
| $75,000 to $99,999 | 1,537 | 15.2% |
| $100,000 to $149,999 | 2,286 | 22.6% |
| $150,000 to $199,999 | 951 | 9.4% |
| $200,000+ | 566 | 5.6% |
Household Income by Householder Age in Benton County
The median household income in Benton County is $79,444, with the highest median household income of $99,337 found in the 25 to 44 years age bracket for the primary householder. A total of 2,832 households (28.0%) fall into this category. Meanwhile, the 65+ years age bracket for the primary householder has the lowest median household income of $47,550, with 2,958 households (29.2%) in this group.
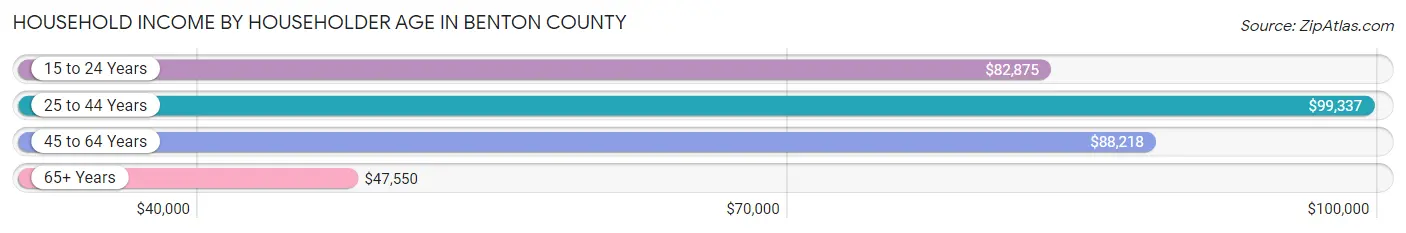
| Income Bracket | # Households | Median Income |
| 15 to 24 Years | 312 (3.1%) | $82,875 |
| 25 to 44 Years | 2,832 (28.0%) | $99,337 |
| 45 to 64 Years | 4,012 (39.7%) | $88,218 |
| 65+ Years | 2,958 (29.2%) | $47,550 |
| Total | 10,114 (100.0%) | $79,444 |
Poverty in Benton County
Income Below Poverty by Sex and Age in Benton County
With 6.1% poverty level for males and 10.6% for females among the residents of Benton County, 16 and 17 year old males and 75 year old and over females are the most vulnerable to poverty, with 55 males (17.5%) and 271 females (23.6%) in their respective age groups living below the poverty level.
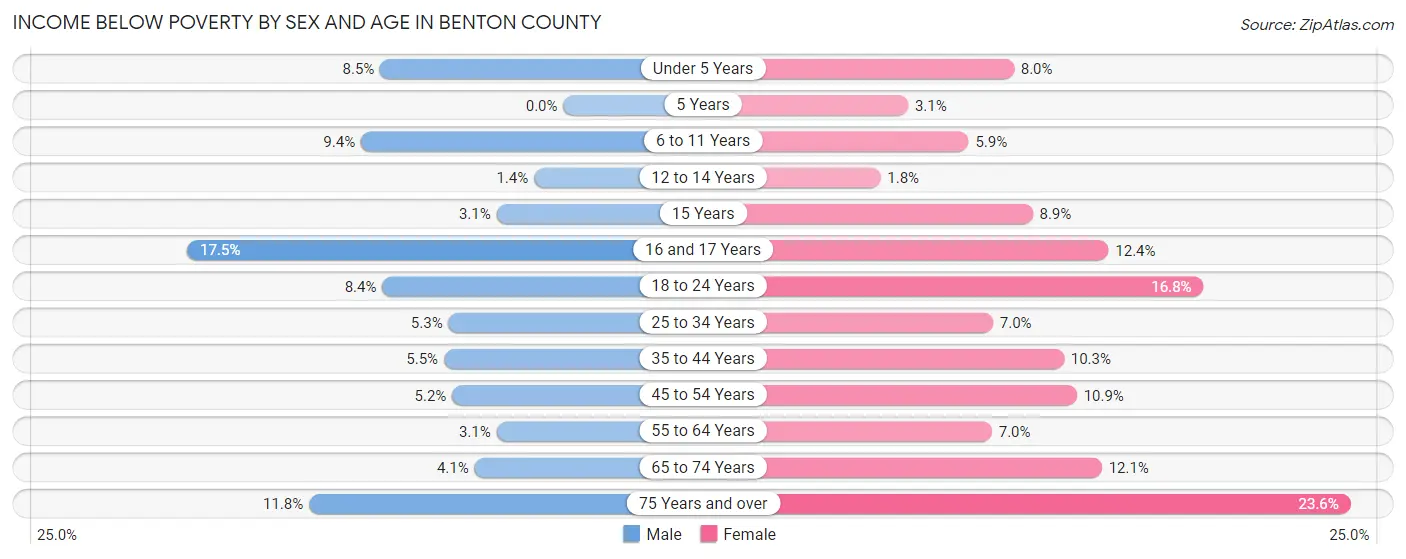
| Age Bracket | Male | Female |
| Under 5 Years | 62 (8.5%) | 57 (8.0%) |
| 5 Years | 0 (0.0%) | 5 (3.1%) |
| 6 to 11 Years | 92 (9.4%) | 54 (5.9%) |
| 12 to 14 Years | 8 (1.4%) | 8 (1.8%) |
| 15 Years | 7 (3.1%) | 17 (8.8%) |
| 16 and 17 Years | 55 (17.5%) | 46 (12.4%) |
| 18 to 24 Years | 82 (8.4%) | 147 (16.8%) |
| 25 to 34 Years | 75 (5.3%) | 90 (7.0%) |
| 35 to 44 Years | 88 (5.5%) | 156 (10.3%) |
| 45 to 54 Years | 85 (5.2%) | 178 (10.9%) |
| 55 to 64 Years | 62 (3.1%) | 134 (7.0%) |
| 65 to 74 Years | 55 (4.1%) | 154 (12.1%) |
| 75 Years and over | 101 (11.8%) | 271 (23.6%) |
| Total | 772 (6.1%) | 1,317 (10.6%) |
Income Above Poverty by Sex and Age in Benton County
According to the poverty statistics in Benton County, males aged 5 years and females aged 12 to 14 years are the age groups that are most secure financially, with 100.0% of males and 98.2% of females in these age groups living above the poverty line.
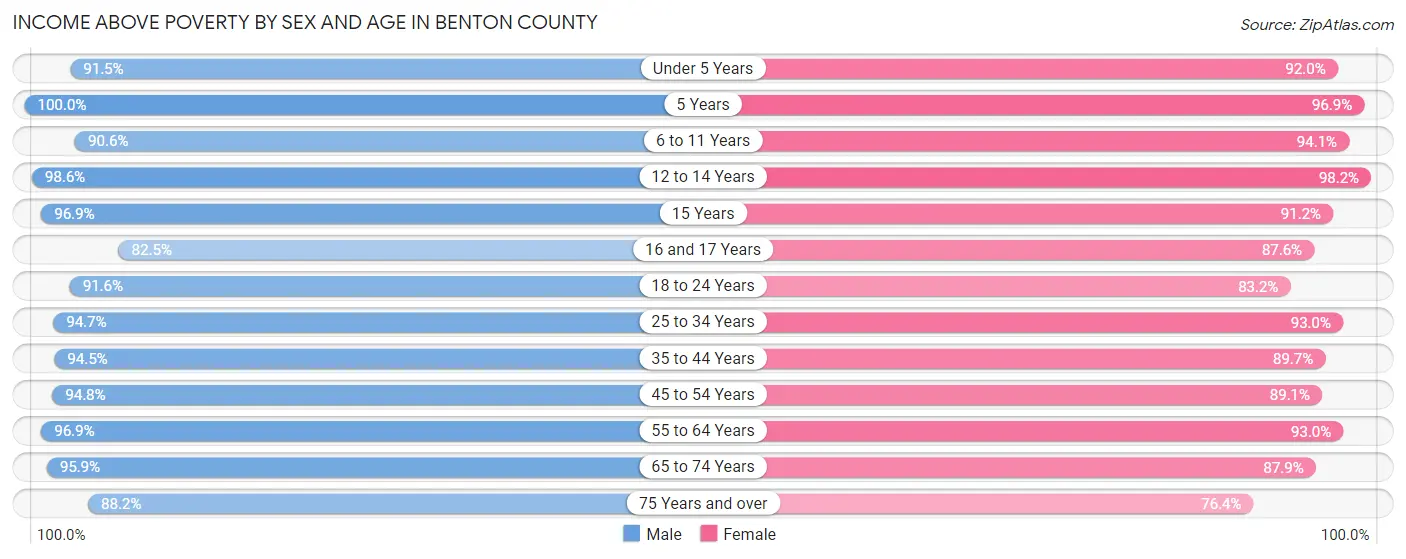
| Age Bracket | Male | Female |
| Under 5 Years | 667 (91.5%) | 657 (92.0%) |
| 5 Years | 63 (100.0%) | 158 (96.9%) |
| 6 to 11 Years | 888 (90.6%) | 865 (94.1%) |
| 12 to 14 Years | 579 (98.6%) | 440 (98.2%) |
| 15 Years | 219 (96.9%) | 175 (91.1%) |
| 16 and 17 Years | 260 (82.5%) | 326 (87.6%) |
| 18 to 24 Years | 894 (91.6%) | 729 (83.2%) |
| 25 to 34 Years | 1,332 (94.7%) | 1,193 (93.0%) |
| 35 to 44 Years | 1,501 (94.5%) | 1,359 (89.7%) |
| 45 to 54 Years | 1,562 (94.8%) | 1,455 (89.1%) |
| 55 to 64 Years | 1,940 (96.9%) | 1,790 (93.0%) |
| 65 to 74 Years | 1,279 (95.9%) | 1,123 (87.9%) |
| 75 Years and over | 755 (88.2%) | 877 (76.4%) |
| Total | 11,939 (93.9%) | 11,147 (89.4%) |
Income Below Poverty Among Married-Couple Families in Benton County
The poverty statistics for married-couple families in Benton County show that 2.8% or 163 of the total 5,843 families live below the poverty line. Families with 5 or more children have the highest poverty rate of 13.4%, comprising of 9 families. On the other hand, families with 1 or 2 children have the lowest poverty rate of 0.1%, which includes 2 families.
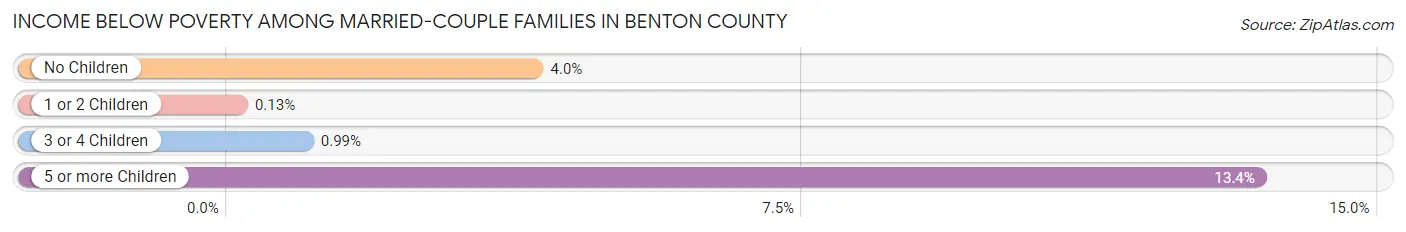
| Children | Above Poverty | Below Poverty |
| No Children | 3,541 (96.0%) | 147 (4.0%) |
| 1 or 2 Children | 1,582 (99.9%) | 2 (0.1%) |
| 3 or 4 Children | 499 (99.0%) | 5 (1.0%) |
| 5 or more Children | 58 (86.6%) | 9 (13.4%) |
| Total | 5,680 (97.2%) | 163 (2.8%) |
Income Below Poverty Among Single-Parent Households in Benton County
According to the poverty data in Benton County, 5.7% or 26 single-father households and 17.9% or 107 single-mother households are living below the poverty line. Among single-father households, those with no children have the highest poverty rate, with 16 households (25.4%) experiencing poverty. Likewise, among single-mother households, those with 3 or 4 children have the highest poverty rate, with 45 households (60.0%) falling below the poverty line.
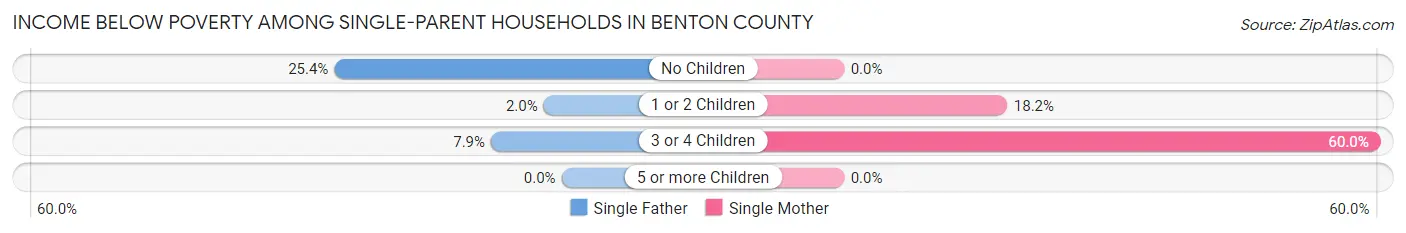
| Children | Single Father | Single Mother |
| No Children | 16 (25.4%) | 0 (0.0%) |
| 1 or 2 Children | 7 (2.0%) | 62 (18.2%) |
| 3 or 4 Children | 3 (7.9%) | 45 (60.0%) |
| 5 or more Children | 0 (0.0%) | 0 (0.0%) |
| Total | 26 (5.7%) | 107 (17.9%) |
Income Below Poverty Among Married-Couple vs Single-Parent Households in Benton County
The poverty data for Benton County shows that 163 of the married-couple family households (2.8%) and 133 of the single-parent households (12.6%) are living below the poverty level. Within the married-couple family households, those with 5 or more children have the highest poverty rate, with 9 households (13.4%) falling below the poverty line. Among the single-parent households, those with 3 or 4 children have the highest poverty rate, with 48 household (42.5%) living below poverty.
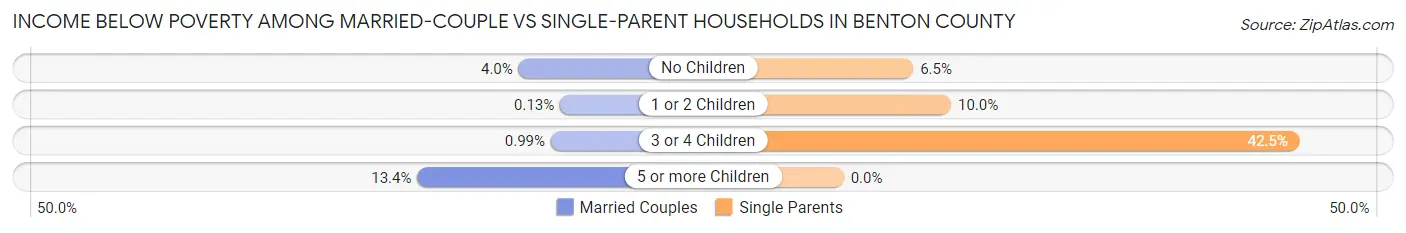
| Children | Married-Couple Families | Single-Parent Households |
| No Children | 147 (4.0%) | 16 (6.5%) |
| 1 or 2 Children | 2 (0.1%) | 69 (10.0%) |
| 3 or 4 Children | 5 (1.0%) | 48 (42.5%) |
| 5 or more Children | 9 (13.4%) | 0 (0.0%) |
| Total | 163 (2.8%) | 133 (12.6%) |
Race in Benton County
The most populous races in Benton County are White / Caucasian (24,514 | 95.6%), Two or more Races (672 | 2.6%), and Hispanic or Latino (442 | 1.7%).
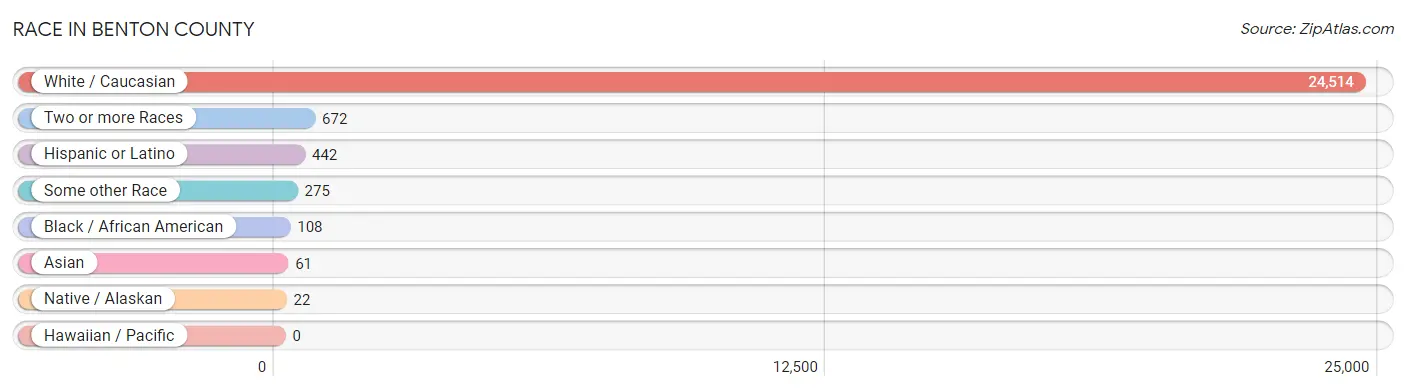
| Race | # Population | % Population |
| Asian | 61 | 0.2% |
| Black / African American | 108 | 0.4% |
| Hawaiian / Pacific | 0 | 0.0% |
| Hispanic or Latino | 442 | 1.7% |
| Native / Alaskan | 22 | 0.1% |
| White / Caucasian | 24,514 | 95.6% |
| Two or more Races | 672 | 2.6% |
| Some other Race | 275 | 1.1% |
| Total | 25,652 | 100.0% |
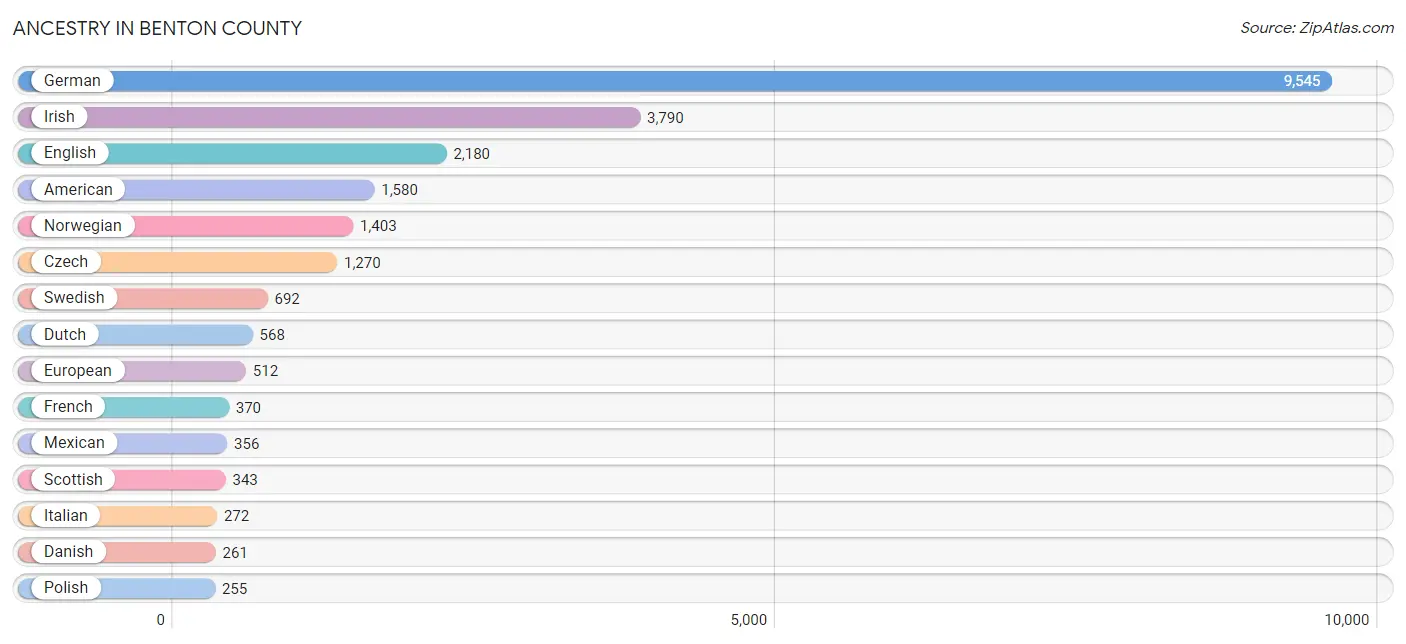
Ancestry in Benton County
The most populous ancestries reported in Benton County are German (9,545 | 37.2%), Irish (3,790 | 14.8%), English (2,180 | 8.5%), American (1,580 | 6.2%), and Norwegian (1,403 | 5.5%), together accounting for 72.1% of all Benton County residents.
| Ancestry | # Population | % Population |
| African | 10 | 0.0% |
| American | 1,580 | 6.2% |
| Apache | 8 | 0.0% |
| Austrian | 9 | 0.0% |
| Belgian | 104 | 0.4% |
| Belizean | 26 | 0.1% |
| Blackfeet | 3 | 0.0% |
| British | 146 | 0.6% |
| Burmese | 28 | 0.1% |
| Canadian | 9 | 0.0% |
| Celtic | 5 | 0.0% |
| Central American | 26 | 0.1% |
| Cherokee | 23 | 0.1% |
| Chippewa | 4 | 0.0% |
| Choctaw | 9 | 0.0% |
| Croatian | 2 | 0.0% |
| Czech | 1,270 | 5.0% |
| Czechoslovakian | 76 | 0.3% |
| Danish | 261 | 1.0% |
| Dutch | 568 | 2.2% |
| English | 2,180 | 8.5% |
| European | 512 | 2.0% |
| Finnish | 196 | 0.8% |
| French | 370 | 1.4% |
| French Canadian | 42 | 0.2% |
| German | 9,545 | 37.2% |
| Ghanaian | 82 | 0.3% |
| Greek | 7 | 0.0% |
| Guamanian / Chamorro | 3 | 0.0% |
| Guatemalan | 1 | 0.0% |
| Honduran | 7 | 0.0% |
| Hungarian | 9 | 0.0% |
| Indian (Asian) | 11 | 0.0% |
| Irish | 3,790 | 14.8% |
| Iroquois | 8 | 0.0% |
| Italian | 272 | 1.1% |
| Korean | 13 | 0.1% |
| Latvian | 13 | 0.1% |
| Lithuanian | 18 | 0.1% |
| Luxembourger | 8 | 0.0% |
| Malaysian | 10 | 0.0% |
| Mexican | 356 | 1.4% |
| Navajo | 1 | 0.0% |
| Northern European | 48 | 0.2% |
| Norwegian | 1,403 | 5.5% |
| Paiute | 3 | 0.0% |
| Pakistani | 1 | 0.0% |
| Pennsylvania German | 22 | 0.1% |
| Polish | 255 | 1.0% |
| Potawatomi | 1 | 0.0% |
| Puerto Rican | 14 | 0.1% |
| Romanian | 2 | 0.0% |
| Russian | 67 | 0.3% |
| Salvadoran | 18 | 0.1% |
| Scandinavian | 29 | 0.1% |
| Scotch-Irish | 151 | 0.6% |
| Scottish | 343 | 1.3% |
| Sioux | 10 | 0.0% |
| Slovak | 41 | 0.2% |
| Slovene | 55 | 0.2% |
| Spaniard | 5 | 0.0% |
| Sri Lankan | 13 | 0.1% |
| Subsaharan African | 92 | 0.4% |
| Swedish | 692 | 2.7% |
| Swiss | 101 | 0.4% |
| Thai | 41 | 0.2% |
| Welsh | 113 | 0.4% | View All 67 Rows |
Immigrants in Benton County
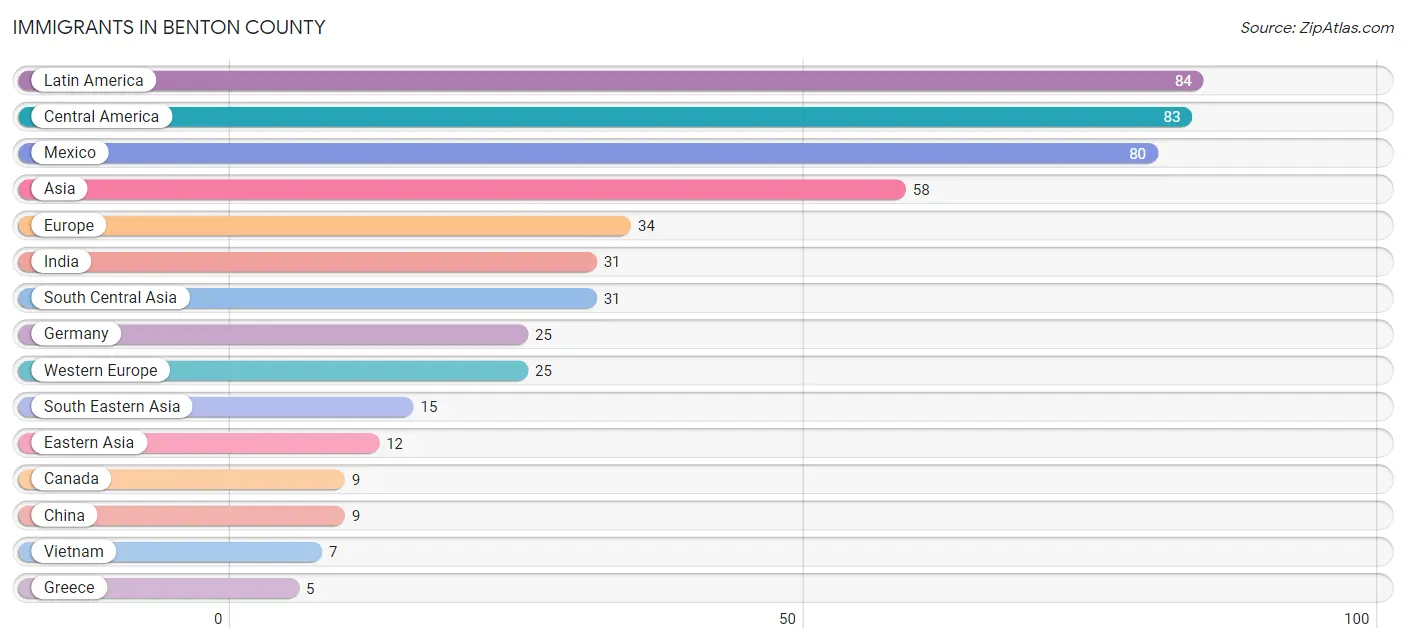
The most numerous immigrant groups reported in Benton County came from Latin America (84 | 0.3%), Central America (83 | 0.3%), Mexico (80 | 0.3%), Asia (58 | 0.2%), and Europe (34 | 0.1%), together accounting for 1.3% of all Benton County residents.
| Immigration Origin | # Population | % Population |
| Asia | 58 | 0.2% |
| Belize | 2 | 0.0% |
| Canada | 9 | 0.0% |
| Caribbean | 1 | 0.0% |
| Central America | 83 | 0.3% |
| China | 9 | 0.0% |
| Eastern Asia | 12 | 0.1% |
| England | 1 | 0.0% |
| Europe | 34 | 0.1% |
| Germany | 25 | 0.1% |
| Greece | 5 | 0.0% |
| Guatemala | 1 | 0.0% |
| India | 31 | 0.1% |
| Korea | 3 | 0.0% |
| Laos | 3 | 0.0% |
| Latin America | 84 | 0.3% |
| Mexico | 80 | 0.3% |
| Northern Europe | 4 | 0.0% |
| Philippines | 4 | 0.0% |
| Scotland | 3 | 0.0% |
| South Central Asia | 31 | 0.1% |
| South Eastern Asia | 15 | 0.1% |
| Southern Europe | 5 | 0.0% |
| St. Vincent and the Grenadines | 1 | 0.0% |
| Thailand | 1 | 0.0% |
| Vietnam | 7 | 0.0% |
| Western Europe | 25 | 0.1% | View All 27 Rows |
Sex and Age in Benton County
Sex and Age in Benton County
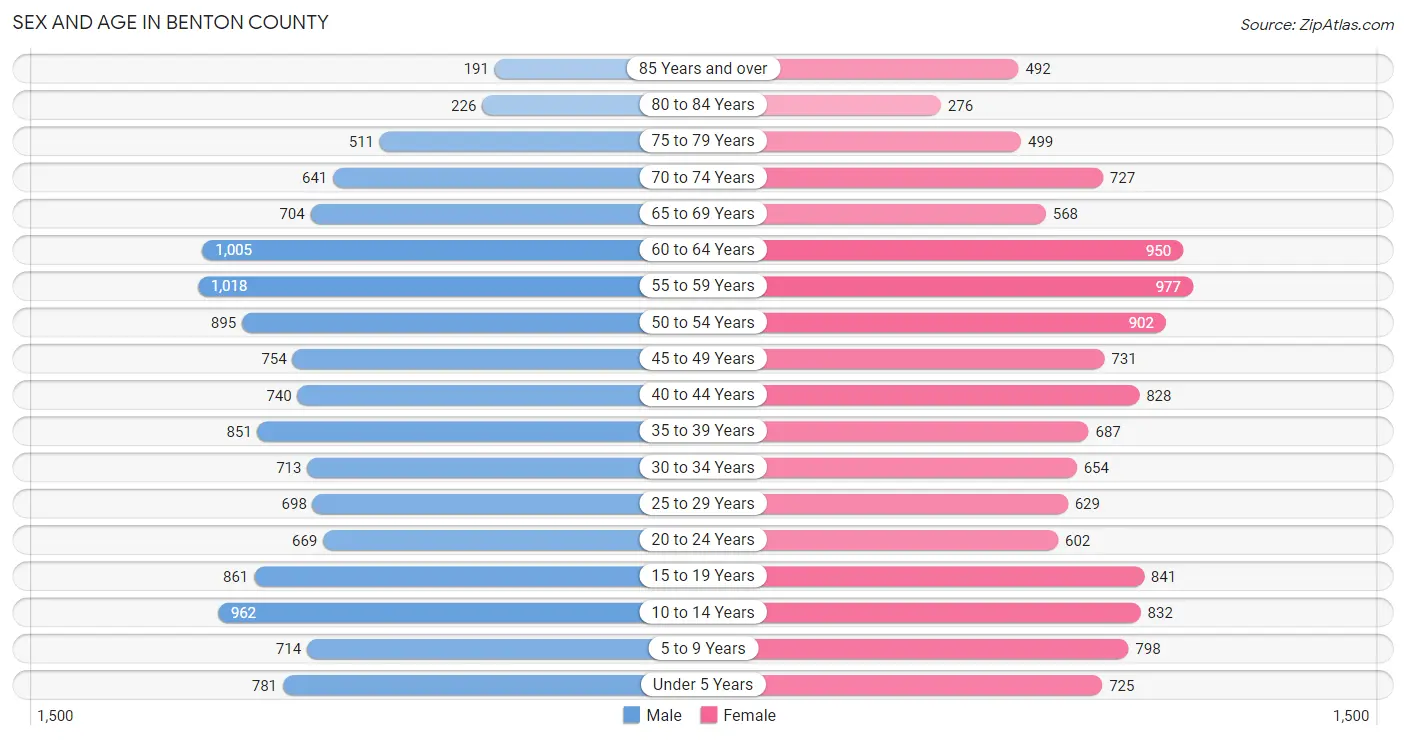
The most populous age groups in Benton County are 55 to 59 Years (1,018 | 7.9%) for men and 55 to 59 Years (977 | 7.7%) for women.
| Age Bracket | Male | Female |
| Under 5 Years | 781 (6.0%) | 725 (5.7%) |
| 5 to 9 Years | 714 (5.5%) | 798 (6.3%) |
| 10 to 14 Years | 962 (7.4%) | 832 (6.5%) |
| 15 to 19 Years | 861 (6.7%) | 841 (6.6%) |
| 20 to 24 Years | 669 (5.2%) | 602 (4.7%) |
| 25 to 29 Years | 698 (5.4%) | 629 (5.0%) |
| 30 to 34 Years | 713 (5.5%) | 654 (5.1%) |
| 35 to 39 Years | 851 (6.6%) | 687 (5.4%) |
| 40 to 44 Years | 740 (5.7%) | 828 (6.5%) |
| 45 to 49 Years | 754 (5.8%) | 731 (5.8%) |
| 50 to 54 Years | 895 (6.9%) | 902 (7.1%) |
| 55 to 59 Years | 1,018 (7.9%) | 977 (7.7%) |
| 60 to 64 Years | 1,005 (7.8%) | 950 (7.5%) |
| 65 to 69 Years | 704 (5.4%) | 568 (4.5%) |
| 70 to 74 Years | 641 (5.0%) | 727 (5.7%) |
| 75 to 79 Years | 511 (4.0%) | 499 (3.9%) |
| 80 to 84 Years | 226 (1.8%) | 276 (2.2%) |
| 85 Years and over | 191 (1.5%) | 492 (3.9%) |
| Total | 12,934 (100.0%) | 12,718 (100.0%) |
Families and Households in Benton County
Median Family Size in Benton County
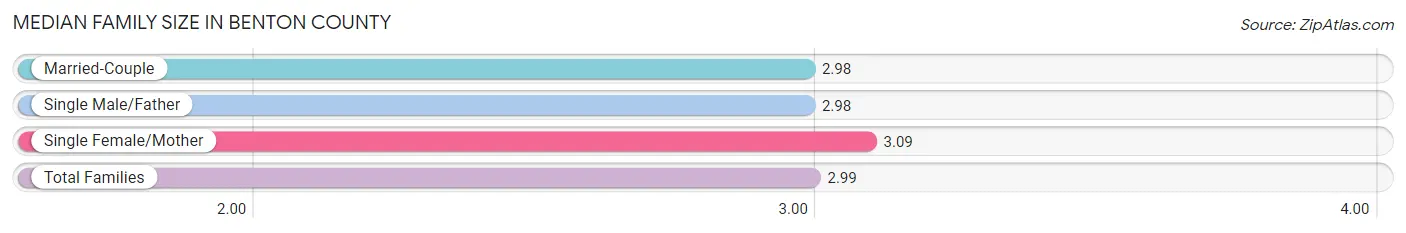
The median family size in Benton County is 2.99 persons per family, with single female/mother families (599 | 8.7%) accounting for the largest median family size of 3.09 persons per family. On the other hand, married-couple families (5,843 | 84.7%) represent the smallest median family size with 2.98 persons per family.
| Family Type | # Families | Family Size |
| Married-Couple | 5,843 (84.7%) | 2.98 |
| Single Male/Father | 455 (6.6%) | 2.98 |
| Single Female/Mother | 599 (8.7%) | 3.09 |
| Total Families | 6,897 (100.0%) | 2.99 |
Median Household Size in Benton County
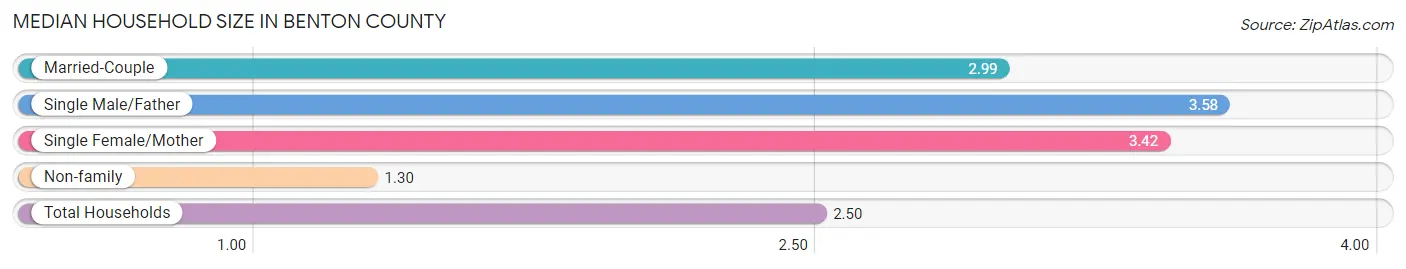
The median household size in Benton County is 2.50 persons per household, with single male/father households (455 | 4.5%) accounting for the largest median household size of 3.58 persons per household. non-family households (3,217 | 31.8%) represent the smallest median household size with 1.30 persons per household.
| Household Type | # Households | Household Size |
| Married-Couple | 5,843 (57.8%) | 2.99 |
| Single Male/Father | 455 (4.5%) | 3.58 |
| Single Female/Mother | 599 (5.9%) | 3.42 |
| Non-family | 3,217 (31.8%) | 1.30 |
| Total Households | 10,114 (100.0%) | 2.50 |
Household Size by Marriage Status in Benton County
Out of a total of 10,114 households in Benton County, 6,897 (68.2%) are family households, while 3,217 (31.8%) are nonfamily households. The most numerous type of family households are 2-person households, comprising 3,770, and the most common type of nonfamily households are 1-person households, comprising 2,583.
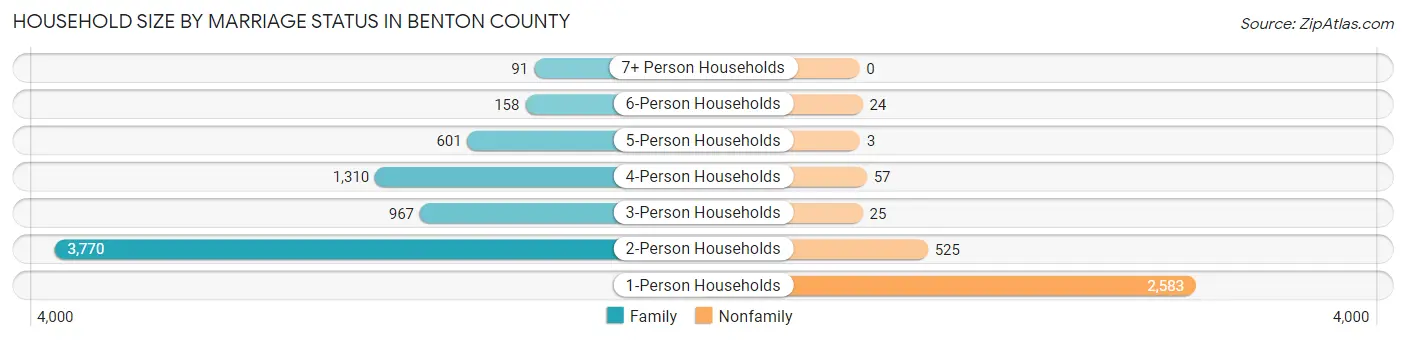
| Household Size | Family Households | Nonfamily Households |
| 1-Person Households | - | 2,583 (25.5%) |
| 2-Person Households | 3,770 (37.3%) | 525 (5.2%) |
| 3-Person Households | 967 (9.6%) | 25 (0.3%) |
| 4-Person Households | 1,310 (13.0%) | 57 (0.6%) |
| 5-Person Households | 601 (5.9%) | 3 (0.0%) |
| 6-Person Households | 158 (1.6%) | 24 (0.2%) |
| 7+ Person Households | 91 (0.9%) | 0 (0.0%) |
| Total | 6,897 (68.2%) | 3,217 (31.8%) |
Female Fertility in Benton County
Fertility by Age in Benton County
Average fertility rate in Benton County is 48.0 births per 1,000 women. Women in the age bracket of 20 to 34 years have the highest fertility rate with 105.0 births per 1,000 women. Women in the age bracket of 20 to 34 years acount for 79.5% of all women with births.
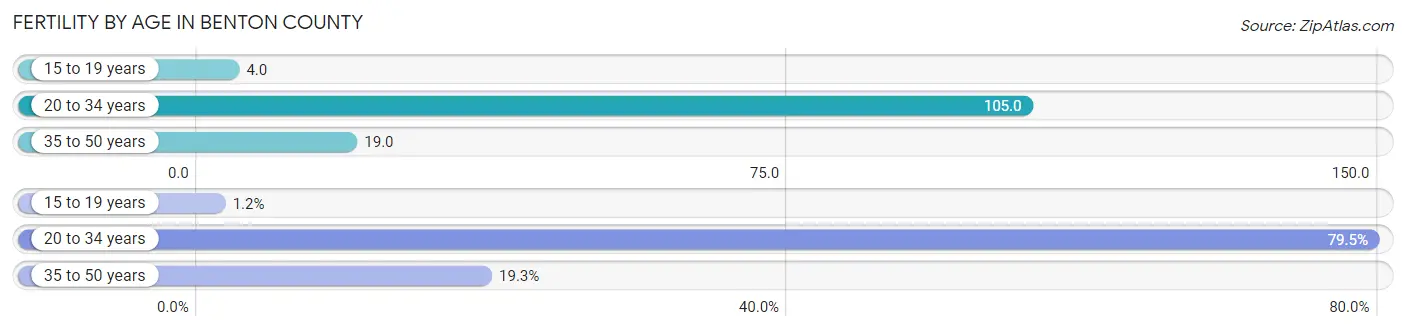
| Age Bracket | Women with Births | Births / 1,000 Women |
| 15 to 19 years | 3 (1.2%) | 4.0 |
| 20 to 34 years | 198 (79.5%) | 105.0 |
| 35 to 50 years | 48 (19.3%) | 19.0 |
| Total | 249 (100.0%) | 48.0 |
Fertility by Age by Marriage Status in Benton County
84.7% of women with births (249) in Benton County are married. The highest percentage of unmarried women with births falls into 15 to 19 years age bracket with 100.0% of them unmarried at the time of birth, while the lowest percentage of unmarried women with births belong to 20 to 34 years age bracket with 8.6% of them unmarried.
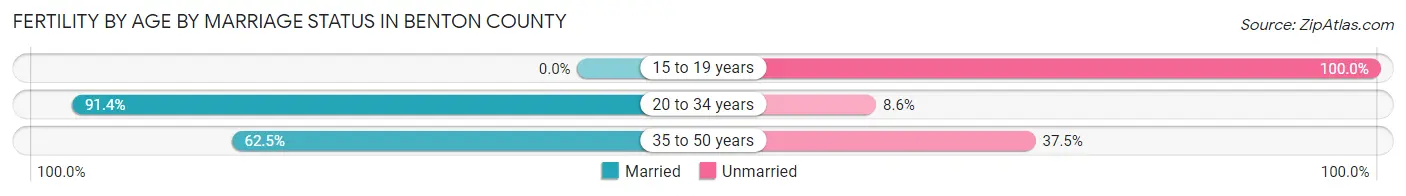
| Age Bracket | Married | Unmarried |
| 15 to 19 years | 0 (0.0%) | 3 (100.0%) |
| 20 to 34 years | 181 (91.4%) | 17 (8.6%) |
| 35 to 50 years | 30 (62.5%) | 18 (37.5%) |
| Total | 211 (84.7%) | 38 (15.3%) |
Fertility by Education in Benton County
Average fertility rate in Benton County is 48.0 births per 1,000 women. Women with the education attainment of graduate degree have the highest fertility rate of 77.0 births per 1,000 women, while women with the education attainment of less than high school have the lowest fertility at 16.0 births per 1,000 women. Women with the education attainment of college or associate's degree represent 45.0% of all women with births.
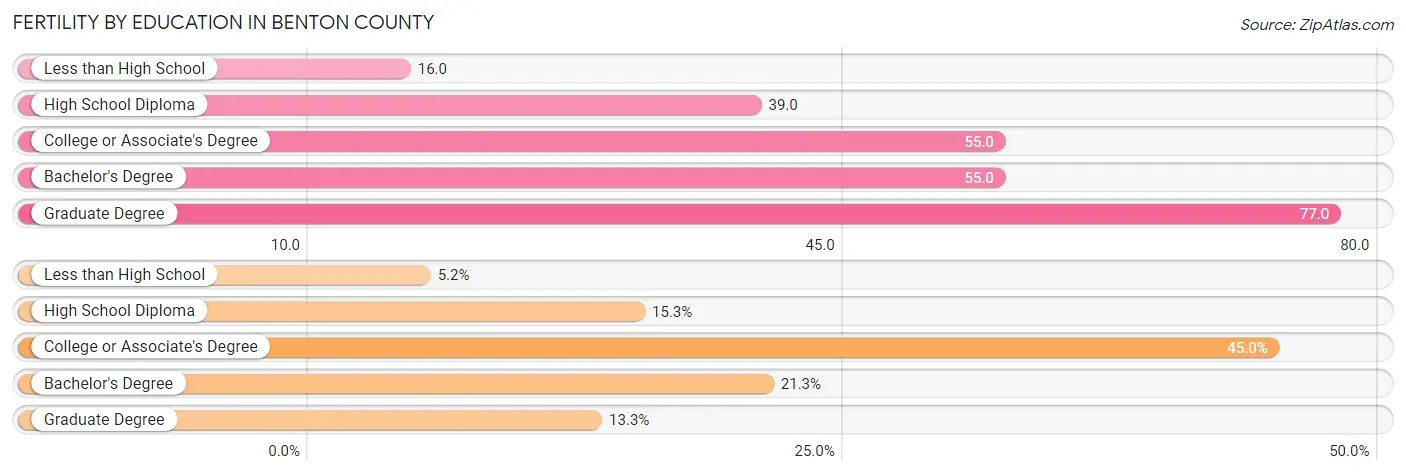
| Educational Attainment | Women with Births | Births / 1,000 Women |
| Less than High School | 13 (5.2%) | 16.0 |
| High School Diploma | 38 (15.3%) | 39.0 |
| College or Associate's Degree | 112 (45.0%) | 55.0 |
| Bachelor's Degree | 53 (21.3%) | 55.0 |
| Graduate Degree | 33 (13.3%) | 77.0 |
| Total | 249 (100.0%) | 48.0 |
Fertility by Education by Marriage Status in Benton County
15.3% of women with births in Benton County are unmarried. Women with the educational attainment of less than high school are most likely to be married with 100.0% of them married at childbirth, while women with the educational attainment of high school diploma are least likely to be married with 55.3% of them unmarried at childbirth.
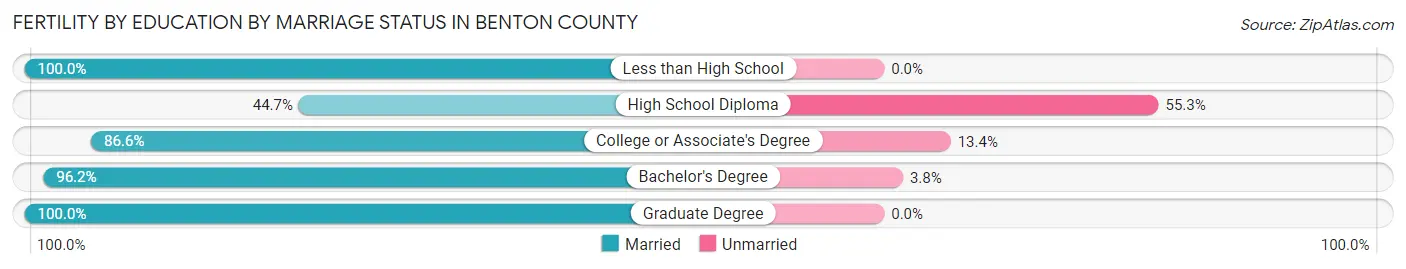
| Educational Attainment | Married | Unmarried |
| Less than High School | 13 (100.0%) | 0 (0.0%) |
| High School Diploma | 17 (44.7%) | 21 (55.3%) |
| College or Associate's Degree | 97 (86.6%) | 15 (13.4%) |
| Bachelor's Degree | 51 (96.2%) | 2 (3.8%) |
| Graduate Degree | 33 (100.0%) | 0 (0.0%) |
| Total | 211 (84.7%) | 38 (15.3%) |
Employment Characteristics in Benton County
Employment by Class of Employer in Benton County
Among the 13,111 employed individuals in Benton County, private company employees (8,937 | 68.2%), local government employees (1,247 | 9.5%), and not-for-profit organizations (892 | 6.8%) make up the most common classes of employment.
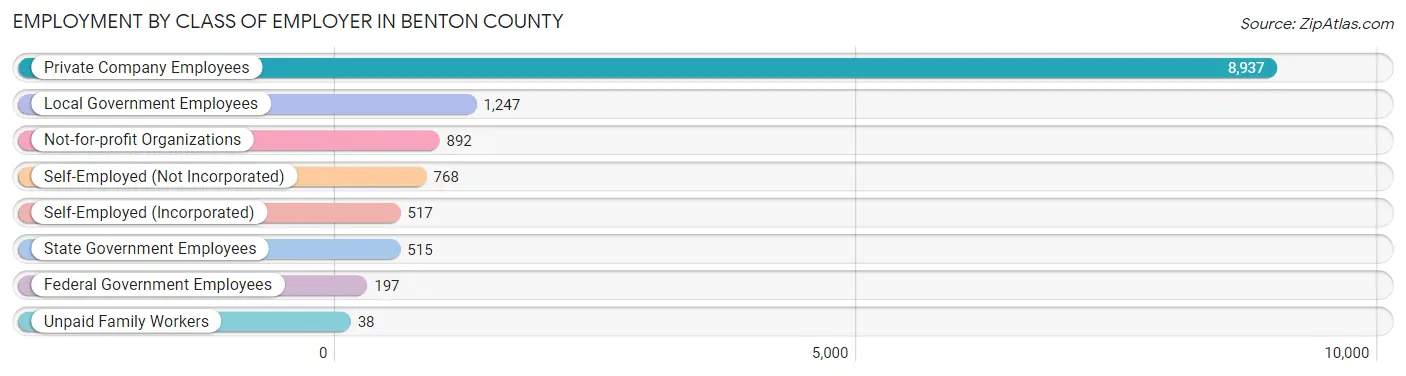
| Employer Class | # Employees | % Employees |
| Private Company Employees | 8,937 | 68.2% |
| Self-Employed (Incorporated) | 517 | 3.9% |
| Self-Employed (Not Incorporated) | 768 | 5.9% |
| Not-for-profit Organizations | 892 | 6.8% |
| Local Government Employees | 1,247 | 9.5% |
| State Government Employees | 515 | 3.9% |
| Federal Government Employees | 197 | 1.5% |
| Unpaid Family Workers | 38 | 0.3% |
| Total | 13,111 | 100.0% |
Employment Status by Age in Benton County
According to the labor force statistics for Benton County, out of the total population over 16 years of age (20,422), 66.2% or 13,519 individuals are in the labor force, with 2.3% or 311 of them unemployed. The age group with the highest labor force participation rate is 30 to 34 years, with 90.6% or 1,239 individuals in the labor force. Within the labor force, the 20 to 24 years age range has the highest percentage of unemployed individuals, with 5.8% or 61 of them being unemployed.
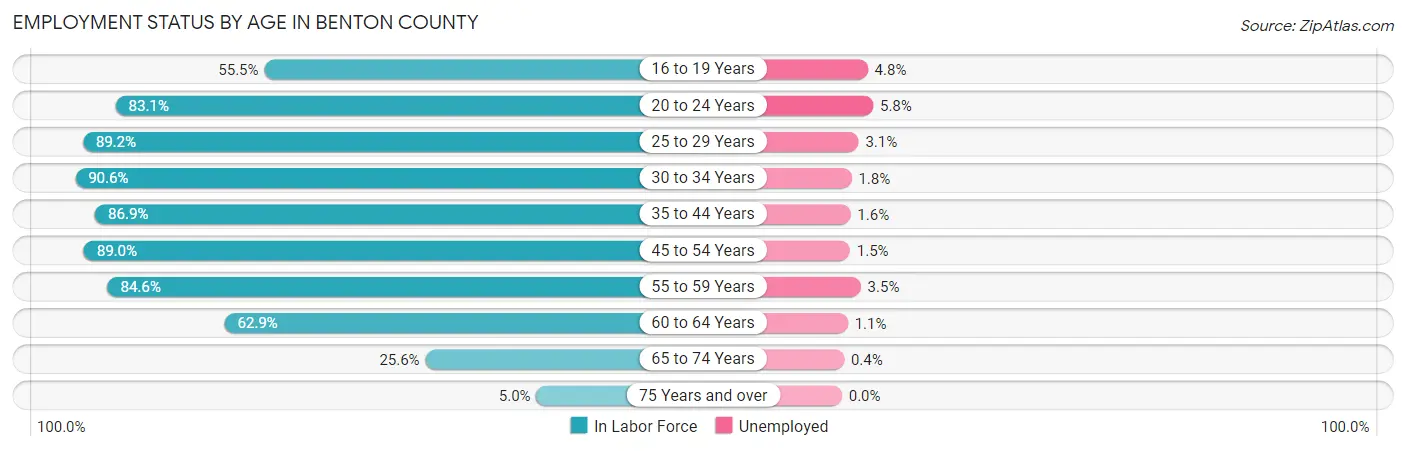
| Age Bracket | In Labor Force | Unemployed |
| 16 to 19 Years | 713 (55.5%) | 34 (4.8%) |
| 20 to 24 Years | 1,056 (83.1%) | 61 (5.8%) |
| 25 to 29 Years | 1,184 (89.2%) | 37 (3.1%) |
| 30 to 34 Years | 1,239 (90.6%) | 22 (1.8%) |
| 35 to 44 Years | 2,699 (86.9%) | 43 (1.6%) |
| 45 to 54 Years | 2,921 (89.0%) | 44 (1.5%) |
| 55 to 59 Years | 1,688 (84.6%) | 59 (3.5%) |
| 60 to 64 Years | 1,230 (62.9%) | 14 (1.1%) |
| 65 to 74 Years | 676 (25.6%) | 3 (0.4%) |
| 75 Years and over | 110 (5.0%) | 0 (0.0%) |
| Total | 13,519 (66.2%) | 311 (2.3%) |
Employment Status by Educational Attainment in Benton County
According to labor force statistics for Benton County, 84.1% of individuals (10,960) out of the total population between 25 and 64 years of age (13,032) are in the labor force, with 2.0% or 219 of them being unemployed. The group with the highest labor force participation rate are those with the educational attainment of bachelor's degree or higher, with 92.5% or 2,984 individuals in the labor force. Within the labor force, individuals with high school diploma education have the highest percentage of unemployment, with 3.8% or 114 of them being unemployed.
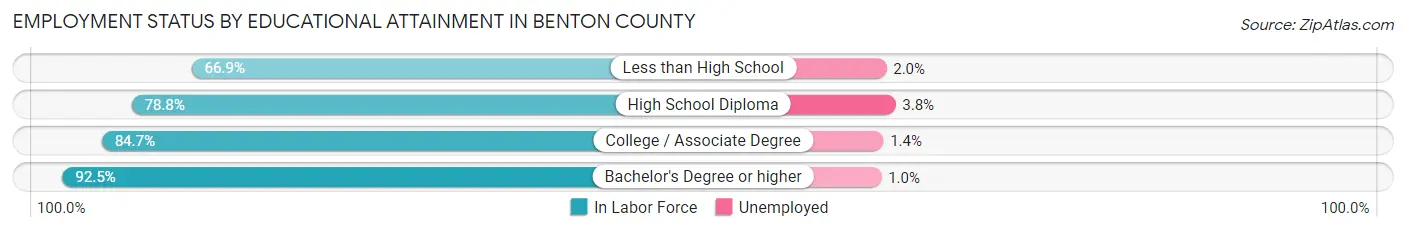
| Educational Attainment | In Labor Force | Unemployed |
| Less than High School | 394 (66.9%) | 12 (2.0%) |
| High School Diploma | 3,013 (78.8%) | 145 (3.8%) |
| College / Associate Degree | 4,568 (84.7%) | 76 (1.4%) |
| Bachelor's Degree or higher | 2,984 (92.5%) | 32 (1.0%) |
| Total | 10,960 (84.1%) | 261 (2.0%) |
Employment Occupations by Sex in Benton County
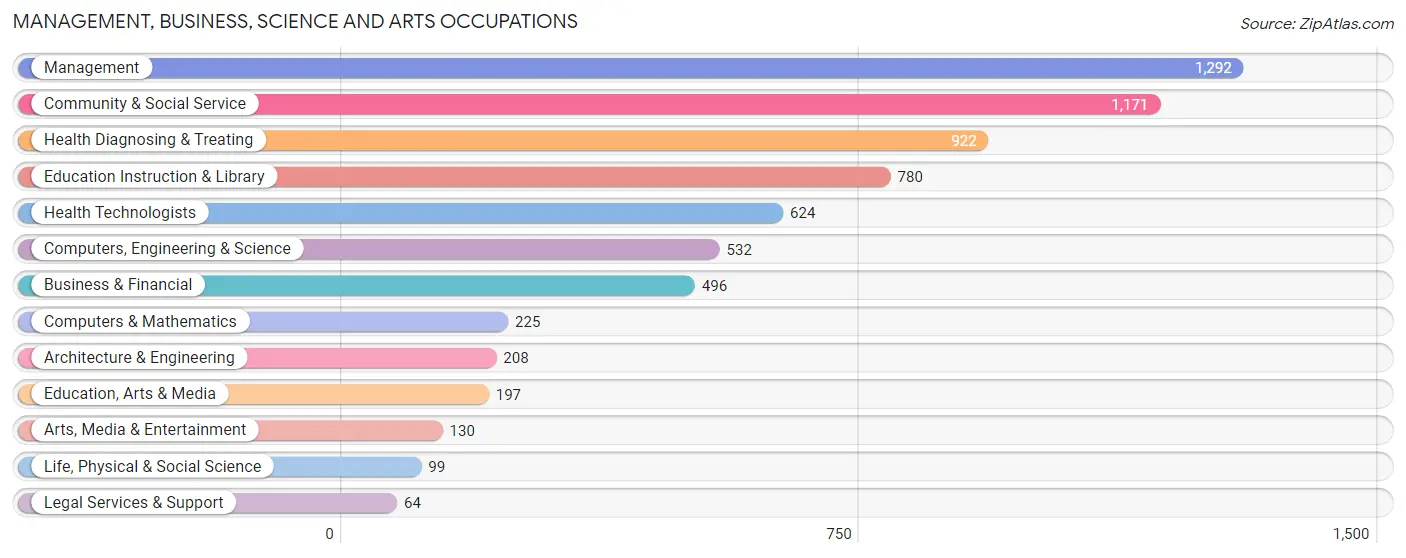
Management, Business, Science and Arts Occupations
The most common Management, Business, Science and Arts occupations in Benton County are Management (1,292 | 9.8%), Community & Social Service (1,171 | 8.9%), Health Diagnosing & Treating (922 | 7.0%), Education Instruction & Library (780 | 5.9%), and Health Technologists (624 | 4.7%).
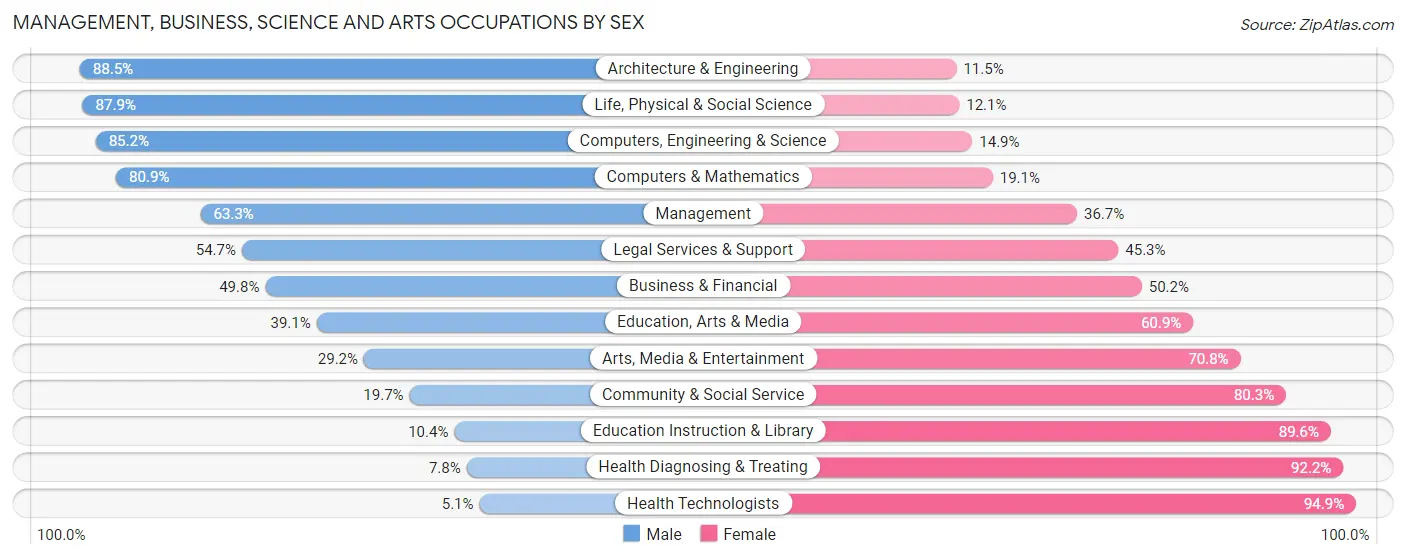
Management, Business, Science and Arts Occupations by Sex
Within the Management, Business, Science and Arts occupations in Benton County, the most male-oriented occupations are Architecture & Engineering (88.5%), Life, Physical & Social Science (87.9%), and Computers, Engineering & Science (85.2%), while the most female-oriented occupations are Health Technologists (94.9%), Health Diagnosing & Treating (92.2%), and Education Instruction & Library (89.6%).
| Occupation | Male | Female |
| Management | 818 (63.3%) | 474 (36.7%) |
| Business & Financial | 247 (49.8%) | 249 (50.2%) |
| Computers, Engineering & Science | 453 (85.2%) | 79 (14.8%) |
| Computers & Mathematics | 182 (80.9%) | 43 (19.1%) |
| Architecture & Engineering | 184 (88.5%) | 24 (11.5%) |
| Life, Physical & Social Science | 87 (87.9%) | 12 (12.1%) |
| Community & Social Service | 231 (19.7%) | 940 (80.3%) |
| Education, Arts & Media | 77 (39.1%) | 120 (60.9%) |
| Legal Services & Support | 35 (54.7%) | 29 (45.3%) |
| Education Instruction & Library | 81 (10.4%) | 699 (89.6%) |
| Arts, Media & Entertainment | 38 (29.2%) | 92 (70.8%) |
| Health Diagnosing & Treating | 72 (7.8%) | 850 (92.2%) |
| Health Technologists | 32 (5.1%) | 592 (94.9%) |
| Total (Category) | 1,821 (41.3%) | 2,592 (58.7%) |
| Total (Overall) | 7,325 (55.5%) | 5,869 (44.5%) |
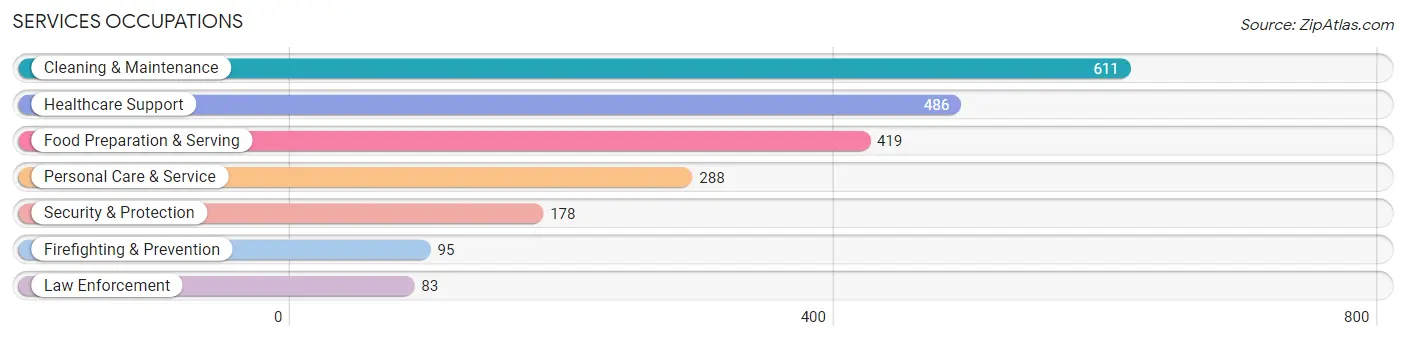
Services Occupations
The most common Services occupations in Benton County are Cleaning & Maintenance (611 | 4.6%), Healthcare Support (486 | 3.7%), Food Preparation & Serving (419 | 3.2%), Personal Care & Service (288 | 2.2%), and Security & Protection (178 | 1.3%).
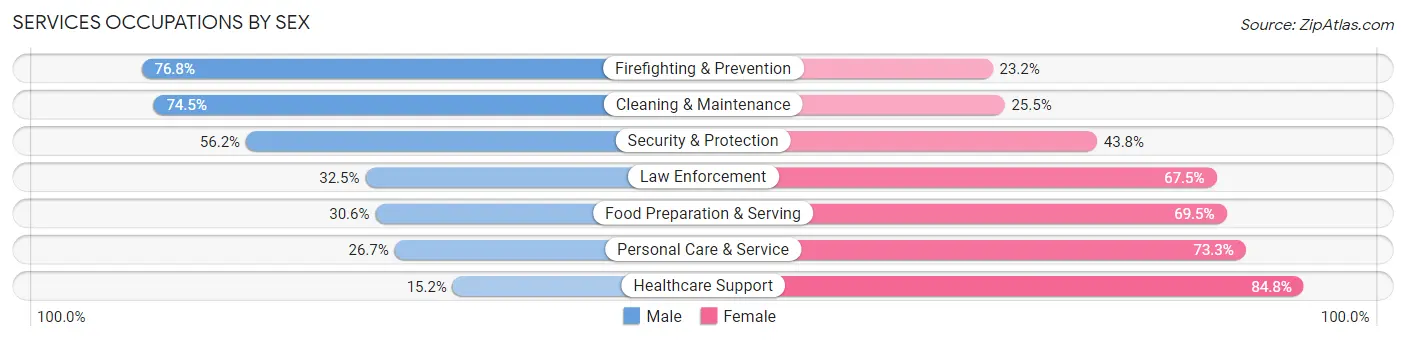
Services Occupations by Sex
Within the Services occupations in Benton County, the most male-oriented occupations are Firefighting & Prevention (76.8%), Cleaning & Maintenance (74.5%), and Security & Protection (56.2%), while the most female-oriented occupations are Healthcare Support (84.8%), Personal Care & Service (73.3%), and Food Preparation & Serving (69.5%).
| Occupation | Male | Female |
| Healthcare Support | 74 (15.2%) | 412 (84.8%) |
| Security & Protection | 100 (56.2%) | 78 (43.8%) |
| Firefighting & Prevention | 73 (76.8%) | 22 (23.2%) |
| Law Enforcement | 27 (32.5%) | 56 (67.5%) |
| Food Preparation & Serving | 128 (30.5%) | 291 (69.5%) |
| Cleaning & Maintenance | 455 (74.5%) | 156 (25.5%) |
| Personal Care & Service | 77 (26.7%) | 211 (73.3%) |
| Total (Category) | 834 (42.1%) | 1,148 (57.9%) |
| Total (Overall) | 7,325 (55.5%) | 5,869 (44.5%) |
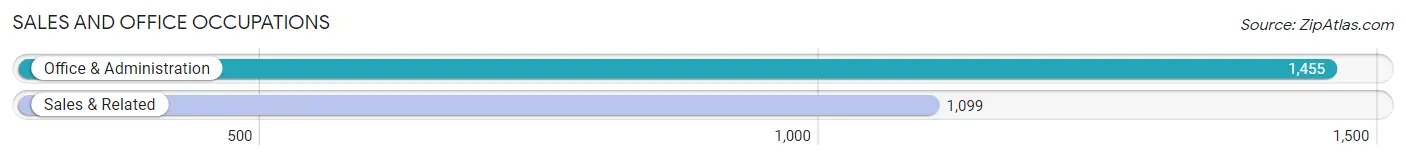
Sales and Office Occupations
The most common Sales and Office occupations in Benton County are Office & Administration (1,455 | 11.0%), and Sales & Related (1,099 | 8.3%).
Sales and Office Occupations by Sex
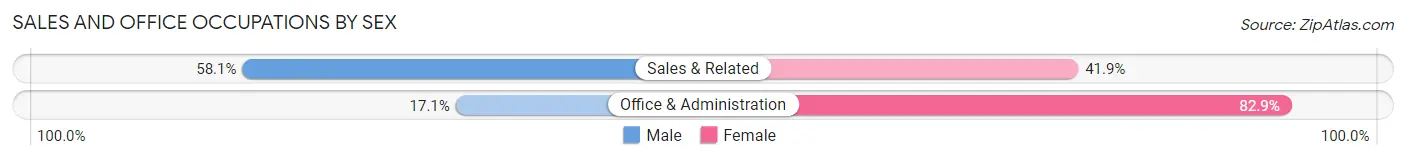
| Occupation | Male | Female |
| Sales & Related | 639 (58.1%) | 460 (41.9%) |
| Office & Administration | 249 (17.1%) | 1,206 (82.9%) |
| Total (Category) | 888 (34.8%) | 1,666 (65.2%) |
| Total (Overall) | 7,325 (55.5%) | 5,869 (44.5%) |
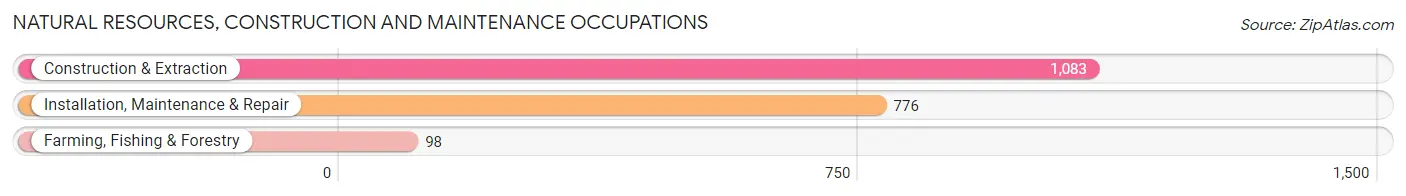
Natural Resources, Construction and Maintenance Occupations
The most common Natural Resources, Construction and Maintenance occupations in Benton County are Construction & Extraction (1,083 | 8.2%), Installation, Maintenance & Repair (776 | 5.9%), and Farming, Fishing & Forestry (98 | 0.7%).
Natural Resources, Construction and Maintenance Occupations by Sex
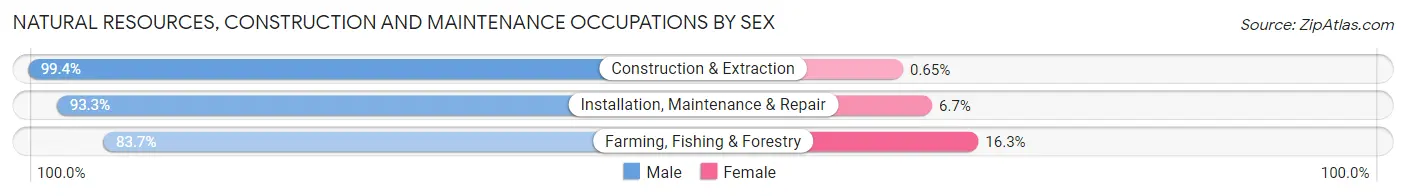
| Occupation | Male | Female |
| Farming, Fishing & Forestry | 82 (83.7%) | 16 (16.3%) |
| Construction & Extraction | 1,076 (99.4%) | 7 (0.6%) |
| Installation, Maintenance & Repair | 724 (93.3%) | 52 (6.7%) |
| Total (Category) | 1,882 (96.2%) | 75 (3.8%) |
| Total (Overall) | 7,325 (55.5%) | 5,869 (44.5%) |
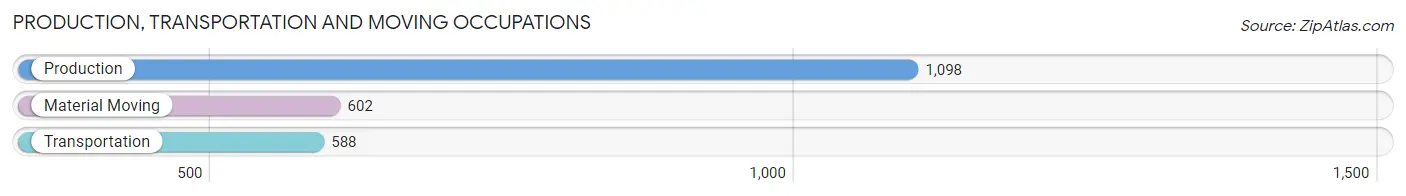
Production, Transportation and Moving Occupations
The most common Production, Transportation and Moving occupations in Benton County are Production (1,098 | 8.3%), Material Moving (602 | 4.6%), and Transportation (588 | 4.5%).
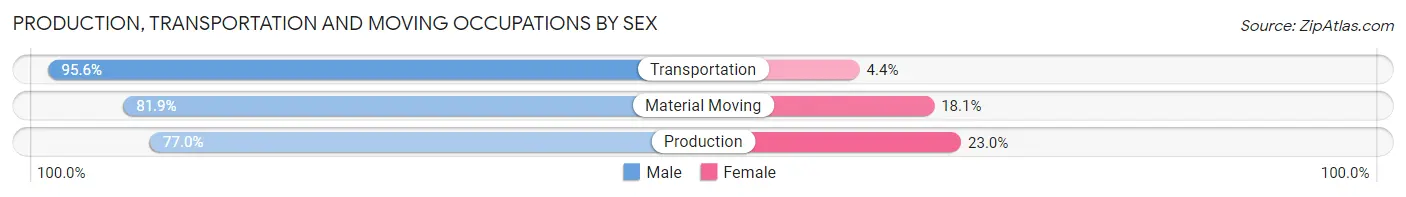
Production, Transportation and Moving Occupations by Sex
| Occupation | Male | Female |
| Production | 845 (77.0%) | 253 (23.0%) |
| Transportation | 562 (95.6%) | 26 (4.4%) |
| Material Moving | 493 (81.9%) | 109 (18.1%) |
| Total (Category) | 1,900 (83.0%) | 388 (17.0%) |
| Total (Overall) | 7,325 (55.5%) | 5,869 (44.5%) |
Employment Industries by Sex in Benton County
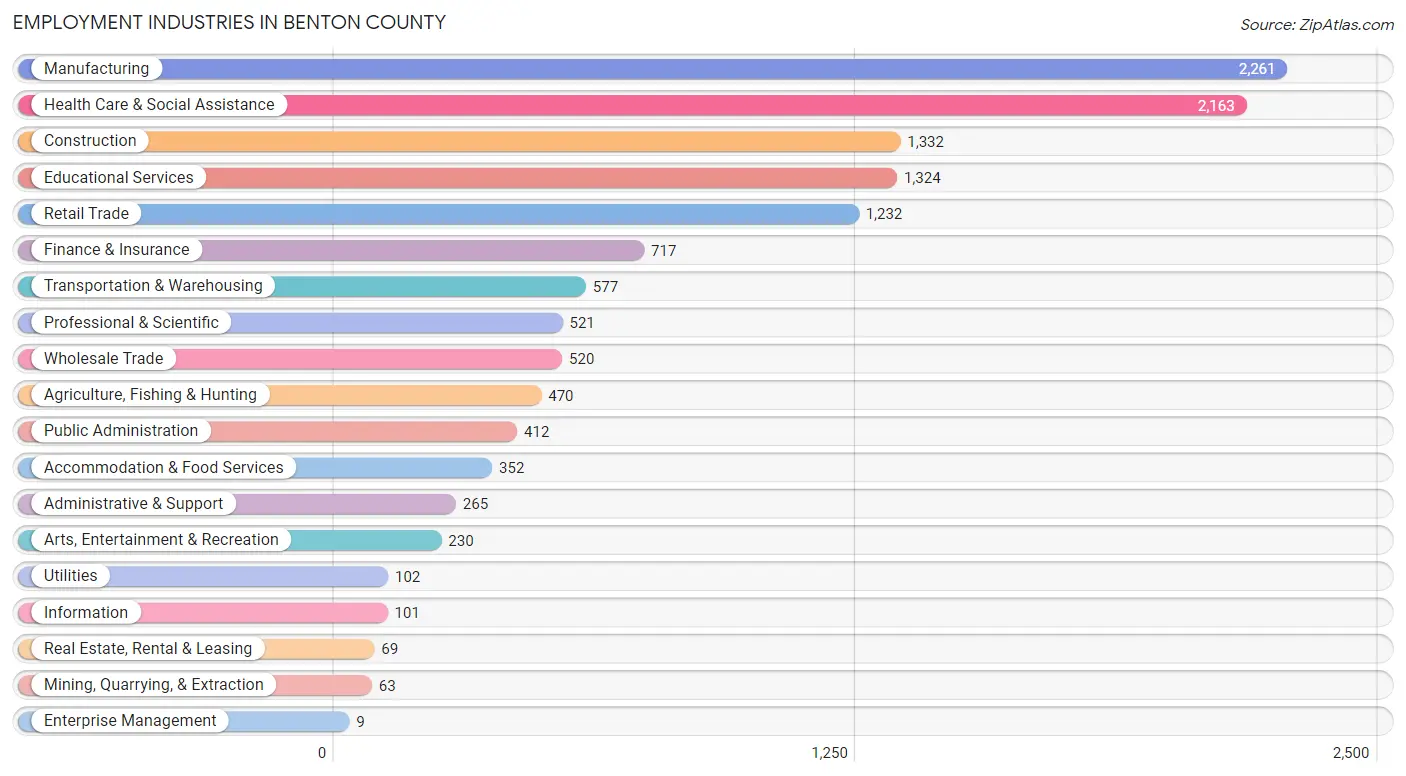
Employment Industries in Benton County
The major employment industries in Benton County include Manufacturing (2,261 | 17.1%), Health Care & Social Assistance (2,163 | 16.4%), Construction (1,332 | 10.1%), Educational Services (1,324 | 10.0%), and Retail Trade (1,232 | 9.3%).
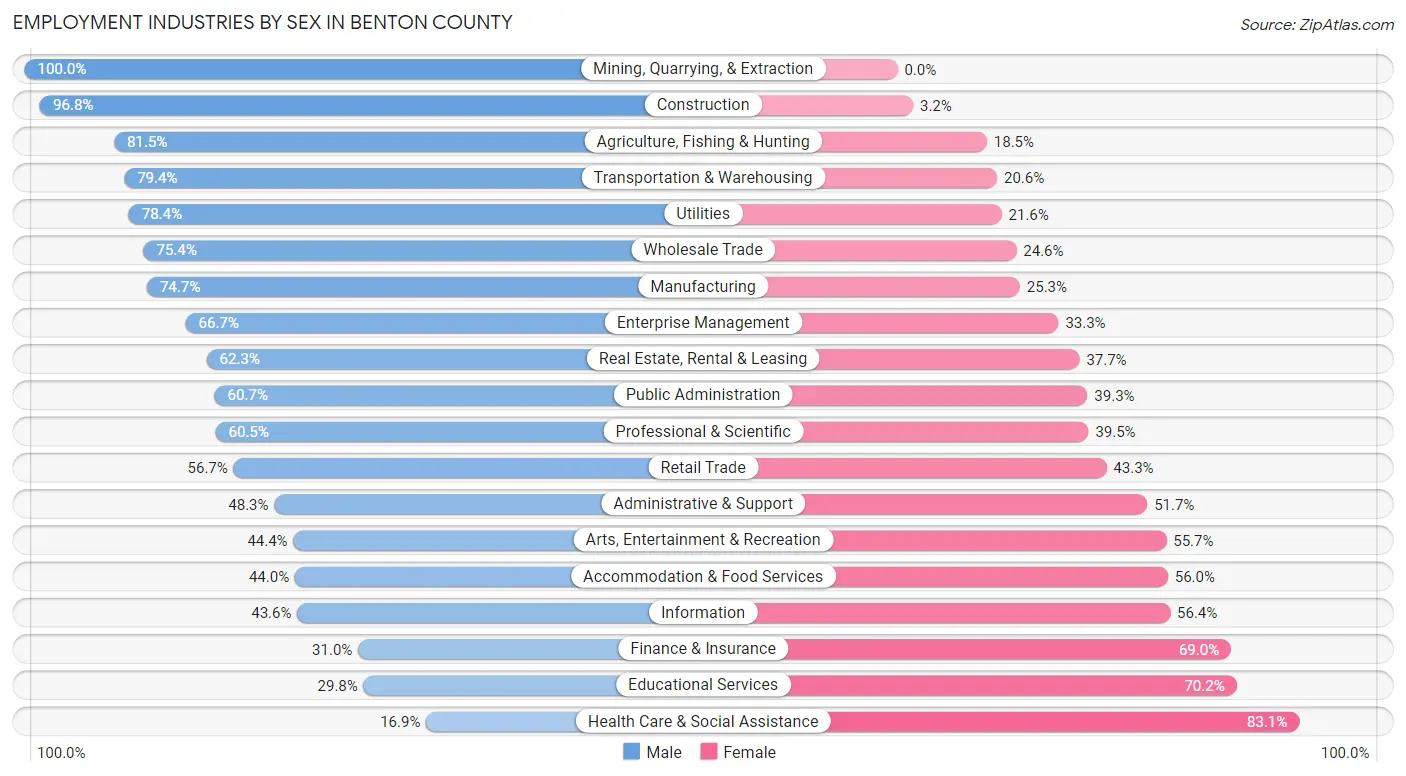
Employment Industries by Sex in Benton County
The Benton County industries that see more men than women are Mining, Quarrying, & Extraction (100.0%), Construction (96.8%), and Agriculture, Fishing & Hunting (81.5%), whereas the industries that tend to have a higher number of women are Health Care & Social Assistance (83.1%), Educational Services (70.2%), and Finance & Insurance (69.0%).
| Industry | Male | Female |
| Agriculture, Fishing & Hunting | 383 (81.5%) | 87 (18.5%) |
| Mining, Quarrying, & Extraction | 63 (100.0%) | 0 (0.0%) |
| Construction | 1,289 (96.8%) | 43 (3.2%) |
| Manufacturing | 1,688 (74.7%) | 573 (25.3%) |
| Wholesale Trade | 392 (75.4%) | 128 (24.6%) |
| Retail Trade | 699 (56.7%) | 533 (43.3%) |
| Transportation & Warehousing | 458 (79.4%) | 119 (20.6%) |
| Utilities | 80 (78.4%) | 22 (21.6%) |
| Information | 44 (43.6%) | 57 (56.4%) |
| Finance & Insurance | 222 (31.0%) | 495 (69.0%) |
| Real Estate, Rental & Leasing | 43 (62.3%) | 26 (37.7%) |
| Professional & Scientific | 315 (60.5%) | 206 (39.5%) |
| Enterprise Management | 6 (66.7%) | 3 (33.3%) |
| Administrative & Support | 128 (48.3%) | 137 (51.7%) |
| Educational Services | 395 (29.8%) | 929 (70.2%) |
| Health Care & Social Assistance | 365 (16.9%) | 1,798 (83.1%) |
| Arts, Entertainment & Recreation | 102 (44.4%) | 128 (55.6%) |
| Accommodation & Food Services | 155 (44.0%) | 197 (56.0%) |
| Public Administration | 250 (60.7%) | 162 (39.3%) |
| Total | 7,325 (55.5%) | 5,869 (44.5%) |
Education in Benton County
School Enrollment in Benton County
The most common levels of schooling among the 5,539 students in Benton County are high school (1,489 | 26.9%), middle school (1,369 | 24.7%), and elementary school (1,366 | 24.7%).
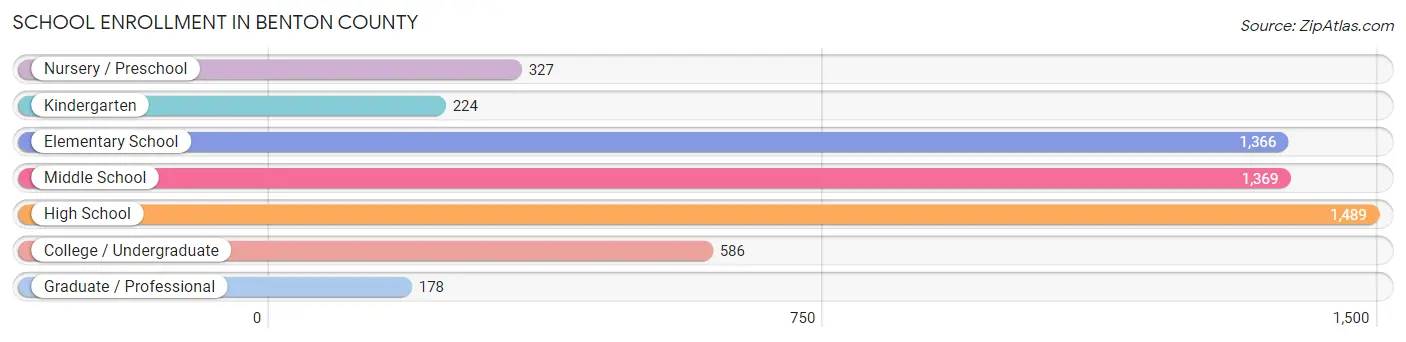
| School Level | # Students | % Students |
| Nursery / Preschool | 327 | 5.9% |
| Kindergarten | 224 | 4.0% |
| Elementary School | 1,366 | 24.7% |
| Middle School | 1,369 | 24.7% |
| High School | 1,489 | 26.9% |
| College / Undergraduate | 586 | 10.6% |
| Graduate / Professional | 178 | 3.2% |
| Total | 5,539 | 100.0% |
School Enrollment by Age by Funding Source in Benton County
Out of a total of 5,539 students who are enrolled in schools in Benton County, 587 (10.6%) attend a private institution, while the remaining 4,952 (89.4%) are enrolled in public schools. The age group of 35 years and over has the highest likelihood of being enrolled in private schools, with 86 (49.4% in the age bracket) enrolled. Conversely, the age group of 15 to 17 year olds has the lowest likelihood of being enrolled in a private school, with 1,050 (95.0% in the age bracket) attending a public institution.
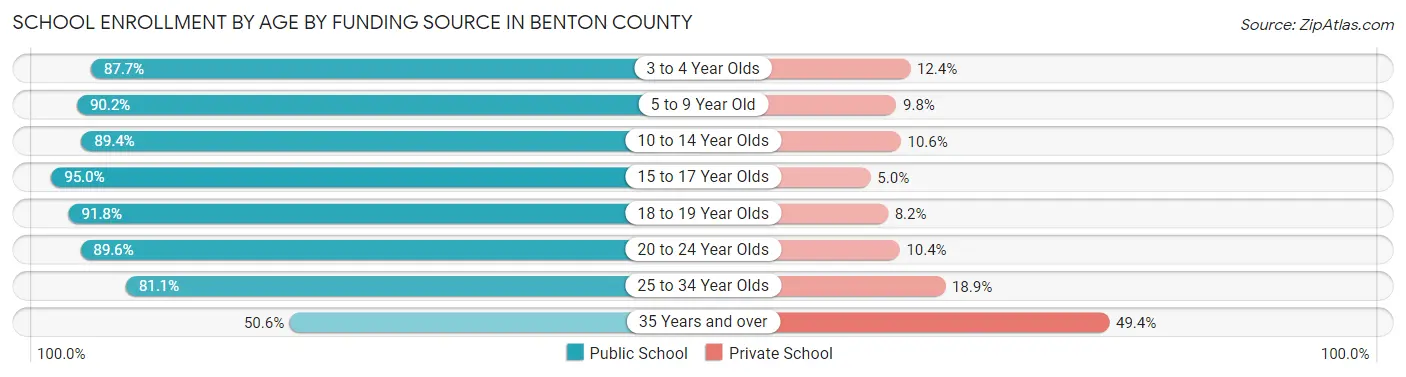
| Age Bracket | Public School | Private School |
| 3 to 4 Year Olds | 220 (87.6%) | 31 (12.3%) |
| 5 to 9 Year Old | 1,322 (90.2%) | 143 (9.8%) |
| 10 to 14 Year Olds | 1,588 (89.4%) | 188 (10.6%) |
| 15 to 17 Year Olds | 1,050 (95.0%) | 55 (5.0%) |
| 18 to 19 Year Olds | 347 (91.8%) | 31 (8.2%) |
| 20 to 24 Year Olds | 207 (89.6%) | 24 (10.4%) |
| 25 to 34 Year Olds | 129 (81.1%) | 30 (18.9%) |
| 35 Years and over | 88 (50.6%) | 86 (49.4%) |
| Total | 4,952 (89.4%) | 587 (10.6%) |
Educational Attainment by Field of Study in Benton County
Business (1,020 | 22.7%), education (1,018 | 22.7%), science & technology (528 | 11.8%), bio, nature & agricultural (464 | 10.3%), and arts & humanities (315 | 7.0%) are the most common fields of study among 4,490 individuals in Benton County who have obtained a bachelor's degree or higher.
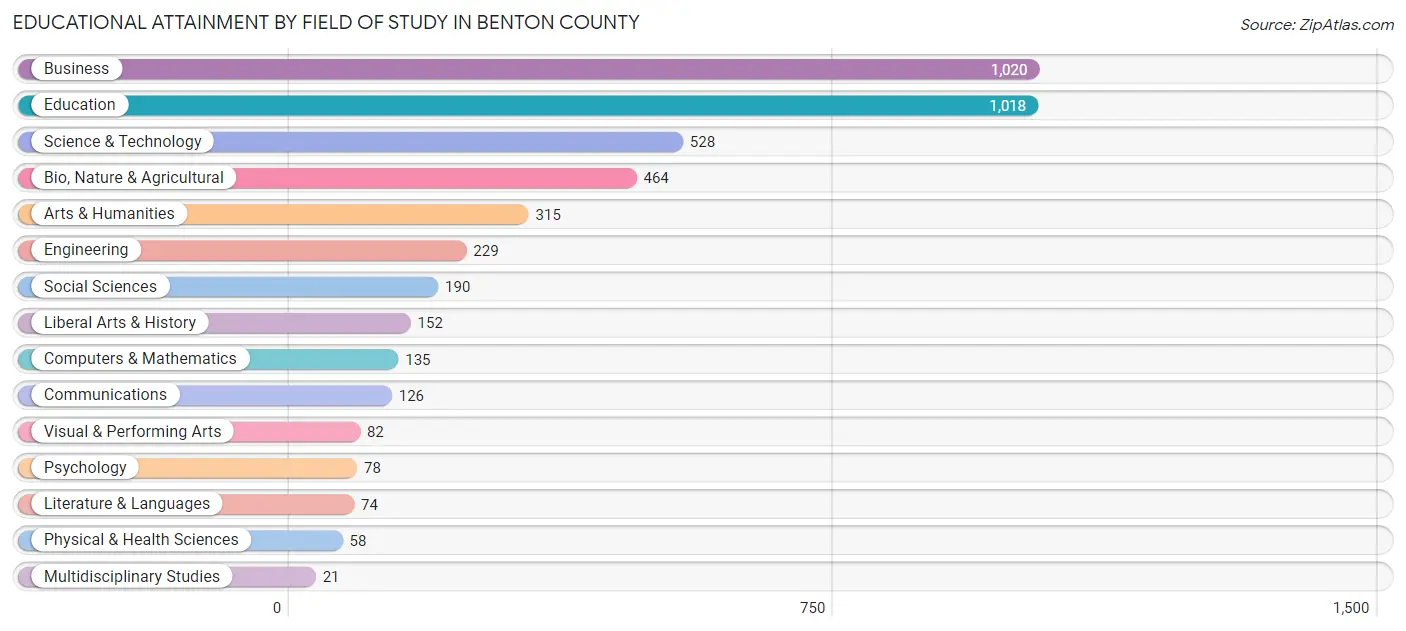
| Field of Study | # Graduates | % Graduates |
| Computers & Mathematics | 135 | 3.0% |
| Bio, Nature & Agricultural | 464 | 10.3% |
| Physical & Health Sciences | 58 | 1.3% |
| Psychology | 78 | 1.7% |
| Social Sciences | 190 | 4.2% |
| Engineering | 229 | 5.1% |
| Multidisciplinary Studies | 21 | 0.5% |
| Science & Technology | 528 | 11.8% |
| Business | 1,020 | 22.7% |
| Education | 1,018 | 22.7% |
| Literature & Languages | 74 | 1.7% |
| Liberal Arts & History | 152 | 3.4% |
| Visual & Performing Arts | 82 | 1.8% |
| Communications | 126 | 2.8% |
| Arts & Humanities | 315 | 7.0% |
| Total | 4,490 | 100.0% |
Transportation & Commute in Benton County
Vehicle Availability by Sex in Benton County
The most prevalent vehicle ownership categories in Benton County are males with 2 vehicles (2,739, accounting for 37.9%) and females with 2 vehicles (2,100, making up 47.0%).
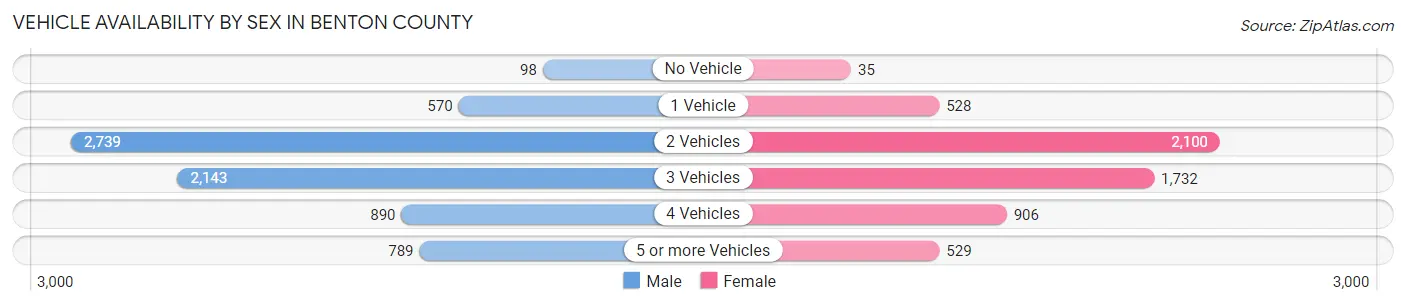
| Vehicles Available | Male | Female |
| No Vehicle | 98 (1.4%) | 35 (0.6%) |
| 1 Vehicle | 570 (7.9%) | 528 (9.1%) |
| 2 Vehicles | 2,739 (37.9%) | 2,100 (36.0%) |
| 3 Vehicles | 2,143 (29.6%) | 1,732 (29.7%) |
| 4 Vehicles | 890 (12.3%) | 906 (15.5%) |
| 5 or more Vehicles | 789 (10.9%) | 529 (9.1%) |
| Total | 7,229 (100.0%) | 5,830 (100.0%) |
Commute Time in Benton County
The most frequently occuring commute durations in Benton County are 30 to 34 minutes (1,710 commuters, 14.3%), 5 to 9 minutes (1,338 commuters, 11.2%), and 15 to 19 minutes (1,315 commuters, 11.0%).
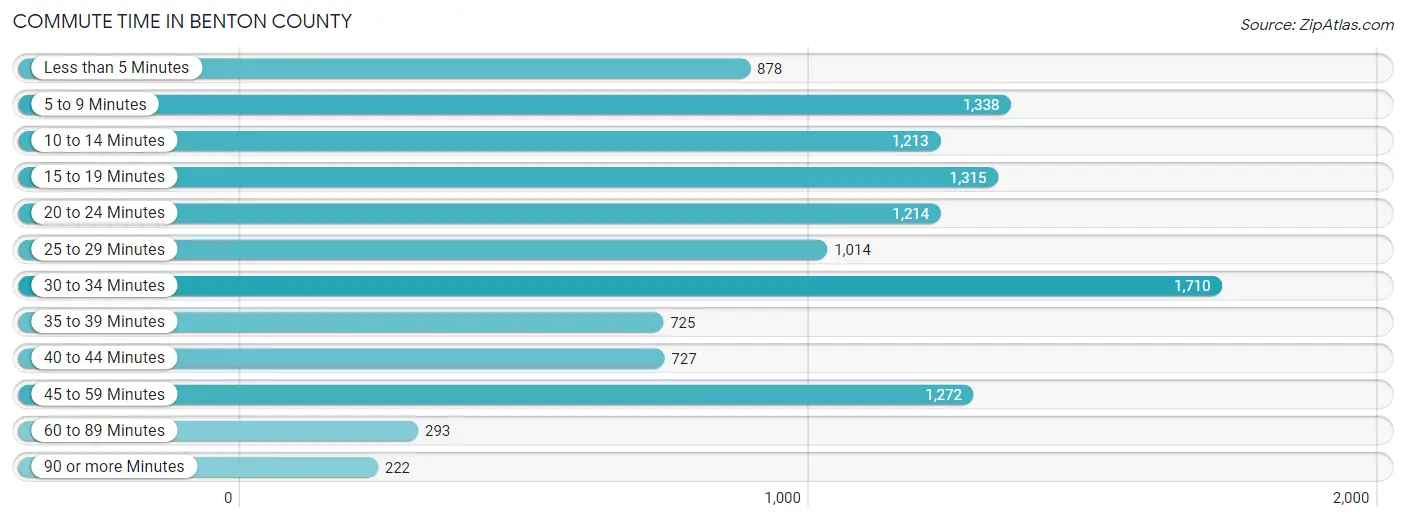
| Commute Time | # Commuters | % Commuters |
| Less than 5 Minutes | 878 | 7.4% |
| 5 to 9 Minutes | 1,338 | 11.2% |
| 10 to 14 Minutes | 1,213 | 10.2% |
| 15 to 19 Minutes | 1,315 | 11.0% |
| 20 to 24 Minutes | 1,214 | 10.2% |
| 25 to 29 Minutes | 1,014 | 8.5% |
| 30 to 34 Minutes | 1,710 | 14.3% |
| 35 to 39 Minutes | 725 | 6.1% |
| 40 to 44 Minutes | 727 | 6.1% |
| 45 to 59 Minutes | 1,272 | 10.7% |
| 60 to 89 Minutes | 293 | 2.5% |
| 90 or more Minutes | 222 | 1.9% |
Commute Time by Sex in Benton County
The most common commute times in Benton County are 30 to 34 minutes (946 commuters, 14.1%) for males and 30 to 34 minutes (764 commuters, 14.6%) for females.
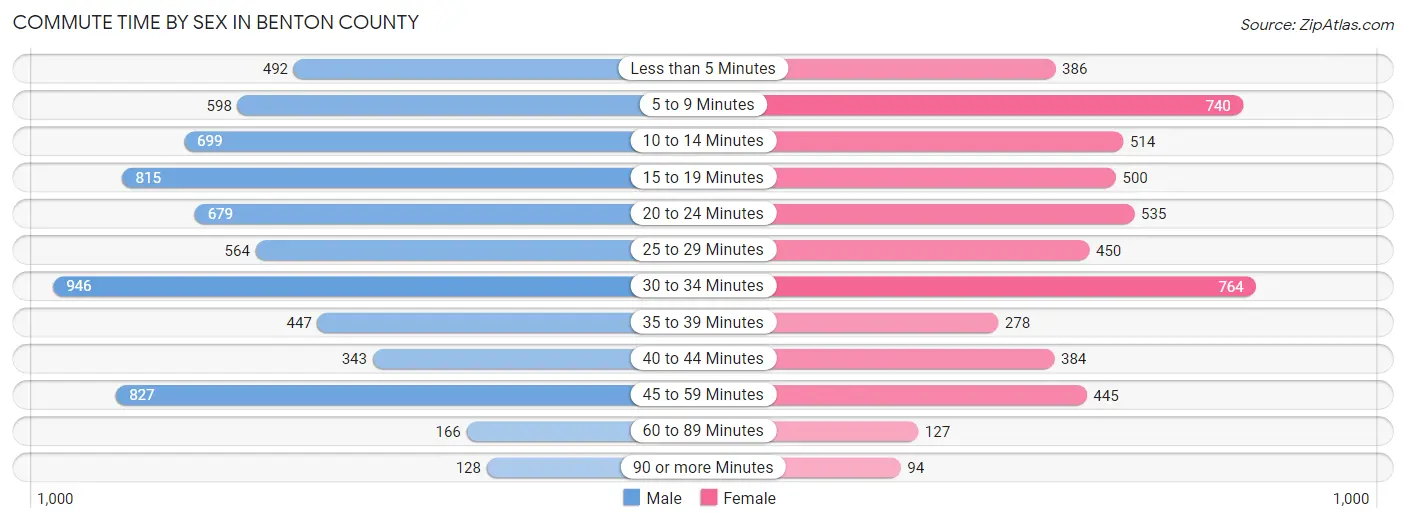
| Commute Time | Male | Female |
| Less than 5 Minutes | 492 (7.3%) | 386 (7.4%) |
| 5 to 9 Minutes | 598 (8.9%) | 740 (14.2%) |
| 10 to 14 Minutes | 699 (10.4%) | 514 (9.9%) |
| 15 to 19 Minutes | 815 (12.2%) | 500 (9.6%) |
| 20 to 24 Minutes | 679 (10.1%) | 535 (10.2%) |
| 25 to 29 Minutes | 564 (8.4%) | 450 (8.6%) |
| 30 to 34 Minutes | 946 (14.1%) | 764 (14.6%) |
| 35 to 39 Minutes | 447 (6.7%) | 278 (5.3%) |
| 40 to 44 Minutes | 343 (5.1%) | 384 (7.4%) |
| 45 to 59 Minutes | 827 (12.3%) | 445 (8.5%) |
| 60 to 89 Minutes | 166 (2.5%) | 127 (2.4%) |
| 90 or more Minutes | 128 (1.9%) | 94 (1.8%) |
Time of Departure to Work by Sex in Benton County
The most frequent times of departure to work in Benton County are 7:00 AM to 7:29 AM (1,112, 16.6%) for males and 7:00 AM to 7:29 AM (1,222, 23.4%) for females.
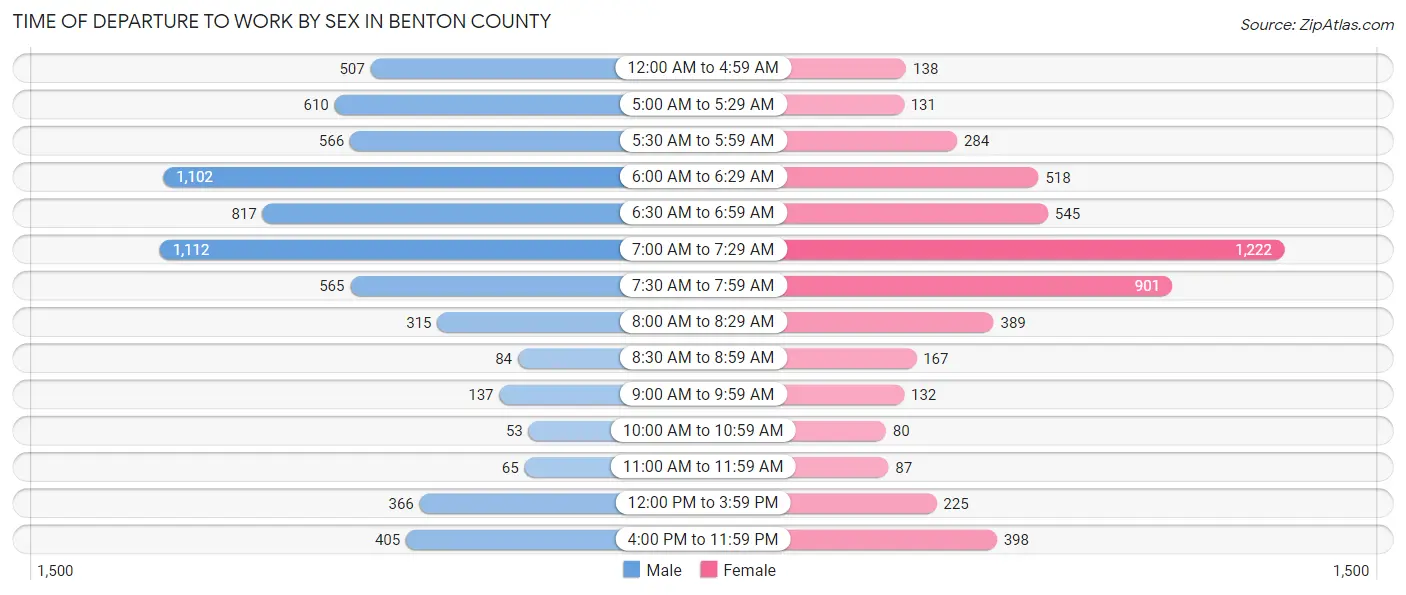
| Time of Departure | Male | Female |
| 12:00 AM to 4:59 AM | 507 (7.6%) | 138 (2.6%) |
| 5:00 AM to 5:29 AM | 610 (9.1%) | 131 (2.5%) |
| 5:30 AM to 5:59 AM | 566 (8.4%) | 284 (5.4%) |
| 6:00 AM to 6:29 AM | 1,102 (16.4%) | 518 (9.9%) |
| 6:30 AM to 6:59 AM | 817 (12.2%) | 545 (10.4%) |
| 7:00 AM to 7:29 AM | 1,112 (16.6%) | 1,222 (23.4%) |
| 7:30 AM to 7:59 AM | 565 (8.4%) | 901 (17.3%) |
| 8:00 AM to 8:29 AM | 315 (4.7%) | 389 (7.5%) |
| 8:30 AM to 8:59 AM | 84 (1.3%) | 167 (3.2%) |
| 9:00 AM to 9:59 AM | 137 (2.0%) | 132 (2.5%) |
| 10:00 AM to 10:59 AM | 53 (0.8%) | 80 (1.5%) |
| 11:00 AM to 11:59 AM | 65 (1.0%) | 87 (1.7%) |
| 12:00 PM to 3:59 PM | 366 (5.5%) | 225 (4.3%) |
| 4:00 PM to 11:59 PM | 405 (6.0%) | 398 (7.6%) |
| Total | 6,704 (100.0%) | 5,217 (100.0%) |
Housing Occupancy in Benton County
Occupancy by Ownership in Benton County
Of the total 10,114 dwellings in Benton County, owner-occupied units account for 8,471 (83.8%), while renter-occupied units make up 1,643 (16.2%).
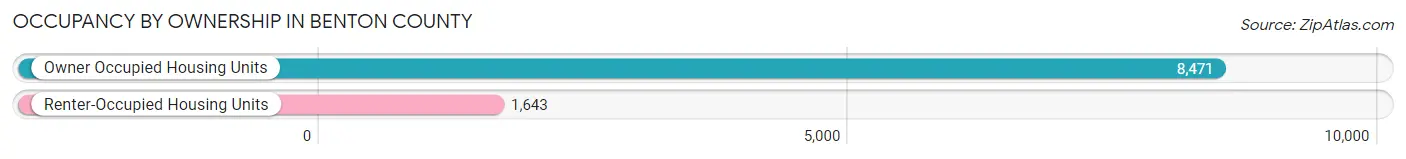
| Occupancy | # Housing Units | % Housing Units |
| Owner Occupied Housing Units | 8,471 | 83.8% |
| Renter-Occupied Housing Units | 1,643 | 16.2% |
| Total Occupied Housing Units | 10,114 | 100.0% |
Occupancy by Household Size in Benton County
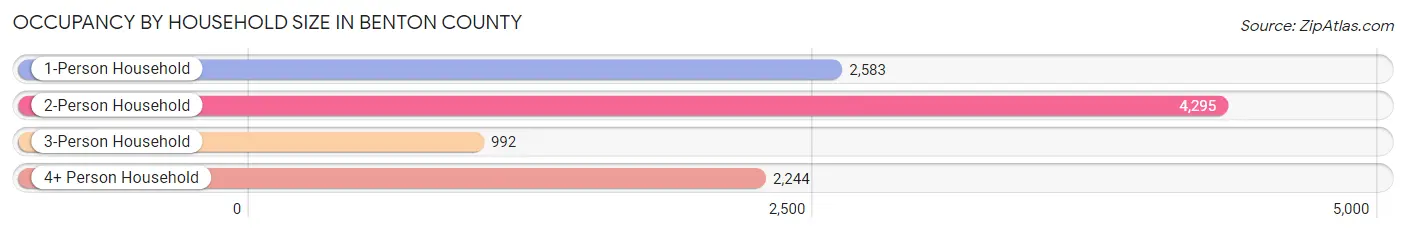
| Household Size | # Housing Units | % Housing Units |
| 1-Person Household | 2,583 | 25.5% |
| 2-Person Household | 4,295 | 42.5% |
| 3-Person Household | 992 | 9.8% |
| 4+ Person Household | 2,244 | 22.2% |
| Total Housing Units | 10,114 | 100.0% |
Occupancy by Ownership by Household Size in Benton County
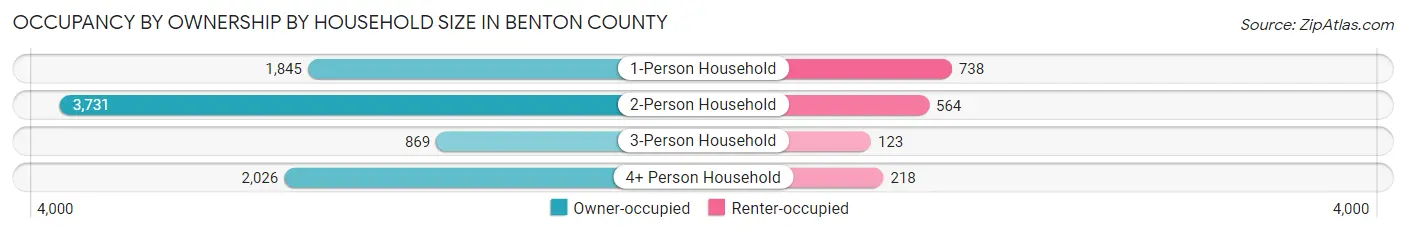
| Household Size | Owner-occupied | Renter-occupied |
| 1-Person Household | 1,845 (71.4%) | 738 (28.6%) |
| 2-Person Household | 3,731 (86.9%) | 564 (13.1%) |
| 3-Person Household | 869 (87.6%) | 123 (12.4%) |
| 4+ Person Household | 2,026 (90.3%) | 218 (9.7%) |
| Total Housing Units | 8,471 (83.8%) | 1,643 (16.2%) |
Occupancy by Educational Attainment in Benton County
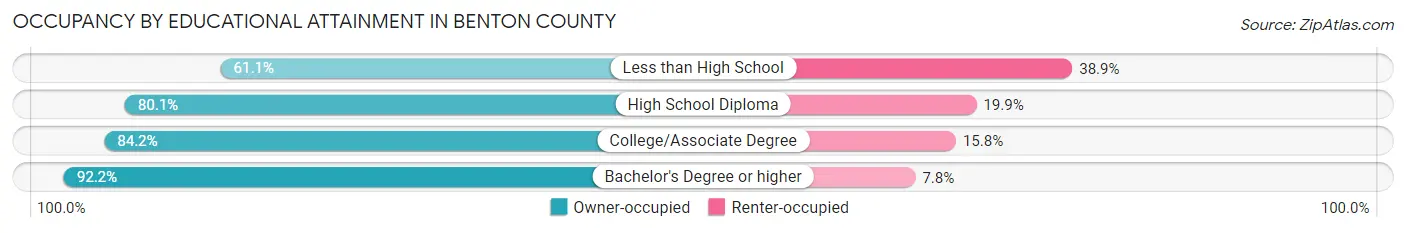
| Household Size | Owner-occupied | Renter-occupied |
| Less than High School | 294 (61.1%) | 187 (38.9%) |
| High School Diploma | 2,683 (80.1%) | 666 (19.9%) |
| College/Associate Degree | 3,151 (84.2%) | 592 (15.8%) |
| Bachelor's Degree or higher | 2,343 (92.2%) | 198 (7.8%) |
Occupancy by Age of Householder in Benton County
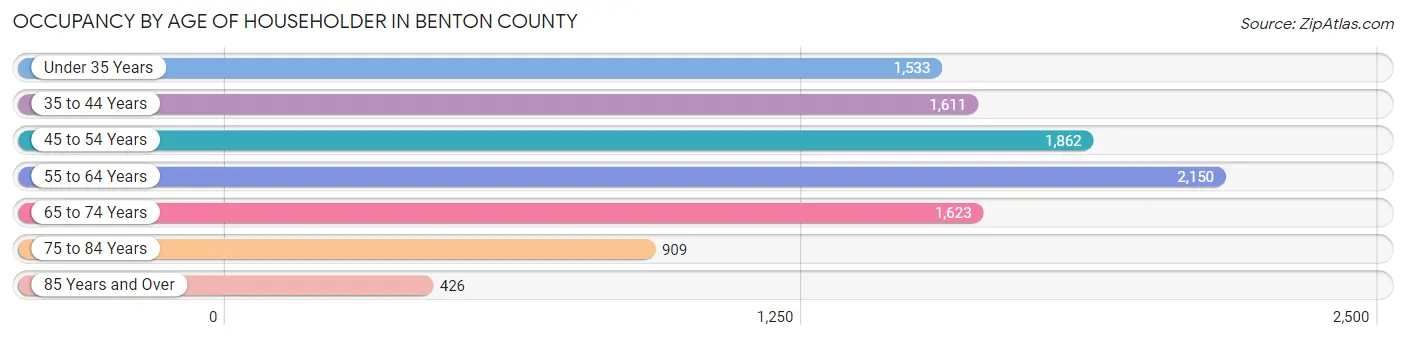
| Age Bracket | # Households | % Households |
| Under 35 Years | 1,533 | 15.2% |
| 35 to 44 Years | 1,611 | 15.9% |
| 45 to 54 Years | 1,862 | 18.4% |
| 55 to 64 Years | 2,150 | 21.3% |
| 65 to 74 Years | 1,623 | 16.1% |
| 75 to 84 Years | 909 | 9.0% |
| 85 Years and Over | 426 | 4.2% |
| Total | 10,114 | 100.0% |
Housing Finances in Benton County
Median Income by Occupancy in Benton County
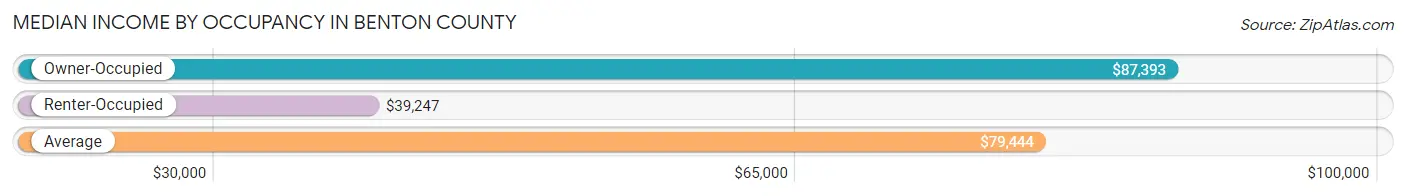
| Occupancy Type | # Households | Median Income |
| Owner-Occupied | 8,471 (83.8%) | $87,393 |
| Renter-Occupied | 1,643 (16.2%) | $39,247 |
| Average | 10,114 (100.0%) | $79,444 |
Occupancy by Householder Income Bracket in Benton County
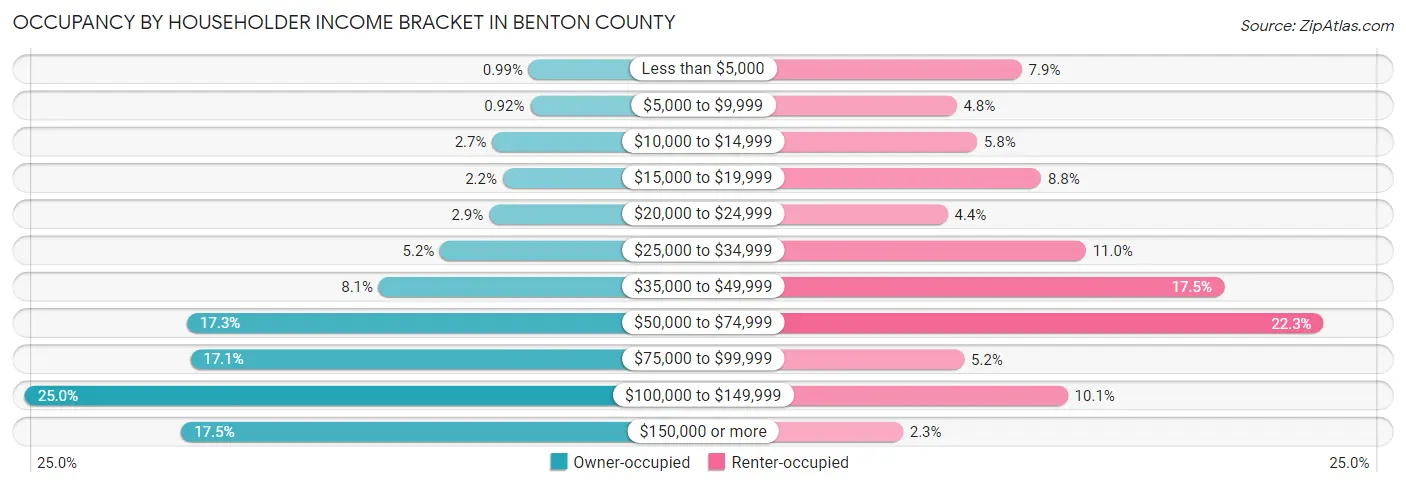
| Income Bracket | Owner-occupied | Renter-occupied |
| Less than $5,000 | 84 (1.0%) | 130 (7.9%) |
| $5,000 to $9,999 | 78 (0.9%) | 79 (4.8%) |
| $10,000 to $14,999 | 231 (2.7%) | 95 (5.8%) |
| $15,000 to $19,999 | 189 (2.2%) | 145 (8.8%) |
| $20,000 to $24,999 | 244 (2.9%) | 72 (4.4%) |
| $25,000 to $34,999 | 441 (5.2%) | 180 (11.0%) |
| $35,000 to $49,999 | 689 (8.1%) | 288 (17.5%) |
| $50,000 to $74,999 | 1,463 (17.3%) | 366 (22.3%) |
| $75,000 to $99,999 | 1,449 (17.1%) | 85 (5.2%) |
| $100,000 to $149,999 | 2,117 (25.0%) | 166 (10.1%) |
| $150,000 or more | 1,486 (17.5%) | 37 (2.2%) |
| Total | 8,471 (100.0%) | 1,643 (100.0%) |
Monthly Housing Cost Tiers in Benton County
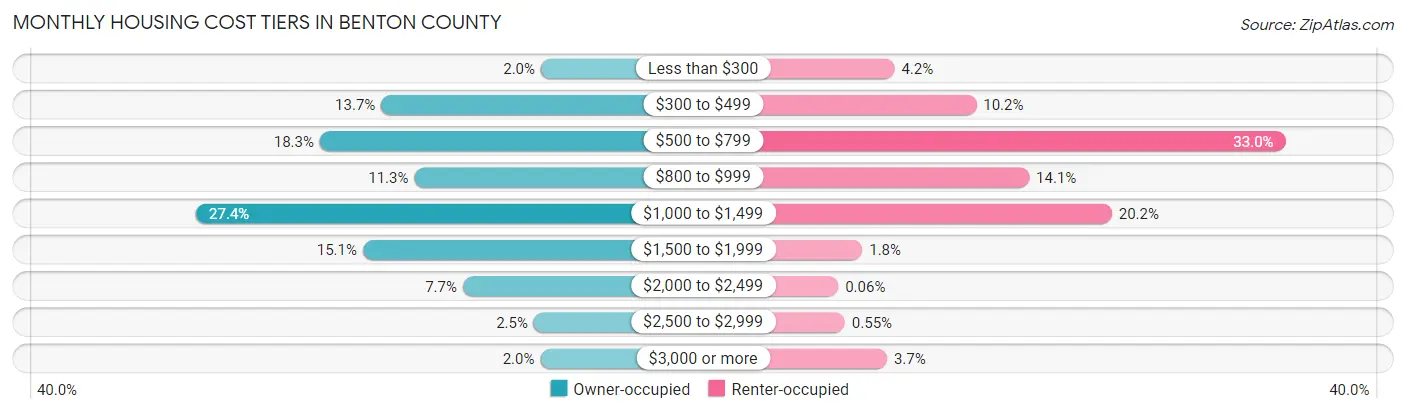
| Monthly Cost | Owner-occupied | Renter-occupied |
| Less than $300 | 168 (2.0%) | 69 (4.2%) |
| $300 to $499 | 1,164 (13.7%) | 168 (10.2%) |
| $500 to $799 | 1,547 (18.3%) | 542 (33.0%) |
| $800 to $999 | 957 (11.3%) | 232 (14.1%) |
| $1,000 to $1,499 | 2,319 (27.4%) | 332 (20.2%) |
| $1,500 to $1,999 | 1,278 (15.1%) | 30 (1.8%) |
| $2,000 to $2,499 | 655 (7.7%) | 1 (0.1%) |
| $2,500 to $2,999 | 212 (2.5%) | 9 (0.5%) |
| $3,000 or more | 171 (2.0%) | 60 (3.6%) |
| Total | 8,471 (100.0%) | 1,643 (100.0%) |
Physical Housing Characteristics in Benton County
Housing Structures in Benton County
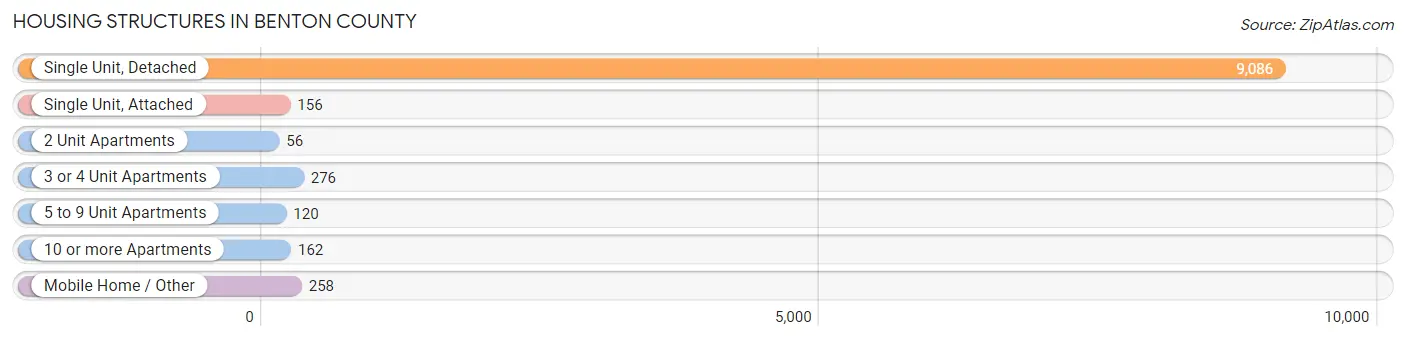
| Structure Type | # Housing Units | % Housing Units |
| Single Unit, Detached | 9,086 | 89.8% |
| Single Unit, Attached | 156 | 1.5% |
| 2 Unit Apartments | 56 | 0.5% |
| 3 or 4 Unit Apartments | 276 | 2.7% |
| 5 to 9 Unit Apartments | 120 | 1.2% |
| 10 or more Apartments | 162 | 1.6% |
| Mobile Home / Other | 258 | 2.5% |
| Total | 10,114 | 100.0% |
Housing Structures by Occupancy in Benton County
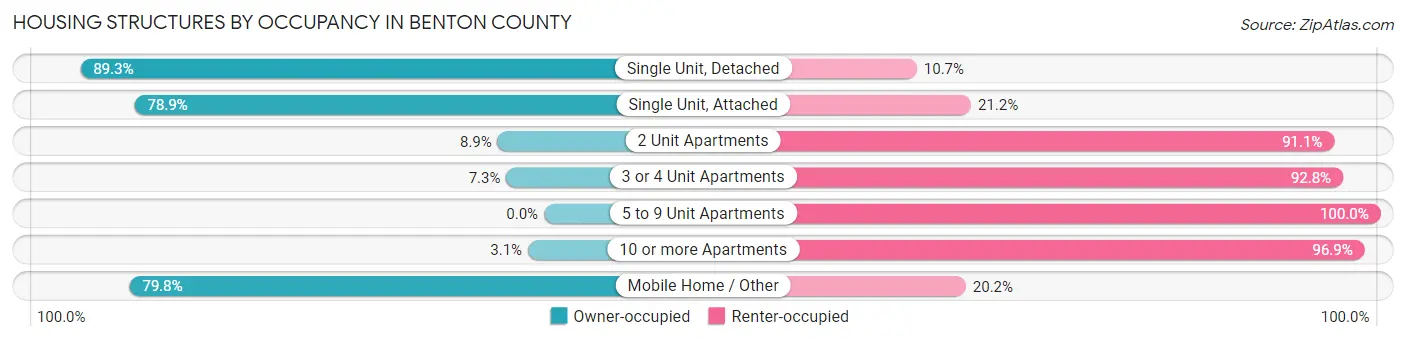
| Structure Type | Owner-occupied | Renter-occupied |
| Single Unit, Detached | 8,112 (89.3%) | 974 (10.7%) |
| Single Unit, Attached | 123 (78.8%) | 33 (21.1%) |
| 2 Unit Apartments | 5 (8.9%) | 51 (91.1%) |
| 3 or 4 Unit Apartments | 20 (7.2%) | 256 (92.7%) |
| 5 to 9 Unit Apartments | 0 (0.0%) | 120 (100.0%) |
| 10 or more Apartments | 5 (3.1%) | 157 (96.9%) |
| Mobile Home / Other | 206 (79.8%) | 52 (20.2%) |
| Total | 8,471 (83.8%) | 1,643 (16.2%) |
Housing Structures by Number of Rooms in Benton County
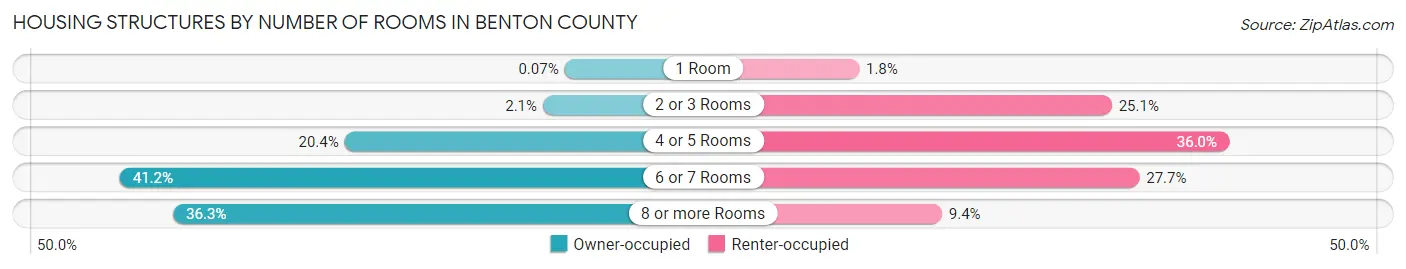
| Number of Rooms | Owner-occupied | Renter-occupied |
| 1 Room | 6 (0.1%) | 29 (1.8%) |
| 2 or 3 Rooms | 175 (2.1%) | 413 (25.1%) |
| 4 or 5 Rooms | 1,729 (20.4%) | 591 (36.0%) |
| 6 or 7 Rooms | 3,489 (41.2%) | 455 (27.7%) |
| 8 or more Rooms | 3,072 (36.3%) | 155 (9.4%) |
| Total | 8,471 (100.0%) | 1,643 (100.0%) |
Housing Structure by Heating Type in Benton County
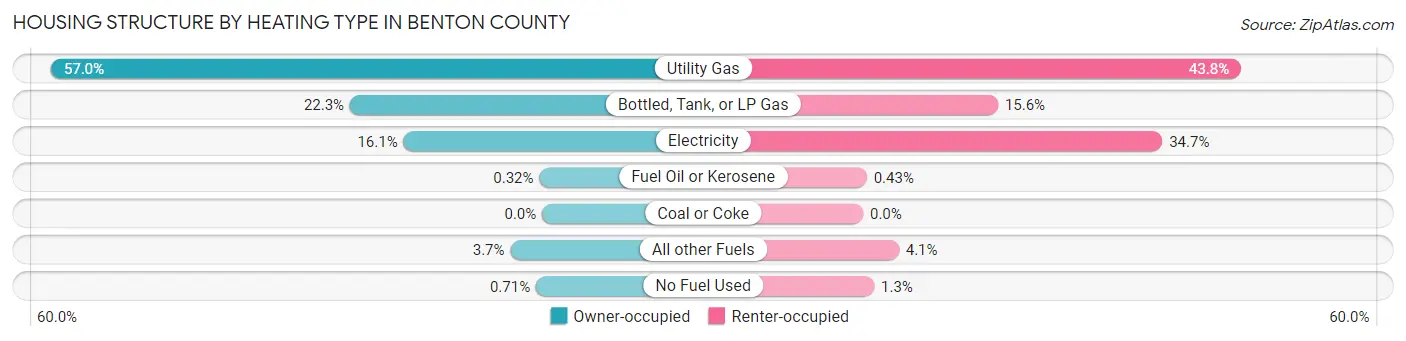
| Heating Type | Owner-occupied | Renter-occupied |
| Utility Gas | 4,824 (57.0%) | 720 (43.8%) |
| Bottled, Tank, or LP Gas | 1,887 (22.3%) | 257 (15.6%) |
| Electricity | 1,361 (16.1%) | 570 (34.7%) |
| Fuel Oil or Kerosene | 27 (0.3%) | 7 (0.4%) |
| Coal or Coke | 0 (0.0%) | 0 (0.0%) |
| All other Fuels | 312 (3.7%) | 68 (4.1%) |
| No Fuel Used | 60 (0.7%) | 21 (1.3%) |
| Total | 8,471 (100.0%) | 1,643 (100.0%) |
Household Vehicle Usage in Benton County
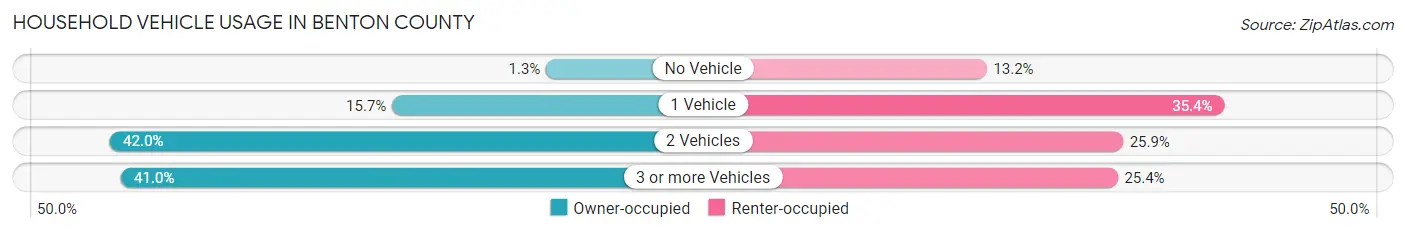
| Vehicles per Household | Owner-occupied | Renter-occupied |
| No Vehicle | 111 (1.3%) | 217 (13.2%) |
| 1 Vehicle | 1,329 (15.7%) | 582 (35.4%) |
| 2 Vehicles | 3,559 (42.0%) | 426 (25.9%) |
| 3 or more Vehicles | 3,472 (41.0%) | 418 (25.4%) |
| Total | 8,471 (100.0%) | 1,643 (100.0%) |
Real Estate & Mortgages in Benton County
Real Estate and Mortgage Overview in Benton County
| Characteristic | Without Mortgage | With Mortgage |
| Housing Units | 3,308 | 5,163 |
| Median Property Value | $175,800 | $197,500 |
| Median Household Income | $59,615 | $1,208 |
| Monthly Housing Costs | $569 | $171 |
| Real Estate Taxes | $2,263 | $60 |
Property Value by Mortgage Status in Benton County
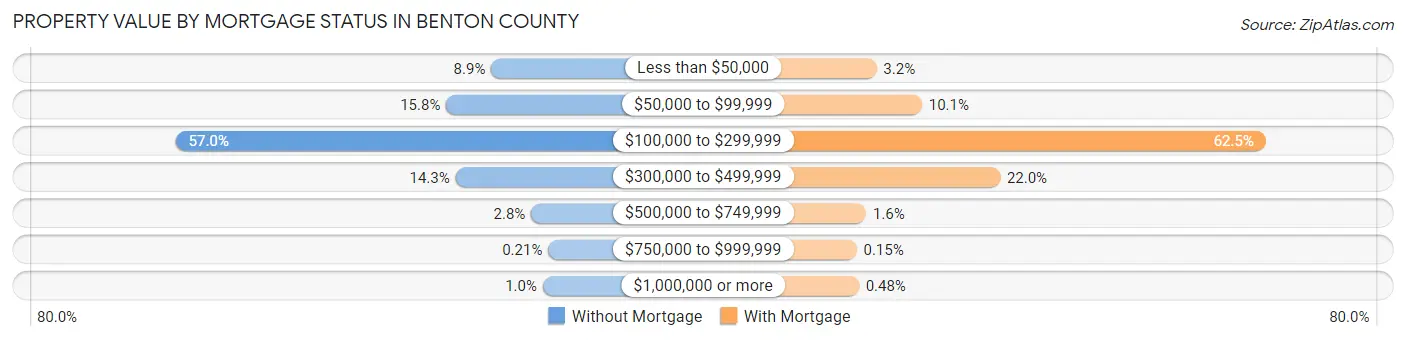
| Property Value | Without Mortgage | With Mortgage |
| Less than $50,000 | 294 (8.9%) | 164 (3.2%) |
| $50,000 to $99,999 | 521 (15.8%) | 521 (10.1%) |
| $100,000 to $299,999 | 1,885 (57.0%) | 3,227 (62.5%) |
| $300,000 to $499,999 | 474 (14.3%) | 1,136 (22.0%) |
| $500,000 to $749,999 | 93 (2.8%) | 82 (1.6%) |
| $750,000 to $999,999 | 7 (0.2%) | 8 (0.2%) |
| $1,000,000 or more | 34 (1.0%) | 25 (0.5%) |
| Total | 3,308 (100.0%) | 5,163 (100.0%) |
Household Income by Mortgage Status in Benton County
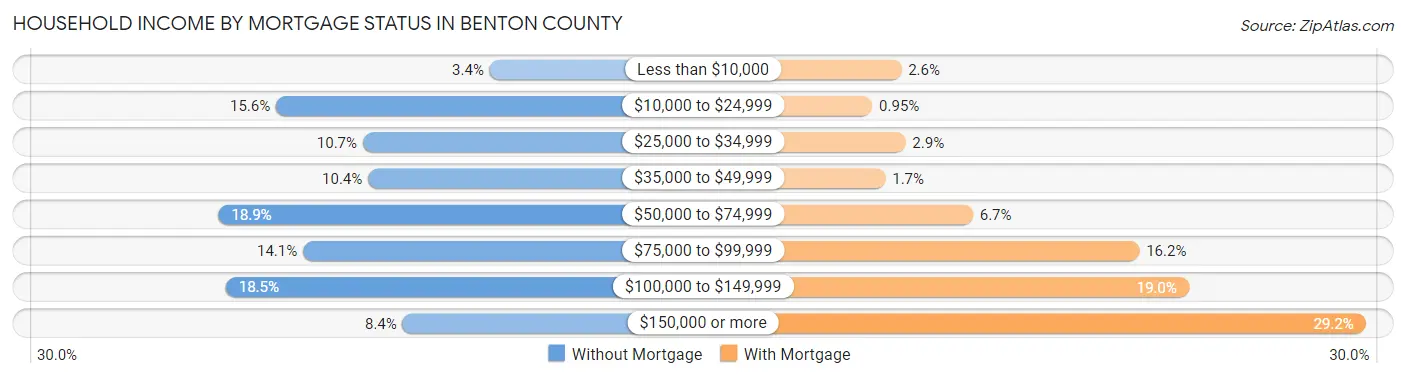
| Household Income | Without Mortgage | With Mortgage |
| Less than $10,000 | 113 (3.4%) | 135 (2.6%) |
| $10,000 to $24,999 | 517 (15.6%) | 49 (0.9%) |
| $25,000 to $34,999 | 353 (10.7%) | 147 (2.9%) |
| $35,000 to $49,999 | 343 (10.4%) | 88 (1.7%) |
| $50,000 to $74,999 | 626 (18.9%) | 346 (6.7%) |
| $75,000 to $99,999 | 466 (14.1%) | 837 (16.2%) |
| $100,000 to $149,999 | 612 (18.5%) | 983 (19.0%) |
| $150,000 or more | 278 (8.4%) | 1,505 (29.1%) |
| Total | 3,308 (100.0%) | 5,163 (100.0%) |
Property Value to Household Income Ratio in Benton County
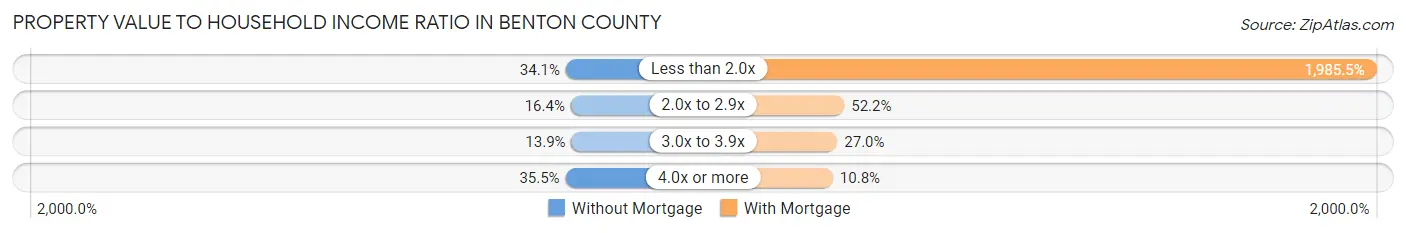
| Value-to-Income Ratio | Without Mortgage | With Mortgage |
| Less than 2.0x | 1,127 (34.1%) | 102,511 (1,985.5%) |
| 2.0x to 2.9x | 541 (16.4%) | 2,697 (52.2%) |
| 3.0x to 3.9x | 458 (13.9%) | 1,394 (27.0%) |
| 4.0x or more | 1,174 (35.5%) | 557 (10.8%) |
| Total | 3,308 (100.0%) | 5,163 (100.0%) |
Real Estate Taxes by Mortgage Status in Benton County
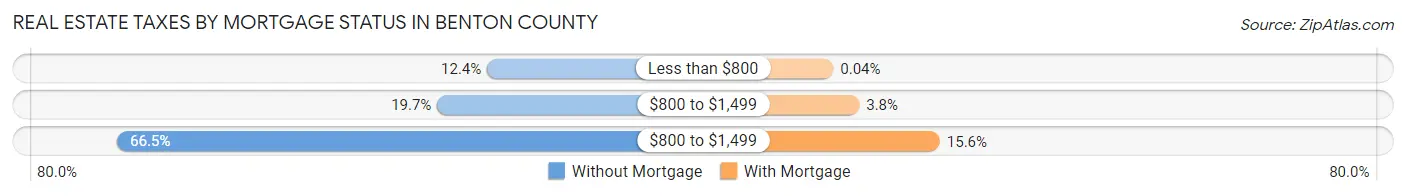
| Property Taxes | Without Mortgage | With Mortgage |
| Less than $800 | 411 (12.4%) | 2 (0.0%) |
| $800 to $1,499 | 652 (19.7%) | 198 (3.8%) |
| $800 to $1,499 | 2,199 (66.5%) | 806 (15.6%) |
| Total | 3,308 (100.0%) | 5,163 (100.0%) |
Health & Disability in Benton County
Health Insurance Coverage by Age in Benton County
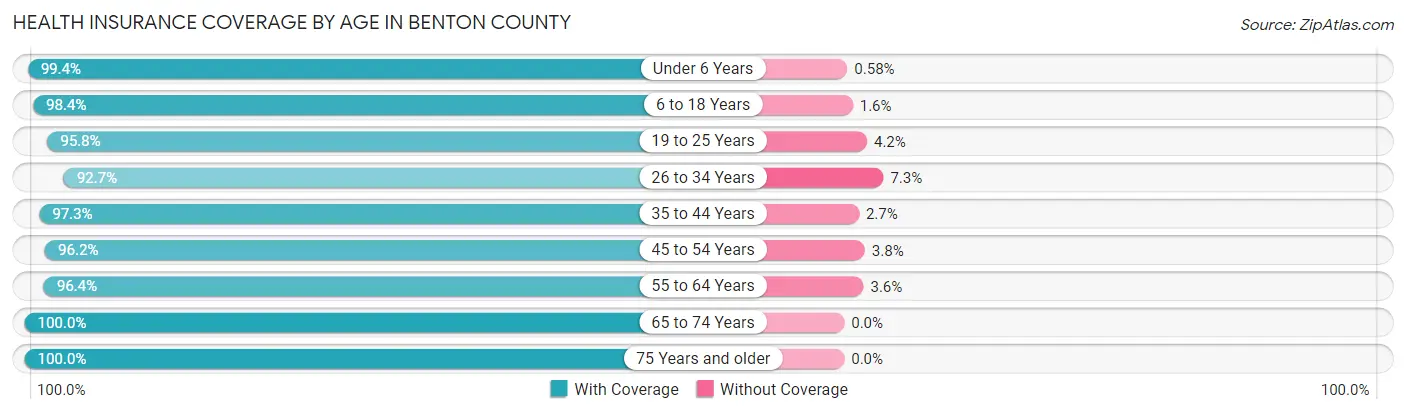
| Age Bracket | With Coverage | Without Coverage |
| Under 6 Years | 1,722 (99.4%) | 10 (0.6%) |
| 6 to 18 Years | 4,422 (98.4%) | 71 (1.6%) |
| 19 to 25 Years | 1,718 (95.8%) | 76 (4.2%) |
| 26 to 34 Years | 2,262 (92.7%) | 178 (7.3%) |
| 35 to 44 Years | 3,019 (97.3%) | 85 (2.7%) |
| 45 to 54 Years | 3,154 (96.2%) | 126 (3.8%) |
| 55 to 64 Years | 3,785 (96.4%) | 141 (3.6%) |
| 65 to 74 Years | 2,611 (100.0%) | 0 (0.0%) |
| 75 Years and older | 2,004 (100.0%) | 0 (0.0%) |
| Total | 24,697 (97.3%) | 687 (2.7%) |
Health Insurance Coverage by Citizenship Status in Benton County
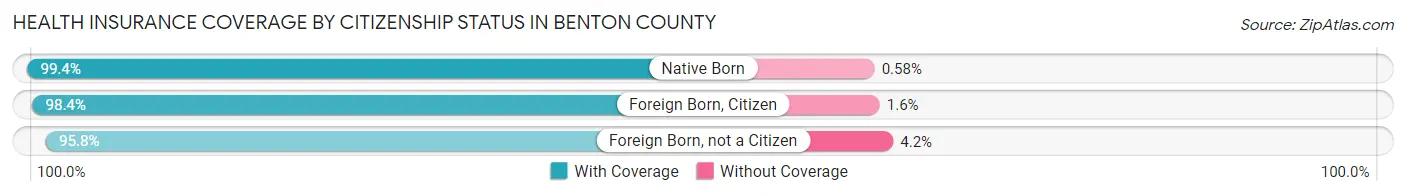
| Citizenship Status | With Coverage | Without Coverage |
| Native Born | 1,722 (99.4%) | 10 (0.6%) |
| Foreign Born, Citizen | 4,422 (98.4%) | 71 (1.6%) |
| Foreign Born, not a Citizen | 1,718 (95.8%) | 76 (4.2%) |
Health Insurance Coverage by Household Income in Benton County
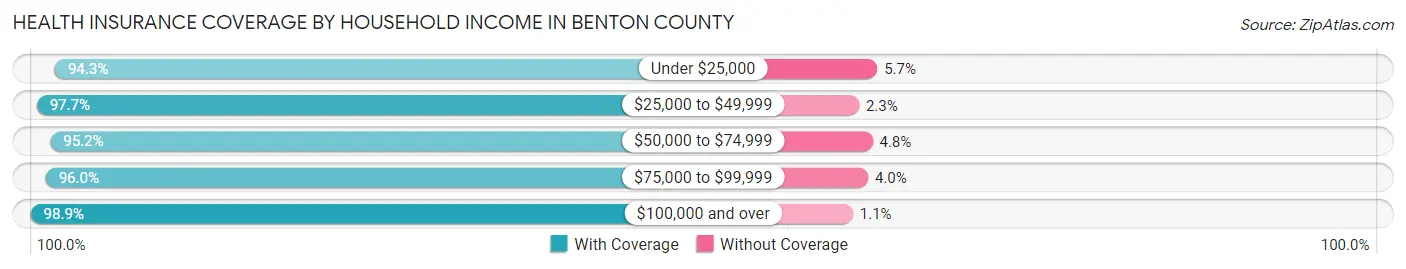
| Household Income | With Coverage | Without Coverage |
| Under $25,000 | 1,770 (94.3%) | 107 (5.7%) |
| $25,000 to $49,999 | 3,004 (97.7%) | 70 (2.3%) |
| $50,000 to $74,999 | 4,030 (95.2%) | 204 (4.8%) |
| $75,000 to $99,999 | 3,795 (96.0%) | 157 (4.0%) |
| $100,000 and over | 12,024 (98.9%) | 139 (1.1%) |
Public vs Private Health Insurance Coverage by Age in Benton County
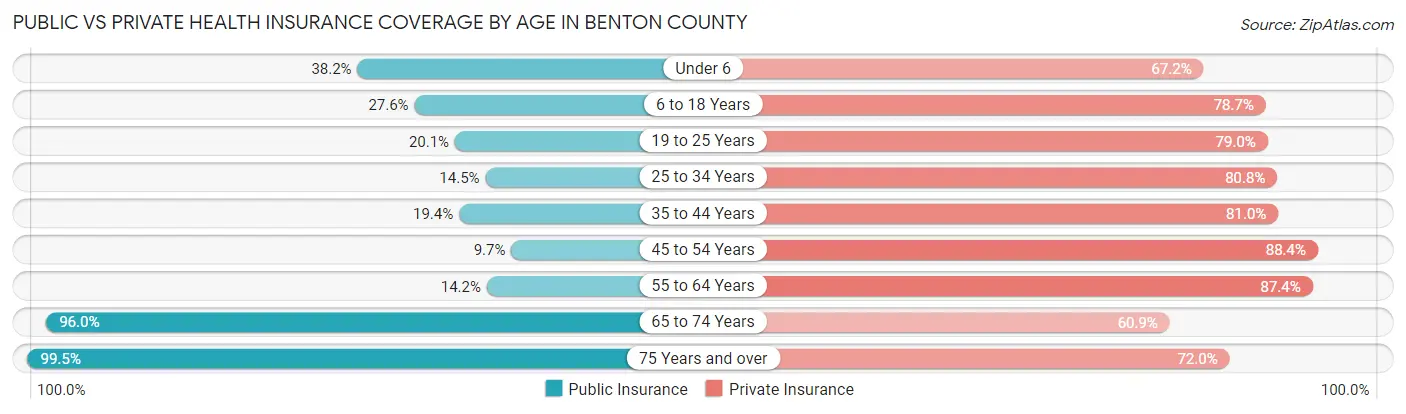
| Age Bracket | Public Insurance | Private Insurance |
| Under 6 | 662 (38.2%) | 1,163 (67.1%) |
| 6 to 18 Years | 1,242 (27.6%) | 3,535 (78.7%) |
| 19 to 25 Years | 361 (20.1%) | 1,418 (79.0%) |
| 25 to 34 Years | 353 (14.5%) | 1,972 (80.8%) |
| 35 to 44 Years | 601 (19.4%) | 2,514 (81.0%) |
| 45 to 54 Years | 317 (9.7%) | 2,898 (88.3%) |
| 55 to 64 Years | 558 (14.2%) | 3,430 (87.4%) |
| 65 to 74 Years | 2,506 (96.0%) | 1,589 (60.9%) |
| 75 Years and over | 1,993 (99.5%) | 1,442 (72.0%) |
| Total | 8,593 (33.9%) | 19,961 (78.6%) |
Disability Status by Sex by Age in Benton County
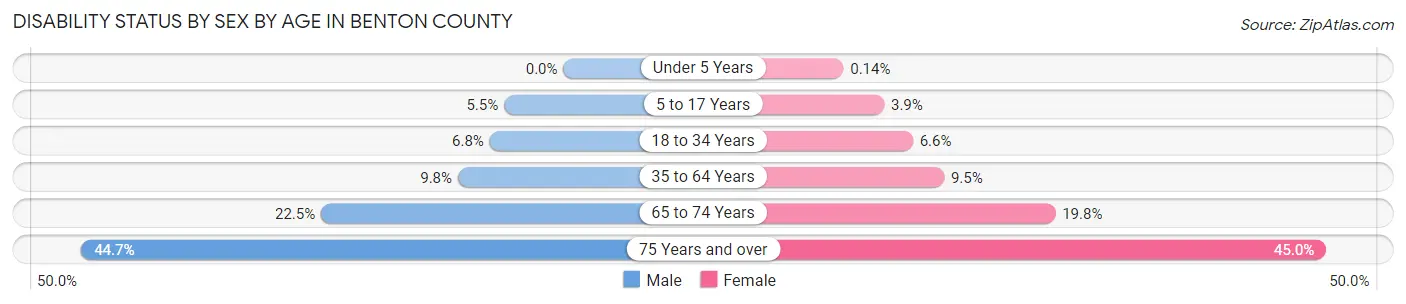
| Age Bracket | Male | Female |
| Under 5 Years | 0 (0.0%) | 1 (0.1%) |
| 5 to 17 Years | 122 (5.5%) | 86 (3.9%) |
| 18 to 34 Years | 163 (6.8%) | 142 (6.6%) |
| 35 to 64 Years | 513 (9.8%) | 481 (9.5%) |
| 65 to 74 Years | 300 (22.5%) | 253 (19.8%) |
| 75 Years and over | 383 (44.7%) | 516 (45.0%) |
Disability Class by Sex by Age in Benton County
Disability Class: Hearing Difficulty
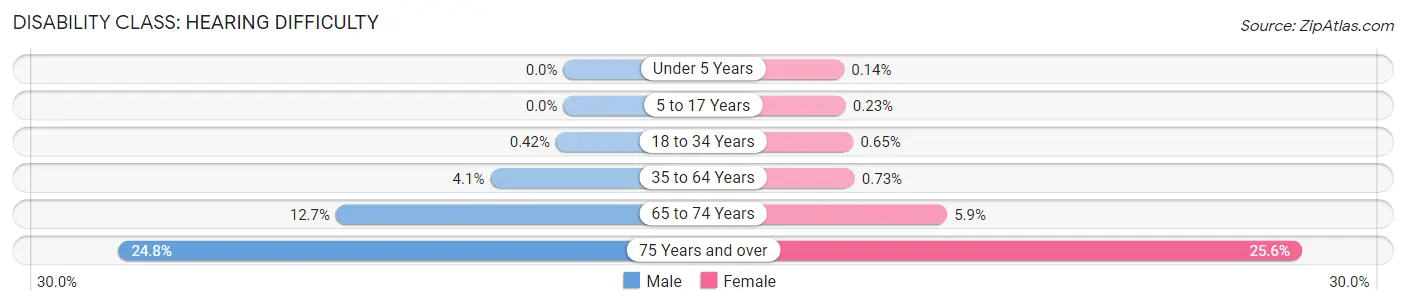
| Age Bracket | Male | Female |
| Under 5 Years | 0 (0.0%) | 1 (0.1%) |
| 5 to 17 Years | 0 (0.0%) | 5 (0.2%) |
| 18 to 34 Years | 10 (0.4%) | 14 (0.6%) |
| 35 to 64 Years | 213 (4.1%) | 37 (0.7%) |
| 65 to 74 Years | 169 (12.7%) | 75 (5.9%) |
| 75 Years and over | 212 (24.8%) | 294 (25.6%) |
Disability Class: Vision Difficulty
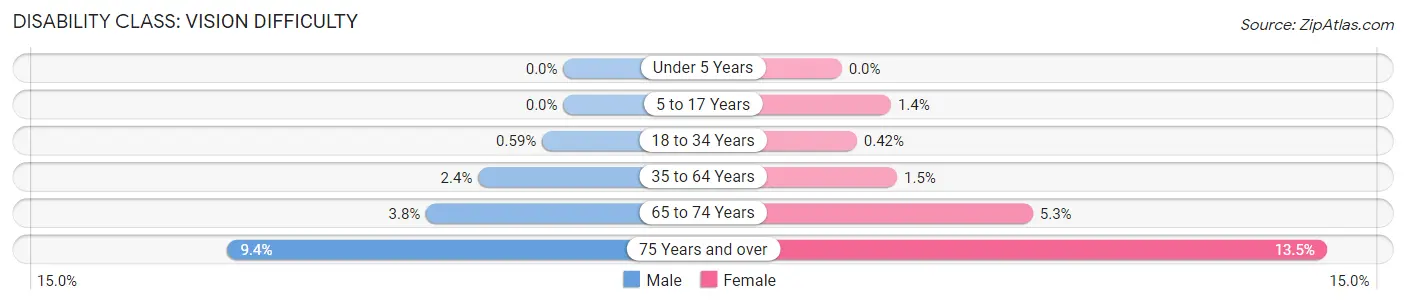
| Age Bracket | Male | Female |
| Under 5 Years | 0 (0.0%) | 0 (0.0%) |
| 5 to 17 Years | 0 (0.0%) | 30 (1.4%) |
| 18 to 34 Years | 14 (0.6%) | 9 (0.4%) |
| 35 to 64 Years | 124 (2.4%) | 78 (1.5%) |
| 65 to 74 Years | 51 (3.8%) | 68 (5.3%) |
| 75 Years and over | 80 (9.3%) | 155 (13.5%) |
Disability Class: Cognitive Difficulty
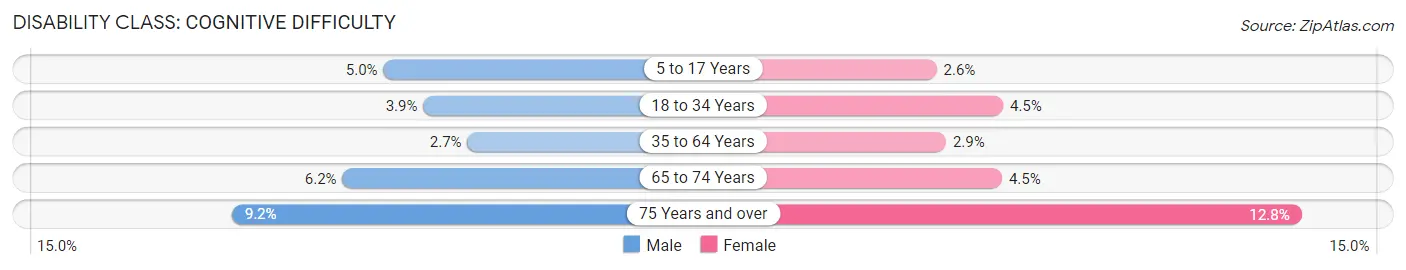
| Age Bracket | Male | Female |
| 5 to 17 Years | 111 (5.0%) | 58 (2.6%) |
| 18 to 34 Years | 93 (3.9%) | 97 (4.5%) |
| 35 to 64 Years | 140 (2.7%) | 147 (2.9%) |
| 65 to 74 Years | 82 (6.1%) | 57 (4.5%) |
| 75 Years and over | 79 (9.2%) | 147 (12.8%) |
Disability Class: Ambulatory Difficulty
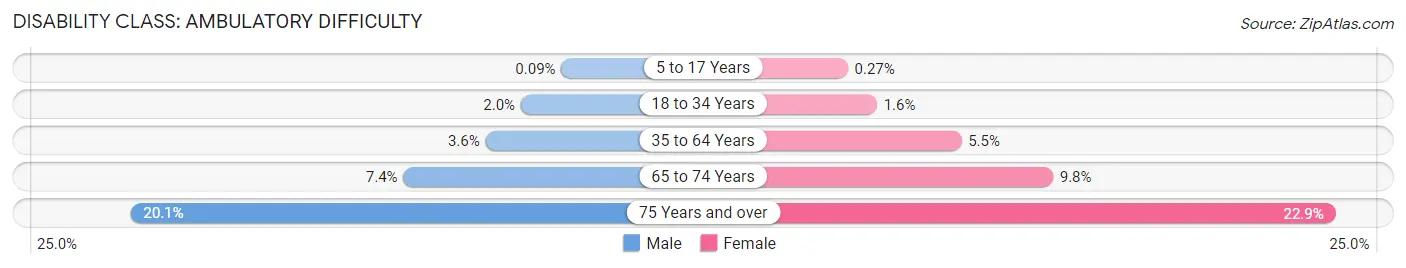
| Age Bracket | Male | Female |
| 5 to 17 Years | 2 (0.1%) | 6 (0.3%) |
| 18 to 34 Years | 47 (2.0%) | 35 (1.6%) |
| 35 to 64 Years | 189 (3.6%) | 281 (5.5%) |
| 65 to 74 Years | 99 (7.4%) | 125 (9.8%) |
| 75 Years and over | 172 (20.1%) | 263 (22.9%) |
Disability Class: Self-Care Difficulty
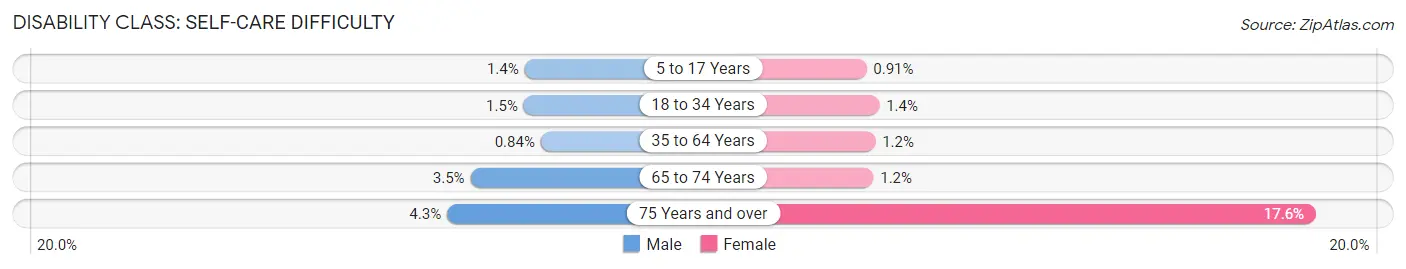
| Age Bracket | Male | Female |
| 5 to 17 Years | 32 (1.4%) | 20 (0.9%) |
| 18 to 34 Years | 35 (1.5%) | 30 (1.4%) |
| 35 to 64 Years | 44 (0.8%) | 63 (1.2%) |
| 65 to 74 Years | 46 (3.5%) | 15 (1.2%) |
| 75 Years and over | 37 (4.3%) | 202 (17.6%) |
Technology Access in Benton County
Computing Device Access in Benton County
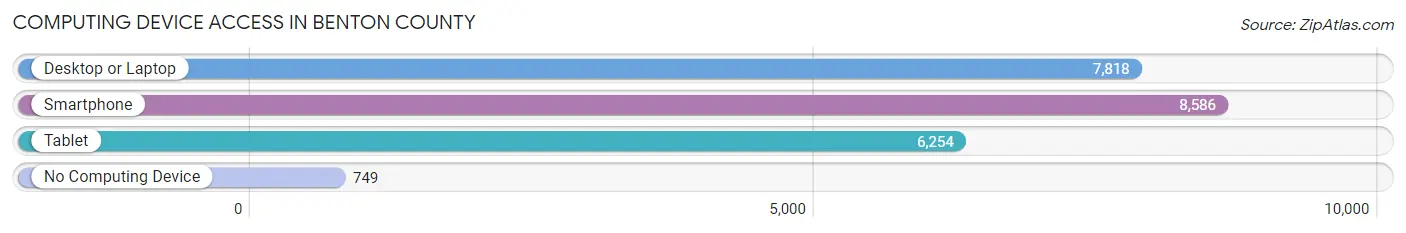
| Device Type | # Households | % Households |
| Desktop or Laptop | 7,818 | 77.3% |
| Smartphone | 8,586 | 84.9% |
| Tablet | 6,254 | 61.8% |
| No Computing Device | 749 | 7.4% |
| Total | 10,114 | 100.0% |
Internet Access in Benton County
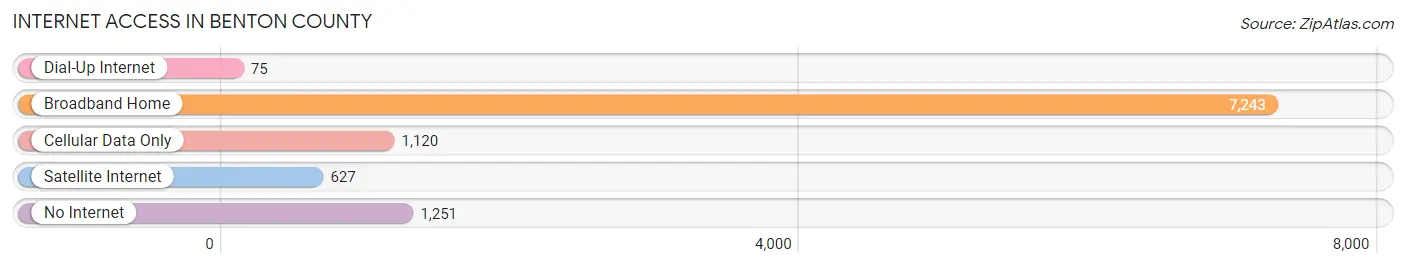
| Internet Type | # Households | % Households |
| Dial-Up Internet | 75 | 0.7% |
| Broadband Home | 7,243 | 71.6% |
| Cellular Data Only | 1,120 | 11.1% |
| Satellite Internet | 627 | 6.2% |
| No Internet | 1,251 | 12.4% |
| Total | 10,114 | 100.0% |
Benton County Summary
Benton County is located in the state of Iowa in the United States. It is part of the Cedar Rapids Metropolitan Statistical Area and is bordered by Tama County to the north, Iowa County to the east, Linn County to the south, and Jones County to the west. The county seat is Vinton, and the largest city is Vinton. As of the 2010 census, the population was 26,076.
Geography
Benton County is located in the rolling hills of east-central Iowa. The county is mostly rural, with small towns and villages scattered throughout. The county is drained by the Cedar River, which flows through the county from north to south. The county is also home to several small lakes, including Lake Macbride, Big Creek Lake, and Otter Creek Lake.
The county has a total area of 576 square miles, of which 574 square miles is land and 2.2 square miles is water. The highest point in the county is located in the northwest corner, at an elevation of 1,092 feet.
History
Benton County was established in 1837 and was named after Thomas Hart Benton, a U.S. Senator from Missouri. The county was originally part of Linn County, but was split off in 1837. The first settlers arrived in the county in 1836, and the county was officially organized in 1839.
The county was largely agricultural in its early years, with corn, oats, and wheat being the main crops. The county also had a thriving livestock industry, with cattle, hogs, and sheep being raised. The county also had several small manufacturing industries, including a flour mill, a sawmill, and a brickyard.
Economy
Benton County is largely agricultural, with corn, soybeans, and oats being the main crops. The county also has a thriving livestock industry, with cattle, hogs, and sheep being raised. The county also has several small manufacturing industries, including a flour mill, a sawmill, and a brickyard.
The county is also home to several large employers, including the Vinton-Shellsburg Community School District, the Benton Community School District, and the Iowa State University Extension Office. The county is also home to several small businesses, including restaurants, retail stores, and service providers.
Demographics
As of the 2010 census, there were 26,076 people, 10,093 households, and 7,072 families living in the county. The population density was 45.3 people per square mile. There were 10,945 housing units at an average density of 19.0 per square mile. The racial makeup of the county was 97.3% White, 0.5% African American, 0.2% Native American, 0.5% Asian, 0.1% Pacific Islander, 0.6% from other races, and 0.8% from two or more races. Hispanic or Latino of any race were 1.7% of the population.
The median income for a household in the county was $48,945, and the median income for a family was $58,945. The per capita income for the county was $23,845. About 5.2% of families and 7.7% of the population were below the poverty line, including 9.2% of those under age 18 and 6.2% of those age 65 or over.
Conclusion
Benton County is a rural county located in east-central Iowa. It is mostly agricultural, with corn, soybeans, and oats being the main crops. The county also has a thriving livestock industry, with cattle, hogs, and sheep being raised. The county also has several small manufacturing industries, including a flour mill, a sawmill, and a brickyard. The county is also home to several large employers, including the Vinton-Shellsburg Community School District, the Benton Community School District, and the Iowa State University Extension Office. As of the 2010 census, the population was 26,076.
Common Questions
What is Per Capita Income in Benton County?
Per Capita income in Benton County is $37,926.
What is the Median Family Income in Benton County?
Median Family Income in Benton County is $95,589.
What is the Median Household income in Benton County?
Median Household Income in Benton County is $79,444.
What is Income or Wage Gap in Benton County?
Income or Wage Gap in Benton County is 29.5%.
Women in Benton County earn 70.5 cents for every dollar earned by a man.
What is Family Income Deficit in Benton County?
Family Income Deficit in Benton County is $8,949.
Families that are below poverty line in Benton County earn $8,949 less on average than the poverty threshold level.
What is Inequality or Gini Index in Benton County?
Inequality or Gini Index in Benton County is 0.39.
What is the Total Population of Benton County?
Total Population of Benton County is 25,652.
What is the Total Male Population of Benton County?
Total Male Population of Benton County is 12,934.
What is the Total Female Population of Benton County?
Total Female Population of Benton County is 12,718.
What is the Ratio of Males per 100 Females in Benton County?
There are 101.70 Males per 100 Females in Benton County.
What is the Ratio of Females per 100 Males in Benton County?
There are 98.33 Females per 100 Males in Benton County.
What is the Median Population Age in Benton County?
Median Population Age in Benton County is 43.0 Years.
What is the Average Family Size in Benton County
Average Family Size in Benton County is 3.0 People.
What is the Average Household Size in Benton County
Average Household Size in Benton County is 2.5 People.
How Large is the Labor Force in Benton County?
There are 13,519 People in the Labor Forcein in Benton County.
What is the Percentage of People in the Labor Force in Benton County?
66.2% of People are in the Labor Force in Benton County.
What is the Unemployment Rate in Benton County?
Unemployment Rate in Benton County is 2.3%.