Ankeny, IA Map & Demographics
Ankeny Map
Ankeny Overview
$46,184
PER CAPITA INCOME
$118,421
AVG FAMILY INCOME
$101,151
AVG HOUSEHOLD INCOME
27.4%
WAGE / INCOME GAP [ % ]
72.6¢/ $1
WAGE / INCOME GAP [ $ ]
$13,259
FAMILY INCOME DEFICIT
0.37
INEQUALITY / GINI INDEX
68,392
TOTAL POPULATION
33,973
MALE POPULATION
34,419
FEMALE POPULATION
98.70
MALES / 100 FEMALES
101.31
FEMALES / 100 MALES
33.3
MEDIAN AGE
3.1
AVG FAMILY SIZE
2.5
AVG HOUSEHOLD SIZE
39,513
LABOR FORCE [ PEOPLE ]
76.2%
PERCENT IN LABOR FORCE
2.6%
UNEMPLOYMENT RATE
Ankeny Area Codes
Income in Ankeny
Income Overview in Ankeny
Per Capita Income in Ankeny is $46,184, while median incomes of families and households are $118,421 and $101,151 respectively.
| Characteristic | Number | Measure |
| Per Capita Income | 68,392 | $46,184 |
| Median Family Income | 17,448 | $118,421 |
| Mean Family Income | 17,448 | $140,263 |
| Median Household Income | 26,525 | $101,151 |
| Mean Household Income | 26,525 | $117,347 |
| Income Deficit | 17,448 | $13,259 |
| Wage / Income Gap (%) | 68,392 | 27.42% |
| Wage / Income Gap ($) | 68,392 | 72.58¢ per $1 |
| Gini / Inequality Index | 68,392 | 0.37 |
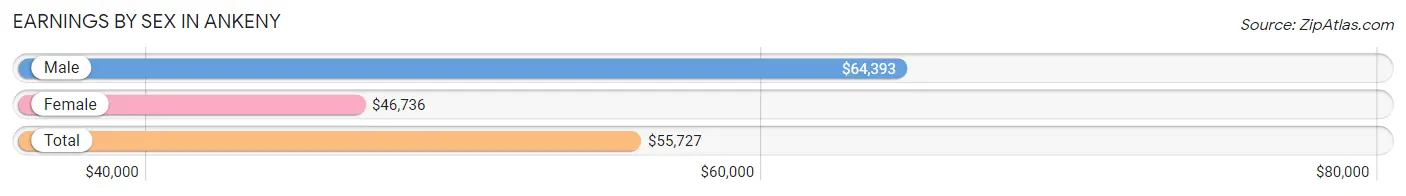
Earnings by Sex in Ankeny
Average Earnings in Ankeny are $55,727, $64,393 for men and $46,736 for women, a difference of 27.4%.
| Sex | Number | Average Earnings |
| Male | 21,815 (52.9%) | $64,393 |
| Female | 19,437 (47.1%) | $46,736 |
| Total | 41,252 (100.0%) | $55,727 |
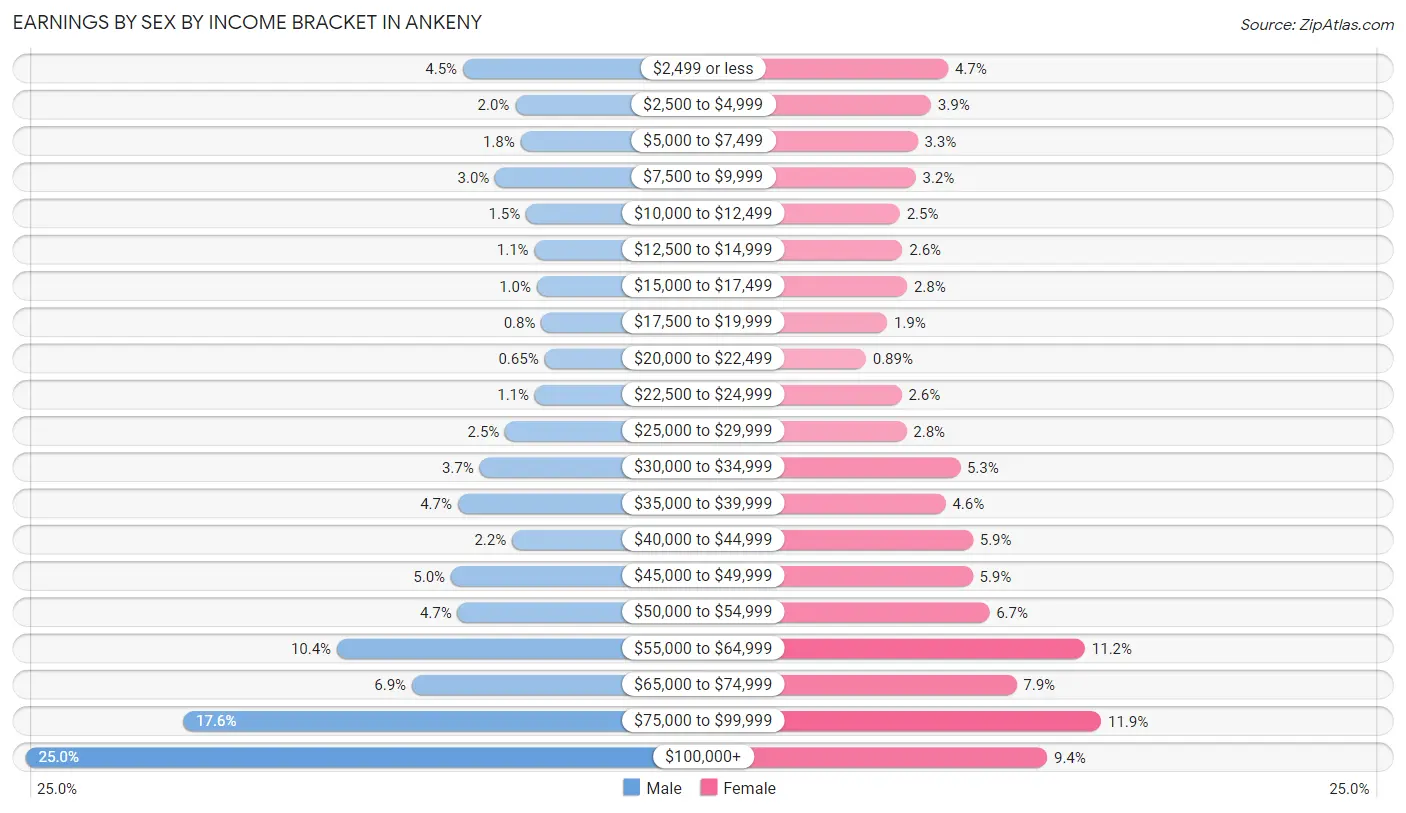
Earnings by Sex by Income Bracket in Ankeny
The most common earnings brackets in Ankeny are $100,000+ for men (5,443 | 24.9%) and $75,000 to $99,999 for women (2,314 | 11.9%).
| Income | Male | Female |
| $2,499 or less | 976 (4.5%) | 921 (4.7%) |
| $2,500 to $4,999 | 440 (2.0%) | 765 (3.9%) |
| $5,000 to $7,499 | 386 (1.8%) | 643 (3.3%) |
| $7,500 to $9,999 | 646 (3.0%) | 626 (3.2%) |
| $10,000 to $12,499 | 329 (1.5%) | 482 (2.5%) |
| $12,500 to $14,999 | 245 (1.1%) | 506 (2.6%) |
| $15,000 to $17,499 | 221 (1.0%) | 549 (2.8%) |
| $17,500 to $19,999 | 174 (0.8%) | 366 (1.9%) |
| $20,000 to $22,499 | 142 (0.6%) | 173 (0.9%) |
| $22,500 to $24,999 | 240 (1.1%) | 498 (2.6%) |
| $25,000 to $29,999 | 544 (2.5%) | 543 (2.8%) |
| $30,000 to $34,999 | 805 (3.7%) | 1,031 (5.3%) |
| $35,000 to $39,999 | 1,028 (4.7%) | 898 (4.6%) |
| $40,000 to $44,999 | 474 (2.2%) | 1,146 (5.9%) |
| $45,000 to $49,999 | 1,098 (5.0%) | 1,145 (5.9%) |
| $50,000 to $54,999 | 1,029 (4.7%) | 1,297 (6.7%) |
| $55,000 to $64,999 | 2,262 (10.4%) | 2,168 (11.2%) |
| $65,000 to $74,999 | 1,497 (6.9%) | 1,543 (7.9%) |
| $75,000 to $99,999 | 3,836 (17.6%) | 2,314 (11.9%) |
| $100,000+ | 5,443 (24.9%) | 1,823 (9.4%) |
| Total | 21,815 (100.0%) | 19,437 (100.0%) |
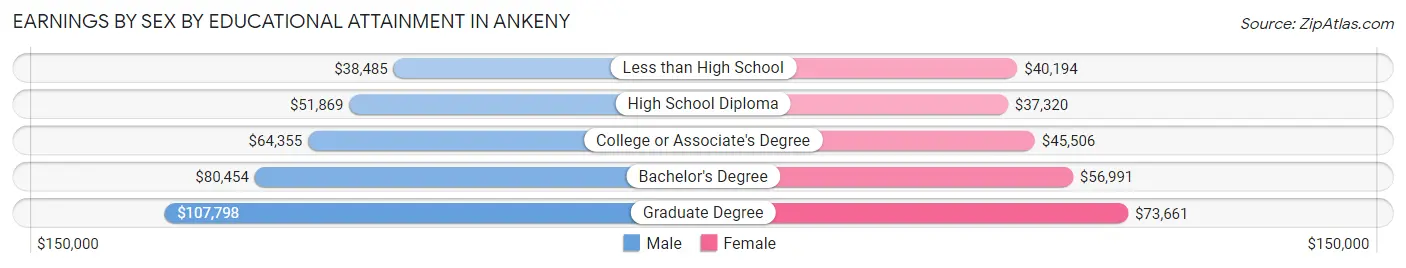
Earnings by Sex by Educational Attainment in Ankeny
Average earnings in Ankeny are $75,633 for men and $52,569 for women, a difference of 30.5%. Men with an educational attainment of graduate degree enjoy the highest average annual earnings of $107,798, while those with less than high school education earn the least with $38,485. Women with an educational attainment of graduate degree earn the most with the average annual earnings of $73,661, while those with high school diploma education have the smallest earnings of $37,320.
| Educational Attainment | Male Income | Female Income |
| Less than High School | $38,485 | $40,194 |
| High School Diploma | $51,869 | $37,320 |
| College or Associate's Degree | $64,355 | $45,506 |
| Bachelor's Degree | $80,454 | $56,991 |
| Graduate Degree | $107,798 | $73,661 |
| Total | $75,633 | $52,569 |
Family Income in Ankeny
Family Income Brackets in Ankeny
According to the Ankeny family income data, there are 5,653 families falling into the $100,000 to $149,999 income range, which is the most common income bracket and makes up 32.4% of all families. Conversely, the $10,000 to $14,999 income bracket is the least frequent group with only 35 families (0.2%) belonging to this category.
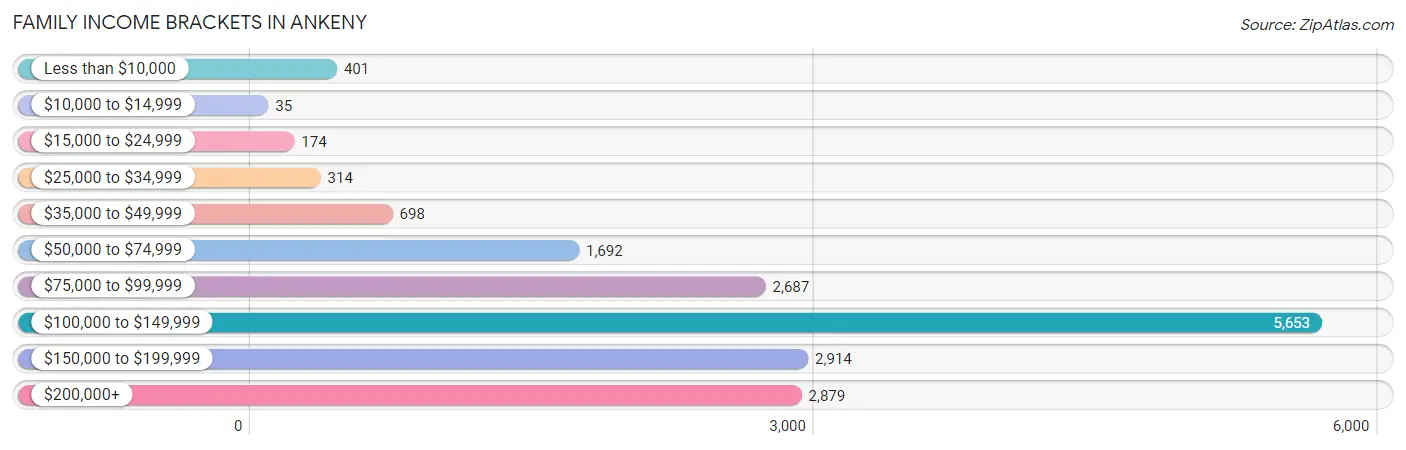
| Income Bracket | # Families | % Families |
| Less than $10,000 | 401 | 2.3% |
| $10,000 to $14,999 | 35 | 0.2% |
| $15,000 to $24,999 | 174 | 1.0% |
| $25,000 to $34,999 | 314 | 1.8% |
| $35,000 to $49,999 | 698 | 4.0% |
| $50,000 to $74,999 | 1,692 | 9.7% |
| $75,000 to $99,999 | 2,687 | 15.4% |
| $100,000 to $149,999 | 5,653 | 32.4% |
| $150,000 to $199,999 | 2,914 | 16.7% |
| $200,000+ | 2,879 | 16.5% |
Family Income by Famaliy Size in Ankeny
7+ person families (100 | 0.6%) account for the highest median family income in Ankeny with $178,529 per family, while 2-person families (7,695 | 44.1%) have the highest median income of $53,517 per family member.
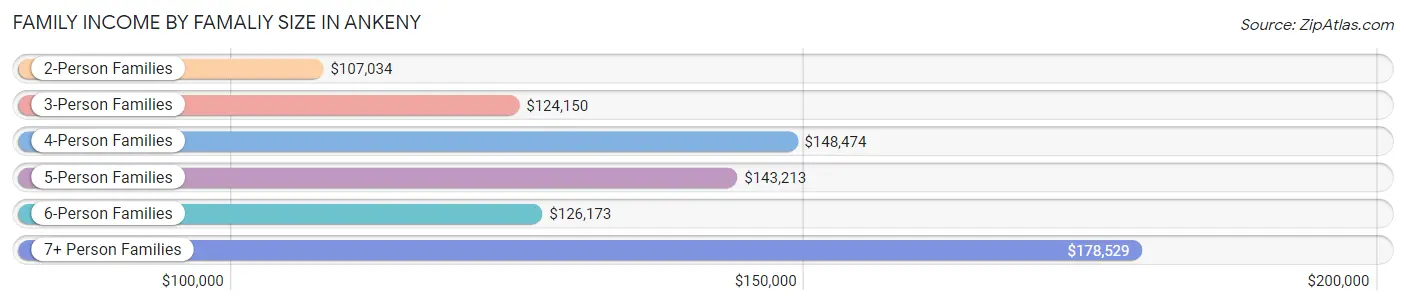
| Income Bracket | # Families | Median Income |
| 2-Person Families | 7,695 (44.1%) | $107,034 |
| 3-Person Families | 3,203 (18.4%) | $124,150 |
| 4-Person Families | 3,883 (22.3%) | $148,474 |
| 5-Person Families | 2,053 (11.8%) | $143,213 |
| 6-Person Families | 514 (2.9%) | $126,173 |
| 7+ Person Families | 100 (0.6%) | $178,529 |
| Total | 17,448 (100.0%) | $118,421 |
Family Income by Number of Earners in Ankeny
The median family income in Ankeny is $118,421, with families comprising 3+ earners (2,178) having the highest median family income of $178,910, while families with no earners (1,635) have the lowest median family income of $75,442, accounting for 12.5% and 9.4% of families, respectively.
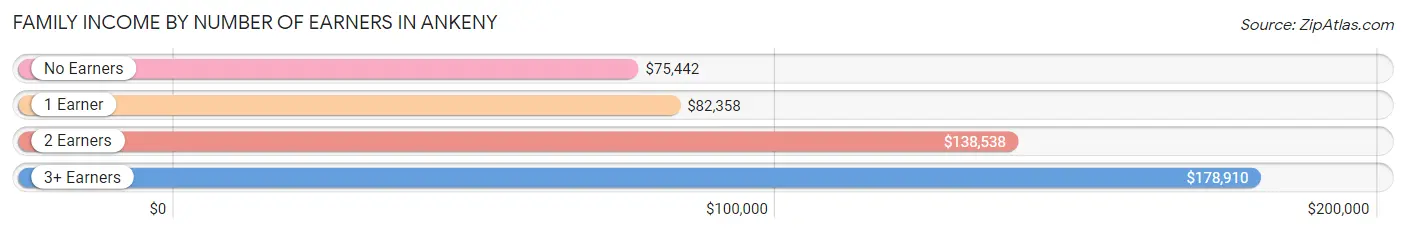
| Number of Earners | # Families | Median Income |
| No Earners | 1,635 (9.4%) | $75,442 |
| 1 Earner | 3,836 (22.0%) | $82,358 |
| 2 Earners | 9,799 (56.2%) | $138,538 |
| 3+ Earners | 2,178 (12.5%) | $178,910 |
| Total | 17,448 (100.0%) | $118,421 |
Household Income in Ankeny
Household Income Brackets in Ankeny
With 6,817 households falling in the category, the $100,000 to $149,999 income range is the most frequent in Ankeny, accounting for 25.7% of all households. In contrast, only 345 households (1.3%) fall into the $10,000 to $14,999 income bracket, making it the least populous group.
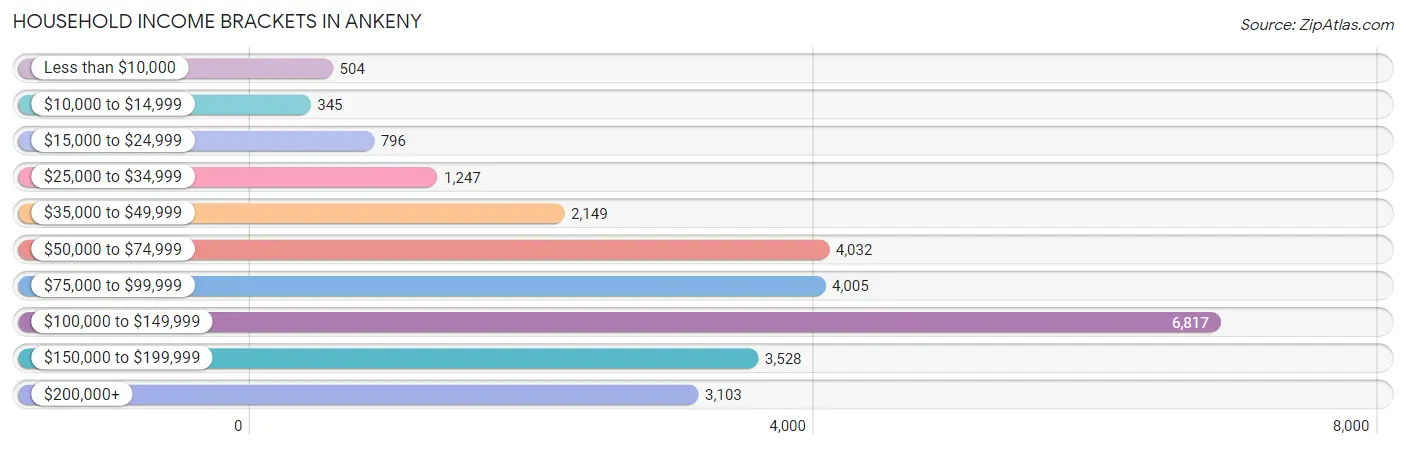
| Income Bracket | # Households | % Households |
| Less than $10,000 | 504 | 1.9% |
| $10,000 to $14,999 | 345 | 1.3% |
| $15,000 to $24,999 | 796 | 3.0% |
| $25,000 to $34,999 | 1,247 | 4.7% |
| $35,000 to $49,999 | 2,149 | 8.1% |
| $50,000 to $74,999 | 4,032 | 15.2% |
| $75,000 to $99,999 | 4,005 | 15.1% |
| $100,000 to $149,999 | 6,817 | 25.7% |
| $150,000 to $199,999 | 3,528 | 13.3% |
| $200,000+ | 3,103 | 11.7% |
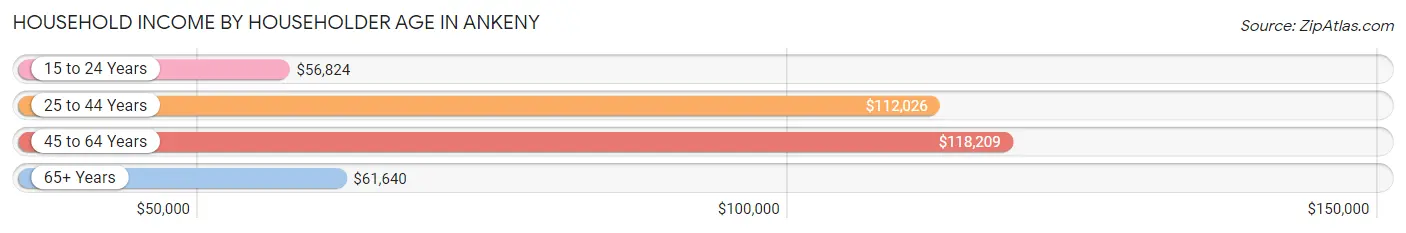
Household Income by Householder Age in Ankeny
The median household income in Ankeny is $101,151, with the highest median household income of $118,209 found in the 45 to 64 years age bracket for the primary householder. A total of 7,970 households (30.0%) fall into this category. Meanwhile, the 15 to 24 years age bracket for the primary householder has the lowest median household income of $56,824, with 1,787 households (6.7%) in this group.
| Income Bracket | # Households | Median Income |
| 15 to 24 Years | 1,787 (6.7%) | $56,824 |
| 25 to 44 Years | 12,021 (45.3%) | $112,026 |
| 45 to 64 Years | 7,970 (30.0%) | $118,209 |
| 65+ Years | 4,747 (17.9%) | $61,640 |
| Total | 26,525 (100.0%) | $101,151 |
Poverty in Ankeny
Income Below Poverty by Sex and Age in Ankeny
With 3.9% poverty level for males and 5.6% for females among the residents of Ankeny, under 5 year old males and 18 to 24 year old females are the most vulnerable to poverty, with 348 males (14.1%) and 764 females (26.7%) in their respective age groups living below the poverty level.
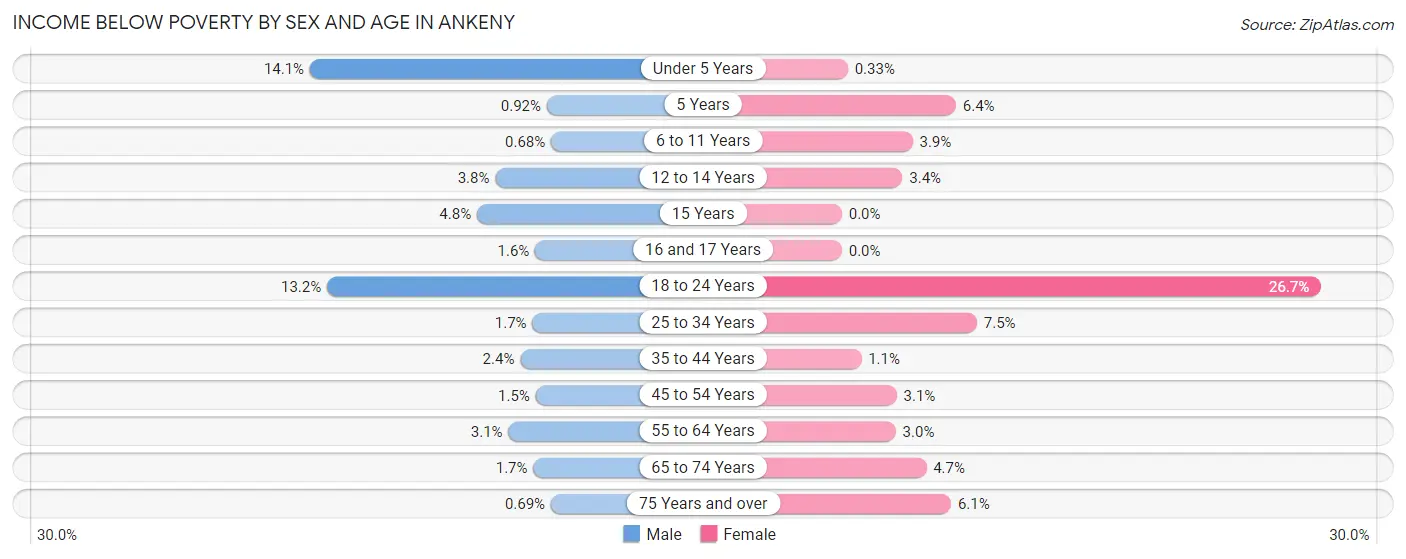
| Age Bracket | Male | Female |
| Under 5 Years | 348 (14.1%) | 8 (0.3%) |
| 5 Years | 5 (0.9%) | 35 (6.4%) |
| 6 to 11 Years | 23 (0.7%) | 125 (3.9%) |
| 12 to 14 Years | 60 (3.8%) | 51 (3.4%) |
| 15 Years | 20 (4.8%) | 0 (0.0%) |
| 16 and 17 Years | 16 (1.6%) | 0 (0.0%) |
| 18 to 24 Years | 405 (13.2%) | 764 (26.7%) |
| 25 to 34 Years | 95 (1.7%) | 429 (7.5%) |
| 35 to 44 Years | 132 (2.4%) | 59 (1.1%) |
| 45 to 54 Years | 64 (1.5%) | 125 (3.0%) |
| 55 to 64 Years | 88 (3.1%) | 76 (3.0%) |
| 65 to 74 Years | 31 (1.7%) | 121 (4.7%) |
| 75 Years and over | 8 (0.7%) | 117 (6.1%) |
| Total | 1,295 (3.9%) | 1,910 (5.6%) |
Income Above Poverty by Sex and Age in Ankeny
According to the poverty statistics in Ankeny, males aged 6 to 11 years and females aged 15 years are the age groups that are most secure financially, with 99.3% of males and 100.0% of females in these age groups living above the poverty line.
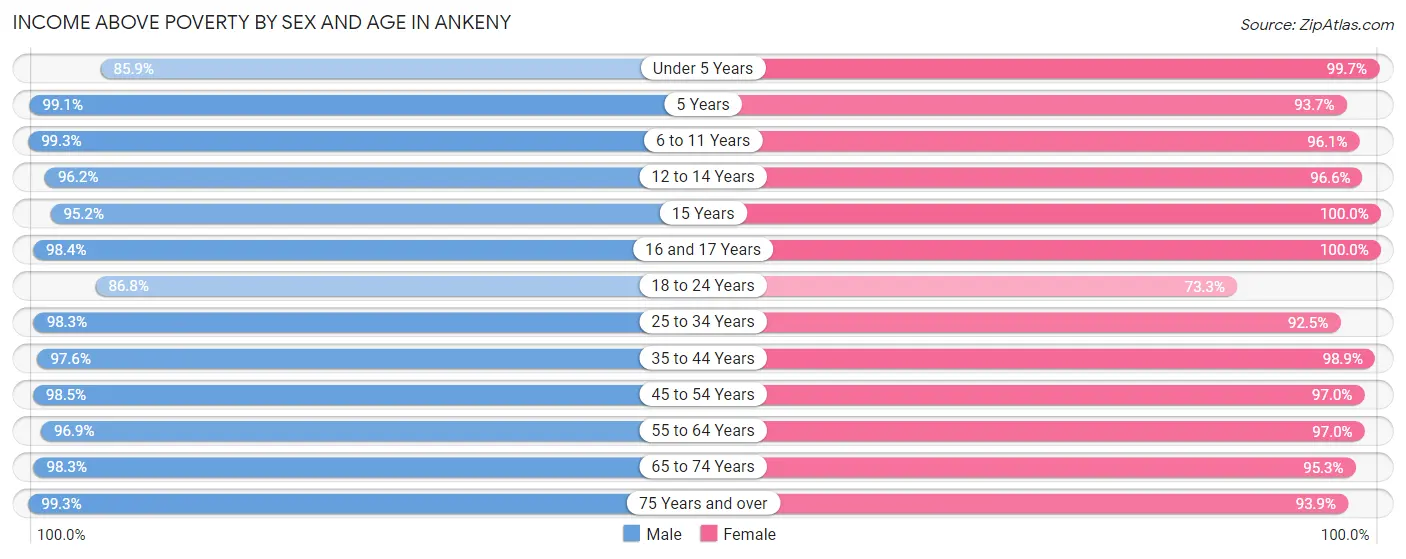
| Age Bracket | Male | Female |
| Under 5 Years | 2,119 (85.9%) | 2,446 (99.7%) |
| 5 Years | 537 (99.1%) | 516 (93.6%) |
| 6 to 11 Years | 3,347 (99.3%) | 3,050 (96.1%) |
| 12 to 14 Years | 1,524 (96.2%) | 1,461 (96.6%) |
| 15 Years | 396 (95.2%) | 317 (100.0%) |
| 16 and 17 Years | 1,004 (98.4%) | 861 (100.0%) |
| 18 to 24 Years | 2,672 (86.8%) | 2,099 (73.3%) |
| 25 to 34 Years | 5,432 (98.3%) | 5,278 (92.5%) |
| 35 to 44 Years | 5,365 (97.6%) | 5,391 (98.9%) |
| 45 to 54 Years | 4,102 (98.5%) | 3,967 (97.0%) |
| 55 to 64 Years | 2,786 (96.9%) | 2,459 (97.0%) |
| 65 to 74 Years | 1,822 (98.3%) | 2,453 (95.3%) |
| 75 Years and over | 1,147 (99.3%) | 1,807 (93.9%) |
| Total | 32,253 (96.1%) | 32,105 (94.4%) |
Income Below Poverty Among Married-Couple Families in Ankeny
The poverty statistics for married-couple families in Ankeny show that 0.3% or 45 of the total 14,832 families live below the poverty line. Families with 5 or more children have the highest poverty rate of 8.6%, comprising of 5 families. On the other hand, families with 1 or 2 children have the lowest poverty rate of 0.0%, which includes 0 families.
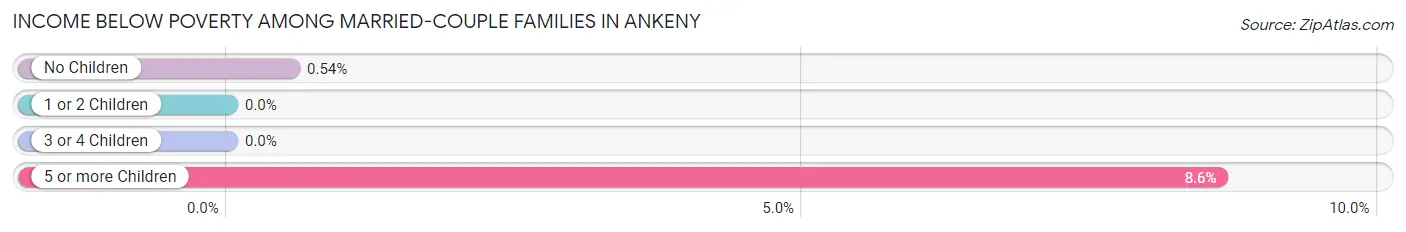
| Children | Above Poverty | Below Poverty |
| No Children | 7,331 (99.5%) | 40 (0.5%) |
| 1 or 2 Children | 5,325 (100.0%) | 0 (0.0%) |
| 3 or 4 Children | 2,078 (100.0%) | 0 (0.0%) |
| 5 or more Children | 53 (91.4%) | 5 (8.6%) |
| Total | 14,787 (99.7%) | 45 (0.3%) |
Income Below Poverty Among Single-Parent Households in Ankeny
According to the poverty data in Ankeny, 18.3% or 126 single-father households and 19.0% or 366 single-mother households are living below the poverty line. Among single-father households, those with 1 or 2 children have the highest poverty rate, with 126 households (29.3%) experiencing poverty. Likewise, among single-mother households, those with 1 or 2 children have the highest poverty rate, with 336 households (26.3%) falling below the poverty line.
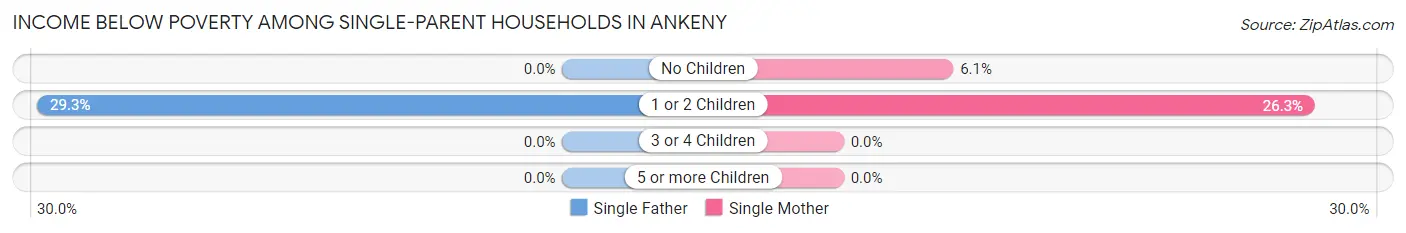
| Children | Single Father | Single Mother |
| No Children | 0 (0.0%) | 30 (6.1%) |
| 1 or 2 Children | 126 (29.3%) | 336 (26.3%) |
| 3 or 4 Children | 0 (0.0%) | 0 (0.0%) |
| 5 or more Children | 0 (0.0%) | 0 (0.0%) |
| Total | 126 (18.3%) | 366 (19.0%) |
Income Below Poverty Among Married-Couple vs Single-Parent Households in Ankeny
The poverty data for Ankeny shows that 45 of the married-couple family households (0.3%) and 492 of the single-parent households (18.8%) are living below the poverty level. Within the married-couple family households, those with 5 or more children have the highest poverty rate, with 5 households (8.6%) falling below the poverty line. Among the single-parent households, those with 1 or 2 children have the highest poverty rate, with 462 household (27.1%) living below poverty.
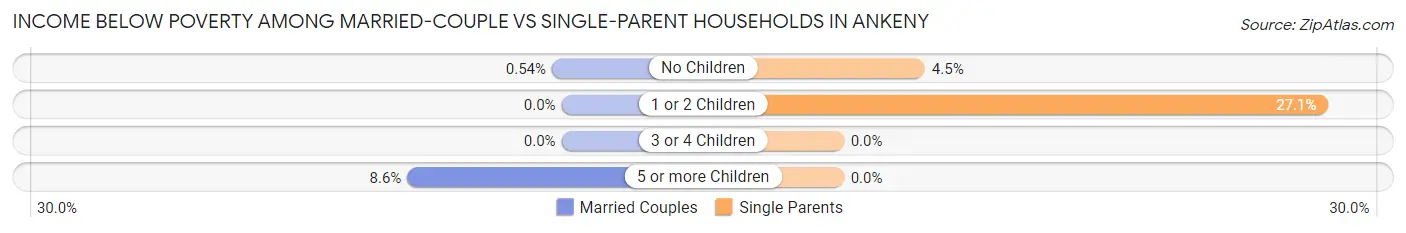
| Children | Married-Couple Families | Single-Parent Households |
| No Children | 40 (0.5%) | 30 (4.5%) |
| 1 or 2 Children | 0 (0.0%) | 462 (27.1%) |
| 3 or 4 Children | 0 (0.0%) | 0 (0.0%) |
| 5 or more Children | 5 (8.6%) | 0 (0.0%) |
| Total | 45 (0.3%) | 492 (18.8%) |
Race in Ankeny
The most populous races in Ankeny are White / Caucasian (62,024 | 90.7%), Two or more Races (2,939 | 4.3%), and Hispanic or Latino (2,566 | 3.7%).
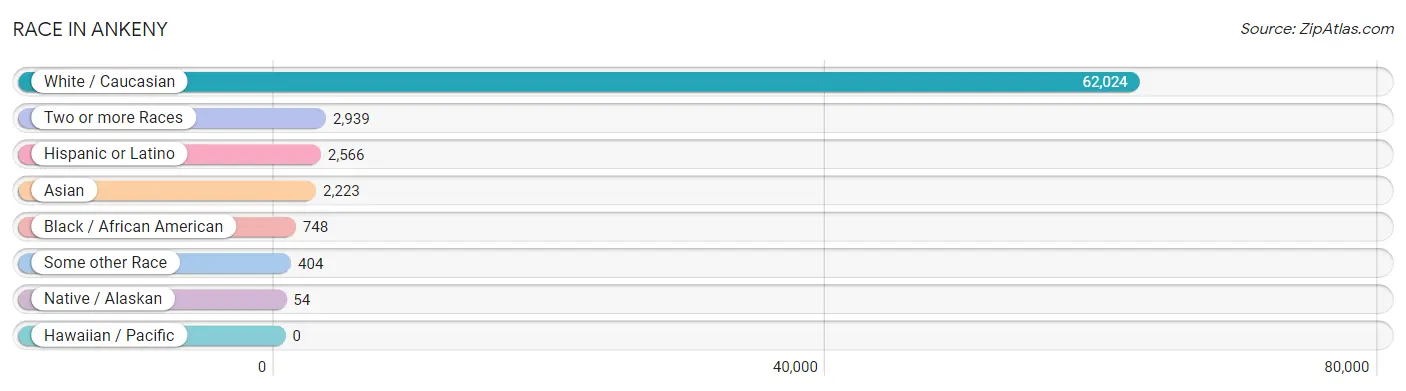
| Race | # Population | % Population |
| Asian | 2,223 | 3.3% |
| Black / African American | 748 | 1.1% |
| Hawaiian / Pacific | 0 | 0.0% |
| Hispanic or Latino | 2,566 | 3.7% |
| Native / Alaskan | 54 | 0.1% |
| White / Caucasian | 62,024 | 90.7% |
| Two or more Races | 2,939 | 4.3% |
| Some other Race | 404 | 0.6% |
| Total | 68,392 | 100.0% |
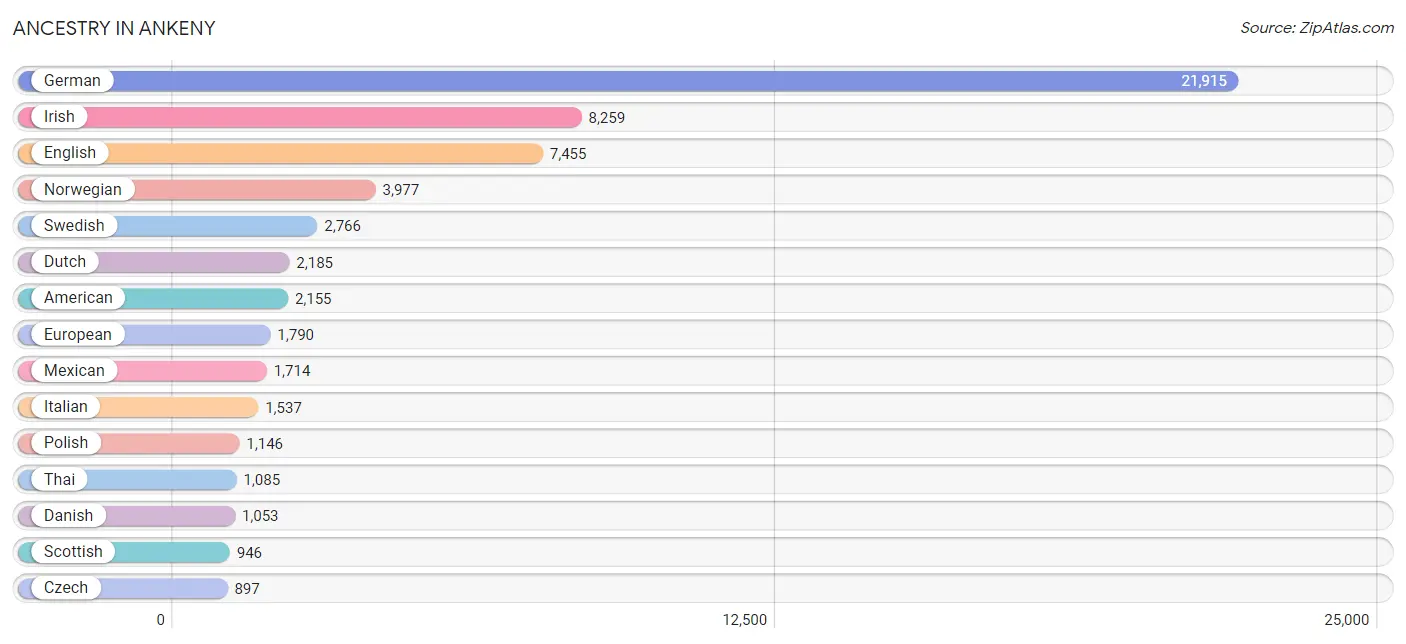
Ancestry in Ankeny
The most populous ancestries reported in Ankeny are German (21,915 | 32.0%), Irish (8,259 | 12.1%), English (7,455 | 10.9%), Norwegian (3,977 | 5.8%), and Swedish (2,766 | 4.0%), together accounting for 64.9% of all Ankeny residents.
| Ancestry | # Population | % Population |
| African | 356 | 0.5% |
| Alaskan Athabascan | 14 | 0.0% |
| Albanian | 5 | 0.0% |
| American | 2,155 | 3.2% |
| Arab | 275 | 0.4% |
| Argentinean | 14 | 0.0% |
| Austrian | 103 | 0.2% |
| Belgian | 57 | 0.1% |
| Bhutanese | 167 | 0.2% |
| British | 485 | 0.7% |
| Bulgarian | 11 | 0.0% |
| Burmese | 537 | 0.8% |
| Canadian | 21 | 0.0% |
| Central American | 171 | 0.3% |
| Cherokee | 55 | 0.1% |
| Chippewa | 3 | 0.0% |
| Choctaw | 25 | 0.0% |
| Colombian | 176 | 0.3% |
| Cree | 17 | 0.0% |
| Croatian | 63 | 0.1% |
| Czech | 897 | 1.3% |
| Czechoslovakian | 52 | 0.1% |
| Danish | 1,053 | 1.5% |
| Dutch | 2,185 | 3.2% |
| Eastern European | 102 | 0.2% |
| Egyptian | 102 | 0.2% |
| English | 7,455 | 10.9% |
| European | 1,790 | 2.6% |
| Filipino | 10 | 0.0% |
| Finnish | 34 | 0.1% |
| French | 834 | 1.2% |
| French Canadian | 94 | 0.1% |
| German | 21,915 | 32.0% |
| Greek | 145 | 0.2% |
| Guatemalan | 1 | 0.0% |
| Hungarian | 450 | 0.7% |
| Indian (Asian) | 134 | 0.2% |
| Irish | 8,259 | 12.1% |
| Italian | 1,537 | 2.2% |
| Jamaican | 81 | 0.1% |
| Jordanian | 60 | 0.1% |
| Kiowa | 37 | 0.1% |
| Korean | 214 | 0.3% |
| Latvian | 8 | 0.0% |
| Lithuanian | 15 | 0.0% |
| Luxembourger | 298 | 0.4% |
| Malaysian | 240 | 0.4% |
| Mexican | 1,714 | 2.5% |
| Native Hawaiian | 64 | 0.1% |
| Navajo | 11 | 0.0% |
| New Zealander | 34 | 0.1% |
| Nicaraguan | 76 | 0.1% |
| Northern European | 359 | 0.5% |
| Norwegian | 3,977 | 5.8% |
| Pakistani | 99 | 0.1% |
| Pennsylvania German | 24 | 0.0% |
| Polish | 1,146 | 1.7% |
| Portuguese | 22 | 0.0% |
| Pueblo | 37 | 0.1% |
| Puerto Rican | 303 | 0.4% |
| Russian | 274 | 0.4% |
| Salvadoran | 94 | 0.1% |
| Scandinavian | 883 | 1.3% |
| Scotch-Irish | 390 | 0.6% |
| Scottish | 946 | 1.4% |
| Serbian | 8 | 0.0% |
| Sioux | 8 | 0.0% |
| Slovak | 119 | 0.2% |
| Slovene | 26 | 0.0% |
| South American | 226 | 0.3% |
| Spaniard | 40 | 0.1% |
| Spanish | 34 | 0.1% |
| Sri Lankan | 451 | 0.7% |
| Subsaharan African | 448 | 0.7% |
| Swedish | 2,766 | 4.0% |
| Swiss | 340 | 0.5% |
| Thai | 1,085 | 1.6% |
| Turkish | 29 | 0.0% |
| Ukrainian | 168 | 0.3% |
| Venezuelan | 36 | 0.1% |
| Welsh | 564 | 0.8% |
| Yugoslavian | 622 | 0.9% | View All 82 Rows |
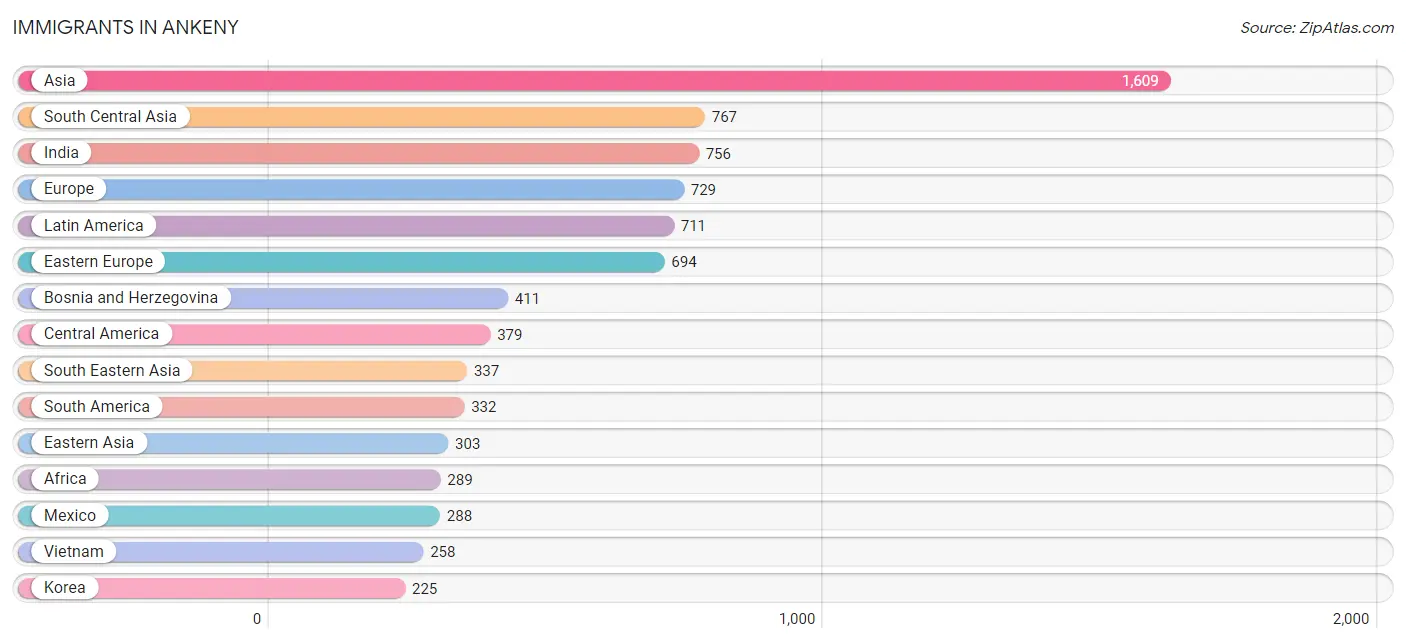
Immigrants in Ankeny
The most numerous immigrant groups reported in Ankeny came from Asia (1,609 | 2.4%), South Central Asia (767 | 1.1%), India (756 | 1.1%), Europe (729 | 1.1%), and Latin America (711 | 1.0%), together accounting for 6.7% of all Ankeny residents.
| Immigration Origin | # Population | % Population |
| Africa | 289 | 0.4% |
| Asia | 1,609 | 2.4% |
| Bosnia and Herzegovina | 411 | 0.6% |
| Brazil | 41 | 0.1% |
| Bulgaria | 11 | 0.0% |
| Cameroon | 14 | 0.0% |
| Canada | 30 | 0.0% |
| Central America | 379 | 0.5% |
| China | 23 | 0.0% |
| Colombia | 151 | 0.2% |
| Congo | 105 | 0.2% |
| Croatia | 30 | 0.0% |
| Eastern Africa | 62 | 0.1% |
| Eastern Asia | 303 | 0.4% |
| Eastern Europe | 694 | 1.0% |
| Egypt | 21 | 0.0% |
| El Salvador | 14 | 0.0% |
| England | 11 | 0.0% |
| Europe | 729 | 1.1% |
| Germany | 7 | 0.0% |
| Guatemala | 1 | 0.0% |
| India | 756 | 1.1% |
| Italy | 17 | 0.0% |
| Japan | 55 | 0.1% |
| Jordan | 75 | 0.1% |
| Korea | 225 | 0.3% |
| Laos | 10 | 0.0% |
| Latin America | 711 | 1.0% |
| Liberia | 40 | 0.1% |
| Mexico | 288 | 0.4% |
| Middle Africa | 119 | 0.2% |
| Nepal | 11 | 0.0% |
| Nicaragua | 76 | 0.1% |
| Northern Africa | 21 | 0.0% |
| Northern Europe | 11 | 0.0% |
| Oceania | 15 | 0.0% |
| Philippines | 50 | 0.1% |
| Poland | 51 | 0.1% |
| Russia | 43 | 0.1% |
| South America | 332 | 0.5% |
| South Central Asia | 767 | 1.1% |
| South Eastern Asia | 337 | 0.5% |
| Southern Europe | 17 | 0.0% |
| Thailand | 19 | 0.0% |
| Turkey | 14 | 0.0% |
| Uganda | 11 | 0.0% |
| Ukraine | 148 | 0.2% |
| Uruguay | 131 | 0.2% |
| Venezuela | 9 | 0.0% |
| Vietnam | 258 | 0.4% |
| Western Africa | 40 | 0.1% |
| Western Asia | 202 | 0.3% |
| Western Europe | 7 | 0.0% | View All 53 Rows |
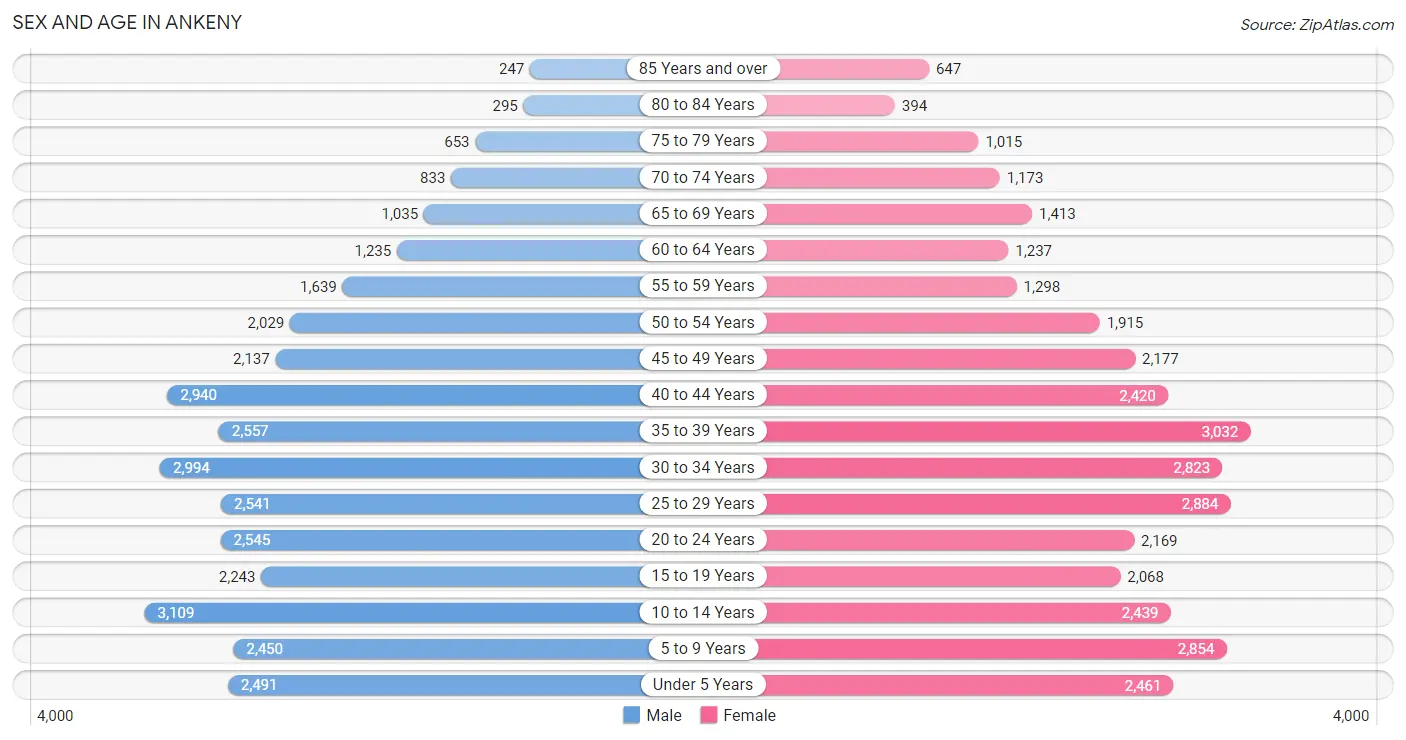
Sex and Age in Ankeny
Sex and Age in Ankeny
The most populous age groups in Ankeny are 10 to 14 Years (3,109 | 9.1%) for men and 35 to 39 Years (3,032 | 8.8%) for women.
| Age Bracket | Male | Female |
| Under 5 Years | 2,491 (7.3%) | 2,461 (7.1%) |
| 5 to 9 Years | 2,450 (7.2%) | 2,854 (8.3%) |
| 10 to 14 Years | 3,109 (9.1%) | 2,439 (7.1%) |
| 15 to 19 Years | 2,243 (6.6%) | 2,068 (6.0%) |
| 20 to 24 Years | 2,545 (7.5%) | 2,169 (6.3%) |
| 25 to 29 Years | 2,541 (7.5%) | 2,884 (8.4%) |
| 30 to 34 Years | 2,994 (8.8%) | 2,823 (8.2%) |
| 35 to 39 Years | 2,557 (7.5%) | 3,032 (8.8%) |
| 40 to 44 Years | 2,940 (8.6%) | 2,420 (7.0%) |
| 45 to 49 Years | 2,137 (6.3%) | 2,177 (6.3%) |
| 50 to 54 Years | 2,029 (6.0%) | 1,915 (5.6%) |
| 55 to 59 Years | 1,639 (4.8%) | 1,298 (3.8%) |
| 60 to 64 Years | 1,235 (3.6%) | 1,237 (3.6%) |
| 65 to 69 Years | 1,035 (3.0%) | 1,413 (4.1%) |
| 70 to 74 Years | 833 (2.5%) | 1,173 (3.4%) |
| 75 to 79 Years | 653 (1.9%) | 1,015 (2.9%) |
| 80 to 84 Years | 295 (0.9%) | 394 (1.1%) |
| 85 Years and over | 247 (0.7%) | 647 (1.9%) |
| Total | 33,973 (100.0%) | 34,419 (100.0%) |
Families and Households in Ankeny
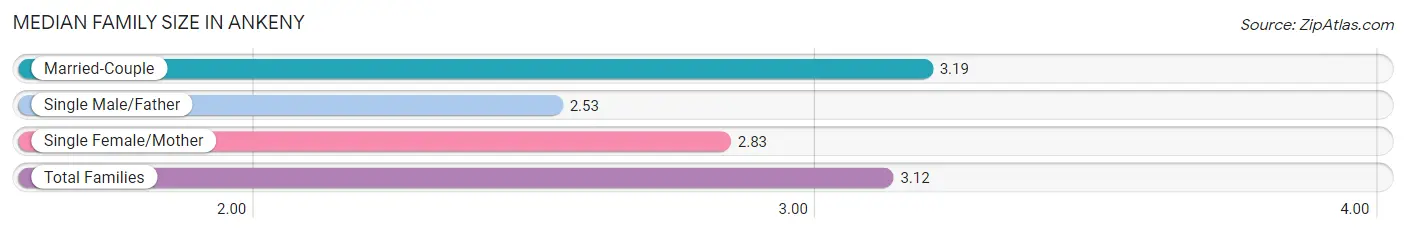
Median Family Size in Ankeny
The median family size in Ankeny is 3.12 persons per family, with married-couple families (14,832 | 85.0%) accounting for the largest median family size of 3.19 persons per family. On the other hand, single male/father families (689 | 4.0%) represent the smallest median family size with 2.53 persons per family.
| Family Type | # Families | Family Size |
| Married-Couple | 14,832 (85.0%) | 3.19 |
| Single Male/Father | 689 (4.0%) | 2.53 |
| Single Female/Mother | 1,927 (11.0%) | 2.83 |
| Total Families | 17,448 (100.0%) | 3.12 |
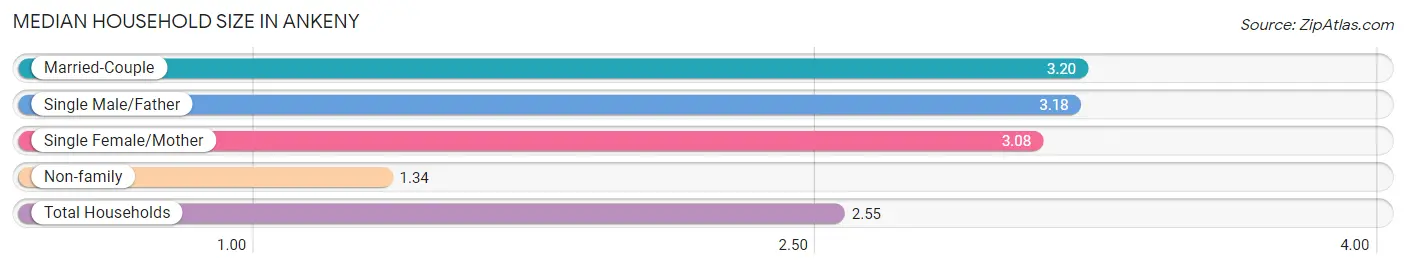
Median Household Size in Ankeny
The median household size in Ankeny is 2.55 persons per household, with married-couple households (14,832 | 55.9%) accounting for the largest median household size of 3.2 persons per household. non-family households (9,077 | 34.2%) represent the smallest median household size with 1.34 persons per household.
| Household Type | # Households | Household Size |
| Married-Couple | 14,832 (55.9%) | 3.20 |
| Single Male/Father | 689 (2.6%) | 3.18 |
| Single Female/Mother | 1,927 (7.3%) | 3.08 |
| Non-family | 9,077 (34.2%) | 1.34 |
| Total Households | 26,525 (100.0%) | 2.55 |
Household Size by Marriage Status in Ankeny
Out of a total of 26,525 households in Ankeny, 17,448 (65.8%) are family households, while 9,077 (34.2%) are nonfamily households. The most numerous type of family households are 2-person households, comprising 7,190, and the most common type of nonfamily households are 1-person households, comprising 6,794.
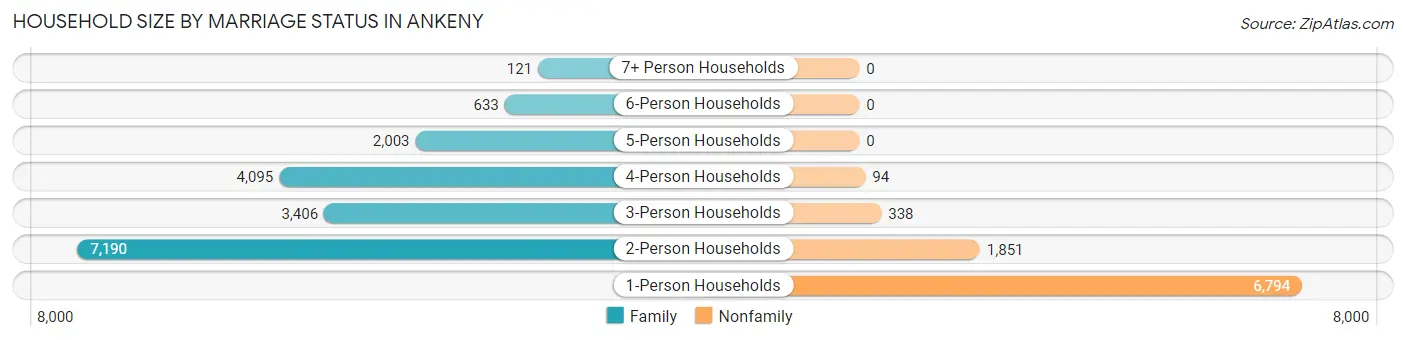
| Household Size | Family Households | Nonfamily Households |
| 1-Person Households | - | 6,794 (25.6%) |
| 2-Person Households | 7,190 (27.1%) | 1,851 (7.0%) |
| 3-Person Households | 3,406 (12.8%) | 338 (1.3%) |
| 4-Person Households | 4,095 (15.4%) | 94 (0.4%) |
| 5-Person Households | 2,003 (7.5%) | 0 (0.0%) |
| 6-Person Households | 633 (2.4%) | 0 (0.0%) |
| 7+ Person Households | 121 (0.5%) | 0 (0.0%) |
| Total | 17,448 (65.8%) | 9,077 (34.2%) |
Female Fertility in Ankeny
Fertility by Age in Ankeny
Average fertility rate in Ankeny is 39.0 births per 1,000 women. Women in the age bracket of 20 to 34 years have the highest fertility rate with 57.0 births per 1,000 women. Women in the age bracket of 20 to 34 years acount for 63.5% of all women with births.
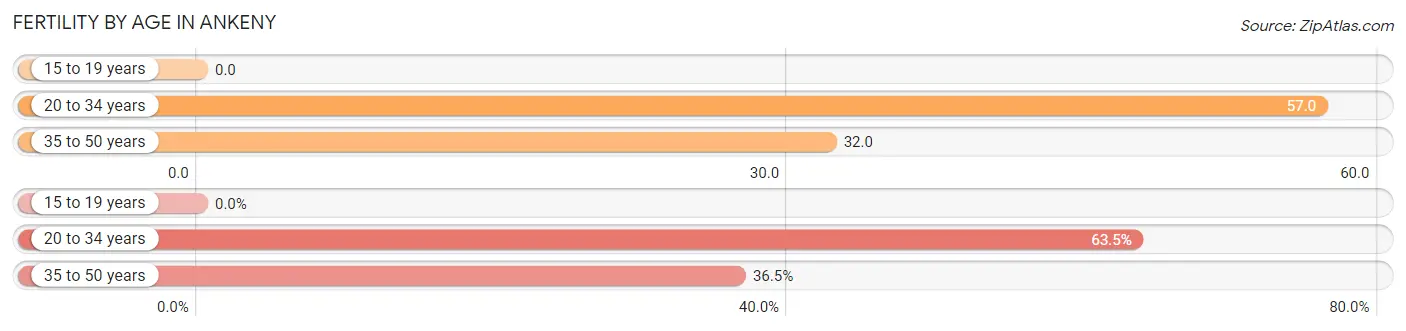
| Age Bracket | Women with Births | Births / 1,000 Women |
| 15 to 19 years | 0 (0.0%) | 0.0 |
| 20 to 34 years | 447 (63.5%) | 57.0 |
| 35 to 50 years | 257 (36.5%) | 32.0 |
| Total | 704 (100.0%) | 39.0 |
Fertility by Age by Marriage Status in Ankeny
89.2% of women with births (704) in Ankeny are married. The highest percentage of unmarried women with births falls into 35 to 50 years age bracket with 14.0% of them unmarried at the time of birth, while the lowest percentage of unmarried women with births belong to 20 to 34 years age bracket with 9.0% of them unmarried.
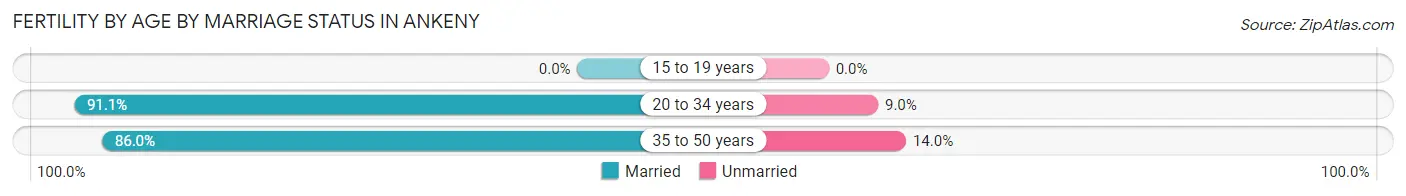
| Age Bracket | Married | Unmarried |
| 15 to 19 years | 0 (0.0%) | 0 (0.0%) |
| 20 to 34 years | 407 (91.0%) | 40 (8.9%) |
| 35 to 50 years | 221 (86.0%) | 36 (14.0%) |
| Total | 628 (89.2%) | 76 (10.8%) |
Fertility by Education in Ankeny
Average fertility rate in Ankeny is 39.0 births per 1,000 women. Women with the education attainment of graduate degree have the highest fertility rate of 68.0 births per 1,000 women, while women with the education attainment of high school diploma have the lowest fertility at 6.0 births per 1,000 women. Women with the education attainment of college or associate's degree represent 34.1% of all women with births.
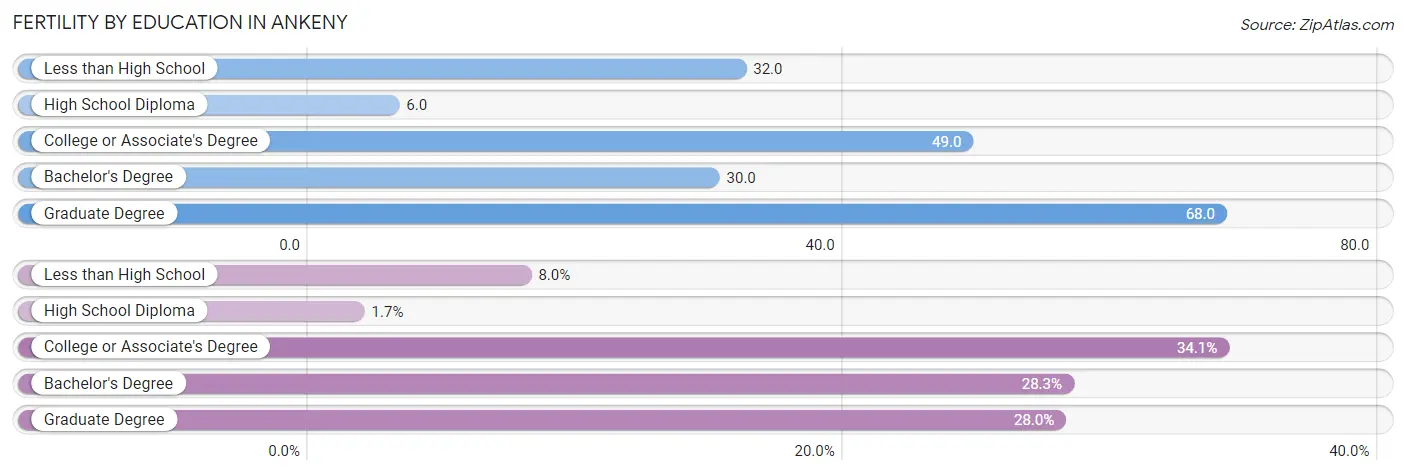
| Educational Attainment | Women with Births | Births / 1,000 Women |
| Less than High School | 56 (8.0%) | 32.0 |
| High School Diploma | 12 (1.7%) | 6.0 |
| College or Associate's Degree | 240 (34.1%) | 49.0 |
| Bachelor's Degree | 199 (28.3%) | 30.0 |
| Graduate Degree | 197 (28.0%) | 68.0 |
| Total | 704 (100.0%) | 39.0 |
Fertility by Education by Marriage Status in Ankeny
10.8% of women with births in Ankeny are unmarried. Women with the educational attainment of less than high school are most likely to be married with 100.0% of them married at childbirth, while women with the educational attainment of college or associate's degree are least likely to be married with 31.7% of them unmarried at childbirth.
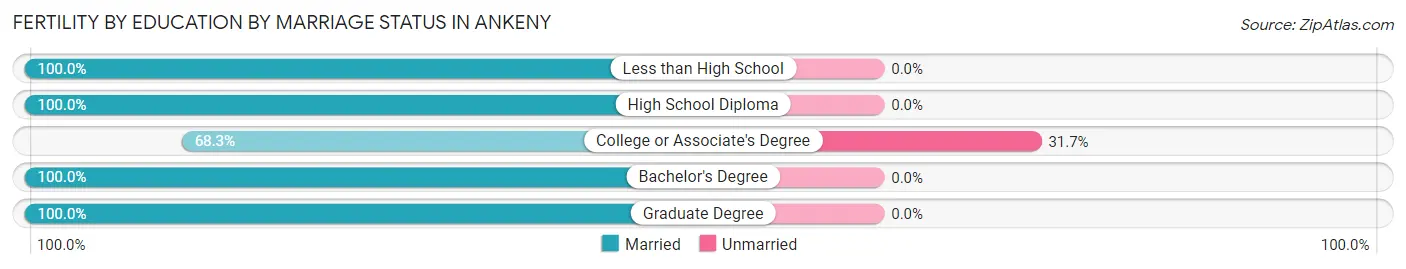
| Educational Attainment | Married | Unmarried |
| Less than High School | 56 (100.0%) | 0 (0.0%) |
| High School Diploma | 12 (100.0%) | 0 (0.0%) |
| College or Associate's Degree | 164 (68.3%) | 76 (31.7%) |
| Bachelor's Degree | 199 (100.0%) | 0 (0.0%) |
| Graduate Degree | 197 (100.0%) | 0 (0.0%) |
| Total | 628 (89.2%) | 76 (10.8%) |
Employment Characteristics in Ankeny
Employment by Class of Employer in Ankeny
Among the 38,033 employed individuals in Ankeny, private company employees (26,910 | 70.8%), not-for-profit organizations (3,325 | 8.7%), and local government employees (2,777 | 7.3%) make up the most common classes of employment.
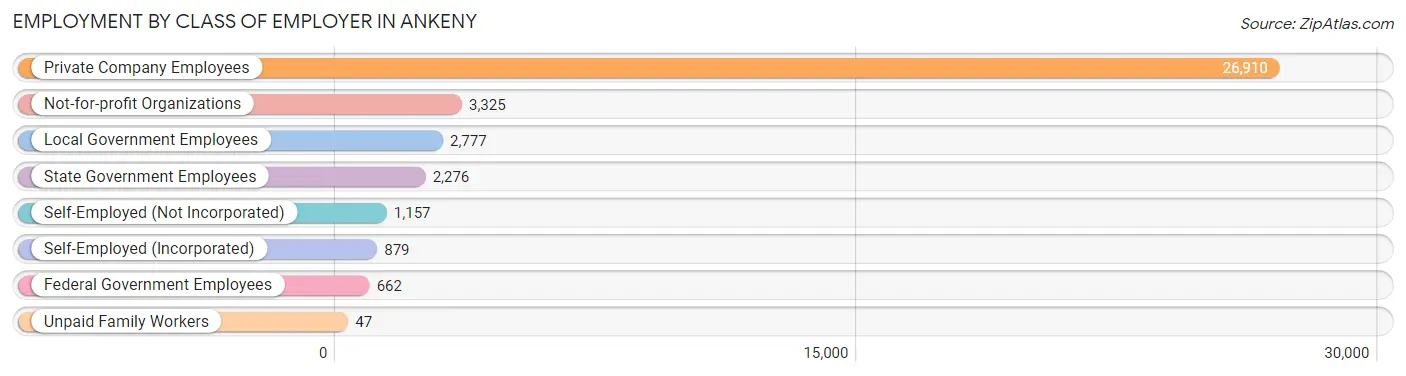
| Employer Class | # Employees | % Employees |
| Private Company Employees | 26,910 | 70.8% |
| Self-Employed (Incorporated) | 879 | 2.3% |
| Self-Employed (Not Incorporated) | 1,157 | 3.0% |
| Not-for-profit Organizations | 3,325 | 8.7% |
| Local Government Employees | 2,777 | 7.3% |
| State Government Employees | 2,276 | 6.0% |
| Federal Government Employees | 662 | 1.7% |
| Unpaid Family Workers | 47 | 0.1% |
| Total | 38,033 | 100.0% |
Employment Status by Age in Ankeny
According to the labor force statistics for Ankeny, out of the total population over 16 years of age (51,854), 76.2% or 39,513 individuals are in the labor force, with 2.6% or 1,027 of them unemployed. The age group with the highest labor force participation rate is 30 to 34 years, with 95.0% or 5,526 individuals in the labor force. Within the labor force, the 20 to 24 years age range has the highest percentage of unemployed individuals, with 6.2% or 239 of them being unemployed.
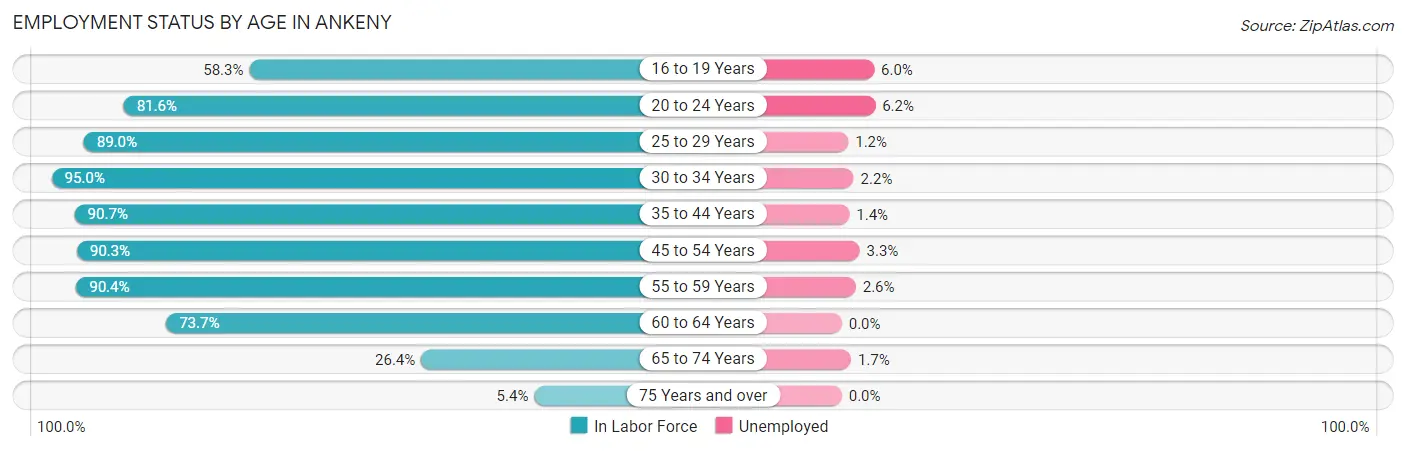
| Age Bracket | In Labor Force | Unemployed |
| 16 to 19 Years | 2,085 (58.3%) | 125 (6.0%) |
| 20 to 24 Years | 3,847 (81.6%) | 239 (6.2%) |
| 25 to 29 Years | 4,828 (89.0%) | 58 (1.2%) |
| 30 to 34 Years | 5,526 (95.0%) | 122 (2.2%) |
| 35 to 44 Years | 9,931 (90.7%) | 139 (1.4%) |
| 45 to 54 Years | 7,457 (90.3%) | 246 (3.3%) |
| 55 to 59 Years | 2,655 (90.4%) | 69 (2.6%) |
| 60 to 64 Years | 1,822 (73.7%) | 0 (0.0%) |
| 65 to 74 Years | 1,176 (26.4%) | 20 (1.7%) |
| 75 Years and over | 176 (5.4%) | 0 (0.0%) |
| Total | 39,513 (76.2%) | 1,027 (2.6%) |
Employment Status by Educational Attainment in Ankeny
According to labor force statistics for Ankeny, 89.9% of individuals (32,236) out of the total population between 25 and 64 years of age (35,858) are in the labor force, with 1.9% or 612 of them being unemployed. The group with the highest labor force participation rate are those with the educational attainment of bachelor's degree or higher, with 91.7% or 18,568 individuals in the labor force. Within the labor force, individuals with less than high school education have the highest percentage of unemployment, with 12.6% or 40 of them being unemployed.
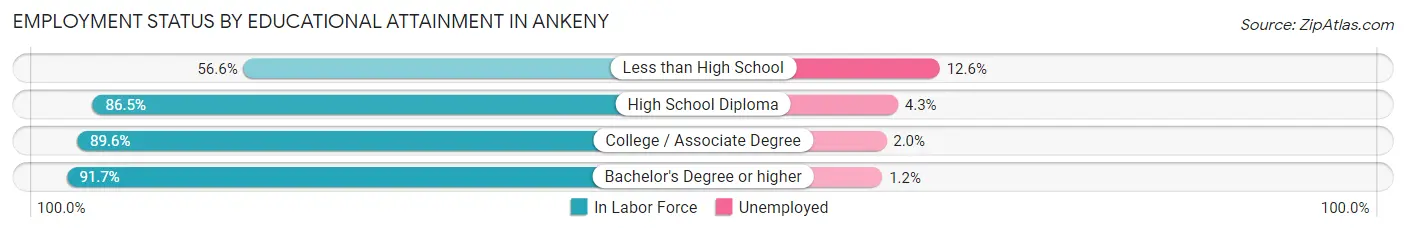
| Educational Attainment | In Labor Force | Unemployed |
| Less than High School | 318 (56.6%) | 71 (12.6%) |
| High School Diploma | 4,099 (86.5%) | 204 (4.3%) |
| College / Associate Degree | 9,236 (89.6%) | 206 (2.0%) |
| Bachelor's Degree or higher | 18,568 (91.7%) | 243 (1.2%) |
| Total | 32,236 (89.9%) | 681 (1.9%) |
Employment Occupations by Sex in Ankeny
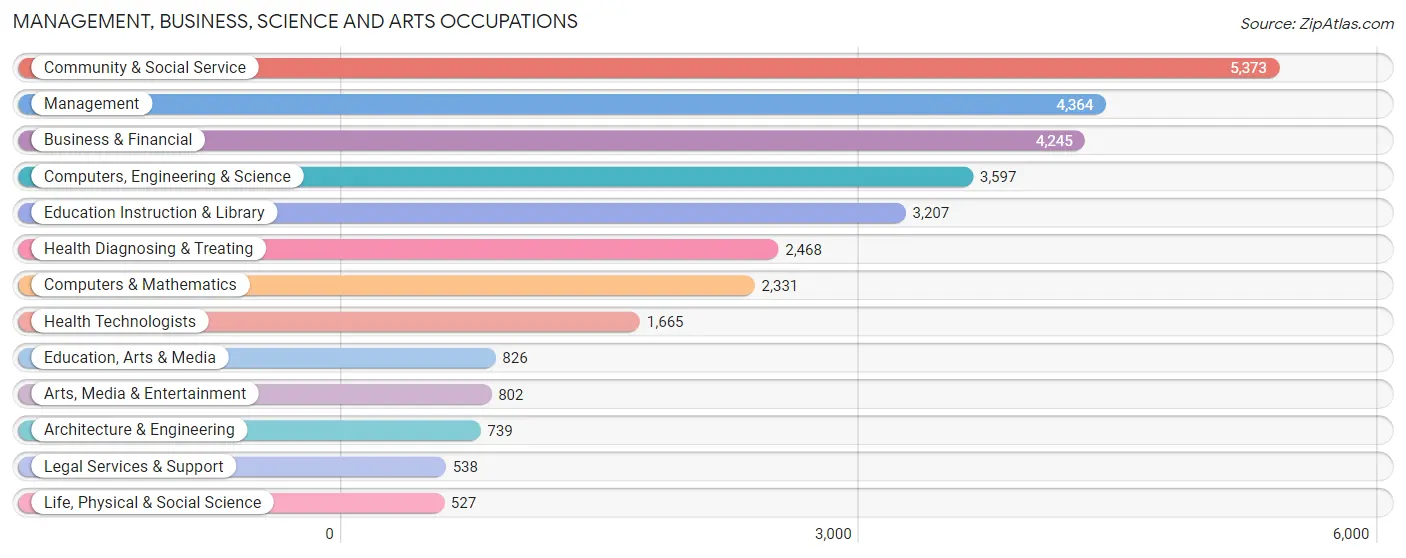
Management, Business, Science and Arts Occupations
The most common Management, Business, Science and Arts occupations in Ankeny are Community & Social Service (5,373 | 14.1%), Management (4,364 | 11.4%), Business & Financial (4,245 | 11.1%), Computers, Engineering & Science (3,597 | 9.4%), and Education Instruction & Library (3,207 | 8.4%).
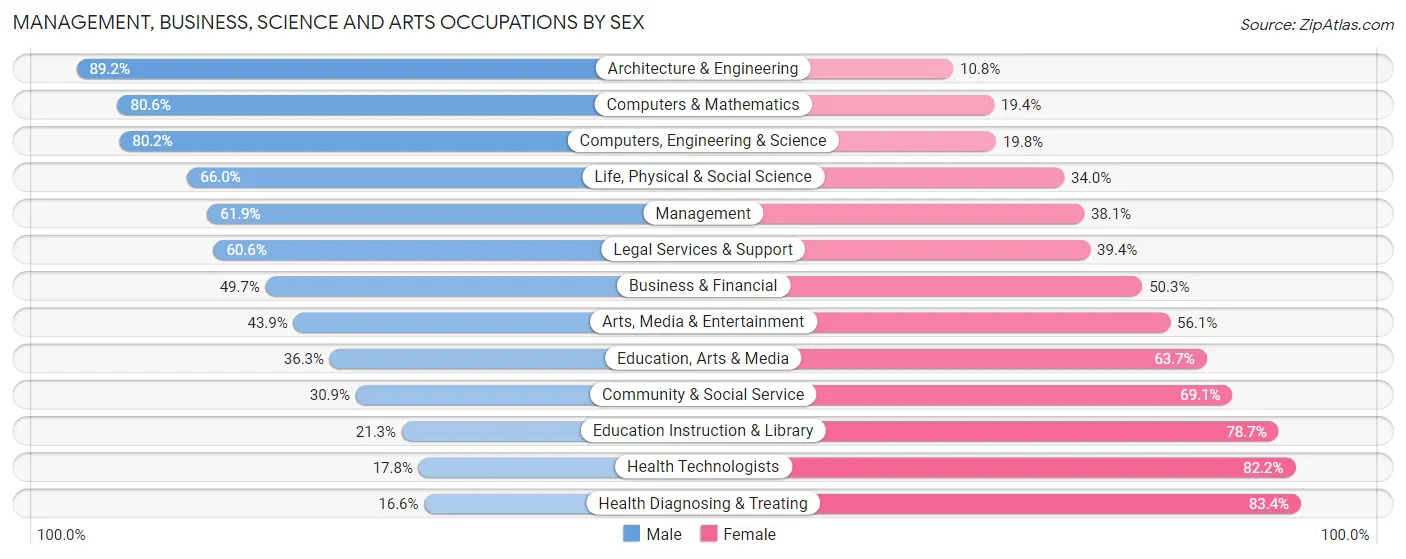
Management, Business, Science and Arts Occupations by Sex
Within the Management, Business, Science and Arts occupations in Ankeny, the most male-oriented occupations are Architecture & Engineering (89.2%), Computers & Mathematics (80.6%), and Computers, Engineering & Science (80.2%), while the most female-oriented occupations are Health Diagnosing & Treating (83.4%), Health Technologists (82.2%), and Education Instruction & Library (78.7%).
| Occupation | Male | Female |
| Management | 2,700 (61.9%) | 1,664 (38.1%) |
| Business & Financial | 2,110 (49.7%) | 2,135 (50.3%) |
| Computers, Engineering & Science | 2,886 (80.2%) | 711 (19.8%) |
| Computers & Mathematics | 1,879 (80.6%) | 452 (19.4%) |
| Architecture & Engineering | 659 (89.2%) | 80 (10.8%) |
| Life, Physical & Social Science | 348 (66.0%) | 179 (34.0%) |
| Community & Social Service | 1,661 (30.9%) | 3,712 (69.1%) |
| Education, Arts & Media | 300 (36.3%) | 526 (63.7%) |
| Legal Services & Support | 326 (60.6%) | 212 (39.4%) |
| Education Instruction & Library | 683 (21.3%) | 2,524 (78.7%) |
| Arts, Media & Entertainment | 352 (43.9%) | 450 (56.1%) |
| Health Diagnosing & Treating | 410 (16.6%) | 2,058 (83.4%) |
| Health Technologists | 296 (17.8%) | 1,369 (82.2%) |
| Total (Category) | 9,767 (48.7%) | 10,280 (51.3%) |
| Total (Overall) | 20,056 (52.5%) | 18,123 (47.5%) |
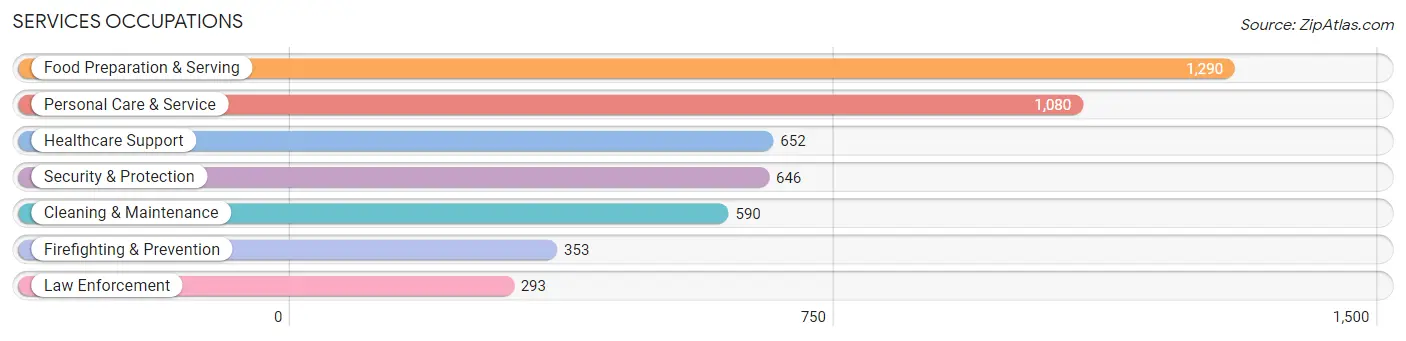
Services Occupations
The most common Services occupations in Ankeny are Food Preparation & Serving (1,290 | 3.4%), Personal Care & Service (1,080 | 2.8%), Healthcare Support (652 | 1.7%), Security & Protection (646 | 1.7%), and Cleaning & Maintenance (590 | 1.5%).
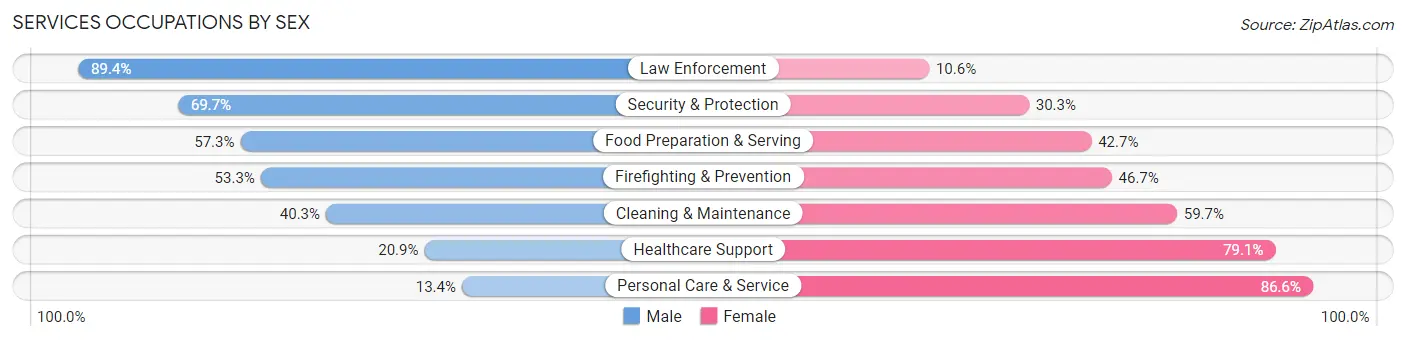
Services Occupations by Sex
Within the Services occupations in Ankeny, the most male-oriented occupations are Law Enforcement (89.4%), Security & Protection (69.7%), and Food Preparation & Serving (57.3%), while the most female-oriented occupations are Personal Care & Service (86.6%), Healthcare Support (79.1%), and Cleaning & Maintenance (59.7%).
| Occupation | Male | Female |
| Healthcare Support | 136 (20.9%) | 516 (79.1%) |
| Security & Protection | 450 (69.7%) | 196 (30.3%) |
| Firefighting & Prevention | 188 (53.3%) | 165 (46.7%) |
| Law Enforcement | 262 (89.4%) | 31 (10.6%) |
| Food Preparation & Serving | 739 (57.3%) | 551 (42.7%) |
| Cleaning & Maintenance | 238 (40.3%) | 352 (59.7%) |
| Personal Care & Service | 145 (13.4%) | 935 (86.6%) |
| Total (Category) | 1,708 (40.1%) | 2,550 (59.9%) |
| Total (Overall) | 20,056 (52.5%) | 18,123 (47.5%) |
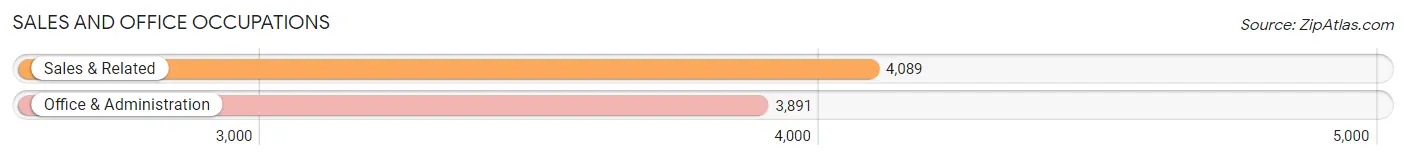
Sales and Office Occupations
The most common Sales and Office occupations in Ankeny are Sales & Related (4,089 | 10.7%), and Office & Administration (3,891 | 10.2%).
Sales and Office Occupations by Sex
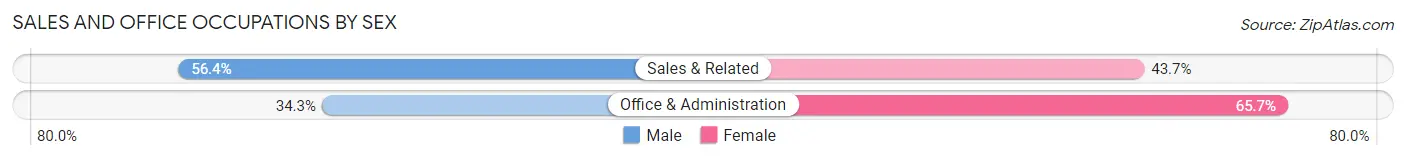
| Occupation | Male | Female |
| Sales & Related | 2,304 (56.4%) | 1,785 (43.6%) |
| Office & Administration | 1,334 (34.3%) | 2,557 (65.7%) |
| Total (Category) | 3,638 (45.6%) | 4,342 (54.4%) |
| Total (Overall) | 20,056 (52.5%) | 18,123 (47.5%) |
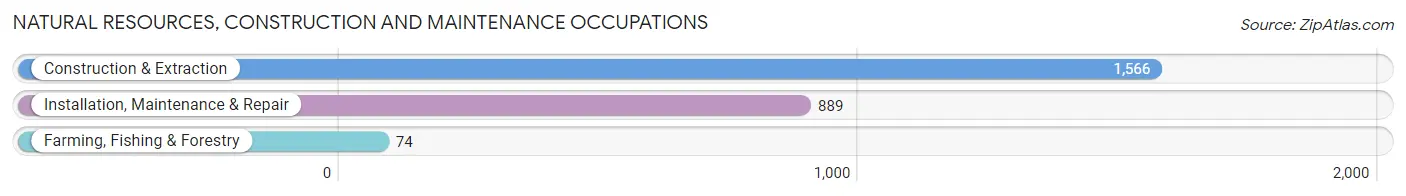
Natural Resources, Construction and Maintenance Occupations
The most common Natural Resources, Construction and Maintenance occupations in Ankeny are Construction & Extraction (1,566 | 4.1%), Installation, Maintenance & Repair (889 | 2.3%), and Farming, Fishing & Forestry (74 | 0.2%).
Natural Resources, Construction and Maintenance Occupations by Sex
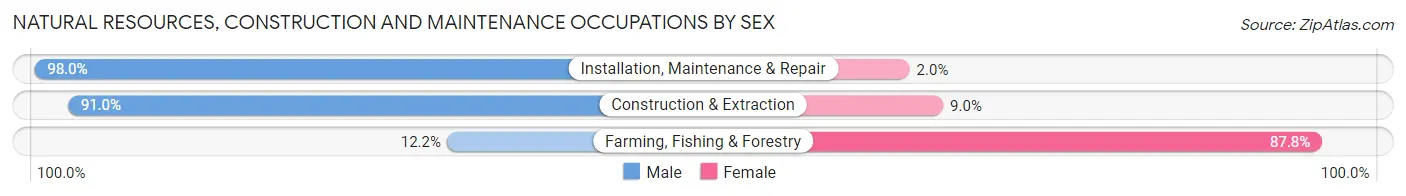
| Occupation | Male | Female |
| Farming, Fishing & Forestry | 9 (12.2%) | 65 (87.8%) |
| Construction & Extraction | 1,425 (91.0%) | 141 (9.0%) |
| Installation, Maintenance & Repair | 871 (98.0%) | 18 (2.0%) |
| Total (Category) | 2,305 (91.1%) | 224 (8.9%) |
| Total (Overall) | 20,056 (52.5%) | 18,123 (47.5%) |
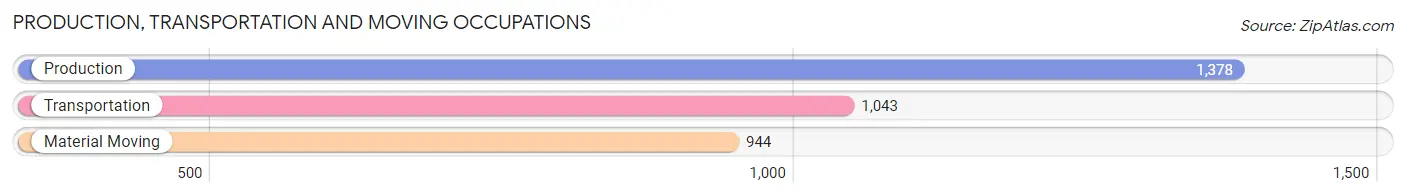
Production, Transportation and Moving Occupations
The most common Production, Transportation and Moving occupations in Ankeny are Production (1,378 | 3.6%), Transportation (1,043 | 2.7%), and Material Moving (944 | 2.5%).
Production, Transportation and Moving Occupations by Sex
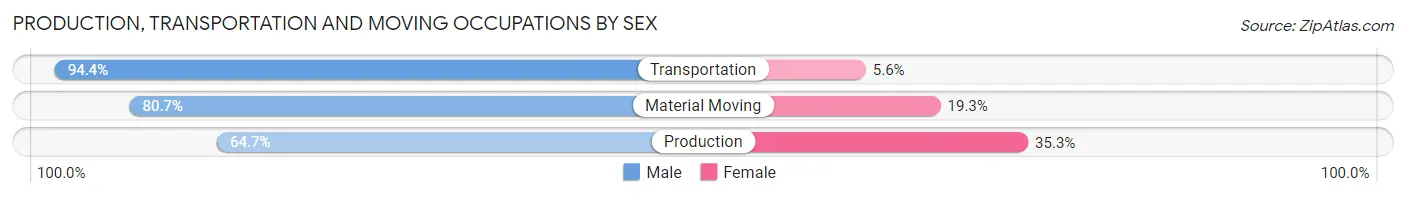
| Occupation | Male | Female |
| Production | 891 (64.7%) | 487 (35.3%) |
| Transportation | 985 (94.4%) | 58 (5.6%) |
| Material Moving | 762 (80.7%) | 182 (19.3%) |
| Total (Category) | 2,638 (78.4%) | 727 (21.6%) |
| Total (Overall) | 20,056 (52.5%) | 18,123 (47.5%) |
Employment Industries by Sex in Ankeny
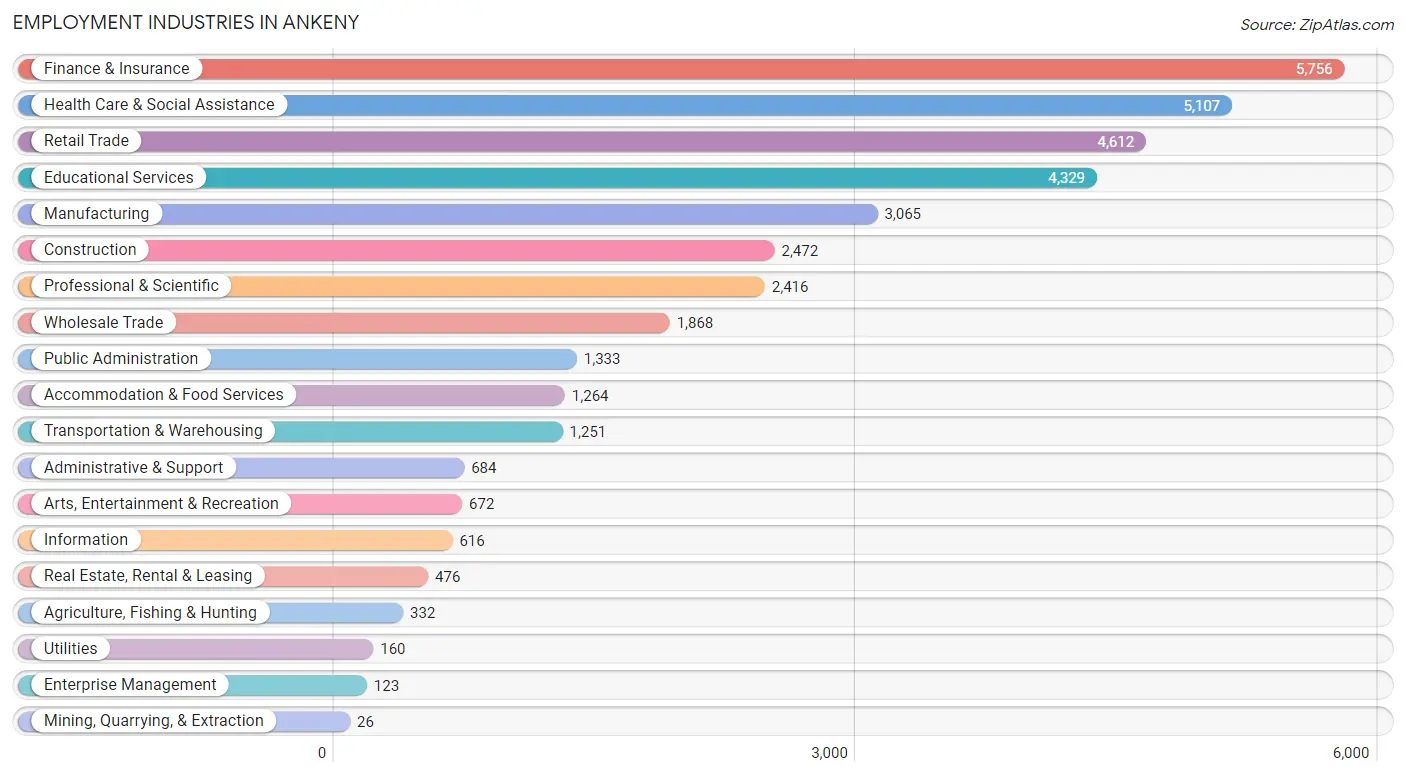
Employment Industries in Ankeny
The major employment industries in Ankeny include Finance & Insurance (5,756 | 15.1%), Health Care & Social Assistance (5,107 | 13.4%), Retail Trade (4,612 | 12.1%), Educational Services (4,329 | 11.3%), and Manufacturing (3,065 | 8.0%).
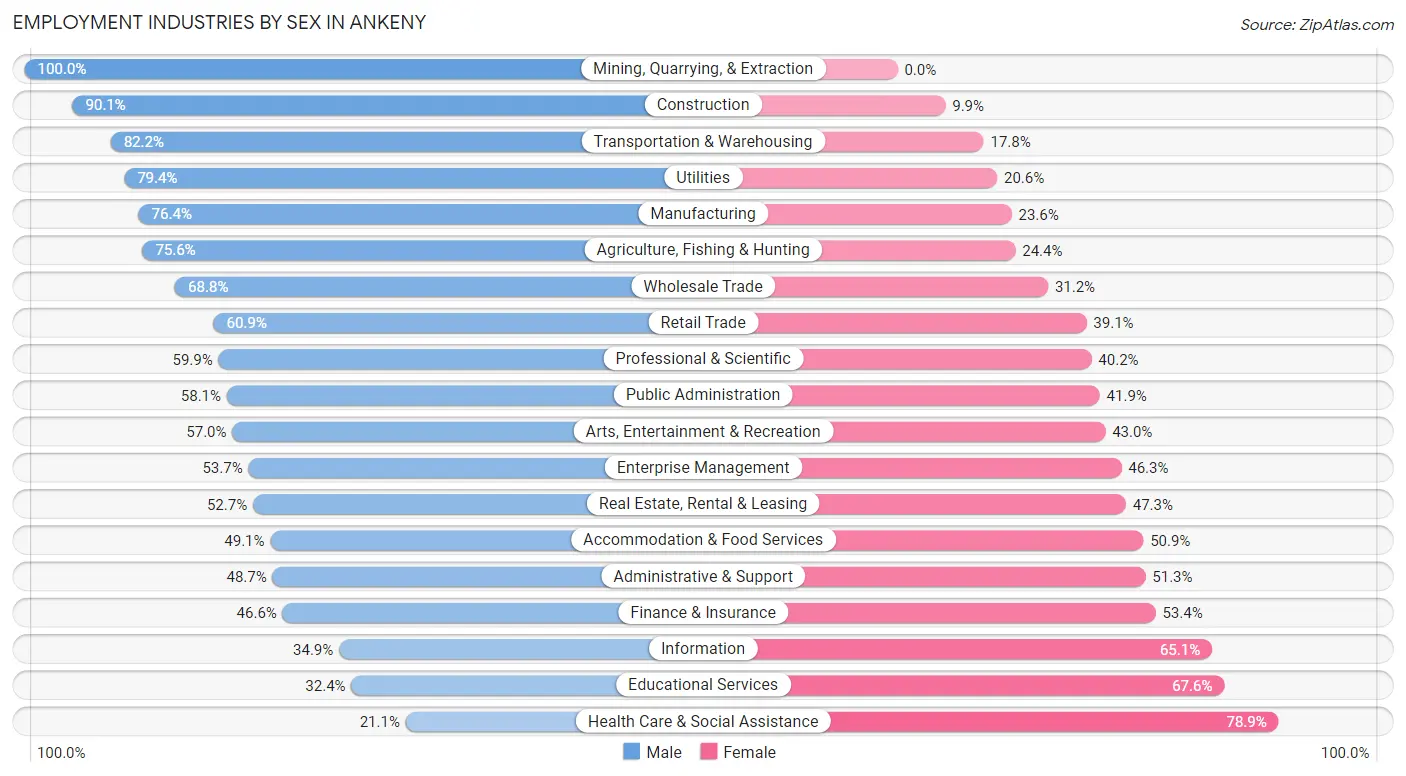
Employment Industries by Sex in Ankeny
The Ankeny industries that see more men than women are Mining, Quarrying, & Extraction (100.0%), Construction (90.1%), and Transportation & Warehousing (82.2%), whereas the industries that tend to have a higher number of women are Health Care & Social Assistance (78.9%), Educational Services (67.6%), and Information (65.1%).
| Industry | Male | Female |
| Agriculture, Fishing & Hunting | 251 (75.6%) | 81 (24.4%) |
| Mining, Quarrying, & Extraction | 26 (100.0%) | 0 (0.0%) |
| Construction | 2,227 (90.1%) | 245 (9.9%) |
| Manufacturing | 2,341 (76.4%) | 724 (23.6%) |
| Wholesale Trade | 1,286 (68.8%) | 582 (31.2%) |
| Retail Trade | 2,808 (60.9%) | 1,804 (39.1%) |
| Transportation & Warehousing | 1,028 (82.2%) | 223 (17.8%) |
| Utilities | 127 (79.4%) | 33 (20.6%) |
| Information | 215 (34.9%) | 401 (65.1%) |
| Finance & Insurance | 2,681 (46.6%) | 3,075 (53.4%) |
| Real Estate, Rental & Leasing | 251 (52.7%) | 225 (47.3%) |
| Professional & Scientific | 1,446 (59.9%) | 970 (40.2%) |
| Enterprise Management | 66 (53.7%) | 57 (46.3%) |
| Administrative & Support | 333 (48.7%) | 351 (51.3%) |
| Educational Services | 1,401 (32.4%) | 2,928 (67.6%) |
| Health Care & Social Assistance | 1,078 (21.1%) | 4,029 (78.9%) |
| Arts, Entertainment & Recreation | 383 (57.0%) | 289 (43.0%) |
| Accommodation & Food Services | 621 (49.1%) | 643 (50.9%) |
| Public Administration | 775 (58.1%) | 558 (41.9%) |
| Total | 20,056 (52.5%) | 18,123 (47.5%) |
Education in Ankeny
School Enrollment in Ankeny
The most common levels of schooling among the 18,158 students in Ankeny are middle school (3,896 | 21.5%), elementary school (3,817 | 21.0%), and college / undergraduate (3,663 | 20.2%).
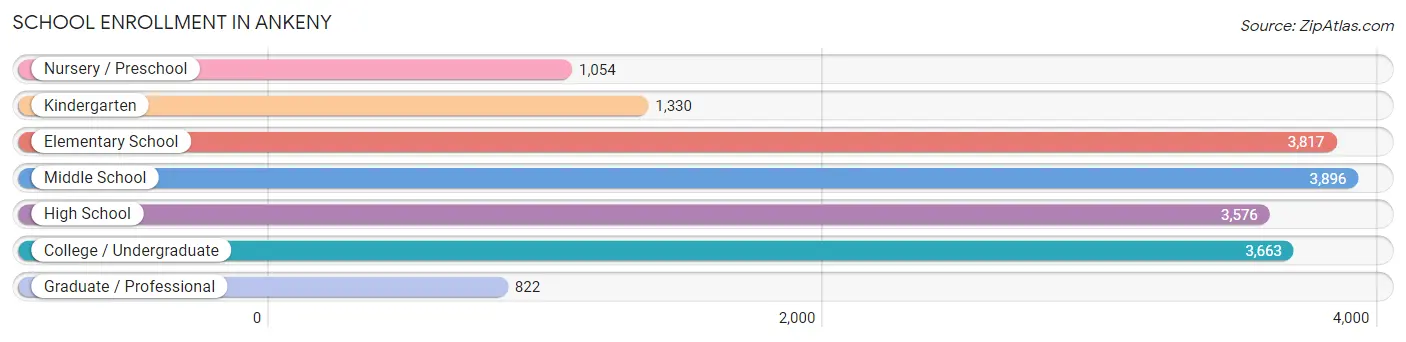
| School Level | # Students | % Students |
| Nursery / Preschool | 1,054 | 5.8% |
| Kindergarten | 1,330 | 7.3% |
| Elementary School | 3,817 | 21.0% |
| Middle School | 3,896 | 21.5% |
| High School | 3,576 | 19.7% |
| College / Undergraduate | 3,663 | 20.2% |
| Graduate / Professional | 822 | 4.5% |
| Total | 18,158 | 100.0% |
School Enrollment by Age by Funding Source in Ankeny
Out of a total of 18,158 students who are enrolled in schools in Ankeny, 2,796 (15.4%) attend a private institution, while the remaining 15,362 (84.6%) are enrolled in public schools. The age group of 3 to 4 year olds has the highest likelihood of being enrolled in private schools, with 276 (35.6% in the age bracket) enrolled. Conversely, the age group of 15 to 17 year olds has the lowest likelihood of being enrolled in a private school, with 2,327 (94.8% in the age bracket) attending a public institution.
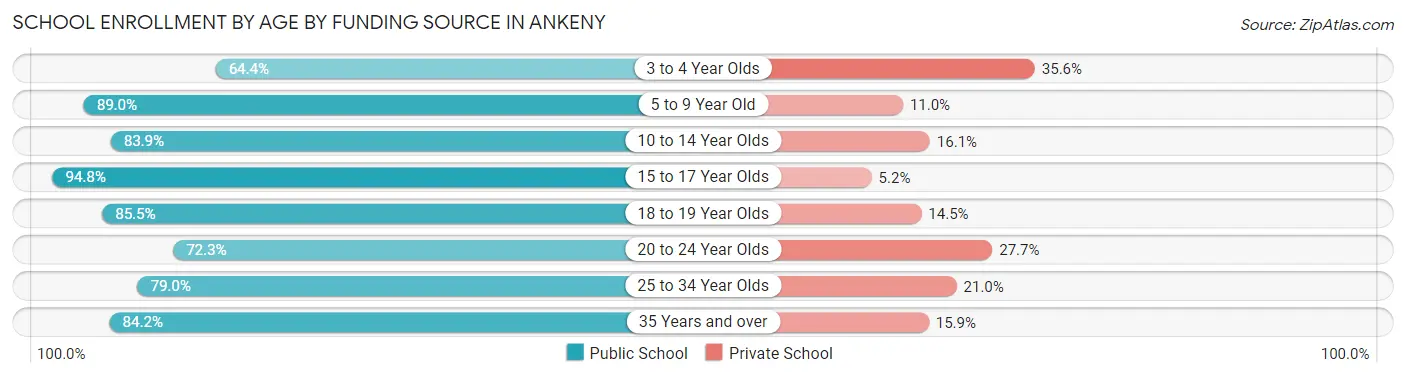
| Age Bracket | Public School | Private School |
| 3 to 4 Year Olds | 499 (64.4%) | 276 (35.6%) |
| 5 to 9 Year Old | 4,544 (89.0%) | 564 (11.0%) |
| 10 to 14 Year Olds | 3,994 (83.9%) | 764 (16.1%) |
| 15 to 17 Year Olds | 2,327 (94.8%) | 128 (5.2%) |
| 18 to 19 Year Olds | 1,075 (85.5%) | 182 (14.5%) |
| 20 to 24 Year Olds | 1,355 (72.3%) | 519 (27.7%) |
| 25 to 34 Year Olds | 882 (79.0%) | 235 (21.0%) |
| 35 Years and over | 685 (84.2%) | 129 (15.9%) |
| Total | 15,362 (84.6%) | 2,796 (15.4%) |
Educational Attainment by Field of Study in Ankeny
Business (6,766 | 27.9%), education (3,524 | 14.5%), science & technology (2,362 | 9.7%), bio, nature & agricultural (1,699 | 7.0%), and arts & humanities (1,525 | 6.3%) are the most common fields of study among 24,266 individuals in Ankeny who have obtained a bachelor's degree or higher.
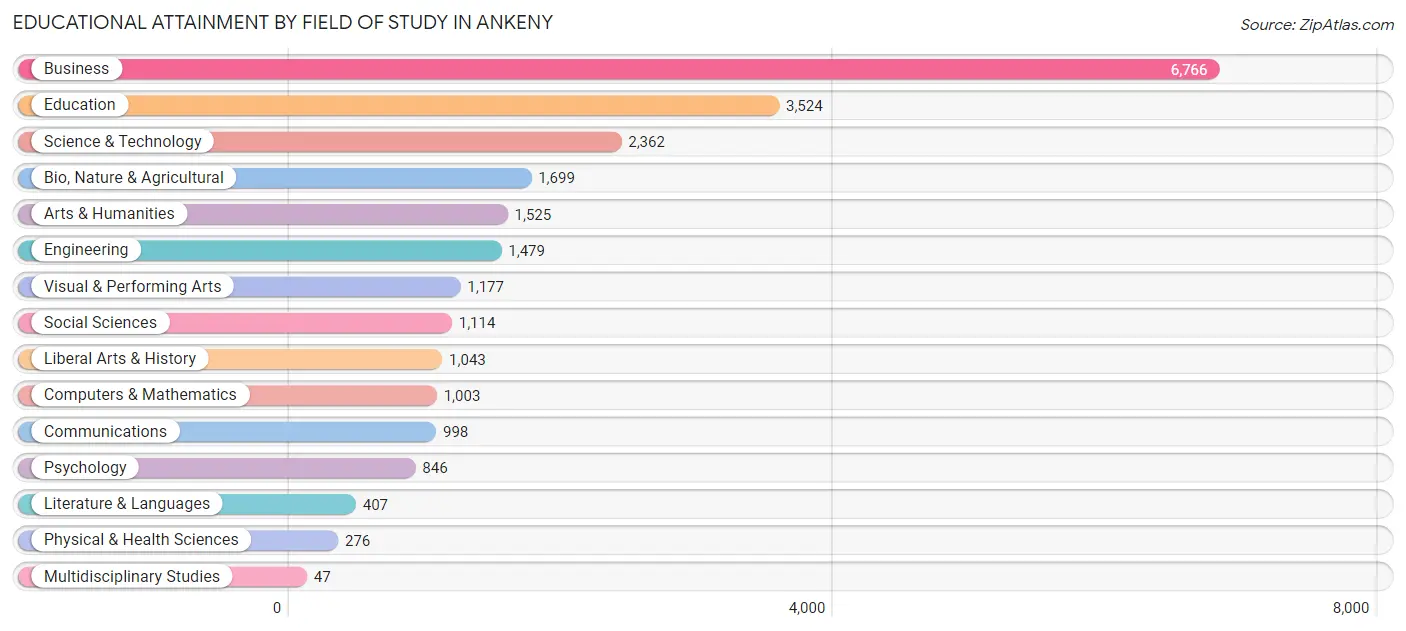
| Field of Study | # Graduates | % Graduates |
| Computers & Mathematics | 1,003 | 4.1% |
| Bio, Nature & Agricultural | 1,699 | 7.0% |
| Physical & Health Sciences | 276 | 1.1% |
| Psychology | 846 | 3.5% |
| Social Sciences | 1,114 | 4.6% |
| Engineering | 1,479 | 6.1% |
| Multidisciplinary Studies | 47 | 0.2% |
| Science & Technology | 2,362 | 9.7% |
| Business | 6,766 | 27.9% |
| Education | 3,524 | 14.5% |
| Literature & Languages | 407 | 1.7% |
| Liberal Arts & History | 1,043 | 4.3% |
| Visual & Performing Arts | 1,177 | 4.9% |
| Communications | 998 | 4.1% |
| Arts & Humanities | 1,525 | 6.3% |
| Total | 24,266 | 100.0% |
Transportation & Commute in Ankeny
Vehicle Availability by Sex in Ankeny
The most prevalent vehicle ownership categories in Ankeny are males with 2 vehicles (10,450, accounting for 52.1%) and females with 2 vehicles (9,101, making up 59.0%).
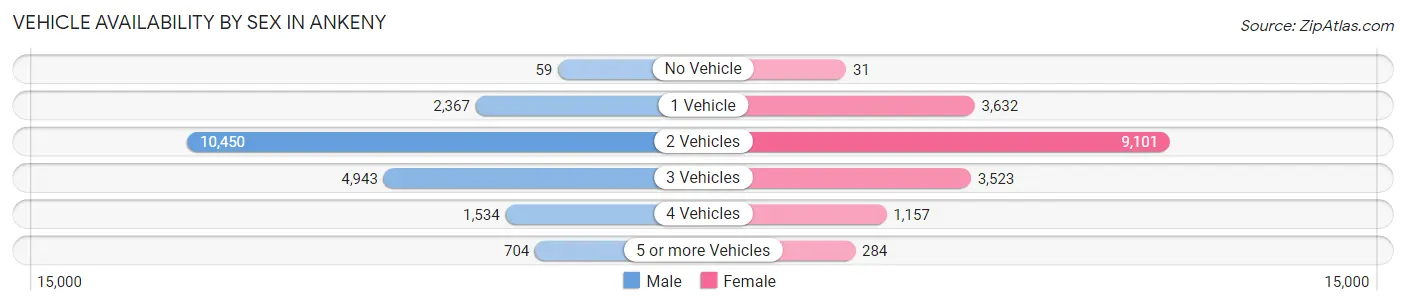
| Vehicles Available | Male | Female |
| No Vehicle | 59 (0.3%) | 31 (0.2%) |
| 1 Vehicle | 2,367 (11.8%) | 3,632 (20.5%) |
| 2 Vehicles | 10,450 (52.1%) | 9,101 (51.3%) |
| 3 Vehicles | 4,943 (24.6%) | 3,523 (19.9%) |
| 4 Vehicles | 1,534 (7.6%) | 1,157 (6.5%) |
| 5 or more Vehicles | 704 (3.5%) | 284 (1.6%) |
| Total | 20,057 (100.0%) | 17,728 (100.0%) |
Commute Time in Ankeny
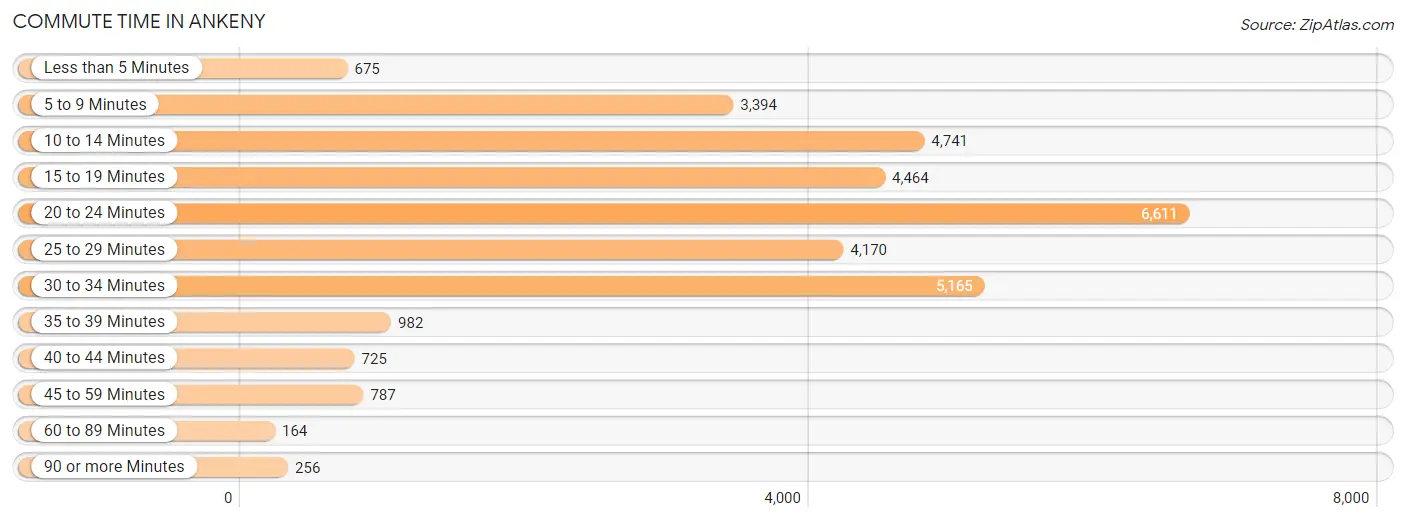
The most frequently occuring commute durations in Ankeny are 20 to 24 minutes (6,611 commuters, 20.6%), 30 to 34 minutes (5,165 commuters, 16.1%), and 10 to 14 minutes (4,741 commuters, 14.7%).
| Commute Time | # Commuters | % Commuters |
| Less than 5 Minutes | 675 | 2.1% |
| 5 to 9 Minutes | 3,394 | 10.6% |
| 10 to 14 Minutes | 4,741 | 14.7% |
| 15 to 19 Minutes | 4,464 | 13.9% |
| 20 to 24 Minutes | 6,611 | 20.6% |
| 25 to 29 Minutes | 4,170 | 13.0% |
| 30 to 34 Minutes | 5,165 | 16.1% |
| 35 to 39 Minutes | 982 | 3.1% |
| 40 to 44 Minutes | 725 | 2.3% |
| 45 to 59 Minutes | 787 | 2.5% |
| 60 to 89 Minutes | 164 | 0.5% |
| 90 or more Minutes | 256 | 0.8% |
Commute Time by Sex in Ankeny
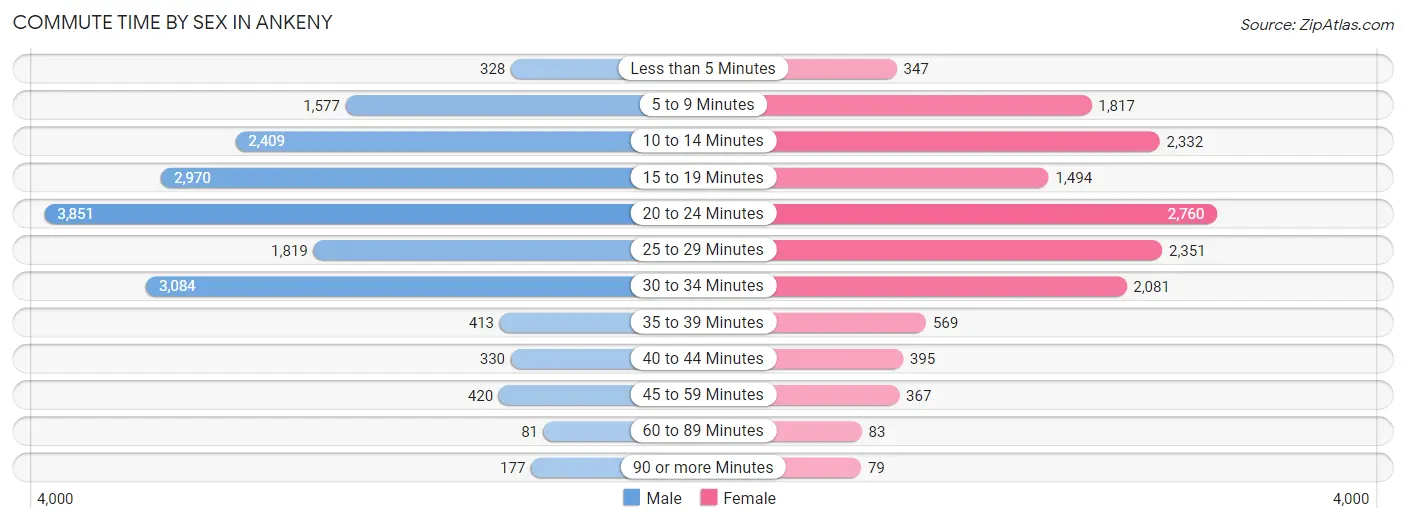
The most common commute times in Ankeny are 20 to 24 minutes (3,851 commuters, 22.1%) for males and 20 to 24 minutes (2,760 commuters, 18.8%) for females.
| Commute Time | Male | Female |
| Less than 5 Minutes | 328 (1.9%) | 347 (2.4%) |
| 5 to 9 Minutes | 1,577 (9.0%) | 1,817 (12.4%) |
| 10 to 14 Minutes | 2,409 (13.8%) | 2,332 (15.9%) |
| 15 to 19 Minutes | 2,970 (17.0%) | 1,494 (10.2%) |
| 20 to 24 Minutes | 3,851 (22.1%) | 2,760 (18.8%) |
| 25 to 29 Minutes | 1,819 (10.4%) | 2,351 (16.0%) |
| 30 to 34 Minutes | 3,084 (17.7%) | 2,081 (14.2%) |
| 35 to 39 Minutes | 413 (2.4%) | 569 (3.9%) |
| 40 to 44 Minutes | 330 (1.9%) | 395 (2.7%) |
| 45 to 59 Minutes | 420 (2.4%) | 367 (2.5%) |
| 60 to 89 Minutes | 81 (0.5%) | 83 (0.6%) |
| 90 or more Minutes | 177 (1.0%) | 79 (0.5%) |
Time of Departure to Work by Sex in Ankeny
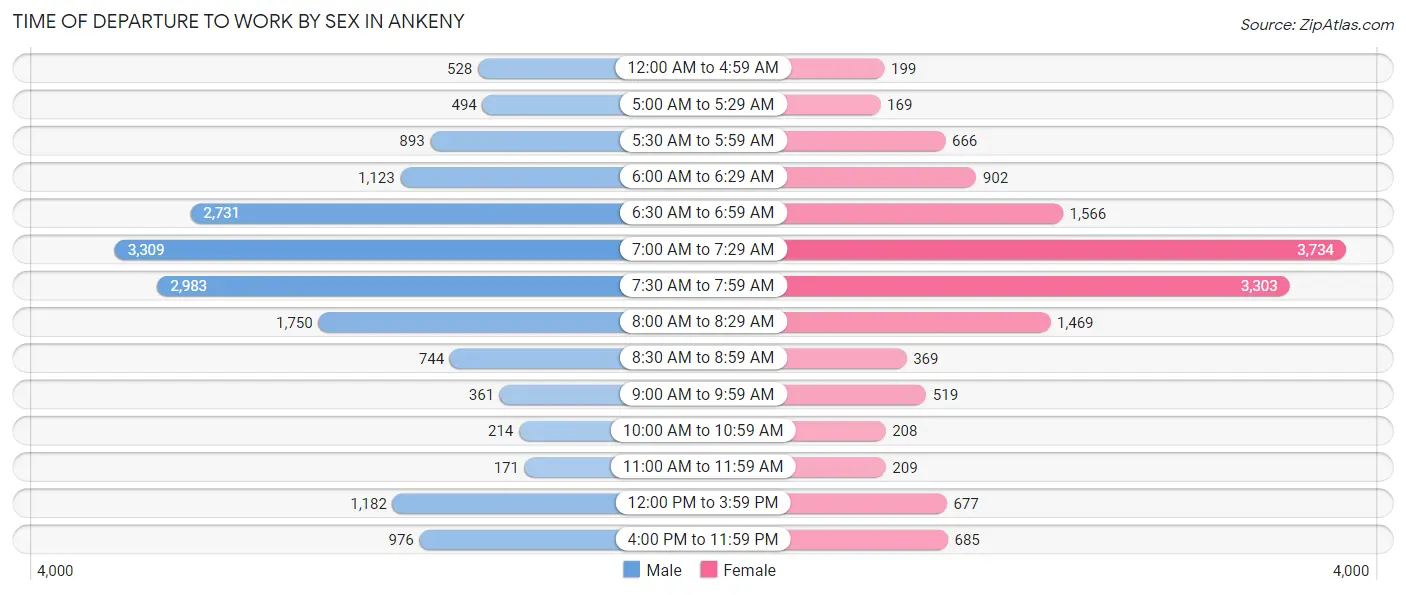
The most frequent times of departure to work in Ankeny are 7:00 AM to 7:29 AM (3,309, 19.0%) for males and 7:00 AM to 7:29 AM (3,734, 25.4%) for females.
| Time of Departure | Male | Female |
| 12:00 AM to 4:59 AM | 528 (3.0%) | 199 (1.4%) |
| 5:00 AM to 5:29 AM | 494 (2.8%) | 169 (1.1%) |
| 5:30 AM to 5:59 AM | 893 (5.1%) | 666 (4.5%) |
| 6:00 AM to 6:29 AM | 1,123 (6.4%) | 902 (6.1%) |
| 6:30 AM to 6:59 AM | 2,731 (15.6%) | 1,566 (10.7%) |
| 7:00 AM to 7:29 AM | 3,309 (19.0%) | 3,734 (25.4%) |
| 7:30 AM to 7:59 AM | 2,983 (17.1%) | 3,303 (22.5%) |
| 8:00 AM to 8:29 AM | 1,750 (10.0%) | 1,469 (10.0%) |
| 8:30 AM to 8:59 AM | 744 (4.3%) | 369 (2.5%) |
| 9:00 AM to 9:59 AM | 361 (2.1%) | 519 (3.5%) |
| 10:00 AM to 10:59 AM | 214 (1.2%) | 208 (1.4%) |
| 11:00 AM to 11:59 AM | 171 (1.0%) | 209 (1.4%) |
| 12:00 PM to 3:59 PM | 1,182 (6.8%) | 677 (4.6%) |
| 4:00 PM to 11:59 PM | 976 (5.6%) | 685 (4.7%) |
| Total | 17,459 (100.0%) | 14,675 (100.0%) |
Housing Occupancy in Ankeny
Occupancy by Ownership in Ankeny
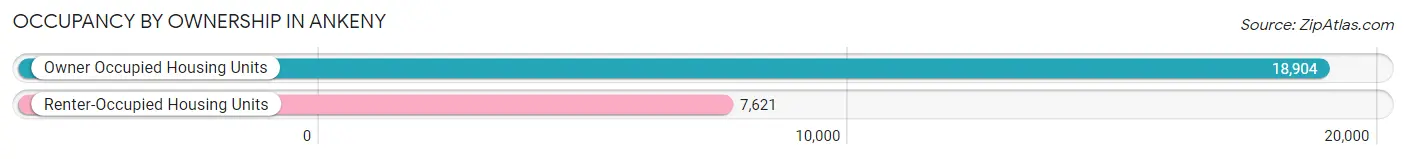
Of the total 26,525 dwellings in Ankeny, owner-occupied units account for 18,904 (71.3%), while renter-occupied units make up 7,621 (28.7%).
| Occupancy | # Housing Units | % Housing Units |
| Owner Occupied Housing Units | 18,904 | 71.3% |
| Renter-Occupied Housing Units | 7,621 | 28.7% |
| Total Occupied Housing Units | 26,525 | 100.0% |
Occupancy by Household Size in Ankeny
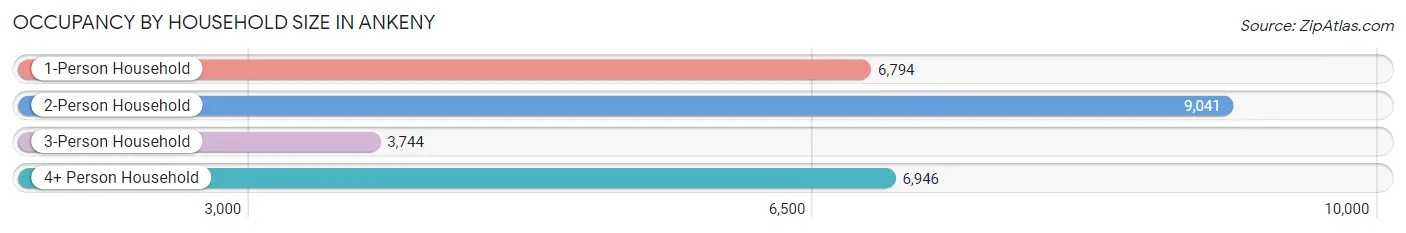
| Household Size | # Housing Units | % Housing Units |
| 1-Person Household | 6,794 | 25.6% |
| 2-Person Household | 9,041 | 34.1% |
| 3-Person Household | 3,744 | 14.1% |
| 4+ Person Household | 6,946 | 26.2% |
| Total Housing Units | 26,525 | 100.0% |
Occupancy by Ownership by Household Size in Ankeny
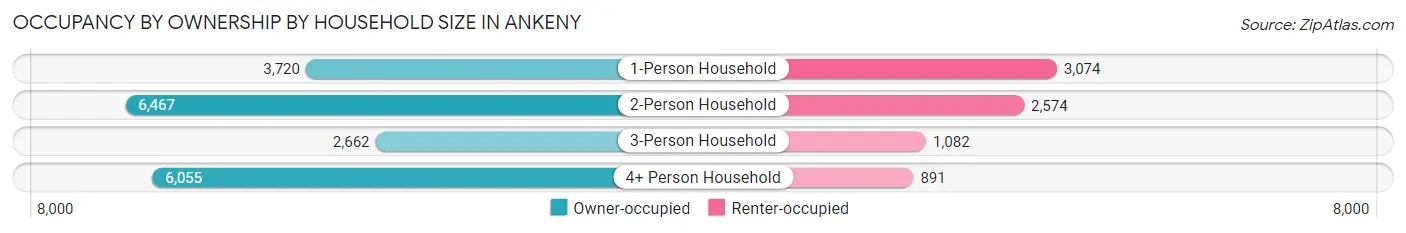
| Household Size | Owner-occupied | Renter-occupied |
| 1-Person Household | 3,720 (54.7%) | 3,074 (45.3%) |
| 2-Person Household | 6,467 (71.5%) | 2,574 (28.5%) |
| 3-Person Household | 2,662 (71.1%) | 1,082 (28.9%) |
| 4+ Person Household | 6,055 (87.2%) | 891 (12.8%) |
| Total Housing Units | 18,904 (71.3%) | 7,621 (28.7%) |
Occupancy by Educational Attainment in Ankeny
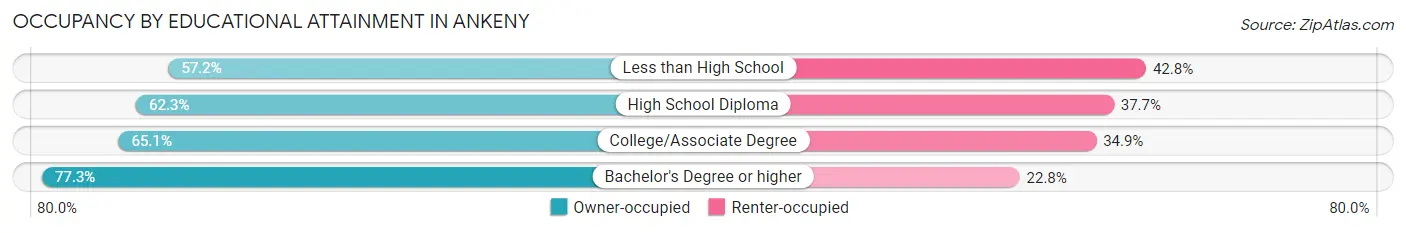
| Household Size | Owner-occupied | Renter-occupied |
| Less than High School | 139 (57.2%) | 104 (42.8%) |
| High School Diploma | 2,048 (62.3%) | 1,239 (37.7%) |
| College/Associate Degree | 5,606 (65.1%) | 3,005 (34.9%) |
| Bachelor's Degree or higher | 11,111 (77.2%) | 3,273 (22.8%) |
Occupancy by Age of Householder in Ankeny
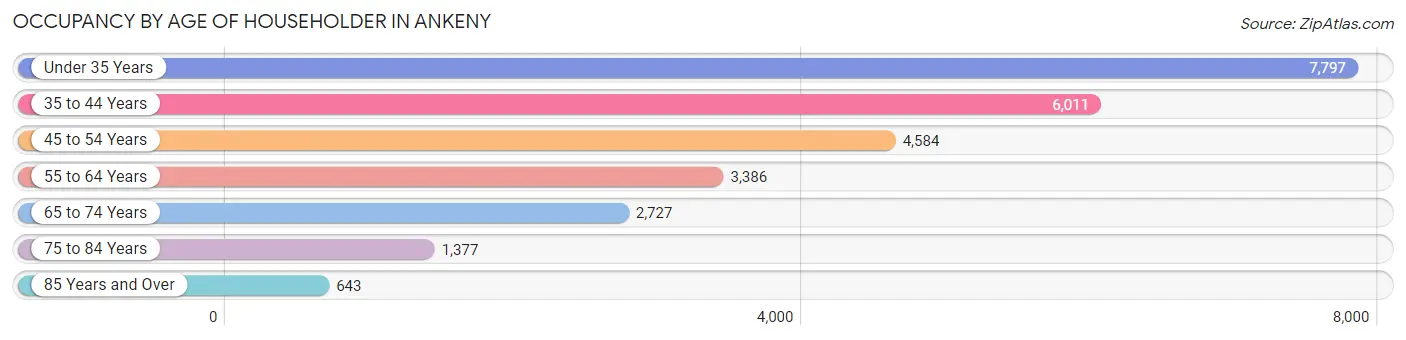
| Age Bracket | # Households | % Households |
| Under 35 Years | 7,797 | 29.4% |
| 35 to 44 Years | 6,011 | 22.7% |
| 45 to 54 Years | 4,584 | 17.3% |
| 55 to 64 Years | 3,386 | 12.8% |
| 65 to 74 Years | 2,727 | 10.3% |
| 75 to 84 Years | 1,377 | 5.2% |
| 85 Years and Over | 643 | 2.4% |
| Total | 26,525 | 100.0% |
Housing Finances in Ankeny
Median Income by Occupancy in Ankeny
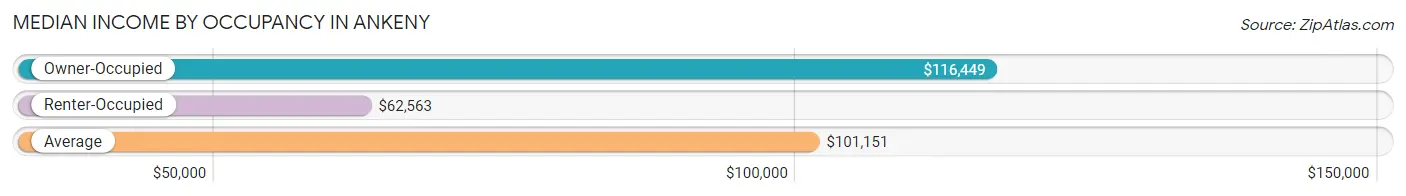
| Occupancy Type | # Households | Median Income |
| Owner-Occupied | 18,904 (71.3%) | $116,449 |
| Renter-Occupied | 7,621 (28.7%) | $62,563 |
| Average | 26,525 (100.0%) | $101,151 |
Occupancy by Householder Income Bracket in Ankeny
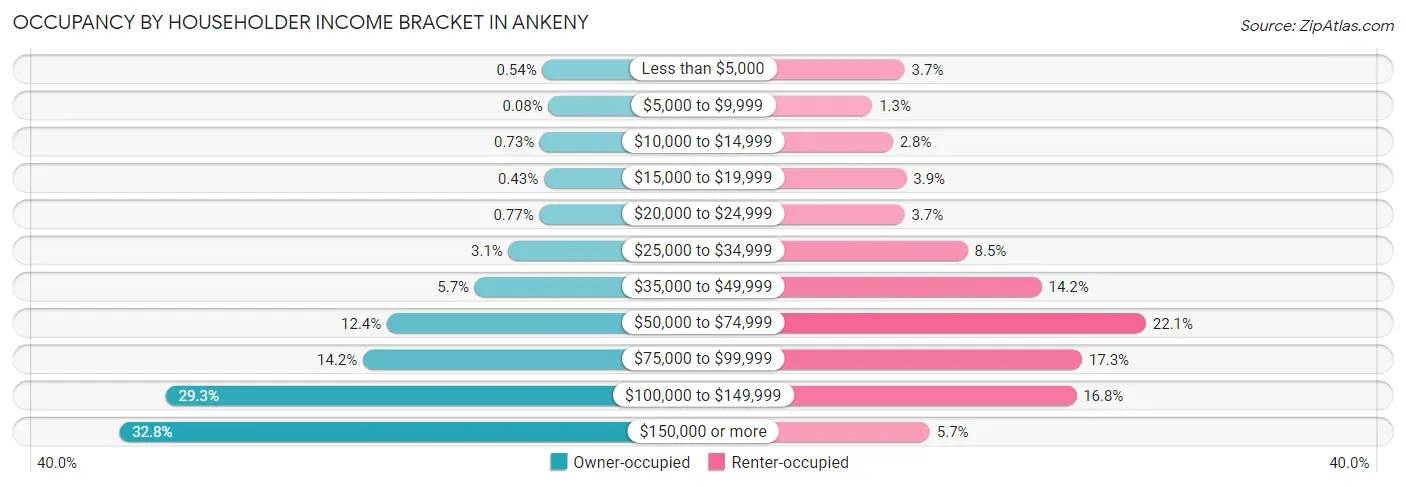
| Income Bracket | Owner-occupied | Renter-occupied |
| Less than $5,000 | 102 (0.5%) | 285 (3.7%) |
| $5,000 to $9,999 | 15 (0.1%) | 97 (1.3%) |
| $10,000 to $14,999 | 138 (0.7%) | 216 (2.8%) |
| $15,000 to $19,999 | 82 (0.4%) | 295 (3.9%) |
| $20,000 to $24,999 | 146 (0.8%) | 284 (3.7%) |
| $25,000 to $34,999 | 589 (3.1%) | 651 (8.5%) |
| $35,000 to $49,999 | 1,075 (5.7%) | 1,080 (14.2%) |
| $50,000 to $74,999 | 2,341 (12.4%) | 1,686 (22.1%) |
| $75,000 to $99,999 | 2,686 (14.2%) | 1,315 (17.2%) |
| $100,000 to $149,999 | 5,532 (29.3%) | 1,281 (16.8%) |
| $150,000 or more | 6,198 (32.8%) | 431 (5.7%) |
| Total | 18,904 (100.0%) | 7,621 (100.0%) |
Monthly Housing Cost Tiers in Ankeny
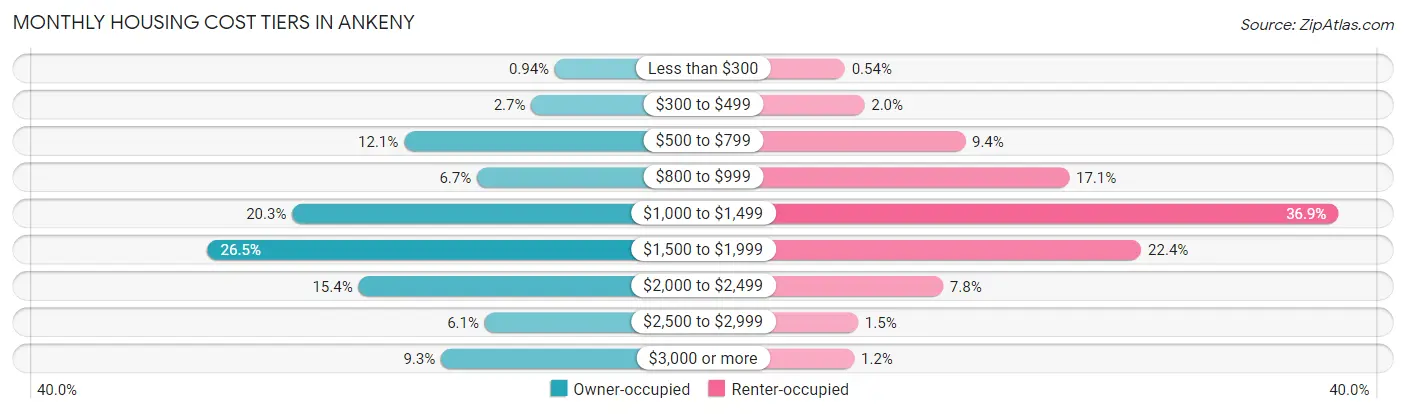
| Monthly Cost | Owner-occupied | Renter-occupied |
| Less than $300 | 178 (0.9%) | 41 (0.5%) |
| $300 to $499 | 506 (2.7%) | 151 (2.0%) |
| $500 to $799 | 2,278 (12.0%) | 716 (9.4%) |
| $800 to $999 | 1,262 (6.7%) | 1,300 (17.1%) |
| $1,000 to $1,499 | 3,836 (20.3%) | 2,811 (36.9%) |
| $1,500 to $1,999 | 5,013 (26.5%) | 1,705 (22.4%) |
| $2,000 to $2,499 | 2,913 (15.4%) | 592 (7.8%) |
| $2,500 to $2,999 | 1,155 (6.1%) | 115 (1.5%) |
| $3,000 or more | 1,763 (9.3%) | 94 (1.2%) |
| Total | 18,904 (100.0%) | 7,621 (100.0%) |
Physical Housing Characteristics in Ankeny
Housing Structures in Ankeny
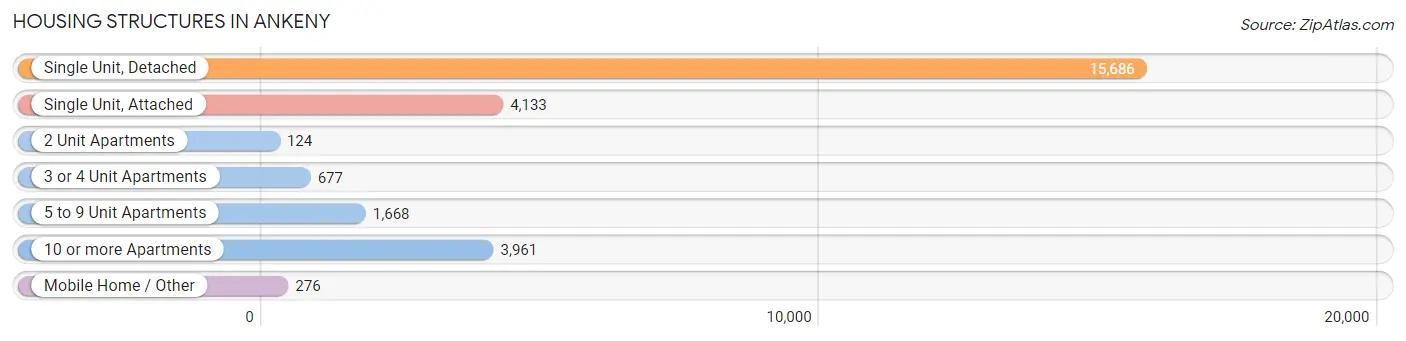
| Structure Type | # Housing Units | % Housing Units |
| Single Unit, Detached | 15,686 | 59.1% |
| Single Unit, Attached | 4,133 | 15.6% |
| 2 Unit Apartments | 124 | 0.5% |
| 3 or 4 Unit Apartments | 677 | 2.5% |
| 5 to 9 Unit Apartments | 1,668 | 6.3% |
| 10 or more Apartments | 3,961 | 14.9% |
| Mobile Home / Other | 276 | 1.0% |
| Total | 26,525 | 100.0% |
Housing Structures by Occupancy in Ankeny
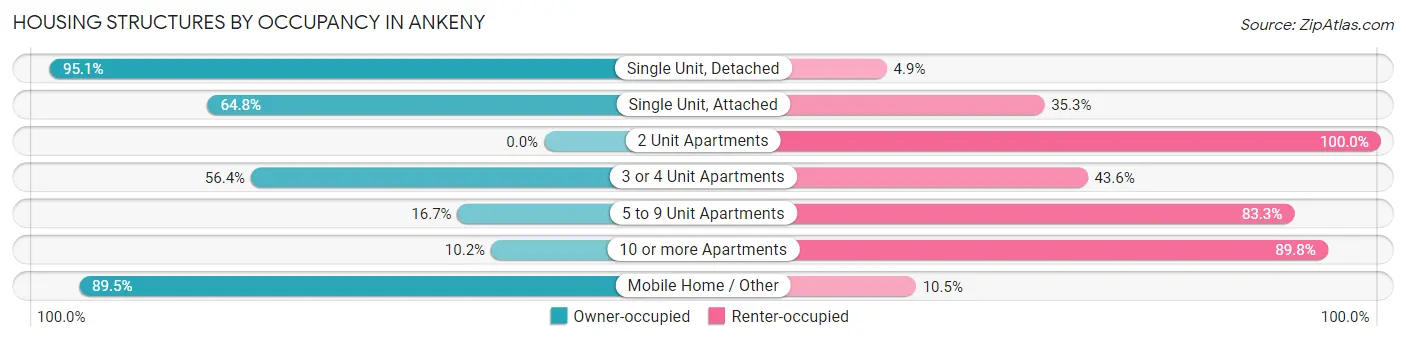
| Structure Type | Owner-occupied | Renter-occupied |
| Single Unit, Detached | 14,916 (95.1%) | 770 (4.9%) |
| Single Unit, Attached | 2,676 (64.7%) | 1,457 (35.2%) |
| 2 Unit Apartments | 0 (0.0%) | 124 (100.0%) |
| 3 or 4 Unit Apartments | 382 (56.4%) | 295 (43.6%) |
| 5 to 9 Unit Apartments | 278 (16.7%) | 1,390 (83.3%) |
| 10 or more Apartments | 405 (10.2%) | 3,556 (89.8%) |
| Mobile Home / Other | 247 (89.5%) | 29 (10.5%) |
| Total | 18,904 (71.3%) | 7,621 (28.7%) |
Housing Structures by Number of Rooms in Ankeny
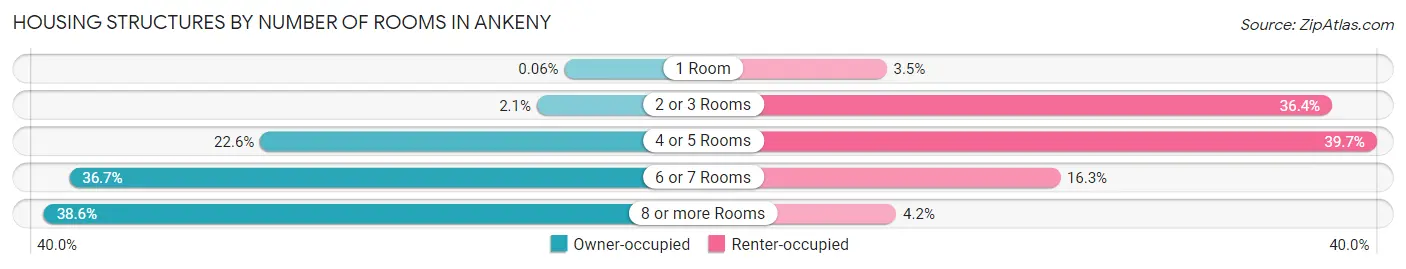
| Number of Rooms | Owner-occupied | Renter-occupied |
| 1 Room | 11 (0.1%) | 263 (3.5%) |
| 2 or 3 Rooms | 397 (2.1%) | 2,774 (36.4%) |
| 4 or 5 Rooms | 4,266 (22.6%) | 3,026 (39.7%) |
| 6 or 7 Rooms | 6,936 (36.7%) | 1,241 (16.3%) |
| 8 or more Rooms | 7,294 (38.6%) | 317 (4.2%) |
| Total | 18,904 (100.0%) | 7,621 (100.0%) |
Housing Structure by Heating Type in Ankeny
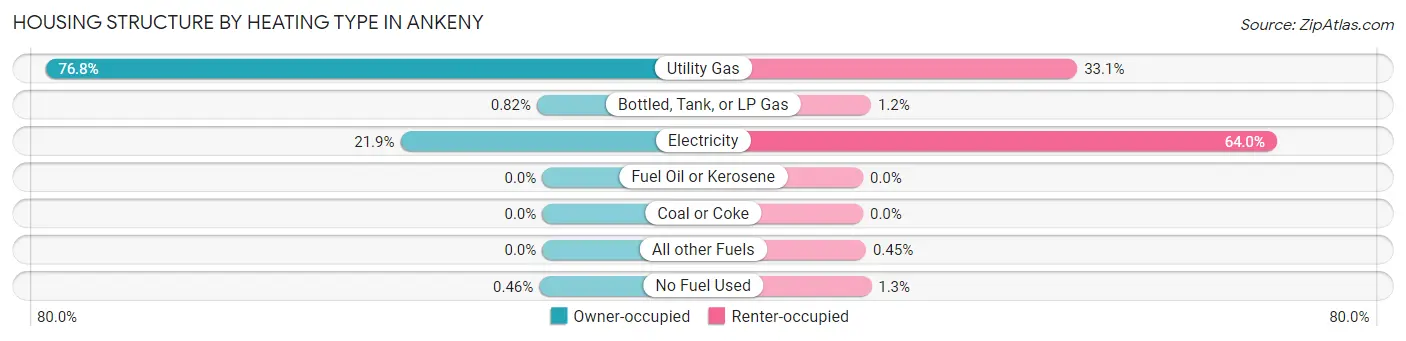
| Heating Type | Owner-occupied | Renter-occupied |
| Utility Gas | 14,519 (76.8%) | 2,523 (33.1%) |
| Bottled, Tank, or LP Gas | 155 (0.8%) | 93 (1.2%) |
| Electricity | 4,143 (21.9%) | 4,874 (63.9%) |
| Fuel Oil or Kerosene | 0 (0.0%) | 0 (0.0%) |
| Coal or Coke | 0 (0.0%) | 0 (0.0%) |
| All other Fuels | 0 (0.0%) | 34 (0.4%) |
| No Fuel Used | 87 (0.5%) | 97 (1.3%) |
| Total | 18,904 (100.0%) | 7,621 (100.0%) |
Household Vehicle Usage in Ankeny
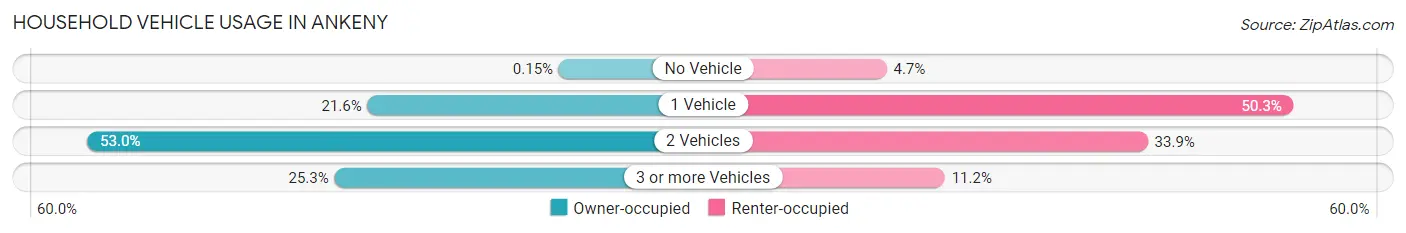
| Vehicles per Household | Owner-occupied | Renter-occupied |
| No Vehicle | 29 (0.2%) | 355 (4.7%) |
| 1 Vehicle | 4,080 (21.6%) | 3,830 (50.3%) |
| 2 Vehicles | 10,017 (53.0%) | 2,584 (33.9%) |
| 3 or more Vehicles | 4,778 (25.3%) | 852 (11.2%) |
| Total | 18,904 (100.0%) | 7,621 (100.0%) |
Real Estate & Mortgages in Ankeny
Real Estate and Mortgage Overview in Ankeny
| Characteristic | Without Mortgage | With Mortgage |
| Housing Units | 4,373 | 14,531 |
| Median Property Value | $258,500 | $286,600 |
| Median Household Income | $86,066 | $5,253 |
| Monthly Housing Costs | $733 | $1,713 |
| Real Estate Taxes | $4,496 | $465 |
Property Value by Mortgage Status in Ankeny
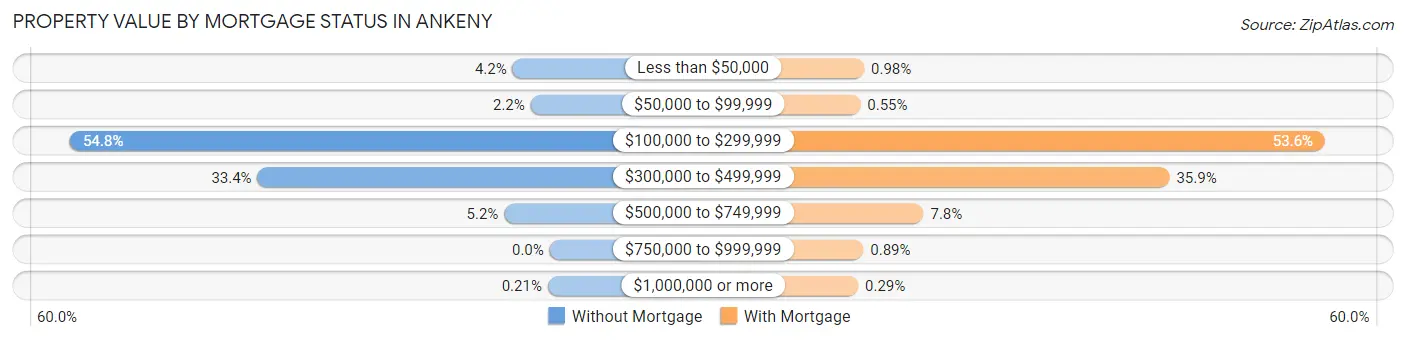
| Property Value | Without Mortgage | With Mortgage |
| Less than $50,000 | 185 (4.2%) | 143 (1.0%) |
| $50,000 to $99,999 | 95 (2.2%) | 80 (0.5%) |
| $100,000 to $299,999 | 2,397 (54.8%) | 7,795 (53.6%) |
| $300,000 to $499,999 | 1,460 (33.4%) | 5,213 (35.9%) |
| $500,000 to $749,999 | 227 (5.2%) | 1,129 (7.8%) |
| $750,000 to $999,999 | 0 (0.0%) | 129 (0.9%) |
| $1,000,000 or more | 9 (0.2%) | 42 (0.3%) |
| Total | 4,373 (100.0%) | 14,531 (100.0%) |
Household Income by Mortgage Status in Ankeny
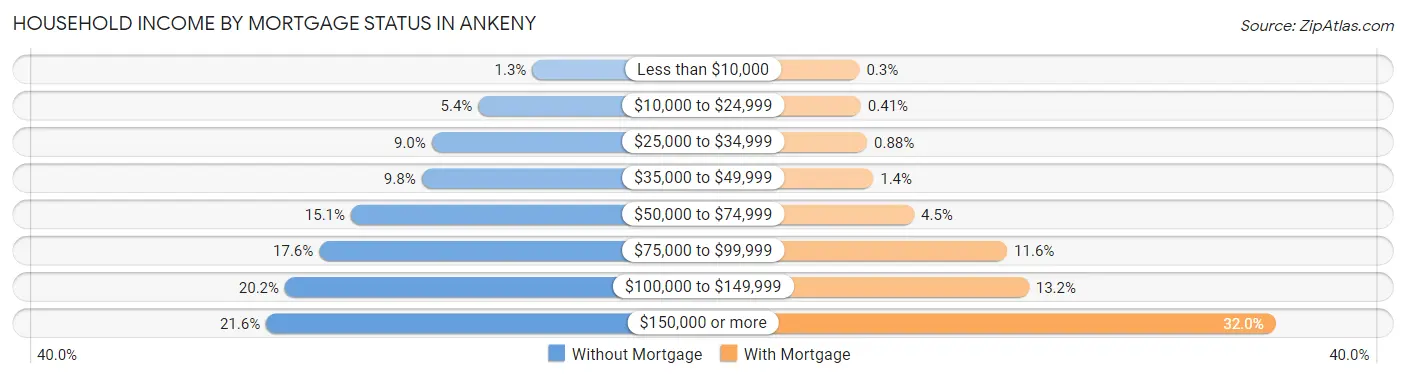
| Household Income | Without Mortgage | With Mortgage |
| Less than $10,000 | 58 (1.3%) | 44 (0.3%) |
| $10,000 to $24,999 | 238 (5.4%) | 59 (0.4%) |
| $25,000 to $34,999 | 393 (9.0%) | 128 (0.9%) |
| $35,000 to $49,999 | 427 (9.8%) | 196 (1.3%) |
| $50,000 to $74,999 | 662 (15.1%) | 648 (4.5%) |
| $75,000 to $99,999 | 768 (17.6%) | 1,679 (11.6%) |
| $100,000 to $149,999 | 882 (20.2%) | 1,918 (13.2%) |
| $150,000 or more | 945 (21.6%) | 4,650 (32.0%) |
| Total | 4,373 (100.0%) | 14,531 (100.0%) |
Property Value to Household Income Ratio in Ankeny
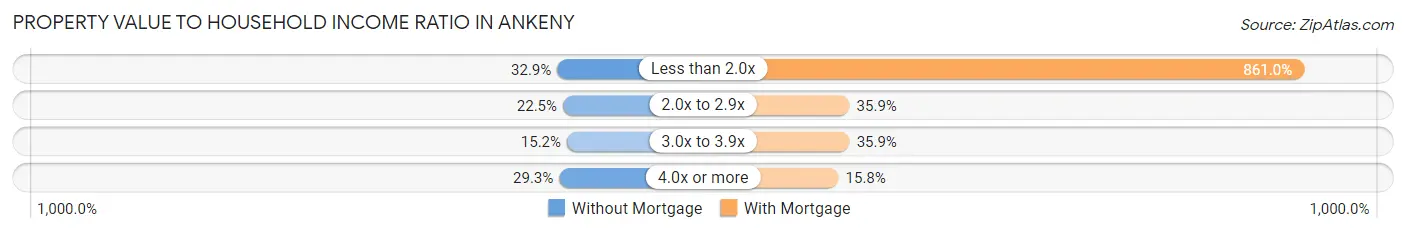
| Value-to-Income Ratio | Without Mortgage | With Mortgage |
| Less than 2.0x | 1,438 (32.9%) | 125,112 (861.0%) |
| 2.0x to 2.9x | 983 (22.5%) | 5,212 (35.9%) |
| 3.0x to 3.9x | 665 (15.2%) | 5,218 (35.9%) |
| 4.0x or more | 1,279 (29.2%) | 2,295 (15.8%) |
| Total | 4,373 (100.0%) | 14,531 (100.0%) |
Real Estate Taxes by Mortgage Status in Ankeny
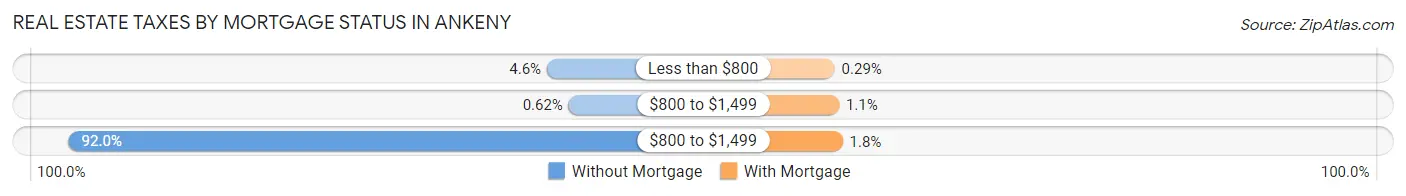
| Property Taxes | Without Mortgage | With Mortgage |
| Less than $800 | 201 (4.6%) | 42 (0.3%) |
| $800 to $1,499 | 27 (0.6%) | 157 (1.1%) |
| $800 to $1,499 | 4,021 (91.9%) | 255 (1.8%) |
| Total | 4,373 (100.0%) | 14,531 (100.0%) |
Health & Disability in Ankeny
Health Insurance Coverage by Age in Ankeny
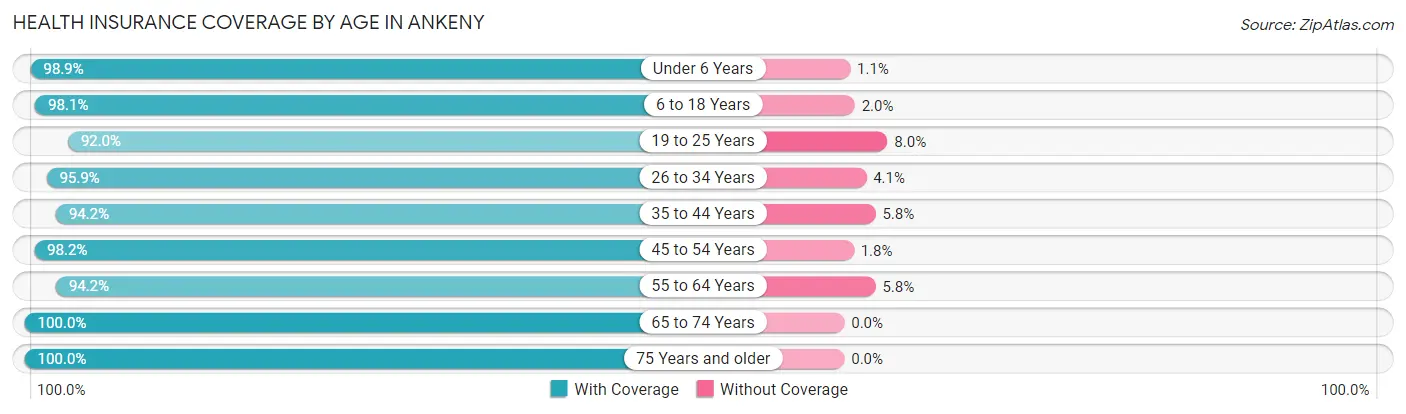
| Age Bracket | With Coverage | Without Coverage |
| Under 6 Years | 5,980 (98.9%) | 65 (1.1%) |
| 6 to 18 Years | 13,119 (98.1%) | 261 (1.9%) |
| 19 to 25 Years | 6,048 (92.0%) | 529 (8.0%) |
| 26 to 34 Years | 9,591 (95.9%) | 408 (4.1%) |
| 35 to 44 Years | 10,222 (94.2%) | 632 (5.8%) |
| 45 to 54 Years | 7,918 (98.2%) | 142 (1.8%) |
| 55 to 64 Years | 5,094 (94.2%) | 315 (5.8%) |
| 65 to 74 Years | 4,427 (100.0%) | 0 (0.0%) |
| 75 Years and older | 3,079 (100.0%) | 0 (0.0%) |
| Total | 65,478 (96.5%) | 2,352 (3.5%) |
Health Insurance Coverage by Citizenship Status in Ankeny
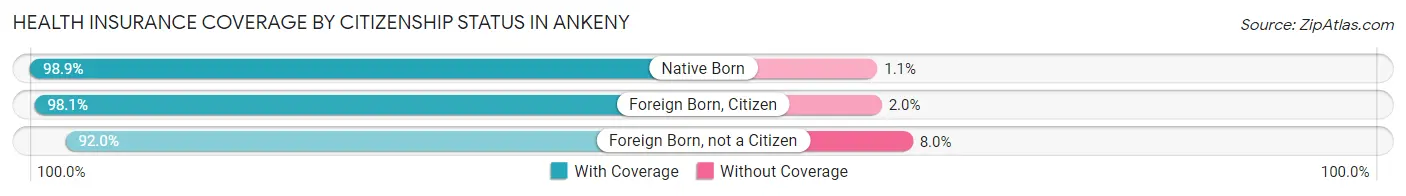
| Citizenship Status | With Coverage | Without Coverage |
| Native Born | 5,980 (98.9%) | 65 (1.1%) |
| Foreign Born, Citizen | 13,119 (98.1%) | 261 (1.9%) |
| Foreign Born, not a Citizen | 6,048 (92.0%) | 529 (8.0%) |
Health Insurance Coverage by Household Income in Ankeny
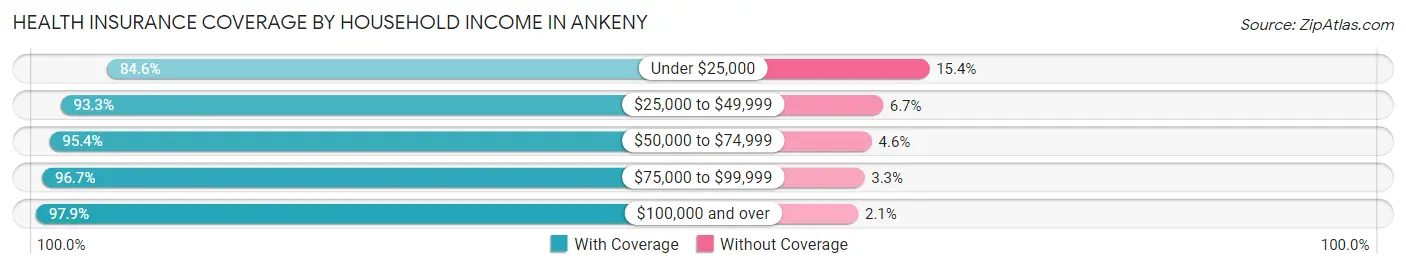
| Household Income | With Coverage | Without Coverage |
| Under $25,000 | 2,174 (84.6%) | 397 (15.4%) |
| $25,000 to $49,999 | 5,025 (93.3%) | 363 (6.7%) |
| $50,000 to $74,999 | 7,564 (95.4%) | 368 (4.6%) |
| $75,000 to $99,999 | 9,965 (96.7%) | 338 (3.3%) |
| $100,000 and over | 40,289 (97.9%) | 867 (2.1%) |
Public vs Private Health Insurance Coverage by Age in Ankeny
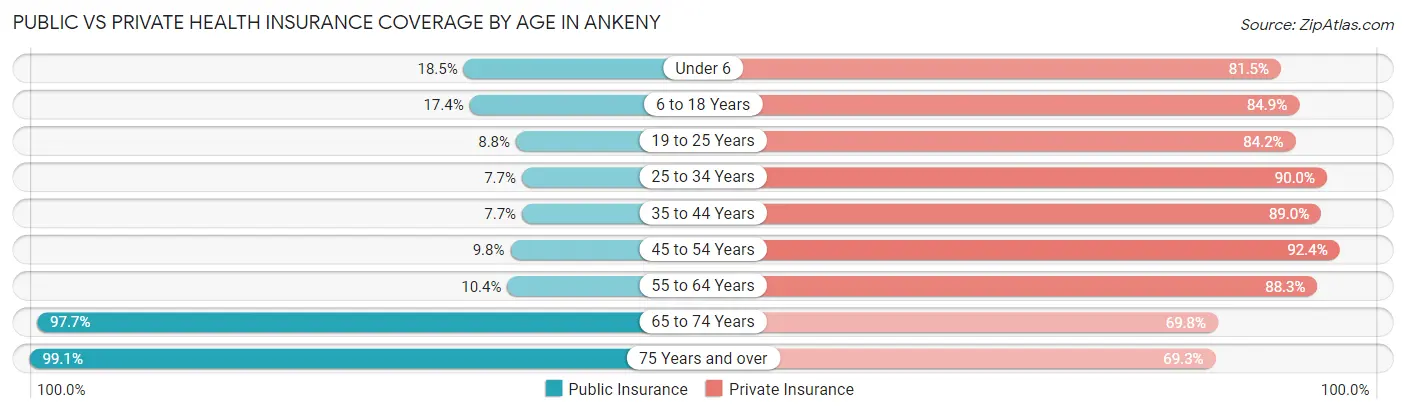
| Age Bracket | Public Insurance | Private Insurance |
| Under 6 | 1,120 (18.5%) | 4,926 (81.5%) |
| 6 to 18 Years | 2,331 (17.4%) | 11,353 (84.9%) |
| 19 to 25 Years | 580 (8.8%) | 5,537 (84.2%) |
| 25 to 34 Years | 771 (7.7%) | 9,002 (90.0%) |
| 35 to 44 Years | 835 (7.7%) | 9,655 (88.9%) |
| 45 to 54 Years | 793 (9.8%) | 7,445 (92.4%) |
| 55 to 64 Years | 563 (10.4%) | 4,774 (88.3%) |
| 65 to 74 Years | 4,324 (97.7%) | 3,089 (69.8%) |
| 75 Years and over | 3,051 (99.1%) | 2,135 (69.3%) |
| Total | 14,368 (21.2%) | 57,916 (85.4%) |
Disability Status by Sex by Age in Ankeny
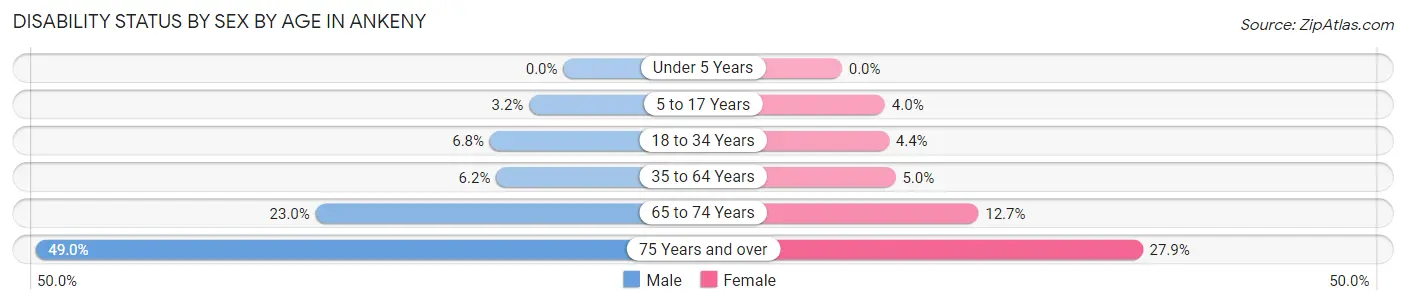
| Age Bracket | Male | Female |
| Under 5 Years | 0 (0.0%) | 0 (0.0%) |
| 5 to 17 Years | 222 (3.2%) | 259 (4.0%) |
| 18 to 34 Years | 602 (6.8%) | 383 (4.4%) |
| 35 to 64 Years | 763 (6.2%) | 602 (5.0%) |
| 65 to 74 Years | 426 (23.0%) | 326 (12.7%) |
| 75 Years and over | 566 (49.0%) | 537 (27.9%) |
Disability Class by Sex by Age in Ankeny
Disability Class: Hearing Difficulty
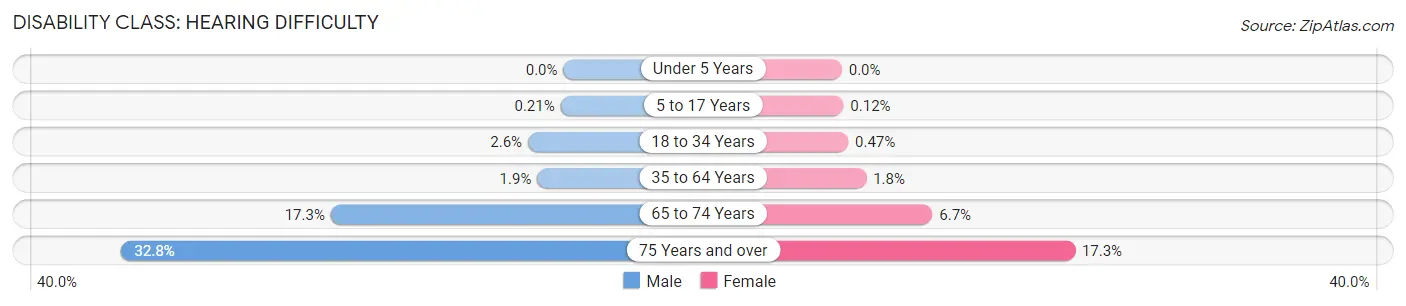
| Age Bracket | Male | Female |
| Under 5 Years | 0 (0.0%) | 0 (0.0%) |
| 5 to 17 Years | 15 (0.2%) | 8 (0.1%) |
| 18 to 34 Years | 232 (2.6%) | 41 (0.5%) |
| 35 to 64 Years | 238 (1.9%) | 218 (1.8%) |
| 65 to 74 Years | 320 (17.3%) | 173 (6.7%) |
| 75 Years and over | 379 (32.8%) | 333 (17.3%) |
Disability Class: Vision Difficulty
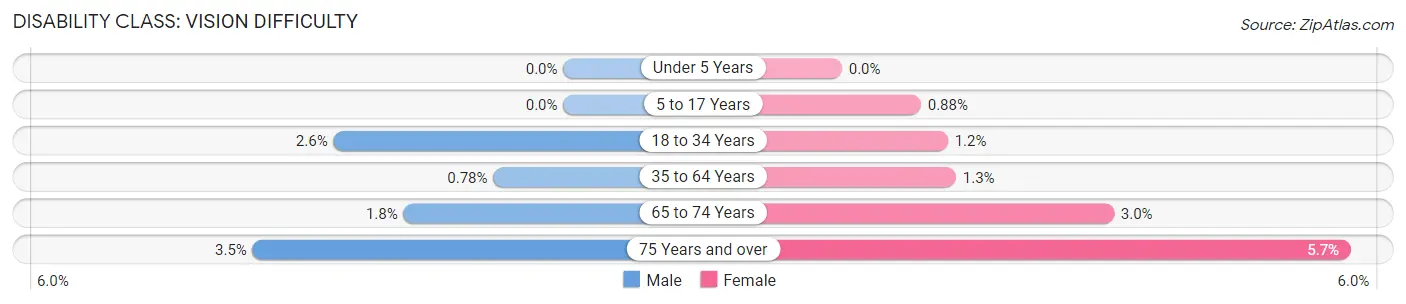
| Age Bracket | Male | Female |
| Under 5 Years | 0 (0.0%) | 0 (0.0%) |
| 5 to 17 Years | 0 (0.0%) | 57 (0.9%) |
| 18 to 34 Years | 226 (2.6%) | 103 (1.2%) |
| 35 to 64 Years | 96 (0.8%) | 153 (1.3%) |
| 65 to 74 Years | 33 (1.8%) | 78 (3.0%) |
| 75 Years and over | 40 (3.5%) | 109 (5.7%) |
Disability Class: Cognitive Difficulty
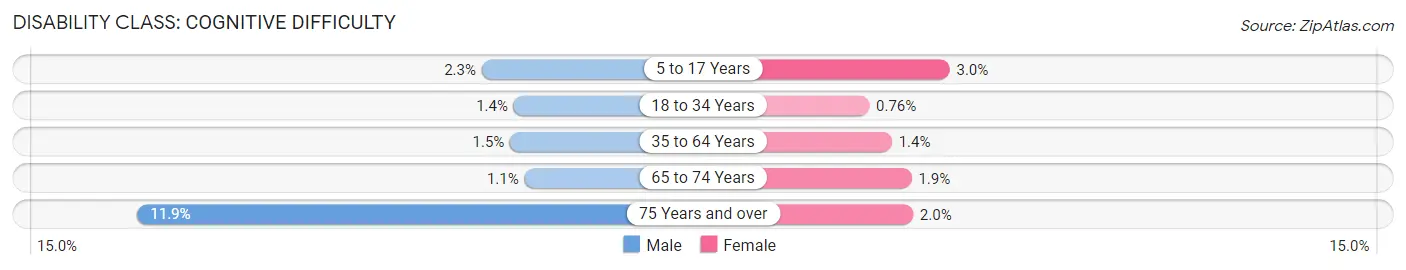
| Age Bracket | Male | Female |
| 5 to 17 Years | 159 (2.3%) | 194 (3.0%) |
| 18 to 34 Years | 122 (1.4%) | 67 (0.8%) |
| 35 to 64 Years | 181 (1.5%) | 168 (1.4%) |
| 65 to 74 Years | 20 (1.1%) | 50 (1.9%) |
| 75 Years and over | 137 (11.9%) | 38 (2.0%) |
Disability Class: Ambulatory Difficulty
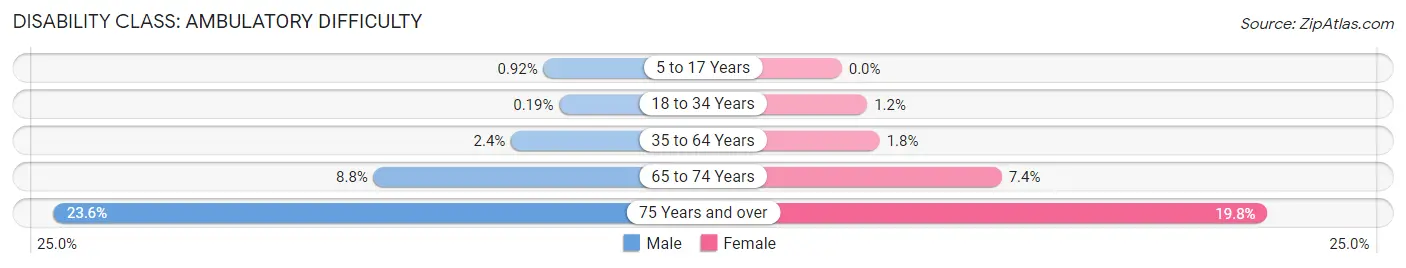
| Age Bracket | Male | Female |
| 5 to 17 Years | 64 (0.9%) | 0 (0.0%) |
| 18 to 34 Years | 17 (0.2%) | 103 (1.2%) |
| 35 to 64 Years | 296 (2.4%) | 212 (1.8%) |
| 65 to 74 Years | 163 (8.8%) | 191 (7.4%) |
| 75 Years and over | 273 (23.6%) | 380 (19.8%) |
Disability Class: Self-Care Difficulty
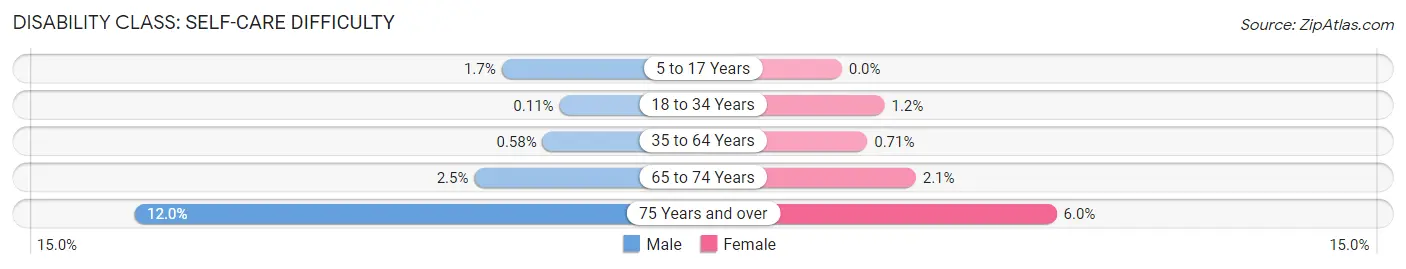
| Age Bracket | Male | Female |
| 5 to 17 Years | 120 (1.7%) | 0 (0.0%) |
| 18 to 34 Years | 10 (0.1%) | 104 (1.2%) |
| 35 to 64 Years | 71 (0.6%) | 86 (0.7%) |
| 65 to 74 Years | 46 (2.5%) | 53 (2.1%) |
| 75 Years and over | 138 (11.9%) | 115 (6.0%) |
Technology Access in Ankeny
Computing Device Access in Ankeny
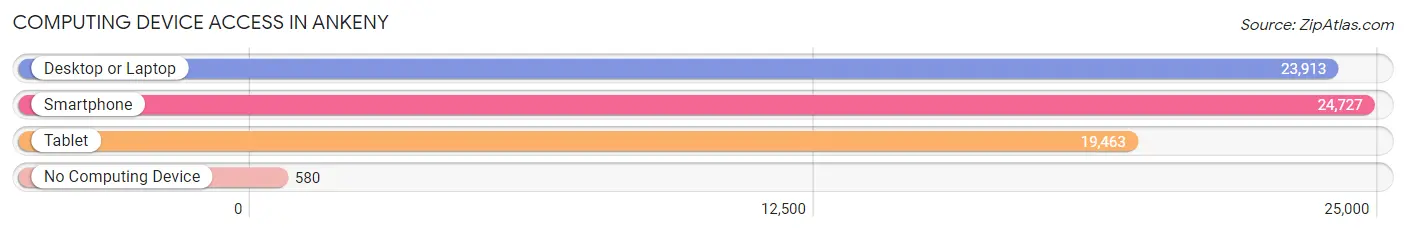
| Device Type | # Households | % Households |
| Desktop or Laptop | 23,913 | 90.1% |
| Smartphone | 24,727 | 93.2% |
| Tablet | 19,463 | 73.4% |
| No Computing Device | 580 | 2.2% |
| Total | 26,525 | 100.0% |
Internet Access in Ankeny
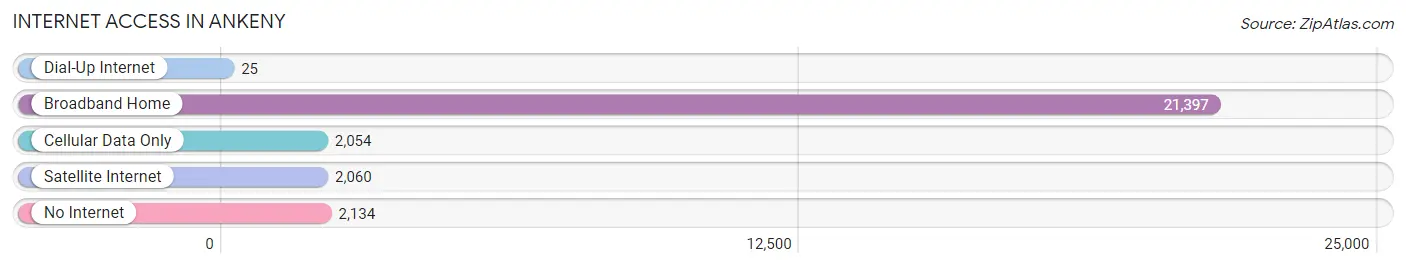
| Internet Type | # Households | % Households |
| Dial-Up Internet | 25 | 0.1% |
| Broadband Home | 21,397 | 80.7% |
| Cellular Data Only | 2,054 | 7.7% |
| Satellite Internet | 2,060 | 7.8% |
| No Internet | 2,134 | 8.1% |
| Total | 26,525 | 100.0% |
Ankeny Summary
Ankeny, Iowa is a city located in Polk County, Iowa, United States. It is a suburb of Des Moines, the state capital. As of the 2010 census, the city population was 45,582, making it the 15th largest city in the state. Ankeny is the fastest growing city in Iowa and the third fastest growing city in the Midwest.
History
Ankeny was founded in 1875 by John Ankeny, a settler from Pennsylvania. He purchased 160 acres of land and built a log cabin on the site. The town was originally called "Ankenytown" and was later changed to Ankeny. The town was incorporated in 1903.
Ankeny experienced rapid growth in the late 20th century, due in part to its proximity to Des Moines. The city's population grew from 4,000 in 1990 to over 45,000 in 2010.
Geography
Ankeny is located in central Iowa, approximately 15 miles north of Des Moines. It is situated in the Des Moines metropolitan area, which has a population of over 600,000. The city covers an area of 24.6 square miles and has an elevation of 945 feet.
The city is located in the Des Moines River Valley, which is part of the larger Central Iowa Uplands region. The city is bordered by the Des Moines River to the east and the Skunk River to the west.
Climate
Ankeny has a humid continental climate, with hot, humid summers and cold, dry winters. The average annual temperature is 50.2°F, with an average high of 68.2°F in July and an average low of 32.2°F in January. The average annual precipitation is 36.2 inches.
Demographics
As of the 2010 census, there were 45,582 people, 17,845 households, and 12,717 families residing in the city. The population density was 1,851.3 people per square mile. The racial makeup of the city was 90.2% White, 3.2% African American, 0.3% Native American, 3.2% Asian, 0.7% from other races, and 2.4% from two or more races. Hispanic or Latino of any race were 2.7% of the population.
The median income for a household in the city was $62,945, and the median income for a family was $76,845. The per capita income for the city was $29,945. About 3.2% of families and 4.7% of the population were below the poverty line, including 5.3% of those under age 18 and 4.2% of those age 65 or over.
Economy
Ankeny is home to a variety of businesses, including manufacturing, retail, and service industries. The city is home to several large employers, including John Deere, Principal Financial Group, and Wells Fargo.
Ankeny is also home to several shopping centers, including the Ankeny Marketplace, the Ankeny Town Center, and the Prairie Trail Shopping Center. The city is also home to several parks, including the Ankeny Wildlife Refuge and the Ankeny National Wildlife Refuge.
Ankeny is served by the Des Moines International Airport, which is located approximately 15 miles south of the city. The city is also served by several major highways, including Interstate 35, U.S. Route 69, and Iowa Highway 141.
Common Questions
What is Per Capita Income in Ankeny?
Per Capita income in Ankeny is $46,184.
What is the Median Family Income in Ankeny?
Median Family Income in Ankeny is $118,421.
What is the Median Household income in Ankeny?
Median Household Income in Ankeny is $101,151.
What is Income or Wage Gap in Ankeny?
Income or Wage Gap in Ankeny is 27.4%.
Women in Ankeny earn 72.6 cents for every dollar earned by a man.
What is Family Income Deficit in Ankeny?
Family Income Deficit in Ankeny is $13,259.
Families that are below poverty line in Ankeny earn $13,259 less on average than the poverty threshold level.
What is Inequality or Gini Index in Ankeny?
Inequality or Gini Index in Ankeny is 0.37.
What is the Total Population of Ankeny?
Total Population of Ankeny is 68,392.
What is the Total Male Population of Ankeny?
Total Male Population of Ankeny is 33,973.
What is the Total Female Population of Ankeny?
Total Female Population of Ankeny is 34,419.
What is the Ratio of Males per 100 Females in Ankeny?
There are 98.70 Males per 100 Females in Ankeny.
What is the Ratio of Females per 100 Males in Ankeny?
There are 101.31 Females per 100 Males in Ankeny.
What is the Median Population Age in Ankeny?
Median Population Age in Ankeny is 33.3 Years.
What is the Average Family Size in Ankeny
Average Family Size in Ankeny is 3.1 People.
What is the Average Household Size in Ankeny
Average Household Size in Ankeny is 2.5 People.
How Large is the Labor Force in Ankeny?
There are 39,513 People in the Labor Forcein in Ankeny.
What is the Percentage of People in the Labor Force in Ankeny?
76.2% of People are in the Labor Force in Ankeny.
What is the Unemployment Rate in Ankeny?
Unemployment Rate in Ankeny is 2.6%.