Ottumwa, IA Map & Demographics
Ottumwa Map
Ottumwa Overview
$29,395
PER CAPITA INCOME
$61,429
AVG FAMILY INCOME
$53,085
AVG HOUSEHOLD INCOME
20.7%
WAGE / INCOME GAP [ % ]
79.3¢/ $1
WAGE / INCOME GAP [ $ ]
$10,995
FAMILY INCOME DEFICIT
0.44
INEQUALITY / GINI INDEX
25,359
TOTAL POPULATION
12,844
MALE POPULATION
12,515
FEMALE POPULATION
102.63
MALES / 100 FEMALES
97.44
FEMALES / 100 MALES
36.7
MEDIAN AGE
3.0
AVG FAMILY SIZE
2.4
AVG HOUSEHOLD SIZE
12,700
LABOR FORCE [ PEOPLE ]
63.3%
PERCENT IN LABOR FORCE
4.5%
UNEMPLOYMENT RATE
Ottumwa Zip Codes
Ottumwa Area Codes
Income in Ottumwa
Income Overview in Ottumwa
Per Capita Income in Ottumwa is $29,395, while median incomes of families and households are $61,429 and $53,085 respectively.
| Characteristic | Number | Measure |
| Per Capita Income | 25,359 | $29,395 |
| Median Family Income | 6,338 | $61,429 |
| Mean Family Income | 6,338 | $77,080 |
| Median Household Income | 10,201 | $53,085 |
| Mean Household Income | 10,201 | $69,867 |
| Income Deficit | 6,338 | $10,995 |
| Wage / Income Gap (%) | 25,359 | 20.69% |
| Wage / Income Gap ($) | 25,359 | 79.31¢ per $1 |
| Gini / Inequality Index | 25,359 | 0.44 |
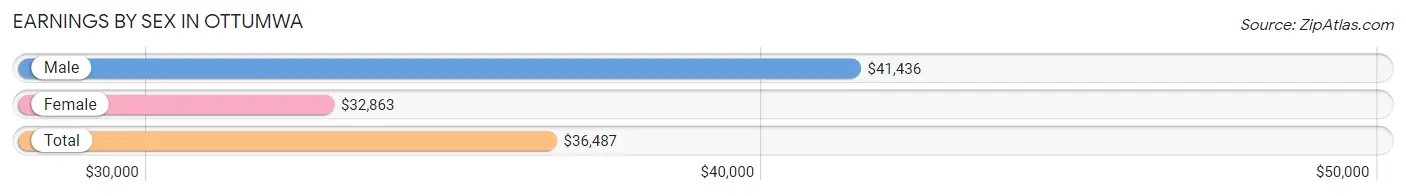
Earnings by Sex in Ottumwa
Average Earnings in Ottumwa are $36,487, $41,436 for men and $32,863 for women, a difference of 20.7%.
| Sex | Number | Average Earnings |
| Male | 7,117 (53.3%) | $41,436 |
| Female | 6,227 (46.7%) | $32,863 |
| Total | 13,344 (100.0%) | $36,487 |
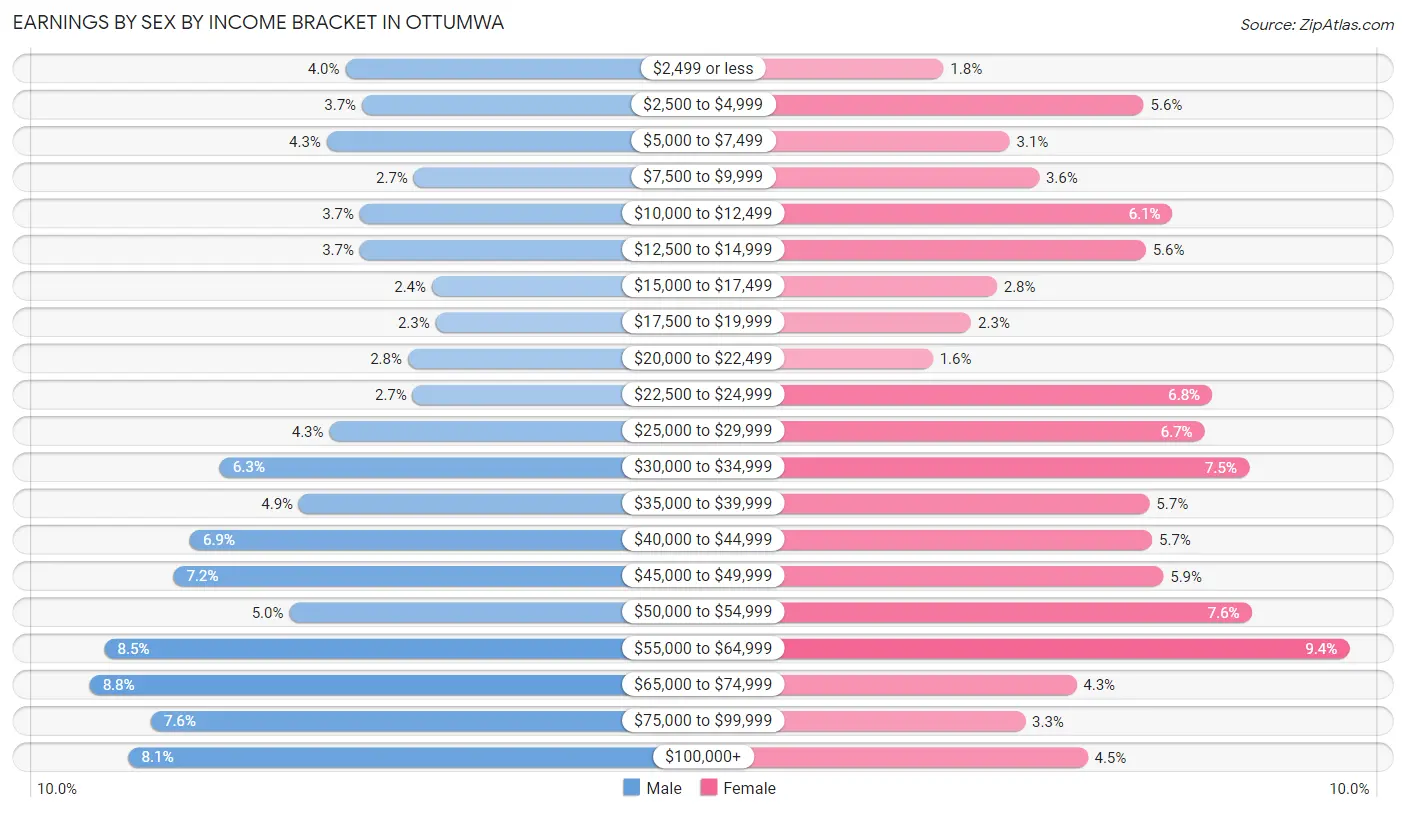
Earnings by Sex by Income Bracket in Ottumwa
The most common earnings brackets in Ottumwa are $65,000 to $74,999 for men (625 | 8.8%) and $55,000 to $64,999 for women (586 | 9.4%).
| Income | Male | Female |
| $2,499 or less | 284 (4.0%) | 113 (1.8%) |
| $2,500 to $4,999 | 262 (3.7%) | 346 (5.6%) |
| $5,000 to $7,499 | 309 (4.3%) | 190 (3.0%) |
| $7,500 to $9,999 | 193 (2.7%) | 224 (3.6%) |
| $10,000 to $12,499 | 265 (3.7%) | 380 (6.1%) |
| $12,500 to $14,999 | 265 (3.7%) | 349 (5.6%) |
| $15,000 to $17,499 | 169 (2.4%) | 175 (2.8%) |
| $17,500 to $19,999 | 164 (2.3%) | 145 (2.3%) |
| $20,000 to $22,499 | 201 (2.8%) | 100 (1.6%) |
| $22,500 to $24,999 | 194 (2.7%) | 426 (6.8%) |
| $25,000 to $29,999 | 305 (4.3%) | 417 (6.7%) |
| $30,000 to $34,999 | 451 (6.3%) | 469 (7.5%) |
| $35,000 to $39,999 | 346 (4.9%) | 353 (5.7%) |
| $40,000 to $44,999 | 491 (6.9%) | 356 (5.7%) |
| $45,000 to $49,999 | 513 (7.2%) | 369 (5.9%) |
| $50,000 to $54,999 | 359 (5.0%) | 472 (7.6%) |
| $55,000 to $64,999 | 605 (8.5%) | 586 (9.4%) |
| $65,000 to $74,999 | 625 (8.8%) | 268 (4.3%) |
| $75,000 to $99,999 | 543 (7.6%) | 208 (3.3%) |
| $100,000+ | 573 (8.1%) | 281 (4.5%) |
| Total | 7,117 (100.0%) | 6,227 (100.0%) |
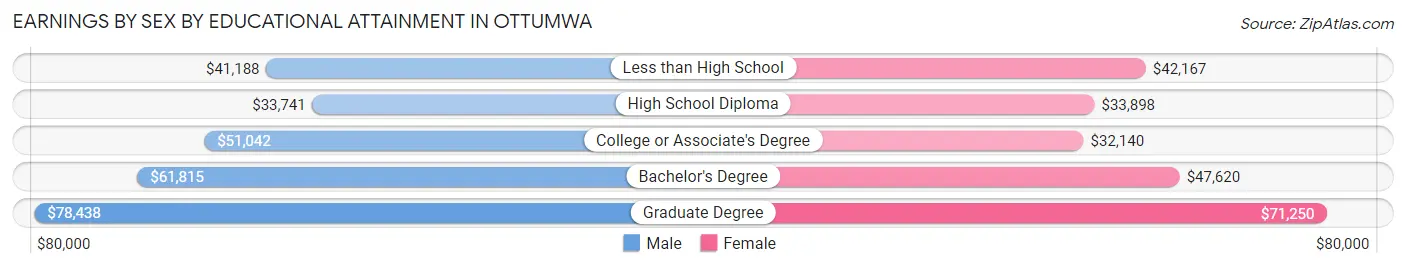
Earnings by Sex by Educational Attainment in Ottumwa
Average earnings in Ottumwa are $45,336 for men and $36,863 for women, a difference of 18.7%. Men with an educational attainment of graduate degree enjoy the highest average annual earnings of $78,438, while those with high school diploma education earn the least with $33,741. Women with an educational attainment of graduate degree earn the most with the average annual earnings of $71,250, while those with college or associate's degree education have the smallest earnings of $32,140.
| Educational Attainment | Male Income | Female Income |
| Less than High School | $41,188 | $42,167 |
| High School Diploma | $33,741 | $33,898 |
| College or Associate's Degree | $51,042 | $32,140 |
| Bachelor's Degree | $61,815 | $47,620 |
| Graduate Degree | $78,438 | $71,250 |
| Total | $45,336 | $36,863 |
Family Income in Ottumwa
Family Income Brackets in Ottumwa
According to the Ottumwa family income data, there are 1,274 families falling into the $50,000 to $74,999 income range, which is the most common income bracket and makes up 20.1% of all families. Conversely, the $200,000+ income bracket is the least frequent group with only 158 families (2.5%) belonging to this category.
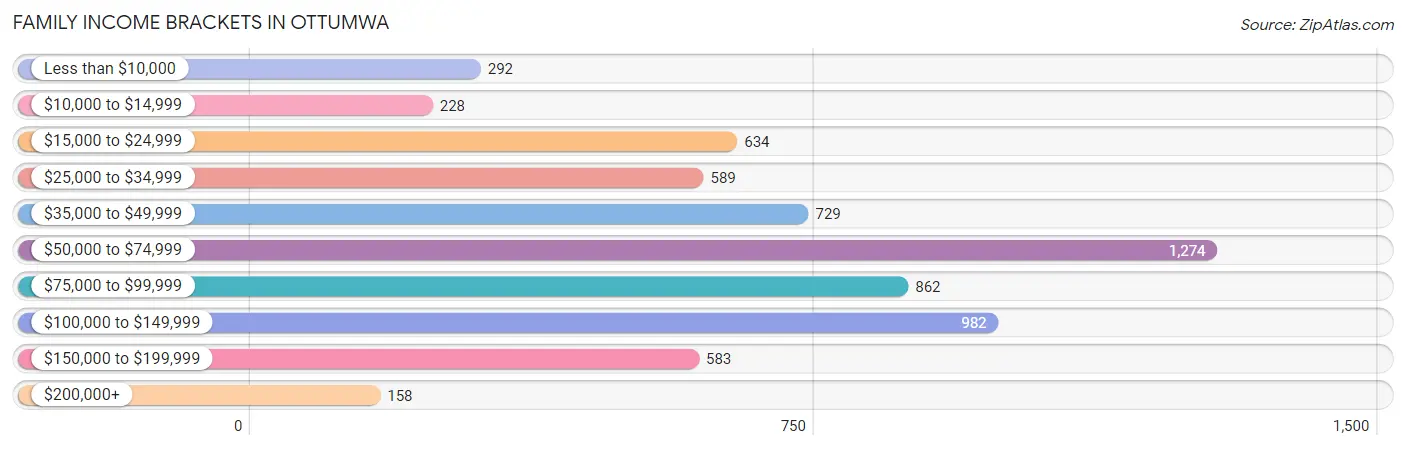
| Income Bracket | # Families | % Families |
| Less than $10,000 | 292 | 4.6% |
| $10,000 to $14,999 | 228 | 3.6% |
| $15,000 to $24,999 | 634 | 10.0% |
| $25,000 to $34,999 | 589 | 9.3% |
| $35,000 to $49,999 | 729 | 11.5% |
| $50,000 to $74,999 | 1,274 | 20.1% |
| $75,000 to $99,999 | 862 | 13.6% |
| $100,000 to $149,999 | 982 | 15.5% |
| $150,000 to $199,999 | 583 | 9.2% |
| $200,000+ | 158 | 2.5% |
Family Income by Famaliy Size in Ottumwa
5-person families (426 | 6.7%) account for the highest median family income in Ottumwa with $101,413 per family, while 2-person families (3,163 | 49.9%) have the highest median income of $28,650 per family member.
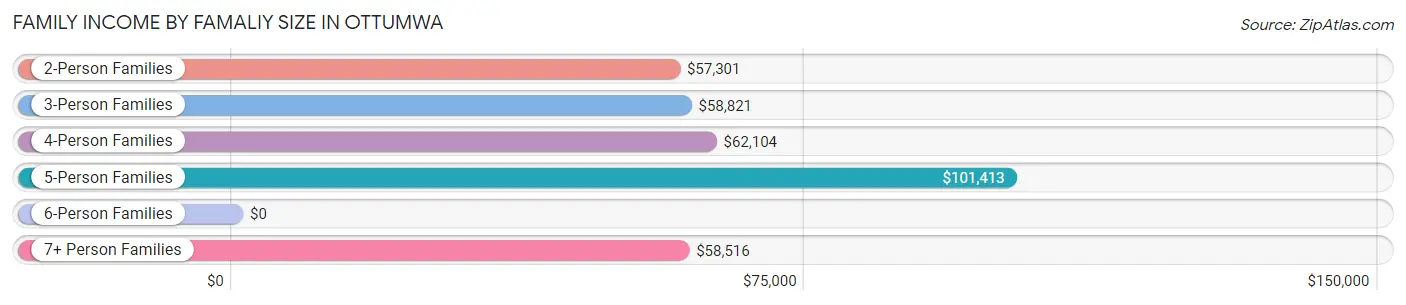
| Income Bracket | # Families | Median Income |
| 2-Person Families | 3,163 (49.9%) | $57,301 |
| 3-Person Families | 1,341 (21.2%) | $58,821 |
| 4-Person Families | 1,133 (17.9%) | $62,104 |
| 5-Person Families | 426 (6.7%) | $101,413 |
| 6-Person Families | 128 (2.0%) | $0 |
| 7+ Person Families | 147 (2.3%) | $58,516 |
| Total | 6,338 (100.0%) | $61,429 |
Family Income by Number of Earners in Ottumwa
The median family income in Ottumwa is $61,429, with families comprising 3+ earners (548) having the highest median family income of $120,156, while families with no earners (1,103) have the lowest median family income of $36,680, accounting for 8.6% and 17.4% of families, respectively.
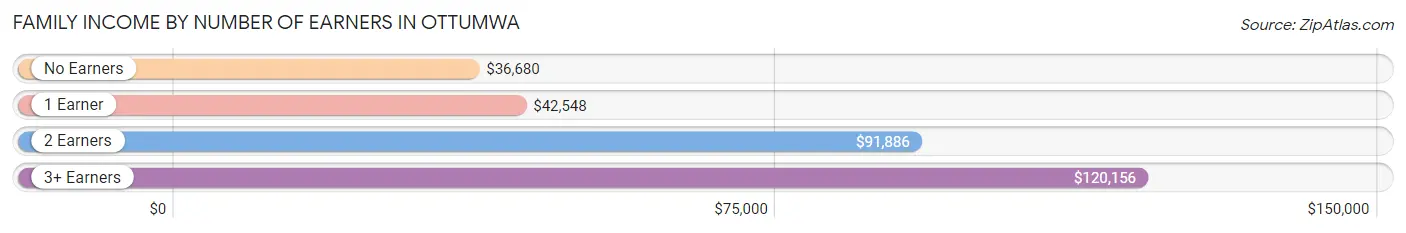
| Number of Earners | # Families | Median Income |
| No Earners | 1,103 (17.4%) | $36,680 |
| 1 Earner | 2,200 (34.7%) | $42,548 |
| 2 Earners | 2,487 (39.2%) | $91,886 |
| 3+ Earners | 548 (8.6%) | $120,156 |
| Total | 6,338 (100.0%) | $61,429 |
Household Income in Ottumwa
Household Income Brackets in Ottumwa
With 1,928 households falling in the category, the $50,000 to $74,999 income range is the most frequent in Ottumwa, accounting for 18.9% of all households. In contrast, only 265 households (2.6%) fall into the $200,000+ income bracket, making it the least populous group.
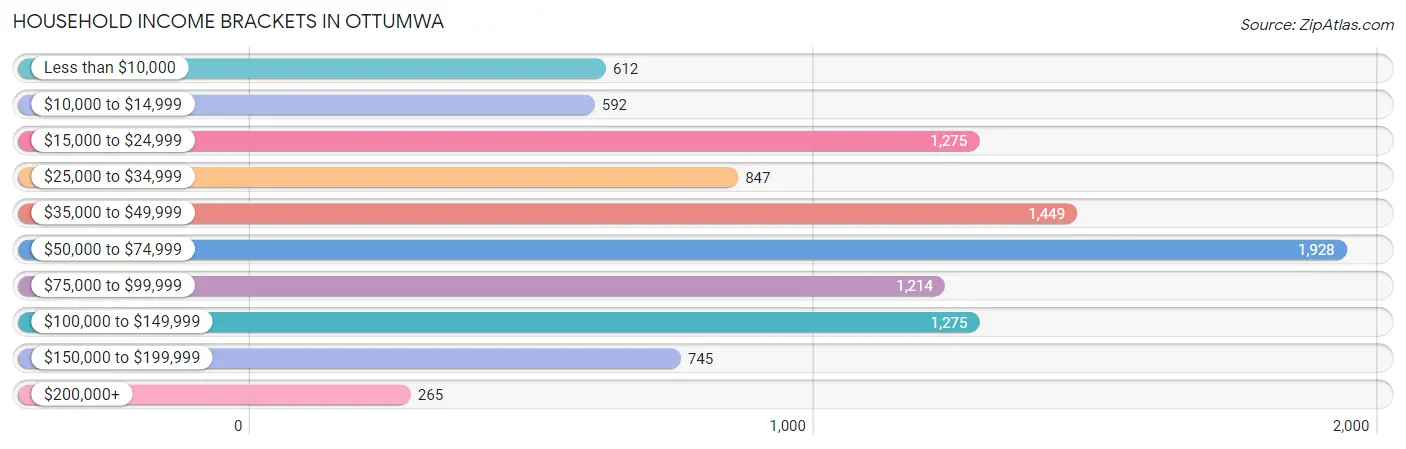
| Income Bracket | # Households | % Households |
| Less than $10,000 | 612 | 6.0% |
| $10,000 to $14,999 | 592 | 5.8% |
| $15,000 to $24,999 | 1,275 | 12.5% |
| $25,000 to $34,999 | 847 | 8.3% |
| $35,000 to $49,999 | 1,449 | 14.2% |
| $50,000 to $74,999 | 1,928 | 18.9% |
| $75,000 to $99,999 | 1,214 | 11.9% |
| $100,000 to $149,999 | 1,275 | 12.5% |
| $150,000 to $199,999 | 745 | 7.3% |
| $200,000+ | 265 | 2.6% |
Household Income by Householder Age in Ottumwa
The median household income in Ottumwa is $53,085, with the highest median household income of $64,131 found in the 45 to 64 years age bracket for the primary householder. A total of 3,949 households (38.7%) fall into this category. Meanwhile, the 65+ years age bracket for the primary householder has the lowest median household income of $37,849, with 2,472 households (24.2%) in this group.
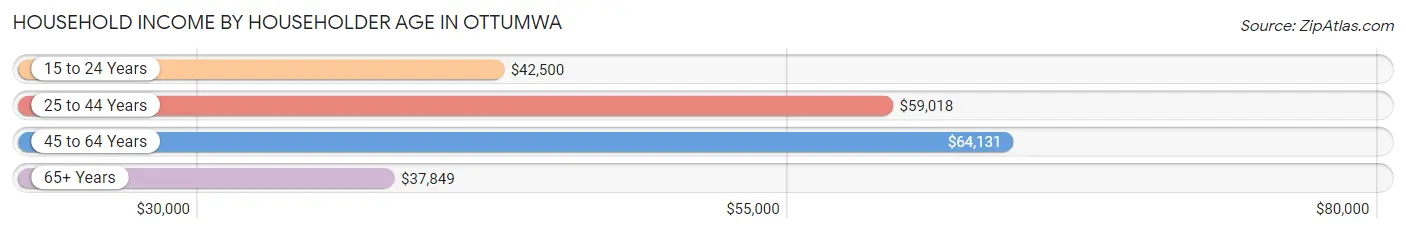
| Income Bracket | # Households | Median Income |
| 15 to 24 Years | 574 (5.6%) | $42,500 |
| 25 to 44 Years | 3,206 (31.4%) | $59,018 |
| 45 to 64 Years | 3,949 (38.7%) | $64,131 |
| 65+ Years | 2,472 (24.2%) | $37,849 |
| Total | 10,201 (100.0%) | $53,085 |
Poverty in Ottumwa
Income Below Poverty by Sex and Age in Ottumwa
With 19.3% poverty level for males and 18.6% for females among the residents of Ottumwa, 6 to 11 year old males and 5 year old females are the most vulnerable to poverty, with 336 males (28.5%) and 54 females (60.7%) in their respective age groups living below the poverty level.
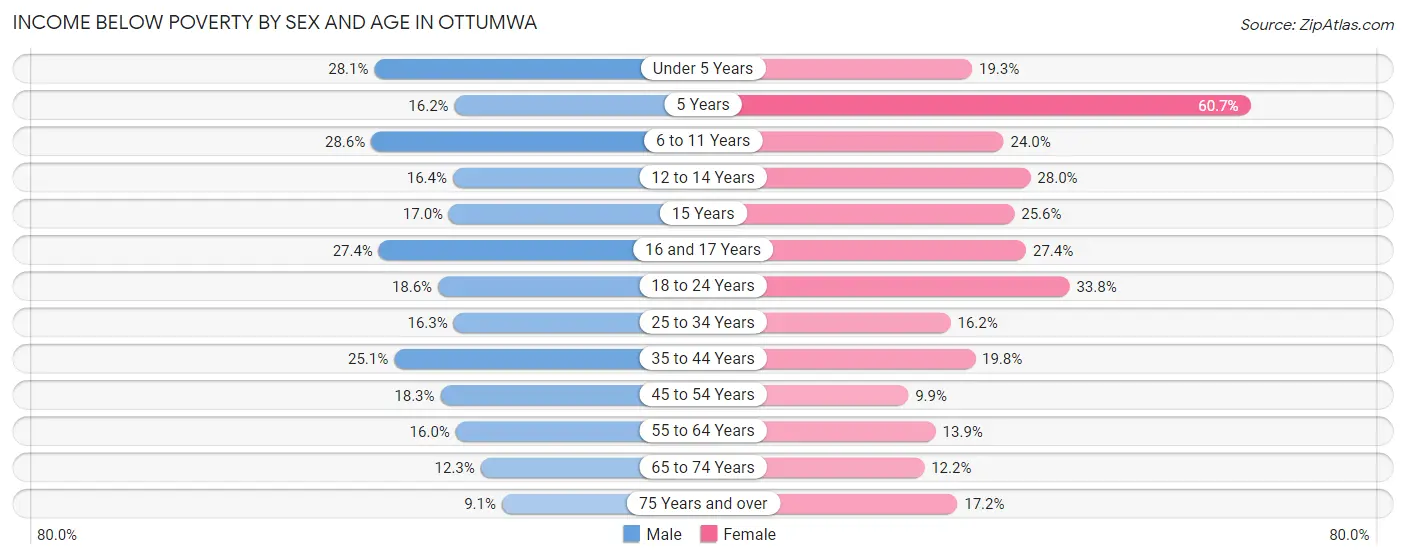
| Age Bracket | Male | Female |
| Under 5 Years | 237 (28.1%) | 164 (19.3%) |
| 5 Years | 44 (16.2%) | 54 (60.7%) |
| 6 to 11 Years | 336 (28.5%) | 174 (24.0%) |
| 12 to 14 Years | 55 (16.4%) | 156 (28.0%) |
| 15 Years | 35 (17.0%) | 41 (25.6%) |
| 16 and 17 Years | 116 (27.4%) | 84 (27.4%) |
| 18 to 24 Years | 181 (18.6%) | 355 (33.8%) |
| 25 to 34 Years | 333 (16.3%) | 271 (16.2%) |
| 35 to 44 Years | 315 (25.1%) | 282 (19.8%) |
| 45 to 54 Years | 306 (18.3%) | 165 (9.9%) |
| 55 to 64 Years | 273 (16.0%) | 208 (13.9%) |
| 65 to 74 Years | 116 (12.3%) | 142 (12.2%) |
| 75 Years and over | 51 (9.1%) | 171 (17.2%) |
| Total | 2,398 (19.3%) | 2,267 (18.6%) |
Income Above Poverty by Sex and Age in Ottumwa
According to the poverty statistics in Ottumwa, males aged 75 years and over and females aged 45 to 54 years are the age groups that are most secure financially, with 90.9% of males and 90.1% of females in these age groups living above the poverty line.
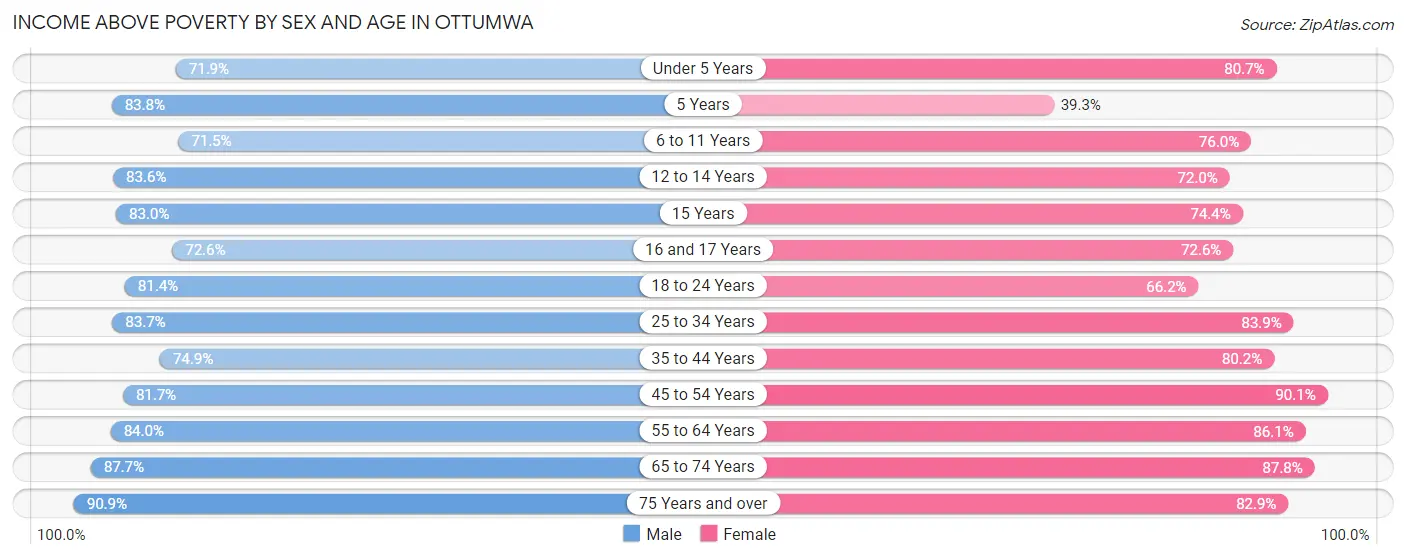
| Age Bracket | Male | Female |
| Under 5 Years | 607 (71.9%) | 684 (80.7%) |
| 5 Years | 228 (83.8%) | 35 (39.3%) |
| 6 to 11 Years | 841 (71.5%) | 550 (76.0%) |
| 12 to 14 Years | 280 (83.6%) | 401 (72.0%) |
| 15 Years | 171 (83.0%) | 119 (74.4%) |
| 16 and 17 Years | 307 (72.6%) | 223 (72.6%) |
| 18 to 24 Years | 791 (81.4%) | 695 (66.2%) |
| 25 to 34 Years | 1,709 (83.7%) | 1,407 (83.9%) |
| 35 to 44 Years | 938 (74.9%) | 1,144 (80.2%) |
| 45 to 54 Years | 1,370 (81.7%) | 1,508 (90.1%) |
| 55 to 64 Years | 1,434 (84.0%) | 1,284 (86.1%) |
| 65 to 74 Years | 828 (87.7%) | 1,018 (87.8%) |
| 75 Years and over | 507 (90.9%) | 826 (82.9%) |
| Total | 10,011 (80.7%) | 9,894 (81.4%) |
Income Below Poverty Among Married-Couple Families in Ottumwa
The poverty statistics for married-couple families in Ottumwa show that 4.4% or 176 of the total 4,029 families live below the poverty line. Families with 5 or more children have the highest poverty rate of 30.8%, comprising of 24 families. On the other hand, families with 3 or 4 children have the lowest poverty rate of 0.0%, which includes 0 families.
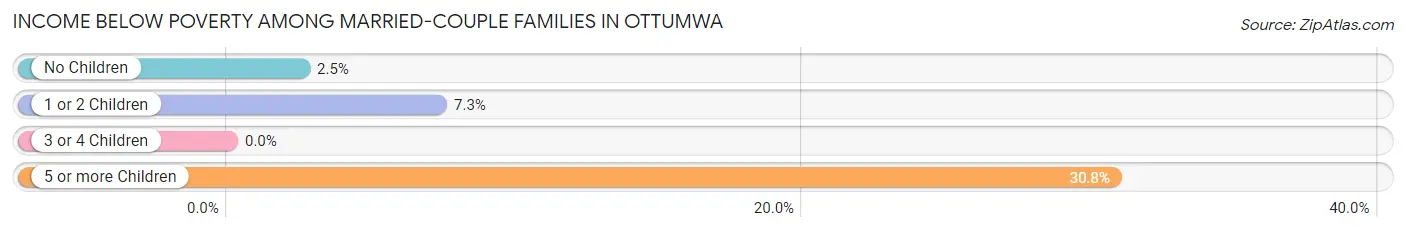
| Children | Above Poverty | Below Poverty |
| No Children | 2,450 (97.5%) | 63 (2.5%) |
| 1 or 2 Children | 1,133 (92.7%) | 89 (7.3%) |
| 3 or 4 Children | 216 (100.0%) | 0 (0.0%) |
| 5 or more Children | 54 (69.2%) | 24 (30.8%) |
| Total | 3,853 (95.6%) | 176 (4.4%) |
Income Below Poverty Among Single-Parent Households in Ottumwa
According to the poverty data in Ottumwa, 39.2% or 233 single-father households and 33.5% or 575 single-mother households are living below the poverty line. Among single-father households, those with 3 or 4 children have the highest poverty rate, with 43 households (69.4%) experiencing poverty. Likewise, among single-mother households, those with 3 or 4 children have the highest poverty rate, with 197 households (56.5%) falling below the poverty line.
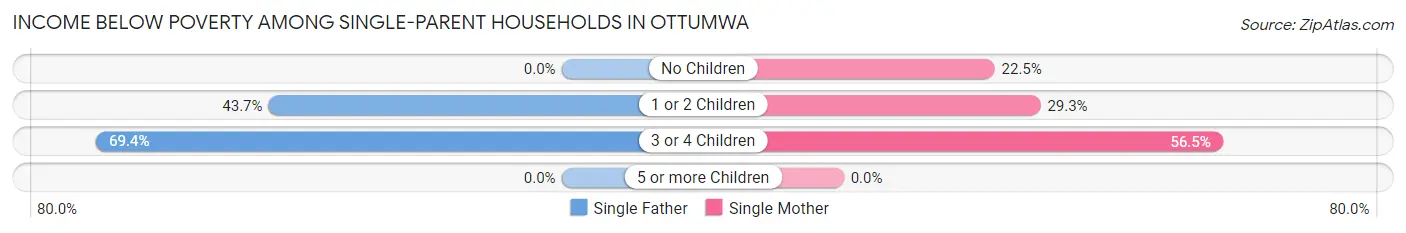
| Children | Single Father | Single Mother |
| No Children | 0 (0.0%) | 74 (22.5%) |
| 1 or 2 Children | 190 (43.7%) | 304 (29.3%) |
| 3 or 4 Children | 43 (69.4%) | 197 (56.5%) |
| 5 or more Children | 0 (0.0%) | 0 (0.0%) |
| Total | 233 (39.2%) | 575 (33.5%) |
Income Below Poverty Among Married-Couple vs Single-Parent Households in Ottumwa
The poverty data for Ottumwa shows that 176 of the married-couple family households (4.4%) and 808 of the single-parent households (35.0%) are living below the poverty level. Within the married-couple family households, those with 5 or more children have the highest poverty rate, with 24 households (30.8%) falling below the poverty line. Among the single-parent households, those with 3 or 4 children have the highest poverty rate, with 240 household (58.4%) living below poverty.
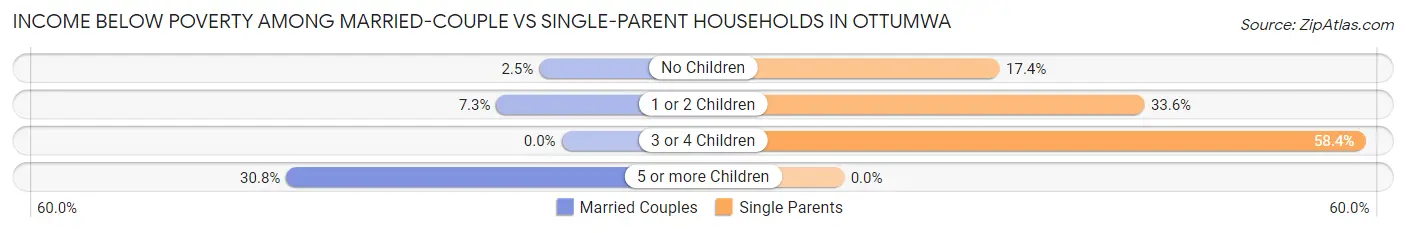
| Children | Married-Couple Families | Single-Parent Households |
| No Children | 63 (2.5%) | 74 (17.4%) |
| 1 or 2 Children | 89 (7.3%) | 494 (33.6%) |
| 3 or 4 Children | 0 (0.0%) | 240 (58.4%) |
| 5 or more Children | 24 (30.8%) | 0 (0.0%) |
| Total | 176 (4.4%) | 808 (35.0%) |
Race in Ottumwa
The most populous races in Ottumwa are White / Caucasian (20,689 | 81.6%), Hispanic or Latino (3,779 | 14.9%), and Two or more Races (1,470 | 5.8%).
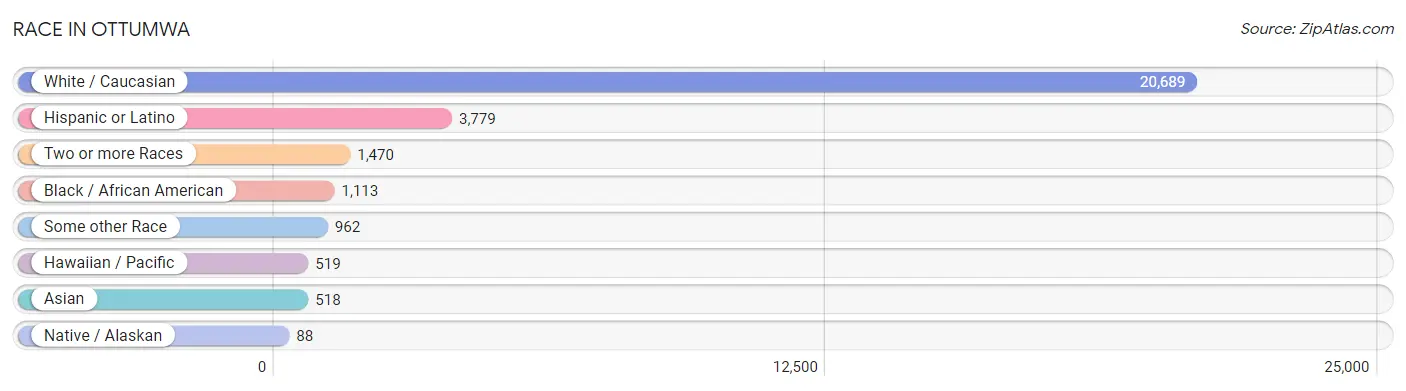
| Race | # Population | % Population |
| Asian | 518 | 2.0% |
| Black / African American | 1,113 | 4.4% |
| Hawaiian / Pacific | 519 | 2.1% |
| Hispanic or Latino | 3,779 | 14.9% |
| Native / Alaskan | 88 | 0.4% |
| White / Caucasian | 20,689 | 81.6% |
| Two or more Races | 1,470 | 5.8% |
| Some other Race | 962 | 3.8% |
| Total | 25,359 | 100.0% |
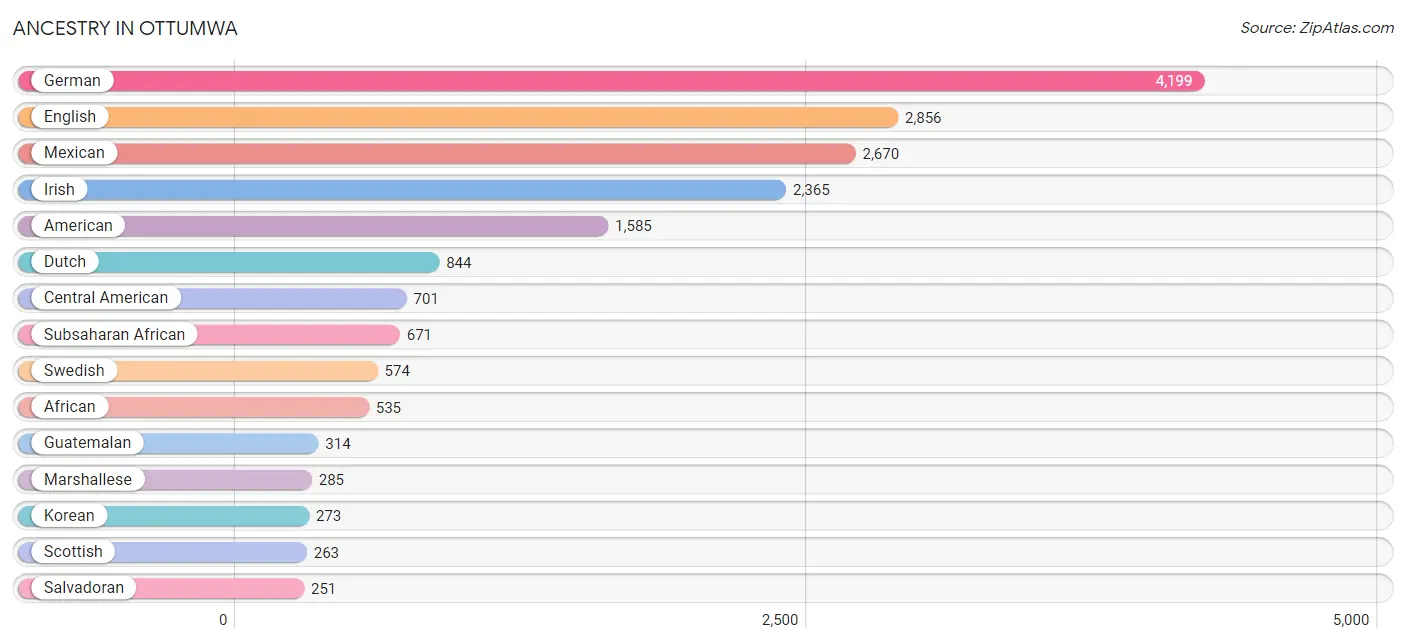
Ancestry in Ottumwa
The most populous ancestries reported in Ottumwa are German (4,199 | 16.6%), English (2,856 | 11.3%), Mexican (2,670 | 10.5%), Irish (2,365 | 9.3%), and American (1,585 | 6.2%), together accounting for 53.9% of all Ottumwa residents.
| Ancestry | # Population | % Population |
| African | 535 | 2.1% |
| American | 1,585 | 6.2% |
| Arab | 69 | 0.3% |
| Belgian | 30 | 0.1% |
| Bhutanese | 15 | 0.1% |
| Blackfeet | 12 | 0.1% |
| British | 195 | 0.8% |
| Burmese | 131 | 0.5% |
| Canadian | 21 | 0.1% |
| Central American | 701 | 2.8% |
| Central American Indian | 77 | 0.3% |
| Cherokee | 9 | 0.0% |
| Chippewa | 1 | 0.0% |
| Colombian | 4 | 0.0% |
| Cuban | 198 | 0.8% |
| Czech | 44 | 0.2% |
| Danish | 102 | 0.4% |
| Dutch | 844 | 3.3% |
| Eastern European | 9 | 0.0% |
| Egyptian | 1 | 0.0% |
| English | 2,856 | 11.3% |
| European | 162 | 0.6% |
| Fijian | 233 | 0.9% |
| Finnish | 9 | 0.0% |
| French | 133 | 0.5% |
| French Canadian | 77 | 0.3% |
| German | 4,199 | 16.6% |
| Greek | 128 | 0.5% |
| Guatemalan | 314 | 1.2% |
| Haitian | 34 | 0.1% |
| Honduran | 112 | 0.4% |
| Hungarian | 24 | 0.1% |
| Indian (Asian) | 44 | 0.2% |
| Indonesian | 48 | 0.2% |
| Irish | 2,365 | 9.3% |
| Israeli | 26 | 0.1% |
| Italian | 192 | 0.8% |
| Jamaican | 9 | 0.0% |
| Korean | 273 | 1.1% |
| Lithuanian | 8 | 0.0% |
| Macedonian | 55 | 0.2% |
| Malaysian | 66 | 0.3% |
| Marshallese | 285 | 1.1% |
| Mexican | 2,670 | 10.5% |
| Moroccan | 47 | 0.2% |
| Native Hawaiian | 8 | 0.0% |
| Nicaraguan | 24 | 0.1% |
| Northern European | 126 | 0.5% |
| Norwegian | 237 | 0.9% |
| Pakistani | 8 | 0.0% |
| Pennsylvania German | 4 | 0.0% |
| Puerto Rican | 115 | 0.4% |
| Russian | 11 | 0.0% |
| Salvadoran | 251 | 1.0% |
| Scandinavian | 12 | 0.1% |
| Scotch-Irish | 139 | 0.5% |
| Scottish | 263 | 1.0% |
| Sioux | 18 | 0.1% |
| Slavic | 11 | 0.0% |
| Slovak | 19 | 0.1% |
| South American | 4 | 0.0% |
| Spaniard | 7 | 0.0% |
| Spanish | 18 | 0.1% |
| Subsaharan African | 671 | 2.6% |
| Sudanese | 136 | 0.5% |
| Swedish | 574 | 2.3% |
| Swiss | 43 | 0.2% |
| Thai | 26 | 0.1% |
| Tlingit-Haida | 8 | 0.0% |
| Ukrainian | 13 | 0.1% |
| Vietnamese | 8 | 0.0% |
| Welsh | 27 | 0.1% |
| Yaqui | 7 | 0.0% |
| Yugoslavian | 14 | 0.1% | View All 74 Rows |
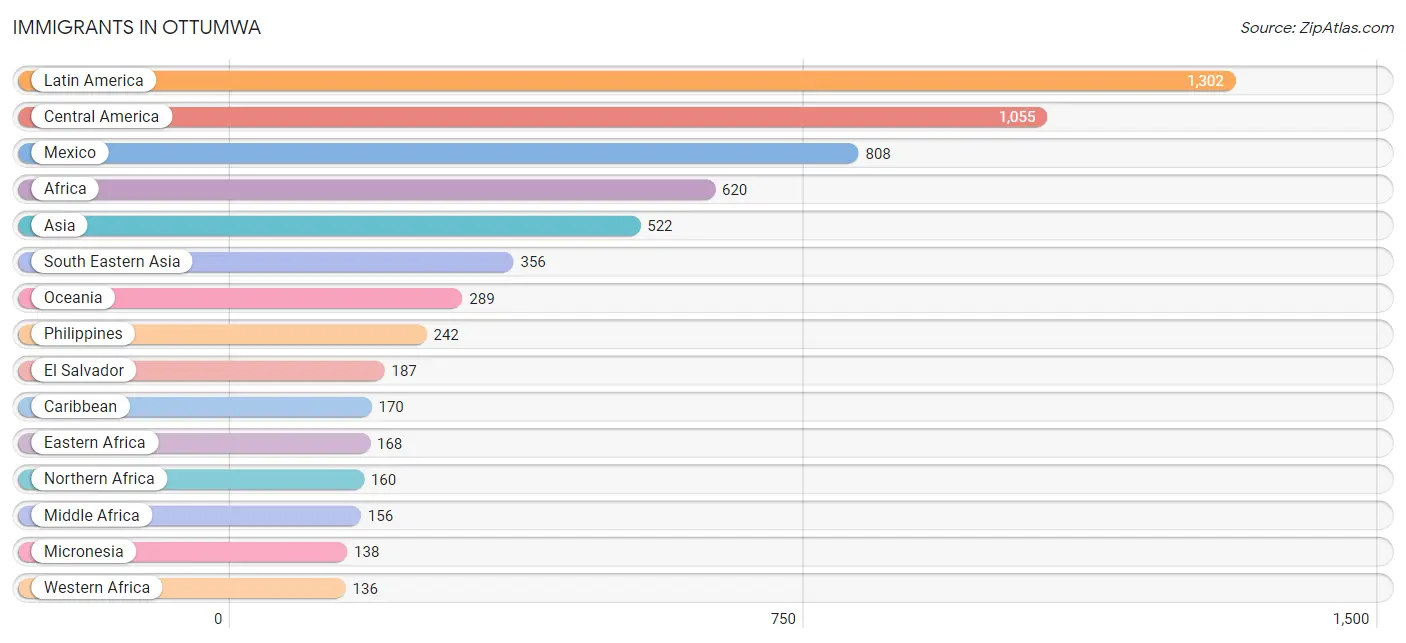
Immigrants in Ottumwa
The most numerous immigrant groups reported in Ottumwa came from Latin America (1,302 | 5.1%), Central America (1,055 | 4.2%), Mexico (808 | 3.2%), Africa (620 | 2.4%), and Asia (522 | 2.1%), together accounting for 17.0% of all Ottumwa residents.
| Immigration Origin | # Population | % Population |
| Africa | 620 | 2.4% |
| Asia | 522 | 2.1% |
| Bangladesh | 8 | 0.0% |
| Brazil | 9 | 0.0% |
| Cameroon | 73 | 0.3% |
| Canada | 8 | 0.0% |
| Caribbean | 170 | 0.7% |
| Central America | 1,055 | 4.2% |
| Colombia | 4 | 0.0% |
| Cuba | 118 | 0.5% |
| Eastern Africa | 168 | 0.7% |
| Eastern Asia | 53 | 0.2% |
| Eastern Europe | 55 | 0.2% |
| El Salvador | 187 | 0.7% |
| England | 16 | 0.1% |
| Eritrea | 80 | 0.3% |
| Ethiopia | 88 | 0.4% |
| Europe | 100 | 0.4% |
| Germany | 18 | 0.1% |
| Ghana | 18 | 0.1% |
| Guatemala | 52 | 0.2% |
| Haiti | 34 | 0.1% |
| India | 84 | 0.3% |
| Israel | 21 | 0.1% |
| Italy | 5 | 0.0% |
| Jamaica | 9 | 0.0% |
| Japan | 15 | 0.1% |
| Korea | 38 | 0.2% |
| Laos | 66 | 0.3% |
| Latin America | 1,302 | 5.1% |
| Liberia | 60 | 0.2% |
| Mexico | 808 | 3.2% |
| Micronesia | 138 | 0.5% |
| Middle Africa | 156 | 0.6% |
| Morocco | 55 | 0.2% |
| Nicaragua | 8 | 0.0% |
| Nigeria | 44 | 0.2% |
| North Macedonia | 55 | 0.2% |
| Northern Africa | 160 | 0.6% |
| Northern Europe | 16 | 0.1% |
| Oceania | 289 | 1.1% |
| Peru | 64 | 0.3% |
| Philippines | 242 | 0.9% |
| South America | 77 | 0.3% |
| South Central Asia | 92 | 0.4% |
| South Eastern Asia | 356 | 1.4% |
| Southern Europe | 5 | 0.0% |
| Sudan | 105 | 0.4% |
| Switzerland | 6 | 0.0% |
| Western Africa | 136 | 0.5% |
| Western Asia | 21 | 0.1% |
| Western Europe | 24 | 0.1% |
| Zaire | 83 | 0.3% | View All 53 Rows |
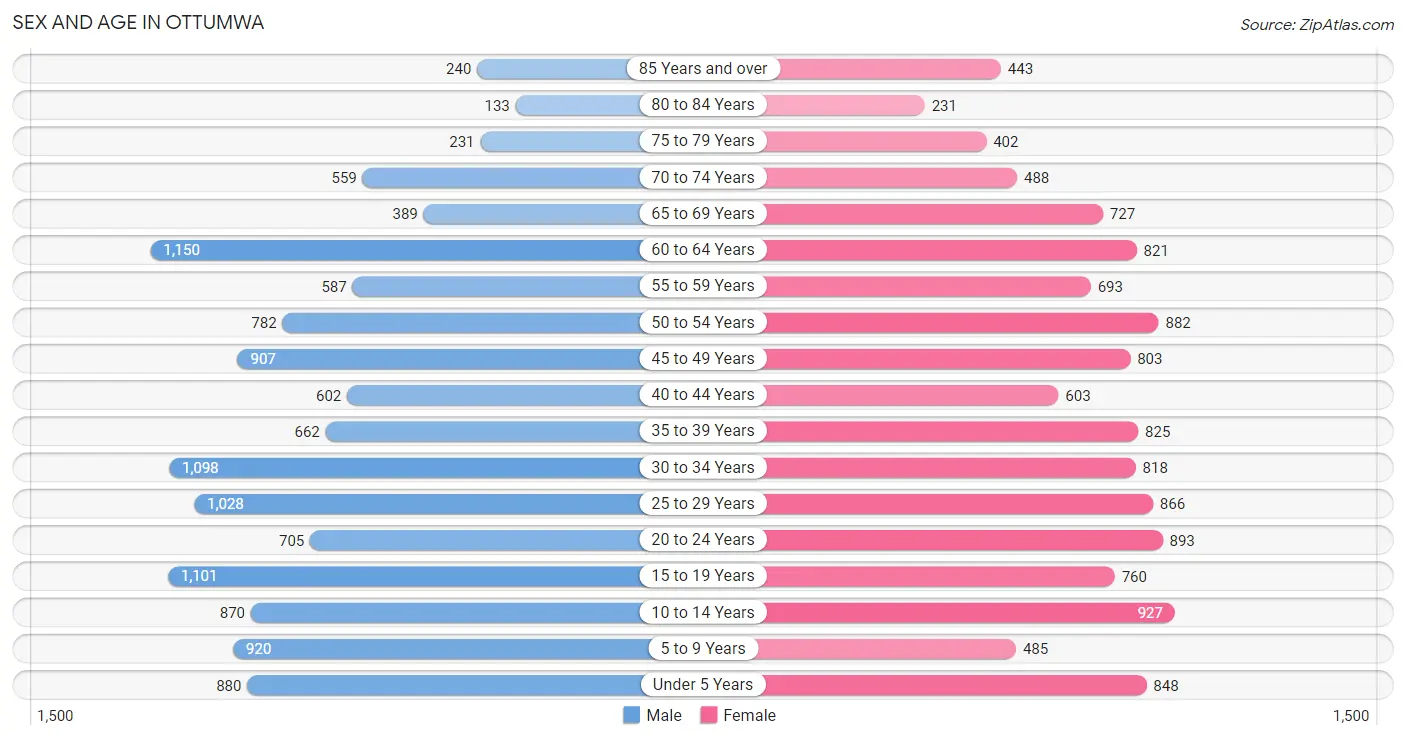
Sex and Age in Ottumwa
Sex and Age in Ottumwa
The most populous age groups in Ottumwa are 60 to 64 Years (1,150 | 8.9%) for men and 10 to 14 Years (927 | 7.4%) for women.
| Age Bracket | Male | Female |
| Under 5 Years | 880 (6.9%) | 848 (6.8%) |
| 5 to 9 Years | 920 (7.2%) | 485 (3.9%) |
| 10 to 14 Years | 870 (6.8%) | 927 (7.4%) |
| 15 to 19 Years | 1,101 (8.6%) | 760 (6.1%) |
| 20 to 24 Years | 705 (5.5%) | 893 (7.1%) |
| 25 to 29 Years | 1,028 (8.0%) | 866 (6.9%) |
| 30 to 34 Years | 1,098 (8.6%) | 818 (6.5%) |
| 35 to 39 Years | 662 (5.1%) | 825 (6.6%) |
| 40 to 44 Years | 602 (4.7%) | 603 (4.8%) |
| 45 to 49 Years | 907 (7.1%) | 803 (6.4%) |
| 50 to 54 Years | 782 (6.1%) | 882 (7.0%) |
| 55 to 59 Years | 587 (4.6%) | 693 (5.5%) |
| 60 to 64 Years | 1,150 (8.9%) | 821 (6.6%) |
| 65 to 69 Years | 389 (3.0%) | 727 (5.8%) |
| 70 to 74 Years | 559 (4.3%) | 488 (3.9%) |
| 75 to 79 Years | 231 (1.8%) | 402 (3.2%) |
| 80 to 84 Years | 133 (1.0%) | 231 (1.8%) |
| 85 Years and over | 240 (1.9%) | 443 (3.5%) |
| Total | 12,844 (100.0%) | 12,515 (100.0%) |
Families and Households in Ottumwa
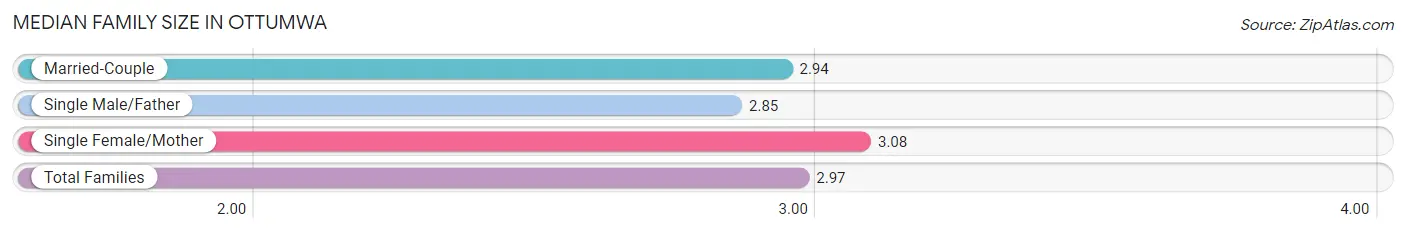
Median Family Size in Ottumwa
The median family size in Ottumwa is 2.97 persons per family, with single female/mother families (1,715 | 27.1%) accounting for the largest median family size of 3.08 persons per family. On the other hand, single male/father families (594 | 9.4%) represent the smallest median family size with 2.85 persons per family.
| Family Type | # Families | Family Size |
| Married-Couple | 4,029 (63.6%) | 2.94 |
| Single Male/Father | 594 (9.4%) | 2.85 |
| Single Female/Mother | 1,715 (27.1%) | 3.08 |
| Total Families | 6,338 (100.0%) | 2.97 |
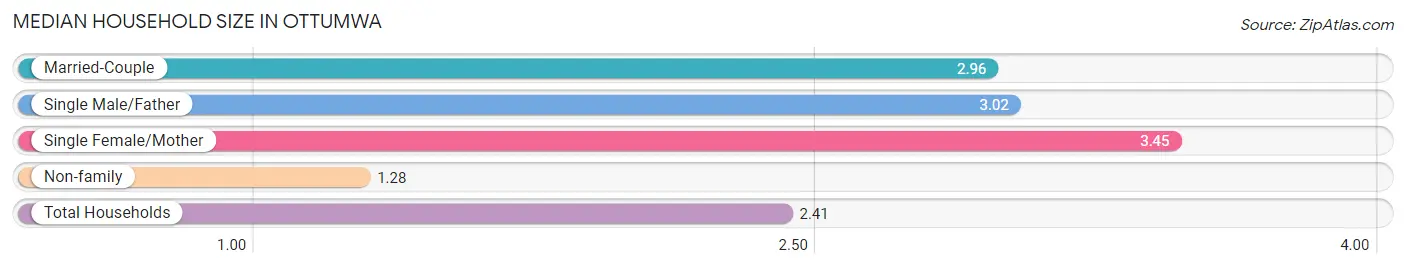
Median Household Size in Ottumwa
The median household size in Ottumwa is 2.41 persons per household, with single female/mother households (1,715 | 16.8%) accounting for the largest median household size of 3.45 persons per household. non-family households (3,863 | 37.9%) represent the smallest median household size with 1.28 persons per household.
| Household Type | # Households | Household Size |
| Married-Couple | 4,029 (39.5%) | 2.96 |
| Single Male/Father | 594 (5.8%) | 3.02 |
| Single Female/Mother | 1,715 (16.8%) | 3.45 |
| Non-family | 3,863 (37.9%) | 1.28 |
| Total Households | 10,201 (100.0%) | 2.41 |
Household Size by Marriage Status in Ottumwa
Out of a total of 10,201 households in Ottumwa, 6,338 (62.1%) are family households, while 3,863 (37.9%) are nonfamily households. The most numerous type of family households are 2-person households, comprising 2,972, and the most common type of nonfamily households are 1-person households, comprising 3,183.
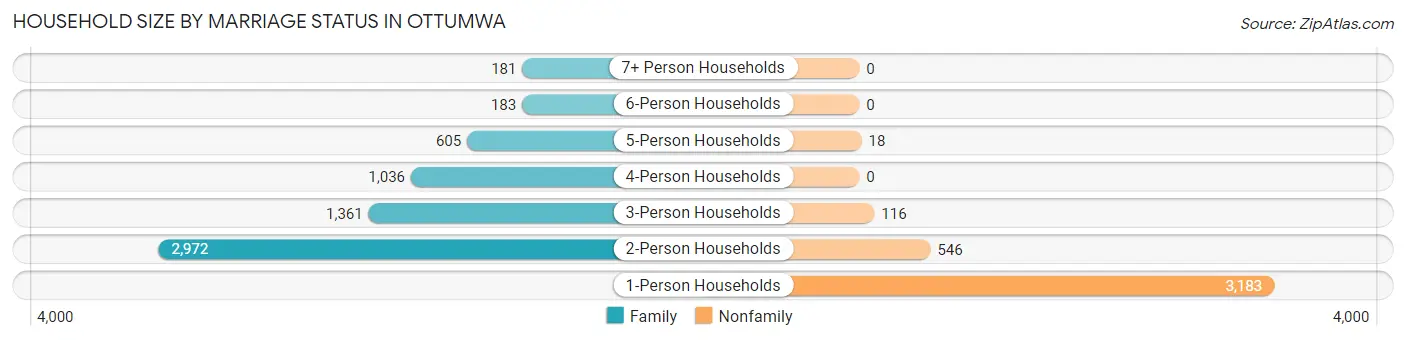
| Household Size | Family Households | Nonfamily Households |
| 1-Person Households | - | 3,183 (31.2%) |
| 2-Person Households | 2,972 (29.1%) | 546 (5.3%) |
| 3-Person Households | 1,361 (13.3%) | 116 (1.1%) |
| 4-Person Households | 1,036 (10.2%) | 0 (0.0%) |
| 5-Person Households | 605 (5.9%) | 18 (0.2%) |
| 6-Person Households | 183 (1.8%) | 0 (0.0%) |
| 7+ Person Households | 181 (1.8%) | 0 (0.0%) |
| Total | 6,338 (62.1%) | 3,863 (37.9%) |
Female Fertility in Ottumwa
Fertility by Age in Ottumwa
Average fertility rate in Ottumwa is 79.0 births per 1,000 women. Women in the age bracket of 20 to 34 years have the highest fertility rate with 138.0 births per 1,000 women. Women in the age bracket of 20 to 34 years acount for 77.9% of all women with births.
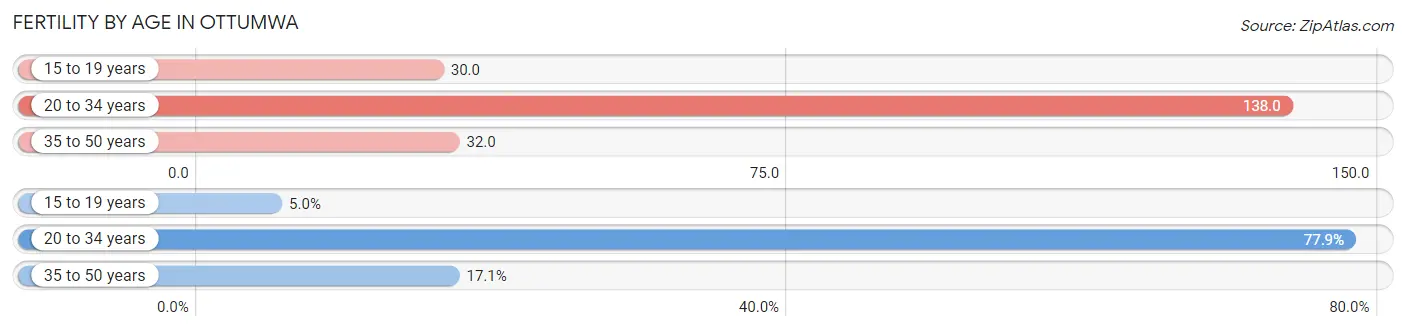
| Age Bracket | Women with Births | Births / 1,000 Women |
| 15 to 19 years | 23 (5.0%) | 30.0 |
| 20 to 34 years | 356 (77.9%) | 138.0 |
| 35 to 50 years | 78 (17.1%) | 32.0 |
| Total | 457 (100.0%) | 79.0 |
Fertility by Age by Marriage Status in Ottumwa
57.1% of women with births (457) in Ottumwa are married. The highest percentage of unmarried women with births falls into 20 to 34 years age bracket with 48.6% of them unmarried at the time of birth, while the lowest percentage of unmarried women with births belong to 15 to 19 years age bracket with 0.0% of them unmarried.
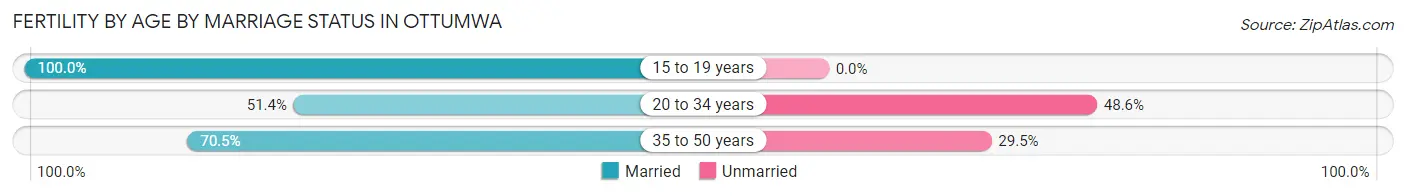
| Age Bracket | Married | Unmarried |
| 15 to 19 years | 23 (100.0%) | 0 (0.0%) |
| 20 to 34 years | 183 (51.4%) | 173 (48.6%) |
| 35 to 50 years | 55 (70.5%) | 23 (29.5%) |
| Total | 261 (57.1%) | 196 (42.9%) |
Fertility by Education in Ottumwa
Average fertility rate in Ottumwa is 79.0 births per 1,000 women. Women with the education attainment of graduate degree have the highest fertility rate of 146.0 births per 1,000 women, while women with the education attainment of bachelor's degree have the lowest fertility at 18.0 births per 1,000 women. Women with the education attainment of high school diploma represent 47.5% of all women with births.
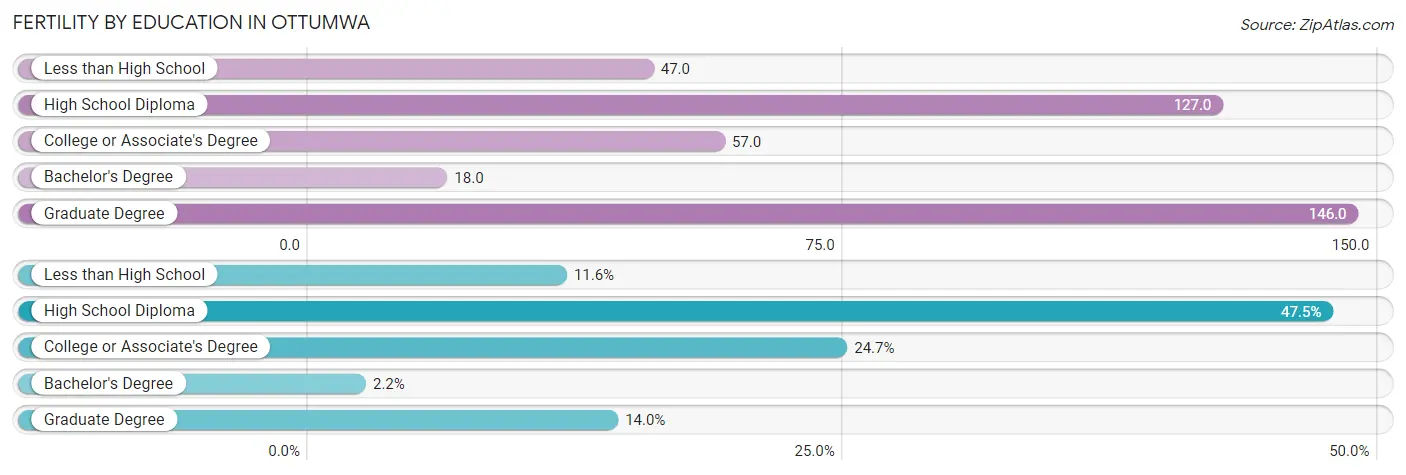
| Educational Attainment | Women with Births | Births / 1,000 Women |
| Less than High School | 53 (11.6%) | 47.0 |
| High School Diploma | 217 (47.5%) | 127.0 |
| College or Associate's Degree | 113 (24.7%) | 57.0 |
| Bachelor's Degree | 10 (2.2%) | 18.0 |
| Graduate Degree | 64 (14.0%) | 146.0 |
| Total | 457 (100.0%) | 79.0 |
Fertility by Education by Marriage Status in Ottumwa
42.9% of women with births in Ottumwa are unmarried. Women with the educational attainment of bachelor's degree are most likely to be married with 100.0% of them married at childbirth, while women with the educational attainment of high school diploma are least likely to be married with 59.5% of them unmarried at childbirth.
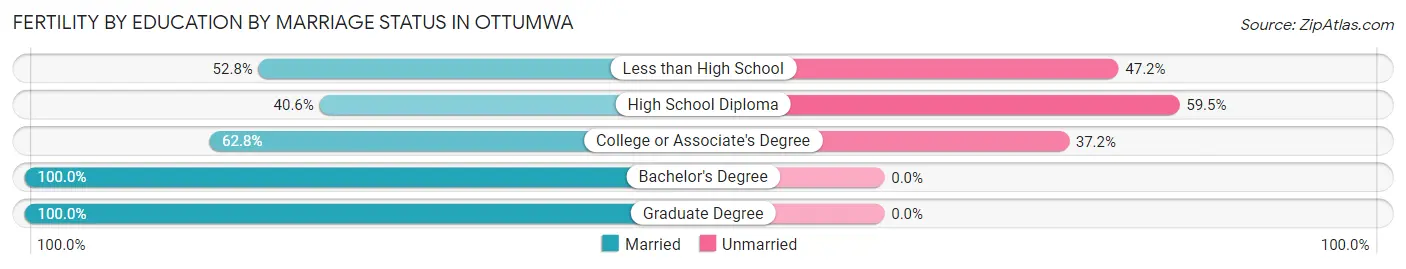
| Educational Attainment | Married | Unmarried |
| Less than High School | 28 (52.8%) | 25 (47.2%) |
| High School Diploma | 88 (40.6%) | 129 (59.5%) |
| College or Associate's Degree | 71 (62.8%) | 42 (37.2%) |
| Bachelor's Degree | 10 (100.0%) | 0 (0.0%) |
| Graduate Degree | 64 (100.0%) | 0 (0.0%) |
| Total | 261 (57.1%) | 196 (42.9%) |
Employment Characteristics in Ottumwa
Employment by Class of Employer in Ottumwa
Among the 11,774 employed individuals in Ottumwa, private company employees (8,553 | 72.6%), not-for-profit organizations (1,079 | 9.2%), and local government employees (887 | 7.5%) make up the most common classes of employment.
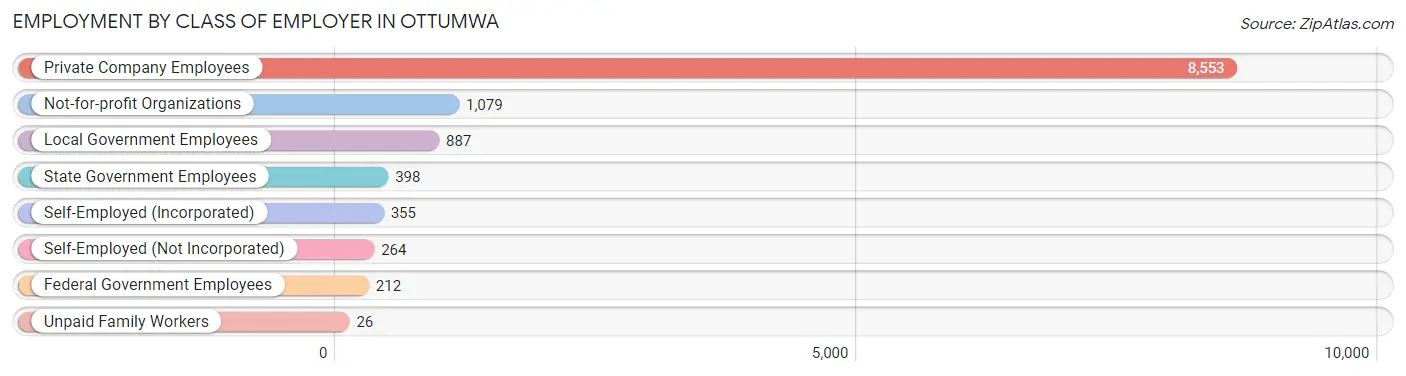
| Employer Class | # Employees | % Employees |
| Private Company Employees | 8,553 | 72.6% |
| Self-Employed (Incorporated) | 355 | 3.0% |
| Self-Employed (Not Incorporated) | 264 | 2.2% |
| Not-for-profit Organizations | 1,079 | 9.2% |
| Local Government Employees | 887 | 7.5% |
| State Government Employees | 398 | 3.4% |
| Federal Government Employees | 212 | 1.8% |
| Unpaid Family Workers | 26 | 0.2% |
| Total | 11,774 | 100.0% |
Employment Status by Age in Ottumwa
According to the labor force statistics for Ottumwa, out of the total population over 16 years of age (20,063), 63.3% or 12,700 individuals are in the labor force, with 4.5% or 572 of them unemployed. The age group with the highest labor force participation rate is 30 to 34 years, with 89.6% or 1,717 individuals in the labor force. Within the labor force, the 16 to 19 years age range has the highest percentage of unemployed individuals, with 13.1% or 114 of them being unemployed.
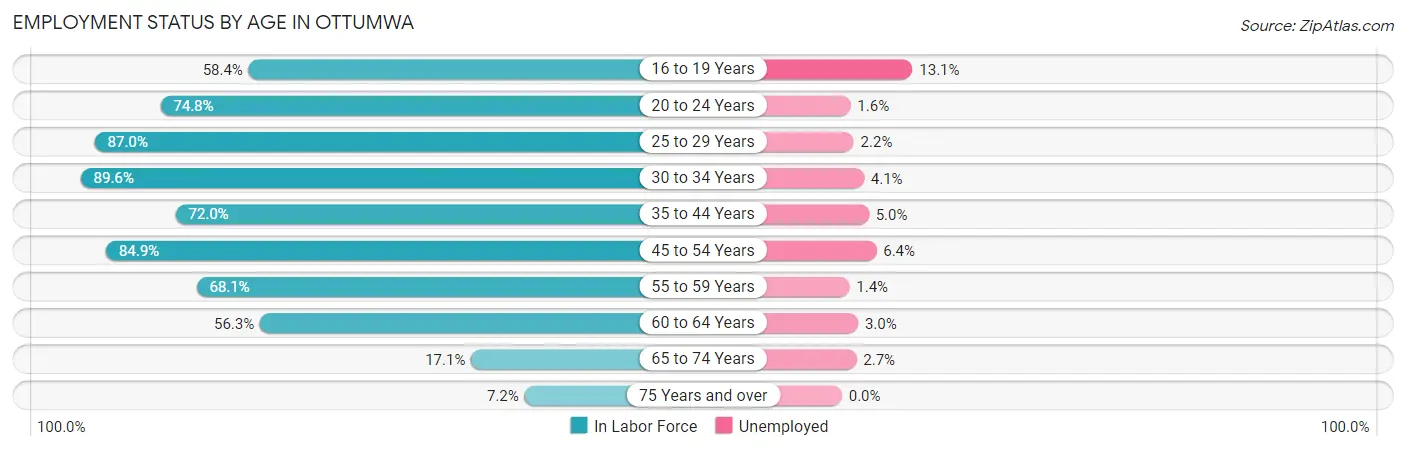
| Age Bracket | In Labor Force | Unemployed |
| 16 to 19 Years | 873 (58.4%) | 114 (13.1%) |
| 20 to 24 Years | 1,195 (74.8%) | 19 (1.6%) |
| 25 to 29 Years | 1,648 (87.0%) | 36 (2.2%) |
| 30 to 34 Years | 1,717 (89.6%) | 70 (4.1%) |
| 35 to 44 Years | 1,938 (72.0%) | 97 (5.0%) |
| 45 to 54 Years | 2,865 (84.9%) | 183 (6.4%) |
| 55 to 59 Years | 872 (68.1%) | 12 (1.4%) |
| 60 to 64 Years | 1,110 (56.3%) | 33 (3.0%) |
| 65 to 74 Years | 370 (17.1%) | 10 (2.7%) |
| 75 Years and over | 121 (7.2%) | 0 (0.0%) |
| Total | 12,700 (63.3%) | 572 (4.5%) |
Employment Status by Educational Attainment in Ottumwa
According to labor force statistics for Ottumwa, 77.3% of individuals (10,147) out of the total population between 25 and 64 years of age (13,127) are in the labor force, with 4.3% or 436 of them being unemployed. The group with the highest labor force participation rate are those with the educational attainment of bachelor's degree or higher, with 87.9% or 2,163 individuals in the labor force. Within the labor force, individuals with less than high school education have the highest percentage of unemployment, with 6.2% or 73 of them being unemployed.
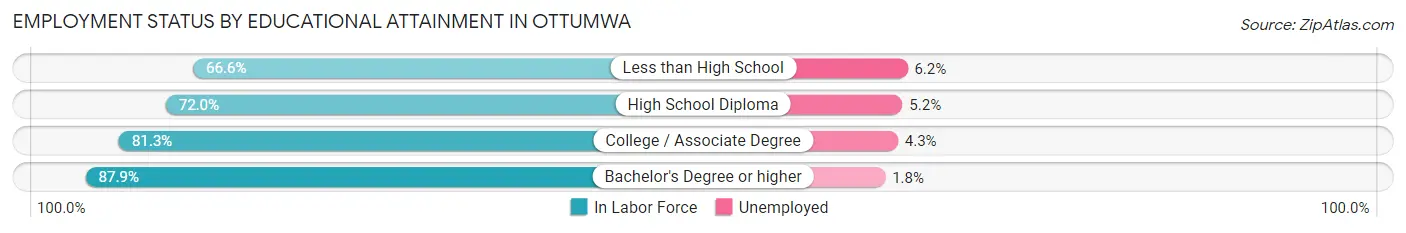
| Educational Attainment | In Labor Force | Unemployed |
| Less than High School | 1,177 (66.6%) | 110 (6.2%) |
| High School Diploma | 3,310 (72.0%) | 239 (5.2%) |
| College / Associate Degree | 3,497 (81.3%) | 185 (4.3%) |
| Bachelor's Degree or higher | 2,163 (87.9%) | 44 (1.8%) |
| Total | 10,147 (77.3%) | 564 (4.3%) |
Employment Occupations by Sex in Ottumwa
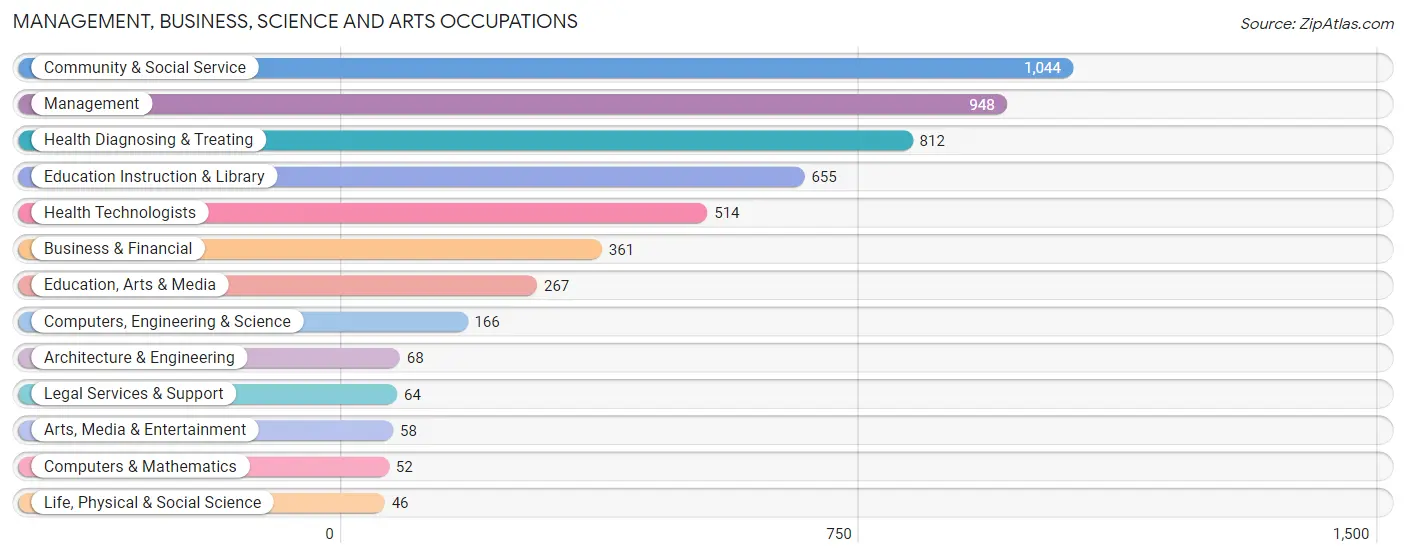
Management, Business, Science and Arts Occupations
The most common Management, Business, Science and Arts occupations in Ottumwa are Community & Social Service (1,044 | 8.6%), Management (948 | 7.8%), Health Diagnosing & Treating (812 | 6.7%), Education Instruction & Library (655 | 5.4%), and Health Technologists (514 | 4.2%).
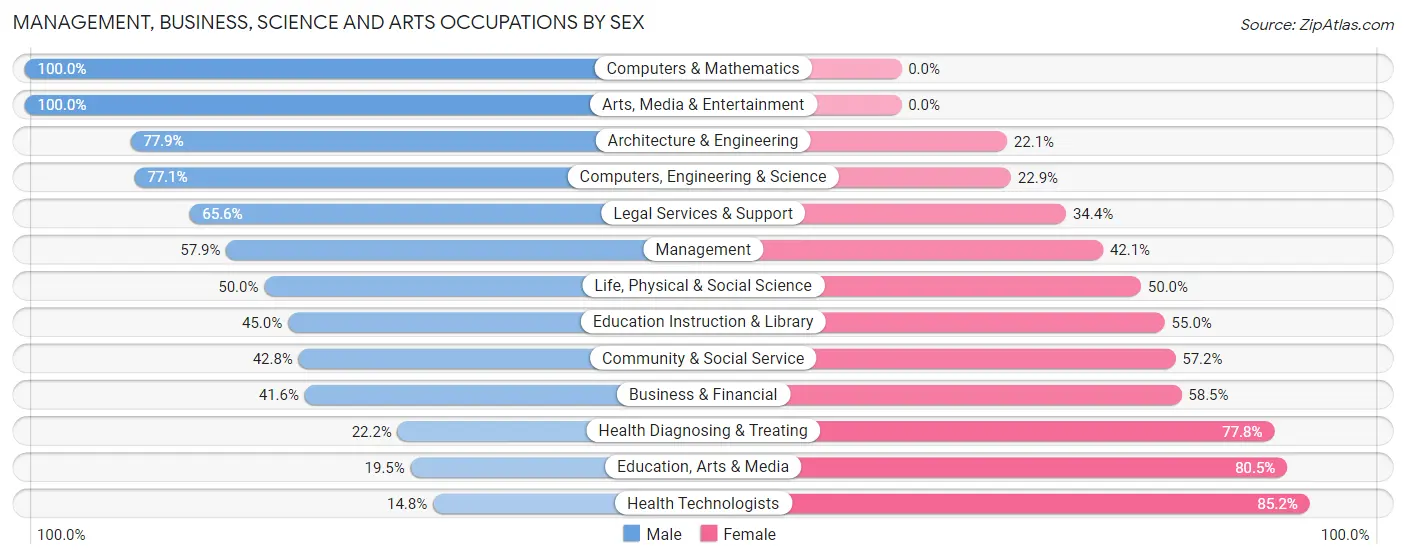
Management, Business, Science and Arts Occupations by Sex
Within the Management, Business, Science and Arts occupations in Ottumwa, the most male-oriented occupations are Computers & Mathematics (100.0%), Arts, Media & Entertainment (100.0%), and Architecture & Engineering (77.9%), while the most female-oriented occupations are Health Technologists (85.2%), Education, Arts & Media (80.5%), and Health Diagnosing & Treating (77.8%).
| Occupation | Male | Female |
| Management | 549 (57.9%) | 399 (42.1%) |
| Business & Financial | 150 (41.5%) | 211 (58.5%) |
| Computers, Engineering & Science | 128 (77.1%) | 38 (22.9%) |
| Computers & Mathematics | 52 (100.0%) | 0 (0.0%) |
| Architecture & Engineering | 53 (77.9%) | 15 (22.1%) |
| Life, Physical & Social Science | 23 (50.0%) | 23 (50.0%) |
| Community & Social Service | 447 (42.8%) | 597 (57.2%) |
| Education, Arts & Media | 52 (19.5%) | 215 (80.5%) |
| Legal Services & Support | 42 (65.6%) | 22 (34.4%) |
| Education Instruction & Library | 295 (45.0%) | 360 (55.0%) |
| Arts, Media & Entertainment | 58 (100.0%) | 0 (0.0%) |
| Health Diagnosing & Treating | 180 (22.2%) | 632 (77.8%) |
| Health Technologists | 76 (14.8%) | 438 (85.2%) |
| Total (Category) | 1,454 (43.6%) | 1,877 (56.4%) |
| Total (Overall) | 6,519 (53.7%) | 5,610 (46.3%) |
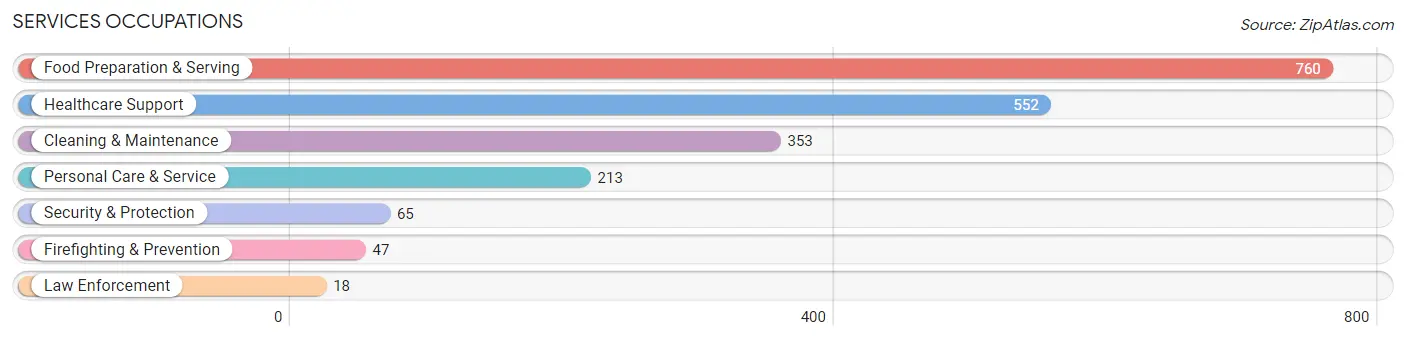
Services Occupations
The most common Services occupations in Ottumwa are Food Preparation & Serving (760 | 6.3%), Healthcare Support (552 | 4.5%), Cleaning & Maintenance (353 | 2.9%), Personal Care & Service (213 | 1.8%), and Security & Protection (65 | 0.5%).
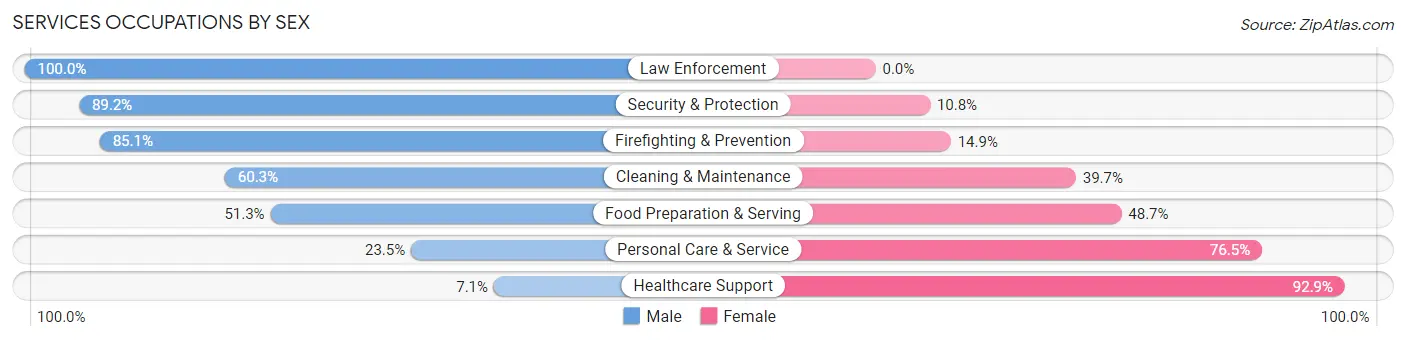
Services Occupations by Sex
Within the Services occupations in Ottumwa, the most male-oriented occupations are Law Enforcement (100.0%), Security & Protection (89.2%), and Firefighting & Prevention (85.1%), while the most female-oriented occupations are Healthcare Support (92.9%), Personal Care & Service (76.5%), and Food Preparation & Serving (48.7%).
| Occupation | Male | Female |
| Healthcare Support | 39 (7.1%) | 513 (92.9%) |
| Security & Protection | 58 (89.2%) | 7 (10.8%) |
| Firefighting & Prevention | 40 (85.1%) | 7 (14.9%) |
| Law Enforcement | 18 (100.0%) | 0 (0.0%) |
| Food Preparation & Serving | 390 (51.3%) | 370 (48.7%) |
| Cleaning & Maintenance | 213 (60.3%) | 140 (39.7%) |
| Personal Care & Service | 50 (23.5%) | 163 (76.5%) |
| Total (Category) | 750 (38.6%) | 1,193 (61.4%) |
| Total (Overall) | 6,519 (53.7%) | 5,610 (46.3%) |
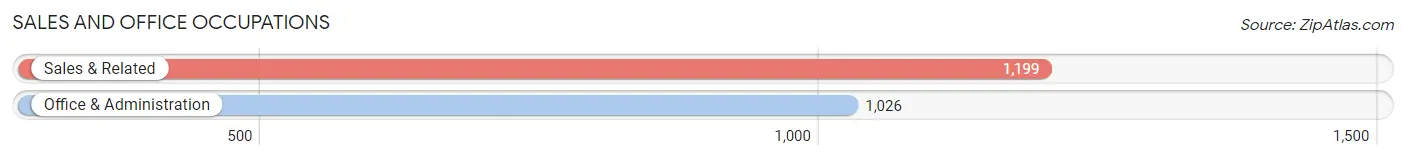
Sales and Office Occupations
The most common Sales and Office occupations in Ottumwa are Sales & Related (1,199 | 9.9%), and Office & Administration (1,026 | 8.5%).
Sales and Office Occupations by Sex
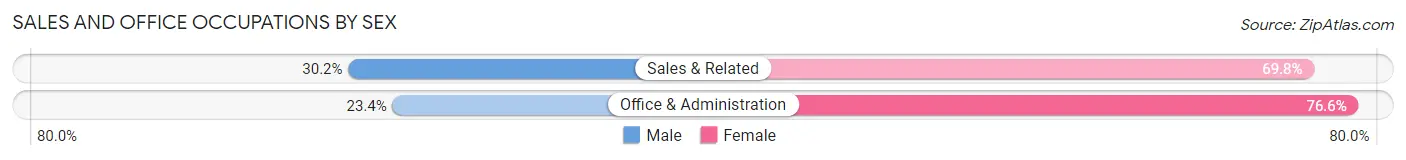
| Occupation | Male | Female |
| Sales & Related | 362 (30.2%) | 837 (69.8%) |
| Office & Administration | 240 (23.4%) | 786 (76.6%) |
| Total (Category) | 602 (27.1%) | 1,623 (72.9%) |
| Total (Overall) | 6,519 (53.7%) | 5,610 (46.3%) |
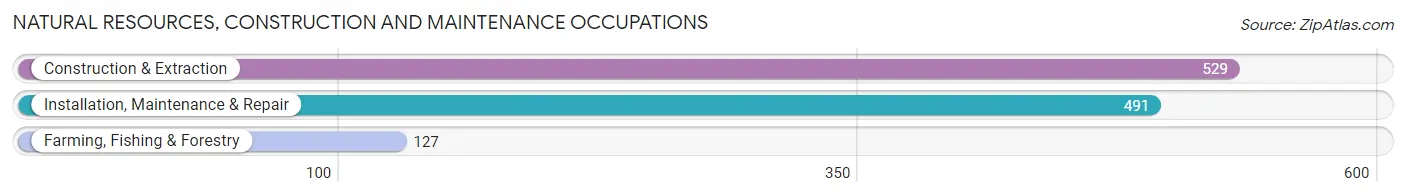
Natural Resources, Construction and Maintenance Occupations
The most common Natural Resources, Construction and Maintenance occupations in Ottumwa are Construction & Extraction (529 | 4.4%), Installation, Maintenance & Repair (491 | 4.1%), and Farming, Fishing & Forestry (127 | 1.1%).
Natural Resources, Construction and Maintenance Occupations by Sex
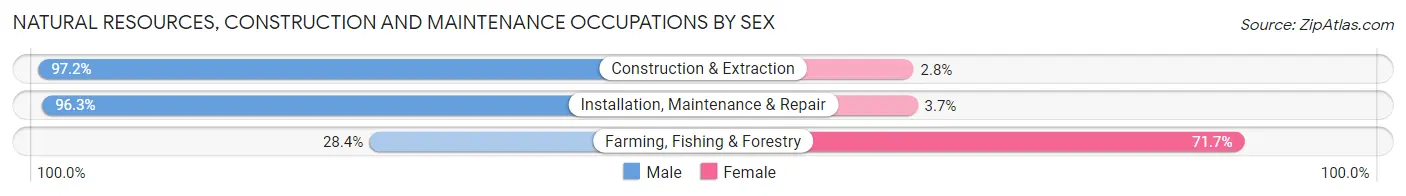
| Occupation | Male | Female |
| Farming, Fishing & Forestry | 36 (28.3%) | 91 (71.7%) |
| Construction & Extraction | 514 (97.2%) | 15 (2.8%) |
| Installation, Maintenance & Repair | 473 (96.3%) | 18 (3.7%) |
| Total (Category) | 1,023 (89.2%) | 124 (10.8%) |
| Total (Overall) | 6,519 (53.7%) | 5,610 (46.3%) |
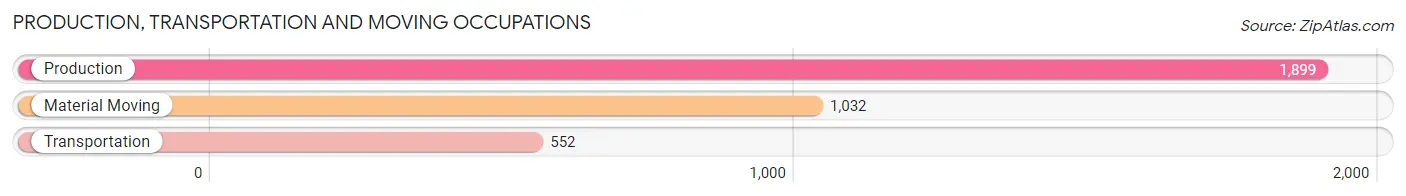
Production, Transportation and Moving Occupations
The most common Production, Transportation and Moving occupations in Ottumwa are Production (1,899 | 15.7%), Material Moving (1,032 | 8.5%), and Transportation (552 | 4.5%).
Production, Transportation and Moving Occupations by Sex
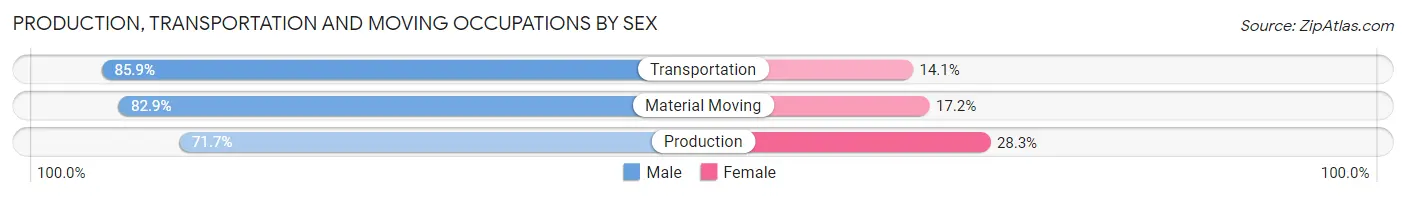
| Occupation | Male | Female |
| Production | 1,361 (71.7%) | 538 (28.3%) |
| Transportation | 474 (85.9%) | 78 (14.1%) |
| Material Moving | 855 (82.9%) | 177 (17.2%) |
| Total (Category) | 2,690 (77.2%) | 793 (22.8%) |
| Total (Overall) | 6,519 (53.7%) | 5,610 (46.3%) |
Employment Industries by Sex in Ottumwa
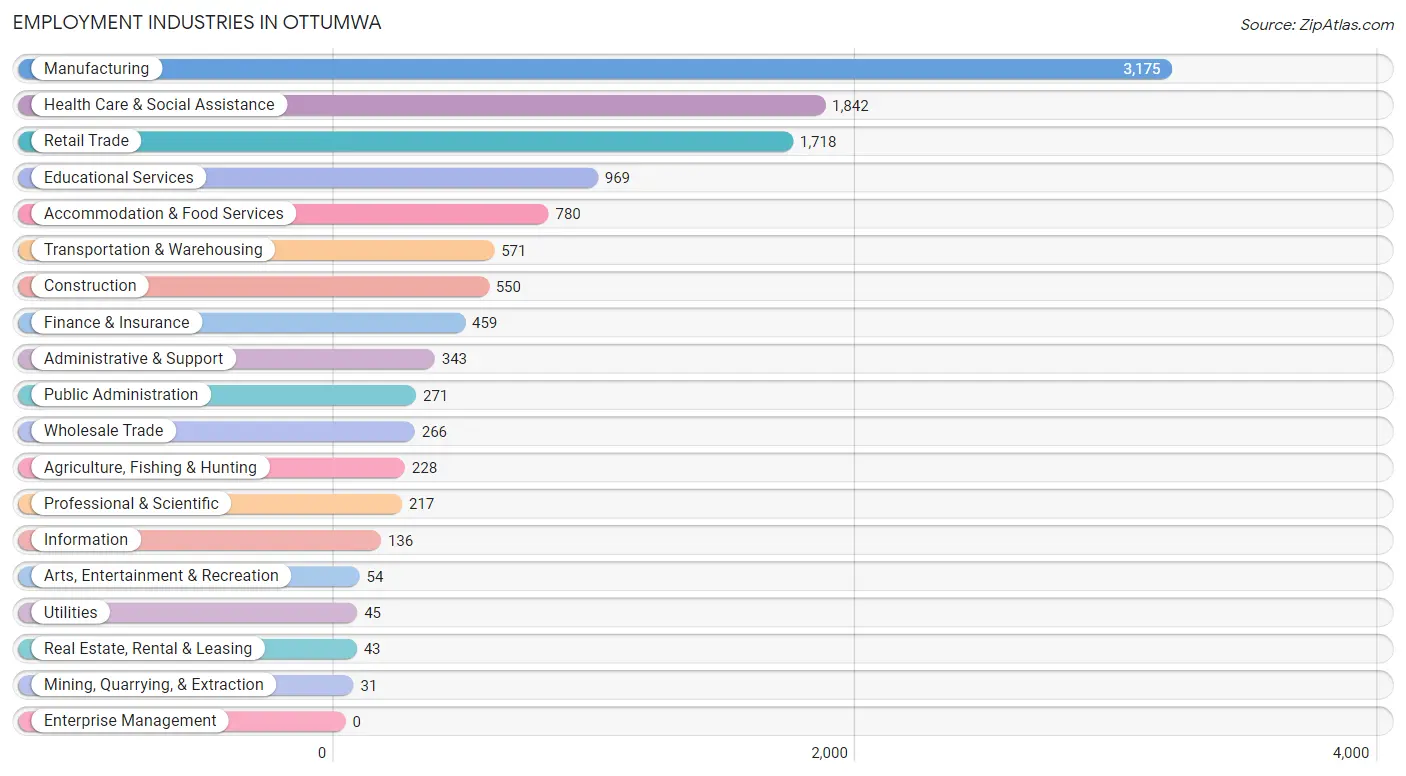
Employment Industries in Ottumwa
The major employment industries in Ottumwa include Manufacturing (3,175 | 26.2%), Health Care & Social Assistance (1,842 | 15.2%), Retail Trade (1,718 | 14.2%), Educational Services (969 | 8.0%), and Accommodation & Food Services (780 | 6.4%).
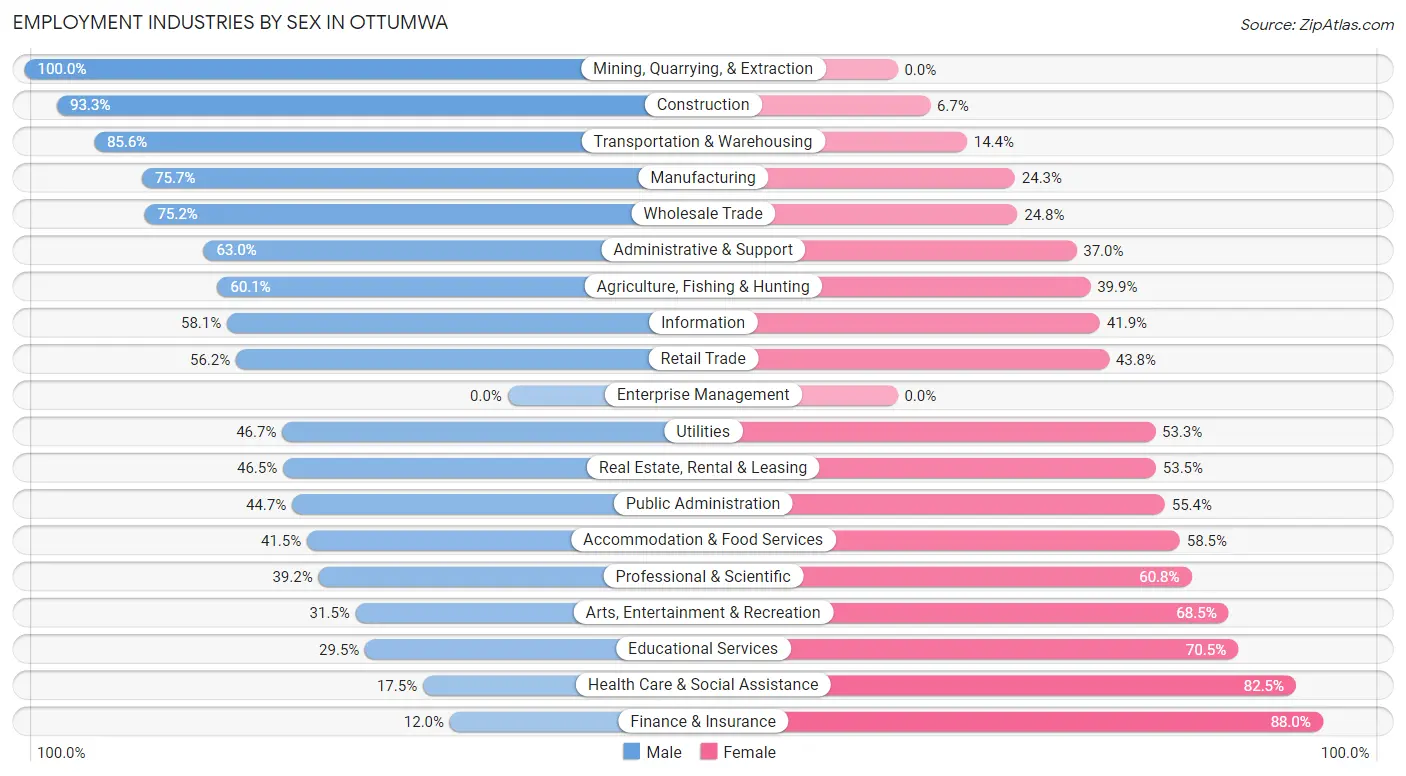
Employment Industries by Sex in Ottumwa
The Ottumwa industries that see more men than women are Mining, Quarrying, & Extraction (100.0%), Construction (93.3%), and Transportation & Warehousing (85.6%), whereas the industries that tend to have a higher number of women are Finance & Insurance (88.0%), Health Care & Social Assistance (82.5%), and Educational Services (70.5%).
| Industry | Male | Female |
| Agriculture, Fishing & Hunting | 137 (60.1%) | 91 (39.9%) |
| Mining, Quarrying, & Extraction | 31 (100.0%) | 0 (0.0%) |
| Construction | 513 (93.3%) | 37 (6.7%) |
| Manufacturing | 2,403 (75.7%) | 772 (24.3%) |
| Wholesale Trade | 200 (75.2%) | 66 (24.8%) |
| Retail Trade | 966 (56.2%) | 752 (43.8%) |
| Transportation & Warehousing | 489 (85.6%) | 82 (14.4%) |
| Utilities | 21 (46.7%) | 24 (53.3%) |
| Information | 79 (58.1%) | 57 (41.9%) |
| Finance & Insurance | 55 (12.0%) | 404 (88.0%) |
| Real Estate, Rental & Leasing | 20 (46.5%) | 23 (53.5%) |
| Professional & Scientific | 85 (39.2%) | 132 (60.8%) |
| Enterprise Management | 0 (0.0%) | 0 (0.0%) |
| Administrative & Support | 216 (63.0%) | 127 (37.0%) |
| Educational Services | 286 (29.5%) | 683 (70.5%) |
| Health Care & Social Assistance | 323 (17.5%) | 1,519 (82.5%) |
| Arts, Entertainment & Recreation | 17 (31.5%) | 37 (68.5%) |
| Accommodation & Food Services | 324 (41.5%) | 456 (58.5%) |
| Public Administration | 121 (44.7%) | 150 (55.3%) |
| Total | 6,519 (53.7%) | 5,610 (46.3%) |
Education in Ottumwa
School Enrollment in Ottumwa
The most common levels of schooling among the 5,748 students in Ottumwa are high school (1,359 | 23.6%), middle school (1,337 | 23.3%), and elementary school (1,128 | 19.6%).
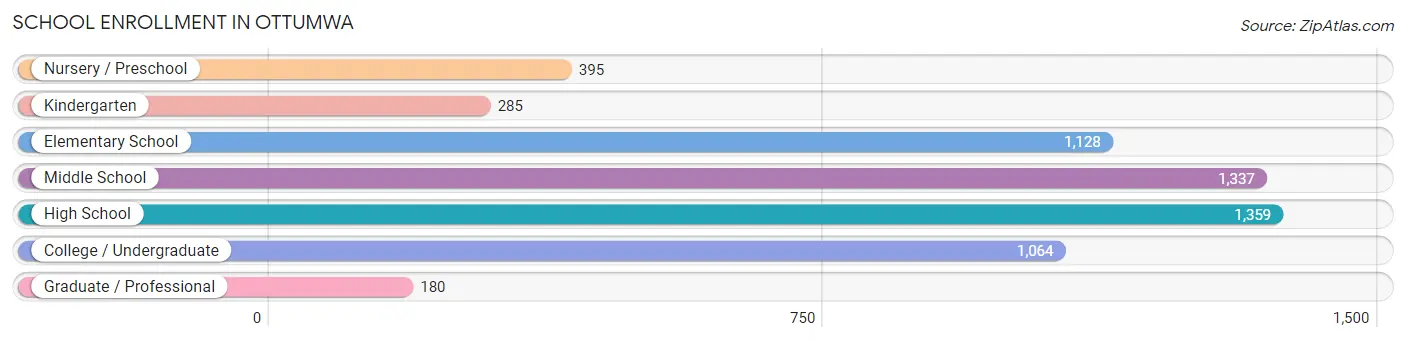
| School Level | # Students | % Students |
| Nursery / Preschool | 395 | 6.9% |
| Kindergarten | 285 | 5.0% |
| Elementary School | 1,128 | 19.6% |
| Middle School | 1,337 | 23.3% |
| High School | 1,359 | 23.6% |
| College / Undergraduate | 1,064 | 18.5% |
| Graduate / Professional | 180 | 3.1% |
| Total | 5,748 | 100.0% |
School Enrollment by Age by Funding Source in Ottumwa
Out of a total of 5,748 students who are enrolled in schools in Ottumwa, 374 (6.5%) attend a private institution, while the remaining 5,374 (93.5%) are enrolled in public schools. The age group of 35 years and over has the highest likelihood of being enrolled in private schools, with 93 (44.1% in the age bracket) enrolled. Conversely, the age group of 25 to 34 year olds has the lowest likelihood of being enrolled in a private school, with 326 (99.4% in the age bracket) attending a public institution.
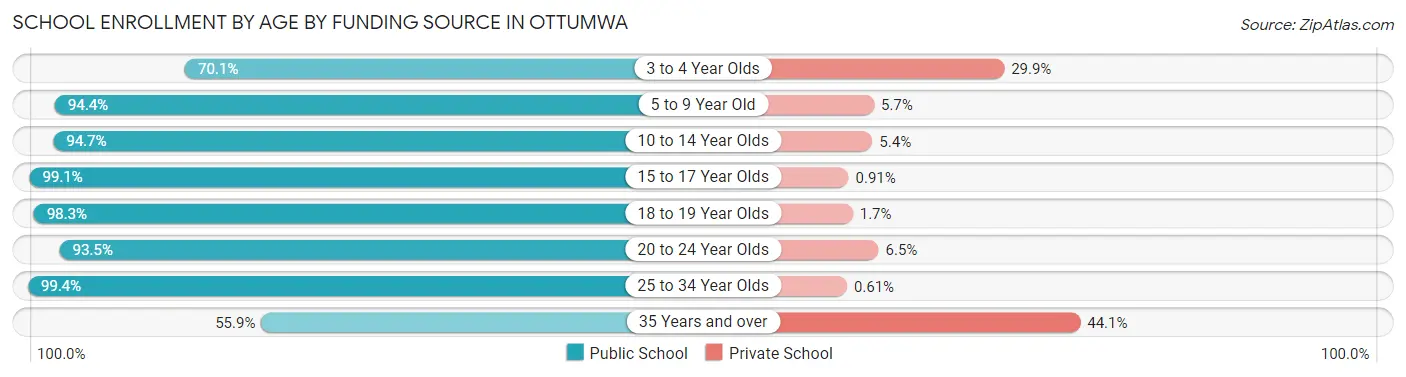
| Age Bracket | Public School | Private School |
| 3 to 4 Year Olds | 143 (70.1%) | 61 (29.9%) |
| 5 to 9 Year Old | 1,303 (94.4%) | 78 (5.7%) |
| 10 to 14 Year Olds | 1,644 (94.7%) | 93 (5.3%) |
| 15 to 17 Year Olds | 978 (99.1%) | 9 (0.9%) |
| 18 to 19 Year Olds | 462 (98.3%) | 8 (1.7%) |
| 20 to 24 Year Olds | 402 (93.5%) | 28 (6.5%) |
| 25 to 34 Year Olds | 326 (99.4%) | 2 (0.6%) |
| 35 Years and over | 118 (55.9%) | 93 (44.1%) |
| Total | 5,374 (93.5%) | 374 (6.5%) |
Educational Attainment by Field of Study in Ottumwa
Education (712 | 19.2%), business (603 | 16.3%), science & technology (476 | 12.8%), psychology (344 | 9.3%), and liberal arts & history (301 | 8.1%) are the most common fields of study among 3,710 individuals in Ottumwa who have obtained a bachelor's degree or higher.
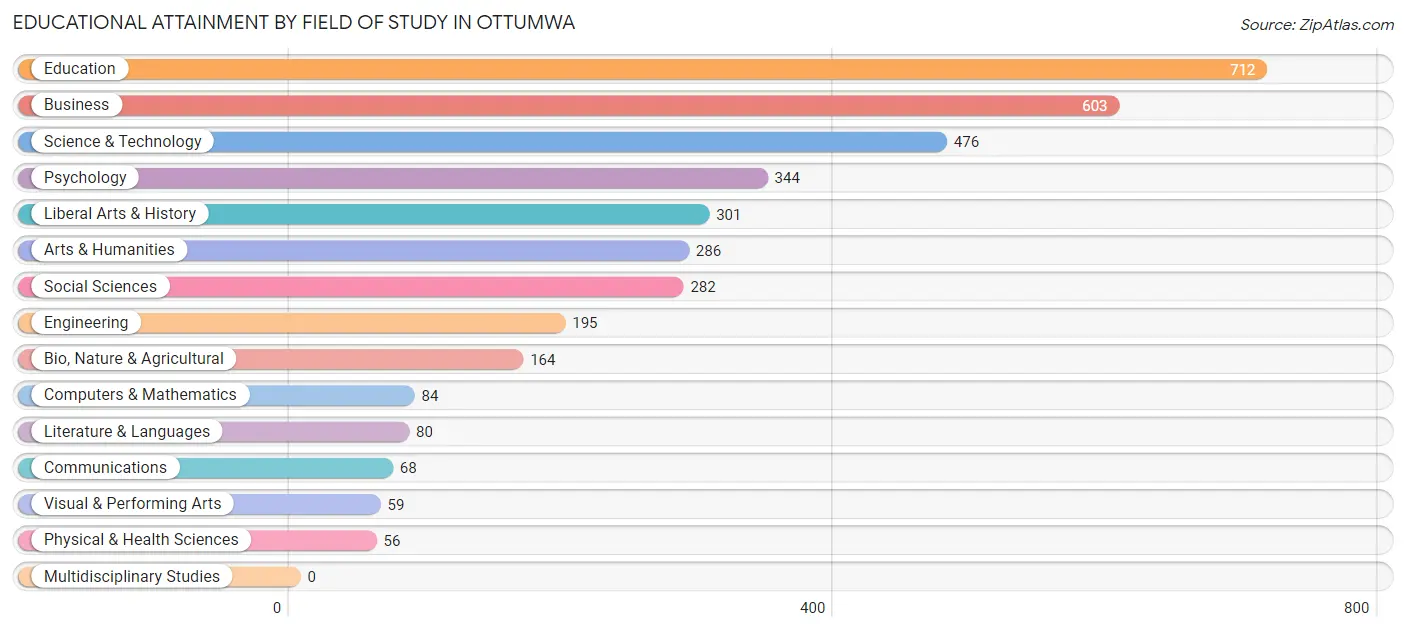
| Field of Study | # Graduates | % Graduates |
| Computers & Mathematics | 84 | 2.3% |
| Bio, Nature & Agricultural | 164 | 4.4% |
| Physical & Health Sciences | 56 | 1.5% |
| Psychology | 344 | 9.3% |
| Social Sciences | 282 | 7.6% |
| Engineering | 195 | 5.3% |
| Multidisciplinary Studies | 0 | 0.0% |
| Science & Technology | 476 | 12.8% |
| Business | 603 | 16.3% |
| Education | 712 | 19.2% |
| Literature & Languages | 80 | 2.2% |
| Liberal Arts & History | 301 | 8.1% |
| Visual & Performing Arts | 59 | 1.6% |
| Communications | 68 | 1.8% |
| Arts & Humanities | 286 | 7.7% |
| Total | 3,710 | 100.0% |
Transportation & Commute in Ottumwa
Vehicle Availability by Sex in Ottumwa
The most prevalent vehicle ownership categories in Ottumwa are males with 2 vehicles (2,396, accounting for 38.1%) and females with 2 vehicles (2,092, making up 44.8%).
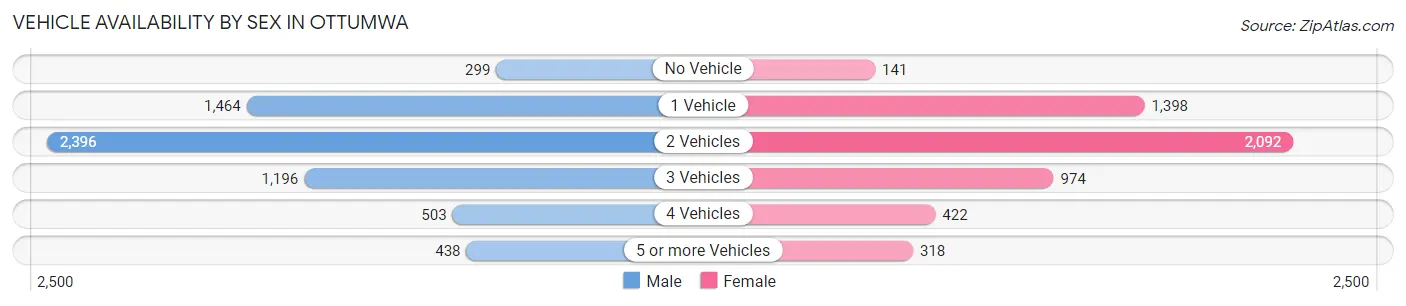
| Vehicles Available | Male | Female |
| No Vehicle | 299 (4.8%) | 141 (2.6%) |
| 1 Vehicle | 1,464 (23.3%) | 1,398 (26.2%) |
| 2 Vehicles | 2,396 (38.1%) | 2,092 (39.1%) |
| 3 Vehicles | 1,196 (19.0%) | 974 (18.2%) |
| 4 Vehicles | 503 (8.0%) | 422 (7.9%) |
| 5 or more Vehicles | 438 (7.0%) | 318 (5.9%) |
| Total | 6,296 (100.0%) | 5,345 (100.0%) |
Commute Time in Ottumwa
The most frequently occuring commute durations in Ottumwa are 5 to 9 minutes (2,934 commuters, 25.8%), 10 to 14 minutes (2,651 commuters, 23.3%), and 15 to 19 minutes (1,886 commuters, 16.6%).
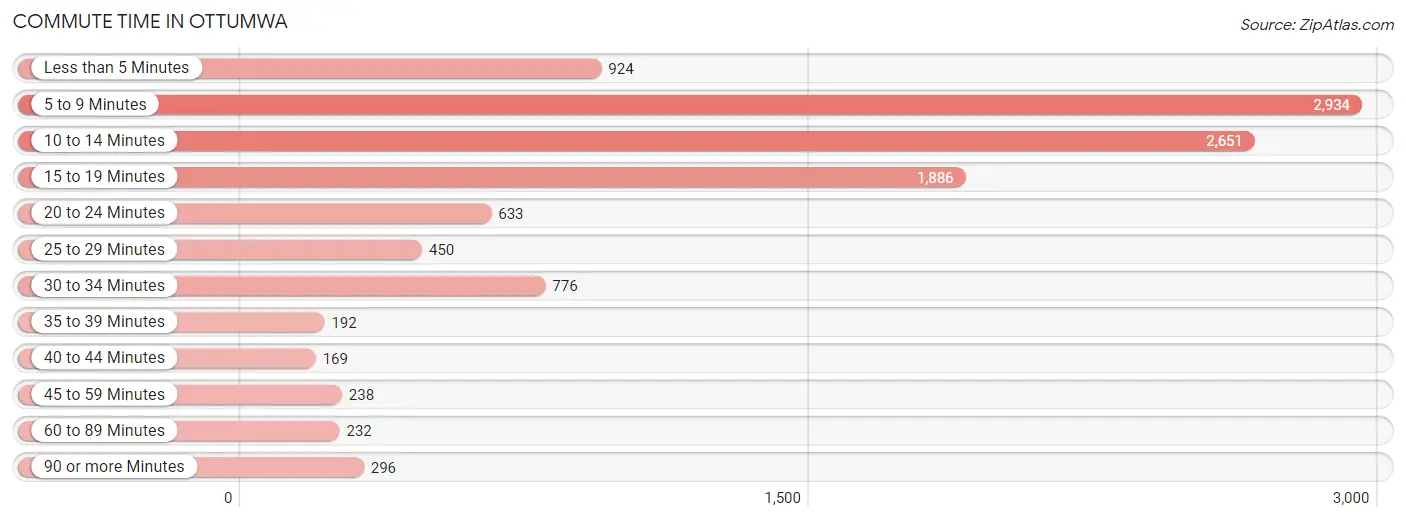
| Commute Time | # Commuters | % Commuters |
| Less than 5 Minutes | 924 | 8.1% |
| 5 to 9 Minutes | 2,934 | 25.8% |
| 10 to 14 Minutes | 2,651 | 23.3% |
| 15 to 19 Minutes | 1,886 | 16.6% |
| 20 to 24 Minutes | 633 | 5.6% |
| 25 to 29 Minutes | 450 | 4.0% |
| 30 to 34 Minutes | 776 | 6.8% |
| 35 to 39 Minutes | 192 | 1.7% |
| 40 to 44 Minutes | 169 | 1.5% |
| 45 to 59 Minutes | 238 | 2.1% |
| 60 to 89 Minutes | 232 | 2.0% |
| 90 or more Minutes | 296 | 2.6% |
Commute Time by Sex in Ottumwa
The most common commute times in Ottumwa are 5 to 9 minutes (1,555 commuters, 24.8%) for males and 10 to 14 minutes (1,399 commuters, 27.3%) for females.
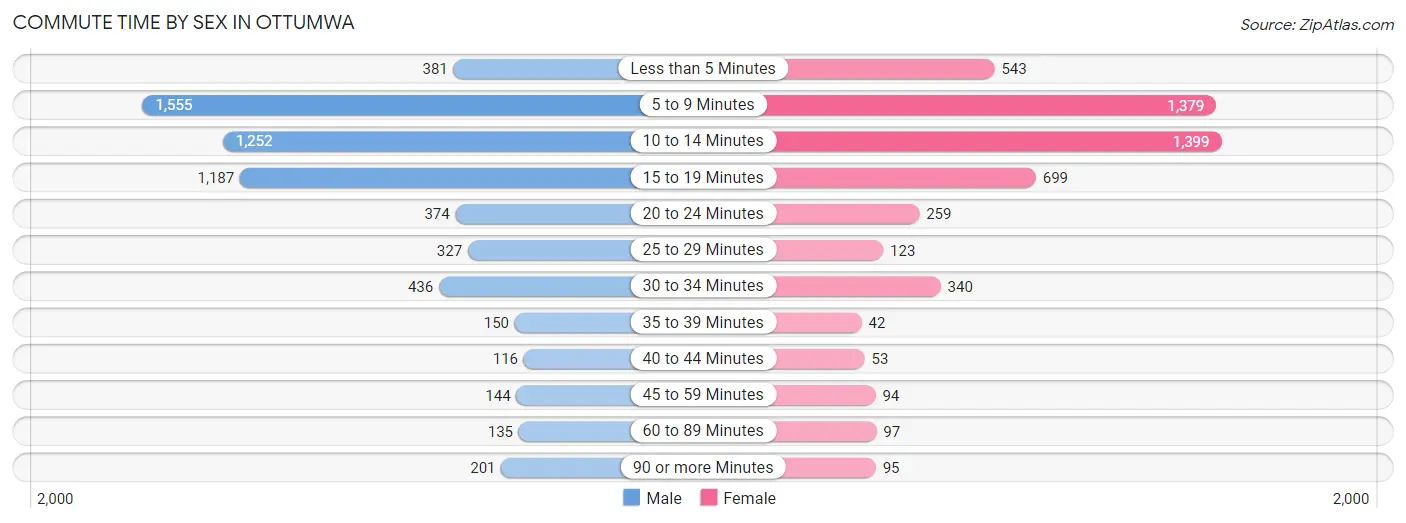
| Commute Time | Male | Female |
| Less than 5 Minutes | 381 (6.1%) | 543 (10.6%) |
| 5 to 9 Minutes | 1,555 (24.8%) | 1,379 (26.9%) |
| 10 to 14 Minutes | 1,252 (20.0%) | 1,399 (27.3%) |
| 15 to 19 Minutes | 1,187 (19.0%) | 699 (13.6%) |
| 20 to 24 Minutes | 374 (6.0%) | 259 (5.1%) |
| 25 to 29 Minutes | 327 (5.2%) | 123 (2.4%) |
| 30 to 34 Minutes | 436 (7.0%) | 340 (6.6%) |
| 35 to 39 Minutes | 150 (2.4%) | 42 (0.8%) |
| 40 to 44 Minutes | 116 (1.8%) | 53 (1.0%) |
| 45 to 59 Minutes | 144 (2.3%) | 94 (1.8%) |
| 60 to 89 Minutes | 135 (2.2%) | 97 (1.9%) |
| 90 or more Minutes | 201 (3.2%) | 95 (1.8%) |
Time of Departure to Work by Sex in Ottumwa
The most frequent times of departure to work in Ottumwa are 12:00 PM to 3:59 PM (1,025, 16.4%) for males and 7:30 AM to 7:59 AM (900, 17.6%) for females.
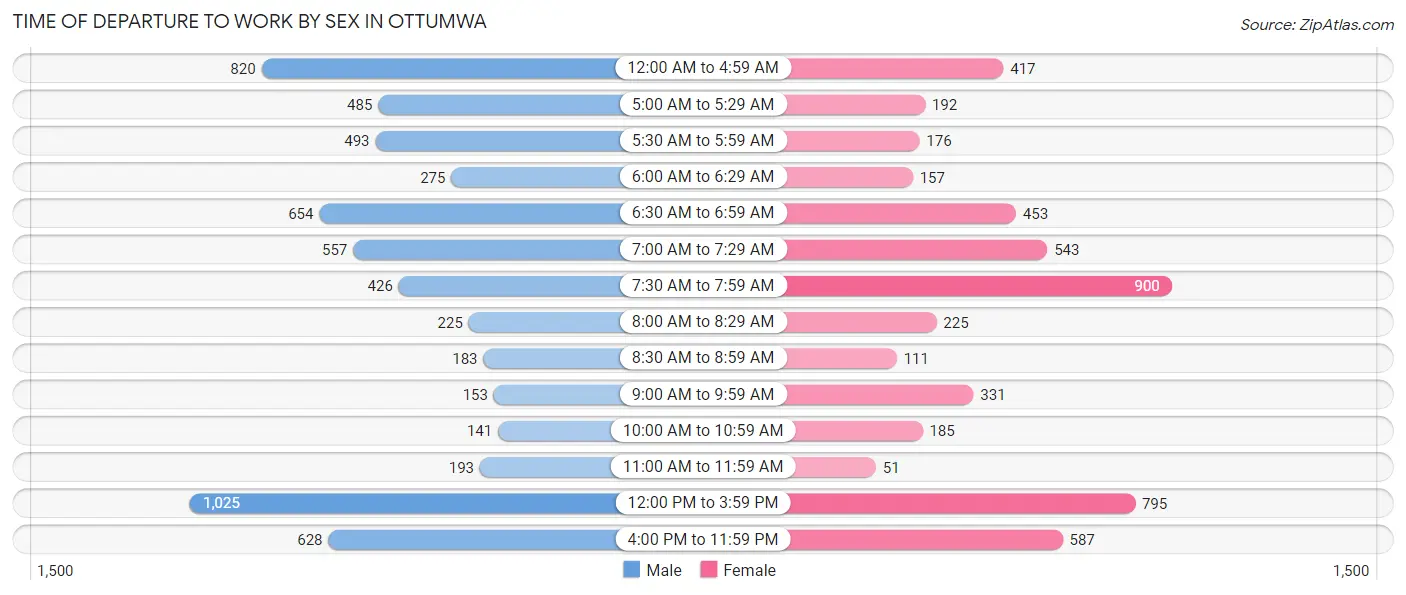
| Time of Departure | Male | Female |
| 12:00 AM to 4:59 AM | 820 (13.1%) | 417 (8.1%) |
| 5:00 AM to 5:29 AM | 485 (7.7%) | 192 (3.7%) |
| 5:30 AM to 5:59 AM | 493 (7.9%) | 176 (3.4%) |
| 6:00 AM to 6:29 AM | 275 (4.4%) | 157 (3.1%) |
| 6:30 AM to 6:59 AM | 654 (10.4%) | 453 (8.8%) |
| 7:00 AM to 7:29 AM | 557 (8.9%) | 543 (10.6%) |
| 7:30 AM to 7:59 AM | 426 (6.8%) | 900 (17.6%) |
| 8:00 AM to 8:29 AM | 225 (3.6%) | 225 (4.4%) |
| 8:30 AM to 8:59 AM | 183 (2.9%) | 111 (2.2%) |
| 9:00 AM to 9:59 AM | 153 (2.4%) | 331 (6.5%) |
| 10:00 AM to 10:59 AM | 141 (2.2%) | 185 (3.6%) |
| 11:00 AM to 11:59 AM | 193 (3.1%) | 51 (1.0%) |
| 12:00 PM to 3:59 PM | 1,025 (16.4%) | 795 (15.5%) |
| 4:00 PM to 11:59 PM | 628 (10.0%) | 587 (11.5%) |
| Total | 6,258 (100.0%) | 5,123 (100.0%) |
Housing Occupancy in Ottumwa
Occupancy by Ownership in Ottumwa
Of the total 10,201 dwellings in Ottumwa, owner-occupied units account for 6,013 (59.0%), while renter-occupied units make up 4,188 (41.0%).
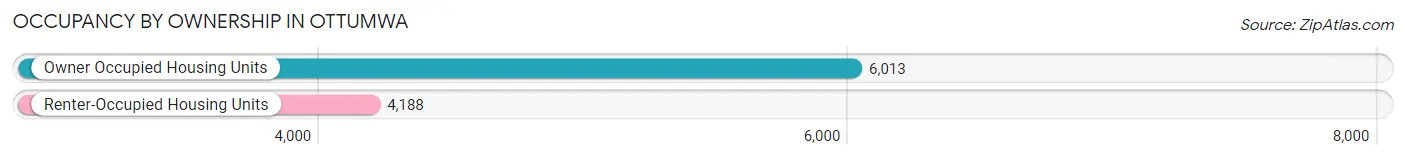
| Occupancy | # Housing Units | % Housing Units |
| Owner Occupied Housing Units | 6,013 | 59.0% |
| Renter-Occupied Housing Units | 4,188 | 41.0% |
| Total Occupied Housing Units | 10,201 | 100.0% |
Occupancy by Household Size in Ottumwa
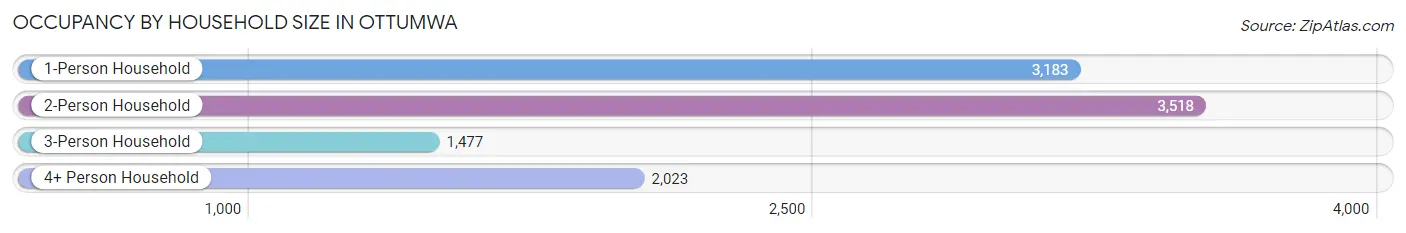
| Household Size | # Housing Units | % Housing Units |
| 1-Person Household | 3,183 | 31.2% |
| 2-Person Household | 3,518 | 34.5% |
| 3-Person Household | 1,477 | 14.5% |
| 4+ Person Household | 2,023 | 19.8% |
| Total Housing Units | 10,201 | 100.0% |
Occupancy by Ownership by Household Size in Ottumwa
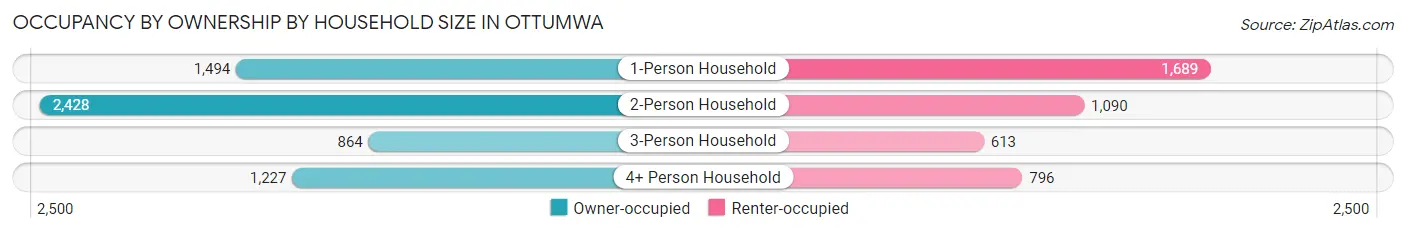
| Household Size | Owner-occupied | Renter-occupied |
| 1-Person Household | 1,494 (46.9%) | 1,689 (53.1%) |
| 2-Person Household | 2,428 (69.0%) | 1,090 (31.0%) |
| 3-Person Household | 864 (58.5%) | 613 (41.5%) |
| 4+ Person Household | 1,227 (60.7%) | 796 (39.4%) |
| Total Housing Units | 6,013 (59.0%) | 4,188 (41.0%) |
Occupancy by Educational Attainment in Ottumwa
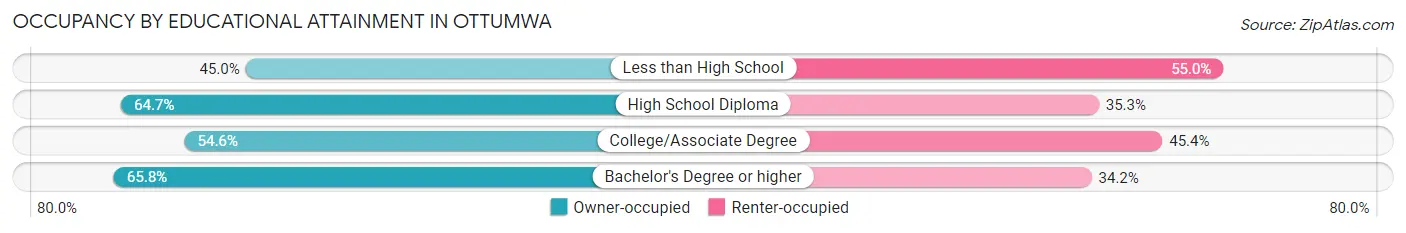
| Household Size | Owner-occupied | Renter-occupied |
| Less than High School | 557 (45.0%) | 682 (55.0%) |
| High School Diploma | 2,118 (64.7%) | 1,156 (35.3%) |
| College/Associate Degree | 1,978 (54.6%) | 1,644 (45.4%) |
| Bachelor's Degree or higher | 1,360 (65.8%) | 706 (34.2%) |
Occupancy by Age of Householder in Ottumwa
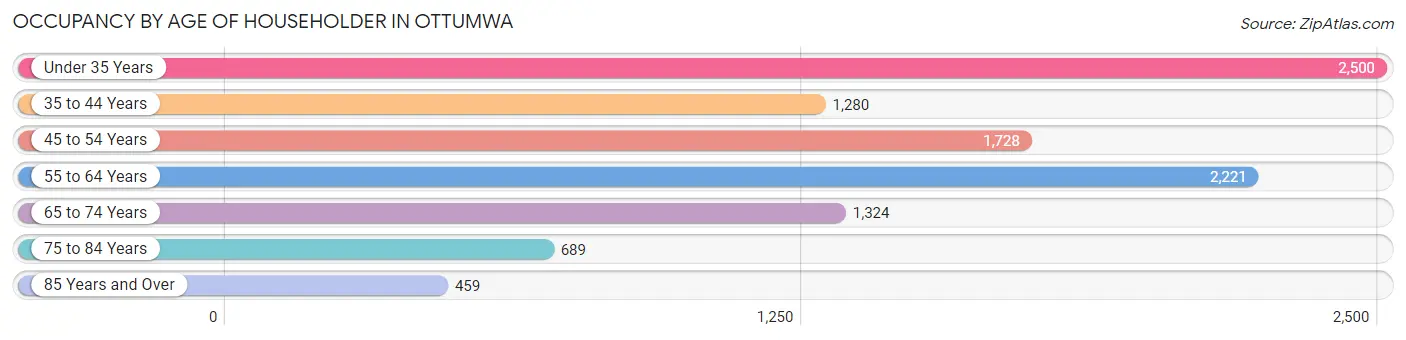
| Age Bracket | # Households | % Households |
| Under 35 Years | 2,500 | 24.5% |
| 35 to 44 Years | 1,280 | 12.6% |
| 45 to 54 Years | 1,728 | 16.9% |
| 55 to 64 Years | 2,221 | 21.8% |
| 65 to 74 Years | 1,324 | 13.0% |
| 75 to 84 Years | 689 | 6.8% |
| 85 Years and Over | 459 | 4.5% |
| Total | 10,201 | 100.0% |
Housing Finances in Ottumwa
Median Income by Occupancy in Ottumwa
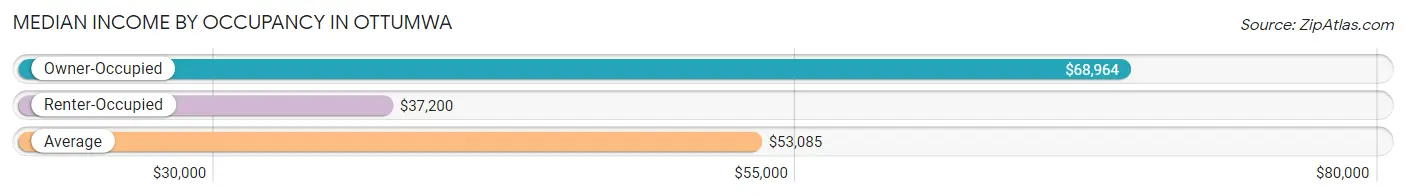
| Occupancy Type | # Households | Median Income |
| Owner-Occupied | 6,013 (59.0%) | $68,964 |
| Renter-Occupied | 4,188 (41.0%) | $37,200 |
| Average | 10,201 (100.0%) | $53,085 |
Occupancy by Householder Income Bracket in Ottumwa
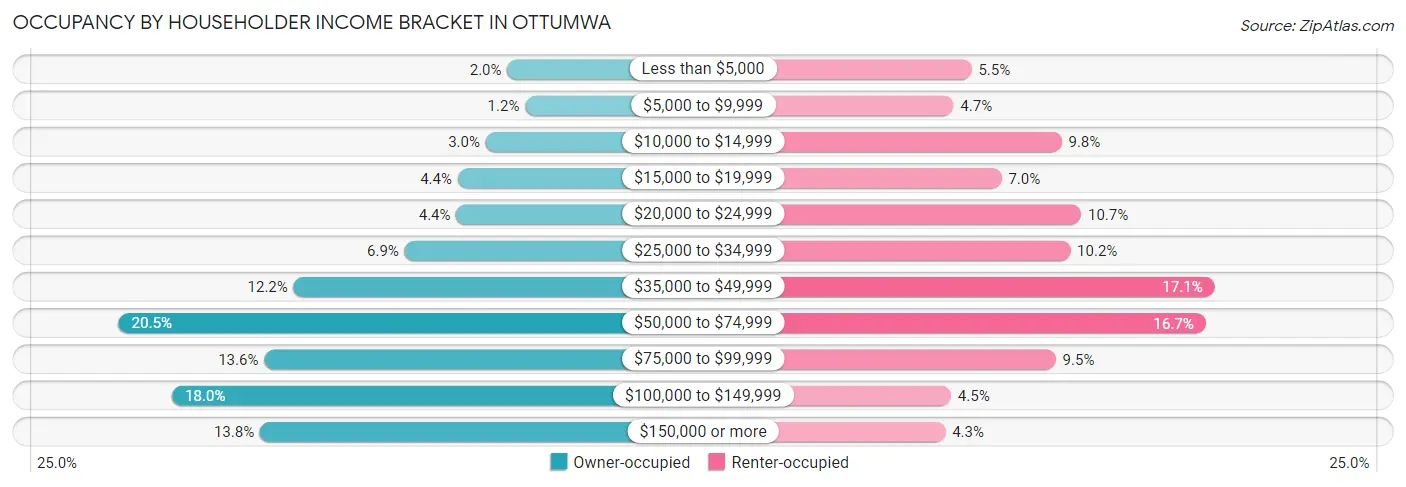
| Income Bracket | Owner-occupied | Renter-occupied |
| Less than $5,000 | 121 (2.0%) | 231 (5.5%) |
| $5,000 to $9,999 | 70 (1.2%) | 195 (4.7%) |
| $10,000 to $14,999 | 183 (3.0%) | 411 (9.8%) |
| $15,000 to $19,999 | 263 (4.4%) | 291 (7.0%) |
| $20,000 to $24,999 | 267 (4.4%) | 450 (10.7%) |
| $25,000 to $34,999 | 415 (6.9%) | 428 (10.2%) |
| $35,000 to $49,999 | 733 (12.2%) | 716 (17.1%) |
| $50,000 to $74,999 | 1,234 (20.5%) | 698 (16.7%) |
| $75,000 to $99,999 | 817 (13.6%) | 399 (9.5%) |
| $100,000 to $149,999 | 1,081 (18.0%) | 190 (4.5%) |
| $150,000 or more | 829 (13.8%) | 179 (4.3%) |
| Total | 6,013 (100.0%) | 4,188 (100.0%) |
Monthly Housing Cost Tiers in Ottumwa
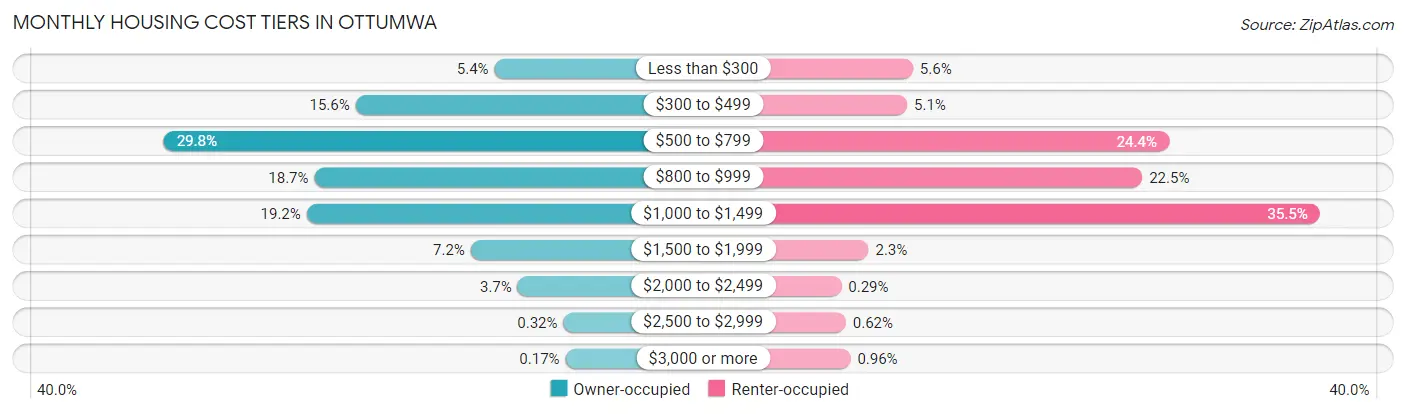
| Monthly Cost | Owner-occupied | Renter-occupied |
| Less than $300 | 325 (5.4%) | 233 (5.6%) |
| $300 to $499 | 940 (15.6%) | 215 (5.1%) |
| $500 to $799 | 1,789 (29.7%) | 1,022 (24.4%) |
| $800 to $999 | 1,122 (18.7%) | 940 (22.5%) |
| $1,000 to $1,499 | 1,156 (19.2%) | 1,487 (35.5%) |
| $1,500 to $1,999 | 430 (7.1%) | 96 (2.3%) |
| $2,000 to $2,499 | 222 (3.7%) | 12 (0.3%) |
| $2,500 to $2,999 | 19 (0.3%) | 26 (0.6%) |
| $3,000 or more | 10 (0.2%) | 40 (1.0%) |
| Total | 6,013 (100.0%) | 4,188 (100.0%) |
Physical Housing Characteristics in Ottumwa
Housing Structures in Ottumwa
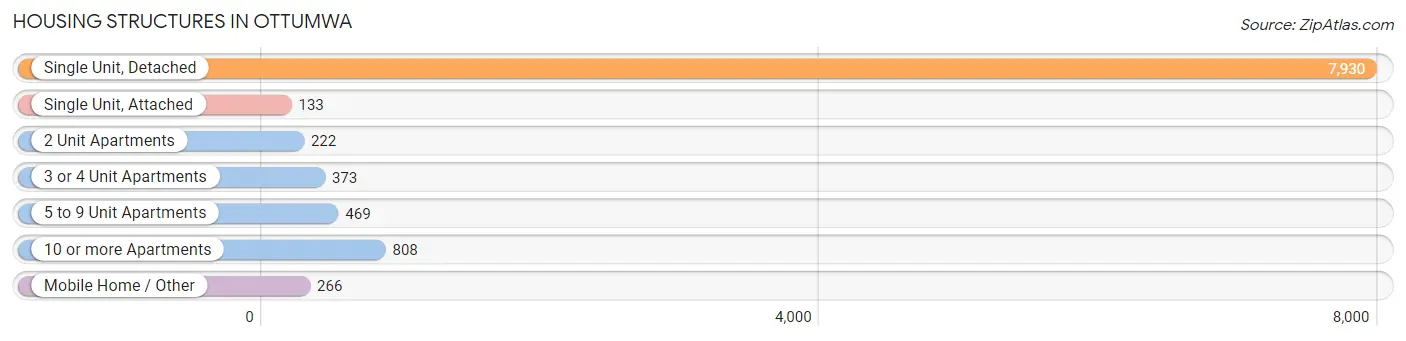
| Structure Type | # Housing Units | % Housing Units |
| Single Unit, Detached | 7,930 | 77.7% |
| Single Unit, Attached | 133 | 1.3% |
| 2 Unit Apartments | 222 | 2.2% |
| 3 or 4 Unit Apartments | 373 | 3.7% |
| 5 to 9 Unit Apartments | 469 | 4.6% |
| 10 or more Apartments | 808 | 7.9% |
| Mobile Home / Other | 266 | 2.6% |
| Total | 10,201 | 100.0% |
Housing Structures by Occupancy in Ottumwa
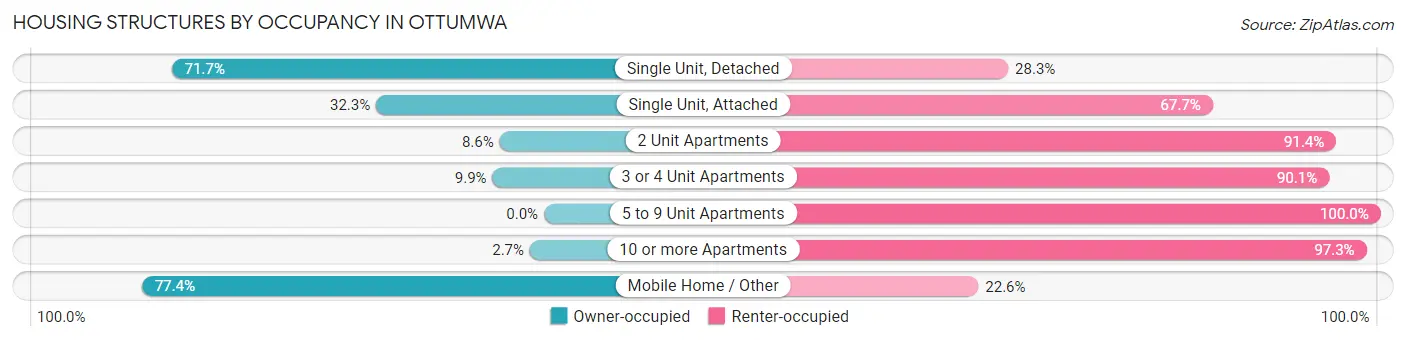
| Structure Type | Owner-occupied | Renter-occupied |
| Single Unit, Detached | 5,686 (71.7%) | 2,244 (28.3%) |
| Single Unit, Attached | 43 (32.3%) | 90 (67.7%) |
| 2 Unit Apartments | 19 (8.6%) | 203 (91.4%) |
| 3 or 4 Unit Apartments | 37 (9.9%) | 336 (90.1%) |
| 5 to 9 Unit Apartments | 0 (0.0%) | 469 (100.0%) |
| 10 or more Apartments | 22 (2.7%) | 786 (97.3%) |
| Mobile Home / Other | 206 (77.4%) | 60 (22.6%) |
| Total | 6,013 (59.0%) | 4,188 (41.0%) |
Housing Structures by Number of Rooms in Ottumwa
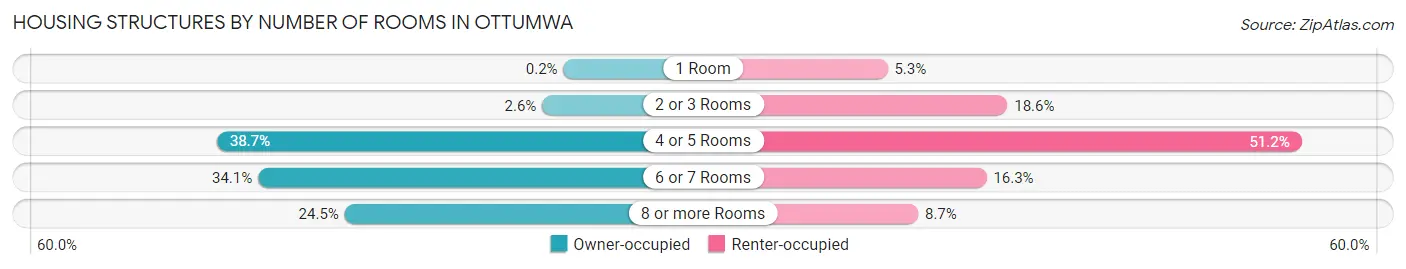
| Number of Rooms | Owner-occupied | Renter-occupied |
| 1 Room | 12 (0.2%) | 221 (5.3%) |
| 2 or 3 Rooms | 154 (2.6%) | 778 (18.6%) |
| 4 or 5 Rooms | 2,325 (38.7%) | 2,145 (51.2%) |
| 6 or 7 Rooms | 2,050 (34.1%) | 681 (16.3%) |
| 8 or more Rooms | 1,472 (24.5%) | 363 (8.7%) |
| Total | 6,013 (100.0%) | 4,188 (100.0%) |
Housing Structure by Heating Type in Ottumwa
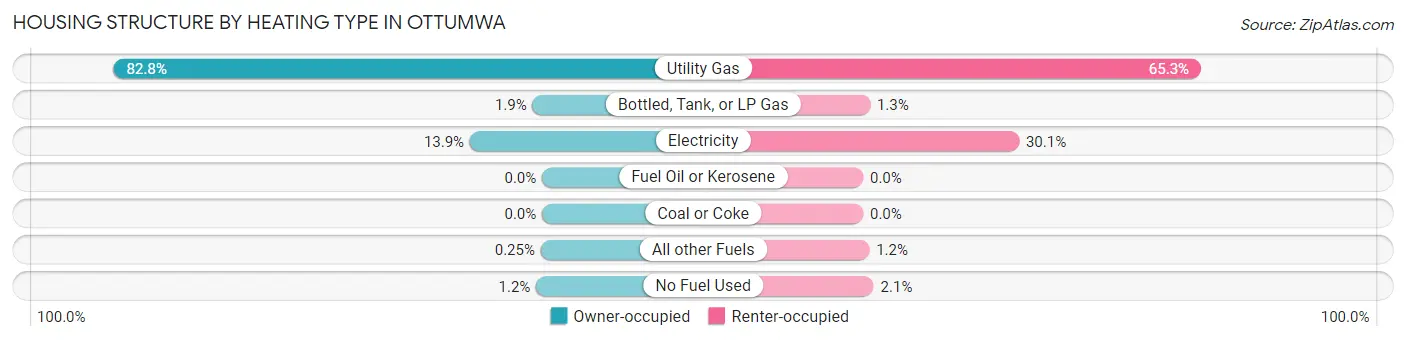
| Heating Type | Owner-occupied | Renter-occupied |
| Utility Gas | 4,980 (82.8%) | 2,734 (65.3%) |
| Bottled, Tank, or LP Gas | 111 (1.8%) | 56 (1.3%) |
| Electricity | 838 (13.9%) | 1,262 (30.1%) |
| Fuel Oil or Kerosene | 0 (0.0%) | 0 (0.0%) |
| Coal or Coke | 0 (0.0%) | 0 (0.0%) |
| All other Fuels | 15 (0.3%) | 50 (1.2%) |
| No Fuel Used | 69 (1.1%) | 86 (2.1%) |
| Total | 6,013 (100.0%) | 4,188 (100.0%) |
Household Vehicle Usage in Ottumwa
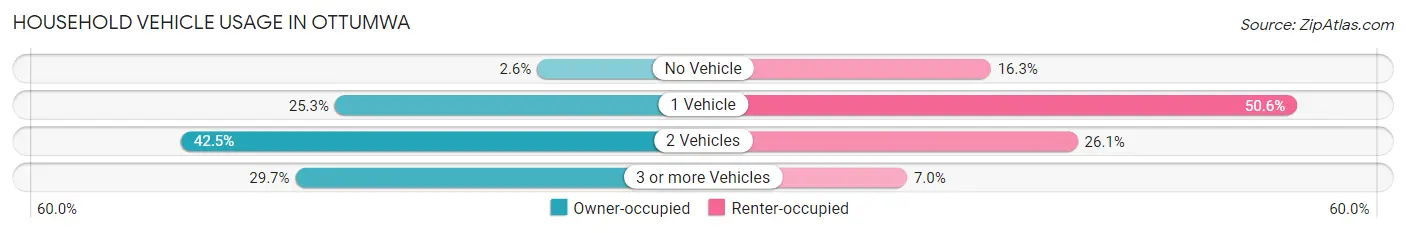
| Vehicles per Household | Owner-occupied | Renter-occupied |
| No Vehicle | 156 (2.6%) | 684 (16.3%) |
| 1 Vehicle | 1,518 (25.3%) | 2,121 (50.6%) |
| 2 Vehicles | 2,555 (42.5%) | 1,092 (26.1%) |
| 3 or more Vehicles | 1,784 (29.7%) | 291 (7.0%) |
| Total | 6,013 (100.0%) | 4,188 (100.0%) |
Real Estate & Mortgages in Ottumwa
Real Estate and Mortgage Overview in Ottumwa
| Characteristic | Without Mortgage | With Mortgage |
| Housing Units | 2,743 | 3,270 |
| Median Property Value | $82,700 | $92,000 |
| Median Household Income | $53,299 | $544 |
| Monthly Housing Costs | $523 | $10 |
| Real Estate Taxes | $1,664 | $19 |
Property Value by Mortgage Status in Ottumwa
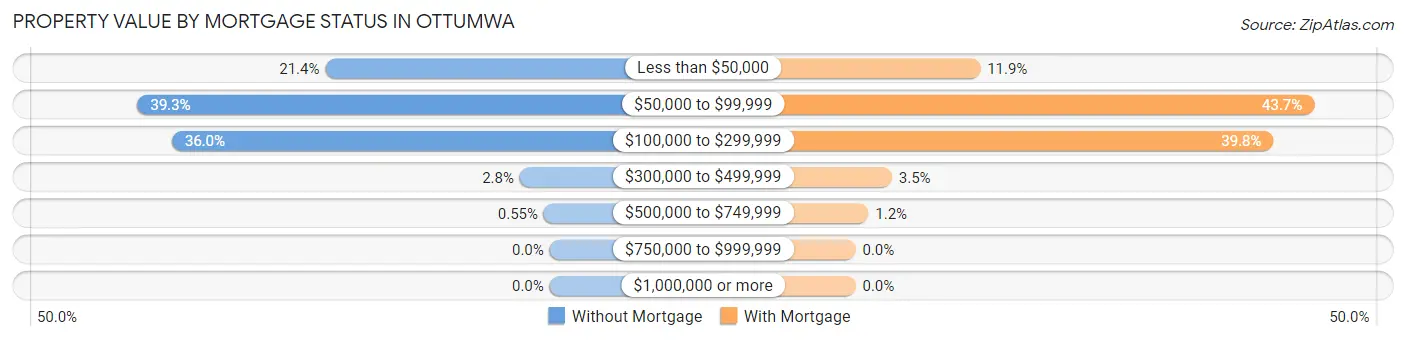
| Property Value | Without Mortgage | With Mortgage |
| Less than $50,000 | 586 (21.4%) | 388 (11.9%) |
| $50,000 to $99,999 | 1,077 (39.3%) | 1,428 (43.7%) |
| $100,000 to $299,999 | 987 (36.0%) | 1,301 (39.8%) |
| $300,000 to $499,999 | 78 (2.8%) | 113 (3.5%) |
| $500,000 to $749,999 | 15 (0.5%) | 40 (1.2%) |
| $750,000 to $999,999 | 0 (0.0%) | 0 (0.0%) |
| $1,000,000 or more | 0 (0.0%) | 0 (0.0%) |
| Total | 2,743 (100.0%) | 3,270 (100.0%) |
Household Income by Mortgage Status in Ottumwa
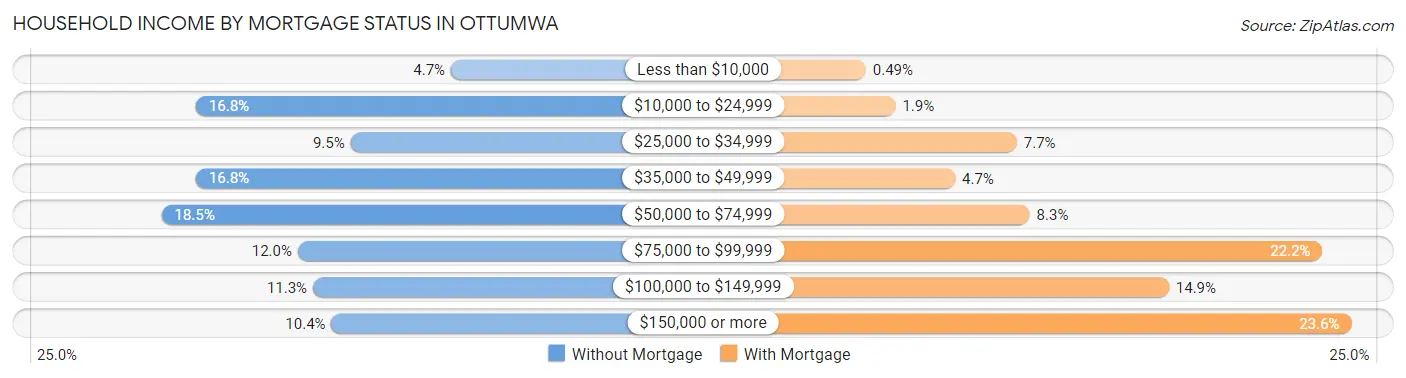
| Household Income | Without Mortgage | With Mortgage |
| Less than $10,000 | 129 (4.7%) | 16 (0.5%) |
| $10,000 to $24,999 | 462 (16.8%) | 62 (1.9%) |
| $25,000 to $34,999 | 260 (9.5%) | 251 (7.7%) |
| $35,000 to $49,999 | 462 (16.8%) | 155 (4.7%) |
| $50,000 to $74,999 | 507 (18.5%) | 271 (8.3%) |
| $75,000 to $99,999 | 329 (12.0%) | 727 (22.2%) |
| $100,000 to $149,999 | 309 (11.3%) | 488 (14.9%) |
| $150,000 or more | 285 (10.4%) | 772 (23.6%) |
| Total | 2,743 (100.0%) | 3,270 (100.0%) |
Property Value to Household Income Ratio in Ottumwa
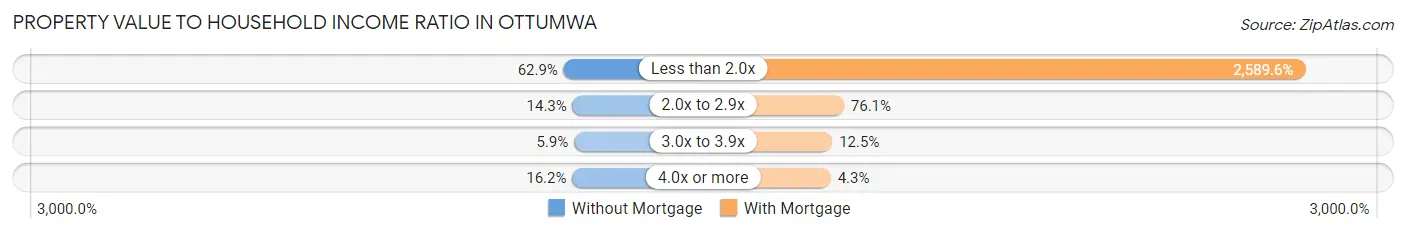
| Value-to-Income Ratio | Without Mortgage | With Mortgage |
| Less than 2.0x | 1,724 (62.8%) | 84,681 (2,589.6%) |
| 2.0x to 2.9x | 393 (14.3%) | 2,487 (76.1%) |
| 3.0x to 3.9x | 162 (5.9%) | 407 (12.4%) |
| 4.0x or more | 443 (16.2%) | 142 (4.3%) |
| Total | 2,743 (100.0%) | 3,270 (100.0%) |
Real Estate Taxes by Mortgage Status in Ottumwa
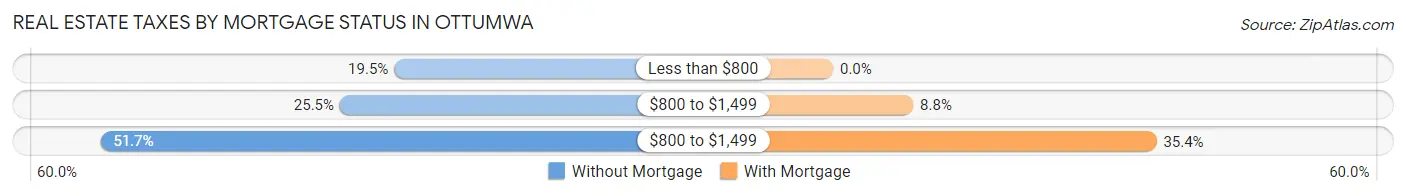
| Property Taxes | Without Mortgage | With Mortgage |
| Less than $800 | 535 (19.5%) | 0 (0.0%) |
| $800 to $1,499 | 698 (25.5%) | 287 (8.8%) |
| $800 to $1,499 | 1,418 (51.7%) | 1,159 (35.4%) |
| Total | 2,743 (100.0%) | 3,270 (100.0%) |
Health & Disability in Ottumwa
Health Insurance Coverage by Age in Ottumwa
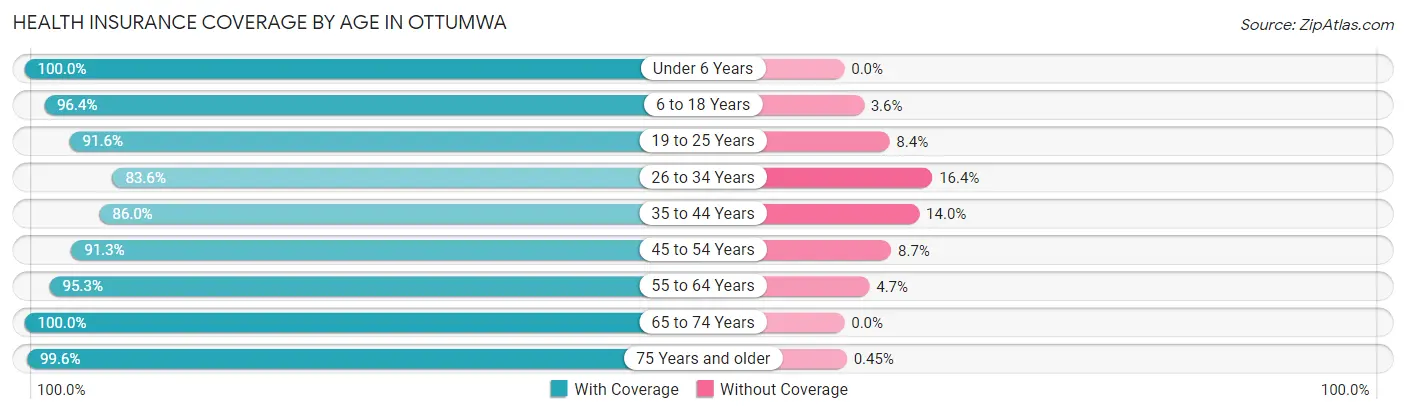
| Age Bracket | With Coverage | Without Coverage |
| Under 6 Years | 2,091 (100.0%) | 0 (0.0%) |
| 6 to 18 Years | 4,201 (96.4%) | 158 (3.6%) |
| 19 to 25 Years | 2,102 (91.6%) | 193 (8.4%) |
| 26 to 34 Years | 2,821 (83.6%) | 553 (16.4%) |
| 35 to 44 Years | 2,305 (86.0%) | 374 (14.0%) |
| 45 to 54 Years | 3,057 (91.3%) | 292 (8.7%) |
| 55 to 64 Years | 3,050 (95.3%) | 149 (4.7%) |
| 65 to 74 Years | 2,104 (100.0%) | 0 (0.0%) |
| 75 Years and older | 1,548 (99.6%) | 7 (0.4%) |
| Total | 23,279 (93.1%) | 1,726 (6.9%) |
Health Insurance Coverage by Citizenship Status in Ottumwa
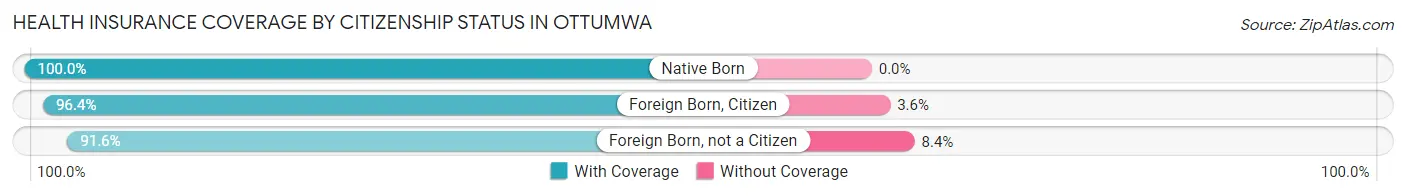
| Citizenship Status | With Coverage | Without Coverage |
| Native Born | 2,091 (100.0%) | 0 (0.0%) |
| Foreign Born, Citizen | 4,201 (96.4%) | 158 (3.6%) |
| Foreign Born, not a Citizen | 2,102 (91.6%) | 193 (8.4%) |
Health Insurance Coverage by Household Income in Ottumwa
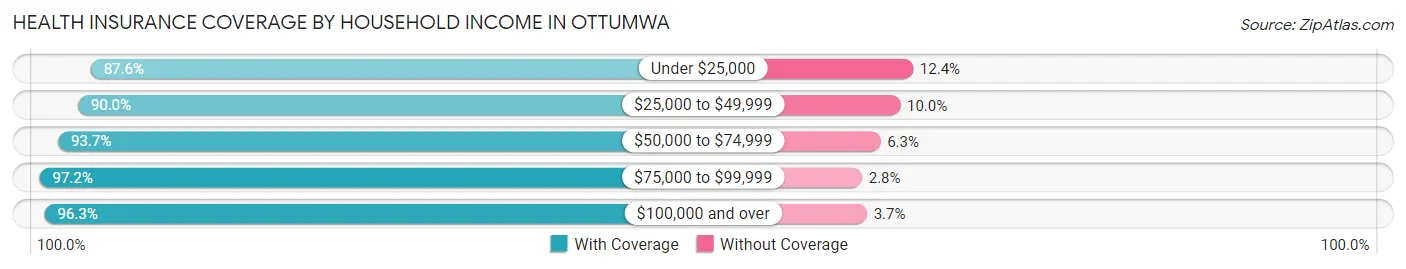
| Household Income | With Coverage | Without Coverage |
| Under $25,000 | 4,163 (87.6%) | 589 (12.4%) |
| $25,000 to $49,999 | 4,341 (90.0%) | 481 (10.0%) |
| $50,000 to $74,999 | 4,430 (93.7%) | 296 (6.3%) |
| $75,000 to $99,999 | 3,013 (97.2%) | 87 (2.8%) |
| $100,000 and over | 6,908 (96.3%) | 268 (3.7%) |
Public vs Private Health Insurance Coverage by Age in Ottumwa
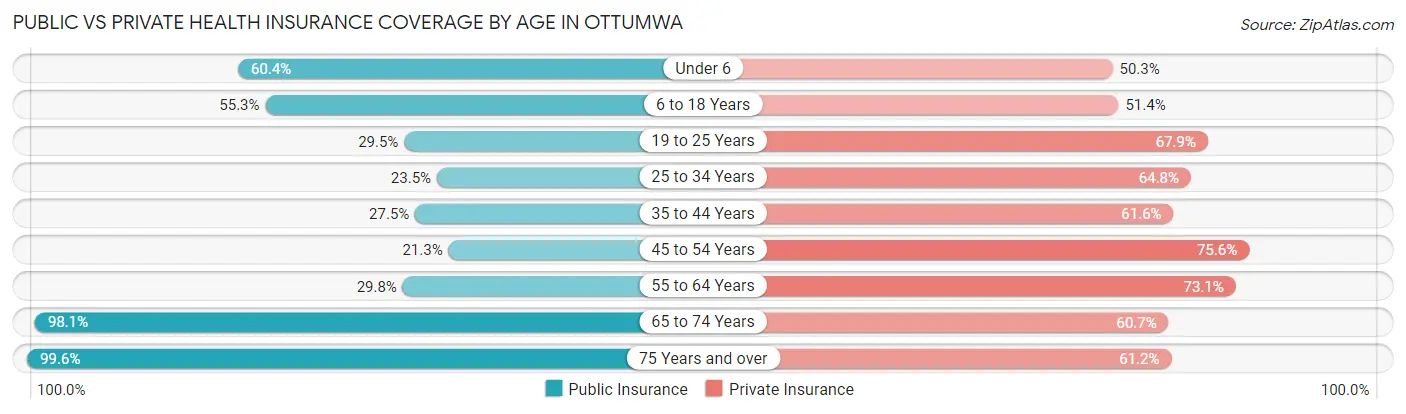
| Age Bracket | Public Insurance | Private Insurance |
| Under 6 | 1,263 (60.4%) | 1,051 (50.3%) |
| 6 to 18 Years | 2,411 (55.3%) | 2,239 (51.4%) |
| 19 to 25 Years | 678 (29.5%) | 1,559 (67.9%) |
| 25 to 34 Years | 792 (23.5%) | 2,186 (64.8%) |
| 35 to 44 Years | 737 (27.5%) | 1,649 (61.6%) |
| 45 to 54 Years | 714 (21.3%) | 2,531 (75.6%) |
| 55 to 64 Years | 954 (29.8%) | 2,338 (73.1%) |
| 65 to 74 Years | 2,064 (98.1%) | 1,276 (60.7%) |
| 75 Years and over | 1,548 (99.6%) | 951 (61.2%) |
| Total | 11,161 (44.6%) | 15,780 (63.1%) |
Disability Status by Sex by Age in Ottumwa
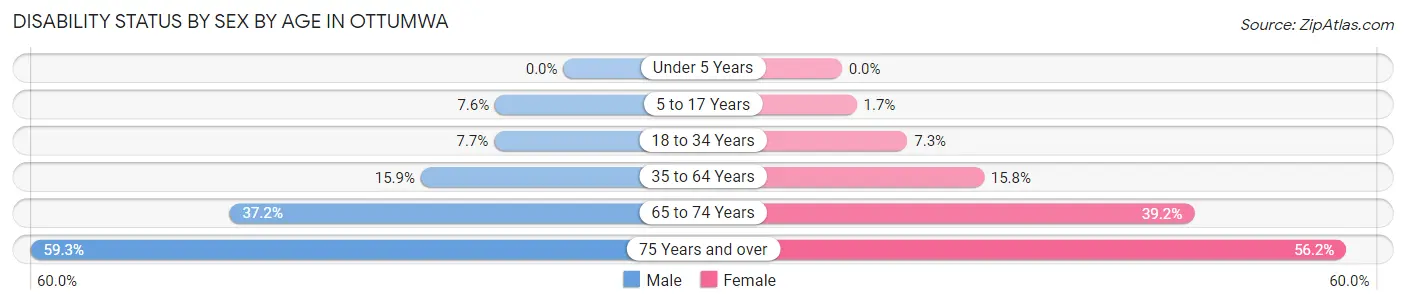
| Age Bracket | Male | Female |
| Under 5 Years | 0 (0.0%) | 0 (0.0%) |
| 5 to 17 Years | 184 (7.6%) | 31 (1.7%) |
| 18 to 34 Years | 249 (7.7%) | 209 (7.3%) |
| 35 to 64 Years | 736 (15.9%) | 726 (15.8%) |
| 65 to 74 Years | 351 (37.2%) | 455 (39.2%) |
| 75 Years and over | 331 (59.3%) | 560 (56.2%) |
Disability Class by Sex by Age in Ottumwa
Disability Class: Hearing Difficulty
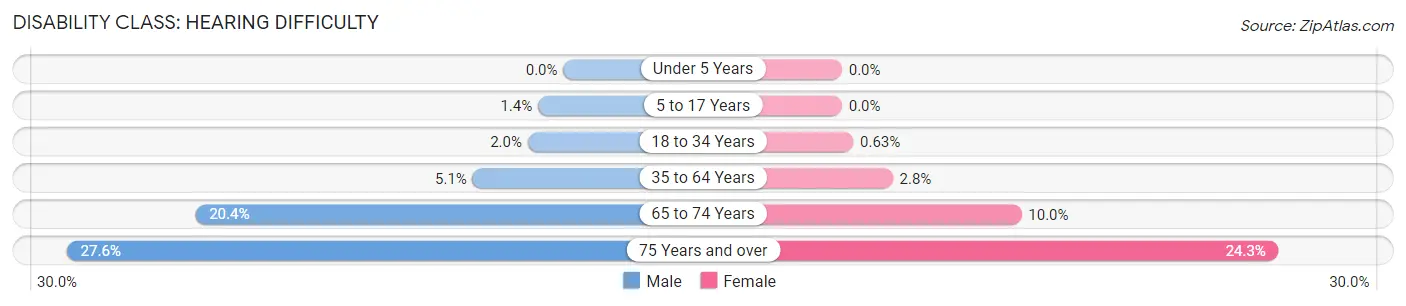
| Age Bracket | Male | Female |
| Under 5 Years | 0 (0.0%) | 0 (0.0%) |
| 5 to 17 Years | 34 (1.4%) | 0 (0.0%) |
| 18 to 34 Years | 64 (2.0%) | 18 (0.6%) |
| 35 to 64 Years | 234 (5.1%) | 130 (2.8%) |
| 65 to 74 Years | 193 (20.4%) | 116 (10.0%) |
| 75 Years and over | 154 (27.6%) | 242 (24.3%) |
Disability Class: Vision Difficulty
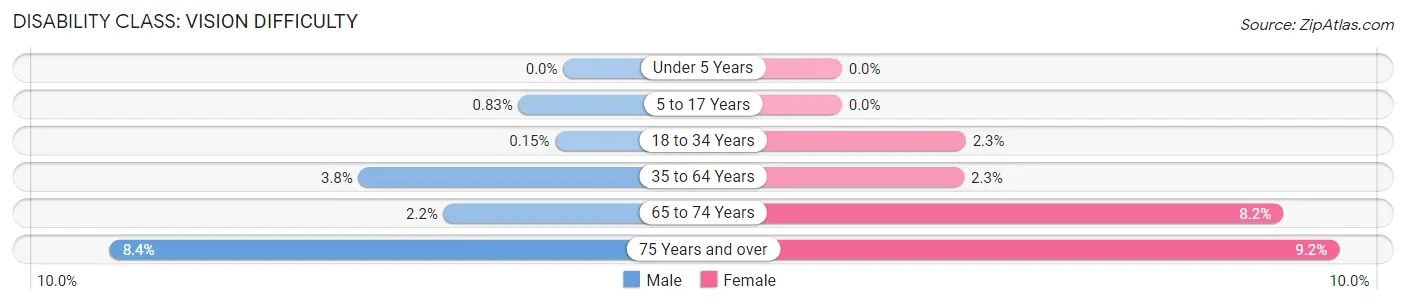
| Age Bracket | Male | Female |
| Under 5 Years | 0 (0.0%) | 0 (0.0%) |
| 5 to 17 Years | 20 (0.8%) | 0 (0.0%) |
| 18 to 34 Years | 5 (0.2%) | 66 (2.3%) |
| 35 to 64 Years | 176 (3.8%) | 104 (2.3%) |
| 65 to 74 Years | 21 (2.2%) | 95 (8.2%) |
| 75 Years and over | 47 (8.4%) | 92 (9.2%) |
Disability Class: Cognitive Difficulty
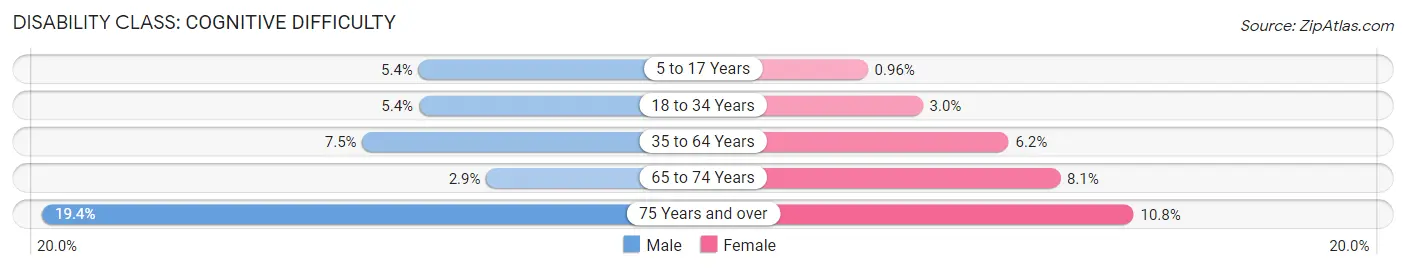
| Age Bracket | Male | Female |
| 5 to 17 Years | 130 (5.4%) | 18 (1.0%) |
| 18 to 34 Years | 173 (5.4%) | 86 (3.0%) |
| 35 to 64 Years | 346 (7.5%) | 284 (6.2%) |
| 65 to 74 Years | 27 (2.9%) | 94 (8.1%) |
| 75 Years and over | 108 (19.4%) | 108 (10.8%) |
Disability Class: Ambulatory Difficulty
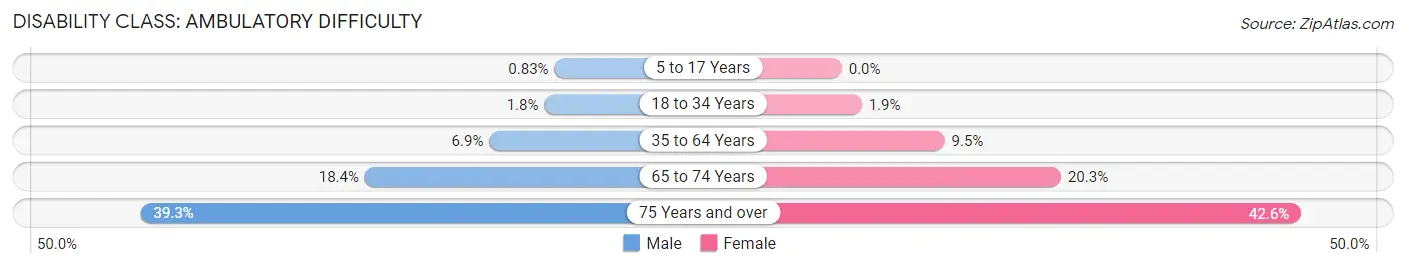
| Age Bracket | Male | Female |
| 5 to 17 Years | 20 (0.8%) | 0 (0.0%) |
| 18 to 34 Years | 57 (1.8%) | 53 (1.8%) |
| 35 to 64 Years | 319 (6.9%) | 438 (9.5%) |
| 65 to 74 Years | 174 (18.4%) | 236 (20.3%) |
| 75 Years and over | 219 (39.3%) | 425 (42.6%) |
Disability Class: Self-Care Difficulty
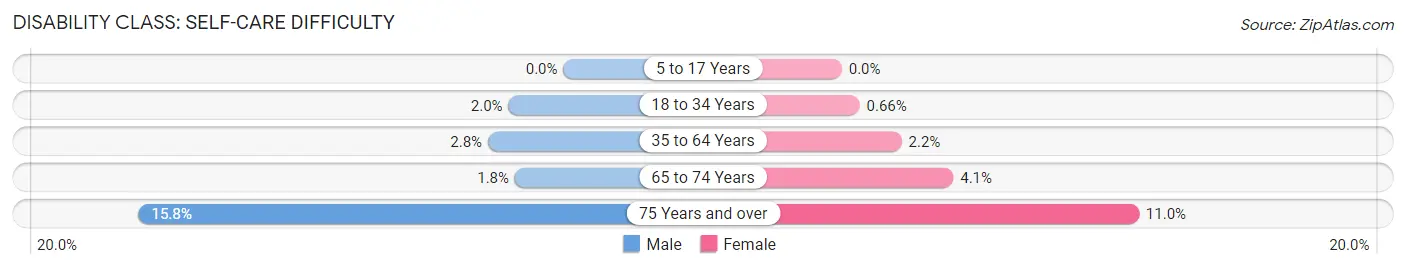
| Age Bracket | Male | Female |
| 5 to 17 Years | 0 (0.0%) | 0 (0.0%) |
| 18 to 34 Years | 66 (2.0%) | 19 (0.7%) |
| 35 to 64 Years | 130 (2.8%) | 102 (2.2%) |
| 65 to 74 Years | 17 (1.8%) | 48 (4.1%) |
| 75 Years and over | 88 (15.8%) | 110 (11.0%) |
Technology Access in Ottumwa
Computing Device Access in Ottumwa
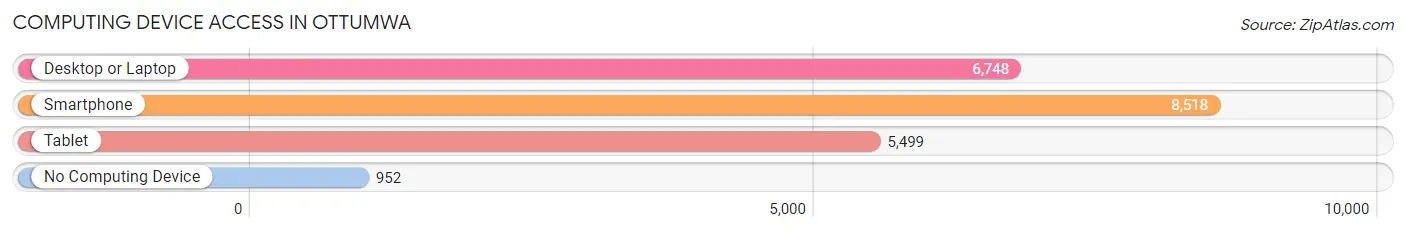
| Device Type | # Households | % Households |
| Desktop or Laptop | 6,748 | 66.1% |
| Smartphone | 8,518 | 83.5% |
| Tablet | 5,499 | 53.9% |
| No Computing Device | 952 | 9.3% |
| Total | 10,201 | 100.0% |
Internet Access in Ottumwa
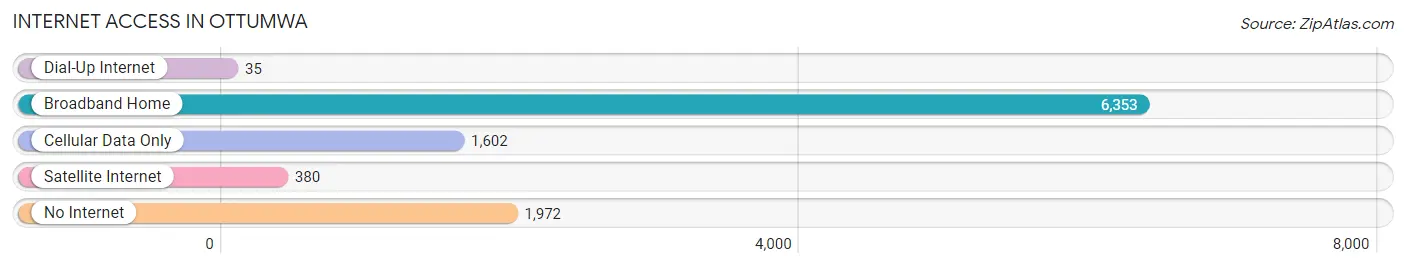
| Internet Type | # Households | % Households |
| Dial-Up Internet | 35 | 0.3% |
| Broadband Home | 6,353 | 62.3% |
| Cellular Data Only | 1,602 | 15.7% |
| Satellite Internet | 380 | 3.7% |
| No Internet | 1,972 | 19.3% |
| Total | 10,201 | 100.0% |
Ottumwa Summary
Ottumwa, Iowa is a city located in Wapello County in the southeastern part of the state. It is the county seat and the largest city in the county. The city is situated along the Des Moines River and is part of the Ottumwa-Oskaloosa Metropolitan Statistical Area. As of the 2010 census, the city had a population of 25,023.
History
The area that is now Ottumwa was first settled in 1841 by a group of settlers from Ohio. The city was named after the Native American tribe of the same name, which had inhabited the area prior to the settlers’ arrival. The city was incorporated in 1853 and was designated as the county seat of Wapello County in 1855.
In the late 19th century, Ottumwa was a major railroad hub and was home to several large industries, including a large coal mining operation. The city was also home to the world’s first female mayor, Mary B. Haskin, who was elected in 1887.
In the early 20th century, the city experienced a period of growth and prosperity. The city was home to several large factories, including the John Deere plant, which employed thousands of workers. The city also had a thriving downtown area, which included several theaters, restaurants, and shops.
Geography
Ottumwa is located in southeastern Iowa, in Wapello County. The city is situated along the Des Moines River and is part of the Ottumwa-Oskaloosa Metropolitan Statistical Area. The city has a total area of 11.2 square miles, of which 11.1 square miles is land and 0.1 square miles is water.
The city is located in a hilly region of the state and is surrounded by several small towns and rural areas. The city is located approximately 75 miles southeast of Des Moines and approximately 150 miles northwest of Chicago.
Economy
Ottumwa’s economy is largely based on manufacturing and agriculture. The city is home to several large factories, including the John Deere plant, which employs thousands of workers. The city is also home to several smaller manufacturing companies, as well as several agricultural businesses.
The city is also home to several large retail stores, including Walmart, Target, and Kohl’s. The city also has a thriving downtown area, which includes several restaurants, shops, and entertainment venues.
Demographics
As of the 2010 census, the city had a population of 25,023. The racial makeup of the city was 87.3% White, 8.2% African American, 0.5% Native American, 0.7% Asian, 0.1% Pacific Islander, 1.2% from other races, and 2.1% from two or more races. Hispanic or Latino of any race were 3.3% of the population.
The median income for a household in the city was $37,845, and the median income for a family was $45,945. The per capita income for the city was $19,845. About 13.2% of families and 16.3% of the population were below the poverty line, including 22.3% of those under age 18 and 8.2% of those age 65 or over.
Common Questions
What is Per Capita Income in Ottumwa?
Per Capita income in Ottumwa is $29,395.
What is the Median Family Income in Ottumwa?
Median Family Income in Ottumwa is $61,429.
What is the Median Household income in Ottumwa?
Median Household Income in Ottumwa is $53,085.
What is Income or Wage Gap in Ottumwa?
Income or Wage Gap in Ottumwa is 20.7%.
Women in Ottumwa earn 79.3 cents for every dollar earned by a man.
What is Family Income Deficit in Ottumwa?
Family Income Deficit in Ottumwa is $10,995.
Families that are below poverty line in Ottumwa earn $10,995 less on average than the poverty threshold level.
What is Inequality or Gini Index in Ottumwa?
Inequality or Gini Index in Ottumwa is 0.44.
What is the Total Population of Ottumwa?
Total Population of Ottumwa is 25,359.
What is the Total Male Population of Ottumwa?
Total Male Population of Ottumwa is 12,844.
What is the Total Female Population of Ottumwa?
Total Female Population of Ottumwa is 12,515.
What is the Ratio of Males per 100 Females in Ottumwa?
There are 102.63 Males per 100 Females in Ottumwa.
What is the Ratio of Females per 100 Males in Ottumwa?
There are 97.44 Females per 100 Males in Ottumwa.
What is the Median Population Age in Ottumwa?
Median Population Age in Ottumwa is 36.7 Years.
What is the Average Family Size in Ottumwa
Average Family Size in Ottumwa is 3.0 People.
What is the Average Household Size in Ottumwa
Average Household Size in Ottumwa is 2.4 People.
How Large is the Labor Force in Ottumwa?
There are 12,700 People in the Labor Forcein in Ottumwa.
What is the Percentage of People in the Labor Force in Ottumwa?
63.3% of People are in the Labor Force in Ottumwa.
What is the Unemployment Rate in Ottumwa?
Unemployment Rate in Ottumwa is 4.5%.