Marshalltown, IA Map & Demographics
Marshalltown Map
Marshalltown Overview
$27,718
PER CAPITA INCOME
$80,154
AVG FAMILY INCOME
$65,000
AVG HOUSEHOLD INCOME
24.6%
WAGE / INCOME GAP [ % ]
75.4¢/ $1
WAGE / INCOME GAP [ $ ]
0.40
INEQUALITY / GINI INDEX
27,511
TOTAL POPULATION
13,987
MALE POPULATION
13,524
FEMALE POPULATION
103.42
MALES / 100 FEMALES
96.69
FEMALES / 100 MALES
35.5
MEDIAN AGE
3.4
AVG FAMILY SIZE
2.6
AVG HOUSEHOLD SIZE
13,794
LABOR FORCE [ PEOPLE ]
65.9%
PERCENT IN LABOR FORCE
6.8%
UNEMPLOYMENT RATE
Marshalltown Zip Codes
Marshalltown Area Codes
Income in Marshalltown
Income Overview in Marshalltown
Per Capita Income in Marshalltown is $27,718, while median incomes of families and households are $80,154 and $65,000 respectively.
| Characteristic | Number | Measure |
| Per Capita Income | 27,511 | $27,718 |
| Median Family Income | 6,301 | $80,154 |
| Mean Family Income | 6,301 | $87,844 |
| Median Household Income | 9,984 | $65,000 |
| Mean Household Income | 9,984 | $75,196 |
| Income Deficit | 6,301 | $0 |
| Wage / Income Gap (%) | 27,511 | 24.64% |
| Wage / Income Gap ($) | 27,511 | 75.36¢ per $1 |
| Gini / Inequality Index | 27,511 | 0.40 |
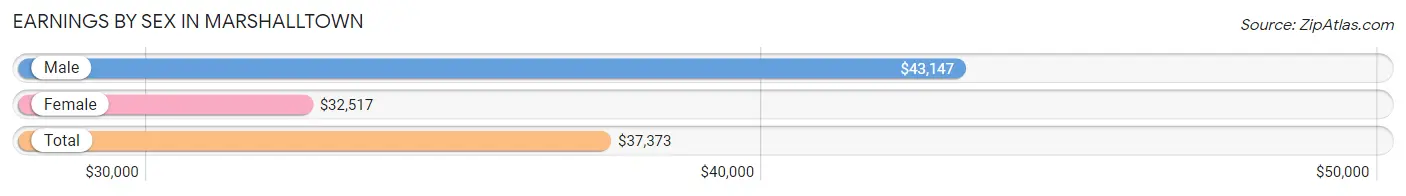
Earnings by Sex in Marshalltown
Average Earnings in Marshalltown are $37,373, $43,147 for men and $32,517 for women, a difference of 24.6%.
| Sex | Number | Average Earnings |
| Male | 7,572 (54.7%) | $43,147 |
| Female | 6,257 (45.3%) | $32,517 |
| Total | 13,829 (100.0%) | $37,373 |
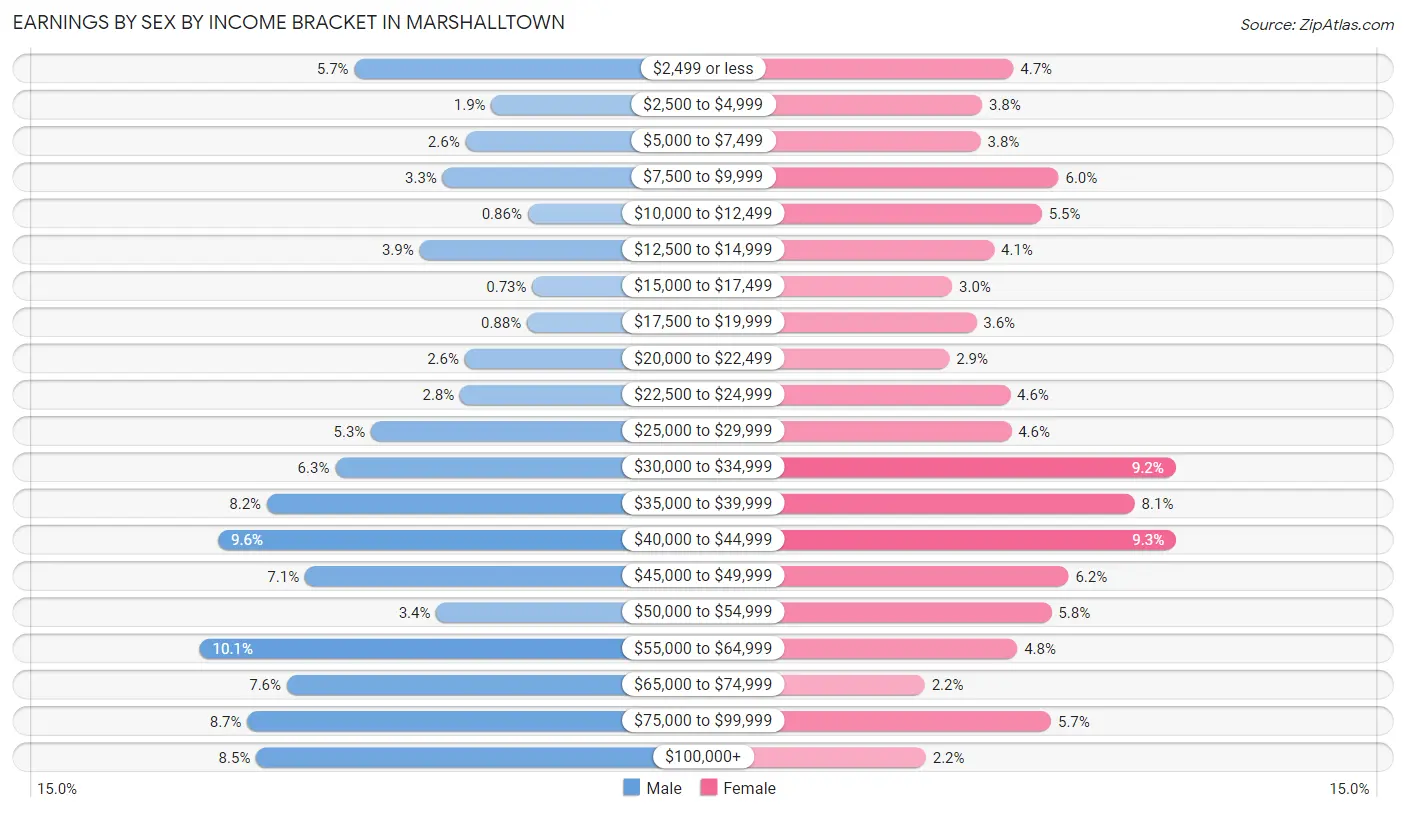
Earnings by Sex by Income Bracket in Marshalltown
The most common earnings brackets in Marshalltown are $55,000 to $64,999 for men (763 | 10.1%) and $40,000 to $44,999 for women (579 | 9.2%).
| Income | Male | Female |
| $2,499 or less | 434 (5.7%) | 293 (4.7%) |
| $2,500 to $4,999 | 142 (1.9%) | 238 (3.8%) |
| $5,000 to $7,499 | 198 (2.6%) | 235 (3.8%) |
| $7,500 to $9,999 | 246 (3.3%) | 372 (5.9%) |
| $10,000 to $12,499 | 65 (0.9%) | 343 (5.5%) |
| $12,500 to $14,999 | 295 (3.9%) | 259 (4.1%) |
| $15,000 to $17,499 | 55 (0.7%) | 185 (3.0%) |
| $17,500 to $19,999 | 67 (0.9%) | 228 (3.6%) |
| $20,000 to $22,499 | 199 (2.6%) | 180 (2.9%) |
| $22,500 to $24,999 | 209 (2.8%) | 287 (4.6%) |
| $25,000 to $29,999 | 398 (5.3%) | 289 (4.6%) |
| $30,000 to $34,999 | 475 (6.3%) | 578 (9.2%) |
| $35,000 to $39,999 | 620 (8.2%) | 506 (8.1%) |
| $40,000 to $44,999 | 724 (9.6%) | 579 (9.2%) |
| $45,000 to $49,999 | 539 (7.1%) | 390 (6.2%) |
| $50,000 to $54,999 | 260 (3.4%) | 360 (5.8%) |
| $55,000 to $64,999 | 763 (10.1%) | 300 (4.8%) |
| $65,000 to $74,999 | 578 (7.6%) | 137 (2.2%) |
| $75,000 to $99,999 | 662 (8.7%) | 359 (5.7%) |
| $100,000+ | 643 (8.5%) | 139 (2.2%) |
| Total | 7,572 (100.0%) | 6,257 (100.0%) |
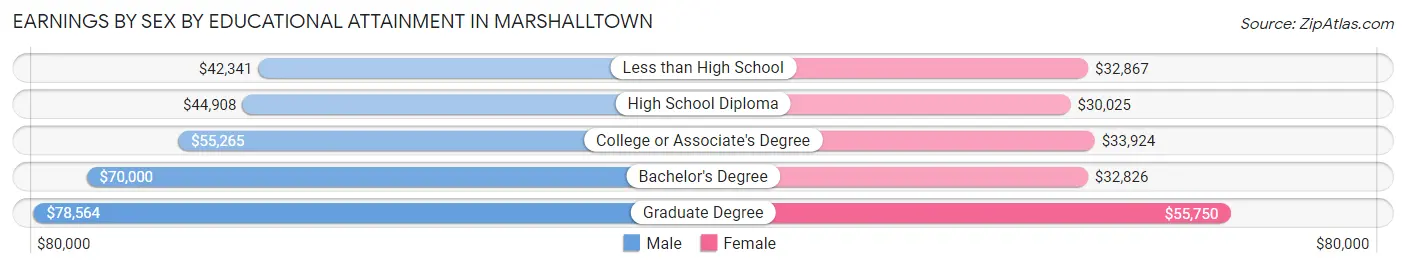
Earnings by Sex by Educational Attainment in Marshalltown
Average earnings in Marshalltown are $47,100 for men and $33,691 for women, a difference of 28.5%. Men with an educational attainment of graduate degree enjoy the highest average annual earnings of $78,564, while those with less than high school education earn the least with $42,341. Women with an educational attainment of graduate degree earn the most with the average annual earnings of $55,750, while those with high school diploma education have the smallest earnings of $30,025.
| Educational Attainment | Male Income | Female Income |
| Less than High School | $42,341 | $32,867 |
| High School Diploma | $44,908 | $30,025 |
| College or Associate's Degree | $55,265 | $33,924 |
| Bachelor's Degree | $70,000 | $32,826 |
| Graduate Degree | $78,564 | $55,750 |
| Total | $47,100 | $33,691 |
Family Income in Marshalltown
Family Income Brackets in Marshalltown
According to the Marshalltown family income data, there are 1,537 families falling into the $100,000 to $149,999 income range, which is the most common income bracket and makes up 24.4% of all families. Conversely, the $10,000 to $14,999 income bracket is the least frequent group with only 101 families (1.6%) belonging to this category.
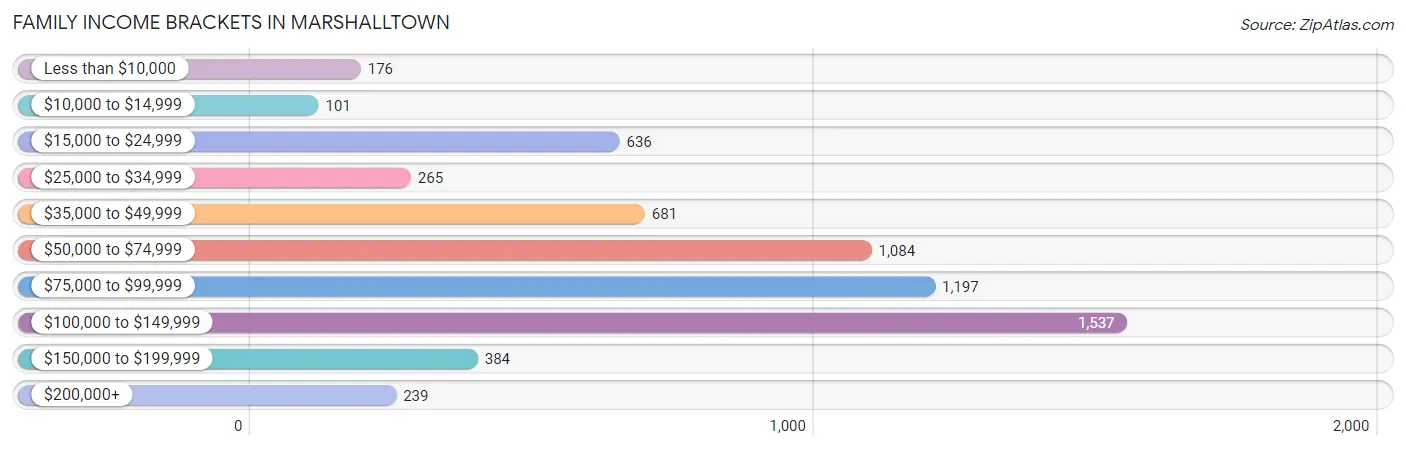
| Income Bracket | # Families | % Families |
| Less than $10,000 | 176 | 2.8% |
| $10,000 to $14,999 | 101 | 1.6% |
| $15,000 to $24,999 | 636 | 10.1% |
| $25,000 to $34,999 | 265 | 4.2% |
| $35,000 to $49,999 | 681 | 10.8% |
| $50,000 to $74,999 | 1,084 | 17.2% |
| $75,000 to $99,999 | 1,197 | 19.0% |
| $100,000 to $149,999 | 1,537 | 24.4% |
| $150,000 to $199,999 | 384 | 6.1% |
| $200,000+ | 239 | 3.8% |
Family Income by Famaliy Size in Marshalltown
7+ person families (416 | 6.6%) account for the highest median family income in Marshalltown with $110,536 per family, while 2-person families (2,562 | 40.7%) have the highest median income of $35,875 per family member.
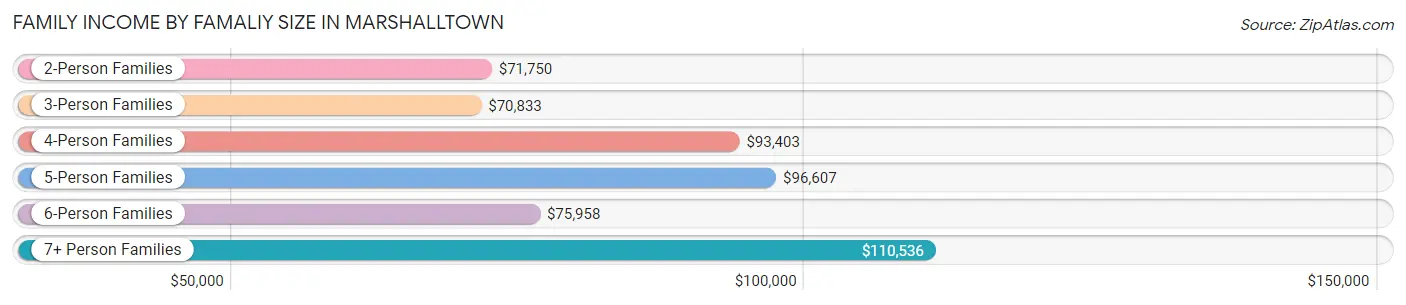
| Income Bracket | # Families | Median Income |
| 2-Person Families | 2,562 (40.7%) | $71,750 |
| 3-Person Families | 1,438 (22.8%) | $70,833 |
| 4-Person Families | 903 (14.3%) | $93,403 |
| 5-Person Families | 665 (10.5%) | $96,607 |
| 6-Person Families | 317 (5.0%) | $75,958 |
| 7+ Person Families | 416 (6.6%) | $110,536 |
| Total | 6,301 (100.0%) | $80,154 |
Family Income by Number of Earners in Marshalltown
The median family income in Marshalltown is $80,154, with families comprising 3+ earners (938) having the highest median family income of $111,786, while families with no earners (807) have the lowest median family income of $45,304, accounting for 14.9% and 12.8% of families, respectively.
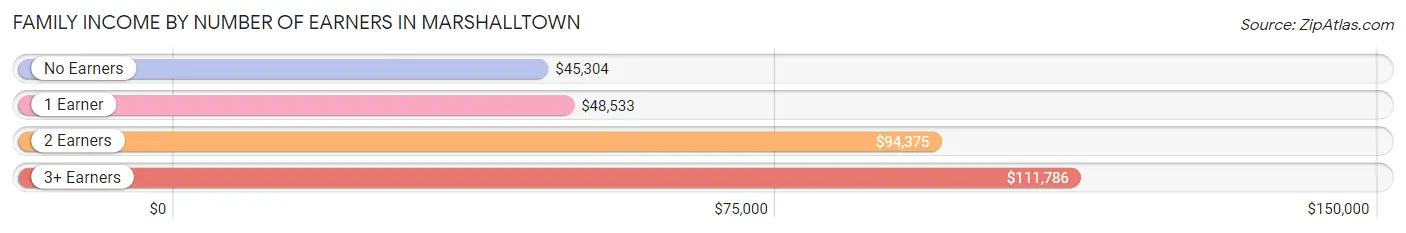
| Number of Earners | # Families | Median Income |
| No Earners | 807 (12.8%) | $45,304 |
| 1 Earner | 1,839 (29.2%) | $48,533 |
| 2 Earners | 2,717 (43.1%) | $94,375 |
| 3+ Earners | 938 (14.9%) | $111,786 |
| Total | 6,301 (100.0%) | $80,154 |
Household Income in Marshalltown
Household Income Brackets in Marshalltown
With 1,937 households falling in the category, the $100,000 to $149,999 income range is the most frequent in Marshalltown, accounting for 19.4% of all households. In contrast, only 290 households (2.9%) fall into the $200,000+ income bracket, making it the least populous group.
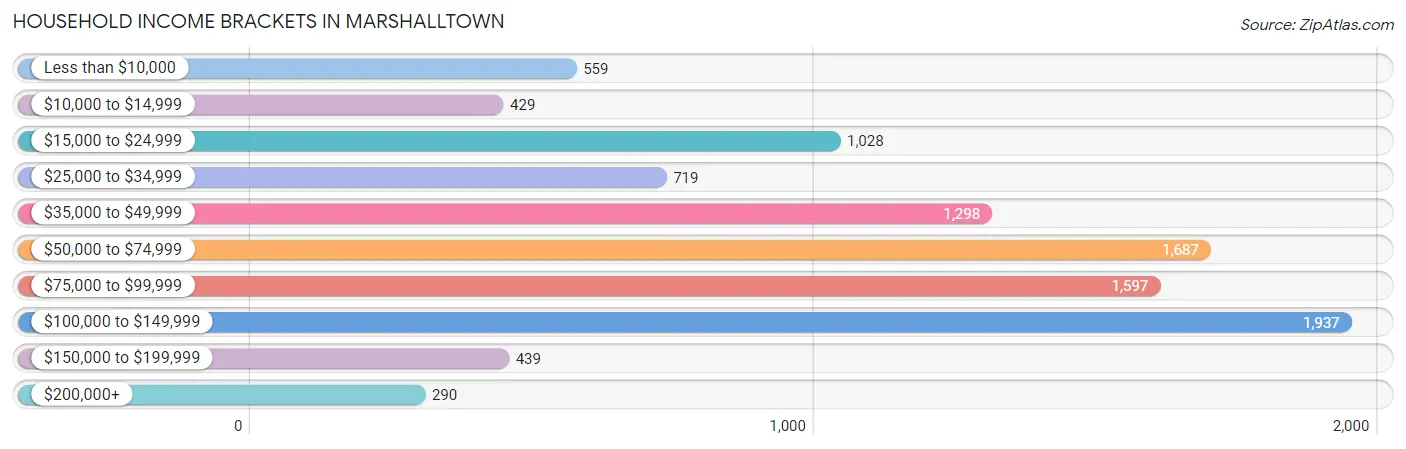
| Income Bracket | # Households | % Households |
| Less than $10,000 | 559 | 5.6% |
| $10,000 to $14,999 | 429 | 4.3% |
| $15,000 to $24,999 | 1,028 | 10.3% |
| $25,000 to $34,999 | 719 | 7.2% |
| $35,000 to $49,999 | 1,298 | 13.0% |
| $50,000 to $74,999 | 1,687 | 16.9% |
| $75,000 to $99,999 | 1,597 | 16.0% |
| $100,000 to $149,999 | 1,937 | 19.4% |
| $150,000 to $199,999 | 439 | 4.4% |
| $200,000+ | 290 | 2.9% |
Household Income by Householder Age in Marshalltown
The median household income in Marshalltown is $65,000, with the highest median household income of $74,383 found in the 45 to 64 years age bracket for the primary householder. A total of 3,519 households (35.2%) fall into this category. Meanwhile, the 65+ years age bracket for the primary householder has the lowest median household income of $47,865, with 2,433 households (24.4%) in this group.
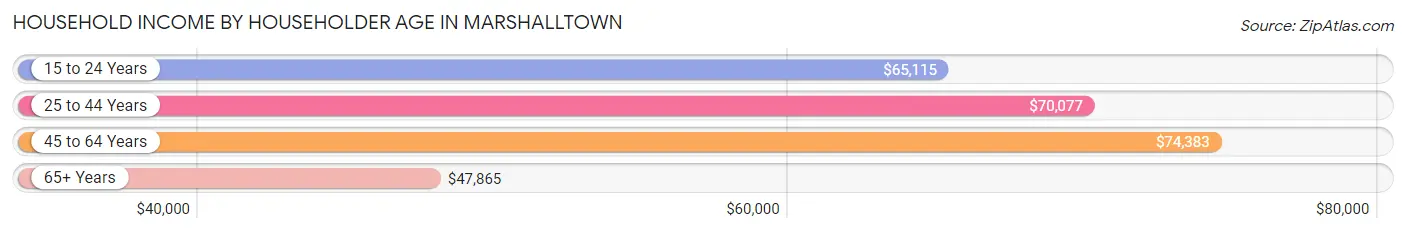
| Income Bracket | # Households | Median Income |
| 15 to 24 Years | 605 (6.1%) | $65,115 |
| 25 to 44 Years | 3,427 (34.3%) | $70,077 |
| 45 to 64 Years | 3,519 (35.2%) | $74,383 |
| 65+ Years | 2,433 (24.4%) | $47,865 |
| Total | 9,984 (100.0%) | $65,000 |
Poverty in Marshalltown
Income Below Poverty by Sex and Age in Marshalltown
With 12.2% poverty level for males and 16.3% for females among the residents of Marshalltown, 12 to 14 year old males and 15 year old females are the most vulnerable to poverty, with 174 males (29.9%) and 48 females (26.2%) in their respective age groups living below the poverty level.
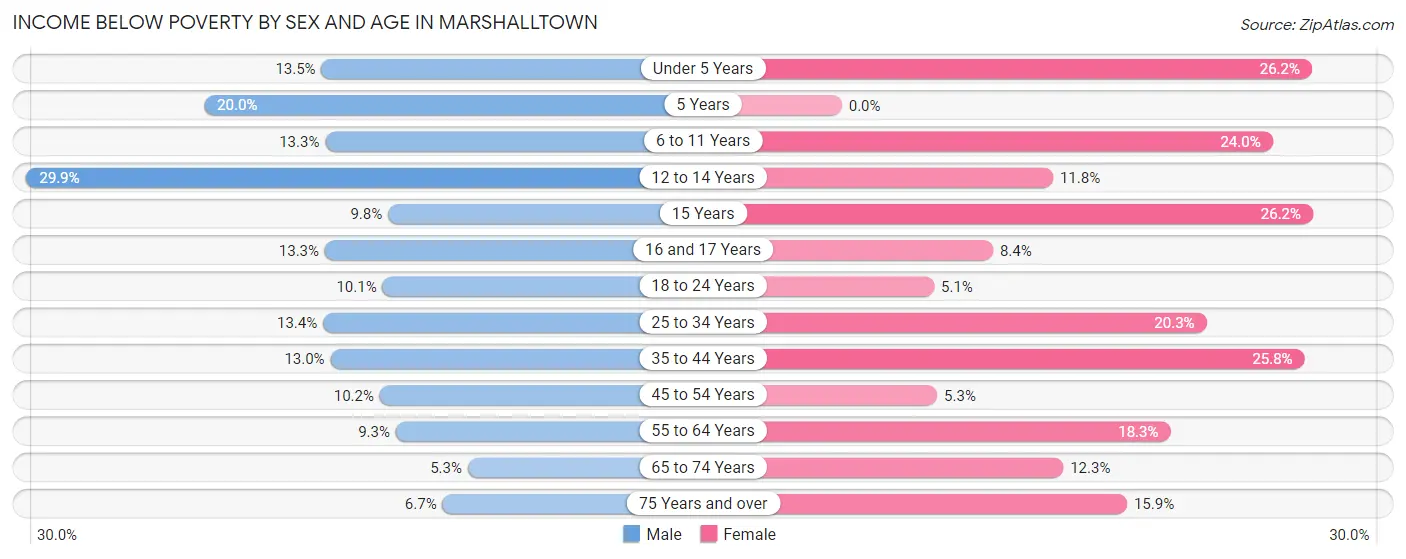
| Age Bracket | Male | Female |
| Under 5 Years | 122 (13.5%) | 235 (26.2%) |
| 5 Years | 91 (20.0%) | 0 (0.0%) |
| 6 to 11 Years | 151 (13.3%) | 324 (24.0%) |
| 12 to 14 Years | 174 (29.9%) | 70 (11.8%) |
| 15 Years | 24 (9.8%) | 48 (26.2%) |
| 16 and 17 Years | 53 (13.3%) | 33 (8.4%) |
| 18 to 24 Years | 139 (10.1%) | 66 (5.1%) |
| 25 to 34 Years | 225 (13.4%) | 347 (20.3%) |
| 35 to 44 Years | 219 (13.0%) | 347 (25.8%) |
| 45 to 54 Years | 153 (10.2%) | 78 (5.3%) |
| 55 to 64 Years | 146 (9.3%) | 294 (18.3%) |
| 65 to 74 Years | 46 (5.3%) | 149 (12.3%) |
| 75 Years and over | 35 (6.7%) | 161 (15.9%) |
| Total | 1,578 (12.2%) | 2,152 (16.3%) |
Income Above Poverty by Sex and Age in Marshalltown
According to the poverty statistics in Marshalltown, males aged 65 to 74 years and females aged 5 years are the age groups that are most secure financially, with 94.7% of males and 100.0% of females in these age groups living above the poverty line.
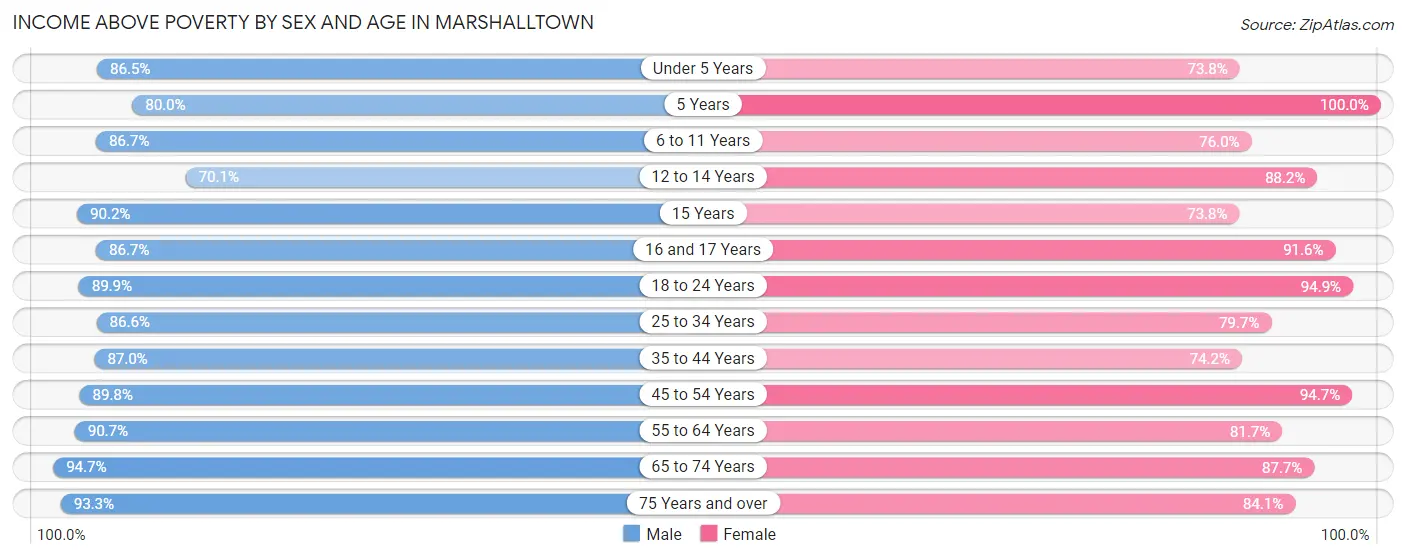
| Age Bracket | Male | Female |
| Under 5 Years | 784 (86.5%) | 663 (73.8%) |
| 5 Years | 364 (80.0%) | 114 (100.0%) |
| 6 to 11 Years | 988 (86.7%) | 1,027 (76.0%) |
| 12 to 14 Years | 408 (70.1%) | 525 (88.2%) |
| 15 Years | 222 (90.2%) | 135 (73.8%) |
| 16 and 17 Years | 346 (86.7%) | 359 (91.6%) |
| 18 to 24 Years | 1,242 (89.9%) | 1,219 (94.9%) |
| 25 to 34 Years | 1,457 (86.6%) | 1,362 (79.7%) |
| 35 to 44 Years | 1,469 (87.0%) | 1,000 (74.2%) |
| 45 to 54 Years | 1,344 (89.8%) | 1,391 (94.7%) |
| 55 to 64 Years | 1,419 (90.7%) | 1,313 (81.7%) |
| 65 to 74 Years | 819 (94.7%) | 1,059 (87.7%) |
| 75 Years and over | 485 (93.3%) | 853 (84.1%) |
| Total | 11,347 (87.8%) | 11,020 (83.7%) |
Income Below Poverty Among Married-Couple Families in Marshalltown
The poverty statistics for married-couple families in Marshalltown show that 7.3% or 366 of the total 4,986 families live below the poverty line. Families with 5 or more children have the highest poverty rate of 37.1%, comprising of 26 families. On the other hand, families with no children have the lowest poverty rate of 2.7%, which includes 63 families.
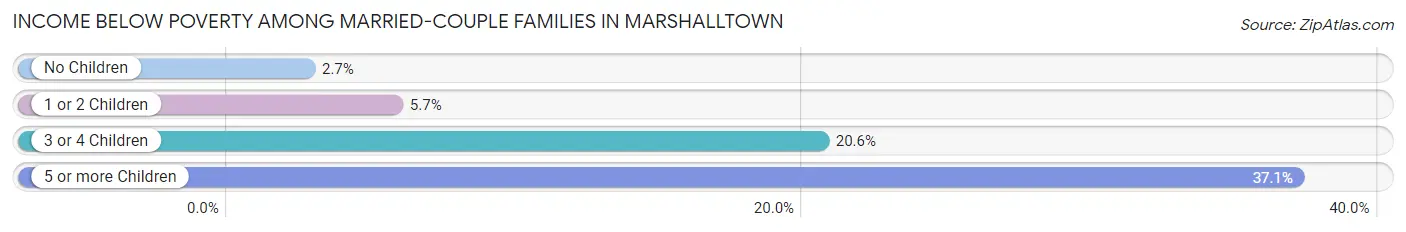
| Children | Above Poverty | Below Poverty |
| No Children | 2,289 (97.3%) | 63 (2.7%) |
| 1 or 2 Children | 1,592 (94.3%) | 97 (5.7%) |
| 3 or 4 Children | 695 (79.4%) | 180 (20.6%) |
| 5 or more Children | 44 (62.9%) | 26 (37.1%) |
| Total | 4,620 (92.7%) | 366 (7.3%) |
Income Below Poverty Among Single-Parent Households in Marshalltown
According to the poverty data in Marshalltown, 5.2% or 25 single-father households and 44.0% or 367 single-mother households are living below the poverty line. Among single-father households, those with no children have the highest poverty rate, with 16 households (9.8%) experiencing poverty. Likewise, among single-mother households, those with 1 or 2 children have the highest poverty rate, with 346 households (59.2%) falling below the poverty line.

| Children | Single Father | Single Mother |
| No Children | 16 (9.8%) | 17 (9.6%) |
| 1 or 2 Children | 0 (0.0%) | 346 (59.2%) |
| 3 or 4 Children | 9 (8.8%) | 4 (7.8%) |
| 5 or more Children | 0 (0.0%) | 0 (0.0%) |
| Total | 25 (5.2%) | 367 (44.0%) |
Income Below Poverty Among Married-Couple vs Single-Parent Households in Marshalltown
The poverty data for Marshalltown shows that 366 of the married-couple family households (7.3%) and 392 of the single-parent households (29.8%) are living below the poverty level. Within the married-couple family households, those with 5 or more children have the highest poverty rate, with 26 households (37.1%) falling below the poverty line. Among the single-parent households, those with 1 or 2 children have the highest poverty rate, with 346 household (43.2%) living below poverty.
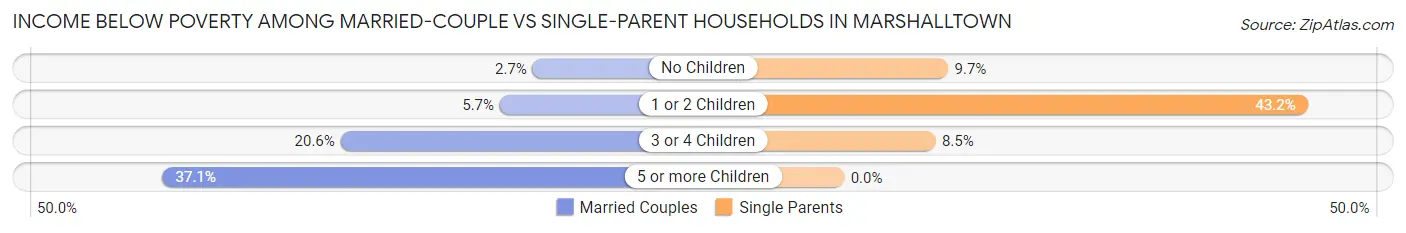
| Children | Married-Couple Families | Single-Parent Households |
| No Children | 63 (2.7%) | 33 (9.7%) |
| 1 or 2 Children | 97 (5.7%) | 346 (43.2%) |
| 3 or 4 Children | 180 (20.6%) | 13 (8.5%) |
| 5 or more Children | 26 (37.1%) | 0 (0.0%) |
| Total | 366 (7.3%) | 392 (29.8%) |
Race in Marshalltown
The most populous races in Marshalltown are White / Caucasian (19,649 | 71.4%), Hispanic or Latino (9,234 | 33.6%), and Two or more Races (3,224 | 11.7%).
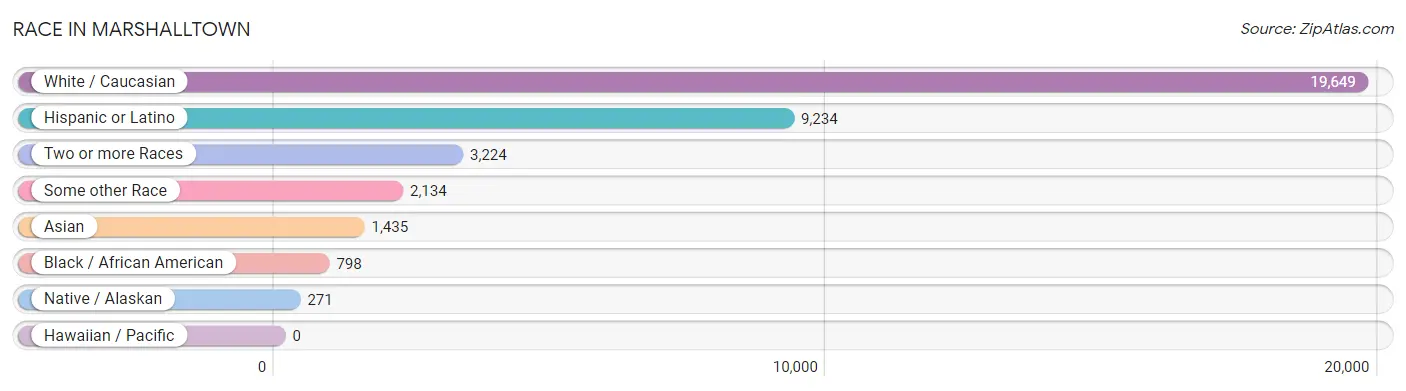
| Race | # Population | % Population |
| Asian | 1,435 | 5.2% |
| Black / African American | 798 | 2.9% |
| Hawaiian / Pacific | 0 | 0.0% |
| Hispanic or Latino | 9,234 | 33.6% |
| Native / Alaskan | 271 | 1.0% |
| White / Caucasian | 19,649 | 71.4% |
| Two or more Races | 3,224 | 11.7% |
| Some other Race | 2,134 | 7.8% |
| Total | 27,511 | 100.0% |
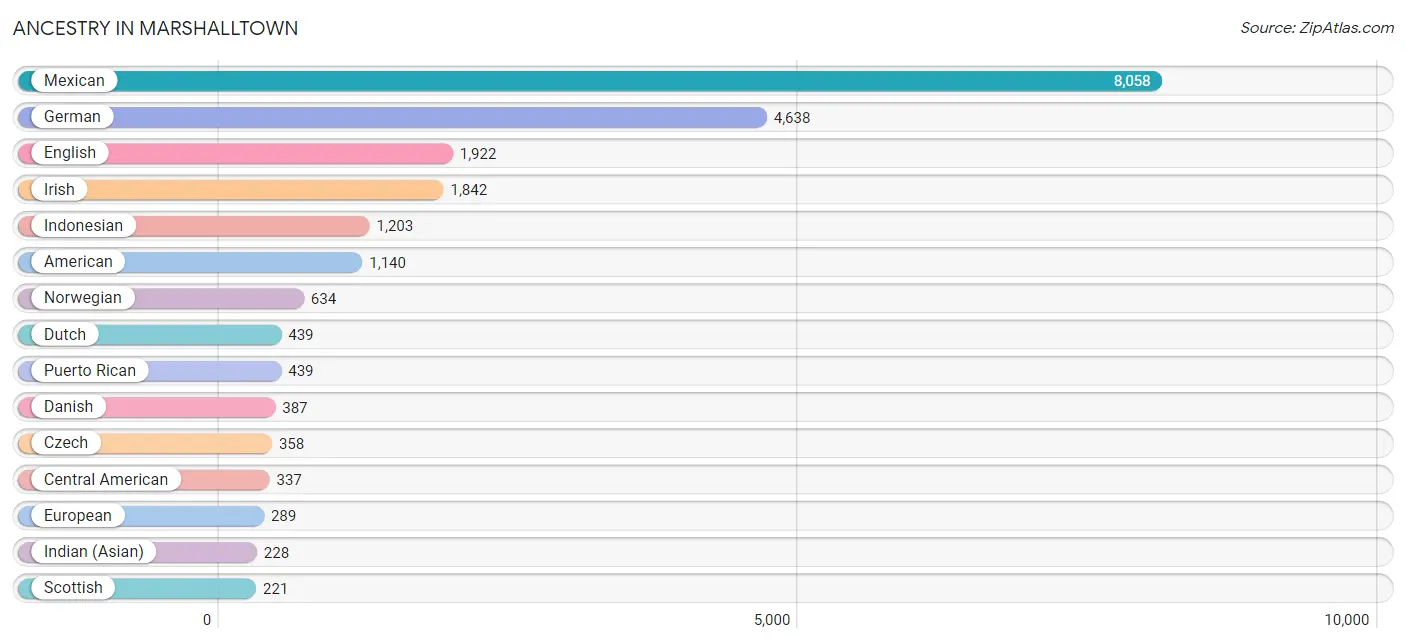
Ancestry in Marshalltown
The most populous ancestries reported in Marshalltown are Mexican (8,058 | 29.3%), German (4,638 | 16.9%), English (1,922 | 7.0%), Irish (1,842 | 6.7%), and Indonesian (1,203 | 4.4%), together accounting for 64.2% of all Marshalltown residents.
| Ancestry | # Population | % Population |
| African | 34 | 0.1% |
| American | 1,140 | 4.1% |
| Arab | 90 | 0.3% |
| Austrian | 37 | 0.1% |
| British | 108 | 0.4% |
| Central American | 337 | 1.2% |
| Central American Indian | 108 | 0.4% |
| Chippewa | 15 | 0.1% |
| Costa Rican | 10 | 0.0% |
| Croatian | 1 | 0.0% |
| Cuban | 26 | 0.1% |
| Czech | 358 | 1.3% |
| Czechoslovakian | 19 | 0.1% |
| Danish | 387 | 1.4% |
| Delaware | 11 | 0.0% |
| Dominican | 209 | 0.8% |
| Dutch | 439 | 1.6% |
| Eastern European | 6 | 0.0% |
| English | 1,922 | 7.0% |
| European | 289 | 1.1% |
| French | 203 | 0.7% |
| French Canadian | 17 | 0.1% |
| German | 4,638 | 16.9% |
| Greek | 12 | 0.0% |
| Guatemalan | 120 | 0.4% |
| Honduran | 115 | 0.4% |
| Hungarian | 9 | 0.0% |
| Indian (Asian) | 228 | 0.8% |
| Indonesian | 1,203 | 4.4% |
| Irish | 1,842 | 6.7% |
| Italian | 174 | 0.6% |
| Lebanese | 10 | 0.0% |
| Lithuanian | 7 | 0.0% |
| Luxembourger | 31 | 0.1% |
| Malaysian | 14 | 0.1% |
| Mexican | 8,058 | 29.3% |
| Mexican American Indian | 169 | 0.6% |
| Moroccan | 80 | 0.3% |
| Navajo | 37 | 0.1% |
| Nicaraguan | 7 | 0.0% |
| Nigerian | 9 | 0.0% |
| Northern European | 29 | 0.1% |
| Norwegian | 634 | 2.3% |
| Panamanian | 35 | 0.1% |
| Pennsylvania German | 16 | 0.1% |
| Peruvian | 21 | 0.1% |
| Polish | 168 | 0.6% |
| Portuguese | 44 | 0.2% |
| Potawatomi | 8 | 0.0% |
| Puerto Rican | 439 | 1.6% |
| Russian | 17 | 0.1% |
| Salvadoran | 50 | 0.2% |
| Scandinavian | 122 | 0.4% |
| Scotch-Irish | 144 | 0.5% |
| Scottish | 221 | 0.8% |
| Serbian | 7 | 0.0% |
| Sioux | 7 | 0.0% |
| Slovak | 33 | 0.1% |
| Somali | 1 | 0.0% |
| South American | 61 | 0.2% |
| South American Indian | 7 | 0.0% |
| Subsaharan African | 161 | 0.6% |
| Sudanese | 9 | 0.0% |
| Swedish | 216 | 0.8% |
| Swiss | 46 | 0.2% |
| Ukrainian | 8 | 0.0% |
| Venezuelan | 40 | 0.2% |
| Welsh | 70 | 0.3% |
| West Indian | 37 | 0.1% | View All 69 Rows |
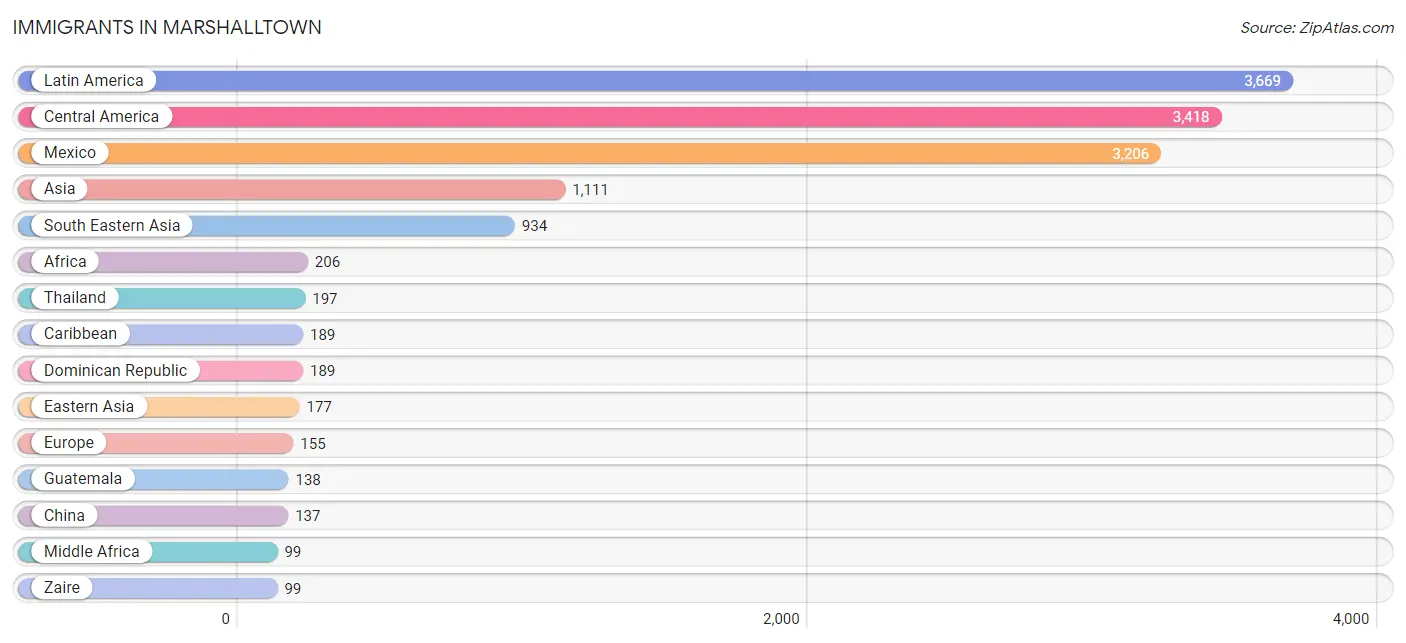
Immigrants in Marshalltown
The most numerous immigrant groups reported in Marshalltown came from Latin America (3,669 | 13.3%), Central America (3,418 | 12.4%), Mexico (3,206 | 11.7%), Asia (1,111 | 4.0%), and South Eastern Asia (934 | 3.4%), together accounting for 44.9% of all Marshalltown residents.
| Immigration Origin | # Population | % Population |
| Africa | 206 | 0.7% |
| Asia | 1,111 | 4.0% |
| Canada | 13 | 0.1% |
| Caribbean | 189 | 0.7% |
| Central America | 3,418 | 12.4% |
| Chile | 42 | 0.2% |
| China | 137 | 0.5% |
| Costa Rica | 10 | 0.0% |
| Czechoslovakia | 9 | 0.0% |
| Dominican Republic | 189 | 0.7% |
| Eastern Africa | 9 | 0.0% |
| Eastern Asia | 177 | 0.6% |
| Eastern Europe | 25 | 0.1% |
| El Salvador | 35 | 0.1% |
| England | 42 | 0.2% |
| Europe | 155 | 0.6% |
| Guatemala | 138 | 0.5% |
| Honduras | 29 | 0.1% |
| Indonesia | 8 | 0.0% |
| Ireland | 12 | 0.0% |
| Kenya | 9 | 0.0% |
| Korea | 40 | 0.2% |
| Laos | 26 | 0.1% |
| Latin America | 3,669 | 13.3% |
| Malaysia | 11 | 0.0% |
| Mexico | 3,206 | 11.7% |
| Middle Africa | 99 | 0.4% |
| Morocco | 80 | 0.3% |
| Nigeria | 9 | 0.0% |
| Northern Africa | 80 | 0.3% |
| Northern Europe | 82 | 0.3% |
| Poland | 16 | 0.1% |
| Portugal | 10 | 0.0% |
| South America | 62 | 0.2% |
| South Eastern Asia | 934 | 3.4% |
| Southern Europe | 10 | 0.0% |
| Thailand | 197 | 0.7% |
| Venezuela | 20 | 0.1% |
| Western Africa | 18 | 0.1% |
| Western Europe | 38 | 0.1% |
| Zaire | 99 | 0.4% | View All 41 Rows |
Sex and Age in Marshalltown
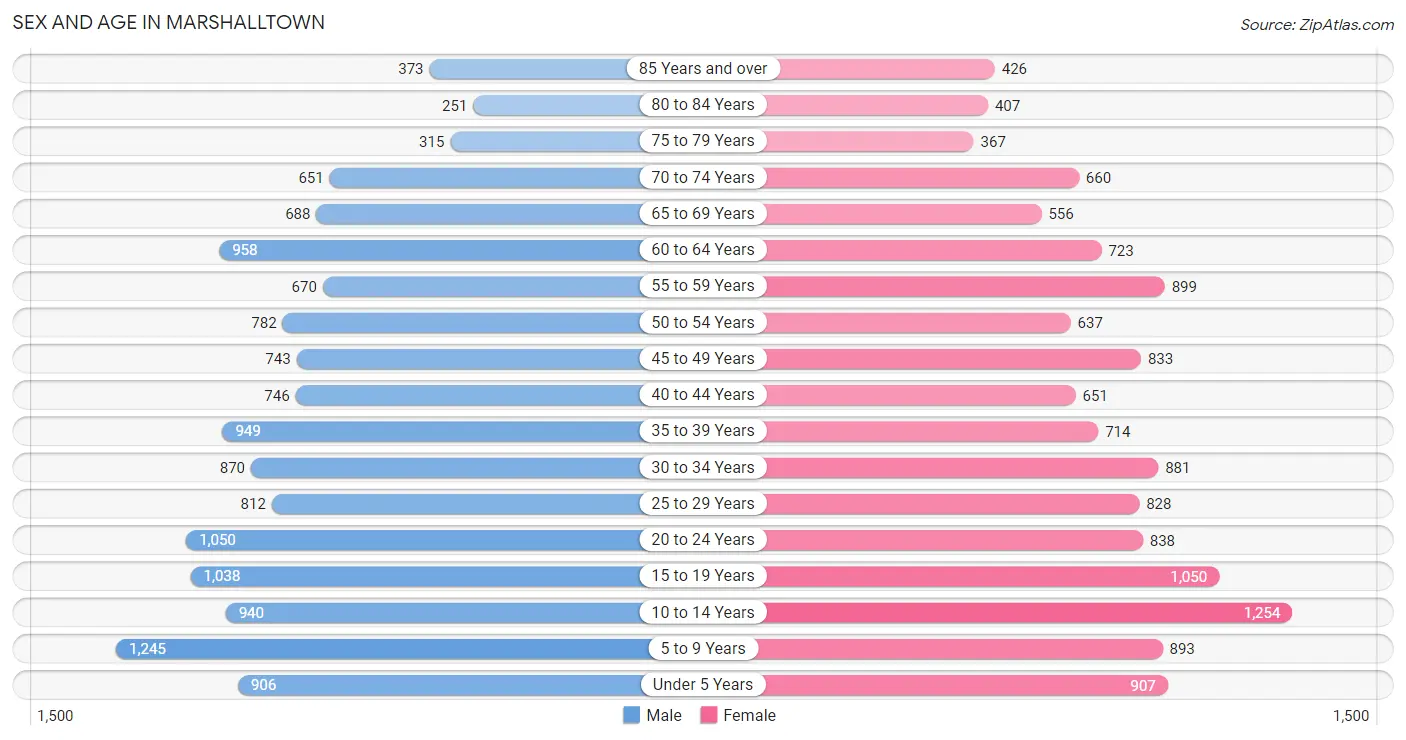
Sex and Age in Marshalltown
The most populous age groups in Marshalltown are 5 to 9 Years (1,245 | 8.9%) for men and 10 to 14 Years (1,254 | 9.3%) for women.
| Age Bracket | Male | Female |
| Under 5 Years | 906 (6.5%) | 907 (6.7%) |
| 5 to 9 Years | 1,245 (8.9%) | 893 (6.6%) |
| 10 to 14 Years | 940 (6.7%) | 1,254 (9.3%) |
| 15 to 19 Years | 1,038 (7.4%) | 1,050 (7.8%) |
| 20 to 24 Years | 1,050 (7.5%) | 838 (6.2%) |
| 25 to 29 Years | 812 (5.8%) | 828 (6.1%) |
| 30 to 34 Years | 870 (6.2%) | 881 (6.5%) |
| 35 to 39 Years | 949 (6.8%) | 714 (5.3%) |
| 40 to 44 Years | 746 (5.3%) | 651 (4.8%) |
| 45 to 49 Years | 743 (5.3%) | 833 (6.2%) |
| 50 to 54 Years | 782 (5.6%) | 637 (4.7%) |
| 55 to 59 Years | 670 (4.8%) | 899 (6.7%) |
| 60 to 64 Years | 958 (6.9%) | 723 (5.3%) |
| 65 to 69 Years | 688 (4.9%) | 556 (4.1%) |
| 70 to 74 Years | 651 (4.6%) | 660 (4.9%) |
| 75 to 79 Years | 315 (2.2%) | 367 (2.7%) |
| 80 to 84 Years | 251 (1.8%) | 407 (3.0%) |
| 85 Years and over | 373 (2.7%) | 426 (3.2%) |
| Total | 13,987 (100.0%) | 13,524 (100.0%) |
Families and Households in Marshalltown
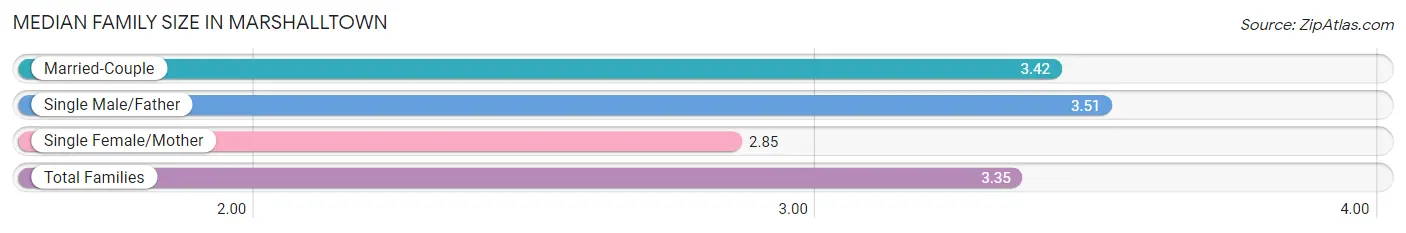
Median Family Size in Marshalltown
The median family size in Marshalltown is 3.35 persons per family, with single male/father families (481 | 7.6%) accounting for the largest median family size of 3.51 persons per family. On the other hand, single female/mother families (834 | 13.2%) represent the smallest median family size with 2.85 persons per family.
| Family Type | # Families | Family Size |
| Married-Couple | 4,986 (79.1%) | 3.42 |
| Single Male/Father | 481 (7.6%) | 3.51 |
| Single Female/Mother | 834 (13.2%) | 2.85 |
| Total Families | 6,301 (100.0%) | 3.35 |
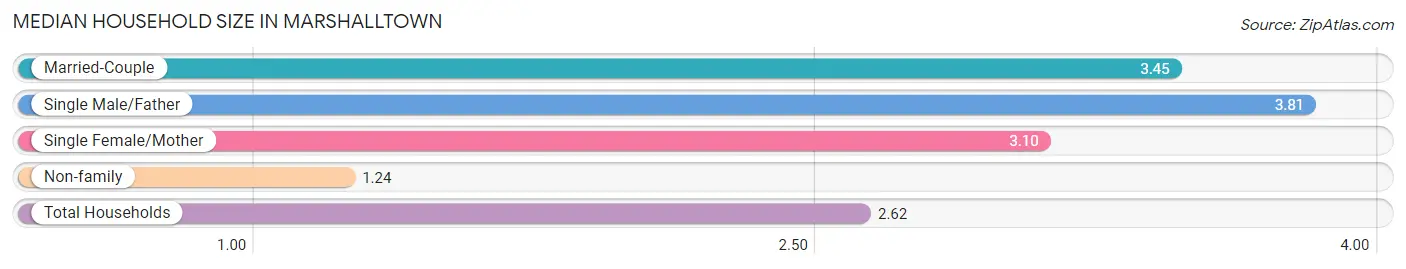
Median Household Size in Marshalltown
The median household size in Marshalltown is 2.62 persons per household, with single male/father households (481 | 4.8%) accounting for the largest median household size of 3.81 persons per household. non-family households (3,683 | 36.9%) represent the smallest median household size with 1.24 persons per household.
| Household Type | # Households | Household Size |
| Married-Couple | 4,986 (49.9%) | 3.45 |
| Single Male/Father | 481 (4.8%) | 3.81 |
| Single Female/Mother | 834 (8.4%) | 3.10 |
| Non-family | 3,683 (36.9%) | 1.24 |
| Total Households | 9,984 (100.0%) | 2.62 |
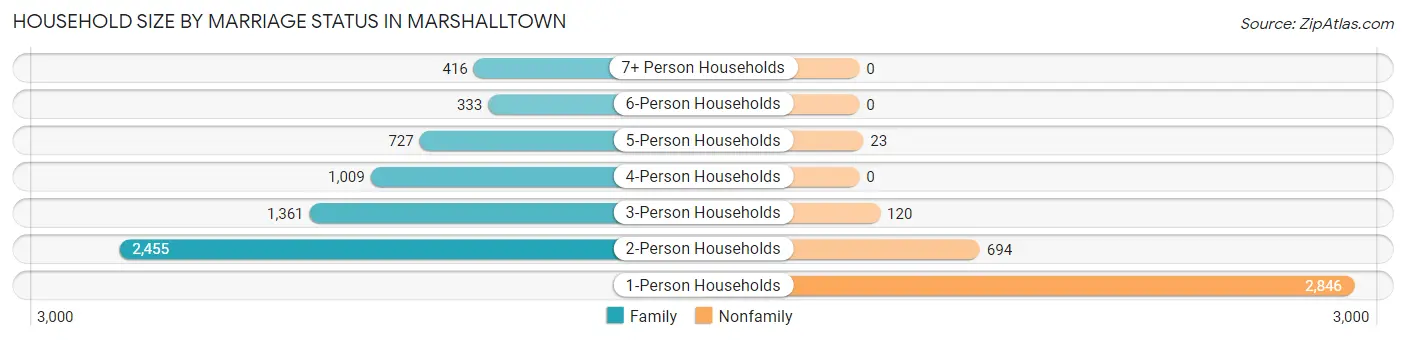
Household Size by Marriage Status in Marshalltown
Out of a total of 9,984 households in Marshalltown, 6,301 (63.1%) are family households, while 3,683 (36.9%) are nonfamily households. The most numerous type of family households are 2-person households, comprising 2,455, and the most common type of nonfamily households are 1-person households, comprising 2,846.
| Household Size | Family Households | Nonfamily Households |
| 1-Person Households | - | 2,846 (28.5%) |
| 2-Person Households | 2,455 (24.6%) | 694 (7.0%) |
| 3-Person Households | 1,361 (13.6%) | 120 (1.2%) |
| 4-Person Households | 1,009 (10.1%) | 0 (0.0%) |
| 5-Person Households | 727 (7.3%) | 23 (0.2%) |
| 6-Person Households | 333 (3.3%) | 0 (0.0%) |
| 7+ Person Households | 416 (4.2%) | 0 (0.0%) |
| Total | 6,301 (63.1%) | 3,683 (36.9%) |
Female Fertility in Marshalltown
Fertility by Age in Marshalltown
Average fertility rate in Marshalltown is 72.0 births per 1,000 women. Women in the age bracket of 20 to 34 years have the highest fertility rate with 135.0 births per 1,000 women. Women in the age bracket of 20 to 34 years acount for 80.0% of all women with births.
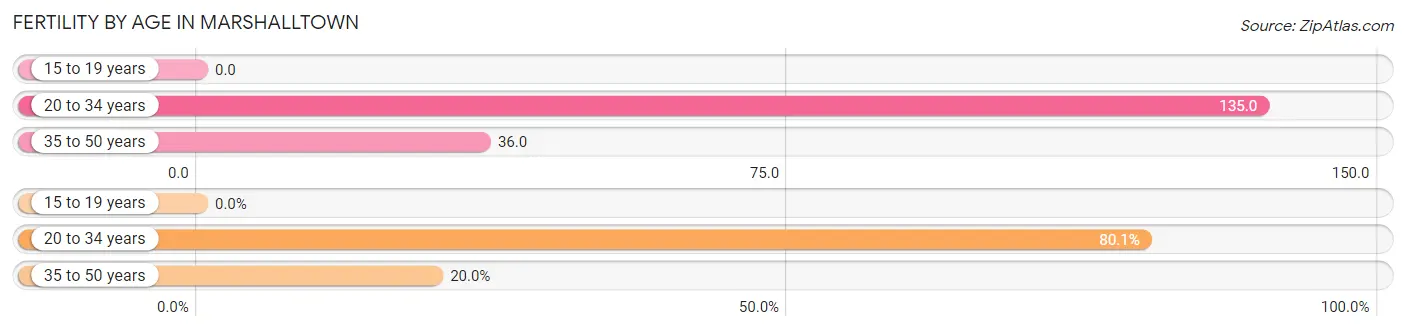
| Age Bracket | Women with Births | Births / 1,000 Women |
| 15 to 19 years | 0 (0.0%) | 0.0 |
| 20 to 34 years | 345 (80.0%) | 135.0 |
| 35 to 50 years | 86 (20.0%) | 36.0 |
| Total | 431 (100.0%) | 72.0 |
Fertility by Age by Marriage Status in Marshalltown
75.9% of women with births (431) in Marshalltown are married. The highest percentage of unmarried women with births falls into 20 to 34 years age bracket with 30.1% of them unmarried at the time of birth, while the lowest percentage of unmarried women with births belong to 35 to 50 years age bracket with 0.0% of them unmarried.
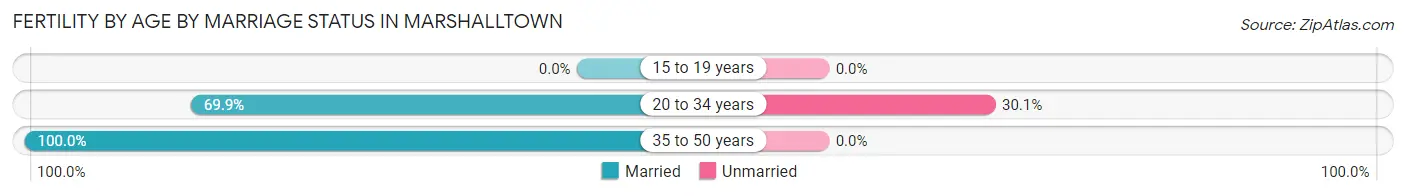
| Age Bracket | Married | Unmarried |
| 15 to 19 years | 0 (0.0%) | 0 (0.0%) |
| 20 to 34 years | 241 (69.9%) | 104 (30.1%) |
| 35 to 50 years | 86 (100.0%) | 0 (0.0%) |
| Total | 327 (75.9%) | 104 (24.1%) |
Fertility by Education in Marshalltown
Average fertility rate in Marshalltown is 72.0 births per 1,000 women. Women with the education attainment of graduate degree have the highest fertility rate of 129.0 births per 1,000 women, while women with the education attainment of less than high school have the lowest fertility at 61.0 births per 1,000 women. Women with the education attainment of college or associate's degree represent 30.2% of all women with births.
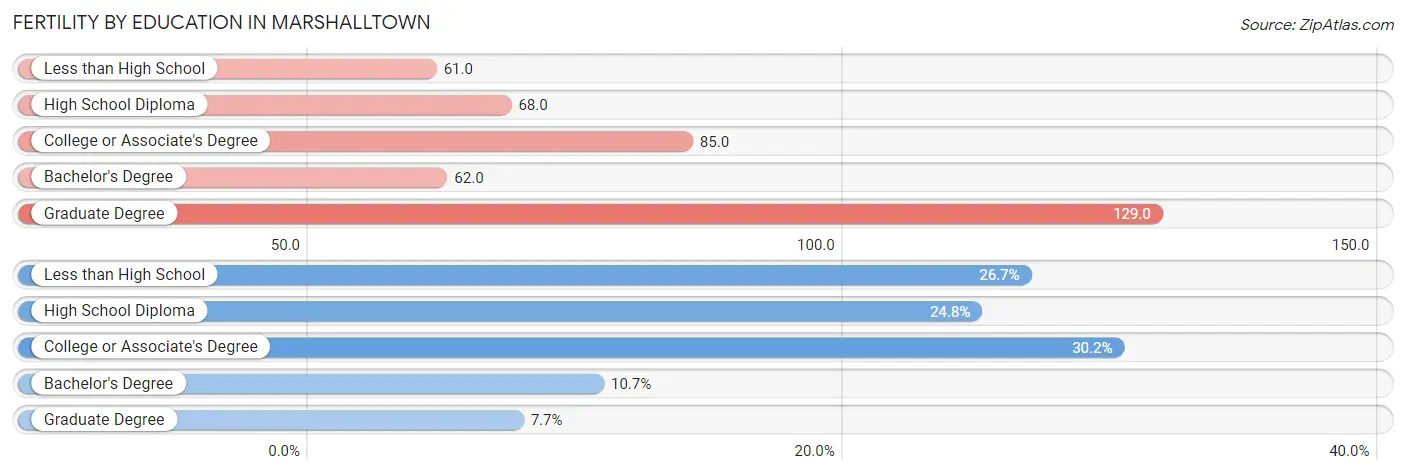
| Educational Attainment | Women with Births | Births / 1,000 Women |
| Less than High School | 115 (26.7%) | 61.0 |
| High School Diploma | 107 (24.8%) | 68.0 |
| College or Associate's Degree | 130 (30.2%) | 85.0 |
| Bachelor's Degree | 46 (10.7%) | 62.0 |
| Graduate Degree | 33 (7.7%) | 129.0 |
| Total | 431 (100.0%) | 72.0 |
Fertility by Education by Marriage Status in Marshalltown
24.1% of women with births in Marshalltown are unmarried. Women with the educational attainment of college or associate's degree are most likely to be married with 100.0% of them married at childbirth, while women with the educational attainment of bachelor's degree are least likely to be married with 69.6% of them unmarried at childbirth.
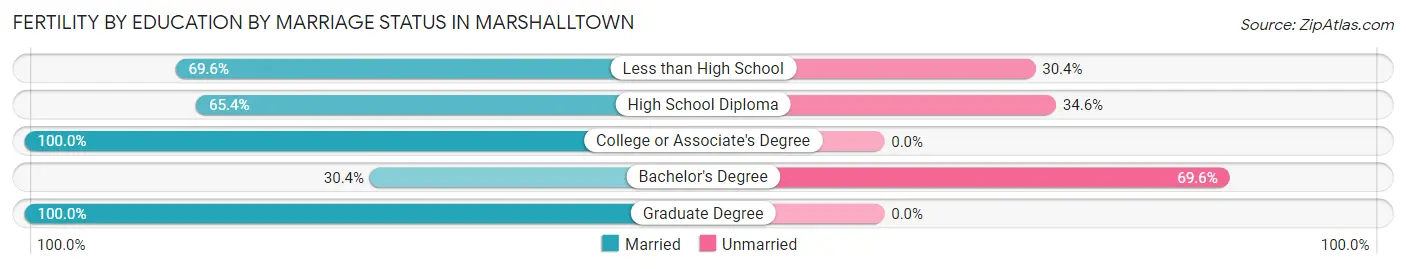
| Educational Attainment | Married | Unmarried |
| Less than High School | 80 (69.6%) | 35 (30.4%) |
| High School Diploma | 70 (65.4%) | 37 (34.6%) |
| College or Associate's Degree | 130 (100.0%) | 0 (0.0%) |
| Bachelor's Degree | 14 (30.4%) | 32 (69.6%) |
| Graduate Degree | 33 (100.0%) | 0 (0.0%) |
| Total | 327 (75.9%) | 104 (24.1%) |
Employment Characteristics in Marshalltown
Employment by Class of Employer in Marshalltown
Among the 12,504 employed individuals in Marshalltown, private company employees (9,455 | 75.6%), local government employees (785 | 6.3%), and not-for-profit organizations (706 | 5.7%) make up the most common classes of employment.
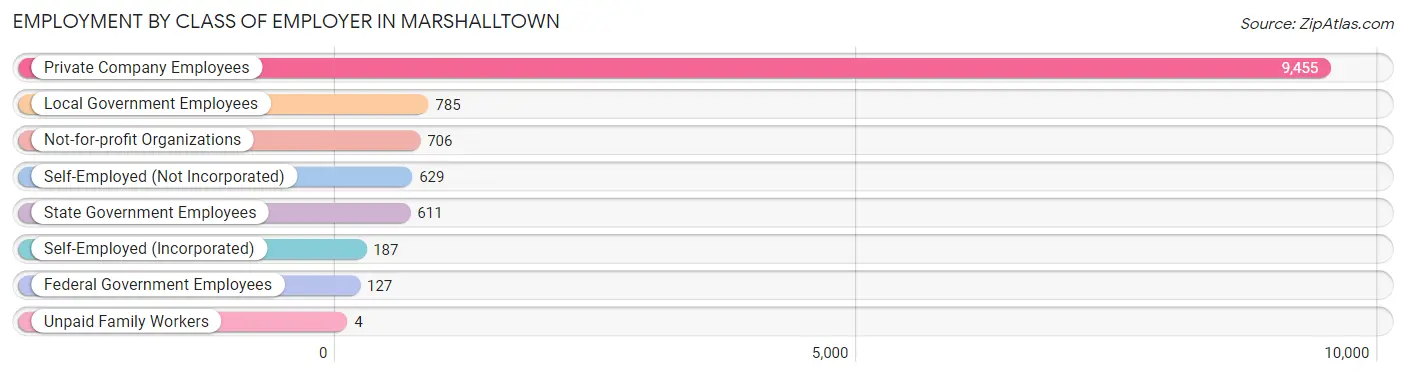
| Employer Class | # Employees | % Employees |
| Private Company Employees | 9,455 | 75.6% |
| Self-Employed (Incorporated) | 187 | 1.5% |
| Self-Employed (Not Incorporated) | 629 | 5.0% |
| Not-for-profit Organizations | 706 | 5.7% |
| Local Government Employees | 785 | 6.3% |
| State Government Employees | 611 | 4.9% |
| Federal Government Employees | 127 | 1.0% |
| Unpaid Family Workers | 4 | 0.0% |
| Total | 12,504 | 100.0% |
Employment Status by Age in Marshalltown
According to the labor force statistics for Marshalltown, out of the total population over 16 years of age (20,932), 65.9% or 13,794 individuals are in the labor force, with 6.8% or 938 of them unemployed. The age group with the highest labor force participation rate is 20 to 24 years, with 93.0% or 1,756 individuals in the labor force. Within the labor force, the 16 to 19 years age range has the highest percentage of unemployed individuals, with 23.0% or 193 of them being unemployed.
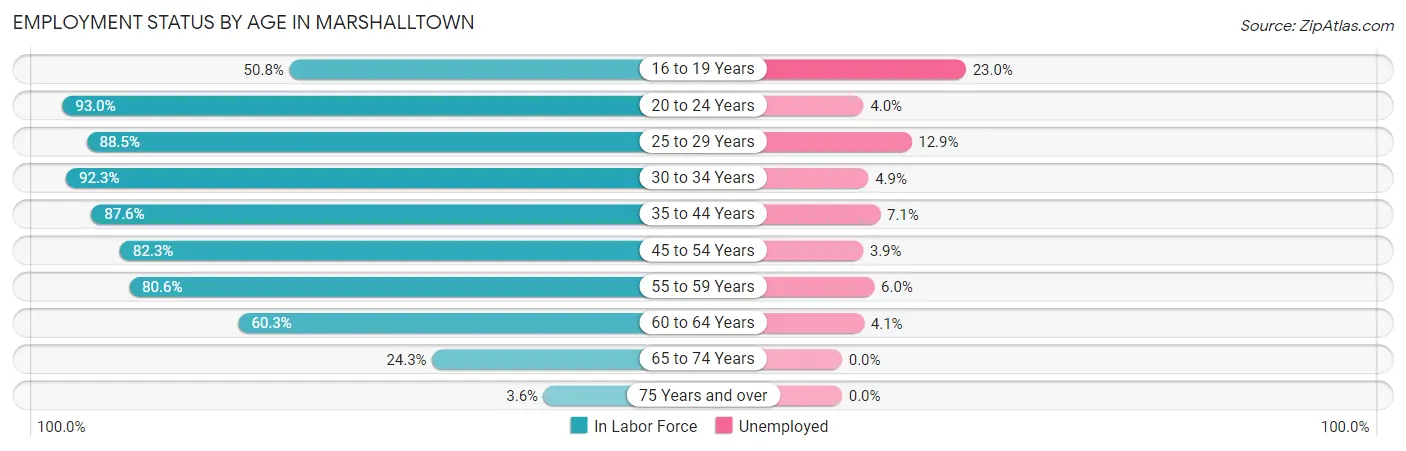
| Age Bracket | In Labor Force | Unemployed |
| 16 to 19 Years | 840 (50.8%) | 193 (23.0%) |
| 20 to 24 Years | 1,756 (93.0%) | 70 (4.0%) |
| 25 to 29 Years | 1,451 (88.5%) | 187 (12.9%) |
| 30 to 34 Years | 1,616 (92.3%) | 79 (4.9%) |
| 35 to 44 Years | 2,681 (87.6%) | 190 (7.1%) |
| 45 to 54 Years | 2,465 (82.3%) | 96 (3.9%) |
| 55 to 59 Years | 1,265 (80.6%) | 76 (6.0%) |
| 60 to 64 Years | 1,014 (60.3%) | 42 (4.1%) |
| 65 to 74 Years | 621 (24.3%) | 0 (0.0%) |
| 75 Years and over | 77 (3.6%) | 0 (0.0%) |
| Total | 13,794 (65.9%) | 938 (6.8%) |
Employment Status by Educational Attainment in Marshalltown
According to labor force statistics for Marshalltown, 82.7% of individuals (10,500) out of the total population between 25 and 64 years of age (12,696) are in the labor force, with 6.4% or 672 of them being unemployed. The group with the highest labor force participation rate are those with the educational attainment of bachelor's degree or higher, with 89.2% or 1,978 individuals in the labor force. Within the labor force, individuals with less than high school education have the highest percentage of unemployment, with 9.1% or 210 of them being unemployed.
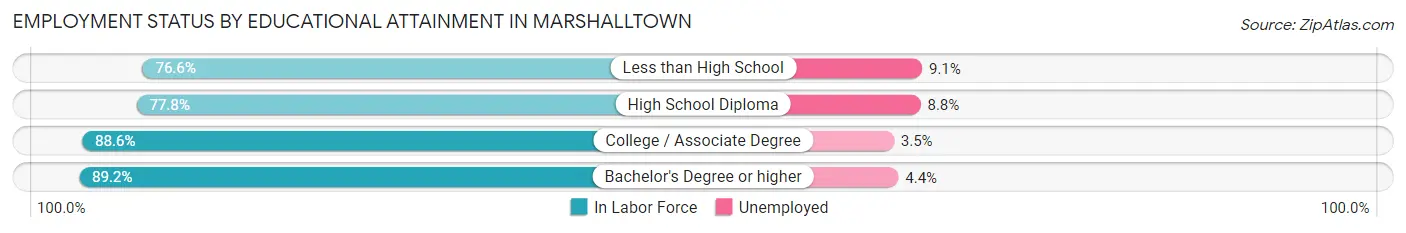
| Educational Attainment | In Labor Force | Unemployed |
| Less than High School | 2,306 (76.6%) | 274 (9.1%) |
| High School Diploma | 2,932 (77.8%) | 332 (8.8%) |
| College / Associate Degree | 3,276 (88.6%) | 129 (3.5%) |
| Bachelor's Degree or higher | 1,978 (89.2%) | 98 (4.4%) |
| Total | 10,500 (82.7%) | 813 (6.4%) |
Employment Occupations by Sex in Marshalltown
Management, Business, Science and Arts Occupations
The most common Management, Business, Science and Arts occupations in Marshalltown are Community & Social Service (1,153 | 9.0%), Education Instruction & Library (803 | 6.2%), Management (701 | 5.4%), Computers, Engineering & Science (607 | 4.7%), and Health Diagnosing & Treating (549 | 4.3%).
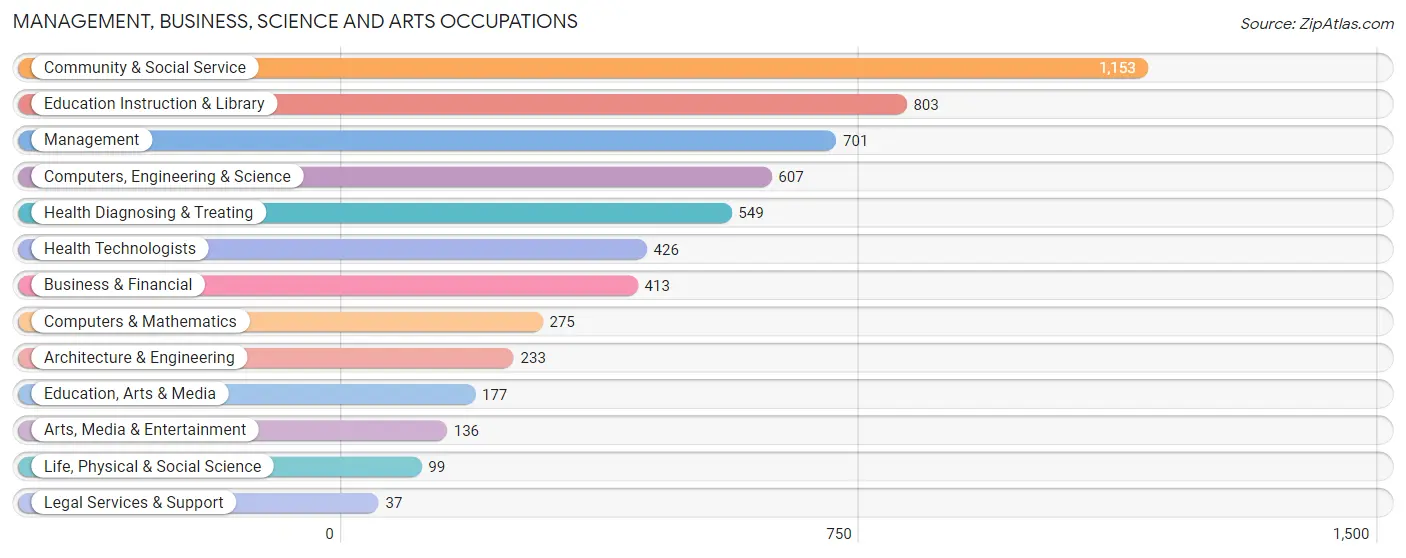
Management, Business, Science and Arts Occupations by Sex
Within the Management, Business, Science and Arts occupations in Marshalltown, the most male-oriented occupations are Architecture & Engineering (77.7%), Business & Financial (65.6%), and Computers, Engineering & Science (60.0%), while the most female-oriented occupations are Health Diagnosing & Treating (73.4%), Education Instruction & Library (72.0%), and Health Technologists (69.3%).
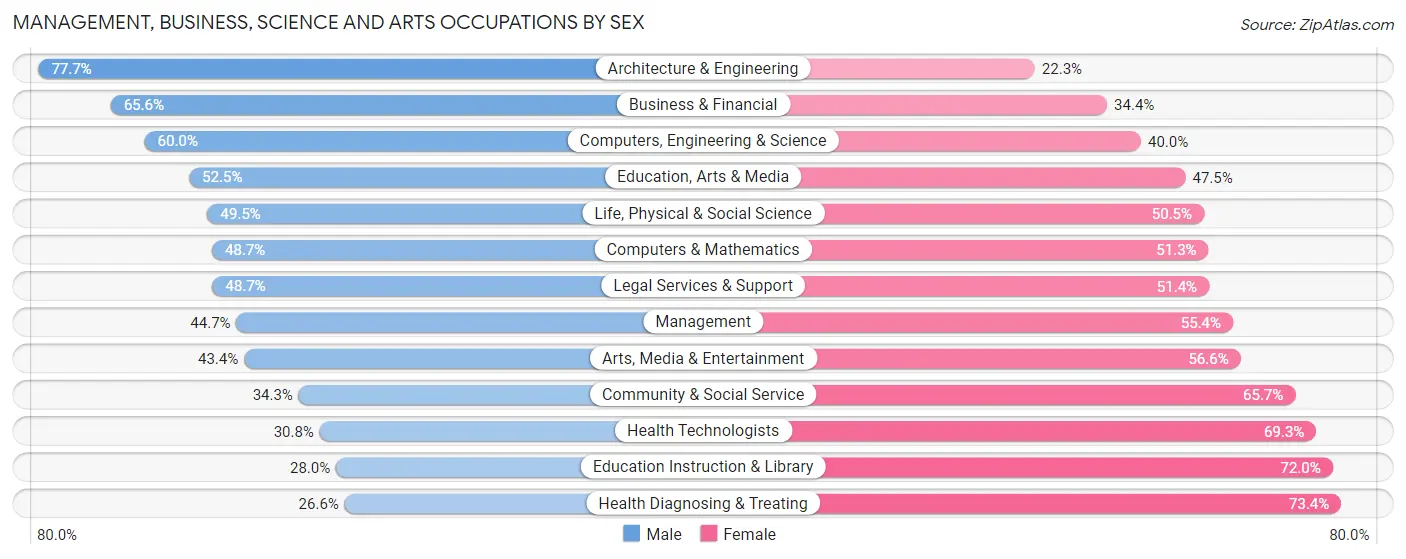
| Occupation | Male | Female |
| Management | 313 (44.7%) | 388 (55.3%) |
| Business & Financial | 271 (65.6%) | 142 (34.4%) |
| Computers, Engineering & Science | 364 (60.0%) | 243 (40.0%) |
| Computers & Mathematics | 134 (48.7%) | 141 (51.3%) |
| Architecture & Engineering | 181 (77.7%) | 52 (22.3%) |
| Life, Physical & Social Science | 49 (49.5%) | 50 (50.5%) |
| Community & Social Service | 395 (34.3%) | 758 (65.7%) |
| Education, Arts & Media | 93 (52.5%) | 84 (47.5%) |
| Legal Services & Support | 18 (48.6%) | 19 (51.3%) |
| Education Instruction & Library | 225 (28.0%) | 578 (72.0%) |
| Arts, Media & Entertainment | 59 (43.4%) | 77 (56.6%) |
| Health Diagnosing & Treating | 146 (26.6%) | 403 (73.4%) |
| Health Technologists | 131 (30.7%) | 295 (69.3%) |
| Total (Category) | 1,489 (43.5%) | 1,934 (56.5%) |
| Total (Overall) | 6,995 (54.4%) | 5,858 (45.6%) |
Services Occupations
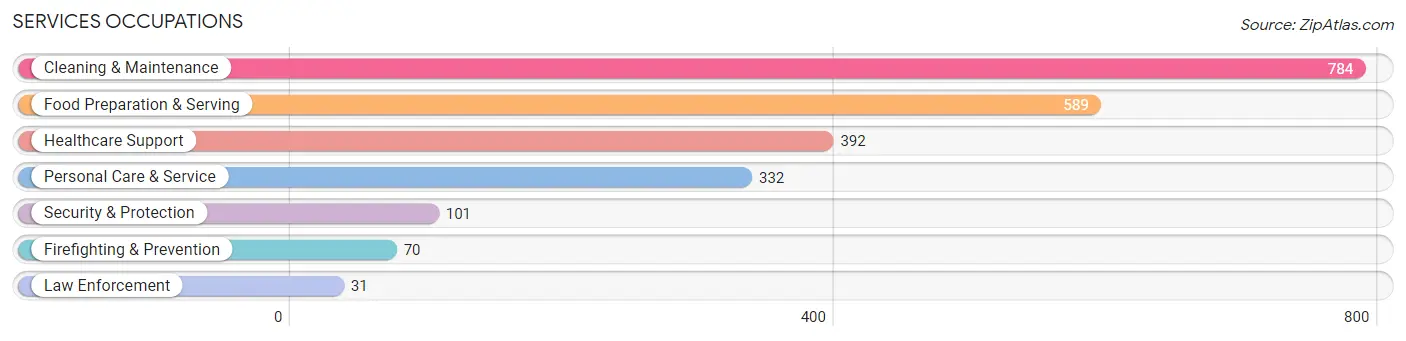
The most common Services occupations in Marshalltown are Cleaning & Maintenance (784 | 6.1%), Food Preparation & Serving (589 | 4.6%), Healthcare Support (392 | 3.0%), Personal Care & Service (332 | 2.6%), and Security & Protection (101 | 0.8%).
Services Occupations by Sex
Within the Services occupations in Marshalltown, the most male-oriented occupations are Law Enforcement (100.0%), Cleaning & Maintenance (63.8%), and Security & Protection (45.5%), while the most female-oriented occupations are Healthcare Support (100.0%), Personal Care & Service (90.7%), and Firefighting & Prevention (78.6%).
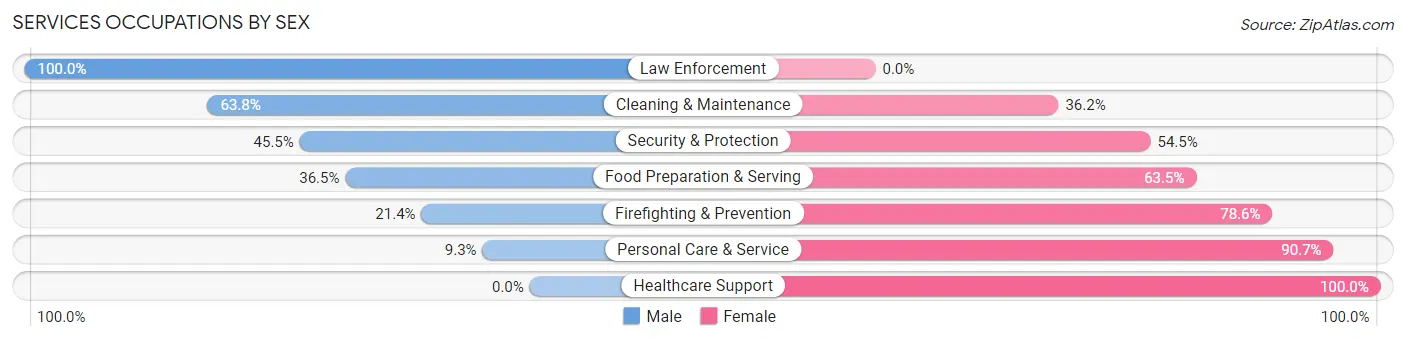
| Occupation | Male | Female |
| Healthcare Support | 0 (0.0%) | 392 (100.0%) |
| Security & Protection | 46 (45.5%) | 55 (54.5%) |
| Firefighting & Prevention | 15 (21.4%) | 55 (78.6%) |
| Law Enforcement | 31 (100.0%) | 0 (0.0%) |
| Food Preparation & Serving | 215 (36.5%) | 374 (63.5%) |
| Cleaning & Maintenance | 500 (63.8%) | 284 (36.2%) |
| Personal Care & Service | 31 (9.3%) | 301 (90.7%) |
| Total (Category) | 792 (36.0%) | 1,406 (64.0%) |
| Total (Overall) | 6,995 (54.4%) | 5,858 (45.6%) |
Sales and Office Occupations
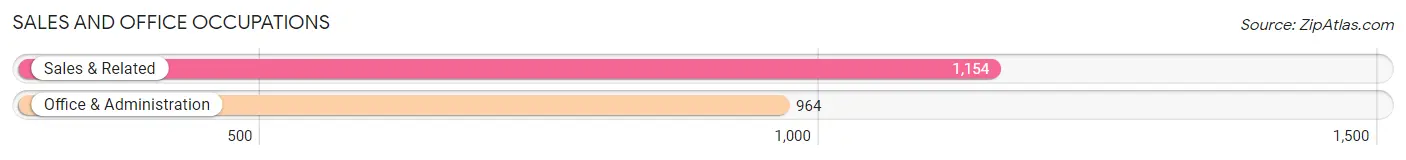
The most common Sales and Office occupations in Marshalltown are Sales & Related (1,154 | 9.0%), and Office & Administration (964 | 7.5%).
Sales and Office Occupations by Sex
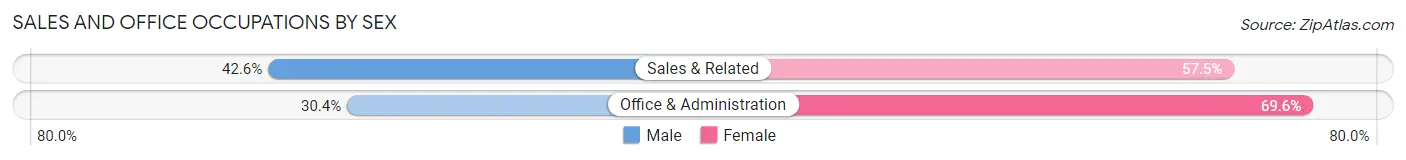
| Occupation | Male | Female |
| Sales & Related | 491 (42.5%) | 663 (57.5%) |
| Office & Administration | 293 (30.4%) | 671 (69.6%) |
| Total (Category) | 784 (37.0%) | 1,334 (63.0%) |
| Total (Overall) | 6,995 (54.4%) | 5,858 (45.6%) |
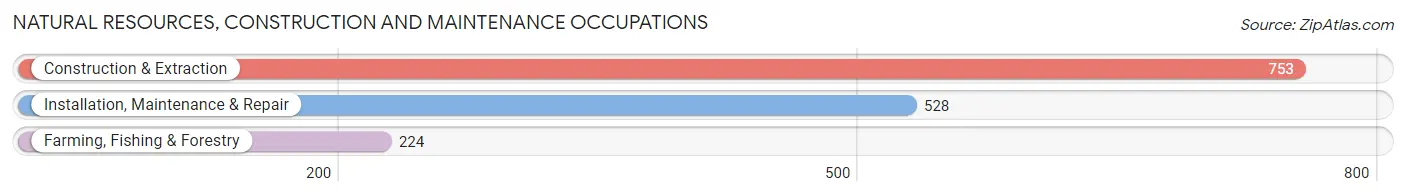
Natural Resources, Construction and Maintenance Occupations
The most common Natural Resources, Construction and Maintenance occupations in Marshalltown are Construction & Extraction (753 | 5.9%), Installation, Maintenance & Repair (528 | 4.1%), and Farming, Fishing & Forestry (224 | 1.7%).
Natural Resources, Construction and Maintenance Occupations by Sex
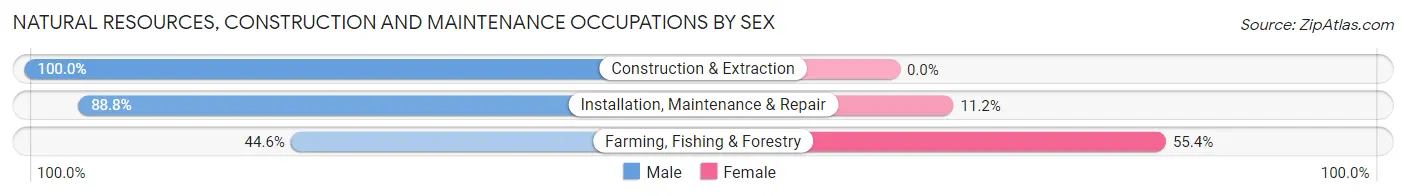
| Occupation | Male | Female |
| Farming, Fishing & Forestry | 100 (44.6%) | 124 (55.4%) |
| Construction & Extraction | 753 (100.0%) | 0 (0.0%) |
| Installation, Maintenance & Repair | 469 (88.8%) | 59 (11.2%) |
| Total (Category) | 1,322 (87.8%) | 183 (12.2%) |
| Total (Overall) | 6,995 (54.4%) | 5,858 (45.6%) |
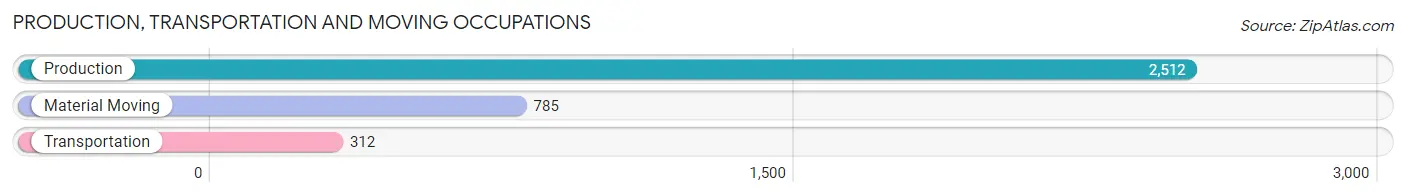
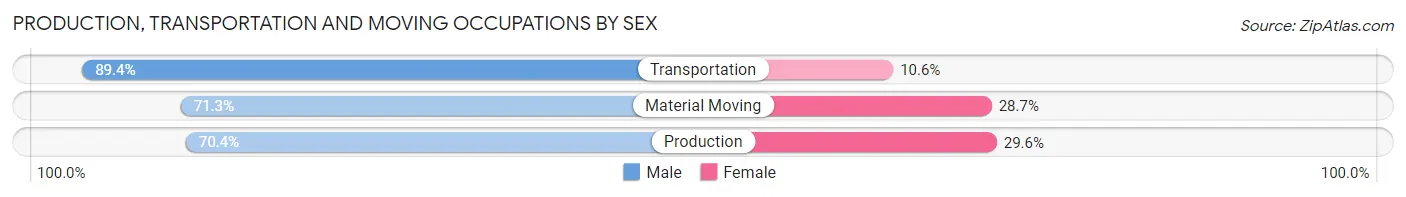
Production, Transportation and Moving Occupations
The most common Production, Transportation and Moving occupations in Marshalltown are Production (2,512 | 19.5%), Material Moving (785 | 6.1%), and Transportation (312 | 2.4%).
Production, Transportation and Moving Occupations by Sex
| Occupation | Male | Female |
| Production | 1,769 (70.4%) | 743 (29.6%) |
| Transportation | 279 (89.4%) | 33 (10.6%) |
| Material Moving | 560 (71.3%) | 225 (28.7%) |
| Total (Category) | 2,608 (72.3%) | 1,001 (27.7%) |
| Total (Overall) | 6,995 (54.4%) | 5,858 (45.6%) |
Employment Industries by Sex in Marshalltown
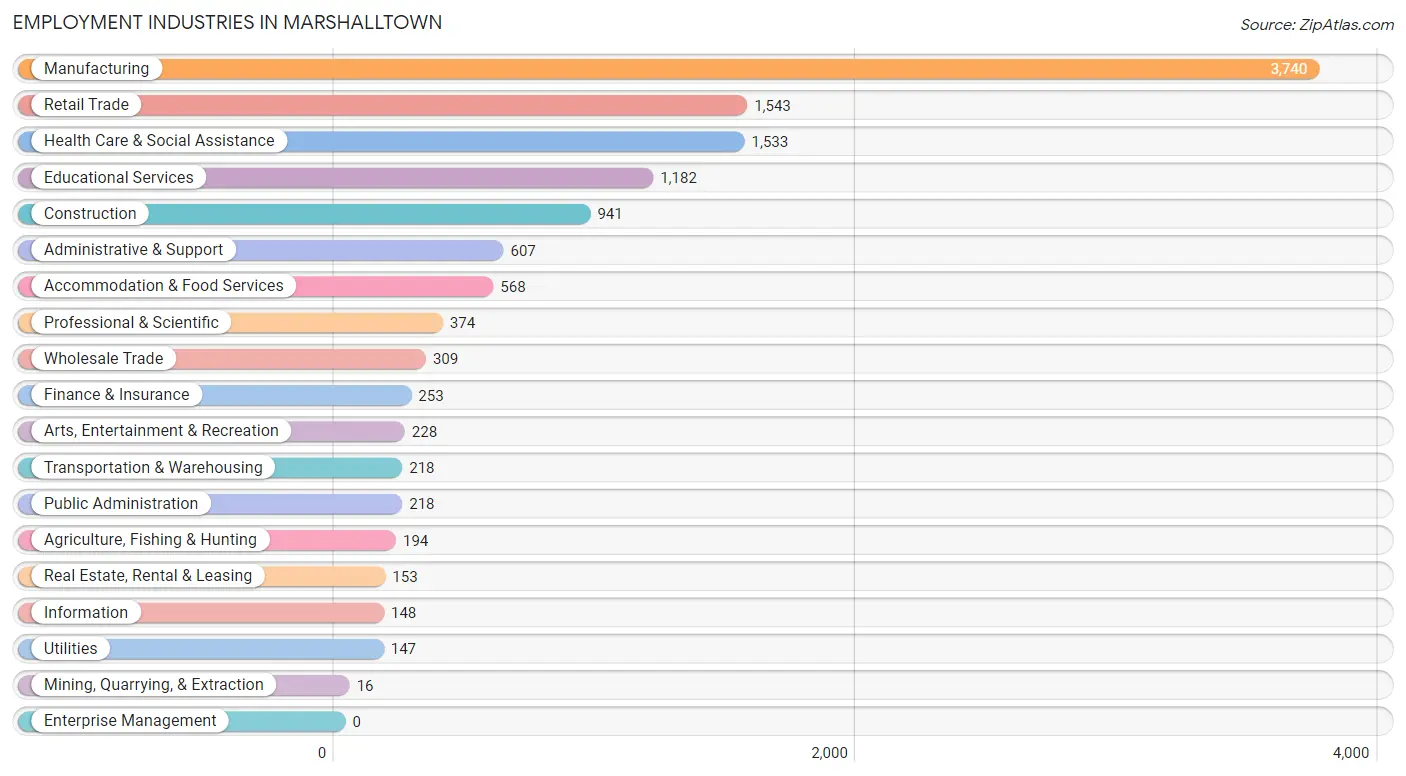
Employment Industries in Marshalltown
The major employment industries in Marshalltown include Manufacturing (3,740 | 29.1%), Retail Trade (1,543 | 12.0%), Health Care & Social Assistance (1,533 | 11.9%), Educational Services (1,182 | 9.2%), and Construction (941 | 7.3%).
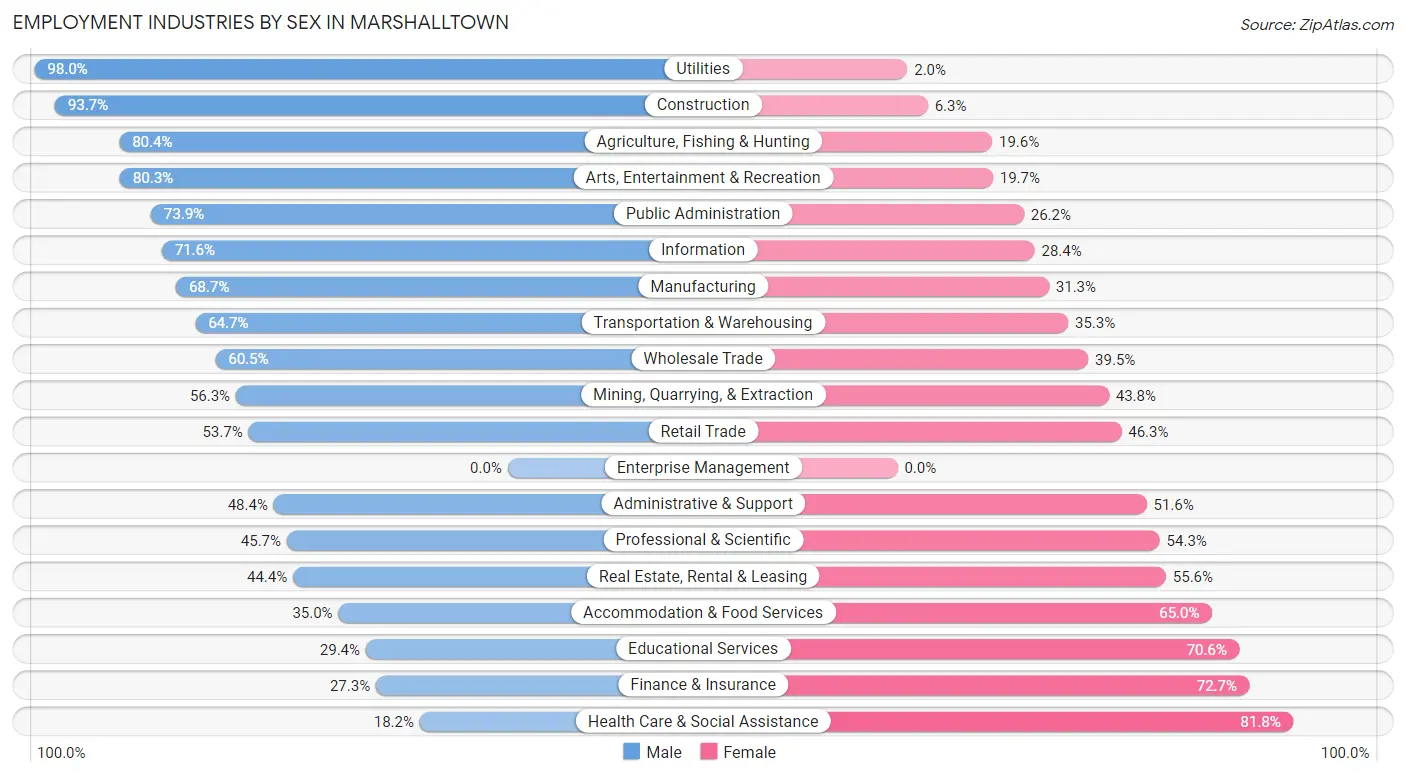
Employment Industries by Sex in Marshalltown
The Marshalltown industries that see more men than women are Utilities (98.0%), Construction (93.7%), and Agriculture, Fishing & Hunting (80.4%), whereas the industries that tend to have a higher number of women are Health Care & Social Assistance (81.8%), Finance & Insurance (72.7%), and Educational Services (70.6%).
| Industry | Male | Female |
| Agriculture, Fishing & Hunting | 156 (80.4%) | 38 (19.6%) |
| Mining, Quarrying, & Extraction | 9 (56.2%) | 7 (43.8%) |
| Construction | 882 (93.7%) | 59 (6.3%) |
| Manufacturing | 2,568 (68.7%) | 1,172 (31.3%) |
| Wholesale Trade | 187 (60.5%) | 122 (39.5%) |
| Retail Trade | 828 (53.7%) | 715 (46.3%) |
| Transportation & Warehousing | 141 (64.7%) | 77 (35.3%) |
| Utilities | 144 (98.0%) | 3 (2.0%) |
| Information | 106 (71.6%) | 42 (28.4%) |
| Finance & Insurance | 69 (27.3%) | 184 (72.7%) |
| Real Estate, Rental & Leasing | 68 (44.4%) | 85 (55.6%) |
| Professional & Scientific | 171 (45.7%) | 203 (54.3%) |
| Enterprise Management | 0 (0.0%) | 0 (0.0%) |
| Administrative & Support | 294 (48.4%) | 313 (51.6%) |
| Educational Services | 347 (29.4%) | 835 (70.6%) |
| Health Care & Social Assistance | 279 (18.2%) | 1,254 (81.8%) |
| Arts, Entertainment & Recreation | 183 (80.3%) | 45 (19.7%) |
| Accommodation & Food Services | 199 (35.0%) | 369 (65.0%) |
| Public Administration | 161 (73.9%) | 57 (26.2%) |
| Total | 6,995 (54.4%) | 5,858 (45.6%) |
Education in Marshalltown
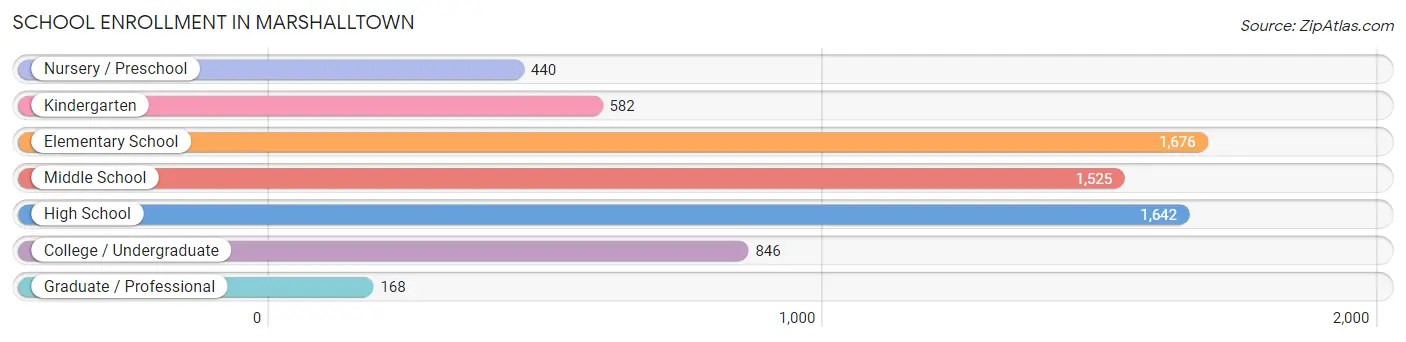
School Enrollment in Marshalltown
The most common levels of schooling among the 6,879 students in Marshalltown are elementary school (1,676 | 24.4%), high school (1,642 | 23.9%), and middle school (1,525 | 22.2%).
| School Level | # Students | % Students |
| Nursery / Preschool | 440 | 6.4% |
| Kindergarten | 582 | 8.5% |
| Elementary School | 1,676 | 24.4% |
| Middle School | 1,525 | 22.2% |
| High School | 1,642 | 23.9% |
| College / Undergraduate | 846 | 12.3% |
| Graduate / Professional | 168 | 2.4% |
| Total | 6,879 | 100.0% |
School Enrollment by Age by Funding Source in Marshalltown
Out of a total of 6,879 students who are enrolled in schools in Marshalltown, 433 (6.3%) attend a private institution, while the remaining 6,446 (93.7%) are enrolled in public schools. The age group of 35 years and over has the highest likelihood of being enrolled in private schools, with 55 (45.8% in the age bracket) enrolled. Conversely, the age group of 15 to 17 year olds has the lowest likelihood of being enrolled in a private school, with 1,164 (98.3% in the age bracket) attending a public institution.
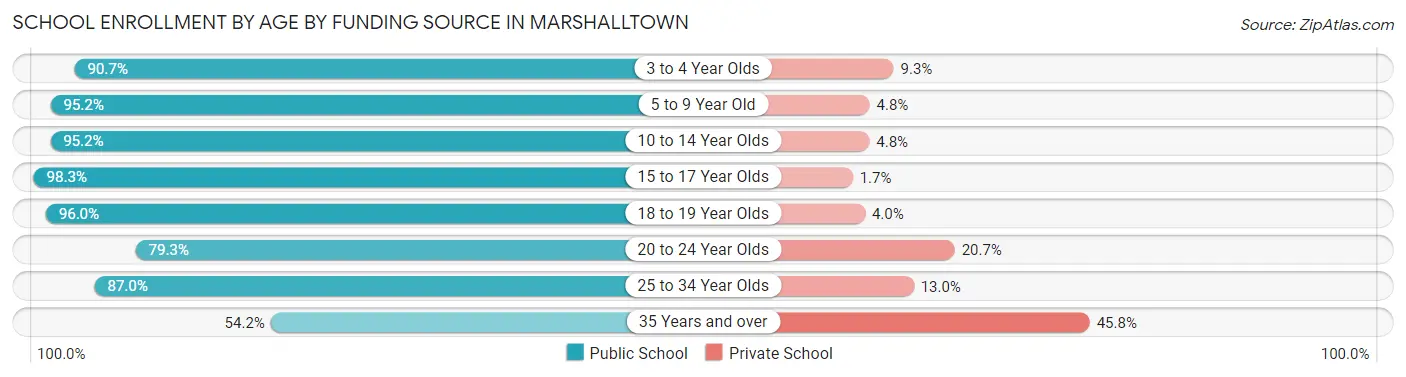
| Age Bracket | Public School | Private School |
| 3 to 4 Year Olds | 273 (90.7%) | 28 (9.3%) |
| 5 to 9 Year Old | 2,010 (95.2%) | 102 (4.8%) |
| 10 to 14 Year Olds | 2,013 (95.2%) | 101 (4.8%) |
| 15 to 17 Year Olds | 1,164 (98.3%) | 20 (1.7%) |
| 18 to 19 Year Olds | 435 (96.0%) | 18 (4.0%) |
| 20 to 24 Year Olds | 326 (79.3%) | 85 (20.7%) |
| 25 to 34 Year Olds | 160 (87.0%) | 24 (13.0%) |
| 35 Years and over | 65 (54.2%) | 55 (45.8%) |
| Total | 6,446 (93.7%) | 433 (6.3%) |
Educational Attainment by Field of Study in Marshalltown
Business (874 | 23.5%), education (733 | 19.8%), science & technology (344 | 9.3%), engineering (279 | 7.5%), and psychology (265 | 7.1%) are the most common fields of study among 3,711 individuals in Marshalltown who have obtained a bachelor's degree or higher.
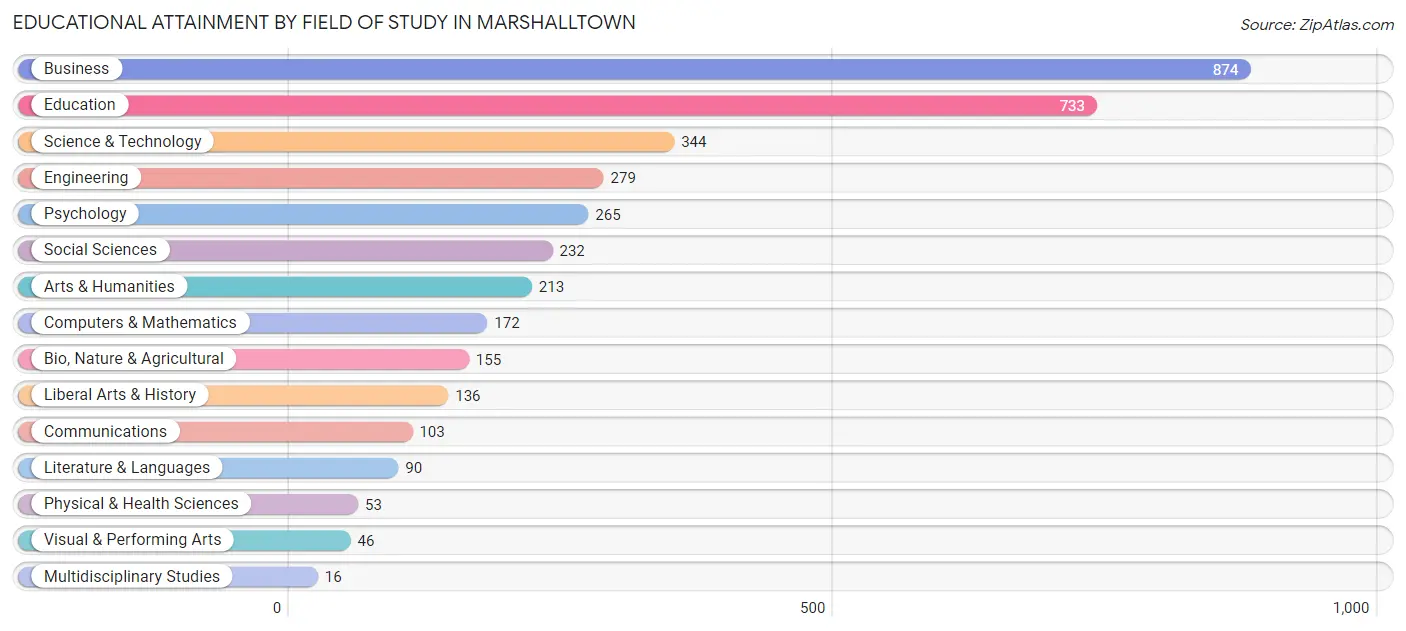
| Field of Study | # Graduates | % Graduates |
| Computers & Mathematics | 172 | 4.6% |
| Bio, Nature & Agricultural | 155 | 4.2% |
| Physical & Health Sciences | 53 | 1.4% |
| Psychology | 265 | 7.1% |
| Social Sciences | 232 | 6.2% |
| Engineering | 279 | 7.5% |
| Multidisciplinary Studies | 16 | 0.4% |
| Science & Technology | 344 | 9.3% |
| Business | 874 | 23.5% |
| Education | 733 | 19.8% |
| Literature & Languages | 90 | 2.4% |
| Liberal Arts & History | 136 | 3.7% |
| Visual & Performing Arts | 46 | 1.2% |
| Communications | 103 | 2.8% |
| Arts & Humanities | 213 | 5.7% |
| Total | 3,711 | 100.0% |
Transportation & Commute in Marshalltown
Vehicle Availability by Sex in Marshalltown
The most prevalent vehicle ownership categories in Marshalltown are males with 2 vehicles (2,806, accounting for 41.1%) and females with 2 vehicles (2,441, making up 49.8%).
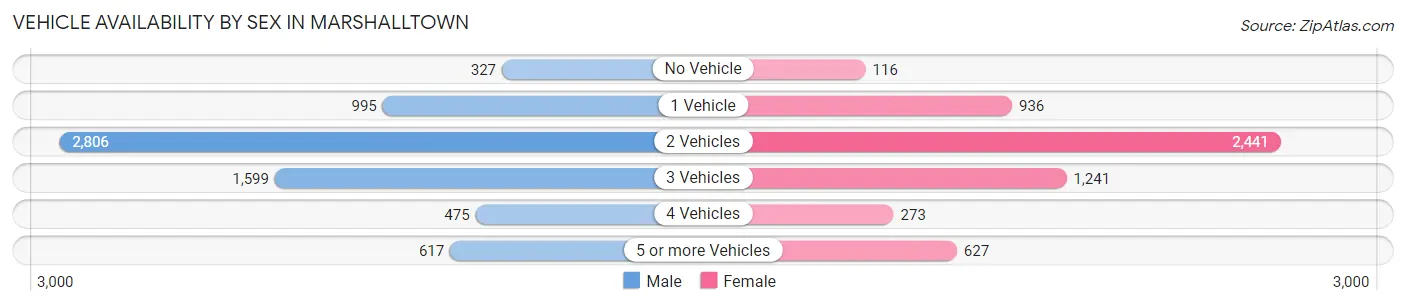
| Vehicles Available | Male | Female |
| No Vehicle | 327 (4.8%) | 116 (2.1%) |
| 1 Vehicle | 995 (14.6%) | 936 (16.6%) |
| 2 Vehicles | 2,806 (41.1%) | 2,441 (43.3%) |
| 3 Vehicles | 1,599 (23.4%) | 1,241 (22.0%) |
| 4 Vehicles | 475 (7.0%) | 273 (4.9%) |
| 5 or more Vehicles | 617 (9.0%) | 627 (11.1%) |
| Total | 6,819 (100.0%) | 5,634 (100.0%) |
Commute Time in Marshalltown
The most frequently occuring commute durations in Marshalltown are 5 to 9 minutes (3,910 commuters, 33.1%), 10 to 14 minutes (3,199 commuters, 27.0%), and 15 to 19 minutes (1,232 commuters, 10.4%).
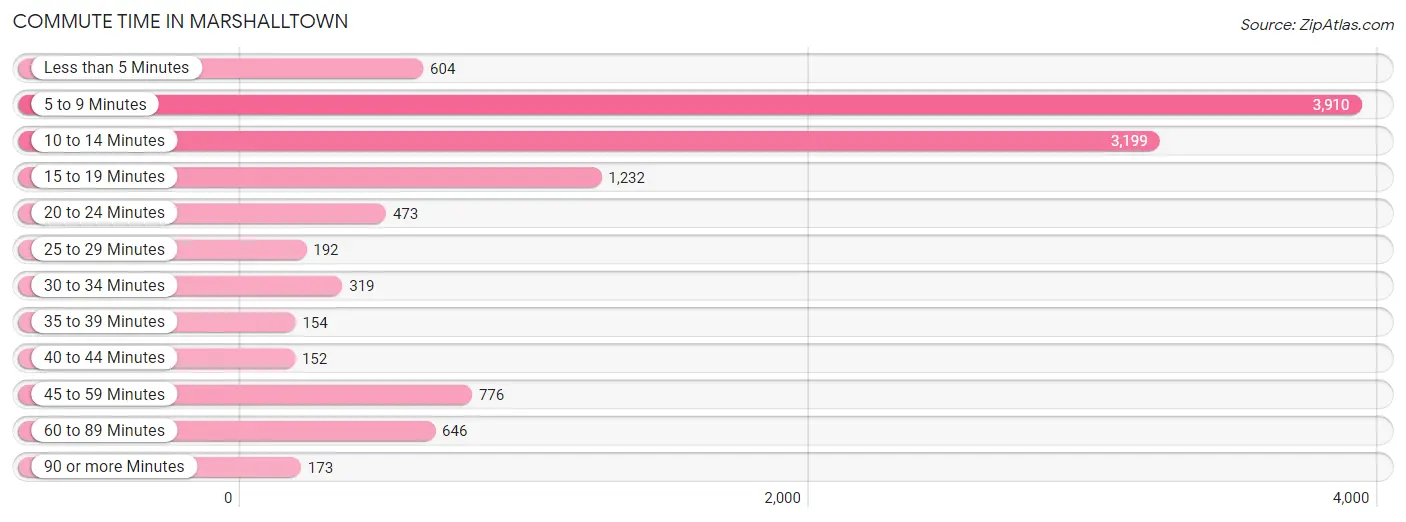
| Commute Time | # Commuters | % Commuters |
| Less than 5 Minutes | 604 | 5.1% |
| 5 to 9 Minutes | 3,910 | 33.1% |
| 10 to 14 Minutes | 3,199 | 27.0% |
| 15 to 19 Minutes | 1,232 | 10.4% |
| 20 to 24 Minutes | 473 | 4.0% |
| 25 to 29 Minutes | 192 | 1.6% |
| 30 to 34 Minutes | 319 | 2.7% |
| 35 to 39 Minutes | 154 | 1.3% |
| 40 to 44 Minutes | 152 | 1.3% |
| 45 to 59 Minutes | 776 | 6.6% |
| 60 to 89 Minutes | 646 | 5.5% |
| 90 or more Minutes | 173 | 1.5% |
Commute Time by Sex in Marshalltown
The most common commute times in Marshalltown are 5 to 9 minutes (1,898 commuters, 29.3%) for males and 5 to 9 minutes (2,012 commuters, 37.6%) for females.
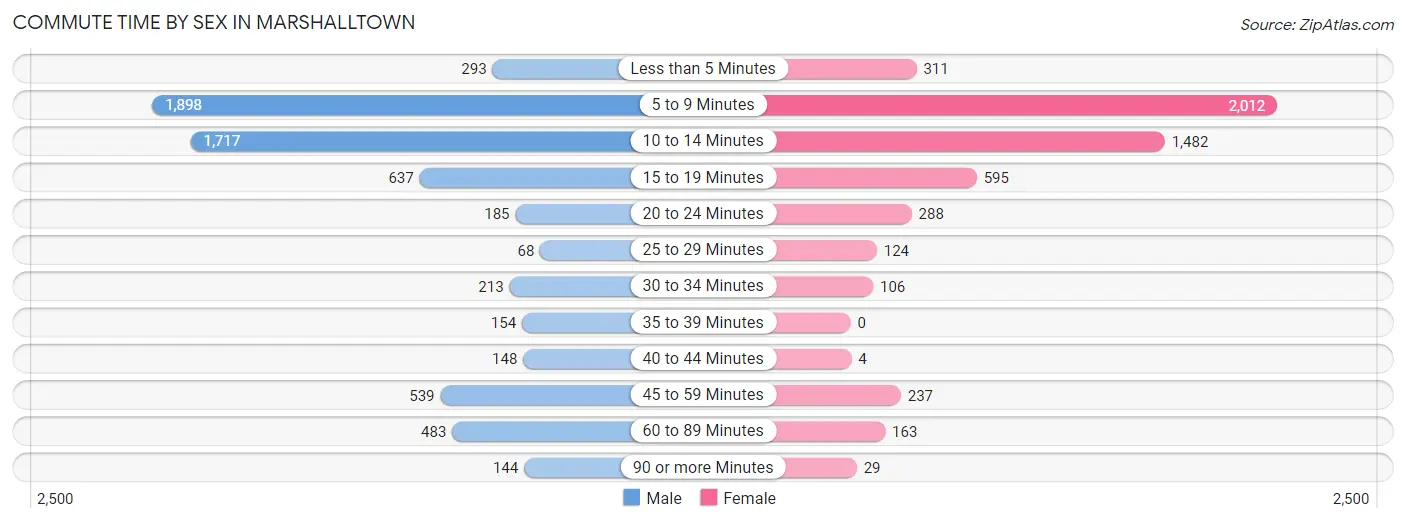
| Commute Time | Male | Female |
| Less than 5 Minutes | 293 (4.5%) | 311 (5.8%) |
| 5 to 9 Minutes | 1,898 (29.3%) | 2,012 (37.6%) |
| 10 to 14 Minutes | 1,717 (26.5%) | 1,482 (27.7%) |
| 15 to 19 Minutes | 637 (9.8%) | 595 (11.1%) |
| 20 to 24 Minutes | 185 (2.9%) | 288 (5.4%) |
| 25 to 29 Minutes | 68 (1.1%) | 124 (2.3%) |
| 30 to 34 Minutes | 213 (3.3%) | 106 (2.0%) |
| 35 to 39 Minutes | 154 (2.4%) | 0 (0.0%) |
| 40 to 44 Minutes | 148 (2.3%) | 4 (0.1%) |
| 45 to 59 Minutes | 539 (8.3%) | 237 (4.4%) |
| 60 to 89 Minutes | 483 (7.4%) | 163 (3.0%) |
| 90 or more Minutes | 144 (2.2%) | 29 (0.5%) |
Time of Departure to Work by Sex in Marshalltown
The most frequent times of departure to work in Marshalltown are 12:00 PM to 3:59 PM (1,108, 17.1%) for males and 12:00 PM to 3:59 PM (838, 15.7%) for females.
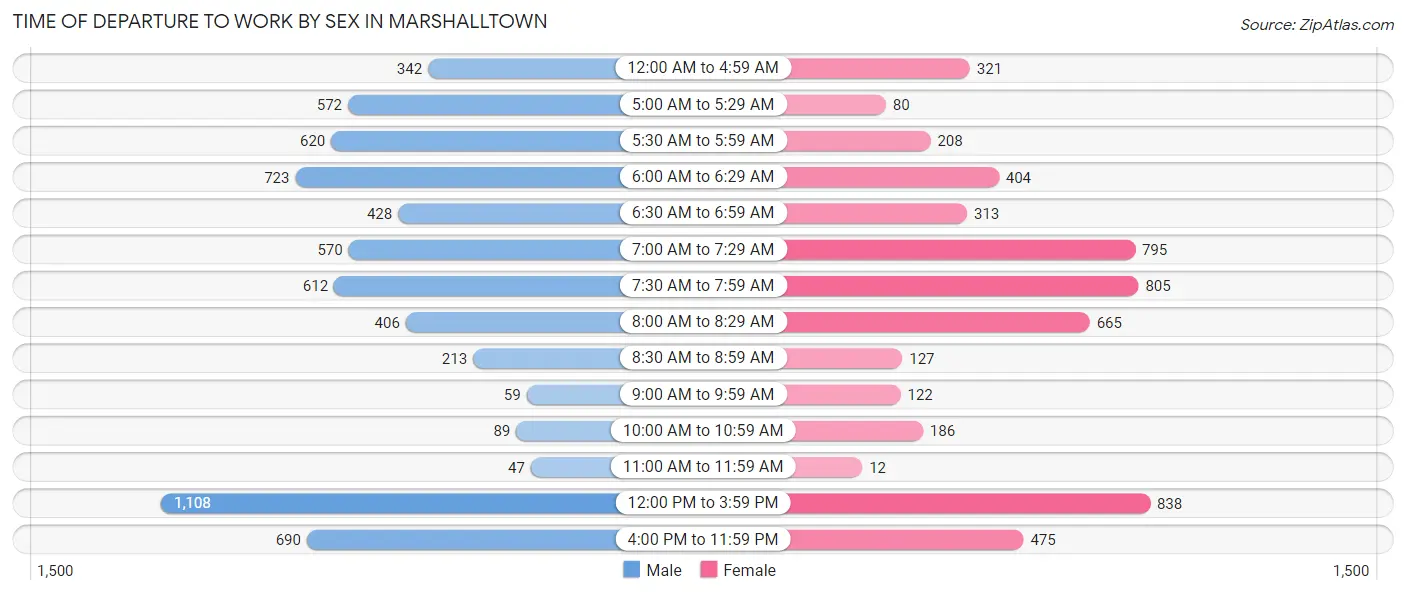
| Time of Departure | Male | Female |
| 12:00 AM to 4:59 AM | 342 (5.3%) | 321 (6.0%) |
| 5:00 AM to 5:29 AM | 572 (8.8%) | 80 (1.5%) |
| 5:30 AM to 5:59 AM | 620 (9.6%) | 208 (3.9%) |
| 6:00 AM to 6:29 AM | 723 (11.2%) | 404 (7.5%) |
| 6:30 AM to 6:59 AM | 428 (6.6%) | 313 (5.9%) |
| 7:00 AM to 7:29 AM | 570 (8.8%) | 795 (14.9%) |
| 7:30 AM to 7:59 AM | 612 (9.5%) | 805 (15.0%) |
| 8:00 AM to 8:29 AM | 406 (6.3%) | 665 (12.4%) |
| 8:30 AM to 8:59 AM | 213 (3.3%) | 127 (2.4%) |
| 9:00 AM to 9:59 AM | 59 (0.9%) | 122 (2.3%) |
| 10:00 AM to 10:59 AM | 89 (1.4%) | 186 (3.5%) |
| 11:00 AM to 11:59 AM | 47 (0.7%) | 12 (0.2%) |
| 12:00 PM to 3:59 PM | 1,108 (17.1%) | 838 (15.7%) |
| 4:00 PM to 11:59 PM | 690 (10.6%) | 475 (8.9%) |
| Total | 6,479 (100.0%) | 5,351 (100.0%) |
Housing Occupancy in Marshalltown
Occupancy by Ownership in Marshalltown
Of the total 9,984 dwellings in Marshalltown, owner-occupied units account for 6,718 (67.3%), while renter-occupied units make up 3,266 (32.7%).
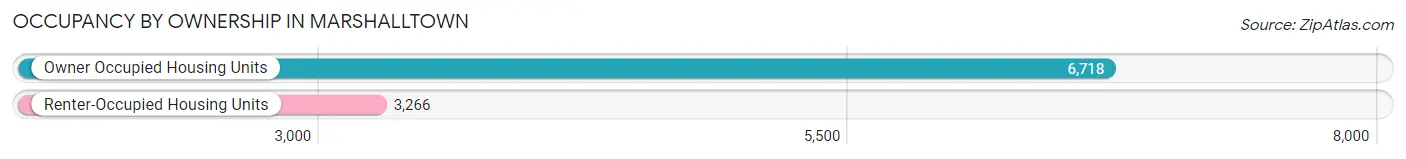
| Occupancy | # Housing Units | % Housing Units |
| Owner Occupied Housing Units | 6,718 | 67.3% |
| Renter-Occupied Housing Units | 3,266 | 32.7% |
| Total Occupied Housing Units | 9,984 | 100.0% |
Occupancy by Household Size in Marshalltown
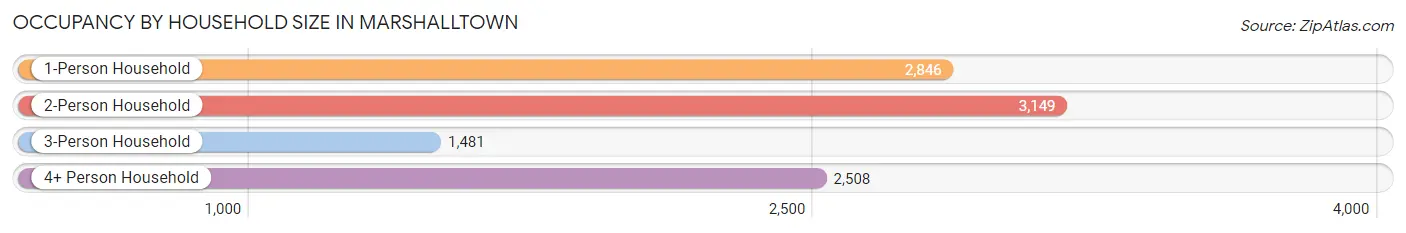
| Household Size | # Housing Units | % Housing Units |
| 1-Person Household | 2,846 | 28.5% |
| 2-Person Household | 3,149 | 31.5% |
| 3-Person Household | 1,481 | 14.8% |
| 4+ Person Household | 2,508 | 25.1% |
| Total Housing Units | 9,984 | 100.0% |
Occupancy by Ownership by Household Size in Marshalltown
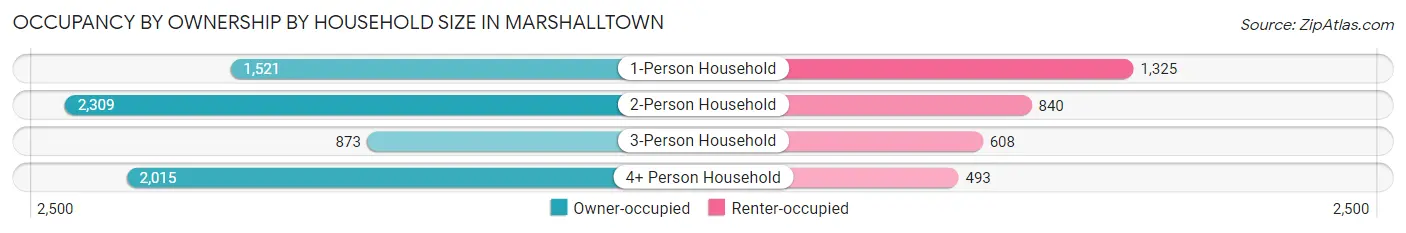
| Household Size | Owner-occupied | Renter-occupied |
| 1-Person Household | 1,521 (53.4%) | 1,325 (46.6%) |
| 2-Person Household | 2,309 (73.3%) | 840 (26.7%) |
| 3-Person Household | 873 (59.0%) | 608 (41.0%) |
| 4+ Person Household | 2,015 (80.3%) | 493 (19.7%) |
| Total Housing Units | 6,718 (67.3%) | 3,266 (32.7%) |
Occupancy by Educational Attainment in Marshalltown
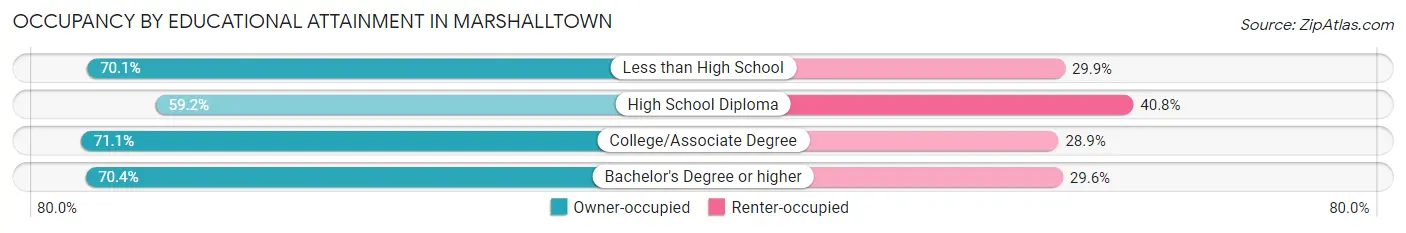
| Household Size | Owner-occupied | Renter-occupied |
| Less than High School | 1,053 (70.1%) | 450 (29.9%) |
| High School Diploma | 1,730 (59.2%) | 1,192 (40.8%) |
| College/Associate Degree | 2,291 (71.1%) | 932 (28.9%) |
| Bachelor's Degree or higher | 1,644 (70.4%) | 692 (29.6%) |
Occupancy by Age of Householder in Marshalltown
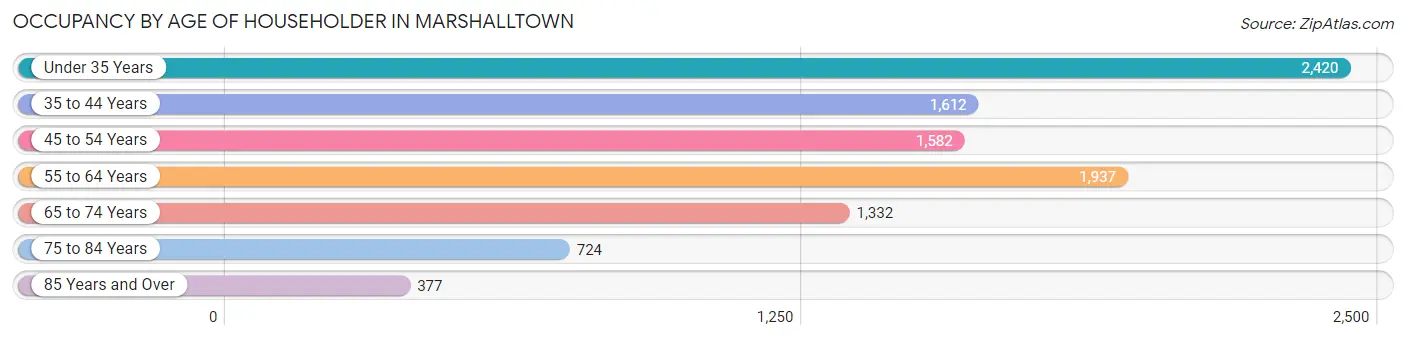
| Age Bracket | # Households | % Households |
| Under 35 Years | 2,420 | 24.2% |
| 35 to 44 Years | 1,612 | 16.2% |
| 45 to 54 Years | 1,582 | 15.9% |
| 55 to 64 Years | 1,937 | 19.4% |
| 65 to 74 Years | 1,332 | 13.3% |
| 75 to 84 Years | 724 | 7.2% |
| 85 Years and Over | 377 | 3.8% |
| Total | 9,984 | 100.0% |
Housing Finances in Marshalltown
Median Income by Occupancy in Marshalltown
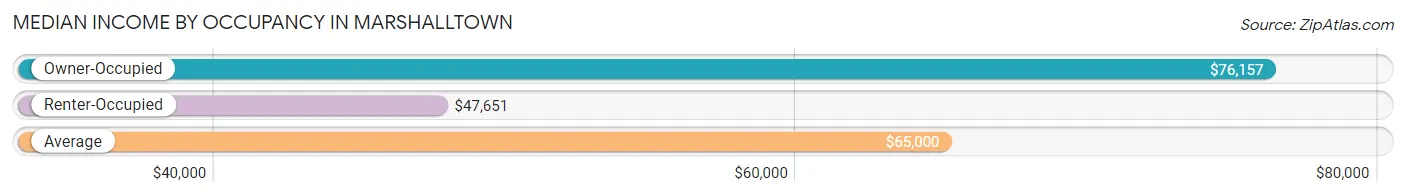
| Occupancy Type | # Households | Median Income |
| Owner-Occupied | 6,718 (67.3%) | $76,157 |
| Renter-Occupied | 3,266 (32.7%) | $47,651 |
| Average | 9,984 (100.0%) | $65,000 |
Occupancy by Householder Income Bracket in Marshalltown
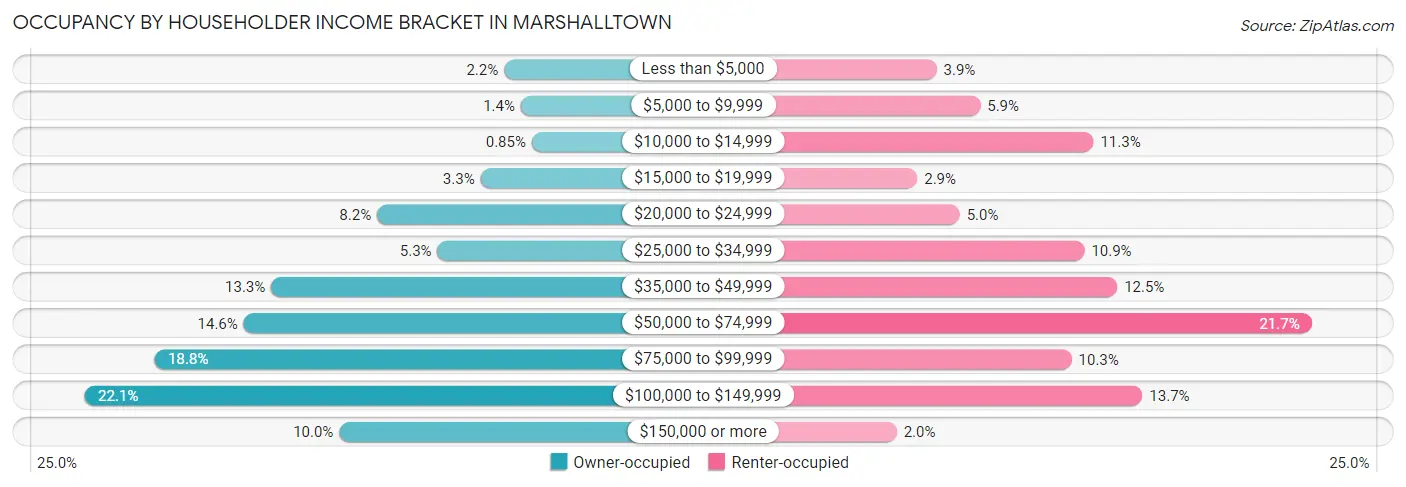
| Income Bracket | Owner-occupied | Renter-occupied |
| Less than $5,000 | 146 (2.2%) | 126 (3.9%) |
| $5,000 to $9,999 | 92 (1.4%) | 194 (5.9%) |
| $10,000 to $14,999 | 57 (0.9%) | 370 (11.3%) |
| $15,000 to $19,999 | 221 (3.3%) | 96 (2.9%) |
| $20,000 to $24,999 | 552 (8.2%) | 162 (5.0%) |
| $25,000 to $34,999 | 359 (5.3%) | 356 (10.9%) |
| $35,000 to $49,999 | 891 (13.3%) | 407 (12.5%) |
| $50,000 to $74,999 | 979 (14.6%) | 709 (21.7%) |
| $75,000 to $99,999 | 1,262 (18.8%) | 336 (10.3%) |
| $100,000 to $149,999 | 1,486 (22.1%) | 446 (13.7%) |
| $150,000 or more | 673 (10.0%) | 64 (2.0%) |
| Total | 6,718 (100.0%) | 3,266 (100.0%) |
Monthly Housing Cost Tiers in Marshalltown
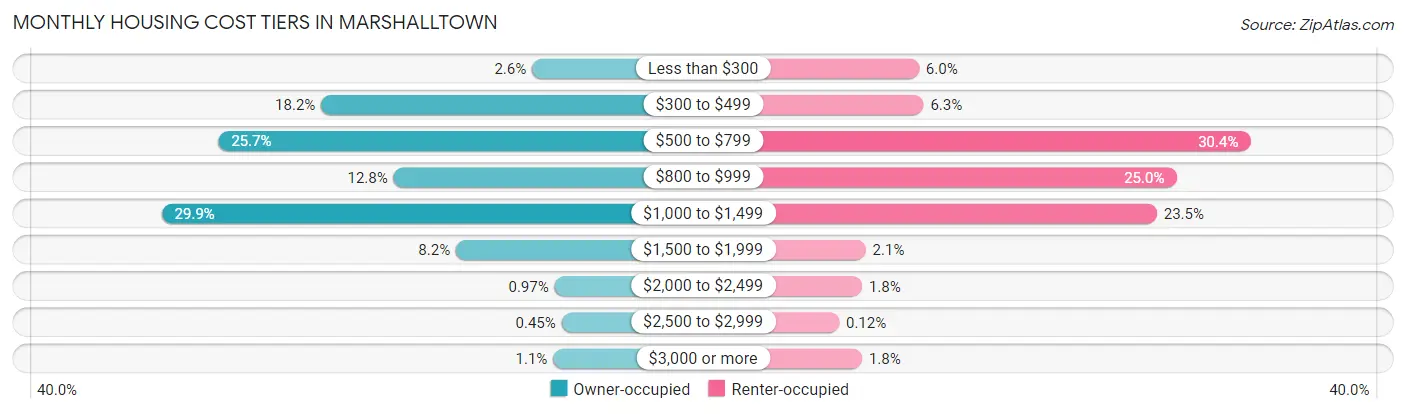
| Monthly Cost | Owner-occupied | Renter-occupied |
| Less than $300 | 177 (2.6%) | 196 (6.0%) |
| $300 to $499 | 1,220 (18.2%) | 207 (6.3%) |
| $500 to $799 | 1,729 (25.7%) | 993 (30.4%) |
| $800 to $999 | 862 (12.8%) | 815 (24.9%) |
| $1,000 to $1,499 | 2,010 (29.9%) | 768 (23.5%) |
| $1,500 to $1,999 | 553 (8.2%) | 68 (2.1%) |
| $2,000 to $2,499 | 65 (1.0%) | 59 (1.8%) |
| $2,500 to $2,999 | 30 (0.4%) | 4 (0.1%) |
| $3,000 or more | 72 (1.1%) | 59 (1.8%) |
| Total | 6,718 (100.0%) | 3,266 (100.0%) |
Physical Housing Characteristics in Marshalltown
Housing Structures in Marshalltown
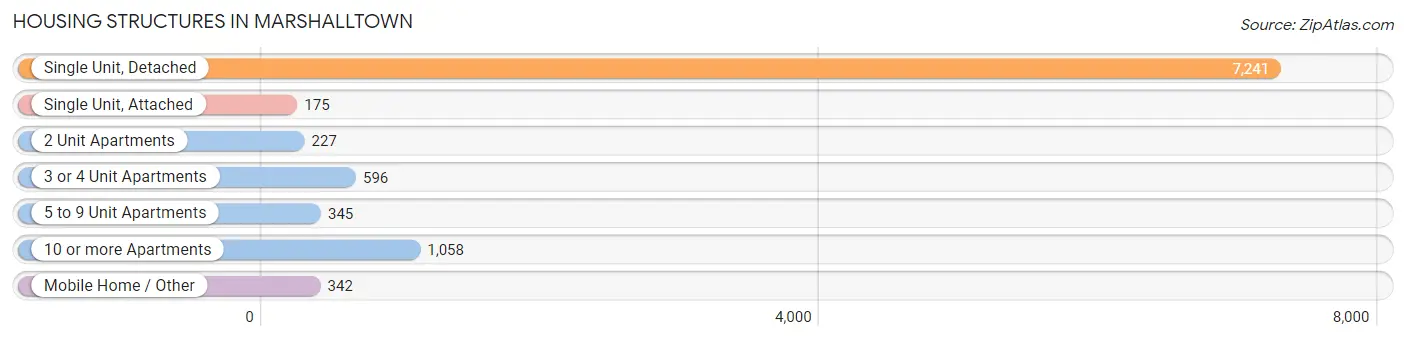
| Structure Type | # Housing Units | % Housing Units |
| Single Unit, Detached | 7,241 | 72.5% |
| Single Unit, Attached | 175 | 1.8% |
| 2 Unit Apartments | 227 | 2.3% |
| 3 or 4 Unit Apartments | 596 | 6.0% |
| 5 to 9 Unit Apartments | 345 | 3.5% |
| 10 or more Apartments | 1,058 | 10.6% |
| Mobile Home / Other | 342 | 3.4% |
| Total | 9,984 | 100.0% |
Housing Structures by Occupancy in Marshalltown
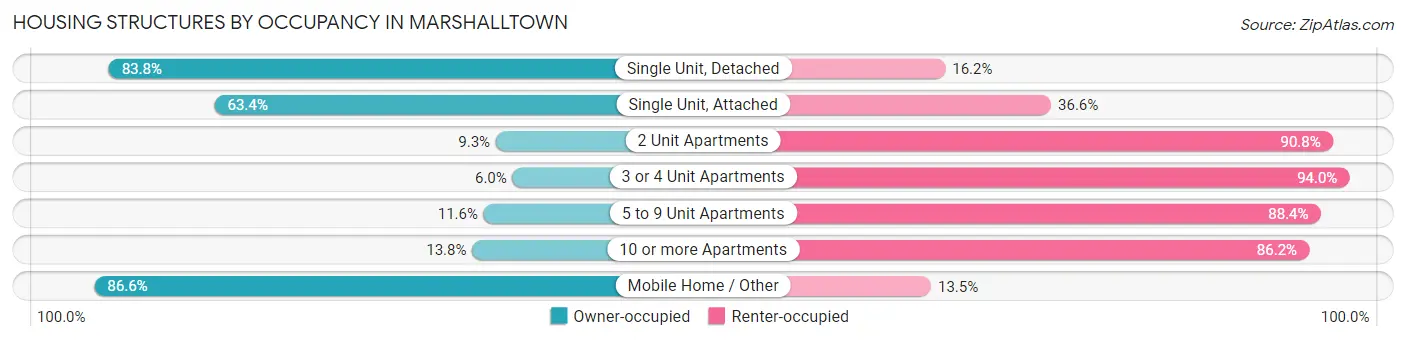
| Structure Type | Owner-occupied | Renter-occupied |
| Single Unit, Detached | 6,068 (83.8%) | 1,173 (16.2%) |
| Single Unit, Attached | 111 (63.4%) | 64 (36.6%) |
| 2 Unit Apartments | 21 (9.2%) | 206 (90.7%) |
| 3 or 4 Unit Apartments | 36 (6.0%) | 560 (94.0%) |
| 5 to 9 Unit Apartments | 40 (11.6%) | 305 (88.4%) |
| 10 or more Apartments | 146 (13.8%) | 912 (86.2%) |
| Mobile Home / Other | 296 (86.6%) | 46 (13.5%) |
| Total | 6,718 (67.3%) | 3,266 (32.7%) |
Housing Structures by Number of Rooms in Marshalltown
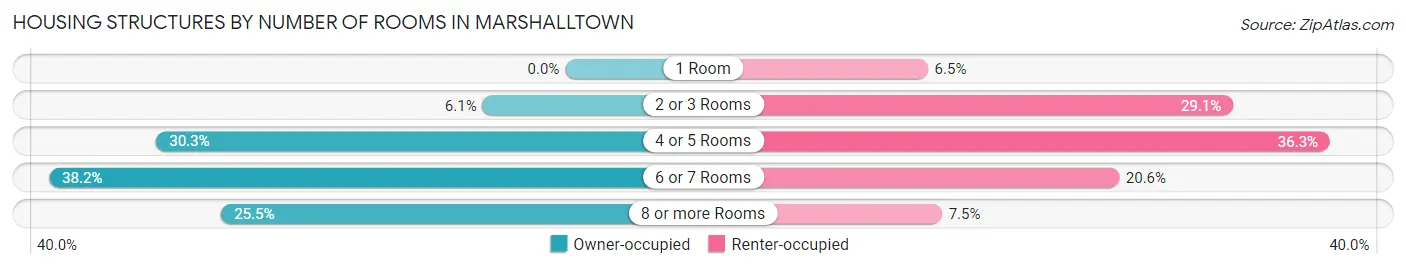
| Number of Rooms | Owner-occupied | Renter-occupied |
| 1 Room | 0 (0.0%) | 212 (6.5%) |
| 2 or 3 Rooms | 411 (6.1%) | 950 (29.1%) |
| 4 or 5 Rooms | 2,032 (30.2%) | 1,184 (36.2%) |
| 6 or 7 Rooms | 2,565 (38.2%) | 674 (20.6%) |
| 8 or more Rooms | 1,710 (25.5%) | 246 (7.5%) |
| Total | 6,718 (100.0%) | 3,266 (100.0%) |
Housing Structure by Heating Type in Marshalltown
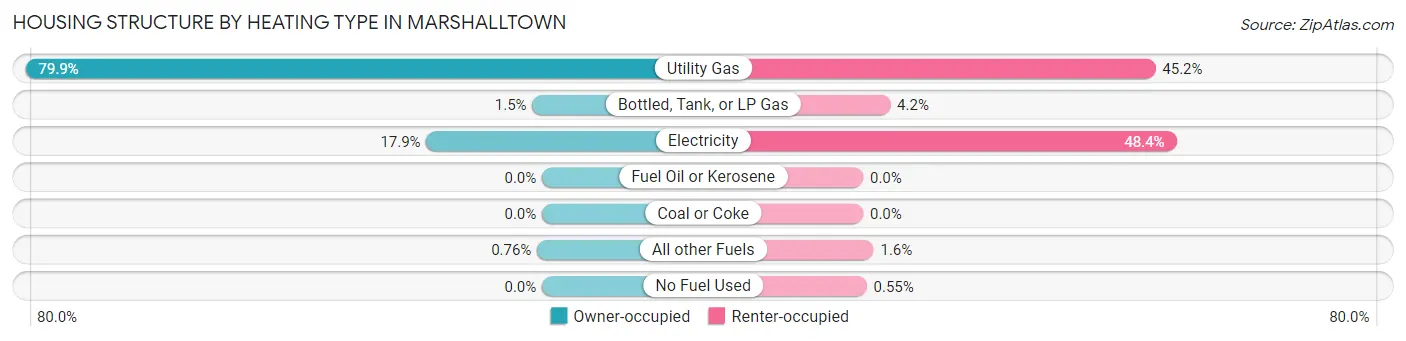
| Heating Type | Owner-occupied | Renter-occupied |
| Utility Gas | 5,366 (79.9%) | 1,476 (45.2%) |
| Bottled, Tank, or LP Gas | 100 (1.5%) | 137 (4.2%) |
| Electricity | 1,201 (17.9%) | 1,582 (48.4%) |
| Fuel Oil or Kerosene | 0 (0.0%) | 0 (0.0%) |
| Coal or Coke | 0 (0.0%) | 0 (0.0%) |
| All other Fuels | 51 (0.8%) | 53 (1.6%) |
| No Fuel Used | 0 (0.0%) | 18 (0.5%) |
| Total | 6,718 (100.0%) | 3,266 (100.0%) |
Household Vehicle Usage in Marshalltown
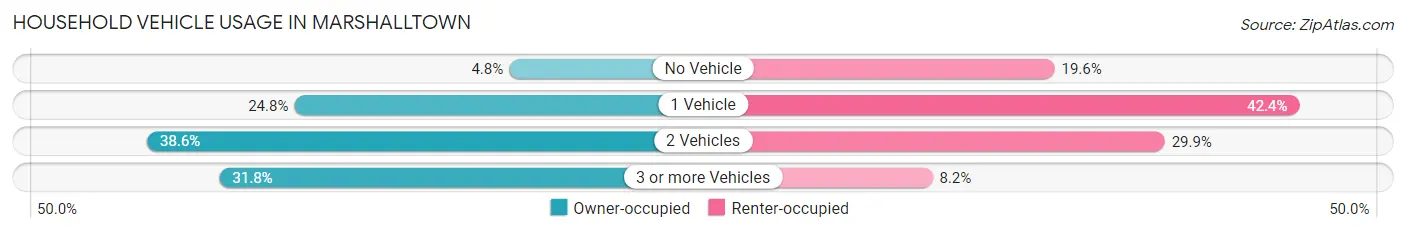
| Vehicles per Household | Owner-occupied | Renter-occupied |
| No Vehicle | 321 (4.8%) | 639 (19.6%) |
| 1 Vehicle | 1,668 (24.8%) | 1,385 (42.4%) |
| 2 Vehicles | 2,592 (38.6%) | 975 (29.8%) |
| 3 or more Vehicles | 2,137 (31.8%) | 267 (8.2%) |
| Total | 6,718 (100.0%) | 3,266 (100.0%) |
Real Estate & Mortgages in Marshalltown
Real Estate and Mortgage Overview in Marshalltown
| Characteristic | Without Mortgage | With Mortgage |
| Housing Units | 3,091 | 3,627 |
| Median Property Value | $95,600 | $121,900 |
| Median Household Income | $59,625 | $449 |
| Monthly Housing Costs | $536 | $72 |
| Real Estate Taxes | $1,843 | $55 |
Property Value by Mortgage Status in Marshalltown
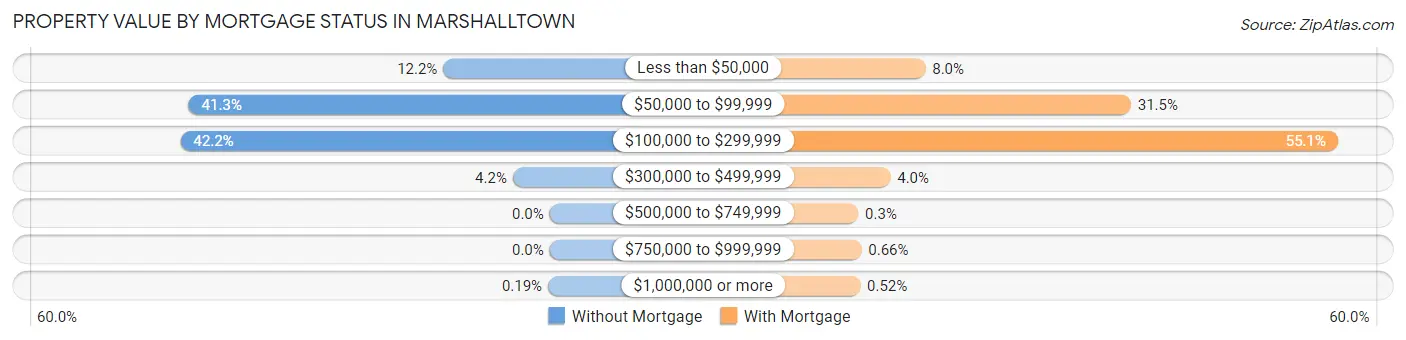
| Property Value | Without Mortgage | With Mortgage |
| Less than $50,000 | 376 (12.2%) | 289 (8.0%) |
| $50,000 to $99,999 | 1,275 (41.2%) | 1,141 (31.5%) |
| $100,000 to $299,999 | 1,304 (42.2%) | 1,999 (55.1%) |
| $300,000 to $499,999 | 130 (4.2%) | 144 (4.0%) |
| $500,000 to $749,999 | 0 (0.0%) | 11 (0.3%) |
| $750,000 to $999,999 | 0 (0.0%) | 24 (0.7%) |
| $1,000,000 or more | 6 (0.2%) | 19 (0.5%) |
| Total | 3,091 (100.0%) | 3,627 (100.0%) |
Household Income by Mortgage Status in Marshalltown
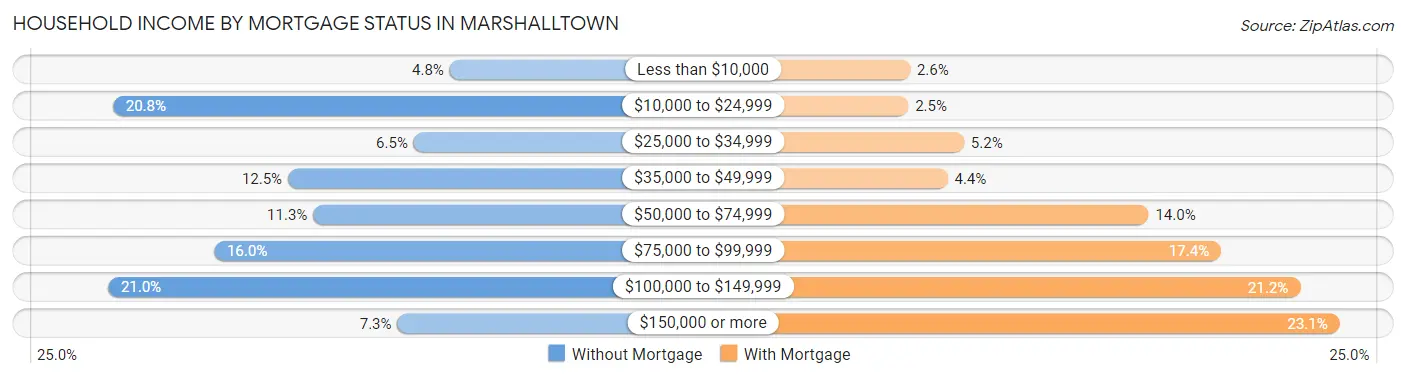
| Household Income | Without Mortgage | With Mortgage |
| Less than $10,000 | 147 (4.8%) | 94 (2.6%) |
| $10,000 to $24,999 | 643 (20.8%) | 91 (2.5%) |
| $25,000 to $34,999 | 200 (6.5%) | 187 (5.2%) |
| $35,000 to $49,999 | 385 (12.5%) | 159 (4.4%) |
| $50,000 to $74,999 | 348 (11.3%) | 506 (14.0%) |
| $75,000 to $99,999 | 494 (16.0%) | 631 (17.4%) |
| $100,000 to $149,999 | 650 (21.0%) | 768 (21.2%) |
| $150,000 or more | 224 (7.2%) | 836 (23.1%) |
| Total | 3,091 (100.0%) | 3,627 (100.0%) |
Property Value to Household Income Ratio in Marshalltown
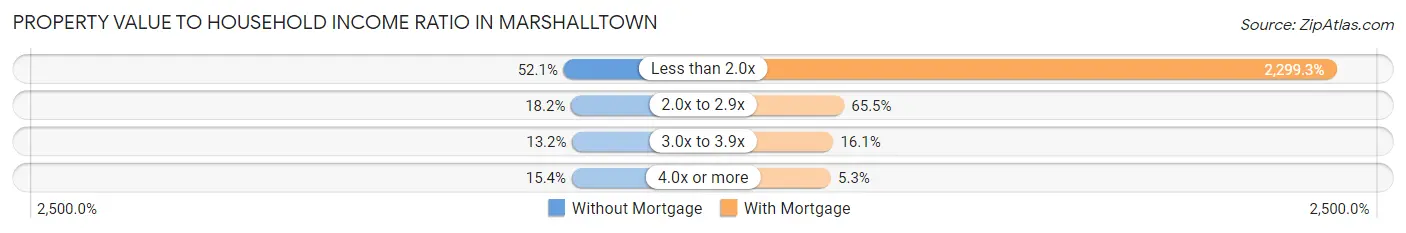
| Value-to-Income Ratio | Without Mortgage | With Mortgage |
| Less than 2.0x | 1,611 (52.1%) | 83,395 (2,299.3%) |
| 2.0x to 2.9x | 561 (18.1%) | 2,377 (65.5%) |
| 3.0x to 3.9x | 408 (13.2%) | 584 (16.1%) |
| 4.0x or more | 476 (15.4%) | 191 (5.3%) |
| Total | 3,091 (100.0%) | 3,627 (100.0%) |
Real Estate Taxes by Mortgage Status in Marshalltown
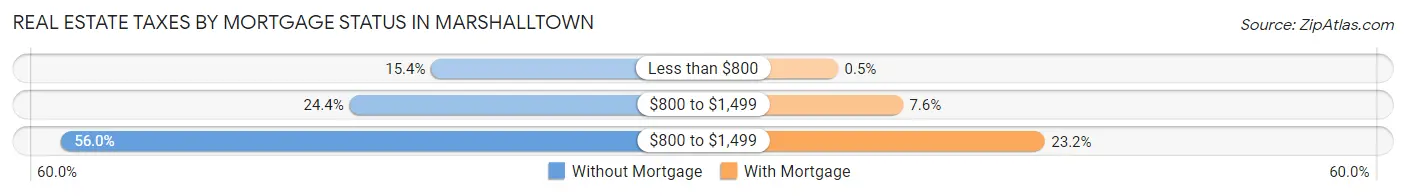
| Property Taxes | Without Mortgage | With Mortgage |
| Less than $800 | 477 (15.4%) | 18 (0.5%) |
| $800 to $1,499 | 754 (24.4%) | 276 (7.6%) |
| $800 to $1,499 | 1,730 (56.0%) | 840 (23.2%) |
| Total | 3,091 (100.0%) | 3,627 (100.0%) |
Health & Disability in Marshalltown
Health Insurance Coverage by Age in Marshalltown
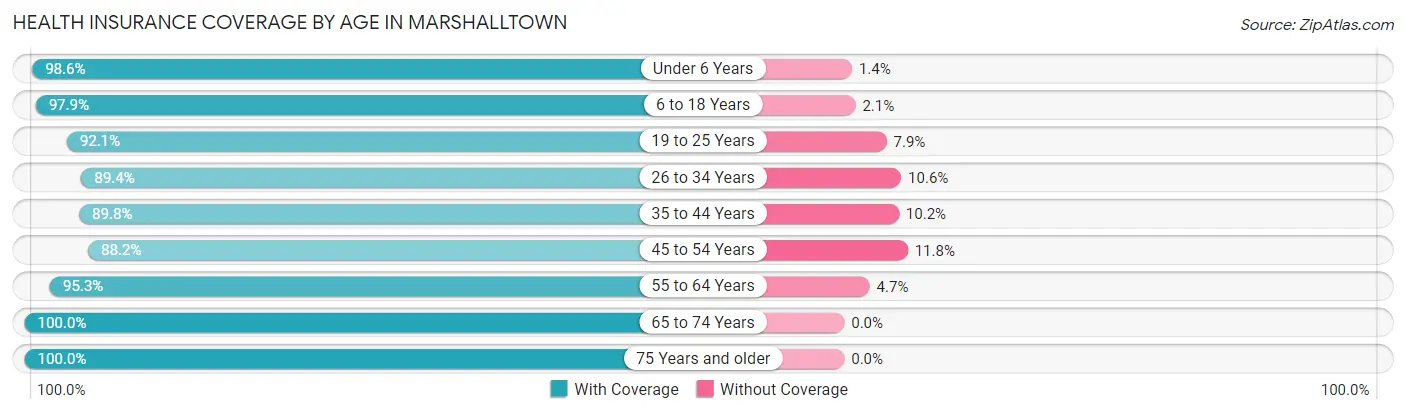
| Age Bracket | With Coverage | Without Coverage |
| Under 6 Years | 2,348 (98.6%) | 34 (1.4%) |
| 6 to 18 Years | 5,169 (97.9%) | 110 (2.1%) |
| 19 to 25 Years | 2,453 (92.1%) | 210 (7.9%) |
| 26 to 34 Years | 2,835 (89.4%) | 336 (10.6%) |
| 35 to 44 Years | 2,726 (89.8%) | 309 (10.2%) |
| 45 to 54 Years | 2,615 (88.2%) | 351 (11.8%) |
| 55 to 64 Years | 3,022 (95.3%) | 150 (4.7%) |
| 65 to 74 Years | 2,073 (100.0%) | 0 (0.0%) |
| 75 Years and older | 1,534 (100.0%) | 0 (0.0%) |
| Total | 24,775 (94.3%) | 1,500 (5.7%) |
Health Insurance Coverage by Citizenship Status in Marshalltown
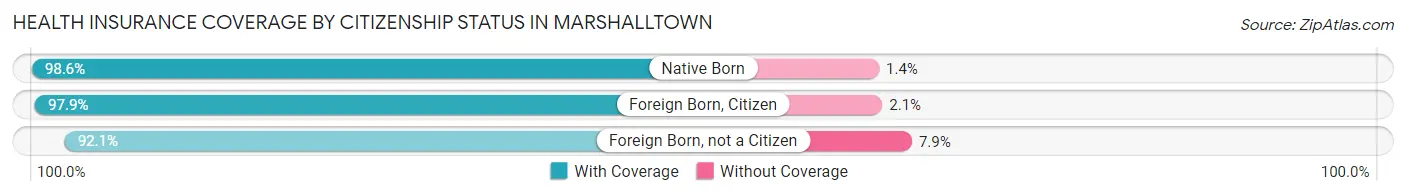
| Citizenship Status | With Coverage | Without Coverage |
| Native Born | 2,348 (98.6%) | 34 (1.4%) |
| Foreign Born, Citizen | 5,169 (97.9%) | 110 (2.1%) |
| Foreign Born, not a Citizen | 2,453 (92.1%) | 210 (7.9%) |
Health Insurance Coverage by Household Income in Marshalltown
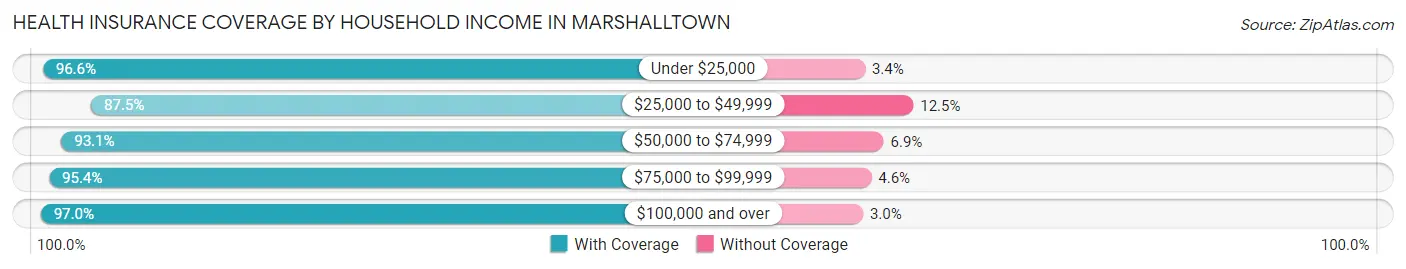
| Household Income | With Coverage | Without Coverage |
| Under $25,000 | 3,343 (96.6%) | 118 (3.4%) |
| $25,000 to $49,999 | 4,139 (87.5%) | 589 (12.5%) |
| $50,000 to $74,999 | 3,933 (93.1%) | 291 (6.9%) |
| $75,000 to $99,999 | 5,180 (95.4%) | 250 (4.6%) |
| $100,000 and over | 8,052 (97.0%) | 252 (3.0%) |
Public vs Private Health Insurance Coverage by Age in Marshalltown
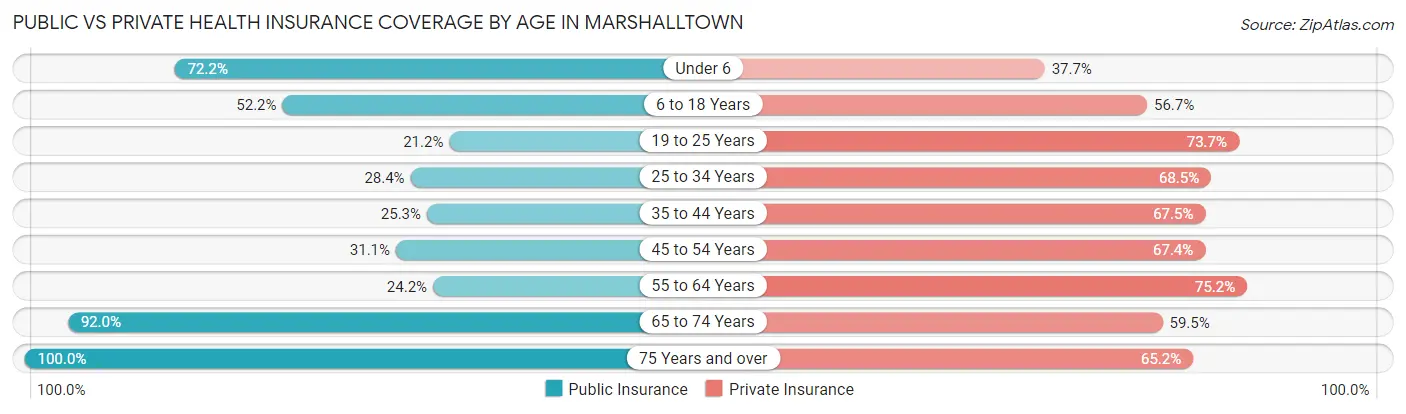
| Age Bracket | Public Insurance | Private Insurance |
| Under 6 | 1,719 (72.2%) | 897 (37.7%) |
| 6 to 18 Years | 2,753 (52.1%) | 2,991 (56.7%) |
| 19 to 25 Years | 564 (21.2%) | 1,962 (73.7%) |
| 25 to 34 Years | 900 (28.4%) | 2,173 (68.5%) |
| 35 to 44 Years | 769 (25.3%) | 2,047 (67.4%) |
| 45 to 54 Years | 922 (31.1%) | 2,000 (67.4%) |
| 55 to 64 Years | 768 (24.2%) | 2,386 (75.2%) |
| 65 to 74 Years | 1,907 (92.0%) | 1,234 (59.5%) |
| 75 Years and over | 1,534 (100.0%) | 1,000 (65.2%) |
| Total | 11,836 (45.1%) | 16,690 (63.5%) |
Disability Status by Sex by Age in Marshalltown
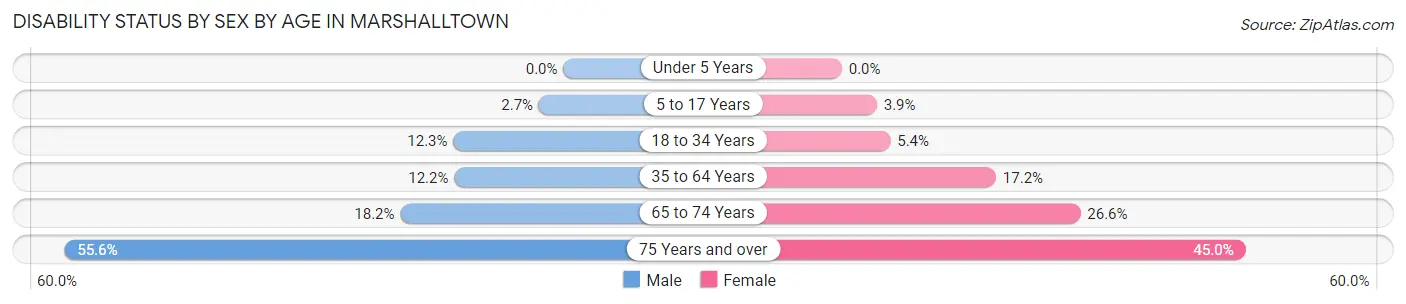
| Age Bracket | Male | Female |
| Under 5 Years | 0 (0.0%) | 0 (0.0%) |
| 5 to 17 Years | 77 (2.7%) | 106 (3.9%) |
| 18 to 34 Years | 381 (12.2%) | 163 (5.4%) |
| 35 to 64 Years | 577 (12.1%) | 759 (17.2%) |
| 65 to 74 Years | 157 (18.1%) | 321 (26.6%) |
| 75 Years and over | 289 (55.6%) | 456 (45.0%) |
Disability Class by Sex by Age in Marshalltown
Disability Class: Hearing Difficulty
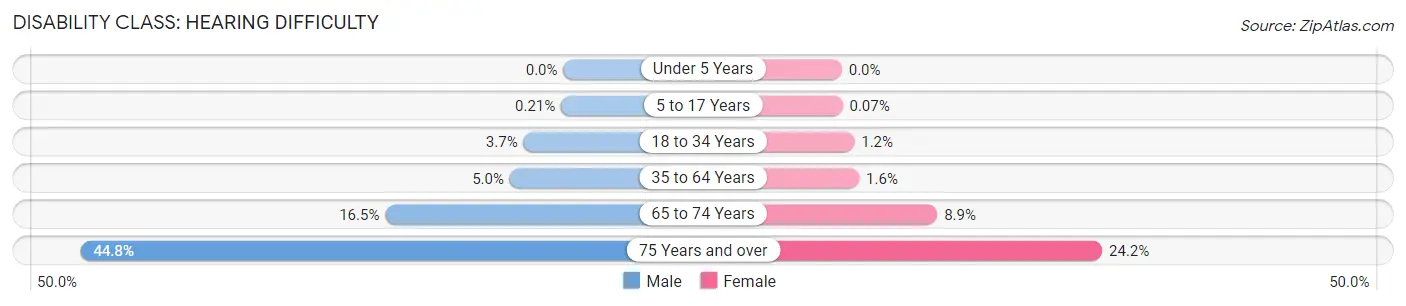
| Age Bracket | Male | Female |
| Under 5 Years | 0 (0.0%) | 0 (0.0%) |
| 5 to 17 Years | 6 (0.2%) | 2 (0.1%) |
| 18 to 34 Years | 115 (3.7%) | 35 (1.2%) |
| 35 to 64 Years | 236 (5.0%) | 71 (1.6%) |
| 65 to 74 Years | 143 (16.5%) | 107 (8.9%) |
| 75 Years and over | 233 (44.8%) | 245 (24.2%) |
Disability Class: Vision Difficulty
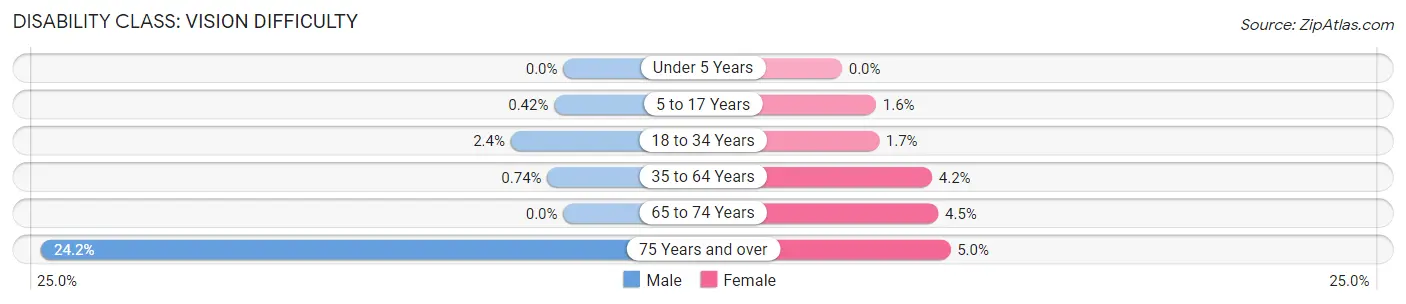
| Age Bracket | Male | Female |
| Under 5 Years | 0 (0.0%) | 0 (0.0%) |
| 5 to 17 Years | 12 (0.4%) | 43 (1.6%) |
| 18 to 34 Years | 76 (2.4%) | 52 (1.7%) |
| 35 to 64 Years | 35 (0.7%) | 185 (4.2%) |
| 65 to 74 Years | 0 (0.0%) | 54 (4.5%) |
| 75 Years and over | 126 (24.2%) | 51 (5.0%) |
Disability Class: Cognitive Difficulty
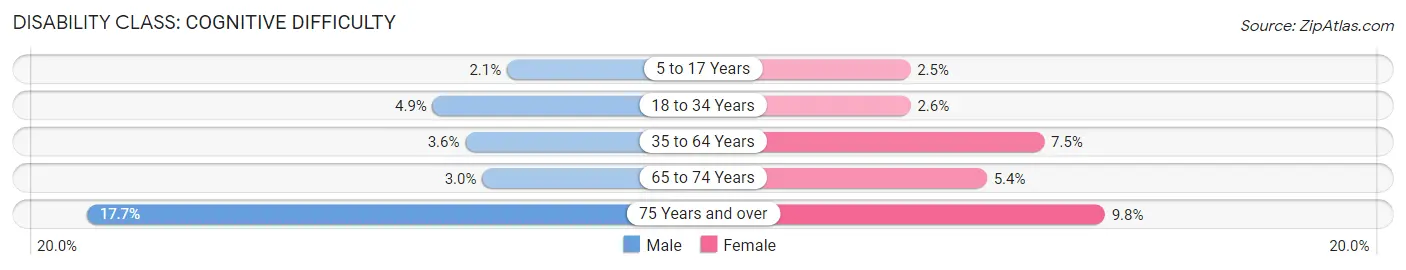
| Age Bracket | Male | Female |
| 5 to 17 Years | 59 (2.1%) | 69 (2.5%) |
| 18 to 34 Years | 151 (4.9%) | 77 (2.5%) |
| 35 to 64 Years | 173 (3.6%) | 332 (7.5%) |
| 65 to 74 Years | 26 (3.0%) | 65 (5.4%) |
| 75 Years and over | 92 (17.7%) | 99 (9.8%) |
Disability Class: Ambulatory Difficulty
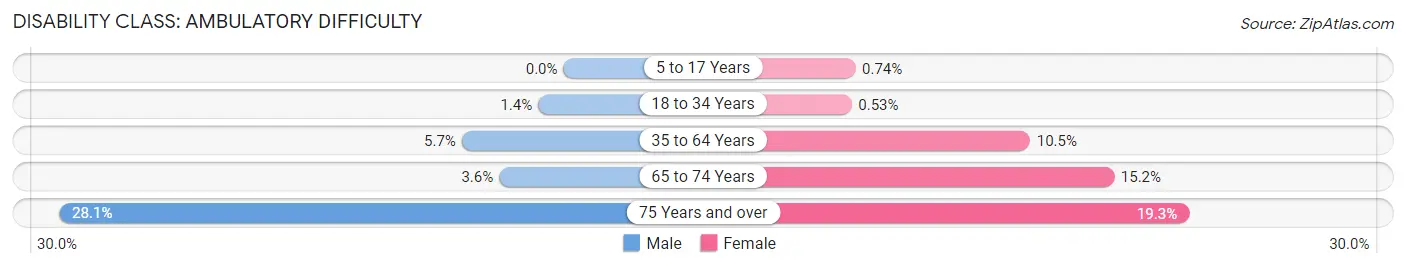
| Age Bracket | Male | Female |
| 5 to 17 Years | 0 (0.0%) | 20 (0.7%) |
| 18 to 34 Years | 44 (1.4%) | 16 (0.5%) |
| 35 to 64 Years | 269 (5.7%) | 463 (10.5%) |
| 65 to 74 Years | 31 (3.6%) | 183 (15.1%) |
| 75 Years and over | 146 (28.1%) | 196 (19.3%) |
Disability Class: Self-Care Difficulty
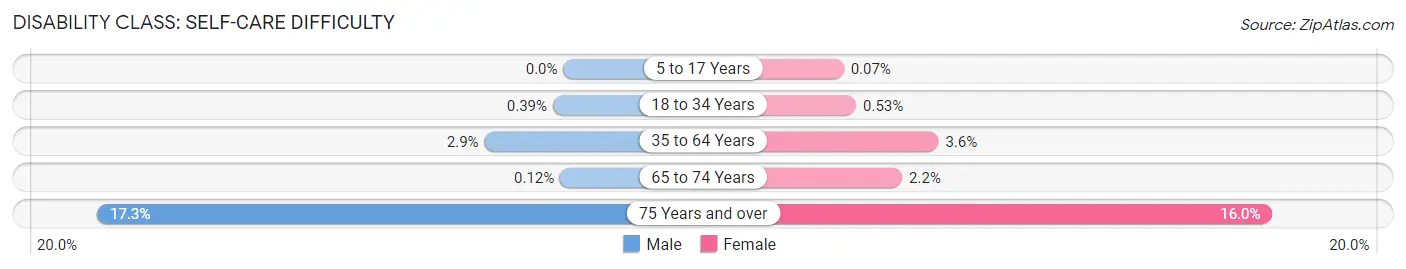
| Age Bracket | Male | Female |
| 5 to 17 Years | 0 (0.0%) | 2 (0.1%) |
| 18 to 34 Years | 12 (0.4%) | 16 (0.5%) |
| 35 to 64 Years | 139 (2.9%) | 159 (3.6%) |
| 65 to 74 Years | 1 (0.1%) | 27 (2.2%) |
| 75 Years and over | 90 (17.3%) | 162 (16.0%) |
Technology Access in Marshalltown
Computing Device Access in Marshalltown
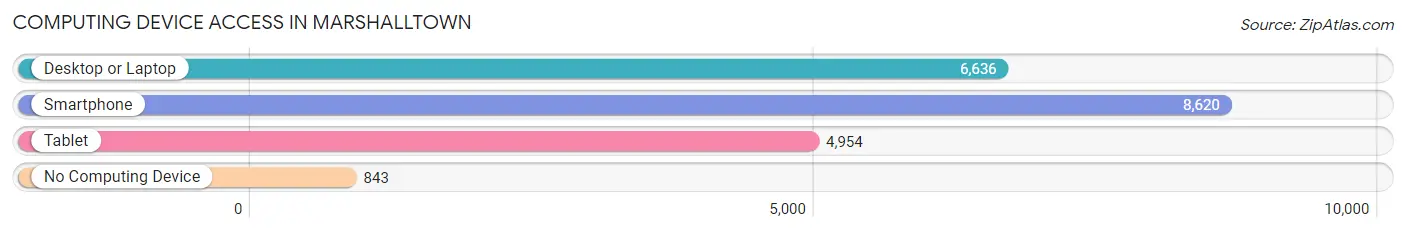
| Device Type | # Households | % Households |
| Desktop or Laptop | 6,636 | 66.5% |
| Smartphone | 8,620 | 86.3% |
| Tablet | 4,954 | 49.6% |
| No Computing Device | 843 | 8.4% |
| Total | 9,984 | 100.0% |
Internet Access in Marshalltown
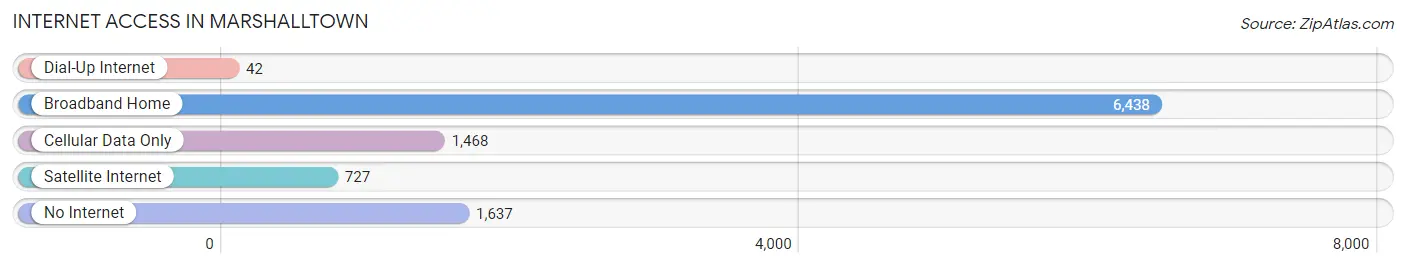
| Internet Type | # Households | % Households |
| Dial-Up Internet | 42 | 0.4% |
| Broadband Home | 6,438 | 64.5% |
| Cellular Data Only | 1,468 | 14.7% |
| Satellite Internet | 727 | 7.3% |
| No Internet | 1,637 | 16.4% |
| Total | 9,984 | 100.0% |
Marshalltown Summary
Marshalltown, Iowa is a city located in Marshall County in the central part of the state. It is the county seat and the largest city in the county. The city is located along the Iowa River and is part of the Des Moines-West Des Moines Metropolitan Statistical Area. As of the 2010 census, the population of Marshalltown was 27,552.
History
Marshalltown was founded in 1853 by William Willard, a settler from Ohio. The city was named after Chief Marshall, a leader of the Meskwaki Native American tribe. The city was incorporated in 1857 and was designated as the county seat of Marshall County.
In the late 19th century, Marshalltown was a major center for the production of brick and tile. The city was also home to several manufacturing companies, including the Marshalltown Company, which produced tools and hardware.
Geography
Marshalltown is located at 42°02'N 92°56'W (42.03, -92.93). The city is situated along the Iowa River and is located in the central part of the state. The city has a total area of 11.2 square miles, of which 11.1 square miles is land and 0.1 square miles is water.
Economy
Marshalltown is a major center for manufacturing and industry. The city is home to several large companies, including Fisher Controls, Fisher Cast Steel, and the Marshalltown Company. The city is also home to several smaller businesses, including a number of restaurants, retail stores, and service providers.
The city is also home to several educational institutions, including Marshalltown Community College, Iowa Valley Community College, and the University of Iowa.
Demographics
As of the 2010 census, the population of Marshalltown was 27,552. The racial makeup of the city was 87.2% White, 5.3% African American, 0.7% Native American, 1.7% Asian, 0.1% Pacific Islander, 2.7% from other races, and 2.1% from two or more races. Hispanic or Latino of any race were 6.3% of the population.
The median income for a household in the city was $41,945, and the median income for a family was $50,945. The per capita income for the city was $20,945. About 11.2% of families and 14.2% of the population were below the poverty line, including 19.2% of those under age 18 and 8.2% of those age 65 or over.
Common Questions
What is Per Capita Income in Marshalltown?
Per Capita income in Marshalltown is $27,718.
What is the Median Family Income in Marshalltown?
Median Family Income in Marshalltown is $80,154.
What is the Median Household income in Marshalltown?
Median Household Income in Marshalltown is $65,000.
What is Income or Wage Gap in Marshalltown?
Income or Wage Gap in Marshalltown is 24.6%.
Women in Marshalltown earn 75.4 cents for every dollar earned by a man.
What is Inequality or Gini Index in Marshalltown?
Inequality or Gini Index in Marshalltown is 0.40.
What is the Total Population of Marshalltown?
Total Population of Marshalltown is 27,511.
What is the Total Male Population of Marshalltown?
Total Male Population of Marshalltown is 13,987.
What is the Total Female Population of Marshalltown?
Total Female Population of Marshalltown is 13,524.
What is the Ratio of Males per 100 Females in Marshalltown?
There are 103.42 Males per 100 Females in Marshalltown.
What is the Ratio of Females per 100 Males in Marshalltown?
There are 96.69 Females per 100 Males in Marshalltown.
What is the Median Population Age in Marshalltown?
Median Population Age in Marshalltown is 35.5 Years.
What is the Average Family Size in Marshalltown
Average Family Size in Marshalltown is 3.4 People.
What is the Average Household Size in Marshalltown
Average Household Size in Marshalltown is 2.6 People.
How Large is the Labor Force in Marshalltown?
There are 13,794 People in the Labor Forcein in Marshalltown.
What is the Percentage of People in the Labor Force in Marshalltown?
65.9% of People are in the Labor Force in Marshalltown.
What is the Unemployment Rate in Marshalltown?
Unemployment Rate in Marshalltown is 6.8%.