Mason City, IA Map & Demographics
Mason City Map
Mason City Overview
$35,089
PER CAPITA INCOME
$78,092
AVG FAMILY INCOME
$60,786
AVG HOUSEHOLD INCOME
32.3%
WAGE / INCOME GAP [ % ]
67.7¢/ $1
WAGE / INCOME GAP [ $ ]
$10,430
FAMILY INCOME DEFICIT
0.41
INEQUALITY / GINI INDEX
27,271
TOTAL POPULATION
13,526
MALE POPULATION
13,745
FEMALE POPULATION
98.41
MALES / 100 FEMALES
101.62
FEMALES / 100 MALES
43.1
MEDIAN AGE
2.7
AVG FAMILY SIZE
2.1
AVG HOUSEHOLD SIZE
14,765
LABOR FORCE [ PEOPLE ]
65.6%
PERCENT IN LABOR FORCE
3.4%
UNEMPLOYMENT RATE
Mason City Zip Codes
Mason City Area Codes
Income in Mason City
Income Overview in Mason City
Per Capita Income in Mason City is $35,089, while median incomes of families and households are $78,092 and $60,786 respectively.
| Characteristic | Number | Measure |
| Per Capita Income | 27,271 | $35,089 |
| Median Family Income | 7,041 | $78,092 |
| Mean Family Income | 7,041 | $91,914 |
| Median Household Income | 12,728 | $60,786 |
| Mean Household Income | 12,728 | $75,095 |
| Income Deficit | 7,041 | $10,430 |
| Wage / Income Gap (%) | 27,271 | 32.35% |
| Wage / Income Gap ($) | 27,271 | 67.65¢ per $1 |
| Gini / Inequality Index | 27,271 | 0.41 |
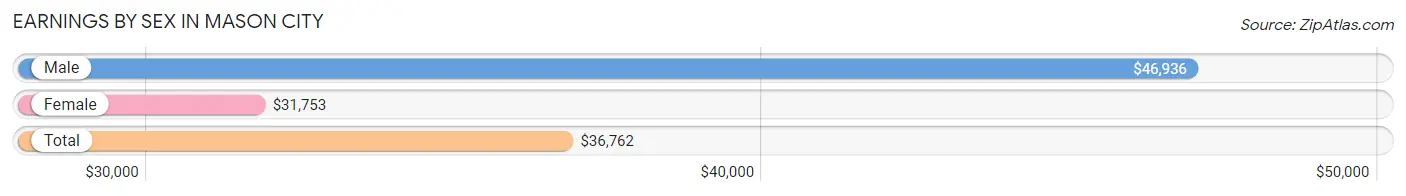
Earnings by Sex in Mason City
Average Earnings in Mason City are $36,762, $46,936 for men and $31,753 for women, a difference of 32.4%.
| Sex | Number | Average Earnings |
| Male | 8,152 (52.4%) | $46,936 |
| Female | 7,412 (47.6%) | $31,753 |
| Total | 15,564 (100.0%) | $36,762 |
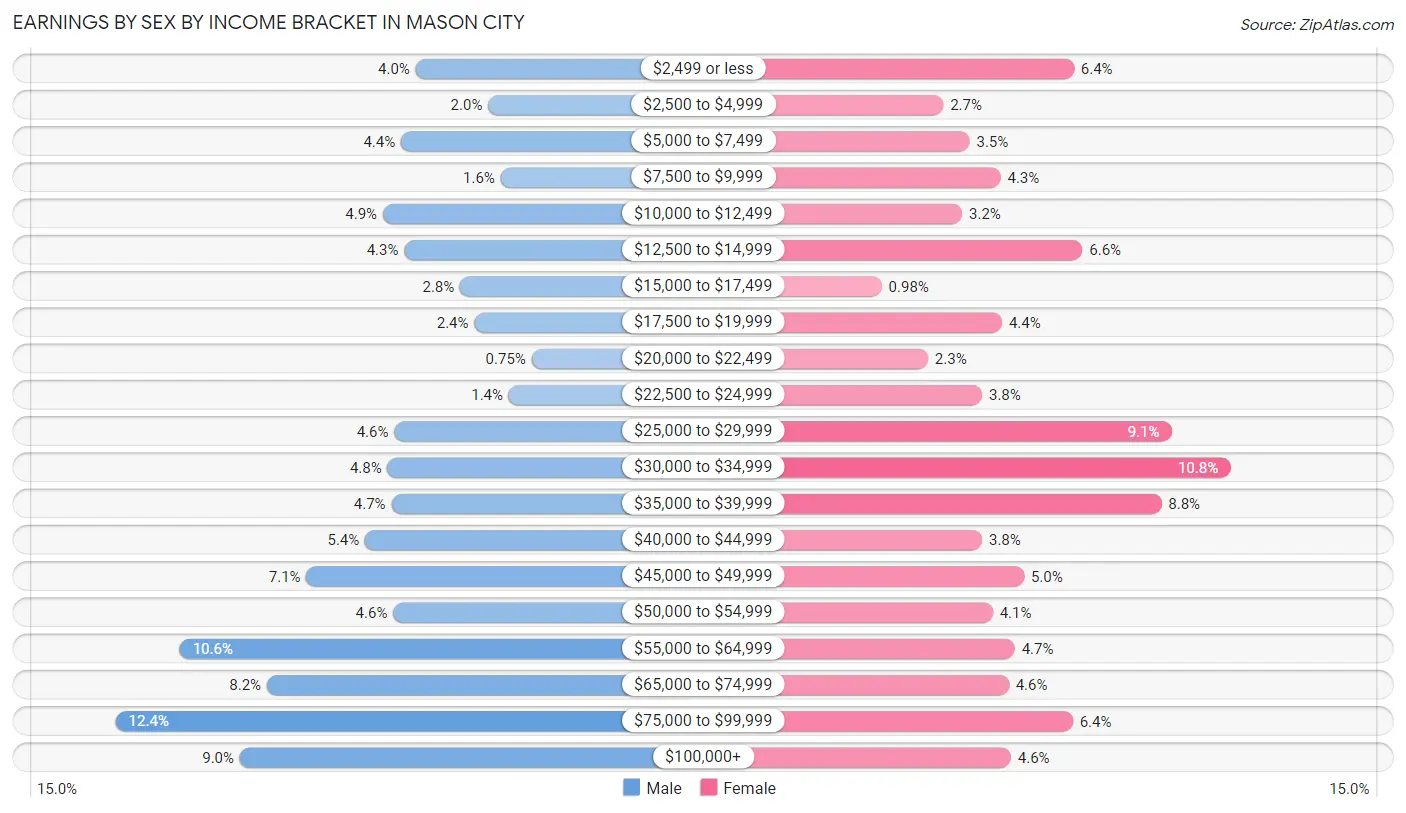
Earnings by Sex by Income Bracket in Mason City
The most common earnings brackets in Mason City are $75,000 to $99,999 for men (1,014 | 12.4%) and $30,000 to $34,999 for women (798 | 10.8%).
| Income | Male | Female |
| $2,499 or less | 327 (4.0%) | 473 (6.4%) |
| $2,500 to $4,999 | 161 (2.0%) | 201 (2.7%) |
| $5,000 to $7,499 | 360 (4.4%) | 256 (3.5%) |
| $7,500 to $9,999 | 132 (1.6%) | 320 (4.3%) |
| $10,000 to $12,499 | 402 (4.9%) | 240 (3.2%) |
| $12,500 to $14,999 | 353 (4.3%) | 491 (6.6%) |
| $15,000 to $17,499 | 225 (2.8%) | 73 (1.0%) |
| $17,500 to $19,999 | 192 (2.4%) | 323 (4.4%) |
| $20,000 to $22,499 | 61 (0.7%) | 169 (2.3%) |
| $22,500 to $24,999 | 113 (1.4%) | 282 (3.8%) |
| $25,000 to $29,999 | 376 (4.6%) | 676 (9.1%) |
| $30,000 to $34,999 | 391 (4.8%) | 798 (10.8%) |
| $35,000 to $39,999 | 382 (4.7%) | 655 (8.8%) |
| $40,000 to $44,999 | 443 (5.4%) | 282 (3.8%) |
| $45,000 to $49,999 | 577 (7.1%) | 369 (5.0%) |
| $50,000 to $54,999 | 378 (4.6%) | 304 (4.1%) |
| $55,000 to $64,999 | 867 (10.6%) | 350 (4.7%) |
| $65,000 to $74,999 | 668 (8.2%) | 337 (4.5%) |
| $75,000 to $99,999 | 1,014 (12.4%) | 471 (6.4%) |
| $100,000+ | 730 (8.9%) | 342 (4.6%) |
| Total | 8,152 (100.0%) | 7,412 (100.0%) |
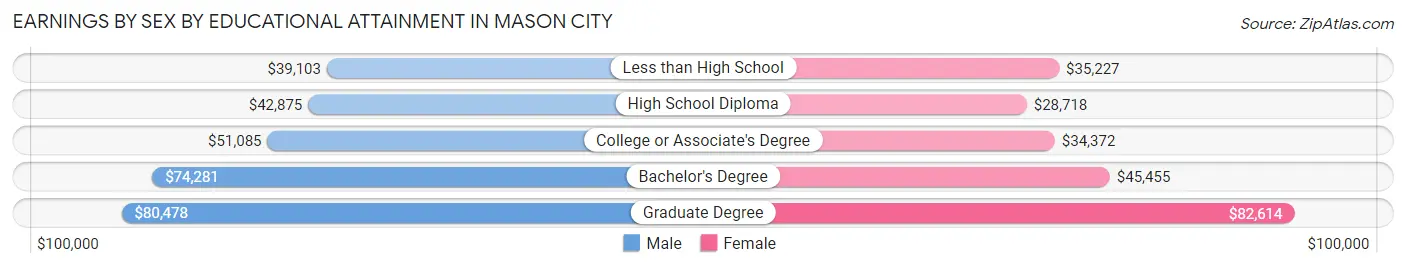
Earnings by Sex by Educational Attainment in Mason City
Average earnings in Mason City are $51,275 for men and $34,664 for women, a difference of 32.4%. Men with an educational attainment of graduate degree enjoy the highest average annual earnings of $80,478, while those with less than high school education earn the least with $39,103. Women with an educational attainment of graduate degree earn the most with the average annual earnings of $82,614, while those with high school diploma education have the smallest earnings of $28,718.
| Educational Attainment | Male Income | Female Income |
| Less than High School | $39,103 | $35,227 |
| High School Diploma | $42,875 | $28,718 |
| College or Associate's Degree | $51,085 | $34,372 |
| Bachelor's Degree | $74,281 | $45,455 |
| Graduate Degree | $80,478 | $82,614 |
| Total | $51,275 | $34,664 |
Family Income in Mason City
Family Income Brackets in Mason City
According to the Mason City family income data, there are 1,465 families falling into the $50,000 to $74,999 income range, which is the most common income bracket and makes up 20.8% of all families. Conversely, the $10,000 to $14,999 income bracket is the least frequent group with only 92 families (1.3%) belonging to this category.
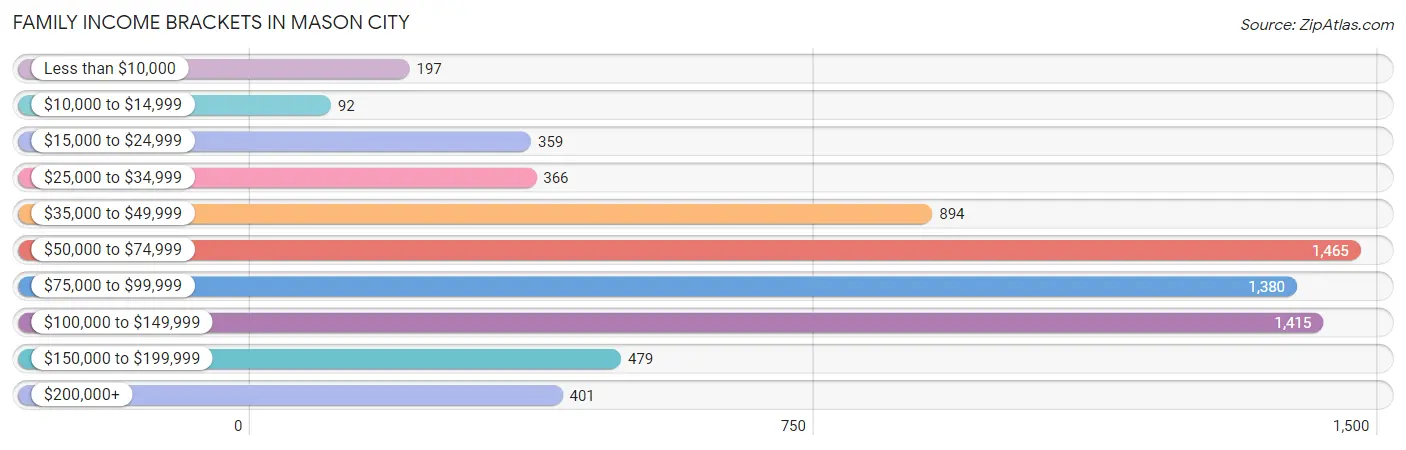
| Income Bracket | # Families | % Families |
| Less than $10,000 | 197 | 2.8% |
| $10,000 to $14,999 | 92 | 1.3% |
| $15,000 to $24,999 | 359 | 5.1% |
| $25,000 to $34,999 | 366 | 5.2% |
| $35,000 to $49,999 | 894 | 12.7% |
| $50,000 to $74,999 | 1,465 | 20.8% |
| $75,000 to $99,999 | 1,380 | 19.6% |
| $100,000 to $149,999 | 1,415 | 20.1% |
| $150,000 to $199,999 | 479 | 6.8% |
| $200,000+ | 401 | 5.7% |
Family Income by Famaliy Size in Mason City
4-person families (909 | 12.9%) account for the highest median family income in Mason City with $103,342 per family, while 2-person families (4,170 | 59.2%) have the highest median income of $35,139 per family member.
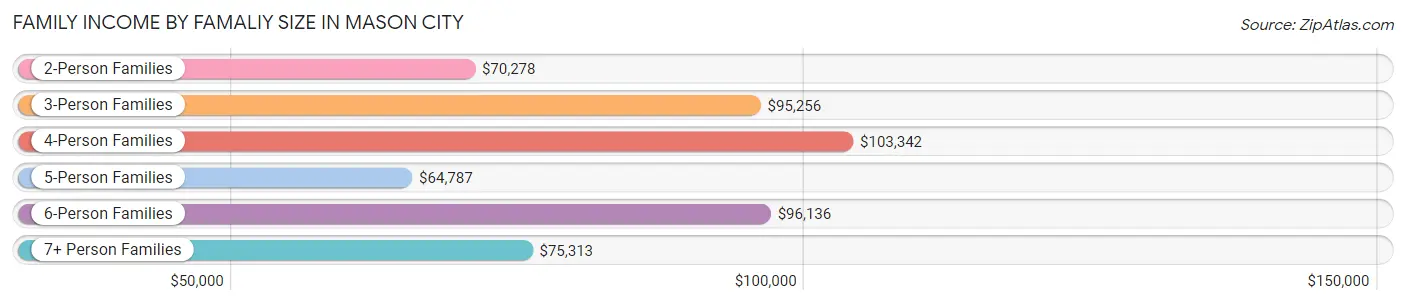
| Income Bracket | # Families | Median Income |
| 2-Person Families | 4,170 (59.2%) | $70,278 |
| 3-Person Families | 1,297 (18.4%) | $95,256 |
| 4-Person Families | 909 (12.9%) | $103,342 |
| 5-Person Families | 536 (7.6%) | $64,787 |
| 6-Person Families | 48 (0.7%) | $96,136 |
| 7+ Person Families | 81 (1.1%) | $75,313 |
| Total | 7,041 (100.0%) | $78,092 |
Family Income by Number of Earners in Mason City
The median family income in Mason City is $78,092, with families comprising 3+ earners (485) having the highest median family income of $135,481, while families with no earners (1,175) have the lowest median family income of $46,270, accounting for 6.9% and 16.7% of families, respectively.
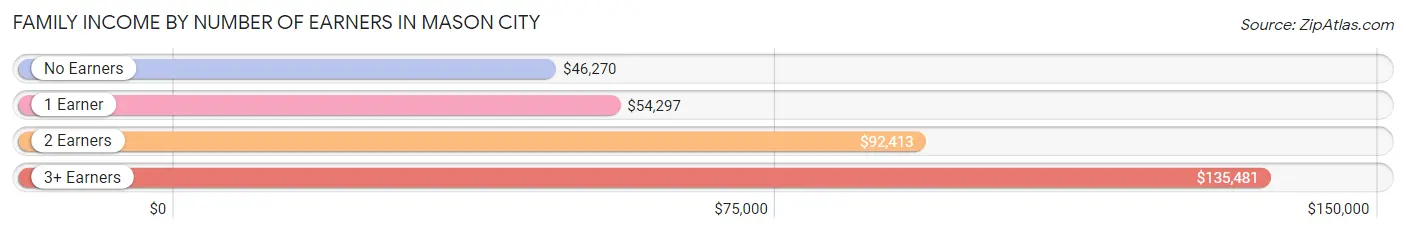
| Number of Earners | # Families | Median Income |
| No Earners | 1,175 (16.7%) | $46,270 |
| 1 Earner | 1,874 (26.6%) | $54,297 |
| 2 Earners | 3,507 (49.8%) | $92,413 |
| 3+ Earners | 485 (6.9%) | $135,481 |
| Total | 7,041 (100.0%) | $78,092 |
Household Income in Mason City
Household Income Brackets in Mason City
With 2,622 households falling in the category, the $50,000 to $74,999 income range is the most frequent in Mason City, accounting for 20.6% of all households. In contrast, only 458 households (3.6%) fall into the less than $10,000 income bracket, making it the least populous group.
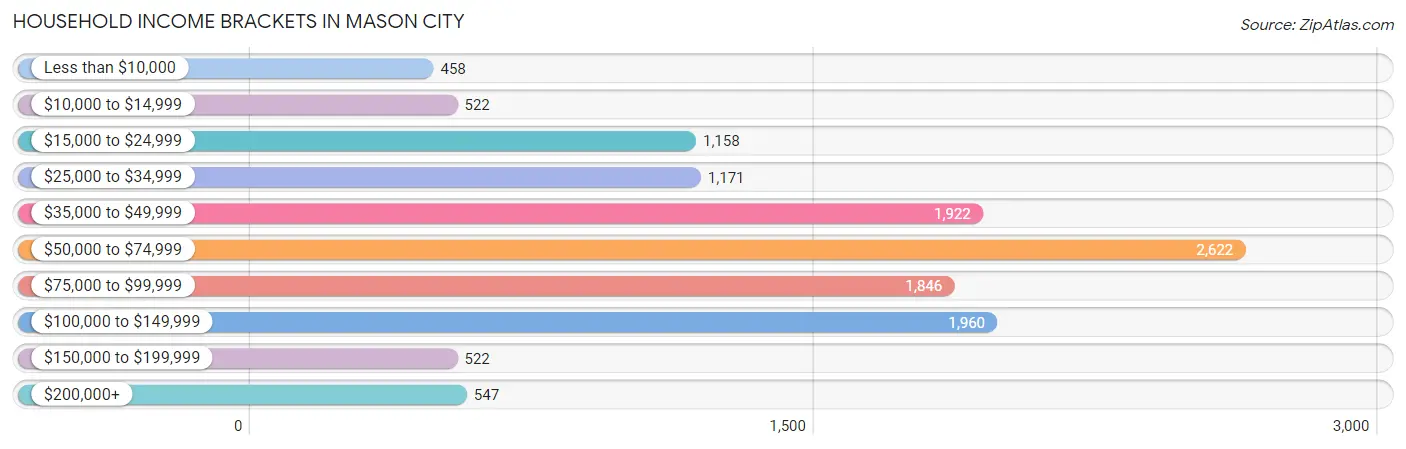
| Income Bracket | # Households | % Households |
| Less than $10,000 | 458 | 3.6% |
| $10,000 to $14,999 | 522 | 4.1% |
| $15,000 to $24,999 | 1,158 | 9.1% |
| $25,000 to $34,999 | 1,171 | 9.2% |
| $35,000 to $49,999 | 1,922 | 15.1% |
| $50,000 to $74,999 | 2,622 | 20.6% |
| $75,000 to $99,999 | 1,846 | 14.5% |
| $100,000 to $149,999 | 1,960 | 15.4% |
| $150,000 to $199,999 | 522 | 4.1% |
| $200,000+ | 547 | 4.3% |
Household Income by Householder Age in Mason City
The median household income in Mason City is $60,786, with the highest median household income of $66,884 found in the 25 to 44 years age bracket for the primary householder. A total of 3,603 households (28.3%) fall into this category. Meanwhile, the 15 to 24 years age bracket for the primary householder has the lowest median household income of $44,934, with 871 households (6.8%) in this group.
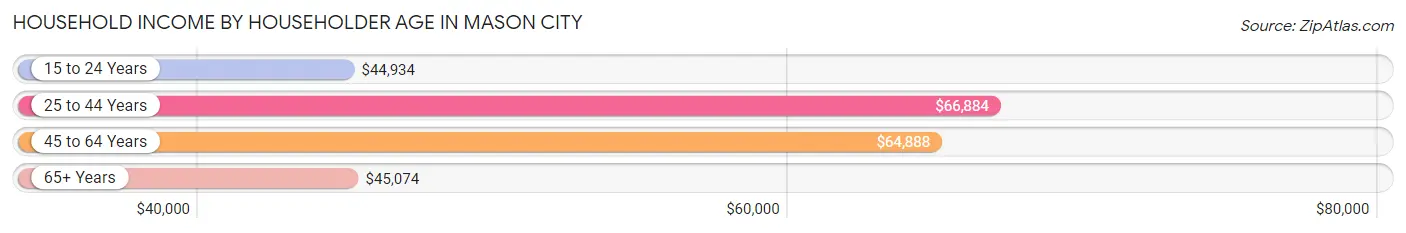
| Income Bracket | # Households | Median Income |
| 15 to 24 Years | 871 (6.8%) | $44,934 |
| 25 to 44 Years | 3,603 (28.3%) | $66,884 |
| 45 to 64 Years | 4,446 (34.9%) | $64,888 |
| 65+ Years | 3,808 (29.9%) | $45,074 |
| Total | 12,728 (100.0%) | $60,786 |
Poverty in Mason City
Income Below Poverty by Sex and Age in Mason City
With 8.9% poverty level for males and 12.2% for females among the residents of Mason City, 5 year old males and 16 and 17 year old females are the most vulnerable to poverty, with 52 males (36.9%) and 122 females (45.0%) in their respective age groups living below the poverty level.
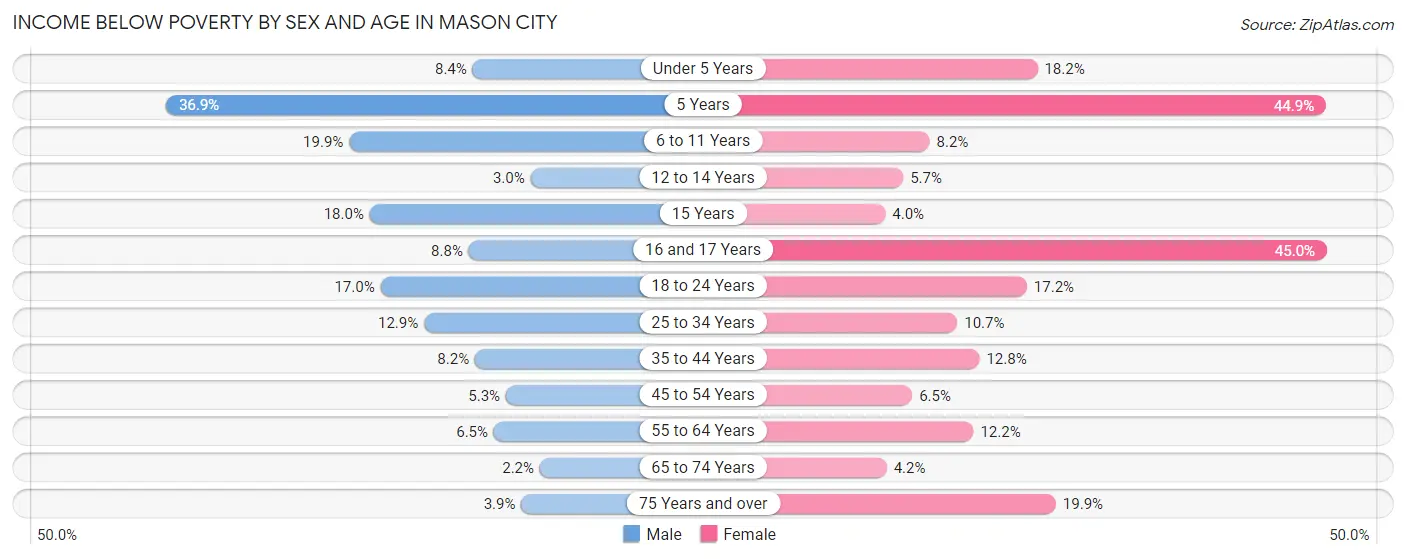
| Age Bracket | Male | Female |
| Under 5 Years | 62 (8.4%) | 97 (18.2%) |
| 5 Years | 52 (36.9%) | 71 (44.9%) |
| 6 to 11 Years | 172 (19.9%) | 69 (8.2%) |
| 12 to 14 Years | 17 (3.0%) | 38 (5.7%) |
| 15 Years | 23 (18.0%) | 4 (4.0%) |
| 16 and 17 Years | 33 (8.8%) | 122 (45.0%) |
| 18 to 24 Years | 177 (17.0%) | 173 (17.2%) |
| 25 to 34 Years | 215 (12.9%) | 185 (10.7%) |
| 35 to 44 Years | 141 (8.2%) | 174 (12.8%) |
| 45 to 54 Years | 86 (5.3%) | 104 (6.5%) |
| 55 to 64 Years | 118 (6.5%) | 243 (12.2%) |
| 65 to 74 Years | 34 (2.2%) | 72 (4.2%) |
| 75 Years and over | 36 (3.9%) | 283 (19.9%) |
| Total | 1,166 (8.9%) | 1,635 (12.2%) |
Income Above Poverty by Sex and Age in Mason City
According to the poverty statistics in Mason City, males aged 65 to 74 years and females aged 15 years are the age groups that are most secure financially, with 97.8% of males and 96.0% of females in these age groups living above the poverty line.
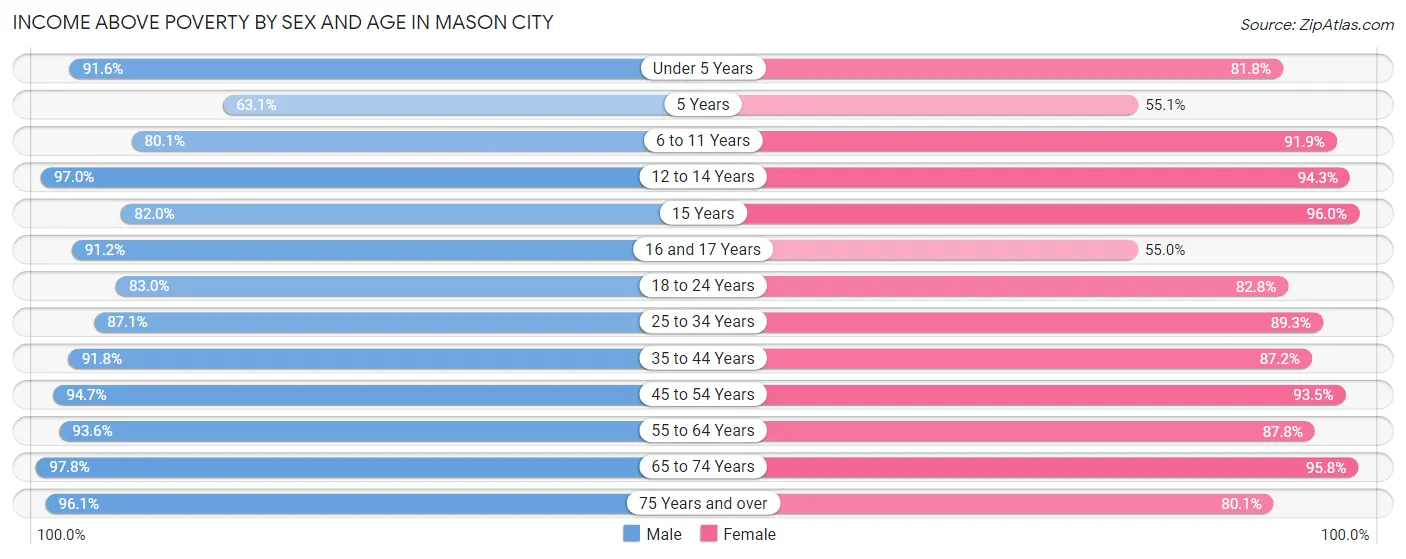
| Age Bracket | Male | Female |
| Under 5 Years | 674 (91.6%) | 437 (81.8%) |
| 5 Years | 89 (63.1%) | 87 (55.1%) |
| 6 to 11 Years | 693 (80.1%) | 778 (91.8%) |
| 12 to 14 Years | 543 (97.0%) | 629 (94.3%) |
| 15 Years | 105 (82.0%) | 95 (96.0%) |
| 16 and 17 Years | 343 (91.2%) | 149 (55.0%) |
| 18 to 24 Years | 866 (83.0%) | 834 (82.8%) |
| 25 to 34 Years | 1,448 (87.1%) | 1,540 (89.3%) |
| 35 to 44 Years | 1,579 (91.8%) | 1,187 (87.2%) |
| 45 to 54 Years | 1,528 (94.7%) | 1,487 (93.5%) |
| 55 to 64 Years | 1,712 (93.5%) | 1,746 (87.8%) |
| 65 to 74 Years | 1,524 (97.8%) | 1,653 (95.8%) |
| 75 Years and over | 888 (96.1%) | 1,141 (80.1%) |
| Total | 11,992 (91.1%) | 11,763 (87.8%) |
Income Below Poverty Among Married-Couple Families in Mason City
The poverty statistics for married-couple families in Mason City show that 2.1% or 111 of the total 5,315 families live below the poverty line. Families with 5 or more children have the highest poverty rate of 6.0%, comprising of 3 families. On the other hand, families with 3 or 4 children have the lowest poverty rate of 0.0%, which includes 0 families.
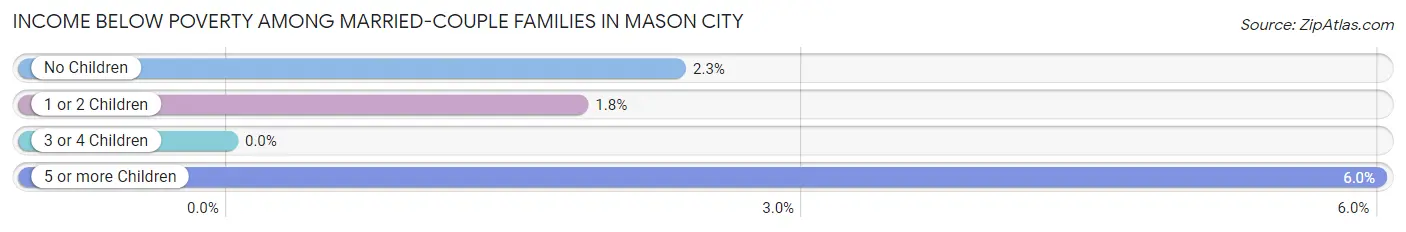
| Children | Above Poverty | Below Poverty |
| No Children | 3,512 (97.7%) | 84 (2.3%) |
| 1 or 2 Children | 1,285 (98.2%) | 24 (1.8%) |
| 3 or 4 Children | 360 (100.0%) | 0 (0.0%) |
| 5 or more Children | 47 (94.0%) | 3 (6.0%) |
| Total | 5,204 (97.9%) | 111 (2.1%) |
Income Below Poverty Among Single-Parent Households in Mason City
According to the poverty data in Mason City, 12.5% or 68 single-father households and 28.6% or 338 single-mother households are living below the poverty line. Among single-father households, those with 3 or 4 children have the highest poverty rate, with 13 households (100.0%) experiencing poverty. Likewise, among single-mother households, those with 3 or 4 children have the highest poverty rate, with 157 households (68.9%) falling below the poverty line.
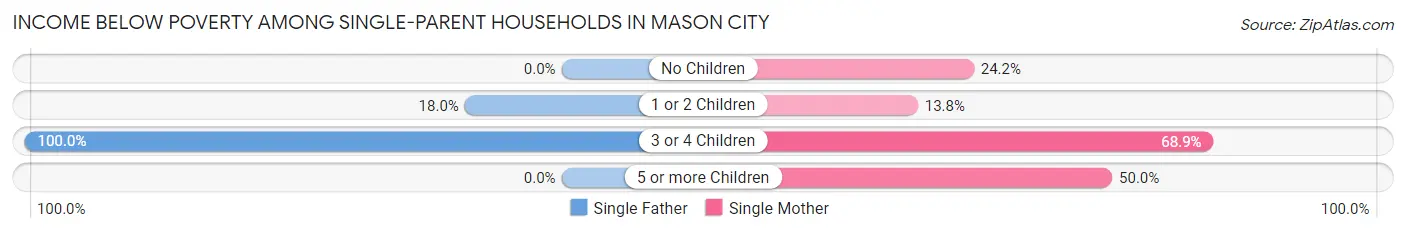
| Children | Single Father | Single Mother |
| No Children | 0 (0.0%) | 94 (24.2%) |
| 1 or 2 Children | 55 (18.0%) | 75 (13.8%) |
| 3 or 4 Children | 13 (100.0%) | 157 (68.9%) |
| 5 or more Children | 0 (0.0%) | 12 (50.0%) |
| Total | 68 (12.5%) | 338 (28.6%) |
Income Below Poverty Among Married-Couple vs Single-Parent Households in Mason City
The poverty data for Mason City shows that 111 of the married-couple family households (2.1%) and 406 of the single-parent households (23.5%) are living below the poverty level. Within the married-couple family households, those with 5 or more children have the highest poverty rate, with 3 households (6.0%) falling below the poverty line. Among the single-parent households, those with 3 or 4 children have the highest poverty rate, with 170 household (70.5%) living below poverty.
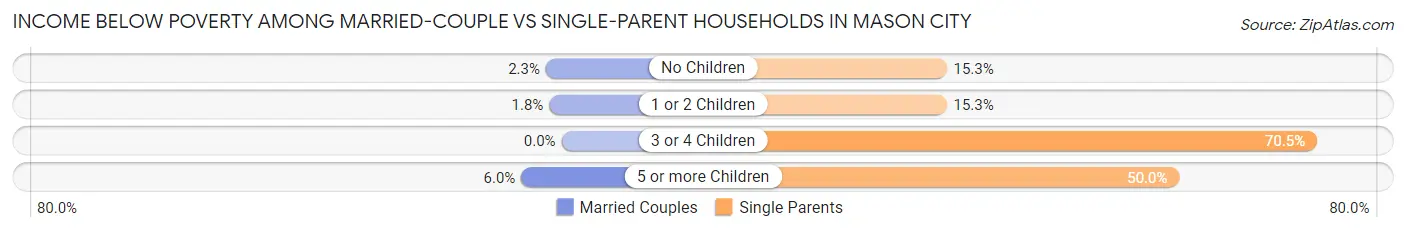
| Children | Married-Couple Families | Single-Parent Households |
| No Children | 84 (2.3%) | 94 (15.3%) |
| 1 or 2 Children | 24 (1.8%) | 130 (15.3%) |
| 3 or 4 Children | 0 (0.0%) | 170 (70.5%) |
| 5 or more Children | 3 (6.0%) | 12 (50.0%) |
| Total | 111 (2.1%) | 406 (23.5%) |
Race in Mason City
The most populous races in Mason City are White / Caucasian (24,789 | 90.9%), Hispanic or Latino (1,794 | 6.6%), and Two or more Races (1,181 | 4.3%).
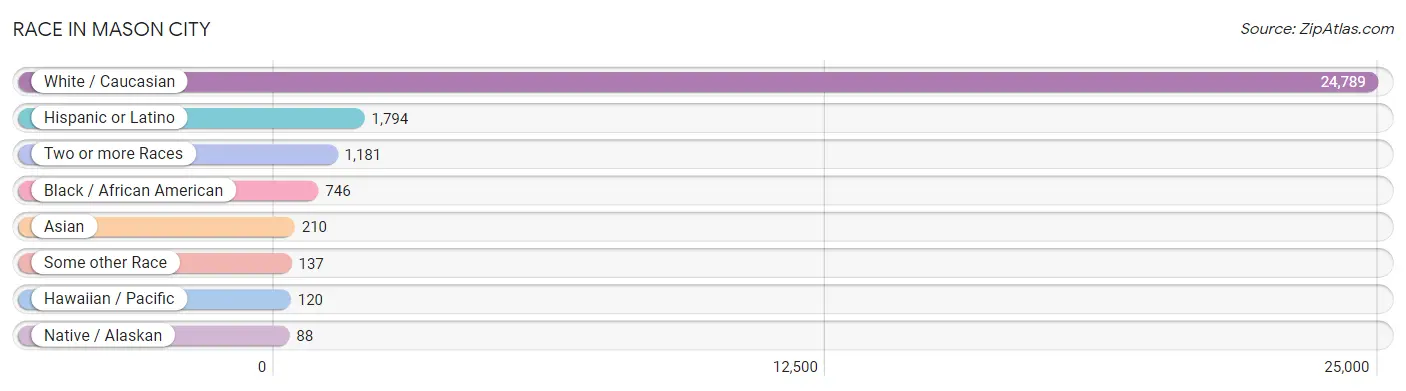
| Race | # Population | % Population |
| Asian | 210 | 0.8% |
| Black / African American | 746 | 2.7% |
| Hawaiian / Pacific | 120 | 0.4% |
| Hispanic or Latino | 1,794 | 6.6% |
| Native / Alaskan | 88 | 0.3% |
| White / Caucasian | 24,789 | 90.9% |
| Two or more Races | 1,181 | 4.3% |
| Some other Race | 137 | 0.5% |
| Total | 27,271 | 100.0% |
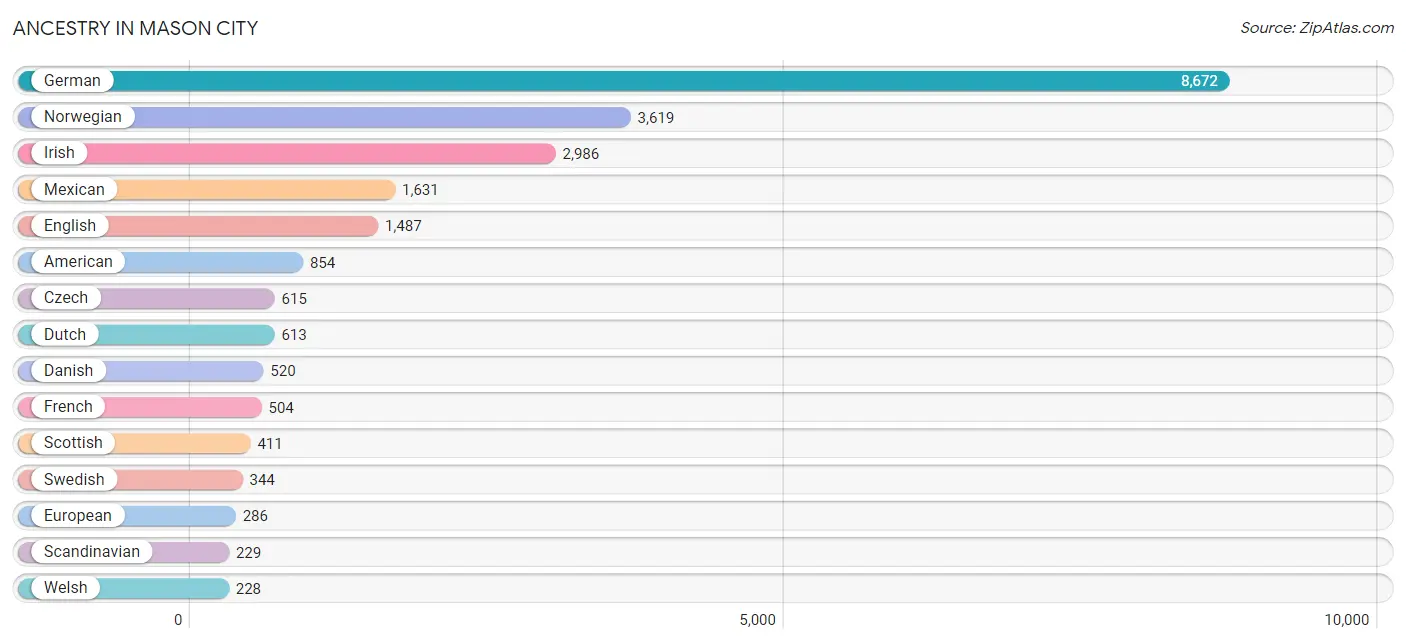
Ancestry in Mason City
The most populous ancestries reported in Mason City are German (8,672 | 31.8%), Norwegian (3,619 | 13.3%), Irish (2,986 | 11.0%), Mexican (1,631 | 6.0%), and English (1,487 | 5.4%), together accounting for 67.4% of all Mason City residents.
| Ancestry | # Population | % Population |
| African | 41 | 0.2% |
| American | 854 | 3.1% |
| Arab | 57 | 0.2% |
| Australian | 5 | 0.0% |
| Austrian | 30 | 0.1% |
| Belgian | 54 | 0.2% |
| Bhutanese | 11 | 0.0% |
| Bolivian | 112 | 0.4% |
| British | 34 | 0.1% |
| Burmese | 25 | 0.1% |
| Canadian | 46 | 0.2% |
| Central American | 1 | 0.0% |
| Central American Indian | 16 | 0.1% |
| Cherokee | 56 | 0.2% |
| Croatian | 8 | 0.0% |
| Czech | 615 | 2.3% |
| Czechoslovakian | 19 | 0.1% |
| Danish | 520 | 1.9% |
| Dutch | 613 | 2.2% |
| Eastern European | 31 | 0.1% |
| English | 1,487 | 5.4% |
| European | 286 | 1.1% |
| Finnish | 10 | 0.0% |
| French | 504 | 1.8% |
| French Canadian | 52 | 0.2% |
| German | 8,672 | 31.8% |
| Ghanaian | 6 | 0.0% |
| Greek | 150 | 0.5% |
| Guatemalan | 1 | 0.0% |
| Hungarian | 31 | 0.1% |
| Icelander | 52 | 0.2% |
| Indian (Asian) | 65 | 0.2% |
| Irish | 2,986 | 11.0% |
| Italian | 64 | 0.2% |
| Kenyan | 7 | 0.0% |
| Korean | 25 | 0.1% |
| Laotian | 4 | 0.0% |
| Lebanese | 12 | 0.0% |
| Lithuanian | 17 | 0.1% |
| Macedonian | 12 | 0.0% |
| Mexican | 1,631 | 6.0% |
| Moroccan | 45 | 0.2% |
| Native Hawaiian | 8 | 0.0% |
| Northern European | 41 | 0.2% |
| Norwegian | 3,619 | 13.3% |
| Pennsylvania German | 21 | 0.1% |
| Polish | 222 | 0.8% |
| Portuguese | 33 | 0.1% |
| Puerto Rican | 27 | 0.1% |
| Russian | 166 | 0.6% |
| Scandinavian | 229 | 0.8% |
| Scotch-Irish | 202 | 0.7% |
| Scottish | 411 | 1.5% |
| Serbian | 25 | 0.1% |
| Sioux | 26 | 0.1% |
| Slovak | 14 | 0.1% |
| South American | 112 | 0.4% |
| Spaniard | 22 | 0.1% |
| Sri Lankan | 162 | 0.6% |
| Subsaharan African | 68 | 0.3% |
| Swedish | 344 | 1.3% |
| Swiss | 43 | 0.2% |
| Ukrainian | 12 | 0.0% |
| Welsh | 228 | 0.8% | View All 64 Rows |
Immigrants in Mason City
The most numerous immigrant groups reported in Mason City came from Latin America (239 | 0.9%), Central America (235 | 0.9%), Mexico (235 | 0.9%), Asia (184 | 0.7%), and South Eastern Asia (170 | 0.6%), together accounting for 3.9% of all Mason City residents.
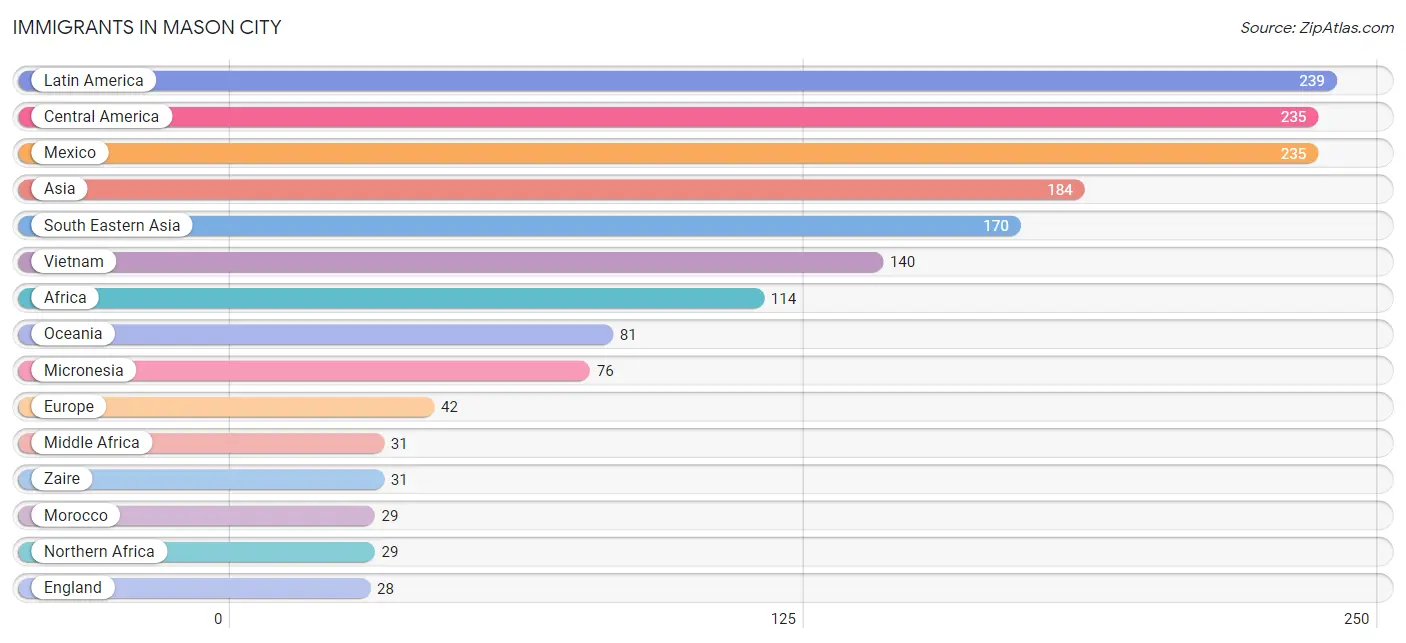
| Immigration Origin | # Population | % Population |
| Africa | 114 | 0.4% |
| Asia | 184 | 0.7% |
| Australia | 5 | 0.0% |
| Central America | 235 | 0.9% |
| Colombia | 4 | 0.0% |
| Eastern Africa | 7 | 0.0% |
| Eastern Asia | 6 | 0.0% |
| Eastern Europe | 14 | 0.1% |
| England | 28 | 0.1% |
| Europe | 42 | 0.2% |
| Ghana | 6 | 0.0% |
| Indonesia | 11 | 0.0% |
| Kenya | 7 | 0.0% |
| Korea | 6 | 0.0% |
| Latin America | 239 | 0.9% |
| Mexico | 235 | 0.9% |
| Micronesia | 76 | 0.3% |
| Middle Africa | 31 | 0.1% |
| Morocco | 29 | 0.1% |
| Northern Africa | 29 | 0.1% |
| Northern Europe | 28 | 0.1% |
| Oceania | 81 | 0.3% |
| Pakistan | 8 | 0.0% |
| Philippines | 19 | 0.1% |
| Russia | 14 | 0.1% |
| South America | 4 | 0.0% |
| South Central Asia | 8 | 0.0% |
| South Eastern Asia | 170 | 0.6% |
| Vietnam | 140 | 0.5% |
| Western Africa | 20 | 0.1% |
| Zaire | 31 | 0.1% | View All 31 Rows |
Sex and Age in Mason City
Sex and Age in Mason City
The most populous age groups in Mason City are 10 to 14 Years (1,128 | 8.3%) for men and 60 to 64 Years (1,178 | 8.6%) for women.
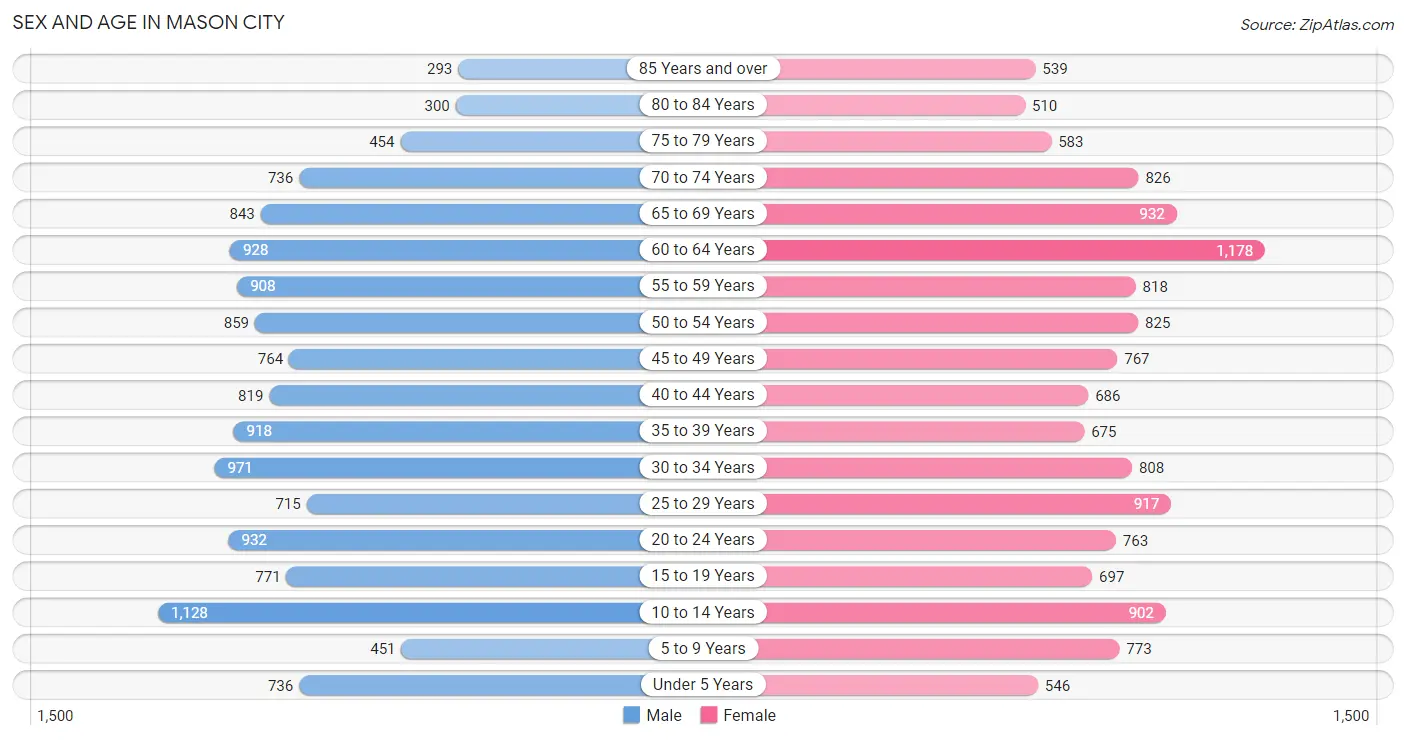
| Age Bracket | Male | Female |
| Under 5 Years | 736 (5.4%) | 546 (4.0%) |
| 5 to 9 Years | 451 (3.3%) | 773 (5.6%) |
| 10 to 14 Years | 1,128 (8.3%) | 902 (6.6%) |
| 15 to 19 Years | 771 (5.7%) | 697 (5.1%) |
| 20 to 24 Years | 932 (6.9%) | 763 (5.6%) |
| 25 to 29 Years | 715 (5.3%) | 917 (6.7%) |
| 30 to 34 Years | 971 (7.2%) | 808 (5.9%) |
| 35 to 39 Years | 918 (6.8%) | 675 (4.9%) |
| 40 to 44 Years | 819 (6.1%) | 686 (5.0%) |
| 45 to 49 Years | 764 (5.7%) | 767 (5.6%) |
| 50 to 54 Years | 859 (6.4%) | 825 (6.0%) |
| 55 to 59 Years | 908 (6.7%) | 818 (5.9%) |
| 60 to 64 Years | 928 (6.9%) | 1,178 (8.6%) |
| 65 to 69 Years | 843 (6.2%) | 932 (6.8%) |
| 70 to 74 Years | 736 (5.4%) | 826 (6.0%) |
| 75 to 79 Years | 454 (3.4%) | 583 (4.2%) |
| 80 to 84 Years | 300 (2.2%) | 510 (3.7%) |
| 85 Years and over | 293 (2.2%) | 539 (3.9%) |
| Total | 13,526 (100.0%) | 13,745 (100.0%) |
Families and Households in Mason City
Median Family Size in Mason City
The median family size in Mason City is 2.73 persons per family, with single female/mother families (1,183 | 16.8%) accounting for the largest median family size of 2.76 persons per family. On the other hand, single male/father families (543 | 7.7%) represent the smallest median family size with 2.59 persons per family.
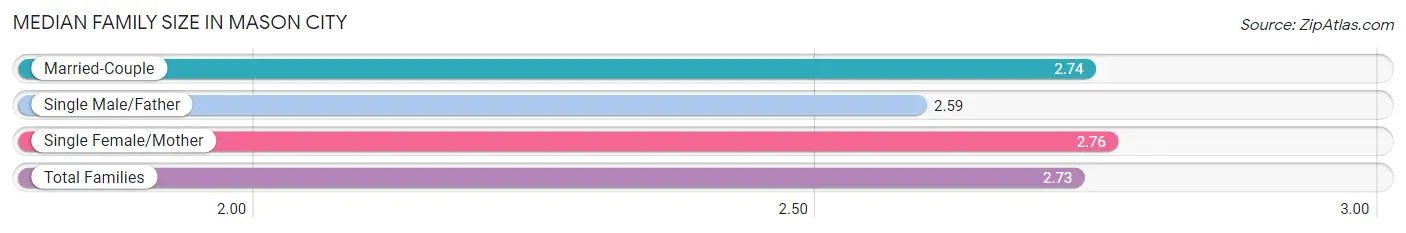
| Family Type | # Families | Family Size |
| Married-Couple | 5,315 (75.5%) | 2.74 |
| Single Male/Father | 543 (7.7%) | 2.59 |
| Single Female/Mother | 1,183 (16.8%) | 2.76 |
| Total Families | 7,041 (100.0%) | 2.73 |
Median Household Size in Mason City
The median household size in Mason City is 2.08 persons per household, with single female/mother households (1,183 | 9.3%) accounting for the largest median household size of 3.05 persons per household. non-family households (5,687 | 44.7%) represent the smallest median household size with 1.17 persons per household.
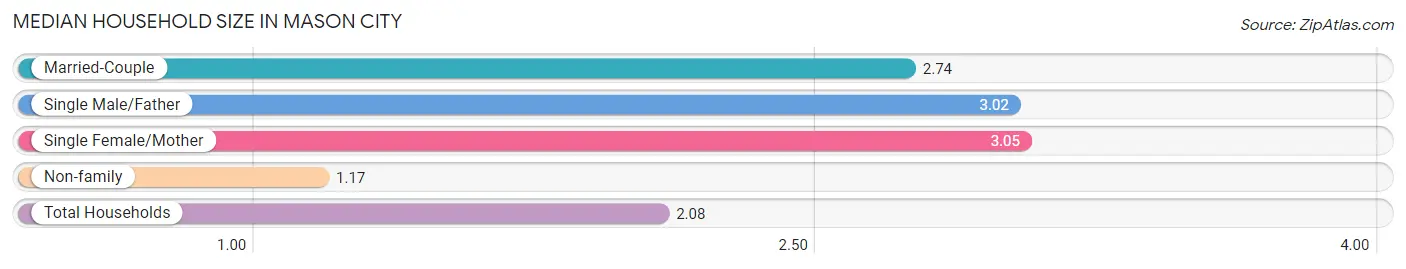
| Household Type | # Households | Household Size |
| Married-Couple | 5,315 (41.8%) | 2.74 |
| Single Male/Father | 543 (4.3%) | 3.02 |
| Single Female/Mother | 1,183 (9.3%) | 3.05 |
| Non-family | 5,687 (44.7%) | 1.17 |
| Total Households | 12,728 (100.0%) | 2.08 |
Household Size by Marriage Status in Mason City
Out of a total of 12,728 households in Mason City, 7,041 (55.3%) are family households, while 5,687 (44.7%) are nonfamily households. The most numerous type of family households are 2-person households, comprising 3,853, and the most common type of nonfamily households are 1-person households, comprising 4,769.
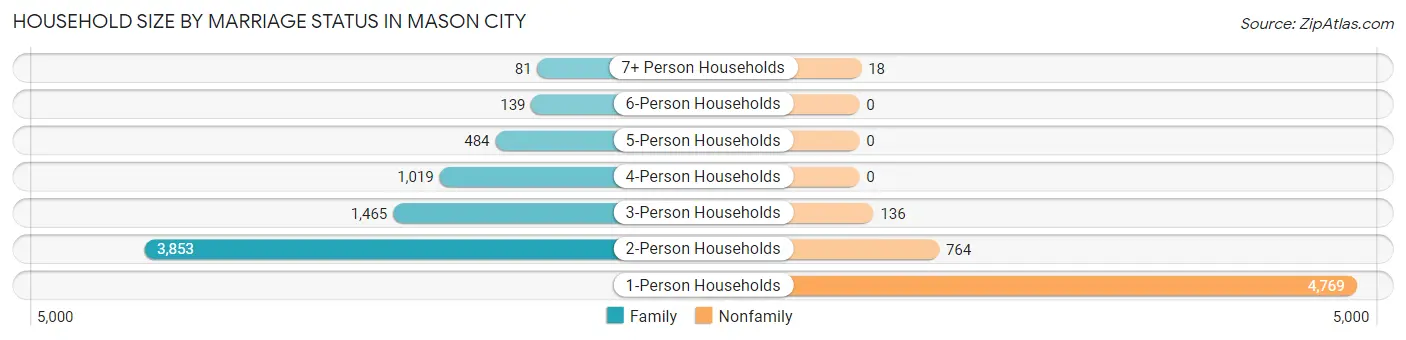
| Household Size | Family Households | Nonfamily Households |
| 1-Person Households | - | 4,769 (37.5%) |
| 2-Person Households | 3,853 (30.3%) | 764 (6.0%) |
| 3-Person Households | 1,465 (11.5%) | 136 (1.1%) |
| 4-Person Households | 1,019 (8.0%) | 0 (0.0%) |
| 5-Person Households | 484 (3.8%) | 0 (0.0%) |
| 6-Person Households | 139 (1.1%) | 0 (0.0%) |
| 7+ Person Households | 81 (0.6%) | 18 (0.1%) |
| Total | 7,041 (55.3%) | 5,687 (44.7%) |
Female Fertility in Mason City
Fertility by Age in Mason City
Average fertility rate in Mason City is 117.0 births per 1,000 women. Women in the age bracket of 20 to 34 years have the highest fertility rate with 188.0 births per 1,000 women. Women in the age bracket of 20 to 34 years acount for 73.4% of all women with births.
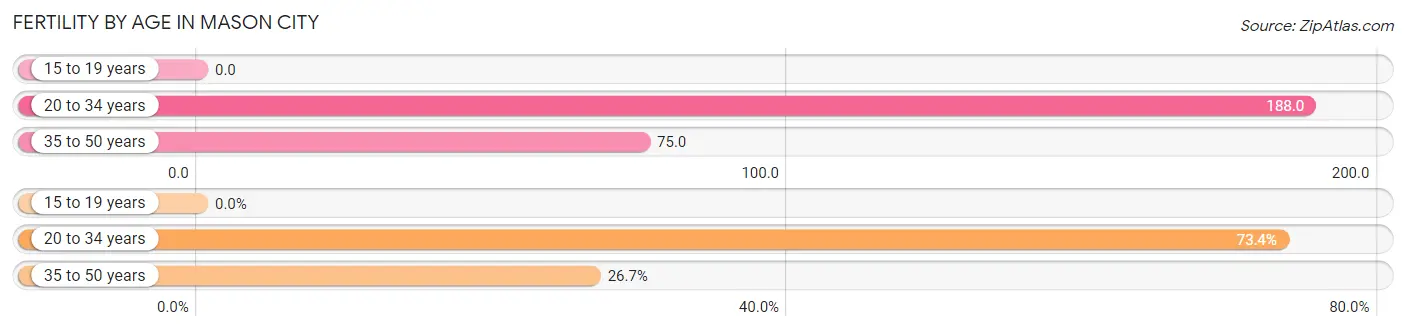
| Age Bracket | Women with Births | Births / 1,000 Women |
| 15 to 19 years | 0 (0.0%) | 0.0 |
| 20 to 34 years | 468 (73.4%) | 188.0 |
| 35 to 50 years | 170 (26.7%) | 75.0 |
| Total | 638 (100.0%) | 117.0 |
Fertility by Age by Marriage Status in Mason City
73.4% of women with births (638) in Mason City are married. The highest percentage of unmarried women with births falls into 20 to 34 years age bracket with 33.3% of them unmarried at the time of birth, while the lowest percentage of unmarried women with births belong to 35 to 50 years age bracket with 8.2% of them unmarried.
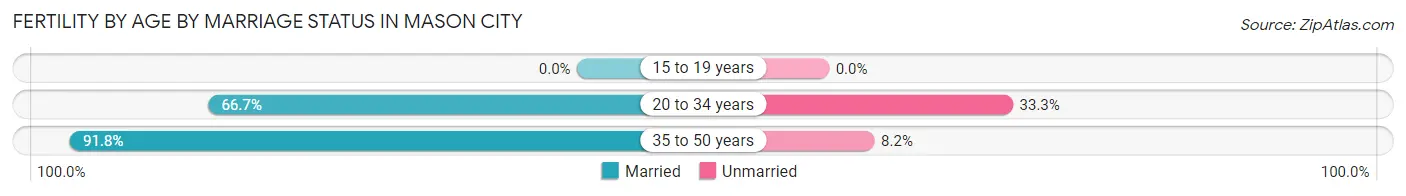
| Age Bracket | Married | Unmarried |
| 15 to 19 years | 0 (0.0%) | 0 (0.0%) |
| 20 to 34 years | 312 (66.7%) | 156 (33.3%) |
| 35 to 50 years | 156 (91.8%) | 14 (8.2%) |
| Total | 468 (73.4%) | 170 (26.7%) |
Fertility by Education in Mason City
Average fertility rate in Mason City is 117.0 births per 1,000 women. Women with the education attainment of less than high school have the highest fertility rate of 194.0 births per 1,000 women, while women with the education attainment of bachelor's degree have the lowest fertility at 40.0 births per 1,000 women. Women with the education attainment of college or associate's degree represent 41.1% of all women with births.
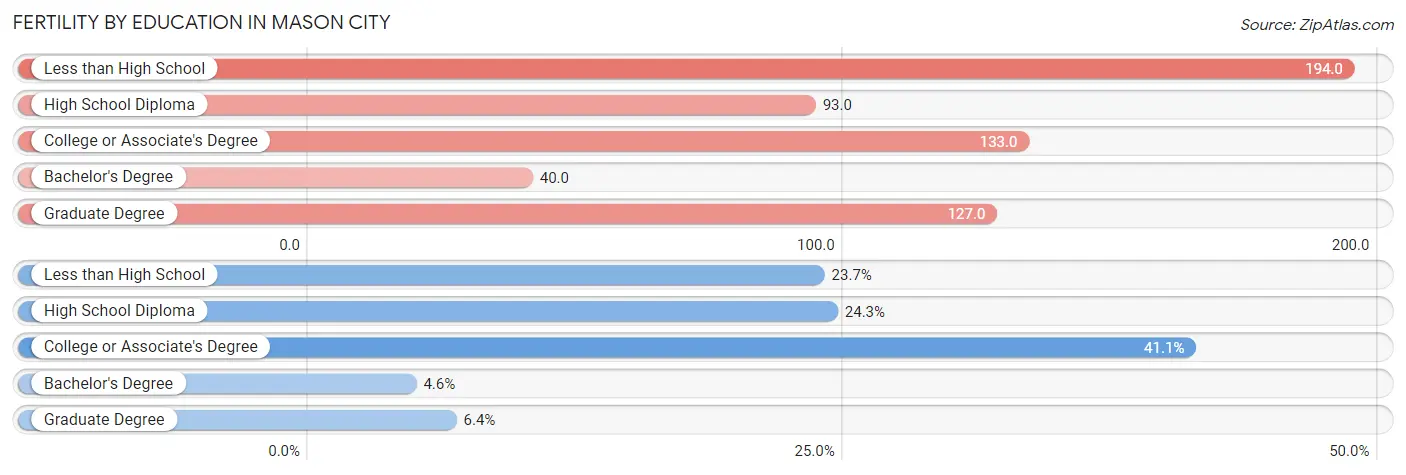
| Educational Attainment | Women with Births | Births / 1,000 Women |
| Less than High School | 151 (23.7%) | 194.0 |
| High School Diploma | 155 (24.3%) | 93.0 |
| College or Associate's Degree | 262 (41.1%) | 133.0 |
| Bachelor's Degree | 29 (4.5%) | 40.0 |
| Graduate Degree | 41 (6.4%) | 127.0 |
| Total | 638 (100.0%) | 117.0 |
Fertility by Education by Marriage Status in Mason City
26.7% of women with births in Mason City are unmarried. Women with the educational attainment of bachelor's degree are most likely to be married with 100.0% of them married at childbirth, while women with the educational attainment of high school diploma are least likely to be married with 42.6% of them unmarried at childbirth.
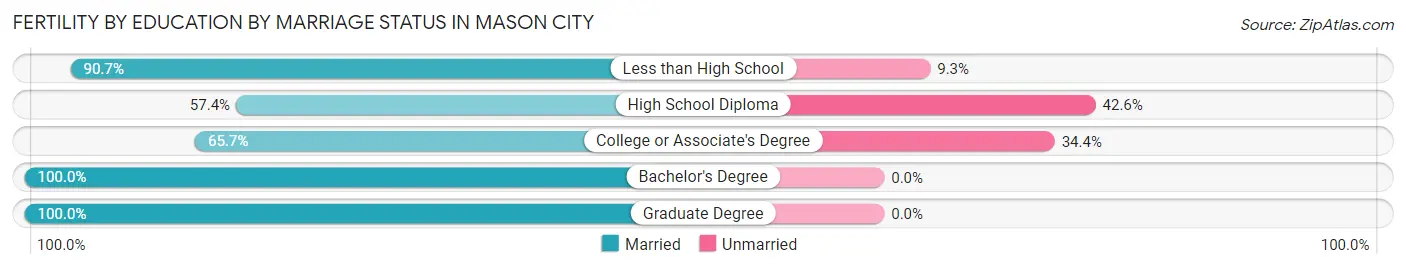
| Educational Attainment | Married | Unmarried |
| Less than High School | 137 (90.7%) | 14 (9.3%) |
| High School Diploma | 89 (57.4%) | 66 (42.6%) |
| College or Associate's Degree | 172 (65.6%) | 90 (34.4%) |
| Bachelor's Degree | 29 (100.0%) | 0 (0.0%) |
| Graduate Degree | 41 (100.0%) | 0 (0.0%) |
| Total | 468 (73.4%) | 170 (26.7%) |
Employment Characteristics in Mason City
Employment by Class of Employer in Mason City
Among the 14,034 employed individuals in Mason City, private company employees (9,998 | 71.2%), not-for-profit organizations (1,268 | 9.0%), and local government employees (1,035 | 7.4%) make up the most common classes of employment.
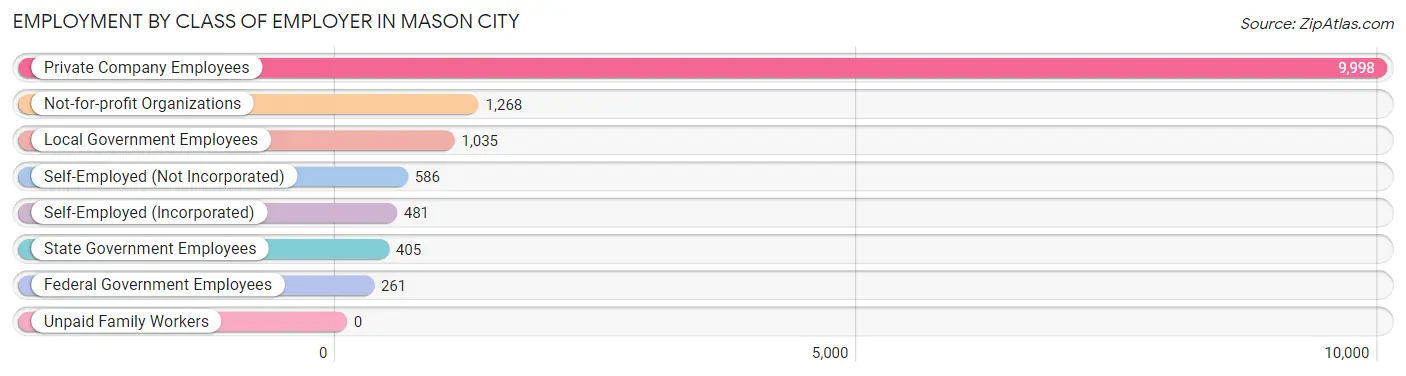
| Employer Class | # Employees | % Employees |
| Private Company Employees | 9,998 | 71.2% |
| Self-Employed (Incorporated) | 481 | 3.4% |
| Self-Employed (Not Incorporated) | 586 | 4.2% |
| Not-for-profit Organizations | 1,268 | 9.0% |
| Local Government Employees | 1,035 | 7.4% |
| State Government Employees | 405 | 2.9% |
| Federal Government Employees | 261 | 1.9% |
| Unpaid Family Workers | 0 | 0.0% |
| Total | 14,034 | 100.0% |
Employment Status by Age in Mason City
According to the labor force statistics for Mason City, out of the total population over 16 years of age (22,507), 65.6% or 14,765 individuals are in the labor force, with 3.4% or 502 of them unemployed. The age group with the highest labor force participation rate is 25 to 29 years, with 90.4% or 1,475 individuals in the labor force. Within the labor force, the 16 to 19 years age range has the highest percentage of unemployed individuals, with 14.5% or 121 of them being unemployed.
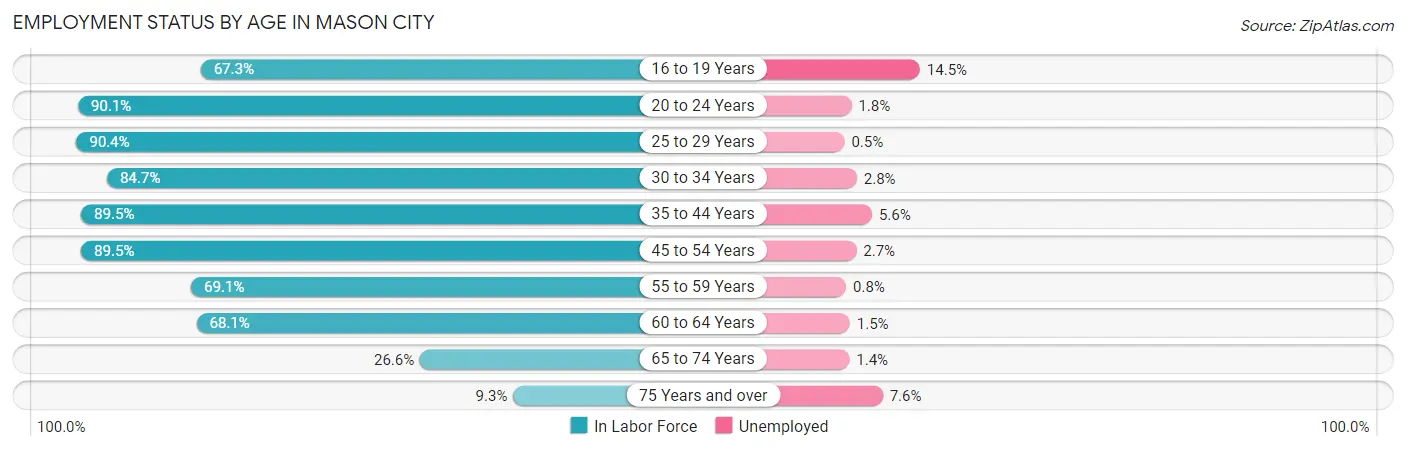
| Age Bracket | In Labor Force | Unemployed |
| 16 to 19 Years | 835 (67.3%) | 121 (14.5%) |
| 20 to 24 Years | 1,527 (90.1%) | 27 (1.8%) |
| 25 to 29 Years | 1,475 (90.4%) | 7 (0.5%) |
| 30 to 34 Years | 1,507 (84.7%) | 42 (2.8%) |
| 35 to 44 Years | 2,773 (89.5%) | 155 (5.6%) |
| 45 to 54 Years | 2,877 (89.5%) | 78 (2.7%) |
| 55 to 59 Years | 1,193 (69.1%) | 10 (0.8%) |
| 60 to 64 Years | 1,434 (68.1%) | 22 (1.5%) |
| 65 to 74 Years | 888 (26.6%) | 12 (1.4%) |
| 75 Years and over | 249 (9.3%) | 19 (7.6%) |
| Total | 14,765 (65.6%) | 502 (3.4%) |
Employment Status by Educational Attainment in Mason City
According to labor force statistics for Mason City, 83.1% of individuals (11,265) out of the total population between 25 and 64 years of age (13,556) are in the labor force, with 2.8% or 315 of them being unemployed. The group with the highest labor force participation rate are those with the educational attainment of bachelor's degree or higher, with 91.6% or 2,689 individuals in the labor force. Within the labor force, individuals with college / associate degree education have the highest percentage of unemployment, with 5.2% or 207 of them being unemployed.
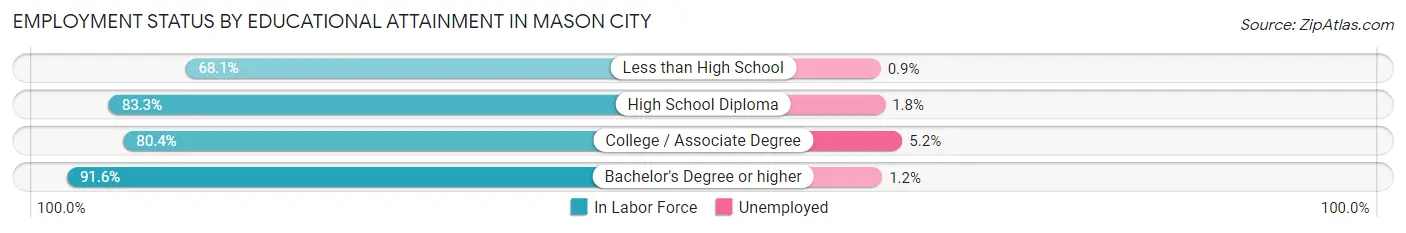
| Educational Attainment | In Labor Force | Unemployed |
| Less than High School | 588 (68.1%) | 8 (0.9%) |
| High School Diploma | 3,998 (83.3%) | 86 (1.8%) |
| College / Associate Degree | 3,985 (80.4%) | 258 (5.2%) |
| Bachelor's Degree or higher | 2,689 (91.6%) | 35 (1.2%) |
| Total | 11,265 (83.1%) | 380 (2.8%) |
Employment Occupations by Sex in Mason City
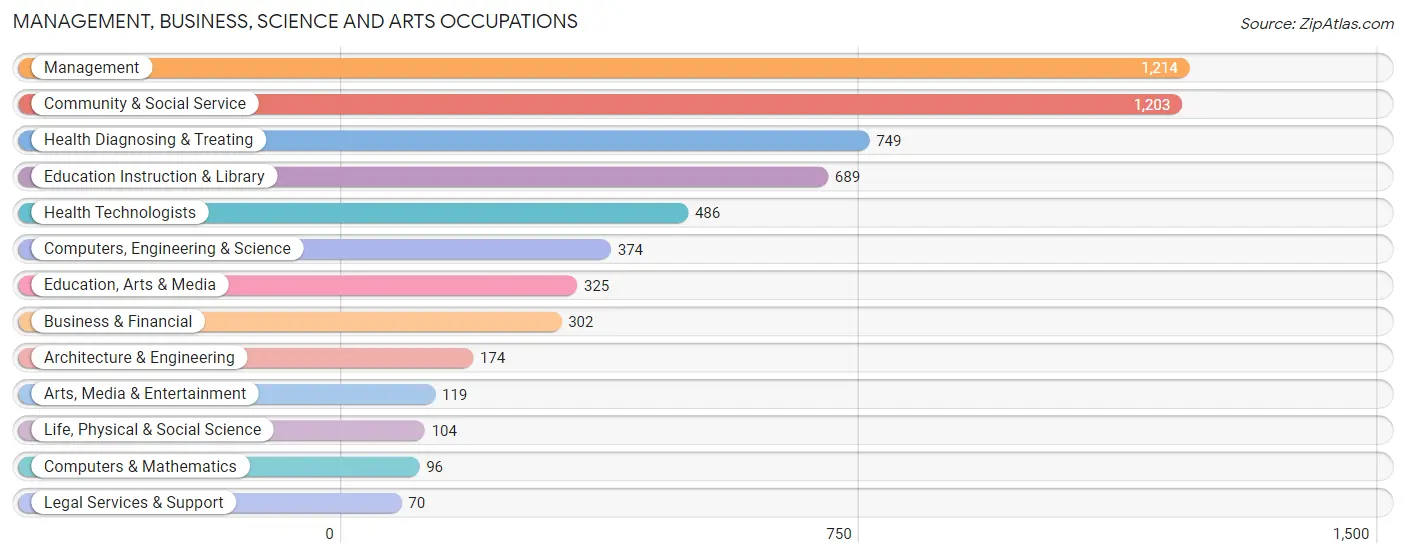
Management, Business, Science and Arts Occupations
The most common Management, Business, Science and Arts occupations in Mason City are Management (1,214 | 8.5%), Community & Social Service (1,203 | 8.5%), Health Diagnosing & Treating (749 | 5.3%), Education Instruction & Library (689 | 4.8%), and Health Technologists (486 | 3.4%).
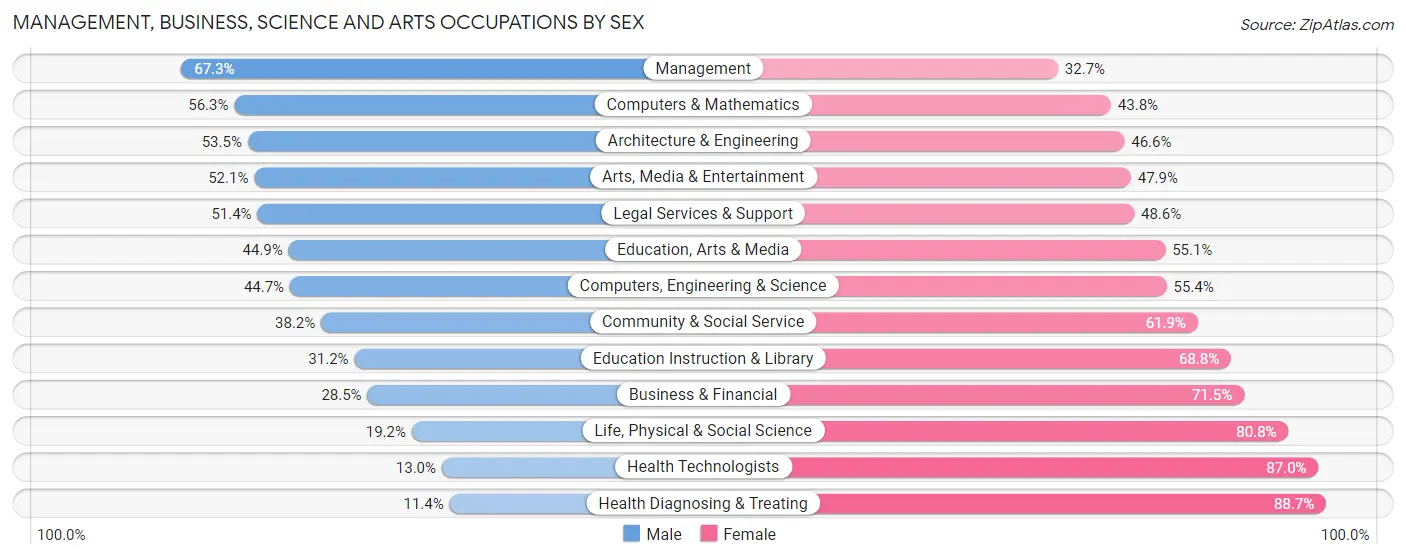
Management, Business, Science and Arts Occupations by Sex
Within the Management, Business, Science and Arts occupations in Mason City, the most male-oriented occupations are Management (67.3%), Computers & Mathematics (56.2%), and Architecture & Engineering (53.4%), while the most female-oriented occupations are Health Diagnosing & Treating (88.6%), Health Technologists (87.0%), and Life, Physical & Social Science (80.8%).
| Occupation | Male | Female |
| Management | 817 (67.3%) | 397 (32.7%) |
| Business & Financial | 86 (28.5%) | 216 (71.5%) |
| Computers, Engineering & Science | 167 (44.7%) | 207 (55.3%) |
| Computers & Mathematics | 54 (56.2%) | 42 (43.8%) |
| Architecture & Engineering | 93 (53.4%) | 81 (46.6%) |
| Life, Physical & Social Science | 20 (19.2%) | 84 (80.8%) |
| Community & Social Service | 459 (38.2%) | 744 (61.9%) |
| Education, Arts & Media | 146 (44.9%) | 179 (55.1%) |
| Legal Services & Support | 36 (51.4%) | 34 (48.6%) |
| Education Instruction & Library | 215 (31.2%) | 474 (68.8%) |
| Arts, Media & Entertainment | 62 (52.1%) | 57 (47.9%) |
| Health Diagnosing & Treating | 85 (11.4%) | 664 (88.6%) |
| Health Technologists | 63 (13.0%) | 423 (87.0%) |
| Total (Category) | 1,614 (42.0%) | 2,228 (58.0%) |
| Total (Overall) | 7,412 (52.0%) | 6,832 (48.0%) |
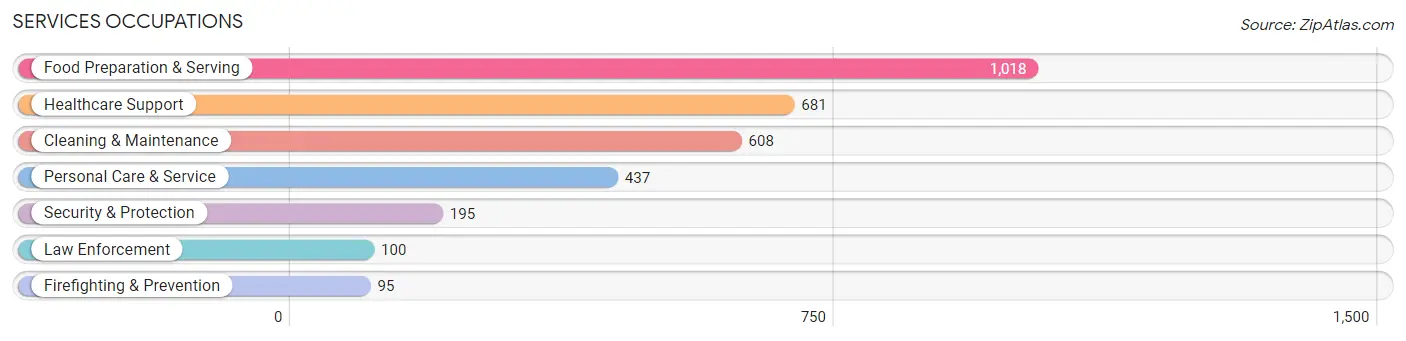
Services Occupations
The most common Services occupations in Mason City are Food Preparation & Serving (1,018 | 7.1%), Healthcare Support (681 | 4.8%), Cleaning & Maintenance (608 | 4.3%), Personal Care & Service (437 | 3.1%), and Security & Protection (195 | 1.4%).
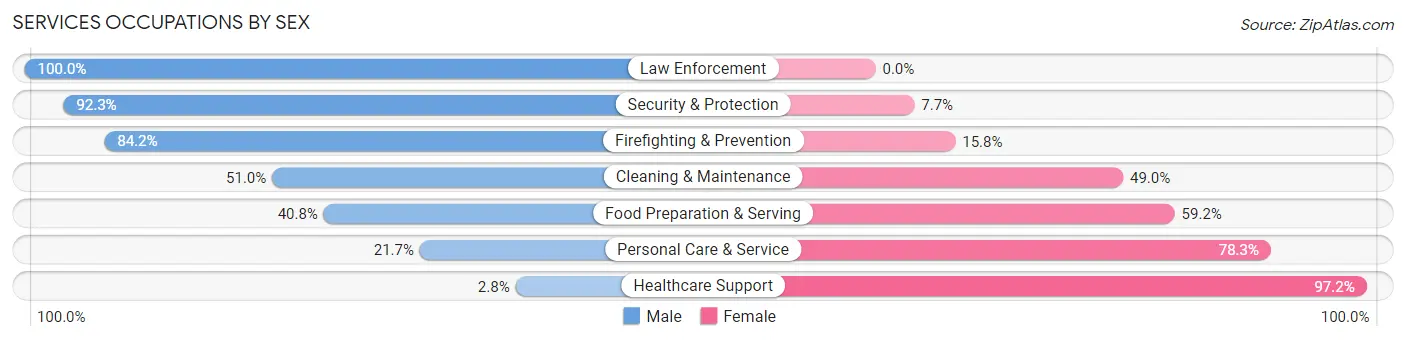
Services Occupations by Sex
Within the Services occupations in Mason City, the most male-oriented occupations are Law Enforcement (100.0%), Security & Protection (92.3%), and Firefighting & Prevention (84.2%), while the most female-oriented occupations are Healthcare Support (97.2%), Personal Care & Service (78.3%), and Food Preparation & Serving (59.2%).
| Occupation | Male | Female |
| Healthcare Support | 19 (2.8%) | 662 (97.2%) |
| Security & Protection | 180 (92.3%) | 15 (7.7%) |
| Firefighting & Prevention | 80 (84.2%) | 15 (15.8%) |
| Law Enforcement | 100 (100.0%) | 0 (0.0%) |
| Food Preparation & Serving | 415 (40.8%) | 603 (59.2%) |
| Cleaning & Maintenance | 310 (51.0%) | 298 (49.0%) |
| Personal Care & Service | 95 (21.7%) | 342 (78.3%) |
| Total (Category) | 1,019 (34.7%) | 1,920 (65.3%) |
| Total (Overall) | 7,412 (52.0%) | 6,832 (48.0%) |
Sales and Office Occupations
The most common Sales and Office occupations in Mason City are Sales & Related (1,824 | 12.8%), and Office & Administration (1,174 | 8.2%).
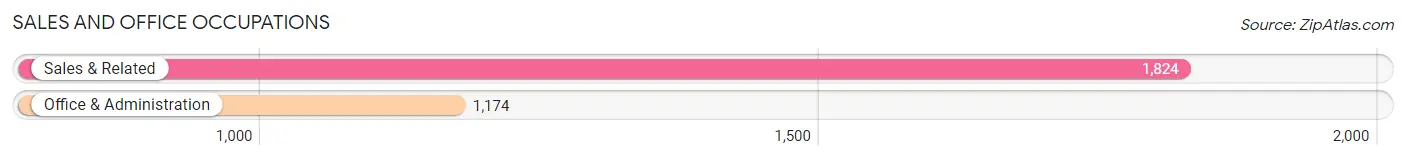
Sales and Office Occupations by Sex
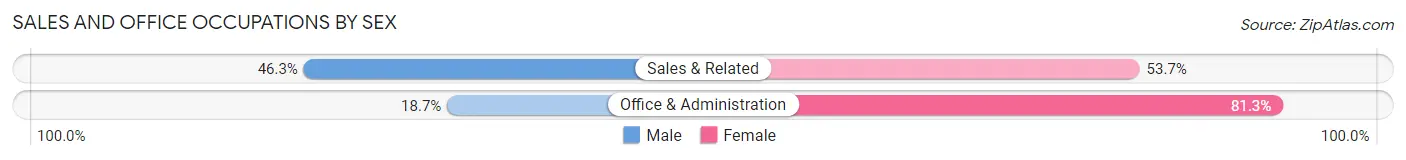
| Occupation | Male | Female |
| Sales & Related | 845 (46.3%) | 979 (53.7%) |
| Office & Administration | 220 (18.7%) | 954 (81.3%) |
| Total (Category) | 1,065 (35.5%) | 1,933 (64.5%) |
| Total (Overall) | 7,412 (52.0%) | 6,832 (48.0%) |
Natural Resources, Construction and Maintenance Occupations
The most common Natural Resources, Construction and Maintenance occupations in Mason City are Construction & Extraction (575 | 4.0%), Installation, Maintenance & Repair (491 | 3.5%), and Farming, Fishing & Forestry (39 | 0.3%).
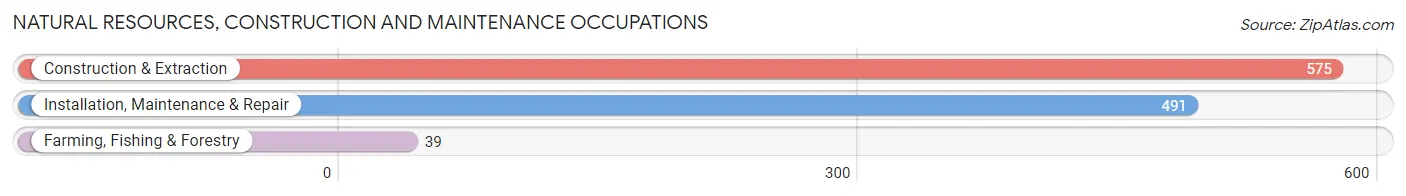
Natural Resources, Construction and Maintenance Occupations by Sex
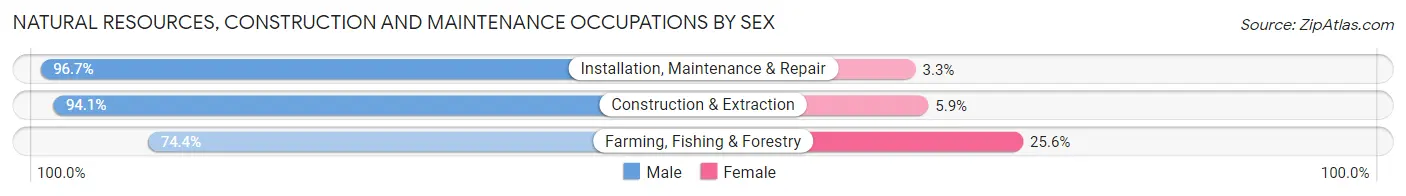
| Occupation | Male | Female |
| Farming, Fishing & Forestry | 29 (74.4%) | 10 (25.6%) |
| Construction & Extraction | 541 (94.1%) | 34 (5.9%) |
| Installation, Maintenance & Repair | 475 (96.7%) | 16 (3.3%) |
| Total (Category) | 1,045 (94.6%) | 60 (5.4%) |
| Total (Overall) | 7,412 (52.0%) | 6,832 (48.0%) |
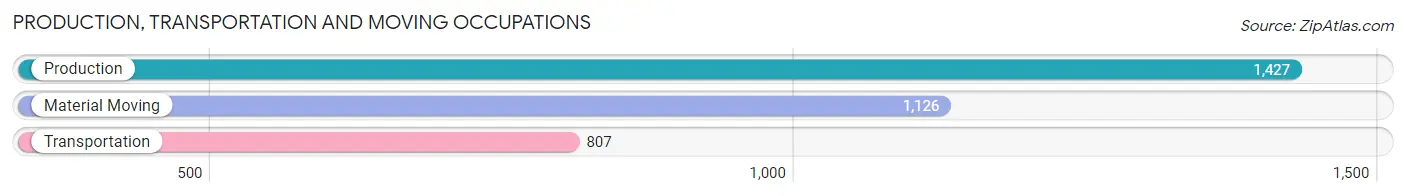
Production, Transportation and Moving Occupations
The most common Production, Transportation and Moving occupations in Mason City are Production (1,427 | 10.0%), Material Moving (1,126 | 7.9%), and Transportation (807 | 5.7%).
Production, Transportation and Moving Occupations by Sex
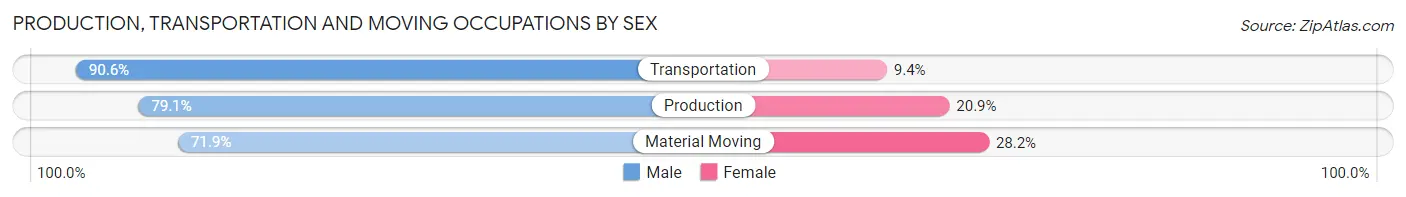
| Occupation | Male | Female |
| Production | 1,129 (79.1%) | 298 (20.9%) |
| Transportation | 731 (90.6%) | 76 (9.4%) |
| Material Moving | 809 (71.9%) | 317 (28.1%) |
| Total (Category) | 2,669 (79.4%) | 691 (20.6%) |
| Total (Overall) | 7,412 (52.0%) | 6,832 (48.0%) |
Employment Industries by Sex in Mason City
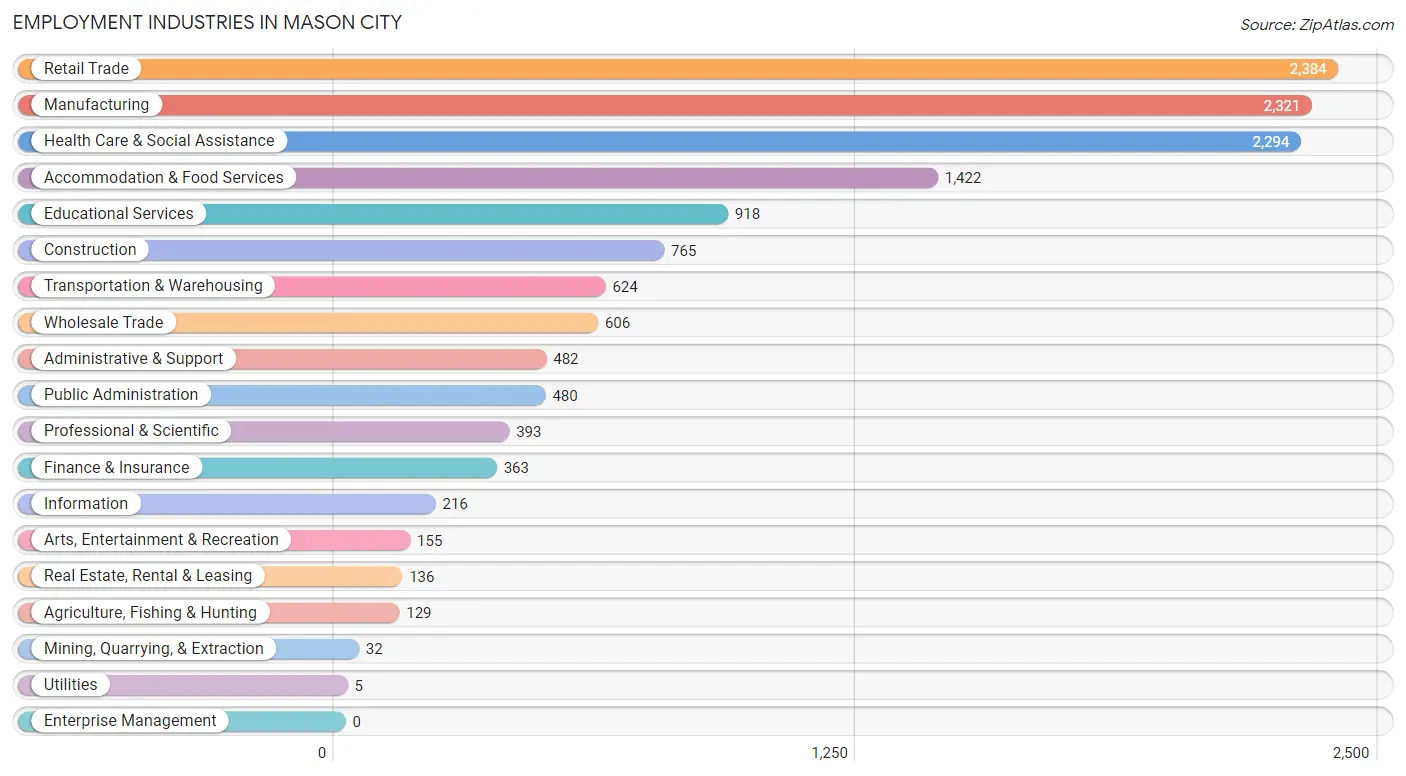
Employment Industries in Mason City
The major employment industries in Mason City include Retail Trade (2,384 | 16.7%), Manufacturing (2,321 | 16.3%), Health Care & Social Assistance (2,294 | 16.1%), Accommodation & Food Services (1,422 | 10.0%), and Educational Services (918 | 6.4%).
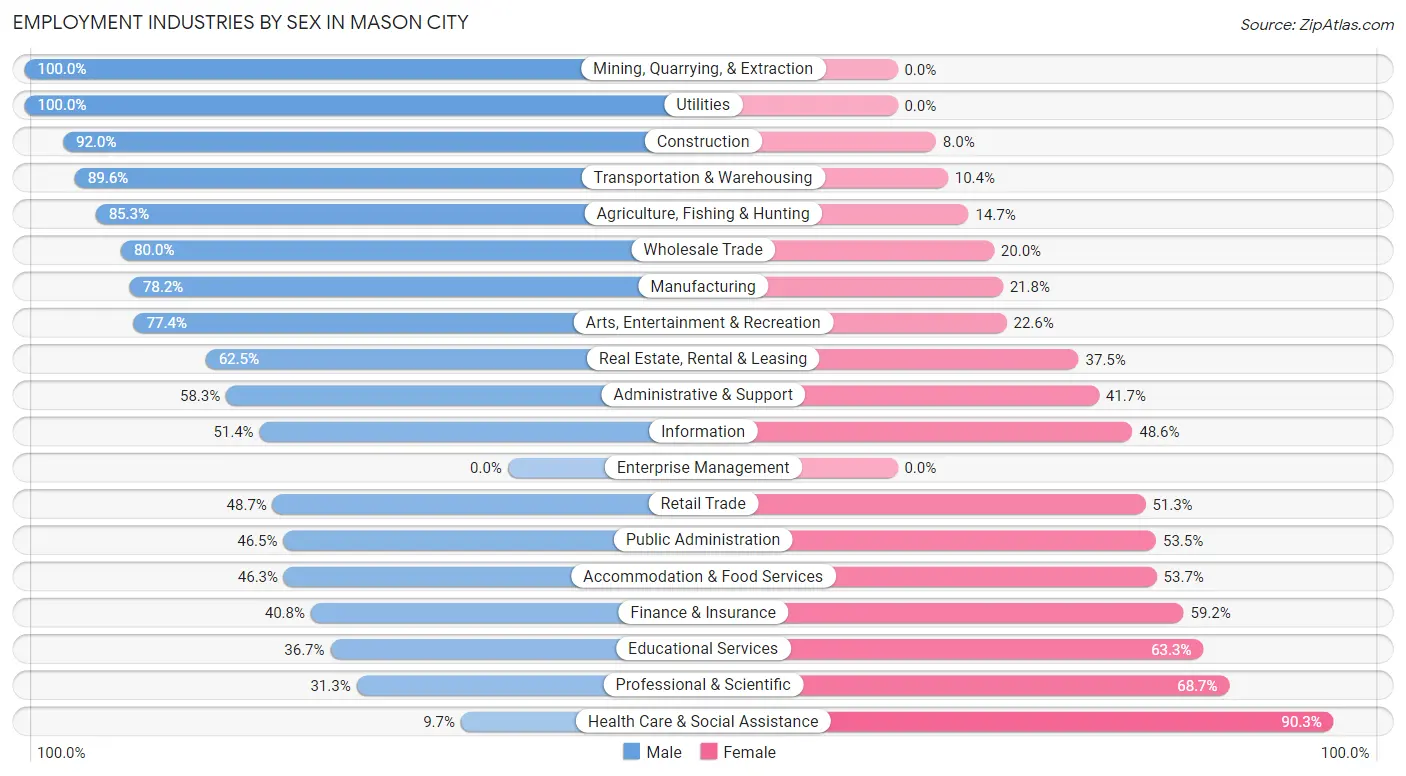
Employment Industries by Sex in Mason City
The Mason City industries that see more men than women are Mining, Quarrying, & Extraction (100.0%), Utilities (100.0%), and Construction (92.0%), whereas the industries that tend to have a higher number of women are Health Care & Social Assistance (90.3%), Professional & Scientific (68.7%), and Educational Services (63.3%).
| Industry | Male | Female |
| Agriculture, Fishing & Hunting | 110 (85.3%) | 19 (14.7%) |
| Mining, Quarrying, & Extraction | 32 (100.0%) | 0 (0.0%) |
| Construction | 704 (92.0%) | 61 (8.0%) |
| Manufacturing | 1,815 (78.2%) | 506 (21.8%) |
| Wholesale Trade | 485 (80.0%) | 121 (20.0%) |
| Retail Trade | 1,160 (48.7%) | 1,224 (51.3%) |
| Transportation & Warehousing | 559 (89.6%) | 65 (10.4%) |
| Utilities | 5 (100.0%) | 0 (0.0%) |
| Information | 111 (51.4%) | 105 (48.6%) |
| Finance & Insurance | 148 (40.8%) | 215 (59.2%) |
| Real Estate, Rental & Leasing | 85 (62.5%) | 51 (37.5%) |
| Professional & Scientific | 123 (31.3%) | 270 (68.7%) |
| Enterprise Management | 0 (0.0%) | 0 (0.0%) |
| Administrative & Support | 281 (58.3%) | 201 (41.7%) |
| Educational Services | 337 (36.7%) | 581 (63.3%) |
| Health Care & Social Assistance | 223 (9.7%) | 2,071 (90.3%) |
| Arts, Entertainment & Recreation | 120 (77.4%) | 35 (22.6%) |
| Accommodation & Food Services | 659 (46.3%) | 763 (53.7%) |
| Public Administration | 223 (46.5%) | 257 (53.5%) |
| Total | 7,412 (52.0%) | 6,832 (48.0%) |
Education in Mason City
School Enrollment in Mason City
The most common levels of schooling among the 5,271 students in Mason City are middle school (1,728 | 32.8%), high school (1,086 | 20.6%), and elementary school (890 | 16.9%).
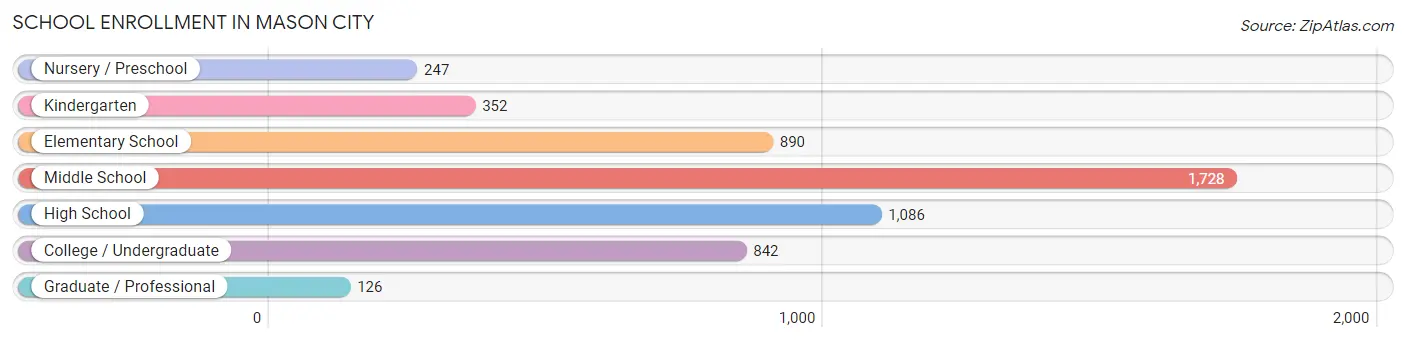
| School Level | # Students | % Students |
| Nursery / Preschool | 247 | 4.7% |
| Kindergarten | 352 | 6.7% |
| Elementary School | 890 | 16.9% |
| Middle School | 1,728 | 32.8% |
| High School | 1,086 | 20.6% |
| College / Undergraduate | 842 | 16.0% |
| Graduate / Professional | 126 | 2.4% |
| Total | 5,271 | 100.0% |
School Enrollment by Age by Funding Source in Mason City
Out of a total of 5,271 students who are enrolled in schools in Mason City, 706 (13.4%) attend a private institution, while the remaining 4,565 (86.6%) are enrolled in public schools. The age group of 35 years and over has the highest likelihood of being enrolled in private schools, with 129 (54.2% in the age bracket) enrolled. Conversely, the age group of 3 to 4 year olds has the lowest likelihood of being enrolled in a private school, with 163 (96.5% in the age bracket) attending a public institution.
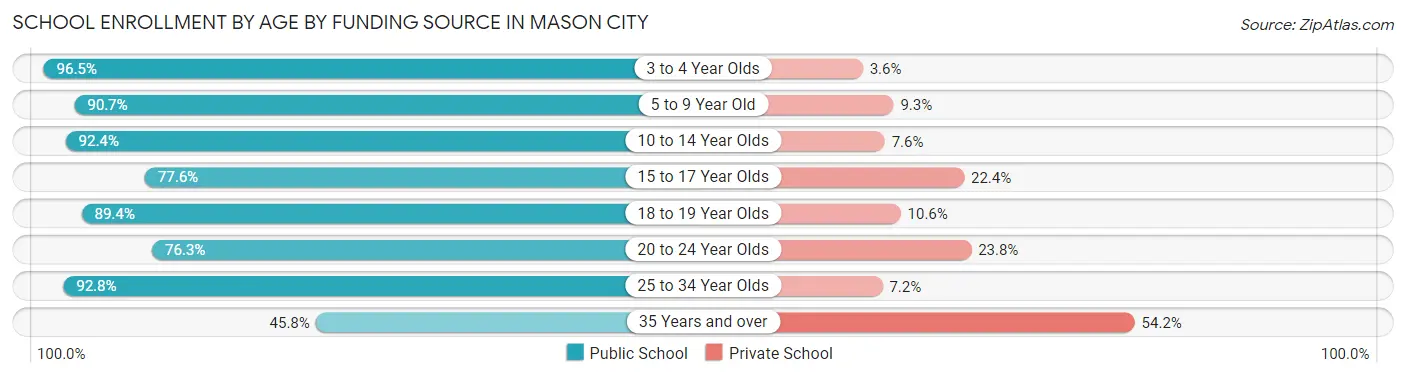
| Age Bracket | Public School | Private School |
| 3 to 4 Year Olds | 163 (96.5%) | 6 (3.5%) |
| 5 to 9 Year Old | 1,076 (90.7%) | 110 (9.3%) |
| 10 to 14 Year Olds | 1,875 (92.4%) | 155 (7.6%) |
| 15 to 17 Year Olds | 578 (77.6%) | 167 (22.4%) |
| 18 to 19 Year Olds | 295 (89.4%) | 35 (10.6%) |
| 20 to 24 Year Olds | 289 (76.2%) | 90 (23.7%) |
| 25 to 34 Year Olds | 180 (92.8%) | 14 (7.2%) |
| 35 Years and over | 109 (45.8%) | 129 (54.2%) |
| Total | 4,565 (86.6%) | 706 (13.4%) |
Educational Attainment by Field of Study in Mason City
Business (957 | 21.3%), education (683 | 15.2%), science & technology (586 | 13.0%), arts & humanities (438 | 9.7%), and social sciences (356 | 7.9%) are the most common fields of study among 4,502 individuals in Mason City who have obtained a bachelor's degree or higher.
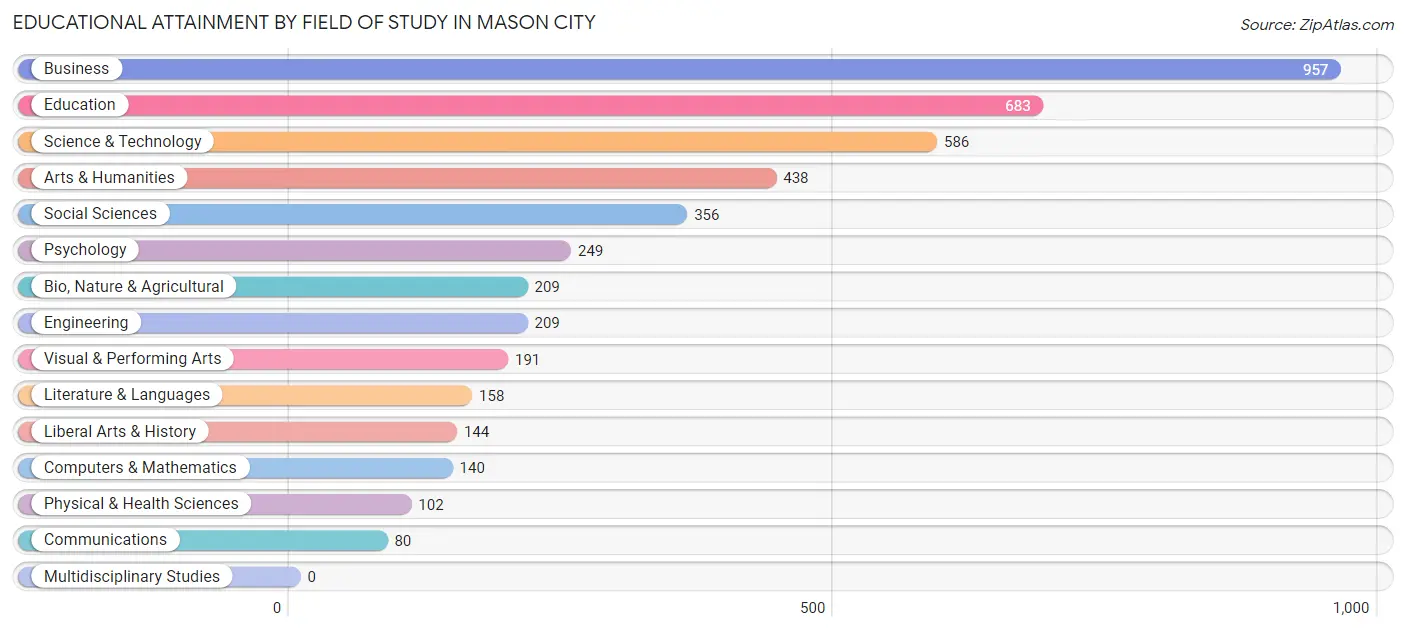
| Field of Study | # Graduates | % Graduates |
| Computers & Mathematics | 140 | 3.1% |
| Bio, Nature & Agricultural | 209 | 4.6% |
| Physical & Health Sciences | 102 | 2.3% |
| Psychology | 249 | 5.5% |
| Social Sciences | 356 | 7.9% |
| Engineering | 209 | 4.6% |
| Multidisciplinary Studies | 0 | 0.0% |
| Science & Technology | 586 | 13.0% |
| Business | 957 | 21.3% |
| Education | 683 | 15.2% |
| Literature & Languages | 158 | 3.5% |
| Liberal Arts & History | 144 | 3.2% |
| Visual & Performing Arts | 191 | 4.2% |
| Communications | 80 | 1.8% |
| Arts & Humanities | 438 | 9.7% |
| Total | 4,502 | 100.0% |
Transportation & Commute in Mason City
Vehicle Availability by Sex in Mason City
The most prevalent vehicle ownership categories in Mason City are males with 2 vehicles (3,613, accounting for 49.4%) and females with 2 vehicles (3,404, making up 54.6%).
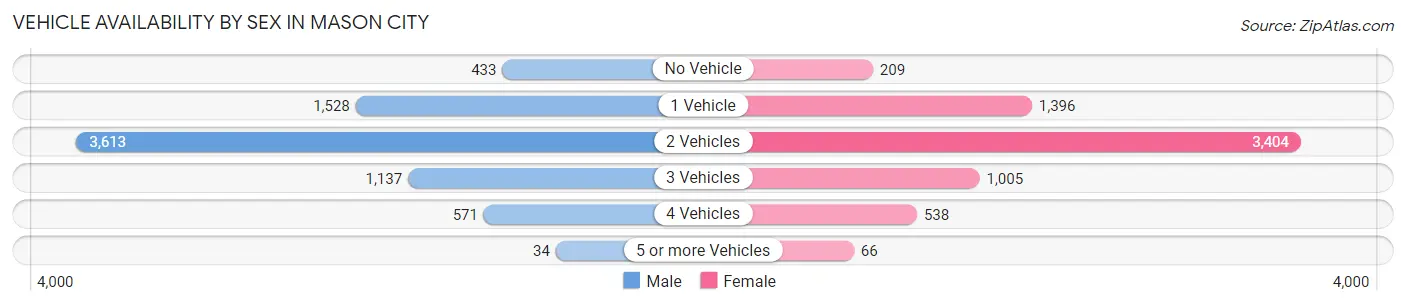
| Vehicles Available | Male | Female |
| No Vehicle | 433 (5.9%) | 209 (3.2%) |
| 1 Vehicle | 1,528 (20.9%) | 1,396 (21.1%) |
| 2 Vehicles | 3,613 (49.4%) | 3,404 (51.4%) |
| 3 Vehicles | 1,137 (15.5%) | 1,005 (15.2%) |
| 4 Vehicles | 571 (7.8%) | 538 (8.1%) |
| 5 or more Vehicles | 34 (0.5%) | 66 (1.0%) |
| Total | 7,316 (100.0%) | 6,618 (100.0%) |
Commute Time in Mason City
The most frequently occuring commute durations in Mason City are 5 to 9 minutes (4,015 commuters, 30.0%), 10 to 14 minutes (3,665 commuters, 27.4%), and 15 to 19 minutes (1,999 commuters, 14.9%).
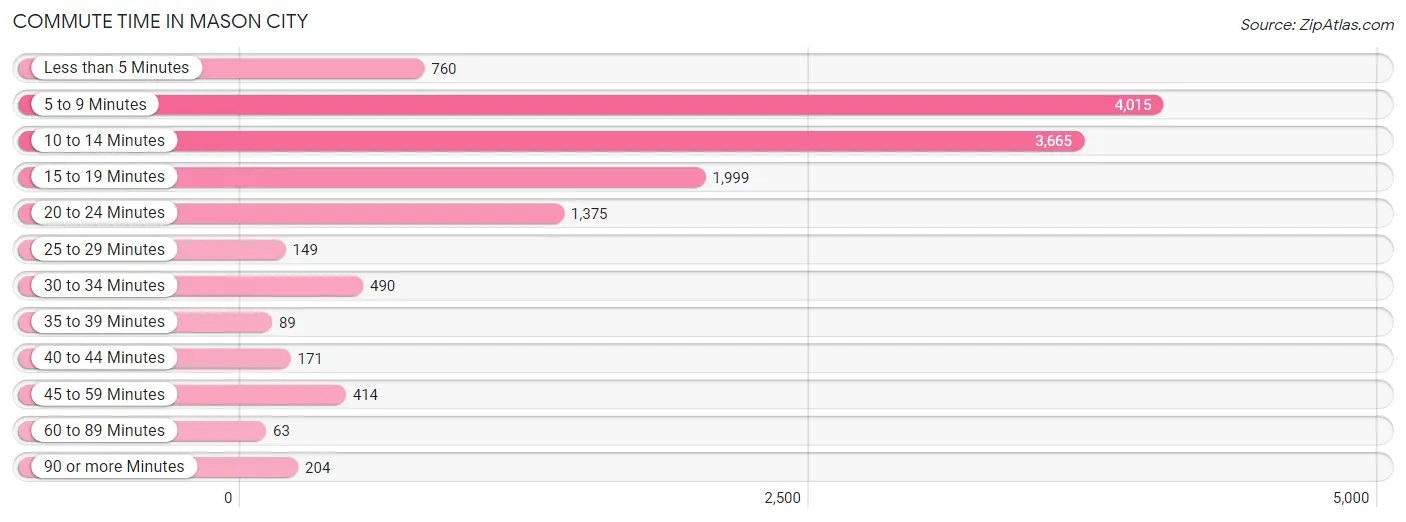
| Commute Time | # Commuters | % Commuters |
| Less than 5 Minutes | 760 | 5.7% |
| 5 to 9 Minutes | 4,015 | 30.0% |
| 10 to 14 Minutes | 3,665 | 27.4% |
| 15 to 19 Minutes | 1,999 | 14.9% |
| 20 to 24 Minutes | 1,375 | 10.3% |
| 25 to 29 Minutes | 149 | 1.1% |
| 30 to 34 Minutes | 490 | 3.7% |
| 35 to 39 Minutes | 89 | 0.7% |
| 40 to 44 Minutes | 171 | 1.3% |
| 45 to 59 Minutes | 414 | 3.1% |
| 60 to 89 Minutes | 63 | 0.5% |
| 90 or more Minutes | 204 | 1.5% |
Commute Time by Sex in Mason City
The most common commute times in Mason City are 5 to 9 minutes (2,015 commuters, 29.0%) for males and 5 to 9 minutes (2,000 commuters, 31.0%) for females.
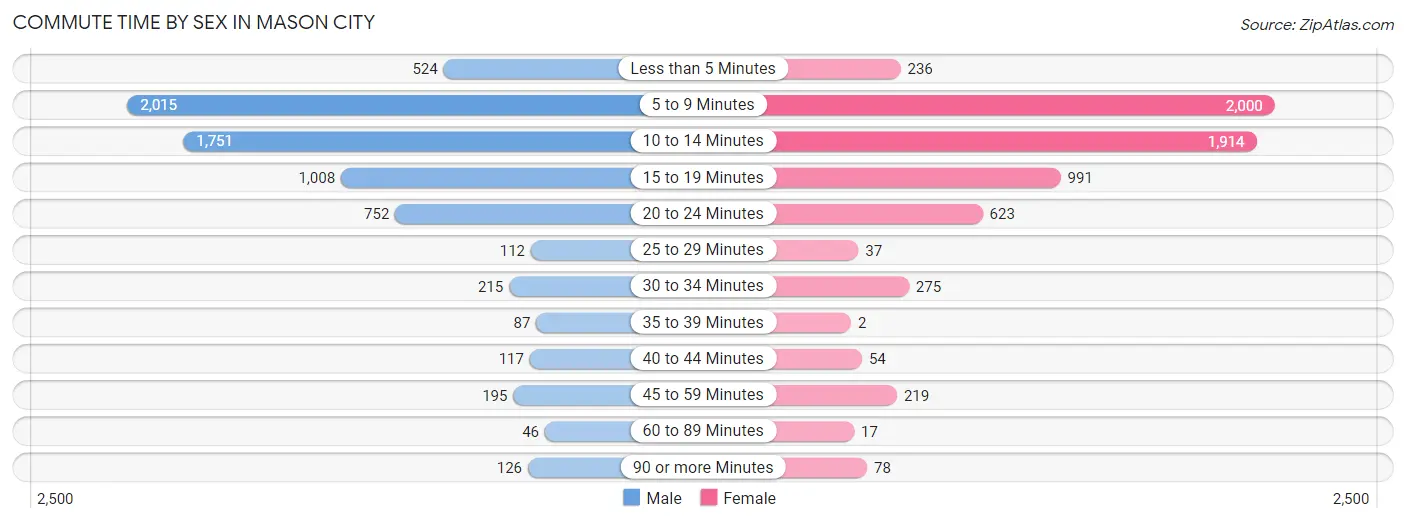
| Commute Time | Male | Female |
| Less than 5 Minutes | 524 (7.5%) | 236 (3.7%) |
| 5 to 9 Minutes | 2,015 (29.0%) | 2,000 (31.0%) |
| 10 to 14 Minutes | 1,751 (25.2%) | 1,914 (29.7%) |
| 15 to 19 Minutes | 1,008 (14.5%) | 991 (15.4%) |
| 20 to 24 Minutes | 752 (10.8%) | 623 (9.7%) |
| 25 to 29 Minutes | 112 (1.6%) | 37 (0.6%) |
| 30 to 34 Minutes | 215 (3.1%) | 275 (4.3%) |
| 35 to 39 Minutes | 87 (1.3%) | 2 (0.0%) |
| 40 to 44 Minutes | 117 (1.7%) | 54 (0.8%) |
| 45 to 59 Minutes | 195 (2.8%) | 219 (3.4%) |
| 60 to 89 Minutes | 46 (0.7%) | 17 (0.3%) |
| 90 or more Minutes | 126 (1.8%) | 78 (1.2%) |
Time of Departure to Work by Sex in Mason City
The most frequent times of departure to work in Mason City are 6:30 AM to 6:59 AM (1,257, 18.1%) for males and 7:30 AM to 7:59 AM (1,014, 15.7%) for females.
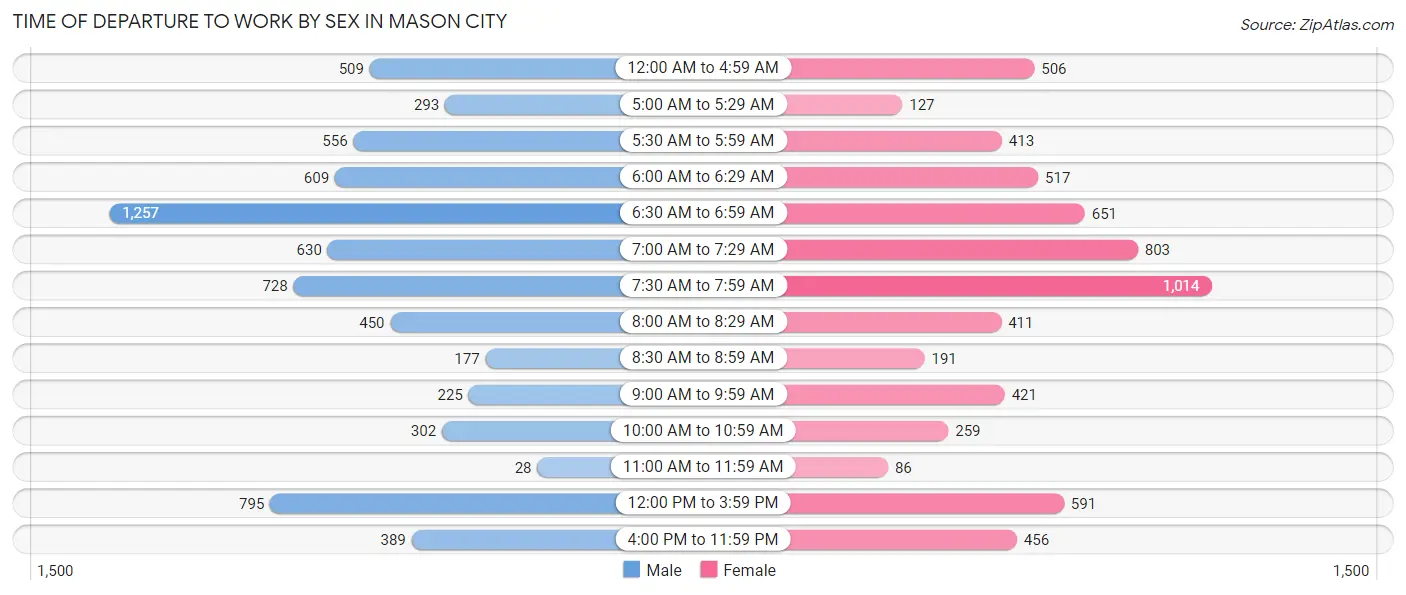
| Time of Departure | Male | Female |
| 12:00 AM to 4:59 AM | 509 (7.3%) | 506 (7.9%) |
| 5:00 AM to 5:29 AM | 293 (4.2%) | 127 (2.0%) |
| 5:30 AM to 5:59 AM | 556 (8.0%) | 413 (6.4%) |
| 6:00 AM to 6:29 AM | 609 (8.8%) | 517 (8.0%) |
| 6:30 AM to 6:59 AM | 1,257 (18.1%) | 651 (10.1%) |
| 7:00 AM to 7:29 AM | 630 (9.1%) | 803 (12.5%) |
| 7:30 AM to 7:59 AM | 728 (10.5%) | 1,014 (15.7%) |
| 8:00 AM to 8:29 AM | 450 (6.5%) | 411 (6.4%) |
| 8:30 AM to 8:59 AM | 177 (2.5%) | 191 (3.0%) |
| 9:00 AM to 9:59 AM | 225 (3.2%) | 421 (6.5%) |
| 10:00 AM to 10:59 AM | 302 (4.3%) | 259 (4.0%) |
| 11:00 AM to 11:59 AM | 28 (0.4%) | 86 (1.3%) |
| 12:00 PM to 3:59 PM | 795 (11.4%) | 591 (9.2%) |
| 4:00 PM to 11:59 PM | 389 (5.6%) | 456 (7.1%) |
| Total | 6,948 (100.0%) | 6,446 (100.0%) |
Housing Occupancy in Mason City
Occupancy by Ownership in Mason City
Of the total 12,728 dwellings in Mason City, owner-occupied units account for 8,641 (67.9%), while renter-occupied units make up 4,087 (32.1%).
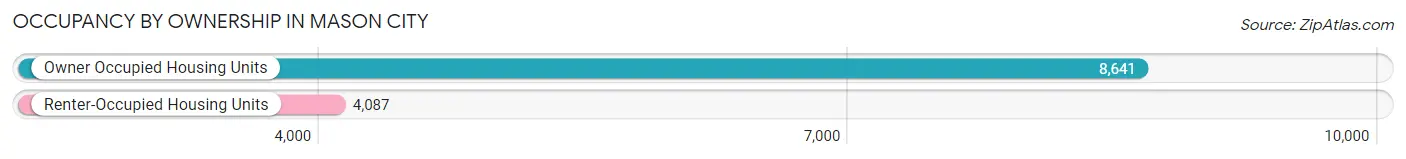
| Occupancy | # Housing Units | % Housing Units |
| Owner Occupied Housing Units | 8,641 | 67.9% |
| Renter-Occupied Housing Units | 4,087 | 32.1% |
| Total Occupied Housing Units | 12,728 | 100.0% |
Occupancy by Household Size in Mason City
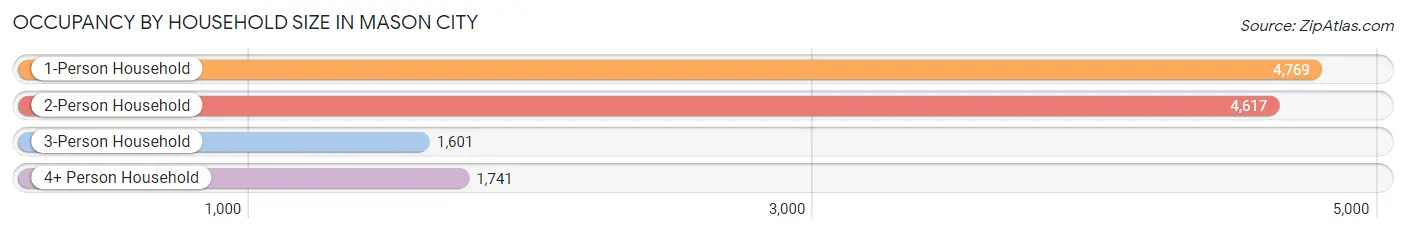
| Household Size | # Housing Units | % Housing Units |
| 1-Person Household | 4,769 | 37.5% |
| 2-Person Household | 4,617 | 36.3% |
| 3-Person Household | 1,601 | 12.6% |
| 4+ Person Household | 1,741 | 13.7% |
| Total Housing Units | 12,728 | 100.0% |
Occupancy by Ownership by Household Size in Mason City
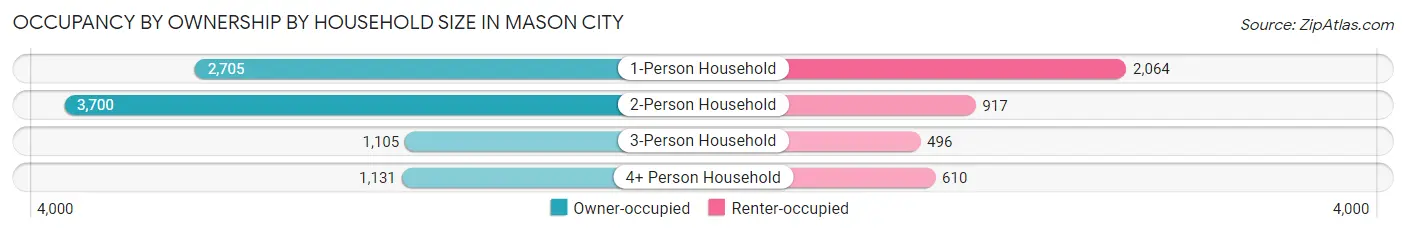
| Household Size | Owner-occupied | Renter-occupied |
| 1-Person Household | 2,705 (56.7%) | 2,064 (43.3%) |
| 2-Person Household | 3,700 (80.1%) | 917 (19.9%) |
| 3-Person Household | 1,105 (69.0%) | 496 (31.0%) |
| 4+ Person Household | 1,131 (65.0%) | 610 (35.0%) |
| Total Housing Units | 8,641 (67.9%) | 4,087 (32.1%) |
Occupancy by Educational Attainment in Mason City
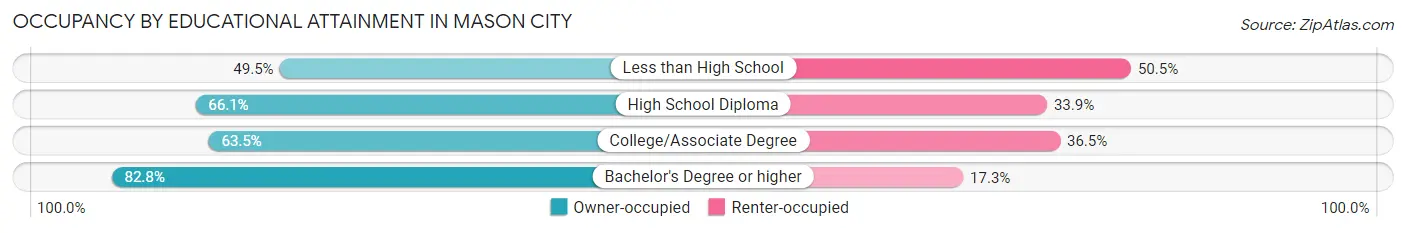
| Household Size | Owner-occupied | Renter-occupied |
| Less than High School | 333 (49.5%) | 340 (50.5%) |
| High School Diploma | 2,929 (66.1%) | 1,500 (33.9%) |
| College/Associate Degree | 3,081 (63.5%) | 1,768 (36.5%) |
| Bachelor's Degree or higher | 2,298 (82.8%) | 479 (17.2%) |
Occupancy by Age of Householder in Mason City
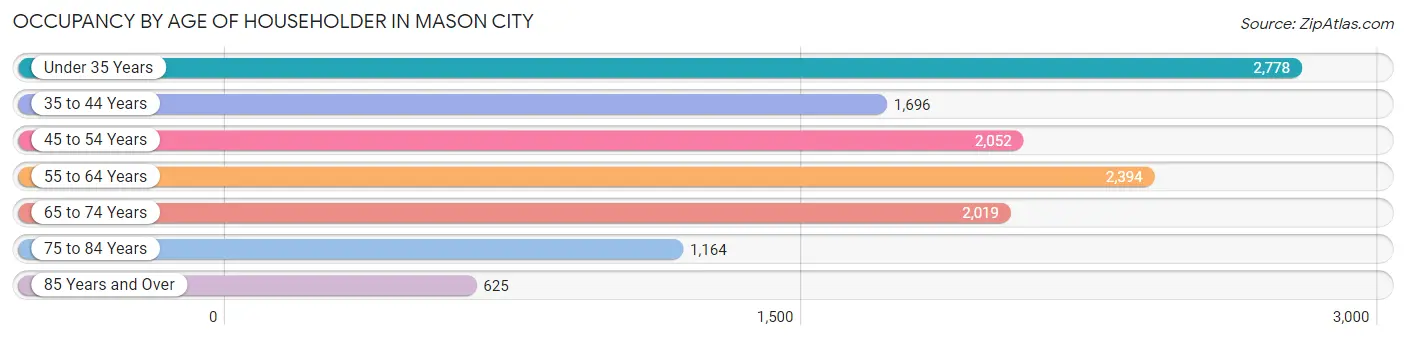
| Age Bracket | # Households | % Households |
| Under 35 Years | 2,778 | 21.8% |
| 35 to 44 Years | 1,696 | 13.3% |
| 45 to 54 Years | 2,052 | 16.1% |
| 55 to 64 Years | 2,394 | 18.8% |
| 65 to 74 Years | 2,019 | 15.9% |
| 75 to 84 Years | 1,164 | 9.1% |
| 85 Years and Over | 625 | 4.9% |
| Total | 12,728 | 100.0% |
Housing Finances in Mason City
Median Income by Occupancy in Mason City
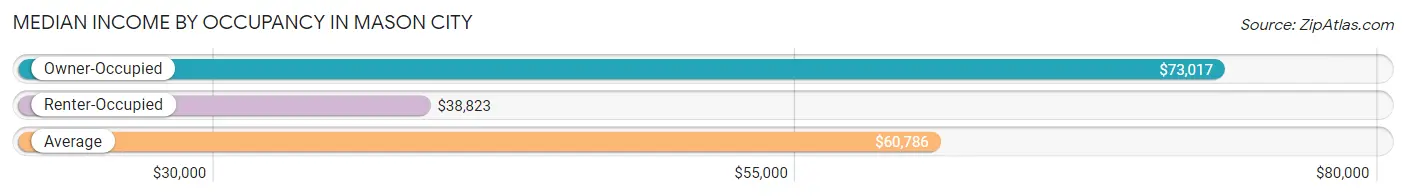
| Occupancy Type | # Households | Median Income |
| Owner-Occupied | 8,641 (67.9%) | $73,017 |
| Renter-Occupied | 4,087 (32.1%) | $38,823 |
| Average | 12,728 (100.0%) | $60,786 |
Occupancy by Householder Income Bracket in Mason City
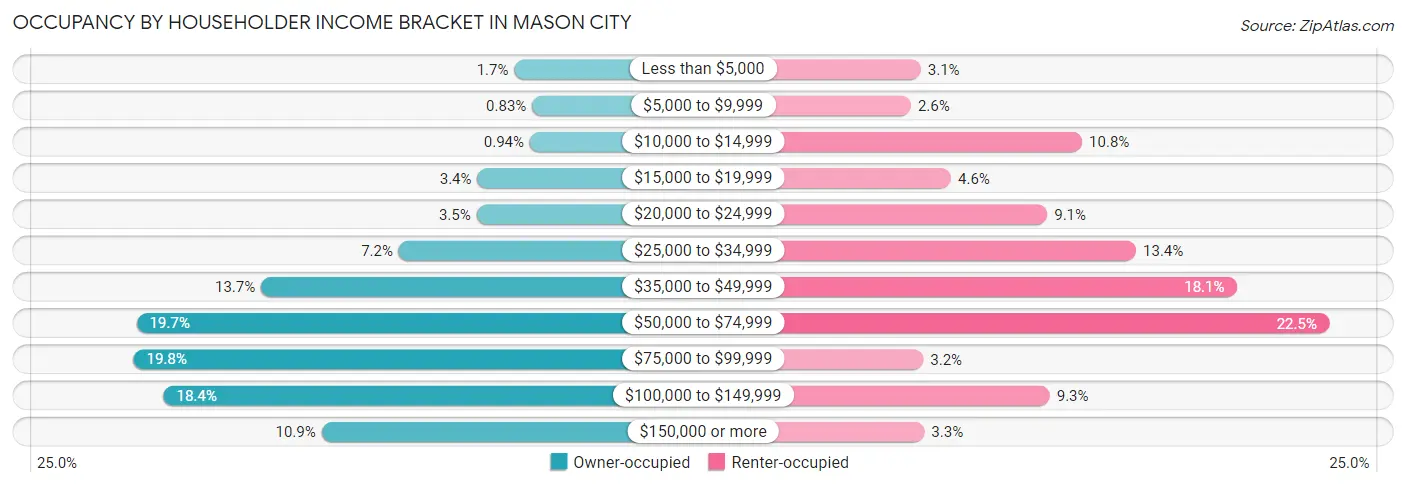
| Income Bracket | Owner-occupied | Renter-occupied |
| Less than $5,000 | 145 (1.7%) | 127 (3.1%) |
| $5,000 to $9,999 | 72 (0.8%) | 108 (2.6%) |
| $10,000 to $14,999 | 81 (0.9%) | 441 (10.8%) |
| $15,000 to $19,999 | 297 (3.4%) | 186 (4.5%) |
| $20,000 to $24,999 | 301 (3.5%) | 373 (9.1%) |
| $25,000 to $34,999 | 620 (7.2%) | 546 (13.4%) |
| $35,000 to $49,999 | 1,187 (13.7%) | 741 (18.1%) |
| $50,000 to $74,999 | 1,700 (19.7%) | 921 (22.5%) |
| $75,000 to $99,999 | 1,712 (19.8%) | 132 (3.2%) |
| $100,000 to $149,999 | 1,588 (18.4%) | 378 (9.2%) |
| $150,000 or more | 938 (10.9%) | 134 (3.3%) |
| Total | 8,641 (100.0%) | 4,087 (100.0%) |
Monthly Housing Cost Tiers in Mason City
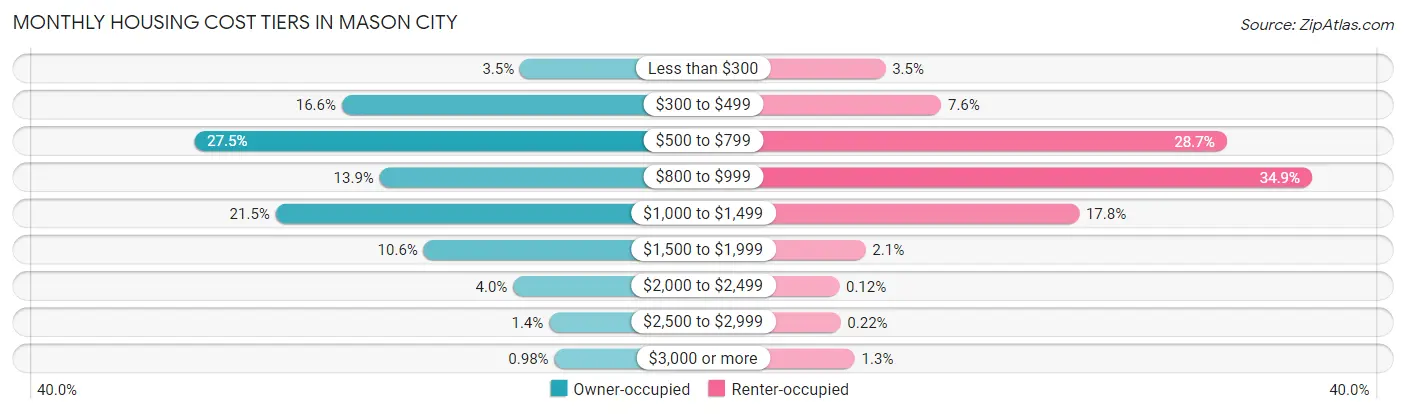
| Monthly Cost | Owner-occupied | Renter-occupied |
| Less than $300 | 303 (3.5%) | 144 (3.5%) |
| $300 to $499 | 1,438 (16.6%) | 312 (7.6%) |
| $500 to $799 | 2,377 (27.5%) | 1,171 (28.6%) |
| $800 to $999 | 1,197 (13.9%) | 1,428 (34.9%) |
| $1,000 to $1,499 | 1,859 (21.5%) | 727 (17.8%) |
| $1,500 to $1,999 | 917 (10.6%) | 84 (2.1%) |
| $2,000 to $2,499 | 347 (4.0%) | 5 (0.1%) |
| $2,500 to $2,999 | 118 (1.4%) | 9 (0.2%) |
| $3,000 or more | 85 (1.0%) | 52 (1.3%) |
| Total | 8,641 (100.0%) | 4,087 (100.0%) |
Physical Housing Characteristics in Mason City
Housing Structures in Mason City
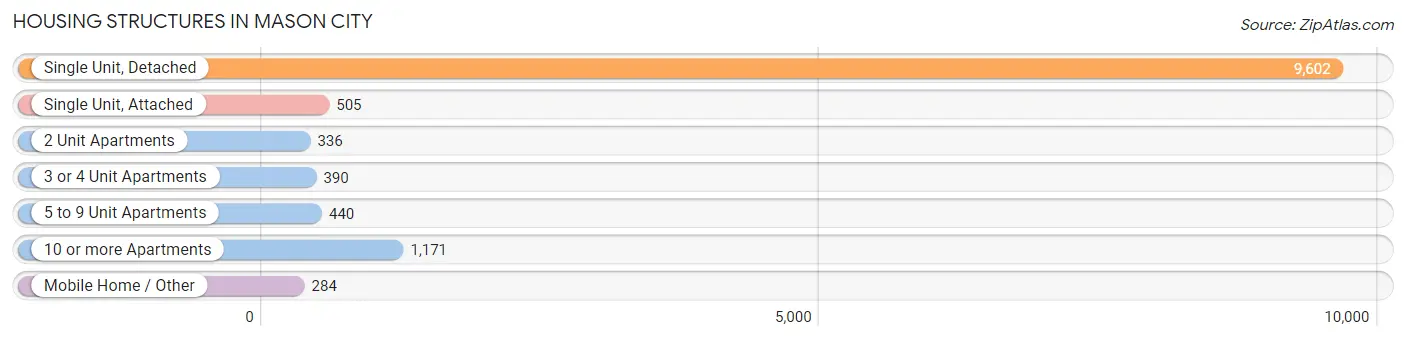
| Structure Type | # Housing Units | % Housing Units |
| Single Unit, Detached | 9,602 | 75.4% |
| Single Unit, Attached | 505 | 4.0% |
| 2 Unit Apartments | 336 | 2.6% |
| 3 or 4 Unit Apartments | 390 | 3.1% |
| 5 to 9 Unit Apartments | 440 | 3.5% |
| 10 or more Apartments | 1,171 | 9.2% |
| Mobile Home / Other | 284 | 2.2% |
| Total | 12,728 | 100.0% |
Housing Structures by Occupancy in Mason City
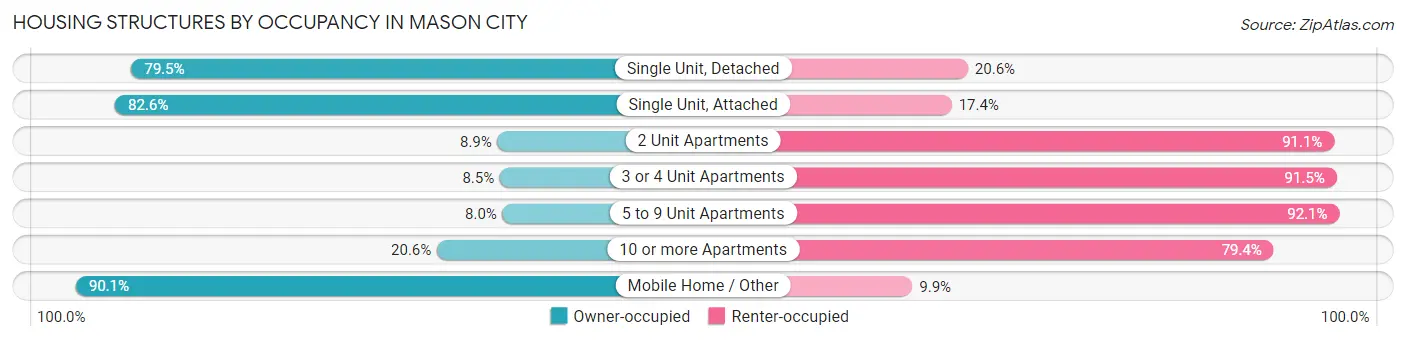
| Structure Type | Owner-occupied | Renter-occupied |
| Single Unit, Detached | 7,629 (79.4%) | 1,973 (20.5%) |
| Single Unit, Attached | 417 (82.6%) | 88 (17.4%) |
| 2 Unit Apartments | 30 (8.9%) | 306 (91.1%) |
| 3 or 4 Unit Apartments | 33 (8.5%) | 357 (91.5%) |
| 5 to 9 Unit Apartments | 35 (8.0%) | 405 (92.0%) |
| 10 or more Apartments | 241 (20.6%) | 930 (79.4%) |
| Mobile Home / Other | 256 (90.1%) | 28 (9.9%) |
| Total | 8,641 (67.9%) | 4,087 (32.1%) |
Housing Structures by Number of Rooms in Mason City
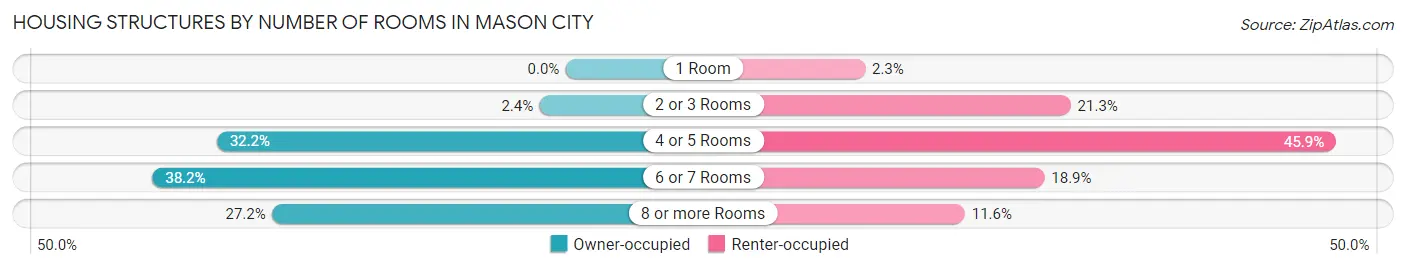
| Number of Rooms | Owner-occupied | Renter-occupied |
| 1 Room | 0 (0.0%) | 95 (2.3%) |
| 2 or 3 Rooms | 209 (2.4%) | 872 (21.3%) |
| 4 or 5 Rooms | 2,785 (32.2%) | 1,875 (45.9%) |
| 6 or 7 Rooms | 3,300 (38.2%) | 773 (18.9%) |
| 8 or more Rooms | 2,347 (27.2%) | 472 (11.6%) |
| Total | 8,641 (100.0%) | 4,087 (100.0%) |
Housing Structure by Heating Type in Mason City
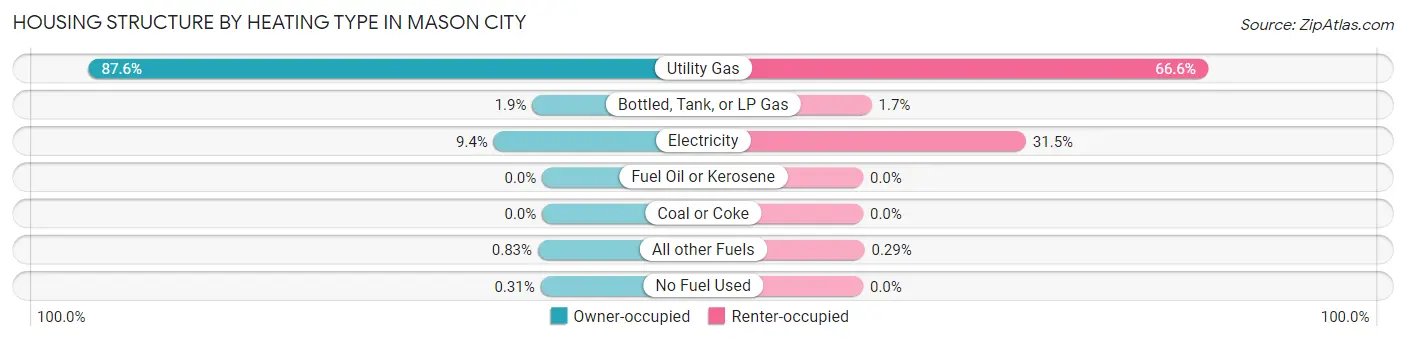
| Heating Type | Owner-occupied | Renter-occupied |
| Utility Gas | 7,570 (87.6%) | 2,721 (66.6%) |
| Bottled, Tank, or LP Gas | 163 (1.9%) | 68 (1.7%) |
| Electricity | 809 (9.4%) | 1,286 (31.5%) |
| Fuel Oil or Kerosene | 0 (0.0%) | 0 (0.0%) |
| Coal or Coke | 0 (0.0%) | 0 (0.0%) |
| All other Fuels | 72 (0.8%) | 12 (0.3%) |
| No Fuel Used | 27 (0.3%) | 0 (0.0%) |
| Total | 8,641 (100.0%) | 4,087 (100.0%) |
Household Vehicle Usage in Mason City
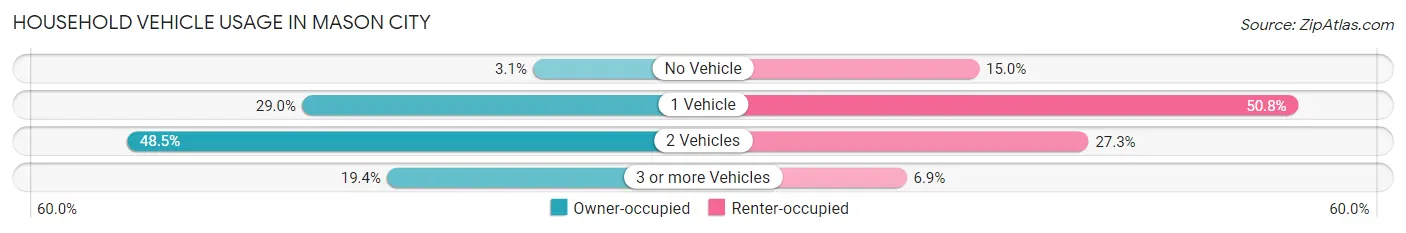
| Vehicles per Household | Owner-occupied | Renter-occupied |
| No Vehicle | 266 (3.1%) | 614 (15.0%) |
| 1 Vehicle | 2,502 (28.9%) | 2,076 (50.8%) |
| 2 Vehicles | 4,194 (48.5%) | 1,115 (27.3%) |
| 3 or more Vehicles | 1,679 (19.4%) | 282 (6.9%) |
| Total | 8,641 (100.0%) | 4,087 (100.0%) |
Real Estate & Mortgages in Mason City
Real Estate and Mortgage Overview in Mason City
| Characteristic | Without Mortgage | With Mortgage |
| Housing Units | 3,553 | 5,088 |
| Median Property Value | $128,700 | $123,600 |
| Median Household Income | $57,317 | $666 |
| Monthly Housing Costs | $521 | $85 |
| Real Estate Taxes | $2,070 | $143 |
Property Value by Mortgage Status in Mason City
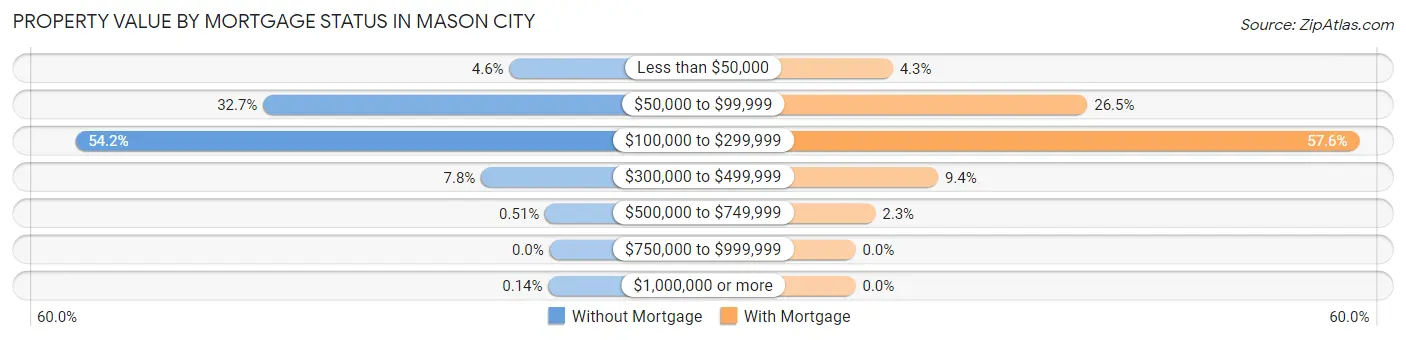
| Property Value | Without Mortgage | With Mortgage |
| Less than $50,000 | 163 (4.6%) | 216 (4.3%) |
| $50,000 to $99,999 | 1,163 (32.7%) | 1,348 (26.5%) |
| $100,000 to $299,999 | 1,926 (54.2%) | 2,929 (57.6%) |
| $300,000 to $499,999 | 278 (7.8%) | 480 (9.4%) |
| $500,000 to $749,999 | 18 (0.5%) | 115 (2.3%) |
| $750,000 to $999,999 | 0 (0.0%) | 0 (0.0%) |
| $1,000,000 or more | 5 (0.1%) | 0 (0.0%) |
| Total | 3,553 (100.0%) | 5,088 (100.0%) |
Household Income by Mortgage Status in Mason City
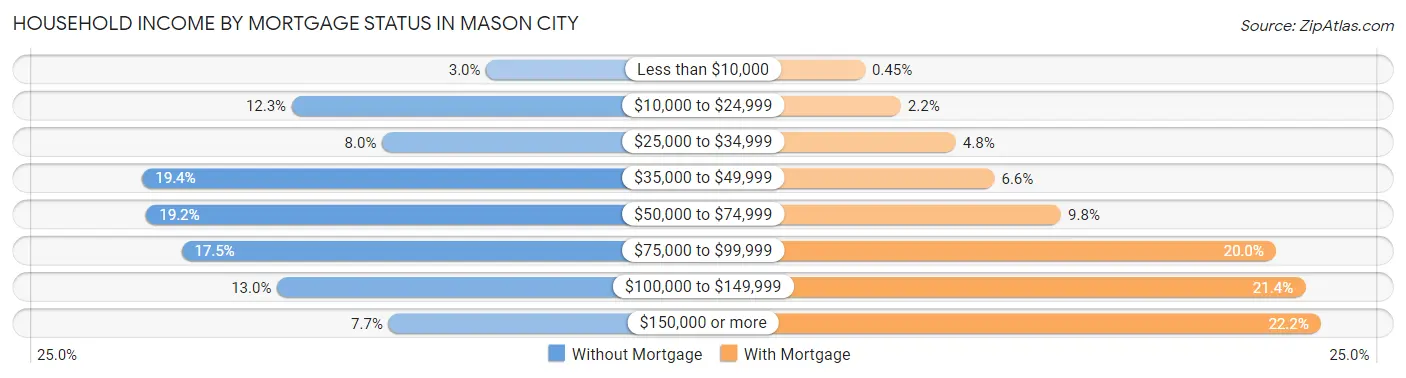
| Household Income | Without Mortgage | With Mortgage |
| Less than $10,000 | 107 (3.0%) | 23 (0.4%) |
| $10,000 to $24,999 | 436 (12.3%) | 110 (2.2%) |
| $25,000 to $34,999 | 283 (8.0%) | 243 (4.8%) |
| $35,000 to $49,999 | 689 (19.4%) | 337 (6.6%) |
| $50,000 to $74,999 | 682 (19.2%) | 498 (9.8%) |
| $75,000 to $99,999 | 623 (17.5%) | 1,018 (20.0%) |
| $100,000 to $149,999 | 461 (13.0%) | 1,089 (21.4%) |
| $150,000 or more | 272 (7.7%) | 1,127 (22.2%) |
| Total | 3,553 (100.0%) | 5,088 (100.0%) |
Property Value to Household Income Ratio in Mason City
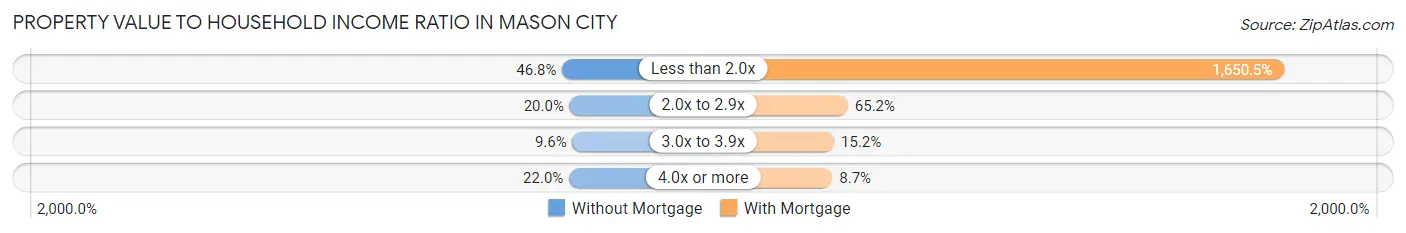
| Value-to-Income Ratio | Without Mortgage | With Mortgage |
| Less than 2.0x | 1,663 (46.8%) | 83,978 (1,650.5%) |
| 2.0x to 2.9x | 710 (20.0%) | 3,319 (65.2%) |
| 3.0x to 3.9x | 341 (9.6%) | 771 (15.1%) |
| 4.0x or more | 782 (22.0%) | 441 (8.7%) |
| Total | 3,553 (100.0%) | 5,088 (100.0%) |
Real Estate Taxes by Mortgage Status in Mason City
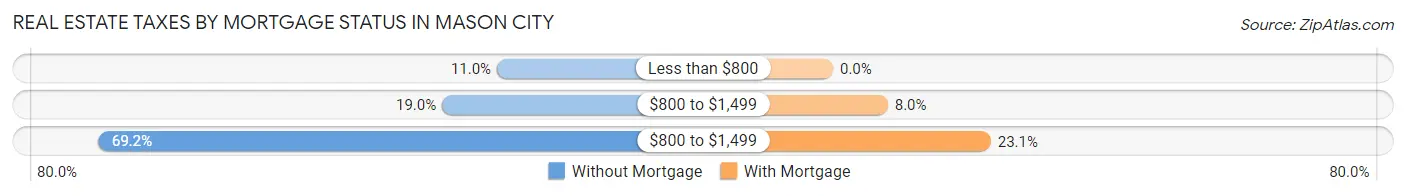
| Property Taxes | Without Mortgage | With Mortgage |
| Less than $800 | 390 (11.0%) | 0 (0.0%) |
| $800 to $1,499 | 675 (19.0%) | 407 (8.0%) |
| $800 to $1,499 | 2,457 (69.2%) | 1,173 (23.1%) |
| Total | 3,553 (100.0%) | 5,088 (100.0%) |
Health & Disability in Mason City
Health Insurance Coverage by Age in Mason City
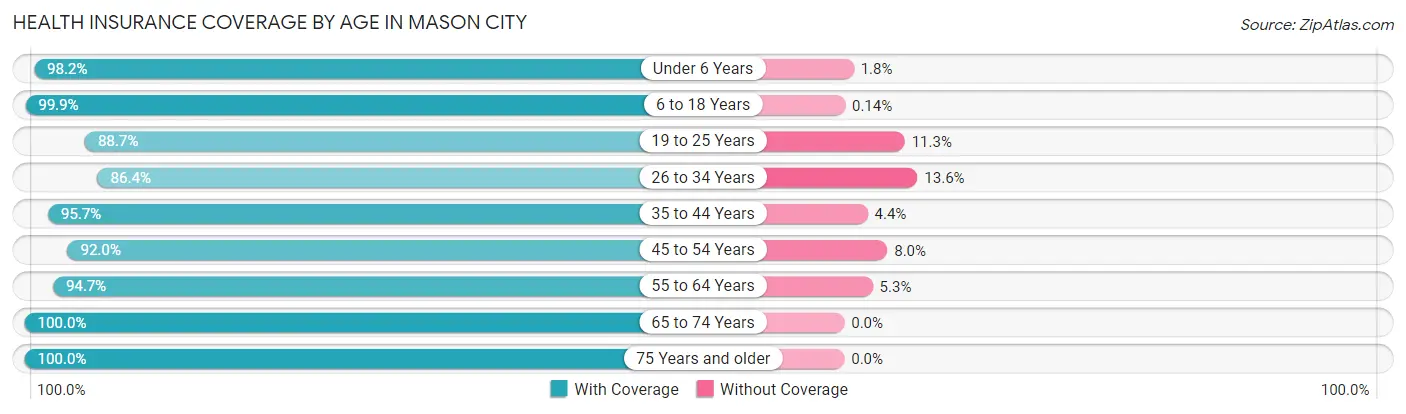
| Age Bracket | With Coverage | Without Coverage |
| Under 6 Years | 1,563 (98.2%) | 28 (1.8%) |
| 6 to 18 Years | 4,191 (99.9%) | 6 (0.1%) |
| 19 to 25 Years | 2,016 (88.7%) | 256 (11.3%) |
| 26 to 34 Years | 2,597 (86.4%) | 410 (13.6%) |
| 35 to 44 Years | 2,947 (95.7%) | 134 (4.3%) |
| 45 to 54 Years | 2,948 (92.0%) | 257 (8.0%) |
| 55 to 64 Years | 3,617 (94.7%) | 202 (5.3%) |
| 65 to 74 Years | 3,283 (100.0%) | 0 (0.0%) |
| 75 Years and older | 2,348 (100.0%) | 0 (0.0%) |
| Total | 25,510 (95.2%) | 1,293 (4.8%) |
Health Insurance Coverage by Citizenship Status in Mason City
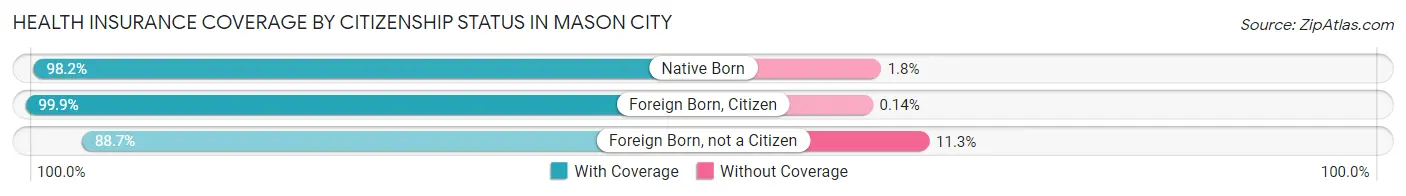
| Citizenship Status | With Coverage | Without Coverage |
| Native Born | 1,563 (98.2%) | 28 (1.8%) |
| Foreign Born, Citizen | 4,191 (99.9%) | 6 (0.1%) |
| Foreign Born, not a Citizen | 2,016 (88.7%) | 256 (11.3%) |
Health Insurance Coverage by Household Income in Mason City
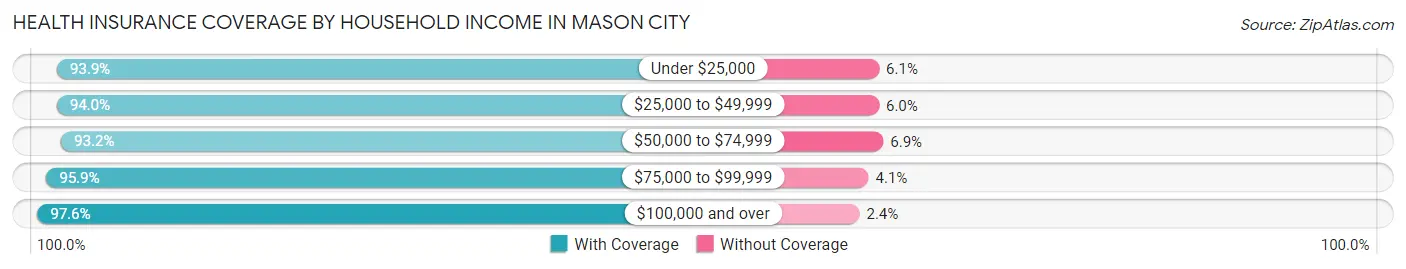
| Household Income | With Coverage | Without Coverage |
| Under $25,000 | 2,666 (93.9%) | 172 (6.1%) |
| $25,000 to $49,999 | 4,950 (94.0%) | 318 (6.0%) |
| $50,000 to $74,999 | 5,017 (93.1%) | 369 (6.9%) |
| $75,000 to $99,999 | 4,231 (95.9%) | 180 (4.1%) |
| $100,000 and over | 8,355 (97.6%) | 205 (2.4%) |
Public vs Private Health Insurance Coverage by Age in Mason City
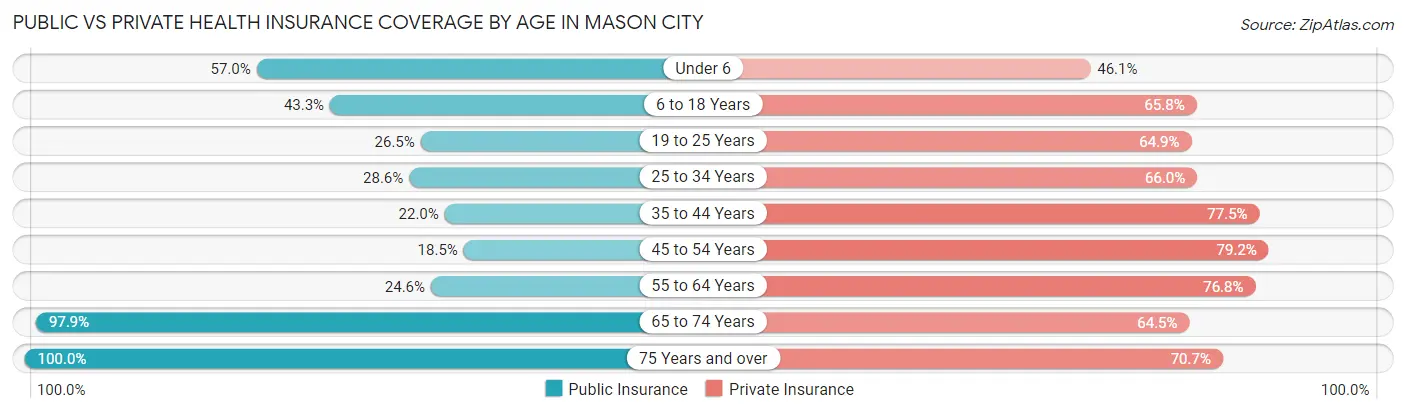
| Age Bracket | Public Insurance | Private Insurance |
| Under 6 | 906 (57.0%) | 734 (46.1%) |
| 6 to 18 Years | 1,818 (43.3%) | 2,763 (65.8%) |
| 19 to 25 Years | 602 (26.5%) | 1,474 (64.9%) |
| 25 to 34 Years | 861 (28.6%) | 1,983 (65.9%) |
| 35 to 44 Years | 679 (22.0%) | 2,388 (77.5%) |
| 45 to 54 Years | 593 (18.5%) | 2,539 (79.2%) |
| 55 to 64 Years | 939 (24.6%) | 2,931 (76.7%) |
| 65 to 74 Years | 3,214 (97.9%) | 2,118 (64.5%) |
| 75 Years and over | 2,348 (100.0%) | 1,660 (70.7%) |
| Total | 11,960 (44.6%) | 18,590 (69.4%) |
Disability Status by Sex by Age in Mason City
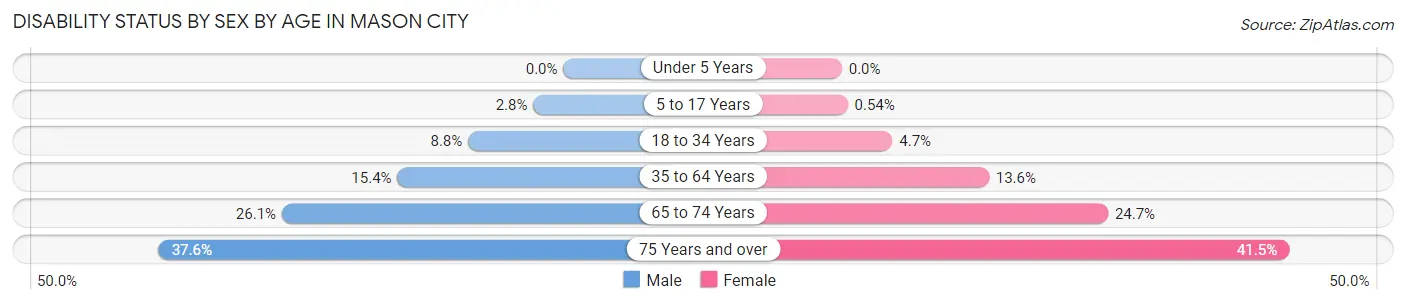
| Age Bracket | Male | Female |
| Under 5 Years | 0 (0.0%) | 0 (0.0%) |
| 5 to 17 Years | 58 (2.8%) | 11 (0.5%) |
| 18 to 34 Years | 252 (8.8%) | 132 (4.7%) |
| 35 to 64 Years | 795 (15.4%) | 674 (13.6%) |
| 65 to 74 Years | 407 (26.1%) | 426 (24.7%) |
| 75 Years and over | 347 (37.6%) | 591 (41.5%) |
Disability Class by Sex by Age in Mason City
Disability Class: Hearing Difficulty
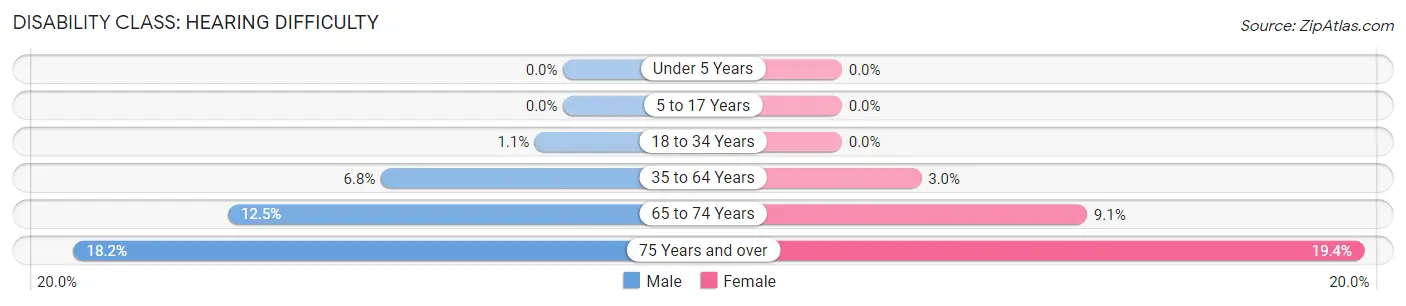
| Age Bracket | Male | Female |
| Under 5 Years | 0 (0.0%) | 0 (0.0%) |
| 5 to 17 Years | 0 (0.0%) | 0 (0.0%) |
| 18 to 34 Years | 30 (1.1%) | 0 (0.0%) |
| 35 to 64 Years | 349 (6.8%) | 146 (2.9%) |
| 65 to 74 Years | 194 (12.4%) | 157 (9.1%) |
| 75 Years and over | 168 (18.2%) | 276 (19.4%) |
Disability Class: Vision Difficulty
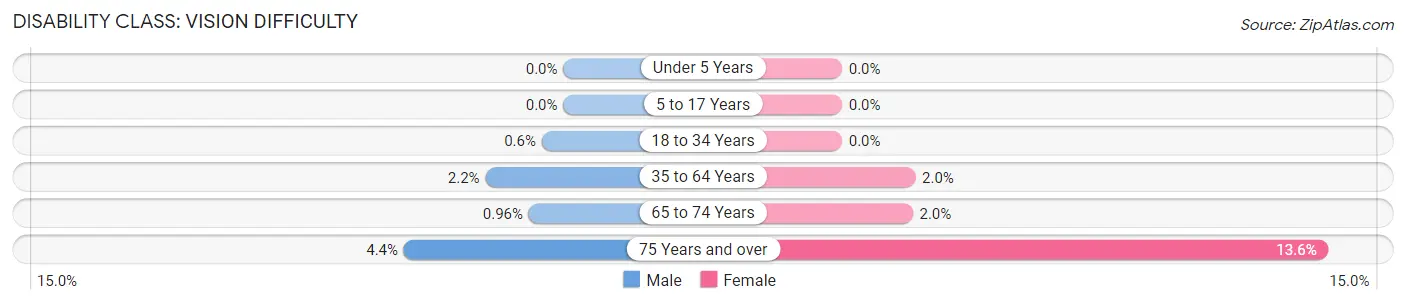
| Age Bracket | Male | Female |
| Under 5 Years | 0 (0.0%) | 0 (0.0%) |
| 5 to 17 Years | 0 (0.0%) | 0 (0.0%) |
| 18 to 34 Years | 17 (0.6%) | 0 (0.0%) |
| 35 to 64 Years | 112 (2.2%) | 101 (2.0%) |
| 65 to 74 Years | 15 (1.0%) | 34 (2.0%) |
| 75 Years and over | 41 (4.4%) | 193 (13.6%) |
Disability Class: Cognitive Difficulty
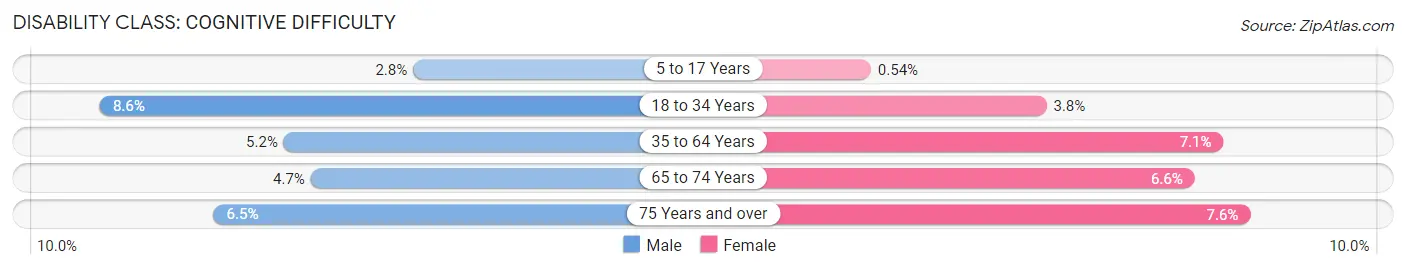
| Age Bracket | Male | Female |
| 5 to 17 Years | 58 (2.8%) | 11 (0.5%) |
| 18 to 34 Years | 245 (8.6%) | 107 (3.8%) |
| 35 to 64 Years | 268 (5.2%) | 350 (7.1%) |
| 65 to 74 Years | 73 (4.7%) | 113 (6.6%) |
| 75 Years and over | 60 (6.5%) | 108 (7.6%) |
Disability Class: Ambulatory Difficulty
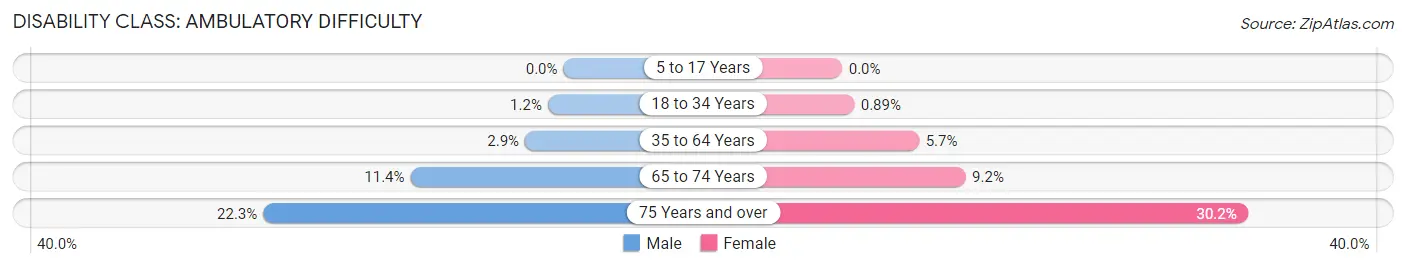
| Age Bracket | Male | Female |
| 5 to 17 Years | 0 (0.0%) | 0 (0.0%) |
| 18 to 34 Years | 33 (1.2%) | 25 (0.9%) |
| 35 to 64 Years | 147 (2.9%) | 282 (5.7%) |
| 65 to 74 Years | 177 (11.4%) | 158 (9.2%) |
| 75 Years and over | 206 (22.3%) | 430 (30.2%) |
Disability Class: Self-Care Difficulty
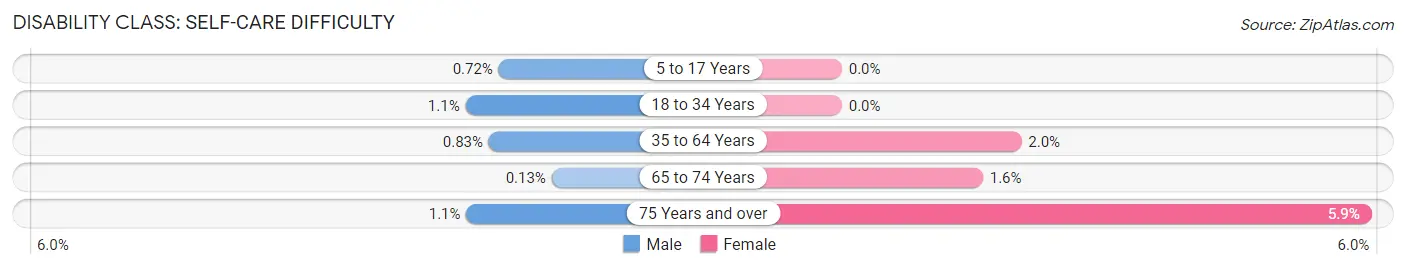
| Age Bracket | Male | Female |
| 5 to 17 Years | 15 (0.7%) | 0 (0.0%) |
| 18 to 34 Years | 31 (1.1%) | 0 (0.0%) |
| 35 to 64 Years | 43 (0.8%) | 99 (2.0%) |
| 65 to 74 Years | 2 (0.1%) | 27 (1.6%) |
| 75 Years and over | 10 (1.1%) | 84 (5.9%) |
Technology Access in Mason City
Computing Device Access in Mason City
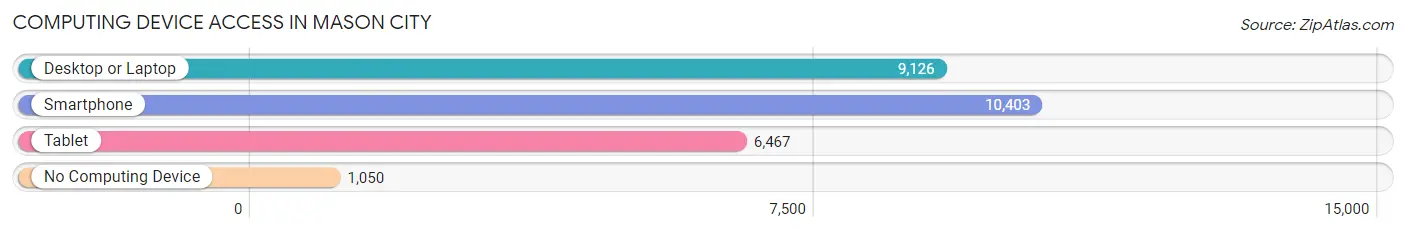
| Device Type | # Households | % Households |
| Desktop or Laptop | 9,126 | 71.7% |
| Smartphone | 10,403 | 81.7% |
| Tablet | 6,467 | 50.8% |
| No Computing Device | 1,050 | 8.3% |
| Total | 12,728 | 100.0% |
Internet Access in Mason City
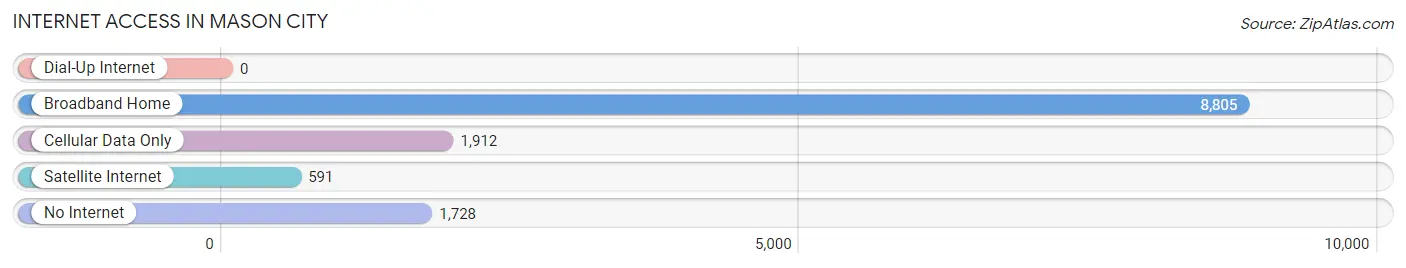
| Internet Type | # Households | % Households |
| Dial-Up Internet | 0 | 0.0% |
| Broadband Home | 8,805 | 69.2% |
| Cellular Data Only | 1,912 | 15.0% |
| Satellite Internet | 591 | 4.6% |
| No Internet | 1,728 | 13.6% |
| Total | 12,728 | 100.0% |
Mason City Summary
Mason City, Iowa is a city located in Cerro Gordo County in the north-central part of the state. It is the county seat and the largest city in the county. The city is situated on the Winnebago River and is located approximately 120 miles north of Des Moines, the state capital. As of the 2010 census, the population of Mason City was 28,079, making it the 24th largest city in Iowa.
History
Mason City was founded in 1853 by settlers from New England. The city was named after a prominent Mason, George M. Flint, who was a member of the Iowa State Senate at the time. The city was incorporated in 1855 and was designated as the county seat of Cerro Gordo County in 1858.
In the late 19th century, Mason City became a major center for the production of brick and tile. The city was also home to a large number of manufacturing plants, including the Mason City Brick and Tile Company, the Mason City Foundry, and the Mason City Machine Works.
In the early 20th century, Mason City was a major center for the production of agricultural equipment. The city was home to the International Harvester Company, which produced tractors, combines, and other farm equipment. The city was also home to the Mason City Foundry, which produced a variety of cast iron products.
Geography
Mason City is located in north-central Iowa, approximately 120 miles north of Des Moines. The city is situated on the Winnebago River and is surrounded by rolling hills and farmland. The city has a total area of 16.2 square miles, of which 15.9 square miles is land and 0.3 square miles is water.
The city has a humid continental climate, with cold, snowy winters and hot, humid summers. The average annual temperature is 48.2°F, with an average high of 61.2°F in July and an average low of 34.2°F in January. The average annual precipitation is 33.2 inches, with an average of 2.7 inches of snowfall per year.
Economy
Mason City has a diversified economy, with a mix of manufacturing, retail, and service industries. The city is home to a number of major employers, including the International Harvester Company, the Mason City Brick and Tile Company, and the Mason City Foundry.
The city is also home to a number of retail businesses, including a number of national chain stores and restaurants. The city is also home to a number of medical facilities, including Mercy Medical Center and the Mayo Clinic Health System.
Demographics
As of the 2010 census, the population of Mason City was 28,079, with a population density of 1,737.7 people per square mile. The median age of the population was 38.7 years, with a gender ratio of 49.7% male and 50.3% female.
The racial makeup of the city was 94.2% White, 1.3% African American, 0.5% Native American, 1.2% Asian, 0.1% Pacific Islander, 1.3% from other races, and 1.4% from two or more races. Hispanic or Latino of any race were 3.7% of the population.
The median household income in Mason City was $45,945, and the median family income was $54,945. The per capita income was $23,945. About 11.2% of the population was below the poverty line.
Common Questions
What is Per Capita Income in Mason City?
Per Capita income in Mason City is $35,089.
What is the Median Family Income in Mason City?
Median Family Income in Mason City is $78,092.
What is the Median Household income in Mason City?
Median Household Income in Mason City is $60,786.
What is Income or Wage Gap in Mason City?
Income or Wage Gap in Mason City is 32.3%.
Women in Mason City earn 67.7 cents for every dollar earned by a man.
What is Family Income Deficit in Mason City?
Family Income Deficit in Mason City is $10,430.
Families that are below poverty line in Mason City earn $10,430 less on average than the poverty threshold level.
What is Inequality or Gini Index in Mason City?
Inequality or Gini Index in Mason City is 0.41.
What is the Total Population of Mason City?
Total Population of Mason City is 27,271.
What is the Total Male Population of Mason City?
Total Male Population of Mason City is 13,526.
What is the Total Female Population of Mason City?
Total Female Population of Mason City is 13,745.
What is the Ratio of Males per 100 Females in Mason City?
There are 98.41 Males per 100 Females in Mason City.
What is the Ratio of Females per 100 Males in Mason City?
There are 101.62 Females per 100 Males in Mason City.
What is the Median Population Age in Mason City?
Median Population Age in Mason City is 43.1 Years.
What is the Average Family Size in Mason City
Average Family Size in Mason City is 2.7 People.
What is the Average Household Size in Mason City
Average Household Size in Mason City is 2.1 People.
How Large is the Labor Force in Mason City?
There are 14,765 People in the Labor Forcein in Mason City.
What is the Percentage of People in the Labor Force in Mason City?
65.6% of People are in the Labor Force in Mason City.
What is the Unemployment Rate in Mason City?
Unemployment Rate in Mason City is 3.4%.