Dubuque County, IA Map & Demographics
Dubuque County Map
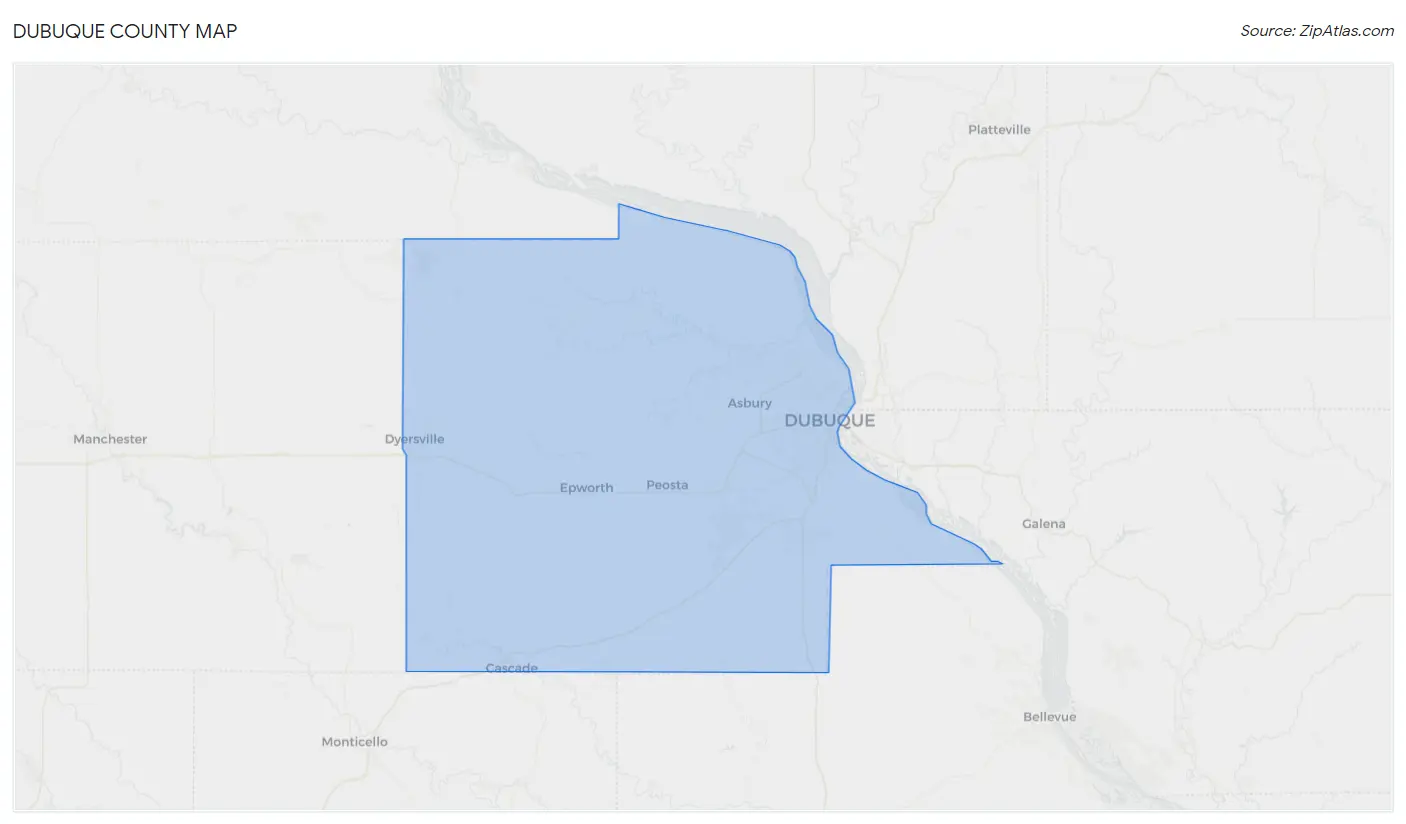
Dubuque County Overview
$38,705
PER CAPITA INCOME
$94,243
AVG FAMILY INCOME
$73,495
AVG HOUSEHOLD INCOME
31.7%
WAGE / INCOME GAP [ % ]
68.3¢/ $1
WAGE / INCOME GAP [ $ ]
$10,900
FAMILY INCOME DEFICIT
0.44
INEQUALITY / GINI INDEX
98,812
TOTAL POPULATION
49,036
MALE POPULATION
49,776
FEMALE POPULATION
98.51
MALES / 100 FEMALES
101.51
FEMALES / 100 MALES
38.7
MEDIAN AGE
3.0
AVG FAMILY SIZE
2.4
AVG HOUSEHOLD SIZE
53,553
LABOR FORCE [ PEOPLE ]
67.4%
PERCENT IN LABOR FORCE
4.1%
UNEMPLOYMENT RATE
Dubuque County Area Codes
Income in Dubuque County
Income Overview in Dubuque County
Per Capita Income in Dubuque County is $38,705, while median incomes of families and households are $94,243 and $73,495 respectively.
| Characteristic | Number | Measure |
| Per Capita Income | 98,812 | $38,705 |
| Median Family Income | 25,367 | $94,243 |
| Mean Family Income | 25,367 | $116,312 |
| Median Household Income | 39,985 | $73,495 |
| Mean Household Income | 39,985 | $95,084 |
| Income Deficit | 25,367 | $10,900 |
| Wage / Income Gap (%) | 98,812 | 31.71% |
| Wage / Income Gap ($) | 98,812 | 68.29¢ per $1 |
| Gini / Inequality Index | 98,812 | 0.44 |
Earnings by Sex in Dubuque County
Average Earnings in Dubuque County are $40,612, $49,494 for men and $33,797 for women, a difference of 31.7%.
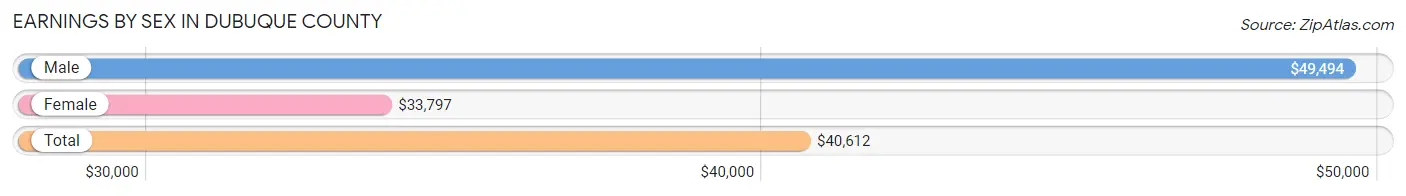
| Sex | Number | Average Earnings |
| Male | 29,611 (51.9%) | $49,494 |
| Female | 27,469 (48.1%) | $33,797 |
| Total | 57,080 (100.0%) | $40,612 |
Earnings by Sex by Income Bracket in Dubuque County
The most common earnings brackets in Dubuque County are $100,000+ for men (3,804 | 12.9%) and $55,000 to $64,999 for women (2,201 | 8.0%).
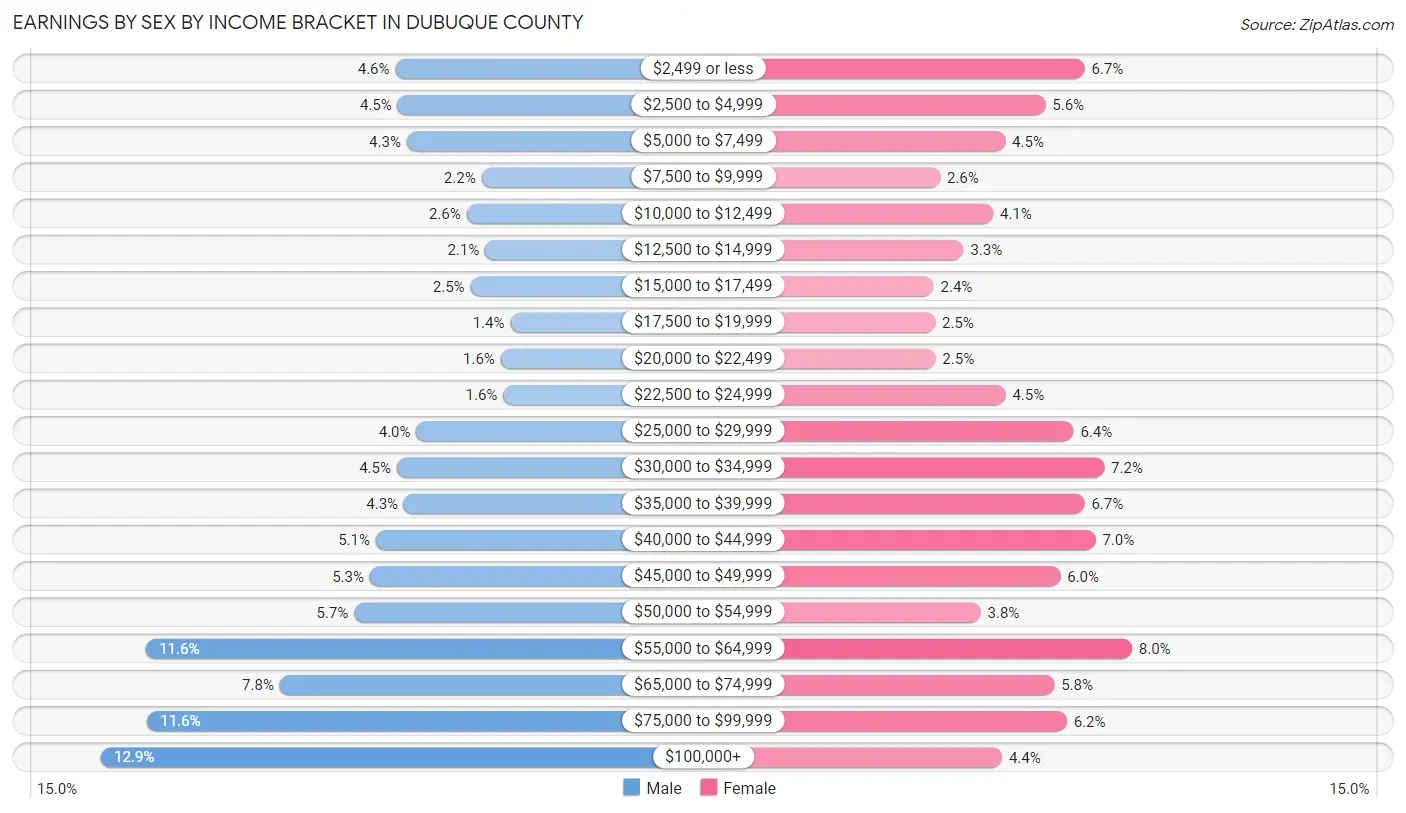
| Income | Male | Female |
| $2,499 or less | 1,357 (4.6%) | 1,836 (6.7%) |
| $2,500 to $4,999 | 1,339 (4.5%) | 1,532 (5.6%) |
| $5,000 to $7,499 | 1,262 (4.3%) | 1,221 (4.4%) |
| $7,500 to $9,999 | 639 (2.2%) | 721 (2.6%) |
| $10,000 to $12,499 | 765 (2.6%) | 1,130 (4.1%) |
| $12,500 to $14,999 | 610 (2.1%) | 901 (3.3%) |
| $15,000 to $17,499 | 730 (2.5%) | 671 (2.4%) |
| $17,500 to $19,999 | 401 (1.3%) | 680 (2.5%) |
| $20,000 to $22,499 | 480 (1.6%) | 685 (2.5%) |
| $22,500 to $24,999 | 459 (1.5%) | 1,225 (4.5%) |
| $25,000 to $29,999 | 1,180 (4.0%) | 1,750 (6.4%) |
| $30,000 to $34,999 | 1,344 (4.5%) | 1,986 (7.2%) |
| $35,000 to $39,999 | 1,285 (4.3%) | 1,834 (6.7%) |
| $40,000 to $44,999 | 1,520 (5.1%) | 1,919 (7.0%) |
| $45,000 to $49,999 | 1,569 (5.3%) | 1,647 (6.0%) |
| $50,000 to $54,999 | 1,700 (5.7%) | 1,033 (3.8%) |
| $55,000 to $64,999 | 3,428 (11.6%) | 2,201 (8.0%) |
| $65,000 to $74,999 | 2,320 (7.8%) | 1,602 (5.8%) |
| $75,000 to $99,999 | 3,419 (11.6%) | 1,698 (6.2%) |
| $100,000+ | 3,804 (12.9%) | 1,197 (4.4%) |
| Total | 29,611 (100.0%) | 27,469 (100.0%) |
Earnings by Sex by Educational Attainment in Dubuque County
Average earnings in Dubuque County are $56,362 for men and $39,357 for women, a difference of 30.2%. Men with an educational attainment of graduate degree enjoy the highest average annual earnings of $85,060, while those with less than high school education earn the least with $30,242. Women with an educational attainment of graduate degree earn the most with the average annual earnings of $59,679, while those with high school diploma education have the smallest earnings of $28,796.
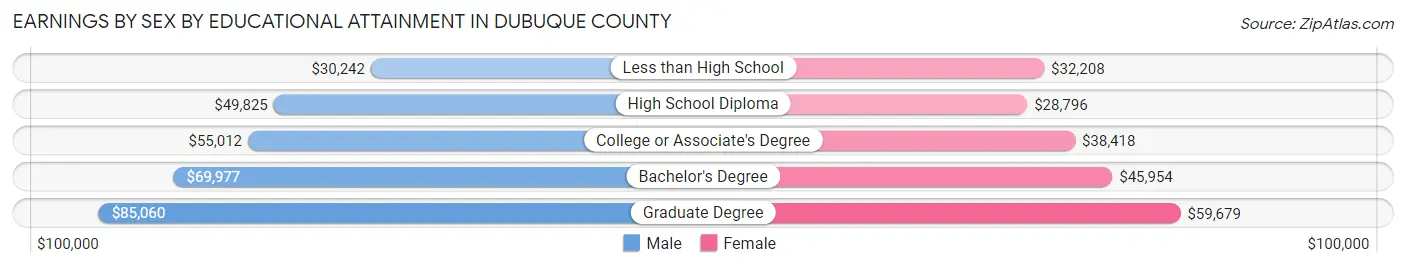
| Educational Attainment | Male Income | Female Income |
| Less than High School | $30,242 | $32,208 |
| High School Diploma | $49,825 | $28,796 |
| College or Associate's Degree | $55,012 | $38,418 |
| Bachelor's Degree | $69,977 | $45,954 |
| Graduate Degree | $85,060 | $59,679 |
| Total | $56,362 | $39,357 |
Family Income in Dubuque County
Family Income Brackets in Dubuque County
According to the Dubuque County family income data, there are 6,392 families falling into the $100,000 to $149,999 income range, which is the most common income bracket and makes up 25.2% of all families. Conversely, the $10,000 to $14,999 income bracket is the least frequent group with only 381 families (1.5%) belonging to this category.
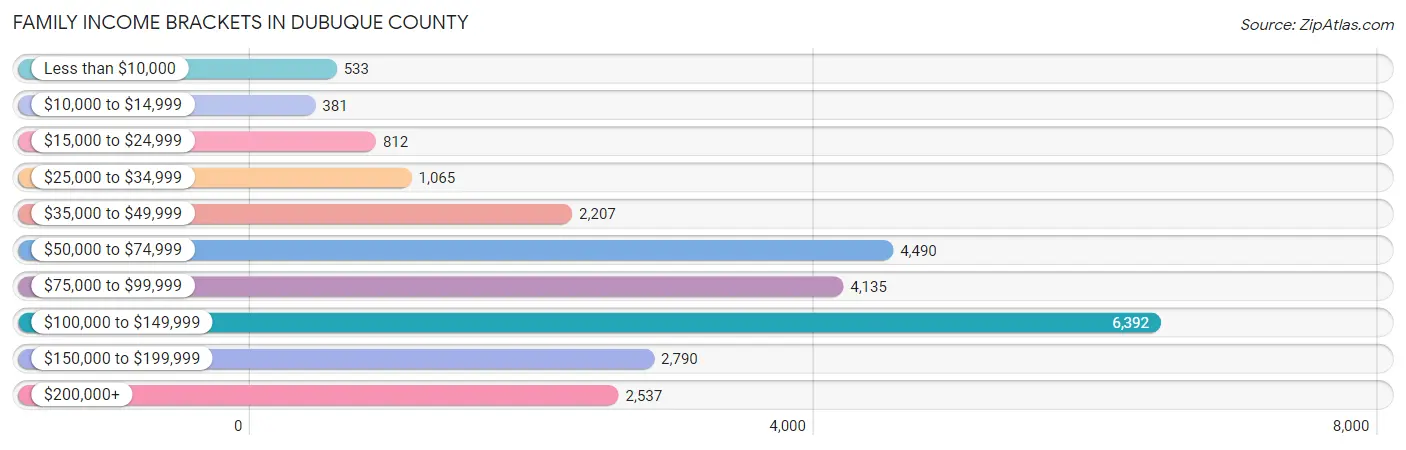
| Income Bracket | # Families | % Families |
| Less than $10,000 | 533 | 2.1% |
| $10,000 to $14,999 | 381 | 1.5% |
| $15,000 to $24,999 | 812 | 3.2% |
| $25,000 to $34,999 | 1,065 | 4.2% |
| $35,000 to $49,999 | 2,207 | 8.7% |
| $50,000 to $74,999 | 4,490 | 17.7% |
| $75,000 to $99,999 | 4,135 | 16.3% |
| $100,000 to $149,999 | 6,392 | 25.2% |
| $150,000 to $199,999 | 2,790 | 11.0% |
| $200,000+ | 2,537 | 10.0% |
Family Income by Famaliy Size in Dubuque County
6-person families (691 | 2.7%) account for the highest median family income in Dubuque County with $125,625 per family, while 2-person families (13,227 | 52.1%) have the highest median income of $40,087 per family member.
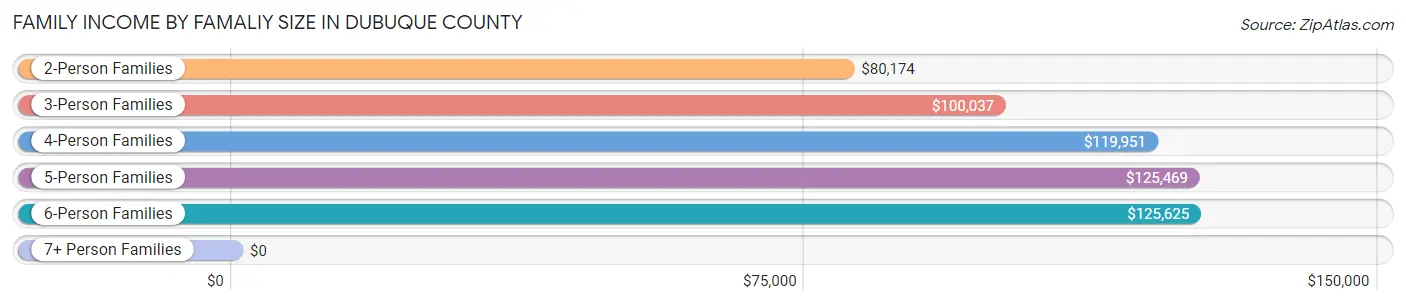
| Income Bracket | # Families | Median Income |
| 2-Person Families | 13,227 (52.1%) | $80,174 |
| 3-Person Families | 4,855 (19.1%) | $100,037 |
| 4-Person Families | 4,318 (17.0%) | $119,951 |
| 5-Person Families | 2,045 (8.1%) | $125,469 |
| 6-Person Families | 691 (2.7%) | $125,625 |
| 7+ Person Families | 231 (0.9%) | $0 |
| Total | 25,367 (100.0%) | $94,243 |
Family Income by Number of Earners in Dubuque County
The median family income in Dubuque County is $94,243, with families comprising 3+ earners (3,396) having the highest median family income of $138,960, while families with no earners (3,496) have the lowest median family income of $56,901, accounting for 13.4% and 13.8% of families, respectively.
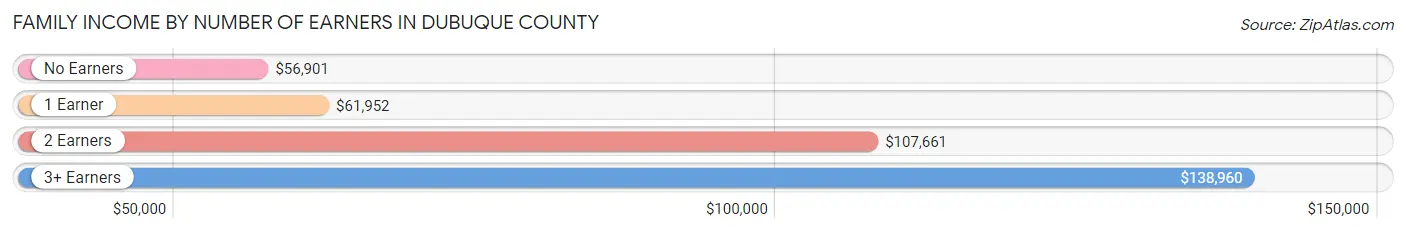
| Number of Earners | # Families | Median Income |
| No Earners | 3,496 (13.8%) | $56,901 |
| 1 Earner | 6,557 (25.9%) | $61,952 |
| 2 Earners | 11,918 (47.0%) | $107,661 |
| 3+ Earners | 3,396 (13.4%) | $138,960 |
| Total | 25,367 (100.0%) | $94,243 |
Household Income in Dubuque County
Household Income Brackets in Dubuque County
With 7,877 households falling in the category, the $100,000 to $149,999 income range is the most frequent in Dubuque County, accounting for 19.7% of all households. In contrast, only 1,320 households (3.3%) fall into the $10,000 to $14,999 income bracket, making it the least populous group.
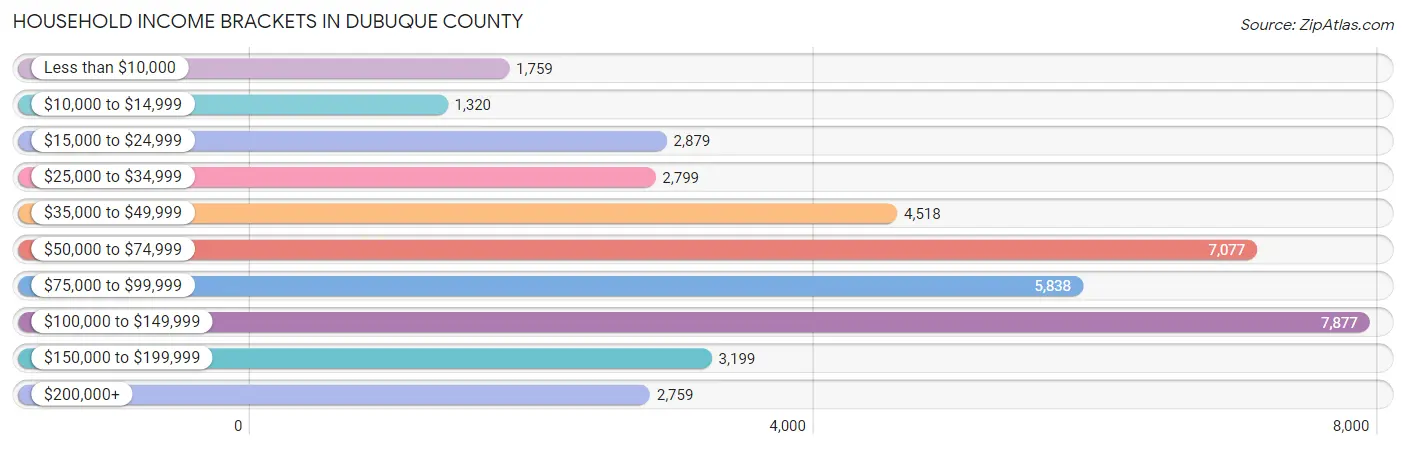
| Income Bracket | # Households | % Households |
| Less than $10,000 | 1,759 | 4.4% |
| $10,000 to $14,999 | 1,320 | 3.3% |
| $15,000 to $24,999 | 2,879 | 7.2% |
| $25,000 to $34,999 | 2,799 | 7.0% |
| $35,000 to $49,999 | 4,518 | 11.3% |
| $50,000 to $74,999 | 7,077 | 17.7% |
| $75,000 to $99,999 | 5,838 | 14.6% |
| $100,000 to $149,999 | 7,877 | 19.7% |
| $150,000 to $199,999 | 3,199 | 8.0% |
| $200,000+ | 2,759 | 6.9% |
Household Income by Householder Age in Dubuque County
The median household income in Dubuque County is $73,495, with the highest median household income of $94,677 found in the 45 to 64 years age bracket for the primary householder. A total of 13,544 households (33.9%) fall into this category. Meanwhile, the 15 to 24 years age bracket for the primary householder has the lowest median household income of $35,683, with 2,385 households (6.0%) in this group.
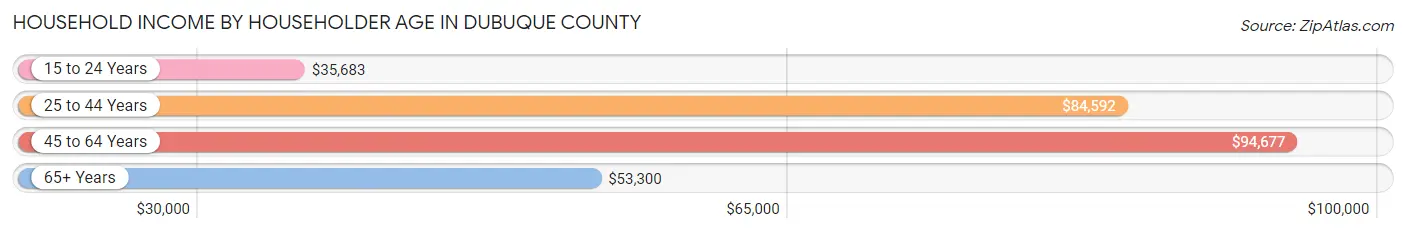
| Income Bracket | # Households | Median Income |
| 15 to 24 Years | 2,385 (6.0%) | $35,683 |
| 25 to 44 Years | 12,752 (31.9%) | $84,592 |
| 45 to 64 Years | 13,544 (33.9%) | $94,677 |
| 65+ Years | 11,304 (28.3%) | $53,300 |
| Total | 39,985 (100.0%) | $73,495 |
Poverty in Dubuque County
Income Below Poverty by Sex and Age in Dubuque County
With 8.3% poverty level for males and 11.5% for females among the residents of Dubuque County, 18 to 24 year old males and 18 to 24 year old females are the most vulnerable to poverty, with 809 males (20.1%) and 1,081 females (26.2%) in their respective age groups living below the poverty level.
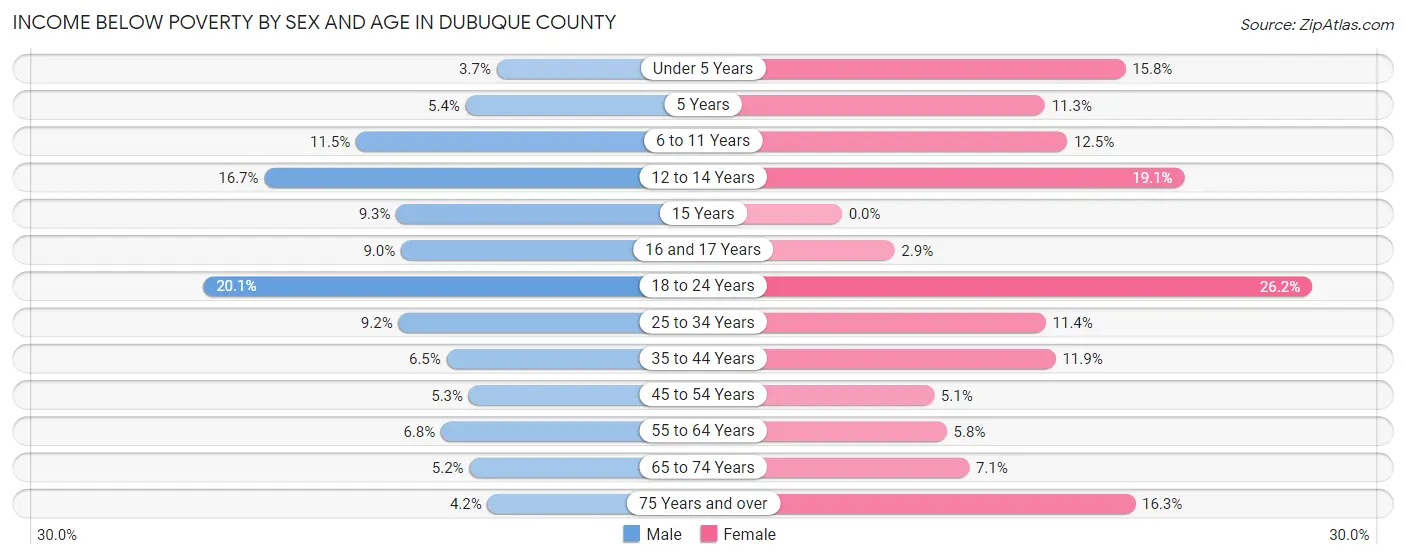
| Age Bracket | Male | Female |
| Under 5 Years | 110 (3.7%) | 467 (15.8%) |
| 5 Years | 36 (5.4%) | 68 (11.3%) |
| 6 to 11 Years | 438 (11.5%) | 455 (12.5%) |
| 12 to 14 Years | 287 (16.7%) | 354 (19.1%) |
| 15 Years | 33 (9.3%) | 0 (0.0%) |
| 16 and 17 Years | 138 (9.0%) | 39 (2.9%) |
| 18 to 24 Years | 809 (20.1%) | 1,081 (26.2%) |
| 25 to 34 Years | 563 (9.2%) | 655 (11.4%) |
| 35 to 44 Years | 388 (6.5%) | 666 (11.9%) |
| 45 to 54 Years | 287 (5.3%) | 279 (5.1%) |
| 55 to 64 Years | 450 (6.8%) | 383 (5.8%) |
| 65 to 74 Years | 258 (5.2%) | 365 (7.1%) |
| 75 Years and over | 122 (4.2%) | 748 (16.3%) |
| Total | 3,919 (8.3%) | 5,560 (11.5%) |
Income Above Poverty by Sex and Age in Dubuque County
According to the poverty statistics in Dubuque County, males aged under 5 years and females aged 15 years are the age groups that are most secure financially, with 96.3% of males and 100.0% of females in these age groups living above the poverty line.
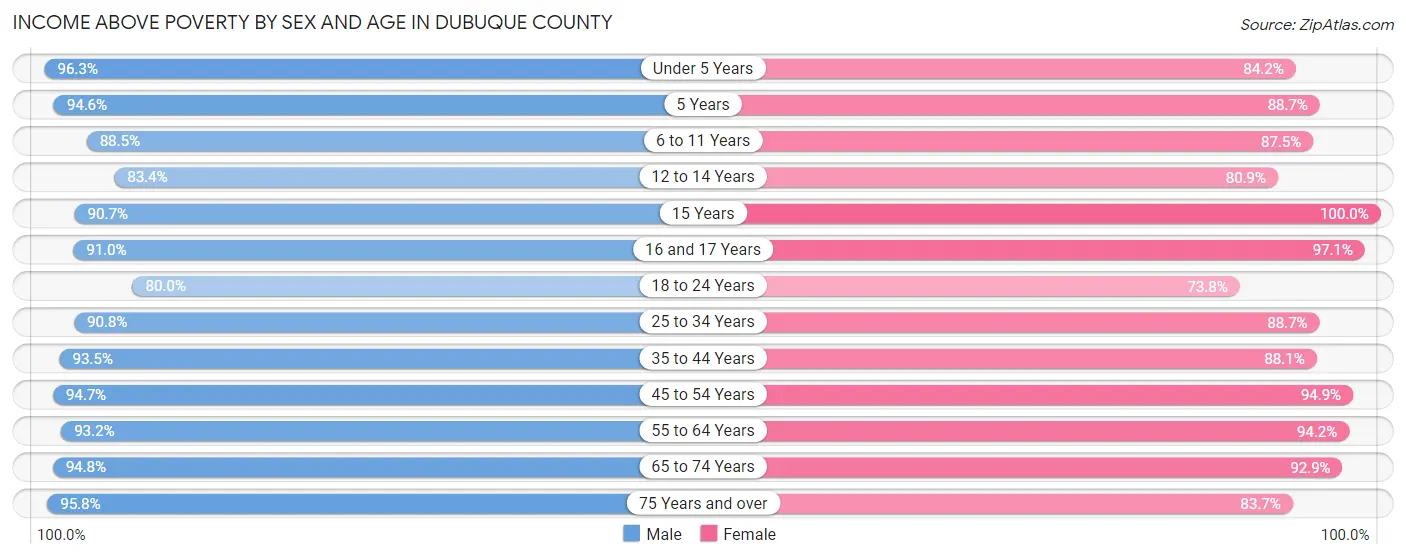
| Age Bracket | Male | Female |
| Under 5 Years | 2,855 (96.3%) | 2,493 (84.2%) |
| 5 Years | 626 (94.6%) | 534 (88.7%) |
| 6 to 11 Years | 3,359 (88.5%) | 3,173 (87.5%) |
| 12 to 14 Years | 1,437 (83.4%) | 1,502 (80.9%) |
| 15 Years | 322 (90.7%) | 602 (100.0%) |
| 16 and 17 Years | 1,389 (91.0%) | 1,291 (97.1%) |
| 18 to 24 Years | 3,226 (79.9%) | 3,048 (73.8%) |
| 25 to 34 Years | 5,572 (90.8%) | 5,118 (88.6%) |
| 35 to 44 Years | 5,578 (93.5%) | 4,929 (88.1%) |
| 45 to 54 Years | 5,165 (94.7%) | 5,155 (94.9%) |
| 55 to 64 Years | 6,155 (93.2%) | 6,180 (94.2%) |
| 65 to 74 Years | 4,671 (94.8%) | 4,789 (92.9%) |
| 75 Years and over | 2,768 (95.8%) | 3,833 (83.7%) |
| Total | 43,123 (91.7%) | 42,647 (88.5%) |
Income Below Poverty Among Married-Couple Families in Dubuque County
The poverty statistics for married-couple families in Dubuque County show that 1.9% or 383 of the total 20,327 families live below the poverty line. Families with 3 or 4 children have the highest poverty rate of 3.5%, comprising of 71 families. On the other hand, families with 1 or 2 children have the lowest poverty rate of 1.7%, which includes 94 families.
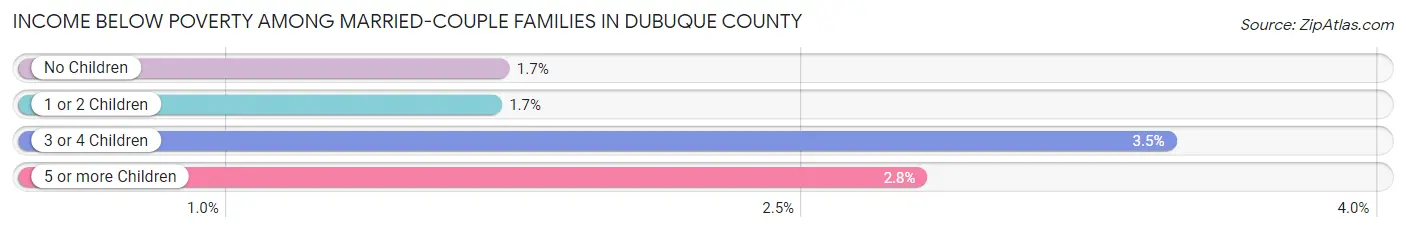
| Children | Above Poverty | Below Poverty |
| No Children | 12,367 (98.3%) | 215 (1.7%) |
| 1 or 2 Children | 5,484 (98.3%) | 94 (1.7%) |
| 3 or 4 Children | 1,989 (96.6%) | 71 (3.5%) |
| 5 or more Children | 104 (97.2%) | 3 (2.8%) |
| Total | 19,944 (98.1%) | 383 (1.9%) |
Income Below Poverty Among Single-Parent Households in Dubuque County
According to the poverty data in Dubuque County, 18.1% or 339 single-father households and 22.9% or 726 single-mother households are living below the poverty line. Among single-father households, those with 3 or 4 children have the highest poverty rate, with 24 households (22.6%) experiencing poverty. Likewise, among single-mother households, those with 3 or 4 children have the highest poverty rate, with 164 households (36.6%) falling below the poverty line.
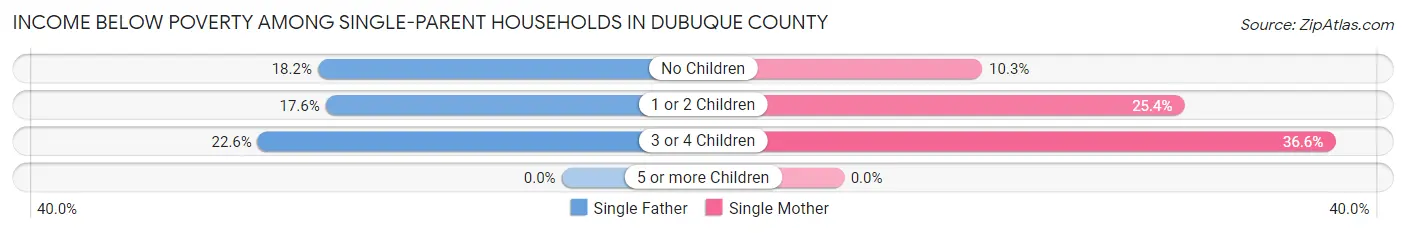
| Children | Single Father | Single Mother |
| No Children | 148 (18.2%) | 88 (10.3%) |
| 1 or 2 Children | 167 (17.6%) | 474 (25.4%) |
| 3 or 4 Children | 24 (22.6%) | 164 (36.6%) |
| 5 or more Children | 0 (0.0%) | 0 (0.0%) |
| Total | 339 (18.1%) | 726 (22.9%) |
Income Below Poverty Among Married-Couple vs Single-Parent Households in Dubuque County
The poverty data for Dubuque County shows that 383 of the married-couple family households (1.9%) and 1,065 of the single-parent households (21.1%) are living below the poverty level. Within the married-couple family households, those with 3 or 4 children have the highest poverty rate, with 71 households (3.5%) falling below the poverty line. Among the single-parent households, those with 3 or 4 children have the highest poverty rate, with 188 household (33.9%) living below poverty.
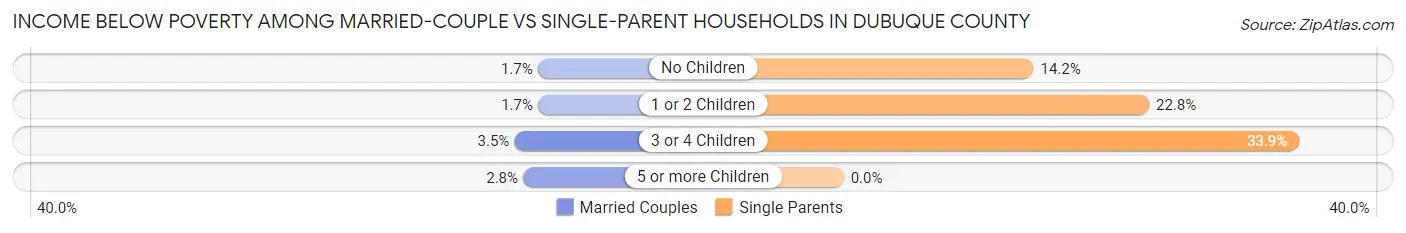
| Children | Married-Couple Families | Single-Parent Households |
| No Children | 215 (1.7%) | 236 (14.1%) |
| 1 or 2 Children | 94 (1.7%) | 641 (22.8%) |
| 3 or 4 Children | 71 (3.5%) | 188 (33.9%) |
| 5 or more Children | 3 (2.8%) | 0 (0.0%) |
| Total | 383 (1.9%) | 1,065 (21.1%) |
Race in Dubuque County
The most populous races in Dubuque County are White / Caucasian (89,619 | 90.7%), Two or more Races (3,390 | 3.4%), and Black / African American (2,968 | 3.0%).
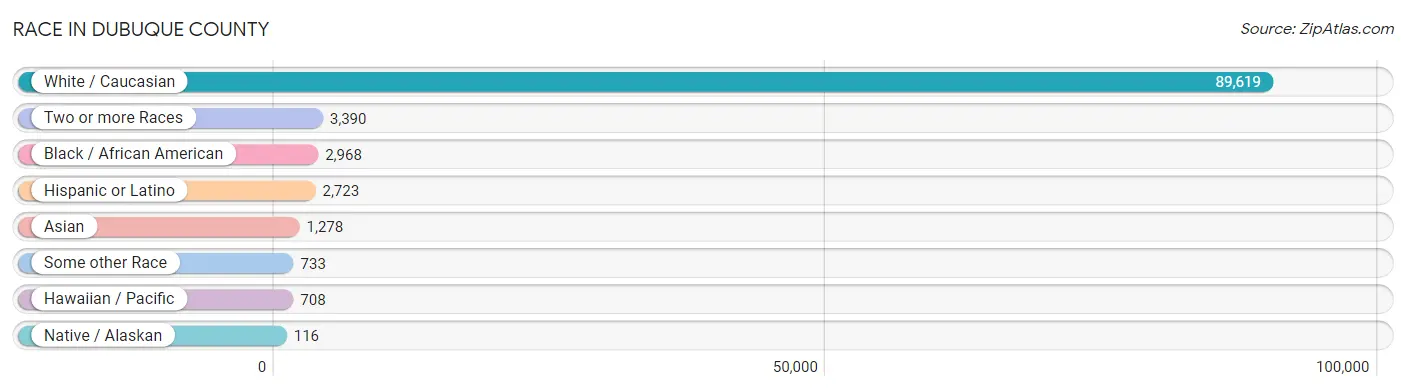
| Race | # Population | % Population |
| Asian | 1,278 | 1.3% |
| Black / African American | 2,968 | 3.0% |
| Hawaiian / Pacific | 708 | 0.7% |
| Hispanic or Latino | 2,723 | 2.8% |
| Native / Alaskan | 116 | 0.1% |
| White / Caucasian | 89,619 | 90.7% |
| Two or more Races | 3,390 | 3.4% |
| Some other Race | 733 | 0.7% |
| Total | 98,812 | 100.0% |
Ancestry in Dubuque County
The most populous ancestries reported in Dubuque County are German (45,728 | 46.3%), Irish (20,716 | 21.0%), English (5,876 | 5.9%), American (4,541 | 4.6%), and Norwegian (2,502 | 2.5%), together accounting for 80.3% of all Dubuque County residents.
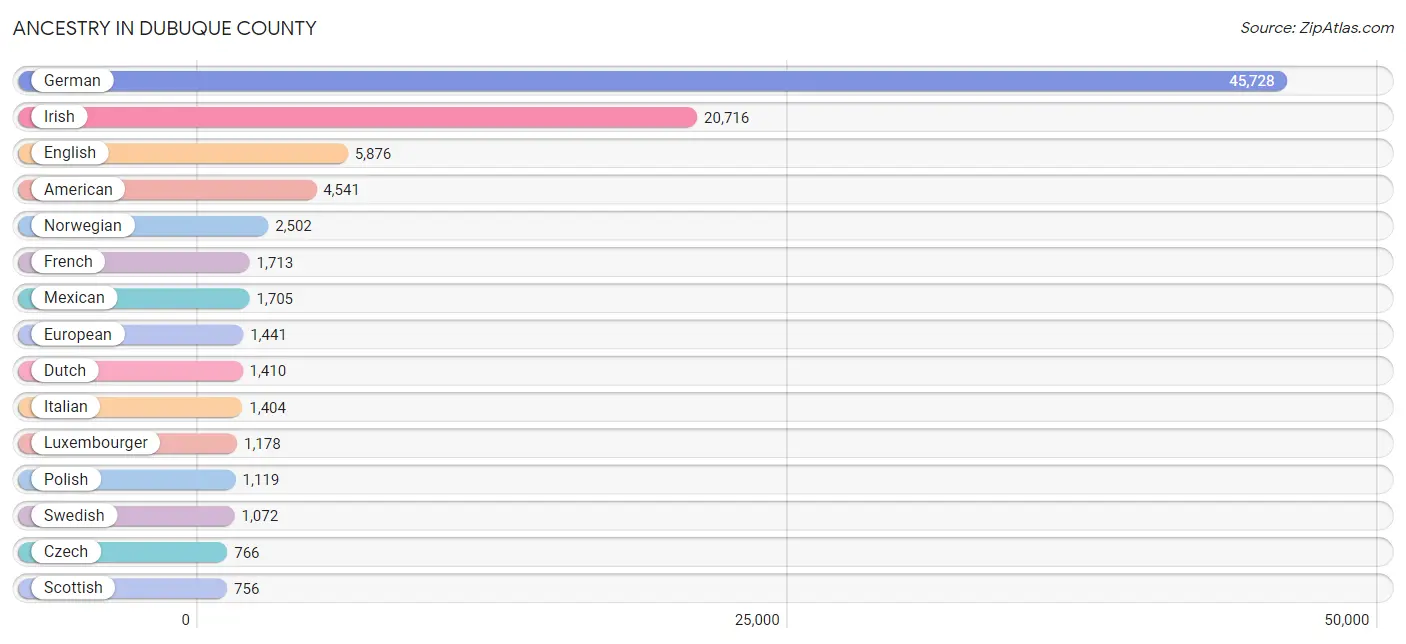
| Ancestry | # Population | % Population |
| African | 351 | 0.4% |
| American | 4,541 | 4.6% |
| Apache | 39 | 0.0% |
| Arab | 238 | 0.2% |
| Australian | 9 | 0.0% |
| Austrian | 158 | 0.2% |
| Belgian | 224 | 0.2% |
| Bhutanese | 127 | 0.1% |
| Blackfeet | 37 | 0.0% |
| Brazilian | 14 | 0.0% |
| British | 298 | 0.3% |
| Burmese | 89 | 0.1% |
| Canadian | 22 | 0.0% |
| Celtic | 15 | 0.0% |
| Central American | 347 | 0.4% |
| Central American Indian | 15 | 0.0% |
| Cherokee | 76 | 0.1% |
| Chilean | 4 | 0.0% |
| Colombian | 23 | 0.0% |
| Croatian | 42 | 0.0% |
| Cuban | 73 | 0.1% |
| Czech | 766 | 0.8% |
| Czechoslovakian | 87 | 0.1% |
| Danish | 592 | 0.6% |
| Dominican | 21 | 0.0% |
| Dutch | 1,410 | 1.4% |
| Eastern European | 45 | 0.1% |
| Egyptian | 4 | 0.0% |
| English | 5,876 | 5.9% |
| European | 1,441 | 1.5% |
| Fijian | 619 | 0.6% |
| Finnish | 35 | 0.0% |
| French | 1,713 | 1.7% |
| French Canadian | 236 | 0.2% |
| German | 45,728 | 46.3% |
| German Russian | 4 | 0.0% |
| Ghanaian | 75 | 0.1% |
| Greek | 266 | 0.3% |
| Guamanian / Chamorro | 35 | 0.0% |
| Guatemalan | 205 | 0.2% |
| Haitian | 17 | 0.0% |
| Honduran | 56 | 0.1% |
| Hungarian | 112 | 0.1% |
| Indian (Asian) | 274 | 0.3% |
| Inupiat | 32 | 0.0% |
| Iranian | 64 | 0.1% |
| Iraqi | 17 | 0.0% |
| Irish | 20,716 | 21.0% |
| Israeli | 8 | 0.0% |
| Italian | 1,404 | 1.4% |
| Jamaican | 14 | 0.0% |
| Korean | 626 | 0.6% |
| Laotian | 19 | 0.0% |
| Latvian | 22 | 0.0% |
| Lebanese | 75 | 0.1% |
| Liberian | 15 | 0.0% |
| Lithuanian | 66 | 0.1% |
| Luxembourger | 1,178 | 1.2% |
| Malaysian | 13 | 0.0% |
| Mexican | 1,705 | 1.7% |
| Mexican American Indian | 7 | 0.0% |
| Moroccan | 11 | 0.0% |
| Native Hawaiian | 16 | 0.0% |
| Nigerian | 3 | 0.0% |
| Northern European | 72 | 0.1% |
| Norwegian | 2,502 | 2.5% |
| Pakistani | 93 | 0.1% |
| Panamanian | 4 | 0.0% |
| Pennsylvania German | 10 | 0.0% |
| Peruvian | 43 | 0.0% |
| Polish | 1,119 | 1.1% |
| Portuguese | 8 | 0.0% |
| Puerto Rican | 164 | 0.2% |
| Romanian | 121 | 0.1% |
| Russian | 273 | 0.3% |
| Salvadoran | 82 | 0.1% |
| Samoan | 8 | 0.0% |
| Scandinavian | 147 | 0.2% |
| Scotch-Irish | 288 | 0.3% |
| Scottish | 756 | 0.8% |
| Serbian | 22 | 0.0% |
| Sioux | 18 | 0.0% |
| Slavic | 11 | 0.0% |
| Slovak | 79 | 0.1% |
| Slovene | 29 | 0.0% |
| Somali | 3 | 0.0% |
| South African | 7 | 0.0% |
| South American | 133 | 0.1% |
| Spaniard | 87 | 0.1% |
| Spanish | 14 | 0.0% |
| Sri Lankan | 136 | 0.1% |
| Subsaharan African | 459 | 0.5% |
| Swedish | 1,072 | 1.1% |
| Swiss | 596 | 0.6% |
| Syrian | 2 | 0.0% |
| Thai | 261 | 0.3% |
| Ukrainian | 45 | 0.1% |
| Venezuelan | 6 | 0.0% |
| Vietnamese | 54 | 0.1% |
| Welsh | 236 | 0.2% |
| Yugoslavian | 259 | 0.3% | View All 101 Rows |
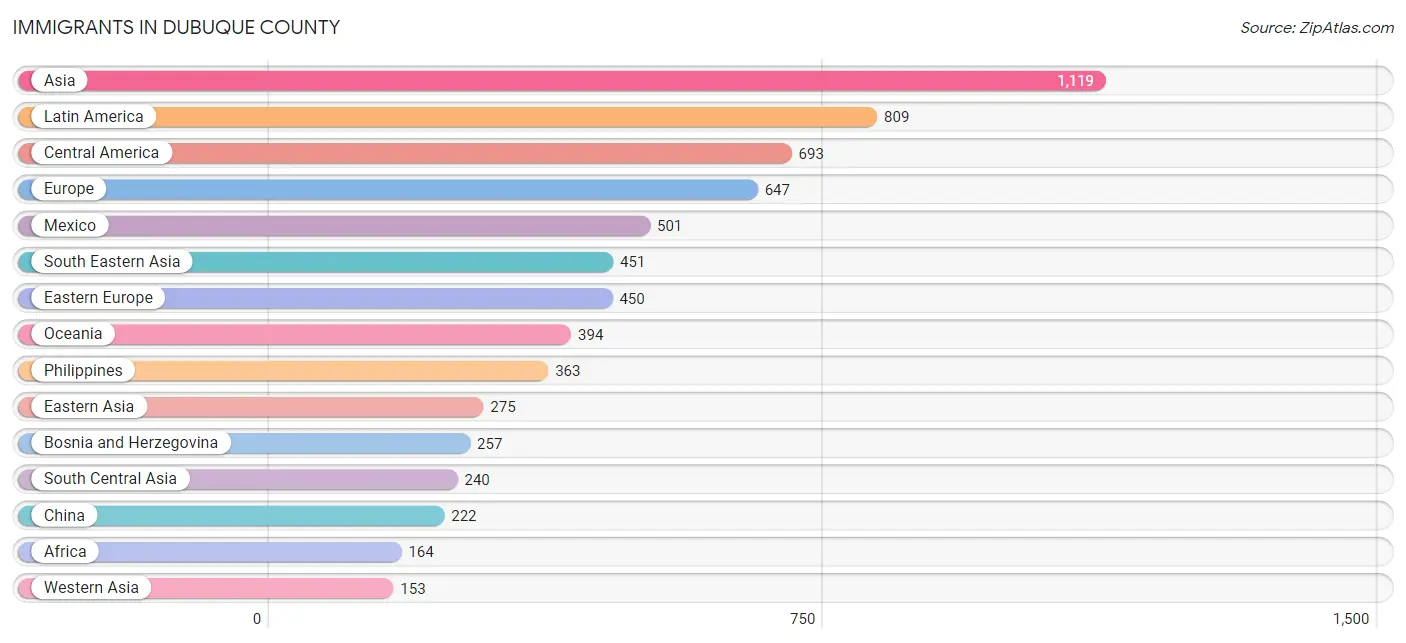
Immigrants in Dubuque County
The most numerous immigrant groups reported in Dubuque County came from Asia (1,119 | 1.1%), Latin America (809 | 0.8%), Central America (693 | 0.7%), Europe (647 | 0.6%), and Mexico (501 | 0.5%), together accounting for 3.8% of all Dubuque County residents.
| Immigration Origin | # Population | % Population |
| Africa | 164 | 0.2% |
| Asia | 1,119 | 1.1% |
| Bangladesh | 27 | 0.0% |
| Belarus | 8 | 0.0% |
| Bosnia and Herzegovina | 257 | 0.3% |
| Cameroon | 5 | 0.0% |
| Canada | 80 | 0.1% |
| Caribbean | 28 | 0.0% |
| Central America | 693 | 0.7% |
| China | 222 | 0.2% |
| Colombia | 18 | 0.0% |
| Croatia | 7 | 0.0% |
| Cuba | 6 | 0.0% |
| Czechoslovakia | 18 | 0.0% |
| Dominican Republic | 5 | 0.0% |
| Eastern Africa | 5 | 0.0% |
| Eastern Asia | 275 | 0.3% |
| Eastern Europe | 450 | 0.5% |
| El Salvador | 9 | 0.0% |
| England | 34 | 0.0% |
| Eritrea | 5 | 0.0% |
| Europe | 647 | 0.6% |
| Germany | 47 | 0.1% |
| Ghana | 88 | 0.1% |
| Guatemala | 147 | 0.2% |
| Guyana | 7 | 0.0% |
| Haiti | 17 | 0.0% |
| Honduras | 32 | 0.0% |
| Hungary | 1 | 0.0% |
| India | 150 | 0.2% |
| Indonesia | 19 | 0.0% |
| Iran | 26 | 0.0% |
| Iraq | 32 | 0.0% |
| Ireland | 3 | 0.0% |
| Italy | 21 | 0.0% |
| Japan | 6 | 0.0% |
| Korea | 47 | 0.1% |
| Laos | 1 | 0.0% |
| Latin America | 809 | 0.8% |
| Latvia | 22 | 0.0% |
| Liberia | 6 | 0.0% |
| Mexico | 501 | 0.5% |
| Middle Africa | 5 | 0.0% |
| Morocco | 4 | 0.0% |
| Nepal | 19 | 0.0% |
| Northern Africa | 4 | 0.0% |
| Northern Europe | 55 | 0.1% |
| Oceania | 394 | 0.4% |
| Pakistan | 18 | 0.0% |
| Panama | 4 | 0.0% |
| Peru | 36 | 0.0% |
| Philippines | 363 | 0.4% |
| Poland | 16 | 0.0% |
| Romania | 88 | 0.1% |
| Russia | 24 | 0.0% |
| Saudi Arabia | 121 | 0.1% |
| Scotland | 9 | 0.0% |
| South Africa | 7 | 0.0% |
| South America | 88 | 0.1% |
| South Central Asia | 240 | 0.2% |
| South Eastern Asia | 451 | 0.5% |
| Southern Europe | 77 | 0.1% |
| Spain | 56 | 0.1% |
| Sweden | 9 | 0.0% |
| Switzerland | 18 | 0.0% |
| Taiwan | 13 | 0.0% |
| Thailand | 7 | 0.0% |
| Ukraine | 9 | 0.0% |
| Venezuela | 27 | 0.0% |
| Vietnam | 61 | 0.1% |
| Western Africa | 94 | 0.1% |
| Western Asia | 153 | 0.2% |
| Western Europe | 65 | 0.1% | View All 73 Rows |
Sex and Age in Dubuque County
Sex and Age in Dubuque County
The most populous age groups in Dubuque County are 20 to 24 Years (3,677 | 7.5%) for men and 60 to 64 Years (3,479 | 7.0%) for women.
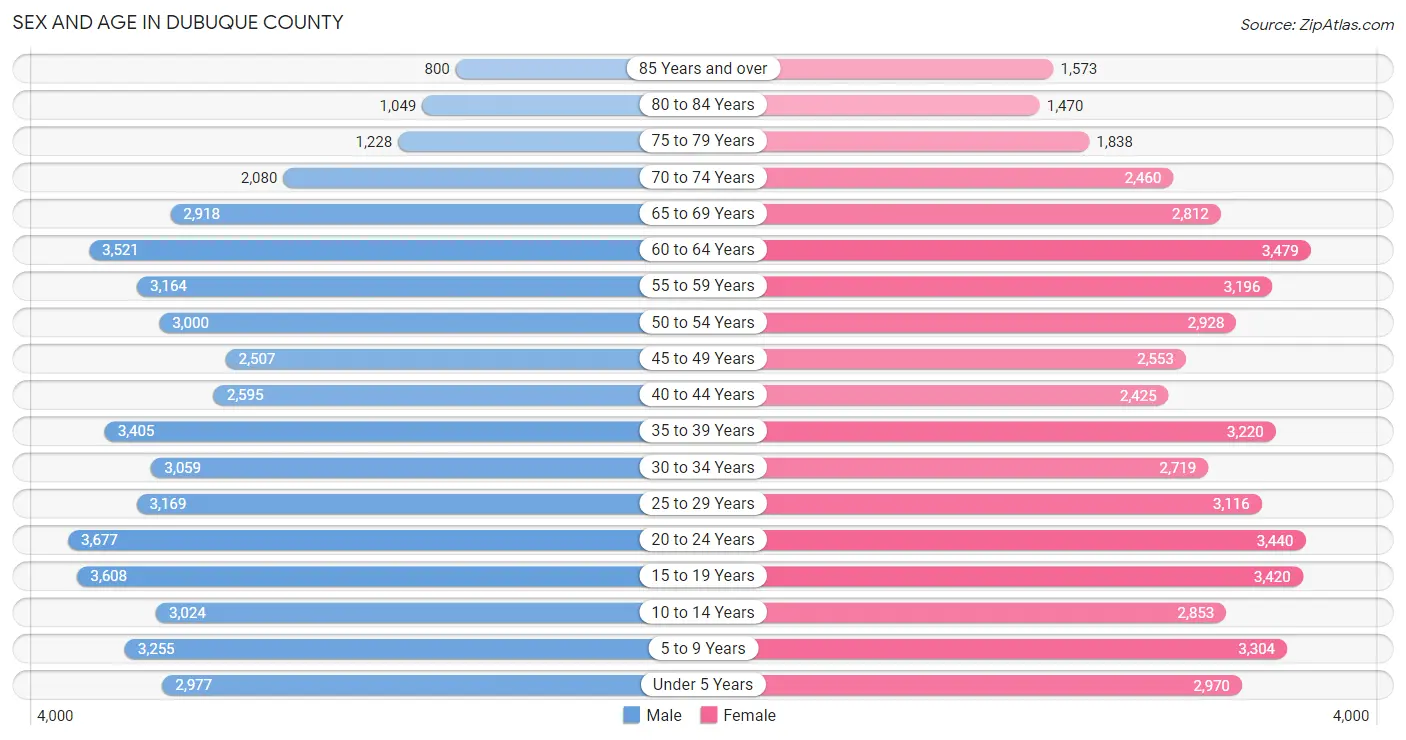
| Age Bracket | Male | Female |
| Under 5 Years | 2,977 (6.1%) | 2,970 (6.0%) |
| 5 to 9 Years | 3,255 (6.6%) | 3,304 (6.6%) |
| 10 to 14 Years | 3,024 (6.2%) | 2,853 (5.7%) |
| 15 to 19 Years | 3,608 (7.4%) | 3,420 (6.9%) |
| 20 to 24 Years | 3,677 (7.5%) | 3,440 (6.9%) |
| 25 to 29 Years | 3,169 (6.5%) | 3,116 (6.3%) |
| 30 to 34 Years | 3,059 (6.2%) | 2,719 (5.5%) |
| 35 to 39 Years | 3,405 (6.9%) | 3,220 (6.5%) |
| 40 to 44 Years | 2,595 (5.3%) | 2,425 (4.9%) |
| 45 to 49 Years | 2,507 (5.1%) | 2,553 (5.1%) |
| 50 to 54 Years | 3,000 (6.1%) | 2,928 (5.9%) |
| 55 to 59 Years | 3,164 (6.5%) | 3,196 (6.4%) |
| 60 to 64 Years | 3,521 (7.2%) | 3,479 (7.0%) |
| 65 to 69 Years | 2,918 (5.9%) | 2,812 (5.7%) |
| 70 to 74 Years | 2,080 (4.2%) | 2,460 (4.9%) |
| 75 to 79 Years | 1,228 (2.5%) | 1,838 (3.7%) |
| 80 to 84 Years | 1,049 (2.1%) | 1,470 (2.9%) |
| 85 Years and over | 800 (1.6%) | 1,573 (3.2%) |
| Total | 49,036 (100.0%) | 49,776 (100.0%) |
Families and Households in Dubuque County
Median Family Size in Dubuque County
The median family size in Dubuque County is 2.96 persons per family, with married-couple families (20,327 | 80.1%) accounting for the largest median family size of 2.98 persons per family. On the other hand, single male/father families (1,871 | 7.4%) represent the smallest median family size with 2.71 persons per family.
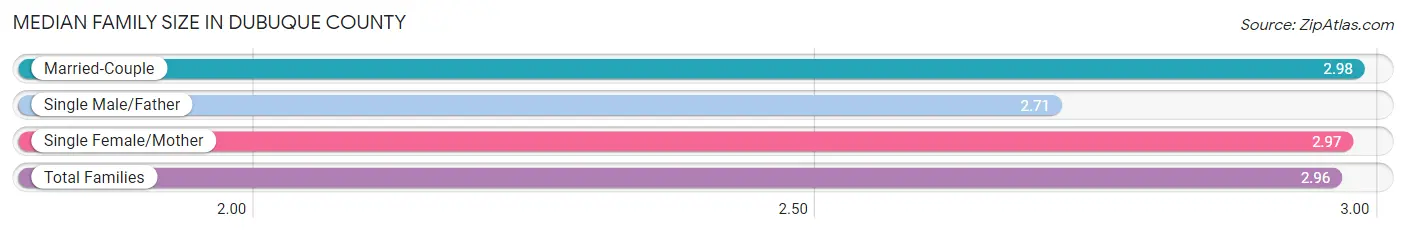
| Family Type | # Families | Family Size |
| Married-Couple | 20,327 (80.1%) | 2.98 |
| Single Male/Father | 1,871 (7.4%) | 2.71 |
| Single Female/Mother | 3,169 (12.5%) | 2.97 |
| Total Families | 25,367 (100.0%) | 2.96 |
Median Household Size in Dubuque County
The median household size in Dubuque County is 2.37 persons per household, with single female/mother households (3,169 | 7.9%) accounting for the largest median household size of 3.17 persons per household. non-family households (14,618 | 36.6%) represent the smallest median household size with 1.24 persons per household.
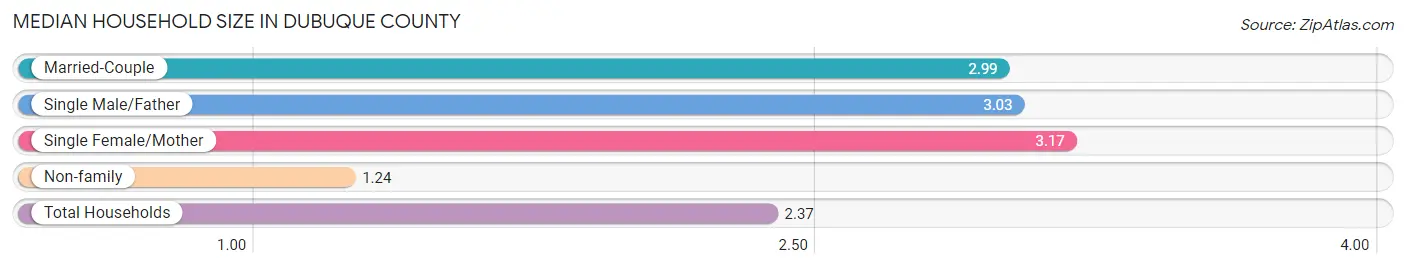
| Household Type | # Households | Household Size |
| Married-Couple | 20,327 (50.8%) | 2.99 |
| Single Male/Father | 1,871 (4.7%) | 3.03 |
| Single Female/Mother | 3,169 (7.9%) | 3.17 |
| Non-family | 14,618 (36.6%) | 1.24 |
| Total Households | 39,985 (100.0%) | 2.37 |
Household Size by Marriage Status in Dubuque County
Out of a total of 39,985 households in Dubuque County, 25,367 (63.4%) are family households, while 14,618 (36.6%) are nonfamily households. The most numerous type of family households are 2-person households, comprising 12,561, and the most common type of nonfamily households are 1-person households, comprising 11,738.
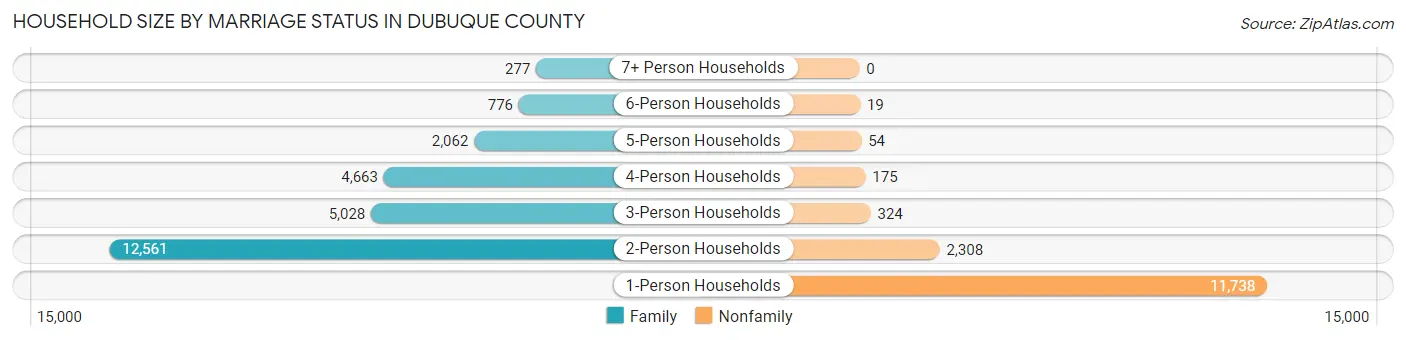
| Household Size | Family Households | Nonfamily Households |
| 1-Person Households | - | 11,738 (29.4%) |
| 2-Person Households | 12,561 (31.4%) | 2,308 (5.8%) |
| 3-Person Households | 5,028 (12.6%) | 324 (0.8%) |
| 4-Person Households | 4,663 (11.7%) | 175 (0.4%) |
| 5-Person Households | 2,062 (5.2%) | 54 (0.1%) |
| 6-Person Households | 776 (1.9%) | 19 (0.1%) |
| 7+ Person Households | 277 (0.7%) | 0 (0.0%) |
| Total | 25,367 (63.4%) | 14,618 (36.6%) |
Female Fertility in Dubuque County
Fertility by Age in Dubuque County
Average fertility rate in Dubuque County is 55.0 births per 1,000 women. Women in the age bracket of 20 to 34 years have the highest fertility rate with 100.0 births per 1,000 women. Women in the age bracket of 20 to 34 years acount for 78.9% of all women with births.
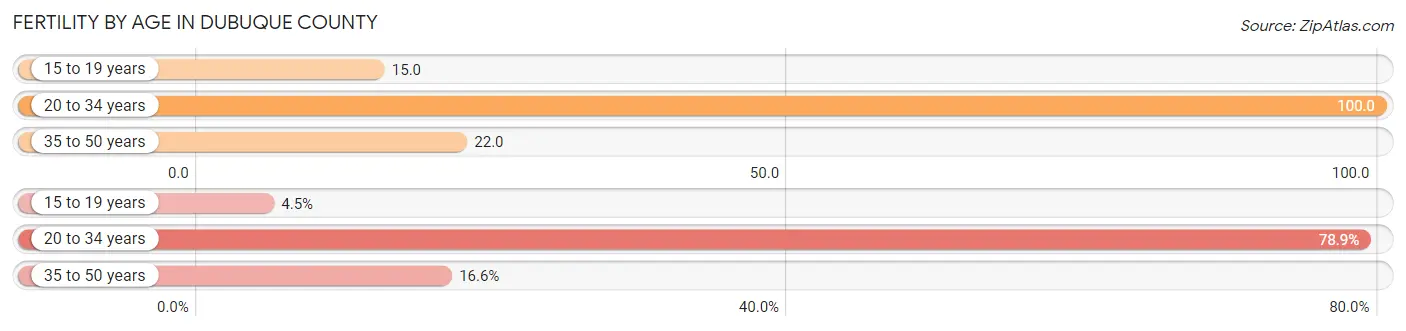
| Age Bracket | Women with Births | Births / 1,000 Women |
| 15 to 19 years | 53 (4.5%) | 15.0 |
| 20 to 34 years | 929 (78.9%) | 100.0 |
| 35 to 50 years | 195 (16.6%) | 22.0 |
| Total | 1,177 (100.0%) | 55.0 |
Fertility by Age by Marriage Status in Dubuque County
69.2% of women with births (1,177) in Dubuque County are married. The highest percentage of unmarried women with births falls into 15 to 19 years age bracket with 100.0% of them unmarried at the time of birth, while the lowest percentage of unmarried women with births belong to 35 to 50 years age bracket with 0.0% of them unmarried.
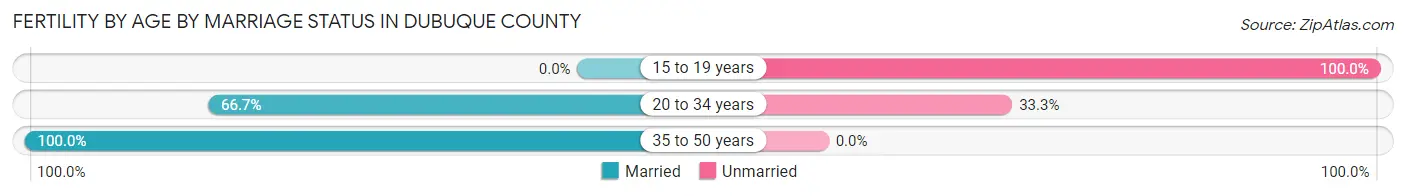
| Age Bracket | Married | Unmarried |
| 15 to 19 years | 0 (0.0%) | 53 (100.0%) |
| 20 to 34 years | 620 (66.7%) | 309 (33.3%) |
| 35 to 50 years | 195 (100.0%) | 0 (0.0%) |
| Total | 814 (69.2%) | 363 (30.8%) |
Fertility by Education in Dubuque County
Average fertility rate in Dubuque County is 55.0 births per 1,000 women. Women with the education attainment of graduate degree have the highest fertility rate of 83.0 births per 1,000 women, while women with the education attainment of less than high school have the lowest fertility at 9.0 births per 1,000 women. Women with the education attainment of college or associate's degree represent 41.4% of all women with births.
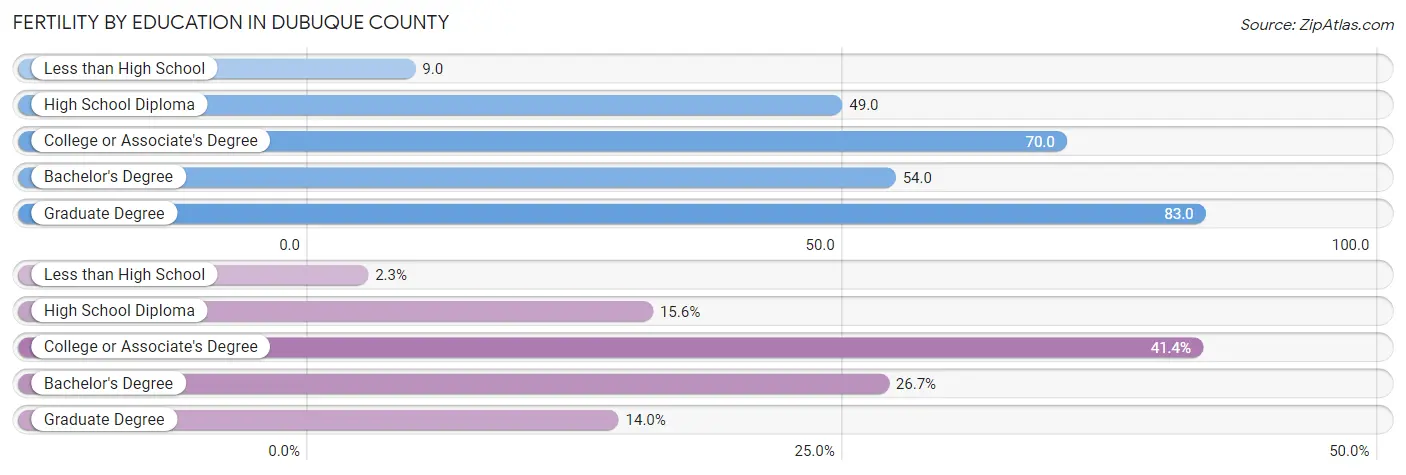
| Educational Attainment | Women with Births | Births / 1,000 Women |
| Less than High School | 27 (2.3%) | 9.0 |
| High School Diploma | 184 (15.6%) | 49.0 |
| College or Associate's Degree | 487 (41.4%) | 70.0 |
| Bachelor's Degree | 314 (26.7%) | 54.0 |
| Graduate Degree | 165 (14.0%) | 83.0 |
| Total | 1,177 (100.0%) | 55.0 |
Fertility by Education by Marriage Status in Dubuque County
30.8% of women with births in Dubuque County are unmarried. Women with the educational attainment of less than high school are most likely to be married with 100.0% of them married at childbirth, while women with the educational attainment of high school diploma are least likely to be married with 81.5% of them unmarried at childbirth.
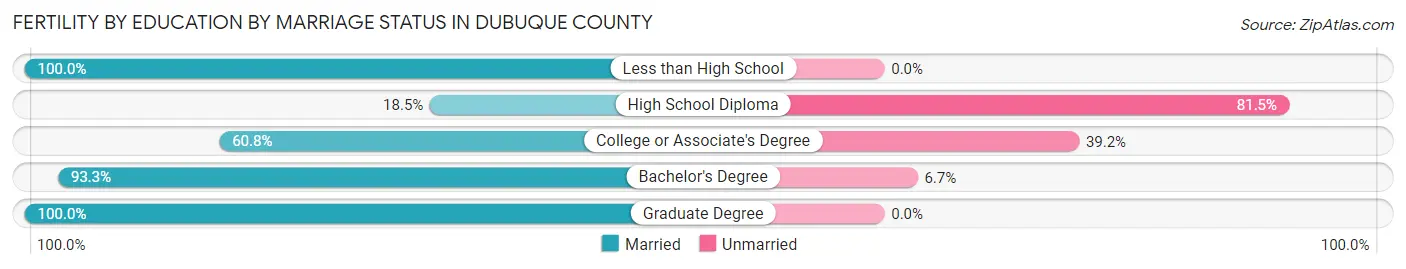
| Educational Attainment | Married | Unmarried |
| Less than High School | 27 (100.0%) | 0 (0.0%) |
| High School Diploma | 34 (18.5%) | 150 (81.5%) |
| College or Associate's Degree | 296 (60.8%) | 191 (39.2%) |
| Bachelor's Degree | 293 (93.3%) | 21 (6.7%) |
| Graduate Degree | 165 (100.0%) | 0 (0.0%) |
| Total | 814 (69.2%) | 363 (30.8%) |
Employment Characteristics in Dubuque County
Employment by Class of Employer in Dubuque County
Among the 50,680 employed individuals in Dubuque County, private company employees (35,238 | 69.5%), not-for-profit organizations (5,886 | 11.6%), and local government employees (3,661 | 7.2%) make up the most common classes of employment.
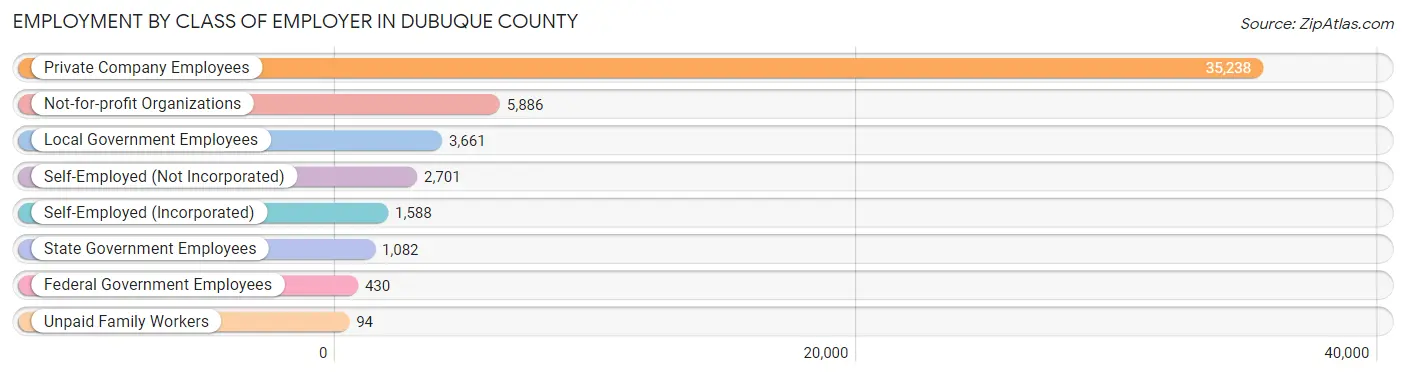
| Employer Class | # Employees | % Employees |
| Private Company Employees | 35,238 | 69.5% |
| Self-Employed (Incorporated) | 1,588 | 3.1% |
| Self-Employed (Not Incorporated) | 2,701 | 5.3% |
| Not-for-profit Organizations | 5,886 | 11.6% |
| Local Government Employees | 3,661 | 7.2% |
| State Government Employees | 1,082 | 2.1% |
| Federal Government Employees | 430 | 0.9% |
| Unpaid Family Workers | 94 | 0.2% |
| Total | 50,680 | 100.0% |
Employment Status by Age in Dubuque County
According to the labor force statistics for Dubuque County, out of the total population over 16 years of age (79,456), 67.4% or 53,553 individuals are in the labor force, with 4.1% or 2,196 of them unemployed. The age group with the highest labor force participation rate is 35 to 44 years, with 91.9% or 10,702 individuals in the labor force. Within the labor force, the 16 to 19 years age range has the highest percentage of unemployed individuals, with 8.1% or 281 of them being unemployed.
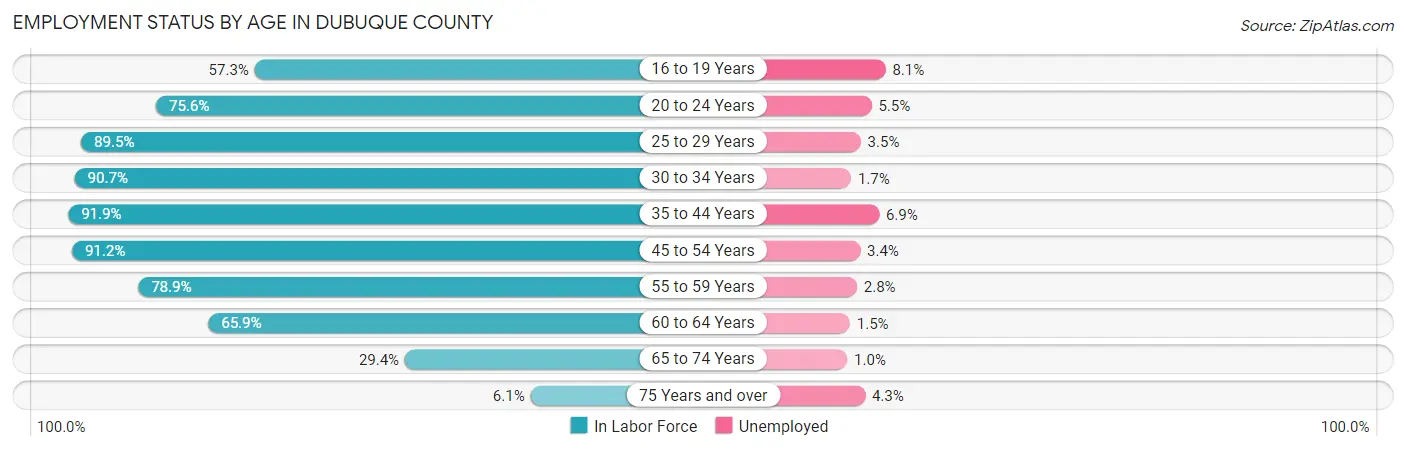
| Age Bracket | In Labor Force | Unemployed |
| 16 to 19 Years | 3,470 (57.3%) | 281 (8.1%) |
| 20 to 24 Years | 5,380 (75.6%) | 296 (5.5%) |
| 25 to 29 Years | 5,625 (89.5%) | 197 (3.5%) |
| 30 to 34 Years | 5,241 (90.7%) | 89 (1.7%) |
| 35 to 44 Years | 10,702 (91.9%) | 738 (6.9%) |
| 45 to 54 Years | 10,021 (91.2%) | 341 (3.4%) |
| 55 to 59 Years | 5,018 (78.9%) | 141 (2.8%) |
| 60 to 64 Years | 4,613 (65.9%) | 69 (1.5%) |
| 65 to 74 Years | 3,019 (29.4%) | 30 (1.0%) |
| 75 Years and over | 485 (6.1%) | 21 (4.3%) |
| Total | 53,553 (67.4%) | 2,196 (4.1%) |
Employment Status by Educational Attainment in Dubuque County
According to labor force statistics for Dubuque County, 85.8% of individuals (41,232) out of the total population between 25 and 64 years of age (48,056) are in the labor force, with 3.8% or 1,567 of them being unemployed. The group with the highest labor force participation rate are those with the educational attainment of bachelor's degree or higher, with 90.6% or 14,890 individuals in the labor force. Within the labor force, individuals with high school diploma education have the highest percentage of unemployment, with 5.9% or 679 of them being unemployed.
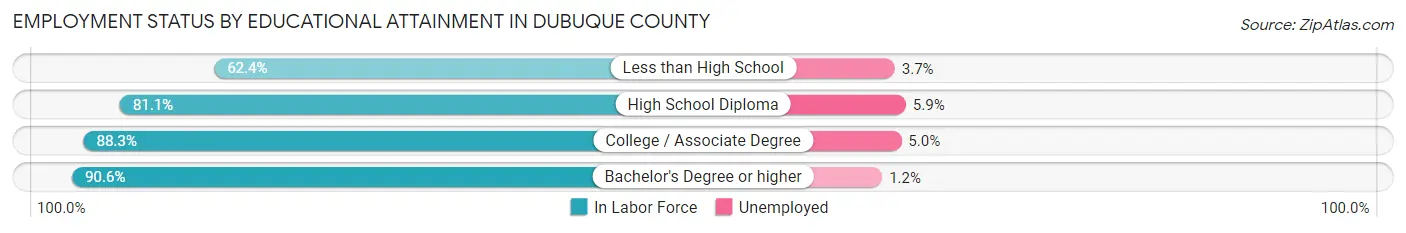
| Educational Attainment | In Labor Force | Unemployed |
| Less than High School | 1,419 (62.4%) | 84 (3.7%) |
| High School Diploma | 11,502 (81.1%) | 837 (5.9%) |
| College / Associate Degree | 13,390 (88.3%) | 758 (5.0%) |
| Bachelor's Degree or higher | 14,890 (90.6%) | 197 (1.2%) |
| Total | 41,232 (85.8%) | 1,826 (3.8%) |
Employment Occupations by Sex in Dubuque County
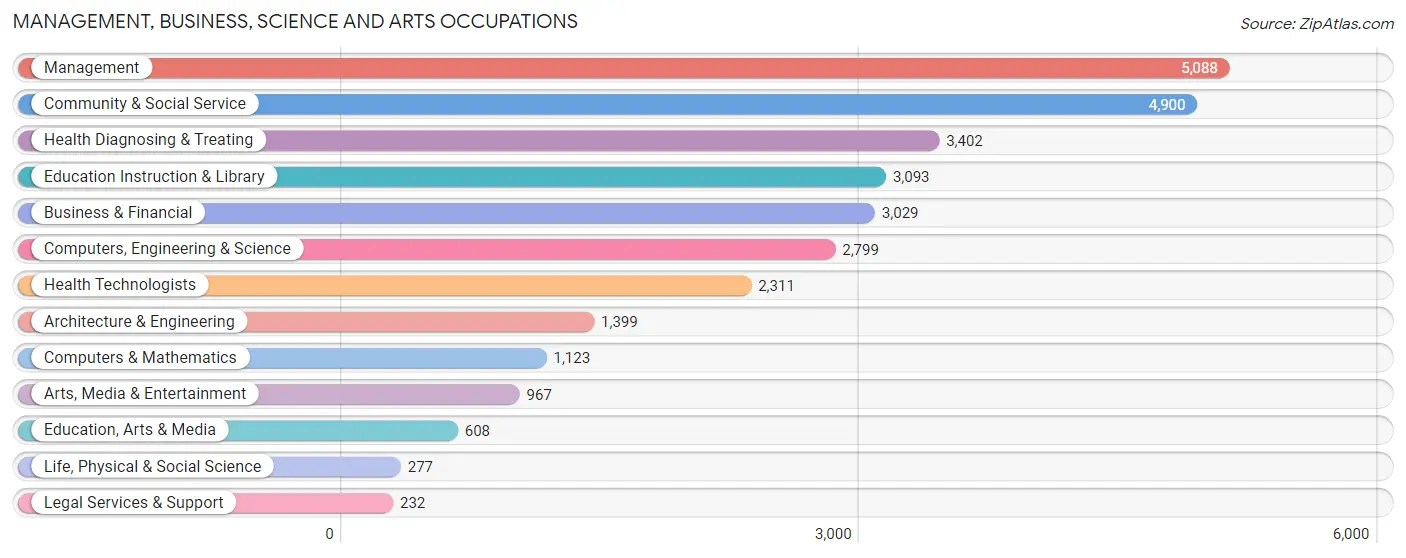
Management, Business, Science and Arts Occupations
The most common Management, Business, Science and Arts occupations in Dubuque County are Management (5,088 | 9.9%), Community & Social Service (4,900 | 9.5%), Health Diagnosing & Treating (3,402 | 6.6%), Education Instruction & Library (3,093 | 6.0%), and Business & Financial (3,029 | 5.9%).
Management, Business, Science and Arts Occupations by Sex
Within the Management, Business, Science and Arts occupations in Dubuque County, the most male-oriented occupations are Architecture & Engineering (88.8%), Computers, Engineering & Science (80.3%), and Computers & Mathematics (75.7%), while the most female-oriented occupations are Health Diagnosing & Treating (79.7%), Education, Arts & Media (76.6%), and Health Technologists (76.6%).
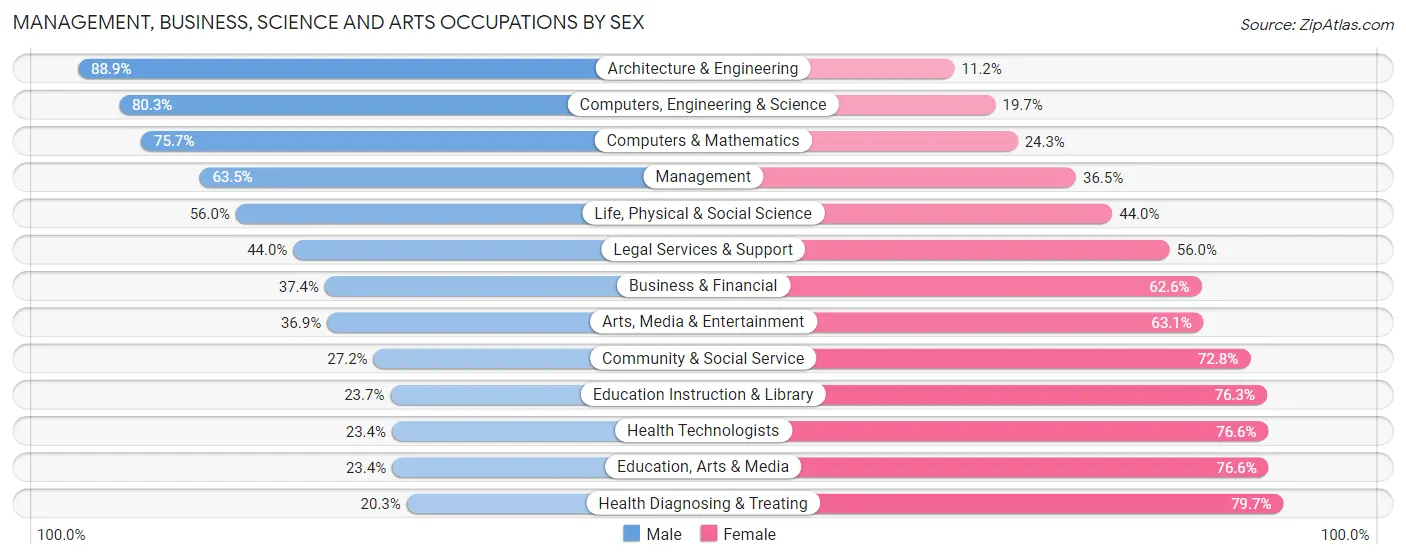
| Occupation | Male | Female |
| Management | 3,232 (63.5%) | 1,856 (36.5%) |
| Business & Financial | 1,132 (37.4%) | 1,897 (62.6%) |
| Computers, Engineering & Science | 2,248 (80.3%) | 551 (19.7%) |
| Computers & Mathematics | 850 (75.7%) | 273 (24.3%) |
| Architecture & Engineering | 1,243 (88.8%) | 156 (11.2%) |
| Life, Physical & Social Science | 155 (56.0%) | 122 (44.0%) |
| Community & Social Service | 1,335 (27.2%) | 3,565 (72.8%) |
| Education, Arts & Media | 142 (23.4%) | 466 (76.6%) |
| Legal Services & Support | 102 (44.0%) | 130 (56.0%) |
| Education Instruction & Library | 734 (23.7%) | 2,359 (76.3%) |
| Arts, Media & Entertainment | 357 (36.9%) | 610 (63.1%) |
| Health Diagnosing & Treating | 691 (20.3%) | 2,711 (79.7%) |
| Health Technologists | 541 (23.4%) | 1,770 (76.6%) |
| Total (Category) | 8,638 (45.0%) | 10,580 (55.0%) |
| Total (Overall) | 26,277 (51.2%) | 25,069 (48.8%) |
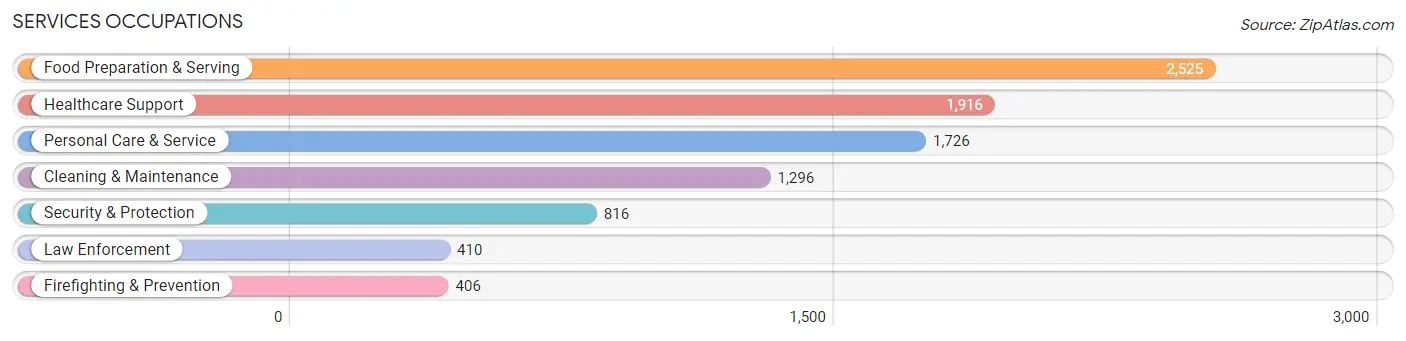
Services Occupations
The most common Services occupations in Dubuque County are Food Preparation & Serving (2,525 | 4.9%), Healthcare Support (1,916 | 3.7%), Personal Care & Service (1,726 | 3.4%), Cleaning & Maintenance (1,296 | 2.5%), and Security & Protection (816 | 1.6%).
Services Occupations by Sex
Within the Services occupations in Dubuque County, the most male-oriented occupations are Firefighting & Prevention (77.8%), Security & Protection (71.2%), and Law Enforcement (64.6%), while the most female-oriented occupations are Healthcare Support (93.2%), Personal Care & Service (81.7%), and Food Preparation & Serving (57.5%).
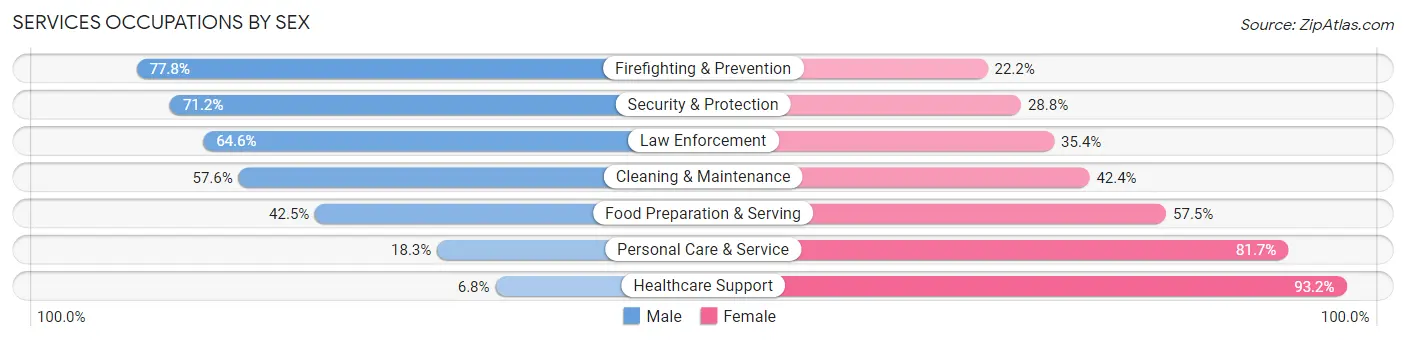
| Occupation | Male | Female |
| Healthcare Support | 130 (6.8%) | 1,786 (93.2%) |
| Security & Protection | 581 (71.2%) | 235 (28.8%) |
| Firefighting & Prevention | 316 (77.8%) | 90 (22.2%) |
| Law Enforcement | 265 (64.6%) | 145 (35.4%) |
| Food Preparation & Serving | 1,072 (42.5%) | 1,453 (57.5%) |
| Cleaning & Maintenance | 747 (57.6%) | 549 (42.4%) |
| Personal Care & Service | 316 (18.3%) | 1,410 (81.7%) |
| Total (Category) | 2,846 (34.4%) | 5,433 (65.6%) |
| Total (Overall) | 26,277 (51.2%) | 25,069 (48.8%) |
Sales and Office Occupations
The most common Sales and Office occupations in Dubuque County are Office & Administration (5,852 | 11.4%), and Sales & Related (4,505 | 8.8%).

Sales and Office Occupations by Sex
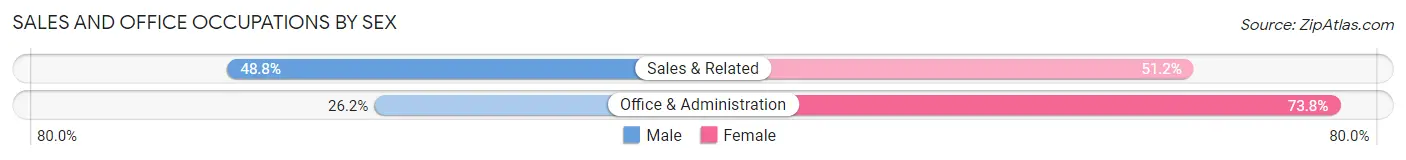
| Occupation | Male | Female |
| Sales & Related | 2,197 (48.8%) | 2,308 (51.2%) |
| Office & Administration | 1,535 (26.2%) | 4,317 (73.8%) |
| Total (Category) | 3,732 (36.0%) | 6,625 (64.0%) |
| Total (Overall) | 26,277 (51.2%) | 25,069 (48.8%) |
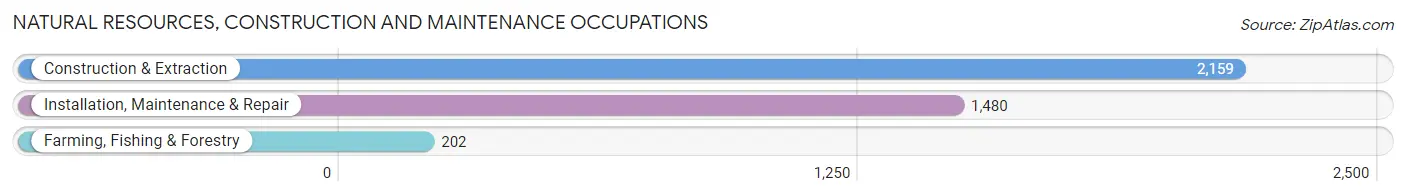
Natural Resources, Construction and Maintenance Occupations
The most common Natural Resources, Construction and Maintenance occupations in Dubuque County are Construction & Extraction (2,159 | 4.2%), Installation, Maintenance & Repair (1,480 | 2.9%), and Farming, Fishing & Forestry (202 | 0.4%).
Natural Resources, Construction and Maintenance Occupations by Sex
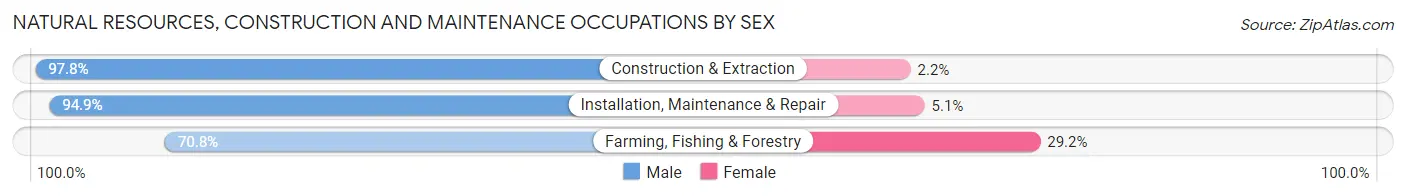
| Occupation | Male | Female |
| Farming, Fishing & Forestry | 143 (70.8%) | 59 (29.2%) |
| Construction & Extraction | 2,111 (97.8%) | 48 (2.2%) |
| Installation, Maintenance & Repair | 1,404 (94.9%) | 76 (5.1%) |
| Total (Category) | 3,658 (95.2%) | 183 (4.8%) |
| Total (Overall) | 26,277 (51.2%) | 25,069 (48.8%) |
Production, Transportation and Moving Occupations
The most common Production, Transportation and Moving occupations in Dubuque County are Production (4,791 | 9.3%), Material Moving (2,864 | 5.6%), and Transportation (1,996 | 3.9%).
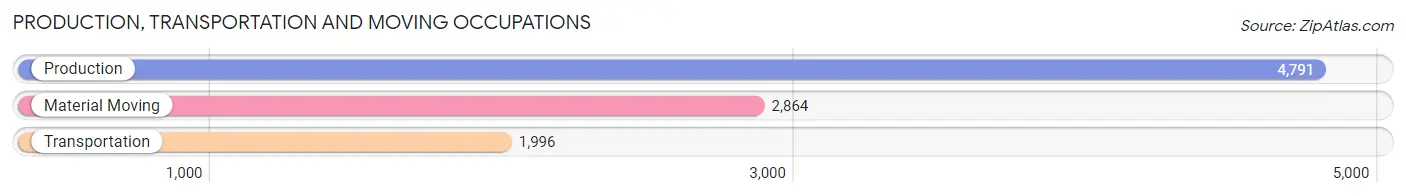
Production, Transportation and Moving Occupations by Sex
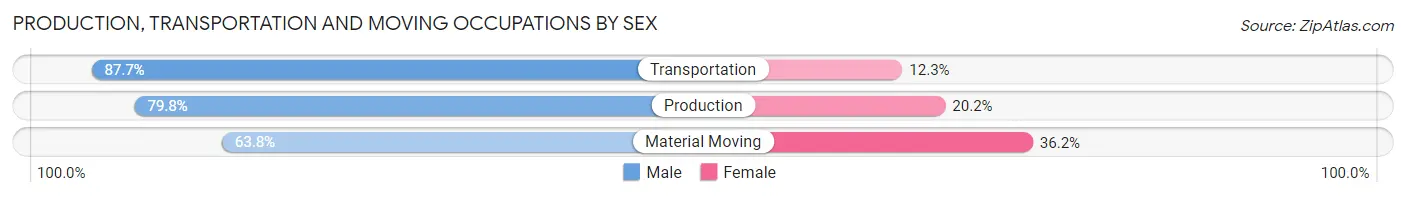
| Occupation | Male | Female |
| Production | 3,825 (79.8%) | 966 (20.2%) |
| Transportation | 1,751 (87.7%) | 245 (12.3%) |
| Material Moving | 1,827 (63.8%) | 1,037 (36.2%) |
| Total (Category) | 7,403 (76.7%) | 2,248 (23.3%) |
| Total (Overall) | 26,277 (51.2%) | 25,069 (48.8%) |
Employment Industries by Sex in Dubuque County
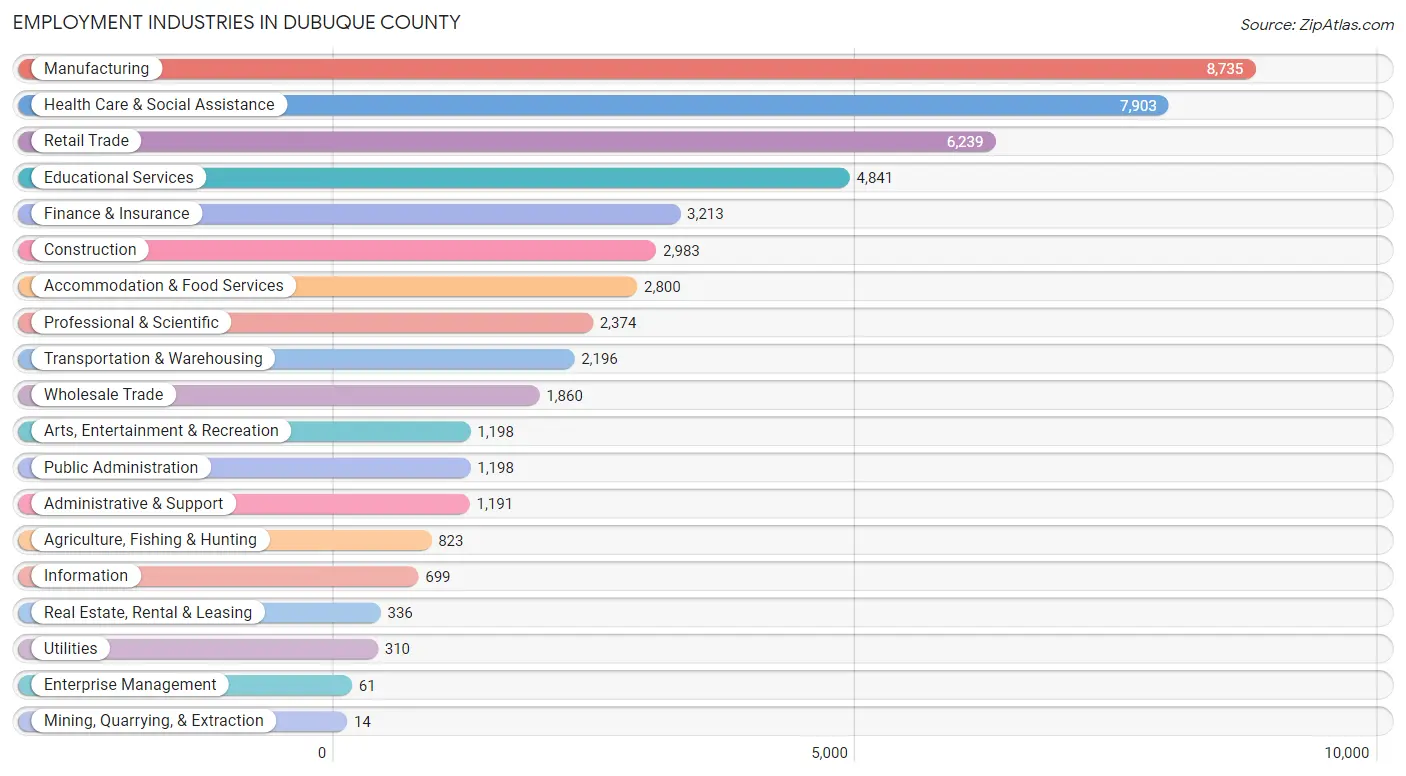
Employment Industries in Dubuque County
The major employment industries in Dubuque County include Manufacturing (8,735 | 17.0%), Health Care & Social Assistance (7,903 | 15.4%), Retail Trade (6,239 | 12.1%), Educational Services (4,841 | 9.4%), and Finance & Insurance (3,213 | 6.3%).
Employment Industries by Sex in Dubuque County
The Dubuque County industries that see more men than women are Utilities (92.3%), Construction (91.5%), and Mining, Quarrying, & Extraction (85.7%), whereas the industries that tend to have a higher number of women are Health Care & Social Assistance (83.9%), Educational Services (67.7%), and Information (66.5%).
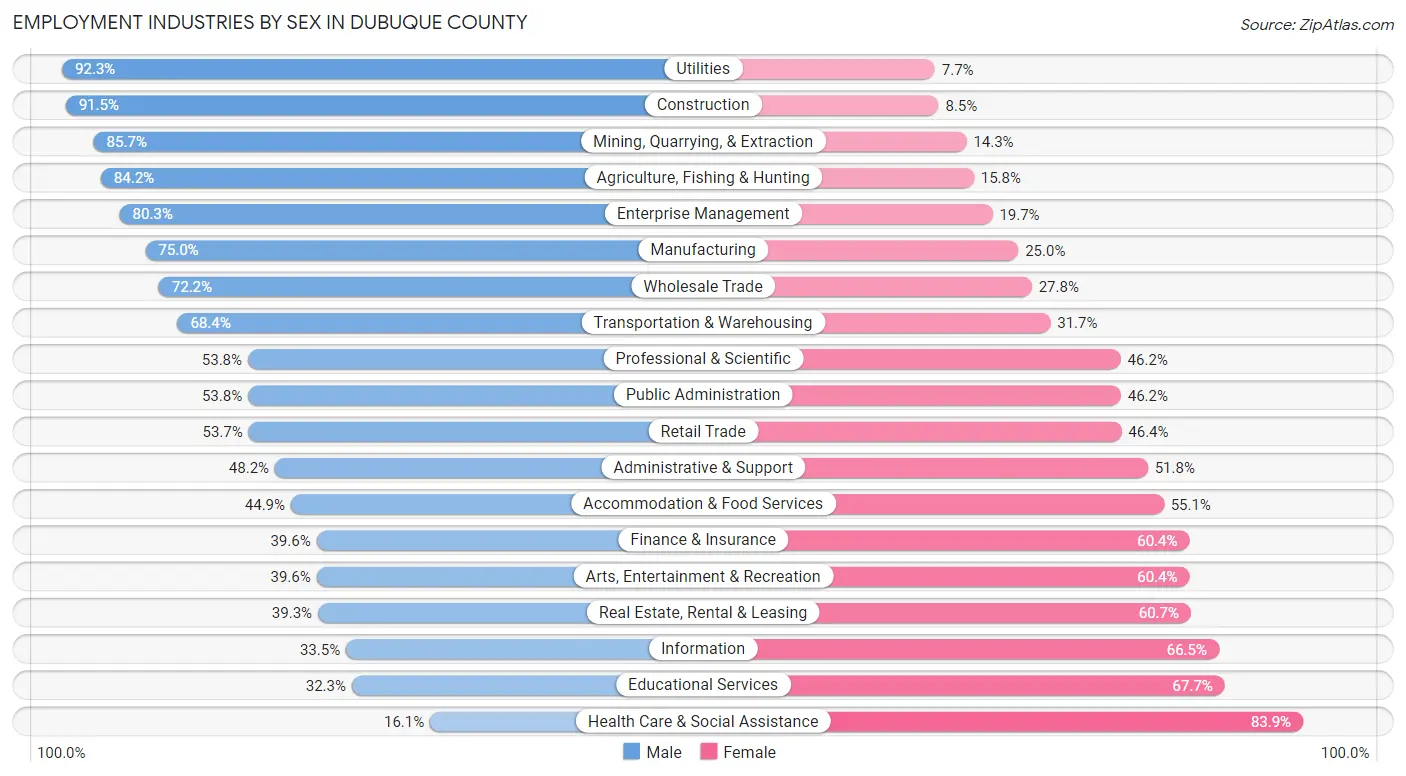
| Industry | Male | Female |
| Agriculture, Fishing & Hunting | 693 (84.2%) | 130 (15.8%) |
| Mining, Quarrying, & Extraction | 12 (85.7%) | 2 (14.3%) |
| Construction | 2,729 (91.5%) | 254 (8.5%) |
| Manufacturing | 6,550 (75.0%) | 2,185 (25.0%) |
| Wholesale Trade | 1,343 (72.2%) | 517 (27.8%) |
| Retail Trade | 3,347 (53.6%) | 2,892 (46.4%) |
| Transportation & Warehousing | 1,501 (68.3%) | 695 (31.7%) |
| Utilities | 286 (92.3%) | 24 (7.7%) |
| Information | 234 (33.5%) | 465 (66.5%) |
| Finance & Insurance | 1,272 (39.6%) | 1,941 (60.4%) |
| Real Estate, Rental & Leasing | 132 (39.3%) | 204 (60.7%) |
| Professional & Scientific | 1,277 (53.8%) | 1,097 (46.2%) |
| Enterprise Management | 49 (80.3%) | 12 (19.7%) |
| Administrative & Support | 574 (48.2%) | 617 (51.8%) |
| Educational Services | 1,562 (32.3%) | 3,279 (67.7%) |
| Health Care & Social Assistance | 1,270 (16.1%) | 6,633 (83.9%) |
| Arts, Entertainment & Recreation | 474 (39.6%) | 724 (60.4%) |
| Accommodation & Food Services | 1,257 (44.9%) | 1,543 (55.1%) |
| Public Administration | 644 (53.8%) | 554 (46.2%) |
| Total | 26,277 (51.2%) | 25,069 (48.8%) |
Education in Dubuque County
School Enrollment in Dubuque County
The most common levels of schooling among the 24,530 students in Dubuque County are college / undergraduate (5,222 | 21.3%), high school (5,109 | 20.8%), and elementary school (4,906 | 20.0%).
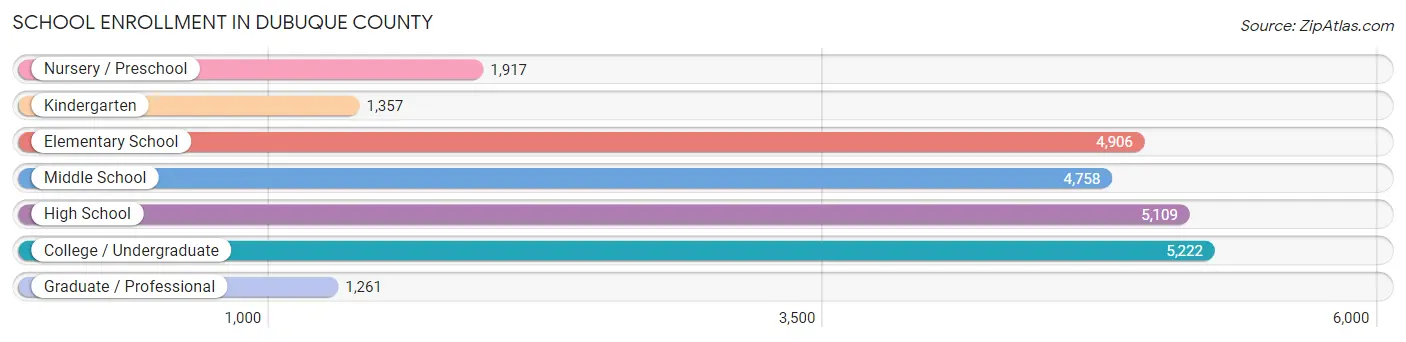
| School Level | # Students | % Students |
| Nursery / Preschool | 1,917 | 7.8% |
| Kindergarten | 1,357 | 5.5% |
| Elementary School | 4,906 | 20.0% |
| Middle School | 4,758 | 19.4% |
| High School | 5,109 | 20.8% |
| College / Undergraduate | 5,222 | 21.3% |
| Graduate / Professional | 1,261 | 5.1% |
| Total | 24,530 | 100.0% |
School Enrollment by Age by Funding Source in Dubuque County
Out of a total of 24,530 students who are enrolled in schools in Dubuque County, 7,261 (29.6%) attend a private institution, while the remaining 17,269 (70.4%) are enrolled in public schools. The age group of 20 to 24 year olds has the highest likelihood of being enrolled in private schools, with 2,078 (61.7% in the age bracket) enrolled. Conversely, the age group of 15 to 17 year olds has the lowest likelihood of being enrolled in a private school, with 3,170 (85.5% in the age bracket) attending a public institution.
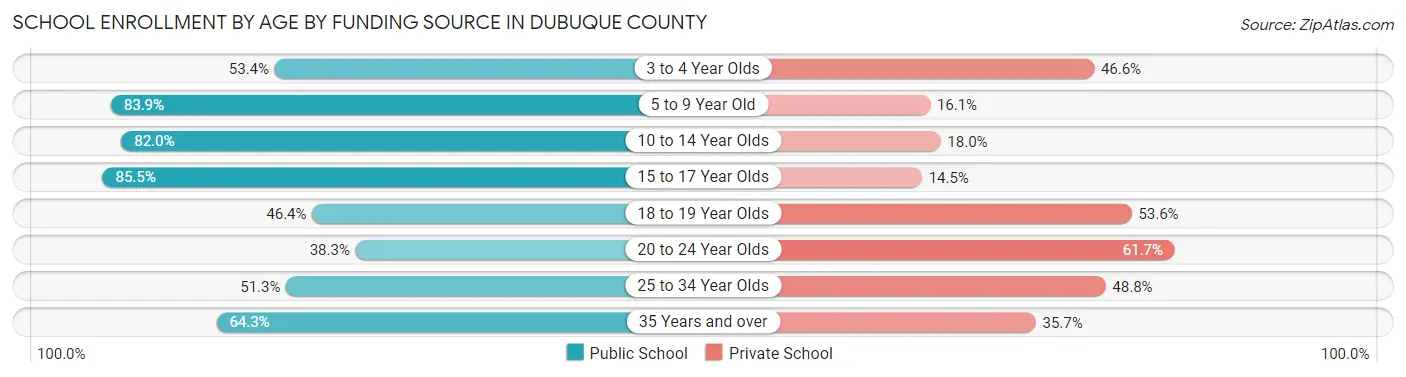
| Age Bracket | Public School | Private School |
| 3 to 4 Year Olds | 656 (53.4%) | 573 (46.6%) |
| 5 to 9 Year Old | 5,376 (83.9%) | 1,029 (16.1%) |
| 10 to 14 Year Olds | 4,762 (82.0%) | 1,047 (18.0%) |
| 15 to 17 Year Olds | 3,170 (85.5%) | 539 (14.5%) |
| 18 to 19 Year Olds | 1,114 (46.4%) | 1,287 (53.6%) |
| 20 to 24 Year Olds | 1,291 (38.3%) | 2,078 (61.7%) |
| 25 to 34 Year Olds | 533 (51.2%) | 507 (48.7%) |
| 35 Years and over | 365 (64.3%) | 203 (35.7%) |
| Total | 17,269 (70.4%) | 7,261 (29.6%) |
Educational Attainment by Field of Study in Dubuque County
Business (4,669 | 19.8%), education (3,955 | 16.8%), science & technology (2,367 | 10.1%), engineering (1,788 | 7.6%), and arts & humanities (1,717 | 7.3%) are the most common fields of study among 23,554 individuals in Dubuque County who have obtained a bachelor's degree or higher.
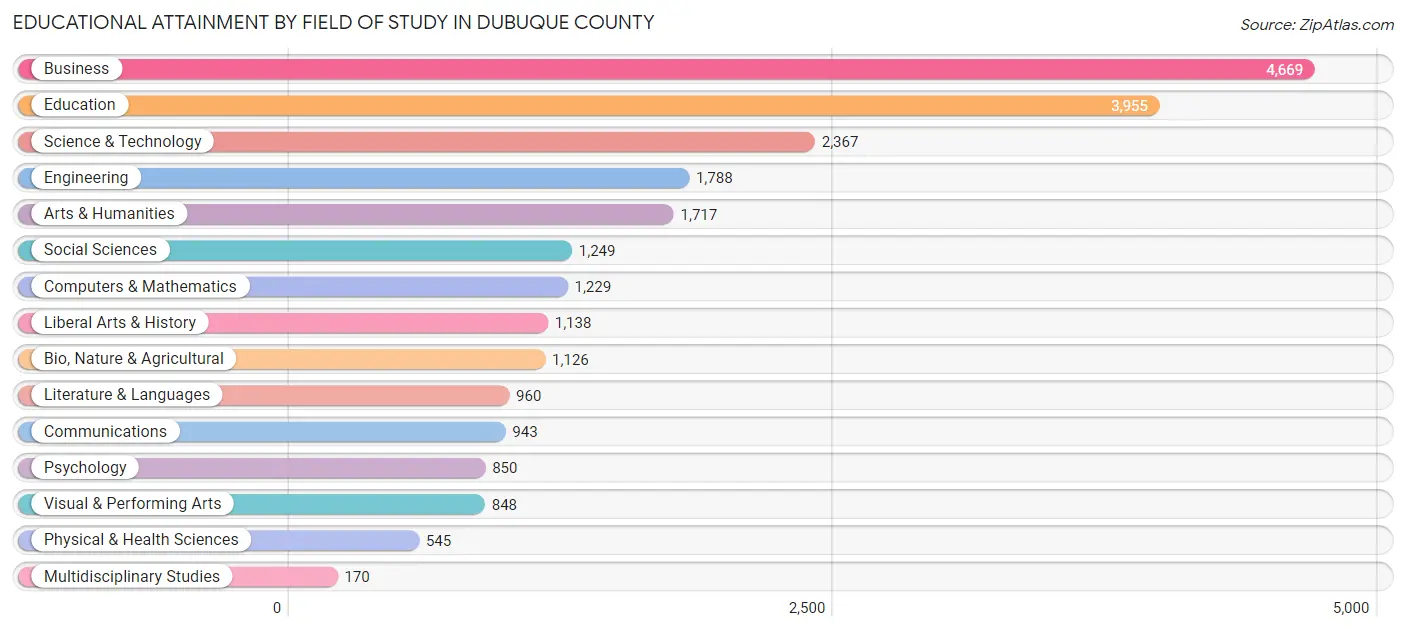
| Field of Study | # Graduates | % Graduates |
| Computers & Mathematics | 1,229 | 5.2% |
| Bio, Nature & Agricultural | 1,126 | 4.8% |
| Physical & Health Sciences | 545 | 2.3% |
| Psychology | 850 | 3.6% |
| Social Sciences | 1,249 | 5.3% |
| Engineering | 1,788 | 7.6% |
| Multidisciplinary Studies | 170 | 0.7% |
| Science & Technology | 2,367 | 10.1% |
| Business | 4,669 | 19.8% |
| Education | 3,955 | 16.8% |
| Literature & Languages | 960 | 4.1% |
| Liberal Arts & History | 1,138 | 4.8% |
| Visual & Performing Arts | 848 | 3.6% |
| Communications | 943 | 4.0% |
| Arts & Humanities | 1,717 | 7.3% |
| Total | 23,554 | 100.0% |
Transportation & Commute in Dubuque County
Vehicle Availability by Sex in Dubuque County
The most prevalent vehicle ownership categories in Dubuque County are males with 2 vehicles (11,563, accounting for 45.4%) and females with 2 vehicles (10,417, making up 47.7%).
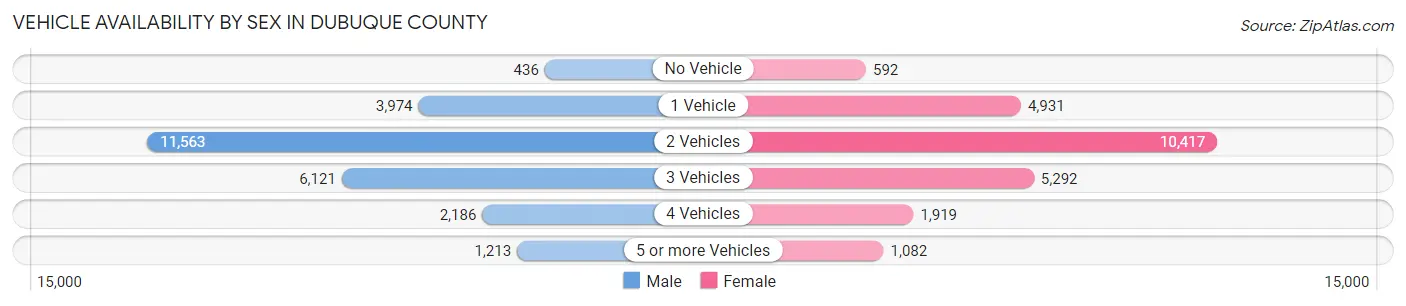
| Vehicles Available | Male | Female |
| No Vehicle | 436 (1.7%) | 592 (2.4%) |
| 1 Vehicle | 3,974 (15.6%) | 4,931 (20.3%) |
| 2 Vehicles | 11,563 (45.4%) | 10,417 (43.0%) |
| 3 Vehicles | 6,121 (24.0%) | 5,292 (21.8%) |
| 4 Vehicles | 2,186 (8.6%) | 1,919 (7.9%) |
| 5 or more Vehicles | 1,213 (4.8%) | 1,082 (4.5%) |
| Total | 25,493 (100.0%) | 24,233 (100.0%) |
Commute Time in Dubuque County
The most frequently occuring commute durations in Dubuque County are 10 to 14 minutes (11,718 commuters, 25.6%), 15 to 19 minutes (9,715 commuters, 21.2%), and 5 to 9 minutes (8,602 commuters, 18.8%).
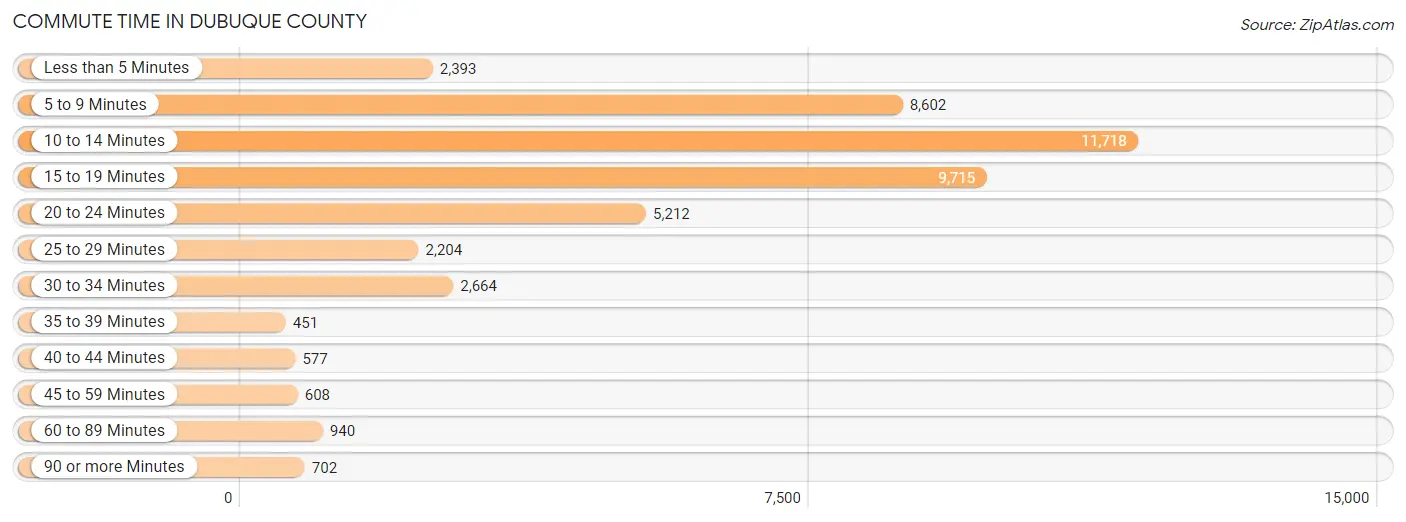
| Commute Time | # Commuters | % Commuters |
| Less than 5 Minutes | 2,393 | 5.2% |
| 5 to 9 Minutes | 8,602 | 18.8% |
| 10 to 14 Minutes | 11,718 | 25.6% |
| 15 to 19 Minutes | 9,715 | 21.2% |
| 20 to 24 Minutes | 5,212 | 11.4% |
| 25 to 29 Minutes | 2,204 | 4.8% |
| 30 to 34 Minutes | 2,664 | 5.8% |
| 35 to 39 Minutes | 451 | 1.0% |
| 40 to 44 Minutes | 577 | 1.3% |
| 45 to 59 Minutes | 608 | 1.3% |
| 60 to 89 Minutes | 940 | 2.1% |
| 90 or more Minutes | 702 | 1.5% |
Commute Time by Sex in Dubuque County
The most common commute times in Dubuque County are 10 to 14 minutes (5,998 commuters, 25.2%) for males and 10 to 14 minutes (5,720 commuters, 26.1%) for females.
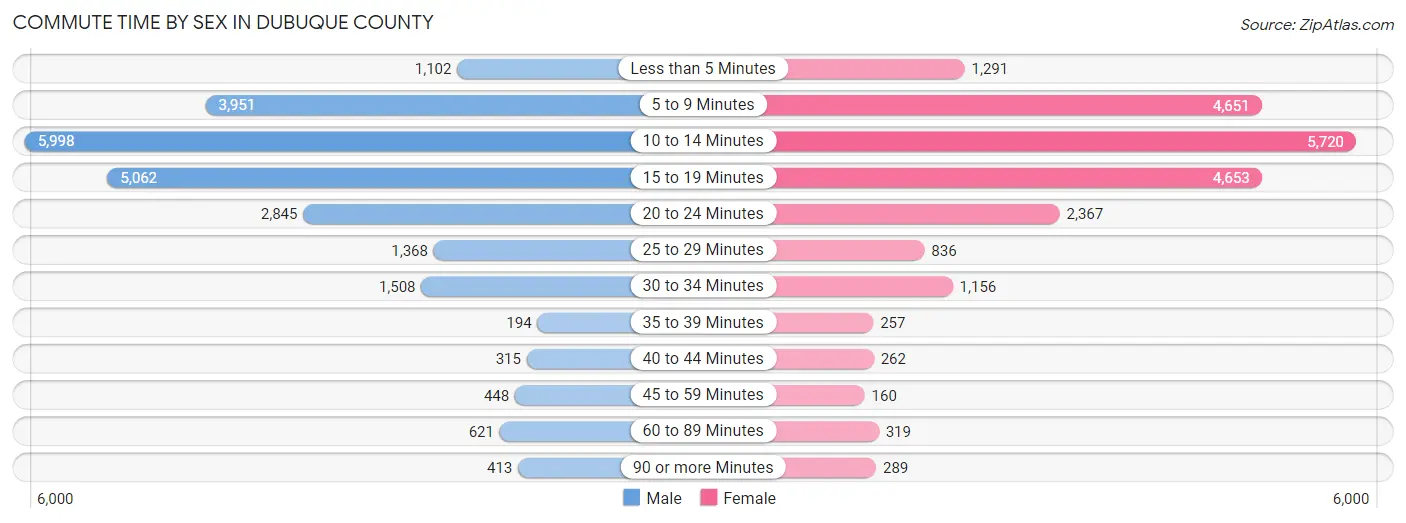
| Commute Time | Male | Female |
| Less than 5 Minutes | 1,102 (4.6%) | 1,291 (5.9%) |
| 5 to 9 Minutes | 3,951 (16.6%) | 4,651 (21.2%) |
| 10 to 14 Minutes | 5,998 (25.2%) | 5,720 (26.1%) |
| 15 to 19 Minutes | 5,062 (21.2%) | 4,653 (21.2%) |
| 20 to 24 Minutes | 2,845 (11.9%) | 2,367 (10.8%) |
| 25 to 29 Minutes | 1,368 (5.7%) | 836 (3.8%) |
| 30 to 34 Minutes | 1,508 (6.3%) | 1,156 (5.3%) |
| 35 to 39 Minutes | 194 (0.8%) | 257 (1.2%) |
| 40 to 44 Minutes | 315 (1.3%) | 262 (1.2%) |
| 45 to 59 Minutes | 448 (1.9%) | 160 (0.7%) |
| 60 to 89 Minutes | 621 (2.6%) | 319 (1.5%) |
| 90 or more Minutes | 413 (1.7%) | 289 (1.3%) |
Time of Departure to Work by Sex in Dubuque County
The most frequent times of departure to work in Dubuque County are 7:00 AM to 7:29 AM (3,569, 15.0%) for males and 7:30 AM to 7:59 AM (4,105, 18.7%) for females.
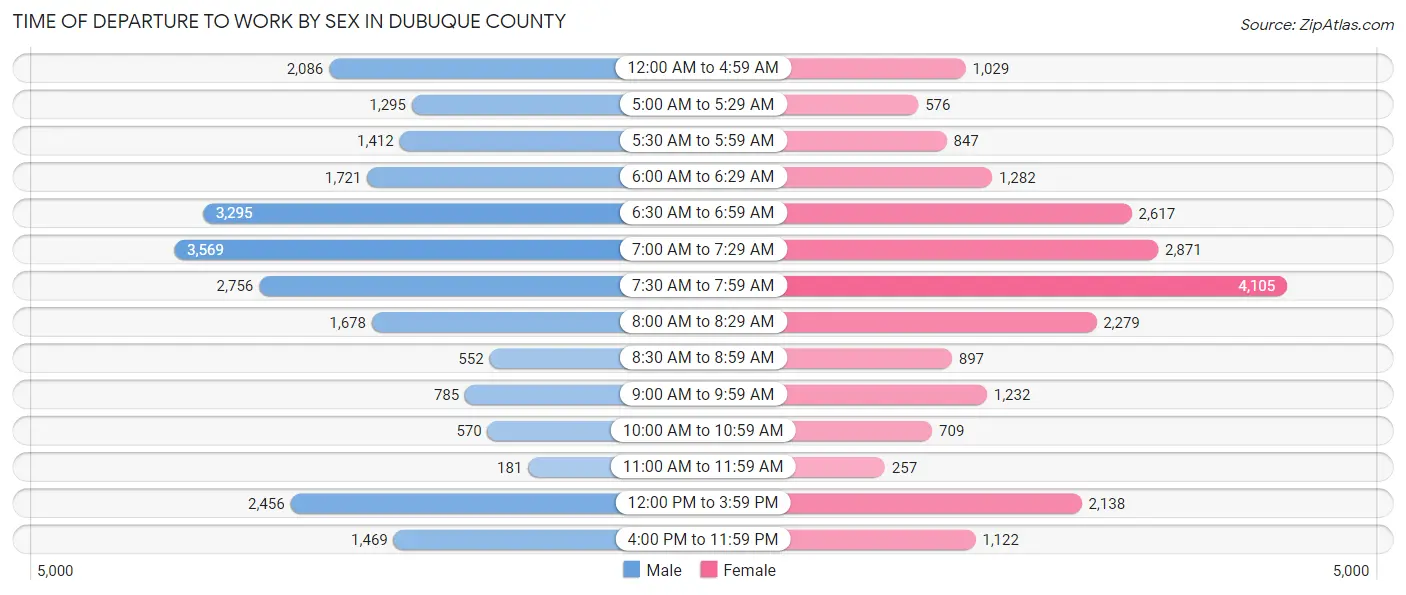
| Time of Departure | Male | Female |
| 12:00 AM to 4:59 AM | 2,086 (8.8%) | 1,029 (4.7%) |
| 5:00 AM to 5:29 AM | 1,295 (5.4%) | 576 (2.6%) |
| 5:30 AM to 5:59 AM | 1,412 (5.9%) | 847 (3.9%) |
| 6:00 AM to 6:29 AM | 1,721 (7.2%) | 1,282 (5.8%) |
| 6:30 AM to 6:59 AM | 3,295 (13.8%) | 2,617 (11.9%) |
| 7:00 AM to 7:29 AM | 3,569 (15.0%) | 2,871 (13.1%) |
| 7:30 AM to 7:59 AM | 2,756 (11.6%) | 4,105 (18.7%) |
| 8:00 AM to 8:29 AM | 1,678 (7.0%) | 2,279 (10.4%) |
| 8:30 AM to 8:59 AM | 552 (2.3%) | 897 (4.1%) |
| 9:00 AM to 9:59 AM | 785 (3.3%) | 1,232 (5.6%) |
| 10:00 AM to 10:59 AM | 570 (2.4%) | 709 (3.2%) |
| 11:00 AM to 11:59 AM | 181 (0.8%) | 257 (1.2%) |
| 12:00 PM to 3:59 PM | 2,456 (10.3%) | 2,138 (9.7%) |
| 4:00 PM to 11:59 PM | 1,469 (6.2%) | 1,122 (5.1%) |
| Total | 23,825 (100.0%) | 21,961 (100.0%) |
Housing Occupancy in Dubuque County
Occupancy by Ownership in Dubuque County
Of the total 39,985 dwellings in Dubuque County, owner-occupied units account for 29,312 (73.3%), while renter-occupied units make up 10,673 (26.7%).
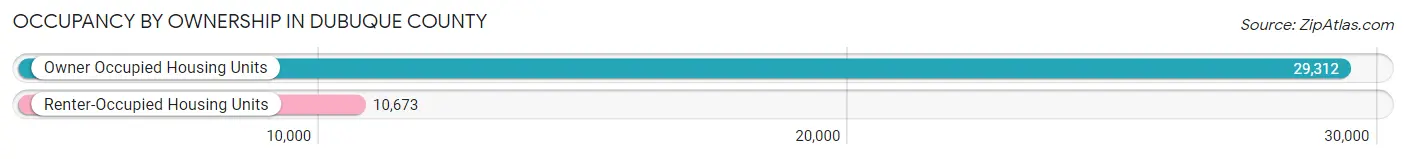
| Occupancy | # Housing Units | % Housing Units |
| Owner Occupied Housing Units | 29,312 | 73.3% |
| Renter-Occupied Housing Units | 10,673 | 26.7% |
| Total Occupied Housing Units | 39,985 | 100.0% |
Occupancy by Household Size in Dubuque County
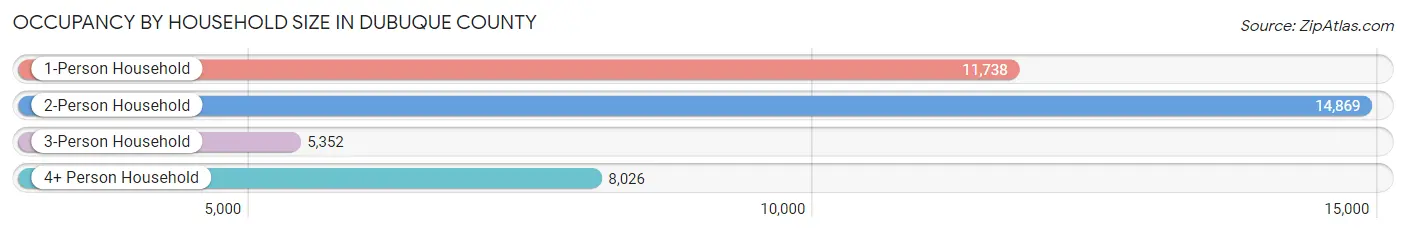
| Household Size | # Housing Units | % Housing Units |
| 1-Person Household | 11,738 | 29.4% |
| 2-Person Household | 14,869 | 37.2% |
| 3-Person Household | 5,352 | 13.4% |
| 4+ Person Household | 8,026 | 20.1% |
| Total Housing Units | 39,985 | 100.0% |
Occupancy by Ownership by Household Size in Dubuque County
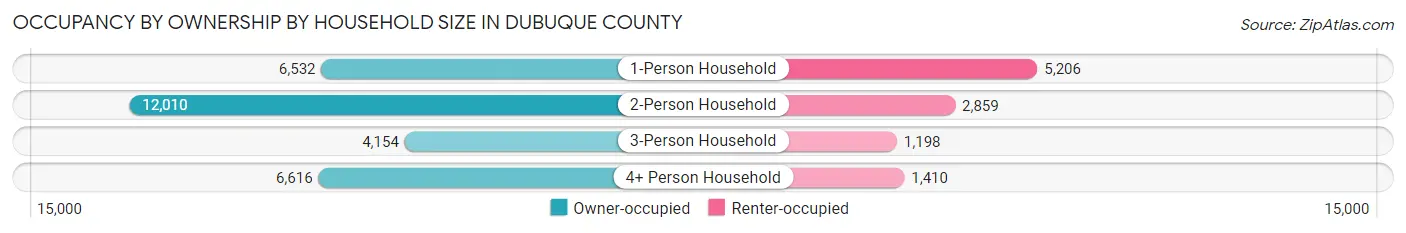
| Household Size | Owner-occupied | Renter-occupied |
| 1-Person Household | 6,532 (55.6%) | 5,206 (44.4%) |
| 2-Person Household | 12,010 (80.8%) | 2,859 (19.2%) |
| 3-Person Household | 4,154 (77.6%) | 1,198 (22.4%) |
| 4+ Person Household | 6,616 (82.4%) | 1,410 (17.6%) |
| Total Housing Units | 29,312 (73.3%) | 10,673 (26.7%) |
Occupancy by Educational Attainment in Dubuque County
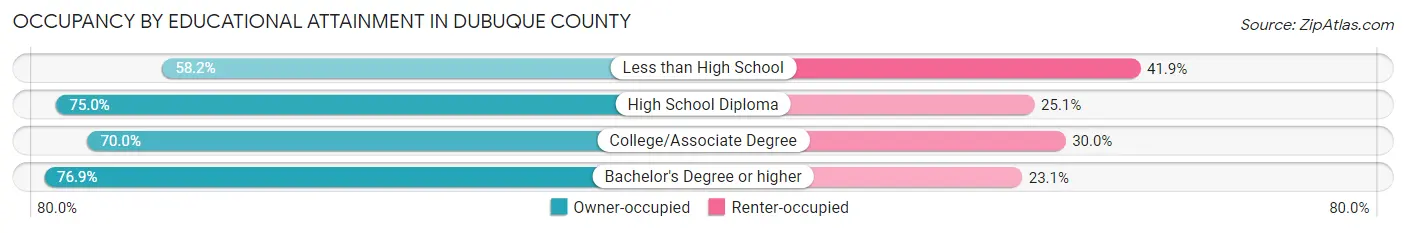
| Household Size | Owner-occupied | Renter-occupied |
| Less than High School | 1,188 (58.2%) | 855 (41.8%) |
| High School Diploma | 9,372 (75.0%) | 3,132 (25.1%) |
| College/Associate Degree | 8,243 (70.0%) | 3,530 (30.0%) |
| Bachelor's Degree or higher | 10,509 (76.9%) | 3,156 (23.1%) |
Occupancy by Age of Householder in Dubuque County
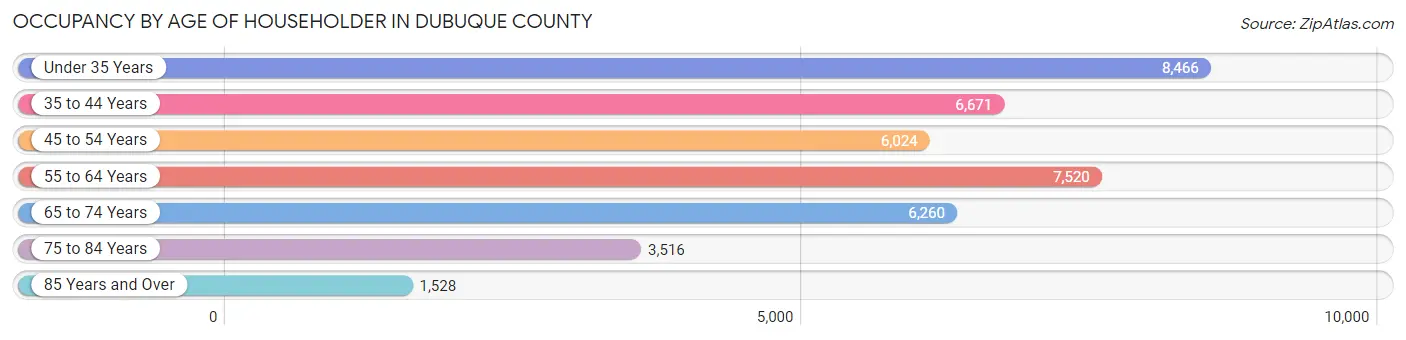
| Age Bracket | # Households | % Households |
| Under 35 Years | 8,466 | 21.2% |
| 35 to 44 Years | 6,671 | 16.7% |
| 45 to 54 Years | 6,024 | 15.1% |
| 55 to 64 Years | 7,520 | 18.8% |
| 65 to 74 Years | 6,260 | 15.7% |
| 75 to 84 Years | 3,516 | 8.8% |
| 85 Years and Over | 1,528 | 3.8% |
| Total | 39,985 | 100.0% |
Housing Finances in Dubuque County
Median Income by Occupancy in Dubuque County
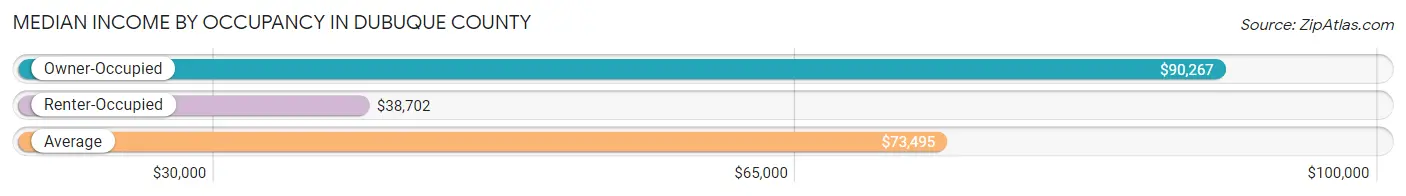
| Occupancy Type | # Households | Median Income |
| Owner-Occupied | 29,312 (73.3%) | $90,267 |
| Renter-Occupied | 10,673 (26.7%) | $38,702 |
| Average | 39,985 (100.0%) | $73,495 |
Occupancy by Householder Income Bracket in Dubuque County
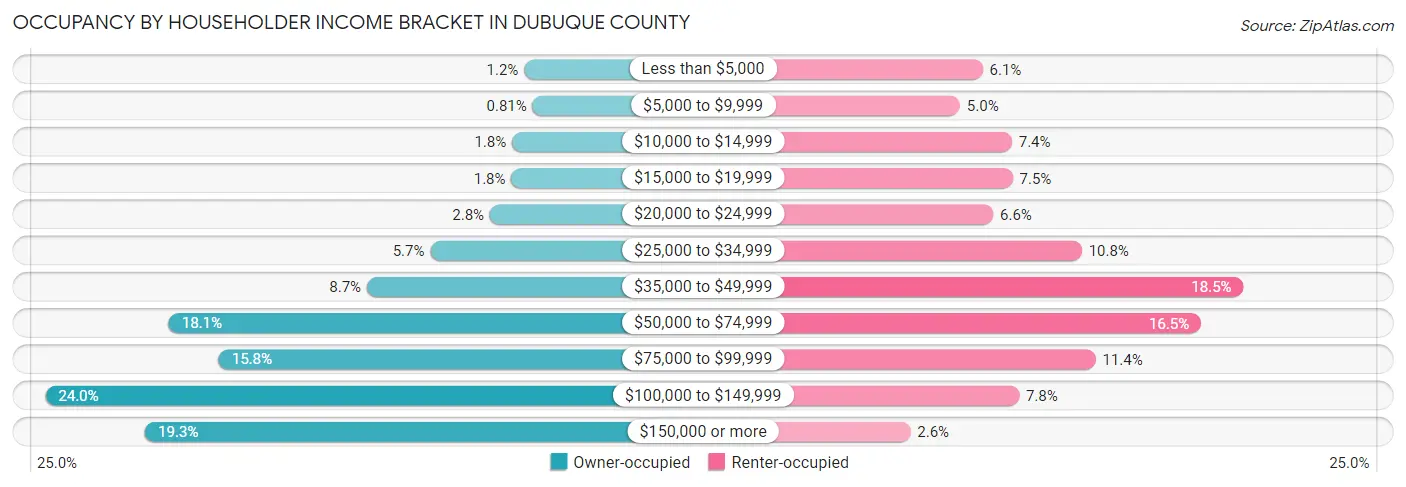
| Income Bracket | Owner-occupied | Renter-occupied |
| Less than $5,000 | 355 (1.2%) | 646 (6.0%) |
| $5,000 to $9,999 | 237 (0.8%) | 530 (5.0%) |
| $10,000 to $14,999 | 526 (1.8%) | 794 (7.4%) |
| $15,000 to $19,999 | 534 (1.8%) | 798 (7.5%) |
| $20,000 to $24,999 | 832 (2.8%) | 699 (6.6%) |
| $25,000 to $34,999 | 1,666 (5.7%) | 1,150 (10.8%) |
| $35,000 to $49,999 | 2,549 (8.7%) | 1,971 (18.5%) |
| $50,000 to $74,999 | 5,313 (18.1%) | 1,756 (16.5%) |
| $75,000 to $99,999 | 4,618 (15.8%) | 1,220 (11.4%) |
| $100,000 to $149,999 | 7,037 (24.0%) | 830 (7.8%) |
| $150,000 or more | 5,645 (19.3%) | 279 (2.6%) |
| Total | 29,312 (100.0%) | 10,673 (100.0%) |
Monthly Housing Cost Tiers in Dubuque County
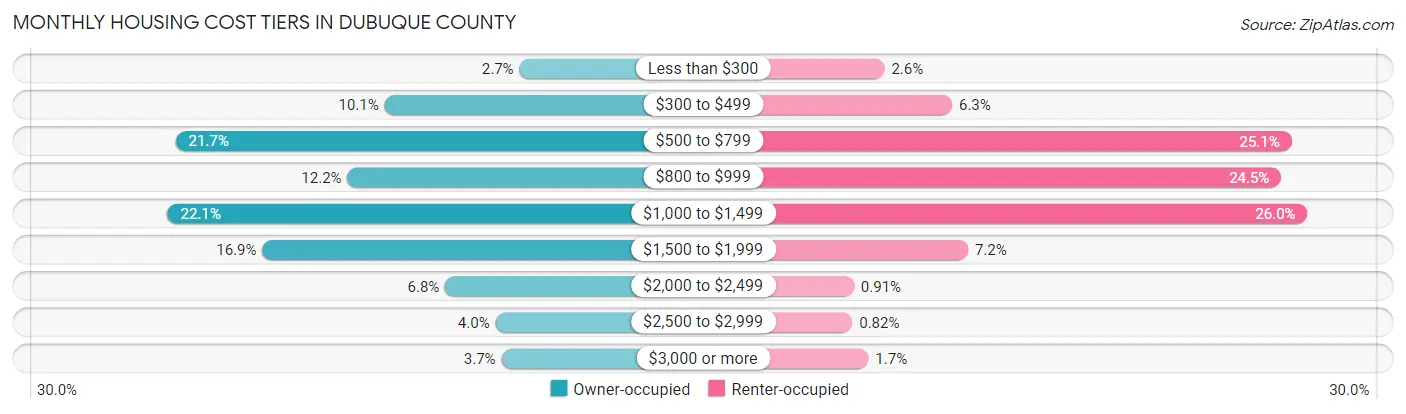
| Monthly Cost | Owner-occupied | Renter-occupied |
| Less than $300 | 782 (2.7%) | 278 (2.6%) |
| $300 to $499 | 2,967 (10.1%) | 676 (6.3%) |
| $500 to $799 | 6,349 (21.7%) | 2,677 (25.1%) |
| $800 to $999 | 3,566 (12.2%) | 2,616 (24.5%) |
| $1,000 to $1,499 | 6,477 (22.1%) | 2,771 (26.0%) |
| $1,500 to $1,999 | 4,944 (16.9%) | 770 (7.2%) |
| $2,000 to $2,499 | 1,984 (6.8%) | 97 (0.9%) |
| $2,500 to $2,999 | 1,169 (4.0%) | 88 (0.8%) |
| $3,000 or more | 1,074 (3.7%) | 182 (1.7%) |
| Total | 29,312 (100.0%) | 10,673 (100.0%) |
Physical Housing Characteristics in Dubuque County
Housing Structures in Dubuque County
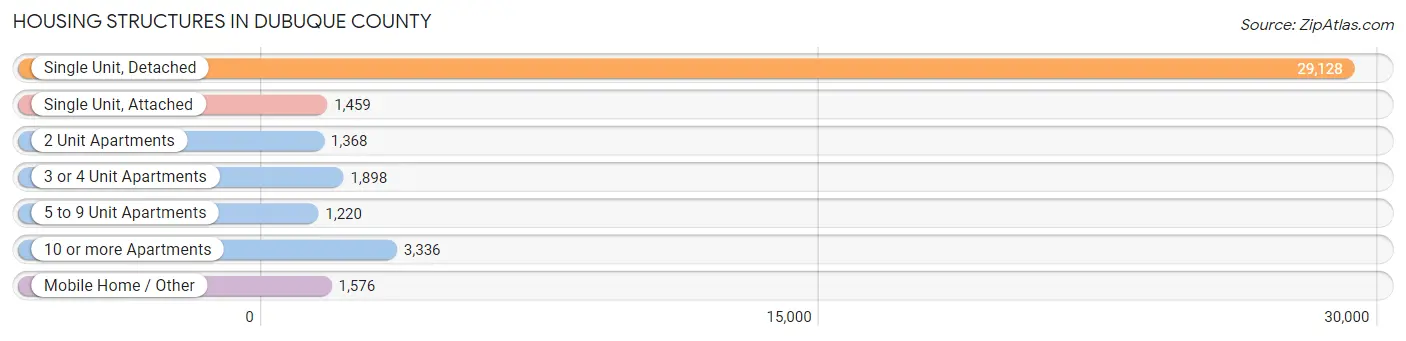
| Structure Type | # Housing Units | % Housing Units |
| Single Unit, Detached | 29,128 | 72.9% |
| Single Unit, Attached | 1,459 | 3.6% |
| 2 Unit Apartments | 1,368 | 3.4% |
| 3 or 4 Unit Apartments | 1,898 | 4.8% |
| 5 to 9 Unit Apartments | 1,220 | 3.0% |
| 10 or more Apartments | 3,336 | 8.3% |
| Mobile Home / Other | 1,576 | 3.9% |
| Total | 39,985 | 100.0% |
Housing Structures by Occupancy in Dubuque County
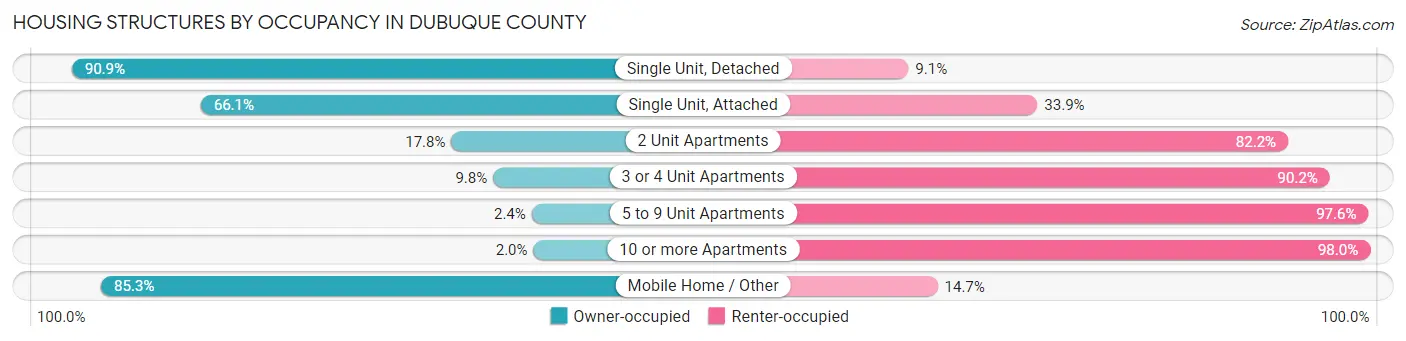
| Structure Type | Owner-occupied | Renter-occupied |
| Single Unit, Detached | 26,477 (90.9%) | 2,651 (9.1%) |
| Single Unit, Attached | 964 (66.1%) | 495 (33.9%) |
| 2 Unit Apartments | 244 (17.8%) | 1,124 (82.2%) |
| 3 or 4 Unit Apartments | 186 (9.8%) | 1,712 (90.2%) |
| 5 to 9 Unit Apartments | 29 (2.4%) | 1,191 (97.6%) |
| 10 or more Apartments | 68 (2.0%) | 3,268 (98.0%) |
| Mobile Home / Other | 1,344 (85.3%) | 232 (14.7%) |
| Total | 29,312 (73.3%) | 10,673 (26.7%) |
Housing Structures by Number of Rooms in Dubuque County
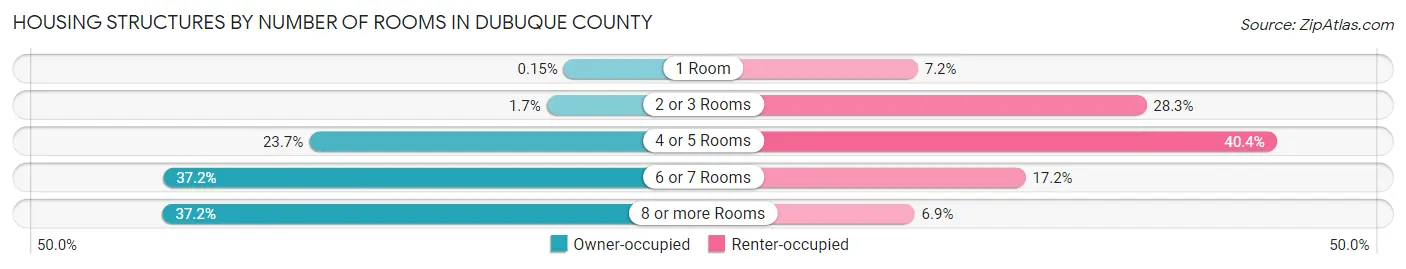
| Number of Rooms | Owner-occupied | Renter-occupied |
| 1 Room | 45 (0.2%) | 768 (7.2%) |
| 2 or 3 Rooms | 507 (1.7%) | 3,025 (28.3%) |
| 4 or 5 Rooms | 6,948 (23.7%) | 4,310 (40.4%) |
| 6 or 7 Rooms | 10,897 (37.2%) | 1,832 (17.2%) |
| 8 or more Rooms | 10,915 (37.2%) | 738 (6.9%) |
| Total | 29,312 (100.0%) | 10,673 (100.0%) |
Housing Structure by Heating Type in Dubuque County
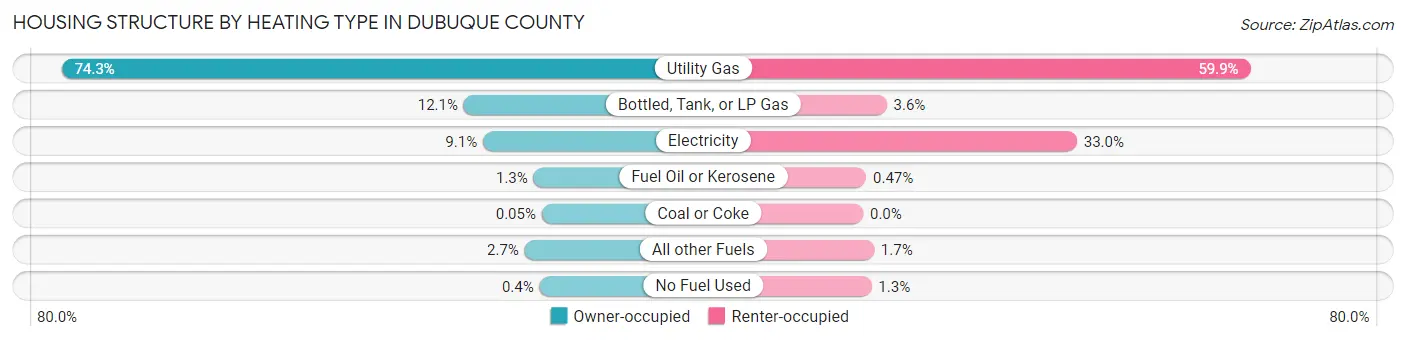
| Heating Type | Owner-occupied | Renter-occupied |
| Utility Gas | 21,780 (74.3%) | 6,391 (59.9%) |
| Bottled, Tank, or LP Gas | 3,550 (12.1%) | 389 (3.6%) |
| Electricity | 2,680 (9.1%) | 3,526 (33.0%) |
| Fuel Oil or Kerosene | 383 (1.3%) | 50 (0.5%) |
| Coal or Coke | 14 (0.1%) | 0 (0.0%) |
| All other Fuels | 789 (2.7%) | 179 (1.7%) |
| No Fuel Used | 116 (0.4%) | 138 (1.3%) |
| Total | 29,312 (100.0%) | 10,673 (100.0%) |
Household Vehicle Usage in Dubuque County
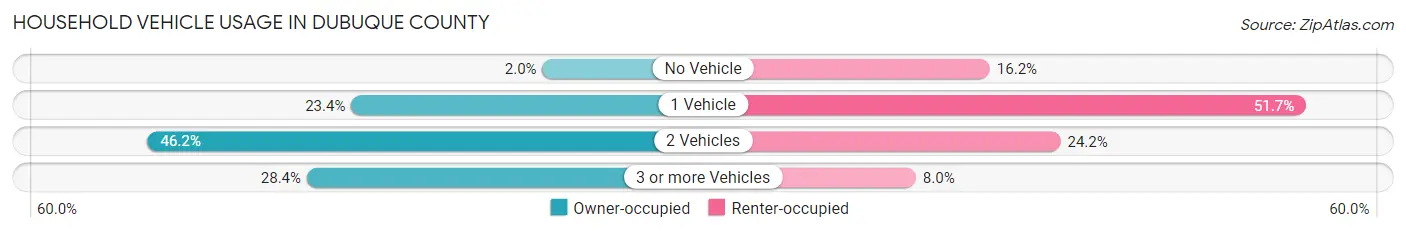
| Vehicles per Household | Owner-occupied | Renter-occupied |
| No Vehicle | 582 (2.0%) | 1,733 (16.2%) |
| 1 Vehicle | 6,862 (23.4%) | 5,513 (51.6%) |
| 2 Vehicles | 13,550 (46.2%) | 2,578 (24.1%) |
| 3 or more Vehicles | 8,318 (28.4%) | 849 (8.0%) |
| Total | 29,312 (100.0%) | 10,673 (100.0%) |
Real Estate & Mortgages in Dubuque County
Real Estate and Mortgage Overview in Dubuque County
| Characteristic | Without Mortgage | With Mortgage |
| Housing Units | 11,351 | 17,961 |
| Median Property Value | $198,300 | $216,200 |
| Median Household Income | $68,042 | $4,081 |
| Monthly Housing Costs | $594 | $1,029 |
| Real Estate Taxes | $2,816 | $305 |
Property Value by Mortgage Status in Dubuque County
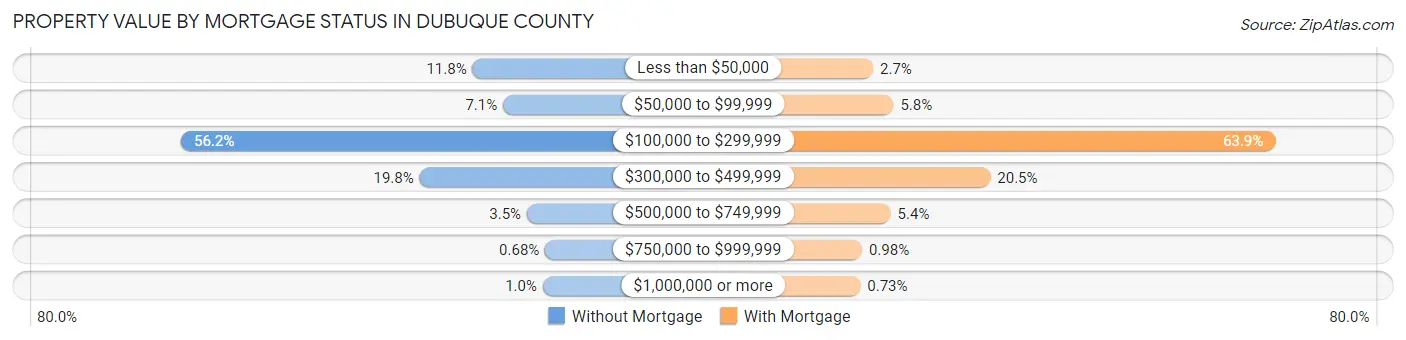
| Property Value | Without Mortgage | With Mortgage |
| Less than $50,000 | 1,334 (11.7%) | 481 (2.7%) |
| $50,000 to $99,999 | 805 (7.1%) | 1,038 (5.8%) |
| $100,000 to $299,999 | 6,375 (56.2%) | 11,485 (63.9%) |
| $300,000 to $499,999 | 2,250 (19.8%) | 3,689 (20.5%) |
| $500,000 to $749,999 | 392 (3.5%) | 961 (5.3%) |
| $750,000 to $999,999 | 77 (0.7%) | 176 (1.0%) |
| $1,000,000 or more | 118 (1.0%) | 131 (0.7%) |
| Total | 11,351 (100.0%) | 17,961 (100.0%) |
Household Income by Mortgage Status in Dubuque County
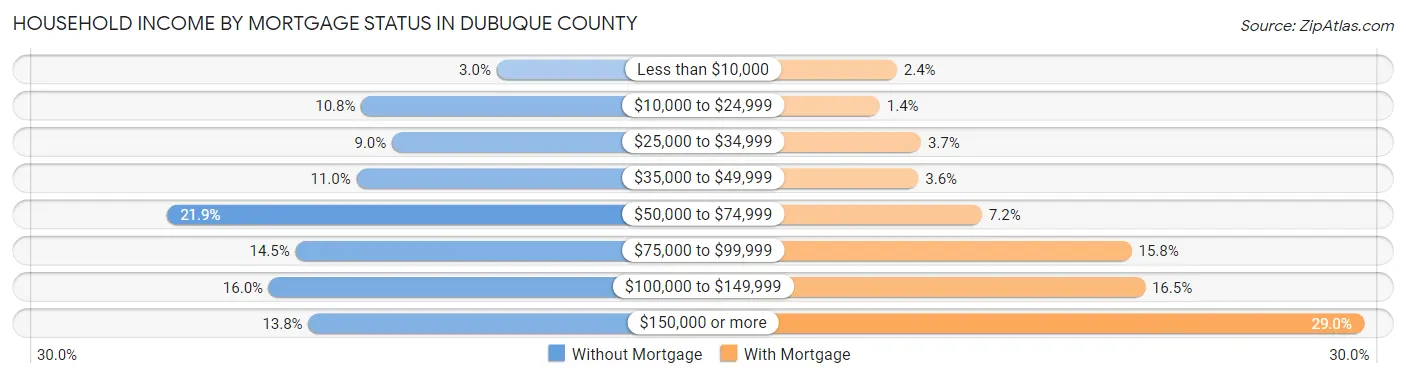
| Household Income | Without Mortgage | With Mortgage |
| Less than $10,000 | 343 (3.0%) | 423 (2.4%) |
| $10,000 to $24,999 | 1,221 (10.8%) | 249 (1.4%) |
| $25,000 to $34,999 | 1,022 (9.0%) | 671 (3.7%) |
| $35,000 to $49,999 | 1,252 (11.0%) | 644 (3.6%) |
| $50,000 to $74,999 | 2,480 (21.8%) | 1,297 (7.2%) |
| $75,000 to $99,999 | 1,648 (14.5%) | 2,833 (15.8%) |
| $100,000 to $149,999 | 1,821 (16.0%) | 2,970 (16.5%) |
| $150,000 or more | 1,564 (13.8%) | 5,216 (29.0%) |
| Total | 11,351 (100.0%) | 17,961 (100.0%) |
Property Value to Household Income Ratio in Dubuque County
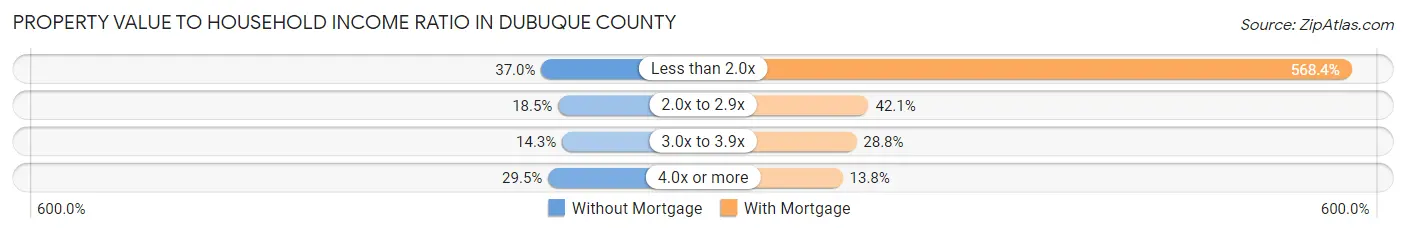
| Value-to-Income Ratio | Without Mortgage | With Mortgage |
| Less than 2.0x | 4,199 (37.0%) | 102,093 (568.4%) |
| 2.0x to 2.9x | 2,105 (18.5%) | 7,557 (42.1%) |
| 3.0x to 3.9x | 1,623 (14.3%) | 5,175 (28.8%) |
| 4.0x or more | 3,350 (29.5%) | 2,486 (13.8%) |
| Total | 11,351 (100.0%) | 17,961 (100.0%) |
Real Estate Taxes by Mortgage Status in Dubuque County
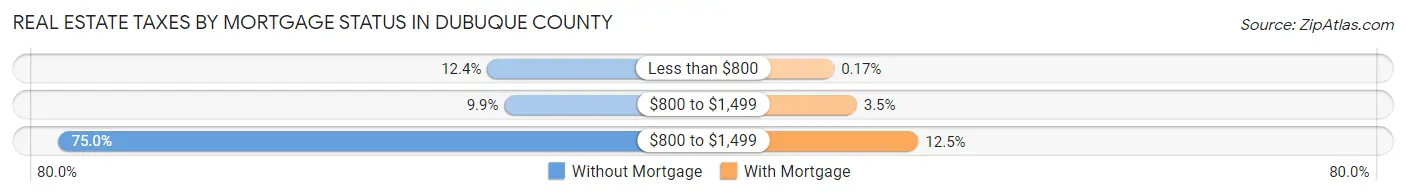
| Property Taxes | Without Mortgage | With Mortgage |
| Less than $800 | 1,407 (12.4%) | 31 (0.2%) |
| $800 to $1,499 | 1,125 (9.9%) | 624 (3.5%) |
| $800 to $1,499 | 8,517 (75.0%) | 2,240 (12.5%) |
| Total | 11,351 (100.0%) | 17,961 (100.0%) |
Health & Disability in Dubuque County
Health Insurance Coverage by Age in Dubuque County
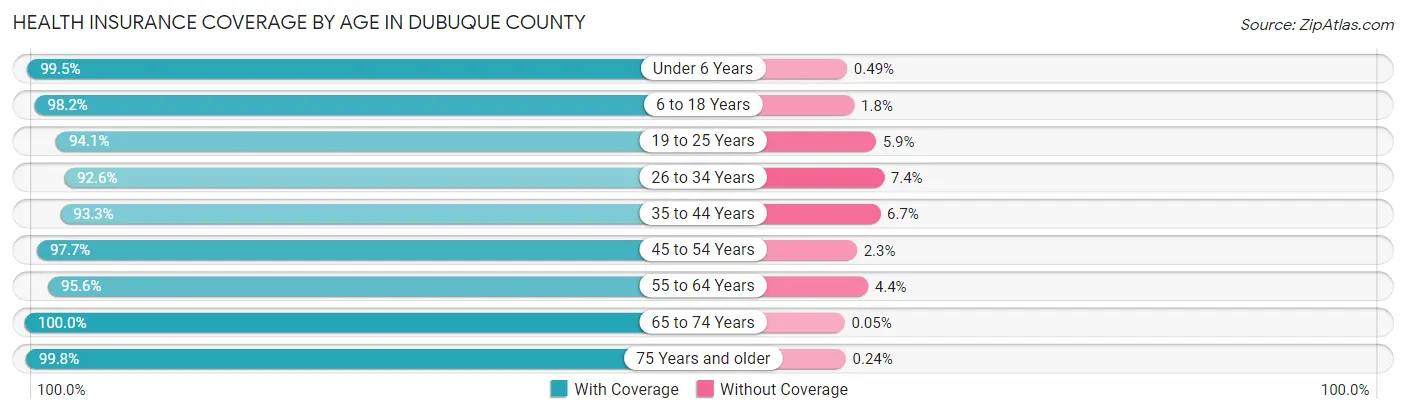
| Age Bracket | With Coverage | Without Coverage |
| Under 6 Years | 7,176 (99.5%) | 35 (0.5%) |
| 6 to 18 Years | 16,325 (98.2%) | 306 (1.8%) |
| 19 to 25 Years | 9,423 (94.1%) | 588 (5.9%) |
| 26 to 34 Years | 9,745 (92.6%) | 777 (7.4%) |
| 35 to 44 Years | 10,778 (93.3%) | 770 (6.7%) |
| 45 to 54 Years | 10,635 (97.7%) | 251 (2.3%) |
| 55 to 64 Years | 12,590 (95.6%) | 578 (4.4%) |
| 65 to 74 Years | 10,078 (100.0%) | 5 (0.1%) |
| 75 Years and older | 7,453 (99.8%) | 18 (0.2%) |
| Total | 94,203 (96.6%) | 3,328 (3.4%) |
Health Insurance Coverage by Citizenship Status in Dubuque County
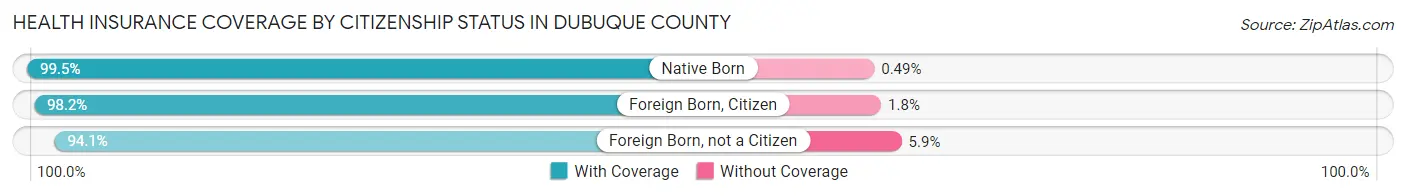
| Citizenship Status | With Coverage | Without Coverage |
| Native Born | 7,176 (99.5%) | 35 (0.5%) |
| Foreign Born, Citizen | 16,325 (98.2%) | 306 (1.8%) |
| Foreign Born, not a Citizen | 9,423 (94.1%) | 588 (5.9%) |
Health Insurance Coverage by Household Income in Dubuque County
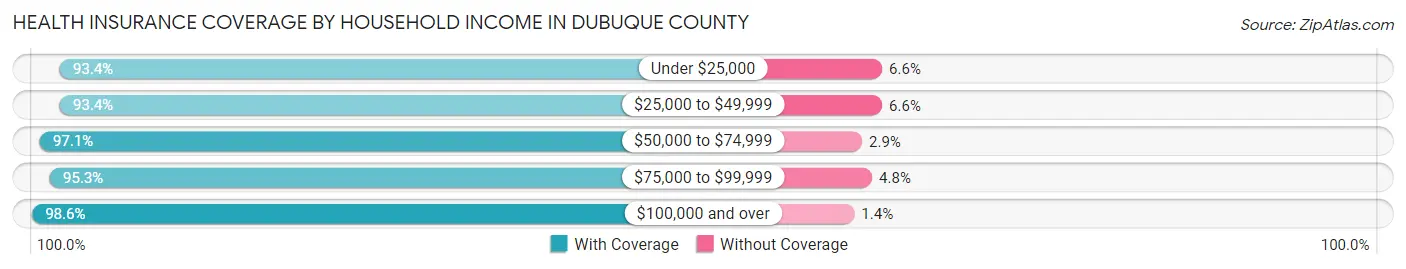
| Household Income | With Coverage | Without Coverage |
| Under $25,000 | 9,042 (93.4%) | 641 (6.6%) |
| $25,000 to $49,999 | 12,419 (93.4%) | 880 (6.6%) |
| $50,000 to $74,999 | 14,629 (97.1%) | 432 (2.9%) |
| $75,000 to $99,999 | 13,782 (95.3%) | 688 (4.8%) |
| $100,000 and over | 41,595 (98.6%) | 603 (1.4%) |
Public vs Private Health Insurance Coverage by Age in Dubuque County
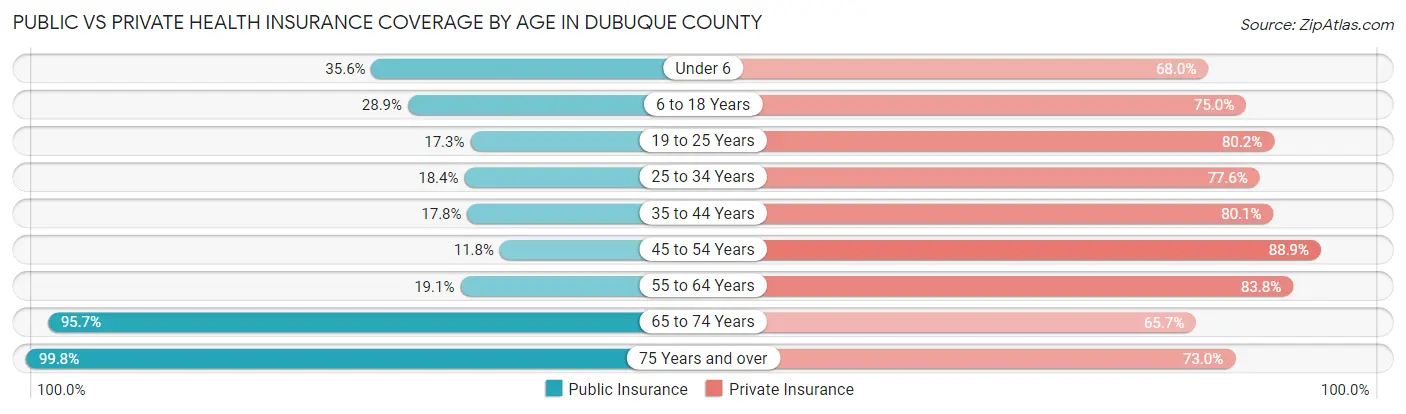
| Age Bracket | Public Insurance | Private Insurance |
| Under 6 | 2,569 (35.6%) | 4,904 (68.0%) |
| 6 to 18 Years | 4,800 (28.9%) | 12,478 (75.0%) |
| 19 to 25 Years | 1,729 (17.3%) | 8,033 (80.2%) |
| 25 to 34 Years | 1,935 (18.4%) | 8,161 (77.6%) |
| 35 to 44 Years | 2,058 (17.8%) | 9,250 (80.1%) |
| 45 to 54 Years | 1,284 (11.8%) | 9,680 (88.9%) |
| 55 to 64 Years | 2,520 (19.1%) | 11,028 (83.8%) |
| 65 to 74 Years | 9,649 (95.7%) | 6,629 (65.7%) |
| 75 Years and over | 7,453 (99.8%) | 5,453 (73.0%) |
| Total | 33,997 (34.9%) | 75,616 (77.5%) |
Disability Status by Sex by Age in Dubuque County
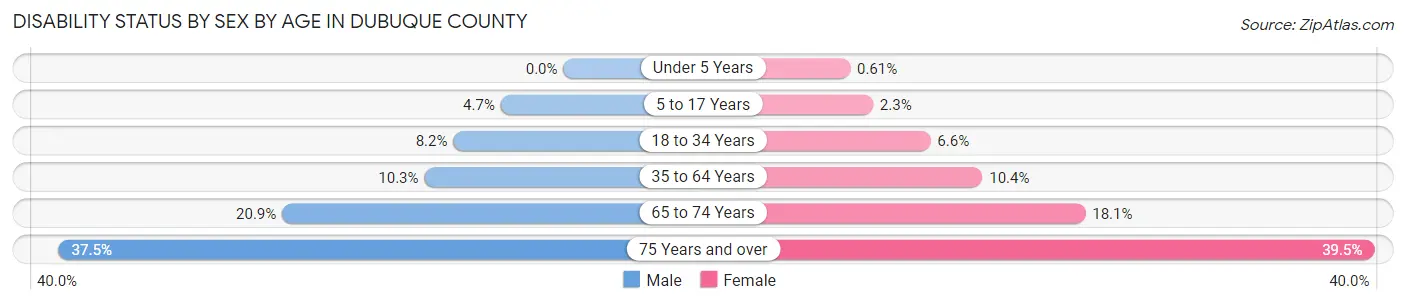
| Age Bracket | Male | Female |
| Under 5 Years | 0 (0.0%) | 18 (0.6%) |
| 5 to 17 Years | 379 (4.6%) | 187 (2.3%) |
| 18 to 34 Years | 935 (8.2%) | 707 (6.6%) |
| 35 to 64 Years | 1,860 (10.3%) | 1,834 (10.4%) |
| 65 to 74 Years | 1,029 (20.9%) | 932 (18.1%) |
| 75 Years and over | 1,083 (37.5%) | 1,811 (39.5%) |
Disability Class by Sex by Age in Dubuque County
Disability Class: Hearing Difficulty
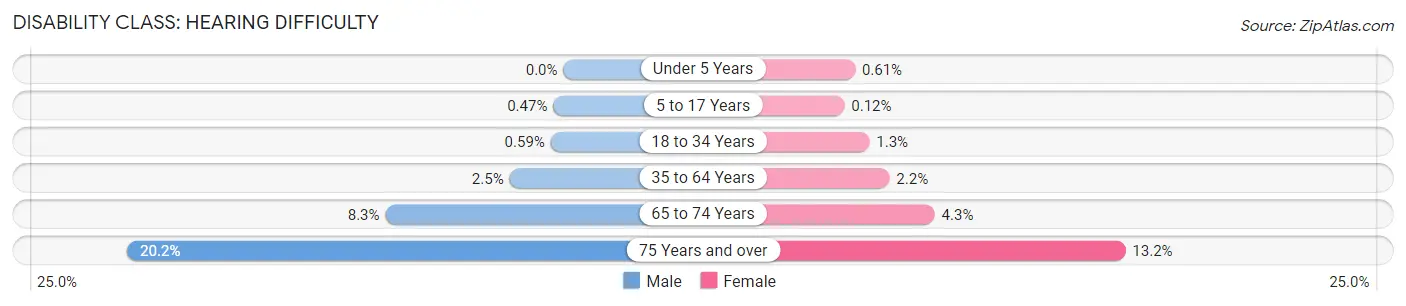
| Age Bracket | Male | Female |
| Under 5 Years | 0 (0.0%) | 18 (0.6%) |
| 5 to 17 Years | 38 (0.5%) | 10 (0.1%) |
| 18 to 34 Years | 68 (0.6%) | 137 (1.3%) |
| 35 to 64 Years | 451 (2.5%) | 389 (2.2%) |
| 65 to 74 Years | 407 (8.3%) | 222 (4.3%) |
| 75 Years and over | 585 (20.2%) | 603 (13.2%) |
Disability Class: Vision Difficulty
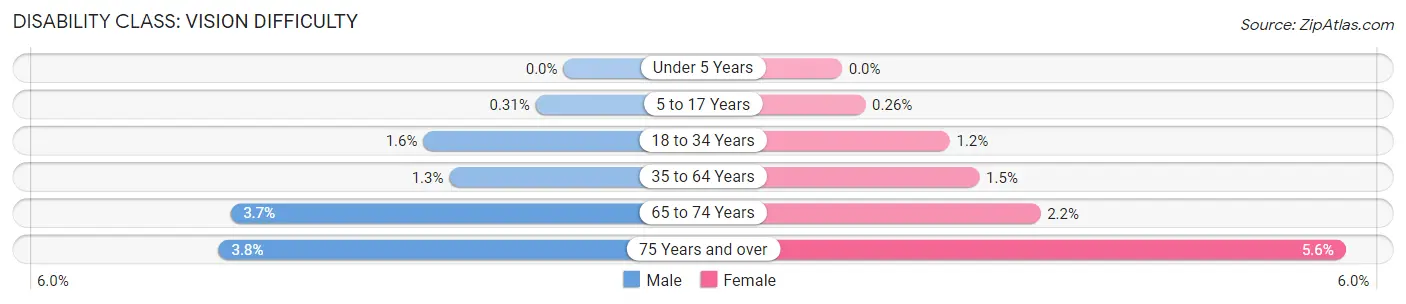
| Age Bracket | Male | Female |
| Under 5 Years | 0 (0.0%) | 0 (0.0%) |
| 5 to 17 Years | 25 (0.3%) | 21 (0.3%) |
| 18 to 34 Years | 179 (1.6%) | 129 (1.2%) |
| 35 to 64 Years | 228 (1.3%) | 269 (1.5%) |
| 65 to 74 Years | 183 (3.7%) | 114 (2.2%) |
| 75 Years and over | 111 (3.8%) | 257 (5.6%) |
Disability Class: Cognitive Difficulty
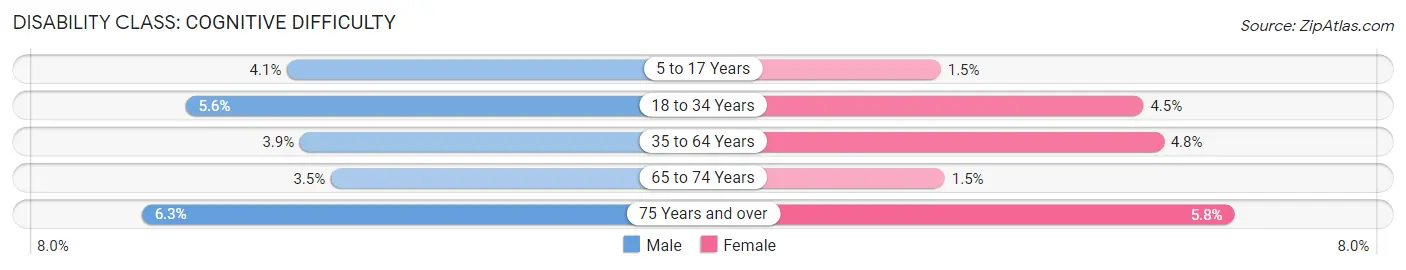
| Age Bracket | Male | Female |
| 5 to 17 Years | 334 (4.1%) | 119 (1.5%) |
| 18 to 34 Years | 642 (5.6%) | 481 (4.5%) |
| 35 to 64 Years | 705 (3.9%) | 840 (4.8%) |
| 65 to 74 Years | 170 (3.5%) | 79 (1.5%) |
| 75 Years and over | 181 (6.3%) | 267 (5.8%) |
Disability Class: Ambulatory Difficulty
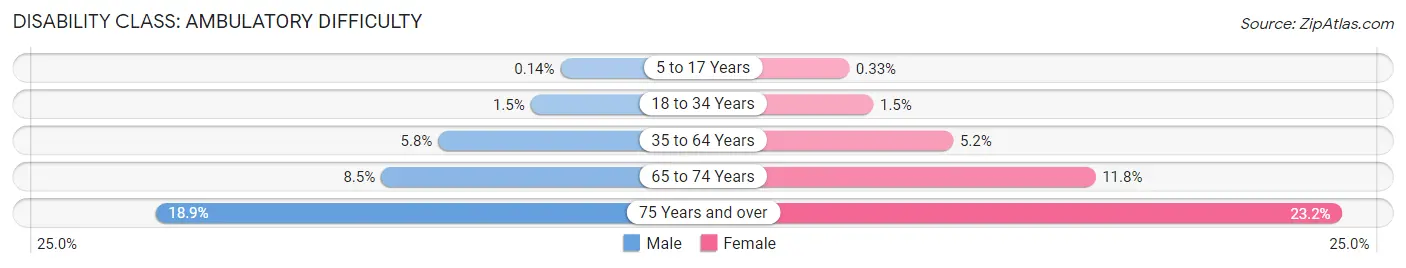
| Age Bracket | Male | Female |
| 5 to 17 Years | 11 (0.1%) | 27 (0.3%) |
| 18 to 34 Years | 174 (1.5%) | 156 (1.5%) |
| 35 to 64 Years | 1,047 (5.8%) | 907 (5.2%) |
| 65 to 74 Years | 417 (8.5%) | 606 (11.8%) |
| 75 Years and over | 547 (18.9%) | 1,064 (23.2%) |
Disability Class: Self-Care Difficulty
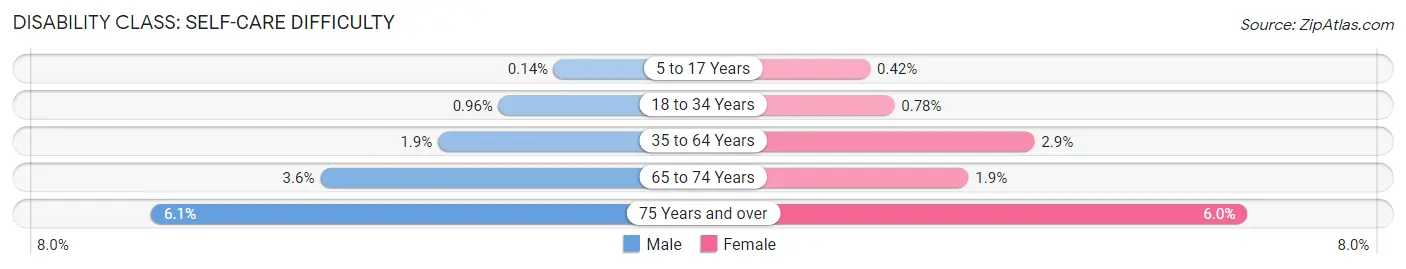
| Age Bracket | Male | Female |
| 5 to 17 Years | 11 (0.1%) | 34 (0.4%) |
| 18 to 34 Years | 110 (1.0%) | 84 (0.8%) |
| 35 to 64 Years | 336 (1.9%) | 503 (2.9%) |
| 65 to 74 Years | 178 (3.6%) | 97 (1.9%) |
| 75 Years and over | 177 (6.1%) | 276 (6.0%) |
Technology Access in Dubuque County
Computing Device Access in Dubuque County
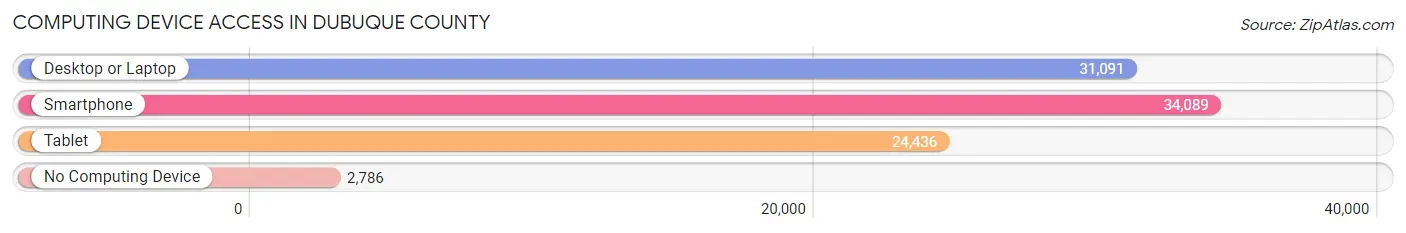
| Device Type | # Households | % Households |
| Desktop or Laptop | 31,091 | 77.8% |
| Smartphone | 34,089 | 85.3% |
| Tablet | 24,436 | 61.1% |
| No Computing Device | 2,786 | 7.0% |
| Total | 39,985 | 100.0% |
Internet Access in Dubuque County
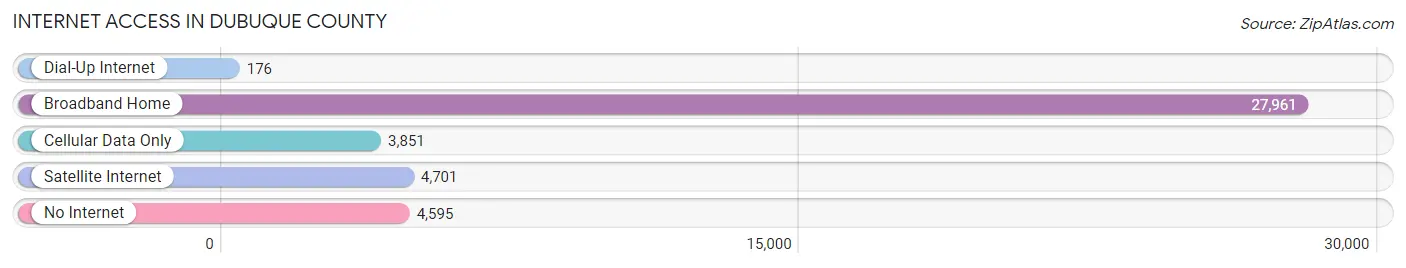
| Internet Type | # Households | % Households |
| Dial-Up Internet | 176 | 0.4% |
| Broadband Home | 27,961 | 69.9% |
| Cellular Data Only | 3,851 | 9.6% |
| Satellite Internet | 4,701 | 11.8% |
| No Internet | 4,595 | 11.5% |
| Total | 39,985 | 100.0% |
Dubuque County Summary
Dubuque County, Iowa is located in the northeastern corner of the state, along the Mississippi River. It is bordered by Wisconsin to the east, Illinois to the south, and Minnesota to the north. The county seat is the city of Dubuque, which is the tenth largest city in Iowa. Dubuque County is home to a population of 94,967 people, according to the 2020 U.S. Census.
History
The area that is now Dubuque County was first settled by Europeans in the late 1700s. The first permanent settlement was established in 1788 by Julien Dubuque, a French-Canadian fur trader. The area was originally part of the Michigan Territory, but in 1834 it became part of the Wisconsin Territory. In 1837, Dubuque County was established as part of the Wisconsin Territory.
In 1846, Iowa became a state and Dubuque County was included in the new state. The county was named after Julien Dubuque, who had died in 1810. The city of Dubuque was established in 1833 and was named after Julien Dubuque.
The county has a rich history of industry and commerce. In the late 1800s, the area was known for its lead mining industry. The city of Dubuque was also a major port on the Mississippi River, and the area was home to several large manufacturing companies.
Geography
Dubuque County covers an area of 845 square miles and is located in the northeastern corner of Iowa. The county is bordered by Wisconsin to the east, Illinois to the south, and Minnesota to the north. The county is located along the Mississippi River and is home to several large lakes, including Lake Dubuque, Lake Odessa, and Lake Como.
The county is mostly rural, with the majority of the population living in the city of Dubuque. The city of Dubuque is located in the center of the county and is the tenth largest city in Iowa. The city is home to a population of 58,945 people, according to the 2020 U.S. Census.
Economy
Dubuque County has a diverse economy, with a mix of manufacturing, agriculture, and services. The county is home to several large manufacturing companies, including John Deere, Hormel Foods, and Kraft Heinz. The county is also home to several agricultural operations, including dairy farms, beef farms, and crop farms.
The county is also home to several service-based businesses, including healthcare, education, and tourism. The city of Dubuque is home to several large healthcare providers, including MercyOne Dubuque Medical Center and UnityPoint Health. The city is also home to several higher education institutions, including the University of Dubuque and Clarke University.
The county is also home to several tourist attractions, including the National Mississippi River Museum and Aquarium, the Dubuque Arboretum and Botanical Gardens, and the Dubuque County Historical Society.
Demographics
According to the 2020 U.S. Census, Dubuque County has a population of 94,967 people. The population is made up of 48.3% male and 51.7% female. The median age of the population is 40.7 years old.
The racial makeup of the county is 87.3% White, 5.3% Black or African American, 1.2% Asian, 0.3% Native American, and 4.9% from other races. The largest ancestry groups in the county are German (37.2%), Irish (17.2%), and English (13.2%).
The median household income in the county is $54,945 and the median home value is $150,400. The unemployment rate in the county is 3.7%.
Conclusion
Dubuque County, Iowa is located in the northeastern corner of the state, along the Mississippi River. It is bordered by Wisconsin to the east, Illinois to the south, and Minnesota to the north. The county has a population of 94,967 people, according to the 2020 U.S. Census. The county has a rich history of industry and commerce, and is home to a diverse economy, with a mix of manufacturing, agriculture, and services. The county is also home to several tourist attractions, including the National Mississippi River Museum and Aquarium, the Dubuque Arboretum and Botanical Gardens, and the Dubuque County Historical Society. The racial makeup of the county is 87.3% White, 5.3% Black or African American, 1.2% Asian, 0.3% Native American, and 4.9% from other races. The median household income in the county is $54,945 and the median home value is $150,400.
Common Questions
What is Per Capita Income in Dubuque County?
Per Capita income in Dubuque County is $38,705.
What is the Median Family Income in Dubuque County?
Median Family Income in Dubuque County is $94,243.
What is the Median Household income in Dubuque County?
Median Household Income in Dubuque County is $73,495.
What is Income or Wage Gap in Dubuque County?
Income or Wage Gap in Dubuque County is 31.7%.
Women in Dubuque County earn 68.3 cents for every dollar earned by a man.
What is Family Income Deficit in Dubuque County?
Family Income Deficit in Dubuque County is $10,900.
Families that are below poverty line in Dubuque County earn $10,900 less on average than the poverty threshold level.
What is Inequality or Gini Index in Dubuque County?
Inequality or Gini Index in Dubuque County is 0.44.
What is the Total Population of Dubuque County?
Total Population of Dubuque County is 98,812.
What is the Total Male Population of Dubuque County?
Total Male Population of Dubuque County is 49,036.
What is the Total Female Population of Dubuque County?
Total Female Population of Dubuque County is 49,776.
What is the Ratio of Males per 100 Females in Dubuque County?
There are 98.51 Males per 100 Females in Dubuque County.
What is the Ratio of Females per 100 Males in Dubuque County?
There are 101.51 Females per 100 Males in Dubuque County.
What is the Median Population Age in Dubuque County?
Median Population Age in Dubuque County is 38.7 Years.
What is the Average Family Size in Dubuque County
Average Family Size in Dubuque County is 3.0 People.
What is the Average Household Size in Dubuque County
Average Household Size in Dubuque County is 2.4 People.
How Large is the Labor Force in Dubuque County?
There are 53,553 People in the Labor Forcein in Dubuque County.
What is the Percentage of People in the Labor Force in Dubuque County?
67.4% of People are in the Labor Force in Dubuque County.
What is the Unemployment Rate in Dubuque County?
Unemployment Rate in Dubuque County is 4.1%.