Scott County, IA Map & Demographics
Scott County Map
Scott County Overview
$40,926
PER CAPITA INCOME
$94,696
AVG FAMILY INCOME
$72,792
AVG HOUSEHOLD INCOME
33.2%
WAGE / INCOME GAP [ % ]
66.8¢/ $1
WAGE / INCOME GAP [ $ ]
$11,616
FAMILY INCOME DEFICIT
0.46
INEQUALITY / GINI INDEX
174,315
TOTAL POPULATION
86,169
MALE POPULATION
88,146
FEMALE POPULATION
97.76
MALES / 100 FEMALES
102.29
FEMALES / 100 MALES
38.7
MEDIAN AGE
3.0
AVG FAMILY SIZE
2.4
AVG HOUSEHOLD SIZE
91,194
LABOR FORCE [ PEOPLE ]
65.9%
PERCENT IN LABOR FORCE
4.0%
UNEMPLOYMENT RATE
Scott County Area Codes
Income in Scott County
Income Overview in Scott County
Per Capita Income in Scott County is $40,926, while median incomes of families and households are $94,696 and $72,792 respectively.
| Characteristic | Number | Measure |
| Per Capita Income | 174,315 | $40,926 |
| Median Family Income | 44,298 | $94,696 |
| Mean Family Income | 44,298 | $118,927 |
| Median Household Income | 71,436 | $72,792 |
| Mean Household Income | 71,436 | $98,290 |
| Income Deficit | 44,298 | $11,616 |
| Wage / Income Gap (%) | 174,315 | 33.20% |
| Wage / Income Gap ($) | 174,315 | 66.80¢ per $1 |
| Gini / Inequality Index | 174,315 | 0.46 |
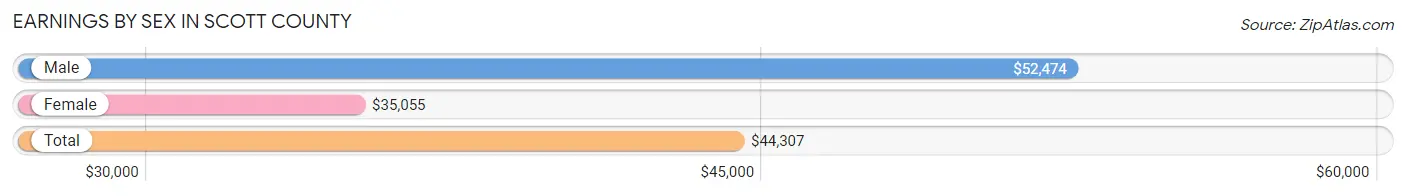
Earnings by Sex in Scott County
Average Earnings in Scott County are $44,307, $52,474 for men and $35,055 for women, a difference of 33.2%.
| Sex | Number | Average Earnings |
| Male | 49,646 (52.3%) | $52,474 |
| Female | 45,242 (47.7%) | $35,055 |
| Total | 94,888 (100.0%) | $44,307 |
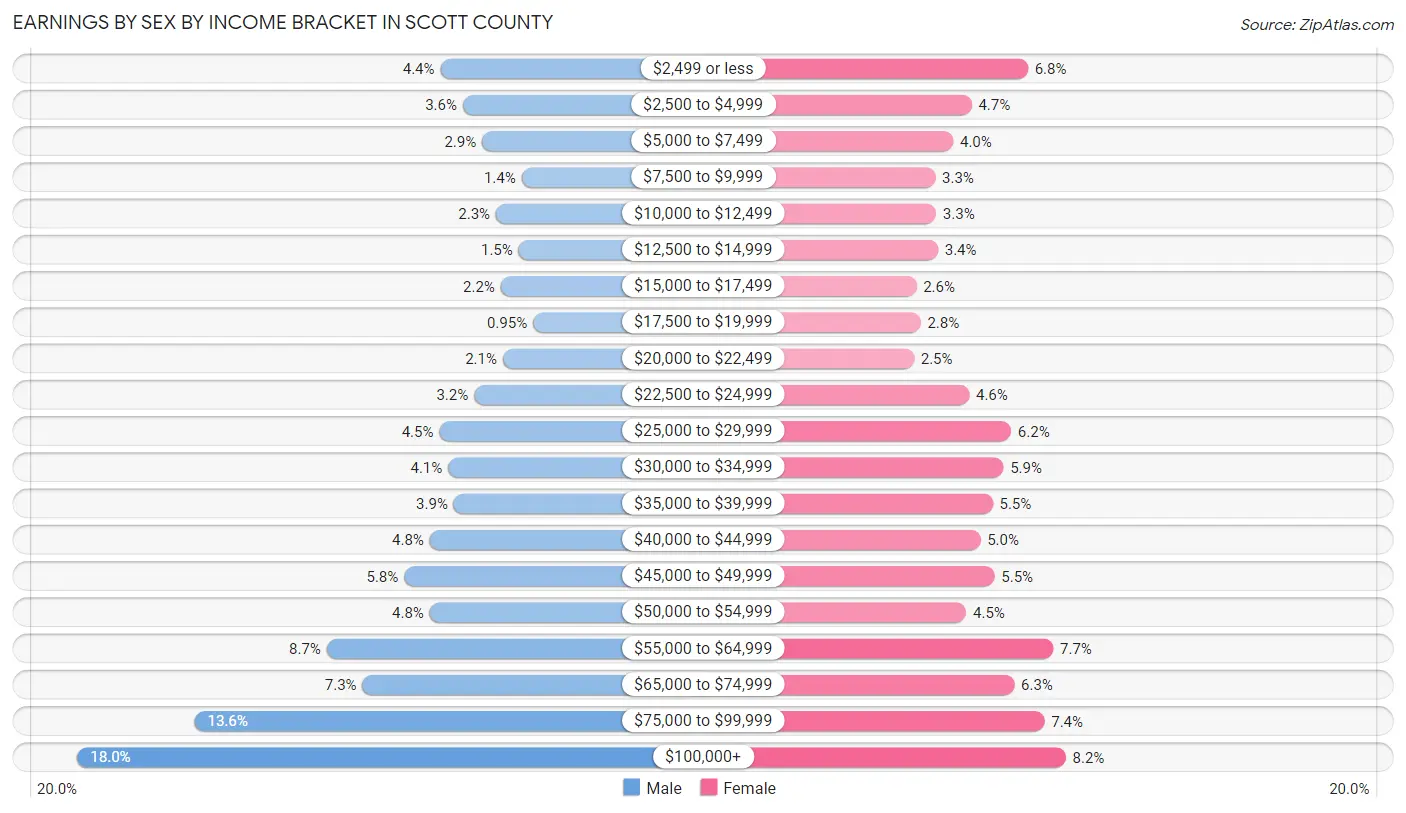
Earnings by Sex by Income Bracket in Scott County
The most common earnings brackets in Scott County are $100,000+ for men (8,944 | 18.0%) and $100,000+ for women (3,710 | 8.2%).
| Income | Male | Female |
| $2,499 or less | 2,195 (4.4%) | 3,066 (6.8%) |
| $2,500 to $4,999 | 1,775 (3.6%) | 2,114 (4.7%) |
| $5,000 to $7,499 | 1,418 (2.9%) | 1,799 (4.0%) |
| $7,500 to $9,999 | 683 (1.4%) | 1,497 (3.3%) |
| $10,000 to $12,499 | 1,162 (2.3%) | 1,513 (3.3%) |
| $12,500 to $14,999 | 740 (1.5%) | 1,543 (3.4%) |
| $15,000 to $17,499 | 1,070 (2.2%) | 1,177 (2.6%) |
| $17,500 to $19,999 | 470 (0.9%) | 1,249 (2.8%) |
| $20,000 to $22,499 | 1,033 (2.1%) | 1,135 (2.5%) |
| $22,500 to $24,999 | 1,569 (3.2%) | 2,072 (4.6%) |
| $25,000 to $29,999 | 2,216 (4.5%) | 2,781 (6.1%) |
| $30,000 to $34,999 | 2,048 (4.1%) | 2,651 (5.9%) |
| $35,000 to $39,999 | 1,946 (3.9%) | 2,468 (5.5%) |
| $40,000 to $44,999 | 2,392 (4.8%) | 2,261 (5.0%) |
| $45,000 to $49,999 | 2,871 (5.8%) | 2,501 (5.5%) |
| $50,000 to $54,999 | 2,394 (4.8%) | 2,024 (4.5%) |
| $55,000 to $64,999 | 4,308 (8.7%) | 3,497 (7.7%) |
| $65,000 to $74,999 | 3,643 (7.3%) | 2,835 (6.3%) |
| $75,000 to $99,999 | 6,769 (13.6%) | 3,349 (7.4%) |
| $100,000+ | 8,944 (18.0%) | 3,710 (8.2%) |
| Total | 49,646 (100.0%) | 45,242 (100.0%) |
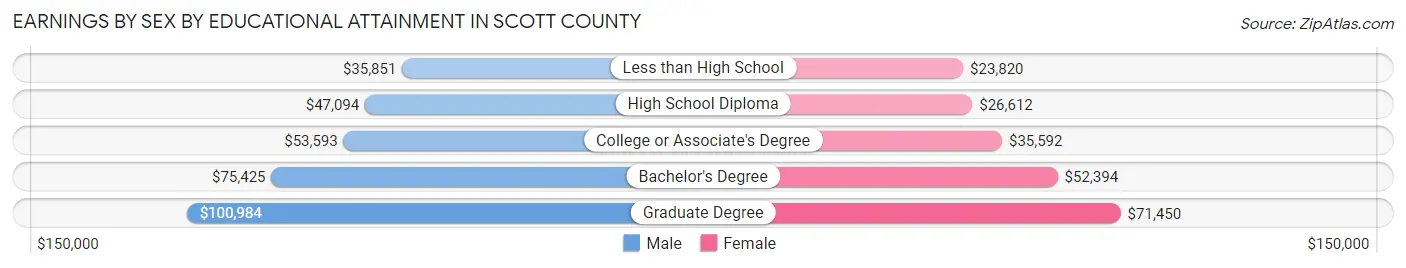
Earnings by Sex by Educational Attainment in Scott County
Average earnings in Scott County are $58,956 for men and $40,828 for women, a difference of 30.7%. Men with an educational attainment of graduate degree enjoy the highest average annual earnings of $100,984, while those with less than high school education earn the least with $35,851. Women with an educational attainment of graduate degree earn the most with the average annual earnings of $71,450, while those with less than high school education have the smallest earnings of $23,820.
| Educational Attainment | Male Income | Female Income |
| Less than High School | $35,851 | $23,820 |
| High School Diploma | $47,094 | $26,612 |
| College or Associate's Degree | $53,593 | $35,592 |
| Bachelor's Degree | $75,425 | $52,394 |
| Graduate Degree | $100,984 | $71,450 |
| Total | $58,956 | $40,828 |
Family Income in Scott County
Family Income Brackets in Scott County
According to the Scott County family income data, there are 10,366 families falling into the $100,000 to $149,999 income range, which is the most common income bracket and makes up 23.4% of all families. Conversely, the $10,000 to $14,999 income bracket is the least frequent group with only 620 families (1.4%) belonging to this category.
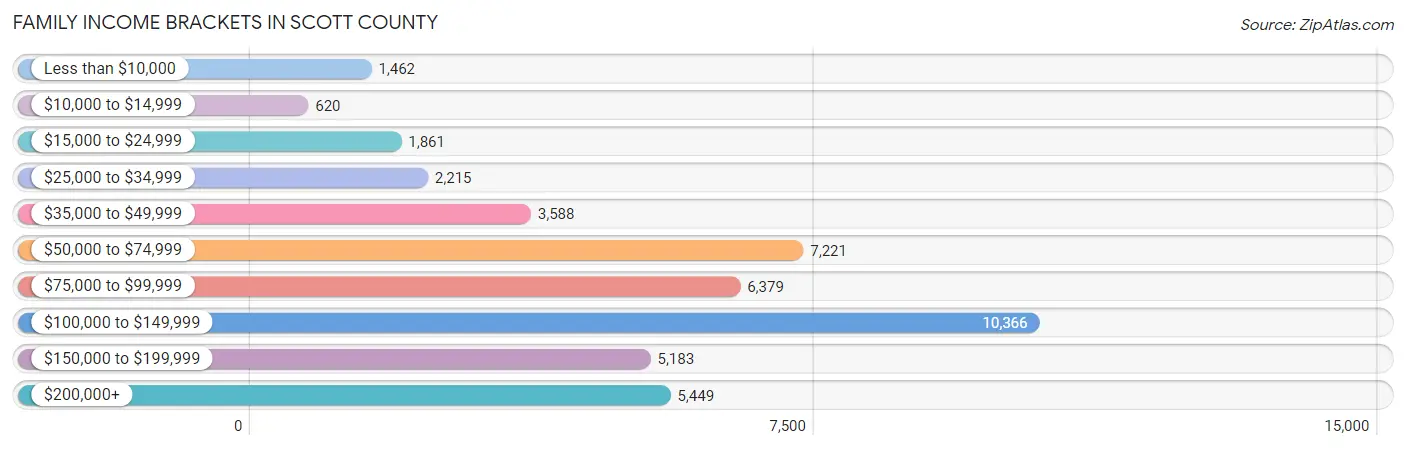
| Income Bracket | # Families | % Families |
| Less than $10,000 | 1,462 | 3.3% |
| $10,000 to $14,999 | 620 | 1.4% |
| $15,000 to $24,999 | 1,861 | 4.2% |
| $25,000 to $34,999 | 2,215 | 5.0% |
| $35,000 to $49,999 | 3,588 | 8.1% |
| $50,000 to $74,999 | 7,221 | 16.3% |
| $75,000 to $99,999 | 6,379 | 14.4% |
| $100,000 to $149,999 | 10,366 | 23.4% |
| $150,000 to $199,999 | 5,183 | 11.7% |
| $200,000+ | 5,449 | 12.3% |
Family Income by Famaliy Size in Scott County
7+ person families (263 | 0.6%) account for the highest median family income in Scott County with $124,154 per family, while 2-person families (22,274 | 50.3%) have the highest median income of $41,198 per family member.
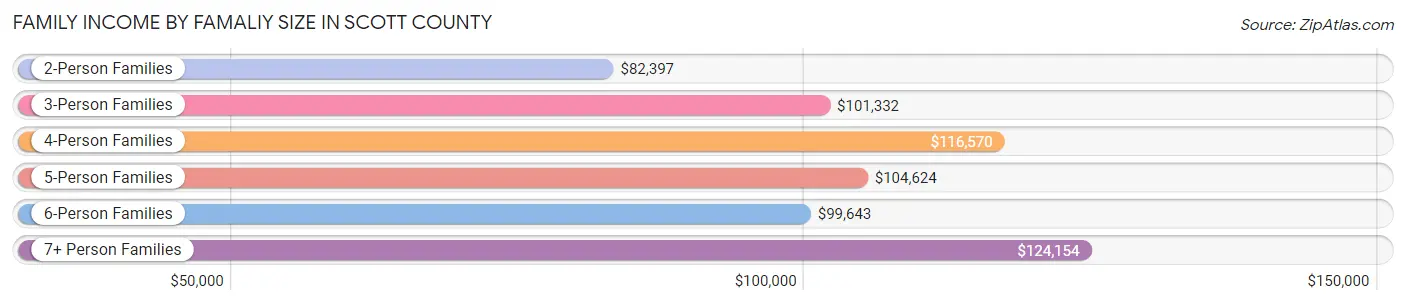
| Income Bracket | # Families | Median Income |
| 2-Person Families | 22,274 (50.3%) | $82,397 |
| 3-Person Families | 9,572 (21.6%) | $101,332 |
| 4-Person Families | 7,789 (17.6%) | $116,570 |
| 5-Person Families | 3,558 (8.0%) | $104,624 |
| 6-Person Families | 842 (1.9%) | $99,643 |
| 7+ Person Families | 263 (0.6%) | $124,154 |
| Total | 44,298 (100.0%) | $94,696 |
Family Income by Number of Earners in Scott County
The median family income in Scott County is $94,696, with families comprising 3+ earners (4,115) having the highest median family income of $142,272, while families with no earners (6,804) have the lowest median family income of $57,995, accounting for 9.3% and 15.4% of families, respectively.
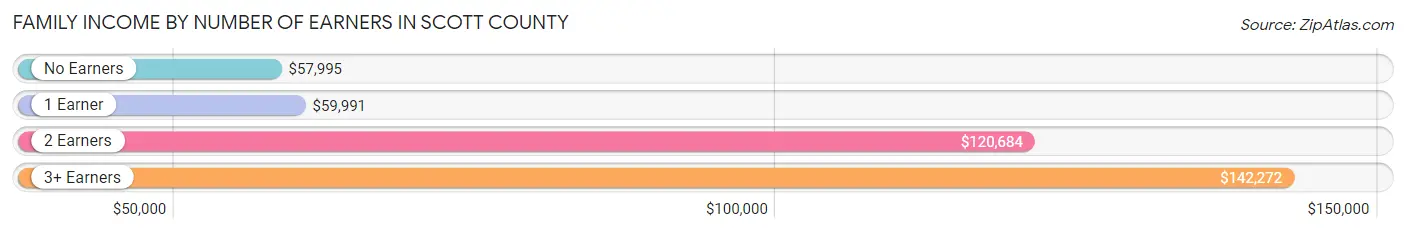
| Number of Earners | # Families | Median Income |
| No Earners | 6,804 (15.4%) | $57,995 |
| 1 Earner | 13,344 (30.1%) | $59,991 |
| 2 Earners | 20,035 (45.2%) | $120,684 |
| 3+ Earners | 4,115 (9.3%) | $142,272 |
| Total | 44,298 (100.0%) | $94,696 |
Household Income in Scott County
Household Income Brackets in Scott County
With 13,501 households falling in the category, the $100,000 to $149,999 income range is the most frequent in Scott County, accounting for 18.9% of all households. In contrast, only 2,357 households (3.3%) fall into the $10,000 to $14,999 income bracket, making it the least populous group.
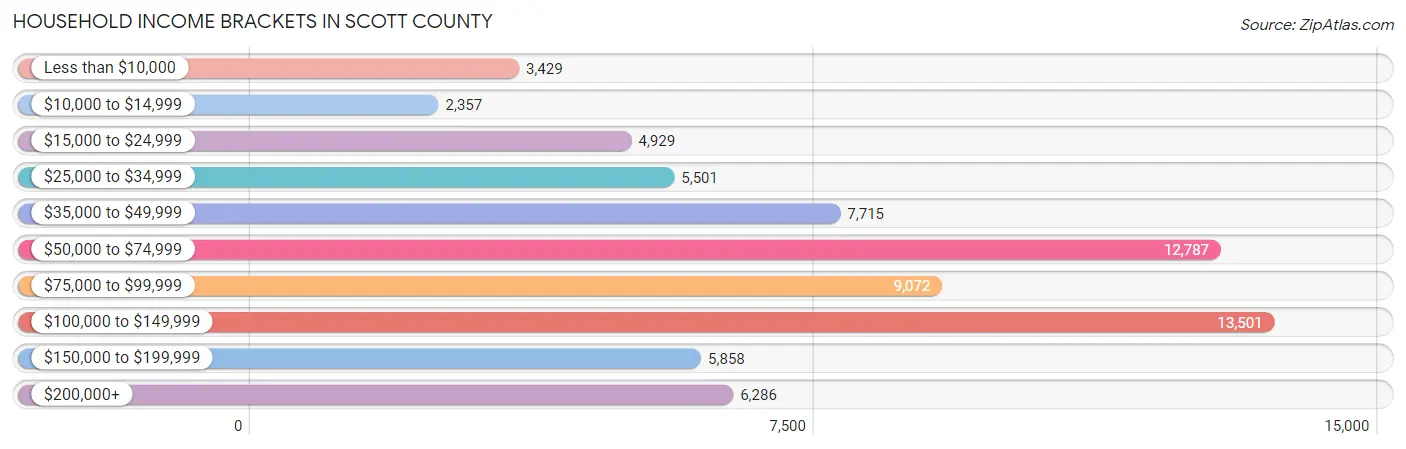
| Income Bracket | # Households | % Households |
| Less than $10,000 | 3,429 | 4.8% |
| $10,000 to $14,999 | 2,357 | 3.3% |
| $15,000 to $24,999 | 4,929 | 6.9% |
| $25,000 to $34,999 | 5,501 | 7.7% |
| $35,000 to $49,999 | 7,715 | 10.8% |
| $50,000 to $74,999 | 12,787 | 17.9% |
| $75,000 to $99,999 | 9,072 | 12.7% |
| $100,000 to $149,999 | 13,501 | 18.9% |
| $150,000 to $199,999 | 5,858 | 8.2% |
| $200,000+ | 6,286 | 8.8% |
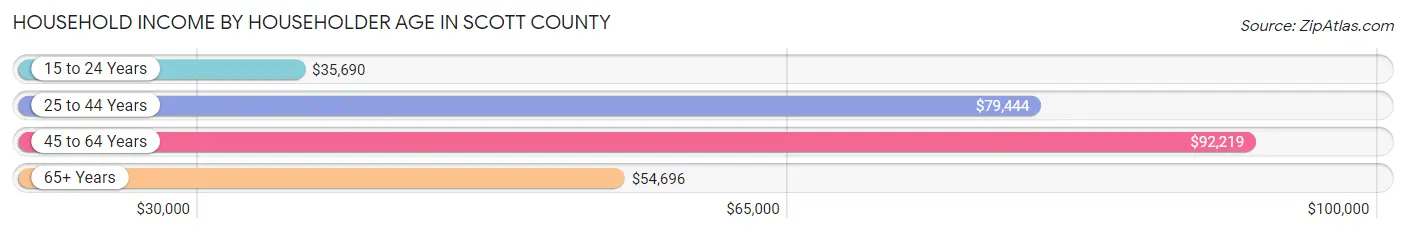
Household Income by Householder Age in Scott County
The median household income in Scott County is $72,792, with the highest median household income of $92,219 found in the 45 to 64 years age bracket for the primary householder. A total of 25,410 households (35.6%) fall into this category. Meanwhile, the 15 to 24 years age bracket for the primary householder has the lowest median household income of $35,690, with 3,334 households (4.7%) in this group.
| Income Bracket | # Households | Median Income |
| 15 to 24 Years | 3,334 (4.7%) | $35,690 |
| 25 to 44 Years | 23,988 (33.6%) | $79,444 |
| 45 to 64 Years | 25,410 (35.6%) | $92,219 |
| 65+ Years | 18,704 (26.2%) | $54,696 |
| Total | 71,436 (100.0%) | $72,792 |
Poverty in Scott County
Income Below Poverty by Sex and Age in Scott County
With 10.3% poverty level for males and 13.5% for females among the residents of Scott County, under 5 year old males and 18 to 24 year old females are the most vulnerable to poverty, with 1,046 males (19.9%) and 1,883 females (27.8%) in their respective age groups living below the poverty level.
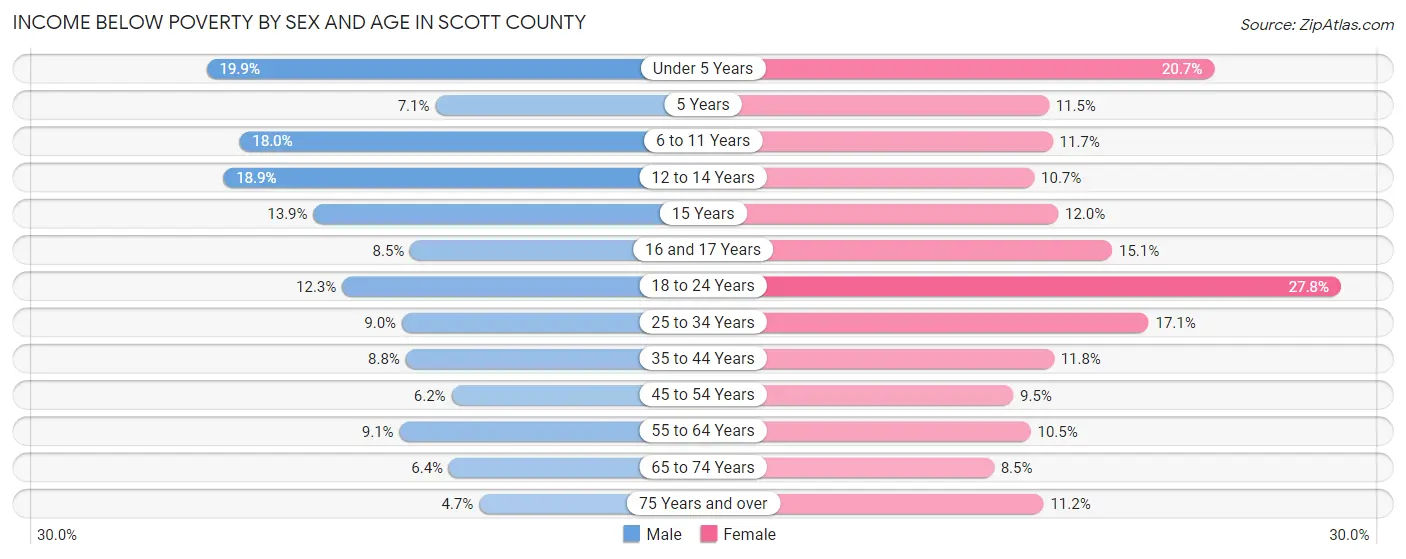
| Age Bracket | Male | Female |
| Under 5 Years | 1,046 (19.9%) | 1,069 (20.7%) |
| 5 Years | 74 (7.1%) | 110 (11.5%) |
| 6 to 11 Years | 1,234 (18.0%) | 746 (11.7%) |
| 12 to 14 Years | 651 (18.9%) | 398 (10.7%) |
| 15 Years | 169 (13.9%) | 118 (12.0%) |
| 16 and 17 Years | 196 (8.5%) | 389 (15.0%) |
| 18 to 24 Years | 848 (12.3%) | 1,883 (27.8%) |
| 25 to 34 Years | 979 (9.0%) | 1,898 (17.1%) |
| 35 to 44 Years | 1,026 (8.8%) | 1,341 (11.8%) |
| 45 to 54 Years | 656 (6.2%) | 992 (9.5%) |
| 55 to 64 Years | 1,024 (9.1%) | 1,204 (10.5%) |
| 65 to 74 Years | 527 (6.4%) | 752 (8.5%) |
| 75 Years and over | 217 (4.7%) | 730 (11.2%) |
| Total | 8,647 (10.3%) | 11,630 (13.5%) |
Income Above Poverty by Sex and Age in Scott County
According to the poverty statistics in Scott County, males aged 75 years and over and females aged 65 to 74 years are the age groups that are most secure financially, with 95.3% of males and 91.5% of females in these age groups living above the poverty line.
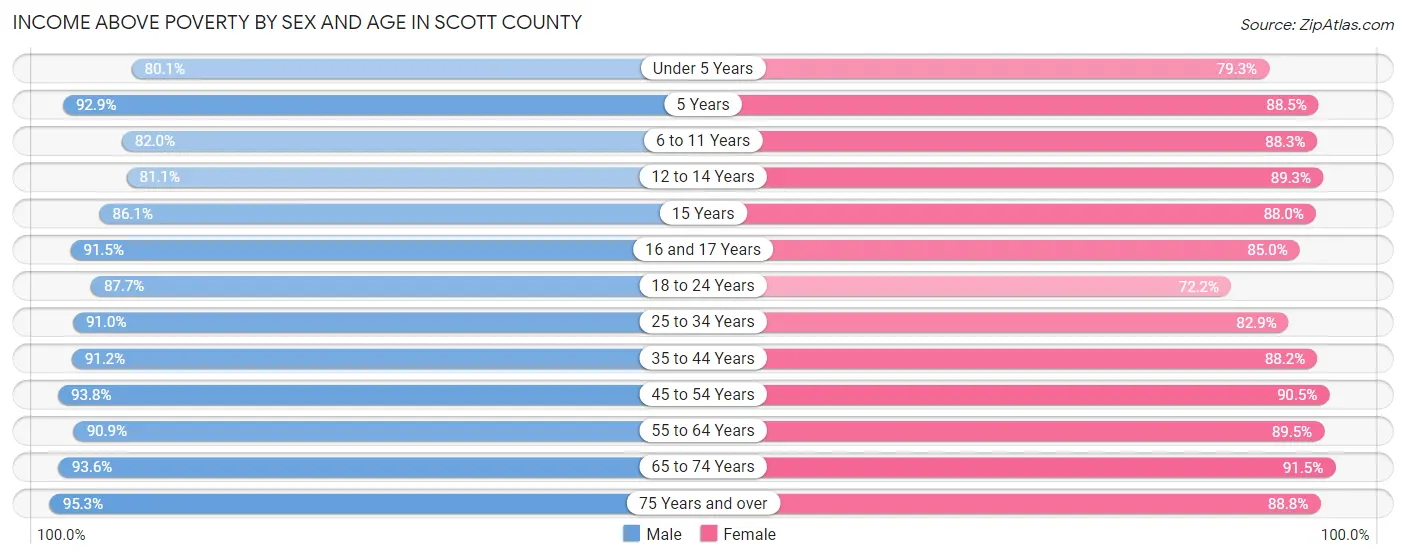
| Age Bracket | Male | Female |
| Under 5 Years | 4,217 (80.1%) | 4,089 (79.3%) |
| 5 Years | 964 (92.9%) | 845 (88.5%) |
| 6 to 11 Years | 5,607 (82.0%) | 5,611 (88.3%) |
| 12 to 14 Years | 2,787 (81.1%) | 3,318 (89.3%) |
| 15 Years | 1,045 (86.1%) | 862 (88.0%) |
| 16 and 17 Years | 2,103 (91.5%) | 2,195 (85.0%) |
| 18 to 24 Years | 6,033 (87.7%) | 4,893 (72.2%) |
| 25 to 34 Years | 9,905 (91.0%) | 9,217 (82.9%) |
| 35 to 44 Years | 10,666 (91.2%) | 10,024 (88.2%) |
| 45 to 54 Years | 9,881 (93.8%) | 9,403 (90.5%) |
| 55 to 64 Years | 10,195 (90.9%) | 10,251 (89.5%) |
| 65 to 74 Years | 7,741 (93.6%) | 8,135 (91.5%) |
| 75 Years and over | 4,407 (95.3%) | 5,768 (88.8%) |
| Total | 75,551 (89.7%) | 74,611 (86.5%) |
Income Below Poverty Among Married-Couple Families in Scott County
The poverty statistics for married-couple families in Scott County show that 2.8% or 917 of the total 33,394 families live below the poverty line. Families with 5 or more children have the highest poverty rate of 13.7%, comprising of 21 families. On the other hand, families with no children have the lowest poverty rate of 2.0%, which includes 393 families.
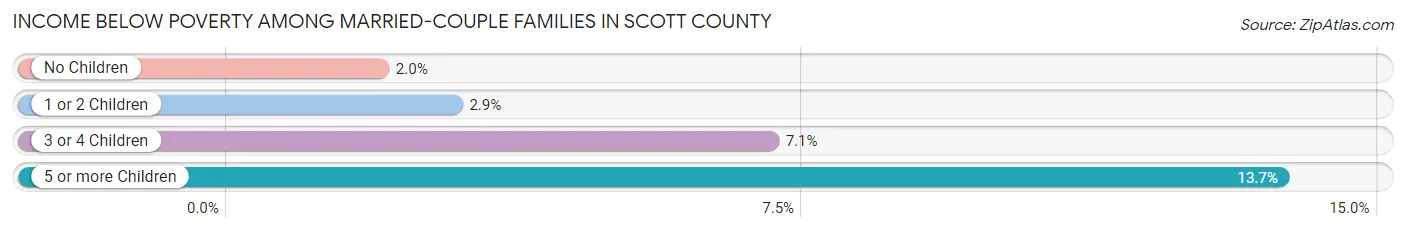
| Children | Above Poverty | Below Poverty |
| No Children | 19,577 (98.0%) | 393 (2.0%) |
| 1 or 2 Children | 10,187 (97.1%) | 307 (2.9%) |
| 3 or 4 Children | 2,581 (92.9%) | 196 (7.1%) |
| 5 or more Children | 132 (86.3%) | 21 (13.7%) |
| Total | 32,477 (97.3%) | 917 (2.8%) |
Income Below Poverty Among Single-Parent Households in Scott County
According to the poverty data in Scott County, 7.6% or 224 single-father households and 31.0% or 2,468 single-mother households are living below the poverty line. Among single-father households, those with 5 or more children have the highest poverty rate, with 39 households (100.0%) experiencing poverty. Likewise, among single-mother households, those with 3 or 4 children have the highest poverty rate, with 596 households (62.9%) falling below the poverty line.
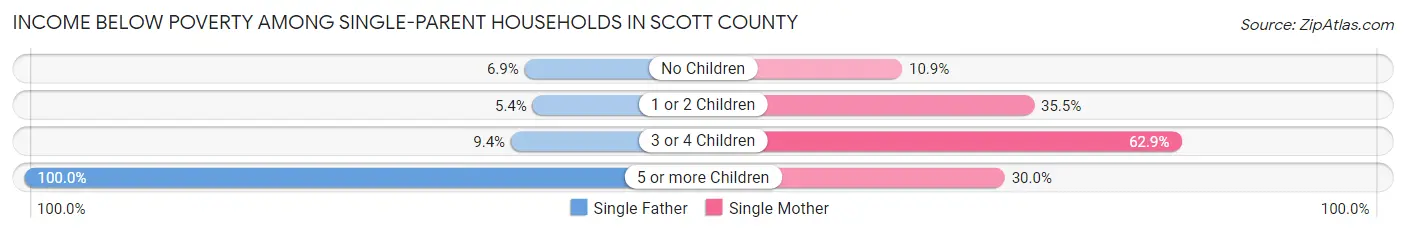
| Children | Single Father | Single Mother |
| No Children | 67 (6.9%) | 270 (10.9%) |
| 1 or 2 Children | 86 (5.4%) | 1,599 (35.5%) |
| 3 or 4 Children | 32 (9.4%) | 596 (62.9%) |
| 5 or more Children | 39 (100.0%) | 3 (30.0%) |
| Total | 224 (7.6%) | 2,468 (31.0%) |
Income Below Poverty Among Married-Couple vs Single-Parent Households in Scott County
The poverty data for Scott County shows that 917 of the married-couple family households (2.8%) and 2,692 of the single-parent households (24.7%) are living below the poverty level. Within the married-couple family households, those with 5 or more children have the highest poverty rate, with 21 households (13.7%) falling below the poverty line. Among the single-parent households, those with 5 or more children have the highest poverty rate, with 42 household (85.7%) living below poverty.
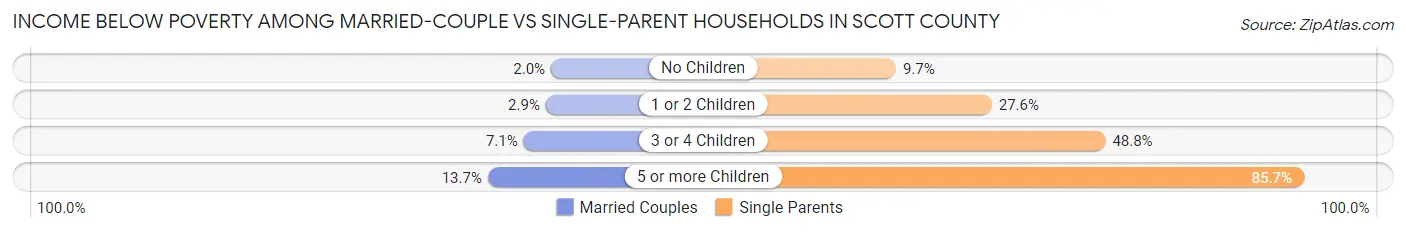
| Children | Married-Couple Families | Single-Parent Households |
| No Children | 393 (2.0%) | 337 (9.7%) |
| 1 or 2 Children | 307 (2.9%) | 1,685 (27.6%) |
| 3 or 4 Children | 196 (7.1%) | 628 (48.8%) |
| 5 or more Children | 21 (13.7%) | 42 (85.7%) |
| Total | 917 (2.8%) | 2,692 (24.7%) |
Race in Scott County
The most populous races in Scott County are White / Caucasian (142,560 | 81.8%), Hispanic or Latino (12,668 | 7.3%), and Black / African American (12,261 | 7.0%).
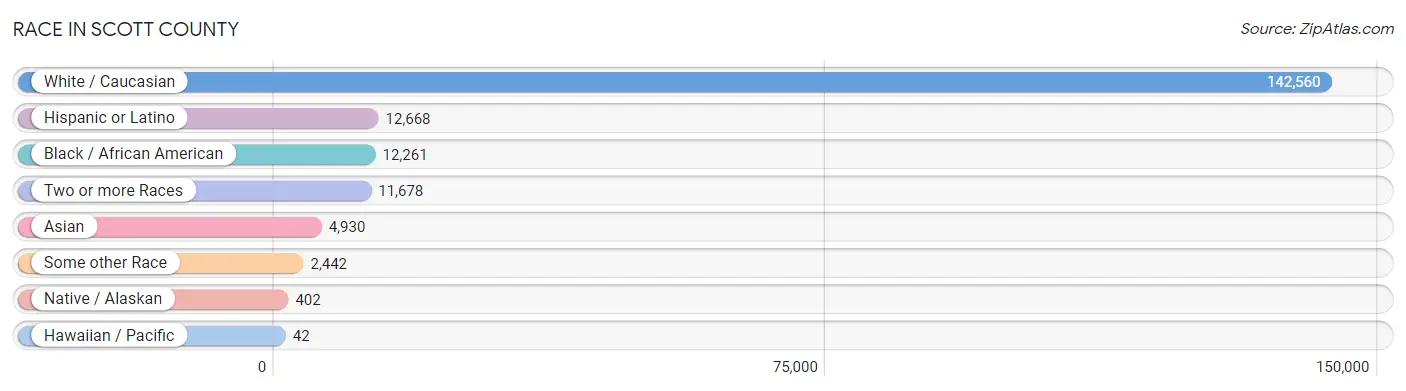
| Race | # Population | % Population |
| Asian | 4,930 | 2.8% |
| Black / African American | 12,261 | 7.0% |
| Hawaiian / Pacific | 42 | 0.0% |
| Hispanic or Latino | 12,668 | 7.3% |
| Native / Alaskan | 402 | 0.2% |
| White / Caucasian | 142,560 | 81.8% |
| Two or more Races | 11,678 | 6.7% |
| Some other Race | 2,442 | 1.4% |
| Total | 174,315 | 100.0% |
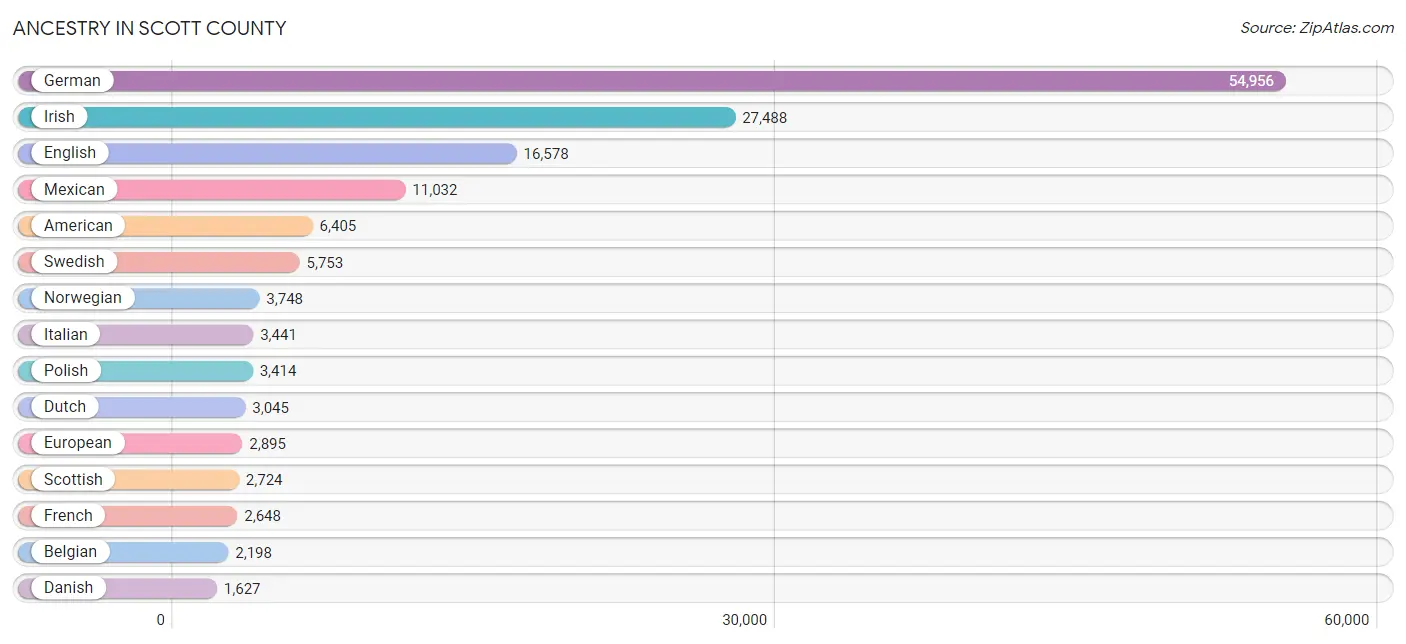
Ancestry in Scott County
The most populous ancestries reported in Scott County are German (54,956 | 31.5%), Irish (27,488 | 15.8%), English (16,578 | 9.5%), Mexican (11,032 | 6.3%), and American (6,405 | 3.7%), together accounting for 66.8% of all Scott County residents.
| Ancestry | # Population | % Population |
| Afghan | 12 | 0.0% |
| African | 591 | 0.3% |
| Alaskan Athabascan | 15 | 0.0% |
| American | 6,405 | 3.7% |
| Apache | 24 | 0.0% |
| Arab | 286 | 0.2% |
| Armenian | 25 | 0.0% |
| Australian | 15 | 0.0% |
| Austrian | 286 | 0.2% |
| Belgian | 2,198 | 1.3% |
| Bhutanese | 429 | 0.3% |
| Blackfeet | 29 | 0.0% |
| Brazilian | 14 | 0.0% |
| British | 879 | 0.5% |
| British West Indian | 14 | 0.0% |
| Bulgarian | 13 | 0.0% |
| Burmese | 775 | 0.4% |
| Canadian | 109 | 0.1% |
| Celtic | 4 | 0.0% |
| Central American | 569 | 0.3% |
| Cherokee | 222 | 0.1% |
| Cheyenne | 7 | 0.0% |
| Chilean | 41 | 0.0% |
| Chippewa | 22 | 0.0% |
| Choctaw | 36 | 0.0% |
| Colombian | 150 | 0.1% |
| Costa Rican | 66 | 0.0% |
| Cree | 2 | 0.0% |
| Croatian | 350 | 0.2% |
| Crow | 7 | 0.0% |
| Cuban | 71 | 0.0% |
| Czech | 1,573 | 0.9% |
| Czechoslovakian | 143 | 0.1% |
| Danish | 1,627 | 0.9% |
| Dominican | 65 | 0.0% |
| Dutch | 3,045 | 1.8% |
| Eastern European | 170 | 0.1% |
| Ecuadorian | 51 | 0.0% |
| Egyptian | 46 | 0.0% |
| English | 16,578 | 9.5% |
| Ethiopian | 1 | 0.0% |
| European | 2,895 | 1.7% |
| Filipino | 9 | 0.0% |
| Finnish | 109 | 0.1% |
| French | 2,648 | 1.5% |
| French American Indian | 6 | 0.0% |
| French Canadian | 386 | 0.2% |
| German | 54,956 | 31.5% |
| German Russian | 9 | 0.0% |
| Greek | 1,255 | 0.7% |
| Guamanian / Chamorro | 68 | 0.0% |
| Guatemalan | 23 | 0.0% |
| Haitian | 350 | 0.2% |
| Honduran | 105 | 0.1% |
| Hopi | 17 | 0.0% |
| Hungarian | 188 | 0.1% |
| Icelander | 9 | 0.0% |
| Indian (Asian) | 859 | 0.5% |
| Indonesian | 196 | 0.1% |
| Inupiat | 17 | 0.0% |
| Iranian | 57 | 0.0% |
| Irish | 27,488 | 15.8% |
| Israeli | 35 | 0.0% |
| Italian | 3,441 | 2.0% |
| Jamaican | 70 | 0.0% |
| Japanese | 78 | 0.0% |
| Kenyan | 23 | 0.0% |
| Kiowa | 4 | 0.0% |
| Korean | 575 | 0.3% |
| Laotian | 51 | 0.0% |
| Latvian | 56 | 0.0% |
| Lebanese | 71 | 0.0% |
| Lithuanian | 102 | 0.1% |
| Lumbee | 2 | 0.0% |
| Luxembourger | 108 | 0.1% |
| Malaysian | 113 | 0.1% |
| Mexican | 11,032 | 6.3% |
| Mexican American Indian | 40 | 0.0% |
| Native Hawaiian | 118 | 0.1% |
| Navajo | 62 | 0.0% |
| Nicaraguan | 163 | 0.1% |
| Nigerian | 11 | 0.0% |
| Northern European | 265 | 0.2% |
| Norwegian | 3,748 | 2.1% |
| Pakistani | 90 | 0.1% |
| Palestinian | 44 | 0.0% |
| Pennsylvania German | 64 | 0.0% |
| Pima | 1 | 0.0% |
| Polish | 3,414 | 2.0% |
| Portuguese | 70 | 0.0% |
| Puerto Rican | 409 | 0.2% |
| Romanian | 34 | 0.0% |
| Russian | 328 | 0.2% |
| Salvadoran | 212 | 0.1% |
| Samoan | 44 | 0.0% |
| Scandinavian | 639 | 0.4% |
| Scotch-Irish | 1,048 | 0.6% |
| Scottish | 2,724 | 1.6% |
| Serbian | 26 | 0.0% |
| Sioux | 140 | 0.1% |
| Slavic | 43 | 0.0% |
| Slovak | 40 | 0.0% |
| Slovene | 15 | 0.0% |
| South African | 10 | 0.0% |
| South American | 288 | 0.2% |
| Spaniard | 36 | 0.0% |
| Spanish | 82 | 0.1% |
| Spanish American Indian | 5 | 0.0% |
| Sri Lankan | 920 | 0.5% |
| Subsaharan African | 711 | 0.4% |
| Swedish | 5,753 | 3.3% |
| Swiss | 610 | 0.4% |
| Syrian | 17 | 0.0% |
| Thai | 1,601 | 0.9% |
| Turkish | 7 | 0.0% |
| Ukrainian | 190 | 0.1% |
| Venezuelan | 3 | 0.0% |
| Vietnamese | 120 | 0.1% |
| Welsh | 870 | 0.5% |
| West Indian | 14 | 0.0% |
| Yaqui | 15 | 0.0% |
| Yugoslavian | 217 | 0.1% | View All 122 Rows |
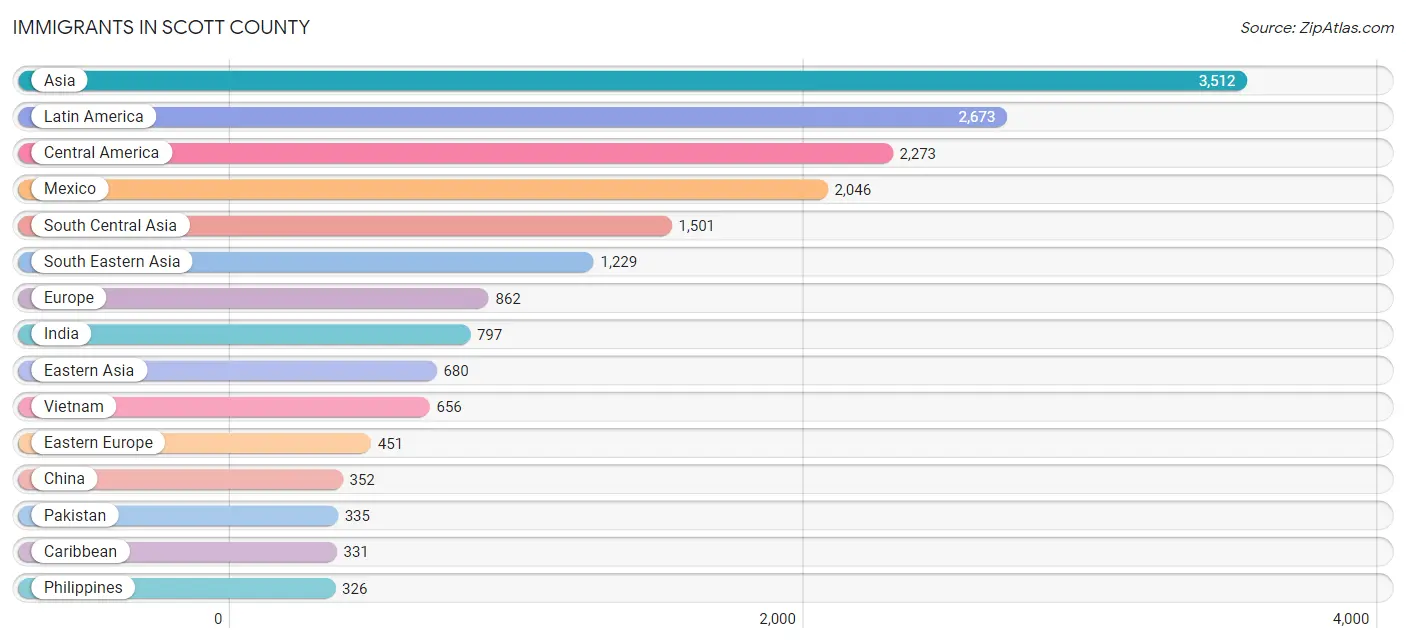
Immigrants in Scott County
The most numerous immigrant groups reported in Scott County came from Asia (3,512 | 2.0%), Latin America (2,673 | 1.5%), Central America (2,273 | 1.3%), Mexico (2,046 | 1.2%), and South Central Asia (1,501 | 0.9%), together accounting for 6.9% of all Scott County residents.
| Immigration Origin | # Population | % Population |
| Africa | 314 | 0.2% |
| Asia | 3,512 | 2.0% |
| Bangladesh | 230 | 0.1% |
| Bosnia and Herzegovina | 183 | 0.1% |
| Brazil | 5 | 0.0% |
| Bulgaria | 13 | 0.0% |
| Cambodia | 26 | 0.0% |
| Canada | 193 | 0.1% |
| Caribbean | 331 | 0.2% |
| Central America | 2,273 | 1.3% |
| Chile | 19 | 0.0% |
| China | 352 | 0.2% |
| Colombia | 45 | 0.0% |
| Costa Rica | 25 | 0.0% |
| Cuba | 10 | 0.0% |
| Eastern Africa | 54 | 0.0% |
| Eastern Asia | 680 | 0.4% |
| Eastern Europe | 451 | 0.3% |
| Egypt | 23 | 0.0% |
| El Salvador | 122 | 0.1% |
| England | 36 | 0.0% |
| Eritrea | 1 | 0.0% |
| Europe | 862 | 0.5% |
| Germany | 202 | 0.1% |
| Guatemala | 62 | 0.0% |
| Haiti | 237 | 0.1% |
| Honduras | 18 | 0.0% |
| Hong Kong | 68 | 0.0% |
| Hungary | 15 | 0.0% |
| India | 797 | 0.5% |
| Indonesia | 14 | 0.0% |
| Iran | 13 | 0.0% |
| Iraq | 59 | 0.0% |
| Ireland | 20 | 0.0% |
| Israel | 16 | 0.0% |
| Italy | 5 | 0.0% |
| Jamaica | 21 | 0.0% |
| Japan | 84 | 0.1% |
| Kenya | 31 | 0.0% |
| Korea | 244 | 0.1% |
| Latin America | 2,673 | 1.5% |
| Latvia | 17 | 0.0% |
| Lebanon | 15 | 0.0% |
| Mexico | 2,046 | 1.2% |
| Morocco | 3 | 0.0% |
| Nepal | 107 | 0.1% |
| Nigeria | 12 | 0.0% |
| Northern Africa | 26 | 0.0% |
| Northern Europe | 180 | 0.1% |
| Norway | 30 | 0.0% |
| Oceania | 13 | 0.0% |
| Pakistan | 335 | 0.2% |
| Philippines | 326 | 0.2% |
| Poland | 161 | 0.1% |
| Portugal | 24 | 0.0% |
| Romania | 10 | 0.0% |
| Russia | 31 | 0.0% |
| Saudi Arabia | 5 | 0.0% |
| Scotland | 24 | 0.0% |
| South Africa | 13 | 0.0% |
| South America | 69 | 0.0% |
| South Central Asia | 1,501 | 0.9% |
| South Eastern Asia | 1,229 | 0.7% |
| Southern Europe | 29 | 0.0% |
| Taiwan | 9 | 0.0% |
| Thailand | 151 | 0.1% |
| Turkey | 7 | 0.0% |
| Ukraine | 10 | 0.0% |
| Uzbekistan | 13 | 0.0% |
| Vietnam | 656 | 0.4% |
| Western Africa | 169 | 0.1% |
| Western Asia | 102 | 0.1% |
| Western Europe | 202 | 0.1% |
| Zimbabwe | 6 | 0.0% | View All 74 Rows |
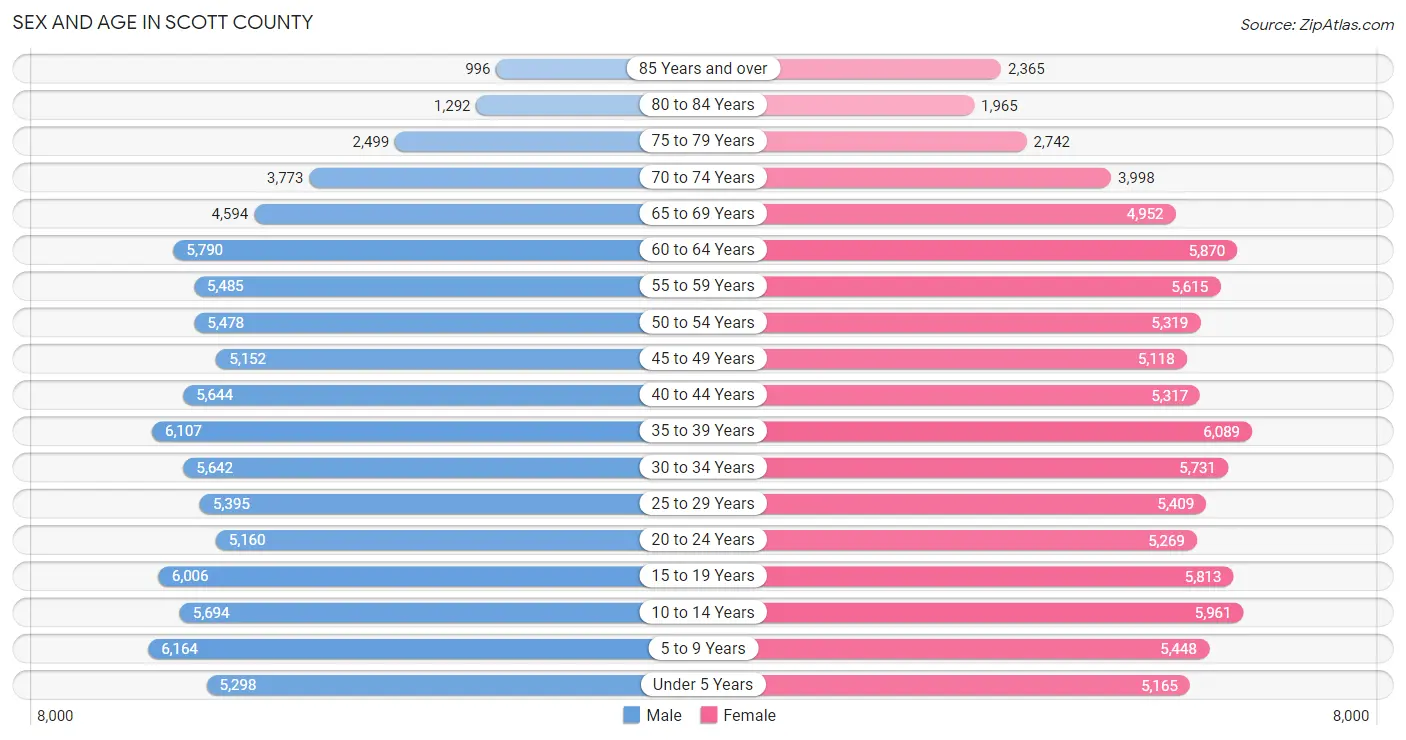
Sex and Age in Scott County
Sex and Age in Scott County
The most populous age groups in Scott County are 5 to 9 Years (6,164 | 7.1%) for men and 35 to 39 Years (6,089 | 6.9%) for women.
| Age Bracket | Male | Female |
| Under 5 Years | 5,298 (6.1%) | 5,165 (5.9%) |
| 5 to 9 Years | 6,164 (7.1%) | 5,448 (6.2%) |
| 10 to 14 Years | 5,694 (6.6%) | 5,961 (6.8%) |
| 15 to 19 Years | 6,006 (7.0%) | 5,813 (6.6%) |
| 20 to 24 Years | 5,160 (6.0%) | 5,269 (6.0%) |
| 25 to 29 Years | 5,395 (6.3%) | 5,409 (6.1%) |
| 30 to 34 Years | 5,642 (6.6%) | 5,731 (6.5%) |
| 35 to 39 Years | 6,107 (7.1%) | 6,089 (6.9%) |
| 40 to 44 Years | 5,644 (6.6%) | 5,317 (6.0%) |
| 45 to 49 Years | 5,152 (6.0%) | 5,118 (5.8%) |
| 50 to 54 Years | 5,478 (6.4%) | 5,319 (6.0%) |
| 55 to 59 Years | 5,485 (6.4%) | 5,615 (6.4%) |
| 60 to 64 Years | 5,790 (6.7%) | 5,870 (6.7%) |
| 65 to 69 Years | 4,594 (5.3%) | 4,952 (5.6%) |
| 70 to 74 Years | 3,773 (4.4%) | 3,998 (4.5%) |
| 75 to 79 Years | 2,499 (2.9%) | 2,742 (3.1%) |
| 80 to 84 Years | 1,292 (1.5%) | 1,965 (2.2%) |
| 85 Years and over | 996 (1.2%) | 2,365 (2.7%) |
| Total | 86,169 (100.0%) | 88,146 (100.0%) |
Families and Households in Scott County
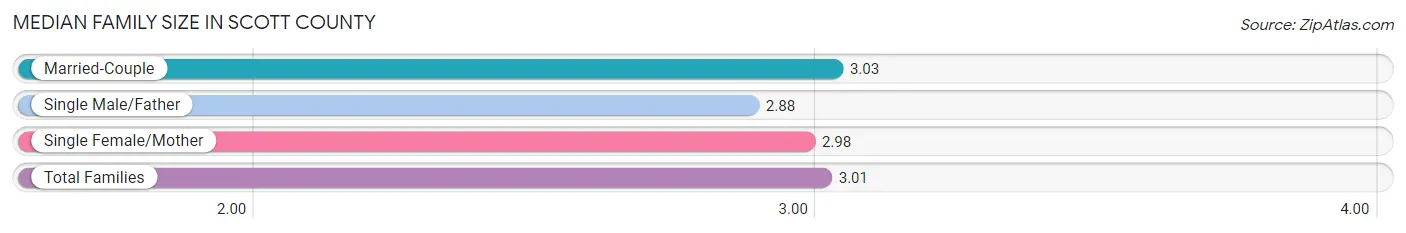
Median Family Size in Scott County
The median family size in Scott County is 3.01 persons per family, with married-couple families (33,394 | 75.4%) accounting for the largest median family size of 3.03 persons per family. On the other hand, single male/father families (2,952 | 6.7%) represent the smallest median family size with 2.88 persons per family.
| Family Type | # Families | Family Size |
| Married-Couple | 33,394 (75.4%) | 3.03 |
| Single Male/Father | 2,952 (6.7%) | 2.88 |
| Single Female/Mother | 7,952 (17.9%) | 2.98 |
| Total Families | 44,298 (100.0%) | 3.01 |
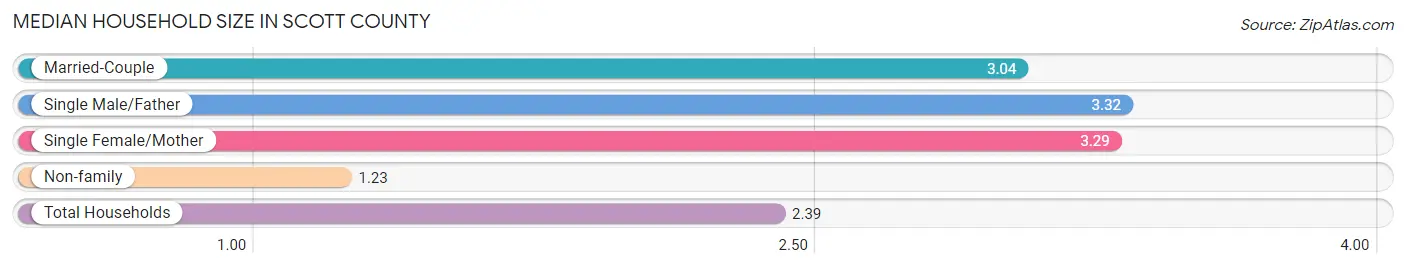
Median Household Size in Scott County
The median household size in Scott County is 2.39 persons per household, with single male/father households (2,952 | 4.1%) accounting for the largest median household size of 3.32 persons per household. non-family households (27,138 | 38.0%) represent the smallest median household size with 1.23 persons per household.
| Household Type | # Households | Household Size |
| Married-Couple | 33,394 (46.8%) | 3.04 |
| Single Male/Father | 2,952 (4.1%) | 3.32 |
| Single Female/Mother | 7,952 (11.1%) | 3.29 |
| Non-family | 27,138 (38.0%) | 1.23 |
| Total Households | 71,436 (100.0%) | 2.39 |
Household Size by Marriage Status in Scott County
Out of a total of 71,436 households in Scott County, 44,298 (62.0%) are family households, while 27,138 (38.0%) are nonfamily households. The most numerous type of family households are 2-person households, comprising 21,263, and the most common type of nonfamily households are 1-person households, comprising 21,971.
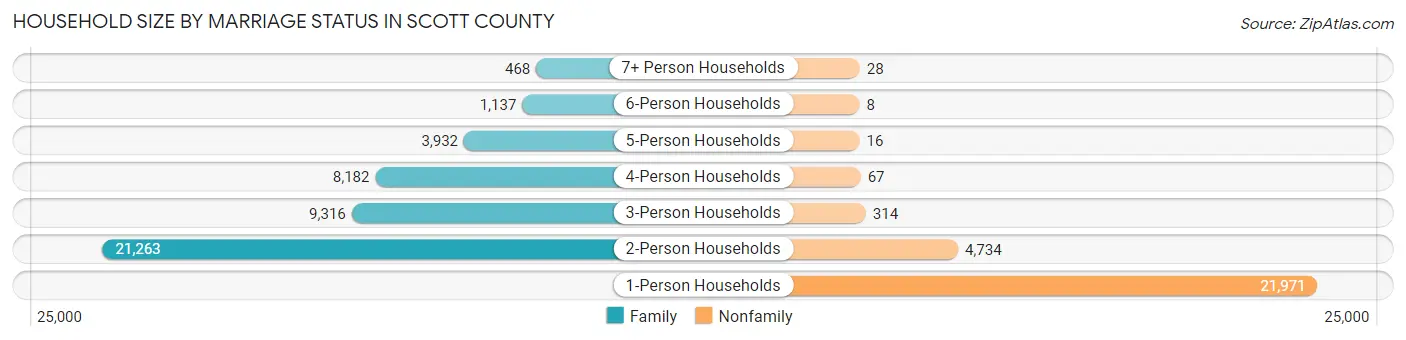
| Household Size | Family Households | Nonfamily Households |
| 1-Person Households | - | 21,971 (30.8%) |
| 2-Person Households | 21,263 (29.8%) | 4,734 (6.6%) |
| 3-Person Households | 9,316 (13.0%) | 314 (0.4%) |
| 4-Person Households | 8,182 (11.5%) | 67 (0.1%) |
| 5-Person Households | 3,932 (5.5%) | 16 (0.0%) |
| 6-Person Households | 1,137 (1.6%) | 8 (0.0%) |
| 7+ Person Households | 468 (0.7%) | 28 (0.0%) |
| Total | 44,298 (62.0%) | 27,138 (38.0%) |
Female Fertility in Scott County
Fertility by Age in Scott County
Average fertility rate in Scott County is 47.0 births per 1,000 women. Women in the age bracket of 20 to 34 years have the highest fertility rate with 94.0 births per 1,000 women. Women in the age bracket of 20 to 34 years acount for 82.6% of all women with births.
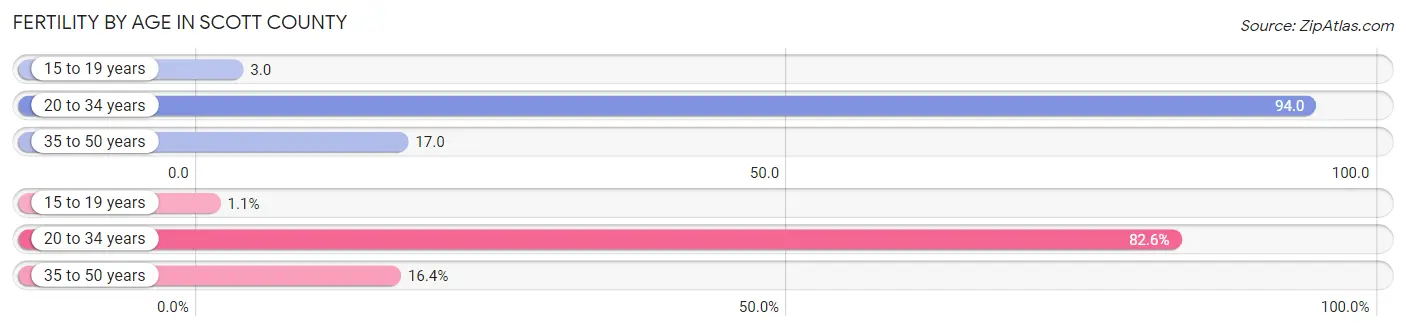
| Age Bracket | Women with Births | Births / 1,000 Women |
| 15 to 19 years | 20 (1.1%) | 3.0 |
| 20 to 34 years | 1,538 (82.6%) | 94.0 |
| 35 to 50 years | 305 (16.4%) | 17.0 |
| Total | 1,863 (100.0%) | 47.0 |
Fertility by Age by Marriage Status in Scott County
65.8% of women with births (1,863) in Scott County are married. The highest percentage of unmarried women with births falls into 15 to 19 years age bracket with 100.0% of them unmarried at the time of birth, while the lowest percentage of unmarried women with births belong to 35 to 50 years age bracket with 16.7% of them unmarried.
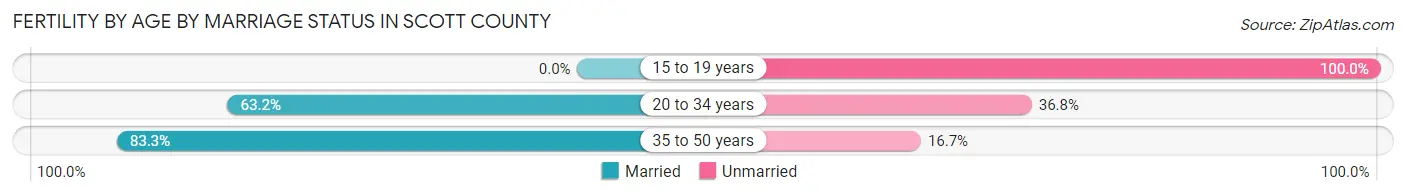
| Age Bracket | Married | Unmarried |
| 15 to 19 years | 0 (0.0%) | 20 (100.0%) |
| 20 to 34 years | 972 (63.2%) | 566 (36.8%) |
| 35 to 50 years | 254 (83.3%) | 51 (16.7%) |
| Total | 1,226 (65.8%) | 637 (34.2%) |
Fertility by Education in Scott County
Average fertility rate in Scott County is 47.0 births per 1,000 women. Women with the education attainment of graduate degree have the highest fertility rate of 73.0 births per 1,000 women, while women with the education attainment of less than high school have the lowest fertility at 21.0 births per 1,000 women. Women with the education attainment of college or associate's degree represent 31.7% of all women with births.
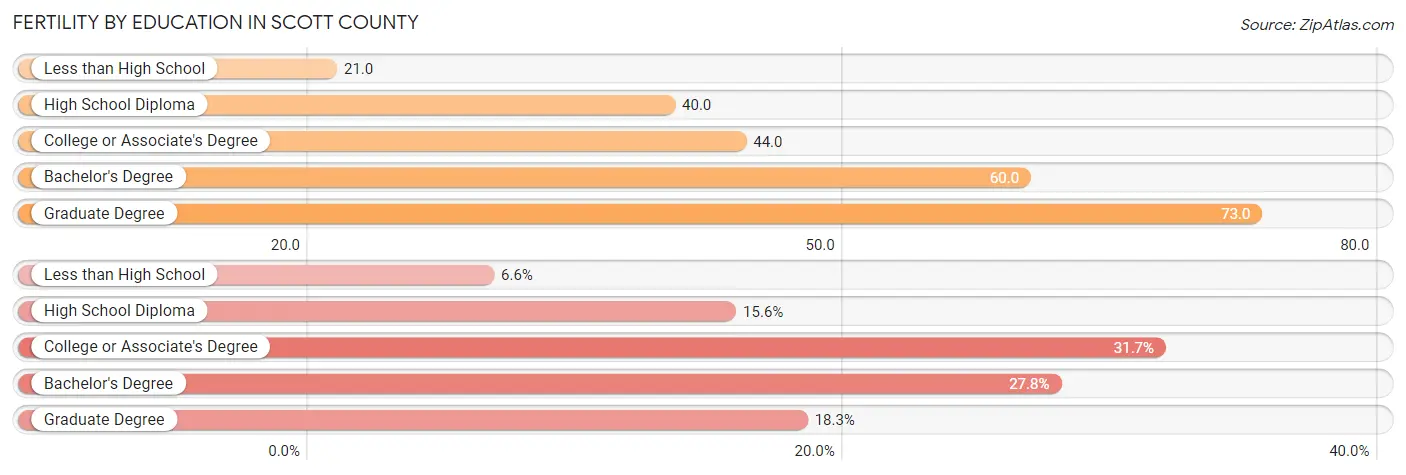
| Educational Attainment | Women with Births | Births / 1,000 Women |
| Less than High School | 122 (6.6%) | 21.0 |
| High School Diploma | 291 (15.6%) | 40.0 |
| College or Associate's Degree | 591 (31.7%) | 44.0 |
| Bachelor's Degree | 518 (27.8%) | 60.0 |
| Graduate Degree | 341 (18.3%) | 73.0 |
| Total | 1,863 (100.0%) | 47.0 |
Fertility by Education by Marriage Status in Scott County
34.2% of women with births in Scott County are unmarried. Women with the educational attainment of bachelor's degree are most likely to be married with 93.8% of them married at childbirth, while women with the educational attainment of high school diploma are least likely to be married with 78.7% of them unmarried at childbirth.
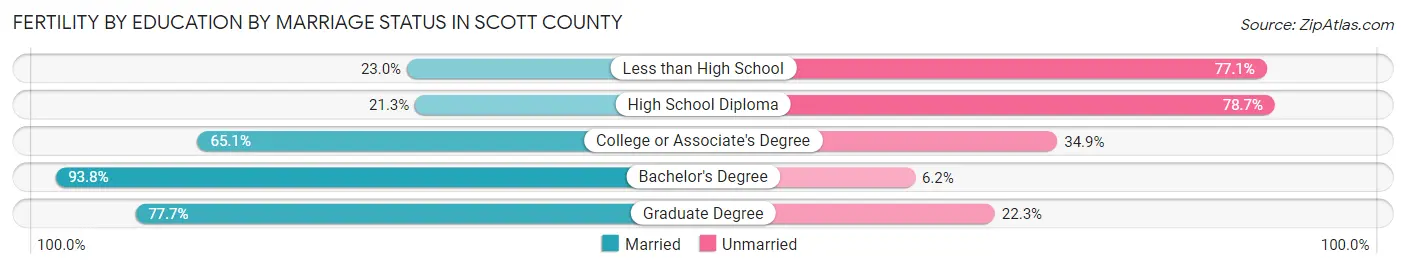
| Educational Attainment | Married | Unmarried |
| Less than High School | 28 (23.0%) | 94 (77.0%) |
| High School Diploma | 62 (21.3%) | 229 (78.7%) |
| College or Associate's Degree | 385 (65.1%) | 206 (34.9%) |
| Bachelor's Degree | 486 (93.8%) | 32 (6.2%) |
| Graduate Degree | 265 (77.7%) | 76 (22.3%) |
| Total | 1,226 (65.8%) | 637 (34.2%) |
Employment Characteristics in Scott County
Employment by Class of Employer in Scott County
Among the 85,855 employed individuals in Scott County, private company employees (59,449 | 69.2%), not-for-profit organizations (7,834 | 9.1%), and local government employees (5,299 | 6.2%) make up the most common classes of employment.
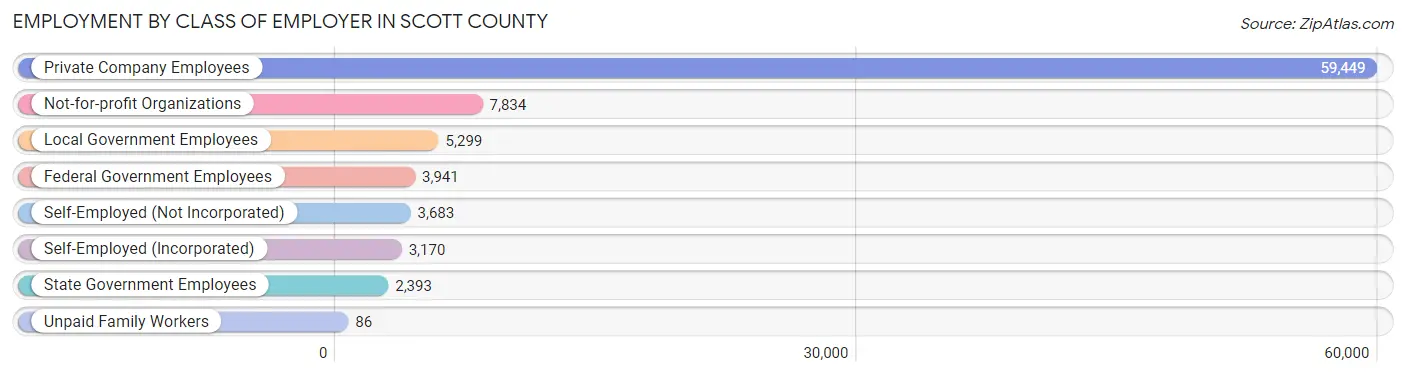
| Employer Class | # Employees | % Employees |
| Private Company Employees | 59,449 | 69.2% |
| Self-Employed (Incorporated) | 3,170 | 3.7% |
| Self-Employed (Not Incorporated) | 3,683 | 4.3% |
| Not-for-profit Organizations | 7,834 | 9.1% |
| Local Government Employees | 5,299 | 6.2% |
| State Government Employees | 2,393 | 2.8% |
| Federal Government Employees | 3,941 | 4.6% |
| Unpaid Family Workers | 86 | 0.1% |
| Total | 85,855 | 100.0% |
Employment Status by Age in Scott County
According to the labor force statistics for Scott County, out of the total population over 16 years of age (138,382), 65.9% or 91,194 individuals are in the labor force, with 4.0% or 3,648 of them unemployed. The age group with the highest labor force participation rate is 30 to 34 years, with 86.3% or 9,815 individuals in the labor force. Within the labor force, the 20 to 24 years age range has the highest percentage of unemployed individuals, with 7.5% or 634 of them being unemployed.
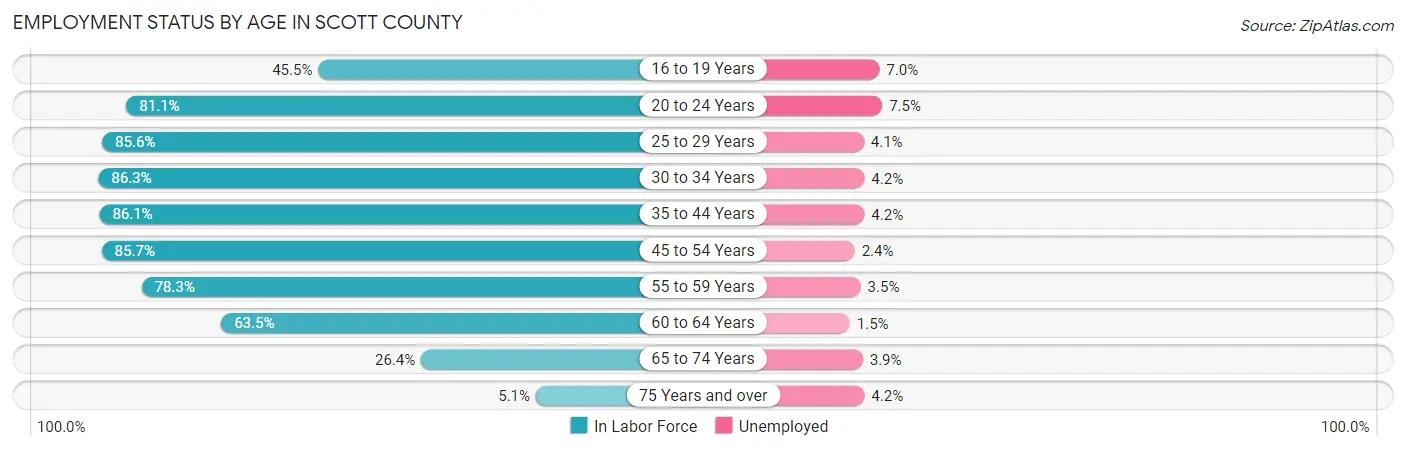
| Age Bracket | In Labor Force | Unemployed |
| 16 to 19 Years | 4,375 (45.5%) | 306 (7.0%) |
| 20 to 24 Years | 8,458 (81.1%) | 634 (7.5%) |
| 25 to 29 Years | 9,248 (85.6%) | 379 (4.1%) |
| 30 to 34 Years | 9,815 (86.3%) | 412 (4.2%) |
| 35 to 44 Years | 19,938 (86.1%) | 837 (4.2%) |
| 45 to 54 Years | 18,054 (85.7%) | 433 (2.4%) |
| 55 to 59 Years | 8,691 (78.3%) | 304 (3.5%) |
| 60 to 64 Years | 7,404 (63.5%) | 111 (1.5%) |
| 65 to 74 Years | 4,572 (26.4%) | 178 (3.9%) |
| 75 Years and over | 605 (5.1%) | 25 (4.2%) |
| Total | 91,194 (65.9%) | 3,648 (4.0%) |
Employment Status by Educational Attainment in Scott County
According to labor force statistics for Scott County, 82.1% of individuals (73,201) out of the total population between 25 and 64 years of age (89,161) are in the labor force, with 3.4% or 2,489 of them being unemployed. The group with the highest labor force participation rate are those with the educational attainment of bachelor's degree or higher, with 88.5% or 29,009 individuals in the labor force. Within the labor force, individuals with high school diploma education have the highest percentage of unemployment, with 6.5% or 1,096 of them being unemployed.
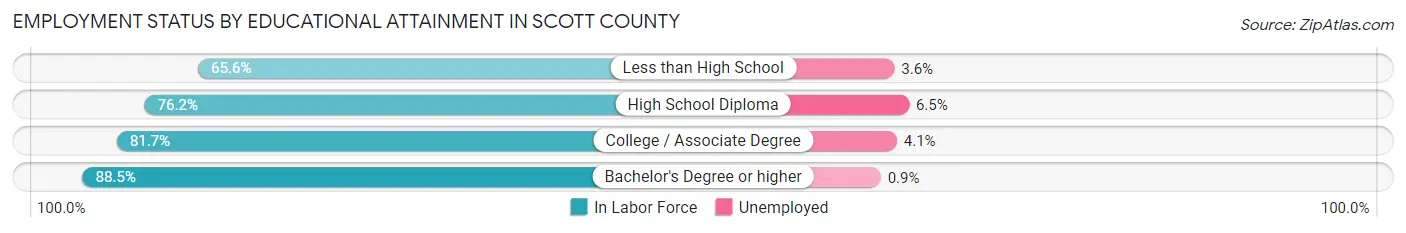
| Educational Attainment | In Labor Force | Unemployed |
| Less than High School | 2,959 (65.6%) | 162 (3.6%) |
| High School Diploma | 16,865 (76.2%) | 1,439 (6.5%) |
| College / Associate Degree | 24,298 (81.7%) | 1,219 (4.1%) |
| Bachelor's Degree or higher | 29,009 (88.5%) | 295 (0.9%) |
| Total | 73,201 (82.1%) | 3,031 (3.4%) |
Employment Occupations by Sex in Scott County
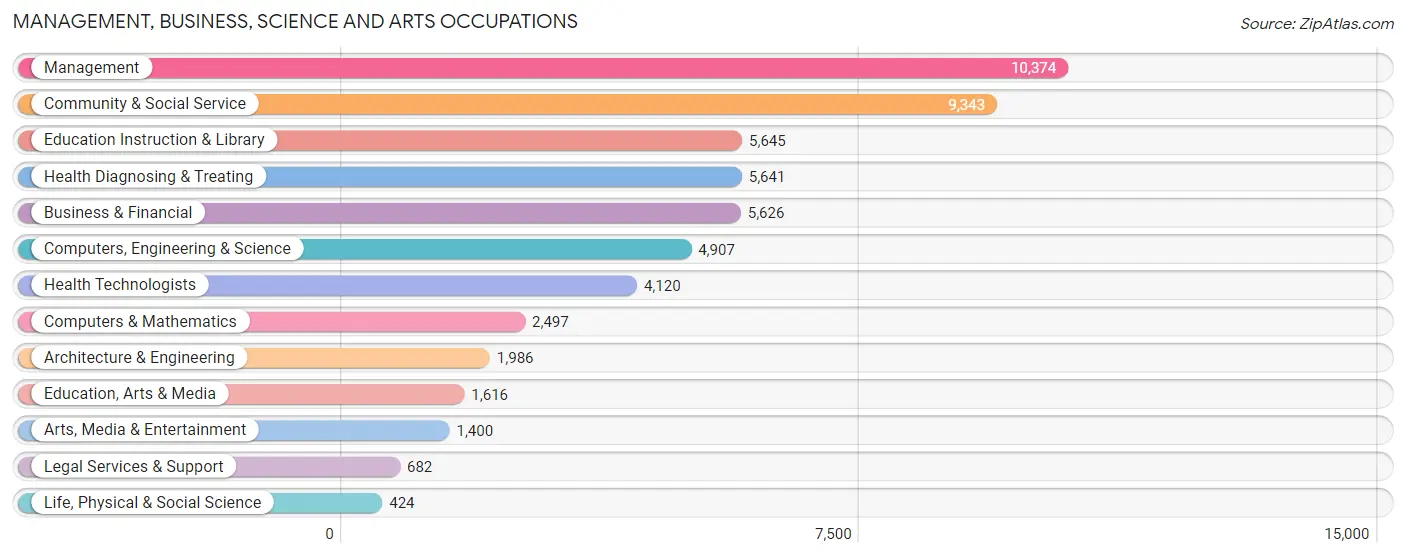
Management, Business, Science and Arts Occupations
The most common Management, Business, Science and Arts occupations in Scott County are Management (10,374 | 11.9%), Community & Social Service (9,343 | 10.7%), Education Instruction & Library (5,645 | 6.5%), Health Diagnosing & Treating (5,641 | 6.5%), and Business & Financial (5,626 | 6.4%).
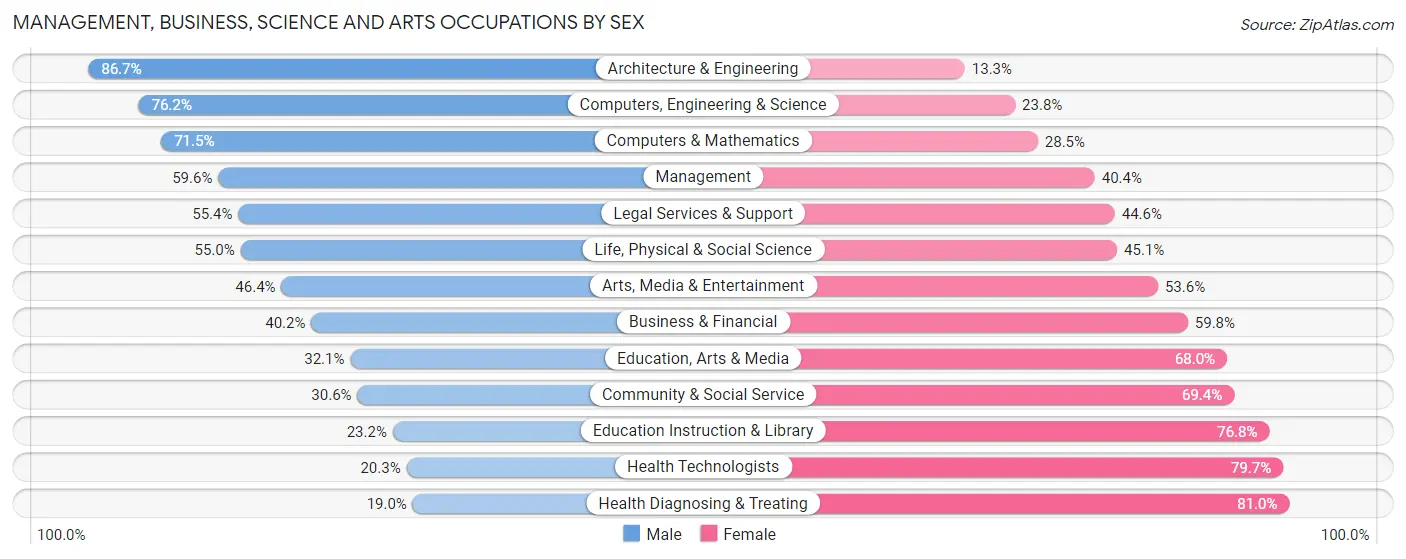
Management, Business, Science and Arts Occupations by Sex
Within the Management, Business, Science and Arts occupations in Scott County, the most male-oriented occupations are Architecture & Engineering (86.7%), Computers, Engineering & Science (76.2%), and Computers & Mathematics (71.5%), while the most female-oriented occupations are Health Diagnosing & Treating (81.0%), Health Technologists (79.7%), and Education Instruction & Library (76.8%).
| Occupation | Male | Female |
| Management | 6,184 (59.6%) | 4,190 (40.4%) |
| Business & Financial | 2,261 (40.2%) | 3,365 (59.8%) |
| Computers, Engineering & Science | 3,740 (76.2%) | 1,167 (23.8%) |
| Computers & Mathematics | 1,785 (71.5%) | 712 (28.5%) |
| Architecture & Engineering | 1,722 (86.7%) | 264 (13.3%) |
| Life, Physical & Social Science | 233 (54.9%) | 191 (45.1%) |
| Community & Social Service | 2,856 (30.6%) | 6,487 (69.4%) |
| Education, Arts & Media | 518 (32.1%) | 1,098 (67.9%) |
| Legal Services & Support | 378 (55.4%) | 304 (44.6%) |
| Education Instruction & Library | 1,310 (23.2%) | 4,335 (76.8%) |
| Arts, Media & Entertainment | 650 (46.4%) | 750 (53.6%) |
| Health Diagnosing & Treating | 1,074 (19.0%) | 4,567 (81.0%) |
| Health Technologists | 838 (20.3%) | 3,282 (79.7%) |
| Total (Category) | 16,115 (44.9%) | 19,776 (55.1%) |
| Total (Overall) | 45,791 (52.4%) | 41,505 (47.5%) |
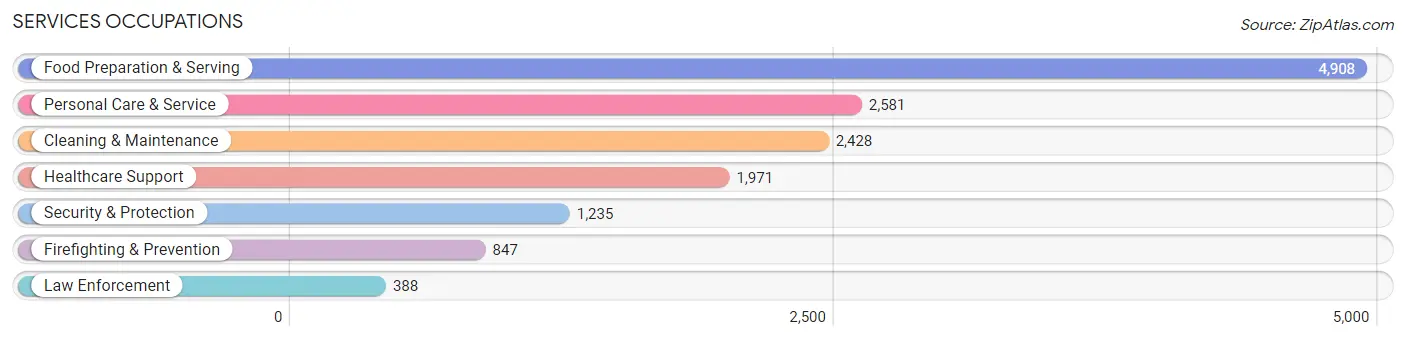
Services Occupations
The most common Services occupations in Scott County are Food Preparation & Serving (4,908 | 5.6%), Personal Care & Service (2,581 | 3.0%), Cleaning & Maintenance (2,428 | 2.8%), Healthcare Support (1,971 | 2.3%), and Security & Protection (1,235 | 1.4%).
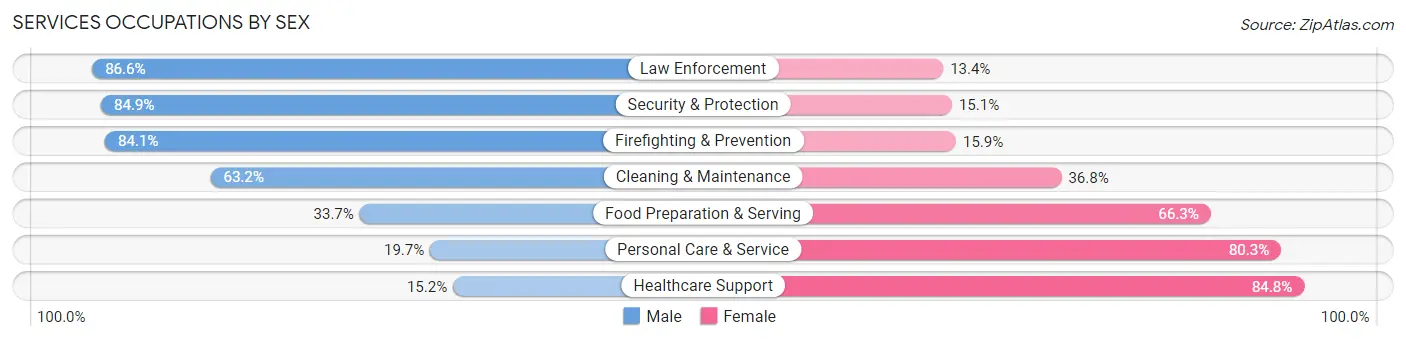
Services Occupations by Sex
Within the Services occupations in Scott County, the most male-oriented occupations are Law Enforcement (86.6%), Security & Protection (84.9%), and Firefighting & Prevention (84.1%), while the most female-oriented occupations are Healthcare Support (84.8%), Personal Care & Service (80.3%), and Food Preparation & Serving (66.3%).
| Occupation | Male | Female |
| Healthcare Support | 299 (15.2%) | 1,672 (84.8%) |
| Security & Protection | 1,048 (84.9%) | 187 (15.1%) |
| Firefighting & Prevention | 712 (84.1%) | 135 (15.9%) |
| Law Enforcement | 336 (86.6%) | 52 (13.4%) |
| Food Preparation & Serving | 1,652 (33.7%) | 3,256 (66.3%) |
| Cleaning & Maintenance | 1,534 (63.2%) | 894 (36.8%) |
| Personal Care & Service | 509 (19.7%) | 2,072 (80.3%) |
| Total (Category) | 5,042 (38.4%) | 8,081 (61.6%) |
| Total (Overall) | 45,791 (52.4%) | 41,505 (47.5%) |
Sales and Office Occupations
The most common Sales and Office occupations in Scott County are Office & Administration (9,036 | 10.3%), and Sales & Related (8,144 | 9.3%).

Sales and Office Occupations by Sex
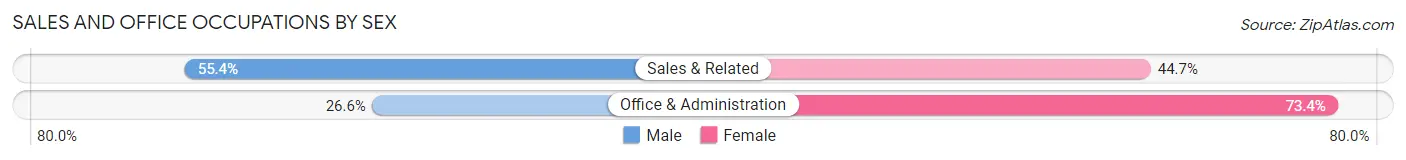
| Occupation | Male | Female |
| Sales & Related | 4,508 (55.3%) | 3,636 (44.7%) |
| Office & Administration | 2,404 (26.6%) | 6,632 (73.4%) |
| Total (Category) | 6,912 (40.2%) | 10,268 (59.8%) |
| Total (Overall) | 45,791 (52.4%) | 41,505 (47.5%) |
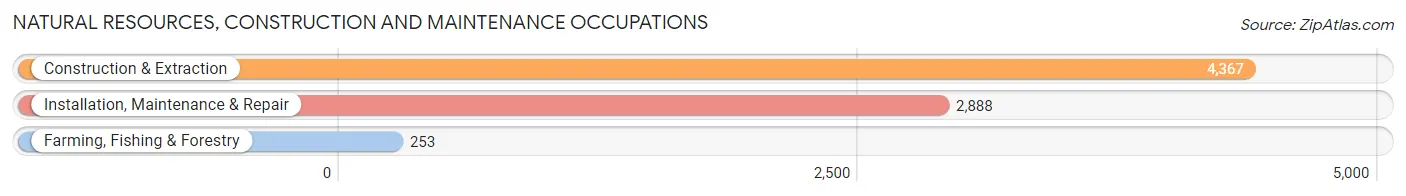
Natural Resources, Construction and Maintenance Occupations
The most common Natural Resources, Construction and Maintenance occupations in Scott County are Construction & Extraction (4,367 | 5.0%), Installation, Maintenance & Repair (2,888 | 3.3%), and Farming, Fishing & Forestry (253 | 0.3%).
Natural Resources, Construction and Maintenance Occupations by Sex
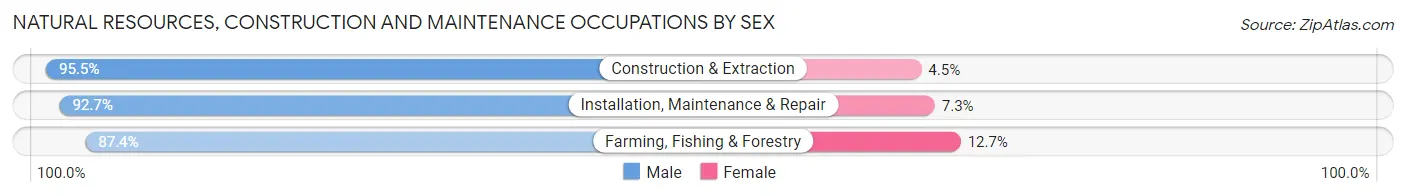
| Occupation | Male | Female |
| Farming, Fishing & Forestry | 221 (87.4%) | 32 (12.7%) |
| Construction & Extraction | 4,172 (95.5%) | 195 (4.5%) |
| Installation, Maintenance & Repair | 2,678 (92.7%) | 210 (7.3%) |
| Total (Category) | 7,071 (94.2%) | 437 (5.8%) |
| Total (Overall) | 45,791 (52.4%) | 41,505 (47.5%) |
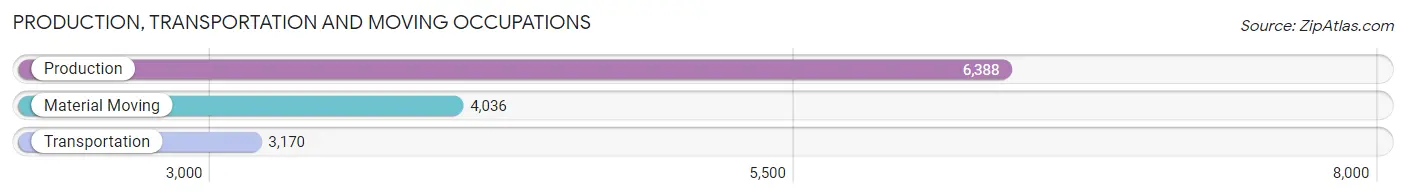
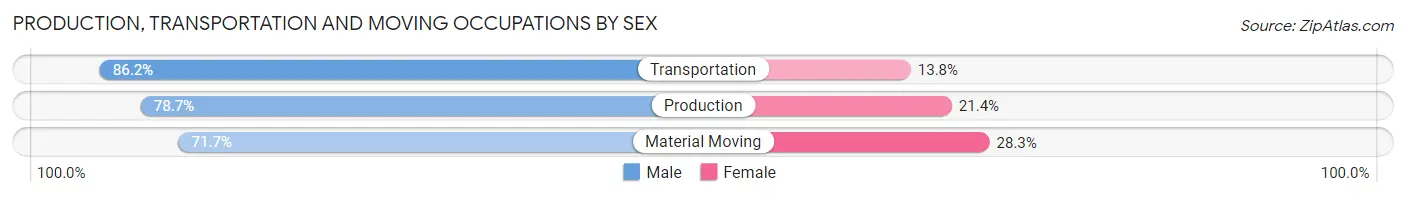
Production, Transportation and Moving Occupations
The most common Production, Transportation and Moving occupations in Scott County are Production (6,388 | 7.3%), Material Moving (4,036 | 4.6%), and Transportation (3,170 | 3.6%).
Production, Transportation and Moving Occupations by Sex
| Occupation | Male | Female |
| Production | 5,024 (78.6%) | 1,364 (21.3%) |
| Transportation | 2,732 (86.2%) | 438 (13.8%) |
| Material Moving | 2,895 (71.7%) | 1,141 (28.3%) |
| Total (Category) | 10,651 (78.3%) | 2,943 (21.6%) |
| Total (Overall) | 45,791 (52.4%) | 41,505 (47.5%) |
Employment Industries by Sex in Scott County
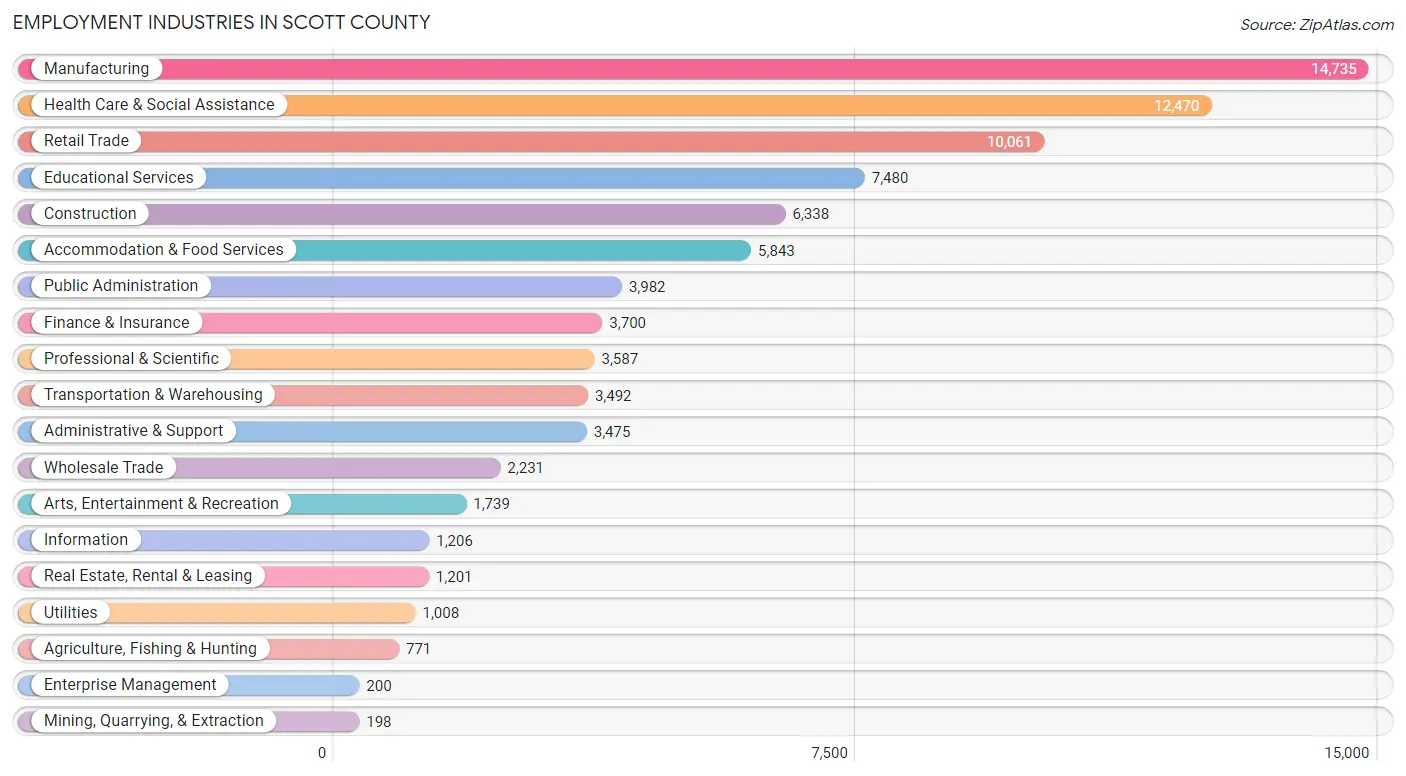
Employment Industries in Scott County
The major employment industries in Scott County include Manufacturing (14,735 | 16.9%), Health Care & Social Assistance (12,470 | 14.3%), Retail Trade (10,061 | 11.5%), Educational Services (7,480 | 8.6%), and Construction (6,338 | 7.3%).
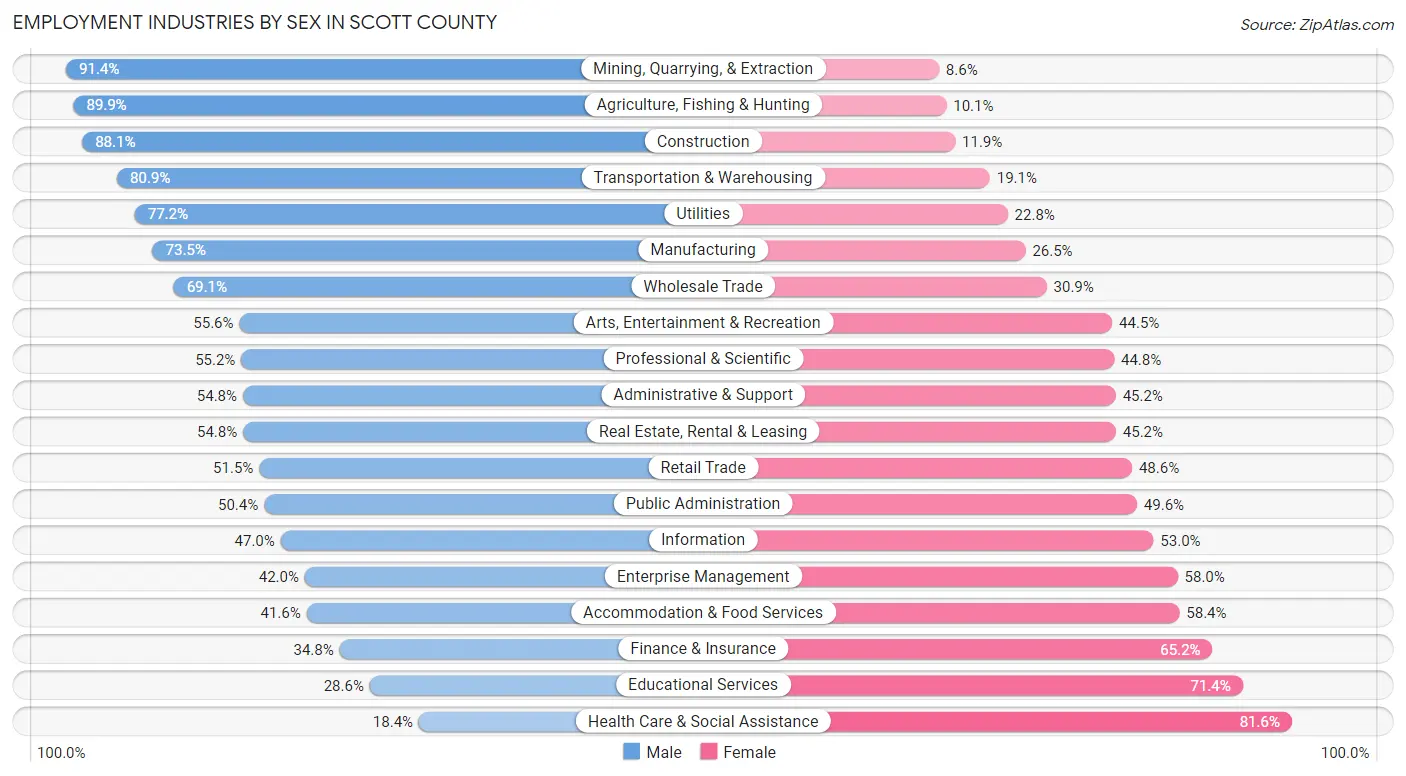
Employment Industries by Sex in Scott County
The Scott County industries that see more men than women are Mining, Quarrying, & Extraction (91.4%), Agriculture, Fishing & Hunting (89.9%), and Construction (88.1%), whereas the industries that tend to have a higher number of women are Health Care & Social Assistance (81.6%), Educational Services (71.4%), and Finance & Insurance (65.2%).
| Industry | Male | Female |
| Agriculture, Fishing & Hunting | 693 (89.9%) | 78 (10.1%) |
| Mining, Quarrying, & Extraction | 181 (91.4%) | 17 (8.6%) |
| Construction | 5,581 (88.1%) | 757 (11.9%) |
| Manufacturing | 10,830 (73.5%) | 3,905 (26.5%) |
| Wholesale Trade | 1,542 (69.1%) | 689 (30.9%) |
| Retail Trade | 5,176 (51.4%) | 4,885 (48.5%) |
| Transportation & Warehousing | 2,824 (80.9%) | 668 (19.1%) |
| Utilities | 778 (77.2%) | 230 (22.8%) |
| Information | 567 (47.0%) | 639 (53.0%) |
| Finance & Insurance | 1,288 (34.8%) | 2,412 (65.2%) |
| Real Estate, Rental & Leasing | 658 (54.8%) | 543 (45.2%) |
| Professional & Scientific | 1,979 (55.2%) | 1,608 (44.8%) |
| Enterprise Management | 84 (42.0%) | 116 (58.0%) |
| Administrative & Support | 1,905 (54.8%) | 1,570 (45.2%) |
| Educational Services | 2,136 (28.6%) | 5,344 (71.4%) |
| Health Care & Social Assistance | 2,293 (18.4%) | 10,177 (81.6%) |
| Arts, Entertainment & Recreation | 966 (55.5%) | 773 (44.5%) |
| Accommodation & Food Services | 2,433 (41.6%) | 3,410 (58.4%) |
| Public Administration | 2,008 (50.4%) | 1,974 (49.6%) |
| Total | 45,791 (52.4%) | 41,505 (47.5%) |
Education in Scott County
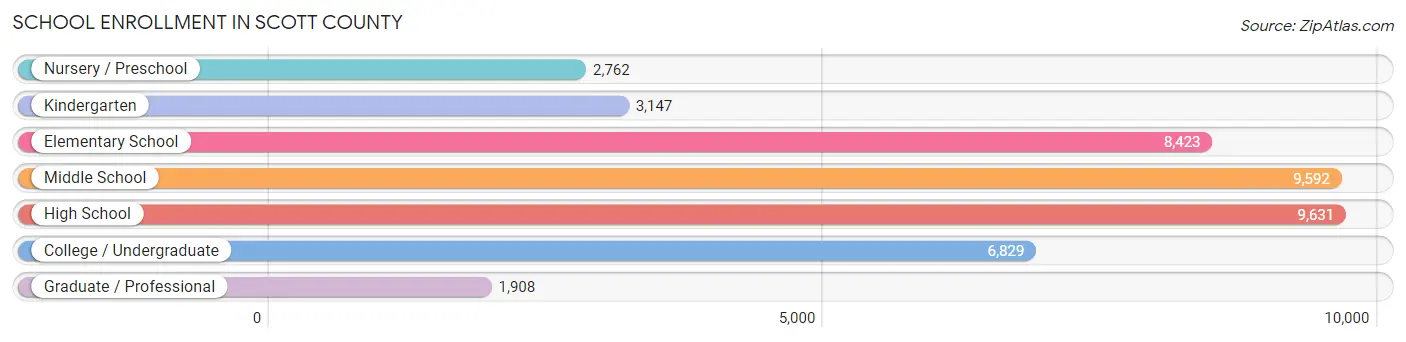
School Enrollment in Scott County
The most common levels of schooling among the 42,292 students in Scott County are high school (9,631 | 22.8%), middle school (9,592 | 22.7%), and elementary school (8,423 | 19.9%).
| School Level | # Students | % Students |
| Nursery / Preschool | 2,762 | 6.5% |
| Kindergarten | 3,147 | 7.4% |
| Elementary School | 8,423 | 19.9% |
| Middle School | 9,592 | 22.7% |
| High School | 9,631 | 22.8% |
| College / Undergraduate | 6,829 | 16.2% |
| Graduate / Professional | 1,908 | 4.5% |
| Total | 42,292 | 100.0% |
School Enrollment by Age by Funding Source in Scott County
Out of a total of 42,292 students who are enrolled in schools in Scott County, 7,147 (16.9%) attend a private institution, while the remaining 35,145 (83.1%) are enrolled in public schools. The age group of 20 to 24 year olds has the highest likelihood of being enrolled in private schools, with 1,609 (44.9% in the age bracket) enrolled. Conversely, the age group of 10 to 14 year olds has the lowest likelihood of being enrolled in a private school, with 10,686 (92.6% in the age bracket) attending a public institution.
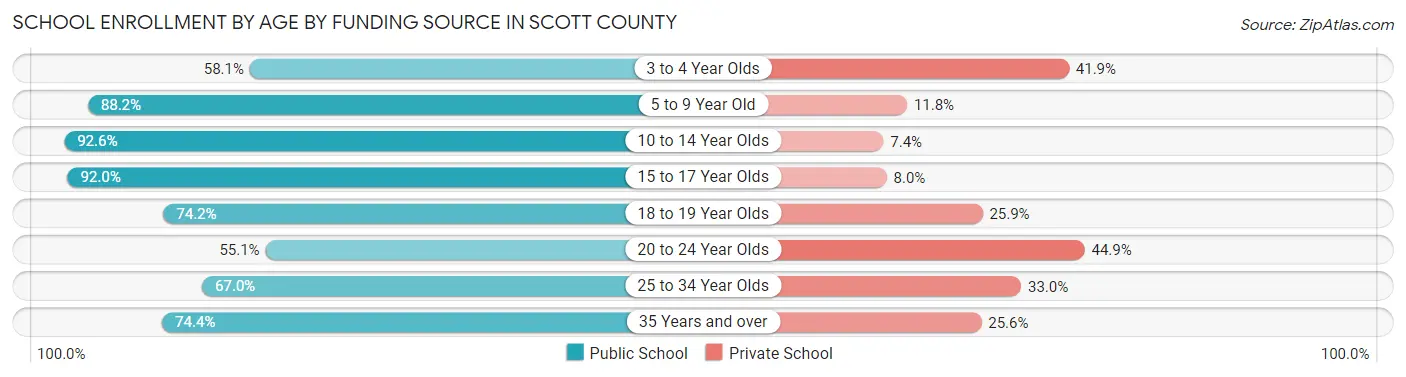
| Age Bracket | Public School | Private School |
| 3 to 4 Year Olds | 1,218 (58.1%) | 880 (41.9%) |
| 5 to 9 Year Old | 9,910 (88.2%) | 1,325 (11.8%) |
| 10 to 14 Year Olds | 10,686 (92.6%) | 853 (7.4%) |
| 15 to 17 Year Olds | 6,405 (92.0%) | 556 (8.0%) |
| 18 to 19 Year Olds | 2,456 (74.2%) | 856 (25.9%) |
| 20 to 24 Year Olds | 1,978 (55.1%) | 1,609 (44.9%) |
| 25 to 34 Year Olds | 1,352 (67.0%) | 667 (33.0%) |
| 35 Years and over | 1,146 (74.4%) | 395 (25.6%) |
| Total | 35,145 (83.1%) | 7,147 (16.9%) |
Educational Attainment by Field of Study in Scott County
Business (9,479 | 21.0%), education (6,908 | 15.3%), science & technology (4,446 | 9.9%), engineering (4,219 | 9.3%), and arts & humanities (2,894 | 6.4%) are the most common fields of study among 45,136 individuals in Scott County who have obtained a bachelor's degree or higher.
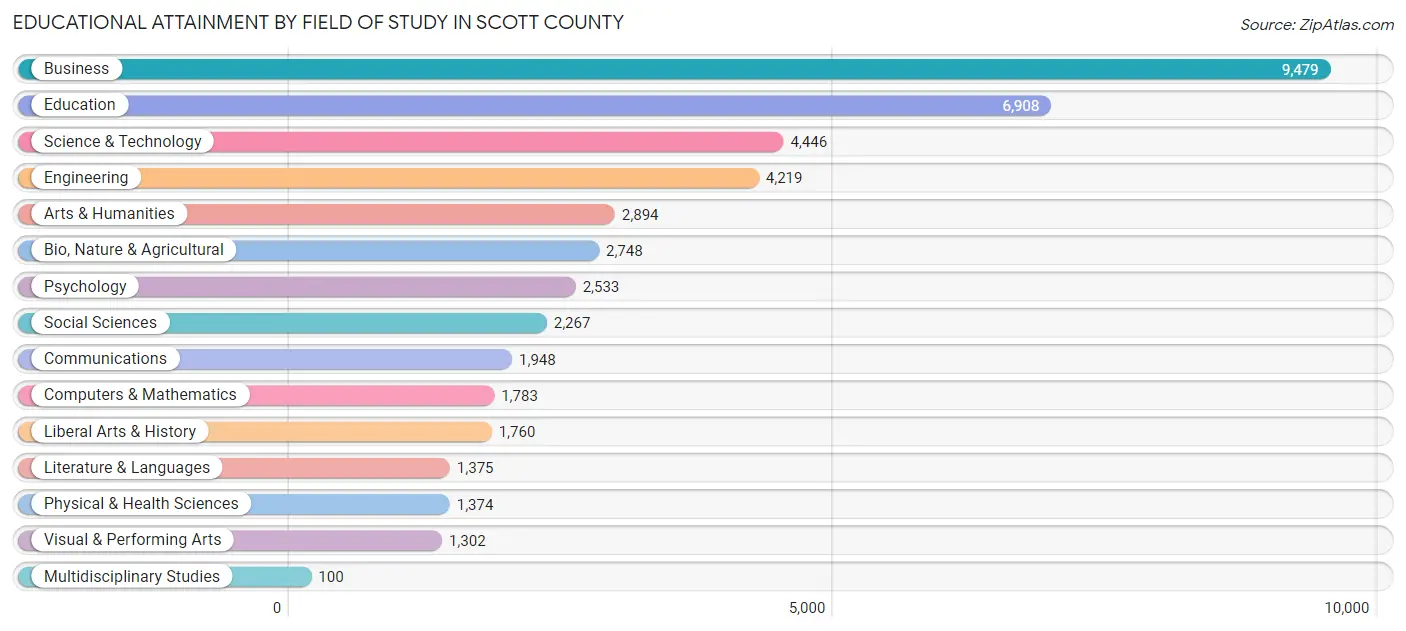
| Field of Study | # Graduates | % Graduates |
| Computers & Mathematics | 1,783 | 4.0% |
| Bio, Nature & Agricultural | 2,748 | 6.1% |
| Physical & Health Sciences | 1,374 | 3.0% |
| Psychology | 2,533 | 5.6% |
| Social Sciences | 2,267 | 5.0% |
| Engineering | 4,219 | 9.3% |
| Multidisciplinary Studies | 100 | 0.2% |
| Science & Technology | 4,446 | 9.9% |
| Business | 9,479 | 21.0% |
| Education | 6,908 | 15.3% |
| Literature & Languages | 1,375 | 3.0% |
| Liberal Arts & History | 1,760 | 3.9% |
| Visual & Performing Arts | 1,302 | 2.9% |
| Communications | 1,948 | 4.3% |
| Arts & Humanities | 2,894 | 6.4% |
| Total | 45,136 | 100.0% |
Transportation & Commute in Scott County
Vehicle Availability by Sex in Scott County
The most prevalent vehicle ownership categories in Scott County are males with 2 vehicles (20,343, accounting for 45.5%) and females with 2 vehicles (17,502, making up 50.6%).
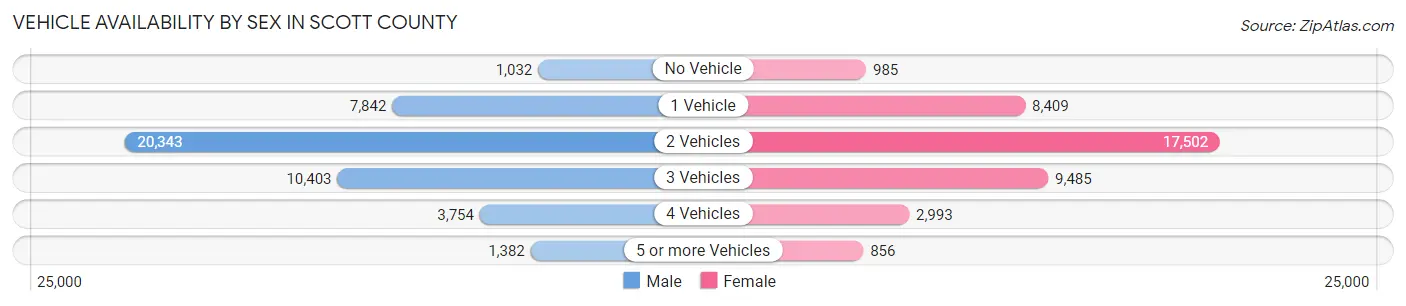
| Vehicles Available | Male | Female |
| No Vehicle | 1,032 (2.3%) | 985 (2.5%) |
| 1 Vehicle | 7,842 (17.5%) | 8,409 (20.9%) |
| 2 Vehicles | 20,343 (45.5%) | 17,502 (43.5%) |
| 3 Vehicles | 10,403 (23.2%) | 9,485 (23.6%) |
| 4 Vehicles | 3,754 (8.4%) | 2,993 (7.4%) |
| 5 or more Vehicles | 1,382 (3.1%) | 856 (2.1%) |
| Total | 44,756 (100.0%) | 40,230 (100.0%) |
Commute Time in Scott County
The most frequently occuring commute durations in Scott County are 15 to 19 minutes (18,226 commuters, 23.1%), 10 to 14 minutes (14,159 commuters, 18.0%), and 20 to 24 minutes (13,983 commuters, 17.7%).
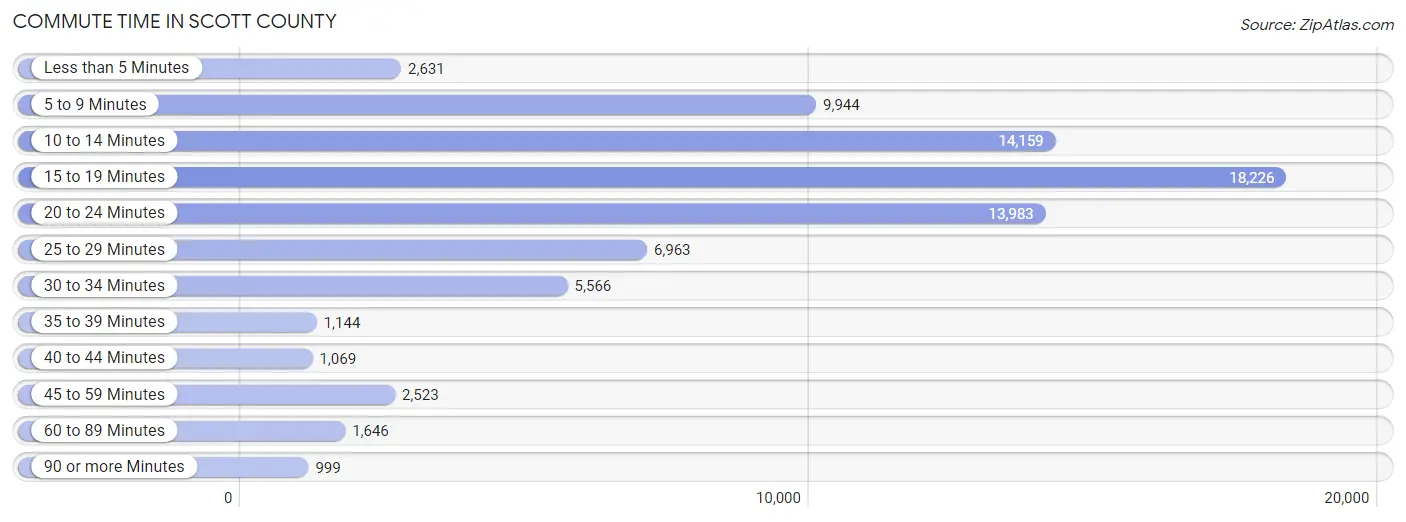
| Commute Time | # Commuters | % Commuters |
| Less than 5 Minutes | 2,631 | 3.3% |
| 5 to 9 Minutes | 9,944 | 12.6% |
| 10 to 14 Minutes | 14,159 | 18.0% |
| 15 to 19 Minutes | 18,226 | 23.1% |
| 20 to 24 Minutes | 13,983 | 17.7% |
| 25 to 29 Minutes | 6,963 | 8.8% |
| 30 to 34 Minutes | 5,566 | 7.1% |
| 35 to 39 Minutes | 1,144 | 1.5% |
| 40 to 44 Minutes | 1,069 | 1.4% |
| 45 to 59 Minutes | 2,523 | 3.2% |
| 60 to 89 Minutes | 1,646 | 2.1% |
| 90 or more Minutes | 999 | 1.3% |
Commute Time by Sex in Scott County
The most common commute times in Scott County are 15 to 19 minutes (9,327 commuters, 22.3%) for males and 15 to 19 minutes (8,899 commuters, 24.0%) for females.
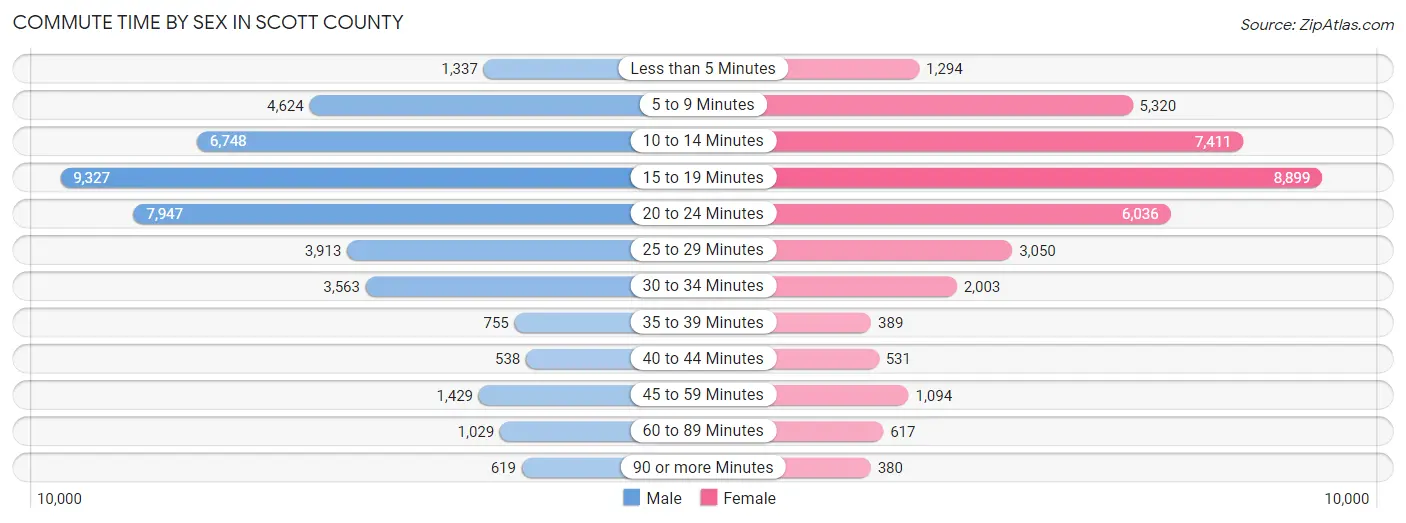
| Commute Time | Male | Female |
| Less than 5 Minutes | 1,337 (3.2%) | 1,294 (3.5%) |
| 5 to 9 Minutes | 4,624 (11.1%) | 5,320 (14.4%) |
| 10 to 14 Minutes | 6,748 (16.1%) | 7,411 (20.0%) |
| 15 to 19 Minutes | 9,327 (22.3%) | 8,899 (24.0%) |
| 20 to 24 Minutes | 7,947 (19.0%) | 6,036 (16.3%) |
| 25 to 29 Minutes | 3,913 (9.3%) | 3,050 (8.2%) |
| 30 to 34 Minutes | 3,563 (8.5%) | 2,003 (5.4%) |
| 35 to 39 Minutes | 755 (1.8%) | 389 (1.1%) |
| 40 to 44 Minutes | 538 (1.3%) | 531 (1.4%) |
| 45 to 59 Minutes | 1,429 (3.4%) | 1,094 (2.9%) |
| 60 to 89 Minutes | 1,029 (2.5%) | 617 (1.7%) |
| 90 or more Minutes | 619 (1.5%) | 380 (1.0%) |
Time of Departure to Work by Sex in Scott County
The most frequent times of departure to work in Scott County are 7:30 AM to 7:59 AM (5,956, 14.2%) for males and 7:30 AM to 7:59 AM (6,740, 18.2%) for females.
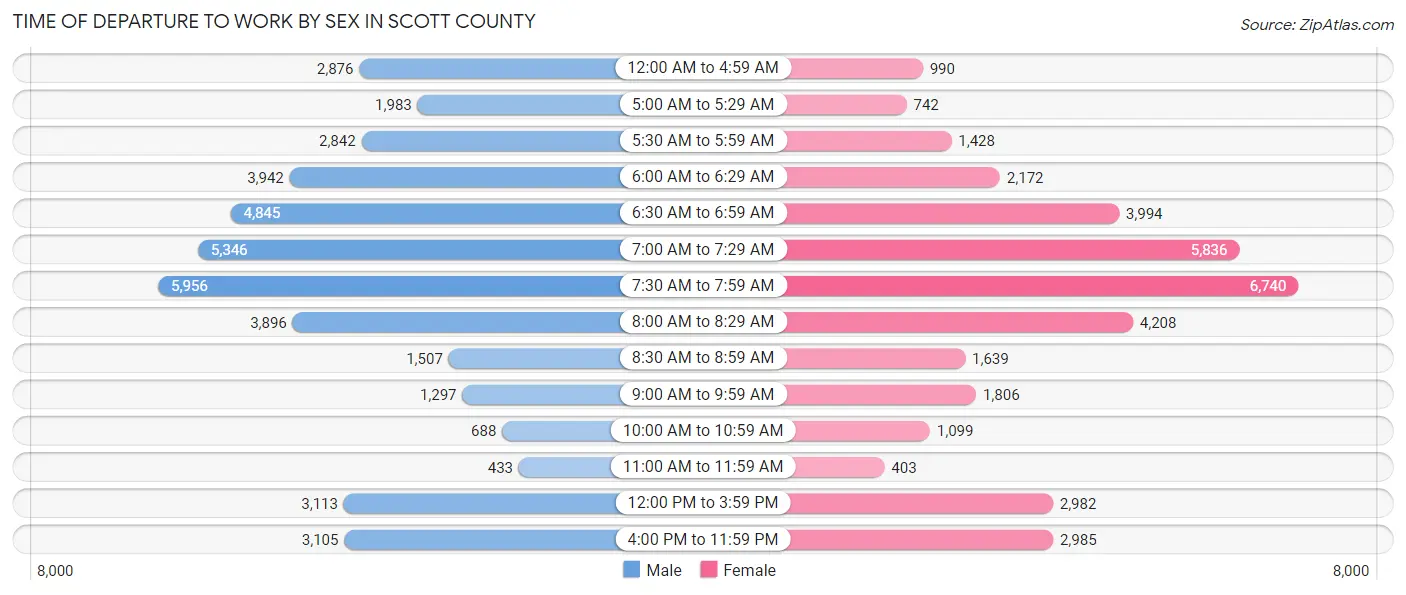
| Time of Departure | Male | Female |
| 12:00 AM to 4:59 AM | 2,876 (6.9%) | 990 (2.7%) |
| 5:00 AM to 5:29 AM | 1,983 (4.7%) | 742 (2.0%) |
| 5:30 AM to 5:59 AM | 2,842 (6.8%) | 1,428 (3.9%) |
| 6:00 AM to 6:29 AM | 3,942 (9.4%) | 2,172 (5.9%) |
| 6:30 AM to 6:59 AM | 4,845 (11.6%) | 3,994 (10.8%) |
| 7:00 AM to 7:29 AM | 5,346 (12.8%) | 5,836 (15.8%) |
| 7:30 AM to 7:59 AM | 5,956 (14.2%) | 6,740 (18.2%) |
| 8:00 AM to 8:29 AM | 3,896 (9.3%) | 4,208 (11.4%) |
| 8:30 AM to 8:59 AM | 1,507 (3.6%) | 1,639 (4.4%) |
| 9:00 AM to 9:59 AM | 1,297 (3.1%) | 1,806 (4.9%) |
| 10:00 AM to 10:59 AM | 688 (1.6%) | 1,099 (3.0%) |
| 11:00 AM to 11:59 AM | 433 (1.0%) | 403 (1.1%) |
| 12:00 PM to 3:59 PM | 3,113 (7.4%) | 2,982 (8.1%) |
| 4:00 PM to 11:59 PM | 3,105 (7.4%) | 2,985 (8.1%) |
| Total | 41,829 (100.0%) | 37,024 (100.0%) |
Housing Occupancy in Scott County
Occupancy by Ownership in Scott County
Of the total 71,436 dwellings in Scott County, owner-occupied units account for 49,363 (69.1%), while renter-occupied units make up 22,073 (30.9%).
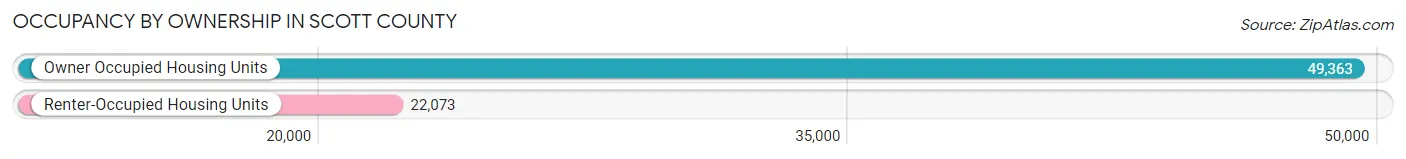
| Occupancy | # Housing Units | % Housing Units |
| Owner Occupied Housing Units | 49,363 | 69.1% |
| Renter-Occupied Housing Units | 22,073 | 30.9% |
| Total Occupied Housing Units | 71,436 | 100.0% |
Occupancy by Household Size in Scott County
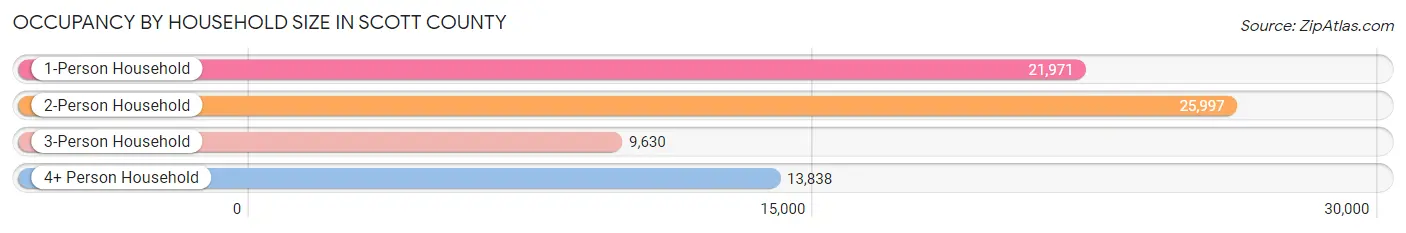
| Household Size | # Housing Units | % Housing Units |
| 1-Person Household | 21,971 | 30.8% |
| 2-Person Household | 25,997 | 36.4% |
| 3-Person Household | 9,630 | 13.5% |
| 4+ Person Household | 13,838 | 19.4% |
| Total Housing Units | 71,436 | 100.0% |
Occupancy by Ownership by Household Size in Scott County
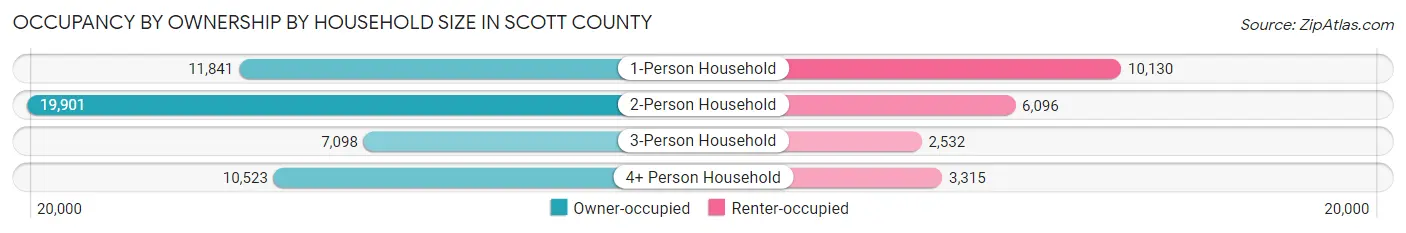
| Household Size | Owner-occupied | Renter-occupied |
| 1-Person Household | 11,841 (53.9%) | 10,130 (46.1%) |
| 2-Person Household | 19,901 (76.5%) | 6,096 (23.4%) |
| 3-Person Household | 7,098 (73.7%) | 2,532 (26.3%) |
| 4+ Person Household | 10,523 (76.0%) | 3,315 (24.0%) |
| Total Housing Units | 49,363 (69.1%) | 22,073 (30.9%) |
Occupancy by Educational Attainment in Scott County
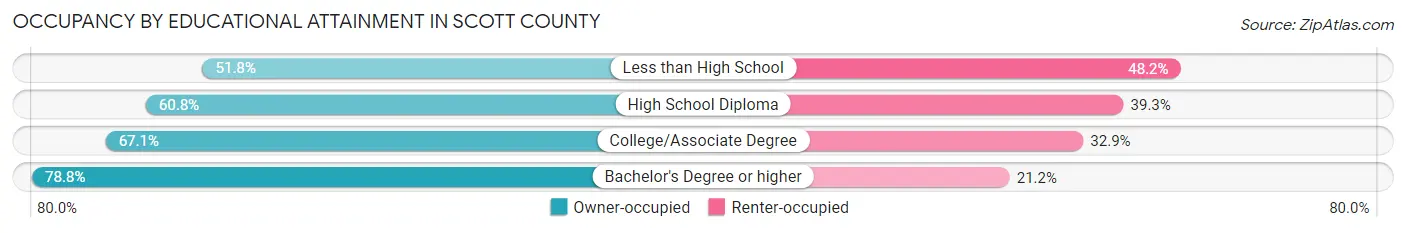
| Household Size | Owner-occupied | Renter-occupied |
| Less than High School | 1,956 (51.8%) | 1,823 (48.2%) |
| High School Diploma | 10,088 (60.8%) | 6,518 (39.3%) |
| College/Associate Degree | 16,744 (67.1%) | 8,198 (32.9%) |
| Bachelor's Degree or higher | 20,575 (78.8%) | 5,534 (21.2%) |
Occupancy by Age of Householder in Scott County
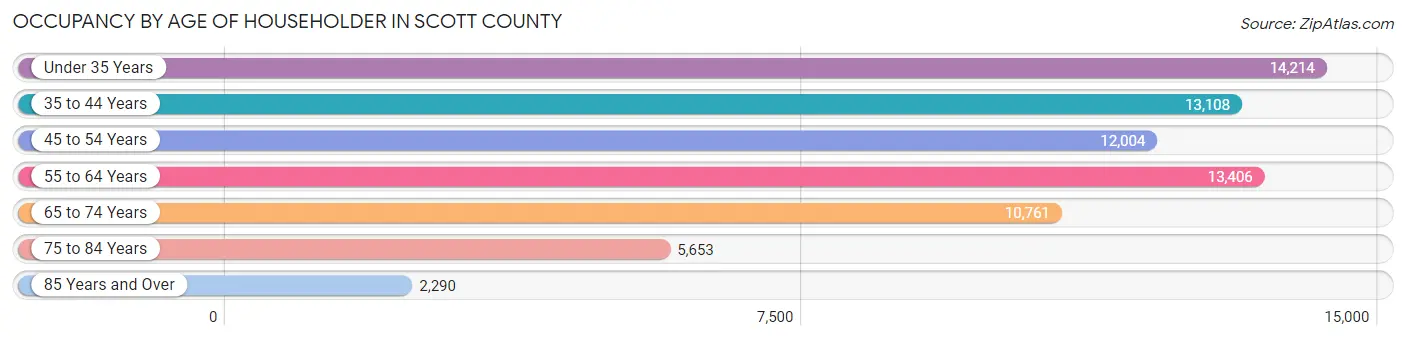
| Age Bracket | # Households | % Households |
| Under 35 Years | 14,214 | 19.9% |
| 35 to 44 Years | 13,108 | 18.3% |
| 45 to 54 Years | 12,004 | 16.8% |
| 55 to 64 Years | 13,406 | 18.8% |
| 65 to 74 Years | 10,761 | 15.1% |
| 75 to 84 Years | 5,653 | 7.9% |
| 85 Years and Over | 2,290 | 3.2% |
| Total | 71,436 | 100.0% |
Housing Finances in Scott County
Median Income by Occupancy in Scott County
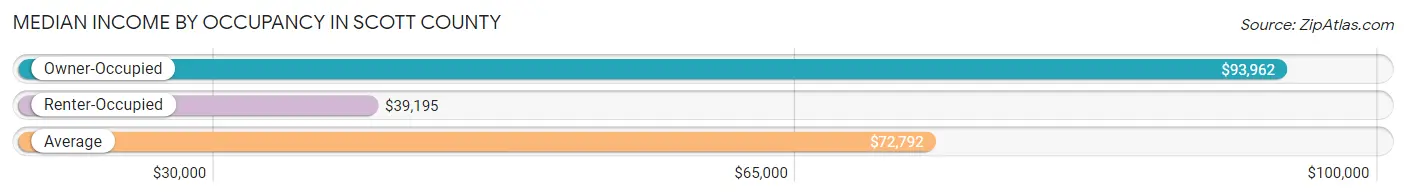
| Occupancy Type | # Households | Median Income |
| Owner-Occupied | 49,363 (69.1%) | $93,962 |
| Renter-Occupied | 22,073 (30.9%) | $39,195 |
| Average | 71,436 (100.0%) | $72,792 |
Occupancy by Householder Income Bracket in Scott County
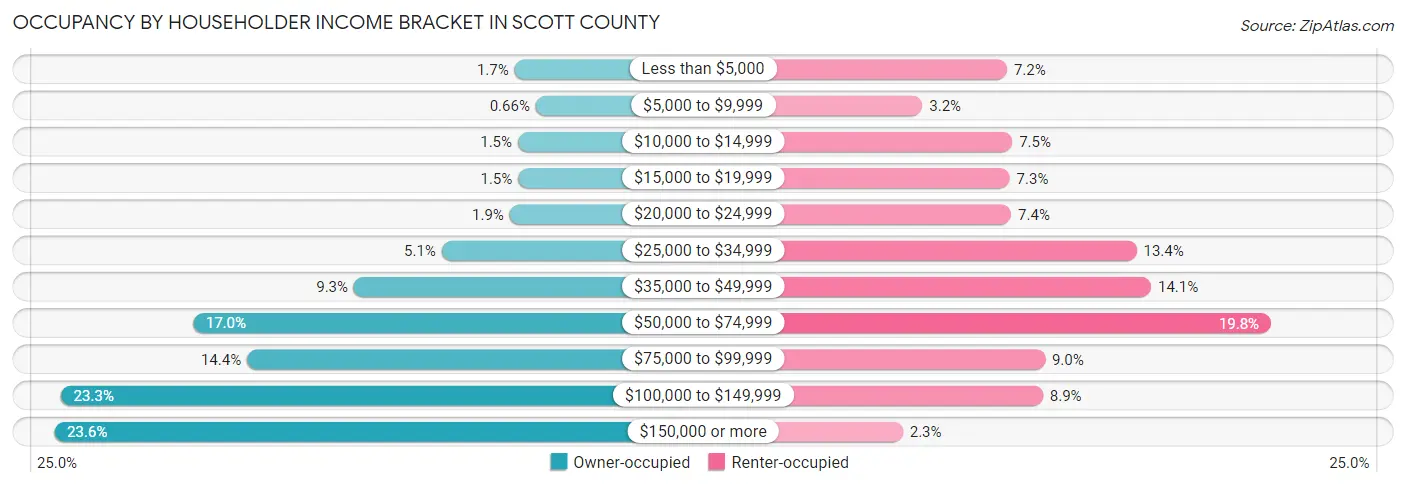
| Income Bracket | Owner-occupied | Renter-occupied |
| Less than $5,000 | 823 (1.7%) | 1,591 (7.2%) |
| $5,000 to $9,999 | 326 (0.7%) | 701 (3.2%) |
| $10,000 to $14,999 | 746 (1.5%) | 1,647 (7.5%) |
| $15,000 to $19,999 | 738 (1.5%) | 1,620 (7.3%) |
| $20,000 to $24,999 | 939 (1.9%) | 1,635 (7.4%) |
| $25,000 to $34,999 | 2,539 (5.1%) | 2,953 (13.4%) |
| $35,000 to $49,999 | 4,601 (9.3%) | 3,105 (14.1%) |
| $50,000 to $74,999 | 8,387 (17.0%) | 4,365 (19.8%) |
| $75,000 to $99,999 | 7,113 (14.4%) | 1,992 (9.0%) |
| $100,000 to $149,999 | 11,499 (23.3%) | 1,968 (8.9%) |
| $150,000 or more | 11,652 (23.6%) | 496 (2.2%) |
| Total | 49,363 (100.0%) | 22,073 (100.0%) |
Monthly Housing Cost Tiers in Scott County
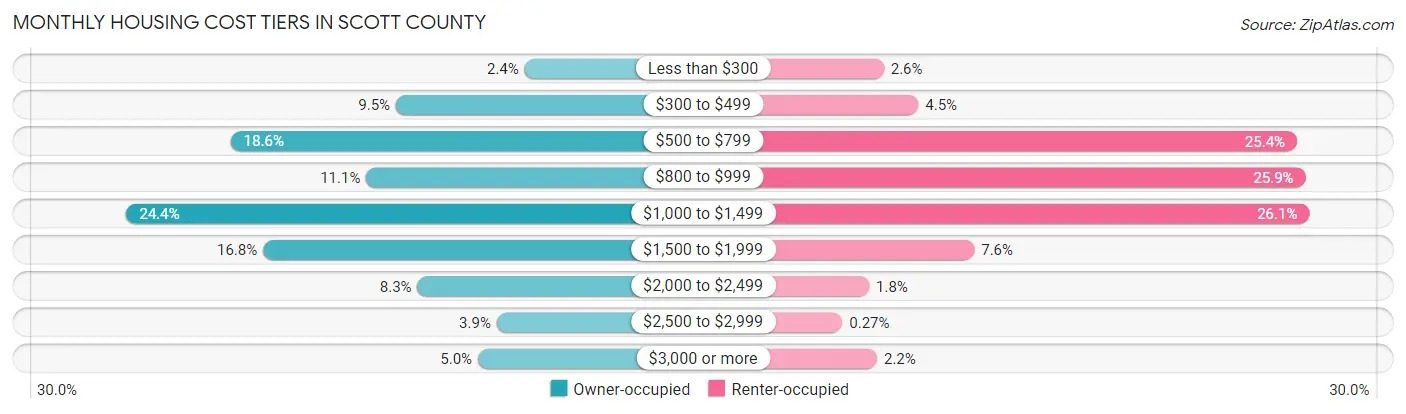
| Monthly Cost | Owner-occupied | Renter-occupied |
| Less than $300 | 1,177 (2.4%) | 566 (2.6%) |
| $300 to $499 | 4,683 (9.5%) | 987 (4.5%) |
| $500 to $799 | 9,192 (18.6%) | 5,602 (25.4%) |
| $800 to $999 | 5,492 (11.1%) | 5,705 (25.9%) |
| $1,000 to $1,499 | 12,035 (24.4%) | 5,753 (26.1%) |
| $1,500 to $1,999 | 8,306 (16.8%) | 1,668 (7.6%) |
| $2,000 to $2,499 | 4,096 (8.3%) | 387 (1.8%) |
| $2,500 to $2,999 | 1,933 (3.9%) | 59 (0.3%) |
| $3,000 or more | 2,449 (5.0%) | 484 (2.2%) |
| Total | 49,363 (100.0%) | 22,073 (100.0%) |
Physical Housing Characteristics in Scott County
Housing Structures in Scott County
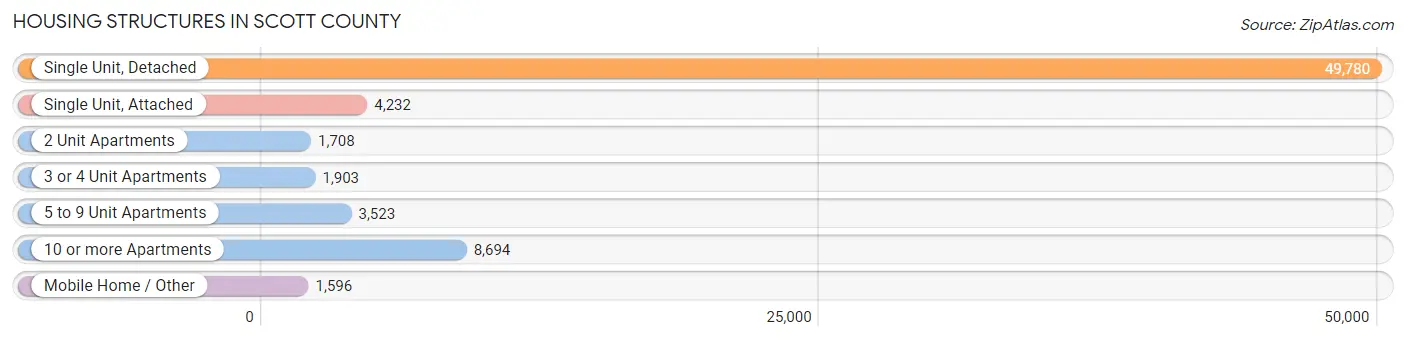
| Structure Type | # Housing Units | % Housing Units |
| Single Unit, Detached | 49,780 | 69.7% |
| Single Unit, Attached | 4,232 | 5.9% |
| 2 Unit Apartments | 1,708 | 2.4% |
| 3 or 4 Unit Apartments | 1,903 | 2.7% |
| 5 to 9 Unit Apartments | 3,523 | 4.9% |
| 10 or more Apartments | 8,694 | 12.2% |
| Mobile Home / Other | 1,596 | 2.2% |
| Total | 71,436 | 100.0% |
Housing Structures by Occupancy in Scott County
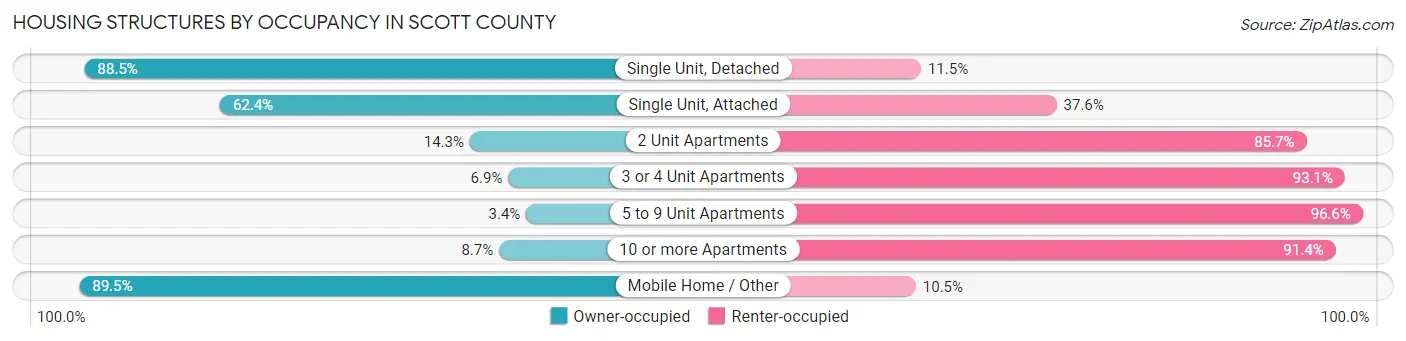
| Structure Type | Owner-occupied | Renter-occupied |
| Single Unit, Detached | 44,047 (88.5%) | 5,733 (11.5%) |
| Single Unit, Attached | 2,640 (62.4%) | 1,592 (37.6%) |
| 2 Unit Apartments | 244 (14.3%) | 1,464 (85.7%) |
| 3 or 4 Unit Apartments | 131 (6.9%) | 1,772 (93.1%) |
| 5 to 9 Unit Apartments | 121 (3.4%) | 3,402 (96.6%) |
| 10 or more Apartments | 752 (8.6%) | 7,942 (91.3%) |
| Mobile Home / Other | 1,428 (89.5%) | 168 (10.5%) |
| Total | 49,363 (69.1%) | 22,073 (30.9%) |
Housing Structures by Number of Rooms in Scott County
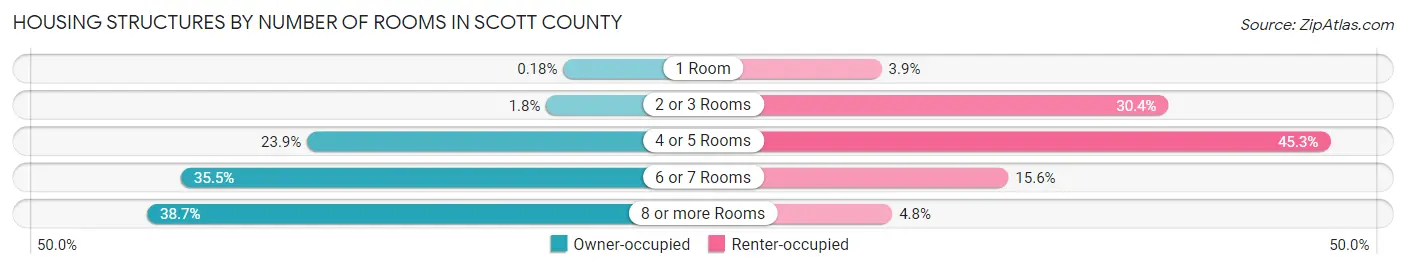
| Number of Rooms | Owner-occupied | Renter-occupied |
| 1 Room | 90 (0.2%) | 852 (3.9%) |
| 2 or 3 Rooms | 866 (1.8%) | 6,705 (30.4%) |
| 4 or 5 Rooms | 11,781 (23.9%) | 10,007 (45.3%) |
| 6 or 7 Rooms | 17,543 (35.5%) | 3,440 (15.6%) |
| 8 or more Rooms | 19,083 (38.7%) | 1,069 (4.8%) |
| Total | 49,363 (100.0%) | 22,073 (100.0%) |
Housing Structure by Heating Type in Scott County
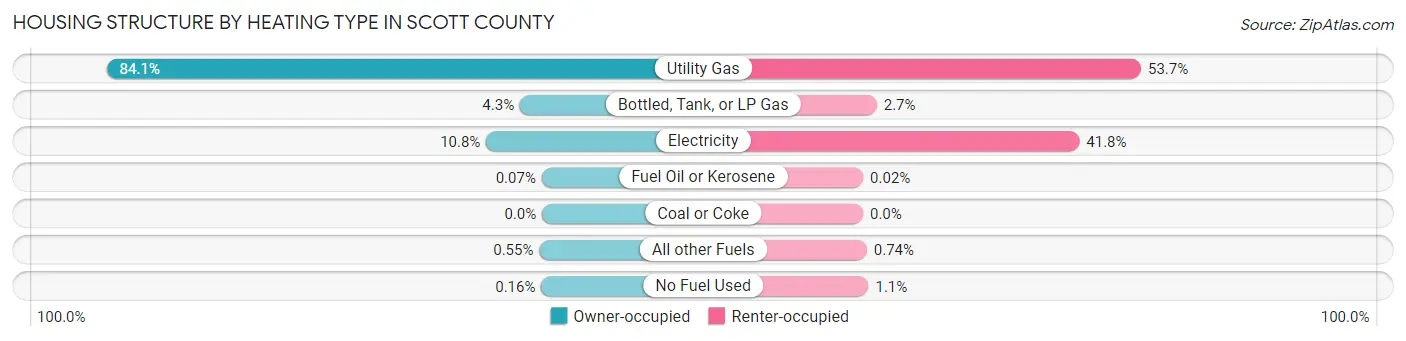
| Heating Type | Owner-occupied | Renter-occupied |
| Utility Gas | 41,536 (84.1%) | 11,858 (53.7%) |
| Bottled, Tank, or LP Gas | 2,106 (4.3%) | 587 (2.7%) |
| Electricity | 5,333 (10.8%) | 9,227 (41.8%) |
| Fuel Oil or Kerosene | 36 (0.1%) | 5 (0.0%) |
| Coal or Coke | 0 (0.0%) | 0 (0.0%) |
| All other Fuels | 272 (0.5%) | 163 (0.7%) |
| No Fuel Used | 80 (0.2%) | 233 (1.1%) |
| Total | 49,363 (100.0%) | 22,073 (100.0%) |
Household Vehicle Usage in Scott County
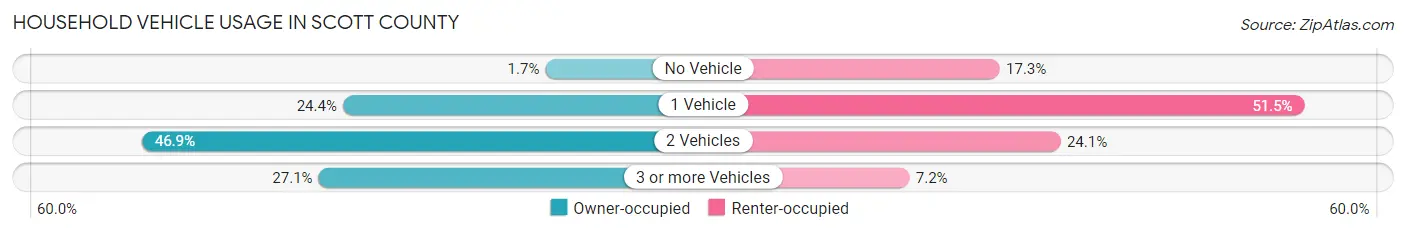
| Vehicles per Household | Owner-occupied | Renter-occupied |
| No Vehicle | 827 (1.7%) | 3,813 (17.3%) |
| 1 Vehicle | 12,026 (24.4%) | 11,362 (51.5%) |
| 2 Vehicles | 23,136 (46.9%) | 5,318 (24.1%) |
| 3 or more Vehicles | 13,374 (27.1%) | 1,580 (7.2%) |
| Total | 49,363 (100.0%) | 22,073 (100.0%) |
Real Estate & Mortgages in Scott County
Real Estate and Mortgage Overview in Scott County
| Characteristic | Without Mortgage | With Mortgage |
| Housing Units | 16,908 | 32,455 |
| Median Property Value | $182,600 | $206,500 |
| Median Household Income | $69,986 | $8,939 |
| Monthly Housing Costs | $592 | $2,428 |
| Real Estate Taxes | $3,009 | $625 |
Property Value by Mortgage Status in Scott County
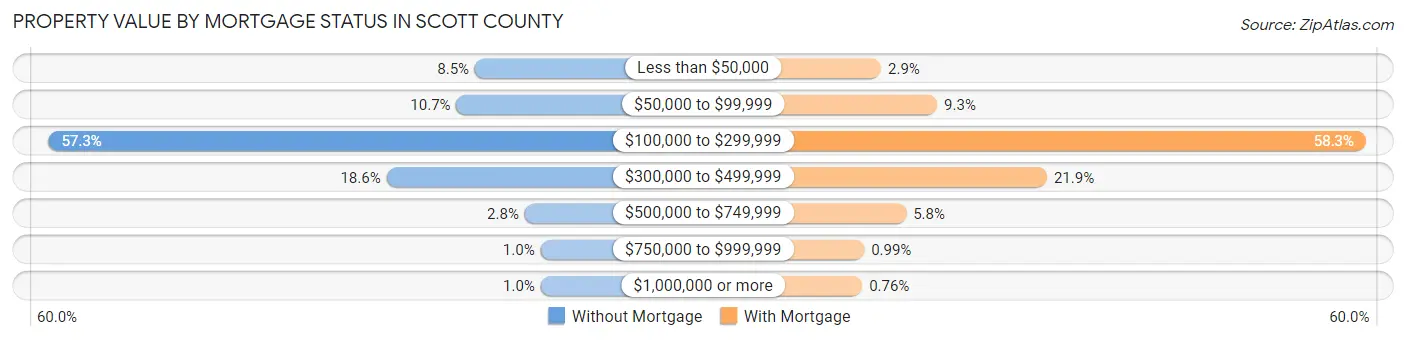
| Property Value | Without Mortgage | With Mortgage |
| Less than $50,000 | 1,443 (8.5%) | 948 (2.9%) |
| $50,000 to $99,999 | 1,801 (10.6%) | 3,029 (9.3%) |
| $100,000 to $299,999 | 9,683 (57.3%) | 18,929 (58.3%) |
| $300,000 to $499,999 | 3,152 (18.6%) | 7,102 (21.9%) |
| $500,000 to $749,999 | 480 (2.8%) | 1,878 (5.8%) |
| $750,000 to $999,999 | 176 (1.0%) | 322 (1.0%) |
| $1,000,000 or more | 173 (1.0%) | 247 (0.8%) |
| Total | 16,908 (100.0%) | 32,455 (100.0%) |
Household Income by Mortgage Status in Scott County
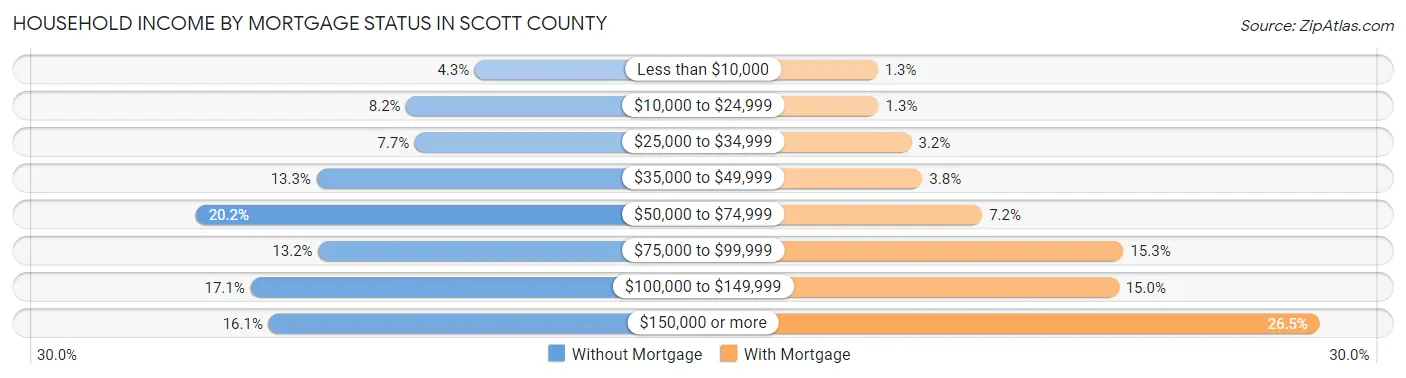
| Household Income | Without Mortgage | With Mortgage |
| Less than $10,000 | 720 (4.3%) | 411 (1.3%) |
| $10,000 to $24,999 | 1,383 (8.2%) | 429 (1.3%) |
| $25,000 to $34,999 | 1,300 (7.7%) | 1,040 (3.2%) |
| $35,000 to $49,999 | 2,251 (13.3%) | 1,239 (3.8%) |
| $50,000 to $74,999 | 3,418 (20.2%) | 2,350 (7.2%) |
| $75,000 to $99,999 | 2,233 (13.2%) | 4,969 (15.3%) |
| $100,000 to $149,999 | 2,890 (17.1%) | 4,880 (15.0%) |
| $150,000 or more | 2,713 (16.1%) | 8,609 (26.5%) |
| Total | 16,908 (100.0%) | 32,455 (100.0%) |
Property Value to Household Income Ratio in Scott County
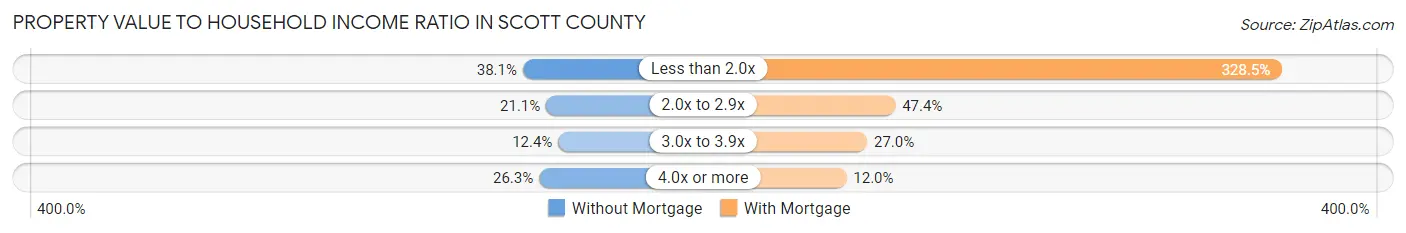
| Value-to-Income Ratio | Without Mortgage | With Mortgage |
| Less than 2.0x | 6,441 (38.1%) | 106,607 (328.5%) |
| 2.0x to 2.9x | 3,574 (21.1%) | 15,390 (47.4%) |
| 3.0x to 3.9x | 2,091 (12.4%) | 8,763 (27.0%) |
| 4.0x or more | 4,441 (26.3%) | 3,877 (11.9%) |
| Total | 16,908 (100.0%) | 32,455 (100.0%) |
Real Estate Taxes by Mortgage Status in Scott County

| Property Taxes | Without Mortgage | With Mortgage |
| Less than $800 | 1,430 (8.5%) | 73 (0.2%) |
| $800 to $1,499 | 1,374 (8.1%) | 972 (3.0%) |
| $800 to $1,499 | 13,674 (80.9%) | 3,191 (9.8%) |
| Total | 16,908 (100.0%) | 32,455 (100.0%) |
Health & Disability in Scott County
Health Insurance Coverage by Age in Scott County
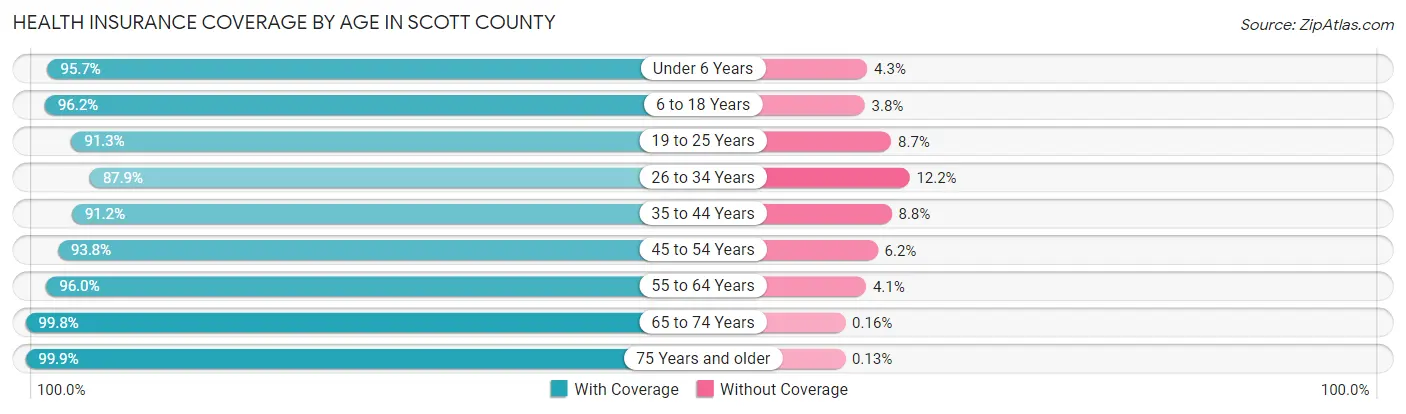
| Age Bracket | With Coverage | Without Coverage |
| Under 6 Years | 12,226 (95.7%) | 544 (4.3%) |
| 6 to 18 Years | 29,091 (96.2%) | 1,145 (3.8%) |
| 19 to 25 Years | 13,439 (91.3%) | 1,284 (8.7%) |
| 26 to 34 Years | 17,609 (87.8%) | 2,435 (12.1%) |
| 35 to 44 Years | 20,950 (91.2%) | 2,023 (8.8%) |
| 45 to 54 Years | 19,567 (93.8%) | 1,295 (6.2%) |
| 55 to 64 Years | 21,755 (96.0%) | 919 (4.1%) |
| 65 to 74 Years | 17,128 (99.8%) | 27 (0.2%) |
| 75 Years and older | 11,108 (99.9%) | 14 (0.1%) |
| Total | 162,873 (94.4%) | 9,686 (5.6%) |
Health Insurance Coverage by Citizenship Status in Scott County
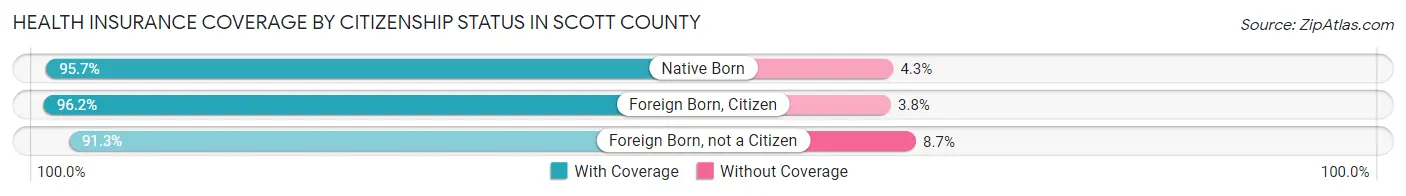
| Citizenship Status | With Coverage | Without Coverage |
| Native Born | 12,226 (95.7%) | 544 (4.3%) |
| Foreign Born, Citizen | 29,091 (96.2%) | 1,145 (3.8%) |
| Foreign Born, not a Citizen | 13,439 (91.3%) | 1,284 (8.7%) |
Health Insurance Coverage by Household Income in Scott County
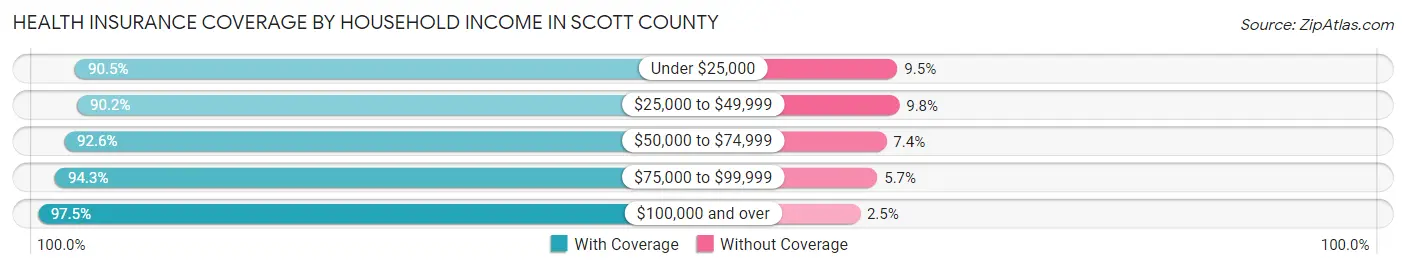
| Household Income | With Coverage | Without Coverage |
| Under $25,000 | 16,266 (90.5%) | 1,703 (9.5%) |
| $25,000 to $49,999 | 23,581 (90.2%) | 2,570 (9.8%) |
| $50,000 to $74,999 | 25,603 (92.6%) | 2,053 (7.4%) |
| $75,000 to $99,999 | 22,773 (94.3%) | 1,379 (5.7%) |
| $100,000 and over | 72,784 (97.5%) | 1,841 (2.5%) |
Public vs Private Health Insurance Coverage by Age in Scott County
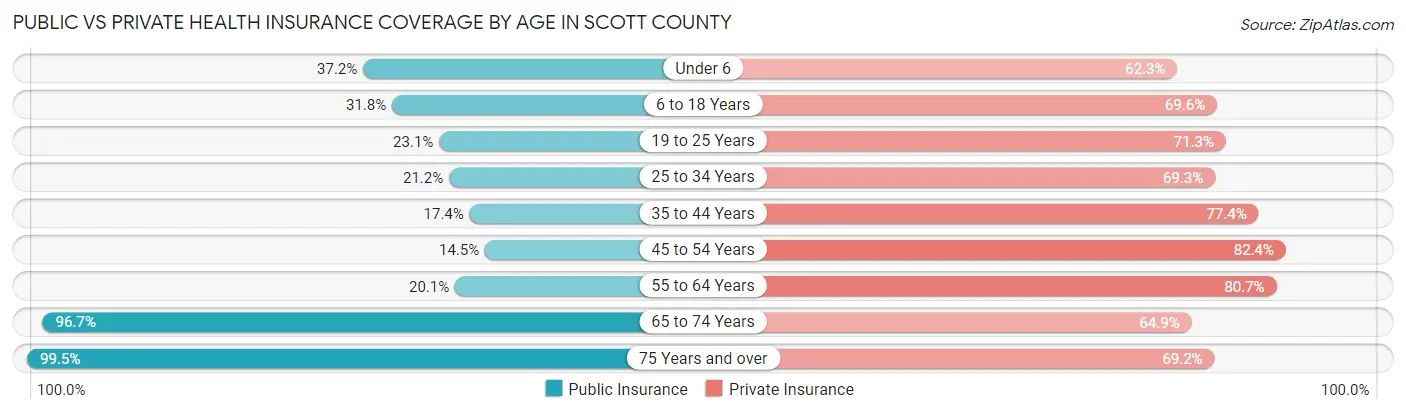
| Age Bracket | Public Insurance | Private Insurance |
| Under 6 | 4,747 (37.2%) | 7,953 (62.3%) |
| 6 to 18 Years | 9,612 (31.8%) | 21,055 (69.6%) |
| 19 to 25 Years | 3,393 (23.1%) | 10,495 (71.3%) |
| 25 to 34 Years | 4,254 (21.2%) | 13,886 (69.3%) |
| 35 to 44 Years | 3,997 (17.4%) | 17,775 (77.4%) |
| 45 to 54 Years | 3,031 (14.5%) | 17,194 (82.4%) |
| 55 to 64 Years | 4,555 (20.1%) | 18,292 (80.7%) |
| 65 to 74 Years | 16,581 (96.7%) | 11,137 (64.9%) |
| 75 Years and over | 11,070 (99.5%) | 7,692 (69.2%) |
| Total | 61,240 (35.5%) | 125,479 (72.7%) |
Disability Status by Sex by Age in Scott County
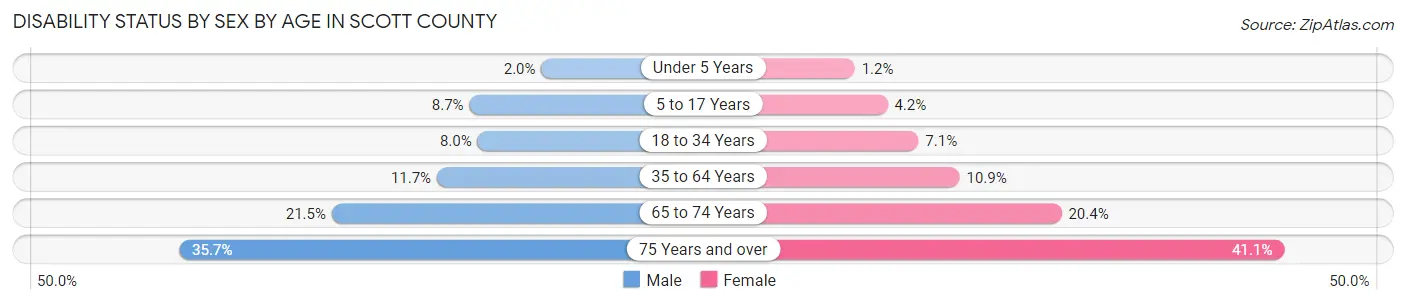
| Age Bracket | Male | Female |
| Under 5 Years | 108 (2.0%) | 62 (1.2%) |
| 5 to 17 Years | 1,339 (8.7%) | 635 (4.2%) |
| 18 to 34 Years | 1,463 (8.0%) | 1,322 (7.1%) |
| 35 to 64 Years | 3,906 (11.7%) | 3,629 (10.9%) |
| 65 to 74 Years | 1,777 (21.5%) | 1,812 (20.4%) |
| 75 Years and over | 1,649 (35.7%) | 2,668 (41.1%) |
Disability Class by Sex by Age in Scott County
Disability Class: Hearing Difficulty
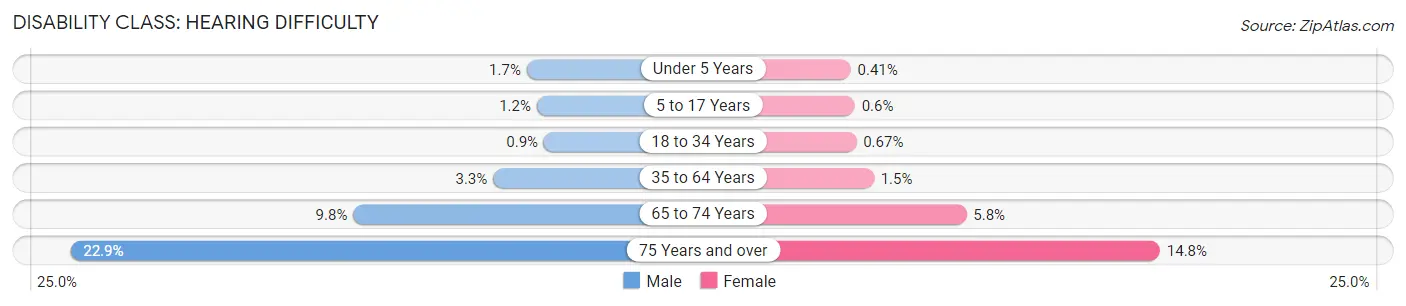
| Age Bracket | Male | Female |
| Under 5 Years | 90 (1.7%) | 21 (0.4%) |
| 5 to 17 Years | 189 (1.2%) | 90 (0.6%) |
| 18 to 34 Years | 166 (0.9%) | 124 (0.7%) |
| 35 to 64 Years | 1,087 (3.3%) | 490 (1.5%) |
| 65 to 74 Years | 806 (9.8%) | 514 (5.8%) |
| 75 Years and over | 1,058 (22.9%) | 959 (14.8%) |
Disability Class: Vision Difficulty
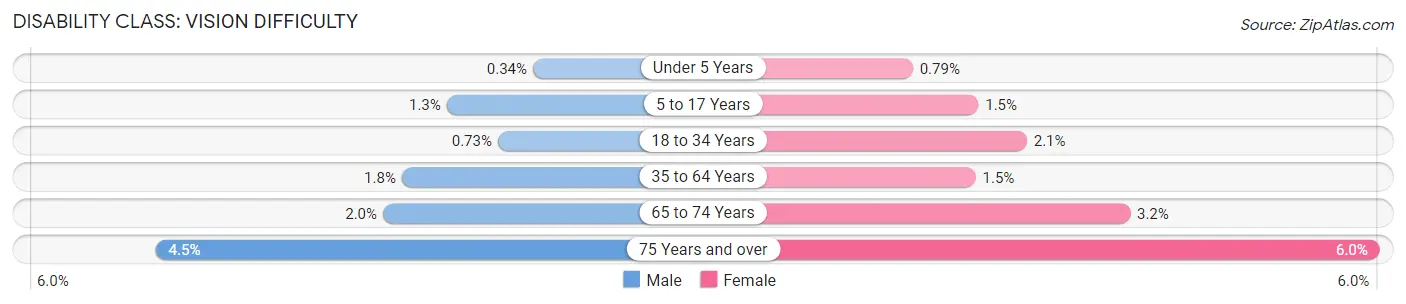
| Age Bracket | Male | Female |
| Under 5 Years | 18 (0.3%) | 41 (0.8%) |
| 5 to 17 Years | 199 (1.3%) | 228 (1.5%) |
| 18 to 34 Years | 134 (0.7%) | 383 (2.1%) |
| 35 to 64 Years | 599 (1.8%) | 496 (1.5%) |
| 65 to 74 Years | 166 (2.0%) | 285 (3.2%) |
| 75 Years and over | 210 (4.5%) | 389 (6.0%) |
Disability Class: Cognitive Difficulty
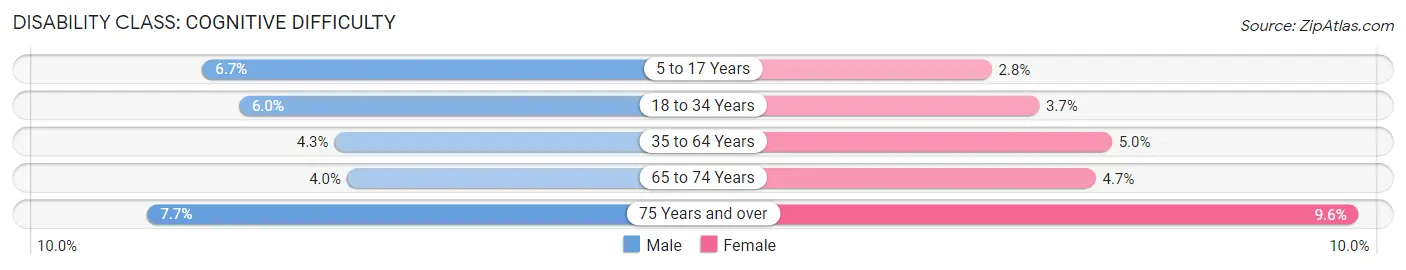
| Age Bracket | Male | Female |
| 5 to 17 Years | 1,029 (6.7%) | 416 (2.8%) |
| 18 to 34 Years | 1,106 (6.0%) | 680 (3.7%) |
| 35 to 64 Years | 1,417 (4.3%) | 1,662 (5.0%) |
| 65 to 74 Years | 332 (4.0%) | 419 (4.7%) |
| 75 Years and over | 357 (7.7%) | 623 (9.6%) |
Disability Class: Ambulatory Difficulty
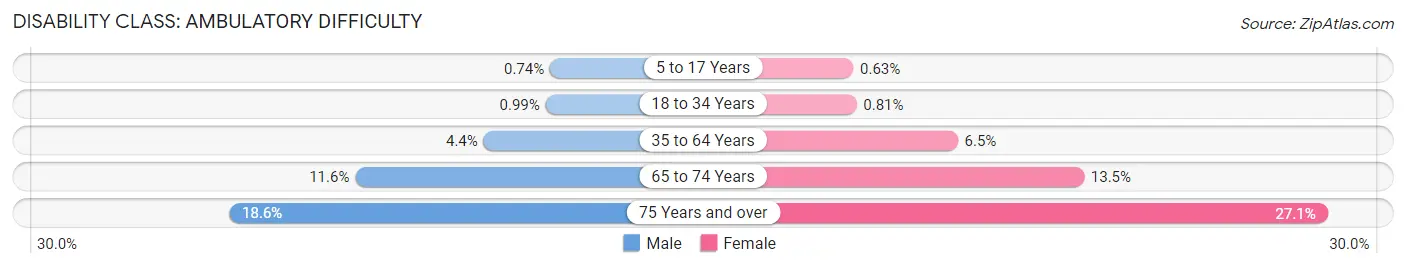
| Age Bracket | Male | Female |
| 5 to 17 Years | 113 (0.7%) | 94 (0.6%) |
| 18 to 34 Years | 182 (1.0%) | 150 (0.8%) |
| 35 to 64 Years | 1,480 (4.4%) | 2,143 (6.5%) |
| 65 to 74 Years | 958 (11.6%) | 1,198 (13.5%) |
| 75 Years and over | 861 (18.6%) | 1,758 (27.1%) |
Disability Class: Self-Care Difficulty
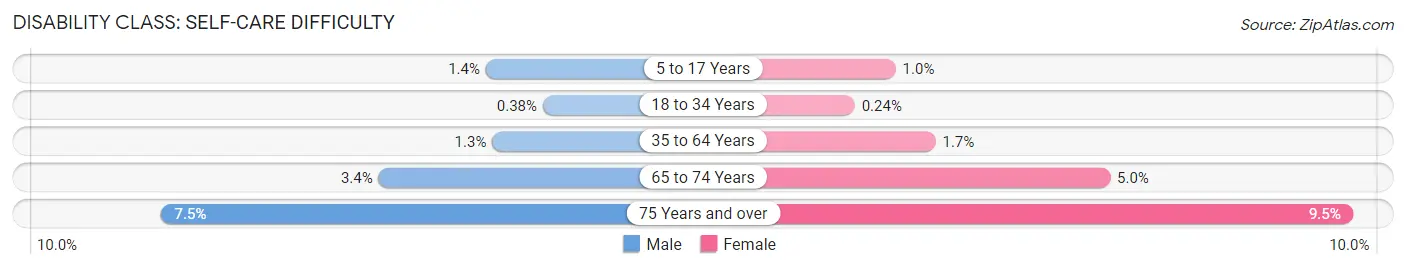
| Age Bracket | Male | Female |
| 5 to 17 Years | 221 (1.4%) | 149 (1.0%) |
| 18 to 34 Years | 70 (0.4%) | 45 (0.2%) |
| 35 to 64 Years | 439 (1.3%) | 579 (1.7%) |
| 65 to 74 Years | 284 (3.4%) | 443 (5.0%) |
| 75 Years and over | 345 (7.5%) | 616 (9.5%) |
Technology Access in Scott County
Computing Device Access in Scott County
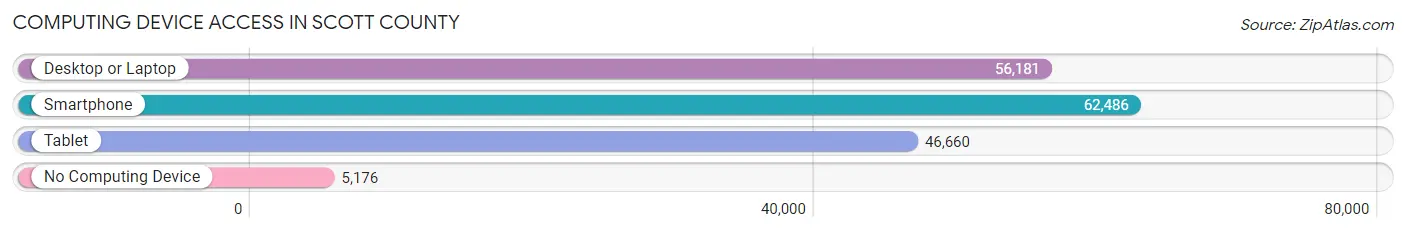
| Device Type | # Households | % Households |
| Desktop or Laptop | 56,181 | 78.6% |
| Smartphone | 62,486 | 87.5% |
| Tablet | 46,660 | 65.3% |
| No Computing Device | 5,176 | 7.2% |
| Total | 71,436 | 100.0% |
Internet Access in Scott County
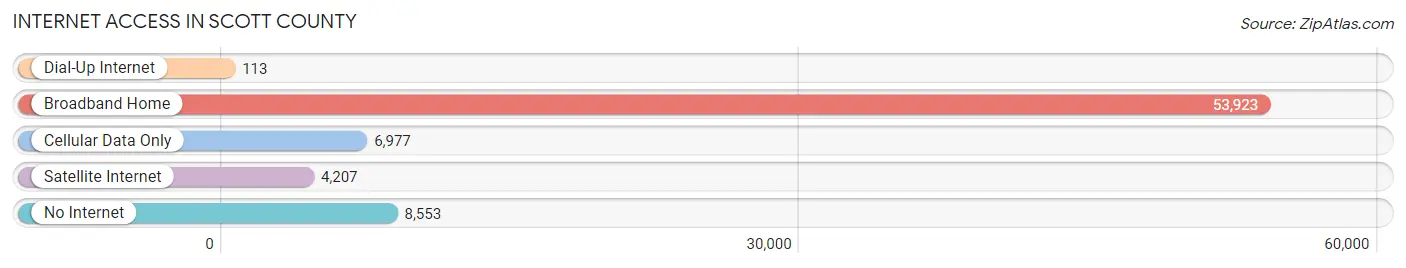
| Internet Type | # Households | % Households |
| Dial-Up Internet | 113 | 0.2% |
| Broadband Home | 53,923 | 75.5% |
| Cellular Data Only | 6,977 | 9.8% |
| Satellite Internet | 4,207 | 5.9% |
| No Internet | 8,553 | 12.0% |
| Total | 71,436 | 100.0% |
Scott County Summary
Scott County is located in the southeastern corner of Iowa, and is part of the Quad Cities metropolitan area. It is bordered by the Mississippi River to the east, and the counties of Clinton, Muscatine, and Cedar to the north, west, and south, respectively. The county seat is Davenport, which is also the largest city in the county. Scott County is home to a population of 165,224 people, as of the 2010 census.
History
Scott County was established in 1837, and was named after General Winfield Scott, a hero of the War of 1812. The county was originally part of the Black Hawk Purchase, a large tract of land purchased from the Sauk and Fox Native American tribes in 1832. The county was initially sparsely populated, but began to grow rapidly in the late 19th century with the arrival of German and Irish immigrants. The county was also home to a large number of African Americans, who had been brought to the area as slaves.
Geography
Scott County covers an area of 545 square miles, and is located in the Midwestern United States. The county is mostly flat, with some rolling hills in the northern and western parts. The Mississippi River forms the eastern border of the county, and the Rock River forms the western border. The county is home to several parks and recreational areas, including the Scott County Park, the Credit Island Park, and the Nahant Marsh.
Economy
Scott County has a diverse economy, with a mix of manufacturing, agriculture, and services. The county is home to several large employers, including John Deere, Alcoa, and Kraft Foods. The county is also home to a number of smaller businesses, including restaurants, retail stores, and professional services. The county is also home to a number of educational institutions, including St. Ambrose University, Palmer College of Chiropractic, and the University of Iowa.
Demographics
As of the 2010 census, Scott County had a population of 165,224 people. The population was spread out, with 24.3% under the age of 18, 10.2% from 18 to 24, 28.2% from 25 to 44, 22.7% from 45 to 64, and 14.6% who were 65 years of age or older. The median age was 36.4 years. The population was 51.2% female and 48.8% male.
The racial makeup of the county was 87.2% White, 6.3% African American, 0.5% Native American, 2.2% Asian, 0.1% Pacific Islander, 1.7% from other races, and 2.0% from two or more races. Hispanic or Latino of any race were 4.2% of the population.
The median income for a household in the county was $50,936, and the median income for a family was $62,945. The per capita income for the county was $25,945. About 8.2% of families and 11.2% of the population were below the poverty line, including 16.2% of those under age 18 and 6.2% of those age 65 or over.
Common Questions
What is Per Capita Income in Scott County?
Per Capita income in Scott County is $40,926.
What is the Median Family Income in Scott County?
Median Family Income in Scott County is $94,696.
What is the Median Household income in Scott County?
Median Household Income in Scott County is $72,792.
What is Income or Wage Gap in Scott County?
Income or Wage Gap in Scott County is 33.2%.
Women in Scott County earn 66.8 cents for every dollar earned by a man.
What is Family Income Deficit in Scott County?
Family Income Deficit in Scott County is $11,616.
Families that are below poverty line in Scott County earn $11,616 less on average than the poverty threshold level.
What is Inequality or Gini Index in Scott County?
Inequality or Gini Index in Scott County is 0.46.
What is the Total Population of Scott County?
Total Population of Scott County is 174,315.
What is the Total Male Population of Scott County?
Total Male Population of Scott County is 86,169.
What is the Total Female Population of Scott County?
Total Female Population of Scott County is 88,146.
What is the Ratio of Males per 100 Females in Scott County?
There are 97.76 Males per 100 Females in Scott County.
What is the Ratio of Females per 100 Males in Scott County?
There are 102.29 Females per 100 Males in Scott County.
What is the Median Population Age in Scott County?
Median Population Age in Scott County is 38.7 Years.
What is the Average Family Size in Scott County
Average Family Size in Scott County is 3.0 People.
What is the Average Household Size in Scott County
Average Household Size in Scott County is 2.4 People.
How Large is the Labor Force in Scott County?
There are 91,194 People in the Labor Forcein in Scott County.
What is the Percentage of People in the Labor Force in Scott County?
65.9% of People are in the Labor Force in Scott County.
What is the Unemployment Rate in Scott County?
Unemployment Rate in Scott County is 4.0%.