Area Code 515 Map & Demographics
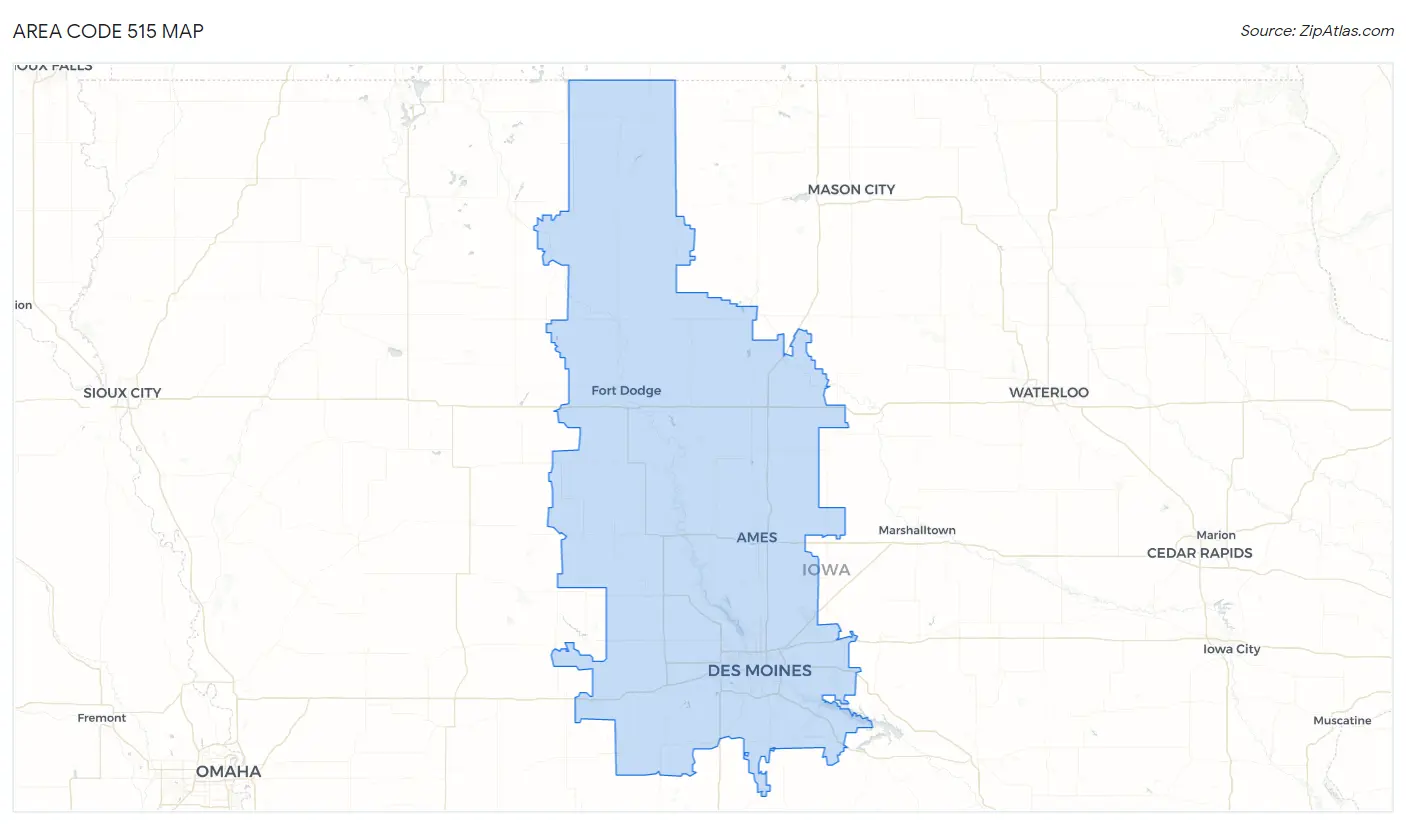
Area Code 515 Map
Area Code 515 Overview
$38,046
PER CAPITA INCOME
$93,041
AVG FAMILY INCOME
$76,153
AVG HOUSEHOLD INCOME
30.0%
WAGE / INCOME GAP [ % ]
70.0¢/ $1
WAGE / INCOME GAP [ $ ]
$11,071
FAMILY INCOME DEFICIT
53.26
INEQUALITY / GINI INDEX
879,616
TOTAL POPULATION
442,416
MALE POPULATION
437,200
FEMALE POPULATION
101.19
MALES / 100 FEMALES
98.82
FEMALES / 100 MALES
41.0
MEDIAN AGE
3.0
AVG FAMILY SIZE
2.4
AVG HOUSEHOLD SIZE
468,280
LABOR FORCE [ PEOPLE ]
67.2%
PERCENT IN LABOR FORCE
4.1%
UNEMPLOYMENT RATE
Income in Area Code 515
Income Overview in Area Code 515
Per Capita Income in Area Code 515 is $38,046, while median incomes of families and households are $93,041 and $76,153 respectively.
| Characteristic | Number | Measure |
| Per Capita Income | 879,616 | $38,046 |
| Median Family Income | 214,642 | $93,041 |
| Mean Family Income | 214,642 | $14,146,060 |
| Median Household Income | 353,708 | $76,153 |
| Mean Household Income | 353,708 | $12,087,281 |
| Income Deficit | 214,642 | $11,071 |
| Wage / Income Gap (%) | 879,616 | 29.95% |
| Wage / Income Gap ($) | 879,616 | 70.05¢ per $1 |
| Gini / Inequality Index | 879,616 | 53.26 |
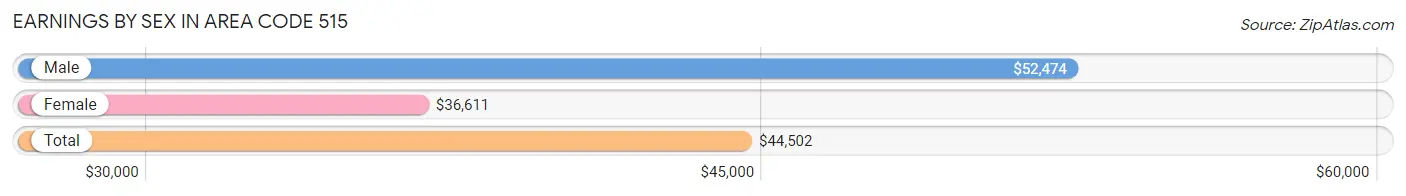
Earnings by Sex in Area Code 515
Average Earnings in Area Code 515 are $44,502, $52,474 for men and $36,611 for women, a difference of 30.2%.
| Sex | Number | Average Earnings |
| Male | 274,461 (53.2%) | $52,474 |
| Female | 241,845 (46.8%) | $36,611 |
| Total | 516,306 (100.0%) | $44,502 |
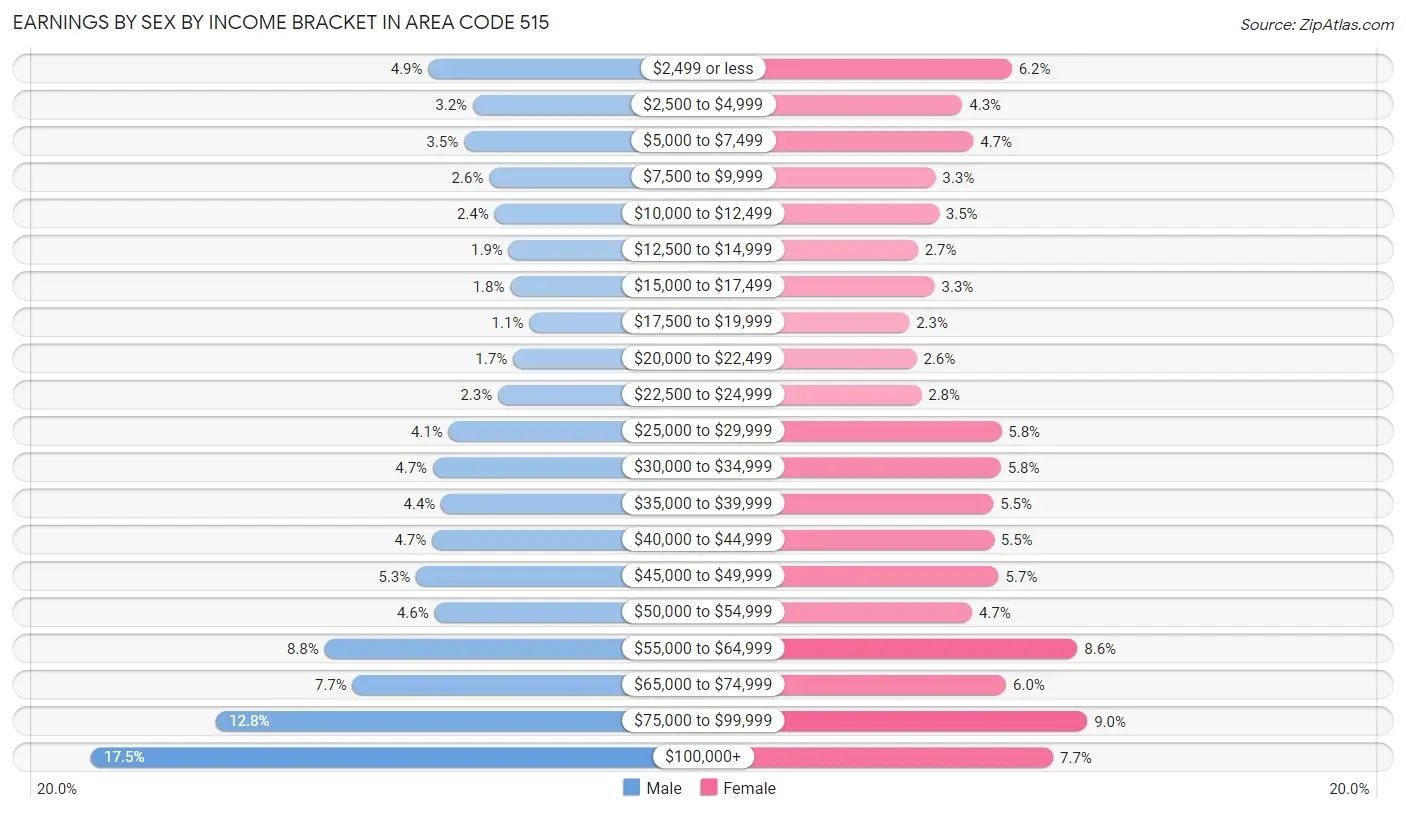
Earnings by Sex by Income Bracket in Area Code 515
The most common earnings brackets in Area Code 515 are $100,000+ for men (48,052 | 17.5%) and $75,000 to $99,999 for women (21,798 | 9.0%).
| Income | Male | Female |
| $2,499 or less | 13,374 (4.9%) | 14,957 (6.2%) |
| $2,500 to $4,999 | 8,770 (3.2%) | 10,472 (4.3%) |
| $5,000 to $7,499 | 9,699 (3.5%) | 11,474 (4.7%) |
| $7,500 to $9,999 | 7,104 (2.6%) | 8,034 (3.3%) |
| $10,000 to $12,499 | 6,572 (2.4%) | 8,345 (3.5%) |
| $12,500 to $14,999 | 5,113 (1.9%) | 6,443 (2.7%) |
| $15,000 to $17,499 | 4,943 (1.8%) | 7,962 (3.3%) |
| $17,500 to $19,999 | 2,996 (1.1%) | 5,666 (2.3%) |
| $20,000 to $22,499 | 4,672 (1.7%) | 6,310 (2.6%) |
| $22,500 to $24,999 | 6,204 (2.3%) | 6,736 (2.8%) |
| $25,000 to $29,999 | 11,279 (4.1%) | 13,995 (5.8%) |
| $30,000 to $34,999 | 12,895 (4.7%) | 13,953 (5.8%) |
| $35,000 to $39,999 | 12,052 (4.4%) | 13,275 (5.5%) |
| $40,000 to $44,999 | 12,977 (4.7%) | 13,317 (5.5%) |
| $45,000 to $49,999 | 14,622 (5.3%) | 13,750 (5.7%) |
| $50,000 to $54,999 | 12,725 (4.6%) | 11,334 (4.7%) |
| $55,000 to $64,999 | 24,052 (8.8%) | 20,899 (8.6%) |
| $65,000 to $74,999 | 21,170 (7.7%) | 14,428 (6.0%) |
| $75,000 to $99,999 | 35,190 (12.8%) | 21,798 (9.0%) |
| $100,000+ | 48,052 (17.5%) | 18,697 (7.7%) |
| Total | 274,461 (100.0%) | 241,845 (100.0%) |
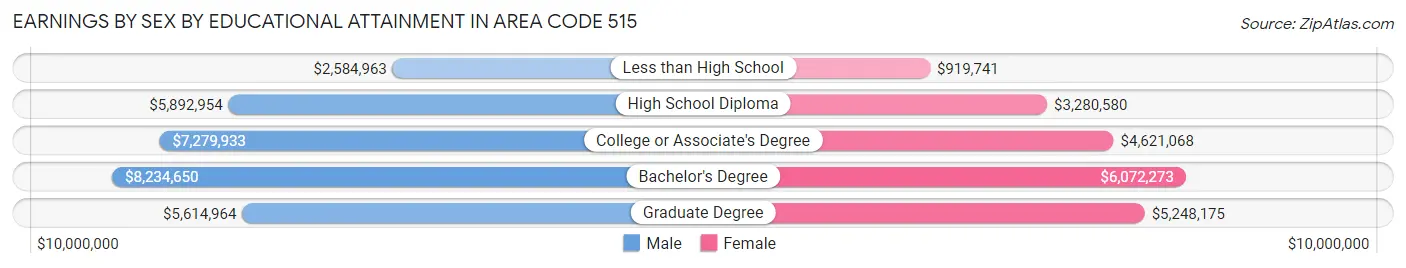
Earnings by Sex by Educational Attainment in Area Code 515
Average earnings in Area Code 515 are $7,530,985 for men and $5,168,438 for women, a difference of 31.4%. Men with an educational attainment of bachelor's degree enjoy the highest average annual earnings of $8,234,650, while those with less than high school education earn the least with $2,584,963. Women with an educational attainment of bachelor's degree earn the most with the average annual earnings of $6,072,273, while those with less than high school education have the smallest earnings of $919,741.
| Educational Attainment | Male Income | Female Income |
| Less than High School | $2,584,963 | $919,741 |
| High School Diploma | $5,892,954 | $3,280,580 |
| College or Associate's Degree | $7,279,933 | $4,621,068 |
| Bachelor's Degree | $8,234,650 | $6,072,273 |
| Graduate Degree | $5,614,964 | $5,248,175 |
| Total | $7,530,985 | $5,168,438 |
Family Income in Area Code 515
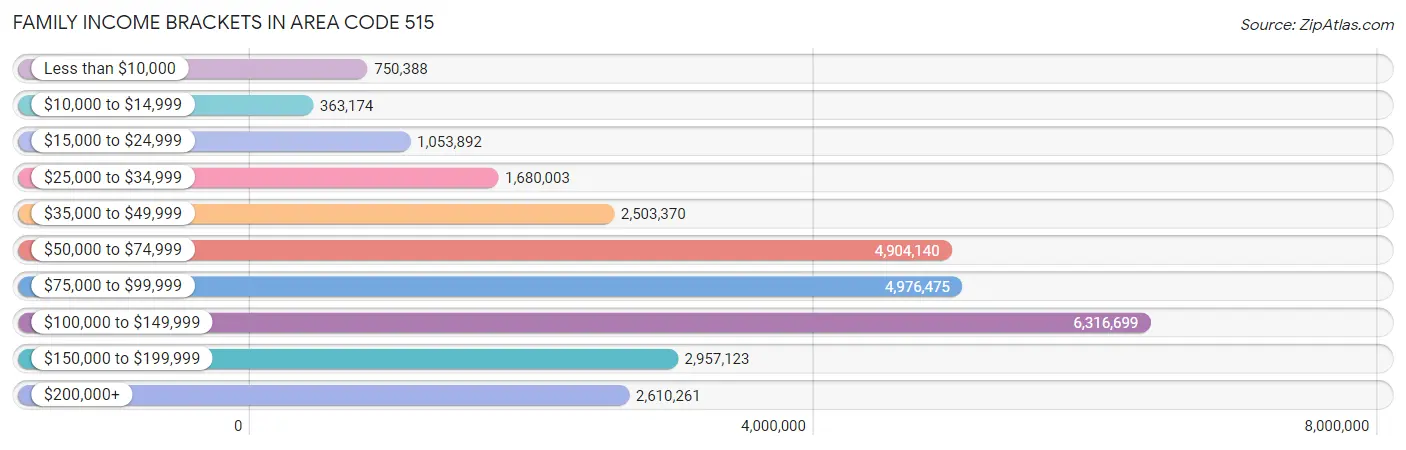
Family Income Brackets in Area Code 515
According to the Area Code 515 family income data, there are 6,316,699 families falling into the $100,000 to $149,999 income range, which is the most common income bracket and makes up 2,942.9% of all families. Conversely, the $10,000 to $14,999 income bracket is the least frequent group with only 363,174 families (169.2%) belonging to this category.
| Income Bracket | # Families | % Families |
| Less than $10,000 | 750,388 | 349.6% |
| $10,000 to $14,999 | 363,174 | 169.2% |
| $15,000 to $24,999 | 1,053,892 | 491.0% |
| $25,000 to $34,999 | 1,680,003 | 782.7% |
| $35,000 to $49,999 | 2,503,370 | 1,166.3% |
| $50,000 to $74,999 | 4,904,140 | 2,284.8% |
| $75,000 to $99,999 | 4,976,475 | 2,318.5% |
| $100,000 to $149,999 | 6,316,699 | 2,942.9% |
| $150,000 to $199,999 | 2,957,123 | 1,377.7% |
| $200,000+ | 2,610,261 | 1,216.1% |
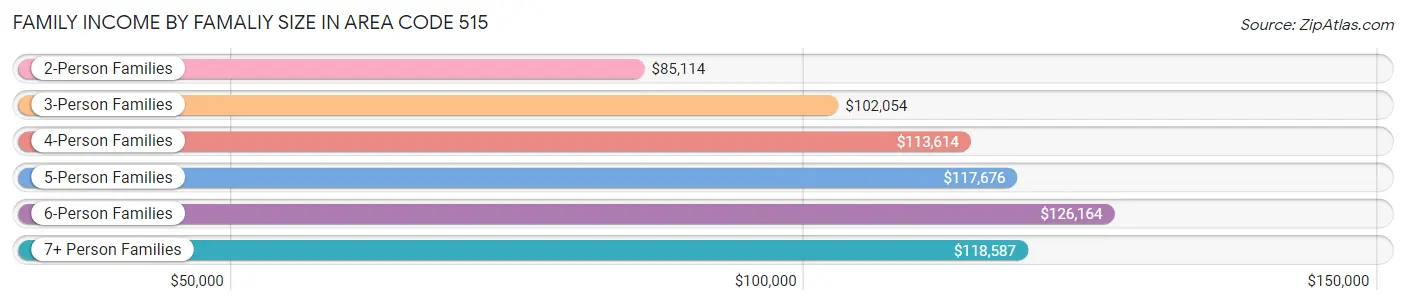
Family Income by Famaliy Size in Area Code 515
6-person families (6,262 | 2.9%) account for the highest median family income in Area Code 515 with $126,164 per family, while 2-person families (102,791 | 47.9%) have the highest median income of $42,557 per family member.
| Income Bracket | # Families | Median Income |
| 2-Person Families | 102,791 (47.9%) | $85,114 |
| 3-Person Families | 43,383 (20.2%) | $102,054 |
| 4-Person Families | 40,001 (18.6%) | $113,614 |
| 5-Person Families | 19,325 (9.0%) | $117,676 |
| 6-Person Families | 6,262 (2.9%) | $126,164 |
| 7+ Person Families | 2,880 (1.3%) | $118,587 |
| Total | 214,642 (100.0%) | $93,041 |
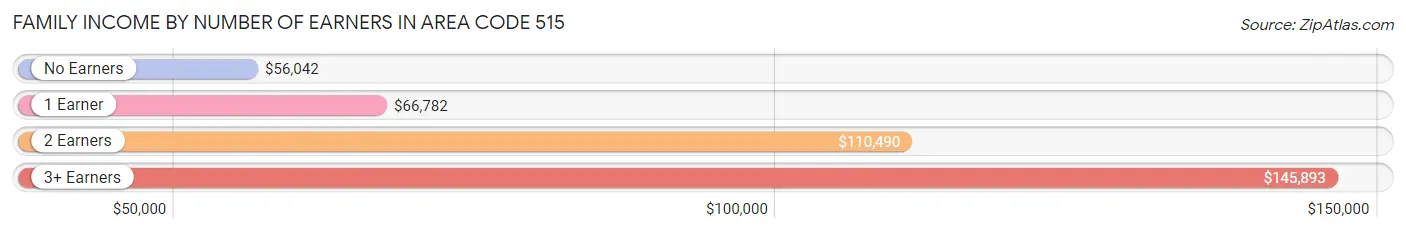
Family Income by Number of Earners in Area Code 515
The median family income in Area Code 515 is $93,041, with families comprising 3+ earners (24,455) having the highest median family income of $145,893, while families with no earners (26,045) have the lowest median family income of $56,042, accounting for 11.4% and 12.1% of families, respectively.
| Number of Earners | # Families | Median Income |
| No Earners | 26,045 (12.1%) | $56,042 |
| 1 Earner | 59,011 (27.5%) | $66,782 |
| 2 Earners | 105,131 (49.0%) | $110,490 |
| 3+ Earners | 24,455 (11.4%) | $145,893 |
| Total | 214,642 (100.0%) | $93,041 |
Household Income in Area Code 515
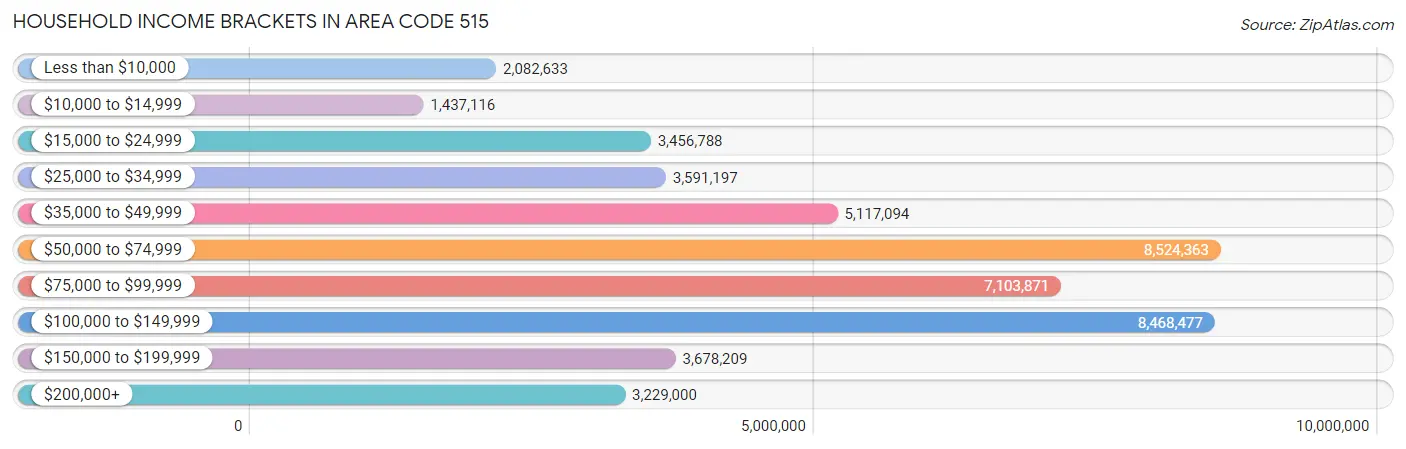
Household Income Brackets in Area Code 515
With 8,524,363 households falling in the category, the $50,000 to $74,999 income range is the most frequent in Area Code 515, accounting for 2,410.0% of all households. In contrast, only 1,437,116 households (406.3%) fall into the $10,000 to $14,999 income bracket, making it the least populous group.
| Income Bracket | # Households | % Households |
| Less than $10,000 | 2,082,633 | 588.8% |
| $10,000 to $14,999 | 1,437,116 | 406.3% |
| $15,000 to $24,999 | 3,456,788 | 977.3% |
| $25,000 to $34,999 | 3,591,197 | 1,015.3% |
| $35,000 to $49,999 | 5,117,094 | 1,446.7% |
| $50,000 to $74,999 | 8,524,363 | 2,410.0% |
| $75,000 to $99,999 | 7,103,871 | 2,008.4% |
| $100,000 to $149,999 | 8,468,477 | 2,394.2% |
| $150,000 to $199,999 | 3,678,209 | 1,039.9% |
| $200,000+ | 3,229,000 | 912.9% |
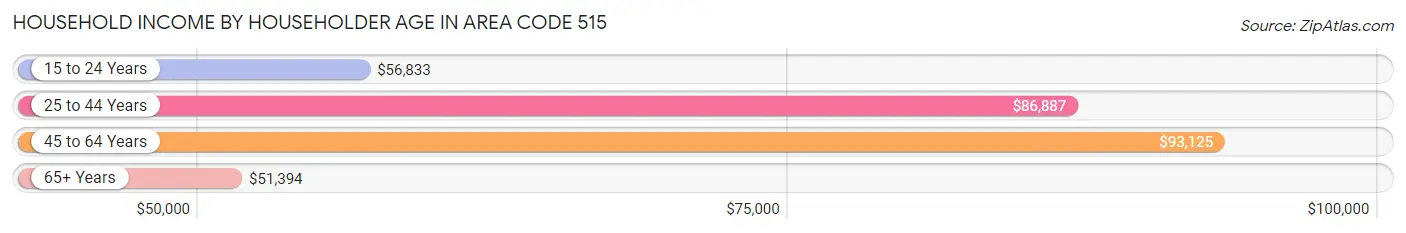
Household Income by Householder Age in Area Code 515
The median household income in Area Code 515 is $76,153, with the highest median household income of $93,125 found in the 45 to 64 years age bracket for the primary householder. A total of 119,172 households (33.7%) fall into this category. Meanwhile, the 65+ years age bracket for the primary householder has the lowest median household income of $51,394, with 81,572 households (23.1%) in this group.
| Income Bracket | # Households | Median Income |
| 15 to 24 Years | 24,138 (6.8%) | $56,833 |
| 25 to 44 Years | 128,826 (36.4%) | $86,886 |
| 45 to 64 Years | 119,172 (33.7%) | $93,125 |
| 65+ Years | 81,572 (23.1%) | $51,394 |
| Total | 353,708 (100.0%) | $76,153 |
Poverty in Area Code 515
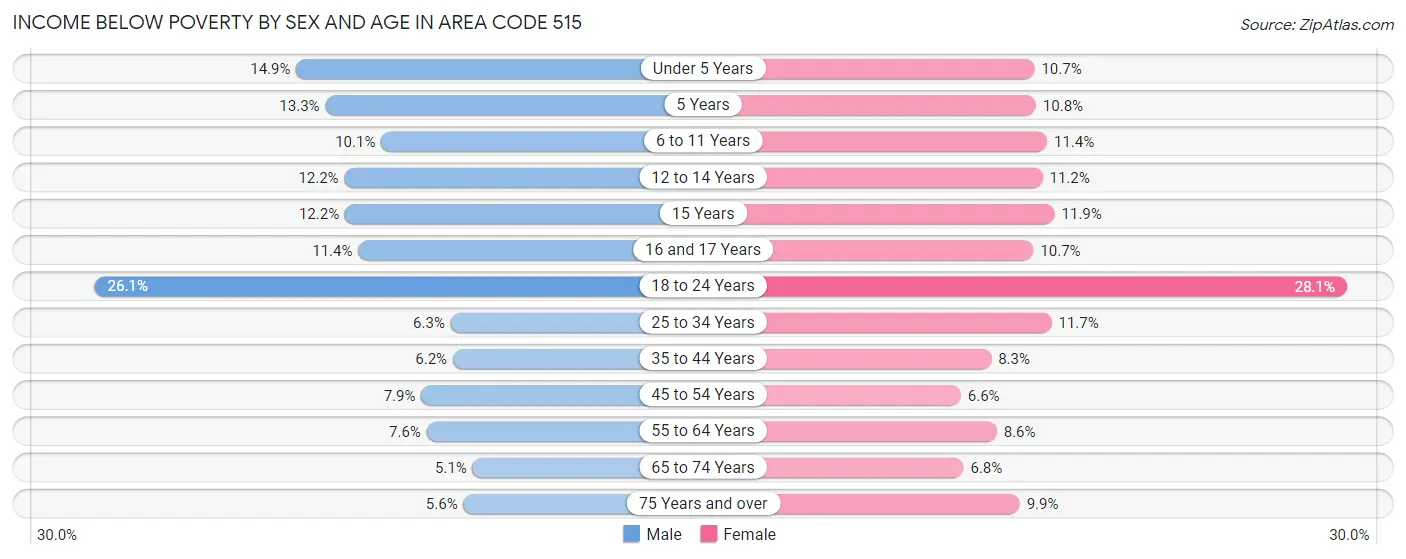
Income Below Poverty by Sex and Age in Area Code 515
With 9.9% poverty level for males and 11.1% for females among the residents of Area Code 515, 18 to 24 year old males and 18 to 24 year old females are the most vulnerable to poverty, with 11,171 males (26.1%) and 11,075 females (28.1%) in their respective age groups living below the poverty level.
| Age Bracket | Male | Female |
| Under 5 Years | 4,097 (14.9%) | 2,851 (10.7%) |
| 5 Years | 805 (13.3%) | 584 (10.8%) |
| 6 to 11 Years | 3,597 (10.1%) | 3,899 (11.4%) |
| 12 to 14 Years | 2,143 (12.2%) | 1,847 (11.2%) |
| 15 Years | 720 (12.2%) | 606 (11.8%) |
| 16 and 17 Years | 1,325 (11.4%) | 1,264 (10.7%) |
| 18 to 24 Years | 11,171 (26.1%) | 11,075 (28.1%) |
| 25 to 34 Years | 3,920 (6.3%) | 6,895 (11.7%) |
| 35 to 44 Years | 3,733 (6.1%) | 4,780 (8.3%) |
| 45 to 54 Years | 4,071 (7.9%) | 3,294 (6.6%) |
| 55 to 64 Years | 3,880 (7.6%) | 4,466 (8.6%) |
| 65 to 74 Years | 1,798 (5.1%) | 2,650 (6.8%) |
| 75 Years and over | 1,088 (5.6%) | 2,837 (9.9%) |
| Total | 42,348 (9.9%) | 47,048 (11.1%) |
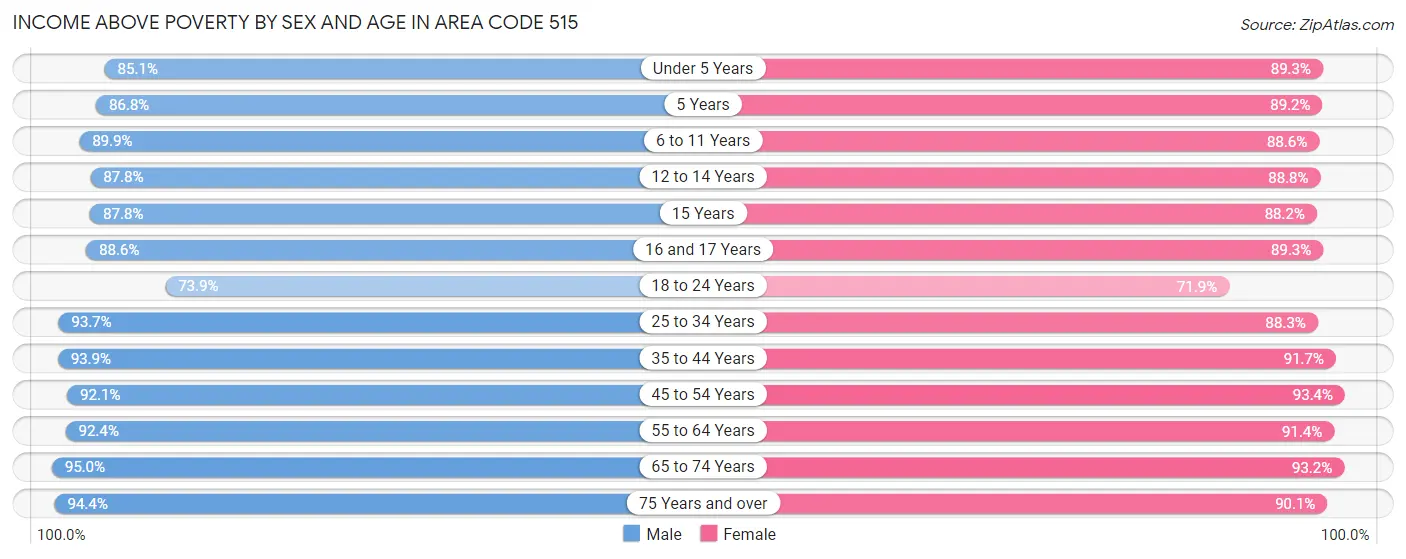
Income Above Poverty by Sex and Age in Area Code 515
According to the poverty statistics in Area Code 515, males aged 65 to 74 years and females aged 45 to 54 years are the age groups that are most secure financially, with 95.0% of males and 93.4% of females in these age groups living above the poverty line.
| Age Bracket | Male | Female |
| Under 5 Years | 23,455 (85.1%) | 23,726 (89.3%) |
| 5 Years | 5,269 (86.8%) | 4,819 (89.2%) |
| 6 to 11 Years | 31,874 (89.9%) | 30,223 (88.6%) |
| 12 to 14 Years | 15,431 (87.8%) | 14,667 (88.8%) |
| 15 Years | 5,202 (87.8%) | 4,506 (88.1%) |
| 16 and 17 Years | 10,273 (88.6%) | 10,581 (89.3%) |
| 18 to 24 Years | 31,636 (73.9%) | 28,303 (71.9%) |
| 25 to 34 Years | 58,578 (93.7%) | 52,125 (88.3%) |
| 35 to 44 Years | 56,961 (93.9%) | 52,696 (91.7%) |
| 45 to 54 Years | 47,377 (92.1%) | 46,410 (93.4%) |
| 55 to 64 Years | 47,076 (92.4%) | 47,307 (91.4%) |
| 65 to 74 Years | 33,771 (95.0%) | 36,413 (93.2%) |
| 75 Years and over | 18,490 (94.4%) | 25,777 (90.1%) |
| Total | 385,393 (90.1%) | 377,553 (88.9%) |
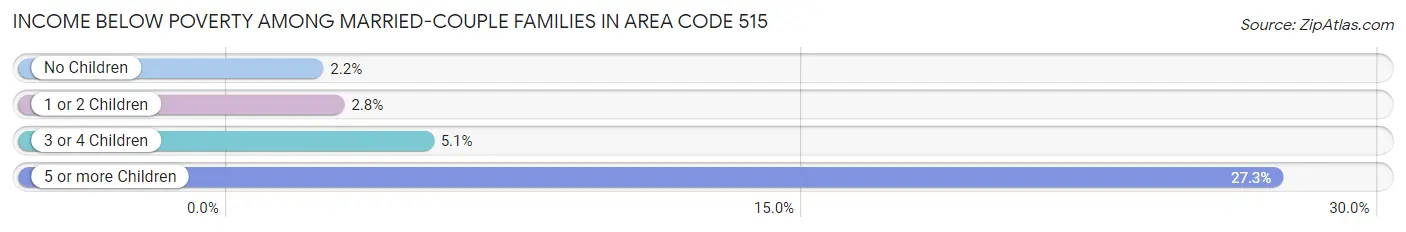
Income Below Poverty Among Married-Couple Families in Area Code 515
The poverty statistics for married-couple families in Area Code 515 show that 3.0% or 4,920 of the total 166,158 families live below the poverty line. Families with 5 or more children have the highest poverty rate of 27.3%, comprising of 444 families. On the other hand, families with no children have the lowest poverty rate of 2.2%, which includes 2,060 families.
| Children | Above Poverty | Below Poverty |
| No Children | 90,123 (97.8%) | 2,060 (2.2%) |
| 1 or 2 Children | 53,461 (97.2%) | 1,529 (2.8%) |
| 3 or 4 Children | 16,471 (94.9%) | 887 (5.1%) |
| 5 or more Children | 1,183 (72.7%) | 444 (27.3%) |
| Total | 161,238 (97.0%) | 4,920 (3.0%) |
Income Below Poverty Among Single-Parent Households in Area Code 515
According to the poverty data in Area Code 515, 11.6% or 1,748 single-father households and 21.4% or 7,163 single-mother households are living below the poverty line. Among single-father households, those with 5 or more children have the highest poverty rate, with 16 households (43.2%) experiencing poverty. Likewise, among single-mother households, those with 3 or 4 children have the highest poverty rate, with 1,682 households (40.1%) falling below the poverty line.
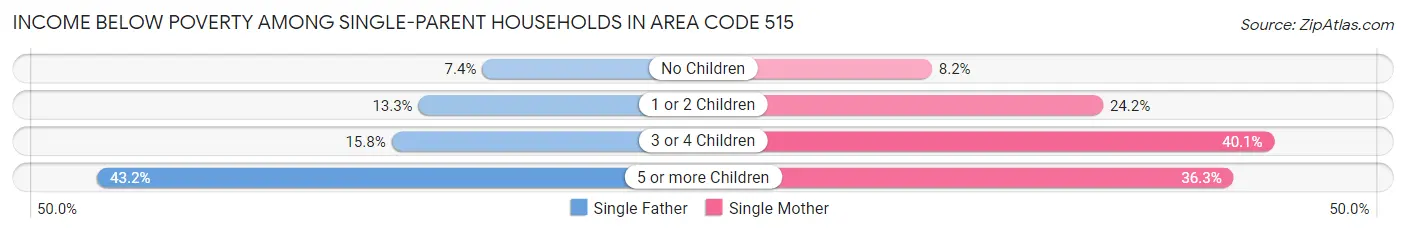
| Children | Single Father | Single Mother |
| No Children | 376 (7.4%) | 849 (8.2%) |
| 1 or 2 Children | 1,133 (13.3%) | 4,432 (24.1%) |
| 3 or 4 Children | 223 (15.8%) | 1,682 (40.1%) |
| 5 or more Children | 16 (43.2%) | 200 (36.3%) |
| Total | 1,748 (11.6%) | 7,163 (21.4%) |
Income Below Poverty Among Married-Couple vs Single-Parent Households in Area Code 515
The poverty data for Area Code 515 shows that 4,920 of the married-couple family households (3.0%) and 8,911 of the single-parent households (18.4%) are living below the poverty level. Within the married-couple family households, those with 5 or more children have the highest poverty rate, with 444 households (27.3%) falling below the poverty line. Among the single-parent households, those with 5 or more children have the highest poverty rate, with 216 household (36.7%) living below poverty.
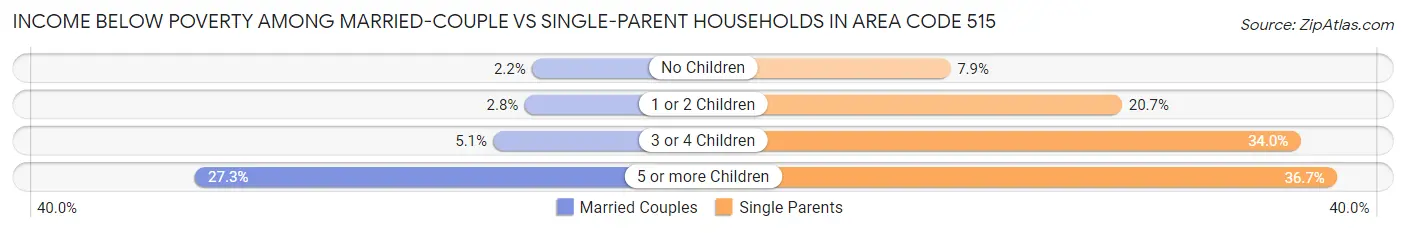
| Children | Married-Couple Families | Single-Parent Households |
| No Children | 2,060 (2.2%) | 1,225 (7.9%) |
| 1 or 2 Children | 1,529 (2.8%) | 5,565 (20.7%) |
| 3 or 4 Children | 887 (5.1%) | 1,905 (34.0%) |
| 5 or more Children | 444 (27.3%) | 216 (36.7%) |
| Total | 4,920 (3.0%) | 8,911 (18.4%) |
Race in Area Code 515
The most populous races in Area Code 515 are White / Caucasian (735,791 | 83.7%), Hispanic or Latino (62,801 | 7.1%), and Two or more Races (43,726 | 5.0%).
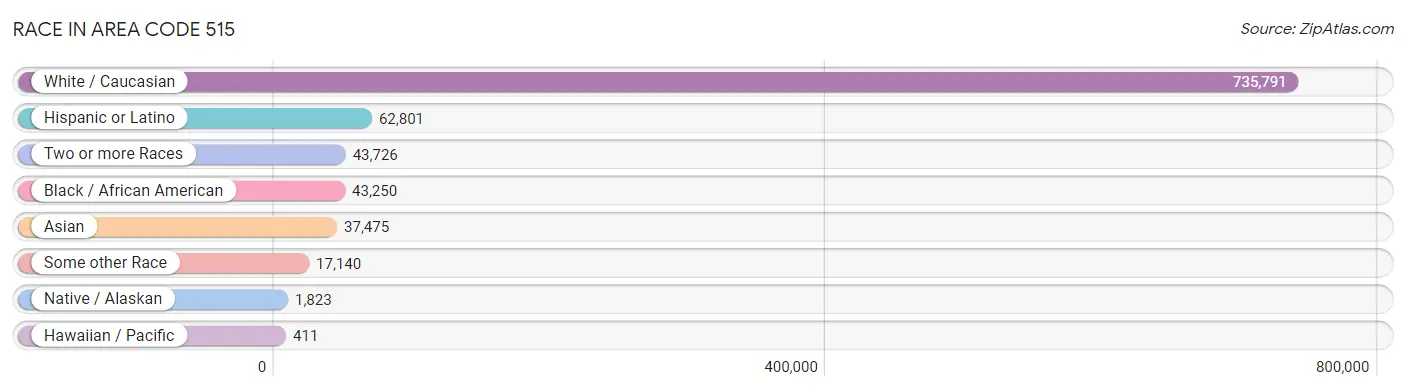
| Race | # Population | % Population |
| Asian | 37,475 | 4.3% |
| Black / African American | 43,250 | 4.9% |
| Hawaiian / Pacific | 411 | 0.1% |
| Hispanic or Latino | 62,801 | 7.1% |
| Native / Alaskan | 1,823 | 0.2% |
| White / Caucasian | 735,791 | 83.7% |
| Two or more Races | 43,726 | 5.0% |
| Some other Race | 17,140 | 1.9% |
| Total | 879,616 | 100.0% |
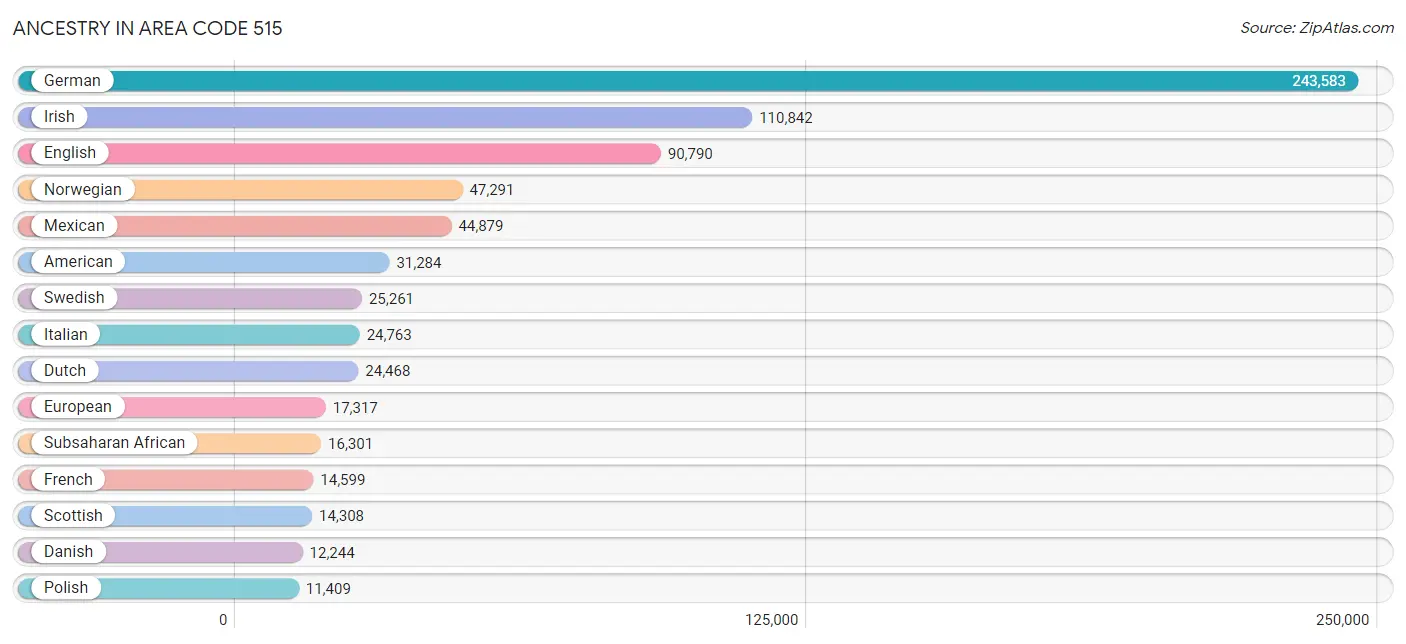
Ancestry in Area Code 515
The most populous ancestries reported in Area Code 515 are German (243,583 | 27.7%), Irish (110,842 | 12.6%), English (90,790 | 10.3%), Norwegian (47,291 | 5.4%), and Mexican (44,879 | 5.1%), together accounting for 61.1% of all Area Code 515 residents.
| Ancestry | # Population | % Population |
| Afghan | 624 | 0.1% |
| African | 4,264 | 0.5% |
| Alaska Native | 42 | 0.0% |
| Alaskan Athabascan | 14 | 0.0% |
| Albanian | 96 | 0.0% |
| Aleut | 5 | 0.0% |
| American | 31,284 | 3.6% |
| Apache | 65 | 0.0% |
| Arab | 3,528 | 0.4% |
| Argentinean | 212 | 0.0% |
| Armenian | 77 | 0.0% |
| Assyrian / Chaldean / Syriac | 39 | 0.0% |
| Australian | 200 | 0.0% |
| Austrian | 1,428 | 0.2% |
| Bahamian | 6 | 0.0% |
| Bangladeshi | 272 | 0.0% |
| Barbadian | 17 | 0.0% |
| Basque | 12 | 0.0% |
| Belgian | 1,144 | 0.1% |
| Bhutanese | 861 | 0.1% |
| Blackfeet | 341 | 0.0% |
| Bolivian | 56 | 0.0% |
| Brazilian | 544 | 0.1% |
| British | 5,054 | 0.6% |
| Bulgarian | 114 | 0.0% |
| Burmese | 4,498 | 0.5% |
| Cajun | 17 | 0.0% |
| Cambodian | 85 | 0.0% |
| Canadian | 880 | 0.1% |
| Cape Verdean | 4 | 0.0% |
| Celtic | 67 | 0.0% |
| Central American | 7,507 | 0.9% |
| Central American Indian | 235 | 0.0% |
| Cherokee | 1,065 | 0.1% |
| Cheyenne | 43 | 0.0% |
| Chickasaw | 9 | 0.0% |
| Chilean | 263 | 0.0% |
| Chippewa | 100 | 0.0% |
| Choctaw | 225 | 0.0% |
| Colombian | 826 | 0.1% |
| Comanche | 141 | 0.0% |
| Costa Rican | 206 | 0.0% |
| Cree | 34 | 0.0% |
| Creek | 102 | 0.0% |
| Croatian | 1,480 | 0.2% |
| Crow | 7 | 0.0% |
| Cuban | 964 | 0.1% |
| Cypriot | 20 | 0.0% |
| Czech | 7,445 | 0.9% |
| Czechoslovakian | 1,073 | 0.1% |
| Danish | 12,244 | 1.4% |
| Dominican | 207 | 0.0% |
| Dutch | 24,468 | 2.8% |
| Dutch West Indian | 9 | 0.0% |
| Eastern European | 1,671 | 0.2% |
| Ecuadorian | 564 | 0.1% |
| Egyptian | 484 | 0.1% |
| English | 90,790 | 10.3% |
| Estonian | 23 | 0.0% |
| Ethiopian | 716 | 0.1% |
| European | 17,317 | 2.0% |
| Filipino | 146 | 0.0% |
| Finnish | 849 | 0.1% |
| French | 14,599 | 1.7% |
| French American Indian | 46 | 0.0% |
| French Canadian | 1,268 | 0.1% |
| German | 243,583 | 27.7% |
| German Russian | 26 | 0.0% |
| Ghanaian | 369 | 0.0% |
| Greek | 1,281 | 0.2% |
| Guamanian / Chamorro | 104 | 0.0% |
| Guatemalan | 2,096 | 0.2% |
| Haitian | 319 | 0.0% |
| Honduran | 921 | 0.1% |
| Hopi | 4 | 0.0% |
| Houma | 4 | 0.0% |
| Hungarian | 1,288 | 0.2% |
| Icelander | 122 | 0.0% |
| Indian (Asian) | 7,094 | 0.8% |
| Indonesian | 3,891 | 0.4% |
| Inupiat | 8 | 0.0% |
| Iranian | 405 | 0.1% |
| Iraqi | 855 | 0.1% |
| Irish | 110,842 | 12.6% |
| Iroquois | 50 | 0.0% |
| Israeli | 35 | 0.0% |
| Italian | 24,763 | 2.8% |
| Jamaican | 638 | 0.1% |
| Japanese | 1,018 | 0.1% |
| Jordanian | 81 | 0.0% |
| Kenyan | 193 | 0.0% |
| Kiowa | 59 | 0.0% |
| Korean | 3,909 | 0.4% |
| Laotian | 174 | 0.0% |
| Latvian | 258 | 0.0% |
| Lebanese | 721 | 0.1% |
| Liberian | 3,115 | 0.4% |
| Lithuanian | 671 | 0.1% |
| Luxembourger | 1,186 | 0.1% |
| Macedonian | 93 | 0.0% |
| Malaysian | 3,998 | 0.4% |
| Maltese | 19 | 0.0% |
| Marshallese | 70 | 0.0% |
| Mexican | 44,879 | 5.1% |
| Mexican American Indian | 451 | 0.1% |
| Mongolian | 297 | 0.0% |
| Moroccan | 153 | 0.0% |
| Native Hawaiian | 533 | 0.1% |
| Navajo | 335 | 0.0% |
| New Zealander | 119 | 0.0% |
| Nicaraguan | 280 | 0.0% |
| Nigerian | 703 | 0.1% |
| Northern European | 2,351 | 0.3% |
| Norwegian | 47,291 | 5.4% |
| Osage | 3 | 0.0% |
| Ottawa | 4 | 0.0% |
| Pakistani | 1,245 | 0.1% |
| Palestinian | 88 | 0.0% |
| Panamanian | 290 | 0.0% |
| Paraguayan | 21 | 0.0% |
| Pennsylvania German | 312 | 0.0% |
| Peruvian | 483 | 0.1% |
| Polish | 11,409 | 1.3% |
| Portuguese | 738 | 0.1% |
| Pueblo | 56 | 0.0% |
| Puerto Rican | 2,901 | 0.3% |
| Romanian | 606 | 0.1% |
| Russian | 3,025 | 0.3% |
| Salvadoran | 3,678 | 0.4% |
| Samoan | 52 | 0.0% |
| Scandinavian | 6,445 | 0.7% |
| Scotch-Irish | 6,640 | 0.7% |
| Scottish | 14,308 | 1.6% |
| Seminole | 2 | 0.0% |
| Senegalese | 106 | 0.0% |
| Serbian | 299 | 0.0% |
| Shoshone | 5 | 0.0% |
| Sierra Leonean | 16 | 0.0% |
| Sioux | 696 | 0.1% |
| Slavic | 445 | 0.1% |
| Slovak | 459 | 0.1% |
| Slovene | 314 | 0.0% |
| Somali | 1,398 | 0.2% |
| South African | 55 | 0.0% |
| South American | 2,780 | 0.3% |
| South American Indian | 16 | 0.0% |
| Spaniard | 776 | 0.1% |
| Spanish | 853 | 0.1% |
| Spanish American | 16 | 0.0% |
| Spanish American Indian | 21 | 0.0% |
| Sri Lankan | 5,284 | 0.6% |
| Subsaharan African | 16,301 | 1.8% |
| Sudanese | 3,773 | 0.4% |
| Swedish | 25,261 | 2.9% |
| Swiss | 3,326 | 0.4% |
| Syrian | 25 | 0.0% |
| Thai | 8,098 | 0.9% |
| Tlingit-Haida | 3 | 0.0% |
| Tongan | 37 | 0.0% |
| Trinidadian and Tobagonian | 15 | 0.0% |
| Turkish | 142 | 0.0% |
| Ugandan | 122 | 0.0% |
| Ukrainian | 1,003 | 0.1% |
| Uruguayan | 25 | 0.0% |
| Ute | 2 | 0.0% |
| Venezuelan | 330 | 0.0% |
| Vietnamese | 196 | 0.0% |
| Welsh | 6,630 | 0.7% |
| West Indian | 37 | 0.0% |
| Yakama | 18 | 0.0% |
| Yaqui | 66 | 0.0% |
| Yugoslavian | 4,419 | 0.5% |
| Yup'ik | 9 | 0.0% | View All 173 Rows |
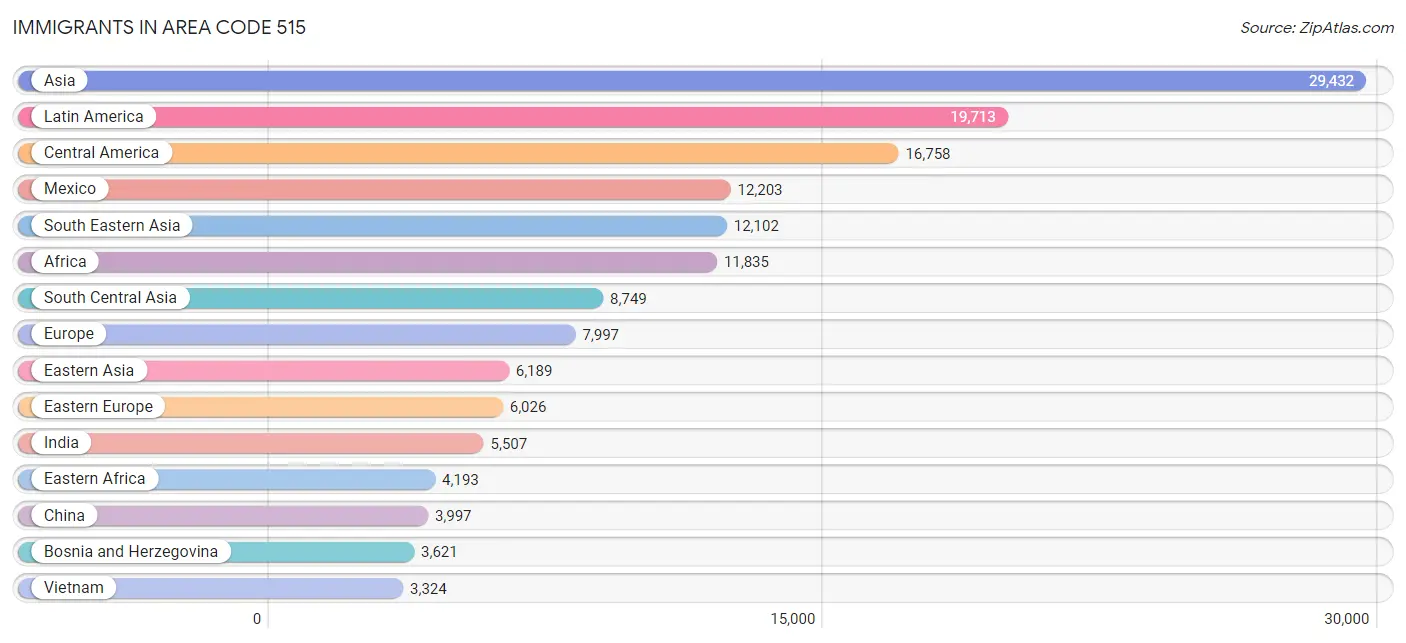
Immigrants in Area Code 515
The most numerous immigrant groups reported in Area Code 515 came from Asia (29,432 | 3.4%), Latin America (19,713 | 2.2%), Central America (16,758 | 1.9%), Mexico (12,203 | 1.4%), and South Eastern Asia (12,102 | 1.4%), together accounting for 10.3% of all Area Code 515 residents.
| Immigration Origin | # Population | % Population |
| Afghanistan | 445 | 0.1% |
| Africa | 11,835 | 1.3% |
| Argentina | 104 | 0.0% |
| Asia | 29,432 | 3.4% |
| Australia | 217 | 0.0% |
| Austria | 19 | 0.0% |
| Azores | 2 | 0.0% |
| Bahamas | 6 | 0.0% |
| Bangladesh | 186 | 0.0% |
| Belarus | 42 | 0.0% |
| Belgium | 11 | 0.0% |
| Belize | 15 | 0.0% |
| Bolivia | 5 | 0.0% |
| Bosnia and Herzegovina | 3,621 | 0.4% |
| Brazil | 858 | 0.1% |
| Bulgaria | 71 | 0.0% |
| Cambodia | 141 | 0.0% |
| Cameroon | 158 | 0.0% |
| Canada | 756 | 0.1% |
| Caribbean | 634 | 0.1% |
| Central America | 16,758 | 1.9% |
| Chile | 55 | 0.0% |
| China | 3,997 | 0.4% |
| Colombia | 627 | 0.1% |
| Congo | 745 | 0.1% |
| Costa Rica | 59 | 0.0% |
| Croatia | 214 | 0.0% |
| Cuba | 233 | 0.0% |
| Denmark | 16 | 0.0% |
| Dominican Republic | 149 | 0.0% |
| Eastern Africa | 4,193 | 0.5% |
| Eastern Asia | 6,189 | 0.7% |
| Eastern Europe | 6,026 | 0.7% |
| Ecuador | 198 | 0.0% |
| Egypt | 606 | 0.1% |
| El Salvador | 2,516 | 0.3% |
| England | 246 | 0.0% |
| Eritrea | 218 | 0.0% |
| Ethiopia | 536 | 0.1% |
| Europe | 7,997 | 0.9% |
| France | 60 | 0.0% |
| Germany | 602 | 0.1% |
| Ghana | 282 | 0.0% |
| Greece | 41 | 0.0% |
| Guatemala | 1,188 | 0.1% |
| Haiti | 123 | 0.0% |
| Honduras | 571 | 0.1% |
| Hong Kong | 100 | 0.0% |
| Hungary | 31 | 0.0% |
| India | 5,507 | 0.6% |
| Indonesia | 263 | 0.0% |
| Iran | 244 | 0.0% |
| Iraq | 1,261 | 0.1% |
| Ireland | 16 | 0.0% |
| Israel | 28 | 0.0% |
| Italy | 161 | 0.0% |
| Jamaica | 94 | 0.0% |
| Japan | 145 | 0.0% |
| Jordan | 242 | 0.0% |
| Kazakhstan | 21 | 0.0% |
| Kenya | 540 | 0.1% |
| Korea | 1,969 | 0.2% |
| Kuwait | 83 | 0.0% |
| Laos | 2,098 | 0.2% |
| Latin America | 19,713 | 2.2% |
| Latvia | 125 | 0.0% |
| Lebanon | 254 | 0.0% |
| Liberia | 1,880 | 0.2% |
| Lithuania | 5 | 0.0% |
| Malaysia | 558 | 0.1% |
| Mexico | 12,203 | 1.4% |
| Micronesia | 58 | 0.0% |
| Middle Africa | 1,336 | 0.2% |
| Moldova | 129 | 0.0% |
| Morocco | 105 | 0.0% |
| Nepal | 682 | 0.1% |
| Netherlands | 105 | 0.0% |
| Nicaragua | 138 | 0.0% |
| Nigeria | 399 | 0.1% |
| Northern Africa | 2,394 | 0.3% |
| Northern Europe | 654 | 0.1% |
| Norway | 86 | 0.0% |
| Oceania | 307 | 0.0% |
| Pakistan | 142 | 0.0% |
| Panama | 52 | 0.0% |
| Peru | 129 | 0.0% |
| Philippines | 1,321 | 0.2% |
| Poland | 160 | 0.0% |
| Portugal | 12 | 0.0% |
| Romania | 166 | 0.0% |
| Russia | 671 | 0.1% |
| Saudi Arabia | 102 | 0.0% |
| Scotland | 21 | 0.0% |
| Senegal | 74 | 0.0% |
| Serbia | 20 | 0.0% |
| Sierra Leone | 117 | 0.0% |
| Singapore | 55 | 0.0% |
| Somalia | 703 | 0.1% |
| South Africa | 215 | 0.0% |
| South America | 2,321 | 0.3% |
| South Central Asia | 8,749 | 1.0% |
| South Eastern Asia | 12,102 | 1.4% |
| Southern Europe | 498 | 0.1% |
| Spain | 265 | 0.0% |
| Sri Lanka | 260 | 0.0% |
| Sudan | 1,596 | 0.2% |
| Sweden | 12 | 0.0% |
| Switzerland | 15 | 0.0% |
| Syria | 57 | 0.0% |
| Taiwan | 184 | 0.0% |
| Thailand | 1,859 | 0.2% |
| Trinidad and Tobago | 29 | 0.0% |
| Turkey | 129 | 0.0% |
| Uganda | 156 | 0.0% |
| Ukraine | 432 | 0.1% |
| Uruguay | 180 | 0.0% |
| Uzbekistan | 46 | 0.0% |
| Venezuela | 141 | 0.0% |
| Vietnam | 3,324 | 0.4% |
| Western Africa | 3,196 | 0.4% |
| Western Asia | 2,378 | 0.3% |
| Western Europe | 819 | 0.1% |
| Yemen | 24 | 0.0% |
| Zaire | 350 | 0.0% |
| Zimbabwe | 47 | 0.0% | View All 125 Rows |
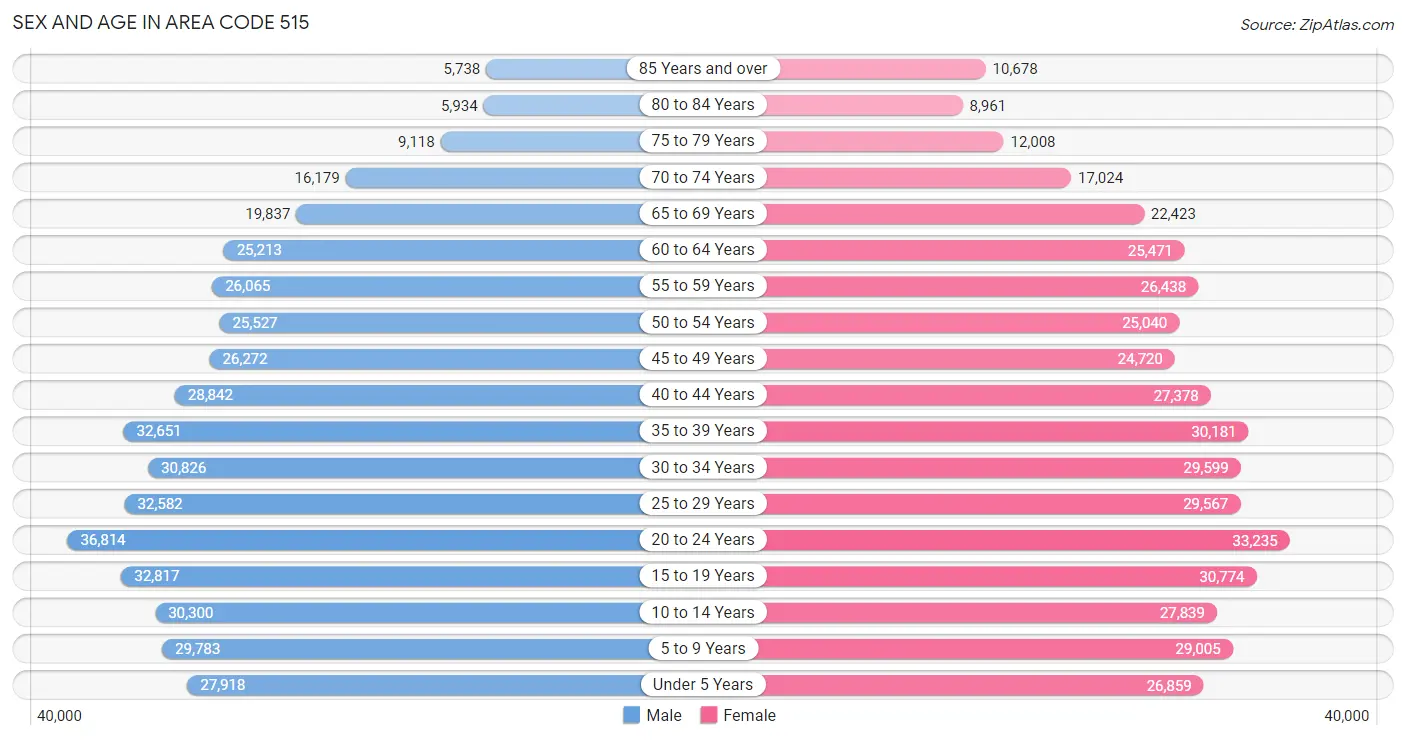
Sex and Age in Area Code 515
Sex and Age in Area Code 515
The most populous age groups in Area Code 515 are 20 to 24 Years (36,814 | 8.3%) for men and 20 to 24 Years (33,235 | 7.6%) for women.
| Age Bracket | Male | Female |
| Under 5 Years | 27,918 (6.3%) | 26,859 (6.1%) |
| 5 to 9 Years | 29,783 (6.7%) | 29,005 (6.6%) |
| 10 to 14 Years | 30,300 (6.9%) | 27,839 (6.4%) |
| 15 to 19 Years | 32,817 (7.4%) | 30,774 (7.0%) |
| 20 to 24 Years | 36,814 (8.3%) | 33,235 (7.6%) |
| 25 to 29 Years | 32,582 (7.4%) | 29,567 (6.8%) |
| 30 to 34 Years | 30,826 (7.0%) | 29,599 (6.8%) |
| 35 to 39 Years | 32,651 (7.4%) | 30,181 (6.9%) |
| 40 to 44 Years | 28,842 (6.5%) | 27,378 (6.3%) |
| 45 to 49 Years | 26,272 (5.9%) | 24,720 (5.7%) |
| 50 to 54 Years | 25,527 (5.8%) | 25,040 (5.7%) |
| 55 to 59 Years | 26,065 (5.9%) | 26,438 (6.0%) |
| 60 to 64 Years | 25,213 (5.7%) | 25,471 (5.8%) |
| 65 to 69 Years | 19,837 (4.5%) | 22,423 (5.1%) |
| 70 to 74 Years | 16,179 (3.7%) | 17,024 (3.9%) |
| 75 to 79 Years | 9,118 (2.1%) | 12,008 (2.8%) |
| 80 to 84 Years | 5,934 (1.3%) | 8,961 (2.1%) |
| 85 Years and over | 5,738 (1.3%) | 10,678 (2.4%) |
| Total | 442,416 (100.0%) | 437,200 (100.0%) |
Families and Households in Area Code 515
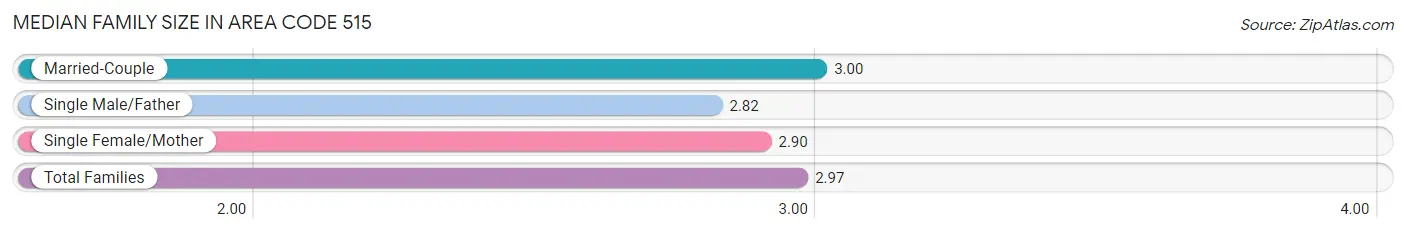
Median Family Size in Area Code 515
The median family size in Area Code 515 is 2.97 persons per family, with married-couple families (166,158 | 77.4%) accounting for the largest median family size of 3.0019 persons per family. On the other hand, single male/father families (15,047 | 7.0%) represent the smallest median family size with 2.82 persons per family.
| Family Type | # Families | Family Size |
| Married-Couple | 166,158 (77.4%) | 3.00 |
| Single Male/Father | 15,047 (7.0%) | 2.82 |
| Single Female/Mother | 33,437 (15.6%) | 2.90 |
| Total Families | 214,642 (100.0%) | 2.97 |
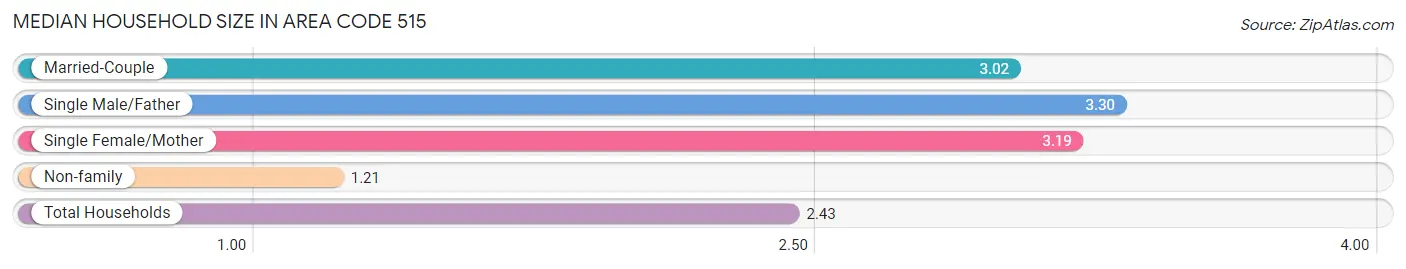
Median Household Size in Area Code 515
The median household size in Area Code 515 is 2.43 persons per household, with single male/father households (15,047 | 4.3%) accounting for the largest median household size of 3.30362 persons per household. non-family households (139,066 | 39.3%) represent the smallest median household size with 1.21 persons per household.
| Household Type | # Households | Household Size |
| Married-Couple | 166,158 (47.0%) | 3.02 |
| Single Male/Father | 15,047 (4.3%) | 3.30 |
| Single Female/Mother | 33,437 (9.5%) | 3.19 |
| Non-family | 139,066 (39.3%) | 1.21 |
| Total Households | 353,708 (100.0%) | 2.43 |
Household Size by Marriage Status in Area Code 515
Out of a total of 353,708 households in Area Code 515, 214,642 (60.7%) are family households, while 139,066 (39.3%) are nonfamily households. The most numerous type of family households are 2-person households, comprising 95,763, and the most common type of nonfamily households are 1-person households, comprising 107,871.
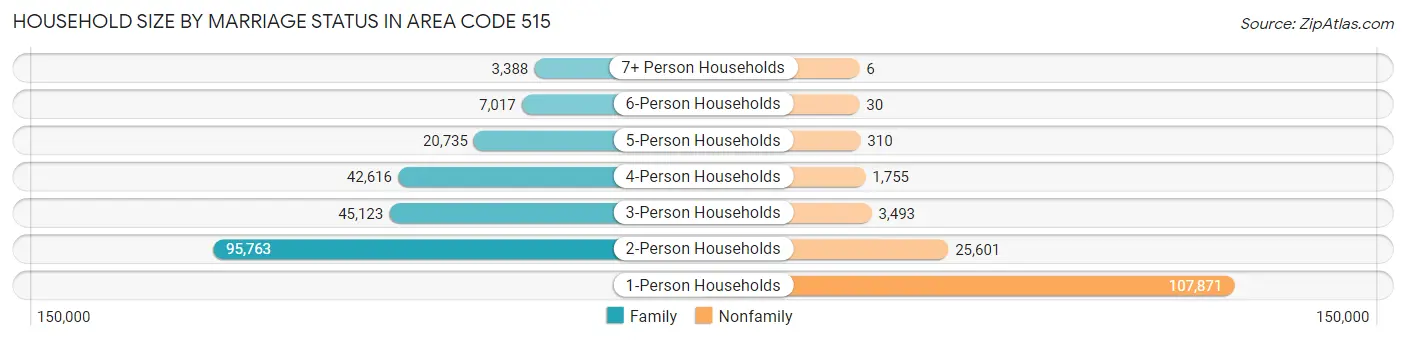
| Household Size | Family Households | Nonfamily Households |
| 1-Person Households | - | 107,871 (30.5%) |
| 2-Person Households | 95,763 (27.1%) | 25,601 (7.2%) |
| 3-Person Households | 45,123 (12.8%) | 3,493 (1.0%) |
| 4-Person Households | 42,616 (12.0%) | 1,755 (0.5%) |
| 5-Person Households | 20,735 (5.9%) | 310 (0.1%) |
| 6-Person Households | 7,017 (2.0%) | 30 (0.0%) |
| 7+ Person Households | 3,388 (1.0%) | 6 (0.0%) |
| Total | 214,642 (60.7%) | 139,066 (39.3%) |
Female Fertility in Area Code 515
Fertility by Age in Area Code 515
Average fertility rate in Area Code 515 is 80.7 births per 1,000 women. Women in the age bracket of 15 to 19 years have the highest fertility rate with 202.0 births per 1,000 women. Women in the age bracket of 20 to 34 years acount for 74.1% of all women with births.
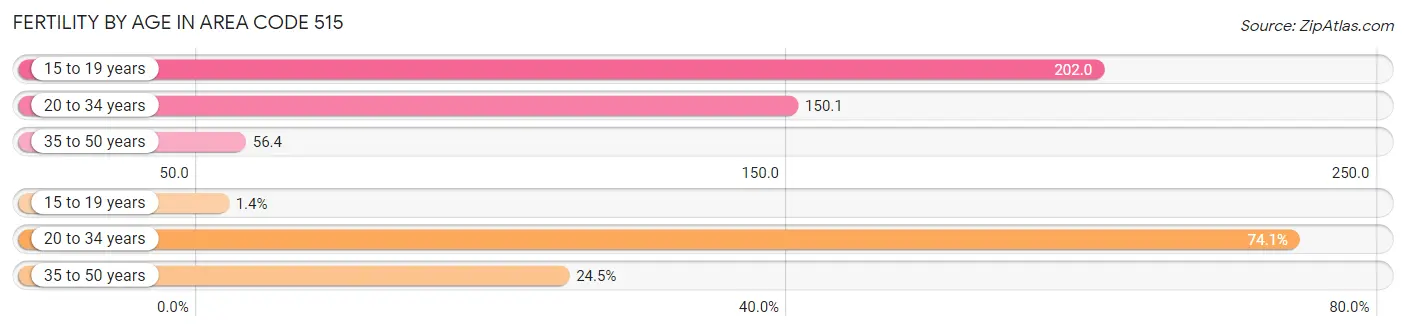
| Age Bracket | Women with Births | Births / 1,000 Women |
| 15 to 19 years | 152 (1.4%) | 202.0 |
| 20 to 34 years | 8,067 (74.1%) | 150.1 |
| 35 to 50 years | 2,668 (24.5%) | 56.4 |
| Total | 10,887 (100.0%) | 80.7 |
Fertility by Age by Marriage Status in Area Code 515
59.1% of women with births (10,887) in Area Code 515 are married. The highest percentage of unmarried women with births falls into 15 to 19 years age bracket with 90.8% of them unmarried at the time of birth, while the lowest percentage of unmarried women with births belong to 20 to 34 years age bracket with 44.2% of them unmarried.
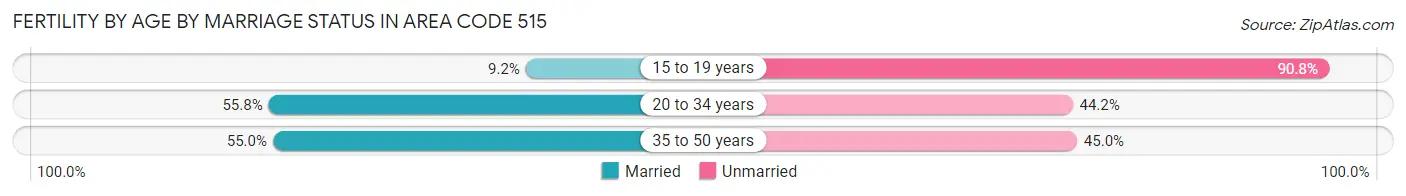
| Age Bracket | Married | Unmarried |
| 15 to 19 years | 14 (9.2%) | 138 (90.8%) |
| 20 to 34 years | 4,502 (55.8%) | 3,565 (44.2%) |
| 35 to 50 years | 1,468 (55.0%) | 1,200 (45.0%) |
| Total | 6,430 (59.1%) | 4,457 (40.9%) |
Fertility by Education in Area Code 515
Average fertility rate in Area Code 515 is 80.7 births per 1,000 women. Women with the education attainment of graduate degree have the highest fertility rate of 164.6 births per 1,000 women, while women with the education attainment of less than high school have the lowest fertility at 86.9 births per 1,000 women. Women with the education attainment of college or associate's degree represent 29.2% of all women with births.
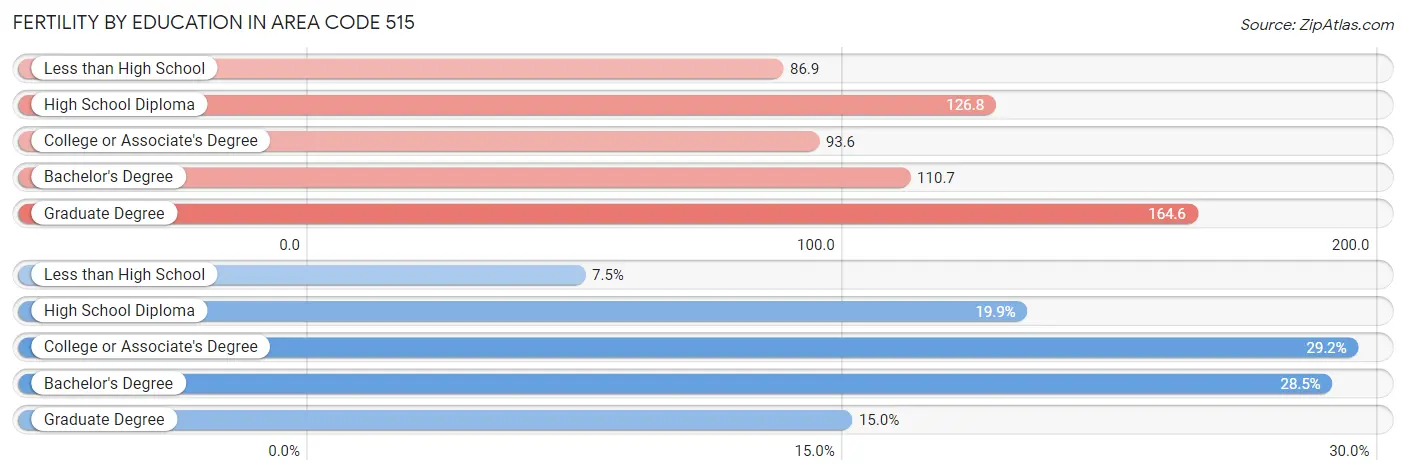
| Educational Attainment | Women with Births | Births / 1,000 Women |
| Less than High School | 813 (7.5%) | 86.9 |
| High School Diploma | 2,166 (19.9%) | 126.8 |
| College or Associate's Degree | 3,179 (29.2%) | 93.6 |
| Bachelor's Degree | 3,099 (28.5%) | 110.7 |
| Graduate Degree | 1,630 (15.0%) | 164.6 |
| Total | 10,887 (100.0%) | 80.7 |
Fertility by Education by Marriage Status in Area Code 515
40.9% of women with births in Area Code 515 are unmarried. Women with the educational attainment of bachelor's degree are most likely to be married with 54.4% of them married at childbirth, while women with the educational attainment of less than high school are least likely to be married with 75.5% of them unmarried at childbirth.
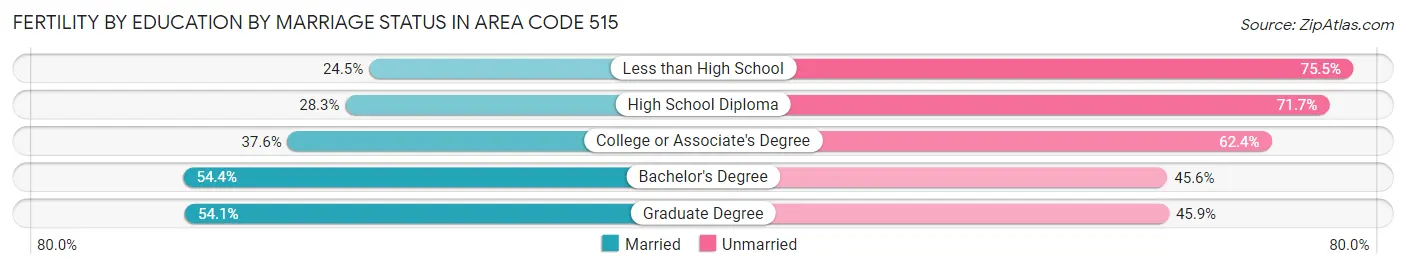
| Educational Attainment | Married | Unmarried |
| Less than High School | 199 (24.5%) | 614 (75.5%) |
| High School Diploma | 613 (28.3%) | 1,553 (71.7%) |
| College or Associate's Degree | 1,196 (37.6%) | 1,983 (62.4%) |
| Bachelor's Degree | 1,685 (54.4%) | 1,414 (45.6%) |
| Graduate Degree | 882 (54.1%) | 748 (45.9%) |
| Total | 6,430 (59.1%) | 4,457 (40.9%) |
Employment Characteristics in Area Code 515
Employment by Class of Employer in Area Code 515
Among the 456,424 employed individuals in Area Code 515, private company employees (310,176 | 68.0%), not-for-profit organizations (39,213 | 8.6%), and local government employees (29,504 | 6.5%) make up the most common classes of employment.
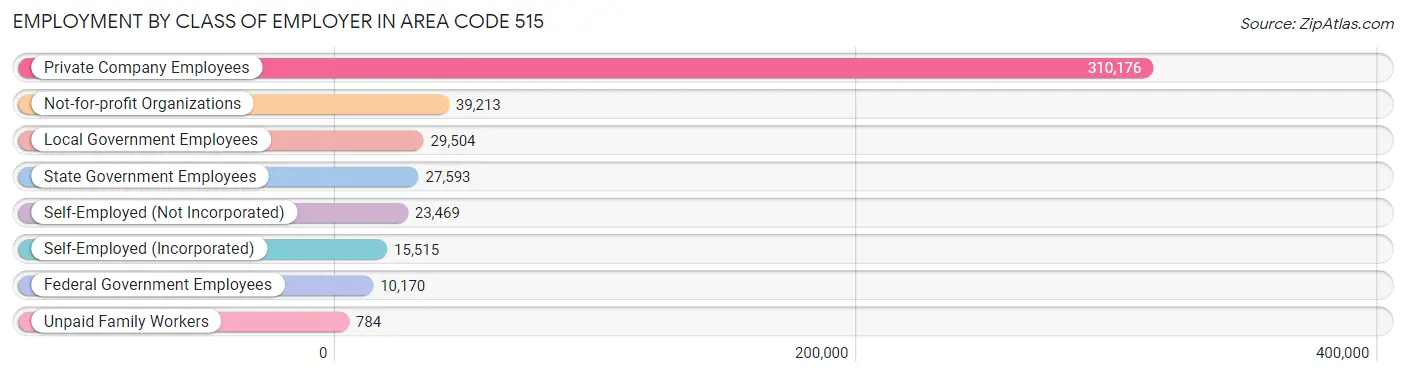
| Employer Class | # Employees | % Employees |
| Private Company Employees | 310,176 | 68.0% |
| Self-Employed (Incorporated) | 15,515 | 3.4% |
| Self-Employed (Not Incorporated) | 23,469 | 5.1% |
| Not-for-profit Organizations | 39,213 | 8.6% |
| Local Government Employees | 29,504 | 6.5% |
| State Government Employees | 27,593 | 6.0% |
| Federal Government Employees | 10,170 | 2.2% |
| Unpaid Family Workers | 784 | 0.2% |
| Total | 456,424 | 100.0% |
Employment Status by Age in Area Code 515
According to the labor force statistics for Area Code 515, out of the total population over 16 years of age (696,830), 67.2% or 468,270 individuals are in the labor force, with 4.1% or 19,105 of them unemployed. The age group with the highest labor force participation rate is 35 to 44 years, with 89.1% or 106,040 individuals in the labor force. Within the labor force, the 16 to 19 years age range has the highest percentage of unemployed individuals, with 1,369.1% or 377,776 of them being unemployed.
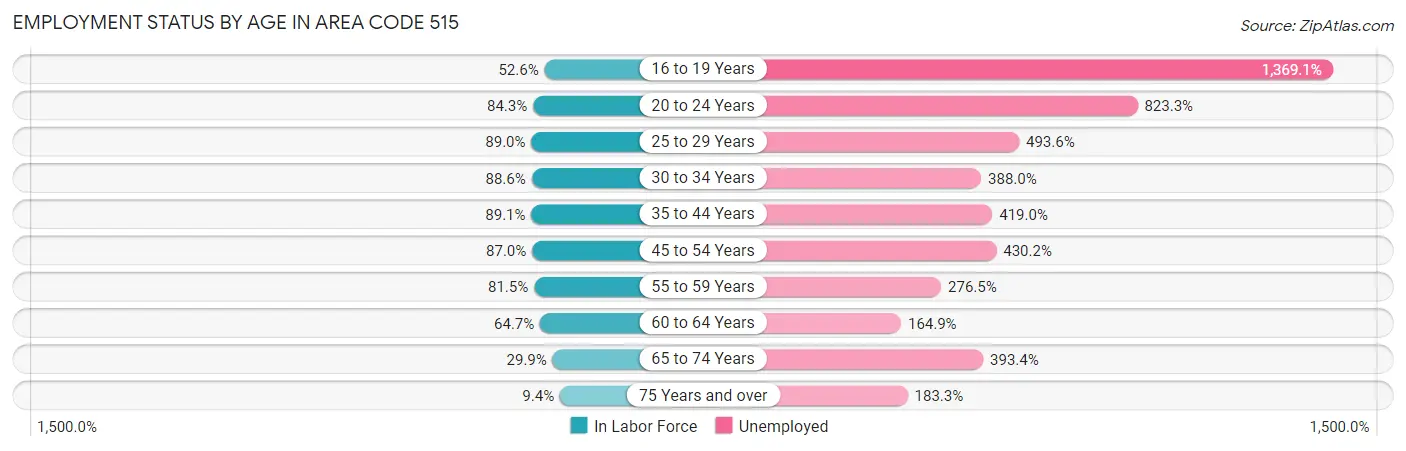
| Age Bracket | In Labor Force | Unemployed |
| 16 to 19 Years | 27,595 (52.5%) | 377,776 (1,369.1%) |
| 20 to 24 Years | 59,074 (84.3%) | 486,340 (823.3%) |
| 25 to 29 Years | 55,327 (89.0%) | 273,084 (493.6%) |
| 30 to 34 Years | 53,509 (88.5%) | 207,603 (388.0%) |
| 35 to 44 Years | 106,039 (89.1%) | 444,308 (419.0%) |
| 45 to 54 Years | 88,356 (87.0%) | 380,108 (430.2%) |
| 55 to 59 Years | 42,781 (81.5%) | 118,284 (276.5%) |
| 60 to 64 Years | 32,802 (64.7%) | 54,092 (164.9%) |
| 65 to 74 Years | 22,560 (29.9%) | 88,763 (393.4%) |
| 75 Years and over | 4,928 (9.4%) | 9,035 (183.3%) |
| Total | 468,280 (67.2%) | 19,116 (4.1%) |
Employment Status by Educational Attainment in Area Code 515
According to labor force statistics for Area Code 515, 84.1% of individuals (375,220) out of the total population between 25 and 64 years of age (446,372) are in the labor force, with 382.5% or 1,435,216 of them being unemployed. The group with the highest labor force participation rate are those with the educational attainment of bachelor's degree or higher, with 91.2% or 165,814 individuals in the labor force. Within the labor force, individuals with less than high school education have the highest percentage of unemployment, with 966.3% or 173,518 of them being unemployed.
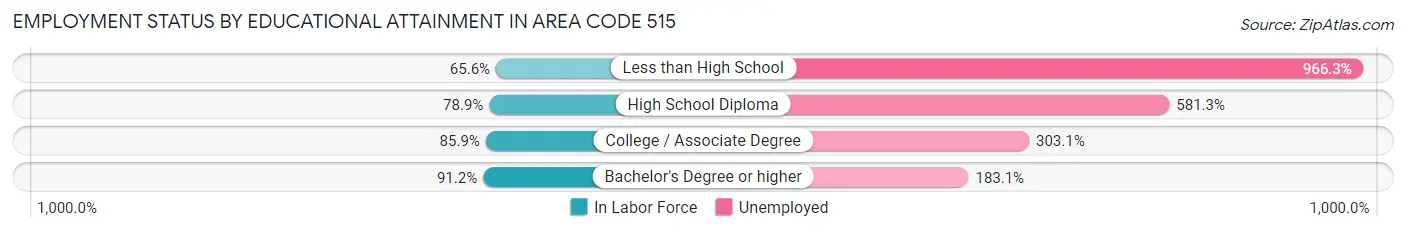
| Educational Attainment | In Labor Force | Unemployed |
| Less than High School | 17,957 (65.5%) | 264,718 (966.3%) |
| High School Diploma | 78,530 (78.9%) | 578,254 (581.3%) |
| College / Associate Degree | 118,240 (85.9%) | 417,269 (303.1%) |
| Bachelor's Degree or higher | 165,816 (91.2%) | 332,938 (183.1%) |
| Total | 375,224 (84.1%) | 1,707,373 (382.5%) |
Employment Occupations by Sex in Area Code 515
Management, Business, Science and Arts Occupations
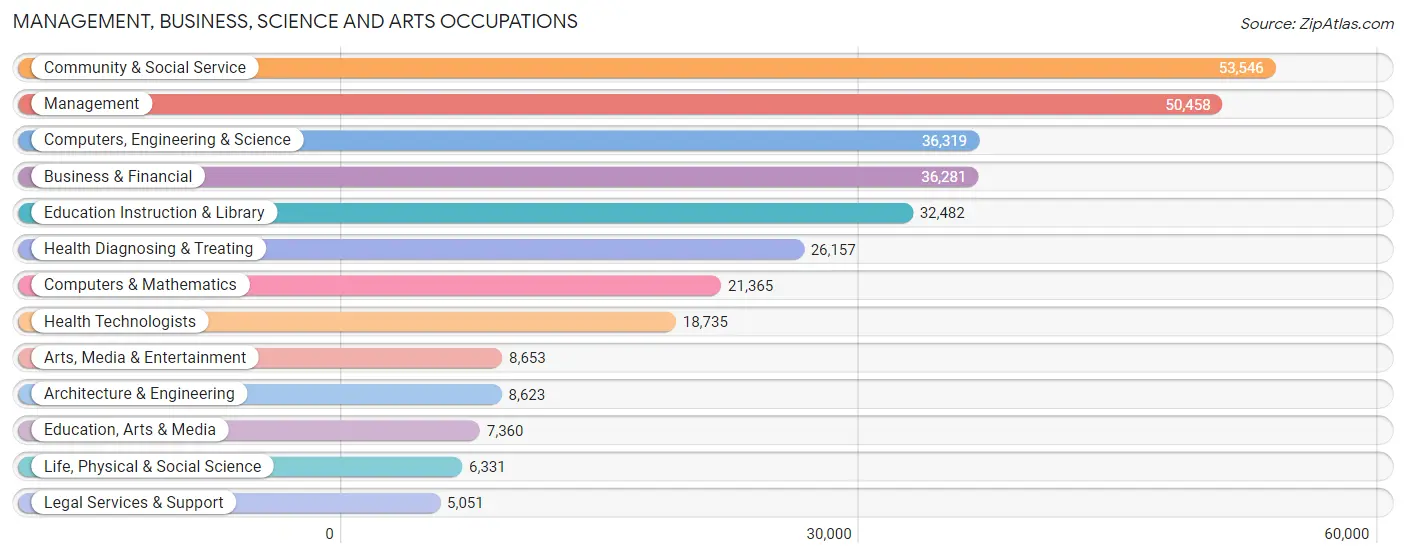
The most common Management, Business, Science and Arts occupations in Area Code 515 are Community & Social Service (53,546 | 11.5%), Management (50,458 | 10.9%), Computers, Engineering & Science (36,319 | 7.8%), Business & Financial (36,281 | 7.8%), and Education Instruction & Library (32,482 | 7.0%).
Management, Business, Science and Arts Occupations by Sex
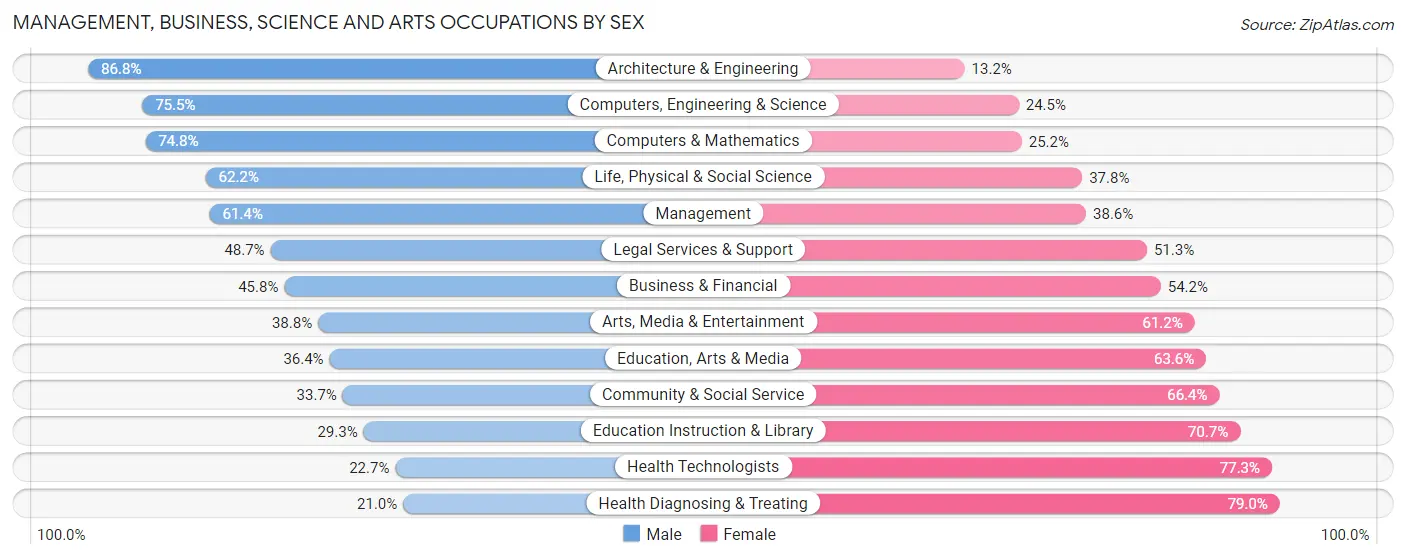
Within the Management, Business, Science and Arts occupations in Area Code 515, the most male-oriented occupations are Architecture & Engineering (86.8%), Computers, Engineering & Science (75.5%), and Computers & Mathematics (74.8%), while the most female-oriented occupations are Health Diagnosing & Treating (79.0%), Health Technologists (77.3%), and Education Instruction & Library (70.7%).
| Occupation | Male | Female |
| Management | 30,992 (61.4%) | 19,466 (38.6%) |
| Business & Financial | 16,633 (45.8%) | 19,648 (54.2%) |
| Computers, Engineering & Science | 27,408 (75.5%) | 8,911 (24.5%) |
| Computers & Mathematics | 15,987 (74.8%) | 5,378 (25.2%) |
| Architecture & Engineering | 7,481 (86.8%) | 1,142 (13.2%) |
| Life, Physical & Social Science | 3,940 (62.2%) | 2,391 (37.8%) |
| Community & Social Service | 18,019 (33.7%) | 35,527 (66.3%) |
| Education, Arts & Media | 2,680 (36.4%) | 4,680 (63.6%) |
| Legal Services & Support | 2,461 (48.7%) | 2,590 (51.3%) |
| Education Instruction & Library | 9,521 (29.3%) | 22,961 (70.7%) |
| Arts, Media & Entertainment | 3,357 (38.8%) | 5,296 (61.2%) |
| Health Diagnosing & Treating | 5,504 (21.0%) | 20,653 (79.0%) |
| Health Technologists | 4,250 (22.7%) | 14,485 (77.3%) |
| Total (Category) | 98,556 (48.6%) | 104,205 (51.4%) |
| Total (Overall) | 246,511 (53.0%) | 218,195 (46.9%) |
Services Occupations
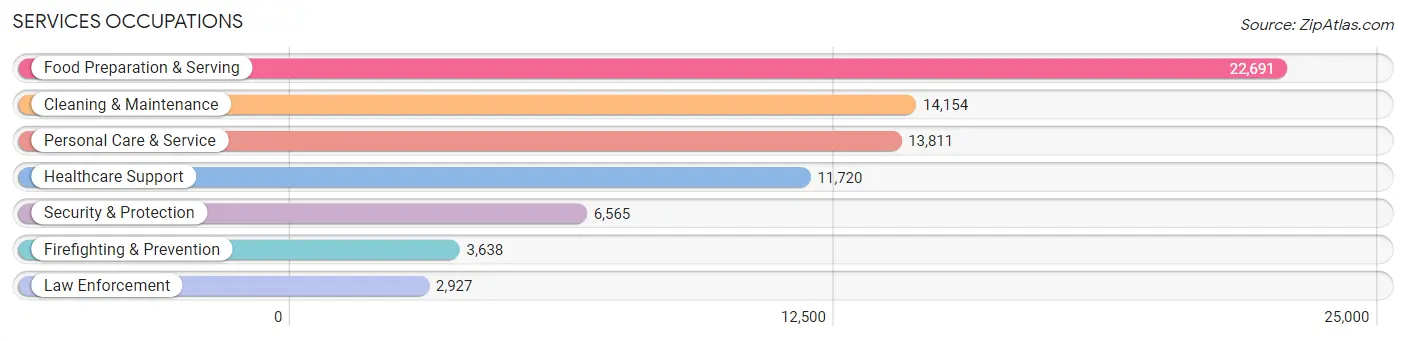
The most common Services occupations in Area Code 515 are Food Preparation & Serving (22,691 | 4.9%), Cleaning & Maintenance (14,154 | 3.0%), Personal Care & Service (13,811 | 3.0%), Healthcare Support (11,720 | 2.5%), and Security & Protection (6,565 | 1.4%).
Services Occupations by Sex
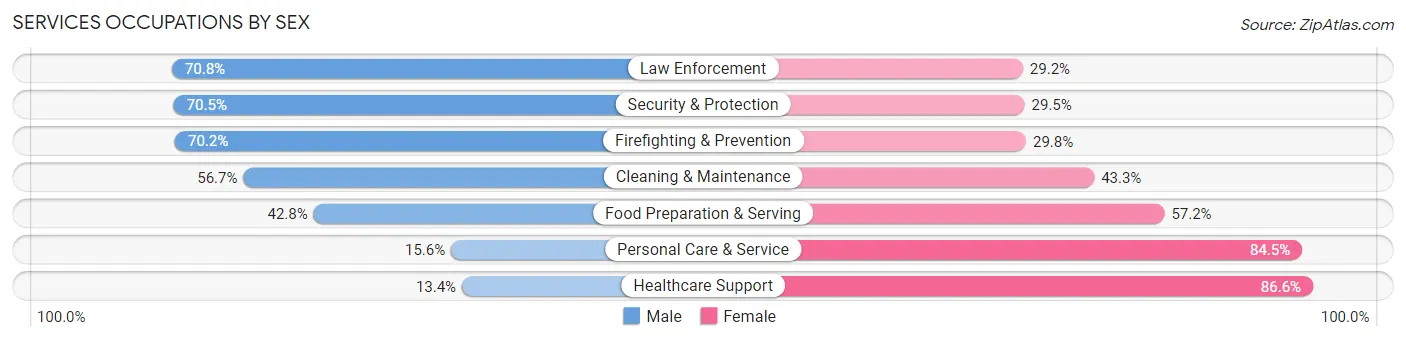
Within the Services occupations in Area Code 515, the most male-oriented occupations are Law Enforcement (70.8%), Security & Protection (70.5%), and Firefighting & Prevention (70.2%), while the most female-oriented occupations are Healthcare Support (86.6%), Personal Care & Service (84.5%), and Food Preparation & Serving (57.2%).
| Occupation | Male | Female |
| Healthcare Support | 1,571 (13.4%) | 10,149 (86.6%) |
| Security & Protection | 4,627 (70.5%) | 1,938 (29.5%) |
| Firefighting & Prevention | 2,554 (70.2%) | 1,084 (29.8%) |
| Law Enforcement | 2,073 (70.8%) | 854 (29.2%) |
| Food Preparation & Serving | 9,709 (42.8%) | 12,982 (57.2%) |
| Cleaning & Maintenance | 8,025 (56.7%) | 6,129 (43.3%) |
| Personal Care & Service | 2,147 (15.5%) | 11,664 (84.5%) |
| Total (Category) | 26,079 (37.8%) | 42,862 (62.2%) |
| Total (Overall) | 246,511 (53.0%) | 218,195 (46.9%) |
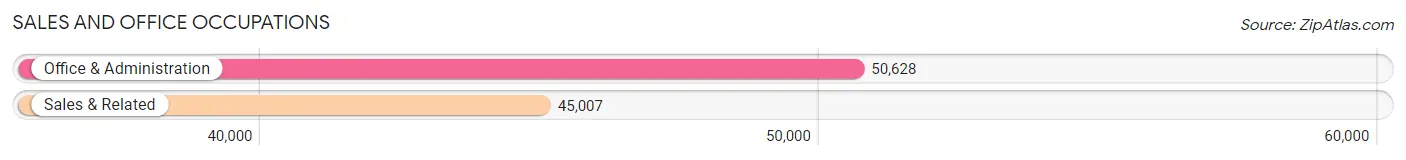
Sales and Office Occupations
The most common Sales and Office occupations in Area Code 515 are Office & Administration (50,628 | 10.9%), and Sales & Related (45,007 | 9.7%).
Sales and Office Occupations by Sex
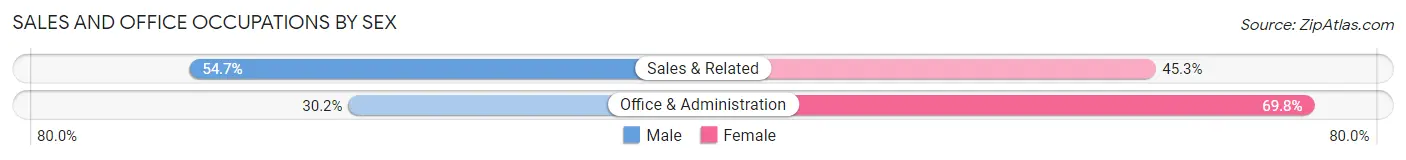
| Occupation | Male | Female |
| Sales & Related | 24,601 (54.7%) | 20,406 (45.3%) |
| Office & Administration | 15,286 (30.2%) | 35,342 (69.8%) |
| Total (Category) | 39,887 (41.7%) | 55,748 (58.3%) |
| Total (Overall) | 246,511 (53.0%) | 218,195 (46.9%) |
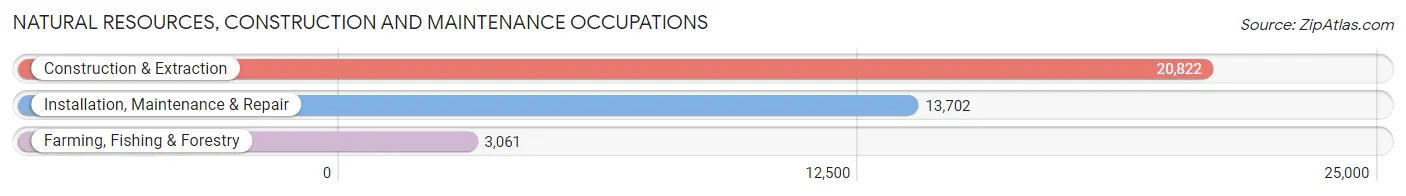
Natural Resources, Construction and Maintenance Occupations
The most common Natural Resources, Construction and Maintenance occupations in Area Code 515 are Construction & Extraction (20,822 | 4.5%), Installation, Maintenance & Repair (13,702 | 2.9%), and Farming, Fishing & Forestry (3,061 | 0.7%).
Natural Resources, Construction and Maintenance Occupations by Sex
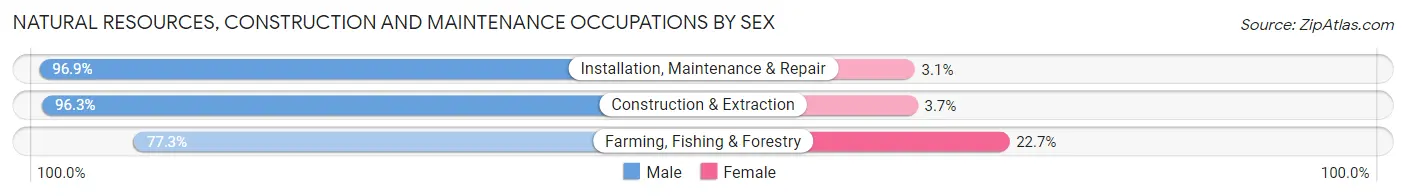
| Occupation | Male | Female |
| Farming, Fishing & Forestry | 2,365 (77.3%) | 696 (22.7%) |
| Construction & Extraction | 20,060 (96.3%) | 762 (3.7%) |
| Installation, Maintenance & Repair | 13,281 (96.9%) | 421 (3.1%) |
| Total (Category) | 35,706 (95.0%) | 1,879 (5.0%) |
| Total (Overall) | 246,511 (53.0%) | 218,195 (46.9%) |
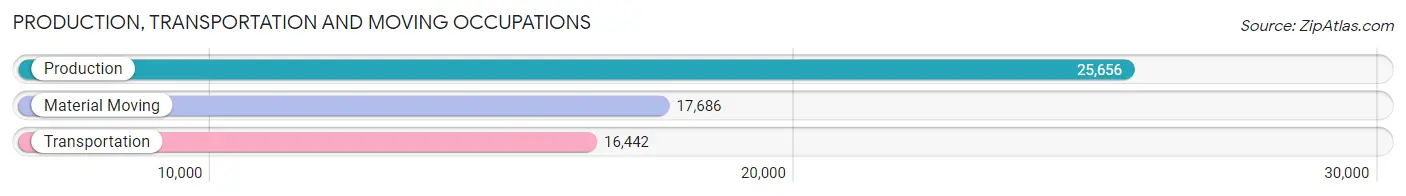
Production, Transportation and Moving Occupations
The most common Production, Transportation and Moving occupations in Area Code 515 are Production (25,656 | 5.5%), Material Moving (17,686 | 3.8%), and Transportation (16,442 | 3.5%).
Production, Transportation and Moving Occupations by Sex
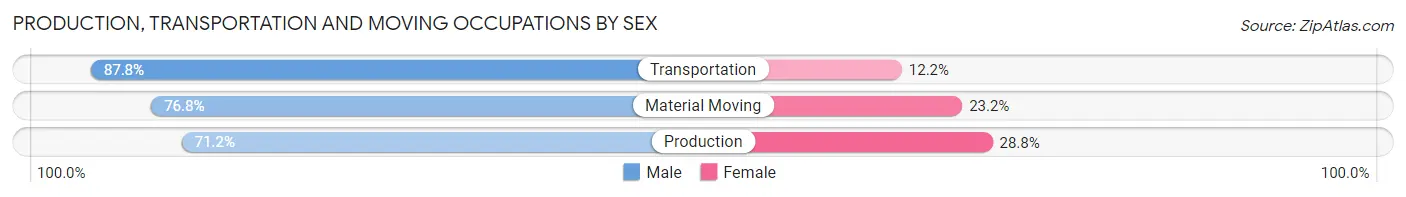
| Occupation | Male | Female |
| Production | 18,267 (71.2%) | 7,389 (28.8%) |
| Transportation | 14,441 (87.8%) | 2,001 (12.2%) |
| Material Moving | 13,575 (76.8%) | 4,111 (23.2%) |
| Total (Category) | 46,283 (77.4%) | 13,501 (22.6%) |
| Total (Overall) | 246,511 (53.0%) | 218,195 (46.9%) |
Employment Industries by Sex in Area Code 515
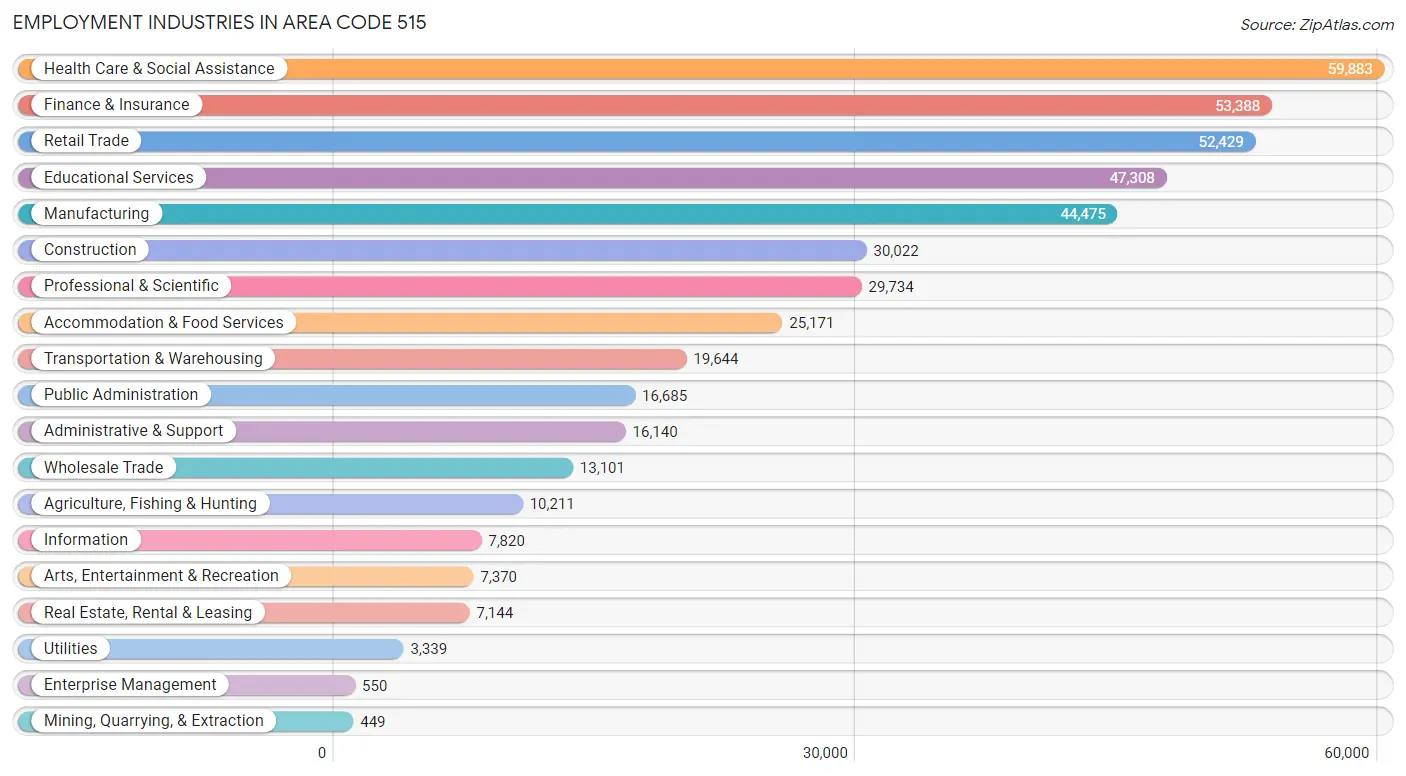
Employment Industries in Area Code 515
The major employment industries in Area Code 515 include Health Care & Social Assistance (59,883 | 12.9%), Finance & Insurance (53,388 | 11.5%), Retail Trade (52,429 | 11.3%), Educational Services (47,308 | 10.2%), and Manufacturing (44,475 | 9.6%).
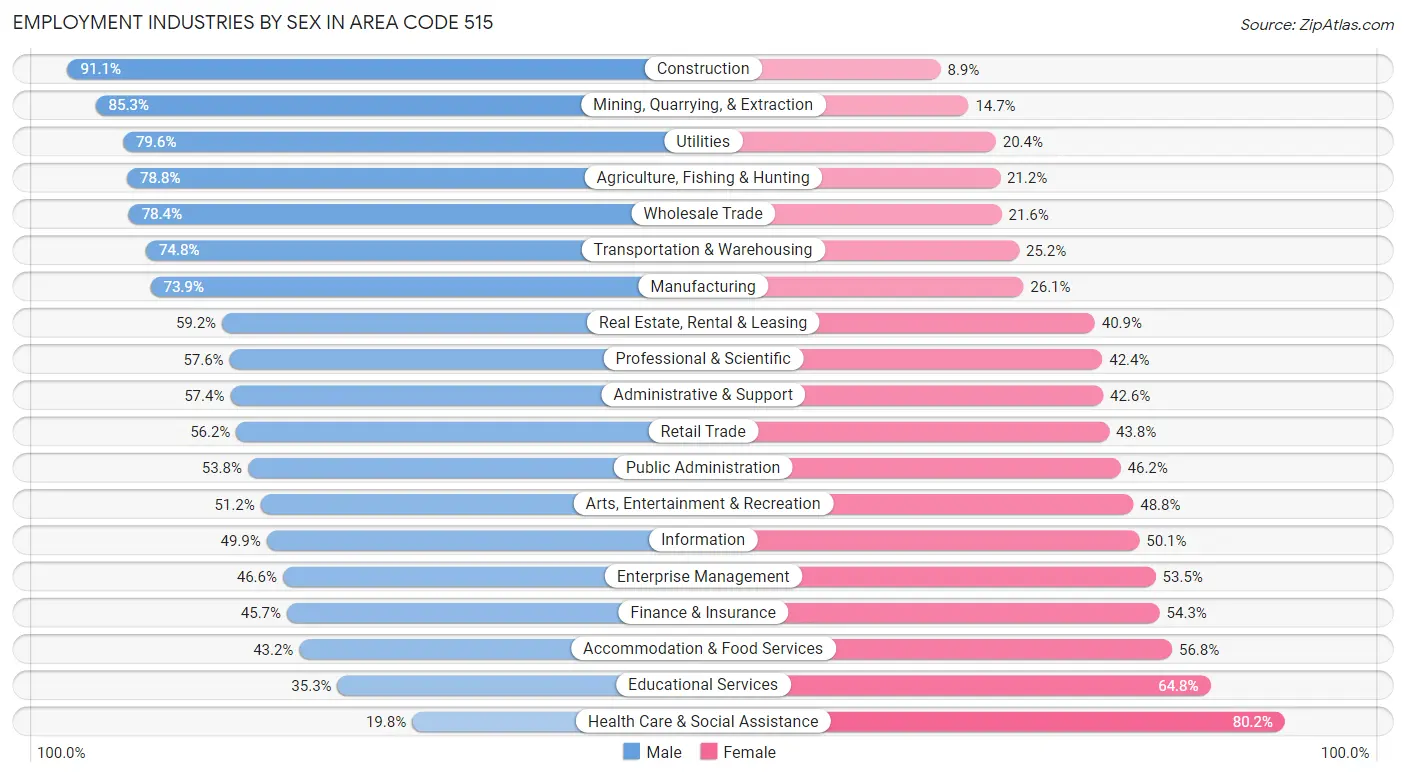
Employment Industries by Sex in Area Code 515
The Area Code 515 industries that see more men than women are Construction (91.1%), Mining, Quarrying, & Extraction (85.3%), and Utilities (79.6%), whereas the industries that tend to have a higher number of women are Health Care & Social Assistance (80.2%), Educational Services (64.7%), and Accommodation & Food Services (56.8%).
| Industry | Male | Female |
| Agriculture, Fishing & Hunting | 8,043 (78.8%) | 2,168 (21.2%) |
| Mining, Quarrying, & Extraction | 383 (85.3%) | 66 (14.7%) |
| Construction | 27,344 (91.1%) | 2,678 (8.9%) |
| Manufacturing | 32,882 (73.9%) | 11,593 (26.1%) |
| Wholesale Trade | 10,277 (78.4%) | 2,824 (21.6%) |
| Retail Trade | 29,463 (56.2%) | 22,966 (43.8%) |
| Transportation & Warehousing | 14,699 (74.8%) | 4,945 (25.2%) |
| Utilities | 2,659 (79.6%) | 680 (20.4%) |
| Information | 3,904 (49.9%) | 3,916 (50.1%) |
| Finance & Insurance | 24,410 (45.7%) | 28,978 (54.3%) |
| Real Estate, Rental & Leasing | 4,226 (59.2%) | 2,918 (40.8%) |
| Professional & Scientific | 17,127 (57.6%) | 12,607 (42.4%) |
| Enterprise Management | 256 (46.6%) | 294 (53.4%) |
| Administrative & Support | 9,271 (57.4%) | 6,869 (42.6%) |
| Educational Services | 16,676 (35.2%) | 30,632 (64.7%) |
| Health Care & Social Assistance | 11,871 (19.8%) | 48,012 (80.2%) |
| Arts, Entertainment & Recreation | 3,772 (51.2%) | 3,598 (48.8%) |
| Accommodation & Food Services | 10,863 (43.2%) | 14,308 (56.8%) |
| Public Administration | 8,976 (53.8%) | 7,709 (46.2%) |
| Total | 246,511 (53.0%) | 218,195 (46.9%) |
Education in Area Code 515
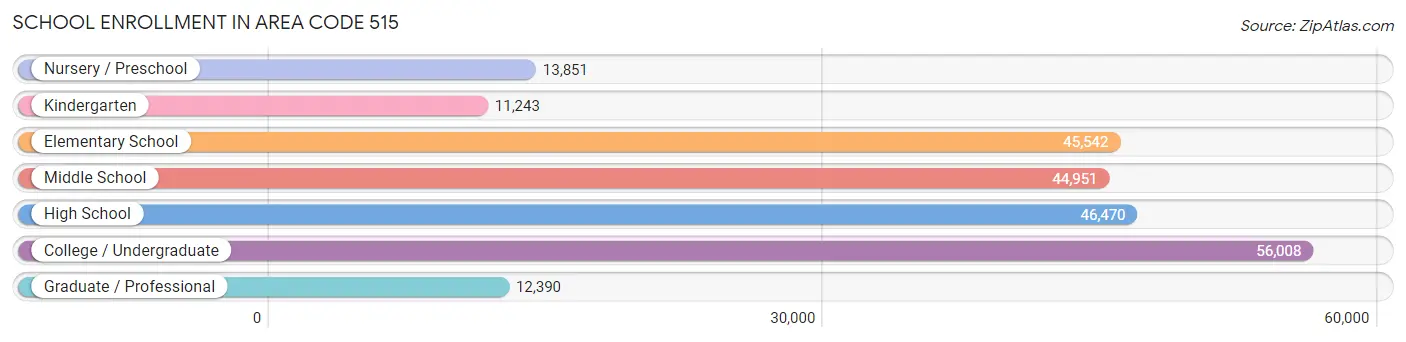
School Enrollment in Area Code 515
The most common levels of schooling among the 230,455 students in Area Code 515 are college / undergraduate (56,008 | 24.3%), high school (46,470 | 20.2%), and elementary school (45,542 | 19.8%).
| School Level | # Students | % Students |
| Nursery / Preschool | 13,851 | 6.0% |
| Kindergarten | 11,243 | 4.9% |
| Elementary School | 45,542 | 19.8% |
| Middle School | 44,951 | 19.5% |
| High School | 46,470 | 20.2% |
| College / Undergraduate | 56,008 | 24.3% |
| Graduate / Professional | 12,390 | 5.4% |
| Total | 230,455 | 100.0% |
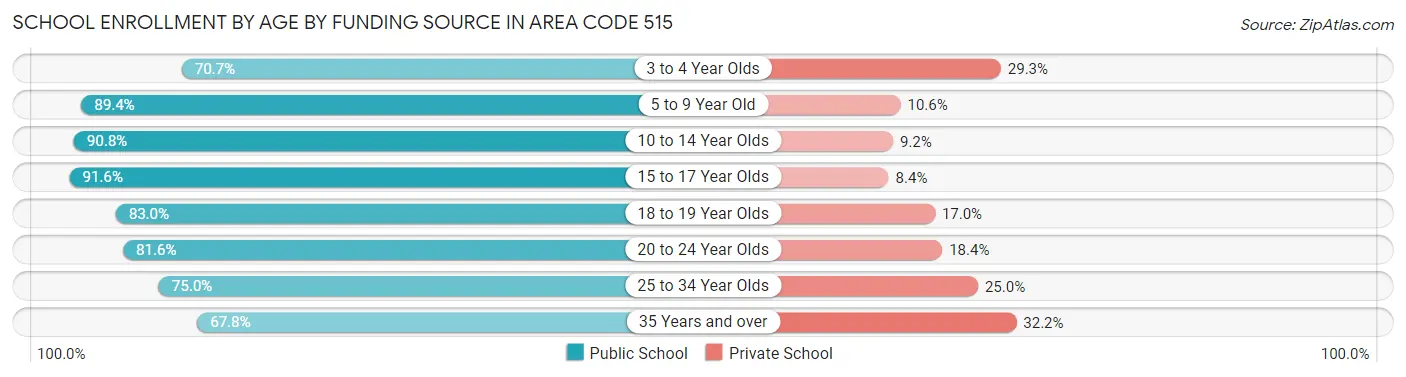
School Enrollment by Age by Funding Source in Area Code 515
Out of a total of 230,455 students who are enrolled in schools in Area Code 515, 32,159 (14.0%) attend a private institution, while the remaining 198,296 (86.1%) are enrolled in public schools. The age group of 35 years and over has the highest likelihood of being enrolled in private schools, with 2,695 (32.2% in the age bracket) enrolled. Conversely, the age group of 15 to 17 year olds has the lowest likelihood of being enrolled in a private school, with 30,910 (91.6% in the age bracket) attending a public institution.
| Age Bracket | Public School | Private School |
| 3 to 4 Year Olds | 6,428 (70.7%) | 2,661 (29.3%) |
| 5 to 9 Year Old | 49,690 (89.4%) | 5,887 (10.6%) |
| 10 to 14 Year Olds | 51,102 (90.8%) | 5,170 (9.2%) |
| 15 to 17 Year Olds | 30,910 (91.6%) | 2,828 (8.4%) |
| 18 to 19 Year Olds | 18,665 (83.0%) | 3,824 (17.0%) |
| 20 to 24 Year Olds | 26,224 (81.6%) | 5,898 (18.4%) |
| 25 to 34 Year Olds | 9,590 (75.0%) | 3,200 (25.0%) |
| 35 Years and over | 5,683 (67.8%) | 2,695 (32.2%) |
| Total | 198,296 (86.1%) | 32,159 (14.0%) |
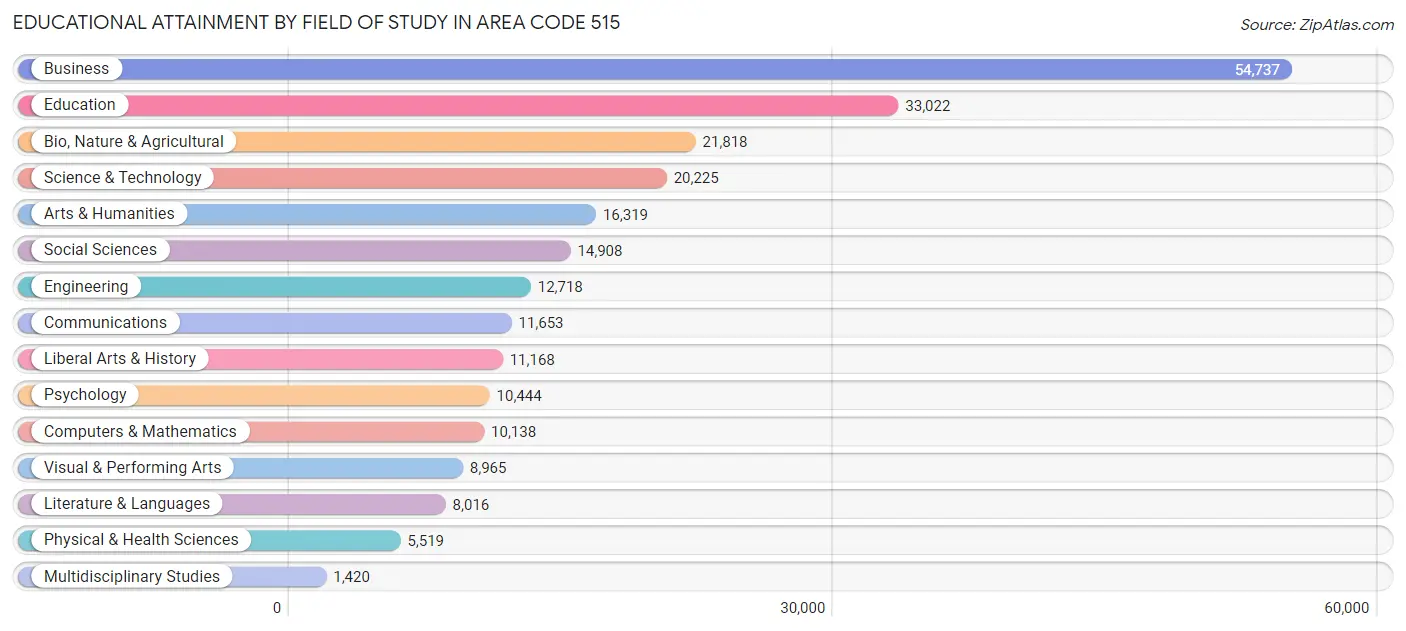
Educational Attainment by Field of Study in Area Code 515
Business (54,737 | 22.7%), education (33,022 | 13.7%), bio, nature & agricultural (21,818 | 9.0%), science & technology (20,225 | 8.4%), and arts & humanities (16,319 | 6.8%) are the most common fields of study among 241,070 individuals in Area Code 515 who have obtained a bachelor's degree or higher.
| Field of Study | # Graduates | % Graduates |
| Computers & Mathematics | 10,138 | 4.2% |
| Bio, Nature & Agricultural | 21,818 | 9.0% |
| Physical & Health Sciences | 5,519 | 2.3% |
| Psychology | 10,444 | 4.3% |
| Social Sciences | 14,908 | 6.2% |
| Engineering | 12,718 | 5.3% |
| Multidisciplinary Studies | 1,420 | 0.6% |
| Science & Technology | 20,225 | 8.4% |
| Business | 54,737 | 22.7% |
| Education | 33,022 | 13.7% |
| Literature & Languages | 8,016 | 3.3% |
| Liberal Arts & History | 11,168 | 4.6% |
| Visual & Performing Arts | 8,965 | 3.7% |
| Communications | 11,653 | 4.8% |
| Arts & Humanities | 16,319 | 6.8% |
| Total | 241,070 | 100.0% |
Transportation & Commute in Area Code 515
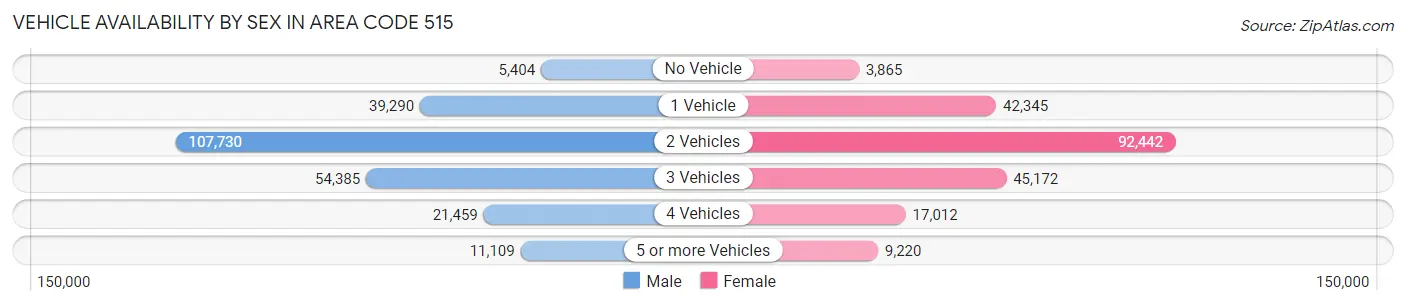
Vehicle Availability by Sex in Area Code 515
The most prevalent vehicle ownership categories in Area Code 515 are males with 2 vehicles (107,730, accounting for 45.0%) and females with 2 vehicles (92,442, making up 51.3%).
| Vehicles Available | Male | Female |
| No Vehicle | 5,404 (2.3%) | 3,865 (1.8%) |
| 1 Vehicle | 39,290 (16.4%) | 42,345 (20.2%) |
| 2 Vehicles | 107,730 (45.0%) | 92,442 (44.0%) |
| 3 Vehicles | 54,385 (22.7%) | 45,172 (21.5%) |
| 4 Vehicles | 21,459 (9.0%) | 17,012 (8.1%) |
| 5 or more Vehicles | 11,109 (4.6%) | 9,220 (4.4%) |
| Total | 239,377 (100.0%) | 210,056 (100.0%) |
Commute Time in Area Code 515
The most frequently occuring commute durations in Area Code 515 are 15 to 19 minutes (75,847 commuters, 18.8%), 10 to 14 minutes (69,551 commuters, 17.3%), and 20 to 24 minutes (68,984 commuters, 17.1%).
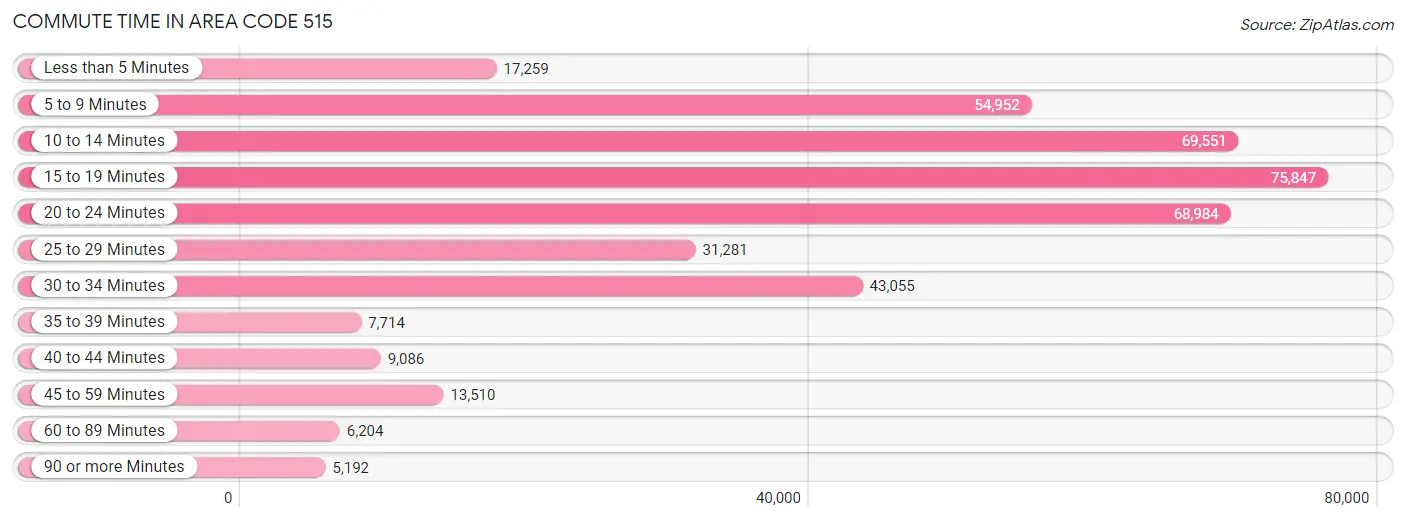
| Commute Time | # Commuters | % Commuters |
| Less than 5 Minutes | 17,259 | 4.3% |
| 5 to 9 Minutes | 54,952 | 13.7% |
| 10 to 14 Minutes | 69,551 | 17.3% |
| 15 to 19 Minutes | 75,847 | 18.8% |
| 20 to 24 Minutes | 68,984 | 17.1% |
| 25 to 29 Minutes | 31,281 | 7.8% |
| 30 to 34 Minutes | 43,055 | 10.7% |
| 35 to 39 Minutes | 7,714 | 1.9% |
| 40 to 44 Minutes | 9,086 | 2.3% |
| 45 to 59 Minutes | 13,510 | 3.4% |
| 60 to 89 Minutes | 6,204 | 1.5% |
| 90 or more Minutes | 5,192 | 1.3% |
Commute Time by Sex in Area Code 515
The most common commute times in Area Code 515 are 15 to 19 minutes (39,691 commuters, 18.3%) for males and 15 to 19 minutes (36,156 commuters, 19.5%) for females.
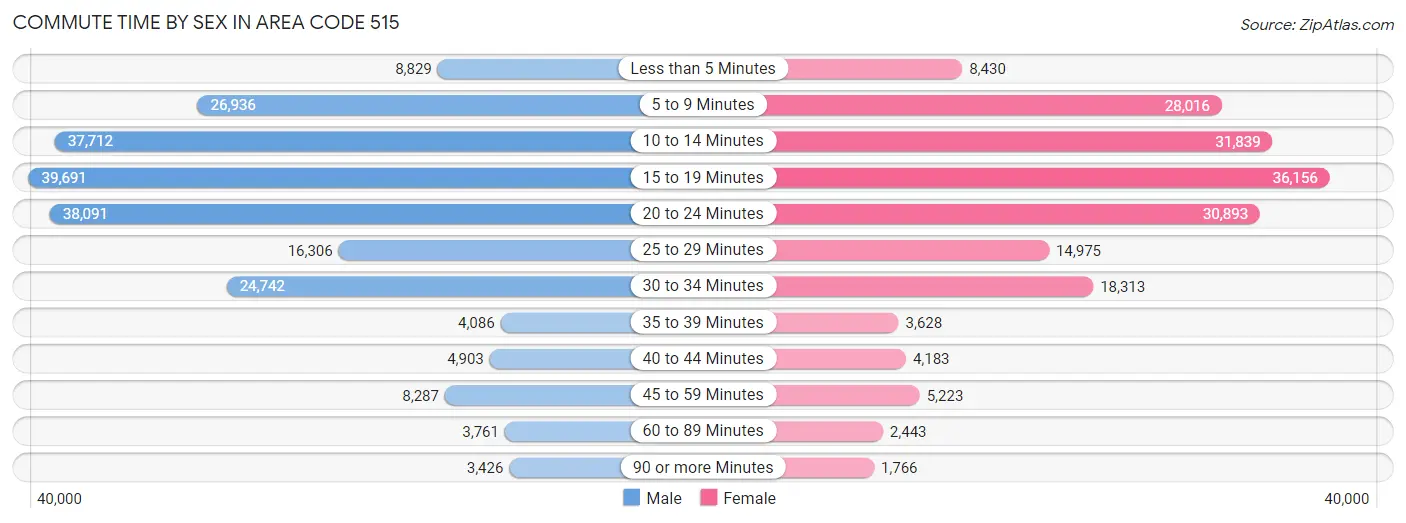
| Commute Time | Male | Female |
| Less than 5 Minutes | 8,829 (4.1%) | 8,430 (4.5%) |
| 5 to 9 Minutes | 26,936 (12.4%) | 28,016 (15.1%) |
| 10 to 14 Minutes | 37,712 (17.4%) | 31,839 (17.1%) |
| 15 to 19 Minutes | 39,691 (18.3%) | 36,156 (19.5%) |
| 20 to 24 Minutes | 38,091 (17.6%) | 30,893 (16.6%) |
| 25 to 29 Minutes | 16,306 (7.5%) | 14,975 (8.1%) |
| 30 to 34 Minutes | 24,742 (11.4%) | 18,313 (9.9%) |
| 35 to 39 Minutes | 4,086 (1.9%) | 3,628 (1.9%) |
| 40 to 44 Minutes | 4,903 (2.3%) | 4,183 (2.2%) |
| 45 to 59 Minutes | 8,287 (3.8%) | 5,223 (2.8%) |
| 60 to 89 Minutes | 3,761 (1.7%) | 2,443 (1.3%) |
| 90 or more Minutes | 3,426 (1.6%) | 1,766 (0.9%) |
Time of Departure to Work by Sex in Area Code 515
The most frequent times of departure to work in Area Code 515 are 7:00 AM to 7:29 AM (32,975, 15.2%) for males and 7:30 AM to 7:59 AM (34,782, 18.7%) for females.
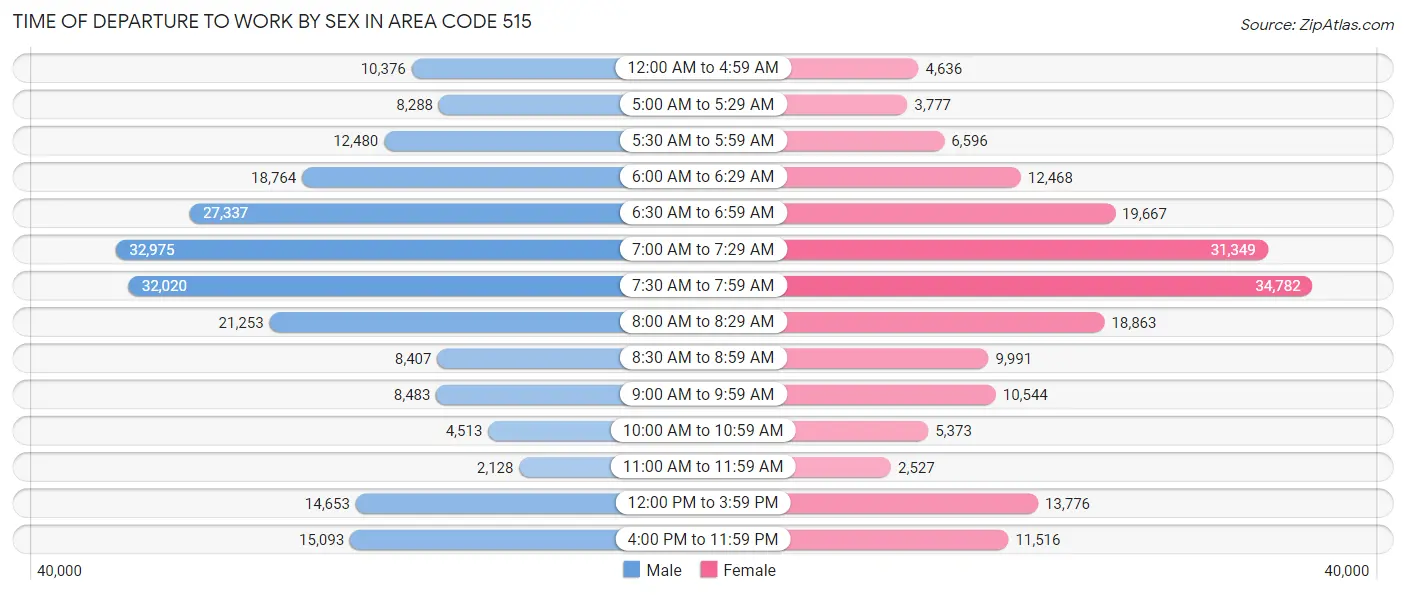
| Time of Departure | Male | Female |
| 12:00 AM to 4:59 AM | 10,376 (4.8%) | 4,636 (2.5%) |
| 5:00 AM to 5:29 AM | 8,288 (3.8%) | 3,777 (2.0%) |
| 5:30 AM to 5:59 AM | 12,480 (5.8%) | 6,596 (3.5%) |
| 6:00 AM to 6:29 AM | 18,764 (8.7%) | 12,468 (6.7%) |
| 6:30 AM to 6:59 AM | 27,337 (12.6%) | 19,667 (10.6%) |
| 7:00 AM to 7:29 AM | 32,975 (15.2%) | 31,349 (16.9%) |
| 7:30 AM to 7:59 AM | 32,020 (14.8%) | 34,782 (18.7%) |
| 8:00 AM to 8:29 AM | 21,253 (9.8%) | 18,863 (10.2%) |
| 8:30 AM to 8:59 AM | 8,407 (3.9%) | 9,991 (5.4%) |
| 9:00 AM to 9:59 AM | 8,483 (3.9%) | 10,544 (5.7%) |
| 10:00 AM to 10:59 AM | 4,513 (2.1%) | 5,373 (2.9%) |
| 11:00 AM to 11:59 AM | 2,128 (1.0%) | 2,527 (1.4%) |
| 12:00 PM to 3:59 PM | 14,653 (6.8%) | 13,776 (7.4%) |
| 4:00 PM to 11:59 PM | 15,093 (7.0%) | 11,516 (6.2%) |
| Total | 216,770 (100.0%) | 185,865 (100.0%) |
Housing Occupancy in Area Code 515
Occupancy by Ownership in Area Code 515
Of the total 353,708 dwellings in Area Code 515, owner-occupied units account for 240,698 (68.0%), while renter-occupied units make up 113,010 (32.0%).
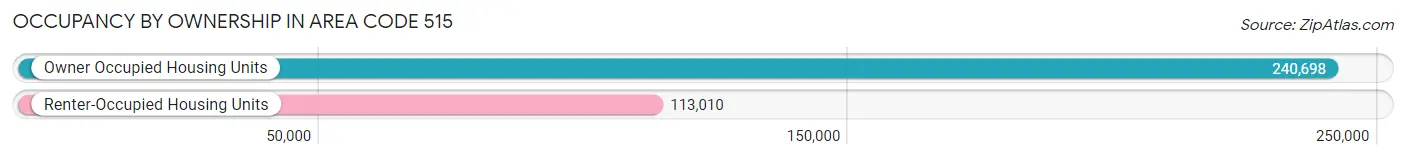
| Occupancy | # Housing Units | % Housing Units |
| Owner Occupied Housing Units | 240,698 | 68.0% |
| Renter-Occupied Housing Units | 113,010 | 32.0% |
| Total Occupied Housing Units | 353,708 | 100.0% |
Occupancy by Household Size in Area Code 515
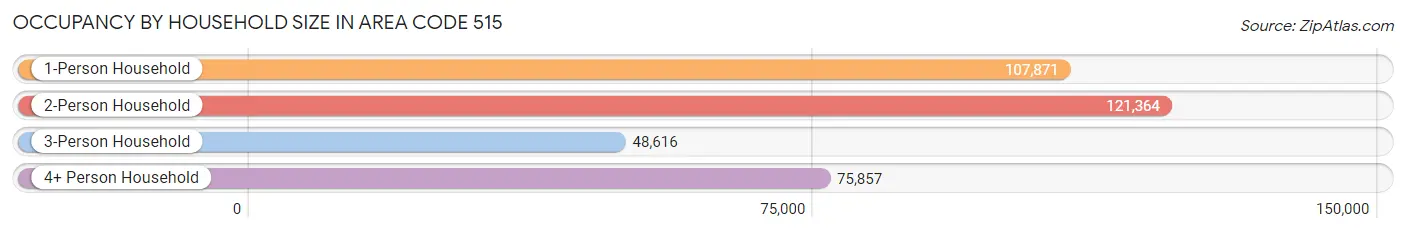
| Household Size | # Housing Units | % Housing Units |
| 1-Person Household | 107,871 | 30.5% |
| 2-Person Household | 121,364 | 34.3% |
| 3-Person Household | 48,616 | 13.7% |
| 4+ Person Household | 75,857 | 21.4% |
| Total Housing Units | 353,708 | 100.0% |
Occupancy by Ownership by Household Size in Area Code 515
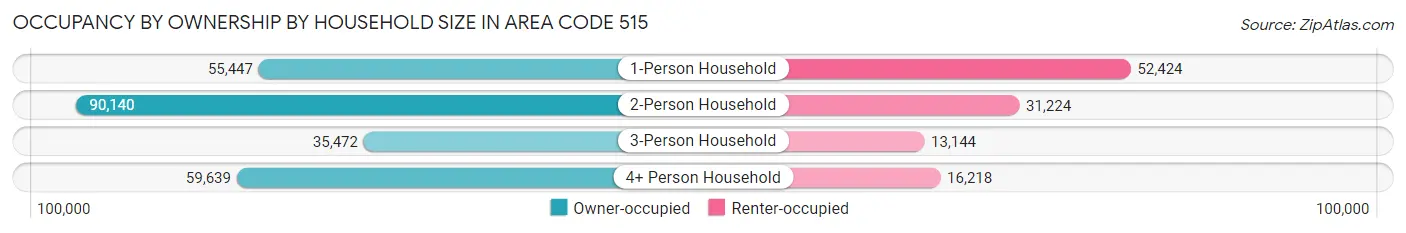
| Household Size | Owner-occupied | Renter-occupied |
| 1-Person Household | 55,447 (51.4%) | 52,424 (48.6%) |
| 2-Person Household | 90,140 (74.3%) | 31,224 (25.7%) |
| 3-Person Household | 35,472 (73.0%) | 13,144 (27.0%) |
| 4+ Person Household | 59,639 (78.6%) | 16,218 (21.4%) |
| Total Housing Units | 240,698 (68.0%) | 113,010 (32.0%) |
Occupancy by Educational Attainment in Area Code 515
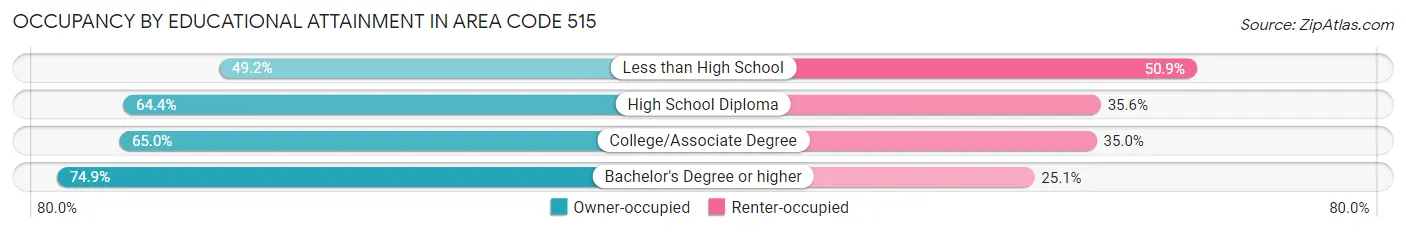
| Household Size | Owner-occupied | Renter-occupied |
| Less than High School | 8,765 (49.1%) | 9,068 (50.8%) |
| High School Diploma | 51,267 (64.4%) | 28,368 (35.6%) |
| College/Associate Degree | 74,133 (65.0%) | 39,873 (35.0%) |
| Bachelor's Degree or higher | 106,533 (74.9%) | 35,701 (25.1%) |
Occupancy by Age of Householder in Area Code 515
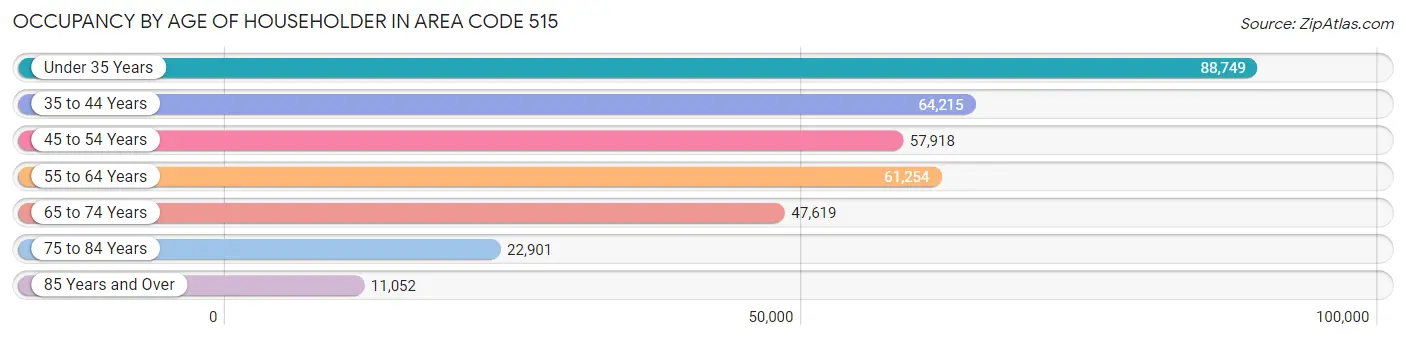
| Age Bracket | # Households | % Households |
| Under 35 Years | 88,749 | 25.1% |
| 35 to 44 Years | 64,215 | 18.1% |
| 45 to 54 Years | 57,918 | 16.4% |
| 55 to 64 Years | 61,254 | 17.3% |
| 65 to 74 Years | 47,619 | 13.5% |
| 75 to 84 Years | 22,901 | 6.5% |
| 85 Years and Over | 11,052 | 3.1% |
| Total | 353,708 | 100.0% |
Housing Finances in Area Code 515
Median Income by Occupancy in Area Code 515
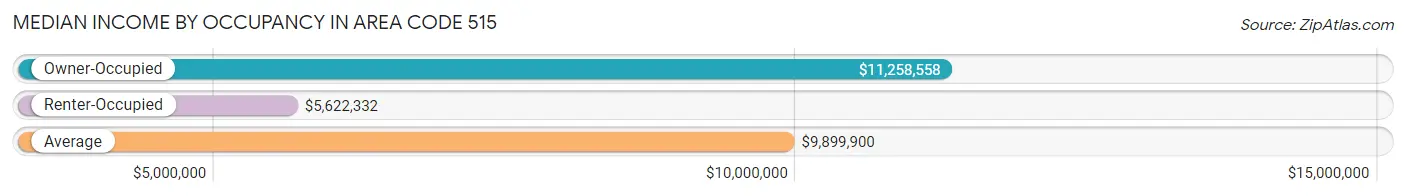
| Occupancy Type | # Households | Median Income |
| Owner-Occupied | 240,698 (68.0%) | $11,258,558 |
| Renter-Occupied | 113,010 (32.0%) | $5,622,332 |
| Average | 353,708 (100.0%) | $9,899,900 |
Occupancy by Householder Income Bracket in Area Code 515
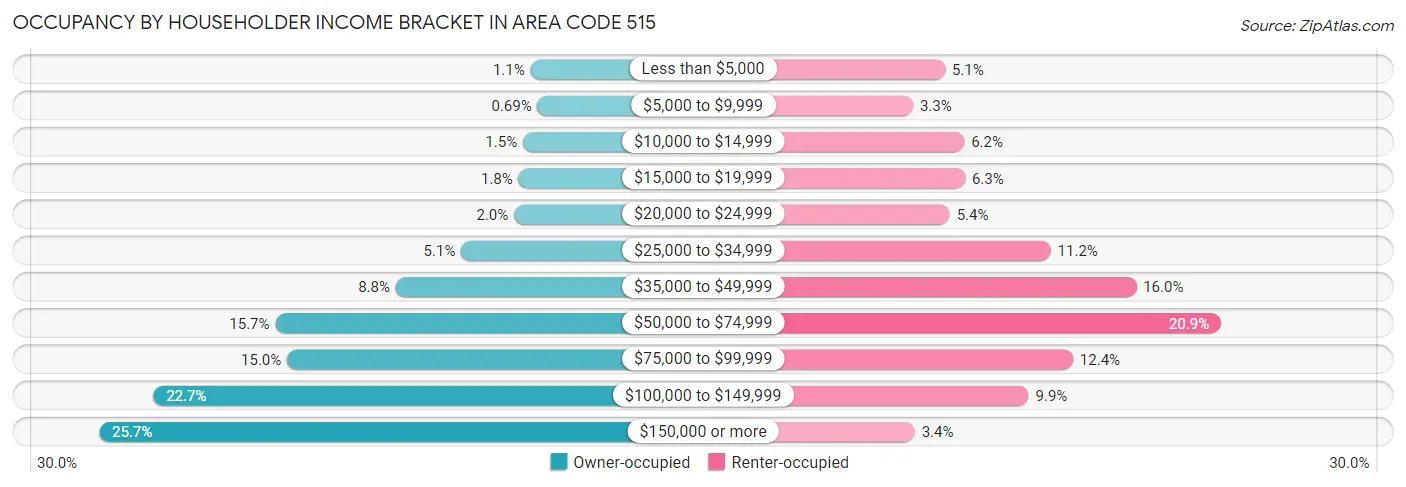
| Income Bracket | Owner-occupied | Renter-occupied |
| Less than $5,000 | 2,615 (1.1%) | 5,780 (5.1%) |
| $5,000 to $9,999 | 1,663 (0.7%) | 3,712 (3.3%) |
| $10,000 to $14,999 | 3,662 (1.5%) | 7,018 (6.2%) |
| $15,000 to $19,999 | 4,271 (1.8%) | 7,063 (6.2%) |
| $20,000 to $24,999 | 4,886 (2.0%) | 6,080 (5.4%) |
| $25,000 to $34,999 | 12,159 (5.1%) | 12,606 (11.2%) |
| $35,000 to $49,999 | 21,151 (8.8%) | 18,124 (16.0%) |
| $50,000 to $74,999 | 37,713 (15.7%) | 23,592 (20.9%) |
| $75,000 to $99,999 | 36,101 (15.0%) | 14,033 (12.4%) |
| $100,000 to $149,999 | 54,512 (22.7%) | 11,180 (9.9%) |
| $150,000 or more | 61,965 (25.7%) | 3,822 (3.4%) |
| Total | 240,698 (100.0%) | 113,010 (100.0%) |
Monthly Housing Cost Tiers in Area Code 515
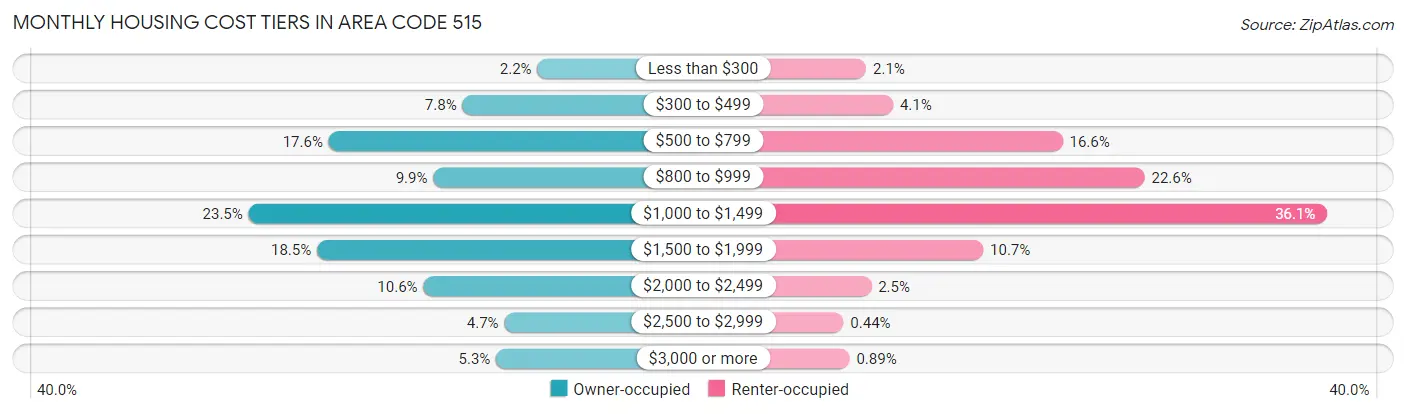
| Monthly Cost | Owner-occupied | Renter-occupied |
| Less than $300 | 5,370 (2.2%) | 2,383 (2.1%) |
| $300 to $499 | 18,662 (7.7%) | 4,617 (4.1%) |
| $500 to $799 | 42,356 (17.6%) | 18,742 (16.6%) |
| $800 to $999 | 23,819 (9.9%) | 25,566 (22.6%) |
| $1,000 to $1,499 | 56,568 (23.5%) | 40,765 (36.1%) |
| $1,500 to $1,999 | 44,421 (18.5%) | 12,124 (10.7%) |
| $2,000 to $2,499 | 25,593 (10.6%) | 2,817 (2.5%) |
| $2,500 to $2,999 | 11,221 (4.7%) | 497 (0.4%) |
| $3,000 or more | 12,688 (5.3%) | 1,007 (0.9%) |
| Total | 240,698 (100.0%) | 113,010 (100.0%) |
Physical Housing Characteristics in Area Code 515
Housing Structures in Area Code 515
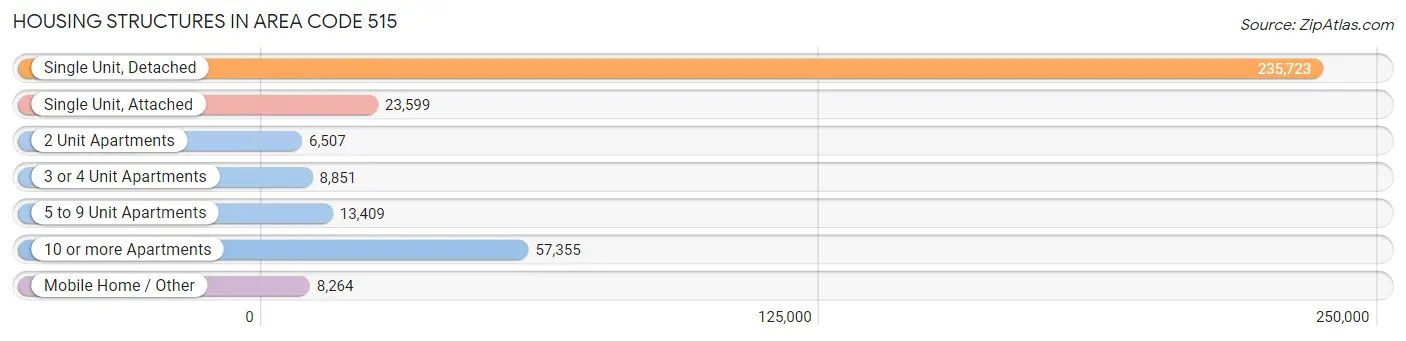
| Structure Type | # Housing Units | % Housing Units |
| Single Unit, Detached | 235,723 | 66.6% |
| Single Unit, Attached | 23,599 | 6.7% |
| 2 Unit Apartments | 6,507 | 1.8% |
| 3 or 4 Unit Apartments | 8,851 | 2.5% |
| 5 to 9 Unit Apartments | 13,409 | 3.8% |
| 10 or more Apartments | 57,355 | 16.2% |
| Mobile Home / Other | 8,264 | 2.3% |
| Total | 353,708 | 100.0% |
Housing Structures by Occupancy in Area Code 515
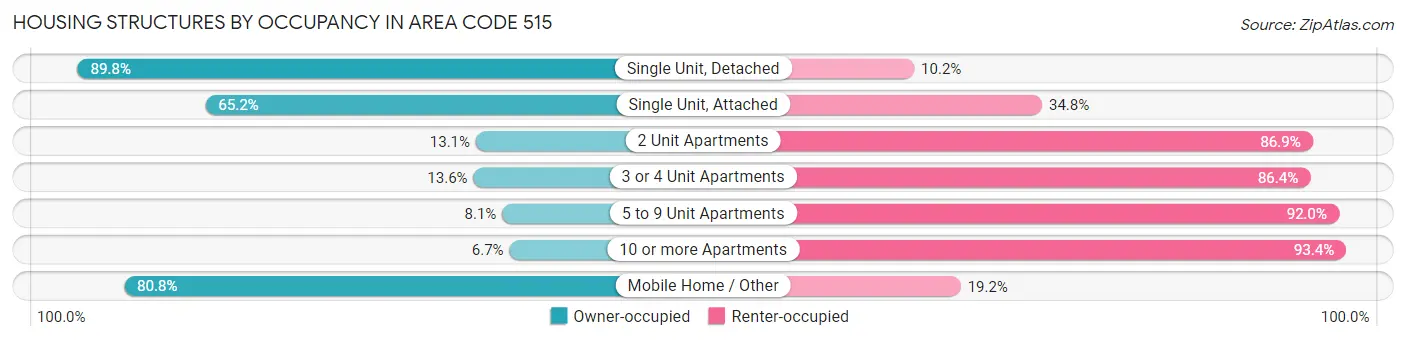
| Structure Type | Owner-occupied | Renter-occupied |
| Single Unit, Detached | 211,687 (89.8%) | 24,036 (10.2%) |
| Single Unit, Attached | 15,383 (65.2%) | 8,216 (34.8%) |
| 2 Unit Apartments | 853 (13.1%) | 5,654 (86.9%) |
| 3 or 4 Unit Apartments | 1,203 (13.6%) | 7,648 (86.4%) |
| 5 to 9 Unit Apartments | 1,079 (8.1%) | 12,330 (91.9%) |
| 10 or more Apartments | 3,812 (6.7%) | 53,543 (93.3%) |
| Mobile Home / Other | 6,681 (80.8%) | 1,583 (19.2%) |
| Total | 240,698 (68.0%) | 113,010 (32.0%) |
Housing Structures by Number of Rooms in Area Code 515
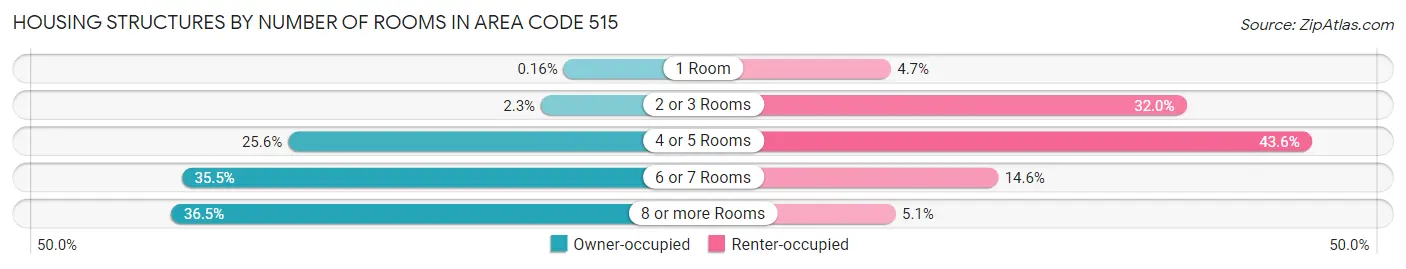
| Number of Rooms | Owner-occupied | Renter-occupied |
| 1 Room | 377 (0.2%) | 5,267 (4.7%) |
| 2 or 3 Rooms | 5,415 (2.2%) | 36,201 (32.0%) |
| 4 or 5 Rooms | 61,703 (25.6%) | 49,282 (43.6%) |
| 6 or 7 Rooms | 85,432 (35.5%) | 16,491 (14.6%) |
| 8 or more Rooms | 87,771 (36.5%) | 5,769 (5.1%) |
| Total | 240,698 (100.0%) | 113,010 (100.0%) |
Housing Structure by Heating Type in Area Code 515
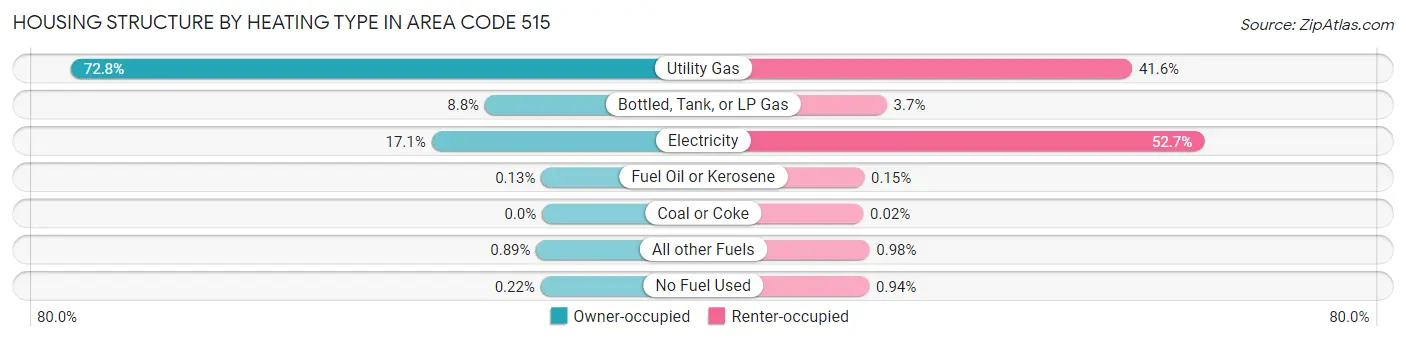
| Heating Type | Owner-occupied | Renter-occupied |
| Utility Gas | 175,324 (72.8%) | 46,973 (41.6%) |
| Bottled, Tank, or LP Gas | 21,275 (8.8%) | 4,120 (3.6%) |
| Electricity | 41,125 (17.1%) | 59,571 (52.7%) |
| Fuel Oil or Kerosene | 313 (0.1%) | 164 (0.2%) |
| Coal or Coke | 5 (0.0%) | 22 (0.0%) |
| All other Fuels | 2,136 (0.9%) | 1,103 (1.0%) |
| No Fuel Used | 520 (0.2%) | 1,057 (0.9%) |
| Total | 240,698 (100.0%) | 113,010 (100.0%) |
Household Vehicle Usage in Area Code 515
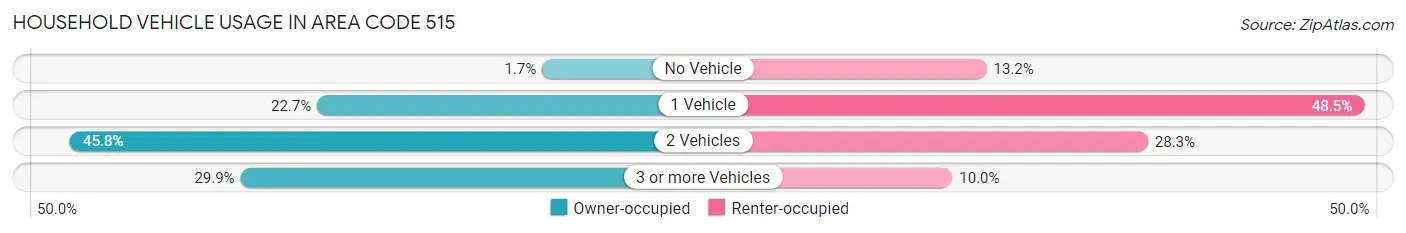
| Vehicles per Household | Owner-occupied | Renter-occupied |
| No Vehicle | 4,099 (1.7%) | 14,944 (13.2%) |
| 1 Vehicle | 54,640 (22.7%) | 54,769 (48.5%) |
| 2 Vehicles | 110,115 (45.8%) | 31,963 (28.3%) |
| 3 or more Vehicles | 71,844 (29.8%) | 11,334 (10.0%) |
| Total | 240,698 (100.0%) | 113,010 (100.0%) |
Real Estate & Mortgages in Area Code 515
Real Estate and Mortgage Overview in Area Code 515
| Characteristic | Without Mortgage | With Mortgage |
| Housing Units | 81,340 | 159,358 |
| Median Property Value | $20,944,400 | $23,238,300 |
| Median Household Income | $8,794,295 | $47,908 |
| Monthly Housing Costs | $76,367 | $12,468 |
| Real Estate Taxes | $309,154 | $4,009 |
Property Value by Mortgage Status in Area Code 515
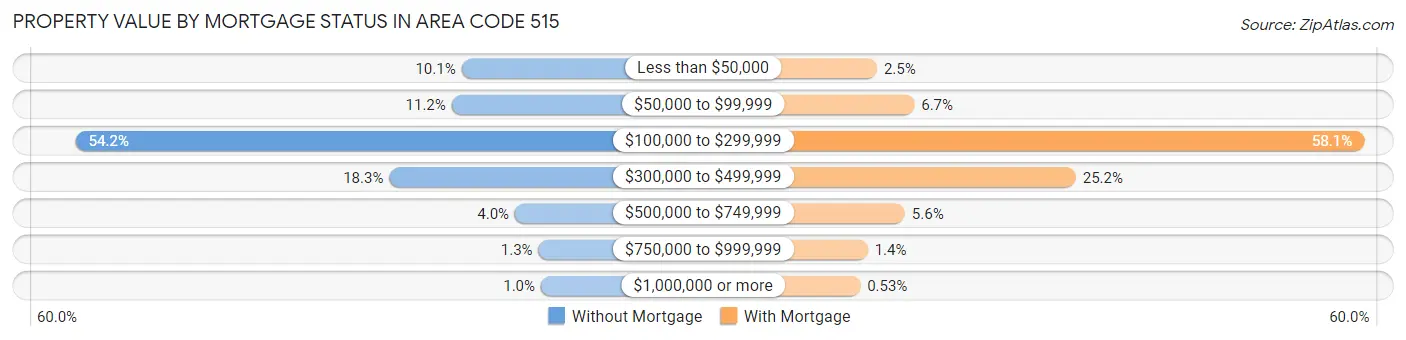
| Property Value | Without Mortgage | With Mortgage |
| Less than $50,000 | 8,191 (10.1%) | 3,908 (2.5%) |
| $50,000 to $99,999 | 9,110 (11.2%) | 10,685 (6.7%) |
| $100,000 to $299,999 | 44,059 (54.2%) | 92,609 (58.1%) |
| $300,000 to $499,999 | 14,909 (18.3%) | 40,112 (25.2%) |
| $500,000 to $749,999 | 3,221 (4.0%) | 8,993 (5.6%) |
| $750,000 to $999,999 | 1,040 (1.3%) | 2,214 (1.4%) |
| $1,000,000 or more | 810 (1.0%) | 837 (0.5%) |
| Total | 81,340 (100.0%) | 159,358 (100.0%) |
Household Income by Mortgage Status in Area Code 515
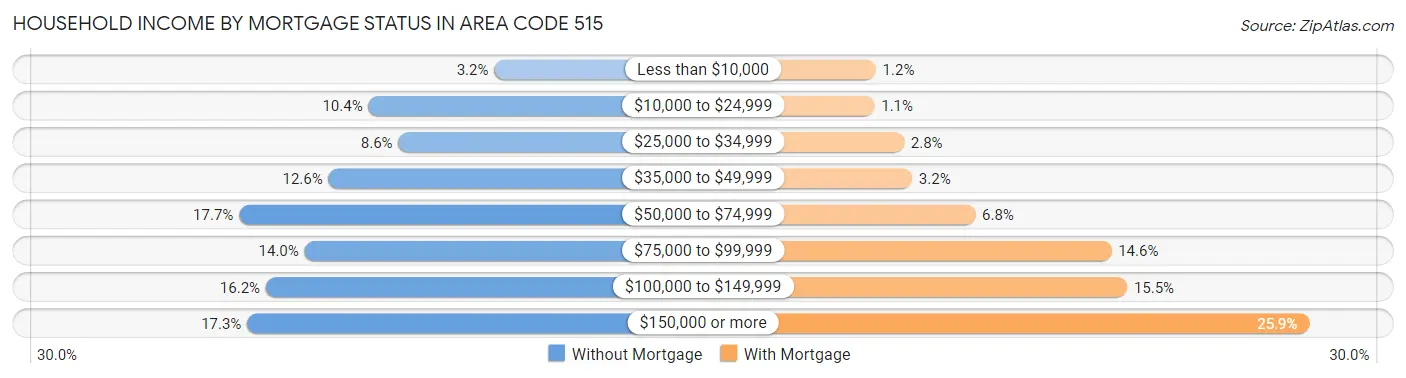
| Household Income | Without Mortgage | With Mortgage |
| Less than $10,000 | 2,569 (3.2%) | 1,838 (1.1%) |
| $10,000 to $24,999 | 8,421 (10.3%) | 1,709 (1.1%) |
| $25,000 to $34,999 | 7,025 (8.6%) | 4,398 (2.8%) |
| $35,000 to $49,999 | 10,270 (12.6%) | 5,134 (3.2%) |
| $50,000 to $74,999 | 14,429 (17.7%) | 10,881 (6.8%) |
| $75,000 to $99,999 | 11,384 (14.0%) | 23,284 (14.6%) |
| $100,000 to $149,999 | 13,185 (16.2%) | 24,717 (15.5%) |
| $150,000 or more | 14,057 (17.3%) | 41,327 (25.9%) |
| Total | 81,340 (100.0%) | 159,358 (100.0%) |
Property Value to Household Income Ratio in Area Code 515
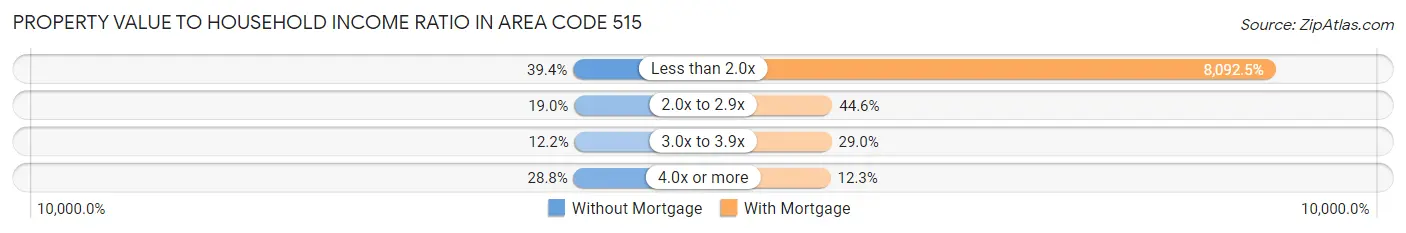
| Value-to-Income Ratio | Without Mortgage | With Mortgage |
| Less than 2.0x | 32,052 (39.4%) | 12,895,989 (8,092.5%) |
| 2.0x to 2.9x | 15,415 (19.0%) | 71,014 (44.6%) |
| 3.0x to 3.9x | 9,929 (12.2%) | 46,240 (29.0%) |
| 4.0x or more | 23,385 (28.7%) | 19,597 (12.3%) |
| Total | 81,340 (100.0%) | 159,358 (100.0%) |
Real Estate Taxes by Mortgage Status in Area Code 515
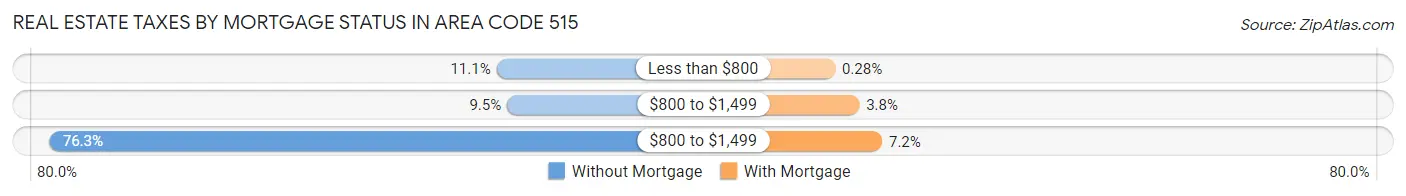
| Property Taxes | Without Mortgage | With Mortgage |
| Less than $800 | 8,985 (11.1%) | 450 (0.3%) |
| $800 to $1,499 | 7,732 (9.5%) | 6,081 (3.8%) |
| $800 to $1,499 | 62,074 (76.3%) | 11,406 (7.2%) |
| Total | 81,340 (100.0%) | 159,358 (100.0%) |
Health & Disability in Area Code 515
Health Insurance Coverage by Age in Area Code 515
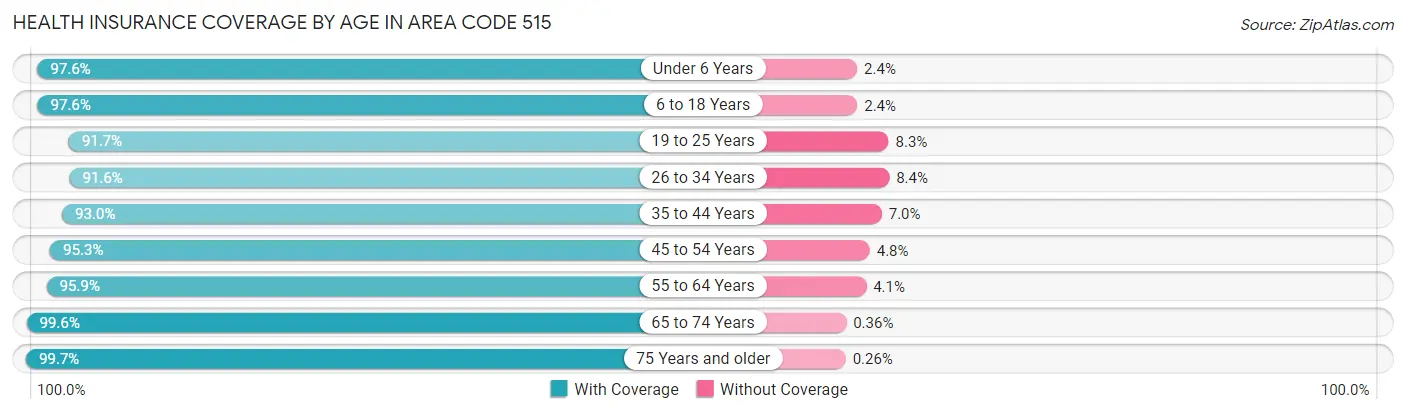
| Age Bracket | With Coverage | Without Coverage |
| Under 6 Years | 64,776 (97.6%) | 1,594 (2.4%) |
| 6 to 18 Years | 150,239 (97.6%) | 3,721 (2.4%) |
| 19 to 25 Years | 87,868 (91.7%) | 7,915 (8.3%) |
| 26 to 34 Years | 100,295 (91.6%) | 9,165 (8.4%) |
| 35 to 44 Years | 109,498 (93.0%) | 8,227 (7.0%) |
| 45 to 54 Years | 95,998 (95.3%) | 4,784 (4.8%) |
| 55 to 64 Years | 98,509 (95.9%) | 4,200 (4.1%) |
| 65 to 74 Years | 74,364 (99.6%) | 268 (0.4%) |
| 75 Years and older | 48,067 (99.7%) | 125 (0.3%) |
| Total | 829,614 (95.4%) | 39,999 (4.6%) |
Health Insurance Coverage by Citizenship Status in Area Code 515
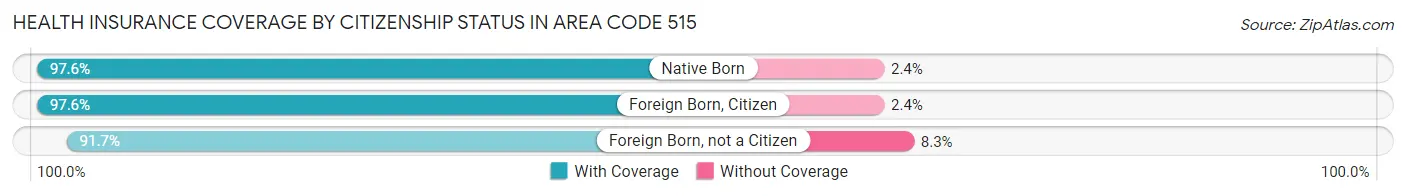
| Citizenship Status | With Coverage | Without Coverage |
| Native Born | 64,776 (97.6%) | 1,594 (2.4%) |
| Foreign Born, Citizen | 150,239 (97.6%) | 3,721 (2.4%) |
| Foreign Born, not a Citizen | 87,868 (91.7%) | 7,915 (8.3%) |
Health Insurance Coverage by Household Income in Area Code 515
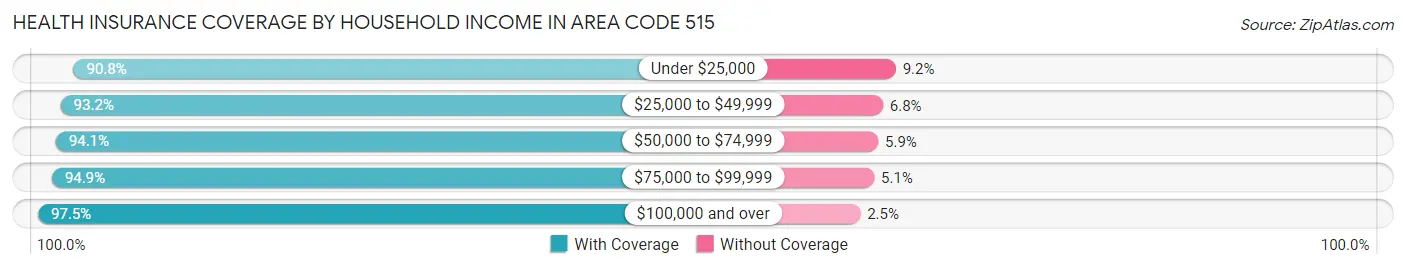
| Household Income | With Coverage | Without Coverage |
| Under $25,000 | 70,146 (90.8%) | 7,070 (9.2%) |
| $25,000 to $49,999 | 110,927 (93.2%) | 8,048 (6.8%) |
| $50,000 to $74,999 | 126,755 (94.1%) | 7,888 (5.9%) |
| $75,000 to $99,999 | 119,646 (94.9%) | 6,441 (5.1%) |
| $100,000 and over | 384,294 (97.5%) | 9,887 (2.5%) |
Public vs Private Health Insurance Coverage by Age in Area Code 515
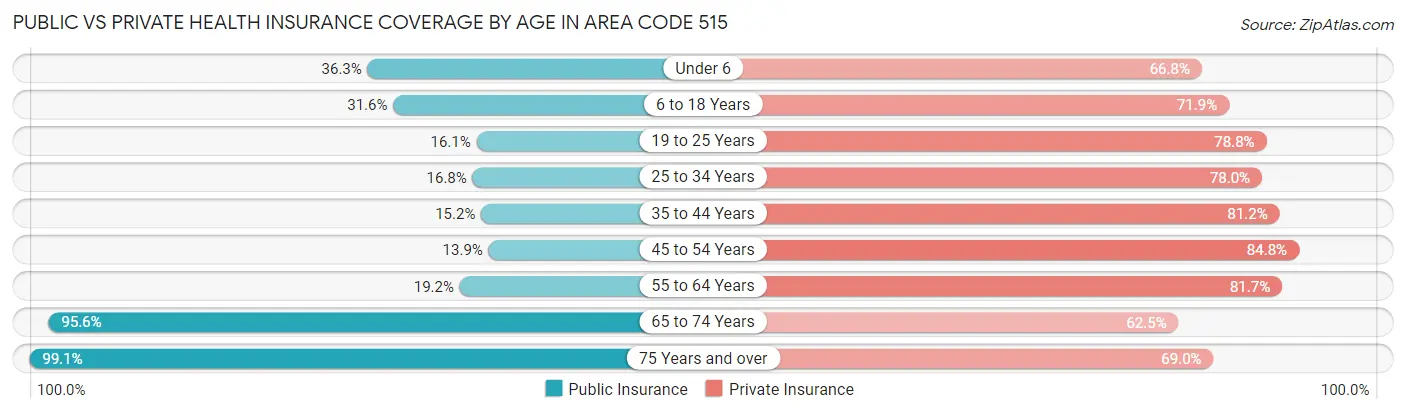
| Age Bracket | Public Insurance | Private Insurance |
| Under 6 | 24,115 (36.3%) | 44,333 (66.8%) |
| 6 to 18 Years | 48,603 (31.6%) | 110,649 (71.9%) |
| 19 to 25 Years | 15,431 (16.1%) | 75,484 (78.8%) |
| 25 to 34 Years | 18,437 (16.8%) | 85,355 (78.0%) |
| 35 to 44 Years | 17,940 (15.2%) | 95,634 (81.2%) |
| 45 to 54 Years | 13,973 (13.9%) | 85,507 (84.8%) |
| 55 to 64 Years | 19,739 (19.2%) | 83,909 (81.7%) |
| 65 to 74 Years | 71,334 (95.6%) | 46,639 (62.5%) |
| 75 Years and over | 47,767 (99.1%) | 33,238 (69.0%) |
| Total | 277,339 (31.9%) | 660,748 (76.0%) |
Disability Status by Sex by Age in Area Code 515
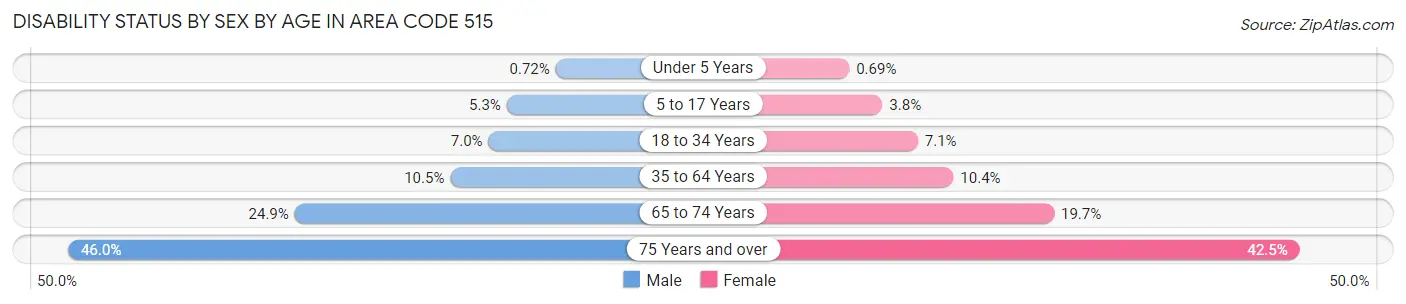
| Age Bracket | Male | Female |
| Under 5 Years | 202 (0.7%) | 184 (0.7%) |
| 5 to 17 Years | 4,077 (5.3%) | 2,782 (3.8%) |
| 18 to 34 Years | 7,889 (7.0%) | 7,476 (7.1%) |
| 35 to 64 Years | 17,041 (10.5%) | 16,464 (10.4%) |
| 65 to 74 Years | 8,871 (24.9%) | 7,697 (19.7%) |
| 75 Years and over | 9,000 (46.0%) | 12,156 (42.5%) |
Disability Class by Sex by Age in Area Code 515
Disability Class: Hearing Difficulty
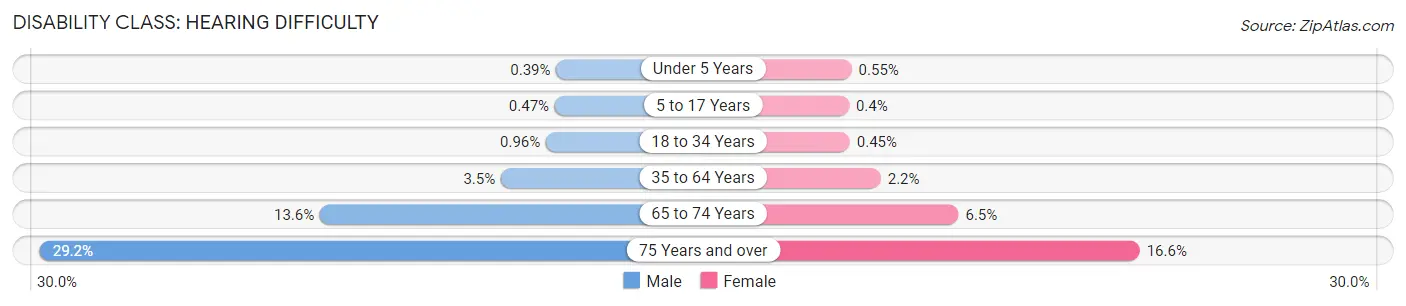
| Age Bracket | Male | Female |
| Under 5 Years | 109 (0.4%) | 147 (0.5%) |
| 5 to 17 Years | 365 (0.5%) | 299 (0.4%) |
| 18 to 34 Years | 1,086 (1.0%) | 475 (0.4%) |
| 35 to 64 Years | 5,626 (3.5%) | 3,445 (2.2%) |
| 65 to 74 Years | 4,820 (13.6%) | 2,540 (6.5%) |
| 75 Years and over | 5,707 (29.1%) | 4,746 (16.6%) |
Disability Class: Vision Difficulty
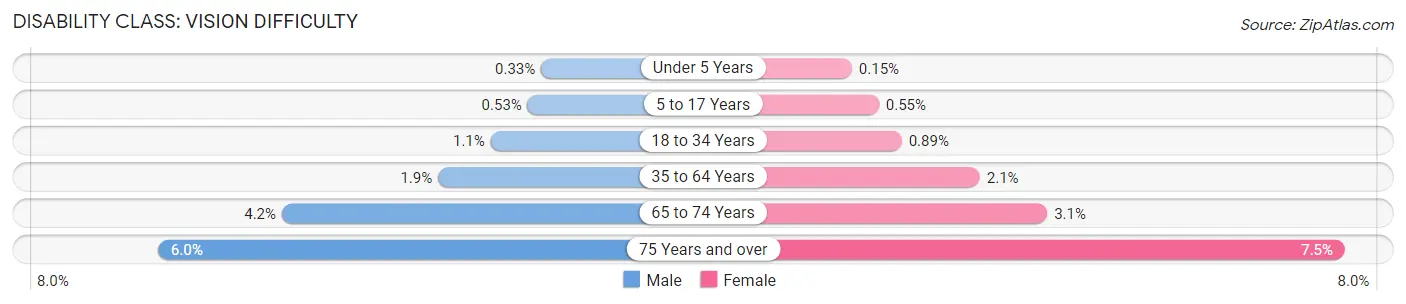
| Age Bracket | Male | Female |
| Under 5 Years | 93 (0.3%) | 41 (0.2%) |
| 5 to 17 Years | 412 (0.5%) | 404 (0.5%) |
| 18 to 34 Years | 1,231 (1.1%) | 946 (0.9%) |
| 35 to 64 Years | 3,021 (1.9%) | 3,262 (2.1%) |
| 65 to 74 Years | 1,487 (4.2%) | 1,191 (3.0%) |
| 75 Years and over | 1,178 (6.0%) | 2,138 (7.5%) |
Disability Class: Cognitive Difficulty
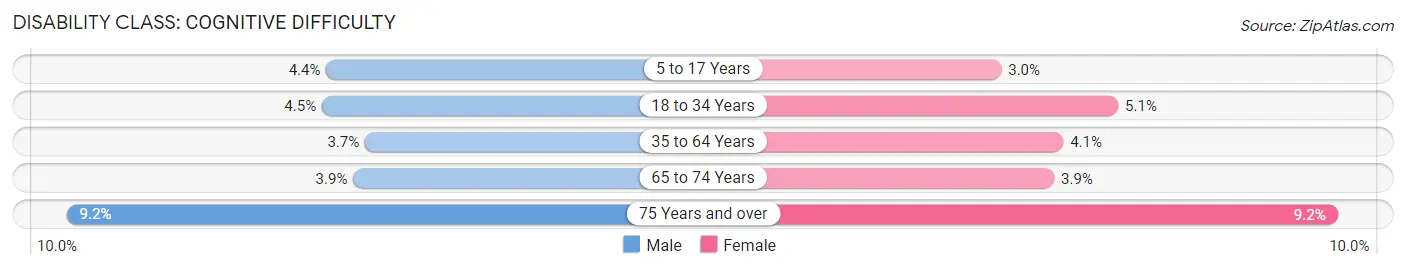
| Age Bracket | Male | Female |
| 5 to 17 Years | 3,409 (4.4%) | 2,188 (3.0%) |
| 18 to 34 Years | 5,079 (4.5%) | 5,436 (5.1%) |
| 35 to 64 Years | 5,970 (3.7%) | 6,534 (4.1%) |
| 65 to 74 Years | 1,387 (3.9%) | 1,541 (3.9%) |
| 75 Years and over | 1,806 (9.2%) | 2,633 (9.2%) |
Disability Class: Ambulatory Difficulty
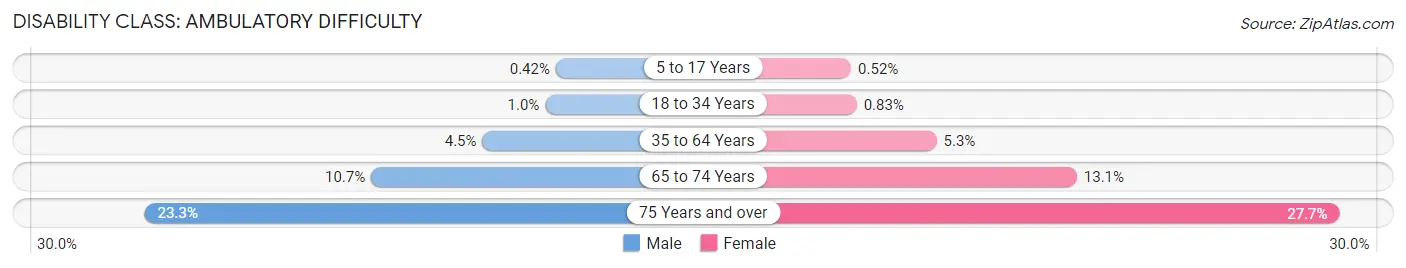
| Age Bracket | Male | Female |
| 5 to 17 Years | 325 (0.4%) | 386 (0.5%) |
| 18 to 34 Years | 1,146 (1.0%) | 881 (0.8%) |
| 35 to 64 Years | 7,327 (4.5%) | 8,388 (5.3%) |
| 65 to 74 Years | 3,810 (10.7%) | 5,115 (13.1%) |
| 75 Years and over | 4,565 (23.3%) | 7,925 (27.7%) |
Disability Class: Self-Care Difficulty
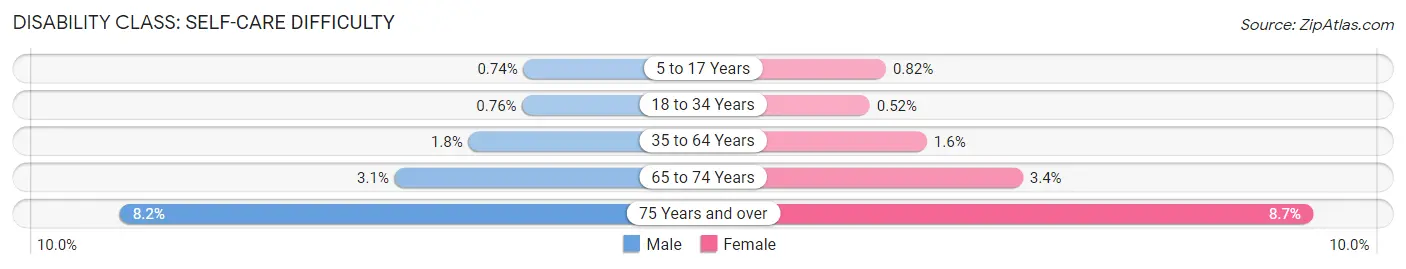
| Age Bracket | Male | Female |
| 5 to 17 Years | 576 (0.7%) | 602 (0.8%) |
| 18 to 34 Years | 866 (0.8%) | 553 (0.5%) |
| 35 to 64 Years | 2,856 (1.8%) | 2,516 (1.6%) |
| 65 to 74 Years | 1,112 (3.1%) | 1,312 (3.4%) |
| 75 Years and over | 1,612 (8.2%) | 2,500 (8.7%) |
Technology Access in Area Code 515
Computing Device Access in Area Code 515
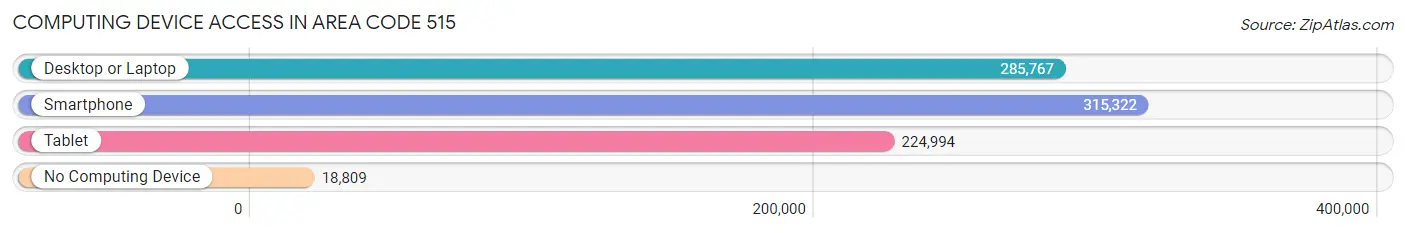
| Device Type | # Households | % Households |
| Desktop or Laptop | 285,767 | 80.8% |
| Smartphone | 315,322 | 89.1% |
| Tablet | 224,994 | 63.6% |
| No Computing Device | 18,809 | 5.3% |
| Total | 353,708 | 100.0% |
Internet Access in Area Code 515
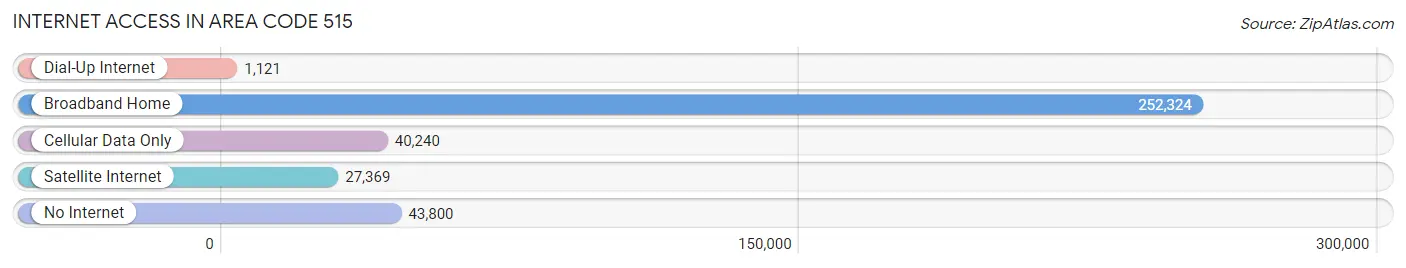
| Internet Type | # Households | % Households |
| Dial-Up Internet | 1,121 | 0.3% |
| Broadband Home | 252,324 | 71.3% |
| Cellular Data Only | 40,240 | 11.4% |
| Satellite Internet | 27,369 | 7.7% |
| No Internet | 43,800 | 12.4% |
| Total | 353,708 | 100.0% |
Area Code 515 Summary
Geography
Area code 515 is located in the state of Iowa in the United States. It covers the central and western parts of the state, including the cities of Des Moines, Ames, and Council Bluffs.
Social
Area code 515 is home to a diverse population of people from all walks of life. The area is known for its friendly and welcoming atmosphere, and is a popular destination for tourists and business travelers alike.
Economics
Area code 515 is home to a thriving economy, with a variety of industries and businesses. The area is home to several Fortune 500 companies, including Principal Financial Group, Meredith Corporation, and Hy-Vee.
Demographics
Area code 515 is home to a population of over 1.5 million people. The area is predominantly white, with a large Hispanic population. The median household income is around $50,000, and the unemployment rate is around 4%.
Common Questions
What is Per Capita Income in Area Code 515?
Per Capita income in Area Code 515 is $38,046.
What is the Median Family Income in Area Code 515?
Median Family Income in Area Code 515 is $93,041.
What is the Median Household income in Area Code 515?
Median Household Income in Area Code 515 is $76,153.
What is Income or Wage Gap in Area Code 515?
Income or Wage Gap in Area Code 515 is 30.0%.
Women in Area Code 515 earn 70.0 cents for every dollar earned by a man.
What is Family Income Deficit in Area Code 515?
Family Income Deficit in Area Code 515 is $11,071.
Families that are below poverty line in Area Code 515 earn $11,071 less on average than the poverty threshold level.
What is Inequality or Gini Index in Area Code 515?
Inequality or Gini Index in Area Code 515 is 53.26.
What is the Total Population of Area Code 515?
Total Population of Area Code 515 is 879,616.
What is the Total Male Population of Area Code 515?
Total Male Population of Area Code 515 is 442,416.
What is the Total Female Population of Area Code 515?
Total Female Population of Area Code 515 is 437,200.
What is the Ratio of Males per 100 Females in Area Code 515?
There are 101.19 Males per 100 Females in Area Code 515.
What is the Ratio of Females per 100 Males in Area Code 515?
There are 98.82 Females per 100 Males in Area Code 515.
What is the Median Population Age in Area Code 515?
Median Population Age in Area Code 515 is 41.0 Years.
What is the Average Family Size in Area Code 515
Average Family Size in Area Code 515 is 3.0 People.
What is the Average Household Size in Area Code 515
Average Household Size in Area Code 515 is 2.4 People.
How Large is the Labor Force in Area Code 515?
There are 468,280 People in the Labor Forcein in Area Code 515.
What is the Percentage of People in the Labor Force in Area Code 515?
67.2% of People are in the Labor Force in Area Code 515.
What is the Unemployment Rate in Area Code 515?
Unemployment Rate in Area Code 515 is 4.1%.