Linn County, IA Map & Demographics
Linn County Map
Linn County Overview
$41,446
PER CAPITA INCOME
$96,369
AVG FAMILY INCOME
$75,457
AVG HOUSEHOLD INCOME
28.8%
WAGE / INCOME GAP [ % ]
71.2¢/ $1
WAGE / INCOME GAP [ $ ]
$9,002
FAMILY INCOME DEFICIT
0.45
INEQUALITY / GINI INDEX
229,308
TOTAL POPULATION
113,646
MALE POPULATION
115,662
FEMALE POPULATION
98.26
MALES / 100 FEMALES
101.77
FEMALES / 100 MALES
38.2
MEDIAN AGE
3.0
AVG FAMILY SIZE
2.4
AVG HOUSEHOLD SIZE
126,214
LABOR FORCE [ PEOPLE ]
68.8%
PERCENT IN LABOR FORCE
3.8%
UNEMPLOYMENT RATE
Linn County Area Codes
Income in Linn County
Income Overview in Linn County
Per Capita Income in Linn County is $41,446, while median incomes of families and households are $96,369 and $75,457 respectively.
| Characteristic | Number | Measure |
| Per Capita Income | 229,308 | $41,446 |
| Median Family Income | 58,150 | $96,369 |
| Mean Family Income | 58,150 | $122,006 |
| Median Household Income | 94,291 | $75,457 |
| Mean Household Income | 94,291 | $99,589 |
| Income Deficit | 58,150 | $9,002 |
| Wage / Income Gap (%) | 229,308 | 28.84% |
| Wage / Income Gap ($) | 229,308 | 71.16¢ per $1 |
| Gini / Inequality Index | 229,308 | 0.45 |
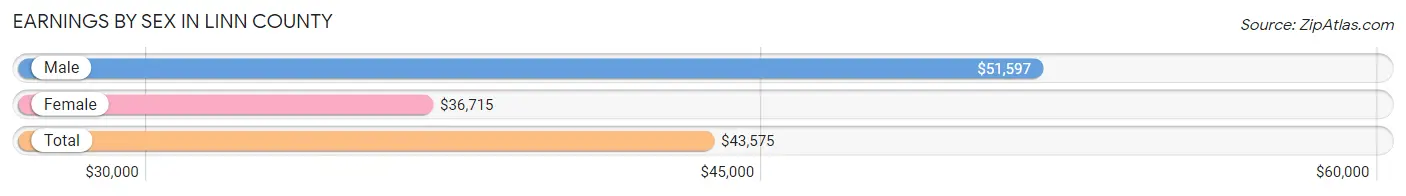
Earnings by Sex in Linn County
Average Earnings in Linn County are $43,575, $51,597 for men and $36,715 for women, a difference of 28.8%.
| Sex | Number | Average Earnings |
| Male | 68,732 (52.1%) | $51,597 |
| Female | 63,263 (47.9%) | $36,715 |
| Total | 131,995 (100.0%) | $43,575 |
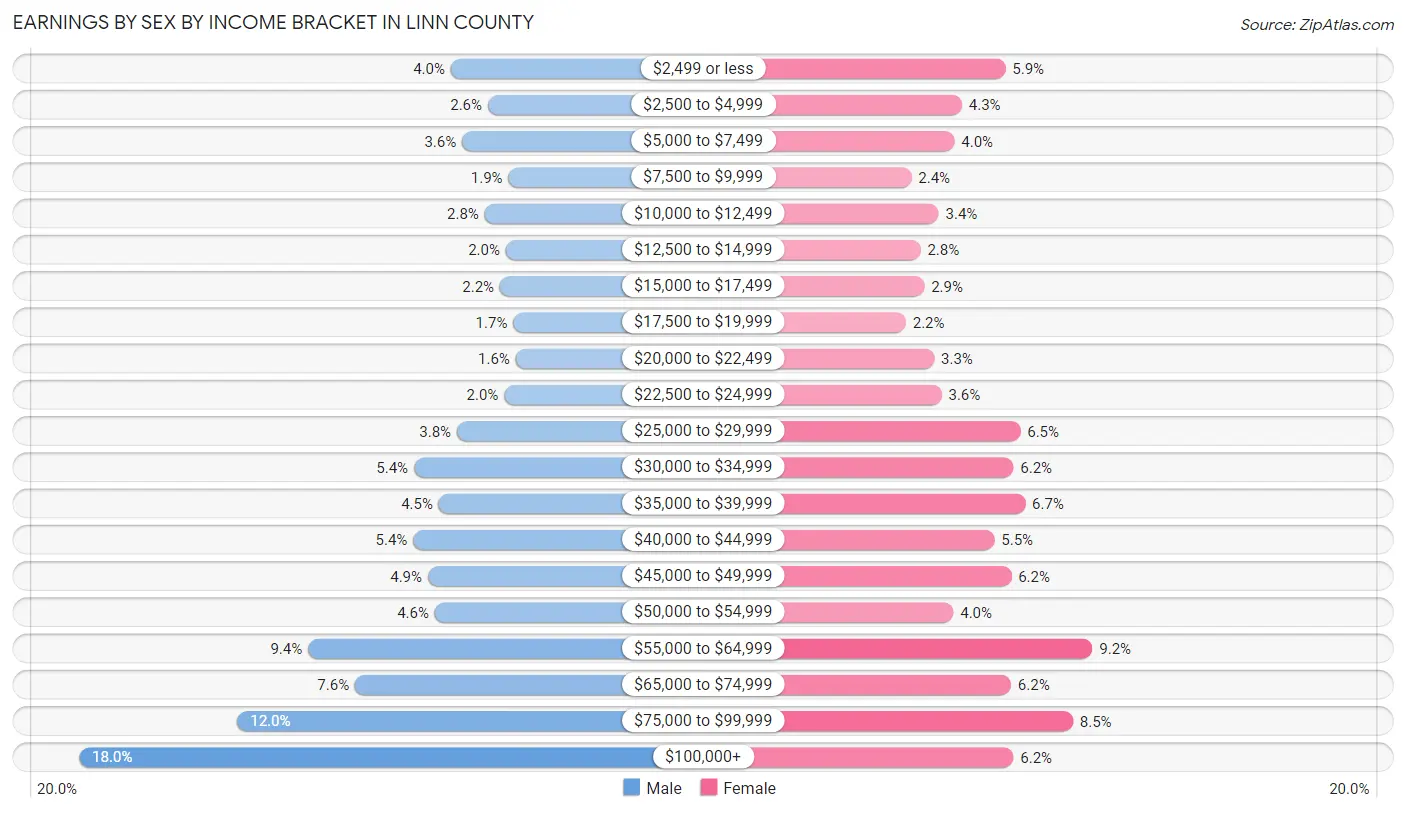
Earnings by Sex by Income Bracket in Linn County
The most common earnings brackets in Linn County are $100,000+ for men (12,343 | 18.0%) and $55,000 to $64,999 for women (5,818 | 9.2%).
| Income | Male | Female |
| $2,499 or less | 2,769 (4.0%) | 3,760 (5.9%) |
| $2,500 to $4,999 | 1,817 (2.6%) | 2,725 (4.3%) |
| $5,000 to $7,499 | 2,478 (3.6%) | 2,551 (4.0%) |
| $7,500 to $9,999 | 1,284 (1.9%) | 1,532 (2.4%) |
| $10,000 to $12,499 | 1,894 (2.8%) | 2,177 (3.4%) |
| $12,500 to $14,999 | 1,351 (2.0%) | 1,743 (2.8%) |
| $15,000 to $17,499 | 1,505 (2.2%) | 1,835 (2.9%) |
| $17,500 to $19,999 | 1,161 (1.7%) | 1,400 (2.2%) |
| $20,000 to $22,499 | 1,097 (1.6%) | 2,066 (3.3%) |
| $22,500 to $24,999 | 1,396 (2.0%) | 2,247 (3.5%) |
| $25,000 to $29,999 | 2,613 (3.8%) | 4,113 (6.5%) |
| $30,000 to $34,999 | 3,719 (5.4%) | 3,949 (6.2%) |
| $35,000 to $39,999 | 3,076 (4.5%) | 4,226 (6.7%) |
| $40,000 to $44,999 | 3,737 (5.4%) | 3,499 (5.5%) |
| $45,000 to $49,999 | 3,363 (4.9%) | 3,898 (6.2%) |
| $50,000 to $54,999 | 3,180 (4.6%) | 2,524 (4.0%) |
| $55,000 to $64,999 | 6,447 (9.4%) | 5,818 (9.2%) |
| $65,000 to $74,999 | 5,235 (7.6%) | 3,892 (6.1%) |
| $75,000 to $99,999 | 8,267 (12.0%) | 5,361 (8.5%) |
| $100,000+ | 12,343 (18.0%) | 3,947 (6.2%) |
| Total | 68,732 (100.0%) | 63,263 (100.0%) |
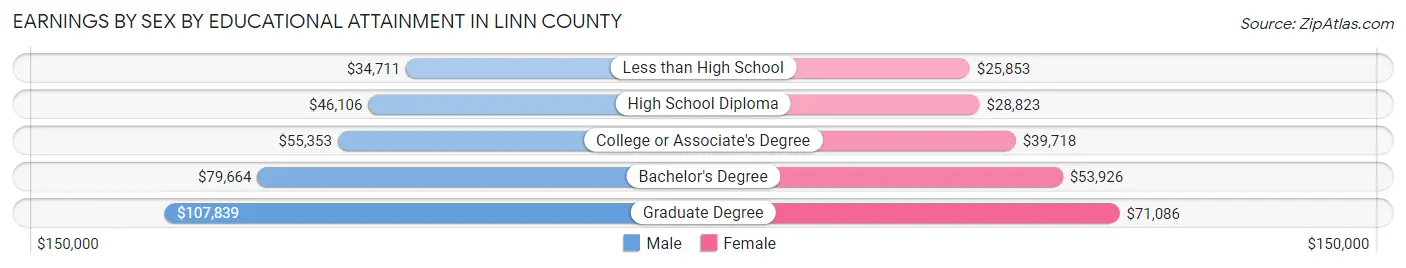
Earnings by Sex by Educational Attainment in Linn County
Average earnings in Linn County are $58,417 for men and $42,033 for women, a difference of 28.1%. Men with an educational attainment of graduate degree enjoy the highest average annual earnings of $107,839, while those with less than high school education earn the least with $34,711. Women with an educational attainment of graduate degree earn the most with the average annual earnings of $71,086, while those with less than high school education have the smallest earnings of $25,853.
| Educational Attainment | Male Income | Female Income |
| Less than High School | $34,711 | $25,853 |
| High School Diploma | $46,106 | $28,823 |
| College or Associate's Degree | $55,353 | $39,718 |
| Bachelor's Degree | $79,664 | $53,926 |
| Graduate Degree | $107,839 | $71,086 |
| Total | $58,417 | $42,033 |
Family Income in Linn County
Family Income Brackets in Linn County
According to the Linn County family income data, there are 13,026 families falling into the $100,000 to $149,999 income range, which is the most common income bracket and makes up 22.4% of all families. Conversely, the $10,000 to $14,999 income bracket is the least frequent group with only 698 families (1.2%) belonging to this category.
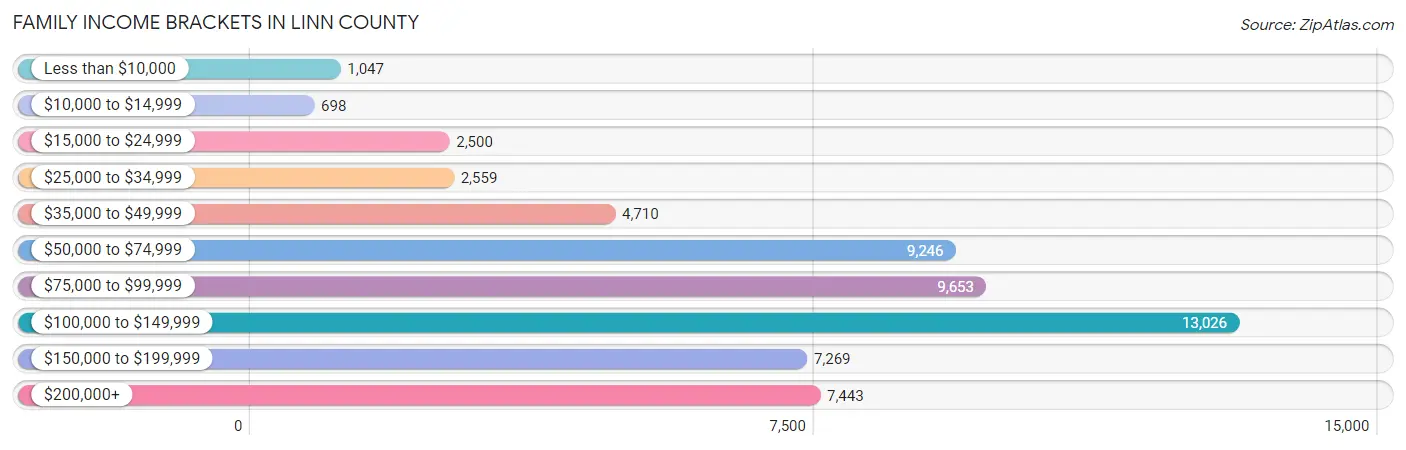
| Income Bracket | # Families | % Families |
| Less than $10,000 | 1,047 | 1.8% |
| $10,000 to $14,999 | 698 | 1.2% |
| $15,000 to $24,999 | 2,500 | 4.3% |
| $25,000 to $34,999 | 2,559 | 4.4% |
| $35,000 to $49,999 | 4,710 | 8.1% |
| $50,000 to $74,999 | 9,246 | 15.9% |
| $75,000 to $99,999 | 9,653 | 16.6% |
| $100,000 to $149,999 | 13,026 | 22.4% |
| $150,000 to $199,999 | 7,269 | 12.5% |
| $200,000+ | 7,443 | 12.8% |
Family Income by Famaliy Size in Linn County
4-person families (10,144 | 17.4%) account for the highest median family income in Linn County with $132,478 per family, while 2-person families (29,099 | 50.0%) have the highest median income of $42,137 per family member.
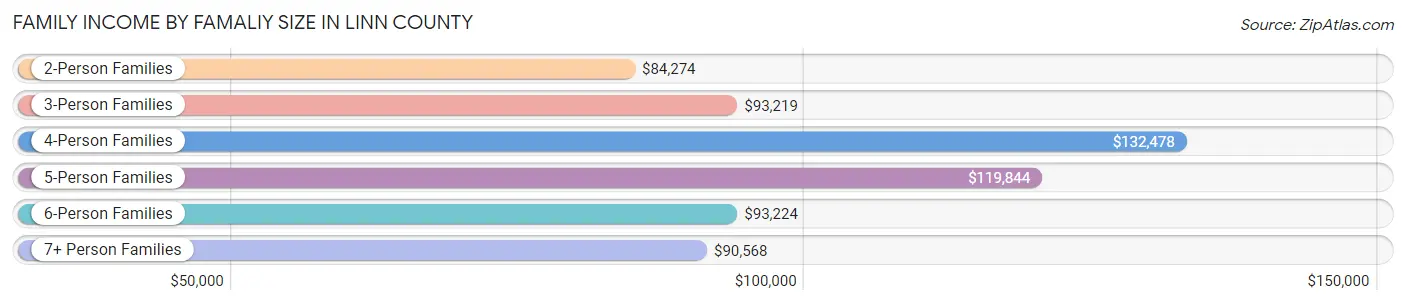
| Income Bracket | # Families | Median Income |
| 2-Person Families | 29,099 (50.0%) | $84,274 |
| 3-Person Families | 12,454 (21.4%) | $93,219 |
| 4-Person Families | 10,144 (17.4%) | $132,478 |
| 5-Person Families | 4,606 (7.9%) | $119,844 |
| 6-Person Families | 1,141 (2.0%) | $93,224 |
| 7+ Person Families | 706 (1.2%) | $90,568 |
| Total | 58,150 (100.0%) | $96,369 |
Family Income by Number of Earners in Linn County
The median family income in Linn County is $96,369, with families comprising 3+ earners (6,936) having the highest median family income of $146,809, while families with no earners (8,422) have the lowest median family income of $60,114, accounting for 11.9% and 14.5% of families, respectively.
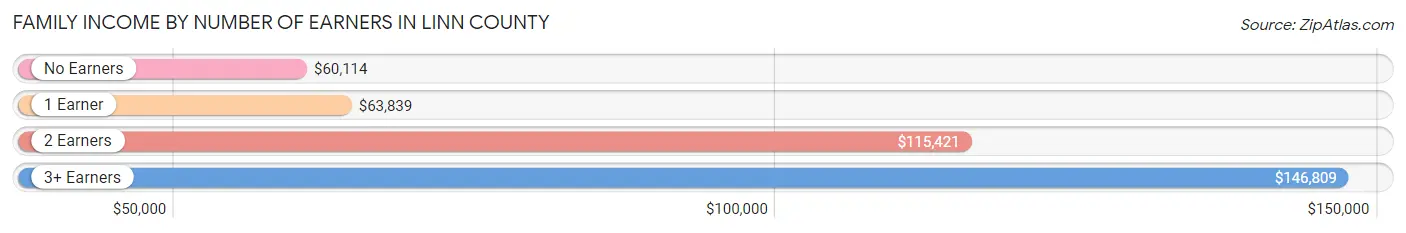
| Number of Earners | # Families | Median Income |
| No Earners | 8,422 (14.5%) | $60,114 |
| 1 Earner | 15,642 (26.9%) | $63,839 |
| 2 Earners | 27,150 (46.7%) | $115,421 |
| 3+ Earners | 6,936 (11.9%) | $146,809 |
| Total | 58,150 (100.0%) | $96,369 |
Household Income in Linn County
Household Income Brackets in Linn County
With 16,784 households falling in the category, the $100,000 to $149,999 income range is the most frequent in Linn County, accounting for 17.8% of all households. In contrast, only 2,829 households (3.0%) fall into the $10,000 to $14,999 income bracket, making it the least populous group.
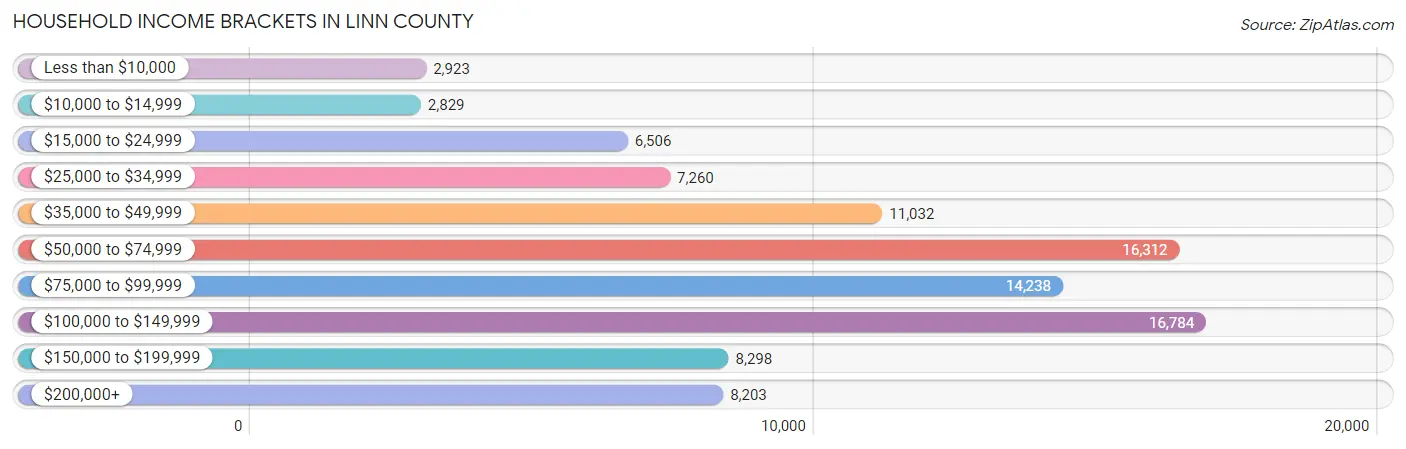
| Income Bracket | # Households | % Households |
| Less than $10,000 | 2,923 | 3.1% |
| $10,000 to $14,999 | 2,829 | 3.0% |
| $15,000 to $24,999 | 6,506 | 6.9% |
| $25,000 to $34,999 | 7,260 | 7.7% |
| $35,000 to $49,999 | 11,032 | 11.7% |
| $50,000 to $74,999 | 16,312 | 17.3% |
| $75,000 to $99,999 | 14,238 | 15.1% |
| $100,000 to $149,999 | 16,784 | 17.8% |
| $150,000 to $199,999 | 8,298 | 8.8% |
| $200,000+ | 8,203 | 8.7% |
Household Income by Householder Age in Linn County
The median household income in Linn County is $75,457, with the highest median household income of $95,295 found in the 45 to 64 years age bracket for the primary householder. A total of 33,620 households (35.7%) fall into this category. Meanwhile, the 15 to 24 years age bracket for the primary householder has the lowest median household income of $45,230, with 4,906 households (5.2%) in this group.
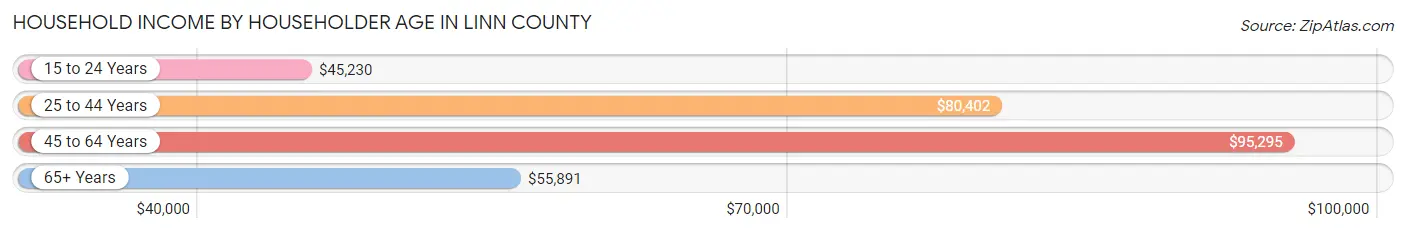
| Income Bracket | # Households | Median Income |
| 15 to 24 Years | 4,906 (5.2%) | $45,230 |
| 25 to 44 Years | 32,011 (34.0%) | $80,402 |
| 45 to 64 Years | 33,620 (35.7%) | $95,295 |
| 65+ Years | 23,754 (25.2%) | $55,891 |
| Total | 94,291 (100.0%) | $75,457 |
Poverty in Linn County
Income Below Poverty by Sex and Age in Linn County
With 8.5% poverty level for males and 10.5% for females among the residents of Linn County, under 5 year old males and 18 to 24 year old females are the most vulnerable to poverty, with 1,194 males (17.4%) and 2,025 females (22.2%) in their respective age groups living below the poverty level.
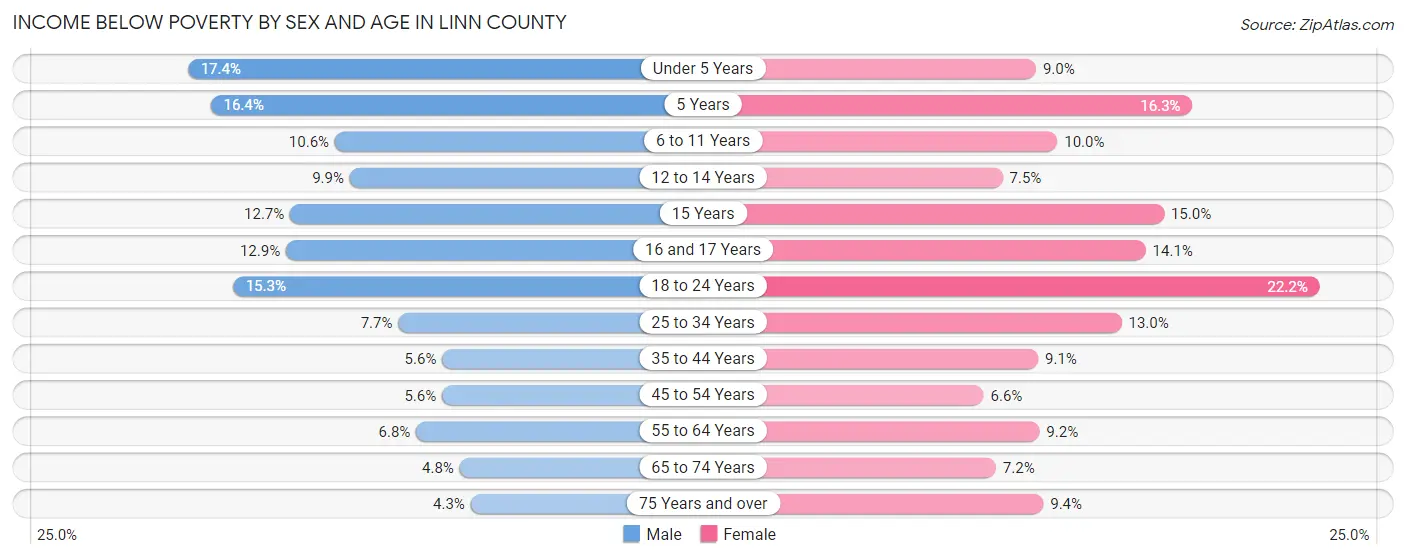
| Age Bracket | Male | Female |
| Under 5 Years | 1,194 (17.4%) | 591 (9.0%) |
| 5 Years | 257 (16.4%) | 184 (16.3%) |
| 6 to 11 Years | 893 (10.6%) | 839 (10.0%) |
| 12 to 14 Years | 466 (9.9%) | 334 (7.5%) |
| 15 Years | 186 (12.7%) | 205 (14.9%) |
| 16 and 17 Years | 404 (12.9%) | 447 (14.1%) |
| 18 to 24 Years | 1,436 (15.3%) | 2,025 (22.2%) |
| 25 to 34 Years | 1,172 (7.7%) | 1,952 (13.0%) |
| 35 to 44 Years | 870 (5.6%) | 1,354 (9.1%) |
| 45 to 54 Years | 792 (5.6%) | 907 (6.6%) |
| 55 to 64 Years | 976 (6.8%) | 1,336 (9.2%) |
| 65 to 74 Years | 494 (4.8%) | 812 (7.1%) |
| 75 Years and over | 270 (4.3%) | 843 (9.3%) |
| Total | 9,410 (8.5%) | 11,829 (10.5%) |
Income Above Poverty by Sex and Age in Linn County
According to the poverty statistics in Linn County, males aged 75 years and over and females aged 45 to 54 years are the age groups that are most secure financially, with 95.7% of males and 93.4% of females in these age groups living above the poverty line.
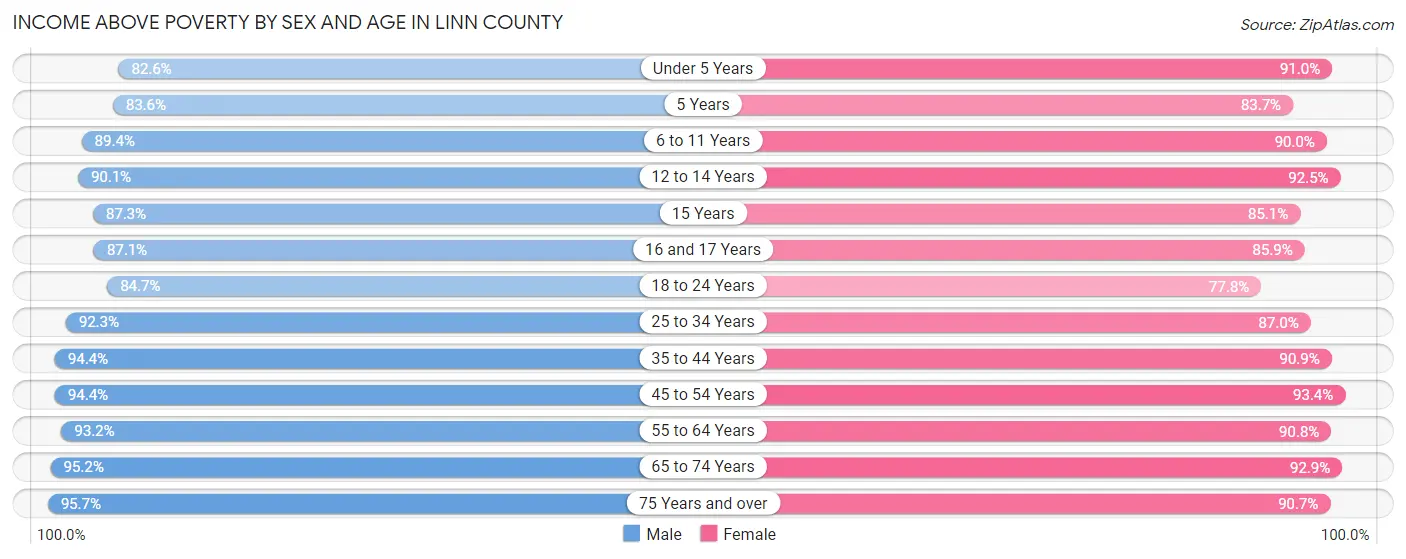
| Age Bracket | Male | Female |
| Under 5 Years | 5,656 (82.6%) | 5,966 (91.0%) |
| 5 Years | 1,313 (83.6%) | 947 (83.7%) |
| 6 to 11 Years | 7,528 (89.4%) | 7,554 (90.0%) |
| 12 to 14 Years | 4,237 (90.1%) | 4,145 (92.5%) |
| 15 Years | 1,281 (87.3%) | 1,166 (85.1%) |
| 16 and 17 Years | 2,736 (87.1%) | 2,723 (85.9%) |
| 18 to 24 Years | 7,928 (84.7%) | 7,109 (77.8%) |
| 25 to 34 Years | 14,120 (92.3%) | 13,081 (87.0%) |
| 35 to 44 Years | 14,613 (94.4%) | 13,501 (90.9%) |
| 45 to 54 Years | 13,265 (94.4%) | 12,880 (93.4%) |
| 55 to 64 Years | 13,309 (93.2%) | 13,230 (90.8%) |
| 65 to 74 Years | 9,766 (95.2%) | 10,540 (92.8%) |
| 75 Years and over | 6,012 (95.7%) | 8,173 (90.6%) |
| Total | 101,764 (91.5%) | 101,015 (89.5%) |
Income Below Poverty Among Married-Couple Families in Linn County
The poverty statistics for married-couple families in Linn County show that 2.8% or 1,233 of the total 44,801 families live below the poverty line. Families with 5 or more children have the highest poverty rate of 7.1%, comprising of 20 families. On the other hand, families with 1 or 2 children have the lowest poverty rate of 2.5%, which includes 359 families.
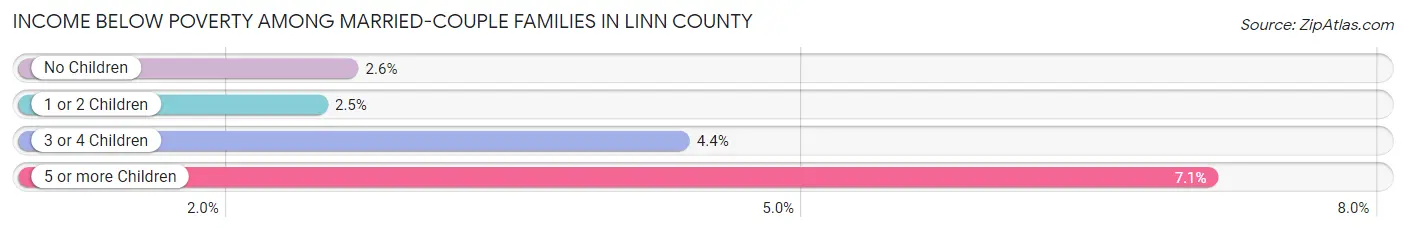
| Children | Above Poverty | Below Poverty |
| No Children | 25,609 (97.4%) | 693 (2.6%) |
| 1 or 2 Children | 14,165 (97.5%) | 359 (2.5%) |
| 3 or 4 Children | 3,533 (95.6%) | 161 (4.4%) |
| 5 or more Children | 261 (92.9%) | 20 (7.1%) |
| Total | 43,568 (97.3%) | 1,233 (2.8%) |
Income Below Poverty Among Single-Parent Households in Linn County
According to the poverty data in Linn County, 12.8% or 554 single-father households and 21.5% or 1,947 single-mother households are living below the poverty line. Among single-father households, those with 3 or 4 children have the highest poverty rate, with 130 households (48.3%) experiencing poverty. Likewise, among single-mother households, those with 3 or 4 children have the highest poverty rate, with 382 households (42.9%) falling below the poverty line.
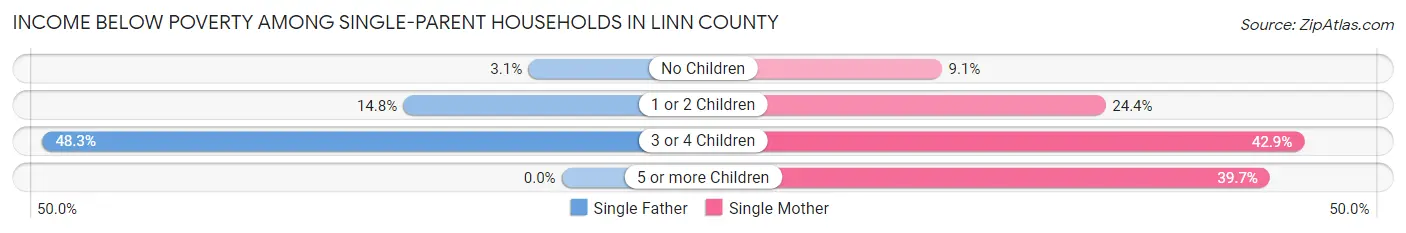
| Children | Single Father | Single Mother |
| No Children | 45 (3.1%) | 262 (9.1%) |
| 1 or 2 Children | 379 (14.8%) | 1,255 (24.4%) |
| 3 or 4 Children | 130 (48.3%) | 382 (42.9%) |
| 5 or more Children | 0 (0.0%) | 48 (39.7%) |
| Total | 554 (12.8%) | 1,947 (21.5%) |
Income Below Poverty Among Married-Couple vs Single-Parent Households in Linn County
The poverty data for Linn County shows that 1,233 of the married-couple family households (2.8%) and 2,501 of the single-parent households (18.7%) are living below the poverty level. Within the married-couple family households, those with 5 or more children have the highest poverty rate, with 20 households (7.1%) falling below the poverty line. Among the single-parent households, those with 3 or 4 children have the highest poverty rate, with 512 household (44.1%) living below poverty.
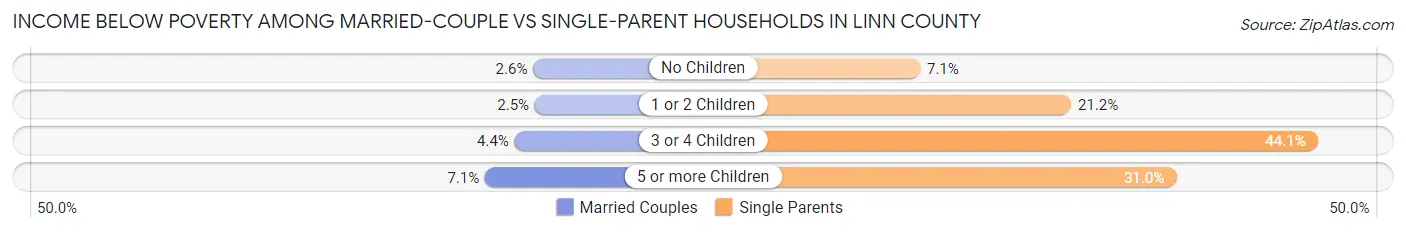
| Children | Married-Couple Families | Single-Parent Households |
| No Children | 693 (2.6%) | 307 (7.1%) |
| 1 or 2 Children | 359 (2.5%) | 1,634 (21.2%) |
| 3 or 4 Children | 161 (4.4%) | 512 (44.1%) |
| 5 or more Children | 20 (7.1%) | 48 (31.0%) |
| Total | 1,233 (2.8%) | 2,501 (18.7%) |
Race in Linn County
The most populous races in Linn County are White / Caucasian (196,168 | 85.6%), Black / African American (13,388 | 5.8%), and Two or more Races (11,336 | 4.9%).
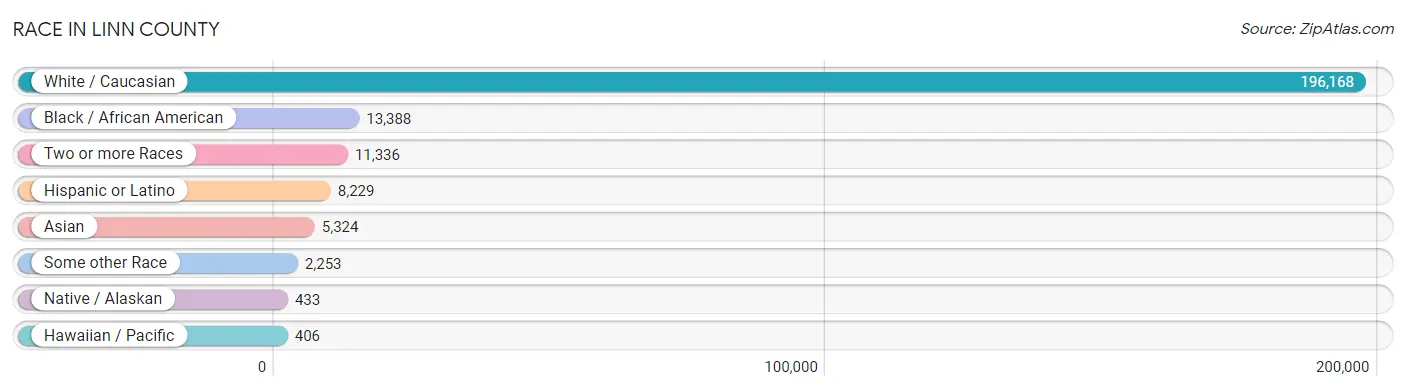
| Race | # Population | % Population |
| Asian | 5,324 | 2.3% |
| Black / African American | 13,388 | 5.8% |
| Hawaiian / Pacific | 406 | 0.2% |
| Hispanic or Latino | 8,229 | 3.6% |
| Native / Alaskan | 433 | 0.2% |
| White / Caucasian | 196,168 | 85.6% |
| Two or more Races | 11,336 | 4.9% |
| Some other Race | 2,253 | 1.0% |
| Total | 229,308 | 100.0% |
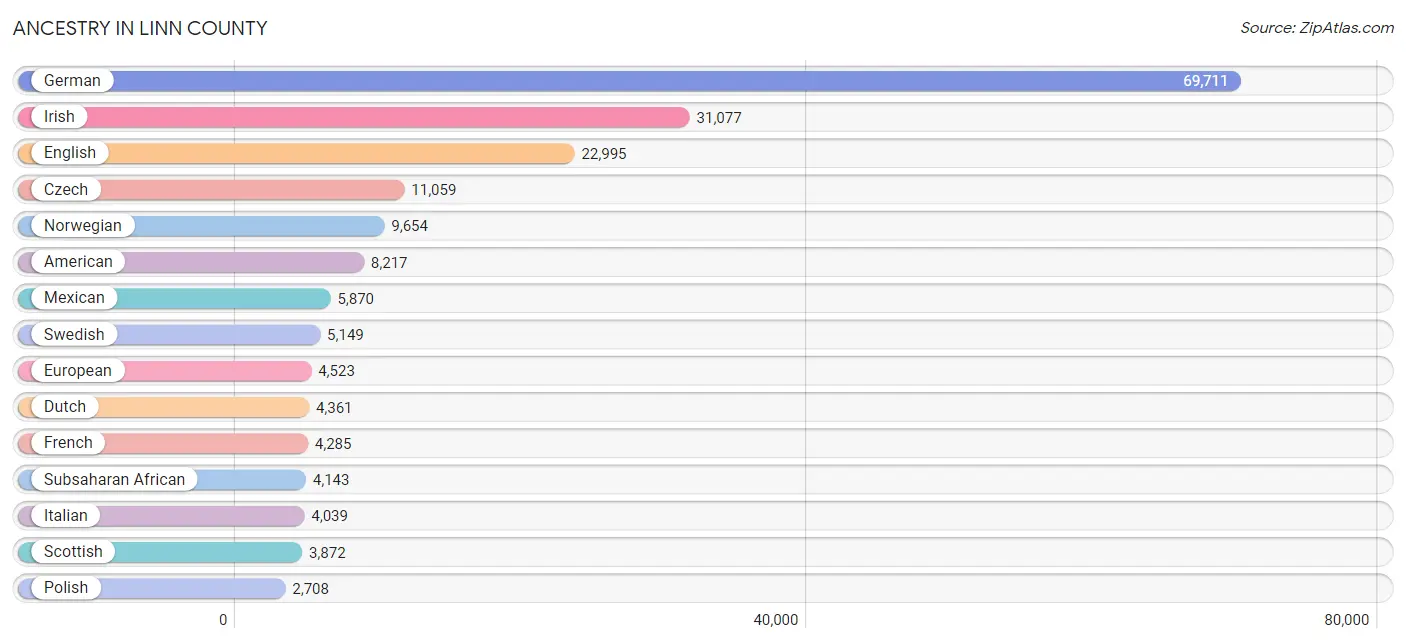
Ancestry in Linn County
The most populous ancestries reported in Linn County are German (69,711 | 30.4%), Irish (31,077 | 13.6%), English (22,995 | 10.0%), Czech (11,059 | 4.8%), and Norwegian (9,654 | 4.2%), together accounting for 63.0% of all Linn County residents.
| Ancestry | # Population | % Population |
| African | 1,402 | 0.6% |
| Alaska Native | 2 | 0.0% |
| Albanian | 95 | 0.0% |
| American | 8,217 | 3.6% |
| Apache | 42 | 0.0% |
| Arab | 2,228 | 1.0% |
| Armenian | 110 | 0.1% |
| Austrian | 541 | 0.2% |
| Bangladeshi | 25 | 0.0% |
| Belgian | 698 | 0.3% |
| Bhutanese | 322 | 0.1% |
| Blackfeet | 39 | 0.0% |
| Brazilian | 64 | 0.0% |
| British | 1,674 | 0.7% |
| Burmese | 475 | 0.2% |
| Canadian | 225 | 0.1% |
| Celtic | 38 | 0.0% |
| Central American | 697 | 0.3% |
| Cherokee | 587 | 0.3% |
| Chickasaw | 22 | 0.0% |
| Chilean | 28 | 0.0% |
| Chippewa | 76 | 0.0% |
| Choctaw | 86 | 0.0% |
| Colombian | 49 | 0.0% |
| Croatian | 167 | 0.1% |
| Crow | 1 | 0.0% |
| Cuban | 83 | 0.0% |
| Czech | 11,059 | 4.8% |
| Czechoslovakian | 500 | 0.2% |
| Danish | 2,061 | 0.9% |
| Dominican | 84 | 0.0% |
| Dutch | 4,361 | 1.9% |
| Eastern European | 329 | 0.1% |
| Ecuadorian | 141 | 0.1% |
| Egyptian | 36 | 0.0% |
| English | 22,995 | 10.0% |
| Estonian | 23 | 0.0% |
| European | 4,523 | 2.0% |
| Finnish | 217 | 0.1% |
| French | 4,285 | 1.9% |
| French American Indian | 80 | 0.0% |
| French Canadian | 424 | 0.2% |
| German | 69,711 | 30.4% |
| Ghanaian | 98 | 0.0% |
| Greek | 264 | 0.1% |
| Guamanian / Chamorro | 21 | 0.0% |
| Guatemalan | 428 | 0.2% |
| Haitian | 83 | 0.0% |
| Honduran | 82 | 0.0% |
| Hungarian | 298 | 0.1% |
| Indian (Asian) | 626 | 0.3% |
| Indonesian | 285 | 0.1% |
| Inupiat | 1 | 0.0% |
| Iranian | 6 | 0.0% |
| Iraqi | 12 | 0.0% |
| Irish | 31,077 | 13.6% |
| Iroquois | 11 | 0.0% |
| Italian | 4,039 | 1.8% |
| Jamaican | 249 | 0.1% |
| Japanese | 28 | 0.0% |
| Jordanian | 35 | 0.0% |
| Kenyan | 36 | 0.0% |
| Korean | 570 | 0.3% |
| Laotian | 155 | 0.1% |
| Latvian | 12 | 0.0% |
| Lebanese | 1,576 | 0.7% |
| Liberian | 30 | 0.0% |
| Lithuanian | 182 | 0.1% |
| Luxembourger | 229 | 0.1% |
| Macedonian | 9 | 0.0% |
| Malaysian | 321 | 0.1% |
| Maltese | 18 | 0.0% |
| Mexican | 5,870 | 2.6% |
| Mexican American Indian | 22 | 0.0% |
| Moroccan | 80 | 0.0% |
| Native Hawaiian | 35 | 0.0% |
| Navajo | 26 | 0.0% |
| Nicaraguan | 89 | 0.0% |
| Nigerian | 289 | 0.1% |
| Northern European | 614 | 0.3% |
| Norwegian | 9,654 | 4.2% |
| Pakistani | 186 | 0.1% |
| Panamanian | 38 | 0.0% |
| Pennsylvania German | 203 | 0.1% |
| Peruvian | 117 | 0.1% |
| Polish | 2,708 | 1.2% |
| Portuguese | 102 | 0.0% |
| Puerto Rican | 431 | 0.2% |
| Romanian | 18 | 0.0% |
| Russian | 437 | 0.2% |
| Salvadoran | 60 | 0.0% |
| Scandinavian | 1,744 | 0.8% |
| Scotch-Irish | 1,828 | 0.8% |
| Scottish | 3,872 | 1.7% |
| Serbian | 83 | 0.0% |
| Sierra Leonean | 20 | 0.0% |
| Sioux | 86 | 0.0% |
| Slavic | 64 | 0.0% |
| Slovak | 271 | 0.1% |
| Slovene | 97 | 0.0% |
| South African | 76 | 0.0% |
| South American | 380 | 0.2% |
| Spaniard | 232 | 0.1% |
| Spanish | 115 | 0.1% |
| Sri Lankan | 599 | 0.3% |
| Subsaharan African | 4,143 | 1.8% |
| Sudanese | 191 | 0.1% |
| Swedish | 5,149 | 2.2% |
| Swiss | 998 | 0.4% |
| Syrian | 129 | 0.1% |
| Thai | 2,242 | 1.0% |
| Tlingit-Haida | 30 | 0.0% |
| Turkish | 31 | 0.0% |
| Ukrainian | 427 | 0.2% |
| Venezuelan | 45 | 0.0% |
| Vietnamese | 57 | 0.0% |
| Welsh | 1,393 | 0.6% |
| Yugoslavian | 48 | 0.0% |
| Yuman | 7 | 0.0% |
| Yup'ik | 13 | 0.0% |
| Zimbabwean | 143 | 0.1% | View All 121 Rows |
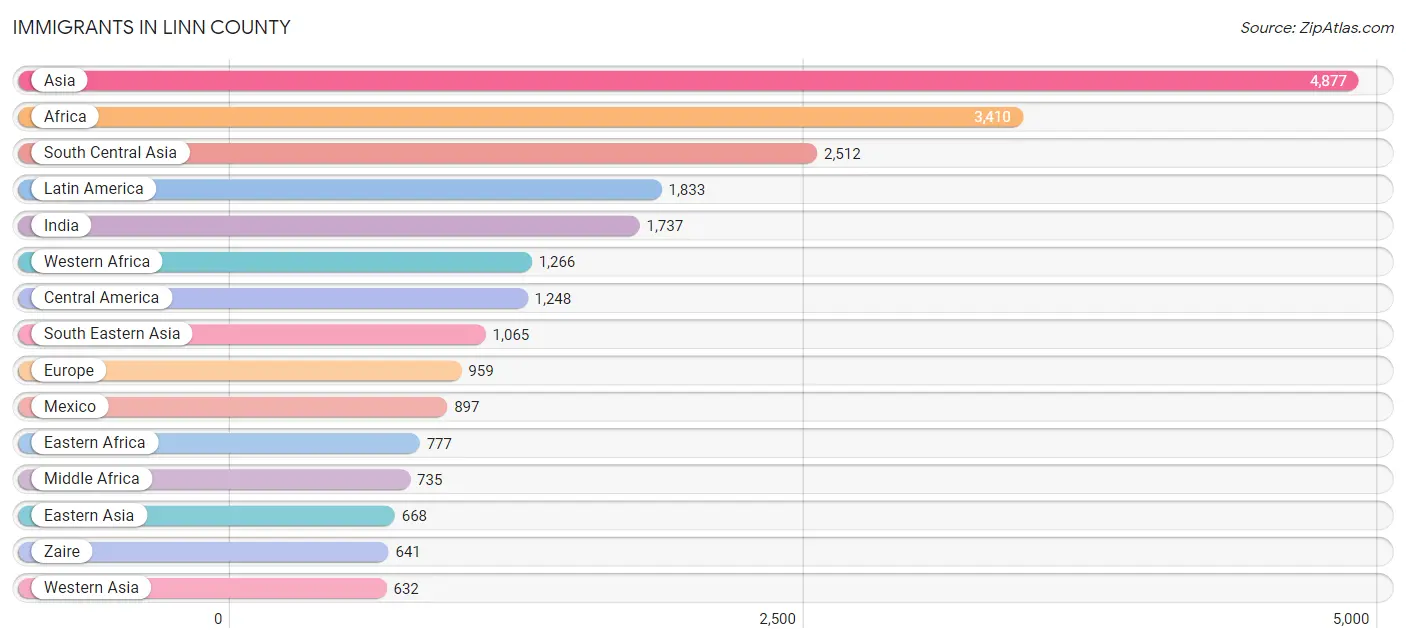
Immigrants in Linn County
The most numerous immigrant groups reported in Linn County came from Asia (4,877 | 2.1%), Africa (3,410 | 1.5%), South Central Asia (2,512 | 1.1%), Latin America (1,833 | 0.8%), and India (1,737 | 0.8%), together accounting for 6.3% of all Linn County residents.
| Immigration Origin | # Population | % Population |
| Africa | 3,410 | 1.5% |
| Armenia | 41 | 0.0% |
| Asia | 4,877 | 2.1% |
| Australia | 34 | 0.0% |
| Bangladesh | 101 | 0.0% |
| Bosnia and Herzegovina | 42 | 0.0% |
| Brazil | 48 | 0.0% |
| Bulgaria | 40 | 0.0% |
| Cambodia | 15 | 0.0% |
| Canada | 295 | 0.1% |
| Caribbean | 311 | 0.1% |
| Central America | 1,248 | 0.5% |
| Chile | 28 | 0.0% |
| China | 428 | 0.2% |
| Colombia | 1 | 0.0% |
| Congo | 94 | 0.0% |
| Croatia | 68 | 0.0% |
| Cuba | 26 | 0.0% |
| Czechoslovakia | 5 | 0.0% |
| Eastern Africa | 777 | 0.3% |
| Eastern Asia | 668 | 0.3% |
| Eastern Europe | 394 | 0.2% |
| Ecuador | 106 | 0.1% |
| El Salvador | 48 | 0.0% |
| England | 33 | 0.0% |
| Eritrea | 12 | 0.0% |
| Ethiopia | 99 | 0.0% |
| Europe | 959 | 0.4% |
| France | 30 | 0.0% |
| Germany | 198 | 0.1% |
| Ghana | 98 | 0.0% |
| Guatemala | 197 | 0.1% |
| Haiti | 108 | 0.1% |
| Honduras | 106 | 0.1% |
| Hong Kong | 6 | 0.0% |
| Hungary | 15 | 0.0% |
| India | 1,737 | 0.8% |
| Indonesia | 58 | 0.0% |
| Iran | 6 | 0.0% |
| Iraq | 24 | 0.0% |
| Ireland | 4 | 0.0% |
| Israel | 22 | 0.0% |
| Italy | 84 | 0.0% |
| Jamaica | 137 | 0.1% |
| Japan | 24 | 0.0% |
| Kenya | 118 | 0.1% |
| Korea | 216 | 0.1% |
| Kuwait | 33 | 0.0% |
| Laos | 161 | 0.1% |
| Latin America | 1,833 | 0.8% |
| Lebanon | 414 | 0.2% |
| Liberia | 255 | 0.1% |
| Mexico | 897 | 0.4% |
| Micronesia | 168 | 0.1% |
| Middle Africa | 735 | 0.3% |
| Morocco | 95 | 0.0% |
| Nepal | 218 | 0.1% |
| Netherlands | 19 | 0.0% |
| Nigeria | 289 | 0.1% |
| Northern Africa | 511 | 0.2% |
| Northern Europe | 202 | 0.1% |
| Oceania | 202 | 0.1% |
| Pakistan | 135 | 0.1% |
| Peru | 54 | 0.0% |
| Philippines | 187 | 0.1% |
| Poland | 19 | 0.0% |
| Russia | 67 | 0.0% |
| Saudi Arabia | 64 | 0.0% |
| Scotland | 24 | 0.0% |
| Sierra Leone | 41 | 0.0% |
| South Africa | 62 | 0.0% |
| South America | 274 | 0.1% |
| South Central Asia | 2,512 | 1.1% |
| South Eastern Asia | 1,065 | 0.5% |
| Southern Europe | 116 | 0.1% |
| Spain | 32 | 0.0% |
| Sri Lanka | 46 | 0.0% |
| Sudan | 298 | 0.1% |
| Sweden | 63 | 0.0% |
| Taiwan | 11 | 0.0% |
| Thailand | 51 | 0.0% |
| Turkey | 34 | 0.0% |
| Ukraine | 76 | 0.0% |
| Venezuela | 37 | 0.0% |
| Vietnam | 375 | 0.2% |
| West Indies | 40 | 0.0% |
| Western Africa | 1,266 | 0.5% |
| Western Asia | 632 | 0.3% |
| Western Europe | 247 | 0.1% |
| Zaire | 641 | 0.3% |
| Zimbabwe | 55 | 0.0% | View All 91 Rows |
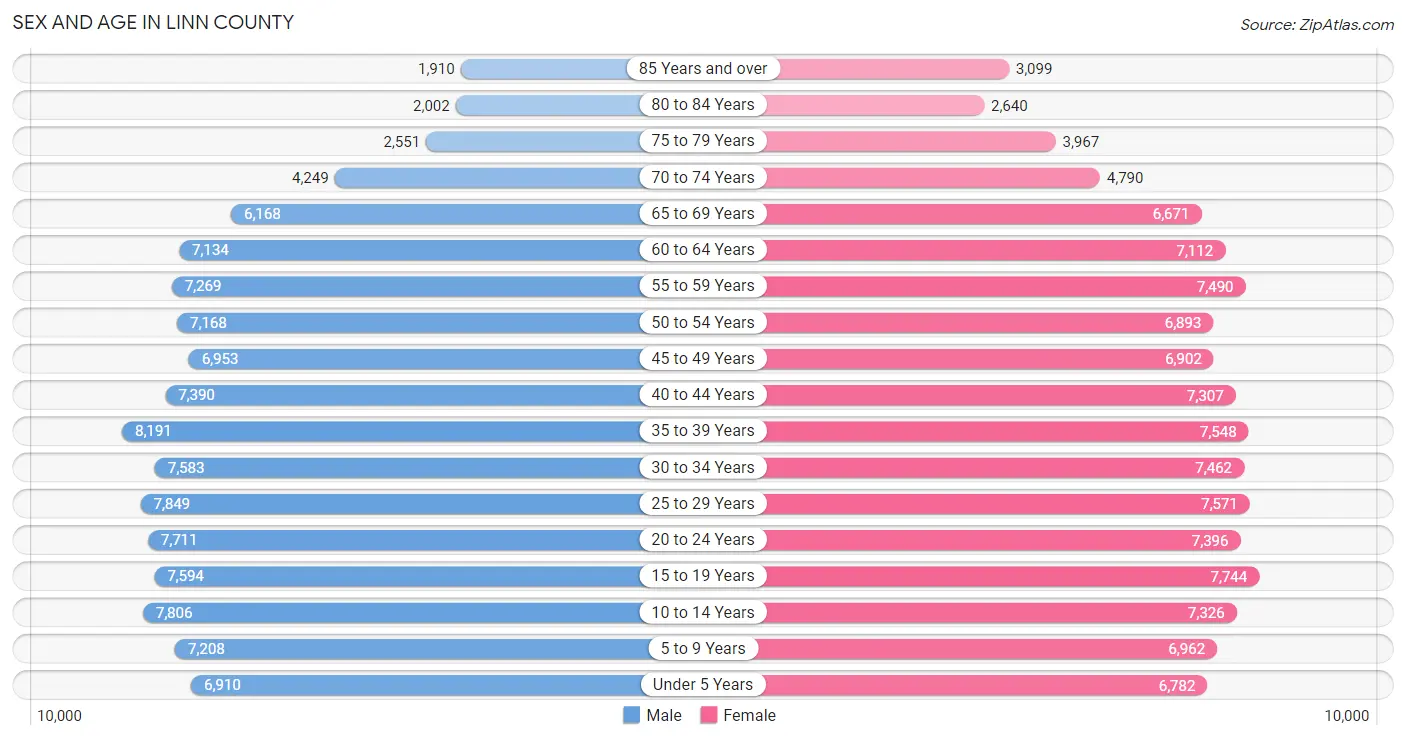
Sex and Age in Linn County
Sex and Age in Linn County
The most populous age groups in Linn County are 35 to 39 Years (8,191 | 7.2%) for men and 15 to 19 Years (7,744 | 6.7%) for women.
| Age Bracket | Male | Female |
| Under 5 Years | 6,910 (6.1%) | 6,782 (5.9%) |
| 5 to 9 Years | 7,208 (6.3%) | 6,962 (6.0%) |
| 10 to 14 Years | 7,806 (6.9%) | 7,326 (6.3%) |
| 15 to 19 Years | 7,594 (6.7%) | 7,744 (6.7%) |
| 20 to 24 Years | 7,711 (6.8%) | 7,396 (6.4%) |
| 25 to 29 Years | 7,849 (6.9%) | 7,571 (6.6%) |
| 30 to 34 Years | 7,583 (6.7%) | 7,462 (6.5%) |
| 35 to 39 Years | 8,191 (7.2%) | 7,548 (6.5%) |
| 40 to 44 Years | 7,390 (6.5%) | 7,307 (6.3%) |
| 45 to 49 Years | 6,953 (6.1%) | 6,902 (6.0%) |
| 50 to 54 Years | 7,168 (6.3%) | 6,893 (6.0%) |
| 55 to 59 Years | 7,269 (6.4%) | 7,490 (6.5%) |
| 60 to 64 Years | 7,134 (6.3%) | 7,112 (6.1%) |
| 65 to 69 Years | 6,168 (5.4%) | 6,671 (5.8%) |
| 70 to 74 Years | 4,249 (3.7%) | 4,790 (4.1%) |
| 75 to 79 Years | 2,551 (2.2%) | 3,967 (3.4%) |
| 80 to 84 Years | 2,002 (1.8%) | 2,640 (2.3%) |
| 85 Years and over | 1,910 (1.7%) | 3,099 (2.7%) |
| Total | 113,646 (100.0%) | 115,662 (100.0%) |
Families and Households in Linn County
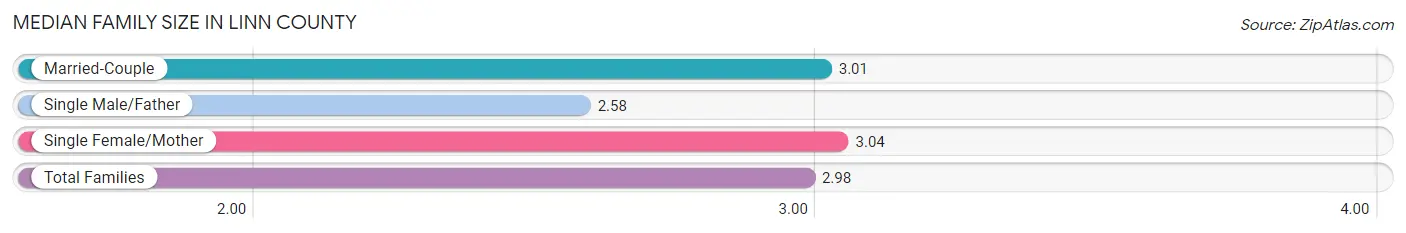
Median Family Size in Linn County
The median family size in Linn County is 2.98 persons per family, with single female/mother families (9,035 | 15.5%) accounting for the largest median family size of 3.04 persons per family. On the other hand, single male/father families (4,314 | 7.4%) represent the smallest median family size with 2.58 persons per family.
| Family Type | # Families | Family Size |
| Married-Couple | 44,801 (77.0%) | 3.01 |
| Single Male/Father | 4,314 (7.4%) | 2.58 |
| Single Female/Mother | 9,035 (15.5%) | 3.04 |
| Total Families | 58,150 (100.0%) | 2.98 |
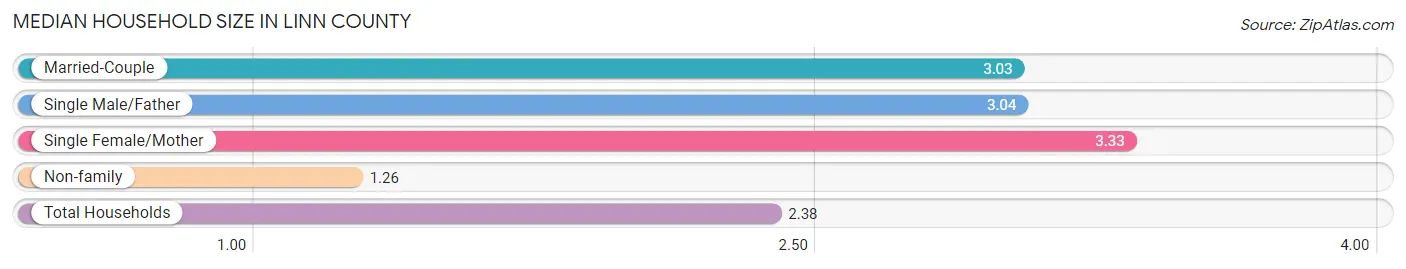
Median Household Size in Linn County
The median household size in Linn County is 2.38 persons per household, with single female/mother households (9,035 | 9.6%) accounting for the largest median household size of 3.33 persons per household. non-family households (36,141 | 38.3%) represent the smallest median household size with 1.26 persons per household.
| Household Type | # Households | Household Size |
| Married-Couple | 44,801 (47.5%) | 3.03 |
| Single Male/Father | 4,314 (4.6%) | 3.04 |
| Single Female/Mother | 9,035 (9.6%) | 3.33 |
| Non-family | 36,141 (38.3%) | 1.26 |
| Total Households | 94,291 (100.0%) | 2.38 |
Household Size by Marriage Status in Linn County
Out of a total of 94,291 households in Linn County, 58,150 (61.7%) are family households, while 36,141 (38.3%) are nonfamily households. The most numerous type of family households are 2-person households, comprising 27,097, and the most common type of nonfamily households are 1-person households, comprising 28,759.
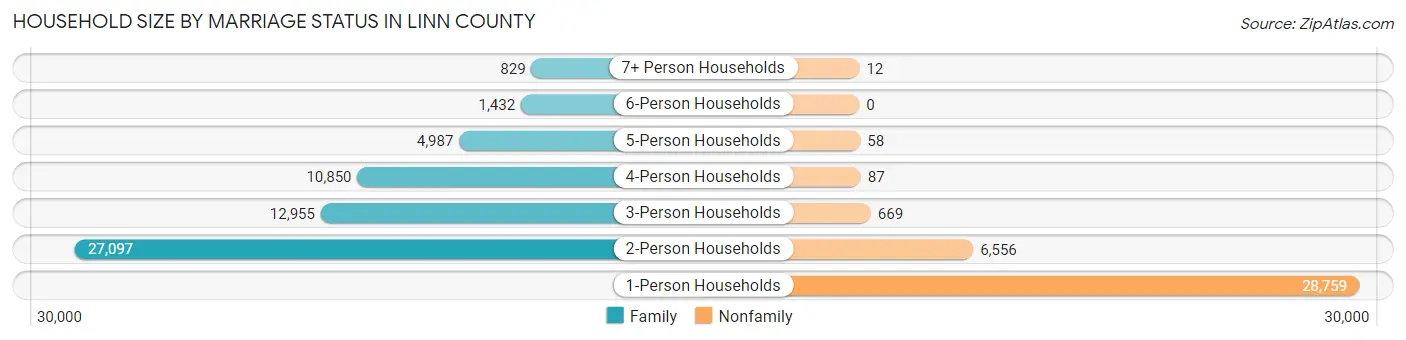
| Household Size | Family Households | Nonfamily Households |
| 1-Person Households | - | 28,759 (30.5%) |
| 2-Person Households | 27,097 (28.7%) | 6,556 (7.0%) |
| 3-Person Households | 12,955 (13.7%) | 669 (0.7%) |
| 4-Person Households | 10,850 (11.5%) | 87 (0.1%) |
| 5-Person Households | 4,987 (5.3%) | 58 (0.1%) |
| 6-Person Households | 1,432 (1.5%) | 0 (0.0%) |
| 7+ Person Households | 829 (0.9%) | 12 (0.0%) |
| Total | 58,150 (61.7%) | 36,141 (38.3%) |
Female Fertility in Linn County
Fertility by Age in Linn County
Average fertility rate in Linn County is 54.0 births per 1,000 women. Women in the age bracket of 20 to 34 years have the highest fertility rate with 83.0 births per 1,000 women. Women in the age bracket of 20 to 34 years acount for 64.4% of all women with births.
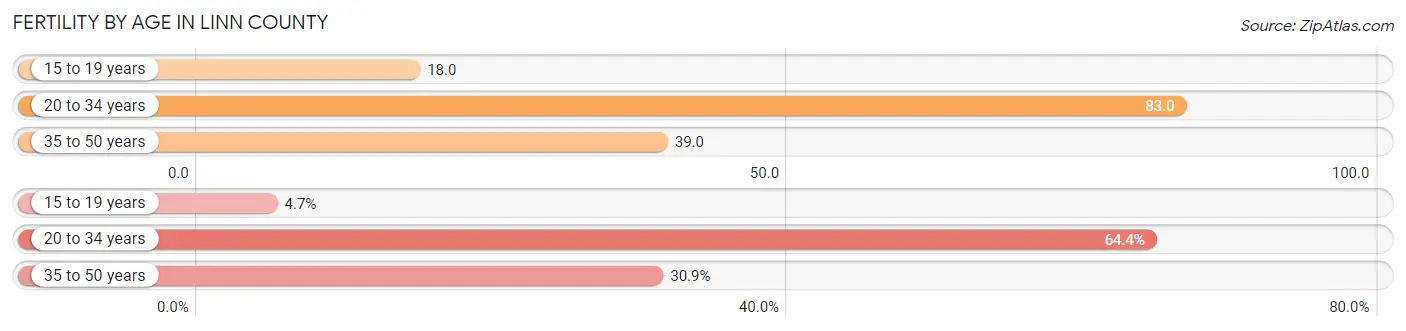
| Age Bracket | Women with Births | Births / 1,000 Women |
| 15 to 19 years | 136 (4.7%) | 18.0 |
| 20 to 34 years | 1,854 (64.4%) | 83.0 |
| 35 to 50 years | 890 (30.9%) | 39.0 |
| Total | 2,880 (100.0%) | 54.0 |
Fertility by Age by Marriage Status in Linn County
67.5% of women with births (2,880) in Linn County are married. The highest percentage of unmarried women with births falls into 15 to 19 years age bracket with 100.0% of them unmarried at the time of birth, while the lowest percentage of unmarried women with births belong to 35 to 50 years age bracket with 25.2% of them unmarried.
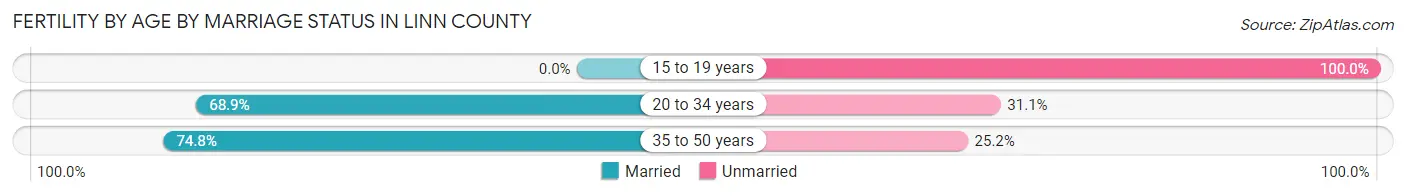
| Age Bracket | Married | Unmarried |
| 15 to 19 years | 0 (0.0%) | 136 (100.0%) |
| 20 to 34 years | 1,277 (68.9%) | 577 (31.1%) |
| 35 to 50 years | 666 (74.8%) | 224 (25.2%) |
| Total | 1,944 (67.5%) | 936 (32.5%) |
Fertility by Education in Linn County
Average fertility rate in Linn County is 54.0 births per 1,000 women. Women with the education attainment of graduate degree have the highest fertility rate of 77.0 births per 1,000 women, while women with the education attainment of less than high school have the lowest fertility at 35.0 births per 1,000 women. Women with the education attainment of bachelor's degree represent 28.8% of all women with births.
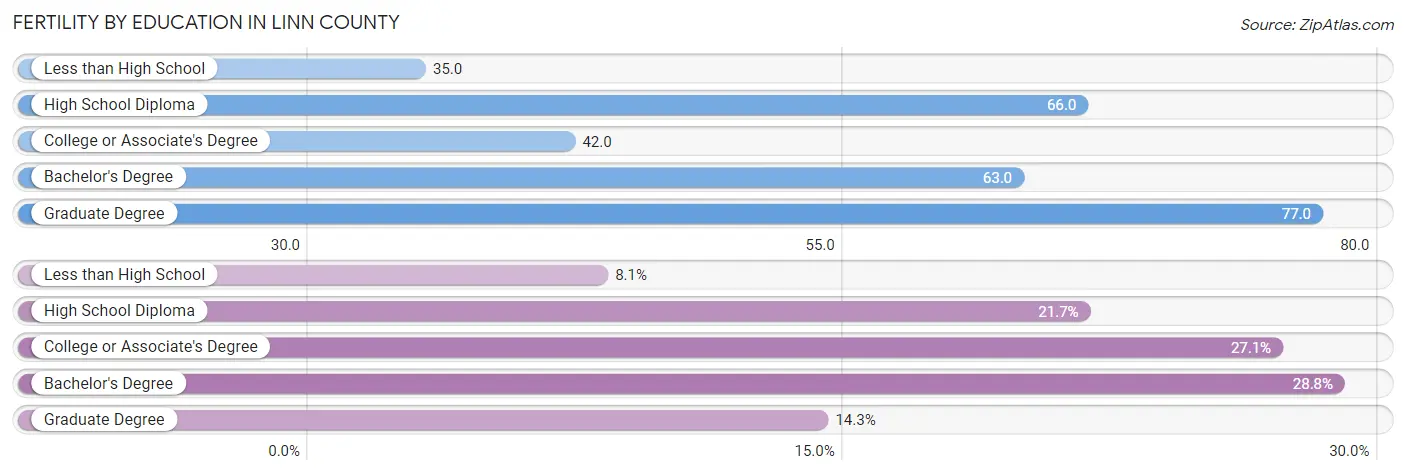
| Educational Attainment | Women with Births | Births / 1,000 Women |
| Less than High School | 234 (8.1%) | 35.0 |
| High School Diploma | 624 (21.7%) | 66.0 |
| College or Associate's Degree | 780 (27.1%) | 42.0 |
| Bachelor's Degree | 830 (28.8%) | 63.0 |
| Graduate Degree | 412 (14.3%) | 77.0 |
| Total | 2,880 (100.0%) | 54.0 |
Fertility by Education by Marriage Status in Linn County
32.5% of women with births in Linn County are unmarried. Women with the educational attainment of bachelor's degree are most likely to be married with 94.2% of them married at childbirth, while women with the educational attainment of less than high school are least likely to be married with 80.3% of them unmarried at childbirth.
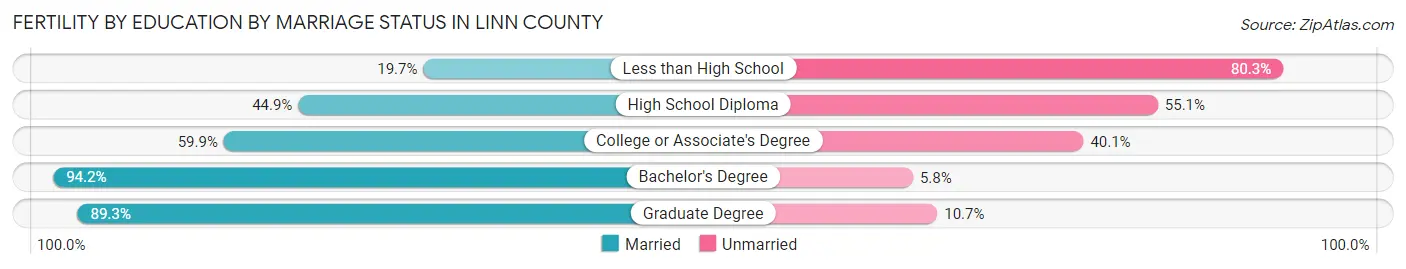
| Educational Attainment | Married | Unmarried |
| Less than High School | 46 (19.7%) | 188 (80.3%) |
| High School Diploma | 280 (44.9%) | 344 (55.1%) |
| College or Associate's Degree | 467 (59.9%) | 313 (40.1%) |
| Bachelor's Degree | 782 (94.2%) | 48 (5.8%) |
| Graduate Degree | 368 (89.3%) | 44 (10.7%) |
| Total | 1,944 (67.5%) | 936 (32.5%) |
Employment Characteristics in Linn County
Employment by Class of Employer in Linn County
Among the 119,071 employed individuals in Linn County, private company employees (86,858 | 73.0%), not-for-profit organizations (10,003 | 8.4%), and local government employees (7,099 | 6.0%) make up the most common classes of employment.
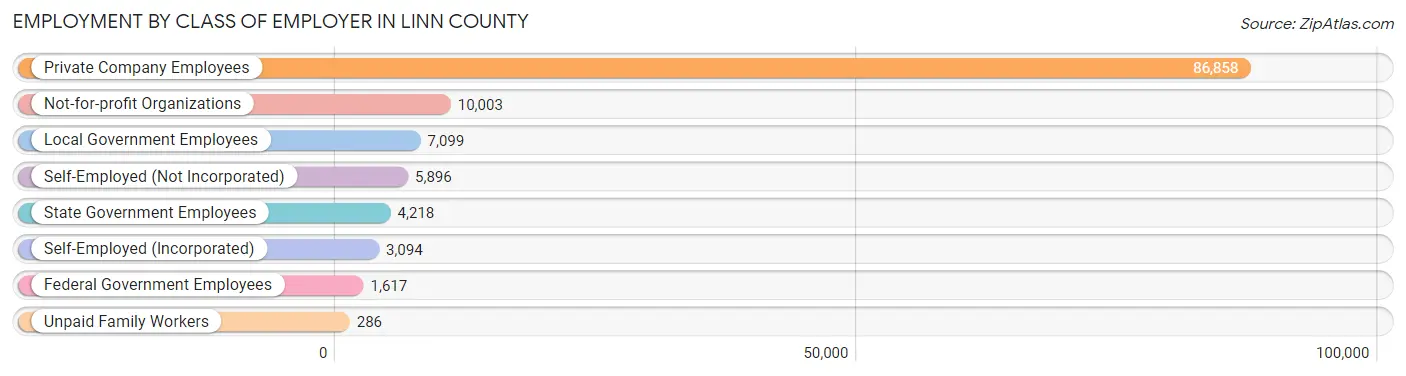
| Employer Class | # Employees | % Employees |
| Private Company Employees | 86,858 | 73.0% |
| Self-Employed (Incorporated) | 3,094 | 2.6% |
| Self-Employed (Not Incorporated) | 5,896 | 5.0% |
| Not-for-profit Organizations | 10,003 | 8.4% |
| Local Government Employees | 7,099 | 6.0% |
| State Government Employees | 4,218 | 3.5% |
| Federal Government Employees | 1,617 | 1.4% |
| Unpaid Family Workers | 286 | 0.2% |
| Total | 119,071 | 100.0% |
Employment Status by Age in Linn County
According to the labor force statistics for Linn County, out of the total population over 16 years of age (183,450), 68.8% or 126,214 individuals are in the labor force, with 3.8% or 4,796 of them unemployed. The age group with the highest labor force participation rate is 35 to 44 years, with 90.3% or 27,484 individuals in the labor force. Within the labor force, the 16 to 19 years age range has the highest percentage of unemployed individuals, with 8.4% or 530 of them being unemployed.
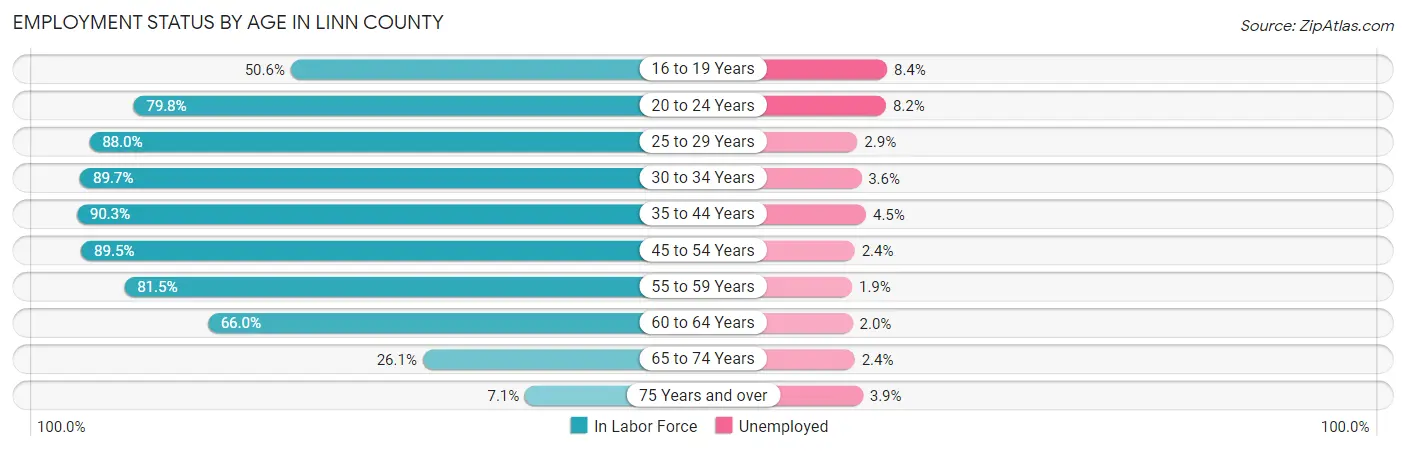
| Age Bracket | In Labor Force | Unemployed |
| 16 to 19 Years | 6,312 (50.6%) | 530 (8.4%) |
| 20 to 24 Years | 12,055 (79.8%) | 989 (8.2%) |
| 25 to 29 Years | 13,570 (88.0%) | 394 (2.9%) |
| 30 to 34 Years | 13,495 (89.7%) | 486 (3.6%) |
| 35 to 44 Years | 27,484 (90.3%) | 1,237 (4.5%) |
| 45 to 54 Years | 24,985 (89.5%) | 600 (2.4%) |
| 55 to 59 Years | 12,029 (81.5%) | 229 (1.9%) |
| 60 to 64 Years | 9,402 (66.0%) | 188 (2.0%) |
| 65 to 74 Years | 5,710 (26.1%) | 137 (2.4%) |
| 75 Years and over | 1,148 (7.1%) | 45 (3.9%) |
| Total | 126,214 (68.8%) | 4,796 (3.8%) |
Employment Status by Educational Attainment in Linn County
According to labor force statistics for Linn County, 85.7% of individuals (100,973) out of the total population between 25 and 64 years of age (117,822) are in the labor force, with 3.1% or 3,130 of them being unemployed. The group with the highest labor force participation rate are those with the educational attainment of bachelor's degree or higher, with 90.2% or 39,524 individuals in the labor force. Within the labor force, individuals with high school diploma education have the highest percentage of unemployment, with 4.8% or 1,018 of them being unemployed.
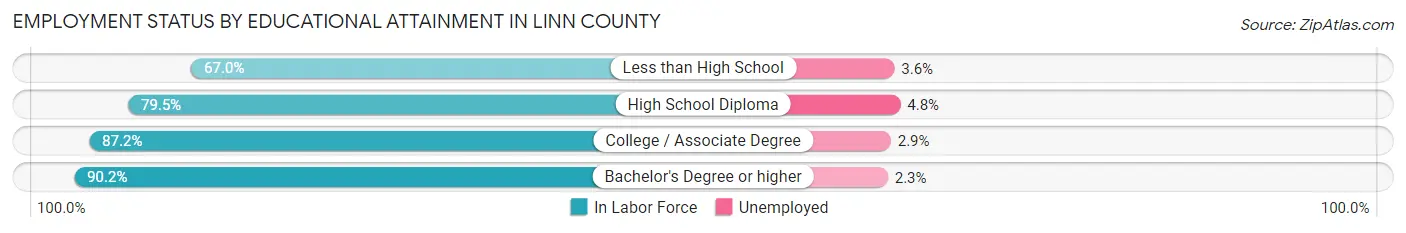
| Educational Attainment | In Labor Force | Unemployed |
| Less than High School | 3,538 (67.0%) | 190 (3.6%) |
| High School Diploma | 21,216 (79.5%) | 1,281 (4.8%) |
| College / Associate Degree | 36,656 (87.2%) | 1,219 (2.9%) |
| Bachelor's Degree or higher | 39,524 (90.2%) | 1,008 (2.3%) |
| Total | 100,973 (85.7%) | 3,652 (3.1%) |
Employment Occupations by Sex in Linn County
Management, Business, Science and Arts Occupations
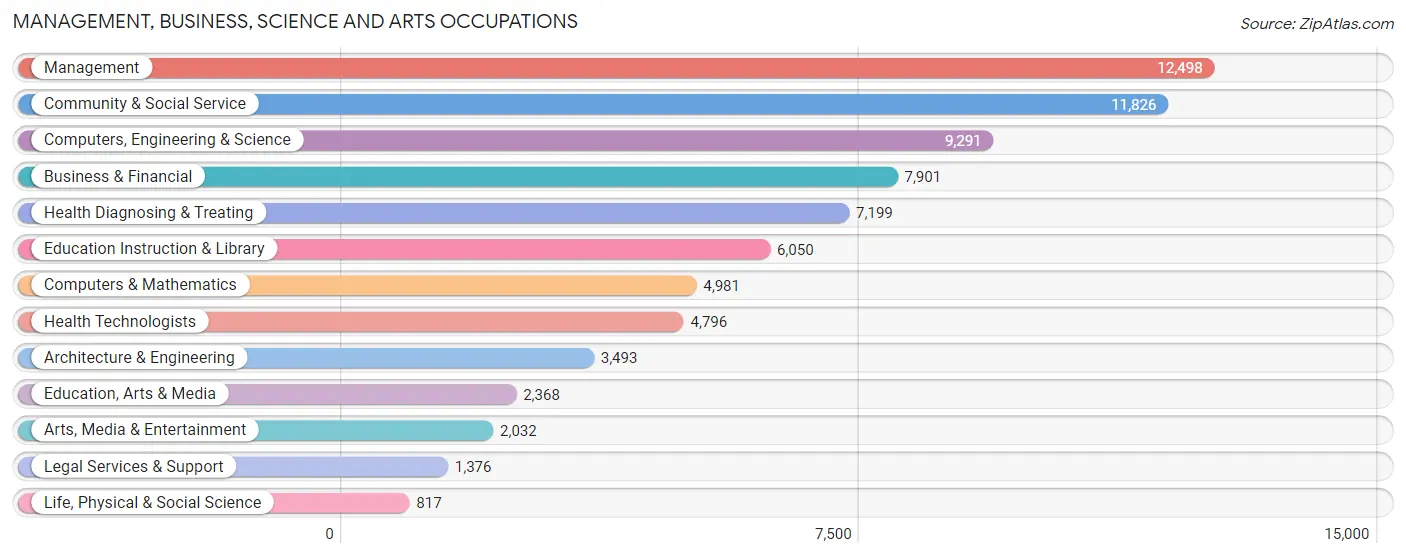
The most common Management, Business, Science and Arts occupations in Linn County are Management (12,498 | 10.3%), Community & Social Service (11,826 | 9.8%), Computers, Engineering & Science (9,291 | 7.7%), Business & Financial (7,901 | 6.5%), and Health Diagnosing & Treating (7,199 | 5.9%).
Management, Business, Science and Arts Occupations by Sex
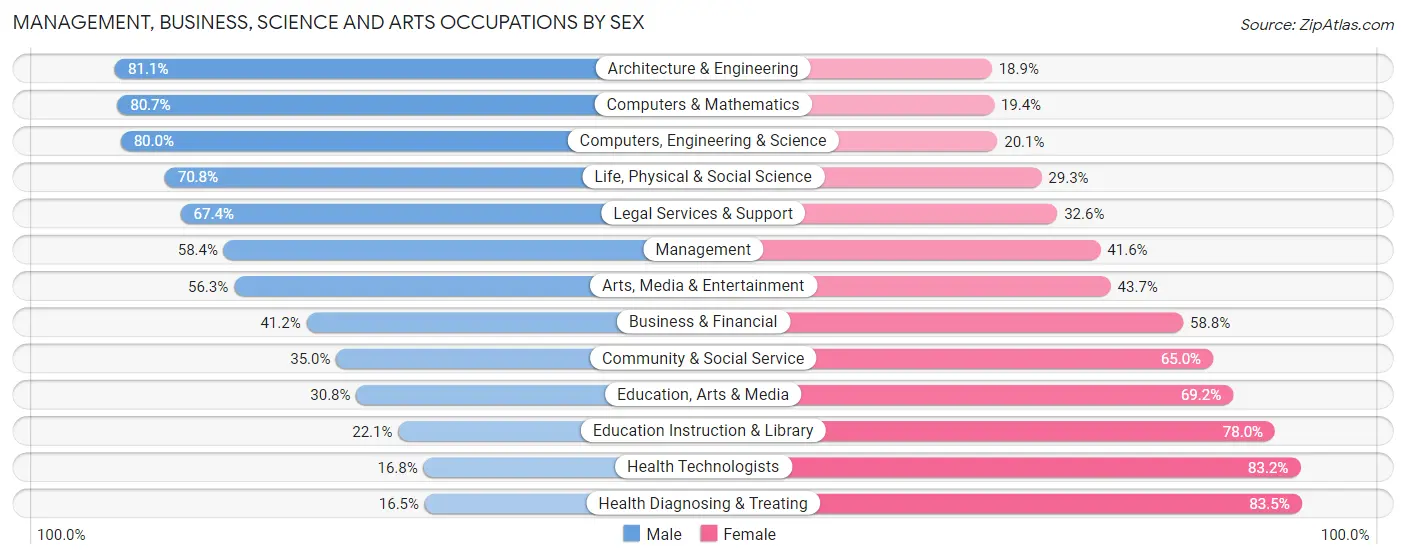
Within the Management, Business, Science and Arts occupations in Linn County, the most male-oriented occupations are Architecture & Engineering (81.1%), Computers & Mathematics (80.6%), and Computers, Engineering & Science (79.9%), while the most female-oriented occupations are Health Diagnosing & Treating (83.5%), Health Technologists (83.2%), and Education Instruction & Library (77.9%).
| Occupation | Male | Female |
| Management | 7,304 (58.4%) | 5,194 (41.6%) |
| Business & Financial | 3,255 (41.2%) | 4,646 (58.8%) |
| Computers, Engineering & Science | 7,428 (79.9%) | 1,863 (20.1%) |
| Computers & Mathematics | 4,017 (80.6%) | 964 (19.4%) |
| Architecture & Engineering | 2,833 (81.1%) | 660 (18.9%) |
| Life, Physical & Social Science | 578 (70.8%) | 239 (29.2%) |
| Community & Social Service | 4,135 (35.0%) | 7,691 (65.0%) |
| Education, Arts & Media | 729 (30.8%) | 1,639 (69.2%) |
| Legal Services & Support | 928 (67.4%) | 448 (32.6%) |
| Education Instruction & Library | 1,334 (22.1%) | 4,716 (77.9%) |
| Arts, Media & Entertainment | 1,144 (56.3%) | 888 (43.7%) |
| Health Diagnosing & Treating | 1,188 (16.5%) | 6,011 (83.5%) |
| Health Technologists | 805 (16.8%) | 3,991 (83.2%) |
| Total (Category) | 23,310 (47.8%) | 25,405 (52.1%) |
| Total (Overall) | 63,170 (52.1%) | 58,148 (47.9%) |
Services Occupations
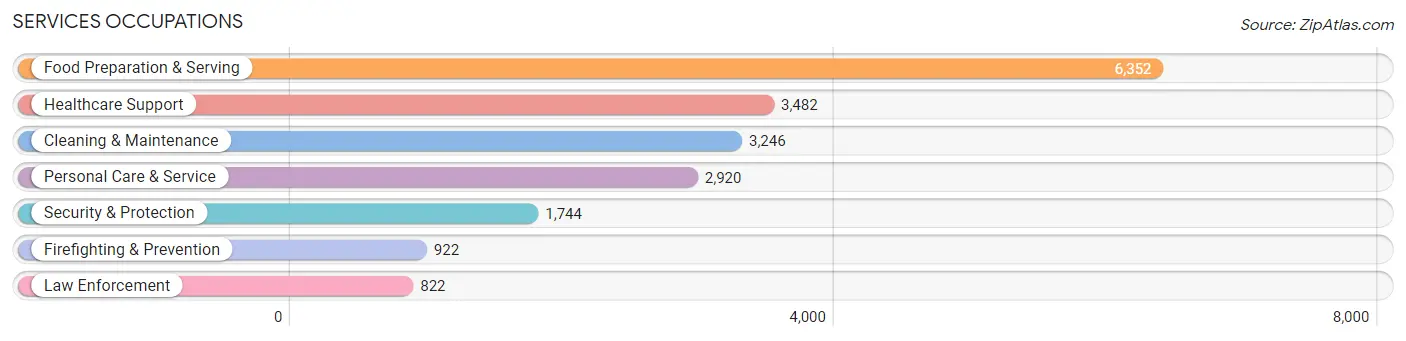
The most common Services occupations in Linn County are Food Preparation & Serving (6,352 | 5.2%), Healthcare Support (3,482 | 2.9%), Cleaning & Maintenance (3,246 | 2.7%), Personal Care & Service (2,920 | 2.4%), and Security & Protection (1,744 | 1.4%).
Services Occupations by Sex
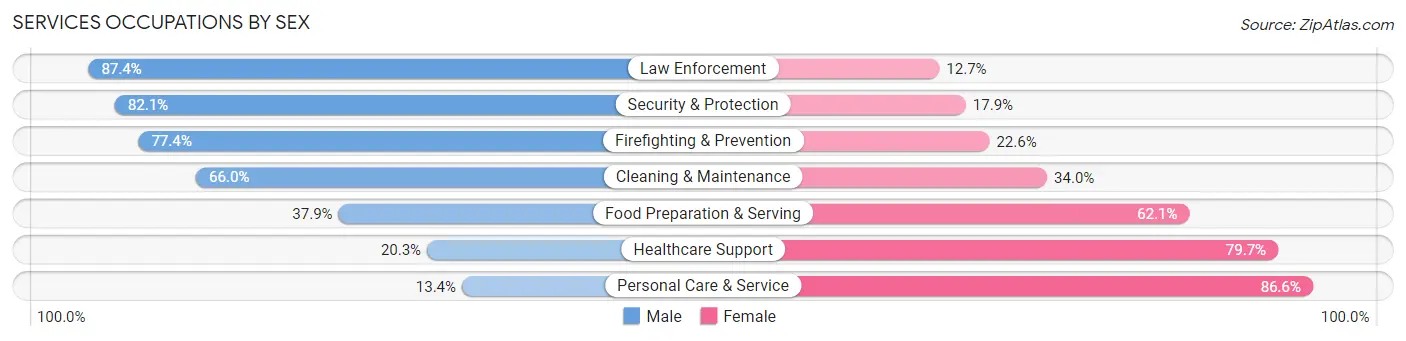
Within the Services occupations in Linn County, the most male-oriented occupations are Law Enforcement (87.4%), Security & Protection (82.1%), and Firefighting & Prevention (77.4%), while the most female-oriented occupations are Personal Care & Service (86.6%), Healthcare Support (79.7%), and Food Preparation & Serving (62.1%).
| Occupation | Male | Female |
| Healthcare Support | 708 (20.3%) | 2,774 (79.7%) |
| Security & Protection | 1,432 (82.1%) | 312 (17.9%) |
| Firefighting & Prevention | 714 (77.4%) | 208 (22.6%) |
| Law Enforcement | 718 (87.4%) | 104 (12.7%) |
| Food Preparation & Serving | 2,405 (37.9%) | 3,947 (62.1%) |
| Cleaning & Maintenance | 2,143 (66.0%) | 1,103 (34.0%) |
| Personal Care & Service | 392 (13.4%) | 2,528 (86.6%) |
| Total (Category) | 7,080 (39.9%) | 10,664 (60.1%) |
| Total (Overall) | 63,170 (52.1%) | 58,148 (47.9%) |
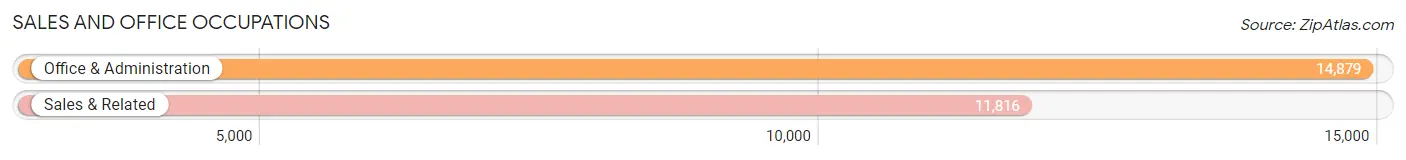
Sales and Office Occupations
The most common Sales and Office occupations in Linn County are Office & Administration (14,879 | 12.3%), and Sales & Related (11,816 | 9.7%).
Sales and Office Occupations by Sex
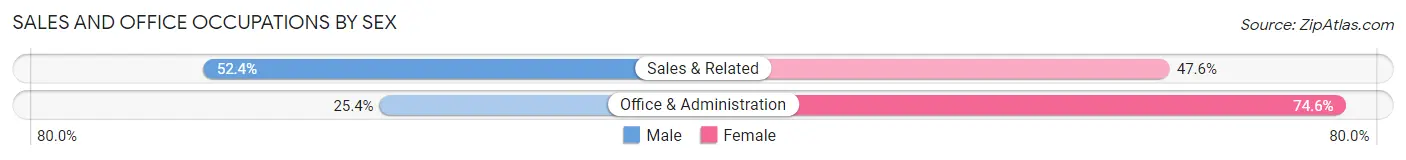
| Occupation | Male | Female |
| Sales & Related | 6,194 (52.4%) | 5,622 (47.6%) |
| Office & Administration | 3,781 (25.4%) | 11,098 (74.6%) |
| Total (Category) | 9,975 (37.4%) | 16,720 (62.6%) |
| Total (Overall) | 63,170 (52.1%) | 58,148 (47.9%) |
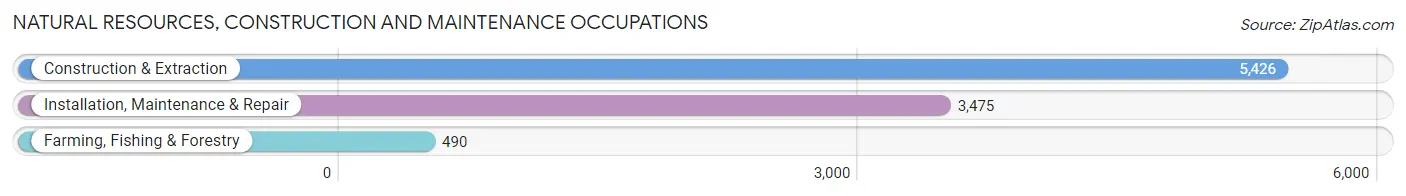
Natural Resources, Construction and Maintenance Occupations
The most common Natural Resources, Construction and Maintenance occupations in Linn County are Construction & Extraction (5,426 | 4.5%), Installation, Maintenance & Repair (3,475 | 2.9%), and Farming, Fishing & Forestry (490 | 0.4%).
Natural Resources, Construction and Maintenance Occupations by Sex
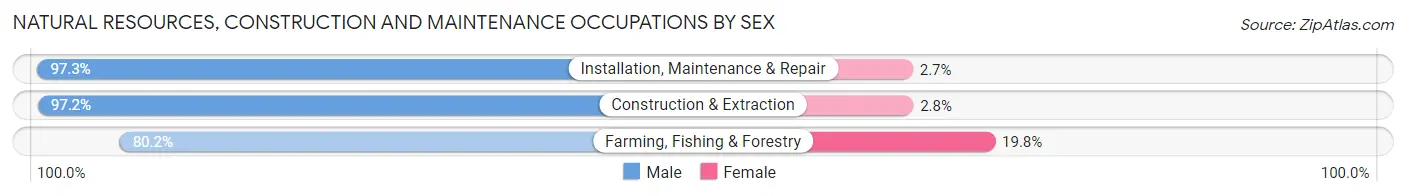
| Occupation | Male | Female |
| Farming, Fishing & Forestry | 393 (80.2%) | 97 (19.8%) |
| Construction & Extraction | 5,276 (97.2%) | 150 (2.8%) |
| Installation, Maintenance & Repair | 3,382 (97.3%) | 93 (2.7%) |
| Total (Category) | 9,051 (96.4%) | 340 (3.6%) |
| Total (Overall) | 63,170 (52.1%) | 58,148 (47.9%) |
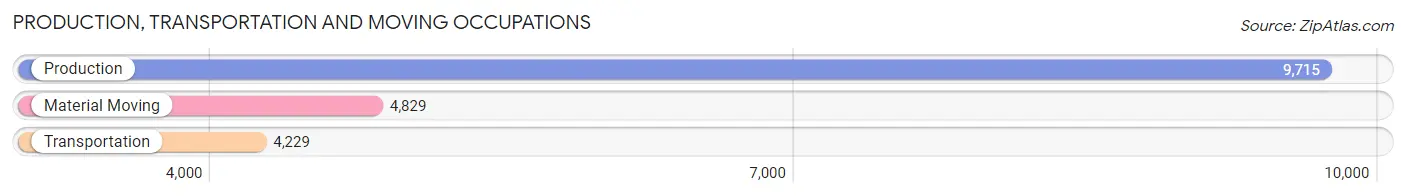
Production, Transportation and Moving Occupations
The most common Production, Transportation and Moving occupations in Linn County are Production (9,715 | 8.0%), Material Moving (4,829 | 4.0%), and Transportation (4,229 | 3.5%).
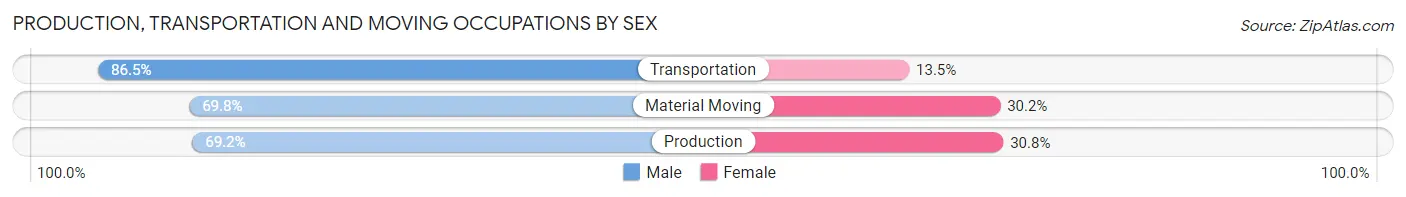
Production, Transportation and Moving Occupations by Sex
| Occupation | Male | Female |
| Production | 6,726 (69.2%) | 2,989 (30.8%) |
| Transportation | 3,658 (86.5%) | 571 (13.5%) |
| Material Moving | 3,370 (69.8%) | 1,459 (30.2%) |
| Total (Category) | 13,754 (73.3%) | 5,019 (26.7%) |
| Total (Overall) | 63,170 (52.1%) | 58,148 (47.9%) |
Employment Industries by Sex in Linn County
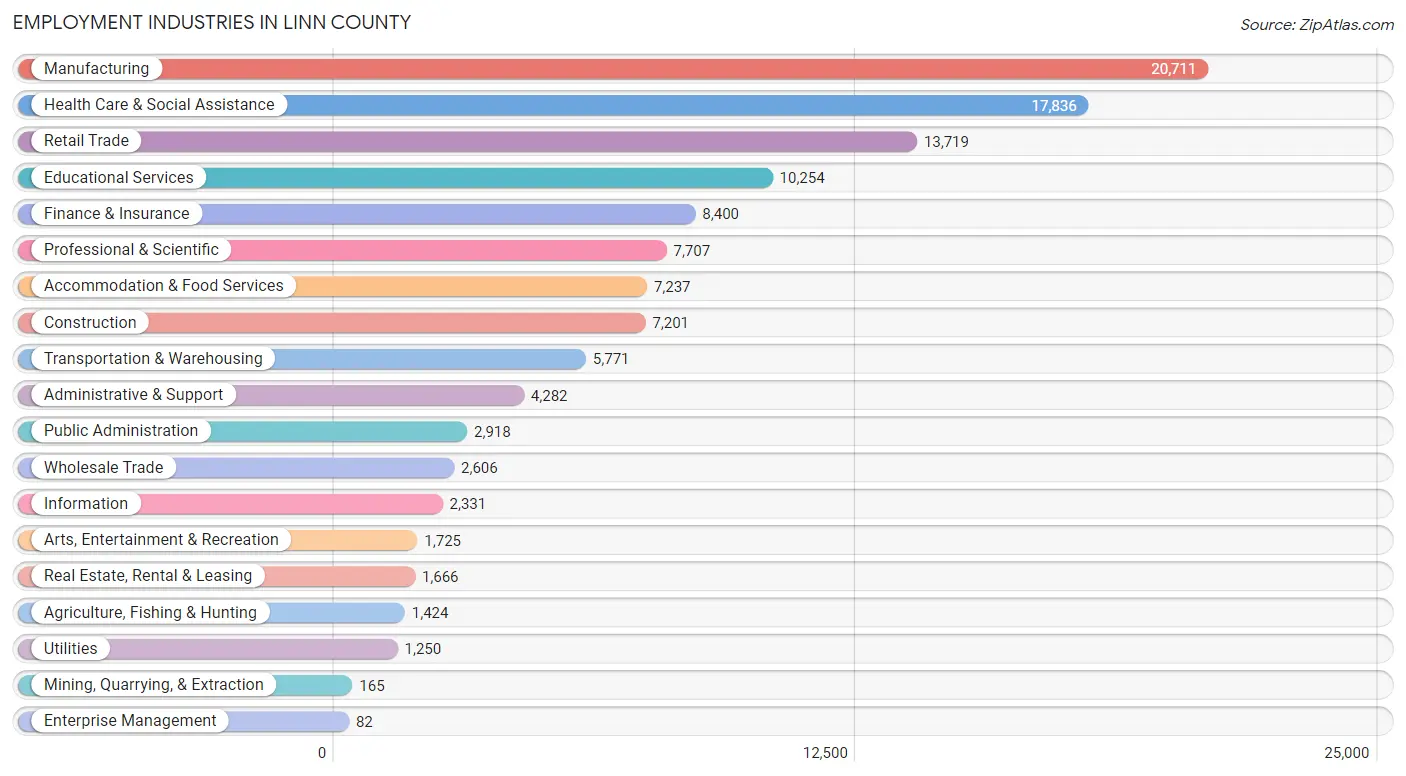
Employment Industries in Linn County
The major employment industries in Linn County include Manufacturing (20,711 | 17.1%), Health Care & Social Assistance (17,836 | 14.7%), Retail Trade (13,719 | 11.3%), Educational Services (10,254 | 8.5%), and Finance & Insurance (8,400 | 6.9%).
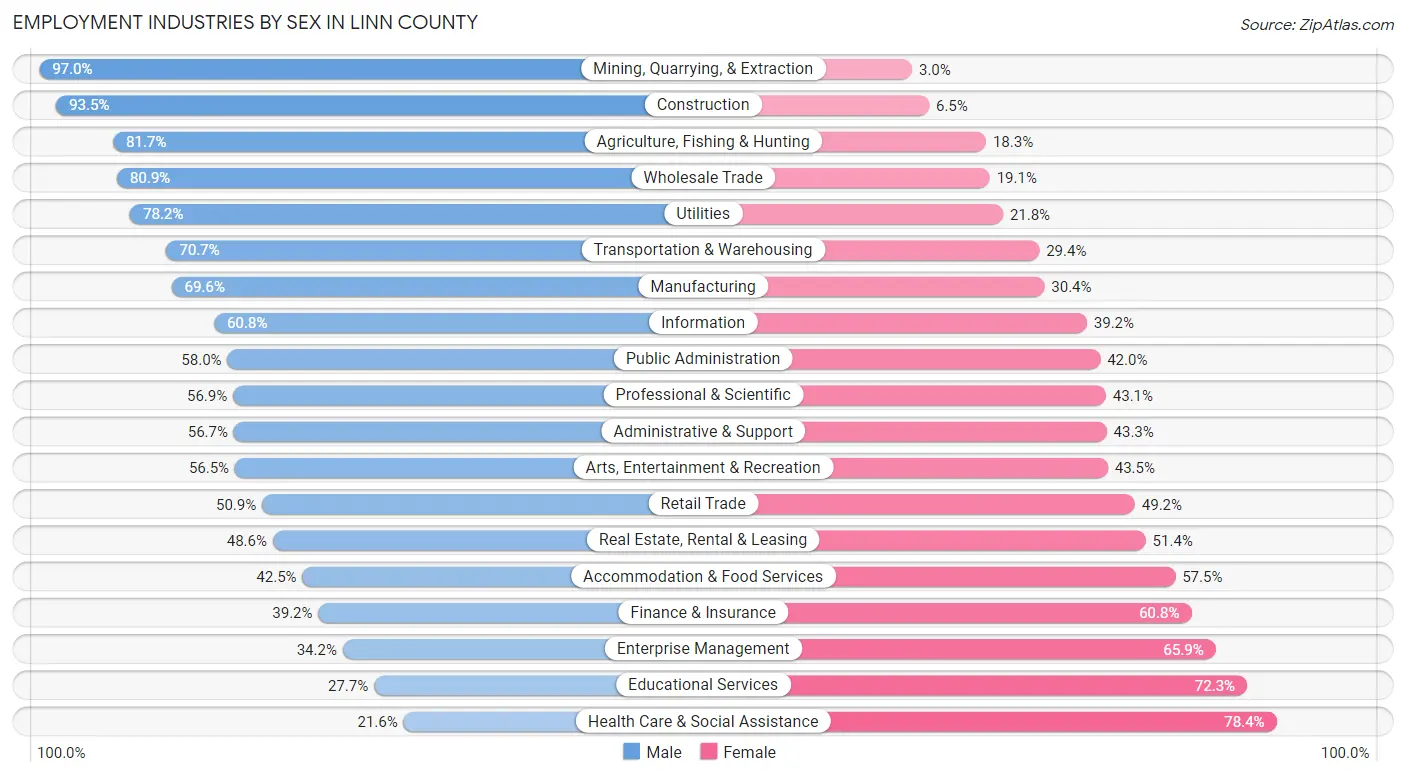
Employment Industries by Sex in Linn County
The Linn County industries that see more men than women are Mining, Quarrying, & Extraction (97.0%), Construction (93.5%), and Agriculture, Fishing & Hunting (81.7%), whereas the industries that tend to have a higher number of women are Health Care & Social Assistance (78.4%), Educational Services (72.3%), and Enterprise Management (65.8%).
| Industry | Male | Female |
| Agriculture, Fishing & Hunting | 1,163 (81.7%) | 261 (18.3%) |
| Mining, Quarrying, & Extraction | 160 (97.0%) | 5 (3.0%) |
| Construction | 6,730 (93.5%) | 471 (6.5%) |
| Manufacturing | 14,410 (69.6%) | 6,301 (30.4%) |
| Wholesale Trade | 2,108 (80.9%) | 498 (19.1%) |
| Retail Trade | 6,976 (50.8%) | 6,743 (49.1%) |
| Transportation & Warehousing | 4,077 (70.7%) | 1,694 (29.3%) |
| Utilities | 977 (78.2%) | 273 (21.8%) |
| Information | 1,417 (60.8%) | 914 (39.2%) |
| Finance & Insurance | 3,292 (39.2%) | 5,108 (60.8%) |
| Real Estate, Rental & Leasing | 810 (48.6%) | 856 (51.4%) |
| Professional & Scientific | 4,382 (56.9%) | 3,325 (43.1%) |
| Enterprise Management | 28 (34.2%) | 54 (65.8%) |
| Administrative & Support | 2,428 (56.7%) | 1,854 (43.3%) |
| Educational Services | 2,837 (27.7%) | 7,417 (72.3%) |
| Health Care & Social Assistance | 3,846 (21.6%) | 13,990 (78.4%) |
| Arts, Entertainment & Recreation | 974 (56.5%) | 751 (43.5%) |
| Accommodation & Food Services | 3,076 (42.5%) | 4,161 (57.5%) |
| Public Administration | 1,693 (58.0%) | 1,225 (42.0%) |
| Total | 63,170 (52.1%) | 58,148 (47.9%) |
Education in Linn County
School Enrollment in Linn County
The most common levels of schooling among the 56,314 students in Linn County are middle school (12,525 | 22.2%), high school (11,926 | 21.2%), and college / undergraduate (11,518 | 20.4%).
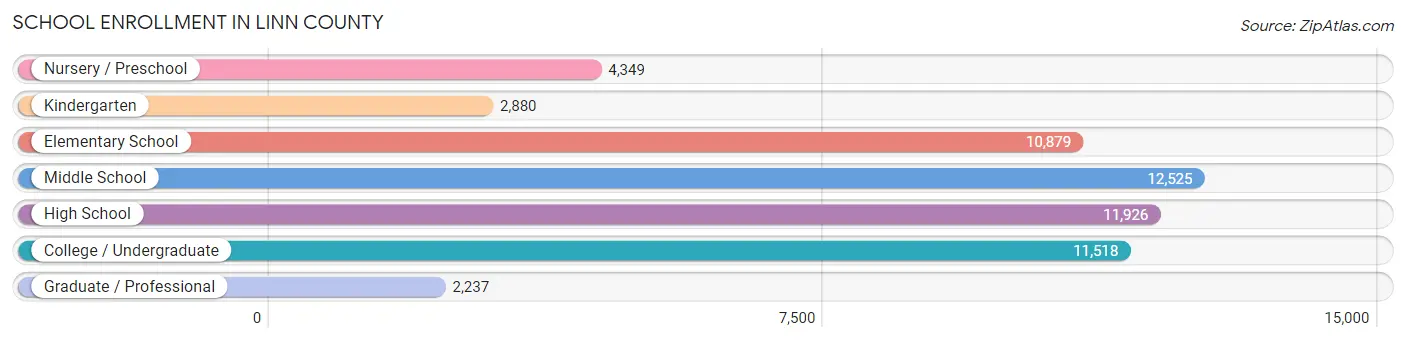
| School Level | # Students | % Students |
| Nursery / Preschool | 4,349 | 7.7% |
| Kindergarten | 2,880 | 5.1% |
| Elementary School | 10,879 | 19.3% |
| Middle School | 12,525 | 22.2% |
| High School | 11,926 | 21.2% |
| College / Undergraduate | 11,518 | 20.4% |
| Graduate / Professional | 2,237 | 4.0% |
| Total | 56,314 | 100.0% |
School Enrollment by Age by Funding Source in Linn County
Out of a total of 56,314 students who are enrolled in schools in Linn County, 10,080 (17.9%) attend a private institution, while the remaining 46,234 (82.1%) are enrolled in public schools. The age group of 18 to 19 year olds has the highest likelihood of being enrolled in private schools, with 2,058 (43.4% in the age bracket) enrolled. Conversely, the age group of 15 to 17 year olds has the lowest likelihood of being enrolled in a private school, with 8,416 (92.4% in the age bracket) attending a public institution.
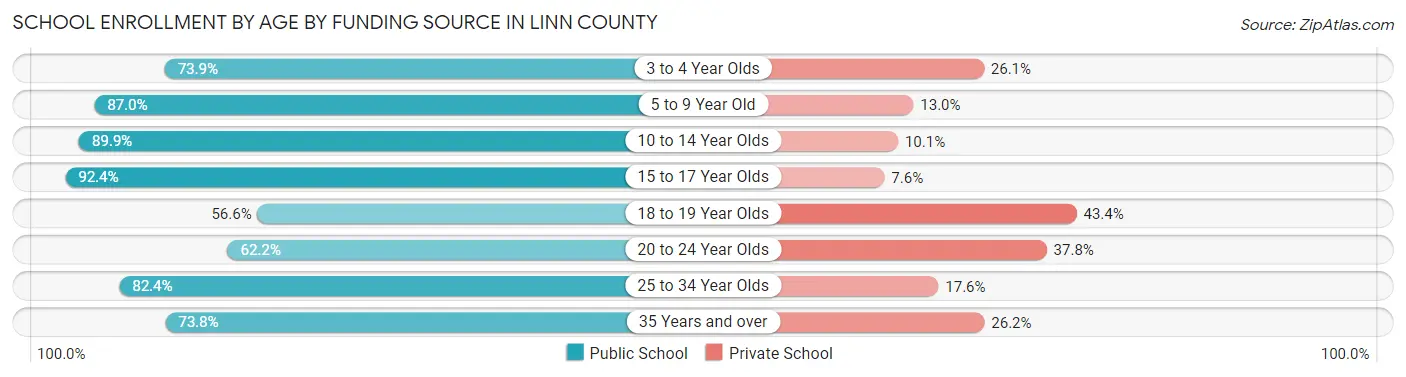
| Age Bracket | Public School | Private School |
| 3 to 4 Year Olds | 2,247 (73.9%) | 794 (26.1%) |
| 5 to 9 Year Old | 12,055 (87.0%) | 1,798 (13.0%) |
| 10 to 14 Year Olds | 13,361 (89.9%) | 1,505 (10.1%) |
| 15 to 17 Year Olds | 8,416 (92.4%) | 691 (7.6%) |
| 18 to 19 Year Olds | 2,686 (56.6%) | 2,058 (43.4%) |
| 20 to 24 Year Olds | 3,516 (62.2%) | 2,138 (37.8%) |
| 25 to 34 Year Olds | 2,147 (82.4%) | 460 (17.6%) |
| 35 Years and over | 1,802 (73.8%) | 640 (26.2%) |
| Total | 46,234 (82.1%) | 10,080 (17.9%) |
Educational Attainment by Field of Study in Linn County
Business (12,393 | 21.0%), education (7,760 | 13.1%), science & technology (5,858 | 9.9%), engineering (5,554 | 9.4%), and arts & humanities (3,680 | 6.2%) are the most common fields of study among 59,065 individuals in Linn County who have obtained a bachelor's degree or higher.
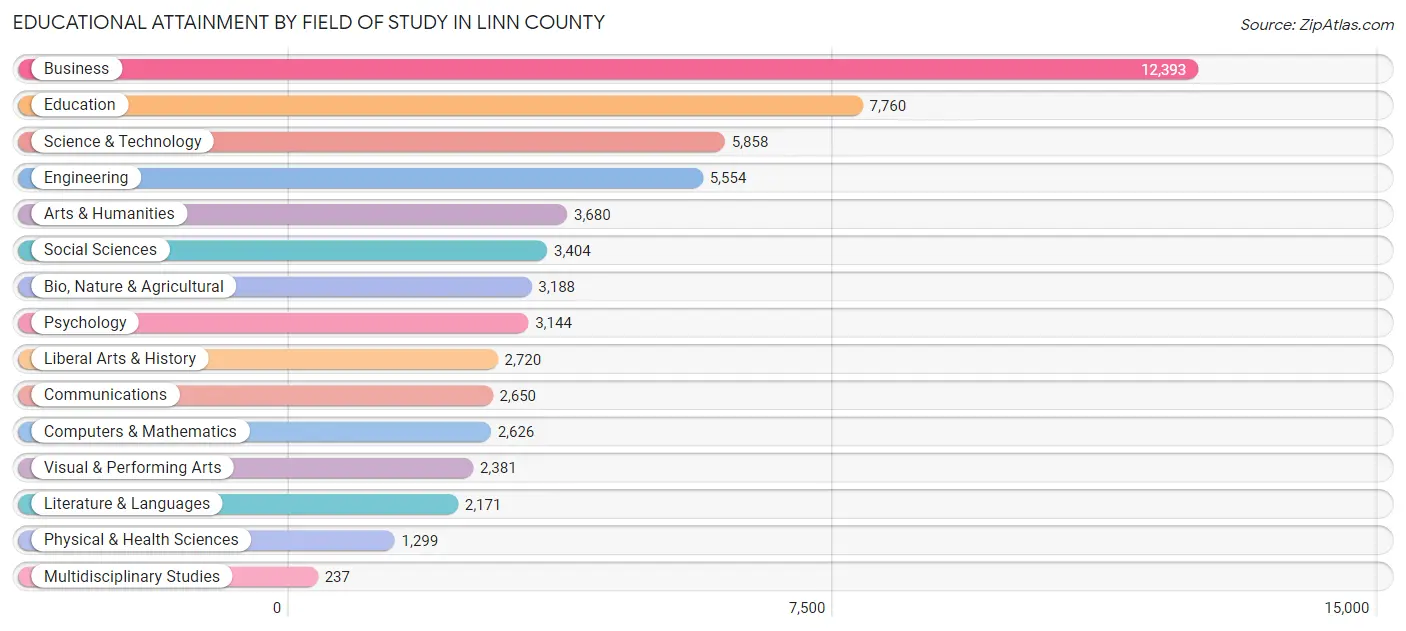
| Field of Study | # Graduates | % Graduates |
| Computers & Mathematics | 2,626 | 4.4% |
| Bio, Nature & Agricultural | 3,188 | 5.4% |
| Physical & Health Sciences | 1,299 | 2.2% |
| Psychology | 3,144 | 5.3% |
| Social Sciences | 3,404 | 5.8% |
| Engineering | 5,554 | 9.4% |
| Multidisciplinary Studies | 237 | 0.4% |
| Science & Technology | 5,858 | 9.9% |
| Business | 12,393 | 21.0% |
| Education | 7,760 | 13.1% |
| Literature & Languages | 2,171 | 3.7% |
| Liberal Arts & History | 2,720 | 4.6% |
| Visual & Performing Arts | 2,381 | 4.0% |
| Communications | 2,650 | 4.5% |
| Arts & Humanities | 3,680 | 6.2% |
| Total | 59,065 | 100.0% |
Transportation & Commute in Linn County
Vehicle Availability by Sex in Linn County
The most prevalent vehicle ownership categories in Linn County are males with 2 vehicles (28,003, accounting for 45.2%) and females with 2 vehicles (24,775, making up 50.0%).
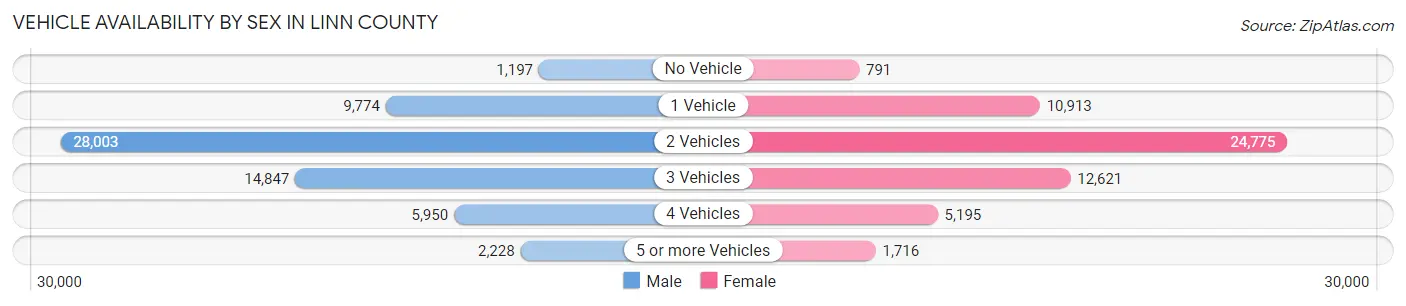
| Vehicles Available | Male | Female |
| No Vehicle | 1,197 (1.9%) | 791 (1.4%) |
| 1 Vehicle | 9,774 (15.8%) | 10,913 (19.5%) |
| 2 Vehicles | 28,003 (45.2%) | 24,775 (44.2%) |
| 3 Vehicles | 14,847 (23.9%) | 12,621 (22.5%) |
| 4 Vehicles | 5,950 (9.6%) | 5,195 (9.3%) |
| 5 or more Vehicles | 2,228 (3.6%) | 1,716 (3.1%) |
| Total | 61,999 (100.0%) | 56,011 (100.0%) |
Commute Time in Linn County
The most frequently occuring commute durations in Linn County are 10 to 14 minutes (23,433 commuters, 22.3%), 15 to 19 minutes (22,922 commuters, 21.8%), and 20 to 24 minutes (15,761 commuters, 15.0%).
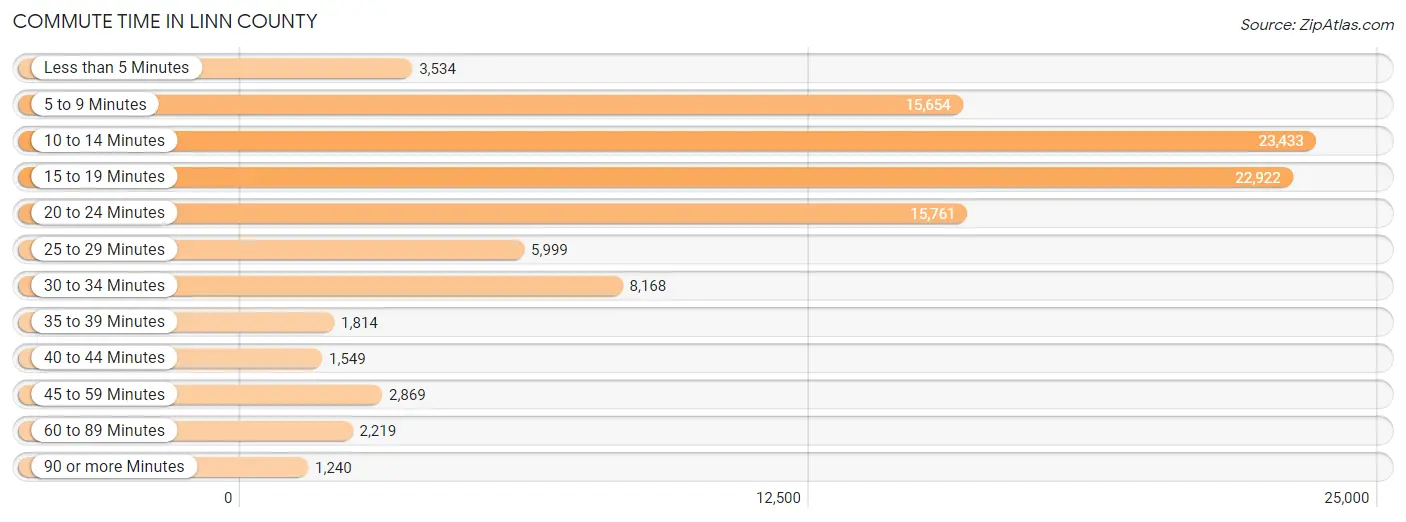
| Commute Time | # Commuters | % Commuters |
| Less than 5 Minutes | 3,534 | 3.4% |
| 5 to 9 Minutes | 15,654 | 14.9% |
| 10 to 14 Minutes | 23,433 | 22.3% |
| 15 to 19 Minutes | 22,922 | 21.8% |
| 20 to 24 Minutes | 15,761 | 15.0% |
| 25 to 29 Minutes | 5,999 | 5.7% |
| 30 to 34 Minutes | 8,168 | 7.8% |
| 35 to 39 Minutes | 1,814 | 1.7% |
| 40 to 44 Minutes | 1,549 | 1.5% |
| 45 to 59 Minutes | 2,869 | 2.7% |
| 60 to 89 Minutes | 2,219 | 2.1% |
| 90 or more Minutes | 1,240 | 1.2% |
Commute Time by Sex in Linn County
The most common commute times in Linn County are 10 to 14 minutes (12,510 commuters, 22.5%) for males and 10 to 14 minutes (10,923 commuters, 22.1%) for females.
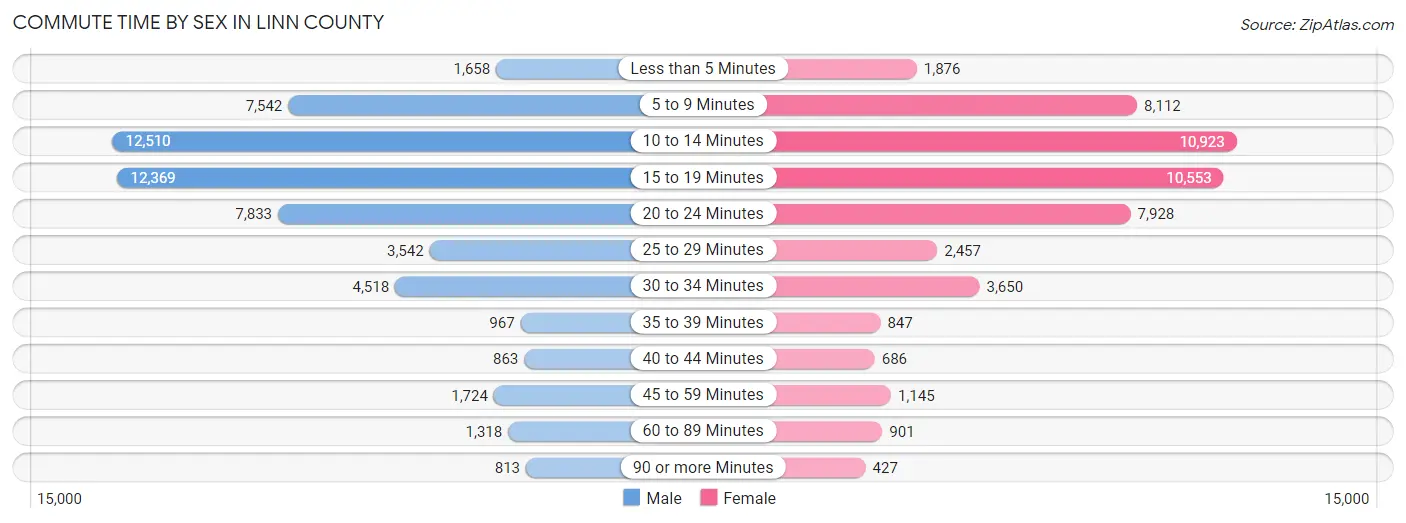
| Commute Time | Male | Female |
| Less than 5 Minutes | 1,658 (3.0%) | 1,876 (3.8%) |
| 5 to 9 Minutes | 7,542 (13.6%) | 8,112 (16.4%) |
| 10 to 14 Minutes | 12,510 (22.5%) | 10,923 (22.1%) |
| 15 to 19 Minutes | 12,369 (22.2%) | 10,553 (21.3%) |
| 20 to 24 Minutes | 7,833 (14.1%) | 7,928 (16.0%) |
| 25 to 29 Minutes | 3,542 (6.4%) | 2,457 (5.0%) |
| 30 to 34 Minutes | 4,518 (8.1%) | 3,650 (7.4%) |
| 35 to 39 Minutes | 967 (1.7%) | 847 (1.7%) |
| 40 to 44 Minutes | 863 (1.5%) | 686 (1.4%) |
| 45 to 59 Minutes | 1,724 (3.1%) | 1,145 (2.3%) |
| 60 to 89 Minutes | 1,318 (2.4%) | 901 (1.8%) |
| 90 or more Minutes | 813 (1.5%) | 427 (0.9%) |
Time of Departure to Work by Sex in Linn County
The most frequent times of departure to work in Linn County are 6:30 AM to 6:59 AM (7,712, 13.9%) for males and 7:30 AM to 7:59 AM (9,553, 19.3%) for females.
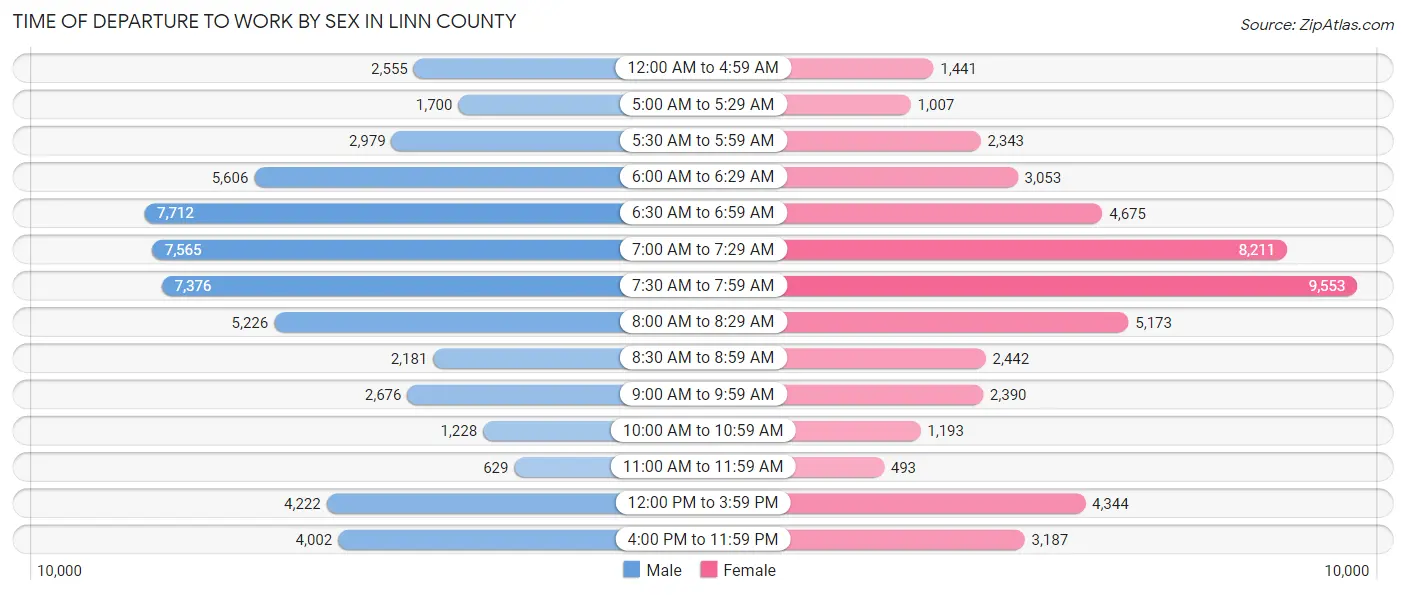
| Time of Departure | Male | Female |
| 12:00 AM to 4:59 AM | 2,555 (4.6%) | 1,441 (2.9%) |
| 5:00 AM to 5:29 AM | 1,700 (3.0%) | 1,007 (2.0%) |
| 5:30 AM to 5:59 AM | 2,979 (5.3%) | 2,343 (4.7%) |
| 6:00 AM to 6:29 AM | 5,606 (10.1%) | 3,053 (6.2%) |
| 6:30 AM to 6:59 AM | 7,712 (13.9%) | 4,675 (9.4%) |
| 7:00 AM to 7:29 AM | 7,565 (13.6%) | 8,211 (16.6%) |
| 7:30 AM to 7:59 AM | 7,376 (13.3%) | 9,553 (19.3%) |
| 8:00 AM to 8:29 AM | 5,226 (9.4%) | 5,173 (10.4%) |
| 8:30 AM to 8:59 AM | 2,181 (3.9%) | 2,442 (4.9%) |
| 9:00 AM to 9:59 AM | 2,676 (4.8%) | 2,390 (4.8%) |
| 10:00 AM to 10:59 AM | 1,228 (2.2%) | 1,193 (2.4%) |
| 11:00 AM to 11:59 AM | 629 (1.1%) | 493 (1.0%) |
| 12:00 PM to 3:59 PM | 4,222 (7.6%) | 4,344 (8.8%) |
| 4:00 PM to 11:59 PM | 4,002 (7.2%) | 3,187 (6.4%) |
| Total | 55,657 (100.0%) | 49,505 (100.0%) |
Housing Occupancy in Linn County
Occupancy by Ownership in Linn County
Of the total 94,291 dwellings in Linn County, owner-occupied units account for 69,894 (74.1%), while renter-occupied units make up 24,397 (25.9%).
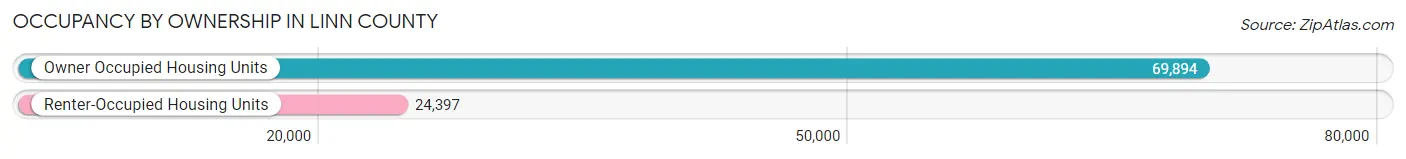
| Occupancy | # Housing Units | % Housing Units |
| Owner Occupied Housing Units | 69,894 | 74.1% |
| Renter-Occupied Housing Units | 24,397 | 25.9% |
| Total Occupied Housing Units | 94,291 | 100.0% |
Occupancy by Household Size in Linn County
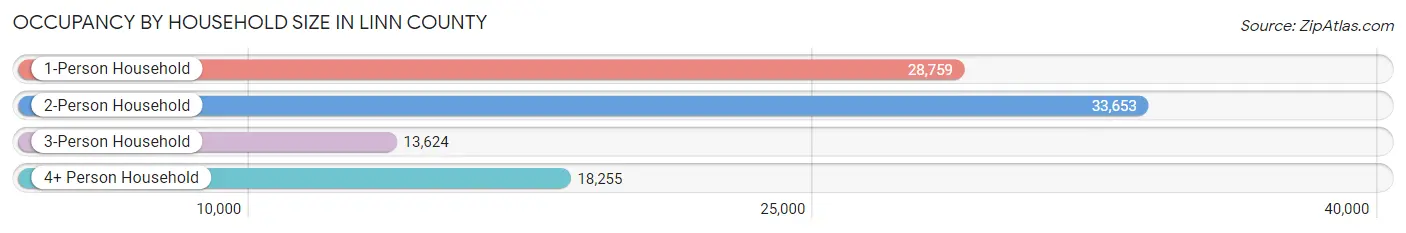
| Household Size | # Housing Units | % Housing Units |
| 1-Person Household | 28,759 | 30.5% |
| 2-Person Household | 33,653 | 35.7% |
| 3-Person Household | 13,624 | 14.4% |
| 4+ Person Household | 18,255 | 19.4% |
| Total Housing Units | 94,291 | 100.0% |
Occupancy by Ownership by Household Size in Linn County
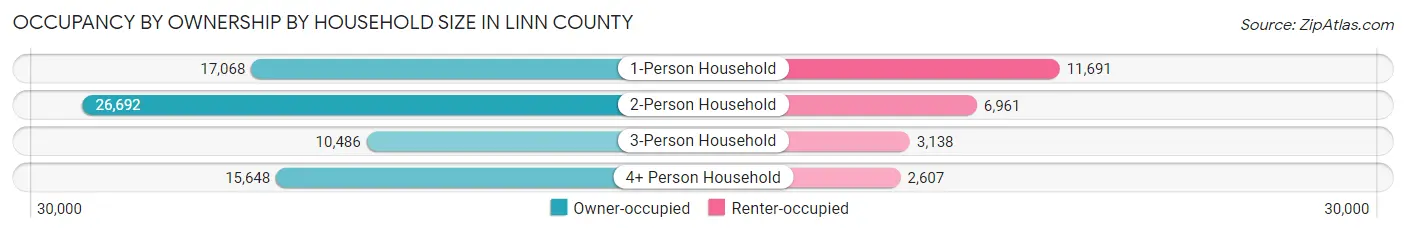
| Household Size | Owner-occupied | Renter-occupied |
| 1-Person Household | 17,068 (59.4%) | 11,691 (40.6%) |
| 2-Person Household | 26,692 (79.3%) | 6,961 (20.7%) |
| 3-Person Household | 10,486 (77.0%) | 3,138 (23.0%) |
| 4+ Person Household | 15,648 (85.7%) | 2,607 (14.3%) |
| Total Housing Units | 69,894 (74.1%) | 24,397 (25.9%) |
Occupancy by Educational Attainment in Linn County
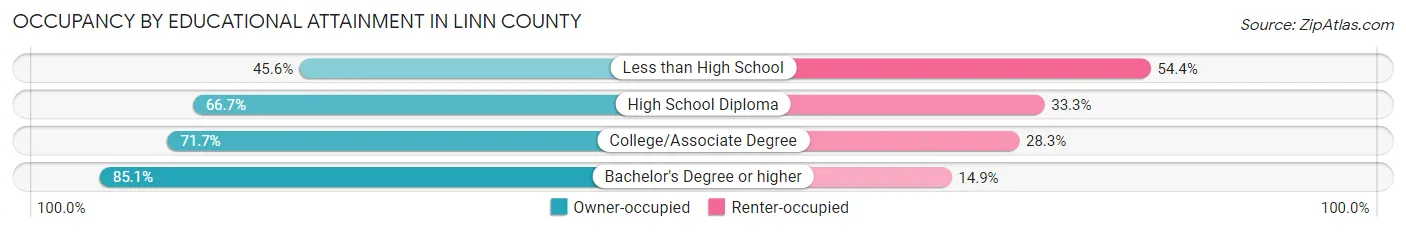
| Household Size | Owner-occupied | Renter-occupied |
| Less than High School | 1,856 (45.6%) | 2,214 (54.4%) |
| High School Diploma | 14,738 (66.7%) | 7,371 (33.3%) |
| College/Associate Degree | 24,849 (71.7%) | 9,822 (28.3%) |
| Bachelor's Degree or higher | 28,451 (85.1%) | 4,990 (14.9%) |
Occupancy by Age of Householder in Linn County
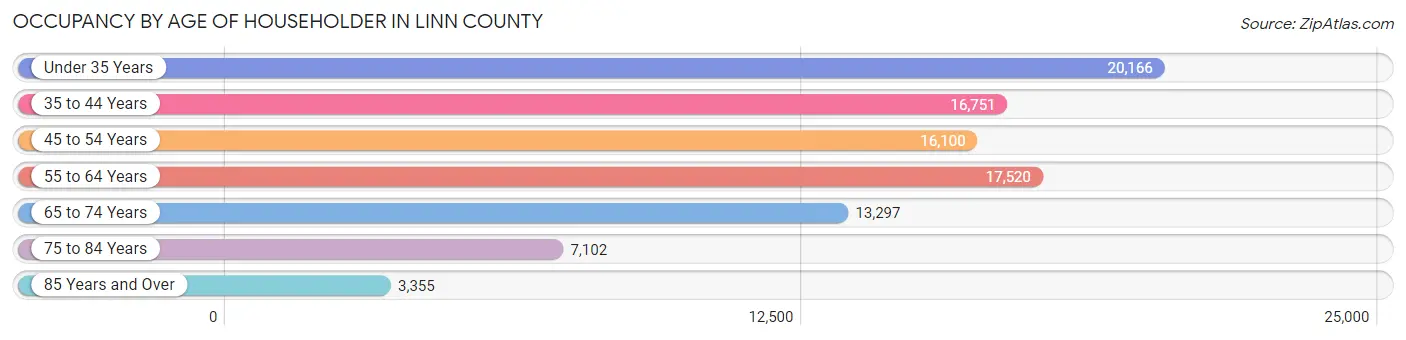
| Age Bracket | # Households | % Households |
| Under 35 Years | 20,166 | 21.4% |
| 35 to 44 Years | 16,751 | 17.8% |
| 45 to 54 Years | 16,100 | 17.1% |
| 55 to 64 Years | 17,520 | 18.6% |
| 65 to 74 Years | 13,297 | 14.1% |
| 75 to 84 Years | 7,102 | 7.5% |
| 85 Years and Over | 3,355 | 3.6% |
| Total | 94,291 | 100.0% |
Housing Finances in Linn County
Median Income by Occupancy in Linn County
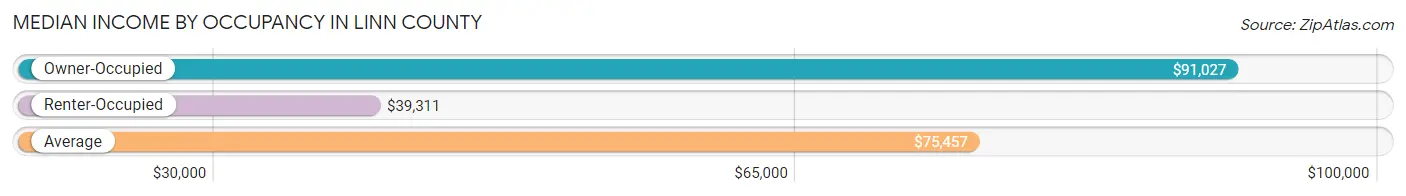
| Occupancy Type | # Households | Median Income |
| Owner-Occupied | 69,894 (74.1%) | $91,027 |
| Renter-Occupied | 24,397 (25.9%) | $39,311 |
| Average | 94,291 (100.0%) | $75,457 |
Occupancy by Householder Income Bracket in Linn County
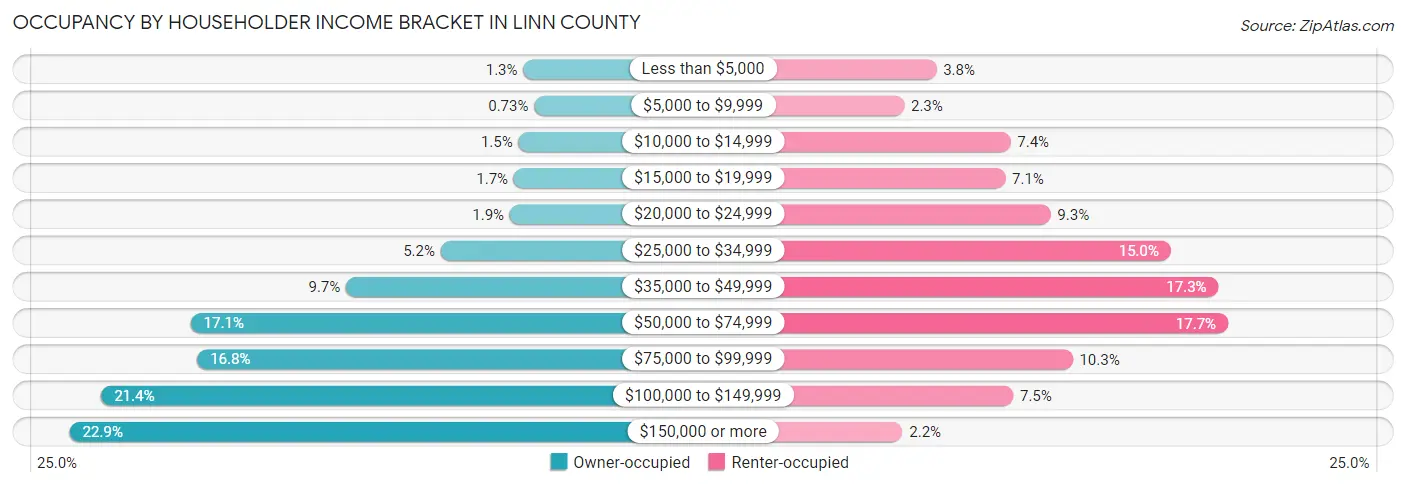
| Income Bracket | Owner-occupied | Renter-occupied |
| Less than $5,000 | 873 (1.3%) | 938 (3.8%) |
| $5,000 to $9,999 | 509 (0.7%) | 564 (2.3%) |
| $10,000 to $14,999 | 1,032 (1.5%) | 1,797 (7.4%) |
| $15,000 to $19,999 | 1,190 (1.7%) | 1,738 (7.1%) |
| $20,000 to $24,999 | 1,323 (1.9%) | 2,263 (9.3%) |
| $25,000 to $34,999 | 3,621 (5.2%) | 3,663 (15.0%) |
| $35,000 to $49,999 | 6,773 (9.7%) | 4,216 (17.3%) |
| $50,000 to $74,999 | 11,945 (17.1%) | 4,325 (17.7%) |
| $75,000 to $99,999 | 11,726 (16.8%) | 2,520 (10.3%) |
| $100,000 to $149,999 | 14,924 (21.3%) | 1,830 (7.5%) |
| $150,000 or more | 15,978 (22.9%) | 543 (2.2%) |
| Total | 69,894 (100.0%) | 24,397 (100.0%) |
Monthly Housing Cost Tiers in Linn County
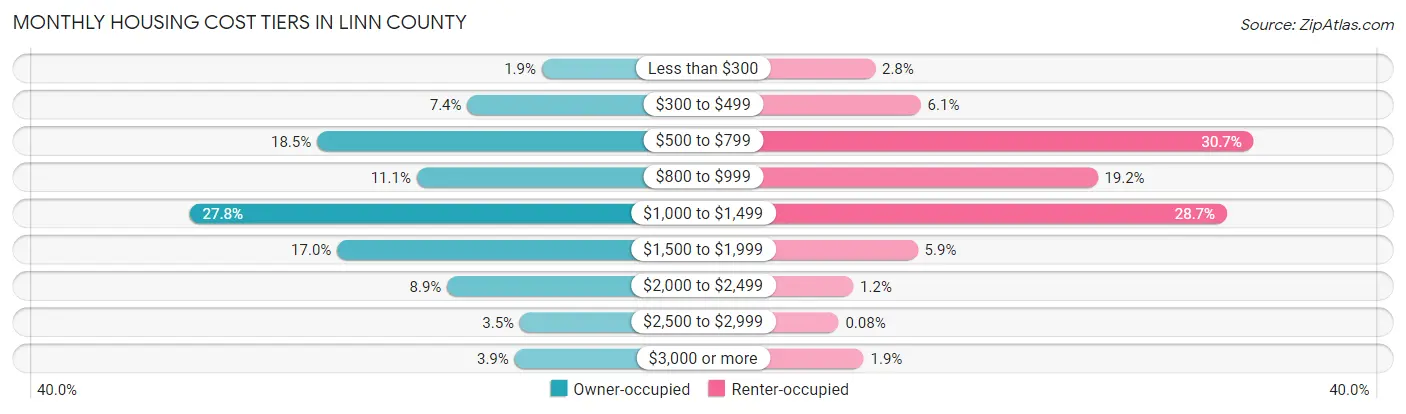
| Monthly Cost | Owner-occupied | Renter-occupied |
| Less than $300 | 1,332 (1.9%) | 676 (2.8%) |
| $300 to $499 | 5,167 (7.4%) | 1,496 (6.1%) |
| $500 to $799 | 12,902 (18.5%) | 7,477 (30.6%) |
| $800 to $999 | 7,770 (11.1%) | 4,671 (19.2%) |
| $1,000 to $1,499 | 19,456 (27.8%) | 6,998 (28.7%) |
| $1,500 to $1,999 | 11,865 (17.0%) | 1,441 (5.9%) |
| $2,000 to $2,499 | 6,209 (8.9%) | 284 (1.2%) |
| $2,500 to $2,999 | 2,460 (3.5%) | 19 (0.1%) |
| $3,000 or more | 2,733 (3.9%) | 470 (1.9%) |
| Total | 69,894 (100.0%) | 24,397 (100.0%) |
Physical Housing Characteristics in Linn County
Housing Structures in Linn County
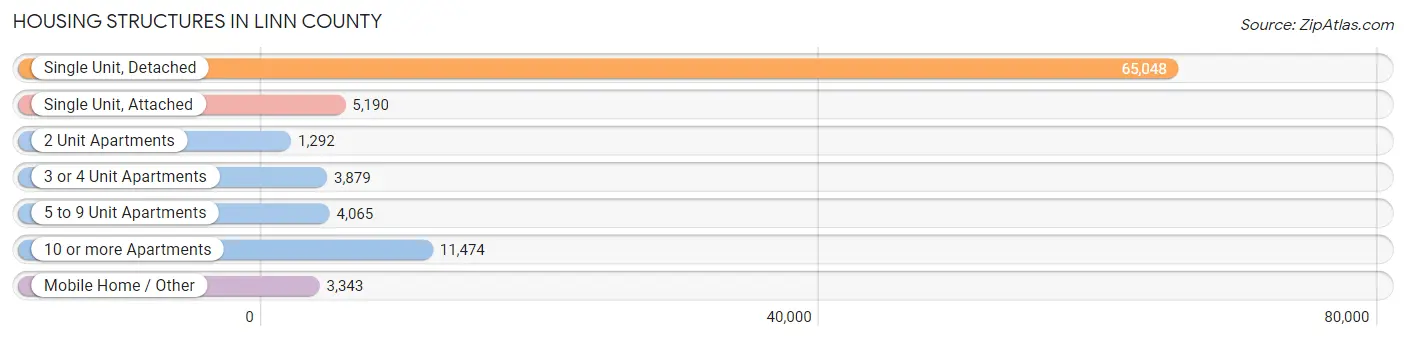
| Structure Type | # Housing Units | % Housing Units |
| Single Unit, Detached | 65,048 | 69.0% |
| Single Unit, Attached | 5,190 | 5.5% |
| 2 Unit Apartments | 1,292 | 1.4% |
| 3 or 4 Unit Apartments | 3,879 | 4.1% |
| 5 to 9 Unit Apartments | 4,065 | 4.3% |
| 10 or more Apartments | 11,474 | 12.2% |
| Mobile Home / Other | 3,343 | 3.5% |
| Total | 94,291 | 100.0% |
Housing Structures by Occupancy in Linn County
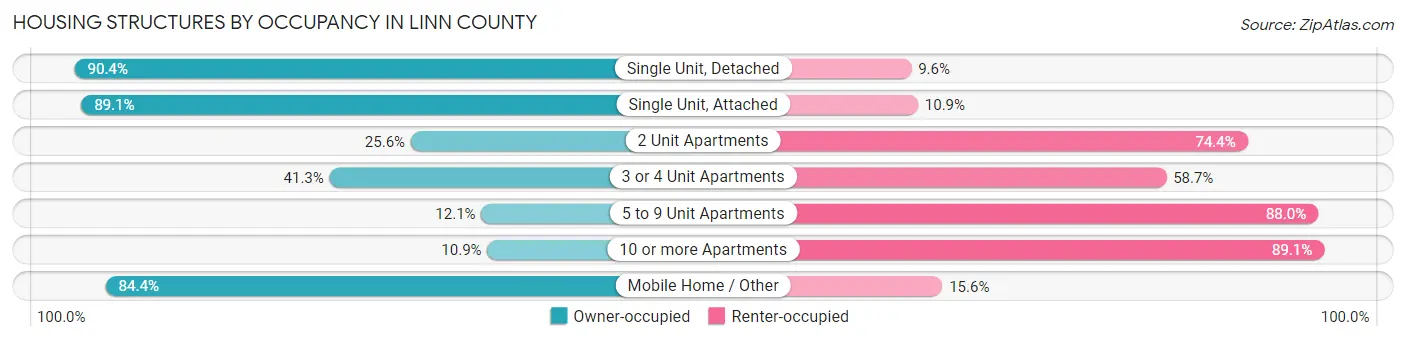
| Structure Type | Owner-occupied | Renter-occupied |
| Single Unit, Detached | 58,778 (90.4%) | 6,270 (9.6%) |
| Single Unit, Attached | 4,624 (89.1%) | 566 (10.9%) |
| 2 Unit Apartments | 331 (25.6%) | 961 (74.4%) |
| 3 or 4 Unit Apartments | 1,601 (41.3%) | 2,278 (58.7%) |
| 5 to 9 Unit Apartments | 490 (12.0%) | 3,575 (87.9%) |
| 10 or more Apartments | 1,249 (10.9%) | 10,225 (89.1%) |
| Mobile Home / Other | 2,821 (84.4%) | 522 (15.6%) |
| Total | 69,894 (74.1%) | 24,397 (25.9%) |
Housing Structures by Number of Rooms in Linn County
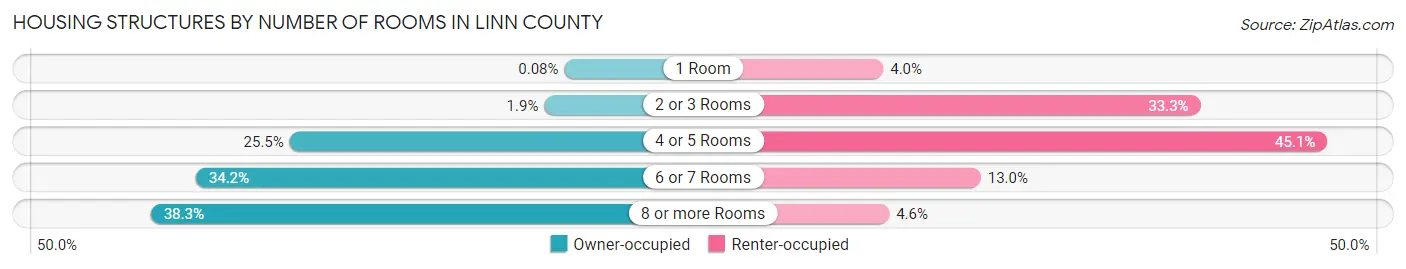
| Number of Rooms | Owner-occupied | Renter-occupied |
| 1 Room | 57 (0.1%) | 978 (4.0%) |
| 2 or 3 Rooms | 1,356 (1.9%) | 8,134 (33.3%) |
| 4 or 5 Rooms | 17,816 (25.5%) | 10,994 (45.1%) |
| 6 or 7 Rooms | 23,873 (34.2%) | 3,178 (13.0%) |
| 8 or more Rooms | 26,792 (38.3%) | 1,113 (4.6%) |
| Total | 69,894 (100.0%) | 24,397 (100.0%) |
Housing Structure by Heating Type in Linn County
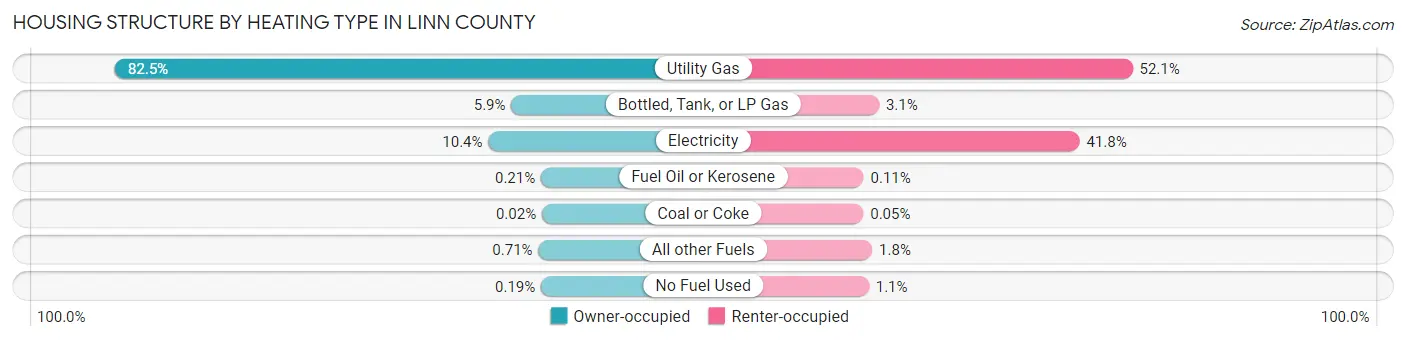
| Heating Type | Owner-occupied | Renter-occupied |
| Utility Gas | 57,689 (82.5%) | 12,703 (52.1%) |
| Bottled, Tank, or LP Gas | 4,155 (5.9%) | 748 (3.1%) |
| Electricity | 7,260 (10.4%) | 10,206 (41.8%) |
| Fuel Oil or Kerosene | 149 (0.2%) | 28 (0.1%) |
| Coal or Coke | 12 (0.0%) | 13 (0.1%) |
| All other Fuels | 499 (0.7%) | 429 (1.8%) |
| No Fuel Used | 130 (0.2%) | 270 (1.1%) |
| Total | 69,894 (100.0%) | 24,397 (100.0%) |
Household Vehicle Usage in Linn County
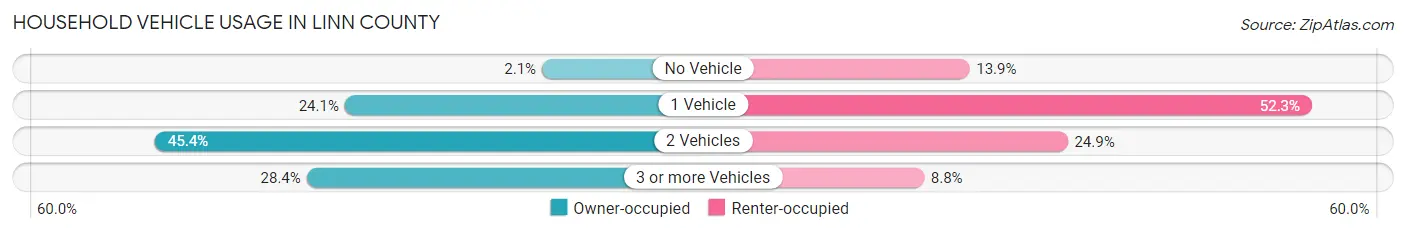
| Vehicles per Household | Owner-occupied | Renter-occupied |
| No Vehicle | 1,436 (2.1%) | 3,399 (13.9%) |
| 1 Vehicle | 16,869 (24.1%) | 12,760 (52.3%) |
| 2 Vehicles | 31,732 (45.4%) | 6,082 (24.9%) |
| 3 or more Vehicles | 19,857 (28.4%) | 2,156 (8.8%) |
| Total | 69,894 (100.0%) | 24,397 (100.0%) |
Real Estate & Mortgages in Linn County
Real Estate and Mortgage Overview in Linn County
| Characteristic | Without Mortgage | With Mortgage |
| Housing Units | 23,736 | 46,158 |
| Median Property Value | $176,900 | $193,000 |
| Median Household Income | $70,904 | $12,053 |
| Monthly Housing Costs | $635 | $2,728 |
| Real Estate Taxes | $3,100 | $712 |
Property Value by Mortgage Status in Linn County
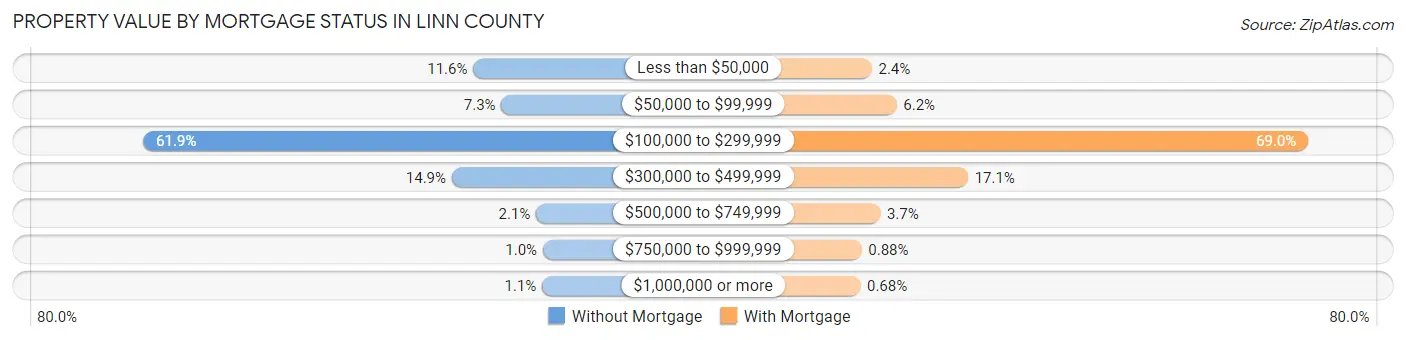
| Property Value | Without Mortgage | With Mortgage |
| Less than $50,000 | 2,760 (11.6%) | 1,127 (2.4%) |
| $50,000 to $99,999 | 1,743 (7.3%) | 2,871 (6.2%) |
| $100,000 to $299,999 | 14,701 (61.9%) | 31,834 (69.0%) |
| $300,000 to $499,999 | 3,535 (14.9%) | 7,889 (17.1%) |
| $500,000 to $749,999 | 486 (2.1%) | 1,715 (3.7%) |
| $750,000 to $999,999 | 243 (1.0%) | 406 (0.9%) |
| $1,000,000 or more | 268 (1.1%) | 316 (0.7%) |
| Total | 23,736 (100.0%) | 46,158 (100.0%) |
Household Income by Mortgage Status in Linn County
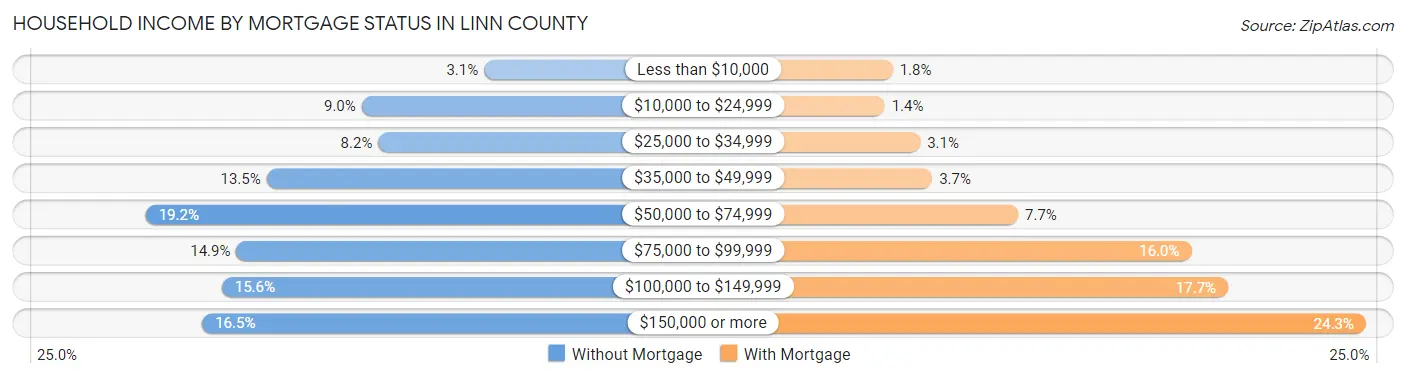
| Household Income | Without Mortgage | With Mortgage |
| Less than $10,000 | 741 (3.1%) | 818 (1.8%) |
| $10,000 to $24,999 | 2,124 (8.9%) | 641 (1.4%) |
| $25,000 to $34,999 | 1,936 (8.2%) | 1,421 (3.1%) |
| $35,000 to $49,999 | 3,199 (13.5%) | 1,685 (3.6%) |
| $50,000 to $74,999 | 4,564 (19.2%) | 3,574 (7.7%) |
| $75,000 to $99,999 | 3,541 (14.9%) | 7,381 (16.0%) |
| $100,000 to $149,999 | 3,706 (15.6%) | 8,185 (17.7%) |
| $150,000 or more | 3,925 (16.5%) | 11,218 (24.3%) |
| Total | 23,736 (100.0%) | 46,158 (100.0%) |
Property Value to Household Income Ratio in Linn County
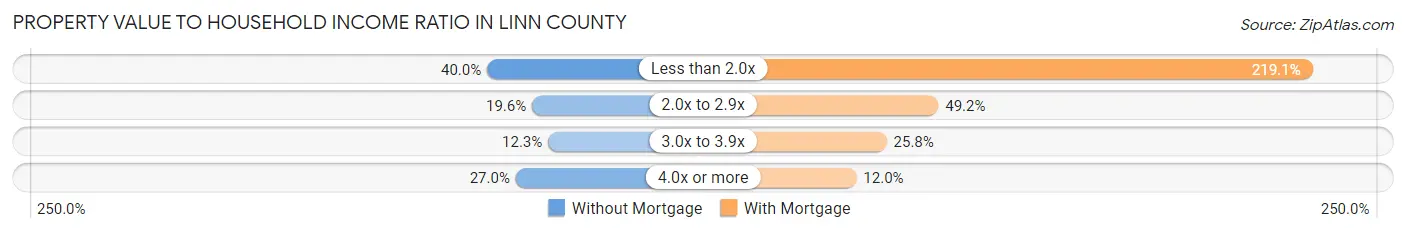
| Value-to-Income Ratio | Without Mortgage | With Mortgage |
| Less than 2.0x | 9,501 (40.0%) | 101,137 (219.1%) |
| 2.0x to 2.9x | 4,655 (19.6%) | 22,716 (49.2%) |
| 3.0x to 3.9x | 2,921 (12.3%) | 11,884 (25.8%) |
| 4.0x or more | 6,414 (27.0%) | 5,554 (12.0%) |
| Total | 23,736 (100.0%) | 46,158 (100.0%) |
Real Estate Taxes by Mortgage Status in Linn County
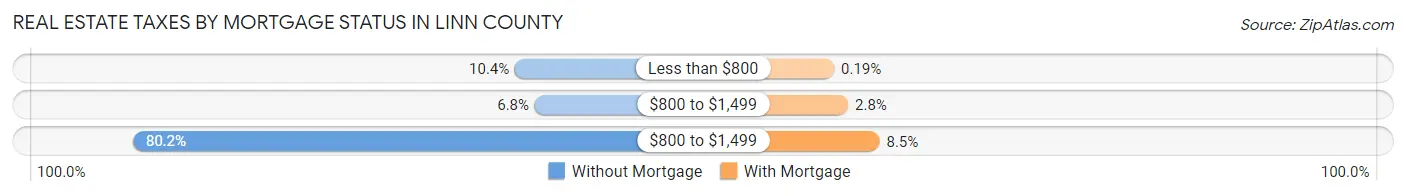
| Property Taxes | Without Mortgage | With Mortgage |
| Less than $800 | 2,472 (10.4%) | 86 (0.2%) |
| $800 to $1,499 | 1,613 (6.8%) | 1,269 (2.8%) |
| $800 to $1,499 | 19,046 (80.2%) | 3,917 (8.5%) |
| Total | 23,736 (100.0%) | 46,158 (100.0%) |
Health & Disability in Linn County
Health Insurance Coverage by Age in Linn County
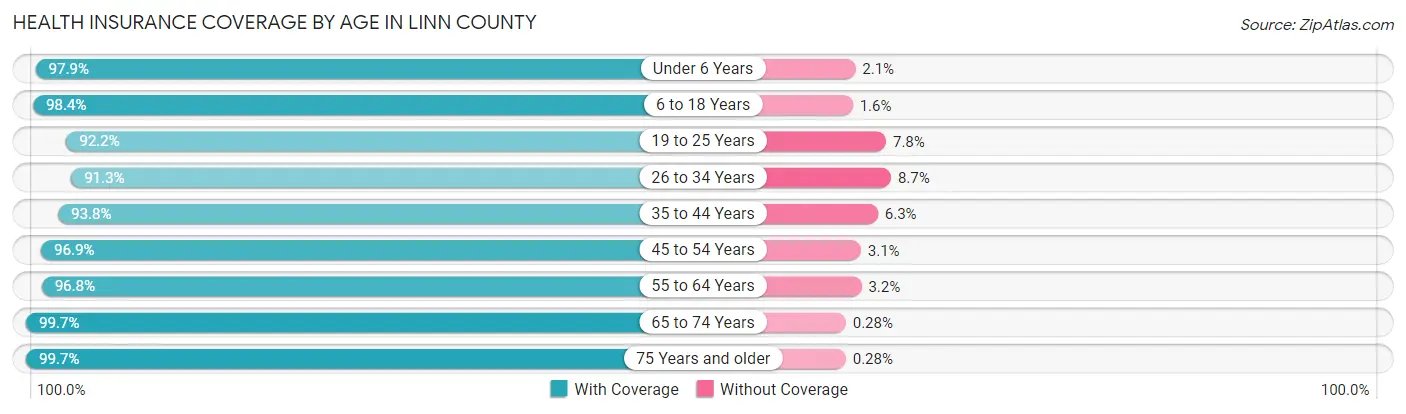
| Age Bracket | With Coverage | Without Coverage |
| Under 6 Years | 16,135 (97.9%) | 339 (2.1%) |
| 6 to 18 Years | 37,968 (98.4%) | 605 (1.6%) |
| 19 to 25 Years | 19,449 (92.2%) | 1,641 (7.8%) |
| 26 to 34 Years | 24,922 (91.3%) | 2,375 (8.7%) |
| 35 to 44 Years | 28,442 (93.8%) | 1,896 (6.2%) |
| 45 to 54 Years | 26,984 (96.9%) | 860 (3.1%) |
| 55 to 64 Years | 27,927 (96.8%) | 924 (3.2%) |
| 65 to 74 Years | 21,552 (99.7%) | 60 (0.3%) |
| 75 Years and older | 15,255 (99.7%) | 43 (0.3%) |
| Total | 218,634 (96.2%) | 8,743 (3.8%) |
Health Insurance Coverage by Citizenship Status in Linn County
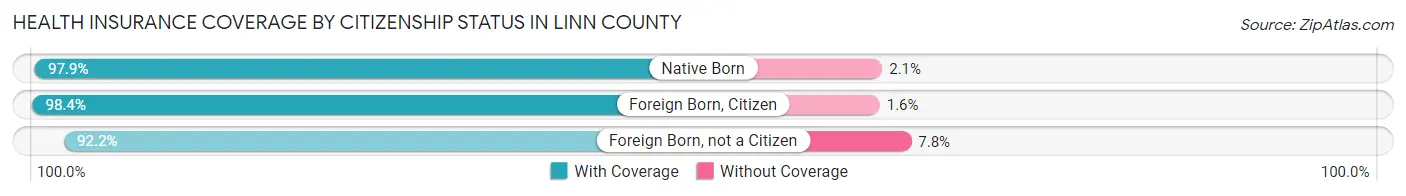
| Citizenship Status | With Coverage | Without Coverage |
| Native Born | 16,135 (97.9%) | 339 (2.1%) |
| Foreign Born, Citizen | 37,968 (98.4%) | 605 (1.6%) |
| Foreign Born, not a Citizen | 19,449 (92.2%) | 1,641 (7.8%) |
Health Insurance Coverage by Household Income in Linn County
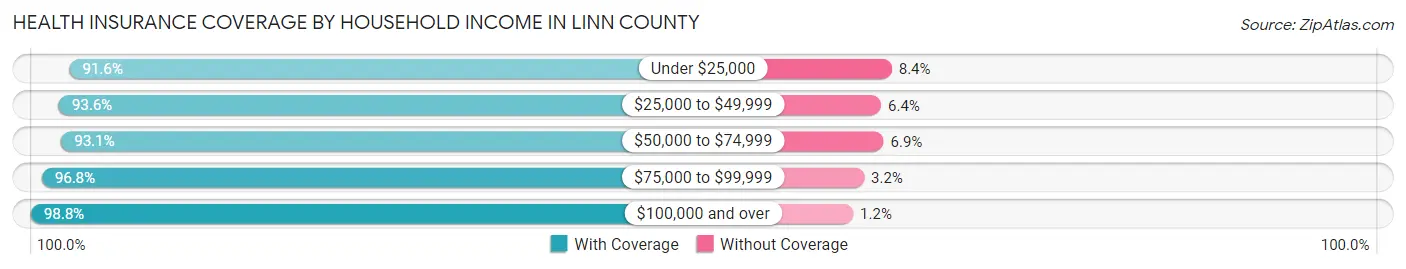
| Household Income | With Coverage | Without Coverage |
| Under $25,000 | 17,967 (91.6%) | 1,655 (8.4%) |
| $25,000 to $49,999 | 30,625 (93.6%) | 2,105 (6.4%) |
| $50,000 to $74,999 | 33,495 (93.1%) | 2,480 (6.9%) |
| $75,000 to $99,999 | 36,274 (96.8%) | 1,215 (3.2%) |
| $100,000 and over | 97,367 (98.8%) | 1,171 (1.2%) |
Public vs Private Health Insurance Coverage by Age in Linn County
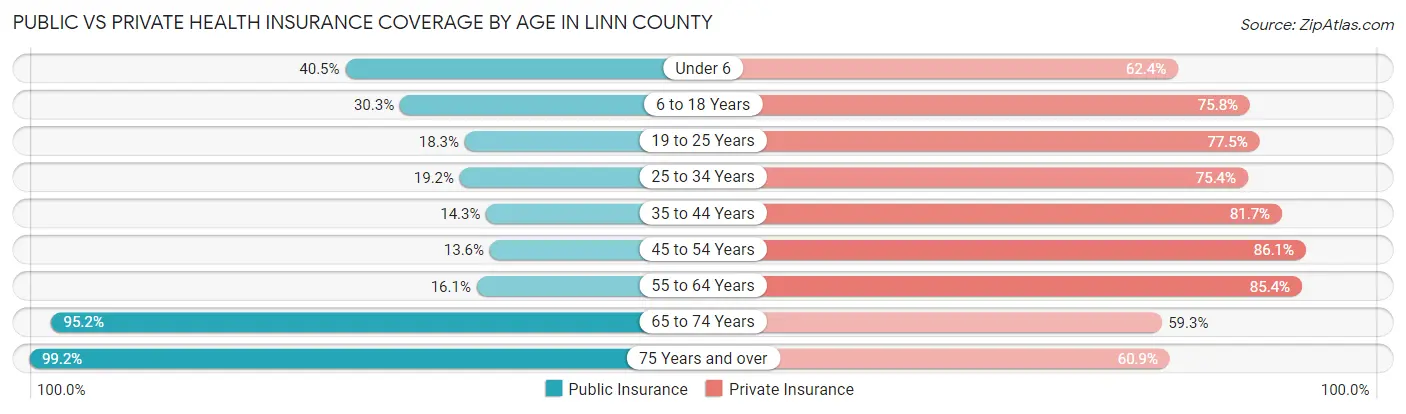
| Age Bracket | Public Insurance | Private Insurance |
| Under 6 | 6,665 (40.5%) | 10,284 (62.4%) |
| 6 to 18 Years | 11,697 (30.3%) | 29,220 (75.7%) |
| 19 to 25 Years | 3,856 (18.3%) | 16,353 (77.5%) |
| 25 to 34 Years | 5,243 (19.2%) | 20,571 (75.4%) |
| 35 to 44 Years | 4,338 (14.3%) | 24,782 (81.7%) |
| 45 to 54 Years | 3,799 (13.6%) | 23,982 (86.1%) |
| 55 to 64 Years | 4,640 (16.1%) | 24,639 (85.4%) |
| 65 to 74 Years | 20,570 (95.2%) | 12,813 (59.3%) |
| 75 Years and over | 15,174 (99.2%) | 9,314 (60.9%) |
| Total | 75,982 (33.4%) | 171,958 (75.6%) |
Disability Status by Sex by Age in Linn County
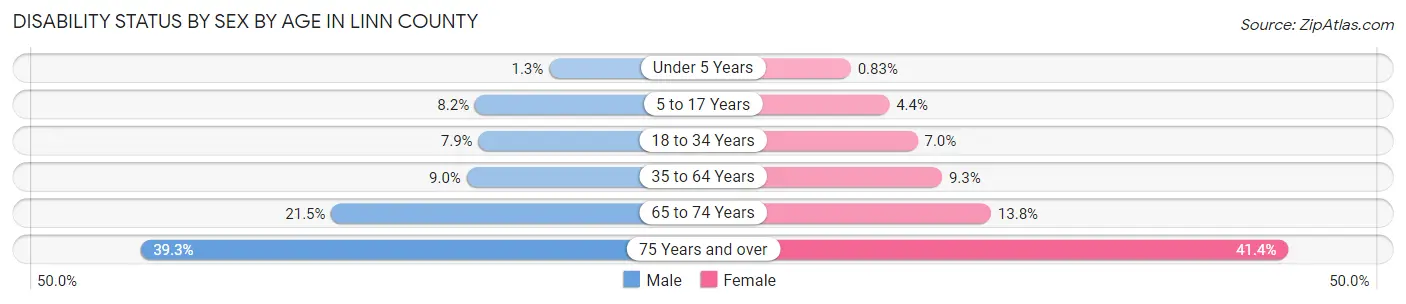
| Age Bracket | Male | Female |
| Under 5 Years | 91 (1.3%) | 56 (0.8%) |
| 5 to 17 Years | 1,605 (8.2%) | 828 (4.4%) |
| 18 to 34 Years | 2,030 (7.9%) | 1,800 (7.0%) |
| 35 to 64 Years | 3,933 (9.0%) | 4,017 (9.3%) |
| 65 to 74 Years | 2,209 (21.5%) | 1,571 (13.8%) |
| 75 Years and over | 2,467 (39.3%) | 3,735 (41.4%) |
Disability Class by Sex by Age in Linn County
Disability Class: Hearing Difficulty
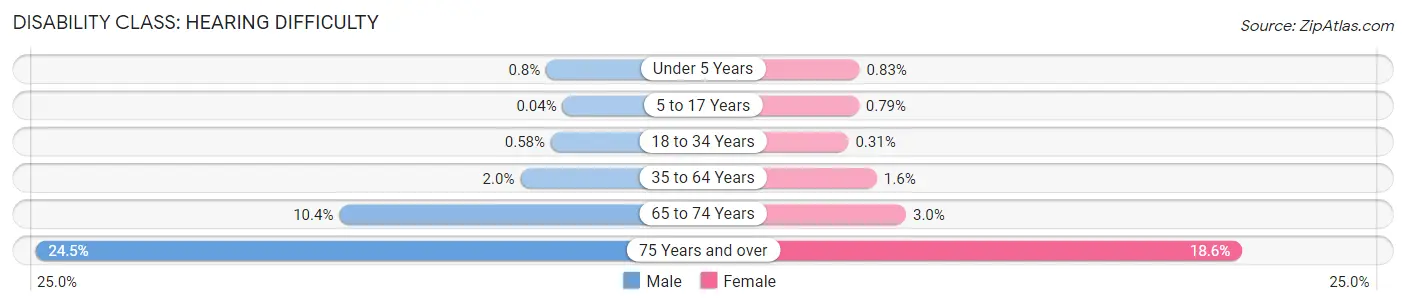
| Age Bracket | Male | Female |
| Under 5 Years | 55 (0.8%) | 56 (0.8%) |
| 5 to 17 Years | 7 (0.0%) | 149 (0.8%) |
| 18 to 34 Years | 150 (0.6%) | 80 (0.3%) |
| 35 to 64 Years | 878 (2.0%) | 705 (1.6%) |
| 65 to 74 Years | 1,067 (10.4%) | 338 (3.0%) |
| 75 Years and over | 1,539 (24.5%) | 1,674 (18.6%) |
Disability Class: Vision Difficulty
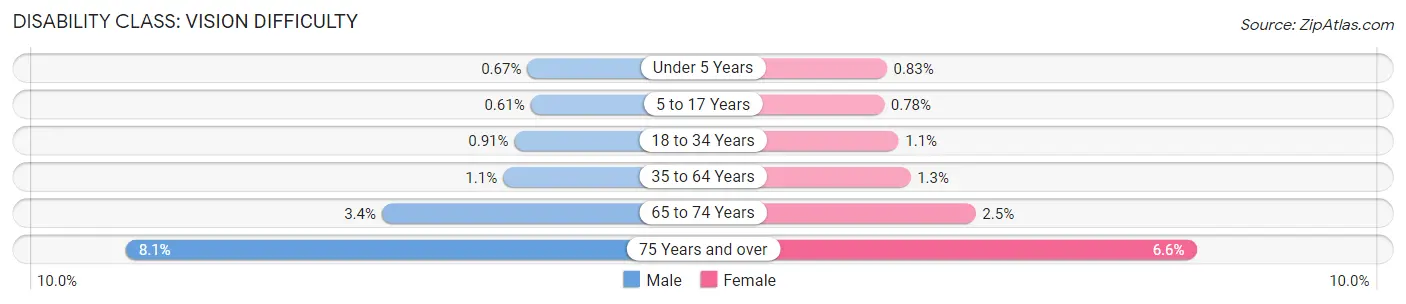
| Age Bracket | Male | Female |
| Under 5 Years | 46 (0.7%) | 56 (0.8%) |
| 5 to 17 Years | 119 (0.6%) | 147 (0.8%) |
| 18 to 34 Years | 234 (0.9%) | 269 (1.1%) |
| 35 to 64 Years | 490 (1.1%) | 547 (1.3%) |
| 65 to 74 Years | 346 (3.4%) | 282 (2.5%) |
| 75 Years and over | 510 (8.1%) | 593 (6.6%) |
Disability Class: Cognitive Difficulty
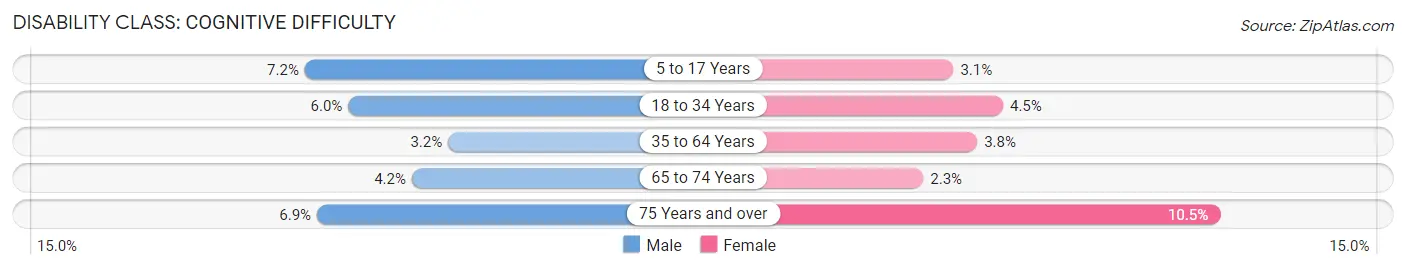
| Age Bracket | Male | Female |
| 5 to 17 Years | 1,409 (7.2%) | 585 (3.1%) |
| 18 to 34 Years | 1,543 (6.0%) | 1,150 (4.5%) |
| 35 to 64 Years | 1,408 (3.2%) | 1,630 (3.8%) |
| 65 to 74 Years | 433 (4.2%) | 258 (2.3%) |
| 75 Years and over | 431 (6.9%) | 949 (10.5%) |
Disability Class: Ambulatory Difficulty
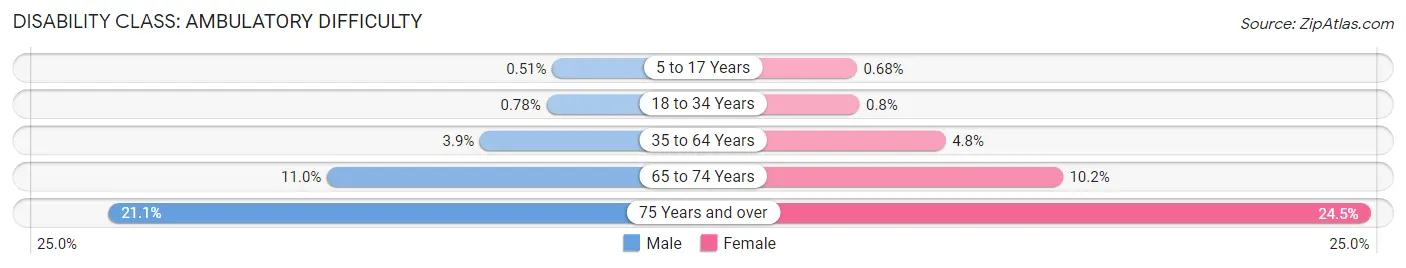
| Age Bracket | Male | Female |
| 5 to 17 Years | 100 (0.5%) | 128 (0.7%) |
| 18 to 34 Years | 201 (0.8%) | 206 (0.8%) |
| 35 to 64 Years | 1,690 (3.9%) | 2,074 (4.8%) |
| 65 to 74 Years | 1,125 (11.0%) | 1,162 (10.2%) |
| 75 Years and over | 1,327 (21.1%) | 2,212 (24.5%) |
Disability Class: Self-Care Difficulty
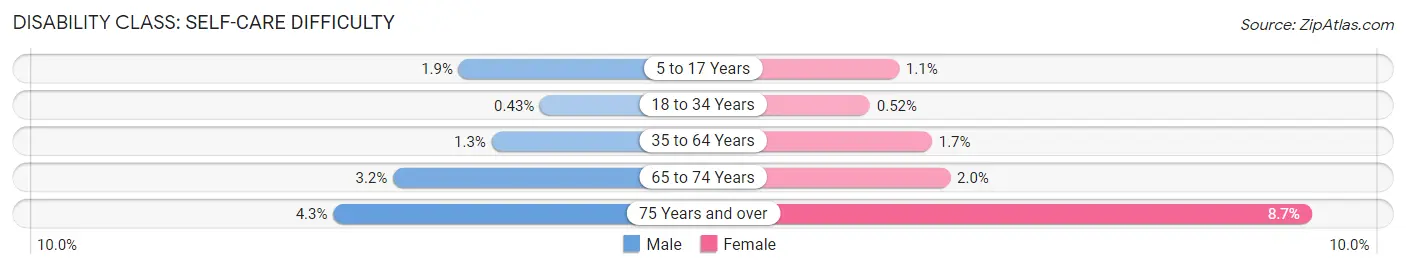
| Age Bracket | Male | Female |
| 5 to 17 Years | 379 (1.9%) | 200 (1.1%) |
| 18 to 34 Years | 110 (0.4%) | 133 (0.5%) |
| 35 to 64 Years | 582 (1.3%) | 720 (1.7%) |
| 65 to 74 Years | 324 (3.2%) | 228 (2.0%) |
| 75 Years and over | 268 (4.3%) | 786 (8.7%) |
Technology Access in Linn County
Computing Device Access in Linn County
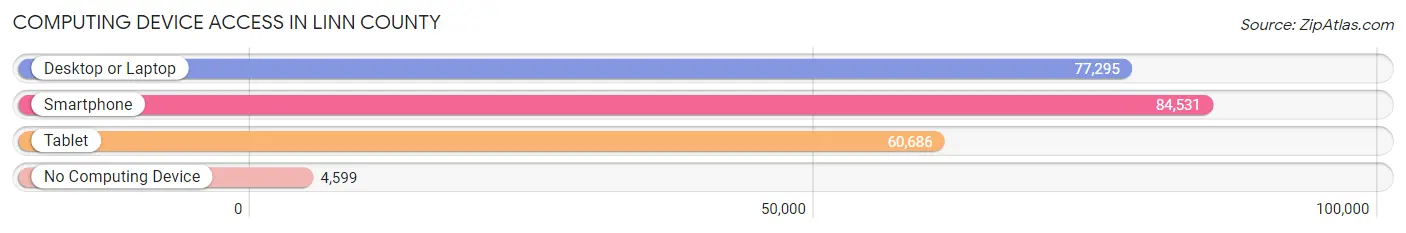
| Device Type | # Households | % Households |
| Desktop or Laptop | 77,295 | 82.0% |
| Smartphone | 84,531 | 89.6% |
| Tablet | 60,686 | 64.4% |
| No Computing Device | 4,599 | 4.9% |
| Total | 94,291 | 100.0% |
Internet Access in Linn County
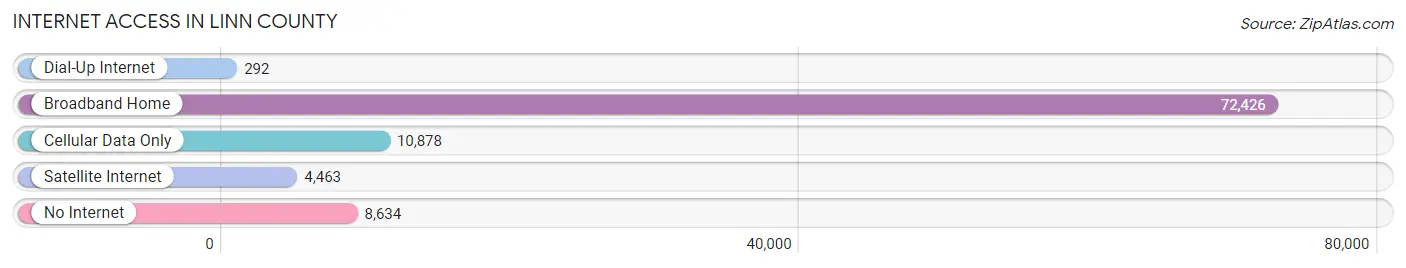
| Internet Type | # Households | % Households |
| Dial-Up Internet | 292 | 0.3% |
| Broadband Home | 72,426 | 76.8% |
| Cellular Data Only | 10,878 | 11.5% |
| Satellite Internet | 4,463 | 4.7% |
| No Internet | 8,634 | 9.2% |
| Total | 94,291 | 100.0% |
Linn County Summary
Linn County, Iowa is located in the eastern part of the state and is the second most populous county in the state. It is bordered by Johnson County to the north, Cedar County to the east, Jones County to the south, and Benton County to the west. The county seat is Cedar Rapids, which is also the second largest city in the state.
History
Linn County was established in 1837 and was named after Senator Lewis F. Linn of Missouri. The county was originally part of the Black Hawk Purchase, which was a large tract of land purchased from the Sac and Fox Indians in 1832. The county was originally part of Dubuque County, but was split off in 1837.
The first settlers in the county were mostly of German and Irish descent. The first town in the county was Marion, which was founded in 1839. The county was largely agricultural in its early years, with the main crops being corn, wheat, and oats.
In the late 19th century, the county began to industrialize, with the establishment of several factories in Cedar Rapids. The city of Cedar Rapids was incorporated in 1849 and quickly became the largest city in the county. The city was a major center for the lumber industry, and was also home to several other industries, including a brewery, a distillery, and a flour mill.
Geography
Linn County covers an area of 745 square miles and is located in the eastern part of the state. The county is mostly flat, with the exception of the bluffs along the Cedar River. The county is drained by the Cedar River, which flows through the county from north to south.
The county is home to several parks and recreational areas, including the Cedar Rapids/Linn County Nature Center, the Cedar Rapids/Linn County Parks and Recreation Department, and the Cedar Rapids/Linn County Conservation Board.
Economy
Linn County has a diverse economy, with a mix of manufacturing, agriculture, and services. The county is home to several major employers, including Rockwell Collins, Quaker Oats, and Alliant Energy.
Agriculture is still an important part of the county’s economy, with corn, soybeans, and hogs being the main crops. The county is also home to several wineries and breweries, as well as a number of small businesses.
Demographics
As of the 2010 census, the population of Linn County was 211,226. The population is fairly evenly split between men and women, with 50.3% of the population being male and 49.7% being female. The median age of the population is 37.7 years.
The racial makeup of the county is 87.3% White, 6.2% African American, 2.2% Asian, 0.7% Native American, 0.1% Pacific Islander, and 3.5% from other races. The largest ancestry groups in the county are German (25.3%), Irish (17.2%), and English (13.2%).
The median household income in the county is $54,945, and the median family income is $66,945. The per capita income in the county is $27,845. The poverty rate in the county is 11.2%.
Common Questions
What is Per Capita Income in Linn County?
Per Capita income in Linn County is $41,446.
What is the Median Family Income in Linn County?
Median Family Income in Linn County is $96,369.
What is the Median Household income in Linn County?
Median Household Income in Linn County is $75,457.
What is Income or Wage Gap in Linn County?
Income or Wage Gap in Linn County is 28.8%.
Women in Linn County earn 71.2 cents for every dollar earned by a man.
What is Family Income Deficit in Linn County?
Family Income Deficit in Linn County is $9,002.
Families that are below poverty line in Linn County earn $9,002 less on average than the poverty threshold level.
What is Inequality or Gini Index in Linn County?
Inequality or Gini Index in Linn County is 0.45.
What is the Total Population of Linn County?
Total Population of Linn County is 229,308.
What is the Total Male Population of Linn County?
Total Male Population of Linn County is 113,646.
What is the Total Female Population of Linn County?
Total Female Population of Linn County is 115,662.
What is the Ratio of Males per 100 Females in Linn County?
There are 98.26 Males per 100 Females in Linn County.
What is the Ratio of Females per 100 Males in Linn County?
There are 101.77 Females per 100 Males in Linn County.
What is the Median Population Age in Linn County?
Median Population Age in Linn County is 38.2 Years.
What is the Average Family Size in Linn County
Average Family Size in Linn County is 3.0 People.
What is the Average Household Size in Linn County
Average Household Size in Linn County is 2.4 People.
How Large is the Labor Force in Linn County?
There are 126,214 People in the Labor Forcein in Linn County.
What is the Percentage of People in the Labor Force in Linn County?
68.8% of People are in the Labor Force in Linn County.
What is the Unemployment Rate in Linn County?
Unemployment Rate in Linn County is 3.8%.