Jones County, IA Map & Demographics
Jones County Map
Jones County Overview
$33,996
PER CAPITA INCOME
$88,862
AVG FAMILY INCOME
$68,781
AVG HOUSEHOLD INCOME
26.4%
WAGE / INCOME GAP [ % ]
73.6¢/ $1
WAGE / INCOME GAP [ $ ]
$12,627
FAMILY INCOME DEFICIT
0.40
INEQUALITY / GINI INDEX
20,733
TOTAL POPULATION
10,828
MALE POPULATION
9,905
FEMALE POPULATION
109.32
MALES / 100 FEMALES
91.48
FEMALES / 100 MALES
43.4
MEDIAN AGE
2.9
AVG FAMILY SIZE
2.4
AVG HOUSEHOLD SIZE
10,343
LABOR FORCE [ PEOPLE ]
61.0%
PERCENT IN LABOR FORCE
3.1%
UNEMPLOYMENT RATE
Income in Jones County
Income Overview in Jones County
Per Capita Income in Jones County is $33,996, while median incomes of families and households are $88,862 and $68,781 respectively.
| Characteristic | Number | Measure |
| Per Capita Income | 20,733 | $33,996 |
| Median Family Income | 5,341 | $88,862 |
| Mean Family Income | 5,341 | $96,962 |
| Median Household Income | 8,062 | $68,781 |
| Mean Household Income | 8,062 | $83,469 |
| Income Deficit | 5,341 | $12,627 |
| Wage / Income Gap (%) | 20,733 | 26.36% |
| Wage / Income Gap ($) | 20,733 | 73.64¢ per $1 |
| Gini / Inequality Index | 20,733 | 0.40 |
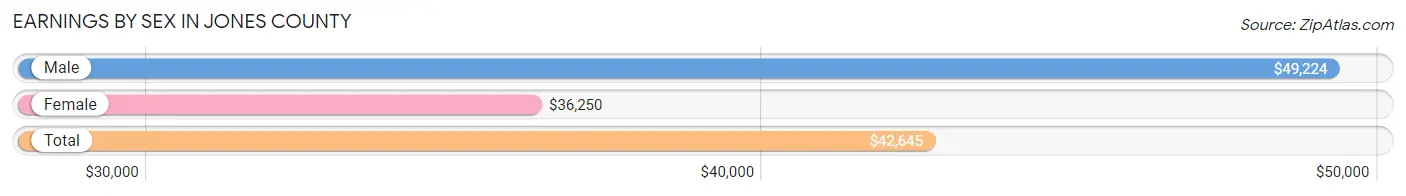
Earnings by Sex in Jones County
Average Earnings in Jones County are $42,645, $49,224 for men and $36,250 for women, a difference of 26.4%.
| Sex | Number | Average Earnings |
| Male | 5,743 (52.5%) | $49,224 |
| Female | 5,205 (47.5%) | $36,250 |
| Total | 10,948 (100.0%) | $42,645 |
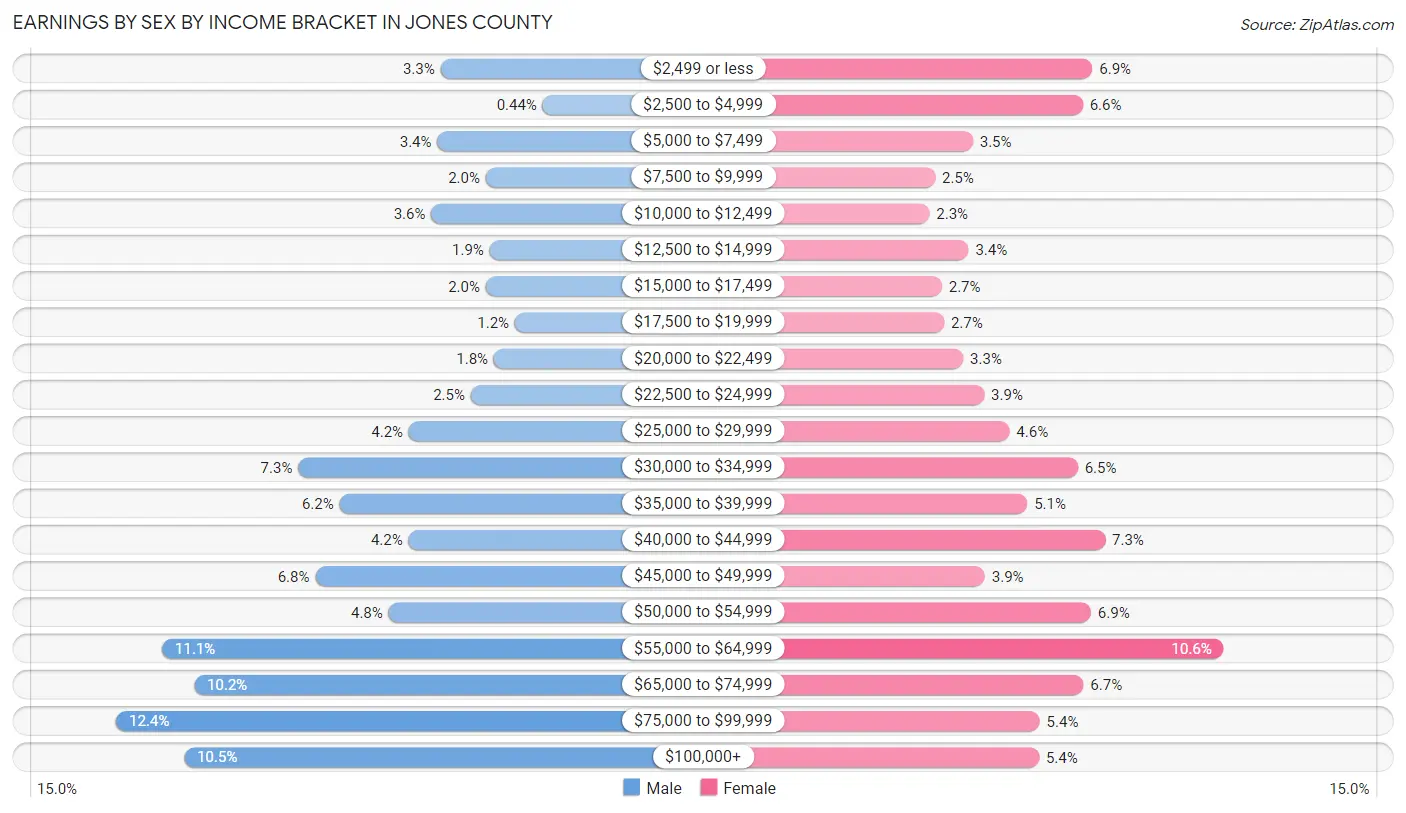
Earnings by Sex by Income Bracket in Jones County
The most common earnings brackets in Jones County are $75,000 to $99,999 for men (714 | 12.4%) and $55,000 to $64,999 for women (551 | 10.6%).
| Income | Male | Female |
| $2,499 or less | 190 (3.3%) | 359 (6.9%) |
| $2,500 to $4,999 | 25 (0.4%) | 345 (6.6%) |
| $5,000 to $7,499 | 195 (3.4%) | 184 (3.5%) |
| $7,500 to $9,999 | 117 (2.0%) | 129 (2.5%) |
| $10,000 to $12,499 | 205 (3.6%) | 121 (2.3%) |
| $12,500 to $14,999 | 111 (1.9%) | 178 (3.4%) |
| $15,000 to $17,499 | 117 (2.0%) | 139 (2.7%) |
| $17,500 to $19,999 | 70 (1.2%) | 142 (2.7%) |
| $20,000 to $22,499 | 104 (1.8%) | 170 (3.3%) |
| $22,500 to $24,999 | 141 (2.5%) | 201 (3.9%) |
| $25,000 to $29,999 | 241 (4.2%) | 238 (4.6%) |
| $30,000 to $34,999 | 420 (7.3%) | 338 (6.5%) |
| $35,000 to $39,999 | 353 (6.1%) | 264 (5.1%) |
| $40,000 to $44,999 | 242 (4.2%) | 378 (7.3%) |
| $45,000 to $49,999 | 392 (6.8%) | 202 (3.9%) |
| $50,000 to $54,999 | 274 (4.8%) | 357 (6.9%) |
| $55,000 to $64,999 | 640 (11.1%) | 551 (10.6%) |
| $65,000 to $74,999 | 588 (10.2%) | 346 (6.7%) |
| $75,000 to $99,999 | 714 (12.4%) | 282 (5.4%) |
| $100,000+ | 604 (10.5%) | 281 (5.4%) |
| Total | 5,743 (100.0%) | 5,205 (100.0%) |
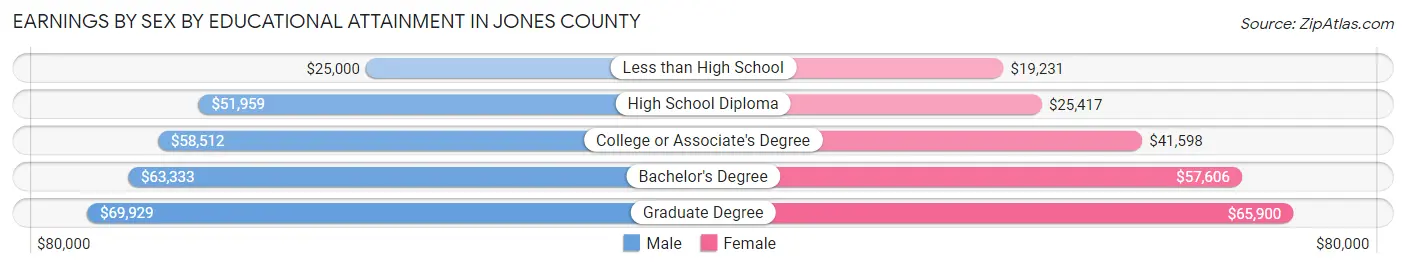
Earnings by Sex by Educational Attainment in Jones County
Average earnings in Jones County are $54,898 for men and $40,622 for women, a difference of 26.0%. Men with an educational attainment of graduate degree enjoy the highest average annual earnings of $69,929, while those with less than high school education earn the least with $25,000. Women with an educational attainment of graduate degree earn the most with the average annual earnings of $65,900, while those with less than high school education have the smallest earnings of $19,231.
| Educational Attainment | Male Income | Female Income |
| Less than High School | $25,000 | $19,231 |
| High School Diploma | $51,959 | $25,417 |
| College or Associate's Degree | $58,512 | $41,598 |
| Bachelor's Degree | $63,333 | $57,606 |
| Graduate Degree | $69,929 | $65,900 |
| Total | $54,898 | $40,622 |
Family Income in Jones County
Family Income Brackets in Jones County
According to the Jones County family income data, there are 1,260 families falling into the $100,000 to $149,999 income range, which is the most common income bracket and makes up 23.6% of all families. Conversely, the $10,000 to $14,999 income bracket is the least frequent group with only 85 families (1.6%) belonging to this category.
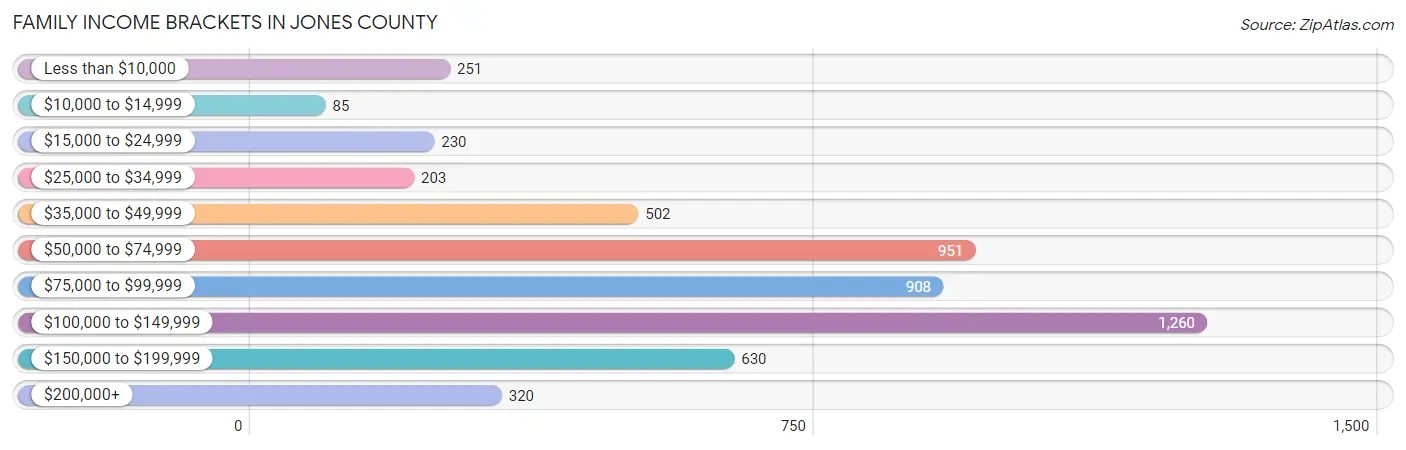
| Income Bracket | # Families | % Families |
| Less than $10,000 | 251 | 4.7% |
| $10,000 to $14,999 | 85 | 1.6% |
| $15,000 to $24,999 | 230 | 4.3% |
| $25,000 to $34,999 | 203 | 3.8% |
| $35,000 to $49,999 | 502 | 9.4% |
| $50,000 to $74,999 | 951 | 17.8% |
| $75,000 to $99,999 | 908 | 17.0% |
| $100,000 to $149,999 | 1,260 | 23.6% |
| $150,000 to $199,999 | 630 | 11.8% |
| $200,000+ | 320 | 6.0% |
Family Income by Famaliy Size in Jones County
4-person families (758 | 14.2%) account for the highest median family income in Jones County with $111,875 per family, while 2-person families (3,221 | 60.3%) have the highest median income of $40,665 per family member.
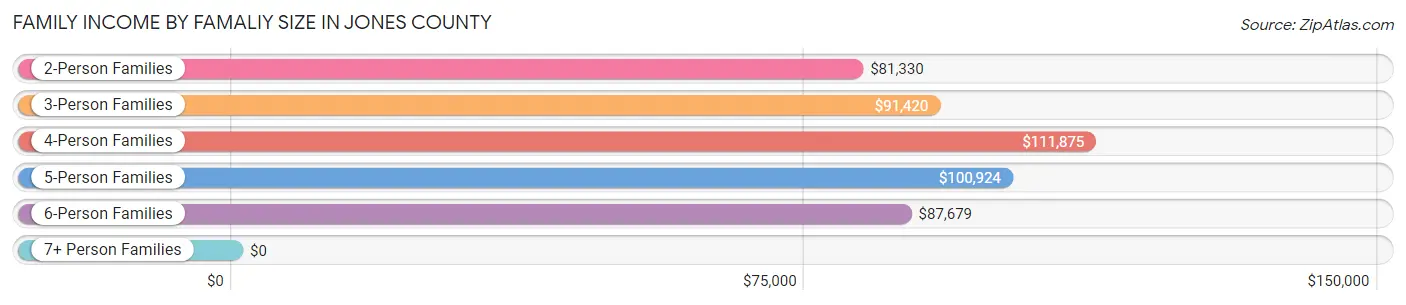
| Income Bracket | # Families | Median Income |
| 2-Person Families | 3,221 (60.3%) | $81,330 |
| 3-Person Families | 865 (16.2%) | $91,420 |
| 4-Person Families | 758 (14.2%) | $111,875 |
| 5-Person Families | 383 (7.2%) | $100,924 |
| 6-Person Families | 79 (1.5%) | $87,679 |
| 7+ Person Families | 35 (0.7%) | $0 |
| Total | 5,341 (100.0%) | $88,862 |
Family Income by Number of Earners in Jones County
The median family income in Jones County is $88,862, with families comprising 3+ earners (393) having the highest median family income of $139,018, while families with 1 earner (1,420) have the lowest median family income of $51,486, accounting for 7.4% and 26.6% of families, respectively.
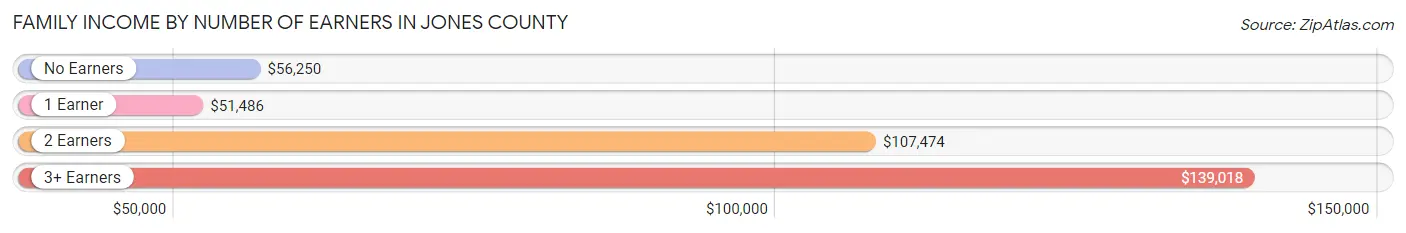
| Number of Earners | # Families | Median Income |
| No Earners | 891 (16.7%) | $56,250 |
| 1 Earner | 1,420 (26.6%) | $51,486 |
| 2 Earners | 2,637 (49.4%) | $107,474 |
| 3+ Earners | 393 (7.4%) | $139,018 |
| Total | 5,341 (100.0%) | $88,862 |
Household Income in Jones County
Household Income Brackets in Jones County
With 1,483 households falling in the category, the $50,000 to $74,999 income range is the most frequent in Jones County, accounting for 18.4% of all households. In contrast, only 202 households (2.5%) fall into the $10,000 to $14,999 income bracket, making it the least populous group.
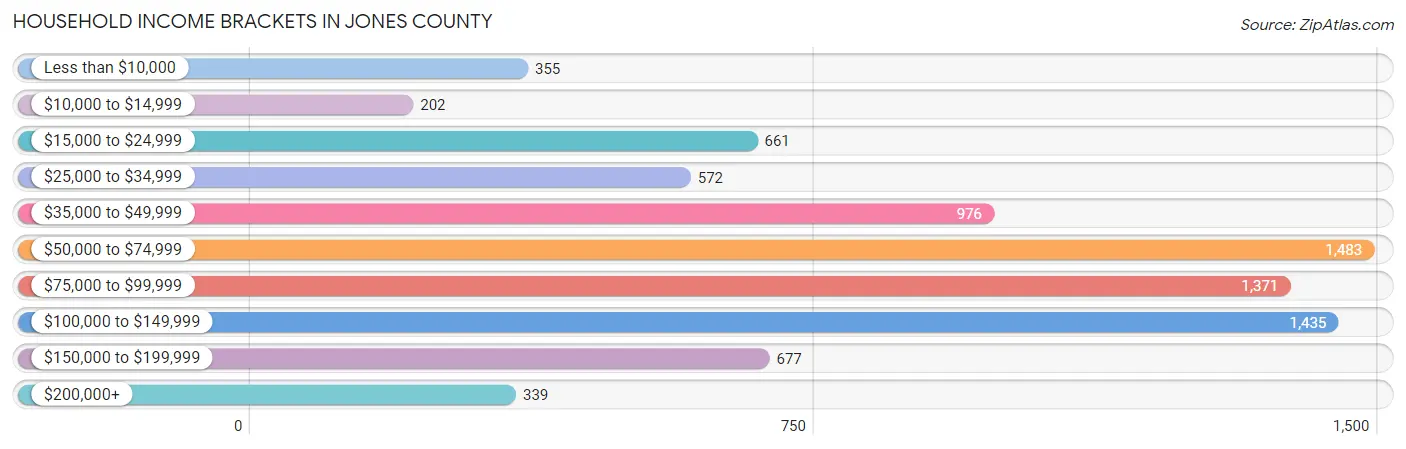
| Income Bracket | # Households | % Households |
| Less than $10,000 | 355 | 4.4% |
| $10,000 to $14,999 | 202 | 2.5% |
| $15,000 to $24,999 | 661 | 8.2% |
| $25,000 to $34,999 | 572 | 7.1% |
| $35,000 to $49,999 | 976 | 12.1% |
| $50,000 to $74,999 | 1,483 | 18.4% |
| $75,000 to $99,999 | 1,371 | 17.0% |
| $100,000 to $149,999 | 1,435 | 17.8% |
| $150,000 to $199,999 | 677 | 8.4% |
| $200,000+ | 339 | 4.2% |
Household Income by Householder Age in Jones County
The median household income in Jones County is $68,781, with the highest median household income of $87,354 found in the 45 to 64 years age bracket for the primary householder. A total of 2,971 households (36.8%) fall into this category. Meanwhile, the 15 to 24 years age bracket for the primary householder has the lowest median household income of $49,423, with 322 households (4.0%) in this group.
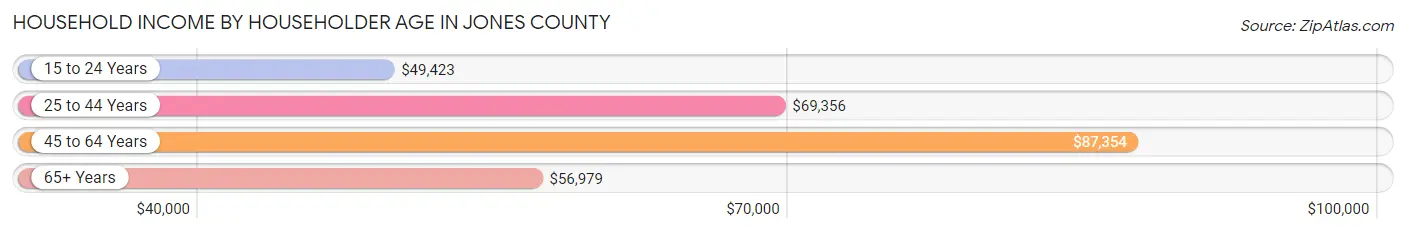
| Income Bracket | # Households | Median Income |
| 15 to 24 Years | 322 (4.0%) | $49,423 |
| 25 to 44 Years | 2,259 (28.0%) | $69,356 |
| 45 to 64 Years | 2,971 (36.8%) | $87,354 |
| 65+ Years | 2,510 (31.1%) | $56,979 |
| Total | 8,062 (100.0%) | $68,781 |
Poverty in Jones County
Income Below Poverty by Sex and Age in Jones County
With 10.3% poverty level for males and 12.5% for females among the residents of Jones County, 35 to 44 year old males and 15 year old females are the most vulnerable to poverty, with 259 males (21.3%) and 35 females (42.2%) in their respective age groups living below the poverty level.
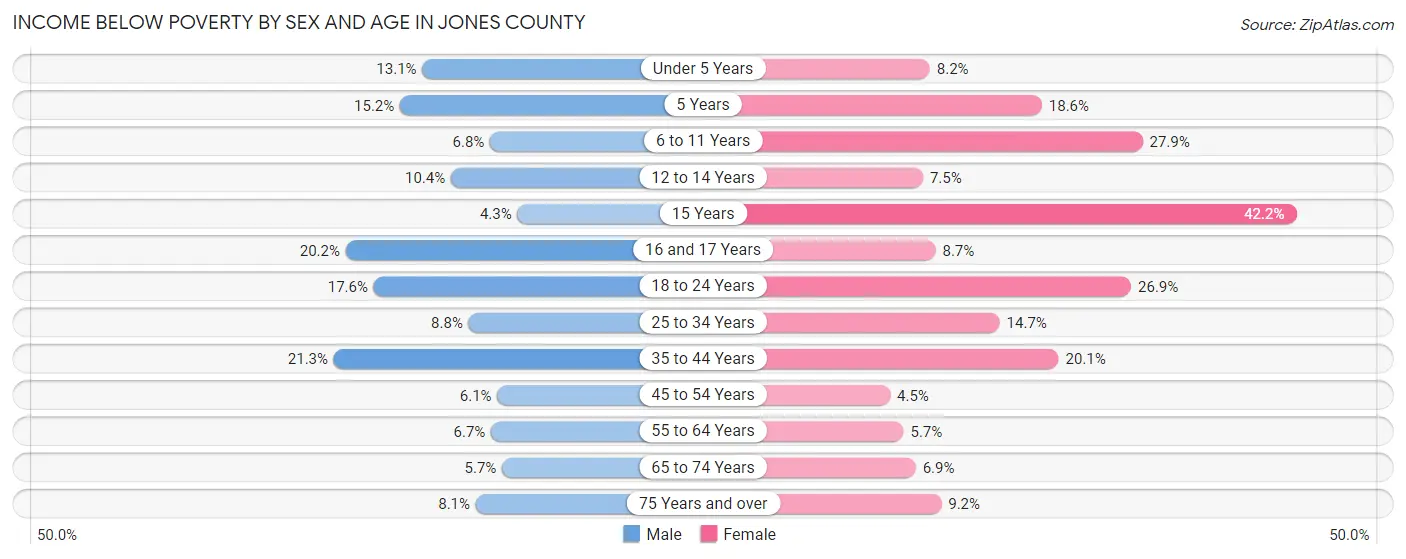
| Age Bracket | Male | Female |
| Under 5 Years | 62 (13.1%) | 49 (8.2%) |
| 5 Years | 15 (15.1%) | 26 (18.6%) |
| 6 to 11 Years | 38 (6.8%) | 204 (27.9%) |
| 12 to 14 Years | 40 (10.4%) | 22 (7.5%) |
| 15 Years | 9 (4.3%) | 35 (42.2%) |
| 16 and 17 Years | 42 (20.2%) | 26 (8.7%) |
| 18 to 24 Years | 127 (17.6%) | 174 (26.9%) |
| 25 to 34 Years | 105 (8.8%) | 144 (14.6%) |
| 35 to 44 Years | 259 (21.3%) | 229 (20.1%) |
| 45 to 54 Years | 75 (6.1%) | 53 (4.5%) |
| 55 to 64 Years | 94 (6.7%) | 85 (5.7%) |
| 65 to 74 Years | 69 (5.7%) | 81 (6.9%) |
| 75 Years and over | 63 (8.1%) | 92 (9.2%) |
| Total | 998 (10.3%) | 1,220 (12.5%) |
Income Above Poverty by Sex and Age in Jones County
According to the poverty statistics in Jones County, males aged 15 years and females aged 45 to 54 years are the age groups that are most secure financially, with 95.8% of males and 95.5% of females in these age groups living above the poverty line.
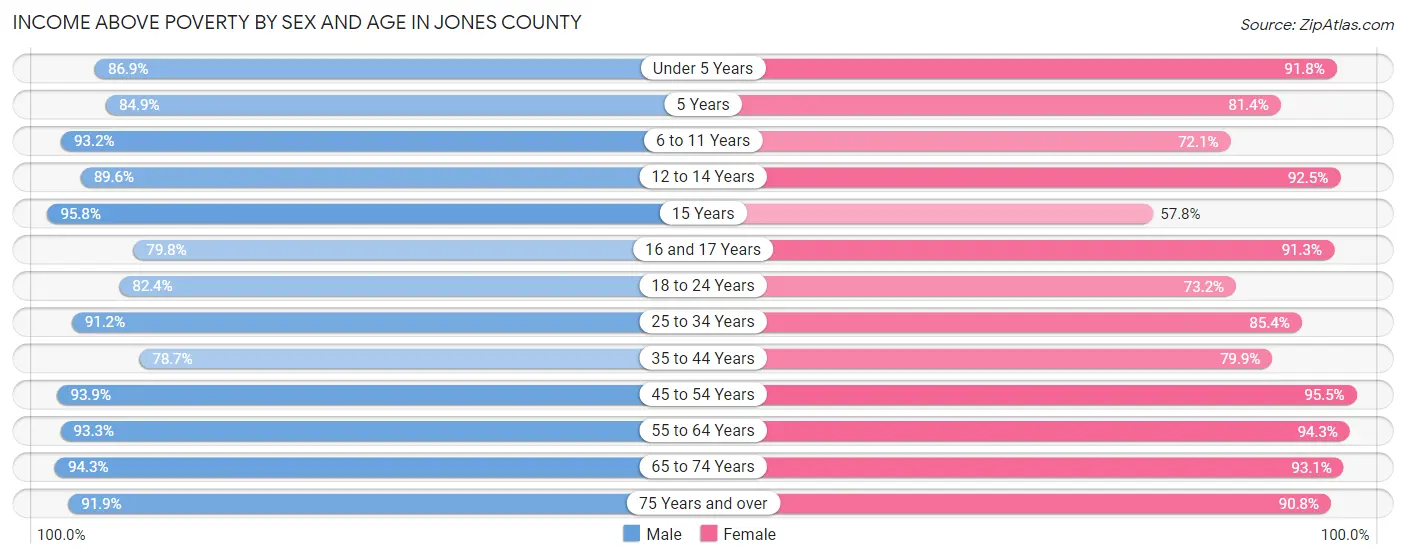
| Age Bracket | Male | Female |
| Under 5 Years | 412 (86.9%) | 551 (91.8%) |
| 5 Years | 84 (84.9%) | 114 (81.4%) |
| 6 to 11 Years | 522 (93.2%) | 527 (72.1%) |
| 12 to 14 Years | 344 (89.6%) | 270 (92.5%) |
| 15 Years | 203 (95.8%) | 48 (57.8%) |
| 16 and 17 Years | 166 (79.8%) | 273 (91.3%) |
| 18 to 24 Years | 595 (82.4%) | 474 (73.2%) |
| 25 to 34 Years | 1,091 (91.2%) | 839 (85.4%) |
| 35 to 44 Years | 957 (78.7%) | 909 (79.9%) |
| 45 to 54 Years | 1,150 (93.9%) | 1,130 (95.5%) |
| 55 to 64 Years | 1,309 (93.3%) | 1,399 (94.3%) |
| 65 to 74 Years | 1,145 (94.3%) | 1,099 (93.1%) |
| 75 Years and over | 713 (91.9%) | 905 (90.8%) |
| Total | 8,691 (89.7%) | 8,538 (87.5%) |
Income Below Poverty Among Married-Couple Families in Jones County
The poverty statistics for married-couple families in Jones County show that 3.6% or 151 of the total 4,215 families live below the poverty line. Families with 5 or more children have the highest poverty rate of 62.5%, comprising of 20 families. On the other hand, families with 3 or 4 children have the lowest poverty rate of 2.9%, which includes 11 families.
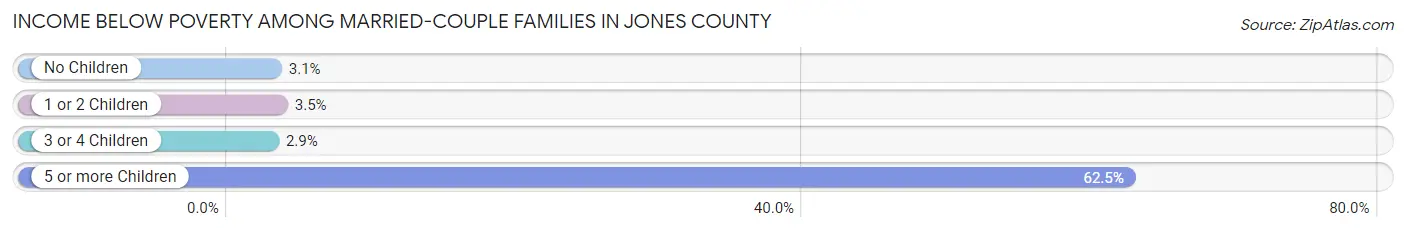
| Children | Above Poverty | Below Poverty |
| No Children | 2,704 (97.0%) | 85 (3.0%) |
| 1 or 2 Children | 973 (96.5%) | 35 (3.5%) |
| 3 or 4 Children | 375 (97.2%) | 11 (2.9%) |
| 5 or more Children | 12 (37.5%) | 20 (62.5%) |
| Total | 4,064 (96.4%) | 151 (3.6%) |
Income Below Poverty Among Single-Parent Households in Jones County
According to the poverty data in Jones County, 11.3% or 33 single-father households and 34.3% or 286 single-mother households are living below the poverty line. Among single-father households, those with 5 or more children have the highest poverty rate, with 4 households (100.0%) experiencing poverty. Likewise, among single-mother households, those with 3 or 4 children have the highest poverty rate, with 20 households (64.5%) falling below the poverty line.
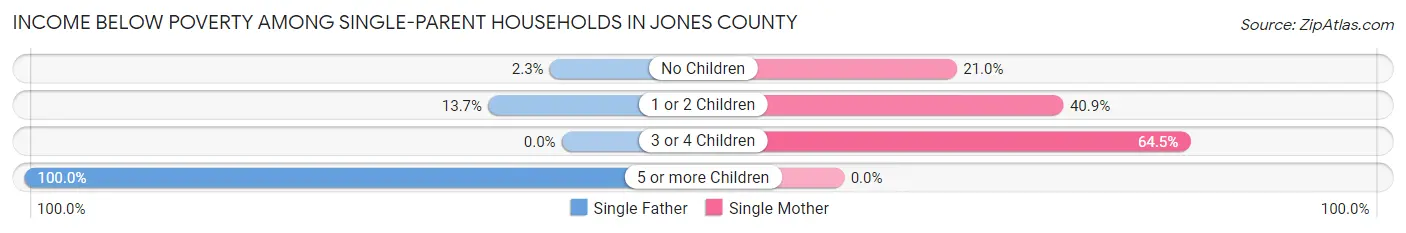
| Children | Single Father | Single Mother |
| No Children | 2 (2.2%) | 65 (21.0%) |
| 1 or 2 Children | 27 (13.7%) | 201 (40.8%) |
| 3 or 4 Children | 0 (0.0%) | 20 (64.5%) |
| 5 or more Children | 4 (100.0%) | 0 (0.0%) |
| Total | 33 (11.3%) | 286 (34.3%) |
Income Below Poverty Among Married-Couple vs Single-Parent Households in Jones County
The poverty data for Jones County shows that 151 of the married-couple family households (3.6%) and 319 of the single-parent households (28.3%) are living below the poverty level. Within the married-couple family households, those with 5 or more children have the highest poverty rate, with 20 households (62.5%) falling below the poverty line. Among the single-parent households, those with 5 or more children have the highest poverty rate, with 4 household (100.0%) living below poverty.
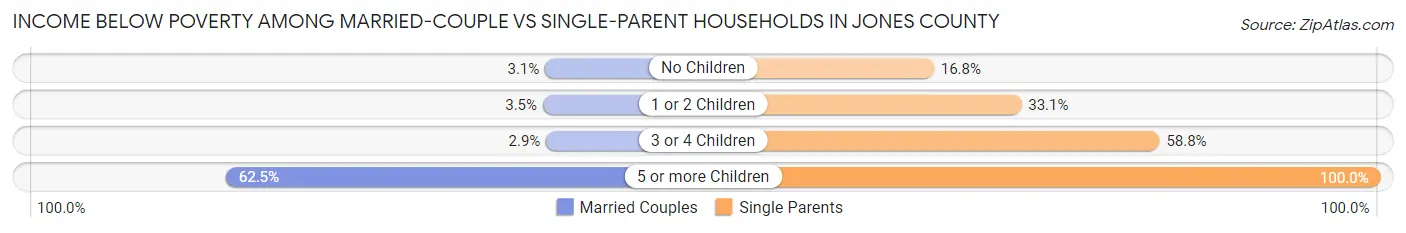
| Children | Married-Couple Families | Single-Parent Households |
| No Children | 85 (3.0%) | 67 (16.8%) |
| 1 or 2 Children | 35 (3.5%) | 228 (33.1%) |
| 3 or 4 Children | 11 (2.9%) | 20 (58.8%) |
| 5 or more Children | 20 (62.5%) | 4 (100.0%) |
| Total | 151 (3.6%) | 319 (28.3%) |
Race in Jones County
The most populous races in Jones County are White / Caucasian (19,264 | 92.9%), Two or more Races (763 | 3.7%), and Black / African American (472 | 2.3%).
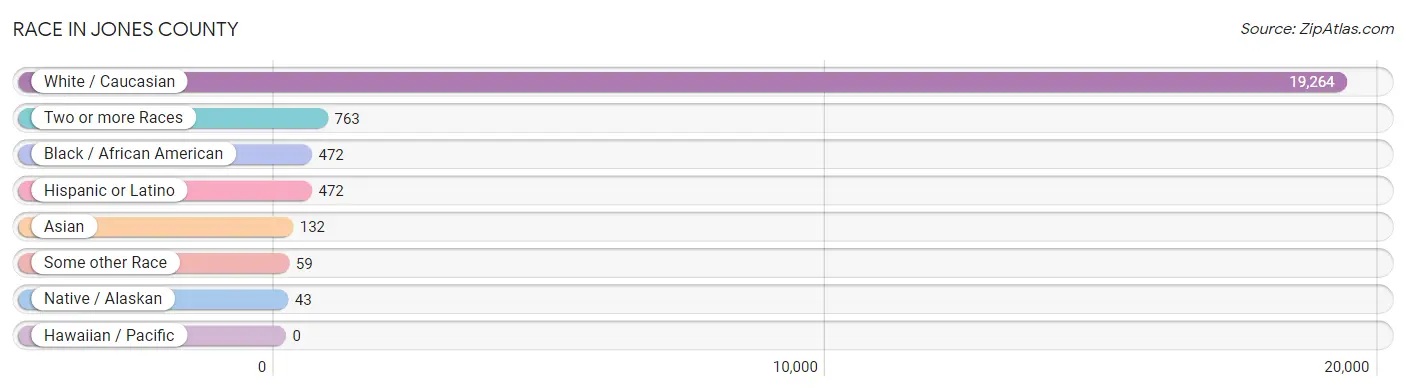
| Race | # Population | % Population |
| Asian | 132 | 0.6% |
| Black / African American | 472 | 2.3% |
| Hawaiian / Pacific | 0 | 0.0% |
| Hispanic or Latino | 472 | 2.3% |
| Native / Alaskan | 43 | 0.2% |
| White / Caucasian | 19,264 | 92.9% |
| Two or more Races | 763 | 3.7% |
| Some other Race | 59 | 0.3% |
| Total | 20,733 | 100.0% |
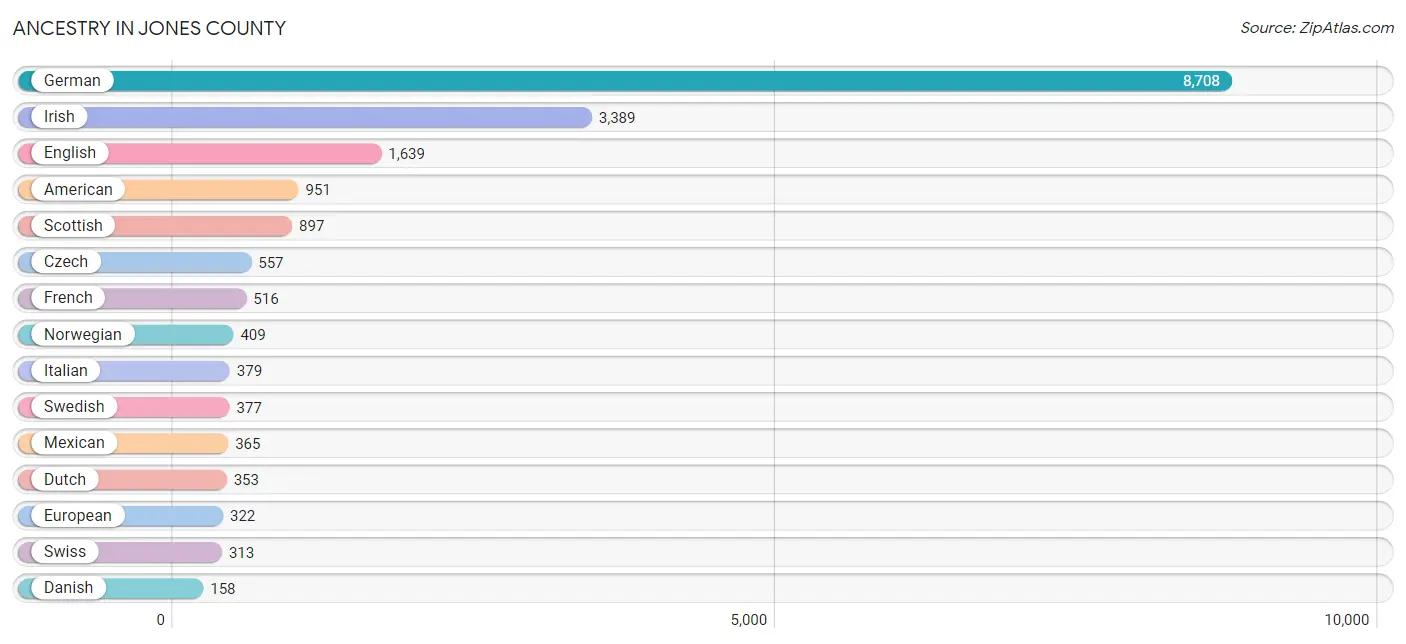
Ancestry in Jones County
The most populous ancestries reported in Jones County are German (8,708 | 42.0%), Irish (3,389 | 16.4%), English (1,639 | 7.9%), American (951 | 4.6%), and Scottish (897 | 4.3%), together accounting for 75.2% of all Jones County residents.
| Ancestry | # Population | % Population |
| African | 89 | 0.4% |
| American | 951 | 4.6% |
| Apache | 12 | 0.1% |
| Austrian | 6 | 0.0% |
| Belgian | 62 | 0.3% |
| Bhutanese | 1 | 0.0% |
| Blackfeet | 1 | 0.0% |
| British | 22 | 0.1% |
| Central American | 53 | 0.3% |
| Central American Indian | 48 | 0.2% |
| Cherokee | 25 | 0.1% |
| Croatian | 17 | 0.1% |
| Cuban | 10 | 0.1% |
| Czech | 557 | 2.7% |
| Czechoslovakian | 51 | 0.3% |
| Danish | 158 | 0.8% |
| Dutch | 353 | 1.7% |
| Eastern European | 34 | 0.2% |
| English | 1,639 | 7.9% |
| European | 322 | 1.5% |
| Finnish | 9 | 0.0% |
| French | 516 | 2.5% |
| French Canadian | 85 | 0.4% |
| German | 8,708 | 42.0% |
| Greek | 7 | 0.0% |
| Guatemalan | 53 | 0.3% |
| Haitian | 27 | 0.1% |
| Hungarian | 82 | 0.4% |
| Indian (Asian) | 141 | 0.7% |
| Irish | 3,389 | 16.4% |
| Italian | 379 | 1.8% |
| Japanese | 11 | 0.1% |
| Korean | 33 | 0.2% |
| Latvian | 39 | 0.2% |
| Lithuanian | 5 | 0.0% |
| Luxembourger | 145 | 0.7% |
| Mexican | 365 | 1.8% |
| Native Hawaiian | 26 | 0.1% |
| Navajo | 11 | 0.1% |
| Northern European | 7 | 0.0% |
| Norwegian | 409 | 2.0% |
| Pakistani | 2 | 0.0% |
| Pennsylvania German | 2 | 0.0% |
| Polish | 123 | 0.6% |
| Portuguese | 15 | 0.1% |
| Pueblo | 21 | 0.1% |
| Puerto Rican | 7 | 0.0% |
| Russian | 50 | 0.2% |
| Scandinavian | 48 | 0.2% |
| Scotch-Irish | 63 | 0.3% |
| Scottish | 897 | 4.3% |
| Sioux | 6 | 0.0% |
| Slovak | 67 | 0.3% |
| Spaniard | 14 | 0.1% |
| Sri Lankan | 26 | 0.1% |
| Subsaharan African | 89 | 0.4% |
| Swedish | 377 | 1.8% |
| Swiss | 313 | 1.5% |
| Thai | 31 | 0.2% |
| Ukrainian | 4 | 0.0% |
| Welsh | 58 | 0.3% |
| West Indian | 8 | 0.0% | View All 62 Rows |
Immigrants in Jones County
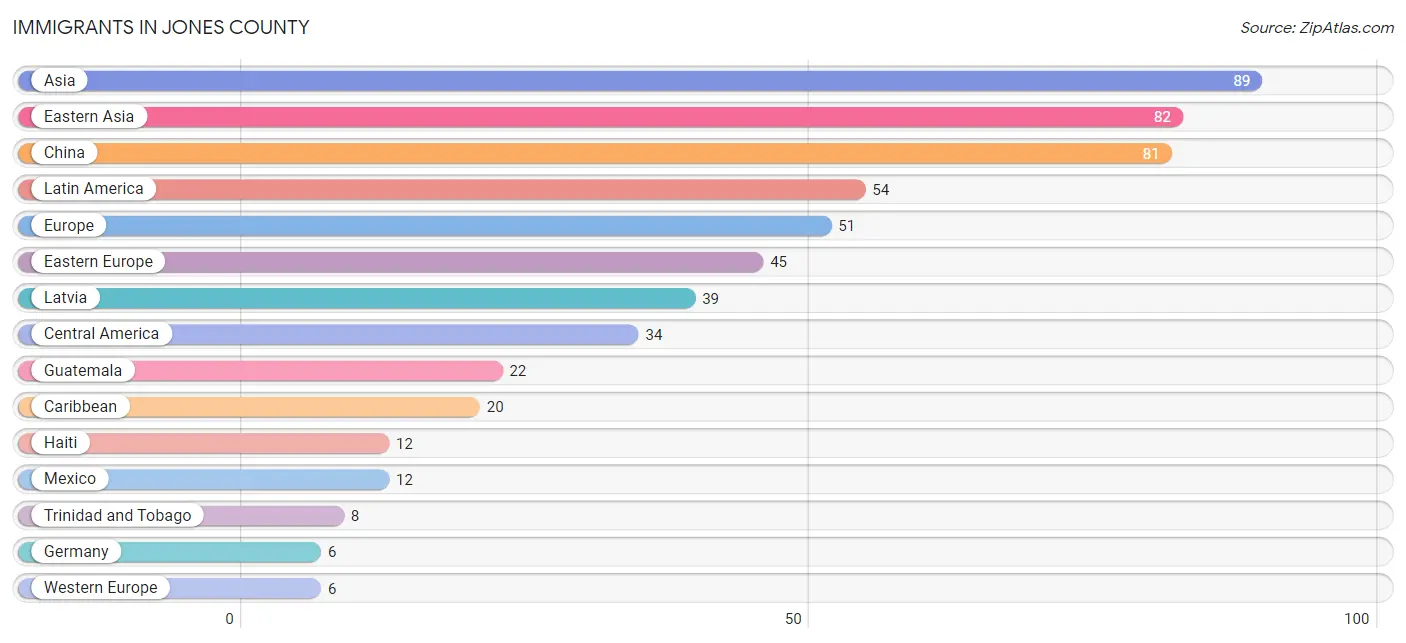
The most numerous immigrant groups reported in Jones County came from Asia (89 | 0.4%), Eastern Asia (82 | 0.4%), China (81 | 0.4%), Latin America (54 | 0.3%), and Europe (51 | 0.3%), together accounting for 1.7% of all Jones County residents.
| Immigration Origin | # Population | % Population |
| Asia | 89 | 0.4% |
| Caribbean | 20 | 0.1% |
| Central America | 34 | 0.2% |
| China | 81 | 0.4% |
| Eastern Asia | 82 | 0.4% |
| Eastern Europe | 45 | 0.2% |
| Europe | 51 | 0.3% |
| Germany | 6 | 0.0% |
| Guatemala | 22 | 0.1% |
| Haiti | 12 | 0.1% |
| India | 5 | 0.0% |
| Japan | 1 | 0.0% |
| Latin America | 54 | 0.3% |
| Latvia | 39 | 0.2% |
| Mexico | 12 | 0.1% |
| Poland | 2 | 0.0% |
| South Central Asia | 5 | 0.0% |
| South Eastern Asia | 2 | 0.0% |
| Thailand | 2 | 0.0% |
| Trinidad and Tobago | 8 | 0.0% |
| Ukraine | 4 | 0.0% |
| Western Europe | 6 | 0.0% | View All 22 Rows |
Sex and Age in Jones County
Sex and Age in Jones County
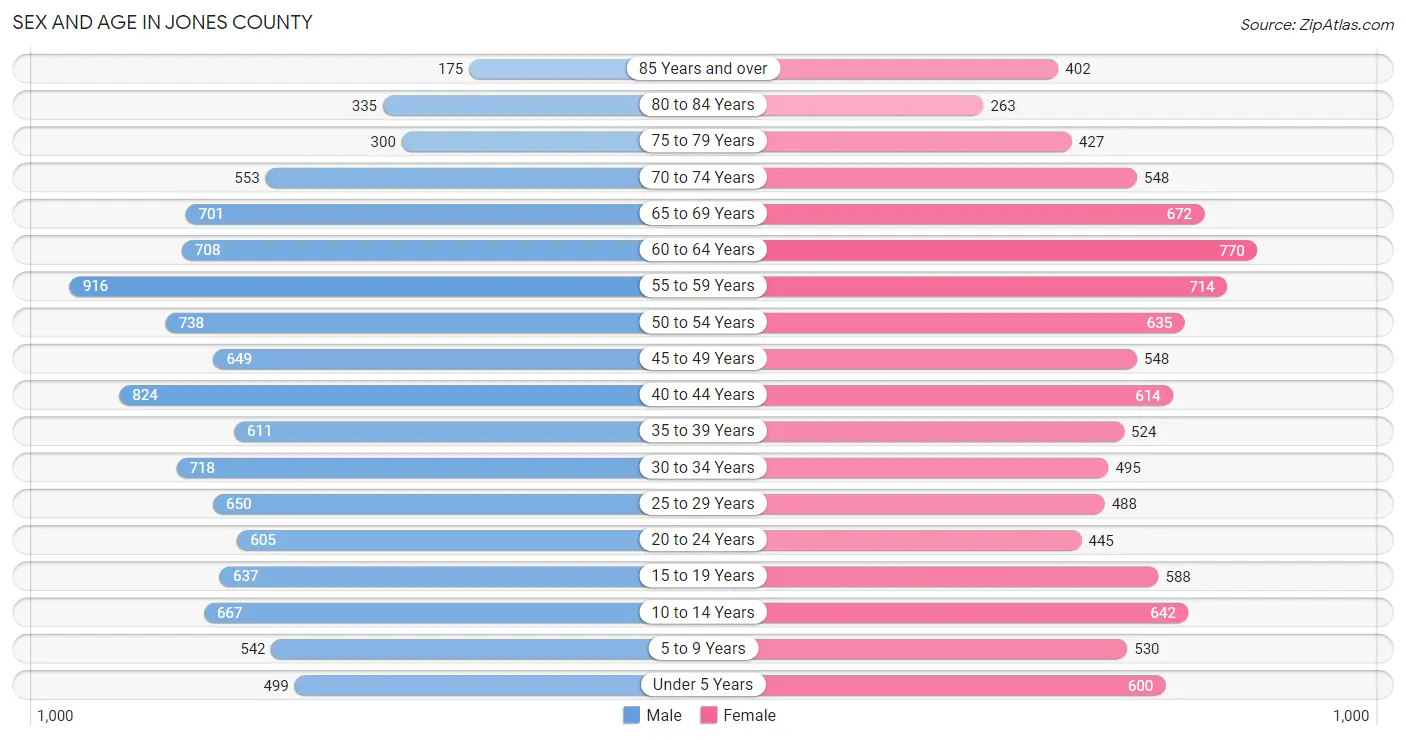
The most populous age groups in Jones County are 55 to 59 Years (916 | 8.5%) for men and 60 to 64 Years (770 | 7.8%) for women.
| Age Bracket | Male | Female |
| Under 5 Years | 499 (4.6%) | 600 (6.1%) |
| 5 to 9 Years | 542 (5.0%) | 530 (5.3%) |
| 10 to 14 Years | 667 (6.2%) | 642 (6.5%) |
| 15 to 19 Years | 637 (5.9%) | 588 (5.9%) |
| 20 to 24 Years | 605 (5.6%) | 445 (4.5%) |
| 25 to 29 Years | 650 (6.0%) | 488 (4.9%) |
| 30 to 34 Years | 718 (6.6%) | 495 (5.0%) |
| 35 to 39 Years | 611 (5.6%) | 524 (5.3%) |
| 40 to 44 Years | 824 (7.6%) | 614 (6.2%) |
| 45 to 49 Years | 649 (6.0%) | 548 (5.5%) |
| 50 to 54 Years | 738 (6.8%) | 635 (6.4%) |
| 55 to 59 Years | 916 (8.5%) | 714 (7.2%) |
| 60 to 64 Years | 708 (6.5%) | 770 (7.8%) |
| 65 to 69 Years | 701 (6.5%) | 672 (6.8%) |
| 70 to 74 Years | 553 (5.1%) | 548 (5.5%) |
| 75 to 79 Years | 300 (2.8%) | 427 (4.3%) |
| 80 to 84 Years | 335 (3.1%) | 263 (2.7%) |
| 85 Years and over | 175 (1.6%) | 402 (4.1%) |
| Total | 10,828 (100.0%) | 9,905 (100.0%) |
Families and Households in Jones County
Median Family Size in Jones County
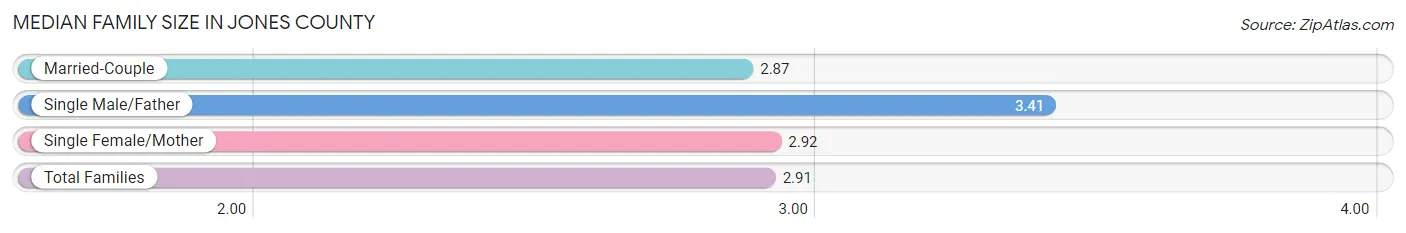
The median family size in Jones County is 2.91 persons per family, with single male/father families (293 | 5.5%) accounting for the largest median family size of 3.41 persons per family. On the other hand, married-couple families (4,215 | 78.9%) represent the smallest median family size with 2.87 persons per family.
| Family Type | # Families | Family Size |
| Married-Couple | 4,215 (78.9%) | 2.87 |
| Single Male/Father | 293 (5.5%) | 3.41 |
| Single Female/Mother | 833 (15.6%) | 2.92 |
| Total Families | 5,341 (100.0%) | 2.91 |
Median Household Size in Jones County
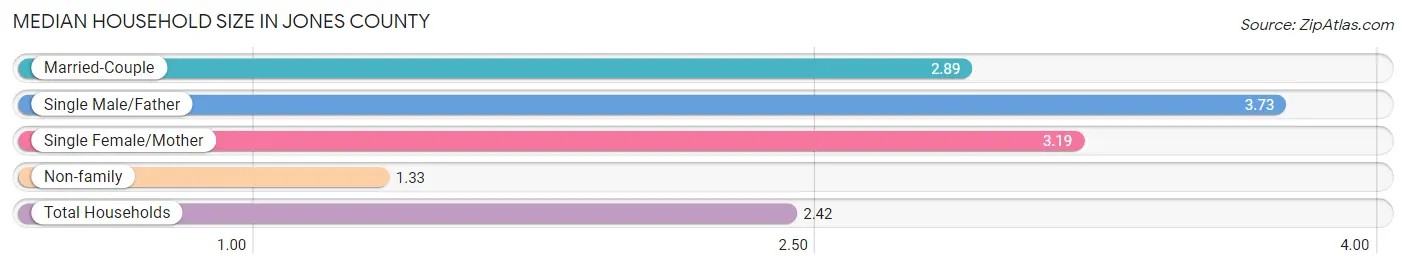
The median household size in Jones County is 2.42 persons per household, with single male/father households (293 | 3.6%) accounting for the largest median household size of 3.73 persons per household. non-family households (2,721 | 33.8%) represent the smallest median household size with 1.33 persons per household.
| Household Type | # Households | Household Size |
| Married-Couple | 4,215 (52.3%) | 2.89 |
| Single Male/Father | 293 (3.6%) | 3.73 |
| Single Female/Mother | 833 (10.3%) | 3.19 |
| Non-family | 2,721 (33.8%) | 1.33 |
| Total Households | 8,062 (100.0%) | 2.42 |
Household Size by Marriage Status in Jones County
Out of a total of 8,062 households in Jones County, 5,341 (66.2%) are family households, while 2,721 (33.8%) are nonfamily households. The most numerous type of family households are 2-person households, comprising 3,144, and the most common type of nonfamily households are 1-person households, comprising 2,230.
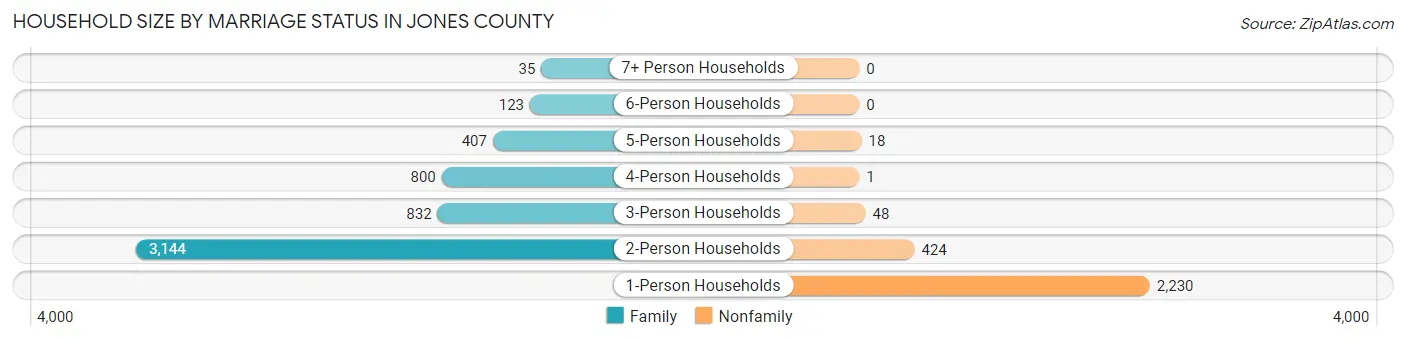
| Household Size | Family Households | Nonfamily Households |
| 1-Person Households | - | 2,230 (27.7%) |
| 2-Person Households | 3,144 (39.0%) | 424 (5.3%) |
| 3-Person Households | 832 (10.3%) | 48 (0.6%) |
| 4-Person Households | 800 (9.9%) | 1 (0.0%) |
| 5-Person Households | 407 (5.1%) | 18 (0.2%) |
| 6-Person Households | 123 (1.5%) | 0 (0.0%) |
| 7+ Person Households | 35 (0.4%) | 0 (0.0%) |
| Total | 5,341 (66.2%) | 2,721 (33.8%) |
Female Fertility in Jones County
Fertility by Age in Jones County
Average fertility rate in Jones County is 59.0 births per 1,000 women. Women in the age bracket of 20 to 34 years have the highest fertility rate with 110.0 births per 1,000 women. Women in the age bracket of 20 to 34 years acount for 70.1% of all women with births.
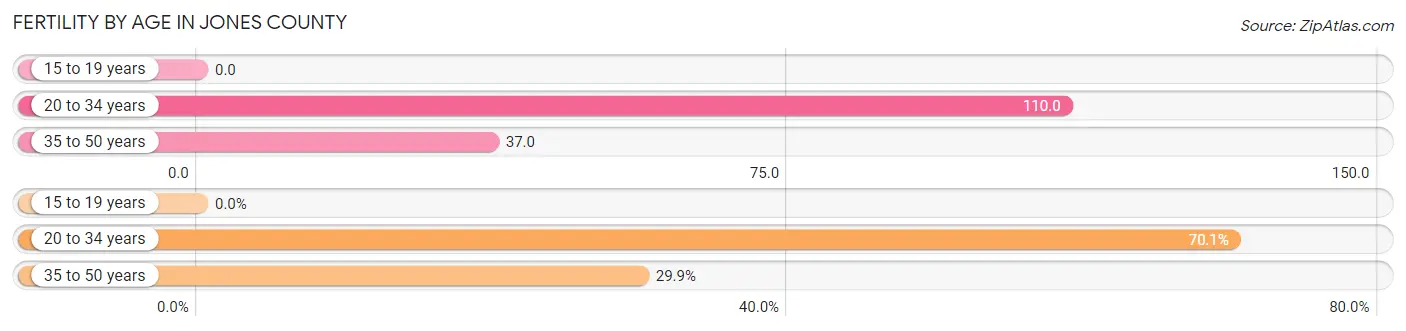
| Age Bracket | Women with Births | Births / 1,000 Women |
| 15 to 19 years | 0 (0.0%) | 0.0 |
| 20 to 34 years | 157 (70.1%) | 110.0 |
| 35 to 50 years | 67 (29.9%) | 37.0 |
| Total | 224 (100.0%) | 59.0 |
Fertility by Age by Marriage Status in Jones County
69.6% of women with births (224) in Jones County are married. The highest percentage of unmarried women with births falls into 20 to 34 years age bracket with 40.1% of them unmarried at the time of birth, while the lowest percentage of unmarried women with births belong to 35 to 50 years age bracket with 7.5% of them unmarried.
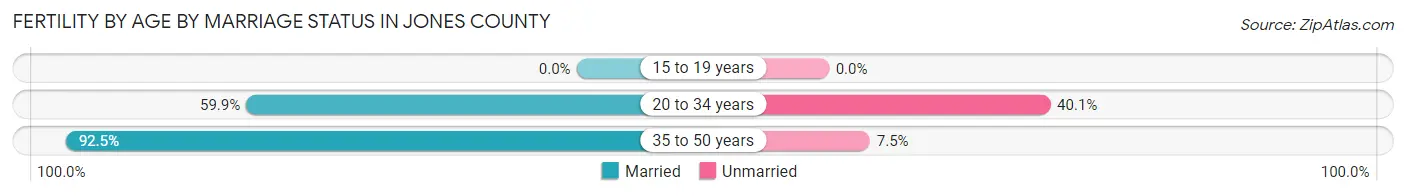
| Age Bracket | Married | Unmarried |
| 15 to 19 years | 0 (0.0%) | 0 (0.0%) |
| 20 to 34 years | 94 (59.9%) | 63 (40.1%) |
| 35 to 50 years | 62 (92.5%) | 5 (7.5%) |
| Total | 156 (69.6%) | 68 (30.4%) |
Fertility by Education in Jones County
Average fertility rate in Jones County is 59.0 births per 1,000 women. Women with the education attainment of graduate degree have the highest fertility rate of 125.0 births per 1,000 women, while women with the education attainment of college or associate's degree have the lowest fertility at 36.0 births per 1,000 women. Women with the education attainment of bachelor's degree represent 27.7% of all women with births.
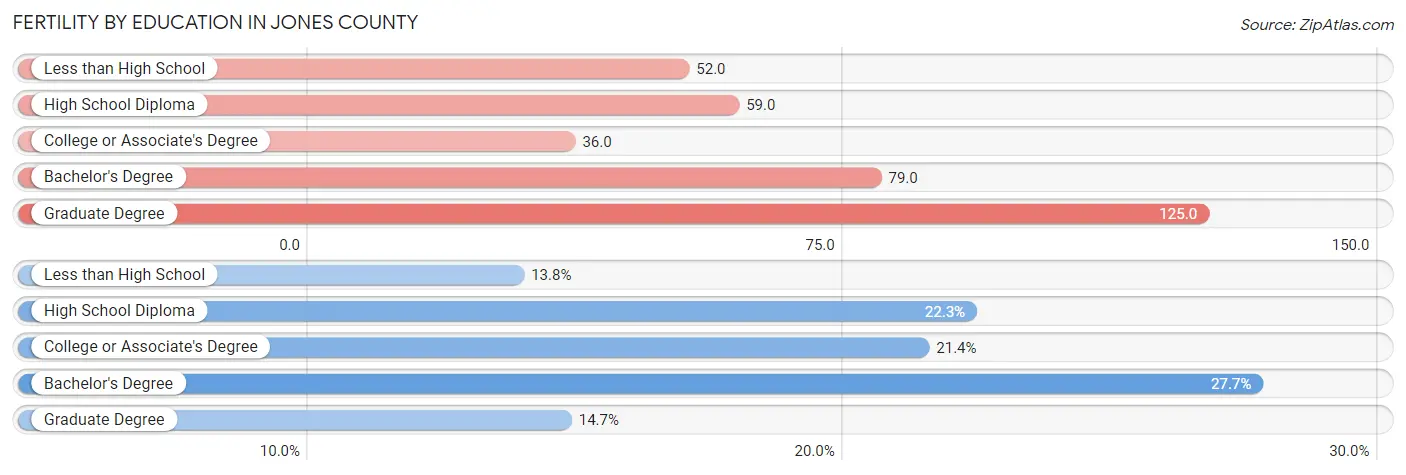
| Educational Attainment | Women with Births | Births / 1,000 Women |
| Less than High School | 31 (13.8%) | 52.0 |
| High School Diploma | 50 (22.3%) | 59.0 |
| College or Associate's Degree | 48 (21.4%) | 36.0 |
| Bachelor's Degree | 62 (27.7%) | 79.0 |
| Graduate Degree | 33 (14.7%) | 125.0 |
| Total | 224 (100.0%) | 59.0 |
Fertility by Education by Marriage Status in Jones County
30.4% of women with births in Jones County are unmarried. Women with the educational attainment of bachelor's degree are most likely to be married with 100.0% of them married at childbirth, while women with the educational attainment of high school diploma are least likely to be married with 64.0% of them unmarried at childbirth.
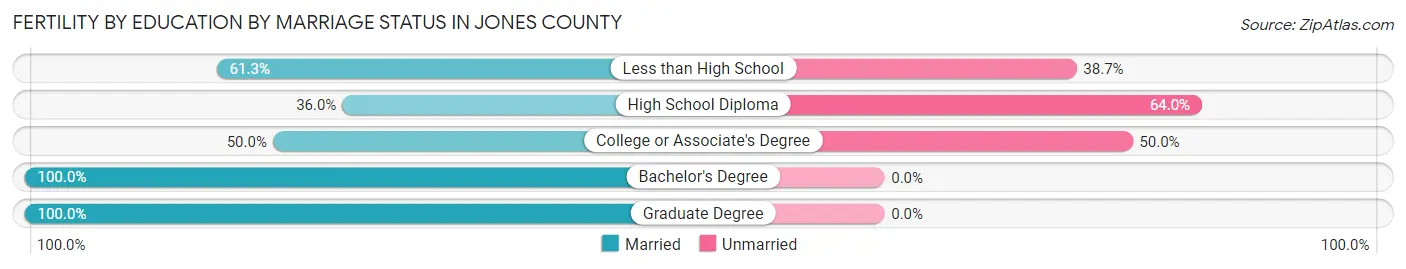
| Educational Attainment | Married | Unmarried |
| Less than High School | 19 (61.3%) | 12 (38.7%) |
| High School Diploma | 18 (36.0%) | 32 (64.0%) |
| College or Associate's Degree | 24 (50.0%) | 24 (50.0%) |
| Bachelor's Degree | 62 (100.0%) | 0 (0.0%) |
| Graduate Degree | 33 (100.0%) | 0 (0.0%) |
| Total | 156 (69.6%) | 68 (30.4%) |
Employment Characteristics in Jones County
Employment by Class of Employer in Jones County
Among the 9,730 employed individuals in Jones County, private company employees (6,364 | 65.4%), self-employed (not incorporated) (846 | 8.7%), and not-for-profit organizations (665 | 6.8%) make up the most common classes of employment.
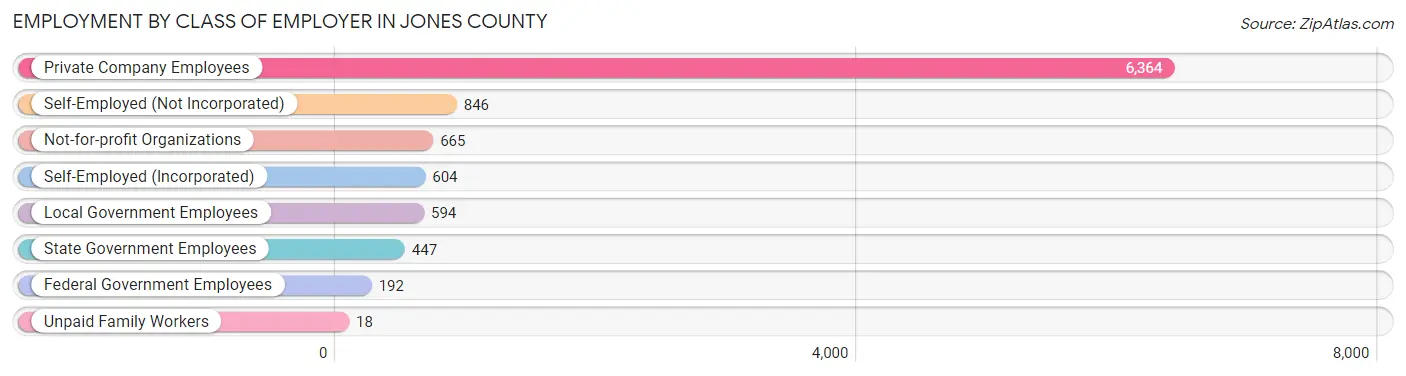
| Employer Class | # Employees | % Employees |
| Private Company Employees | 6,364 | 65.4% |
| Self-Employed (Incorporated) | 604 | 6.2% |
| Self-Employed (Not Incorporated) | 846 | 8.7% |
| Not-for-profit Organizations | 665 | 6.8% |
| Local Government Employees | 594 | 6.1% |
| State Government Employees | 447 | 4.6% |
| Federal Government Employees | 192 | 2.0% |
| Unpaid Family Workers | 18 | 0.2% |
| Total | 9,730 | 100.0% |
Employment Status by Age in Jones County
According to the labor force statistics for Jones County, out of the total population over 16 years of age (16,956), 61.0% or 10,343 individuals are in the labor force, with 3.1% or 321 of them unemployed. The age group with the highest labor force participation rate is 30 to 34 years, with 84.7% or 1,027 individuals in the labor force. Within the labor force, the 16 to 19 years age range has the highest percentage of unemployed individuals, with 13.4% or 69 of them being unemployed.
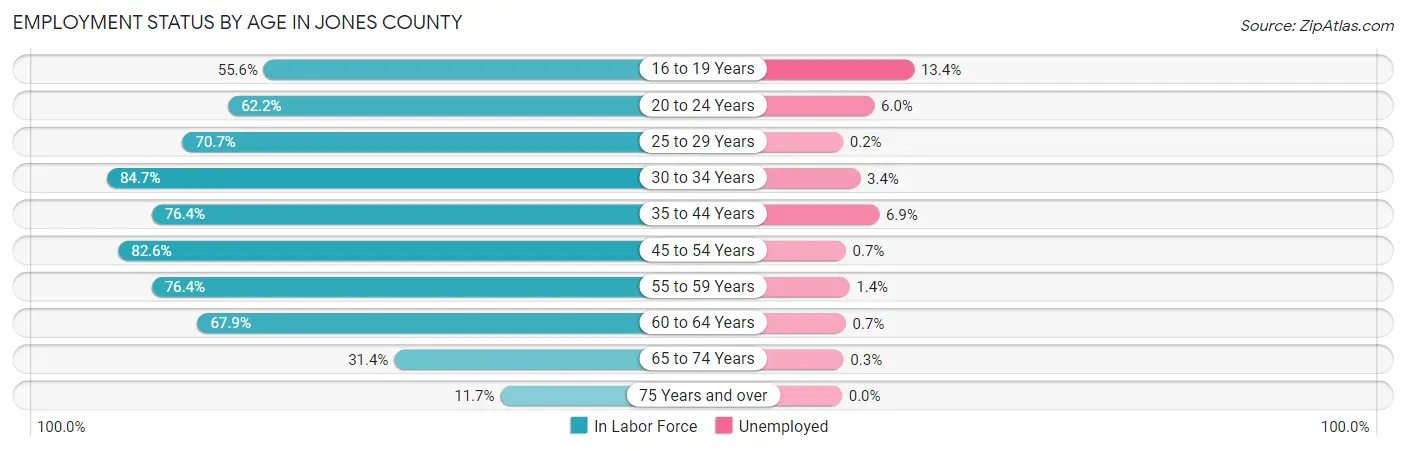
| Age Bracket | In Labor Force | Unemployed |
| 16 to 19 Years | 516 (55.6%) | 69 (13.4%) |
| 20 to 24 Years | 653 (62.2%) | 39 (6.0%) |
| 25 to 29 Years | 805 (70.7%) | 2 (0.2%) |
| 30 to 34 Years | 1,027 (84.7%) | 35 (3.4%) |
| 35 to 44 Years | 1,966 (76.4%) | 136 (6.9%) |
| 45 to 54 Years | 2,123 (82.6%) | 15 (0.7%) |
| 55 to 59 Years | 1,245 (76.4%) | 17 (1.4%) |
| 60 to 64 Years | 1,004 (67.9%) | 7 (0.7%) |
| 65 to 74 Years | 777 (31.4%) | 2 (0.3%) |
| 75 Years and over | 223 (11.7%) | 0 (0.0%) |
| Total | 10,343 (61.0%) | 321 (3.1%) |
Employment Status by Educational Attainment in Jones County
According to labor force statistics for Jones County, 77.1% of individuals (8,174) out of the total population between 25 and 64 years of age (10,602) are in the labor force, with 2.6% or 213 of them being unemployed. The group with the highest labor force participation rate are those with the educational attainment of bachelor's degree or higher, with 89.7% or 2,105 individuals in the labor force. Within the labor force, individuals with less than high school education have the highest percentage of unemployment, with 7.1% or 18 of them being unemployed.
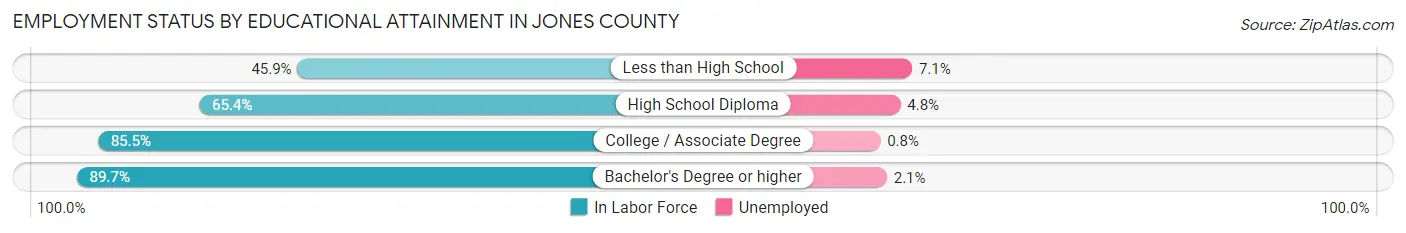
| Educational Attainment | In Labor Force | Unemployed |
| Less than High School | 252 (45.9%) | 39 (7.1%) |
| High School Diploma | 2,533 (65.4%) | 186 (4.8%) |
| College / Associate Degree | 3,277 (85.5%) | 31 (0.8%) |
| Bachelor's Degree or higher | 2,105 (89.7%) | 49 (2.1%) |
| Total | 8,174 (77.1%) | 276 (2.6%) |
Employment Occupations by Sex in Jones County
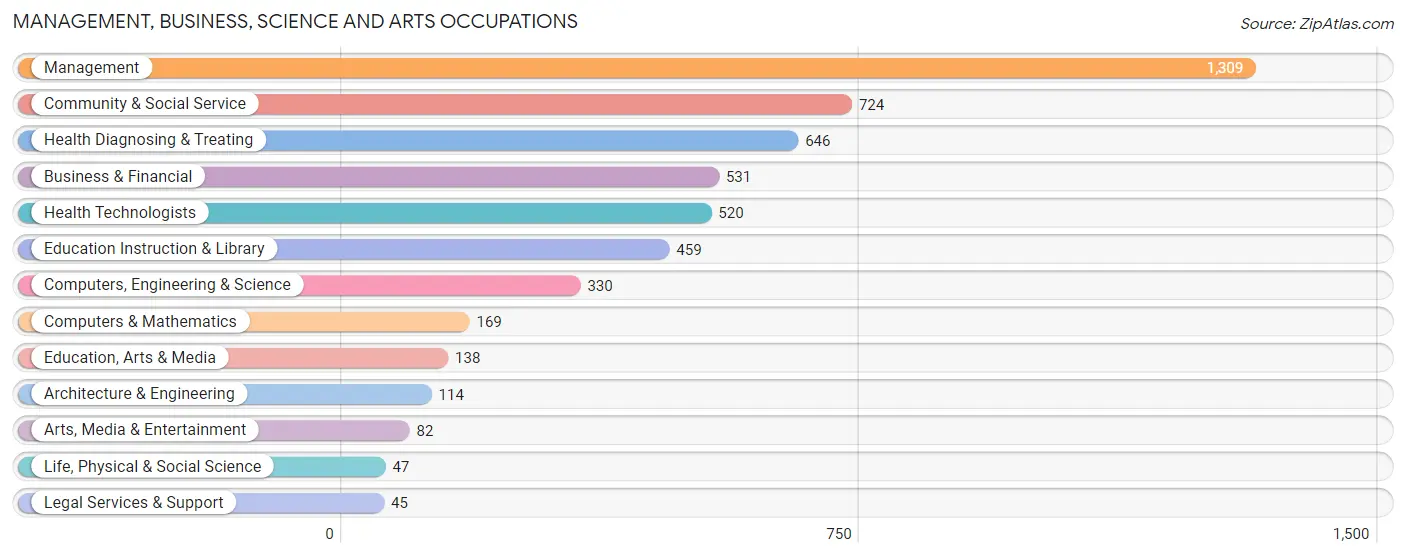
Management, Business, Science and Arts Occupations
The most common Management, Business, Science and Arts occupations in Jones County are Management (1,309 | 13.1%), Community & Social Service (724 | 7.2%), Health Diagnosing & Treating (646 | 6.5%), Business & Financial (531 | 5.3%), and Health Technologists (520 | 5.2%).
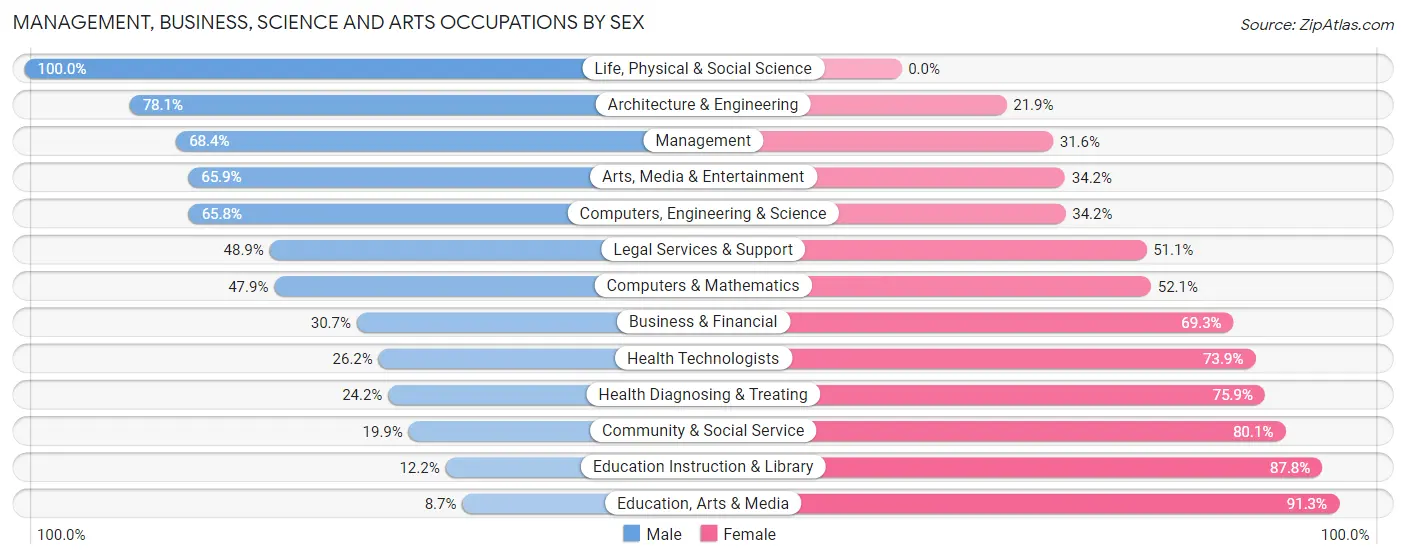
Management, Business, Science and Arts Occupations by Sex
Within the Management, Business, Science and Arts occupations in Jones County, the most male-oriented occupations are Life, Physical & Social Science (100.0%), Architecture & Engineering (78.1%), and Management (68.4%), while the most female-oriented occupations are Education, Arts & Media (91.3%), Education Instruction & Library (87.8%), and Community & Social Service (80.1%).
| Occupation | Male | Female |
| Management | 895 (68.4%) | 414 (31.6%) |
| Business & Financial | 163 (30.7%) | 368 (69.3%) |
| Computers, Engineering & Science | 217 (65.8%) | 113 (34.2%) |
| Computers & Mathematics | 81 (47.9%) | 88 (52.1%) |
| Architecture & Engineering | 89 (78.1%) | 25 (21.9%) |
| Life, Physical & Social Science | 47 (100.0%) | 0 (0.0%) |
| Community & Social Service | 144 (19.9%) | 580 (80.1%) |
| Education, Arts & Media | 12 (8.7%) | 126 (91.3%) |
| Legal Services & Support | 22 (48.9%) | 23 (51.1%) |
| Education Instruction & Library | 56 (12.2%) | 403 (87.8%) |
| Arts, Media & Entertainment | 54 (65.8%) | 28 (34.2%) |
| Health Diagnosing & Treating | 156 (24.1%) | 490 (75.8%) |
| Health Technologists | 136 (26.2%) | 384 (73.9%) |
| Total (Category) | 1,575 (44.5%) | 1,965 (55.5%) |
| Total (Overall) | 5,327 (53.3%) | 4,674 (46.7%) |
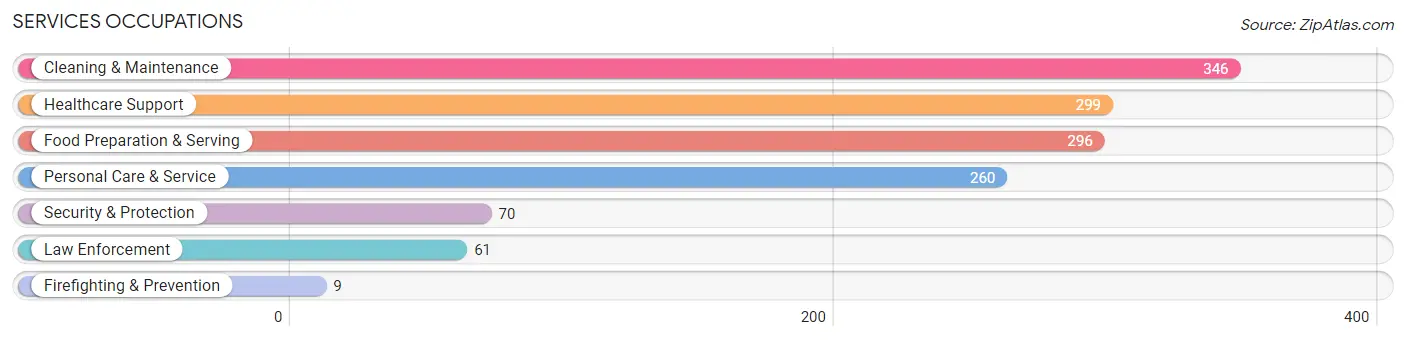
Services Occupations
The most common Services occupations in Jones County are Cleaning & Maintenance (346 | 3.5%), Healthcare Support (299 | 3.0%), Food Preparation & Serving (296 | 3.0%), Personal Care & Service (260 | 2.6%), and Security & Protection (70 | 0.7%).
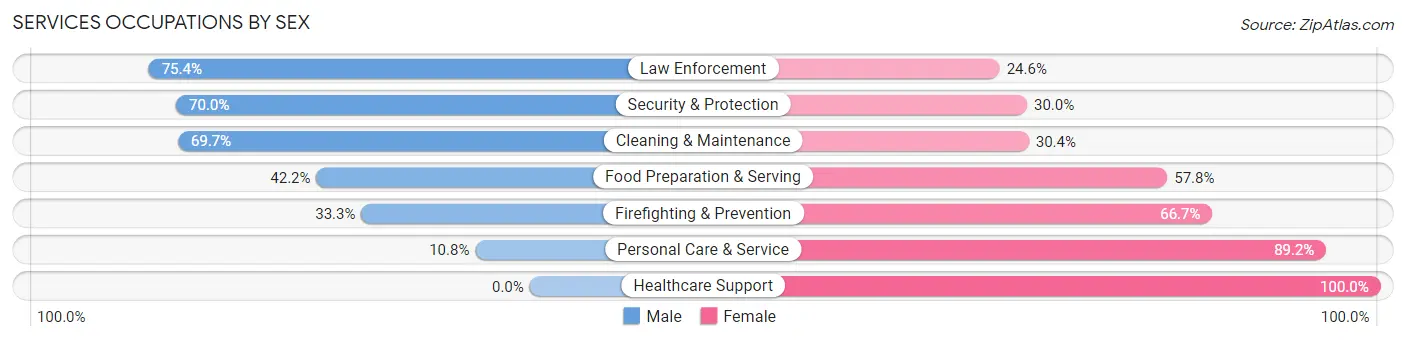
Services Occupations by Sex
Within the Services occupations in Jones County, the most male-oriented occupations are Law Enforcement (75.4%), Security & Protection (70.0%), and Cleaning & Maintenance (69.7%), while the most female-oriented occupations are Healthcare Support (100.0%), Personal Care & Service (89.2%), and Firefighting & Prevention (66.7%).
| Occupation | Male | Female |
| Healthcare Support | 0 (0.0%) | 299 (100.0%) |
| Security & Protection | 49 (70.0%) | 21 (30.0%) |
| Firefighting & Prevention | 3 (33.3%) | 6 (66.7%) |
| Law Enforcement | 46 (75.4%) | 15 (24.6%) |
| Food Preparation & Serving | 125 (42.2%) | 171 (57.8%) |
| Cleaning & Maintenance | 241 (69.7%) | 105 (30.3%) |
| Personal Care & Service | 28 (10.8%) | 232 (89.2%) |
| Total (Category) | 443 (34.8%) | 828 (65.1%) |
| Total (Overall) | 5,327 (53.3%) | 4,674 (46.7%) |
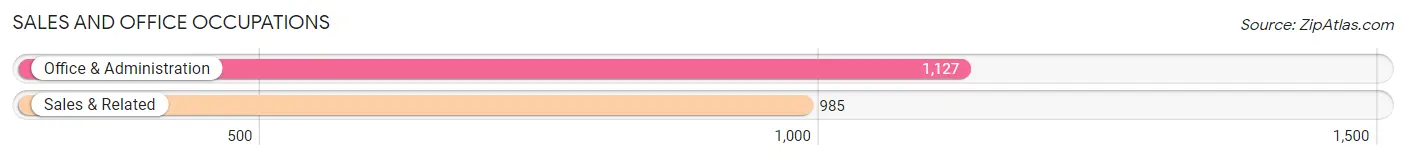
Sales and Office Occupations
The most common Sales and Office occupations in Jones County are Office & Administration (1,127 | 11.3%), and Sales & Related (985 | 9.9%).
Sales and Office Occupations by Sex
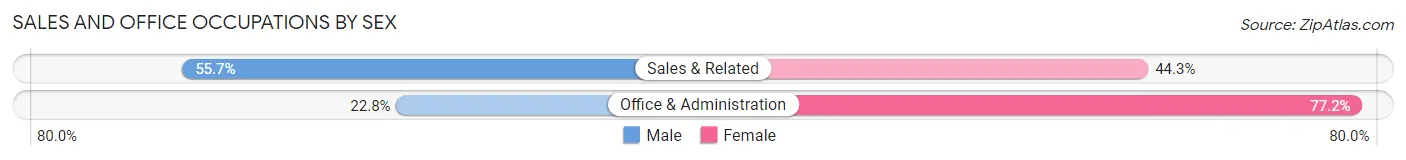
| Occupation | Male | Female |
| Sales & Related | 549 (55.7%) | 436 (44.3%) |
| Office & Administration | 257 (22.8%) | 870 (77.2%) |
| Total (Category) | 806 (38.2%) | 1,306 (61.8%) |
| Total (Overall) | 5,327 (53.3%) | 4,674 (46.7%) |
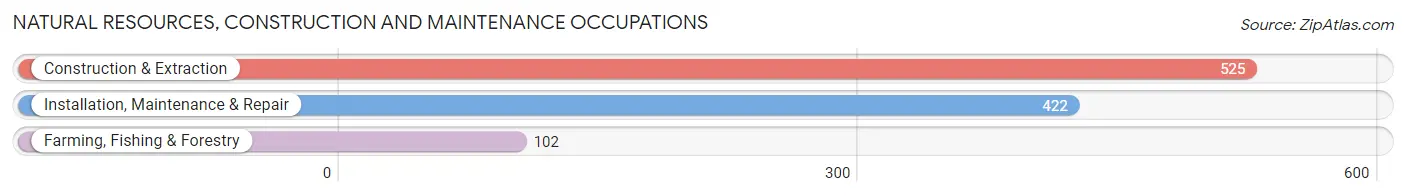
Natural Resources, Construction and Maintenance Occupations
The most common Natural Resources, Construction and Maintenance occupations in Jones County are Construction & Extraction (525 | 5.2%), Installation, Maintenance & Repair (422 | 4.2%), and Farming, Fishing & Forestry (102 | 1.0%).
Natural Resources, Construction and Maintenance Occupations by Sex
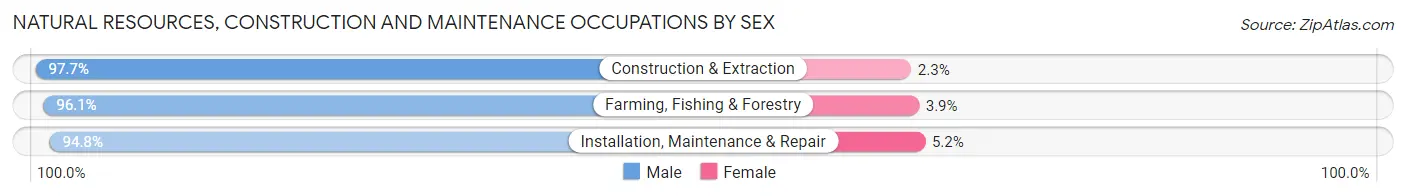
| Occupation | Male | Female |
| Farming, Fishing & Forestry | 98 (96.1%) | 4 (3.9%) |
| Construction & Extraction | 513 (97.7%) | 12 (2.3%) |
| Installation, Maintenance & Repair | 400 (94.8%) | 22 (5.2%) |
| Total (Category) | 1,011 (96.4%) | 38 (3.6%) |
| Total (Overall) | 5,327 (53.3%) | 4,674 (46.7%) |
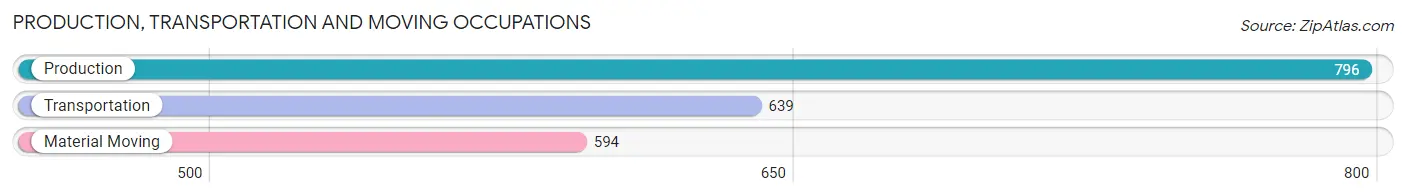
Production, Transportation and Moving Occupations
The most common Production, Transportation and Moving occupations in Jones County are Production (796 | 8.0%), Transportation (639 | 6.4%), and Material Moving (594 | 5.9%).
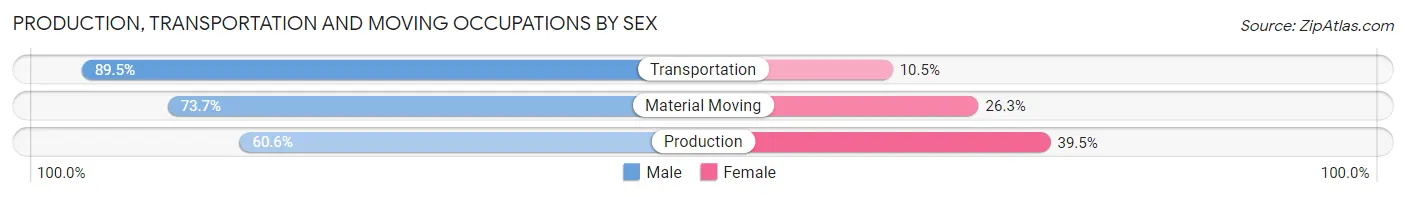
Production, Transportation and Moving Occupations by Sex
| Occupation | Male | Female |
| Production | 482 (60.6%) | 314 (39.5%) |
| Transportation | 572 (89.5%) | 67 (10.5%) |
| Material Moving | 438 (73.7%) | 156 (26.3%) |
| Total (Category) | 1,492 (73.5%) | 537 (26.5%) |
| Total (Overall) | 5,327 (53.3%) | 4,674 (46.7%) |
Employment Industries by Sex in Jones County
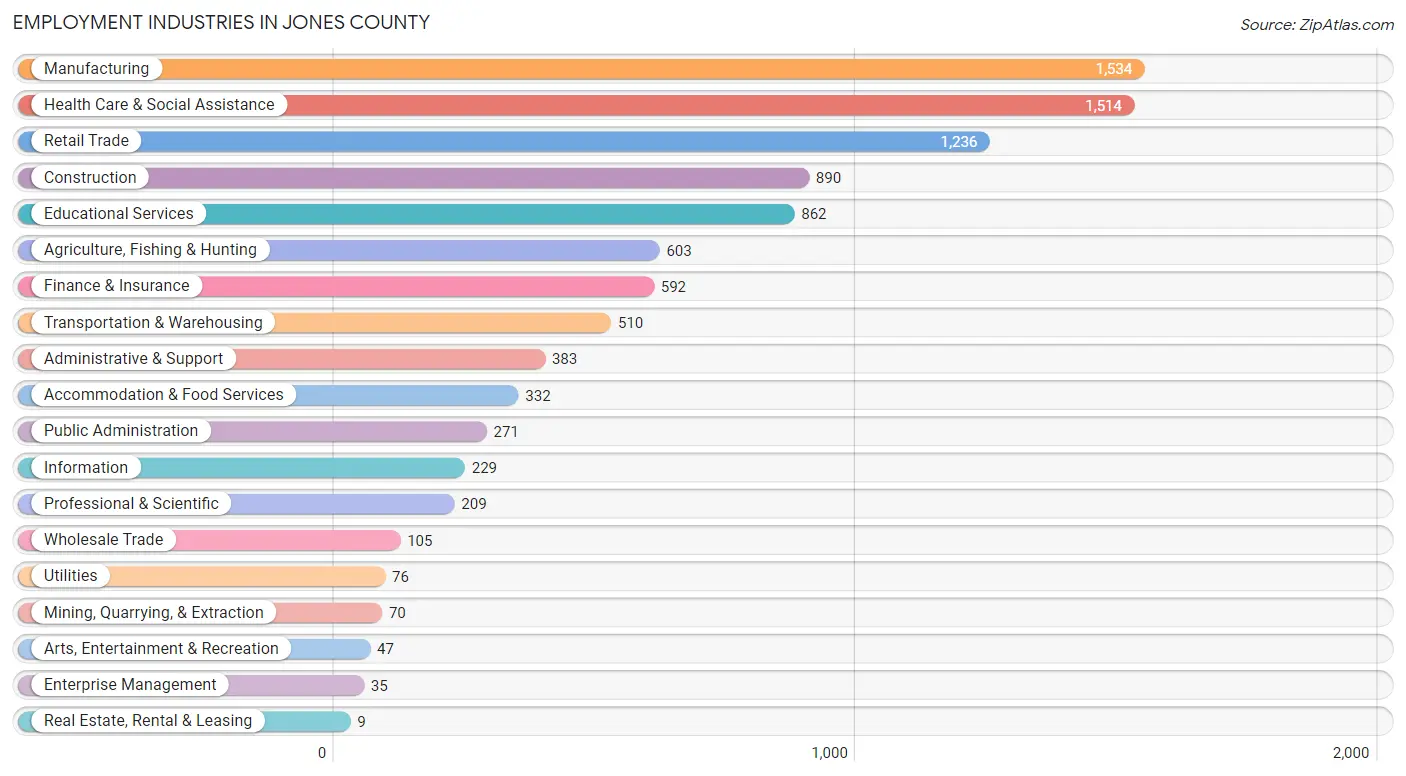
Employment Industries in Jones County
The major employment industries in Jones County include Manufacturing (1,534 | 15.3%), Health Care & Social Assistance (1,514 | 15.1%), Retail Trade (1,236 | 12.4%), Construction (890 | 8.9%), and Educational Services (862 | 8.6%).
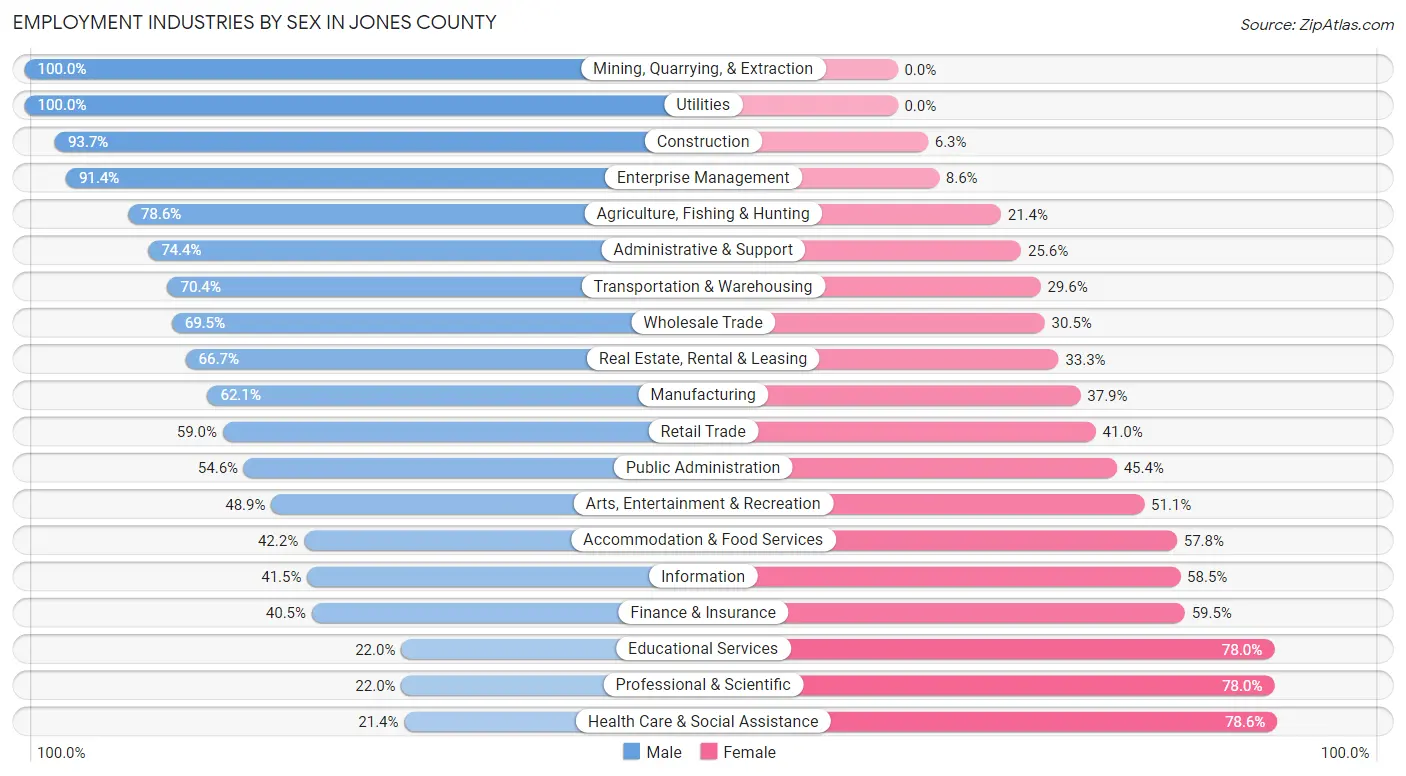
Employment Industries by Sex in Jones County
The Jones County industries that see more men than women are Mining, Quarrying, & Extraction (100.0%), Utilities (100.0%), and Construction (93.7%), whereas the industries that tend to have a higher number of women are Health Care & Social Assistance (78.6%), Professional & Scientific (78.0%), and Educational Services (78.0%).
| Industry | Male | Female |
| Agriculture, Fishing & Hunting | 474 (78.6%) | 129 (21.4%) |
| Mining, Quarrying, & Extraction | 70 (100.0%) | 0 (0.0%) |
| Construction | 834 (93.7%) | 56 (6.3%) |
| Manufacturing | 953 (62.1%) | 581 (37.9%) |
| Wholesale Trade | 73 (69.5%) | 32 (30.5%) |
| Retail Trade | 729 (59.0%) | 507 (41.0%) |
| Transportation & Warehousing | 359 (70.4%) | 151 (29.6%) |
| Utilities | 76 (100.0%) | 0 (0.0%) |
| Information | 95 (41.5%) | 134 (58.5%) |
| Finance & Insurance | 240 (40.5%) | 352 (59.5%) |
| Real Estate, Rental & Leasing | 6 (66.7%) | 3 (33.3%) |
| Professional & Scientific | 46 (22.0%) | 163 (78.0%) |
| Enterprise Management | 32 (91.4%) | 3 (8.6%) |
| Administrative & Support | 285 (74.4%) | 98 (25.6%) |
| Educational Services | 190 (22.0%) | 672 (78.0%) |
| Health Care & Social Assistance | 324 (21.4%) | 1,190 (78.6%) |
| Arts, Entertainment & Recreation | 23 (48.9%) | 24 (51.1%) |
| Accommodation & Food Services | 140 (42.2%) | 192 (57.8%) |
| Public Administration | 148 (54.6%) | 123 (45.4%) |
| Total | 5,327 (53.3%) | 4,674 (46.7%) |
Education in Jones County
School Enrollment in Jones County
The most common levels of schooling among the 4,116 students in Jones County are middle school (1,082 | 26.3%), high school (1,012 | 24.6%), and elementary school (899 | 21.8%).
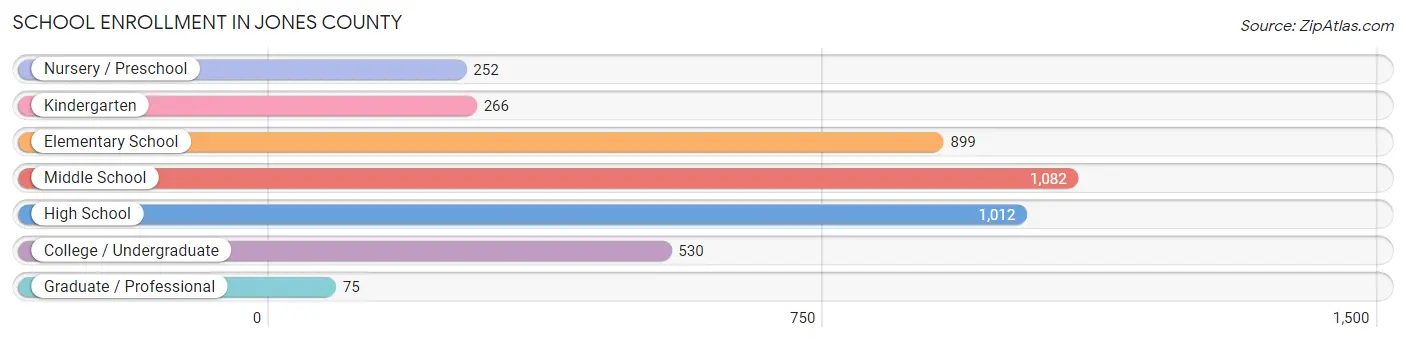
| School Level | # Students | % Students |
| Nursery / Preschool | 252 | 6.1% |
| Kindergarten | 266 | 6.5% |
| Elementary School | 899 | 21.8% |
| Middle School | 1,082 | 26.3% |
| High School | 1,012 | 24.6% |
| College / Undergraduate | 530 | 12.9% |
| Graduate / Professional | 75 | 1.8% |
| Total | 4,116 | 100.0% |
School Enrollment by Age by Funding Source in Jones County
Out of a total of 4,116 students who are enrolled in schools in Jones County, 383 (9.3%) attend a private institution, while the remaining 3,733 (90.7%) are enrolled in public schools. The age group of 25 to 34 year olds has the highest likelihood of being enrolled in private schools, with 77 (54.6% in the age bracket) enrolled. Conversely, the age group of 18 to 19 year olds has the lowest likelihood of being enrolled in a private school, with 222 (100.0% in the age bracket) attending a public institution.
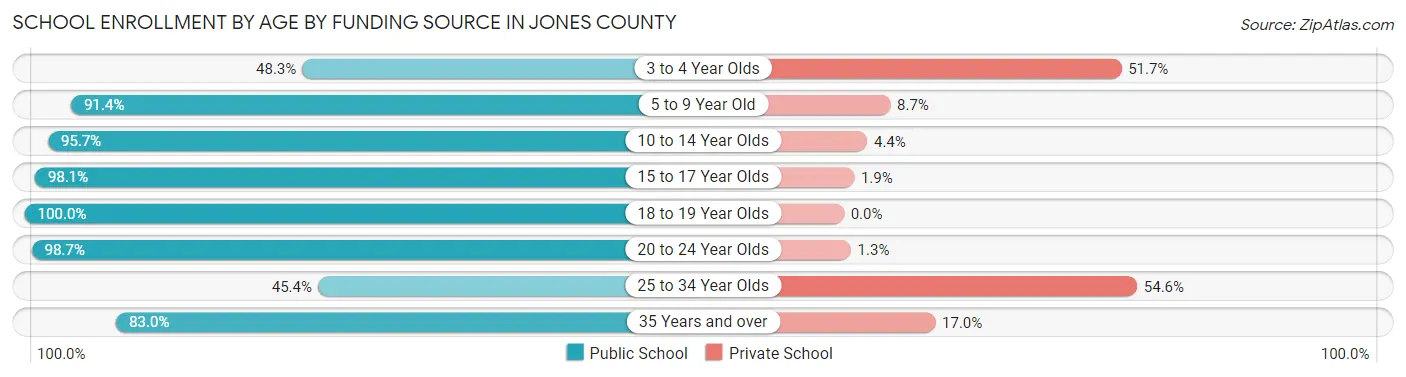
| Age Bracket | Public School | Private School |
| 3 to 4 Year Olds | 100 (48.3%) | 107 (51.7%) |
| 5 to 9 Year Old | 971 (91.3%) | 92 (8.6%) |
| 10 to 14 Year Olds | 1,232 (95.7%) | 56 (4.3%) |
| 15 to 17 Year Olds | 768 (98.1%) | 15 (1.9%) |
| 18 to 19 Year Olds | 222 (100.0%) | 0 (0.0%) |
| 20 to 24 Year Olds | 227 (98.7%) | 3 (1.3%) |
| 25 to 34 Year Olds | 64 (45.4%) | 77 (54.6%) |
| 35 Years and over | 151 (83.0%) | 31 (17.0%) |
| Total | 3,733 (90.7%) | 383 (9.3%) |
Educational Attainment by Field of Study in Jones County
Education (752 | 21.2%), business (589 | 16.6%), science & technology (430 | 12.1%), arts & humanities (416 | 11.7%), and bio, nature & agricultural (293 | 8.3%) are the most common fields of study among 3,544 individuals in Jones County who have obtained a bachelor's degree or higher.
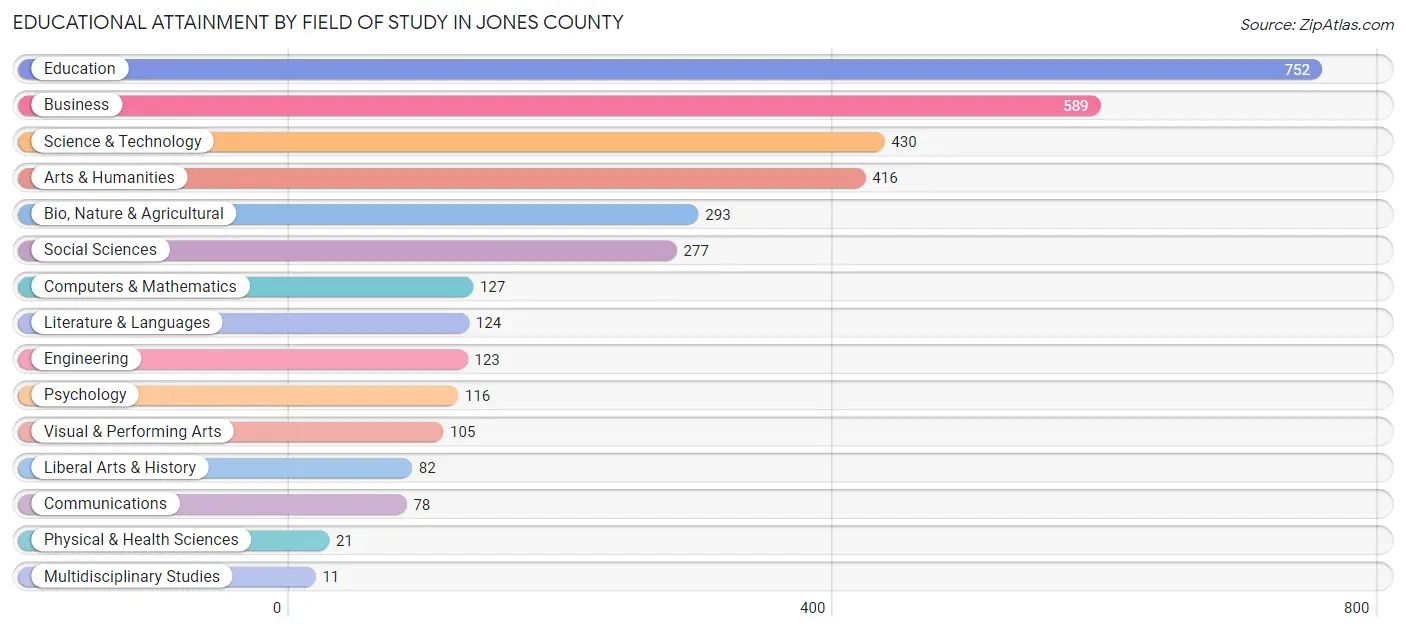
| Field of Study | # Graduates | % Graduates |
| Computers & Mathematics | 127 | 3.6% |
| Bio, Nature & Agricultural | 293 | 8.3% |
| Physical & Health Sciences | 21 | 0.6% |
| Psychology | 116 | 3.3% |
| Social Sciences | 277 | 7.8% |
| Engineering | 123 | 3.5% |
| Multidisciplinary Studies | 11 | 0.3% |
| Science & Technology | 430 | 12.1% |
| Business | 589 | 16.6% |
| Education | 752 | 21.2% |
| Literature & Languages | 124 | 3.5% |
| Liberal Arts & History | 82 | 2.3% |
| Visual & Performing Arts | 105 | 3.0% |
| Communications | 78 | 2.2% |
| Arts & Humanities | 416 | 11.7% |
| Total | 3,544 | 100.0% |
Transportation & Commute in Jones County
Vehicle Availability by Sex in Jones County
The most prevalent vehicle ownership categories in Jones County are males with 2 vehicles (1,883, accounting for 36.4%) and females with 2 vehicles (1,853, making up 41.3%).
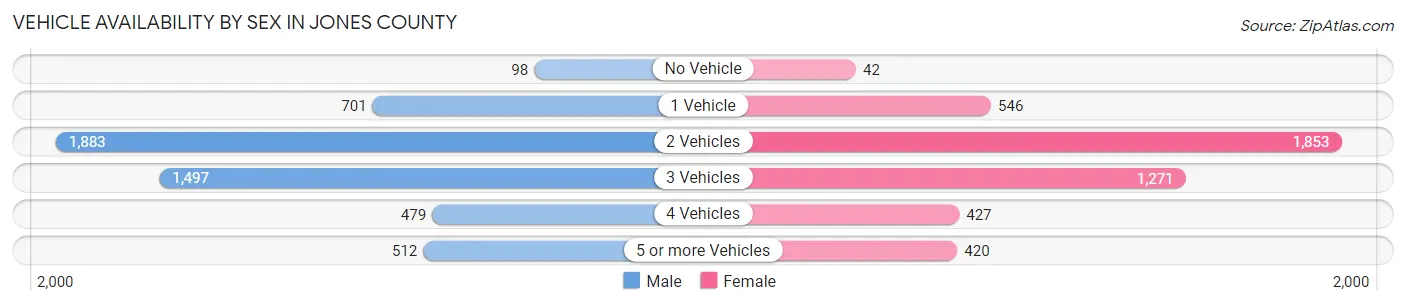
| Vehicles Available | Male | Female |
| No Vehicle | 98 (1.9%) | 42 (0.9%) |
| 1 Vehicle | 701 (13.6%) | 546 (12.0%) |
| 2 Vehicles | 1,883 (36.4%) | 1,853 (40.6%) |
| 3 Vehicles | 1,497 (29.0%) | 1,271 (27.9%) |
| 4 Vehicles | 479 (9.3%) | 427 (9.4%) |
| 5 or more Vehicles | 512 (9.9%) | 420 (9.2%) |
| Total | 5,170 (100.0%) | 4,559 (100.0%) |
Commute Time in Jones County
The most frequently occuring commute durations in Jones County are 5 to 9 minutes (1,609 commuters, 18.5%), 45 to 59 minutes (1,537 commuters, 17.6%), and 15 to 19 minutes (871 commuters, 10.0%).
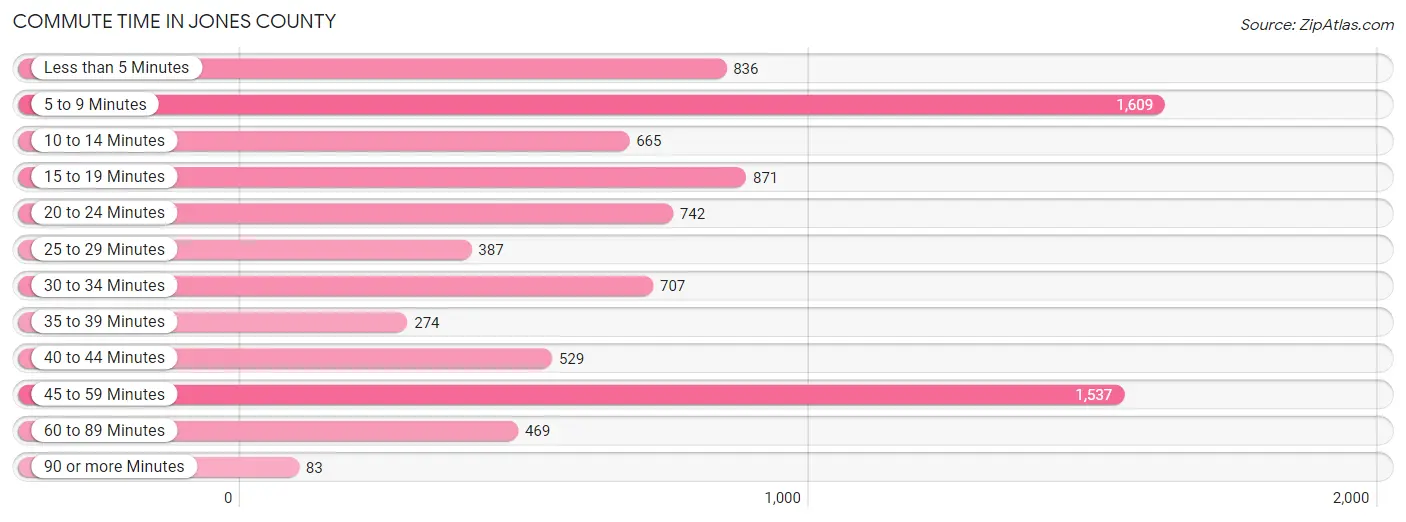
| Commute Time | # Commuters | % Commuters |
| Less than 5 Minutes | 836 | 9.6% |
| 5 to 9 Minutes | 1,609 | 18.5% |
| 10 to 14 Minutes | 665 | 7.6% |
| 15 to 19 Minutes | 871 | 10.0% |
| 20 to 24 Minutes | 742 | 8.5% |
| 25 to 29 Minutes | 387 | 4.4% |
| 30 to 34 Minutes | 707 | 8.1% |
| 35 to 39 Minutes | 274 | 3.2% |
| 40 to 44 Minutes | 529 | 6.1% |
| 45 to 59 Minutes | 1,537 | 17.6% |
| 60 to 89 Minutes | 469 | 5.4% |
| 90 or more Minutes | 83 | 0.9% |
Commute Time by Sex in Jones County
The most common commute times in Jones County are 45 to 59 minutes (916 commuters, 19.9%) for males and 5 to 9 minutes (821 commuters, 20.1%) for females.
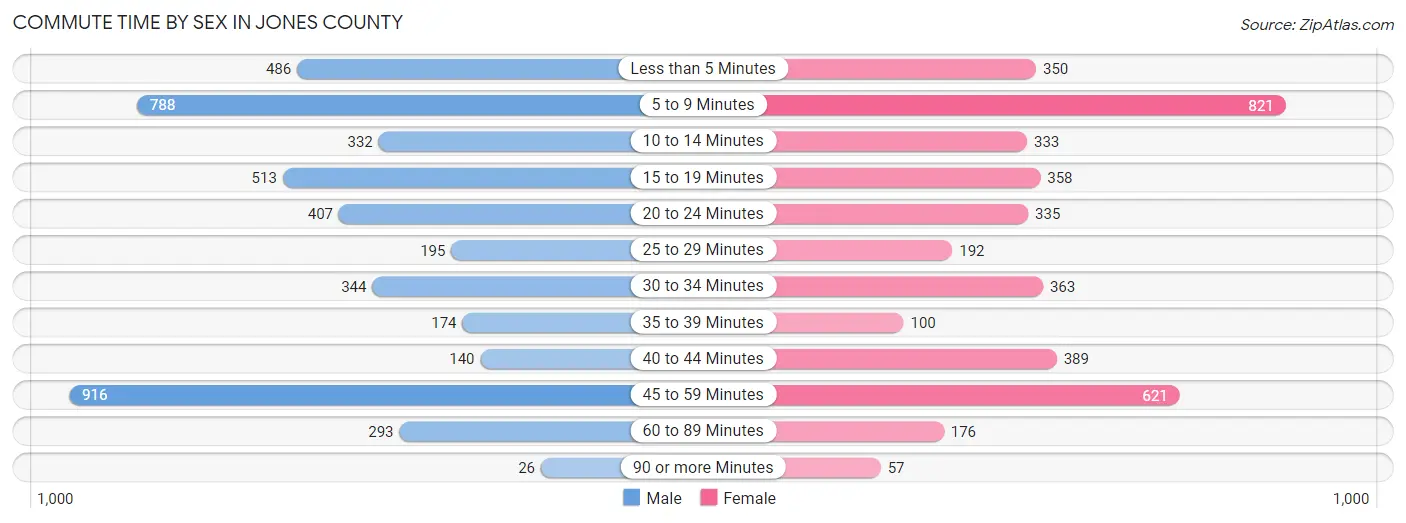
| Commute Time | Male | Female |
| Less than 5 Minutes | 486 (10.5%) | 350 (8.6%) |
| 5 to 9 Minutes | 788 (17.1%) | 821 (20.1%) |
| 10 to 14 Minutes | 332 (7.2%) | 333 (8.1%) |
| 15 to 19 Minutes | 513 (11.1%) | 358 (8.7%) |
| 20 to 24 Minutes | 407 (8.8%) | 335 (8.2%) |
| 25 to 29 Minutes | 195 (4.2%) | 192 (4.7%) |
| 30 to 34 Minutes | 344 (7.5%) | 363 (8.9%) |
| 35 to 39 Minutes | 174 (3.8%) | 100 (2.4%) |
| 40 to 44 Minutes | 140 (3.0%) | 389 (9.5%) |
| 45 to 59 Minutes | 916 (19.9%) | 621 (15.2%) |
| 60 to 89 Minutes | 293 (6.4%) | 176 (4.3%) |
| 90 or more Minutes | 26 (0.6%) | 57 (1.4%) |
Time of Departure to Work by Sex in Jones County
The most frequent times of departure to work in Jones County are 6:30 AM to 6:59 AM (795, 17.2%) for males and 7:30 AM to 7:59 AM (944, 23.1%) for females.
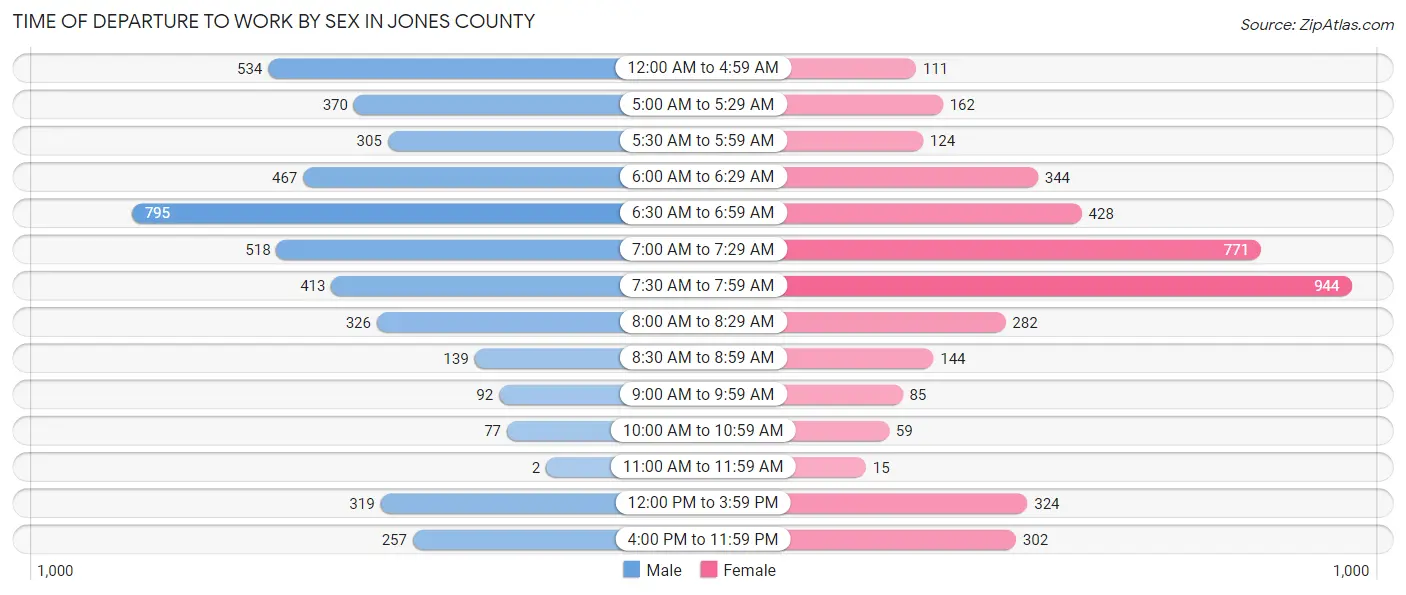
| Time of Departure | Male | Female |
| 12:00 AM to 4:59 AM | 534 (11.6%) | 111 (2.7%) |
| 5:00 AM to 5:29 AM | 370 (8.0%) | 162 (4.0%) |
| 5:30 AM to 5:59 AM | 305 (6.6%) | 124 (3.0%) |
| 6:00 AM to 6:29 AM | 467 (10.1%) | 344 (8.4%) |
| 6:30 AM to 6:59 AM | 795 (17.2%) | 428 (10.4%) |
| 7:00 AM to 7:29 AM | 518 (11.2%) | 771 (18.8%) |
| 7:30 AM to 7:59 AM | 413 (8.9%) | 944 (23.1%) |
| 8:00 AM to 8:29 AM | 326 (7.1%) | 282 (6.9%) |
| 8:30 AM to 8:59 AM | 139 (3.0%) | 144 (3.5%) |
| 9:00 AM to 9:59 AM | 92 (2.0%) | 85 (2.1%) |
| 10:00 AM to 10:59 AM | 77 (1.7%) | 59 (1.4%) |
| 11:00 AM to 11:59 AM | 2 (0.0%) | 15 (0.4%) |
| 12:00 PM to 3:59 PM | 319 (6.9%) | 324 (7.9%) |
| 4:00 PM to 11:59 PM | 257 (5.6%) | 302 (7.4%) |
| Total | 4,614 (100.0%) | 4,095 (100.0%) |
Housing Occupancy in Jones County
Occupancy by Ownership in Jones County
Of the total 8,062 dwellings in Jones County, owner-occupied units account for 6,494 (80.5%), while renter-occupied units make up 1,568 (19.5%).
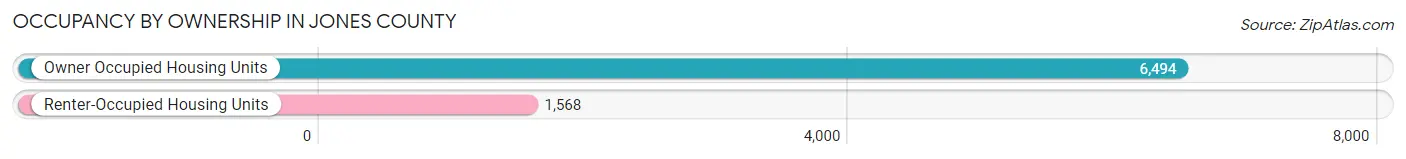
| Occupancy | # Housing Units | % Housing Units |
| Owner Occupied Housing Units | 6,494 | 80.5% |
| Renter-Occupied Housing Units | 1,568 | 19.5% |
| Total Occupied Housing Units | 8,062 | 100.0% |
Occupancy by Household Size in Jones County
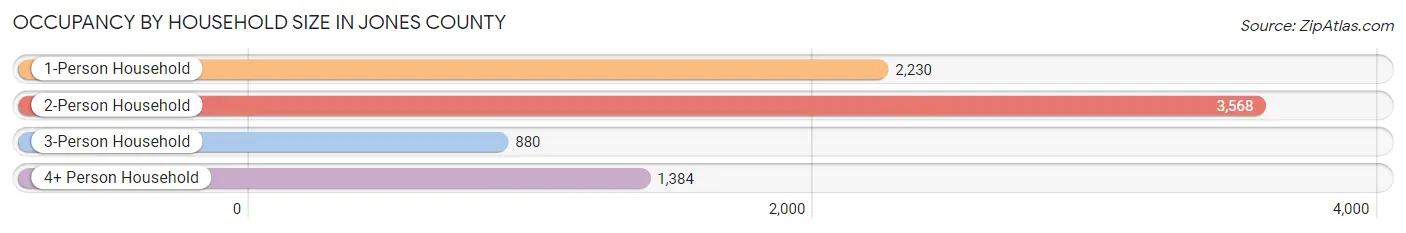
| Household Size | # Housing Units | % Housing Units |
| 1-Person Household | 2,230 | 27.7% |
| 2-Person Household | 3,568 | 44.3% |
| 3-Person Household | 880 | 10.9% |
| 4+ Person Household | 1,384 | 17.2% |
| Total Housing Units | 8,062 | 100.0% |
Occupancy by Ownership by Household Size in Jones County
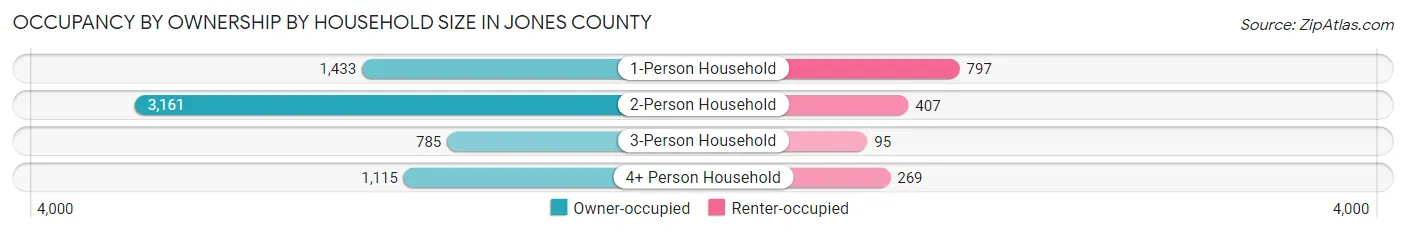
| Household Size | Owner-occupied | Renter-occupied |
| 1-Person Household | 1,433 (64.3%) | 797 (35.7%) |
| 2-Person Household | 3,161 (88.6%) | 407 (11.4%) |
| 3-Person Household | 785 (89.2%) | 95 (10.8%) |
| 4+ Person Household | 1,115 (80.6%) | 269 (19.4%) |
| Total Housing Units | 6,494 (80.5%) | 1,568 (19.5%) |
Occupancy by Educational Attainment in Jones County
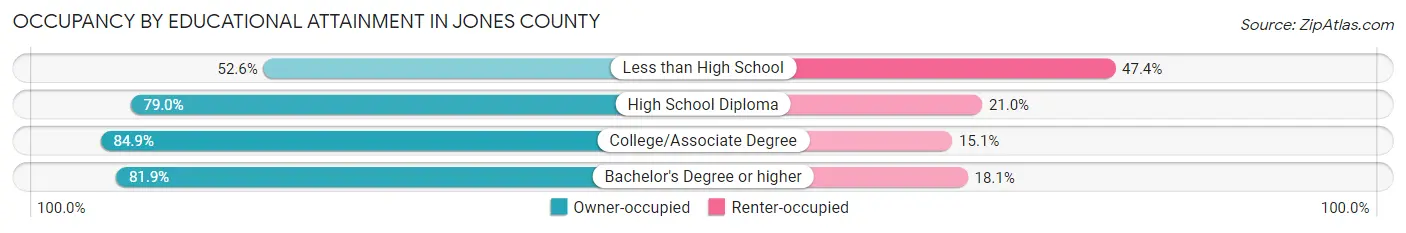
| Household Size | Owner-occupied | Renter-occupied |
| Less than High School | 210 (52.6%) | 189 (47.4%) |
| High School Diploma | 2,208 (79.0%) | 586 (21.0%) |
| College/Associate Degree | 2,476 (84.9%) | 439 (15.1%) |
| Bachelor's Degree or higher | 1,600 (81.9%) | 354 (18.1%) |
Occupancy by Age of Householder in Jones County
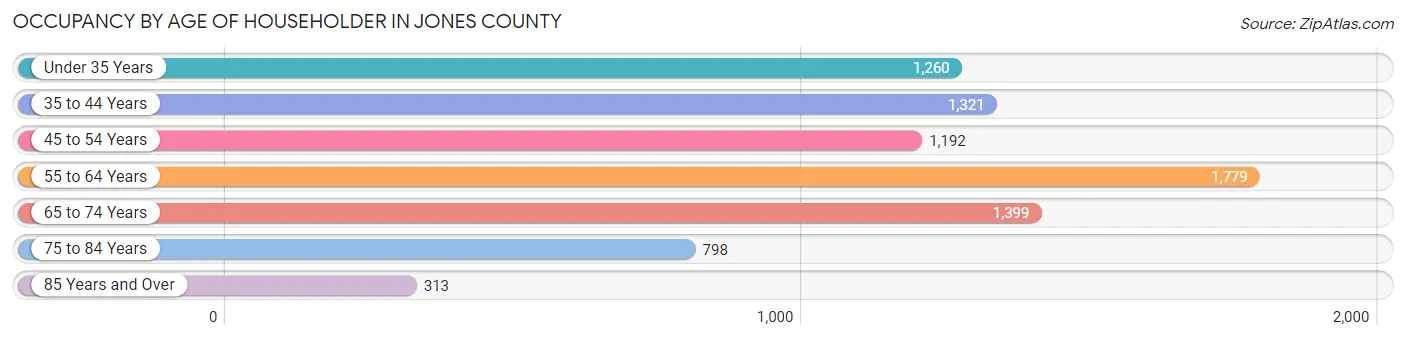
| Age Bracket | # Households | % Households |
| Under 35 Years | 1,260 | 15.6% |
| 35 to 44 Years | 1,321 | 16.4% |
| 45 to 54 Years | 1,192 | 14.8% |
| 55 to 64 Years | 1,779 | 22.1% |
| 65 to 74 Years | 1,399 | 17.3% |
| 75 to 84 Years | 798 | 9.9% |
| 85 Years and Over | 313 | 3.9% |
| Total | 8,062 | 100.0% |
Housing Finances in Jones County
Median Income by Occupancy in Jones County
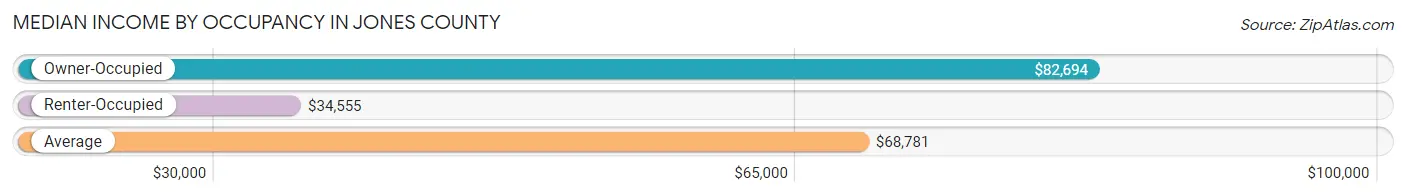
| Occupancy Type | # Households | Median Income |
| Owner-Occupied | 6,494 (80.5%) | $82,694 |
| Renter-Occupied | 1,568 (19.5%) | $34,555 |
| Average | 8,062 (100.0%) | $68,781 |
Occupancy by Householder Income Bracket in Jones County
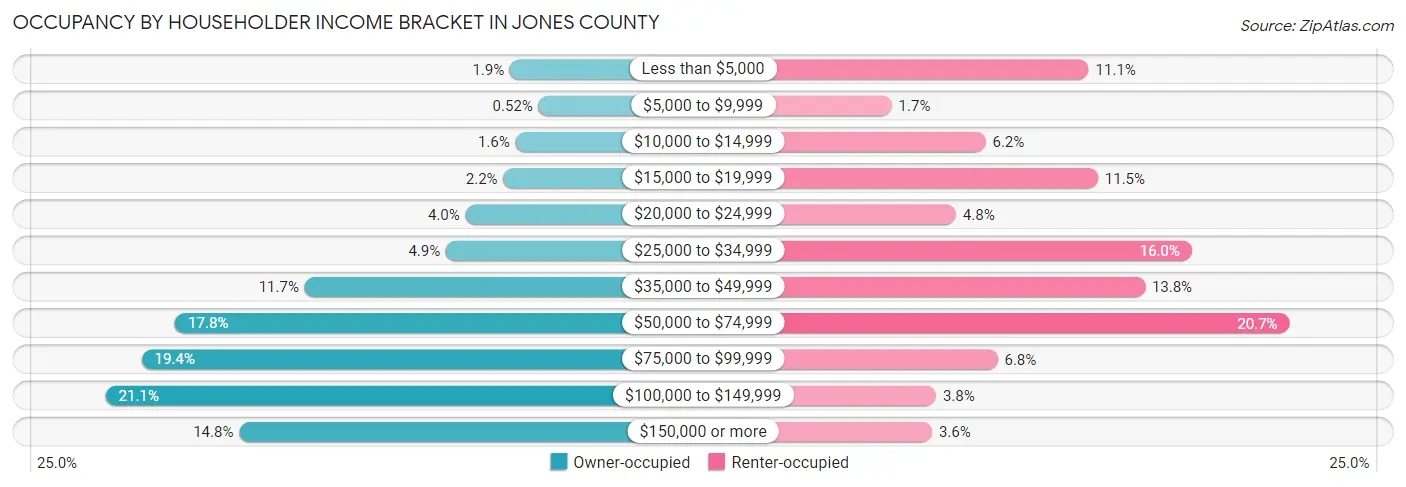
| Income Bracket | Owner-occupied | Renter-occupied |
| Less than $5,000 | 122 (1.9%) | 174 (11.1%) |
| $5,000 to $9,999 | 34 (0.5%) | 27 (1.7%) |
| $10,000 to $14,999 | 105 (1.6%) | 97 (6.2%) |
| $15,000 to $19,999 | 143 (2.2%) | 181 (11.5%) |
| $20,000 to $24,999 | 260 (4.0%) | 75 (4.8%) |
| $25,000 to $34,999 | 320 (4.9%) | 251 (16.0%) |
| $35,000 to $49,999 | 757 (11.7%) | 216 (13.8%) |
| $50,000 to $74,999 | 1,158 (17.8%) | 324 (20.7%) |
| $75,000 to $99,999 | 1,262 (19.4%) | 106 (6.8%) |
| $100,000 to $149,999 | 1,373 (21.1%) | 60 (3.8%) |
| $150,000 or more | 960 (14.8%) | 57 (3.6%) |
| Total | 6,494 (100.0%) | 1,568 (100.0%) |
Monthly Housing Cost Tiers in Jones County
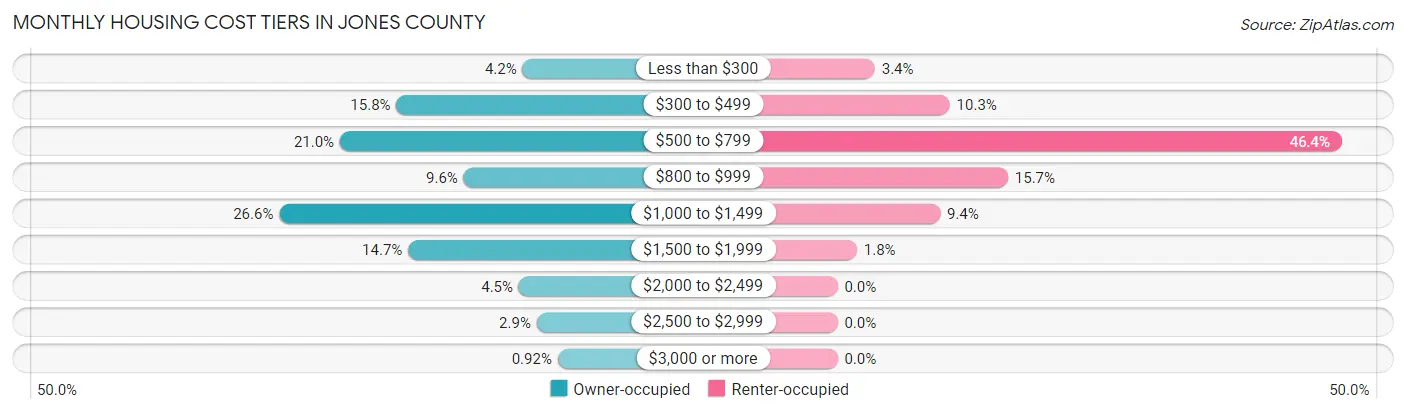
| Monthly Cost | Owner-occupied | Renter-occupied |
| Less than $300 | 270 (4.2%) | 54 (3.4%) |
| $300 to $499 | 1,024 (15.8%) | 162 (10.3%) |
| $500 to $799 | 1,362 (21.0%) | 728 (46.4%) |
| $800 to $999 | 622 (9.6%) | 246 (15.7%) |
| $1,000 to $1,499 | 1,725 (26.6%) | 148 (9.4%) |
| $1,500 to $1,999 | 954 (14.7%) | 28 (1.8%) |
| $2,000 to $2,499 | 292 (4.5%) | 0 (0.0%) |
| $2,500 to $2,999 | 185 (2.9%) | 0 (0.0%) |
| $3,000 or more | 60 (0.9%) | 0 (0.0%) |
| Total | 6,494 (100.0%) | 1,568 (100.0%) |
Physical Housing Characteristics in Jones County
Housing Structures in Jones County
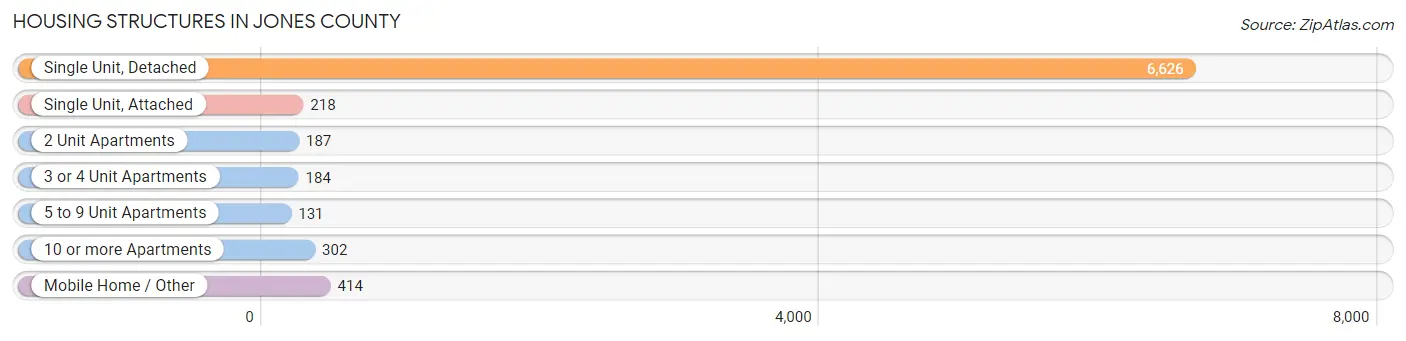
| Structure Type | # Housing Units | % Housing Units |
| Single Unit, Detached | 6,626 | 82.2% |
| Single Unit, Attached | 218 | 2.7% |
| 2 Unit Apartments | 187 | 2.3% |
| 3 or 4 Unit Apartments | 184 | 2.3% |
| 5 to 9 Unit Apartments | 131 | 1.6% |
| 10 or more Apartments | 302 | 3.7% |
| Mobile Home / Other | 414 | 5.1% |
| Total | 8,062 | 100.0% |
Housing Structures by Occupancy in Jones County
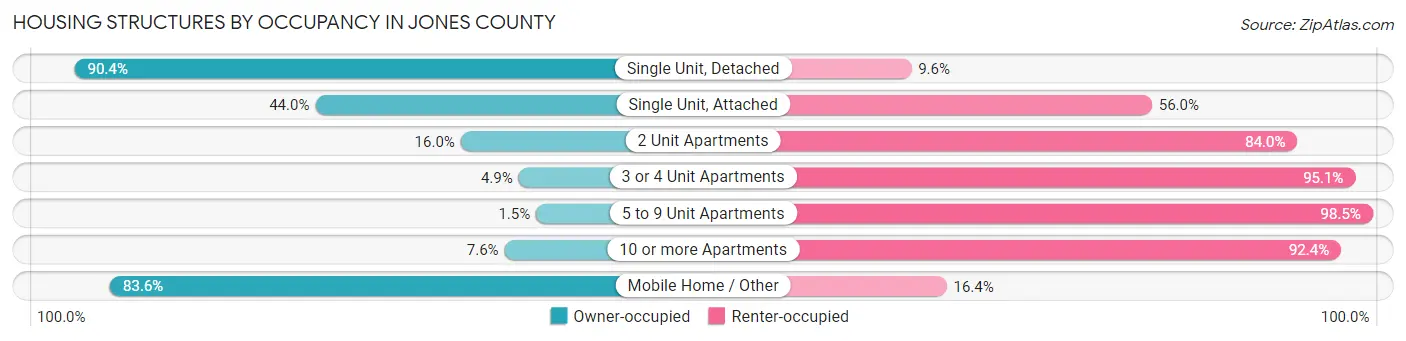
| Structure Type | Owner-occupied | Renter-occupied |
| Single Unit, Detached | 5,988 (90.4%) | 638 (9.6%) |
| Single Unit, Attached | 96 (44.0%) | 122 (56.0%) |
| 2 Unit Apartments | 30 (16.0%) | 157 (84.0%) |
| 3 or 4 Unit Apartments | 9 (4.9%) | 175 (95.1%) |
| 5 to 9 Unit Apartments | 2 (1.5%) | 129 (98.5%) |
| 10 or more Apartments | 23 (7.6%) | 279 (92.4%) |
| Mobile Home / Other | 346 (83.6%) | 68 (16.4%) |
| Total | 6,494 (80.5%) | 1,568 (19.5%) |
Housing Structures by Number of Rooms in Jones County
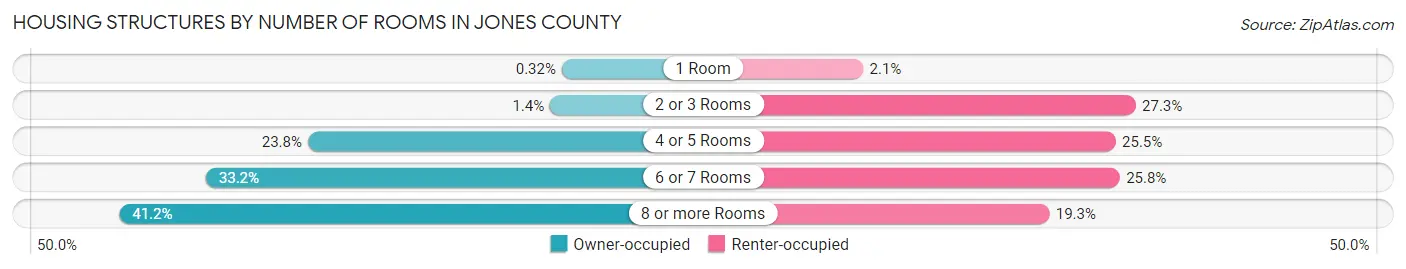
| Number of Rooms | Owner-occupied | Renter-occupied |
| 1 Room | 21 (0.3%) | 33 (2.1%) |
| 2 or 3 Rooms | 91 (1.4%) | 428 (27.3%) |
| 4 or 5 Rooms | 1,546 (23.8%) | 399 (25.5%) |
| 6 or 7 Rooms | 2,158 (33.2%) | 405 (25.8%) |
| 8 or more Rooms | 2,678 (41.2%) | 303 (19.3%) |
| Total | 6,494 (100.0%) | 1,568 (100.0%) |
Housing Structure by Heating Type in Jones County
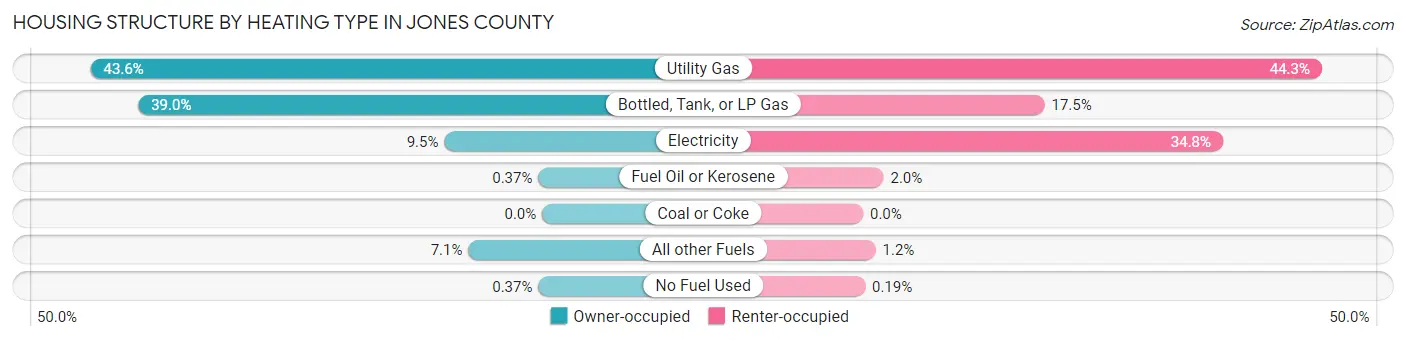
| Heating Type | Owner-occupied | Renter-occupied |
| Utility Gas | 2,834 (43.6%) | 695 (44.3%) |
| Bottled, Tank, or LP Gas | 2,535 (39.0%) | 275 (17.5%) |
| Electricity | 614 (9.5%) | 545 (34.8%) |
| Fuel Oil or Kerosene | 24 (0.4%) | 31 (2.0%) |
| Coal or Coke | 0 (0.0%) | 0 (0.0%) |
| All other Fuels | 463 (7.1%) | 19 (1.2%) |
| No Fuel Used | 24 (0.4%) | 3 (0.2%) |
| Total | 6,494 (100.0%) | 1,568 (100.0%) |
Household Vehicle Usage in Jones County
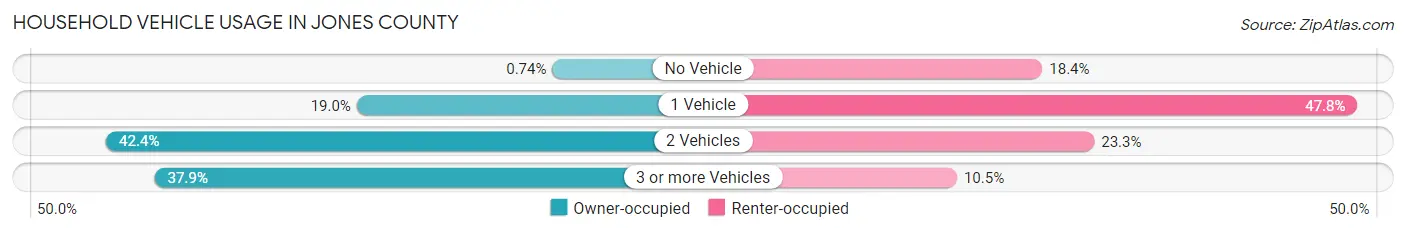
| Vehicles per Household | Owner-occupied | Renter-occupied |
| No Vehicle | 48 (0.7%) | 289 (18.4%) |
| 1 Vehicle | 1,234 (19.0%) | 750 (47.8%) |
| 2 Vehicles | 2,753 (42.4%) | 365 (23.3%) |
| 3 or more Vehicles | 2,459 (37.9%) | 164 (10.5%) |
| Total | 6,494 (100.0%) | 1,568 (100.0%) |
Real Estate & Mortgages in Jones County
Real Estate and Mortgage Overview in Jones County
| Characteristic | Without Mortgage | With Mortgage |
| Housing Units | 2,896 | 3,598 |
| Median Property Value | $144,300 | $179,400 |
| Median Household Income | $67,991 | $595 |
| Monthly Housing Costs | $541 | $50 |
| Real Estate Taxes | $1,923 | $57 |
Property Value by Mortgage Status in Jones County
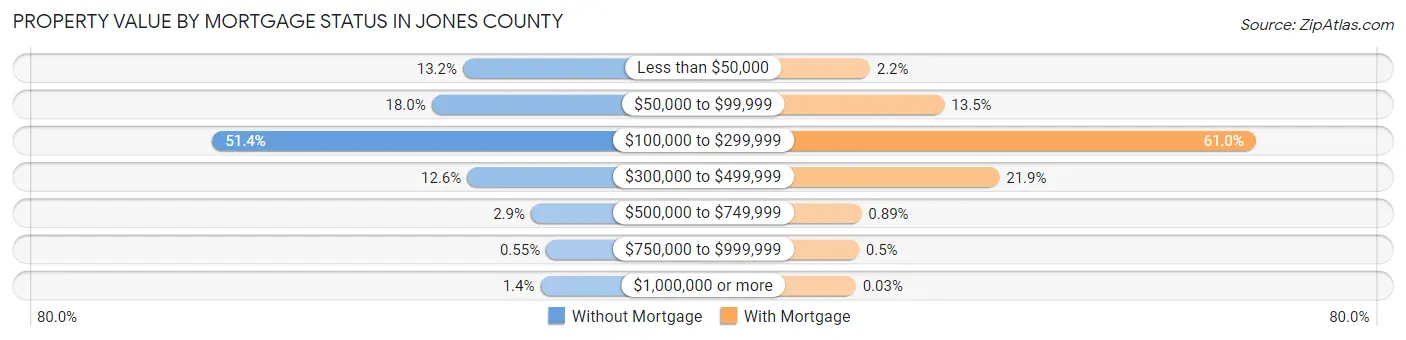
| Property Value | Without Mortgage | With Mortgage |
| Less than $50,000 | 383 (13.2%) | 78 (2.2%) |
| $50,000 to $99,999 | 521 (18.0%) | 487 (13.5%) |
| $100,000 to $299,999 | 1,488 (51.4%) | 2,194 (61.0%) |
| $300,000 to $499,999 | 364 (12.6%) | 788 (21.9%) |
| $500,000 to $749,999 | 83 (2.9%) | 32 (0.9%) |
| $750,000 to $999,999 | 16 (0.5%) | 18 (0.5%) |
| $1,000,000 or more | 41 (1.4%) | 1 (0.0%) |
| Total | 2,896 (100.0%) | 3,598 (100.0%) |
Household Income by Mortgage Status in Jones County
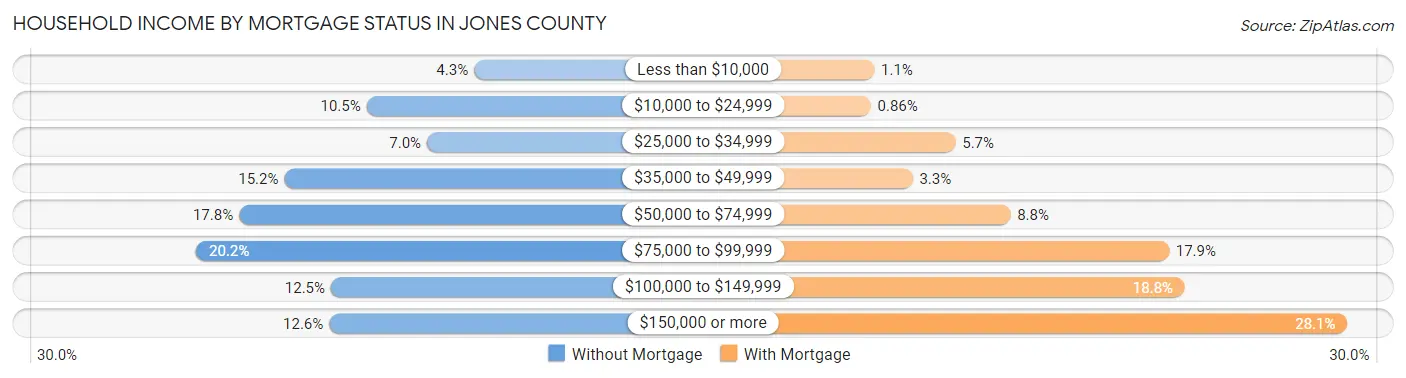
| Household Income | Without Mortgage | With Mortgage |
| Less than $10,000 | 125 (4.3%) | 38 (1.1%) |
| $10,000 to $24,999 | 303 (10.5%) | 31 (0.9%) |
| $25,000 to $34,999 | 203 (7.0%) | 205 (5.7%) |
| $35,000 to $49,999 | 439 (15.2%) | 117 (3.3%) |
| $50,000 to $74,999 | 514 (17.7%) | 318 (8.8%) |
| $75,000 to $99,999 | 585 (20.2%) | 644 (17.9%) |
| $100,000 to $149,999 | 362 (12.5%) | 677 (18.8%) |
| $150,000 or more | 365 (12.6%) | 1,011 (28.1%) |
| Total | 2,896 (100.0%) | 3,598 (100.0%) |
Property Value to Household Income Ratio in Jones County
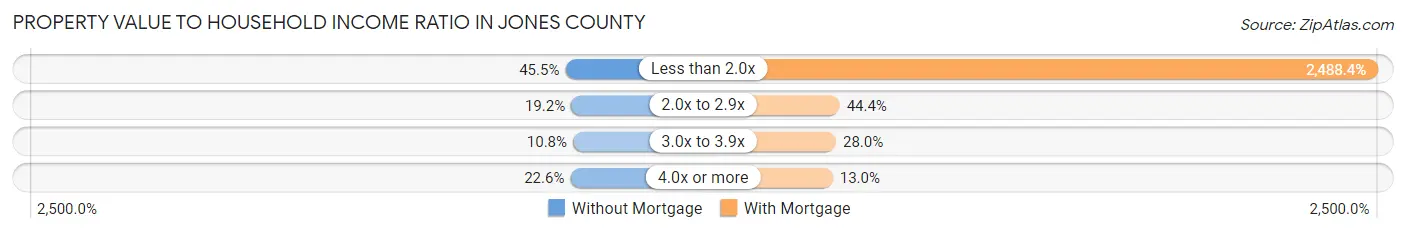
| Value-to-Income Ratio | Without Mortgage | With Mortgage |
| Less than 2.0x | 1,317 (45.5%) | 89,531 (2,488.4%) |
| 2.0x to 2.9x | 557 (19.2%) | 1,596 (44.4%) |
| 3.0x to 3.9x | 313 (10.8%) | 1,008 (28.0%) |
| 4.0x or more | 654 (22.6%) | 467 (13.0%) |
| Total | 2,896 (100.0%) | 3,598 (100.0%) |
Real Estate Taxes by Mortgage Status in Jones County
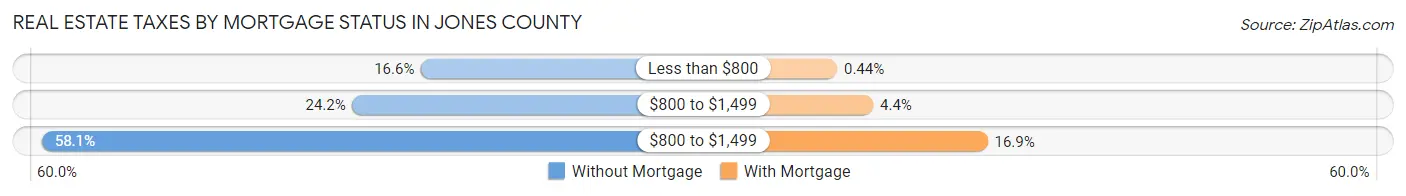
| Property Taxes | Without Mortgage | With Mortgage |
| Less than $800 | 482 (16.6%) | 16 (0.4%) |
| $800 to $1,499 | 700 (24.2%) | 158 (4.4%) |
| $800 to $1,499 | 1,683 (58.1%) | 609 (16.9%) |
| Total | 2,896 (100.0%) | 3,598 (100.0%) |
Health & Disability in Jones County
Health Insurance Coverage by Age in Jones County
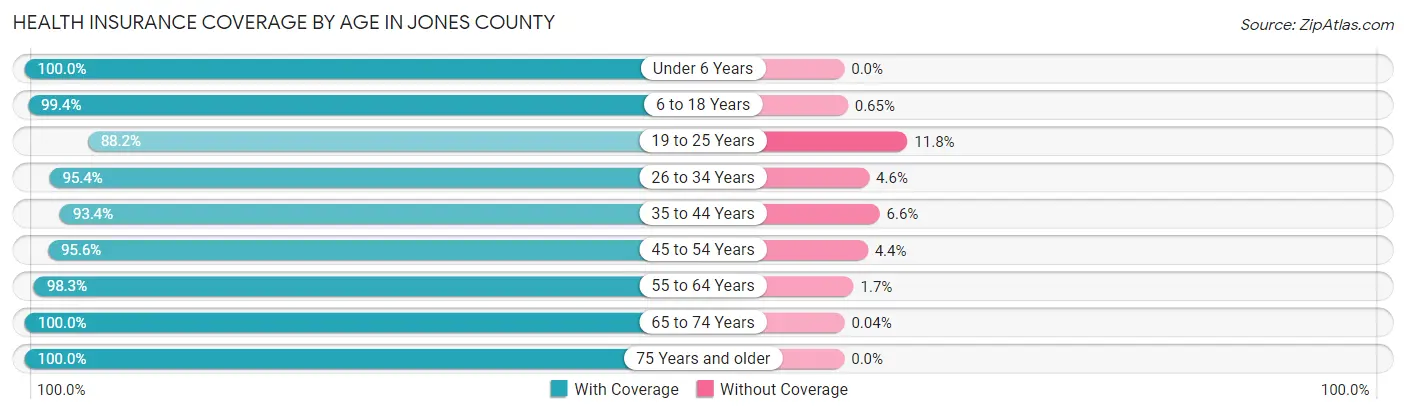
| Age Bracket | With Coverage | Without Coverage |
| Under 6 Years | 1,340 (100.0%) | 0 (0.0%) |
| 6 to 18 Years | 3,206 (99.4%) | 21 (0.6%) |
| 19 to 25 Years | 1,072 (88.2%) | 143 (11.8%) |
| 26 to 34 Years | 1,934 (95.4%) | 94 (4.6%) |
| 35 to 44 Years | 2,199 (93.4%) | 155 (6.6%) |
| 45 to 54 Years | 2,303 (95.6%) | 105 (4.4%) |
| 55 to 64 Years | 2,837 (98.3%) | 50 (1.7%) |
| 65 to 74 Years | 2,393 (100.0%) | 1 (0.0%) |
| 75 Years and older | 1,773 (100.0%) | 0 (0.0%) |
| Total | 19,057 (97.1%) | 569 (2.9%) |
Health Insurance Coverage by Citizenship Status in Jones County
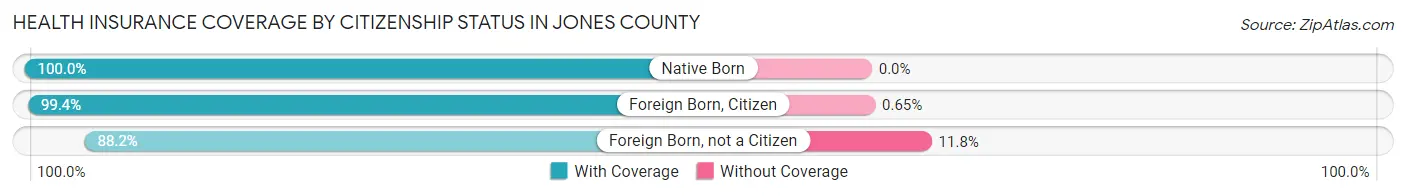
| Citizenship Status | With Coverage | Without Coverage |
| Native Born | 1,340 (100.0%) | 0 (0.0%) |
| Foreign Born, Citizen | 3,206 (99.4%) | 21 (0.6%) |
| Foreign Born, not a Citizen | 1,072 (88.2%) | 143 (11.8%) |
Health Insurance Coverage by Household Income in Jones County
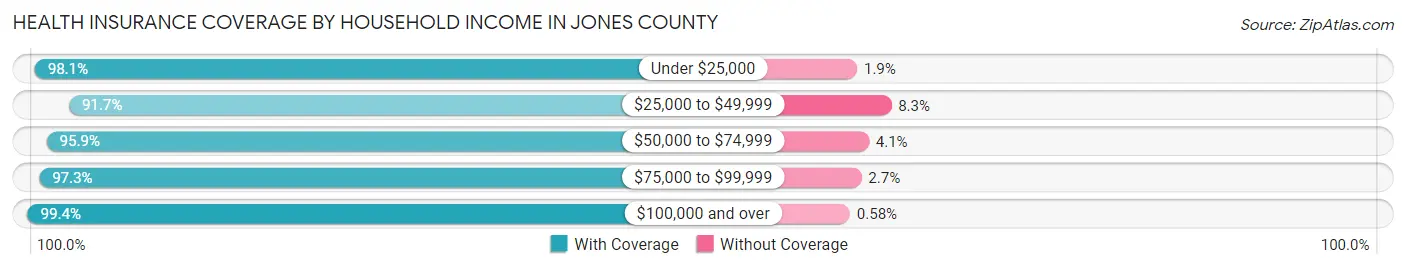
| Household Income | With Coverage | Without Coverage |
| Under $25,000 | 1,987 (98.1%) | 39 (1.9%) |
| $25,000 to $49,999 | 2,731 (91.7%) | 248 (8.3%) |
| $50,000 to $74,999 | 3,299 (95.9%) | 142 (4.1%) |
| $75,000 to $99,999 | 3,414 (97.3%) | 96 (2.7%) |
| $100,000 and over | 7,527 (99.4%) | 44 (0.6%) |
Public vs Private Health Insurance Coverage by Age in Jones County
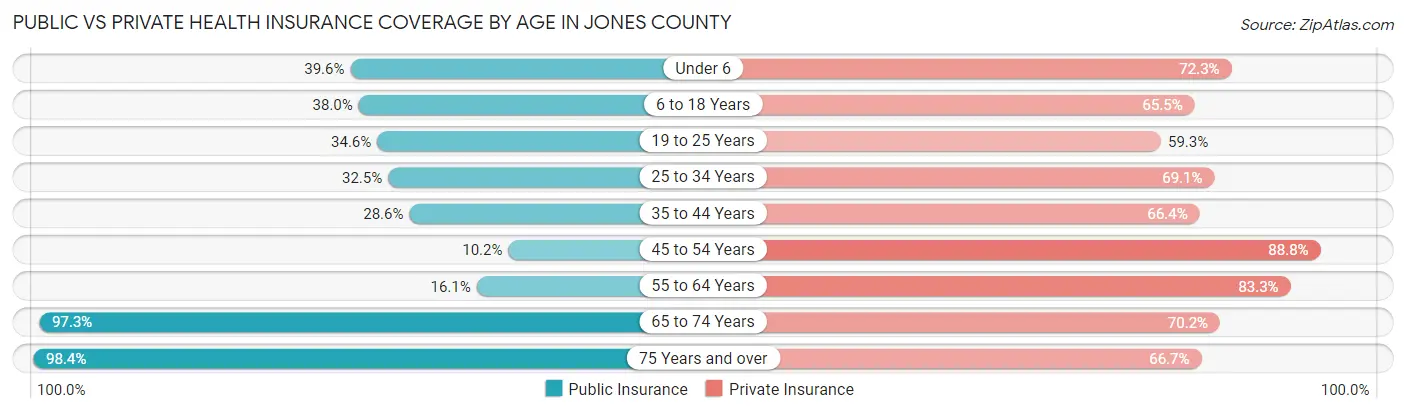
| Age Bracket | Public Insurance | Private Insurance |
| Under 6 | 530 (39.6%) | 969 (72.3%) |
| 6 to 18 Years | 1,227 (38.0%) | 2,113 (65.5%) |
| 19 to 25 Years | 420 (34.6%) | 720 (59.3%) |
| 25 to 34 Years | 660 (32.5%) | 1,402 (69.1%) |
| 35 to 44 Years | 673 (28.6%) | 1,563 (66.4%) |
| 45 to 54 Years | 246 (10.2%) | 2,139 (88.8%) |
| 55 to 64 Years | 465 (16.1%) | 2,404 (83.3%) |
| 65 to 74 Years | 2,330 (97.3%) | 1,680 (70.2%) |
| 75 Years and over | 1,745 (98.4%) | 1,183 (66.7%) |
| Total | 8,296 (42.3%) | 14,173 (72.2%) |
Disability Status by Sex by Age in Jones County
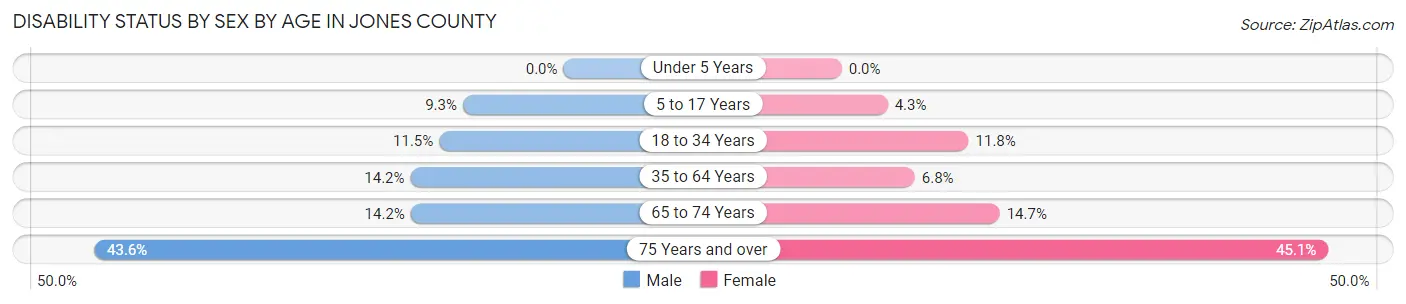
| Age Bracket | Male | Female |
| Under 5 Years | 0 (0.0%) | 0 (0.0%) |
| 5 to 17 Years | 152 (9.3%) | 66 (4.3%) |
| 18 to 34 Years | 219 (11.5%) | 192 (11.8%) |
| 35 to 64 Years | 546 (14.2%) | 258 (6.8%) |
| 65 to 74 Years | 172 (14.2%) | 173 (14.7%) |
| 75 Years and over | 338 (43.6%) | 450 (45.1%) |
Disability Class by Sex by Age in Jones County
Disability Class: Hearing Difficulty
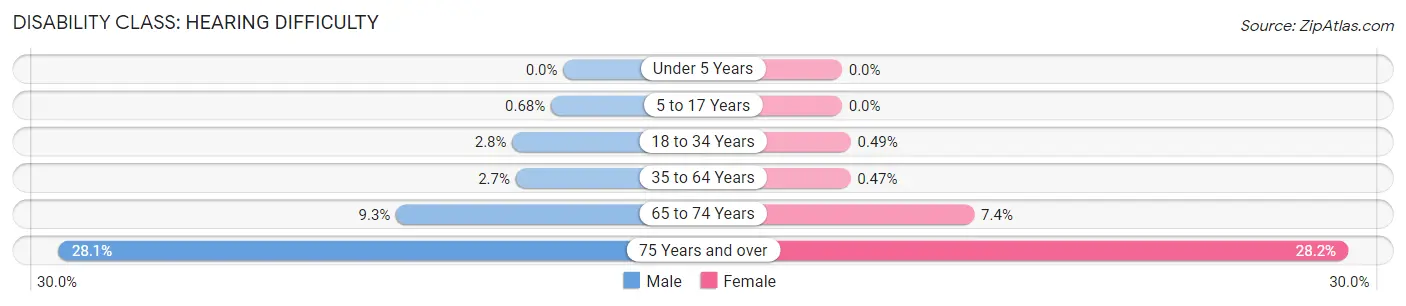
| Age Bracket | Male | Female |
| Under 5 Years | 0 (0.0%) | 0 (0.0%) |
| 5 to 17 Years | 11 (0.7%) | 0 (0.0%) |
| 18 to 34 Years | 54 (2.8%) | 8 (0.5%) |
| 35 to 64 Years | 102 (2.6%) | 18 (0.5%) |
| 65 to 74 Years | 113 (9.3%) | 87 (7.4%) |
| 75 Years and over | 218 (28.1%) | 281 (28.2%) |
Disability Class: Vision Difficulty
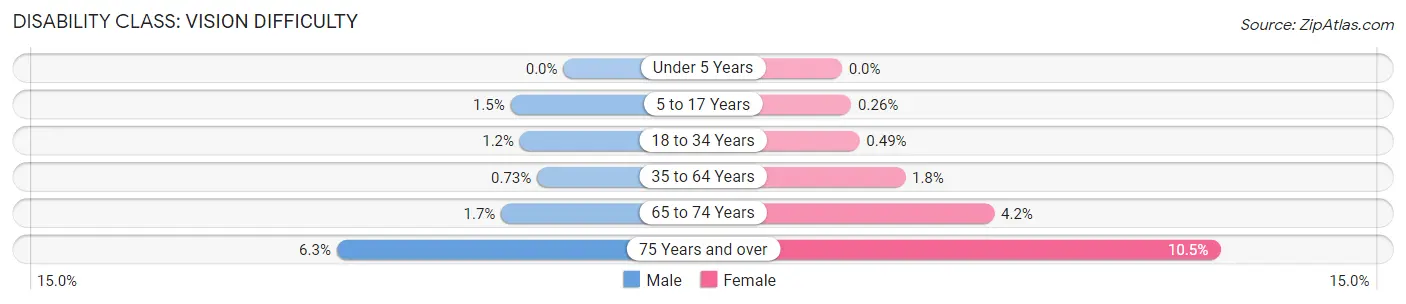
| Age Bracket | Male | Female |
| Under 5 Years | 0 (0.0%) | 0 (0.0%) |
| 5 to 17 Years | 24 (1.5%) | 4 (0.3%) |
| 18 to 34 Years | 23 (1.2%) | 8 (0.5%) |
| 35 to 64 Years | 28 (0.7%) | 67 (1.8%) |
| 65 to 74 Years | 21 (1.7%) | 50 (4.2%) |
| 75 Years and over | 49 (6.3%) | 105 (10.5%) |
Disability Class: Cognitive Difficulty
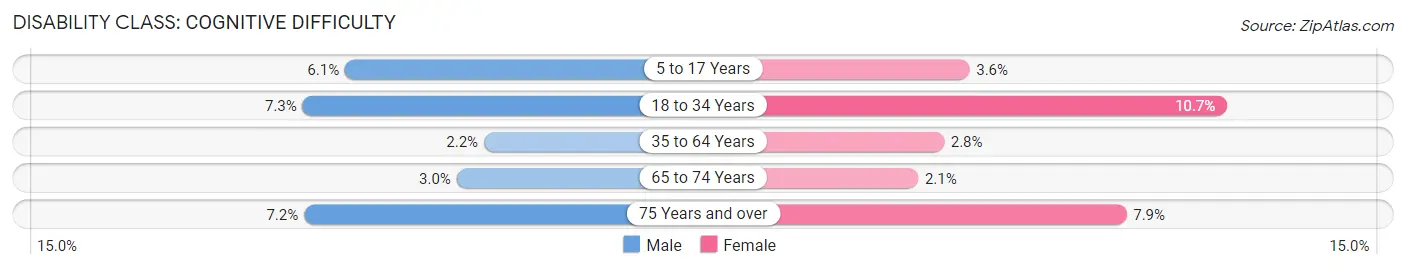
| Age Bracket | Male | Female |
| 5 to 17 Years | 99 (6.1%) | 55 (3.5%) |
| 18 to 34 Years | 138 (7.3%) | 175 (10.7%) |
| 35 to 64 Years | 85 (2.2%) | 108 (2.8%) |
| 65 to 74 Years | 36 (3.0%) | 25 (2.1%) |
| 75 Years and over | 56 (7.2%) | 79 (7.9%) |
Disability Class: Ambulatory Difficulty
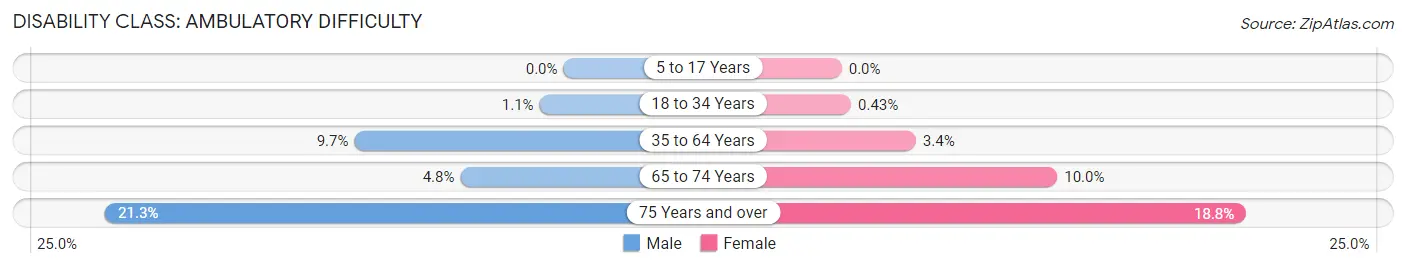
| Age Bracket | Male | Female |
| 5 to 17 Years | 0 (0.0%) | 0 (0.0%) |
| 18 to 34 Years | 21 (1.1%) | 7 (0.4%) |
| 35 to 64 Years | 373 (9.7%) | 131 (3.4%) |
| 65 to 74 Years | 58 (4.8%) | 118 (10.0%) |
| 75 Years and over | 165 (21.3%) | 187 (18.8%) |
Disability Class: Self-Care Difficulty
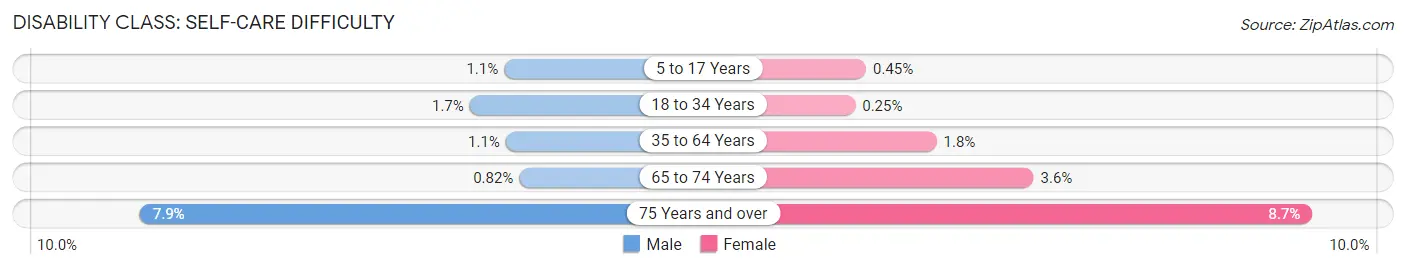
| Age Bracket | Male | Female |
| 5 to 17 Years | 18 (1.1%) | 7 (0.4%) |
| 18 to 34 Years | 33 (1.7%) | 4 (0.3%) |
| 35 to 64 Years | 41 (1.1%) | 67 (1.8%) |
| 65 to 74 Years | 10 (0.8%) | 42 (3.6%) |
| 75 Years and over | 61 (7.9%) | 87 (8.7%) |
Technology Access in Jones County
Computing Device Access in Jones County
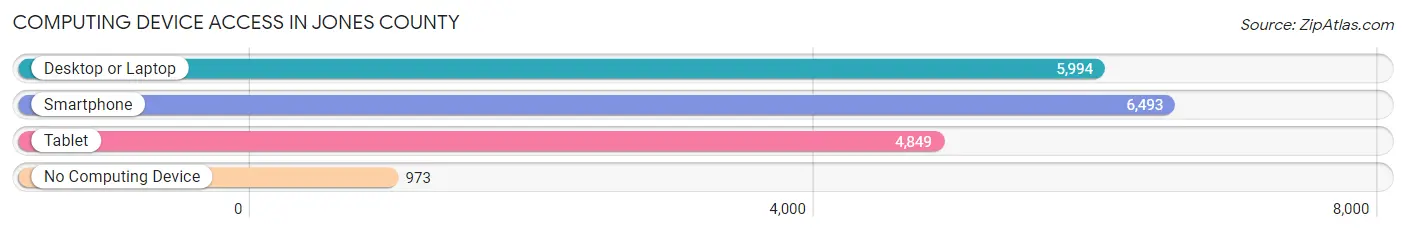
| Device Type | # Households | % Households |
| Desktop or Laptop | 5,994 | 74.4% |
| Smartphone | 6,493 | 80.5% |
| Tablet | 4,849 | 60.2% |
| No Computing Device | 973 | 12.1% |
| Total | 8,062 | 100.0% |
Internet Access in Jones County
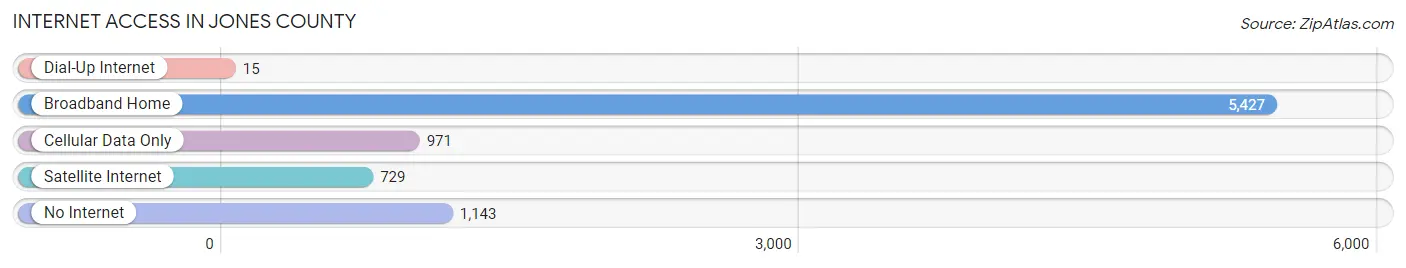
| Internet Type | # Households | % Households |
| Dial-Up Internet | 15 | 0.2% |
| Broadband Home | 5,427 | 67.3% |
| Cellular Data Only | 971 | 12.0% |
| Satellite Internet | 729 | 9.0% |
| No Internet | 1,143 | 14.2% |
| Total | 8,062 | 100.0% |
Jones County Summary
Jones County is located in the state of Iowa in the United States. It is bordered by Cedar, Clinton, Jackson, and Linn counties. The county seat is Anamosa, and the largest city is Monticello. As of the 2010 census, the population was 20,638.
Geography
Jones County is located in east-central Iowa, and is part of the Cedar Rapids Metropolitan Statistical Area. The county has a total area of 576 square miles, of which 573 square miles is land and 3.2 square miles is water. The Wapsipinicon River flows through the county, and the Maquoketa River forms the county's western border. The county is mostly rolling hills and valleys, with some flat areas in the north and south.
The county is home to several state parks, including Backbone State Park, which is the oldest state park in Iowa. The park is located in the northeast corner of the county and is known for its rugged terrain and scenic views. Other parks in the county include the Maquoketa Caves State Park, which is located in the northwest corner of the county and is known for its limestone caves and hiking trails, and the Jones County State Forest, which is located in the south-central part of the county and is known for its hiking trails and camping sites.
Economy
Jones County has a diverse economy, with a mix of agriculture, manufacturing, and services. The county is home to several large employers, including the Anamosa State Penitentiary, which is the largest employer in the county. Other major employers include the Jones County Regional Medical Center, the Jones County Fairgrounds, and the Jones County Courthouse.
Agriculture is a major part of the county's economy, with corn, soybeans, and hay being the main crops. Livestock production is also important, with beef cattle, dairy cows, and hogs being the main animals raised.
Manufacturing is also an important part of the county's economy, with several large companies located in the county. These include the Anamosa Foundry, which produces cast iron products, and the Anamosa Machine Works, which produces agricultural and industrial machinery.
Demographics
As of the 2010 census, the population of Jones County was 20,638. The population was spread out, with 49.3% male and 50.7% female. The median age was 40.2 years. The racial makeup of the county was 97.2% White, 0.7% African American, 0.3% Native American, 0.4% Asian, 0.1% Pacific Islander, 0.5% from other races, and 0.8% from two or more races. Hispanic or Latino of any race were 1.7% of the population.
The median household income was $50,945, and the median family income was $60,945. The per capita income was $24,945. About 8.2% of families and 10.7% of the population were below the poverty line, including 14.2% of those under age 18 and 6.2% of those age 65 or over.
Conclusion
Jones County is a diverse county located in east-central Iowa. It is home to several state parks, and has a mix of agriculture, manufacturing, and services that make up its economy. The population of the county is mostly white, with a median age of 40.2 years and a median household income of $50,945. Jones County is a great place to live and work, and offers a variety of activities and attractions for residents and visitors alike.
Common Questions
What is Per Capita Income in Jones County?
Per Capita income in Jones County is $33,996.
What is the Median Family Income in Jones County?
Median Family Income in Jones County is $88,862.
What is the Median Household income in Jones County?
Median Household Income in Jones County is $68,781.
What is Income or Wage Gap in Jones County?
Income or Wage Gap in Jones County is 26.4%.
Women in Jones County earn 73.6 cents for every dollar earned by a man.
What is Family Income Deficit in Jones County?
Family Income Deficit in Jones County is $12,627.
Families that are below poverty line in Jones County earn $12,627 less on average than the poverty threshold level.
What is Inequality or Gini Index in Jones County?
Inequality or Gini Index in Jones County is 0.40.
What is the Total Population of Jones County?
Total Population of Jones County is 20,733.
What is the Total Male Population of Jones County?
Total Male Population of Jones County is 10,828.
What is the Total Female Population of Jones County?
Total Female Population of Jones County is 9,905.
What is the Ratio of Males per 100 Females in Jones County?
There are 109.32 Males per 100 Females in Jones County.
What is the Ratio of Females per 100 Males in Jones County?
There are 91.48 Females per 100 Males in Jones County.
What is the Median Population Age in Jones County?
Median Population Age in Jones County is 43.4 Years.
What is the Average Family Size in Jones County
Average Family Size in Jones County is 2.9 People.
What is the Average Household Size in Jones County
Average Household Size in Jones County is 2.4 People.
How Large is the Labor Force in Jones County?
There are 10,343 People in the Labor Forcein in Jones County.
What is the Percentage of People in the Labor Force in Jones County?
61.0% of People are in the Labor Force in Jones County.
What is the Unemployment Rate in Jones County?
Unemployment Rate in Jones County is 3.1%.