Muscatine County, IA Map & Demographics
Muscatine County Map
Muscatine County Overview
$34,055
PER CAPITA INCOME
$82,076
AVG FAMILY INCOME
$67,427
AVG HOUSEHOLD INCOME
32.8%
WAGE / INCOME GAP [ % ]
67.2¢/ $1
WAGE / INCOME GAP [ $ ]
$12,188
FAMILY INCOME DEFICIT
0.41
INEQUALITY / GINI INDEX
42,968
TOTAL POPULATION
21,552
MALE POPULATION
21,416
FEMALE POPULATION
100.64
MALES / 100 FEMALES
99.37
FEMALES / 100 MALES
38.6
MEDIAN AGE
3.0
AVG FAMILY SIZE
2.5
AVG HOUSEHOLD SIZE
22,128
LABOR FORCE [ PEOPLE ]
65.3%
PERCENT IN LABOR FORCE
3.5%
UNEMPLOYMENT RATE
Income in Muscatine County
Income Overview in Muscatine County
Per Capita Income in Muscatine County is $34,055, while median incomes of families and households are $82,076 and $67,427 respectively.
| Characteristic | Number | Measure |
| Per Capita Income | 42,968 | $34,055 |
| Median Family Income | 11,460 | $82,076 |
| Mean Family Income | 11,460 | $97,482 |
| Median Household Income | 17,075 | $67,427 |
| Mean Household Income | 17,075 | $84,799 |
| Income Deficit | 11,460 | $12,188 |
| Wage / Income Gap (%) | 42,968 | 32.79% |
| Wage / Income Gap ($) | 42,968 | 67.21¢ per $1 |
| Gini / Inequality Index | 42,968 | 0.41 |
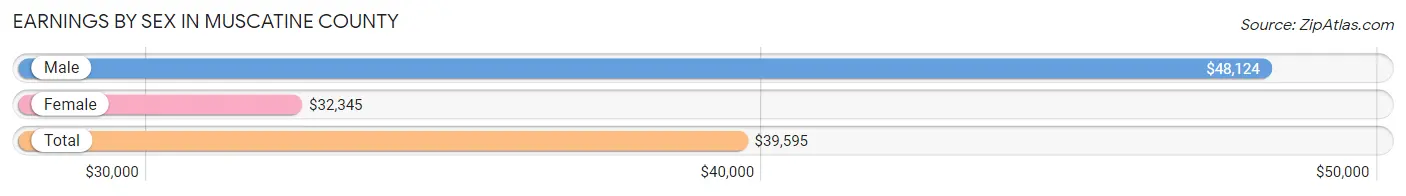
Earnings by Sex in Muscatine County
Average Earnings in Muscatine County are $39,595, $48,124 for men and $32,345 for women, a difference of 32.8%.
| Sex | Number | Average Earnings |
| Male | 12,606 (53.6%) | $48,124 |
| Female | 10,892 (46.4%) | $32,345 |
| Total | 23,498 (100.0%) | $39,595 |
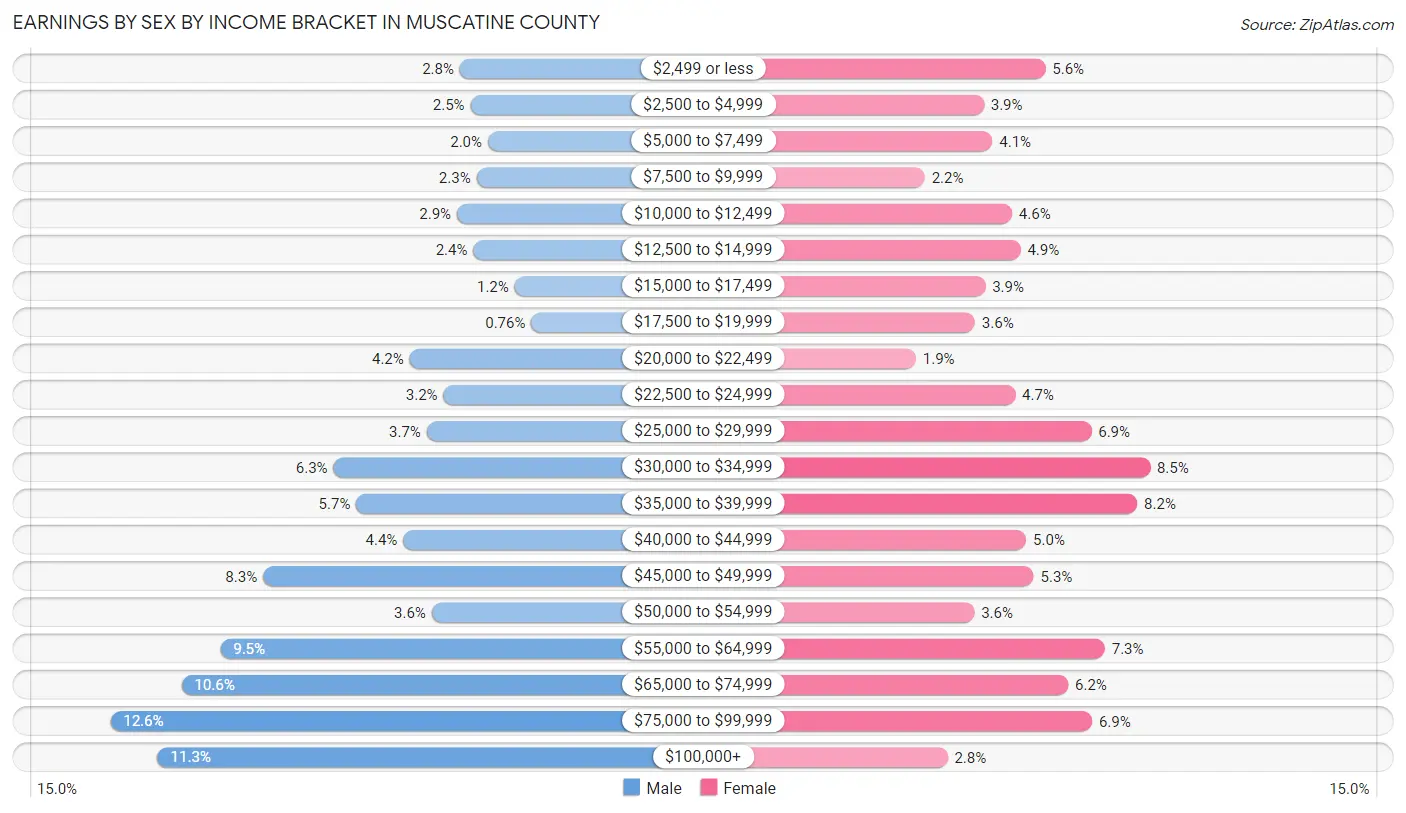
Earnings by Sex by Income Bracket in Muscatine County
The most common earnings brackets in Muscatine County are $75,000 to $99,999 for men (1,587 | 12.6%) and $30,000 to $34,999 for women (928 | 8.5%).
| Income | Male | Female |
| $2,499 or less | 349 (2.8%) | 608 (5.6%) |
| $2,500 to $4,999 | 311 (2.5%) | 419 (3.8%) |
| $5,000 to $7,499 | 249 (2.0%) | 445 (4.1%) |
| $7,500 to $9,999 | 290 (2.3%) | 239 (2.2%) |
| $10,000 to $12,499 | 359 (2.9%) | 505 (4.6%) |
| $12,500 to $14,999 | 301 (2.4%) | 531 (4.9%) |
| $15,000 to $17,499 | 155 (1.2%) | 424 (3.9%) |
| $17,500 to $19,999 | 96 (0.8%) | 392 (3.6%) |
| $20,000 to $22,499 | 527 (4.2%) | 211 (1.9%) |
| $22,500 to $24,999 | 407 (3.2%) | 515 (4.7%) |
| $25,000 to $29,999 | 467 (3.7%) | 748 (6.9%) |
| $30,000 to $34,999 | 797 (6.3%) | 928 (8.5%) |
| $35,000 to $39,999 | 716 (5.7%) | 889 (8.2%) |
| $40,000 to $44,999 | 549 (4.4%) | 549 (5.0%) |
| $45,000 to $49,999 | 1,046 (8.3%) | 572 (5.2%) |
| $50,000 to $54,999 | 449 (3.6%) | 390 (3.6%) |
| $55,000 to $64,999 | 1,197 (9.5%) | 790 (7.2%) |
| $65,000 to $74,999 | 1,335 (10.6%) | 678 (6.2%) |
| $75,000 to $99,999 | 1,587 (12.6%) | 751 (6.9%) |
| $100,000+ | 1,419 (11.3%) | 308 (2.8%) |
| Total | 12,606 (100.0%) | 10,892 (100.0%) |
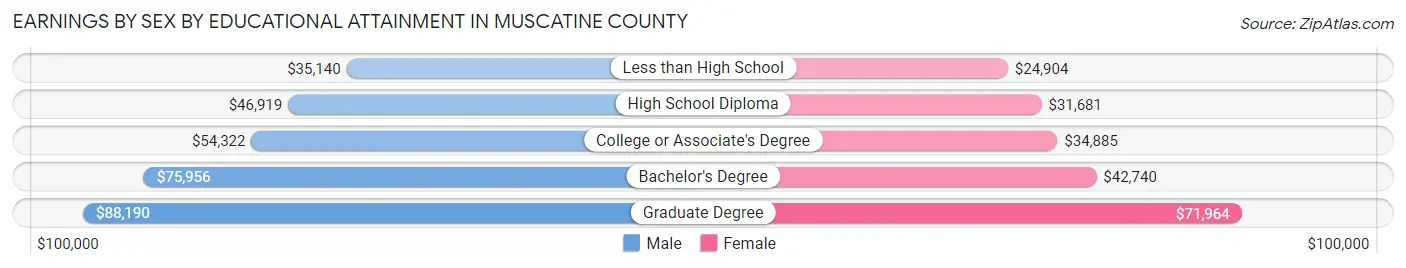
Earnings by Sex by Educational Attainment in Muscatine County
Average earnings in Muscatine County are $54,059 for men and $35,942 for women, a difference of 33.5%. Men with an educational attainment of graduate degree enjoy the highest average annual earnings of $88,190, while those with less than high school education earn the least with $35,140. Women with an educational attainment of graduate degree earn the most with the average annual earnings of $71,964, while those with less than high school education have the smallest earnings of $24,904.
| Educational Attainment | Male Income | Female Income |
| Less than High School | $35,140 | $24,904 |
| High School Diploma | $46,919 | $31,681 |
| College or Associate's Degree | $54,322 | $34,885 |
| Bachelor's Degree | $75,956 | $42,740 |
| Graduate Degree | $88,190 | $71,964 |
| Total | $54,059 | $35,942 |
Family Income in Muscatine County
Family Income Brackets in Muscatine County
According to the Muscatine County family income data, there are 2,808 families falling into the $100,000 to $149,999 income range, which is the most common income bracket and makes up 24.5% of all families. Conversely, the less than $10,000 income bracket is the least frequent group with only 321 families (2.8%) belonging to this category.
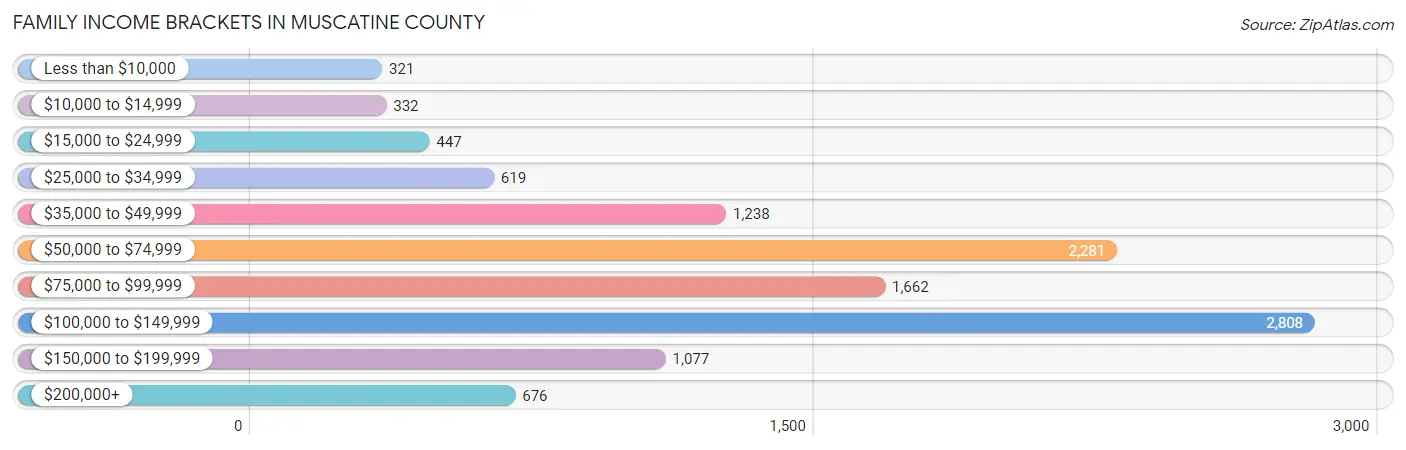
| Income Bracket | # Families | % Families |
| Less than $10,000 | 321 | 2.8% |
| $10,000 to $14,999 | 332 | 2.9% |
| $15,000 to $24,999 | 447 | 3.9% |
| $25,000 to $34,999 | 619 | 5.4% |
| $35,000 to $49,999 | 1,238 | 10.8% |
| $50,000 to $74,999 | 2,281 | 19.9% |
| $75,000 to $99,999 | 1,662 | 14.5% |
| $100,000 to $149,999 | 2,808 | 24.5% |
| $150,000 to $199,999 | 1,077 | 9.4% |
| $200,000+ | 676 | 5.9% |
Family Income by Famaliy Size in Muscatine County
4-person families (1,774 | 15.5%) account for the highest median family income in Muscatine County with $109,861 per family, while 2-person families (5,391 | 47.0%) have the highest median income of $36,378 per family member.
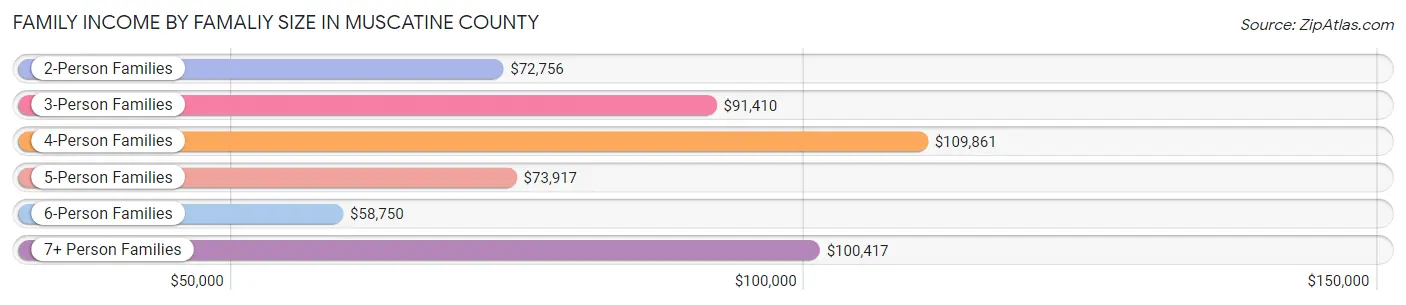
| Income Bracket | # Families | Median Income |
| 2-Person Families | 5,391 (47.0%) | $72,756 |
| 3-Person Families | 2,521 (22.0%) | $91,410 |
| 4-Person Families | 1,774 (15.5%) | $109,861 |
| 5-Person Families | 1,171 (10.2%) | $73,917 |
| 6-Person Families | 445 (3.9%) | $58,750 |
| 7+ Person Families | 158 (1.4%) | $100,417 |
| Total | 11,460 (100.0%) | $82,076 |
Family Income by Number of Earners in Muscatine County
The median family income in Muscatine County is $82,076, with families comprising 3+ earners (1,597) having the highest median family income of $117,782, while families with no earners (1,449) have the lowest median family income of $47,232, accounting for 13.9% and 12.6% of families, respectively.
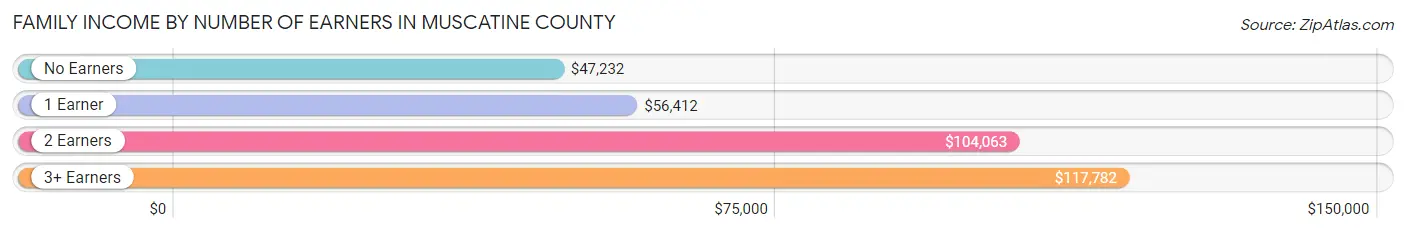
| Number of Earners | # Families | Median Income |
| No Earners | 1,449 (12.6%) | $47,232 |
| 1 Earner | 3,665 (32.0%) | $56,412 |
| 2 Earners | 4,749 (41.4%) | $104,063 |
| 3+ Earners | 1,597 (13.9%) | $117,782 |
| Total | 11,460 (100.0%) | $82,076 |
Household Income in Muscatine County
Household Income Brackets in Muscatine County
With 3,449 households falling in the category, the $100,000 to $149,999 income range is the most frequent in Muscatine County, accounting for 20.2% of all households. In contrast, only 581 households (3.4%) fall into the less than $10,000 income bracket, making it the least populous group.
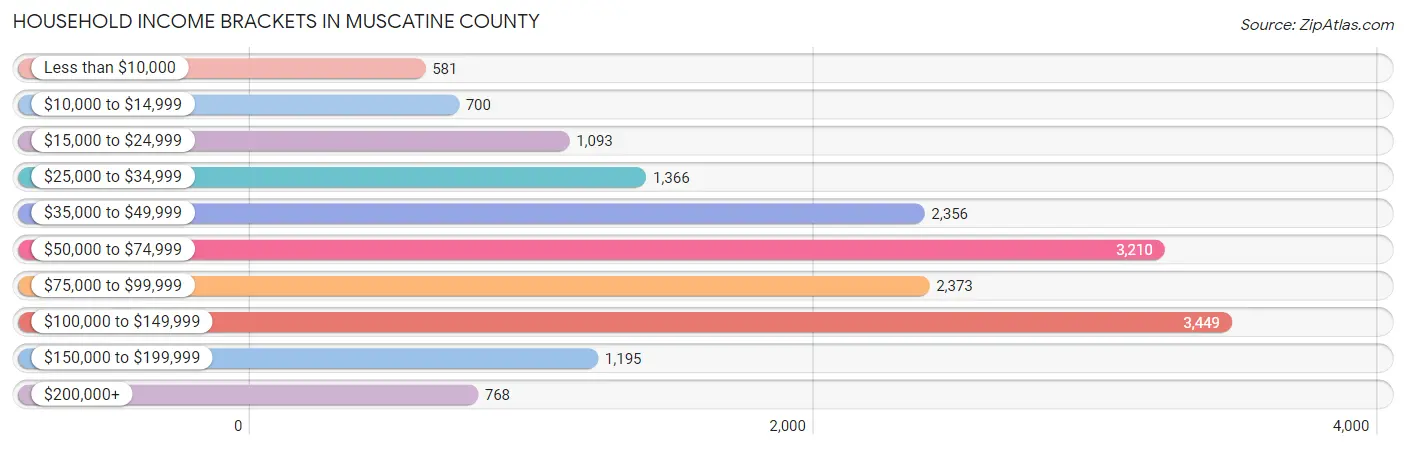
| Income Bracket | # Households | % Households |
| Less than $10,000 | 581 | 3.4% |
| $10,000 to $14,999 | 700 | 4.1% |
| $15,000 to $24,999 | 1,093 | 6.4% |
| $25,000 to $34,999 | 1,366 | 8.0% |
| $35,000 to $49,999 | 2,356 | 13.8% |
| $50,000 to $74,999 | 3,210 | 18.8% |
| $75,000 to $99,999 | 2,373 | 13.9% |
| $100,000 to $149,999 | 3,449 | 20.2% |
| $150,000 to $199,999 | 1,195 | 7.0% |
| $200,000+ | 768 | 4.5% |
Household Income by Householder Age in Muscatine County
The median household income in Muscatine County is $67,427, with the highest median household income of $83,854 found in the 45 to 64 years age bracket for the primary householder. A total of 6,270 households (36.7%) fall into this category. Meanwhile, the 65+ years age bracket for the primary householder has the lowest median household income of $52,014, with 4,699 households (27.5%) in this group.
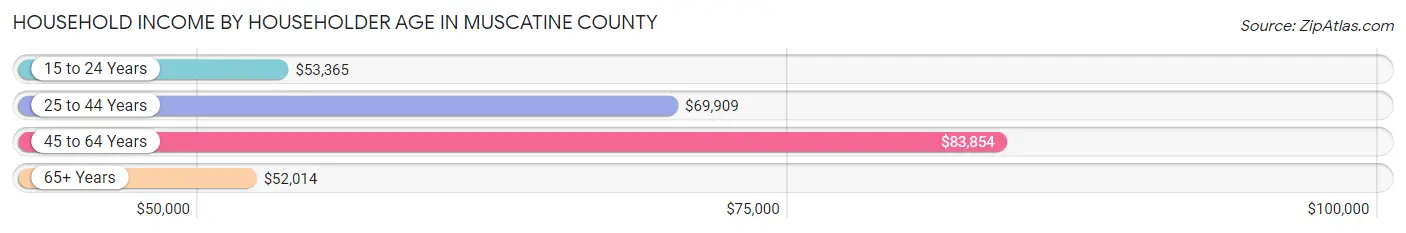
| Income Bracket | # Households | Median Income |
| 15 to 24 Years | 784 (4.6%) | $53,365 |
| 25 to 44 Years | 5,322 (31.2%) | $69,909 |
| 45 to 64 Years | 6,270 (36.7%) | $83,854 |
| 65+ Years | 4,699 (27.5%) | $52,014 |
| Total | 17,075 (100.0%) | $67,427 |
Poverty in Muscatine County
Income Below Poverty by Sex and Age in Muscatine County
With 10.5% poverty level for males and 12.9% for females among the residents of Muscatine County, 12 to 14 year old males and 5 year old females are the most vulnerable to poverty, with 269 males (26.7%) and 98 females (34.7%) in their respective age groups living below the poverty level.
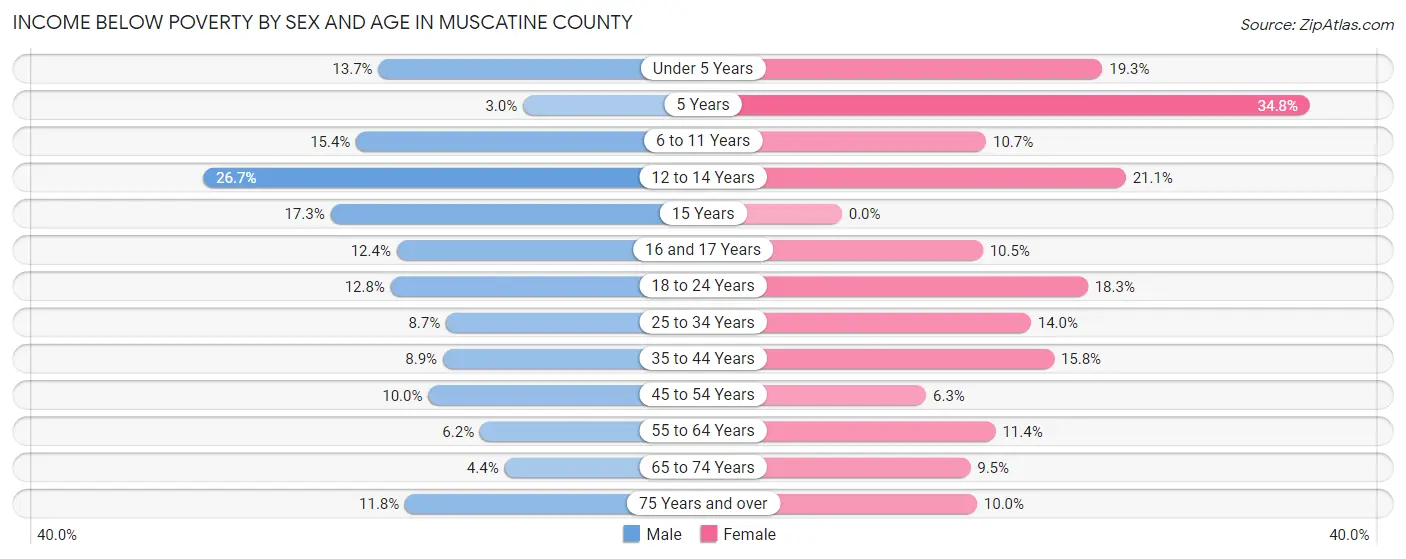
| Age Bracket | Male | Female |
| Under 5 Years | 186 (13.7%) | 235 (19.3%) |
| 5 Years | 7 (3.0%) | 98 (34.7%) |
| 6 to 11 Years | 266 (15.4%) | 175 (10.7%) |
| 12 to 14 Years | 269 (26.7%) | 211 (21.1%) |
| 15 Years | 51 (17.3%) | 0 (0.0%) |
| 16 and 17 Years | 74 (12.4%) | 84 (10.5%) |
| 18 to 24 Years | 235 (12.8%) | 303 (18.3%) |
| 25 to 34 Years | 224 (8.7%) | 369 (14.0%) |
| 35 to 44 Years | 238 (8.9%) | 405 (15.8%) |
| 45 to 54 Years | 266 (10.0%) | 158 (6.3%) |
| 55 to 64 Years | 184 (6.2%) | 317 (11.4%) |
| 65 to 74 Years | 94 (4.4%) | 222 (9.5%) |
| 75 Years and over | 117 (11.7%) | 149 (10.0%) |
| Total | 2,211 (10.5%) | 2,726 (12.9%) |
Income Above Poverty by Sex and Age in Muscatine County
According to the poverty statistics in Muscatine County, males aged 5 years and females aged 15 years are the age groups that are most secure financially, with 97.0% of males and 100.0% of females in these age groups living above the poverty line.
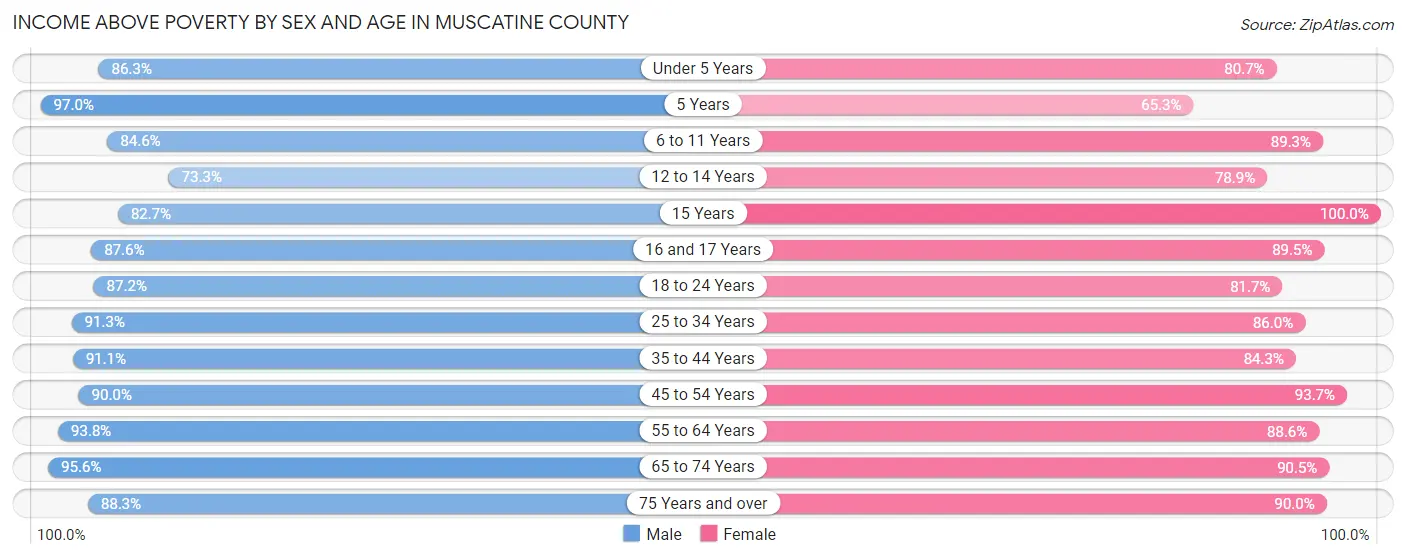
| Age Bracket | Male | Female |
| Under 5 Years | 1,169 (86.3%) | 980 (80.7%) |
| 5 Years | 227 (97.0%) | 184 (65.2%) |
| 6 to 11 Years | 1,463 (84.6%) | 1,459 (89.3%) |
| 12 to 14 Years | 737 (73.3%) | 790 (78.9%) |
| 15 Years | 244 (82.7%) | 173 (100.0%) |
| 16 and 17 Years | 524 (87.6%) | 719 (89.5%) |
| 18 to 24 Years | 1,598 (87.2%) | 1,356 (81.7%) |
| 25 to 34 Years | 2,348 (91.3%) | 2,262 (86.0%) |
| 35 to 44 Years | 2,425 (91.1%) | 2,166 (84.3%) |
| 45 to 54 Years | 2,385 (90.0%) | 2,366 (93.7%) |
| 55 to 64 Years | 2,788 (93.8%) | 2,461 (88.6%) |
| 65 to 74 Years | 2,057 (95.6%) | 2,104 (90.5%) |
| 75 Years and over | 879 (88.2%) | 1,337 (90.0%) |
| Total | 18,844 (89.5%) | 18,357 (87.1%) |
Income Below Poverty Among Married-Couple Families in Muscatine County
The poverty statistics for married-couple families in Muscatine County show that 4.4% or 363 of the total 8,286 families live below the poverty line. Families with 3 or 4 children have the highest poverty rate of 17.7%, comprising of 151 families. On the other hand, families with 5 or more children have the lowest poverty rate of 0.0%, which includes 0 families.
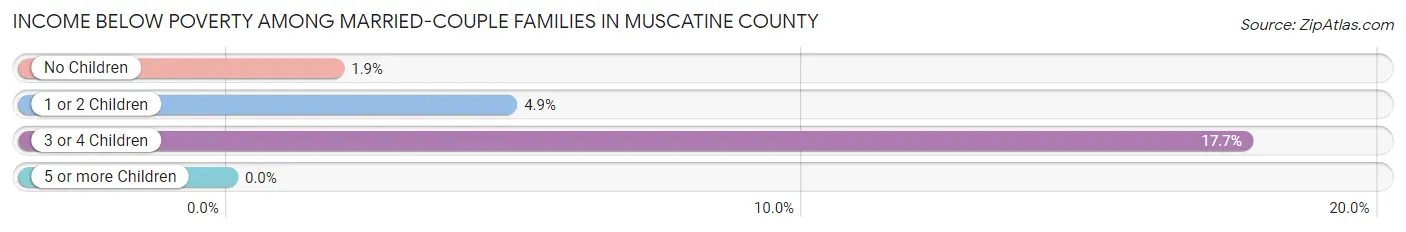
| Children | Above Poverty | Below Poverty |
| No Children | 4,676 (98.2%) | 88 (1.8%) |
| 1 or 2 Children | 2,429 (95.1%) | 124 (4.9%) |
| 3 or 4 Children | 703 (82.3%) | 151 (17.7%) |
| 5 or more Children | 115 (100.0%) | 0 (0.0%) |
| Total | 7,923 (95.6%) | 363 (4.4%) |
Income Below Poverty Among Single-Parent Households in Muscatine County
According to the poverty data in Muscatine County, 16.0% or 185 single-father households and 28.6% or 577 single-mother households are living below the poverty line. Among single-father households, those with 5 or more children have the highest poverty rate, with 2 households (100.0%) experiencing poverty. Likewise, among single-mother households, those with 5 or more children have the highest poverty rate, with 39 households (100.0%) falling below the poverty line.
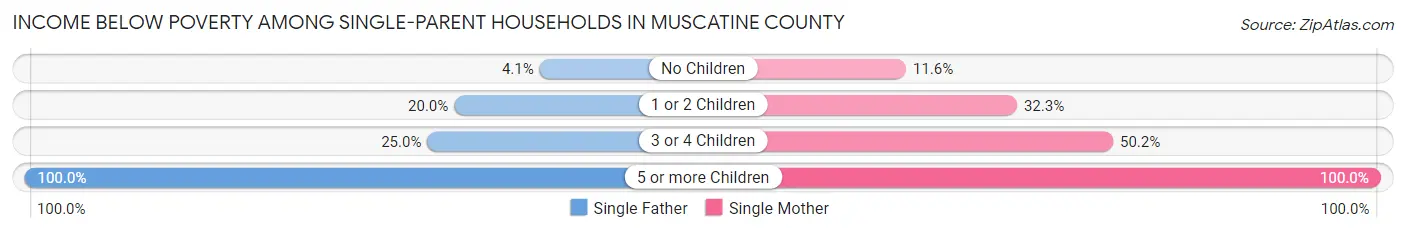
| Children | Single Father | Single Mother |
| No Children | 14 (4.1%) | 86 (11.6%) |
| 1 or 2 Children | 137 (20.0%) | 305 (32.3%) |
| 3 or 4 Children | 32 (25.0%) | 147 (50.2%) |
| 5 or more Children | 2 (100.0%) | 39 (100.0%) |
| Total | 185 (16.0%) | 577 (28.6%) |
Income Below Poverty Among Married-Couple vs Single-Parent Households in Muscatine County
The poverty data for Muscatine County shows that 363 of the married-couple family households (4.4%) and 762 of the single-parent households (24.0%) are living below the poverty level. Within the married-couple family households, those with 3 or 4 children have the highest poverty rate, with 151 households (17.7%) falling below the poverty line. Among the single-parent households, those with 5 or more children have the highest poverty rate, with 41 household (100.0%) living below poverty.
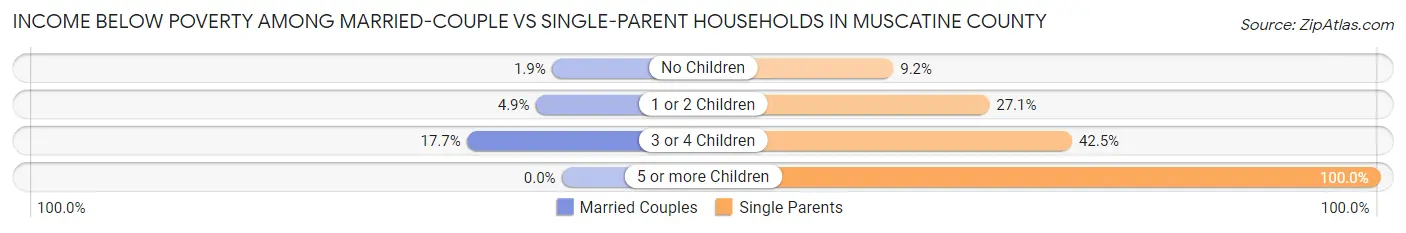
| Children | Married-Couple Families | Single-Parent Households |
| No Children | 88 (1.8%) | 100 (9.2%) |
| 1 or 2 Children | 124 (4.9%) | 442 (27.1%) |
| 3 or 4 Children | 151 (17.7%) | 179 (42.5%) |
| 5 or more Children | 0 (0.0%) | 41 (100.0%) |
| Total | 363 (4.4%) | 762 (24.0%) |
Race in Muscatine County
The most populous races in Muscatine County are White / Caucasian (35,899 | 83.6%), Hispanic or Latino (8,006 | 18.6%), and Some other Race (3,437 | 8.0%).
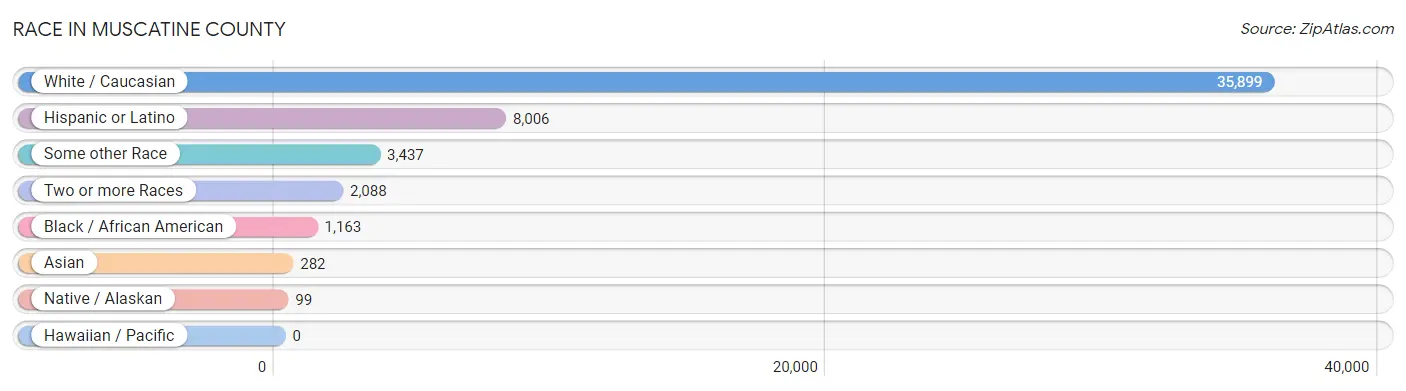
| Race | # Population | % Population |
| Asian | 282 | 0.7% |
| Black / African American | 1,163 | 2.7% |
| Hawaiian / Pacific | 0 | 0.0% |
| Hispanic or Latino | 8,006 | 18.6% |
| Native / Alaskan | 99 | 0.2% |
| White / Caucasian | 35,899 | 83.6% |
| Two or more Races | 2,088 | 4.9% |
| Some other Race | 3,437 | 8.0% |
| Total | 42,968 | 100.0% |
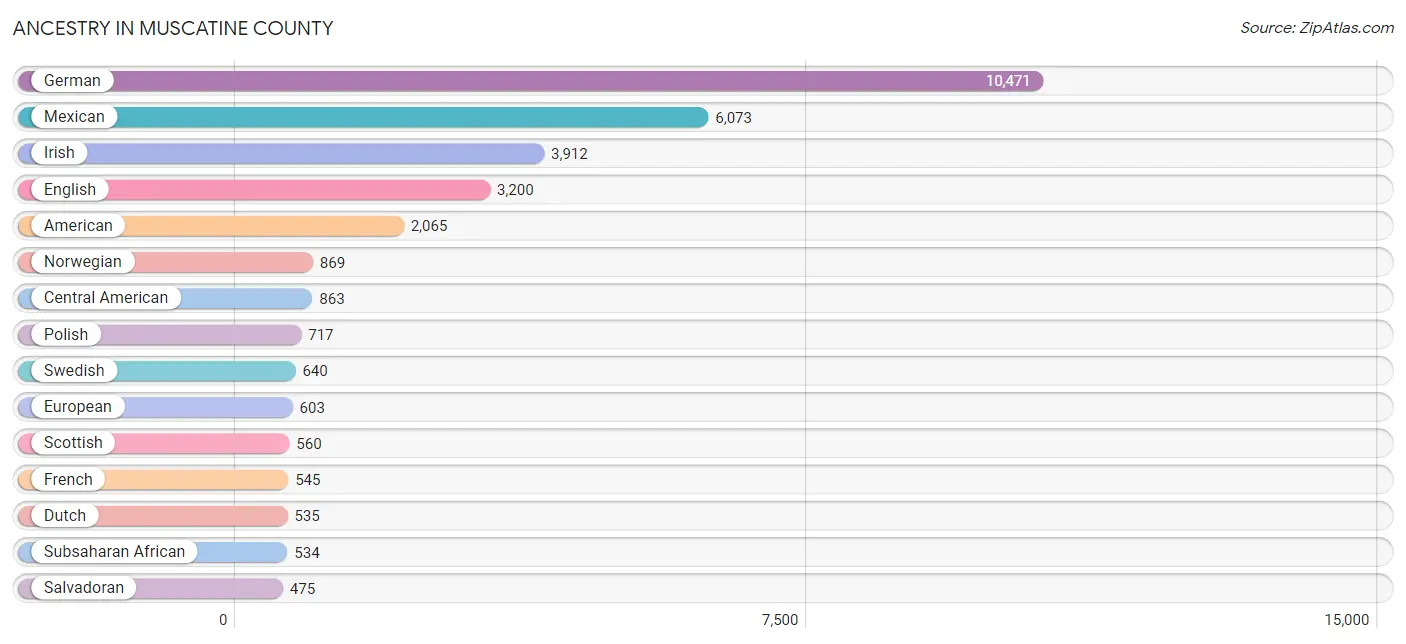
Ancestry in Muscatine County
The most populous ancestries reported in Muscatine County are German (10,471 | 24.4%), Mexican (6,073 | 14.1%), Irish (3,912 | 9.1%), English (3,200 | 7.4%), and American (2,065 | 4.8%), together accounting for 59.9% of all Muscatine County residents.
| Ancestry | # Population | % Population |
| African | 375 | 0.9% |
| American | 2,065 | 4.8% |
| Arab | 77 | 0.2% |
| Australian | 59 | 0.1% |
| Austrian | 32 | 0.1% |
| Belgian | 93 | 0.2% |
| Blackfeet | 70 | 0.2% |
| Brazilian | 37 | 0.1% |
| British | 329 | 0.8% |
| Bulgarian | 22 | 0.1% |
| Burmese | 34 | 0.1% |
| Canadian | 24 | 0.1% |
| Central American | 863 | 2.0% |
| Cherokee | 28 | 0.1% |
| Chippewa | 8 | 0.0% |
| Choctaw | 8 | 0.0% |
| Colombian | 52 | 0.1% |
| Croatian | 42 | 0.1% |
| Cuban | 159 | 0.4% |
| Czech | 413 | 1.0% |
| Czechoslovakian | 51 | 0.1% |
| Danish | 280 | 0.6% |
| Dutch | 535 | 1.3% |
| Eastern European | 56 | 0.1% |
| Egyptian | 27 | 0.1% |
| English | 3,200 | 7.4% |
| Ethiopian | 2 | 0.0% |
| European | 603 | 1.4% |
| Filipino | 18 | 0.0% |
| Finnish | 49 | 0.1% |
| French | 545 | 1.3% |
| French American Indian | 14 | 0.0% |
| French Canadian | 107 | 0.3% |
| German | 10,471 | 24.4% |
| Greek | 69 | 0.2% |
| Guatemalan | 382 | 0.9% |
| Guyanese | 15 | 0.0% |
| Haitian | 52 | 0.1% |
| Honduran | 6 | 0.0% |
| Hungarian | 73 | 0.2% |
| Indian (Asian) | 34 | 0.1% |
| Indonesian | 25 | 0.1% |
| Inupiat | 7 | 0.0% |
| Irish | 3,912 | 9.1% |
| Italian | 370 | 0.9% |
| Japanese | 13 | 0.0% |
| Korean | 131 | 0.3% |
| Lebanese | 50 | 0.1% |
| Liberian | 192 | 0.4% |
| Lithuanian | 14 | 0.0% |
| Luxembourger | 22 | 0.1% |
| Malaysian | 18 | 0.0% |
| Mexican | 6,073 | 14.1% |
| Mexican American Indian | 48 | 0.1% |
| Navajo | 9 | 0.0% |
| Northern European | 53 | 0.1% |
| Norwegian | 869 | 2.0% |
| Ottawa | 4 | 0.0% |
| Pakistani | 7 | 0.0% |
| Pennsylvania German | 53 | 0.1% |
| Polish | 717 | 1.7% |
| Portuguese | 33 | 0.1% |
| Puerto Rican | 147 | 0.3% |
| Romanian | 32 | 0.1% |
| Russian | 6 | 0.0% |
| Salvadoran | 475 | 1.1% |
| Scandinavian | 108 | 0.3% |
| Scotch-Irish | 317 | 0.7% |
| Scottish | 560 | 1.3% |
| Sioux | 90 | 0.2% |
| Slavic | 1 | 0.0% |
| South American | 52 | 0.1% |
| South American Indian | 4 | 0.0% |
| Spaniard | 18 | 0.0% |
| Spanish | 11 | 0.0% |
| Sri Lankan | 79 | 0.2% |
| Subsaharan African | 534 | 1.2% |
| Swedish | 640 | 1.5% |
| Swiss | 115 | 0.3% |
| Thai | 172 | 0.4% |
| Ukrainian | 42 | 0.1% |
| Welsh | 242 | 0.6% |
| West Indian | 47 | 0.1% | View All 83 Rows |
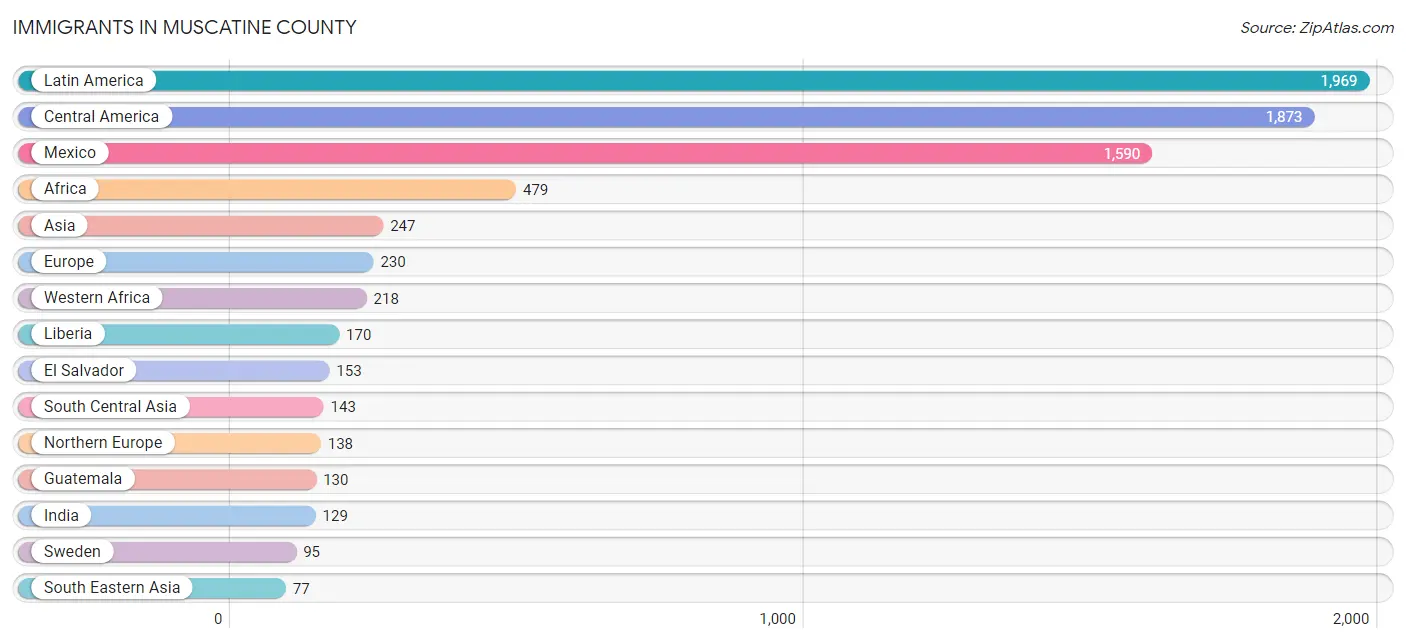
Immigrants in Muscatine County
The most numerous immigrant groups reported in Muscatine County came from Latin America (1,969 | 4.6%), Central America (1,873 | 4.4%), Mexico (1,590 | 3.7%), Africa (479 | 1.1%), and Asia (247 | 0.6%), together accounting for 14.3% of all Muscatine County residents.
| Immigration Origin | # Population | % Population |
| Africa | 479 | 1.1% |
| Asia | 247 | 0.6% |
| Brazil | 3 | 0.0% |
| Bulgaria | 22 | 0.1% |
| Cambodia | 5 | 0.0% |
| Canada | 63 | 0.2% |
| Caribbean | 52 | 0.1% |
| Central America | 1,873 | 4.4% |
| China | 11 | 0.0% |
| Colombia | 4 | 0.0% |
| Eastern Africa | 2 | 0.0% |
| Eastern Asia | 27 | 0.1% |
| Eastern Europe | 72 | 0.2% |
| Egypt | 27 | 0.1% |
| El Salvador | 153 | 0.4% |
| England | 11 | 0.0% |
| Eritrea | 2 | 0.0% |
| Europe | 230 | 0.5% |
| Germany | 20 | 0.1% |
| Guatemala | 130 | 0.3% |
| Guyana | 37 | 0.1% |
| Haiti | 52 | 0.1% |
| India | 129 | 0.3% |
| Korea | 16 | 0.0% |
| Laos | 9 | 0.0% |
| Latin America | 1,969 | 4.6% |
| Liberia | 170 | 0.4% |
| Mexico | 1,590 | 3.7% |
| Nigeria | 48 | 0.1% |
| Northern Africa | 60 | 0.1% |
| Northern Europe | 138 | 0.3% |
| Pakistan | 14 | 0.0% |
| Philippines | 27 | 0.1% |
| Romania | 32 | 0.1% |
| Russia | 1 | 0.0% |
| Scotland | 32 | 0.1% |
| Singapore | 2 | 0.0% |
| South America | 44 | 0.1% |
| South Central Asia | 143 | 0.3% |
| South Eastern Asia | 77 | 0.2% |
| Sudan | 33 | 0.1% |
| Sweden | 95 | 0.2% |
| Thailand | 1 | 0.0% |
| Ukraine | 17 | 0.0% |
| Vietnam | 18 | 0.0% |
| Western Africa | 218 | 0.5% |
| Western Europe | 20 | 0.1% | View All 47 Rows |
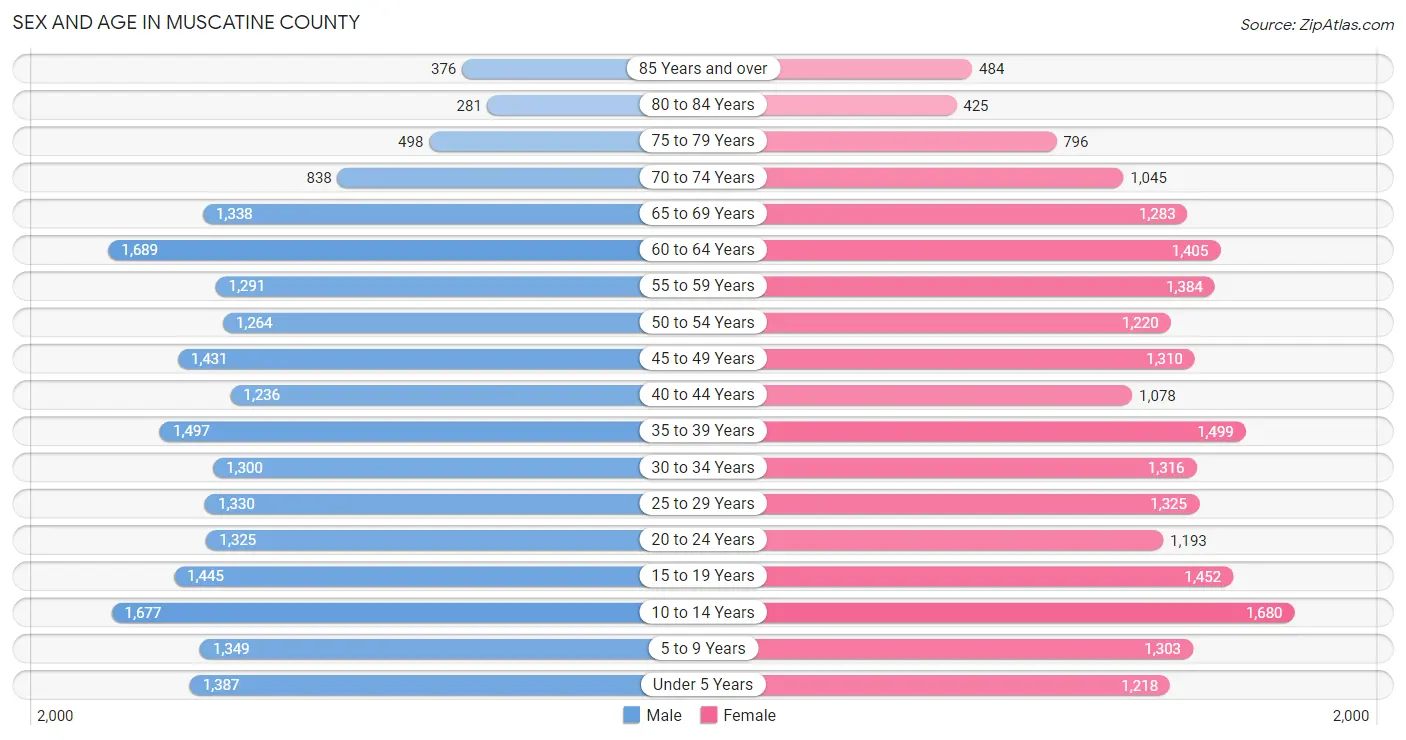
Sex and Age in Muscatine County
Sex and Age in Muscatine County
The most populous age groups in Muscatine County are 60 to 64 Years (1,689 | 7.8%) for men and 10 to 14 Years (1,680 | 7.8%) for women.
| Age Bracket | Male | Female |
| Under 5 Years | 1,387 (6.4%) | 1,218 (5.7%) |
| 5 to 9 Years | 1,349 (6.3%) | 1,303 (6.1%) |
| 10 to 14 Years | 1,677 (7.8%) | 1,680 (7.8%) |
| 15 to 19 Years | 1,445 (6.7%) | 1,452 (6.8%) |
| 20 to 24 Years | 1,325 (6.1%) | 1,193 (5.6%) |
| 25 to 29 Years | 1,330 (6.2%) | 1,325 (6.2%) |
| 30 to 34 Years | 1,300 (6.0%) | 1,316 (6.1%) |
| 35 to 39 Years | 1,497 (7.0%) | 1,499 (7.0%) |
| 40 to 44 Years | 1,236 (5.7%) | 1,078 (5.0%) |
| 45 to 49 Years | 1,431 (6.6%) | 1,310 (6.1%) |
| 50 to 54 Years | 1,264 (5.9%) | 1,220 (5.7%) |
| 55 to 59 Years | 1,291 (6.0%) | 1,384 (6.5%) |
| 60 to 64 Years | 1,689 (7.8%) | 1,405 (6.6%) |
| 65 to 69 Years | 1,338 (6.2%) | 1,283 (6.0%) |
| 70 to 74 Years | 838 (3.9%) | 1,045 (4.9%) |
| 75 to 79 Years | 498 (2.3%) | 796 (3.7%) |
| 80 to 84 Years | 281 (1.3%) | 425 (2.0%) |
| 85 Years and over | 376 (1.7%) | 484 (2.3%) |
| Total | 21,552 (100.0%) | 21,416 (100.0%) |
Families and Households in Muscatine County
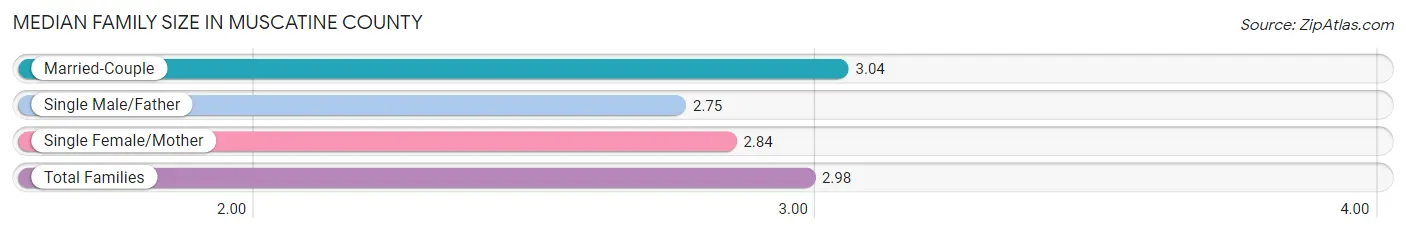
Median Family Size in Muscatine County
The median family size in Muscatine County is 2.98 persons per family, with married-couple families (8,286 | 72.3%) accounting for the largest median family size of 3.04 persons per family. On the other hand, single male/father families (1,157 | 10.1%) represent the smallest median family size with 2.75 persons per family.
| Family Type | # Families | Family Size |
| Married-Couple | 8,286 (72.3%) | 3.04 |
| Single Male/Father | 1,157 (10.1%) | 2.75 |
| Single Female/Mother | 2,017 (17.6%) | 2.84 |
| Total Families | 11,460 (100.0%) | 2.98 |
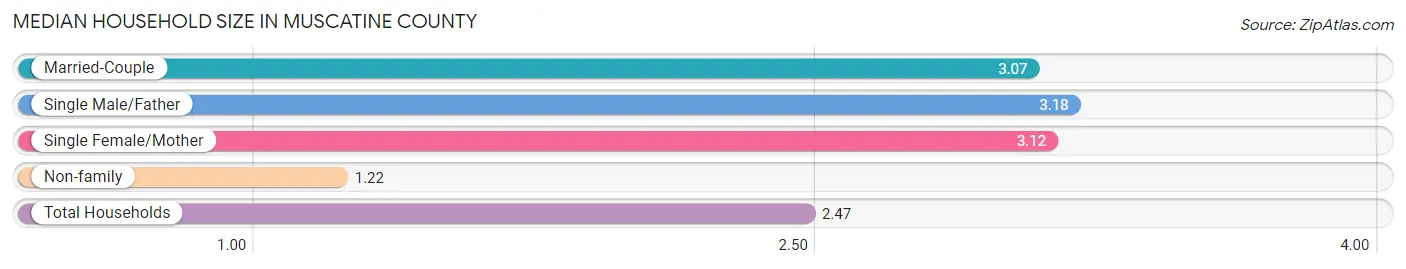
Median Household Size in Muscatine County
The median household size in Muscatine County is 2.47 persons per household, with single male/father households (1,157 | 6.8%) accounting for the largest median household size of 3.18 persons per household. non-family households (5,615 | 32.9%) represent the smallest median household size with 1.22 persons per household.
| Household Type | # Households | Household Size |
| Married-Couple | 8,286 (48.5%) | 3.07 |
| Single Male/Father | 1,157 (6.8%) | 3.18 |
| Single Female/Mother | 2,017 (11.8%) | 3.12 |
| Non-family | 5,615 (32.9%) | 1.22 |
| Total Households | 17,075 (100.0%) | 2.47 |
Household Size by Marriage Status in Muscatine County
Out of a total of 17,075 households in Muscatine County, 11,460 (67.1%) are family households, while 5,615 (32.9%) are nonfamily households. The most numerous type of family households are 2-person households, comprising 5,119, and the most common type of nonfamily households are 1-person households, comprising 4,618.
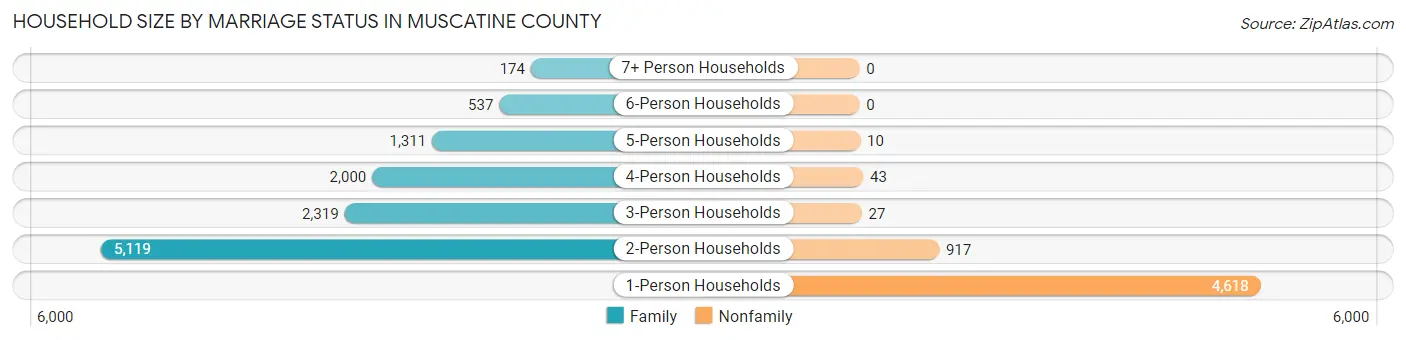
| Household Size | Family Households | Nonfamily Households |
| 1-Person Households | - | 4,618 (27.1%) |
| 2-Person Households | 5,119 (30.0%) | 917 (5.4%) |
| 3-Person Households | 2,319 (13.6%) | 27 (0.2%) |
| 4-Person Households | 2,000 (11.7%) | 43 (0.3%) |
| 5-Person Households | 1,311 (7.7%) | 10 (0.1%) |
| 6-Person Households | 537 (3.1%) | 0 (0.0%) |
| 7+ Person Households | 174 (1.0%) | 0 (0.0%) |
| Total | 11,460 (67.1%) | 5,615 (32.9%) |
Female Fertility in Muscatine County
Fertility by Age in Muscatine County
Average fertility rate in Muscatine County is 49.0 births per 1,000 women. Women in the age bracket of 20 to 34 years have the highest fertility rate with 102.0 births per 1,000 women. Women in the age bracket of 20 to 34 years acount for 83.9% of all women with births.
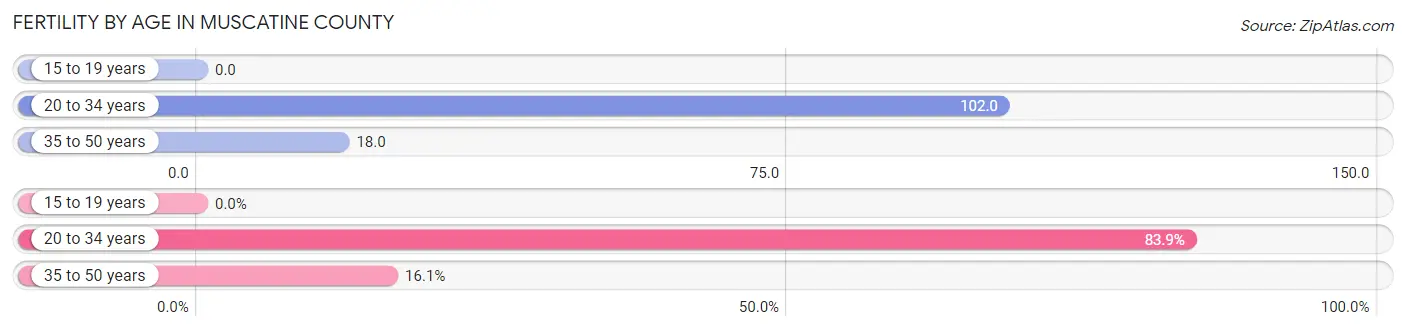
| Age Bracket | Women with Births | Births / 1,000 Women |
| 15 to 19 years | 0 (0.0%) | 0.0 |
| 20 to 34 years | 390 (83.9%) | 102.0 |
| 35 to 50 years | 75 (16.1%) | 18.0 |
| Total | 465 (100.0%) | 49.0 |
Fertility by Age by Marriage Status in Muscatine County
58.3% of women with births (465) in Muscatine County are married. The highest percentage of unmarried women with births falls into 20 to 34 years age bracket with 49.7% of them unmarried at the time of birth, while the lowest percentage of unmarried women with births belong to 35 to 50 years age bracket with 0.0% of them unmarried.
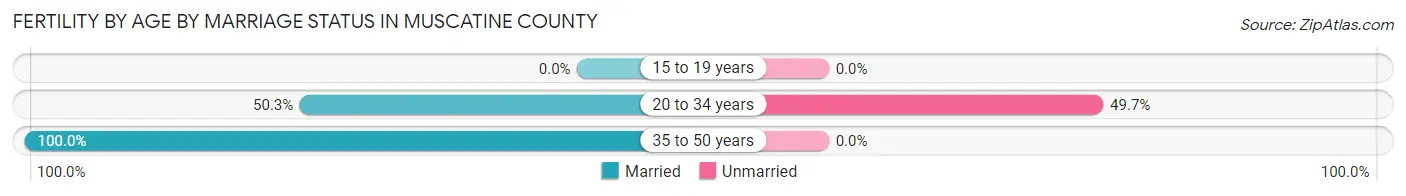
| Age Bracket | Married | Unmarried |
| 15 to 19 years | 0 (0.0%) | 0 (0.0%) |
| 20 to 34 years | 196 (50.3%) | 194 (49.7%) |
| 35 to 50 years | 75 (100.0%) | 0 (0.0%) |
| Total | 271 (58.3%) | 194 (41.7%) |
Fertility by Education in Muscatine County
Average fertility rate in Muscatine County is 49.0 births per 1,000 women. Women with the education attainment of bachelor's degree have the highest fertility rate of 107.0 births per 1,000 women, while women with the education attainment of less than high school have the lowest fertility at 4.0 births per 1,000 women. Women with the education attainment of high school diploma represent 34.8% of all women with births.
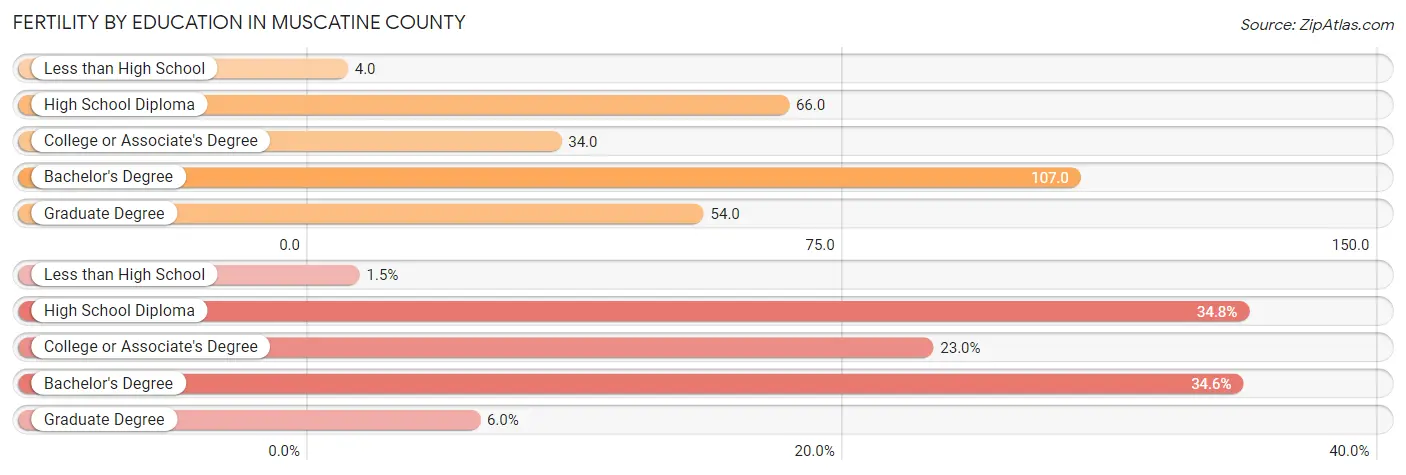
| Educational Attainment | Women with Births | Births / 1,000 Women |
| Less than High School | 7 (1.5%) | 4.0 |
| High School Diploma | 162 (34.8%) | 66.0 |
| College or Associate's Degree | 107 (23.0%) | 34.0 |
| Bachelor's Degree | 161 (34.6%) | 107.0 |
| Graduate Degree | 28 (6.0%) | 54.0 |
| Total | 465 (100.0%) | 49.0 |
Fertility by Education by Marriage Status in Muscatine County
41.7% of women with births in Muscatine County are unmarried. Women with the educational attainment of graduate degree are most likely to be married with 100.0% of them married at childbirth, while women with the educational attainment of less than high school are least likely to be married with 100.0% of them unmarried at childbirth.
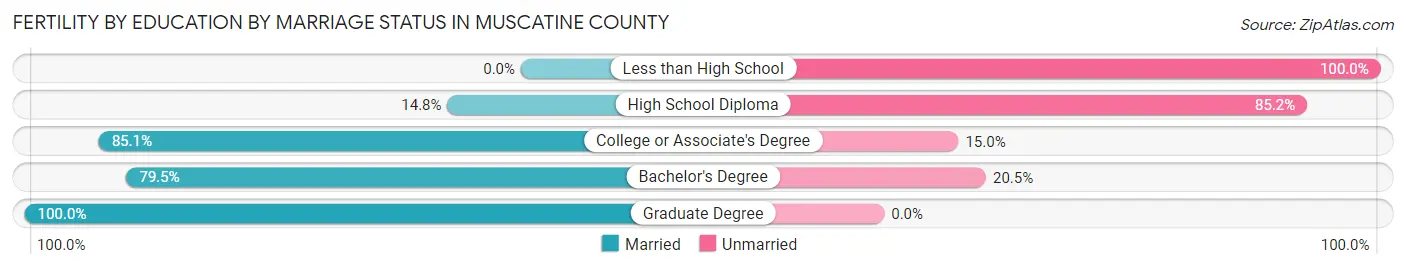
| Educational Attainment | Married | Unmarried |
| Less than High School | 0 (0.0%) | 7 (100.0%) |
| High School Diploma | 24 (14.8%) | 138 (85.2%) |
| College or Associate's Degree | 91 (85.1%) | 16 (14.9%) |
| Bachelor's Degree | 128 (79.5%) | 33 (20.5%) |
| Graduate Degree | 28 (100.0%) | 0 (0.0%) |
| Total | 271 (58.3%) | 194 (41.7%) |
Employment Characteristics in Muscatine County
Employment by Class of Employer in Muscatine County
Among the 20,877 employed individuals in Muscatine County, private company employees (14,901 | 71.4%), local government employees (1,576 | 7.5%), and not-for-profit organizations (1,438 | 6.9%) make up the most common classes of employment.
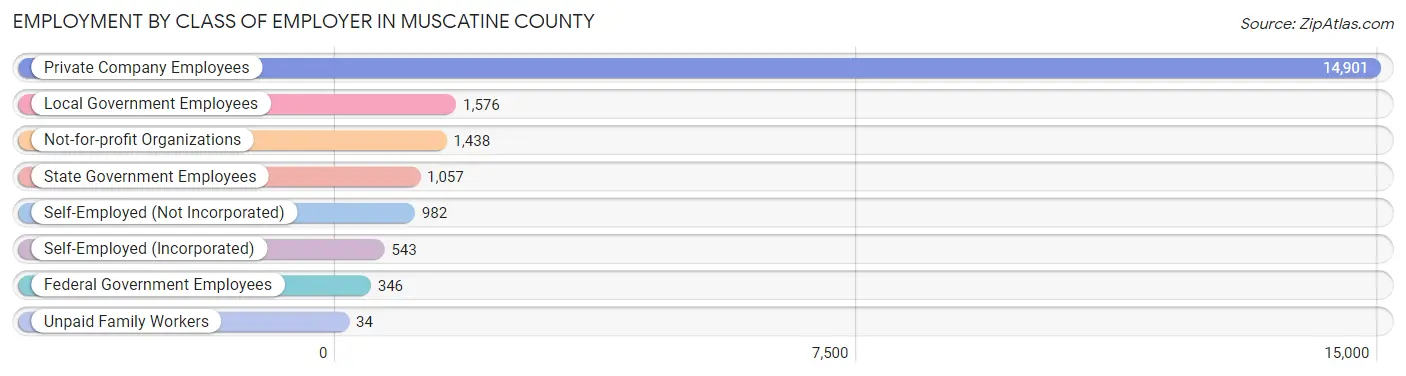
| Employer Class | # Employees | % Employees |
| Private Company Employees | 14,901 | 71.4% |
| Self-Employed (Incorporated) | 543 | 2.6% |
| Self-Employed (Not Incorporated) | 982 | 4.7% |
| Not-for-profit Organizations | 1,438 | 6.9% |
| Local Government Employees | 1,576 | 7.5% |
| State Government Employees | 1,057 | 5.1% |
| Federal Government Employees | 346 | 1.7% |
| Unpaid Family Workers | 34 | 0.2% |
| Total | 20,877 | 100.0% |
Employment Status by Age in Muscatine County
According to the labor force statistics for Muscatine County, out of the total population over 16 years of age (33,886), 65.3% or 22,128 individuals are in the labor force, with 3.5% or 774 of them unemployed. The age group with the highest labor force participation rate is 30 to 34 years, with 90.4% or 2,365 individuals in the labor force. Within the labor force, the 16 to 19 years age range has the highest percentage of unemployed individuals, with 13.9% or 144 of them being unemployed.
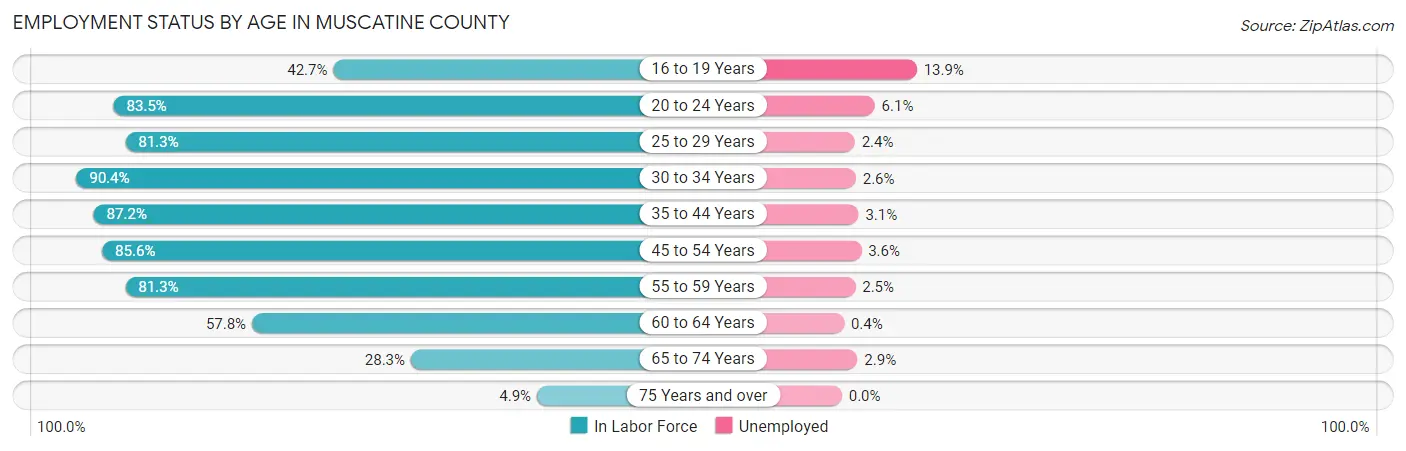
| Age Bracket | In Labor Force | Unemployed |
| 16 to 19 Years | 1,037 (42.7%) | 144 (13.9%) |
| 20 to 24 Years | 2,103 (83.5%) | 128 (6.1%) |
| 25 to 29 Years | 2,159 (81.3%) | 52 (2.4%) |
| 30 to 34 Years | 2,365 (90.4%) | 61 (2.6%) |
| 35 to 44 Years | 4,630 (87.2%) | 144 (3.1%) |
| 45 to 54 Years | 4,473 (85.6%) | 161 (3.6%) |
| 55 to 59 Years | 2,175 (81.3%) | 54 (2.5%) |
| 60 to 64 Years | 1,788 (57.8%) | 7 (0.4%) |
| 65 to 74 Years | 1,275 (28.3%) | 37 (2.9%) |
| 75 Years and over | 140 (4.9%) | 0 (0.0%) |
| Total | 22,128 (65.3%) | 774 (3.5%) |
Employment Status by Educational Attainment in Muscatine County
According to labor force statistics for Muscatine County, 81.5% of individuals (17,584) out of the total population between 25 and 64 years of age (21,575) are in the labor force, with 2.7% or 475 of them being unemployed. The group with the highest labor force participation rate are those with the educational attainment of college / associate degree, with 86.3% or 6,252 individuals in the labor force. Within the labor force, individuals with high school diploma education have the highest percentage of unemployment, with 4.6% or 255 of them being unemployed.
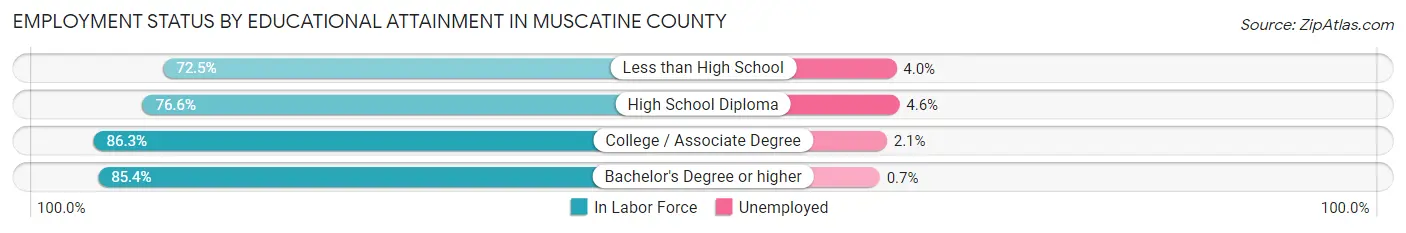
| Educational Attainment | In Labor Force | Unemployed |
| Less than High School | 1,450 (72.5%) | 80 (4.0%) |
| High School Diploma | 5,554 (76.6%) | 334 (4.6%) |
| College / Associate Degree | 6,252 (86.3%) | 152 (2.1%) |
| Bachelor's Degree or higher | 4,338 (85.4%) | 36 (0.7%) |
| Total | 17,584 (81.5%) | 583 (2.7%) |
Employment Occupations by Sex in Muscatine County
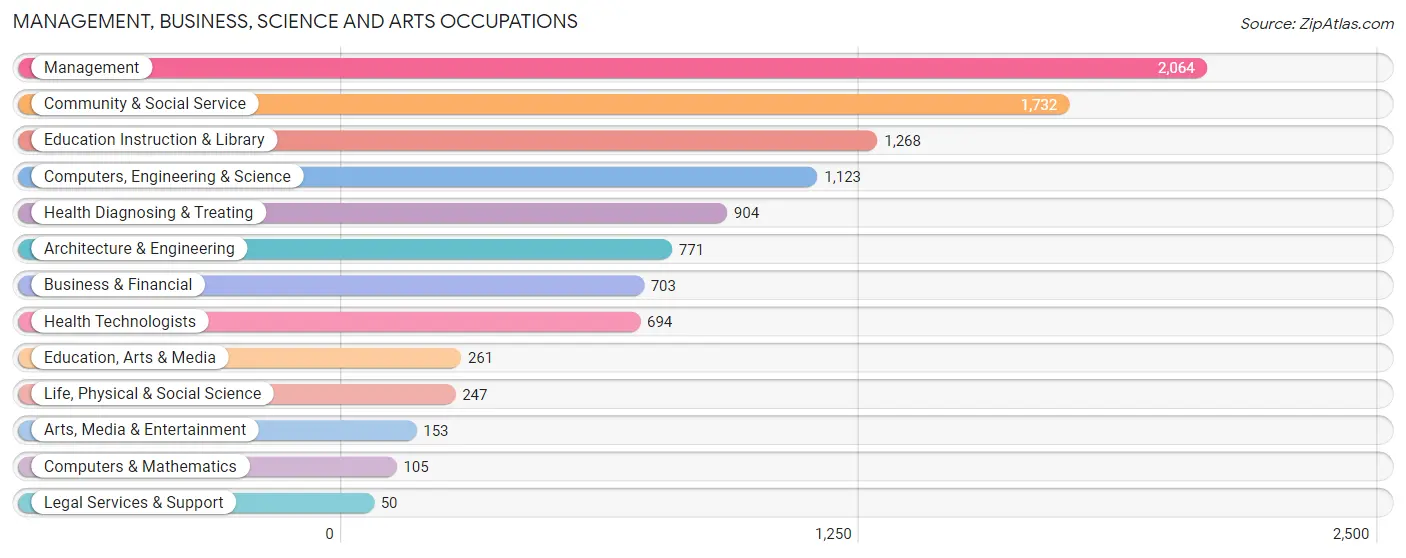
Management, Business, Science and Arts Occupations
The most common Management, Business, Science and Arts occupations in Muscatine County are Management (2,064 | 9.7%), Community & Social Service (1,732 | 8.2%), Education Instruction & Library (1,268 | 6.0%), Computers, Engineering & Science (1,123 | 5.3%), and Health Diagnosing & Treating (904 | 4.3%).
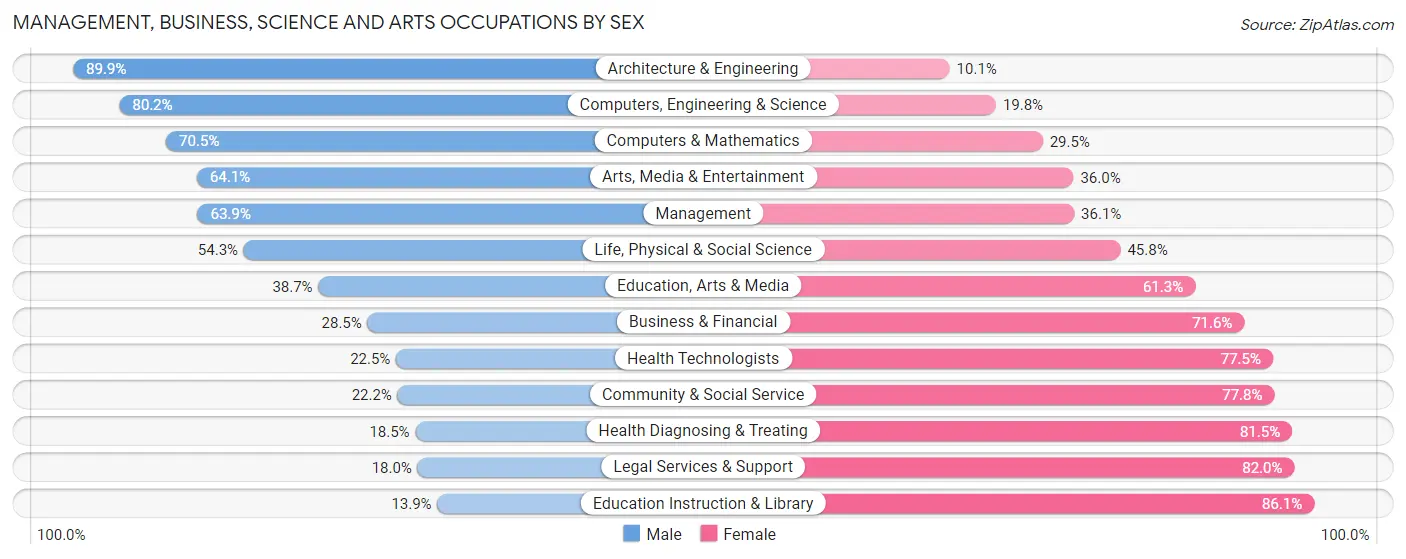
Management, Business, Science and Arts Occupations by Sex
Within the Management, Business, Science and Arts occupations in Muscatine County, the most male-oriented occupations are Architecture & Engineering (89.9%), Computers, Engineering & Science (80.2%), and Computers & Mathematics (70.5%), while the most female-oriented occupations are Education Instruction & Library (86.1%), Legal Services & Support (82.0%), and Health Diagnosing & Treating (81.5%).
| Occupation | Male | Female |
| Management | 1,319 (63.9%) | 745 (36.1%) |
| Business & Financial | 200 (28.4%) | 503 (71.6%) |
| Computers, Engineering & Science | 901 (80.2%) | 222 (19.8%) |
| Computers & Mathematics | 74 (70.5%) | 31 (29.5%) |
| Architecture & Engineering | 693 (89.9%) | 78 (10.1%) |
| Life, Physical & Social Science | 134 (54.2%) | 113 (45.8%) |
| Community & Social Service | 384 (22.2%) | 1,348 (77.8%) |
| Education, Arts & Media | 101 (38.7%) | 160 (61.3%) |
| Legal Services & Support | 9 (18.0%) | 41 (82.0%) |
| Education Instruction & Library | 176 (13.9%) | 1,092 (86.1%) |
| Arts, Media & Entertainment | 98 (64.0%) | 55 (35.9%) |
| Health Diagnosing & Treating | 167 (18.5%) | 737 (81.5%) |
| Health Technologists | 156 (22.5%) | 538 (77.5%) |
| Total (Category) | 2,971 (45.5%) | 3,555 (54.5%) |
| Total (Overall) | 11,458 (53.9%) | 9,804 (46.1%) |
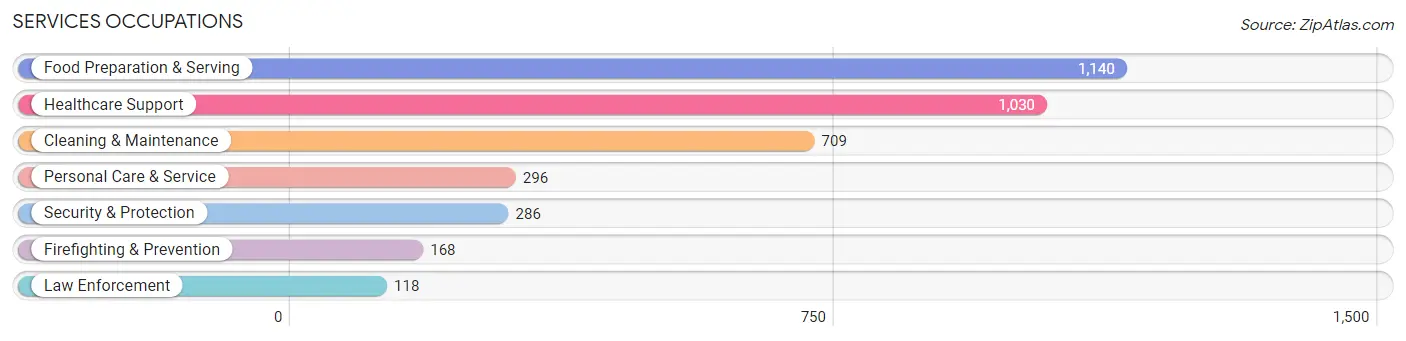
Services Occupations
The most common Services occupations in Muscatine County are Food Preparation & Serving (1,140 | 5.4%), Healthcare Support (1,030 | 4.8%), Cleaning & Maintenance (709 | 3.3%), Personal Care & Service (296 | 1.4%), and Security & Protection (286 | 1.3%).
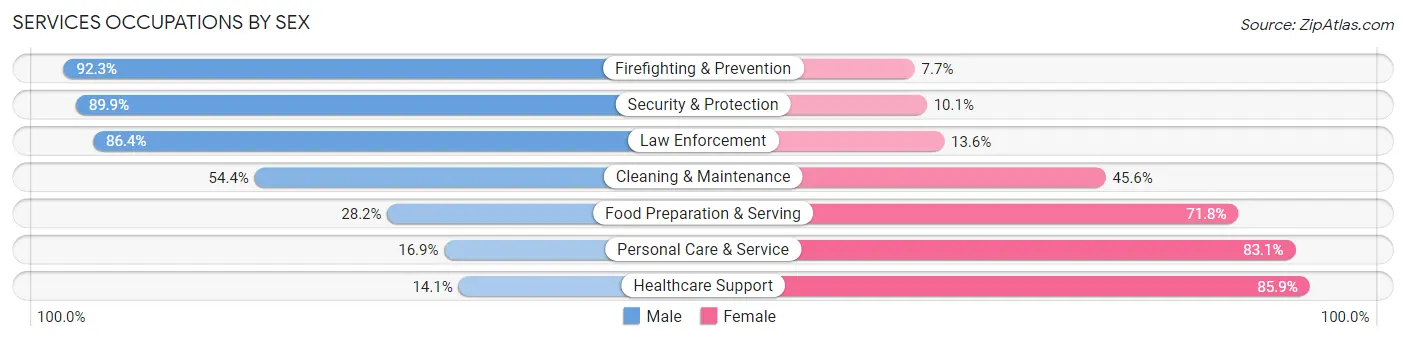
Services Occupations by Sex
Within the Services occupations in Muscatine County, the most male-oriented occupations are Firefighting & Prevention (92.3%), Security & Protection (89.9%), and Law Enforcement (86.4%), while the most female-oriented occupations are Healthcare Support (85.9%), Personal Care & Service (83.1%), and Food Preparation & Serving (71.8%).
| Occupation | Male | Female |
| Healthcare Support | 145 (14.1%) | 885 (85.9%) |
| Security & Protection | 257 (89.9%) | 29 (10.1%) |
| Firefighting & Prevention | 155 (92.3%) | 13 (7.7%) |
| Law Enforcement | 102 (86.4%) | 16 (13.6%) |
| Food Preparation & Serving | 321 (28.2%) | 819 (71.8%) |
| Cleaning & Maintenance | 386 (54.4%) | 323 (45.6%) |
| Personal Care & Service | 50 (16.9%) | 246 (83.1%) |
| Total (Category) | 1,159 (33.5%) | 2,302 (66.5%) |
| Total (Overall) | 11,458 (53.9%) | 9,804 (46.1%) |
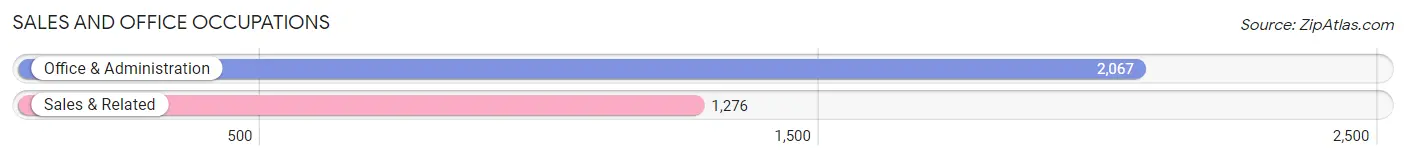
Sales and Office Occupations
The most common Sales and Office occupations in Muscatine County are Office & Administration (2,067 | 9.7%), and Sales & Related (1,276 | 6.0%).
Sales and Office Occupations by Sex
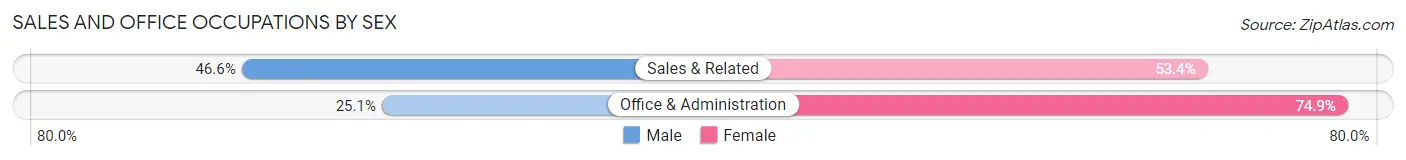
| Occupation | Male | Female |
| Sales & Related | 595 (46.6%) | 681 (53.4%) |
| Office & Administration | 518 (25.1%) | 1,549 (74.9%) |
| Total (Category) | 1,113 (33.3%) | 2,230 (66.7%) |
| Total (Overall) | 11,458 (53.9%) | 9,804 (46.1%) |
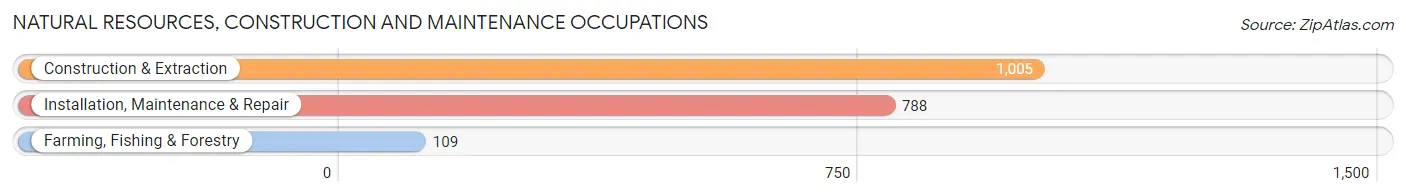
Natural Resources, Construction and Maintenance Occupations
The most common Natural Resources, Construction and Maintenance occupations in Muscatine County are Construction & Extraction (1,005 | 4.7%), Installation, Maintenance & Repair (788 | 3.7%), and Farming, Fishing & Forestry (109 | 0.5%).
Natural Resources, Construction and Maintenance Occupations by Sex
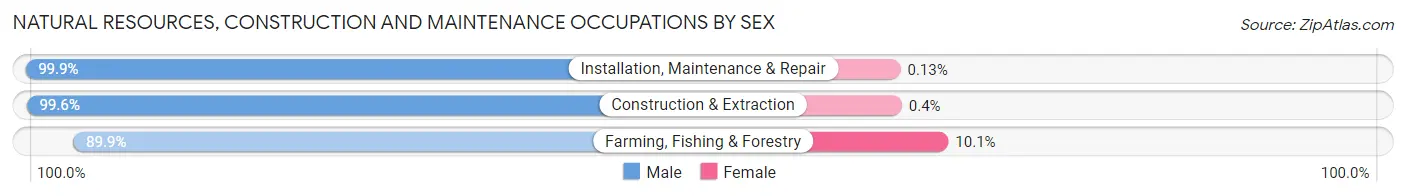
| Occupation | Male | Female |
| Farming, Fishing & Forestry | 98 (89.9%) | 11 (10.1%) |
| Construction & Extraction | 1,001 (99.6%) | 4 (0.4%) |
| Installation, Maintenance & Repair | 787 (99.9%) | 1 (0.1%) |
| Total (Category) | 1,886 (99.2%) | 16 (0.8%) |
| Total (Overall) | 11,458 (53.9%) | 9,804 (46.1%) |
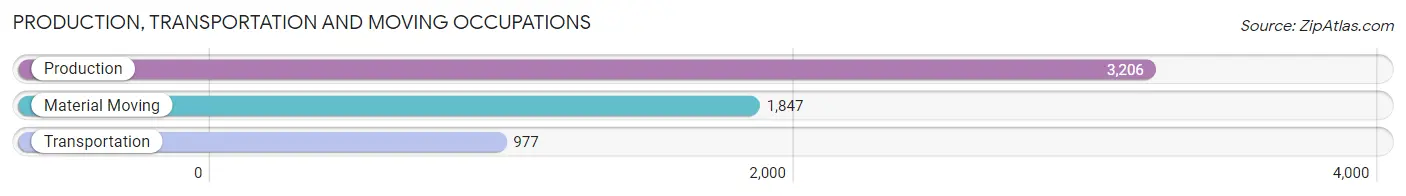
Production, Transportation and Moving Occupations
The most common Production, Transportation and Moving occupations in Muscatine County are Production (3,206 | 15.1%), Material Moving (1,847 | 8.7%), and Transportation (977 | 4.6%).
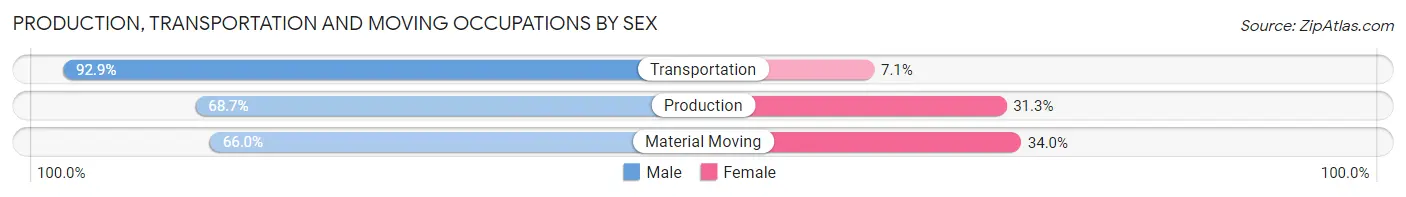
Production, Transportation and Moving Occupations by Sex
| Occupation | Male | Female |
| Production | 2,202 (68.7%) | 1,004 (31.3%) |
| Transportation | 908 (92.9%) | 69 (7.1%) |
| Material Moving | 1,219 (66.0%) | 628 (34.0%) |
| Total (Category) | 4,329 (71.8%) | 1,701 (28.2%) |
| Total (Overall) | 11,458 (53.9%) | 9,804 (46.1%) |
Employment Industries by Sex in Muscatine County
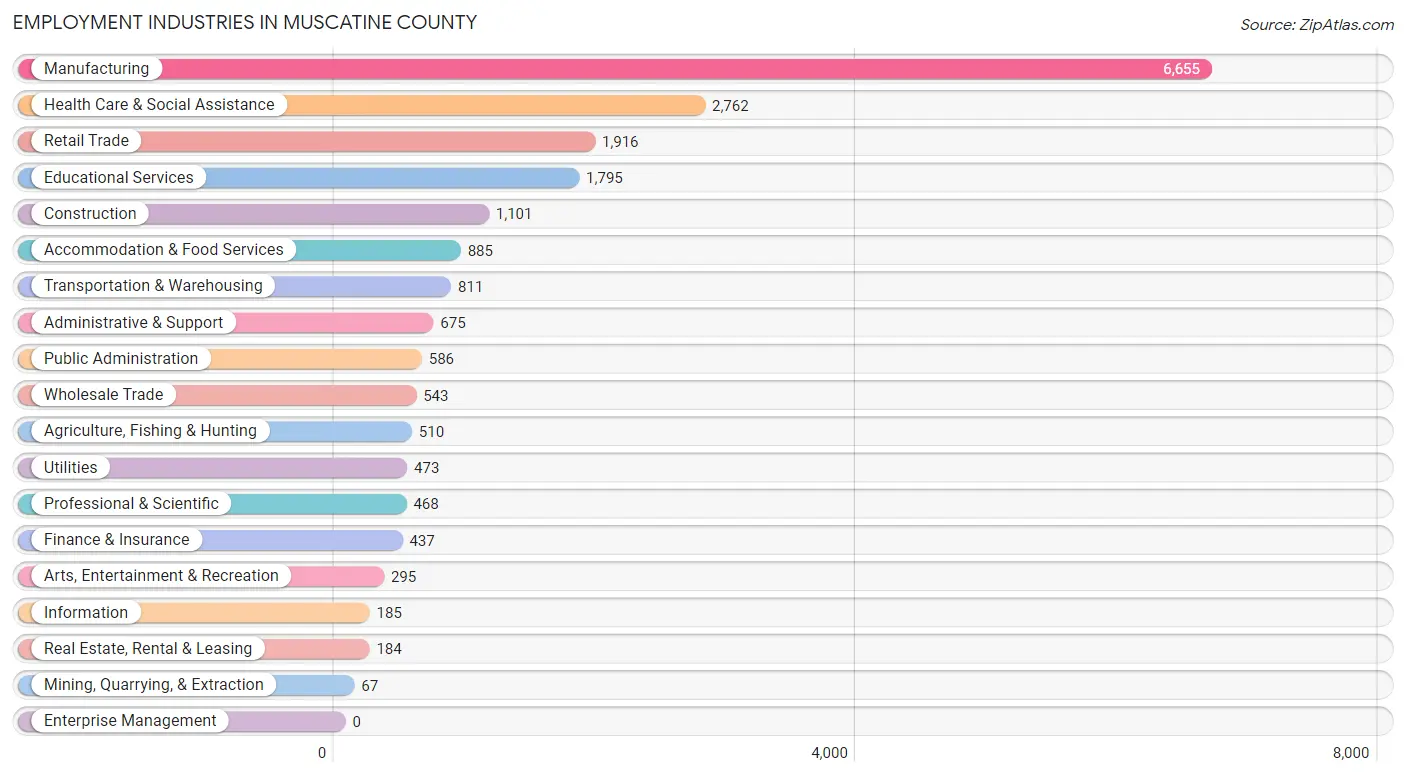
Employment Industries in Muscatine County
The major employment industries in Muscatine County include Manufacturing (6,655 | 31.3%), Health Care & Social Assistance (2,762 | 13.0%), Retail Trade (1,916 | 9.0%), Educational Services (1,795 | 8.4%), and Construction (1,101 | 5.2%).
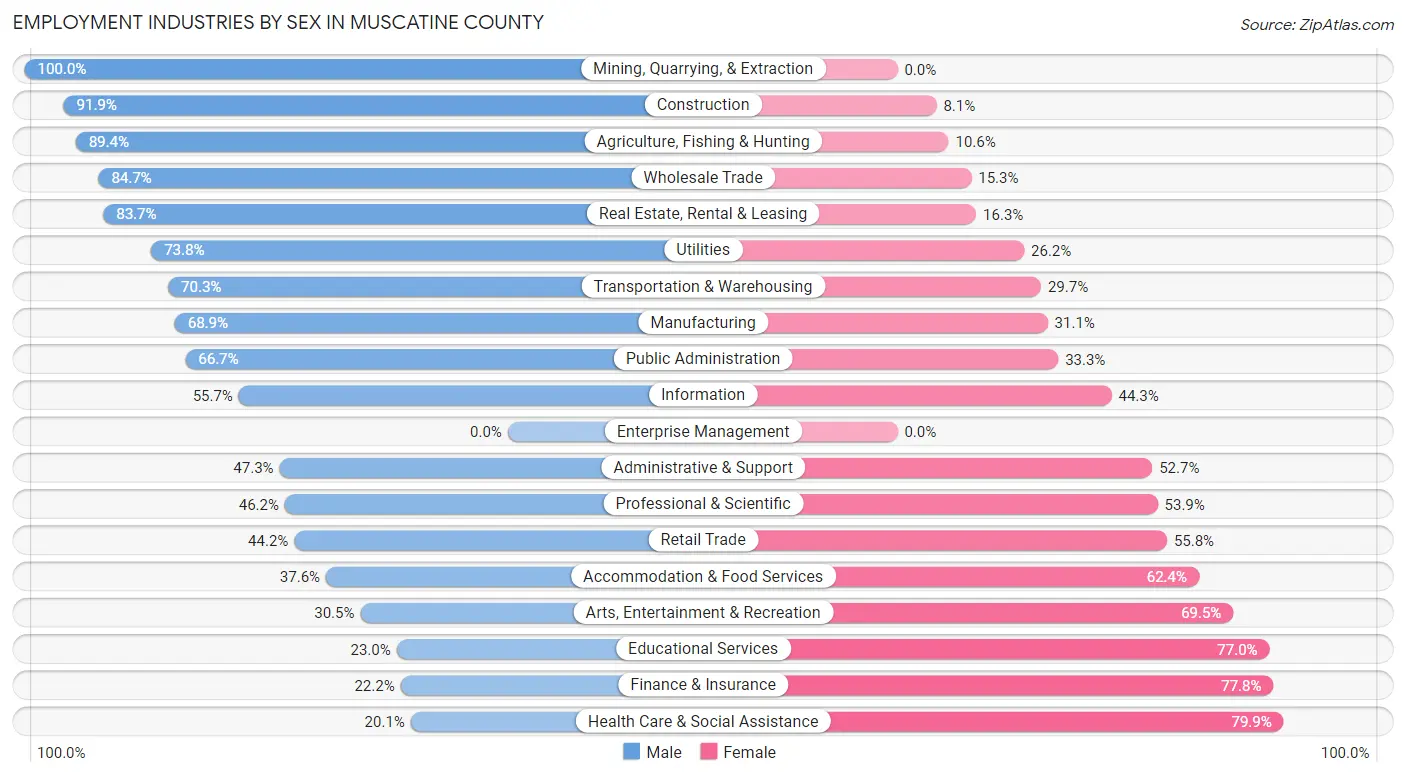
Employment Industries by Sex in Muscatine County
The Muscatine County industries that see more men than women are Mining, Quarrying, & Extraction (100.0%), Construction (91.9%), and Agriculture, Fishing & Hunting (89.4%), whereas the industries that tend to have a higher number of women are Health Care & Social Assistance (79.9%), Finance & Insurance (77.8%), and Educational Services (77.0%).
| Industry | Male | Female |
| Agriculture, Fishing & Hunting | 456 (89.4%) | 54 (10.6%) |
| Mining, Quarrying, & Extraction | 67 (100.0%) | 0 (0.0%) |
| Construction | 1,012 (91.9%) | 89 (8.1%) |
| Manufacturing | 4,585 (68.9%) | 2,070 (31.1%) |
| Wholesale Trade | 460 (84.7%) | 83 (15.3%) |
| Retail Trade | 847 (44.2%) | 1,069 (55.8%) |
| Transportation & Warehousing | 570 (70.3%) | 241 (29.7%) |
| Utilities | 349 (73.8%) | 124 (26.2%) |
| Information | 103 (55.7%) | 82 (44.3%) |
| Finance & Insurance | 97 (22.2%) | 340 (77.8%) |
| Real Estate, Rental & Leasing | 154 (83.7%) | 30 (16.3%) |
| Professional & Scientific | 216 (46.2%) | 252 (53.8%) |
| Enterprise Management | 0 (0.0%) | 0 (0.0%) |
| Administrative & Support | 319 (47.3%) | 356 (52.7%) |
| Educational Services | 413 (23.0%) | 1,382 (77.0%) |
| Health Care & Social Assistance | 555 (20.1%) | 2,207 (79.9%) |
| Arts, Entertainment & Recreation | 90 (30.5%) | 205 (69.5%) |
| Accommodation & Food Services | 333 (37.6%) | 552 (62.4%) |
| Public Administration | 391 (66.7%) | 195 (33.3%) |
| Total | 11,458 (53.9%) | 9,804 (46.1%) |
Education in Muscatine County
School Enrollment in Muscatine County
The most common levels of schooling among the 9,810 students in Muscatine County are middle school (2,548 | 26.0%), high school (2,223 | 22.7%), and elementary school (2,181 | 22.2%).
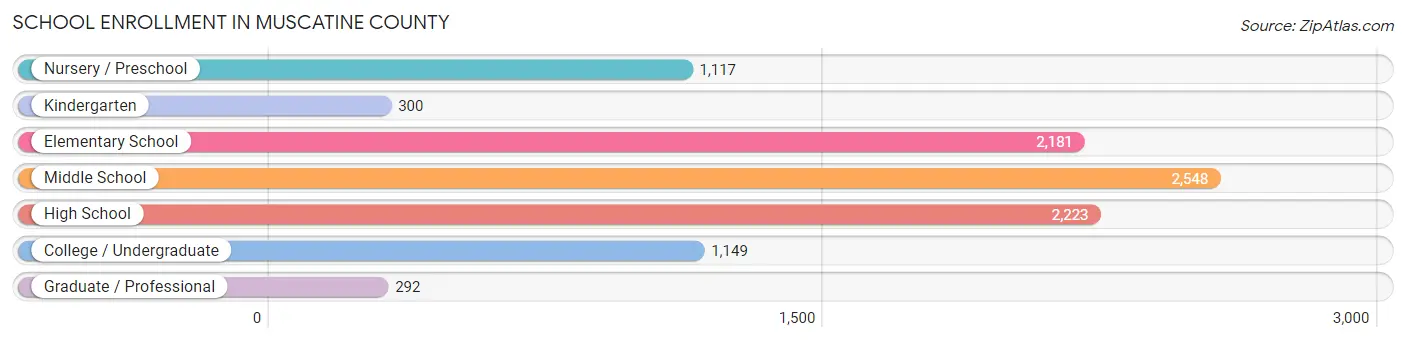
| School Level | # Students | % Students |
| Nursery / Preschool | 1,117 | 11.4% |
| Kindergarten | 300 | 3.1% |
| Elementary School | 2,181 | 22.2% |
| Middle School | 2,548 | 26.0% |
| High School | 2,223 | 22.7% |
| College / Undergraduate | 1,149 | 11.7% |
| Graduate / Professional | 292 | 3.0% |
| Total | 9,810 | 100.0% |
School Enrollment by Age by Funding Source in Muscatine County
Out of a total of 9,810 students who are enrolled in schools in Muscatine County, 1,040 (10.6%) attend a private institution, while the remaining 8,770 (89.4%) are enrolled in public schools. The age group of 35 years and over has the highest likelihood of being enrolled in private schools, with 154 (46.1% in the age bracket) enrolled. Conversely, the age group of 18 to 19 year olds has the lowest likelihood of being enrolled in a private school, with 524 (100.0% in the age bracket) attending a public institution.
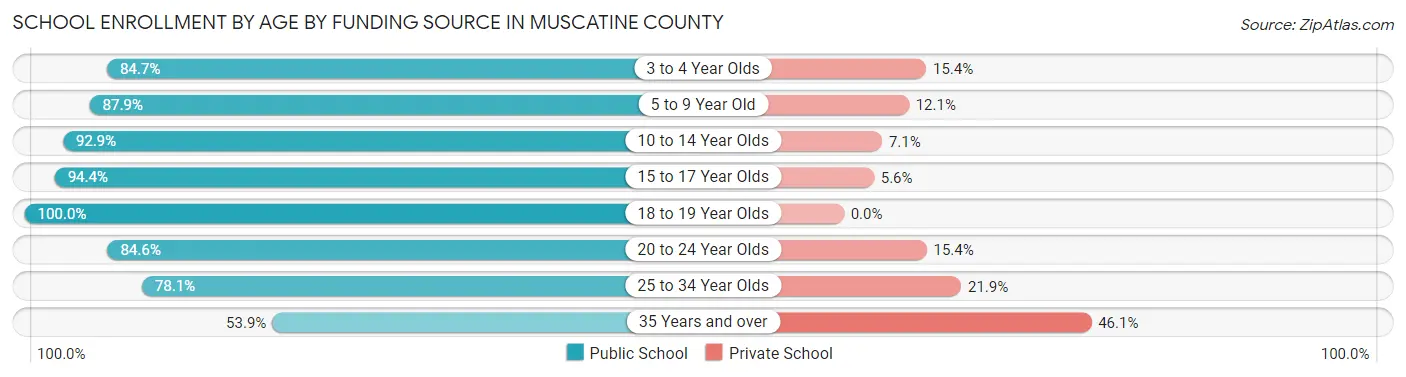
| Age Bracket | Public School | Private School |
| 3 to 4 Year Olds | 623 (84.7%) | 113 (15.3%) |
| 5 to 9 Year Old | 2,219 (87.9%) | 306 (12.1%) |
| 10 to 14 Year Olds | 2,815 (92.9%) | 216 (7.1%) |
| 15 to 17 Year Olds | 1,715 (94.4%) | 102 (5.6%) |
| 18 to 19 Year Olds | 524 (100.0%) | 0 (0.0%) |
| 20 to 24 Year Olds | 504 (84.6%) | 92 (15.4%) |
| 25 to 34 Year Olds | 193 (78.1%) | 54 (21.9%) |
| 35 Years and over | 180 (53.9%) | 154 (46.1%) |
| Total | 8,770 (89.4%) | 1,040 (10.6%) |
Educational Attainment by Field of Study in Muscatine County
Business (1,467 | 20.2%), education (1,456 | 20.0%), science & technology (920 | 12.6%), bio, nature & agricultural (613 | 8.4%), and arts & humanities (516 | 7.1%) are the most common fields of study among 7,282 individuals in Muscatine County who have obtained a bachelor's degree or higher.
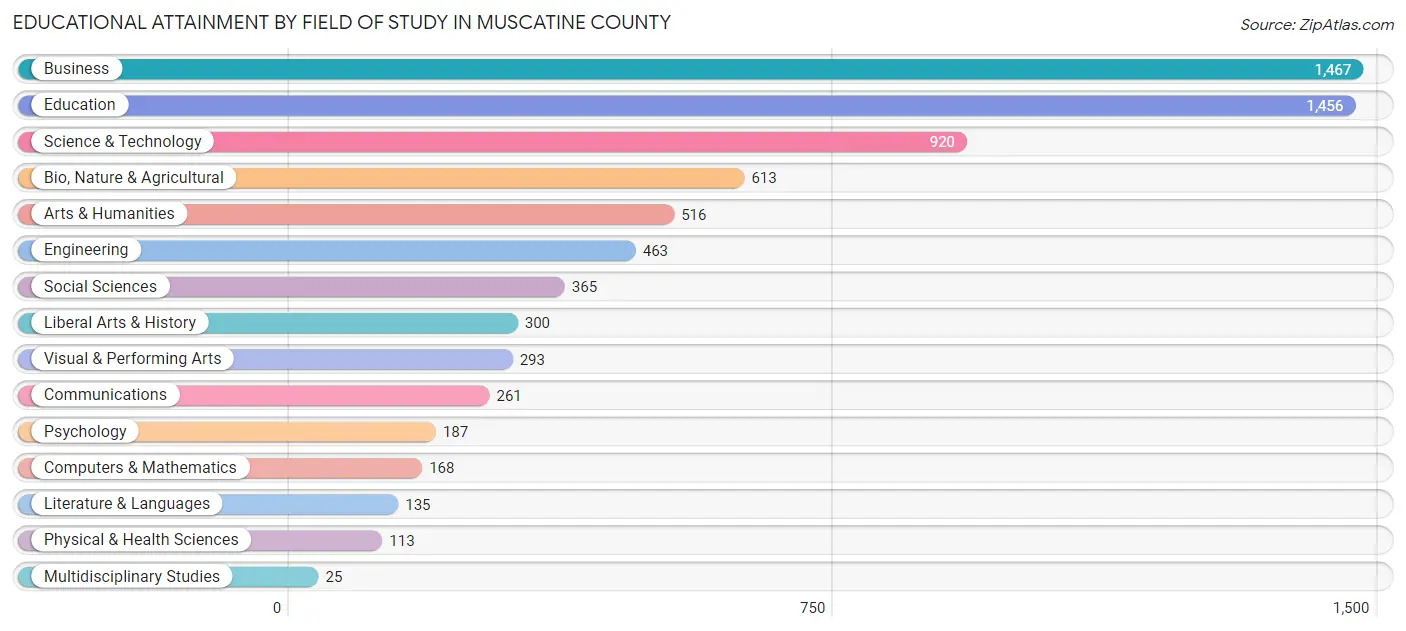
| Field of Study | # Graduates | % Graduates |
| Computers & Mathematics | 168 | 2.3% |
| Bio, Nature & Agricultural | 613 | 8.4% |
| Physical & Health Sciences | 113 | 1.5% |
| Psychology | 187 | 2.6% |
| Social Sciences | 365 | 5.0% |
| Engineering | 463 | 6.4% |
| Multidisciplinary Studies | 25 | 0.3% |
| Science & Technology | 920 | 12.6% |
| Business | 1,467 | 20.2% |
| Education | 1,456 | 20.0% |
| Literature & Languages | 135 | 1.8% |
| Liberal Arts & History | 300 | 4.1% |
| Visual & Performing Arts | 293 | 4.0% |
| Communications | 261 | 3.6% |
| Arts & Humanities | 516 | 7.1% |
| Total | 7,282 | 100.0% |
Transportation & Commute in Muscatine County
Vehicle Availability by Sex in Muscatine County
The most prevalent vehicle ownership categories in Muscatine County are males with 2 vehicles (4,574, accounting for 40.6%) and females with 2 vehicles (3,489, making up 47.7%).
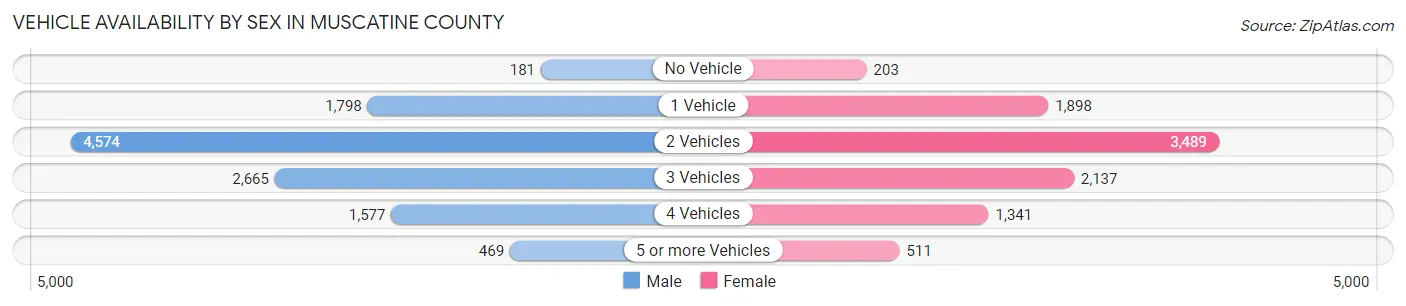
| Vehicles Available | Male | Female |
| No Vehicle | 181 (1.6%) | 203 (2.1%) |
| 1 Vehicle | 1,798 (16.0%) | 1,898 (19.8%) |
| 2 Vehicles | 4,574 (40.6%) | 3,489 (36.4%) |
| 3 Vehicles | 2,665 (23.7%) | 2,137 (22.3%) |
| 4 Vehicles | 1,577 (14.0%) | 1,341 (14.0%) |
| 5 or more Vehicles | 469 (4.2%) | 511 (5.3%) |
| Total | 11,264 (100.0%) | 9,579 (100.0%) |
Commute Time in Muscatine County
The most frequently occuring commute durations in Muscatine County are 10 to 14 minutes (4,032 commuters, 20.2%), 5 to 9 minutes (3,992 commuters, 20.0%), and 15 to 19 minutes (2,882 commuters, 14.5%).
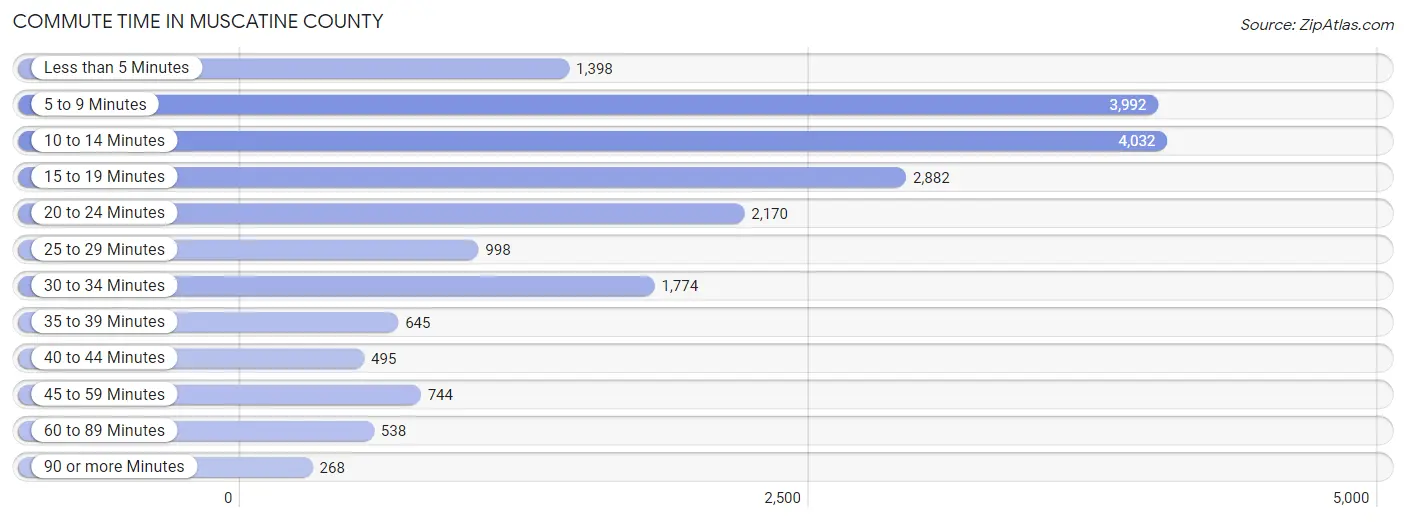
| Commute Time | # Commuters | % Commuters |
| Less than 5 Minutes | 1,398 | 7.0% |
| 5 to 9 Minutes | 3,992 | 20.0% |
| 10 to 14 Minutes | 4,032 | 20.2% |
| 15 to 19 Minutes | 2,882 | 14.5% |
| 20 to 24 Minutes | 2,170 | 10.9% |
| 25 to 29 Minutes | 998 | 5.0% |
| 30 to 34 Minutes | 1,774 | 8.9% |
| 35 to 39 Minutes | 645 | 3.2% |
| 40 to 44 Minutes | 495 | 2.5% |
| 45 to 59 Minutes | 744 | 3.7% |
| 60 to 89 Minutes | 538 | 2.7% |
| 90 or more Minutes | 268 | 1.3% |
Commute Time by Sex in Muscatine County
The most common commute times in Muscatine County are 10 to 14 minutes (2,279 commuters, 20.9%) for males and 5 to 9 minutes (2,088 commuters, 23.1%) for females.
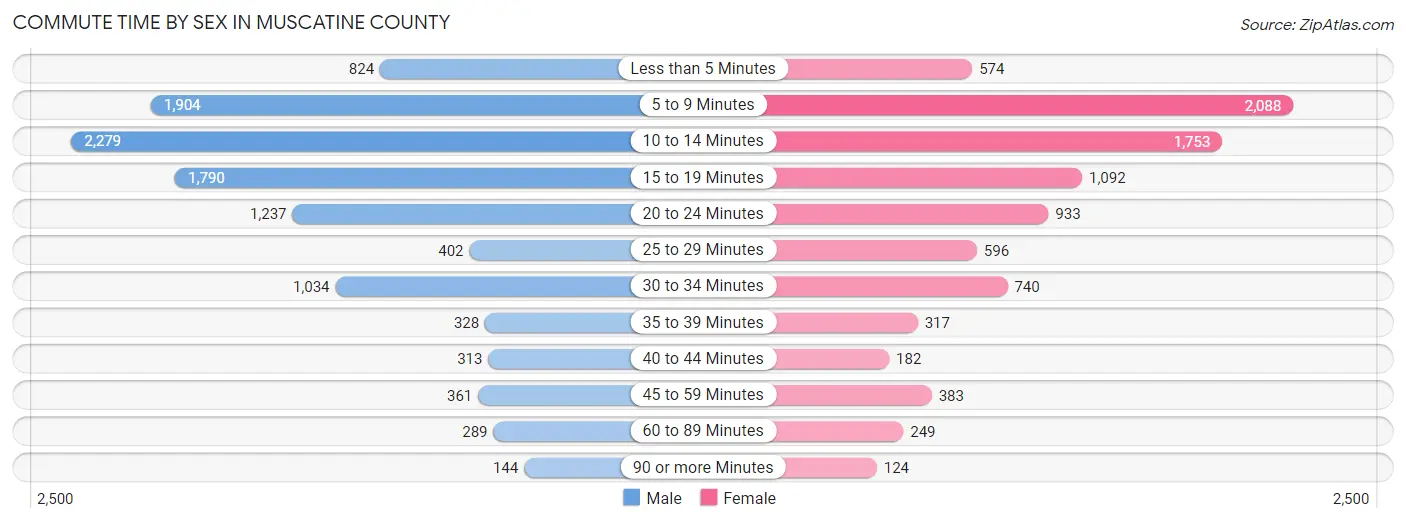
| Commute Time | Male | Female |
| Less than 5 Minutes | 824 (7.6%) | 574 (6.4%) |
| 5 to 9 Minutes | 1,904 (17.5%) | 2,088 (23.1%) |
| 10 to 14 Minutes | 2,279 (20.9%) | 1,753 (19.4%) |
| 15 to 19 Minutes | 1,790 (16.4%) | 1,092 (12.1%) |
| 20 to 24 Minutes | 1,237 (11.3%) | 933 (10.3%) |
| 25 to 29 Minutes | 402 (3.7%) | 596 (6.6%) |
| 30 to 34 Minutes | 1,034 (9.5%) | 740 (8.2%) |
| 35 to 39 Minutes | 328 (3.0%) | 317 (3.5%) |
| 40 to 44 Minutes | 313 (2.9%) | 182 (2.0%) |
| 45 to 59 Minutes | 361 (3.3%) | 383 (4.2%) |
| 60 to 89 Minutes | 289 (2.6%) | 249 (2.8%) |
| 90 or more Minutes | 144 (1.3%) | 124 (1.4%) |
Time of Departure to Work by Sex in Muscatine County
The most frequent times of departure to work in Muscatine County are 6:30 AM to 6:59 AM (1,300, 11.9%) for males and 7:30 AM to 7:59 AM (1,707, 18.9%) for females.
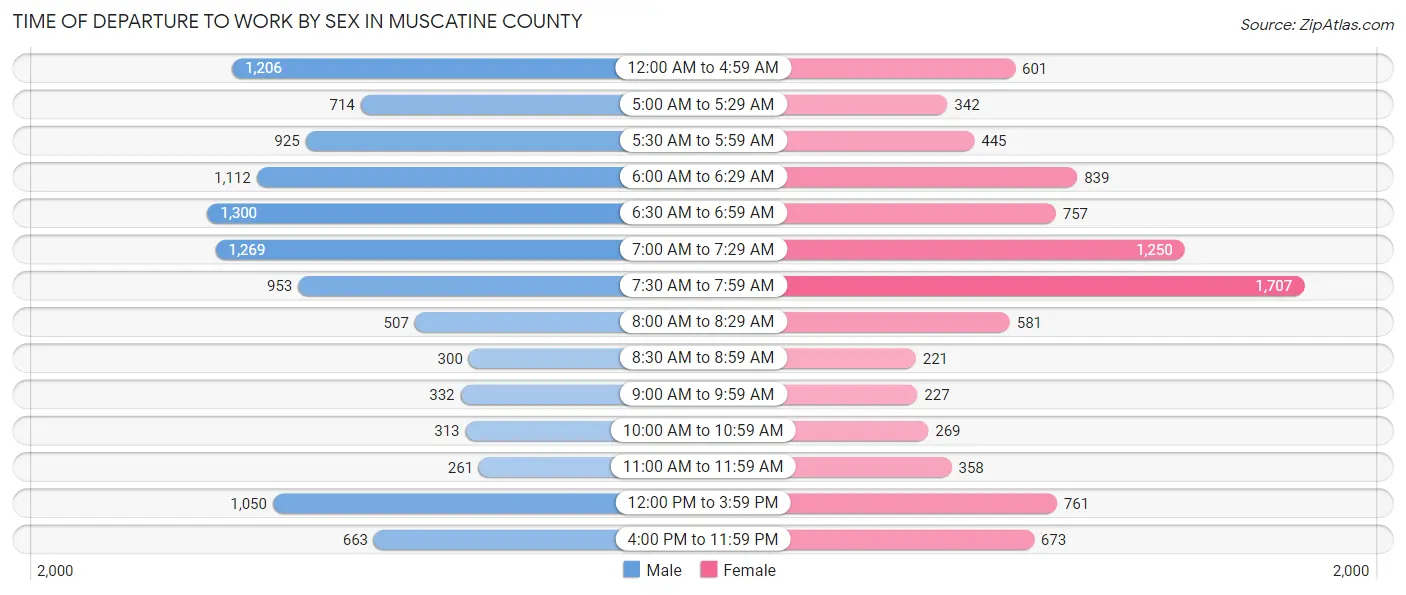
| Time of Departure | Male | Female |
| 12:00 AM to 4:59 AM | 1,206 (11.1%) | 601 (6.7%) |
| 5:00 AM to 5:29 AM | 714 (6.6%) | 342 (3.8%) |
| 5:30 AM to 5:59 AM | 925 (8.5%) | 445 (4.9%) |
| 6:00 AM to 6:29 AM | 1,112 (10.2%) | 839 (9.3%) |
| 6:30 AM to 6:59 AM | 1,300 (11.9%) | 757 (8.4%) |
| 7:00 AM to 7:29 AM | 1,269 (11.6%) | 1,250 (13.8%) |
| 7:30 AM to 7:59 AM | 953 (8.7%) | 1,707 (18.9%) |
| 8:00 AM to 8:29 AM | 507 (4.6%) | 581 (6.4%) |
| 8:30 AM to 8:59 AM | 300 (2.8%) | 221 (2.5%) |
| 9:00 AM to 9:59 AM | 332 (3.0%) | 227 (2.5%) |
| 10:00 AM to 10:59 AM | 313 (2.9%) | 269 (3.0%) |
| 11:00 AM to 11:59 AM | 261 (2.4%) | 358 (4.0%) |
| 12:00 PM to 3:59 PM | 1,050 (9.6%) | 761 (8.4%) |
| 4:00 PM to 11:59 PM | 663 (6.1%) | 673 (7.4%) |
| Total | 10,905 (100.0%) | 9,031 (100.0%) |
Housing Occupancy in Muscatine County
Occupancy by Ownership in Muscatine County
Of the total 17,075 dwellings in Muscatine County, owner-occupied units account for 12,872 (75.4%), while renter-occupied units make up 4,203 (24.6%).
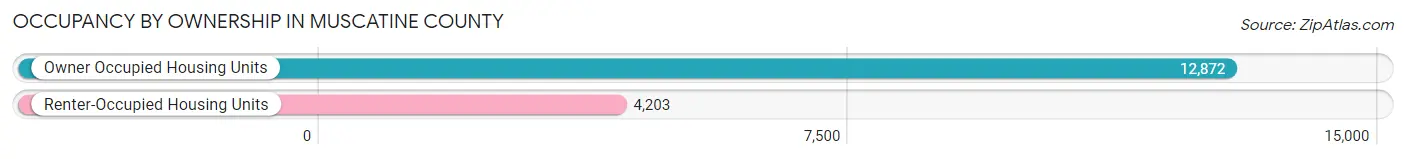
| Occupancy | # Housing Units | % Housing Units |
| Owner Occupied Housing Units | 12,872 | 75.4% |
| Renter-Occupied Housing Units | 4,203 | 24.6% |
| Total Occupied Housing Units | 17,075 | 100.0% |
Occupancy by Household Size in Muscatine County
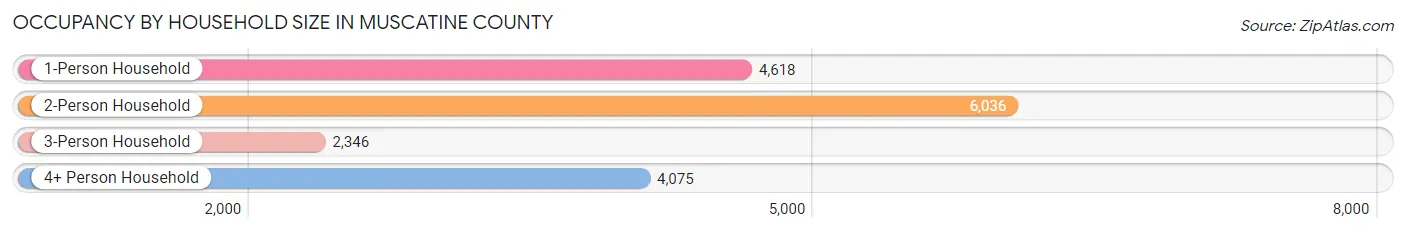
| Household Size | # Housing Units | % Housing Units |
| 1-Person Household | 4,618 | 27.1% |
| 2-Person Household | 6,036 | 35.3% |
| 3-Person Household | 2,346 | 13.7% |
| 4+ Person Household | 4,075 | 23.9% |
| Total Housing Units | 17,075 | 100.0% |
Occupancy by Ownership by Household Size in Muscatine County
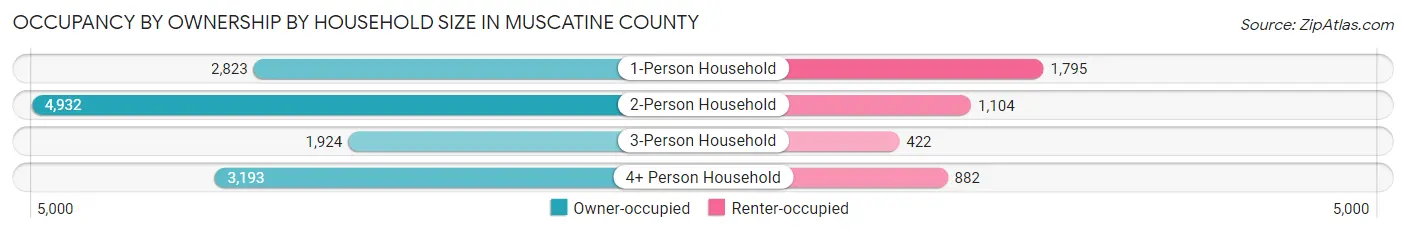
| Household Size | Owner-occupied | Renter-occupied |
| 1-Person Household | 2,823 (61.1%) | 1,795 (38.9%) |
| 2-Person Household | 4,932 (81.7%) | 1,104 (18.3%) |
| 3-Person Household | 1,924 (82.0%) | 422 (18.0%) |
| 4+ Person Household | 3,193 (78.4%) | 882 (21.6%) |
| Total Housing Units | 12,872 (75.4%) | 4,203 (24.6%) |
Occupancy by Educational Attainment in Muscatine County
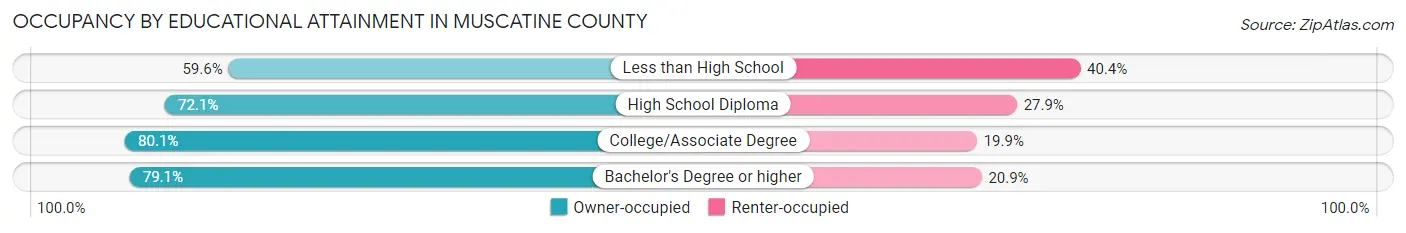
| Household Size | Owner-occupied | Renter-occupied |
| Less than High School | 871 (59.6%) | 591 (40.4%) |
| High School Diploma | 4,187 (72.1%) | 1,617 (27.9%) |
| College/Associate Degree | 4,458 (80.1%) | 1,110 (19.9%) |
| Bachelor's Degree or higher | 3,356 (79.1%) | 885 (20.9%) |
Occupancy by Age of Householder in Muscatine County
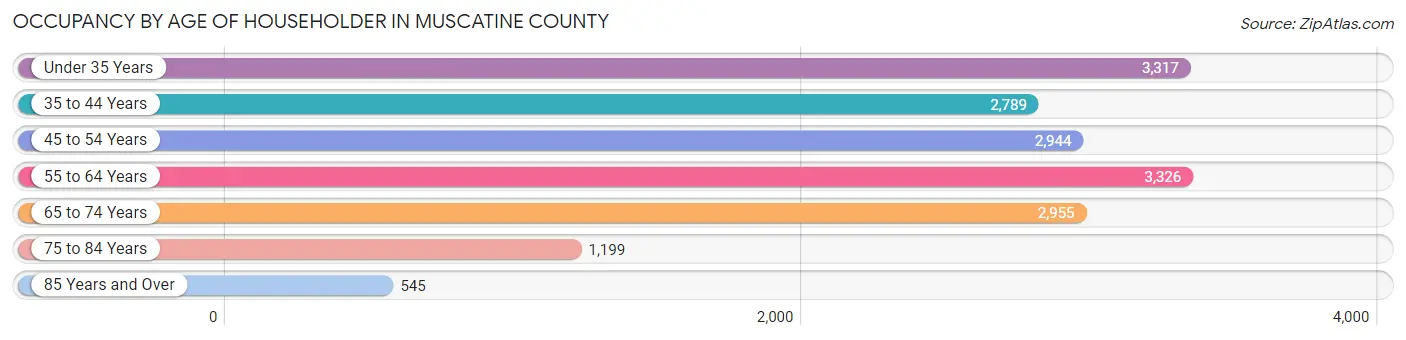
| Age Bracket | # Households | % Households |
| Under 35 Years | 3,317 | 19.4% |
| 35 to 44 Years | 2,789 | 16.3% |
| 45 to 54 Years | 2,944 | 17.2% |
| 55 to 64 Years | 3,326 | 19.5% |
| 65 to 74 Years | 2,955 | 17.3% |
| 75 to 84 Years | 1,199 | 7.0% |
| 85 Years and Over | 545 | 3.2% |
| Total | 17,075 | 100.0% |
Housing Finances in Muscatine County
Median Income by Occupancy in Muscatine County
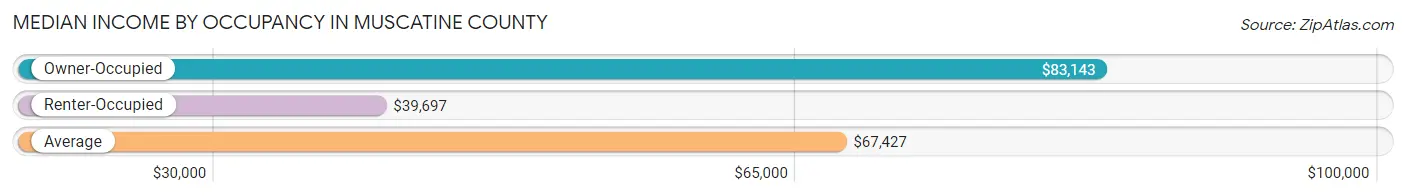
| Occupancy Type | # Households | Median Income |
| Owner-Occupied | 12,872 (75.4%) | $83,143 |
| Renter-Occupied | 4,203 (24.6%) | $39,697 |
| Average | 17,075 (100.0%) | $67,427 |
Occupancy by Householder Income Bracket in Muscatine County

| Income Bracket | Owner-occupied | Renter-occupied |
| Less than $5,000 | 133 (1.0%) | 248 (5.9%) |
| $5,000 to $9,999 | 95 (0.7%) | 102 (2.4%) |
| $10,000 to $14,999 | 206 (1.6%) | 497 (11.8%) |
| $15,000 to $19,999 | 250 (1.9%) | 223 (5.3%) |
| $20,000 to $24,999 | 351 (2.7%) | 263 (6.3%) |
| $25,000 to $34,999 | 863 (6.7%) | 496 (11.8%) |
| $35,000 to $49,999 | 1,722 (13.4%) | 634 (15.1%) |
| $50,000 to $74,999 | 2,229 (17.3%) | 977 (23.3%) |
| $75,000 to $99,999 | 1,883 (14.6%) | 485 (11.5%) |
| $100,000 to $149,999 | 3,235 (25.1%) | 220 (5.2%) |
| $150,000 or more | 1,905 (14.8%) | 58 (1.4%) |
| Total | 12,872 (100.0%) | 4,203 (100.0%) |
Monthly Housing Cost Tiers in Muscatine County
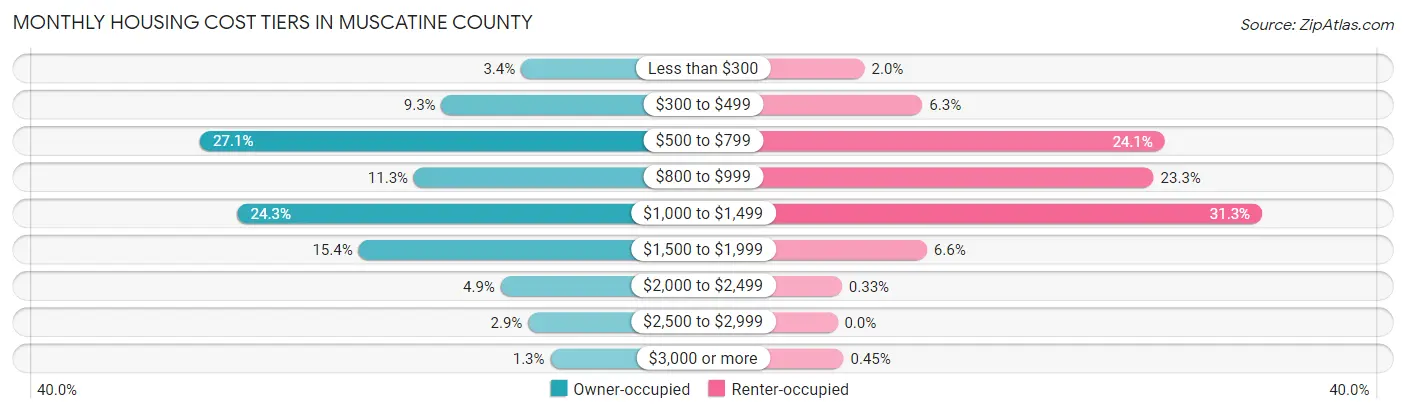
| Monthly Cost | Owner-occupied | Renter-occupied |
| Less than $300 | 443 (3.4%) | 84 (2.0%) |
| $300 to $499 | 1,197 (9.3%) | 263 (6.3%) |
| $500 to $799 | 3,486 (27.1%) | 1,013 (24.1%) |
| $800 to $999 | 1,459 (11.3%) | 979 (23.3%) |
| $1,000 to $1,499 | 3,129 (24.3%) | 1,314 (31.3%) |
| $1,500 to $1,999 | 1,983 (15.4%) | 277 (6.6%) |
| $2,000 to $2,499 | 636 (4.9%) | 14 (0.3%) |
| $2,500 to $2,999 | 374 (2.9%) | 0 (0.0%) |
| $3,000 or more | 165 (1.3%) | 19 (0.4%) |
| Total | 12,872 (100.0%) | 4,203 (100.0%) |
Physical Housing Characteristics in Muscatine County
Housing Structures in Muscatine County
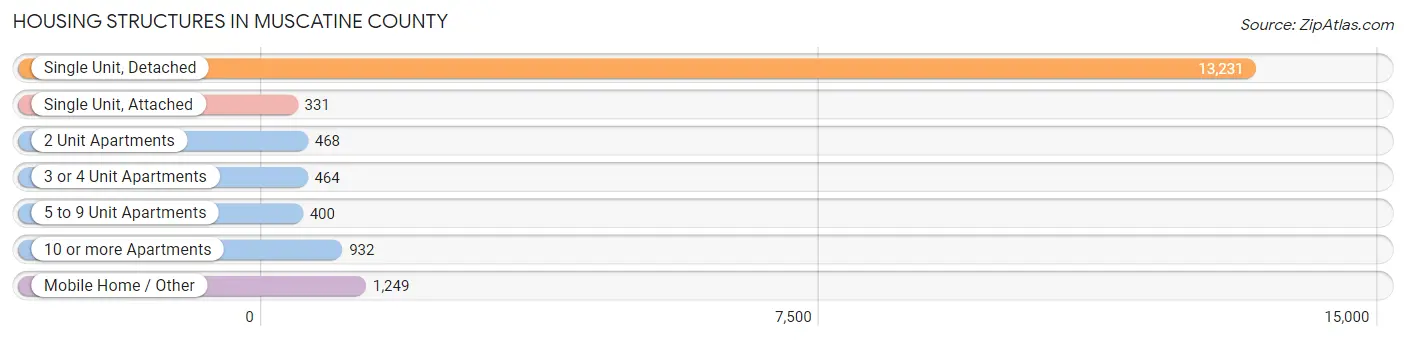
| Structure Type | # Housing Units | % Housing Units |
| Single Unit, Detached | 13,231 | 77.5% |
| Single Unit, Attached | 331 | 1.9% |
| 2 Unit Apartments | 468 | 2.7% |
| 3 or 4 Unit Apartments | 464 | 2.7% |
| 5 to 9 Unit Apartments | 400 | 2.3% |
| 10 or more Apartments | 932 | 5.5% |
| Mobile Home / Other | 1,249 | 7.3% |
| Total | 17,075 | 100.0% |
Housing Structures by Occupancy in Muscatine County
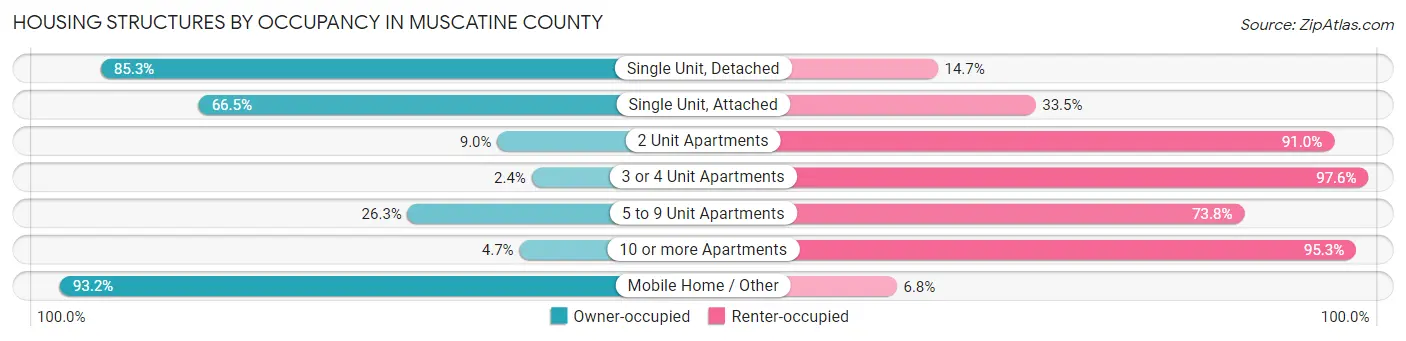
| Structure Type | Owner-occupied | Renter-occupied |
| Single Unit, Detached | 11,286 (85.3%) | 1,945 (14.7%) |
| Single Unit, Attached | 220 (66.5%) | 111 (33.5%) |
| 2 Unit Apartments | 42 (9.0%) | 426 (91.0%) |
| 3 or 4 Unit Apartments | 11 (2.4%) | 453 (97.6%) |
| 5 to 9 Unit Apartments | 105 (26.3%) | 295 (73.8%) |
| 10 or more Apartments | 44 (4.7%) | 888 (95.3%) |
| Mobile Home / Other | 1,164 (93.2%) | 85 (6.8%) |
| Total | 12,872 (75.4%) | 4,203 (24.6%) |
Housing Structures by Number of Rooms in Muscatine County
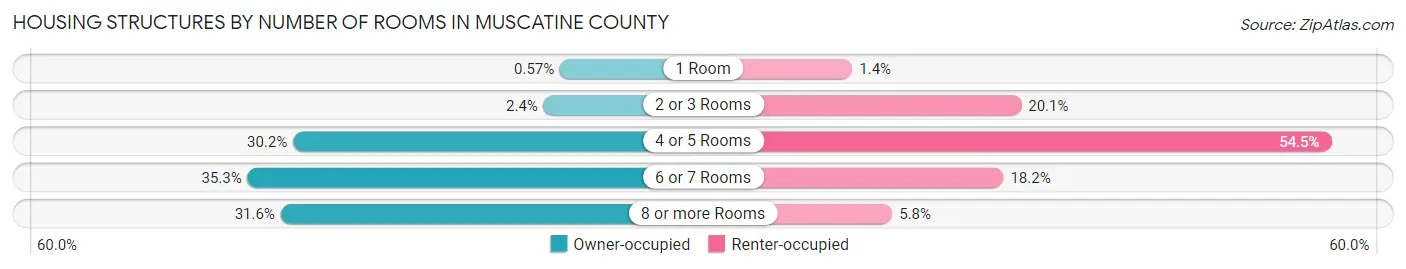
| Number of Rooms | Owner-occupied | Renter-occupied |
| 1 Room | 74 (0.6%) | 58 (1.4%) |
| 2 or 3 Rooms | 307 (2.4%) | 846 (20.1%) |
| 4 or 5 Rooms | 3,887 (30.2%) | 2,292 (54.5%) |
| 6 or 7 Rooms | 4,539 (35.3%) | 763 (18.1%) |
| 8 or more Rooms | 4,065 (31.6%) | 244 (5.8%) |
| Total | 12,872 (100.0%) | 4,203 (100.0%) |
Housing Structure by Heating Type in Muscatine County
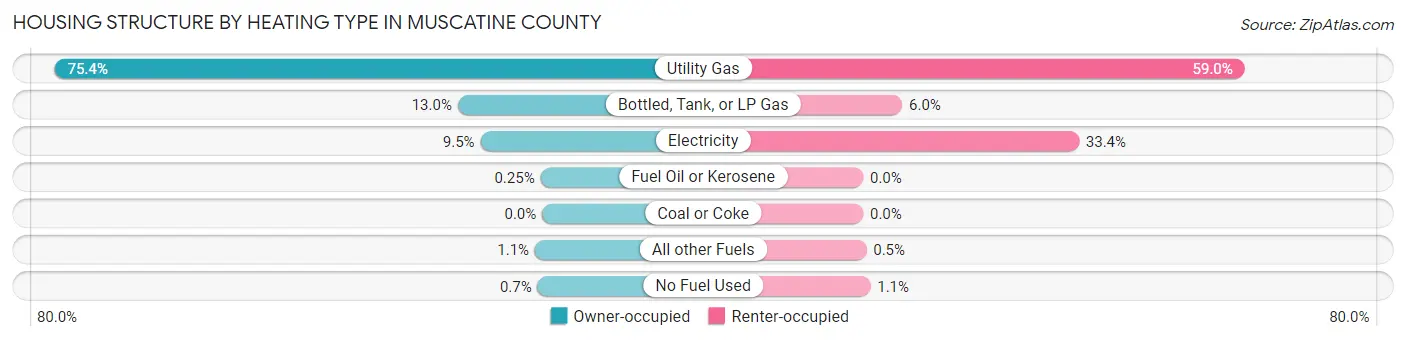
| Heating Type | Owner-occupied | Renter-occupied |
| Utility Gas | 9,701 (75.4%) | 2,479 (59.0%) |
| Bottled, Tank, or LP Gas | 1,679 (13.0%) | 254 (6.0%) |
| Electricity | 1,227 (9.5%) | 1,402 (33.4%) |
| Fuel Oil or Kerosene | 32 (0.3%) | 0 (0.0%) |
| Coal or Coke | 0 (0.0%) | 0 (0.0%) |
| All other Fuels | 143 (1.1%) | 21 (0.5%) |
| No Fuel Used | 90 (0.7%) | 47 (1.1%) |
| Total | 12,872 (100.0%) | 4,203 (100.0%) |
Household Vehicle Usage in Muscatine County
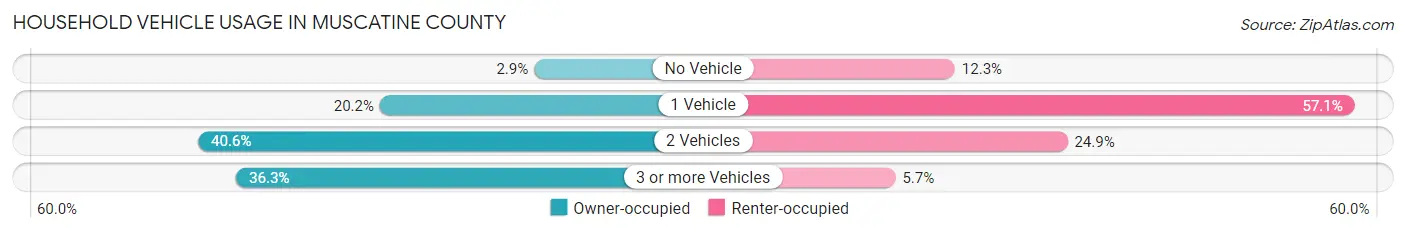
| Vehicles per Household | Owner-occupied | Renter-occupied |
| No Vehicle | 377 (2.9%) | 518 (12.3%) |
| 1 Vehicle | 2,601 (20.2%) | 2,399 (57.1%) |
| 2 Vehicles | 5,222 (40.6%) | 1,048 (24.9%) |
| 3 or more Vehicles | 4,672 (36.3%) | 238 (5.7%) |
| Total | 12,872 (100.0%) | 4,203 (100.0%) |
Real Estate & Mortgages in Muscatine County
Real Estate and Mortgage Overview in Muscatine County
| Characteristic | Without Mortgage | With Mortgage |
| Housing Units | 5,546 | 7,326 |
| Median Property Value | $146,400 | $165,900 |
| Median Household Income | $64,275 | $1,449 |
| Monthly Housing Costs | $592 | $165 |
| Real Estate Taxes | $2,462 | $19 |
Property Value by Mortgage Status in Muscatine County
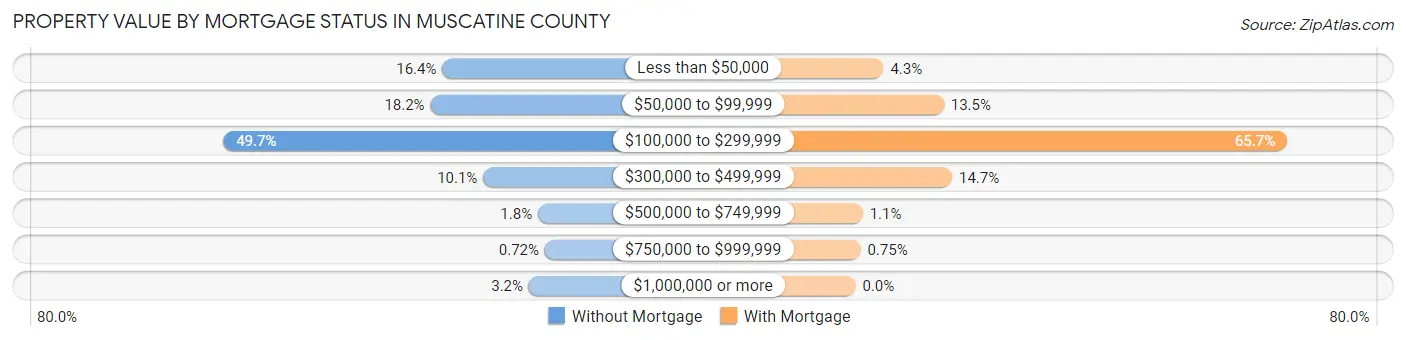
| Property Value | Without Mortgage | With Mortgage |
| Less than $50,000 | 907 (16.4%) | 312 (4.3%) |
| $50,000 to $99,999 | 1,007 (18.2%) | 985 (13.5%) |
| $100,000 to $299,999 | 2,758 (49.7%) | 4,816 (65.7%) |
| $300,000 to $499,999 | 561 (10.1%) | 1,078 (14.7%) |
| $500,000 to $749,999 | 98 (1.8%) | 80 (1.1%) |
| $750,000 to $999,999 | 40 (0.7%) | 55 (0.7%) |
| $1,000,000 or more | 175 (3.2%) | 0 (0.0%) |
| Total | 5,546 (100.0%) | 7,326 (100.0%) |
Household Income by Mortgage Status in Muscatine County
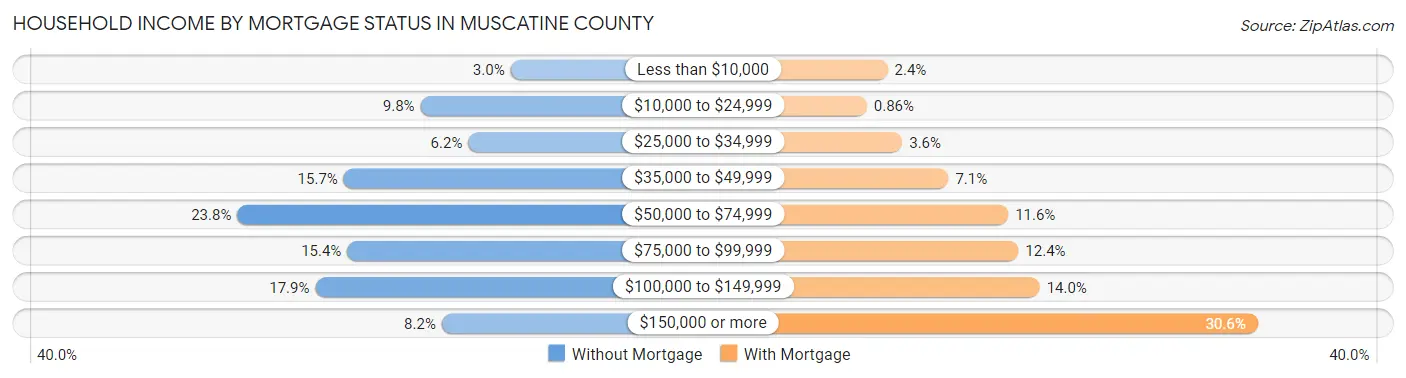
| Household Income | Without Mortgage | With Mortgage |
| Less than $10,000 | 165 (3.0%) | 179 (2.4%) |
| $10,000 to $24,999 | 546 (9.8%) | 63 (0.9%) |
| $25,000 to $34,999 | 344 (6.2%) | 261 (3.6%) |
| $35,000 to $49,999 | 870 (15.7%) | 519 (7.1%) |
| $50,000 to $74,999 | 1,320 (23.8%) | 852 (11.6%) |
| $75,000 to $99,999 | 855 (15.4%) | 909 (12.4%) |
| $100,000 to $149,999 | 990 (17.8%) | 1,028 (14.0%) |
| $150,000 or more | 456 (8.2%) | 2,245 (30.6%) |
| Total | 5,546 (100.0%) | 7,326 (100.0%) |
Property Value to Household Income Ratio in Muscatine County
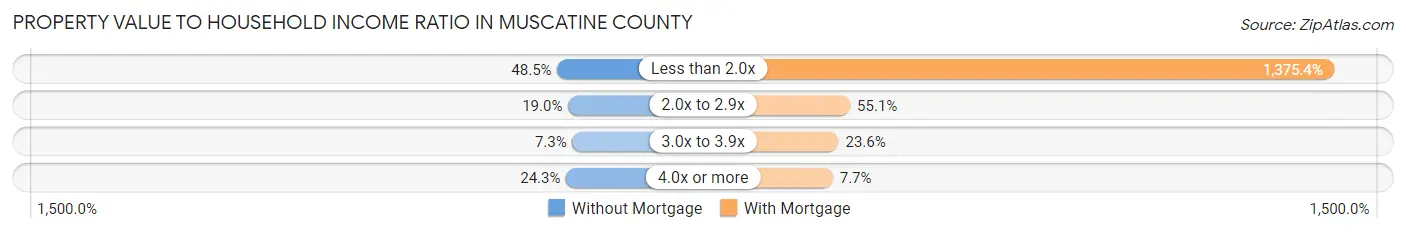
| Value-to-Income Ratio | Without Mortgage | With Mortgage |
| Less than 2.0x | 2,689 (48.5%) | 100,760 (1,375.4%) |
| 2.0x to 2.9x | 1,054 (19.0%) | 4,036 (55.1%) |
| 3.0x to 3.9x | 407 (7.3%) | 1,726 (23.6%) |
| 4.0x or more | 1,346 (24.3%) | 566 (7.7%) |
| Total | 5,546 (100.0%) | 7,326 (100.0%) |
Real Estate Taxes by Mortgage Status in Muscatine County
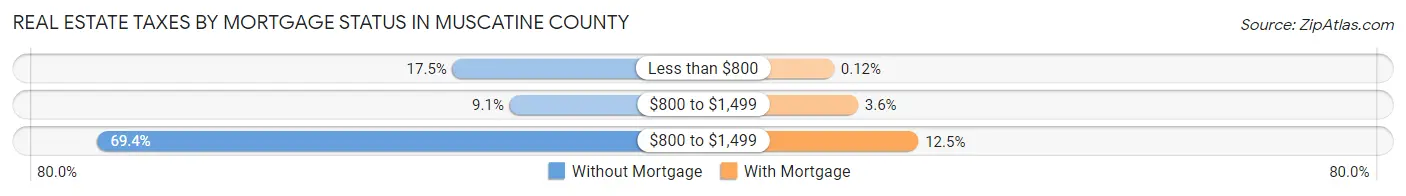
| Property Taxes | Without Mortgage | With Mortgage |
| Less than $800 | 968 (17.4%) | 9 (0.1%) |
| $800 to $1,499 | 505 (9.1%) | 266 (3.6%) |
| $800 to $1,499 | 3,846 (69.4%) | 912 (12.4%) |
| Total | 5,546 (100.0%) | 7,326 (100.0%) |
Health & Disability in Muscatine County
Health Insurance Coverage by Age in Muscatine County
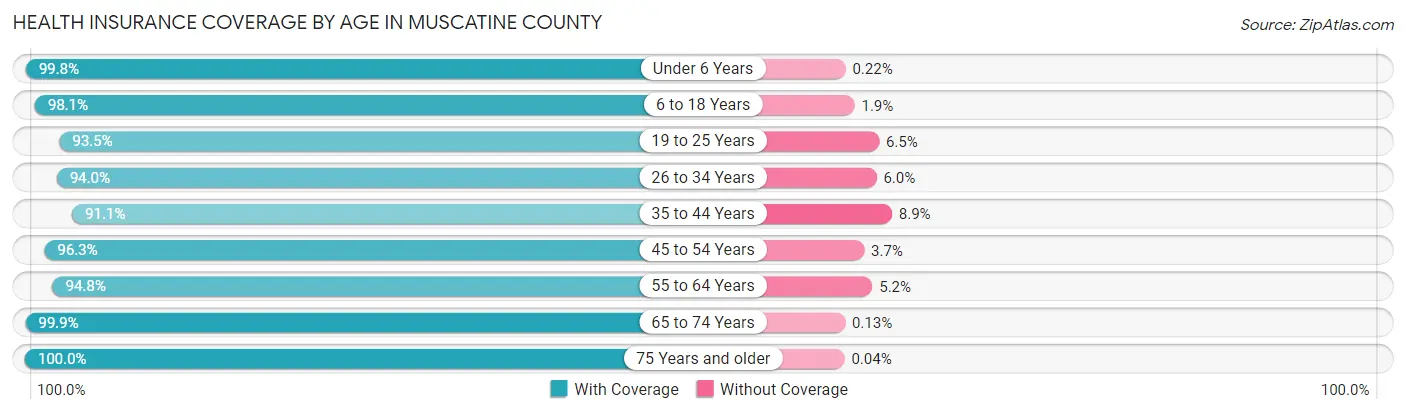
| Age Bracket | With Coverage | Without Coverage |
| Under 6 Years | 3,141 (99.8%) | 7 (0.2%) |
| 6 to 18 Years | 7,642 (98.1%) | 149 (1.9%) |
| 19 to 25 Years | 3,414 (93.5%) | 236 (6.5%) |
| 26 to 34 Years | 4,249 (94.0%) | 271 (6.0%) |
| 35 to 44 Years | 4,746 (91.1%) | 462 (8.9%) |
| 45 to 54 Years | 4,984 (96.3%) | 191 (3.7%) |
| 55 to 64 Years | 5,450 (94.8%) | 300 (5.2%) |
| 65 to 74 Years | 4,471 (99.9%) | 6 (0.1%) |
| 75 Years and older | 2,481 (100.0%) | 1 (0.0%) |
| Total | 40,578 (96.2%) | 1,623 (3.8%) |
Health Insurance Coverage by Citizenship Status in Muscatine County
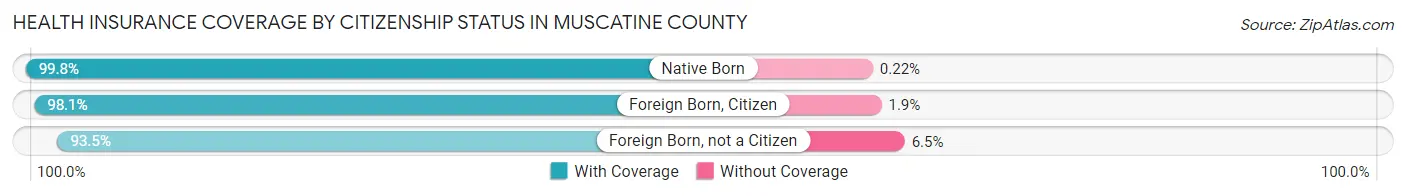
| Citizenship Status | With Coverage | Without Coverage |
| Native Born | 3,141 (99.8%) | 7 (0.2%) |
| Foreign Born, Citizen | 7,642 (98.1%) | 149 (1.9%) |
| Foreign Born, not a Citizen | 3,414 (93.5%) | 236 (6.5%) |
Health Insurance Coverage by Household Income in Muscatine County
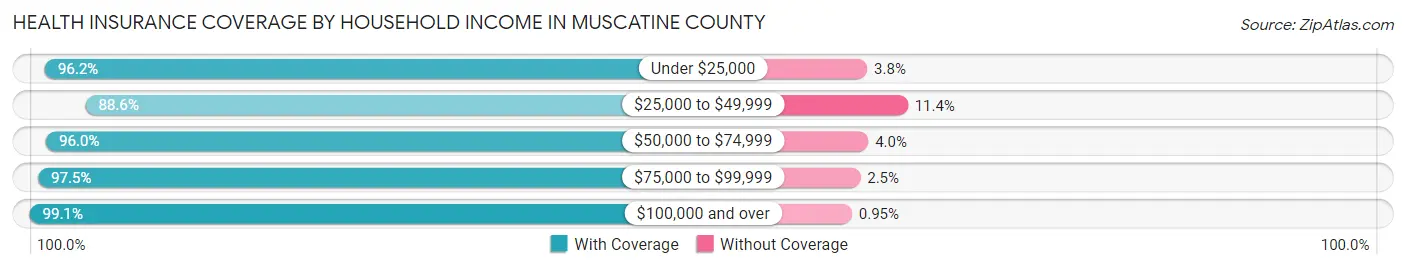
| Household Income | With Coverage | Without Coverage |
| Under $25,000 | 3,916 (96.2%) | 155 (3.8%) |
| $25,000 to $49,999 | 6,273 (88.6%) | 808 (11.4%) |
| $50,000 to $74,999 | 7,873 (96.0%) | 330 (4.0%) |
| $75,000 to $99,999 | 6,058 (97.5%) | 157 (2.5%) |
| $100,000 and over | 16,404 (99.1%) | 157 (0.9%) |
Public vs Private Health Insurance Coverage by Age in Muscatine County
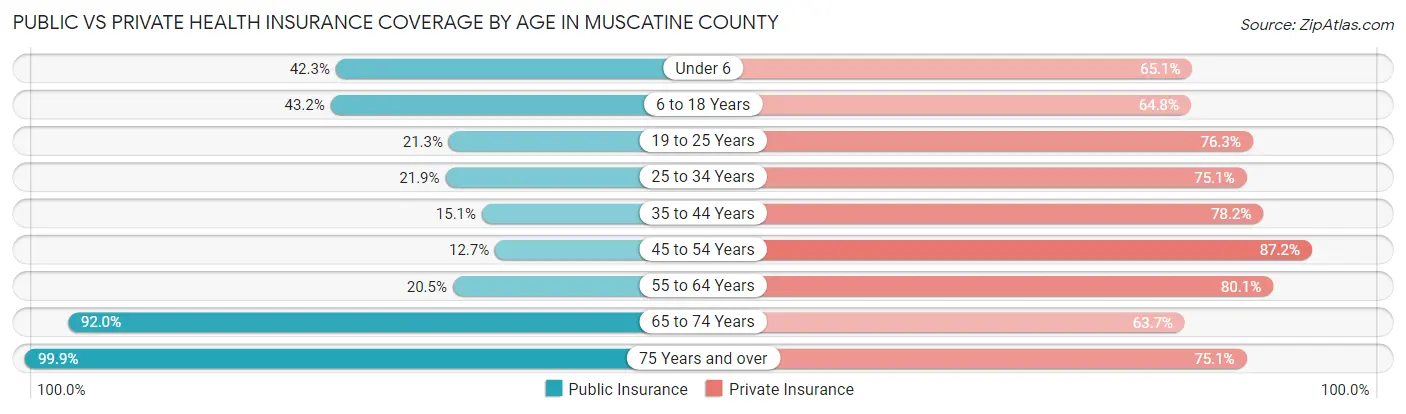
| Age Bracket | Public Insurance | Private Insurance |
| Under 6 | 1,330 (42.2%) | 2,048 (65.1%) |
| 6 to 18 Years | 3,367 (43.2%) | 5,048 (64.8%) |
| 19 to 25 Years | 776 (21.3%) | 2,784 (76.3%) |
| 25 to 34 Years | 990 (21.9%) | 3,394 (75.1%) |
| 35 to 44 Years | 788 (15.1%) | 4,073 (78.2%) |
| 45 to 54 Years | 656 (12.7%) | 4,514 (87.2%) |
| 55 to 64 Years | 1,180 (20.5%) | 4,603 (80.0%) |
| 65 to 74 Years | 4,117 (92.0%) | 2,851 (63.7%) |
| 75 Years and over | 2,480 (99.9%) | 1,864 (75.1%) |
| Total | 15,684 (37.2%) | 31,179 (73.9%) |
Disability Status by Sex by Age in Muscatine County
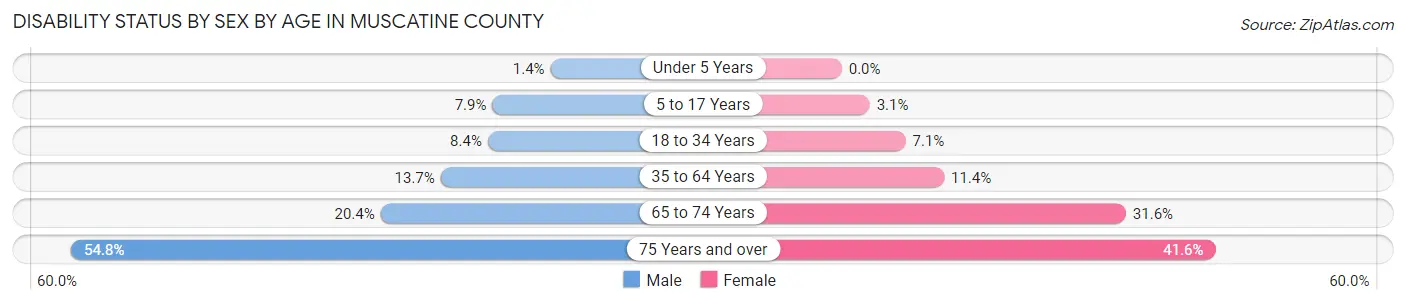
| Age Bracket | Male | Female |
| Under 5 Years | 20 (1.4%) | 0 (0.0%) |
| 5 to 17 Years | 310 (7.9%) | 123 (3.1%) |
| 18 to 34 Years | 371 (8.4%) | 300 (7.1%) |
| 35 to 64 Years | 1,129 (13.7%) | 897 (11.4%) |
| 65 to 74 Years | 438 (20.4%) | 736 (31.6%) |
| 75 Years and over | 546 (54.8%) | 618 (41.6%) |
Disability Class by Sex by Age in Muscatine County
Disability Class: Hearing Difficulty
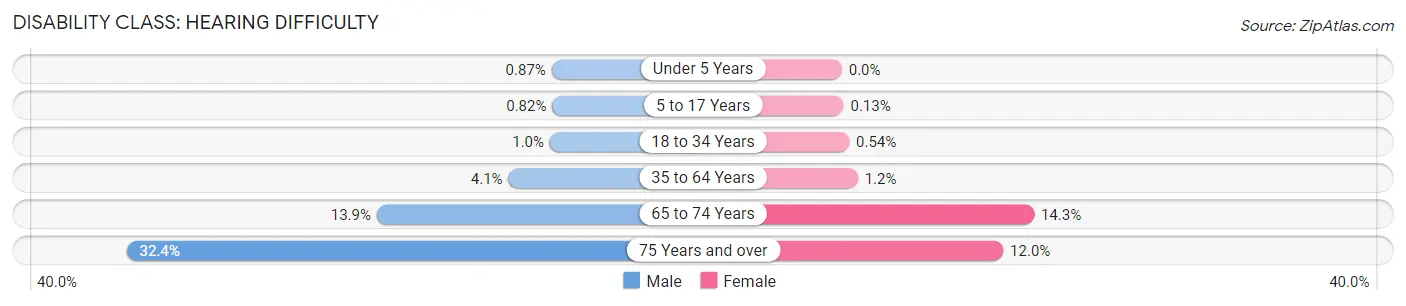
| Age Bracket | Male | Female |
| Under 5 Years | 12 (0.9%) | 0 (0.0%) |
| 5 to 17 Years | 32 (0.8%) | 5 (0.1%) |
| 18 to 34 Years | 44 (1.0%) | 23 (0.5%) |
| 35 to 64 Years | 337 (4.1%) | 93 (1.2%) |
| 65 to 74 Years | 298 (13.9%) | 332 (14.3%) |
| 75 Years and over | 323 (32.4%) | 178 (12.0%) |
Disability Class: Vision Difficulty
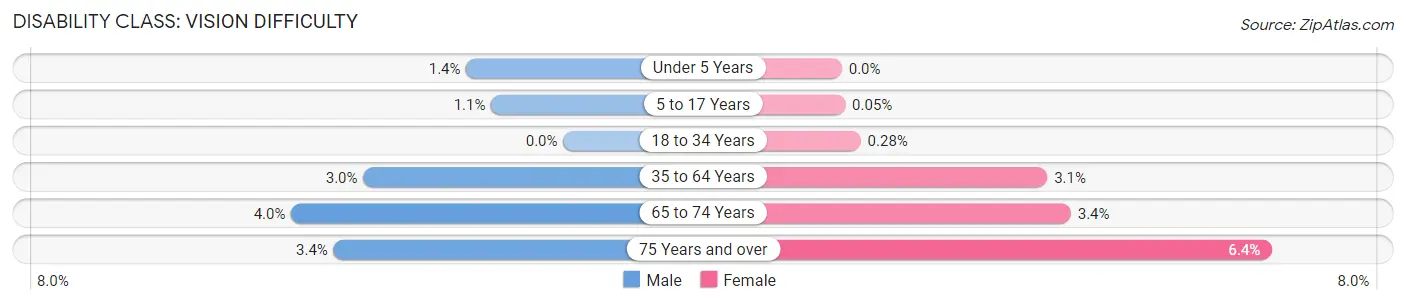
| Age Bracket | Male | Female |
| Under 5 Years | 20 (1.4%) | 0 (0.0%) |
| 5 to 17 Years | 42 (1.1%) | 2 (0.1%) |
| 18 to 34 Years | 0 (0.0%) | 12 (0.3%) |
| 35 to 64 Years | 245 (3.0%) | 240 (3.0%) |
| 65 to 74 Years | 87 (4.0%) | 79 (3.4%) |
| 75 Years and over | 34 (3.4%) | 95 (6.4%) |
Disability Class: Cognitive Difficulty
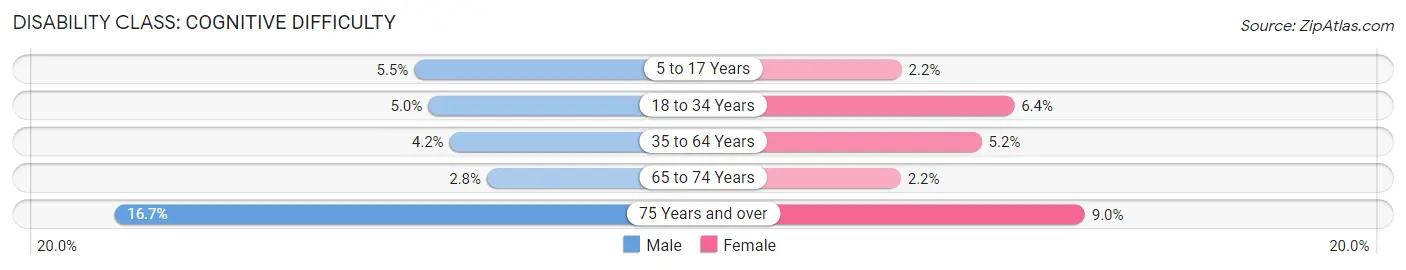
| Age Bracket | Male | Female |
| 5 to 17 Years | 217 (5.5%) | 88 (2.2%) |
| 18 to 34 Years | 221 (5.0%) | 270 (6.4%) |
| 35 to 64 Years | 349 (4.2%) | 409 (5.2%) |
| 65 to 74 Years | 61 (2.8%) | 51 (2.2%) |
| 75 Years and over | 166 (16.7%) | 134 (9.0%) |
Disability Class: Ambulatory Difficulty
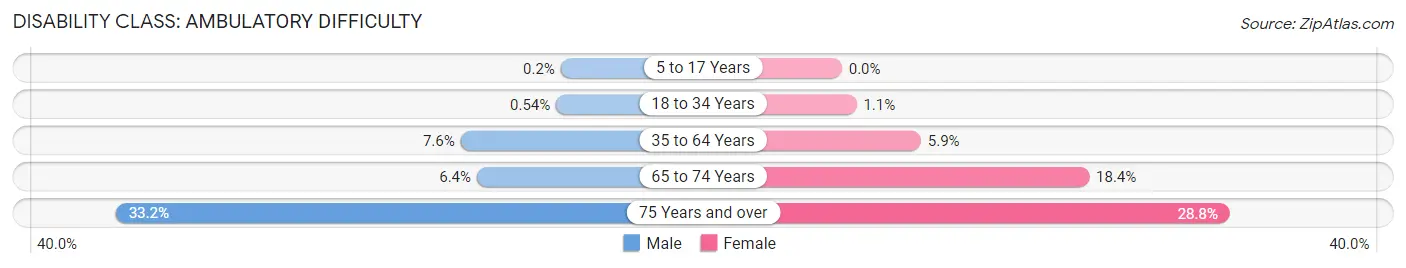
| Age Bracket | Male | Female |
| 5 to 17 Years | 8 (0.2%) | 0 (0.0%) |
| 18 to 34 Years | 24 (0.5%) | 46 (1.1%) |
| 35 to 64 Years | 630 (7.6%) | 462 (5.9%) |
| 65 to 74 Years | 138 (6.4%) | 427 (18.4%) |
| 75 Years and over | 331 (33.2%) | 428 (28.8%) |
Disability Class: Self-Care Difficulty
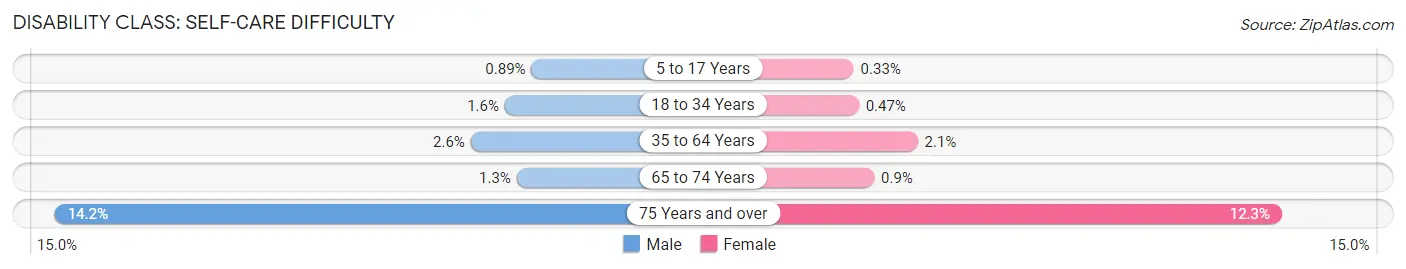
| Age Bracket | Male | Female |
| 5 to 17 Years | 35 (0.9%) | 13 (0.3%) |
| 18 to 34 Years | 72 (1.6%) | 20 (0.5%) |
| 35 to 64 Years | 213 (2.6%) | 166 (2.1%) |
| 65 to 74 Years | 28 (1.3%) | 21 (0.9%) |
| 75 Years and over | 141 (14.2%) | 182 (12.2%) |
Technology Access in Muscatine County
Computing Device Access in Muscatine County
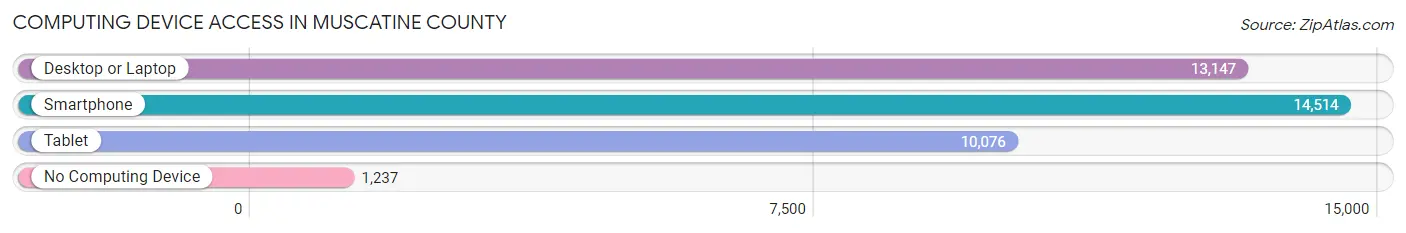
| Device Type | # Households | % Households |
| Desktop or Laptop | 13,147 | 77.0% |
| Smartphone | 14,514 | 85.0% |
| Tablet | 10,076 | 59.0% |
| No Computing Device | 1,237 | 7.2% |
| Total | 17,075 | 100.0% |
Internet Access in Muscatine County
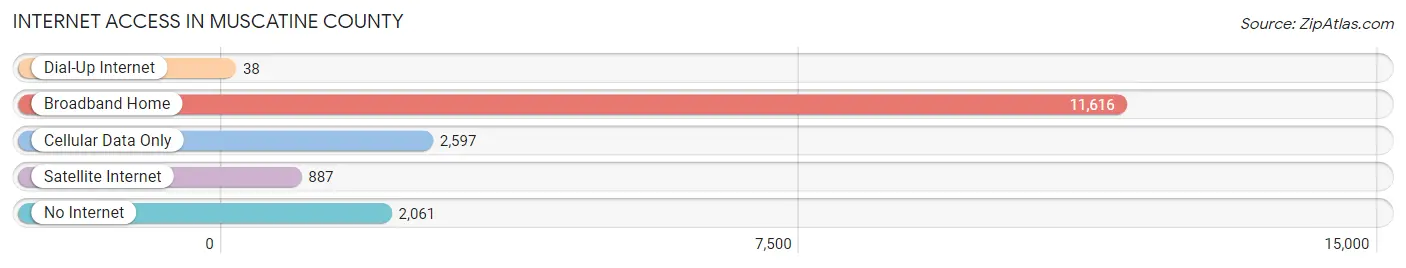
| Internet Type | # Households | % Households |
| Dial-Up Internet | 38 | 0.2% |
| Broadband Home | 11,616 | 68.0% |
| Cellular Data Only | 2,597 | 15.2% |
| Satellite Internet | 887 | 5.2% |
| No Internet | 2,061 | 12.1% |
| Total | 17,075 | 100.0% |
Muscatine County Summary
Muscatine County is located in the southeastern corner of Iowa, along the Mississippi River. It is bordered by Scott County to the north, Louisa County to the east, Cedar County to the south, and Rock Island County, Illinois to the west. The county seat is Muscatine, which is also the largest city in the county. The county was established in 1836 and named after the Muscatine Native American tribe.
Geography
Muscatine County covers an area of 545 square miles, of which 543 square miles is land and 2 square miles is water. The county is located in the Driftless Area of Iowa, which is characterized by rolling hills and valleys. The highest point in the county is located in the northwest corner, at an elevation of 1,068 feet. The county is drained by the Mississippi River, which forms its western border, and by the Wapsipinicon and Cedar Rivers, which flow through the county.
The county is home to several state parks and wildlife areas, including Big Hollow Recreation Area, Lake Odessa Wildlife Area, and Wildcat Den State Park. The county also contains several lakes, including Lake Odessa, Lake Belva Deer, and Lake Geode.
Economy
The economy of Muscatine County is largely based on agriculture. The county is home to several large farms, and the main crops grown in the county are corn, soybeans, and hay. The county is also home to several food processing plants, including Hormel Foods, Kraft Heinz, and Tyson Foods.
The county is also home to several manufacturing companies, including Muscatine Foods, Muscatine Power and Water, and Muscatine Paper Company. The county is also home to several retail stores, including Walmart, Target, and Hy-Vee.
Demographics
As of the 2010 census, there were 42,745 people, 16,845 households, and 11,717 families living in Muscatine County. The population density was 79.2 people per square mile. The racial makeup of the county was 92.3% White, 2.7% African American, 0.4% Native American, 1.2% Asian, 0.1% Pacific Islander, 1.7% from other races, and 2.0% from two or more races. Hispanic or Latino of any race were 4.2% of the population.
The median income for a household in the county was $45,945, and the median income for a family was $54,945. The per capita income for the county was $22,845. About 8.2% of families and 11.2% of the population were below the poverty line, including 15.2% of those under age 18 and 6.2% of those age 65 or over.
The largest ancestry groups in Muscatine County are German (30.2%), Irish (17.2%), English (14.2%), and American (13.2%). The county is also home to a large population of Italian (7.2%) and Dutch (4.2%) ancestry. The county is also home to a large population of Hispanic or Latino (4.2%) ancestry.
Common Questions
What is Per Capita Income in Muscatine County?
Per Capita income in Muscatine County is $34,055.
What is the Median Family Income in Muscatine County?
Median Family Income in Muscatine County is $82,076.
What is the Median Household income in Muscatine County?
Median Household Income in Muscatine County is $67,427.
What is Income or Wage Gap in Muscatine County?
Income or Wage Gap in Muscatine County is 32.8%.
Women in Muscatine County earn 67.2 cents for every dollar earned by a man.
What is Family Income Deficit in Muscatine County?
Family Income Deficit in Muscatine County is $12,188.
Families that are below poverty line in Muscatine County earn $12,188 less on average than the poverty threshold level.
What is Inequality or Gini Index in Muscatine County?
Inequality or Gini Index in Muscatine County is 0.41.
What is the Total Population of Muscatine County?
Total Population of Muscatine County is 42,968.
What is the Total Male Population of Muscatine County?
Total Male Population of Muscatine County is 21,552.
What is the Total Female Population of Muscatine County?
Total Female Population of Muscatine County is 21,416.
What is the Ratio of Males per 100 Females in Muscatine County?
There are 100.64 Males per 100 Females in Muscatine County.
What is the Ratio of Females per 100 Males in Muscatine County?
There are 99.37 Females per 100 Males in Muscatine County.
What is the Median Population Age in Muscatine County?
Median Population Age in Muscatine County is 38.6 Years.
What is the Average Family Size in Muscatine County
Average Family Size in Muscatine County is 3.0 People.
What is the Average Household Size in Muscatine County
Average Household Size in Muscatine County is 2.5 People.
How Large is the Labor Force in Muscatine County?
There are 22,128 People in the Labor Forcein in Muscatine County.
What is the Percentage of People in the Labor Force in Muscatine County?
65.3% of People are in the Labor Force in Muscatine County.
What is the Unemployment Rate in Muscatine County?
Unemployment Rate in Muscatine County is 3.5%.