Marion County, IA Map & Demographics
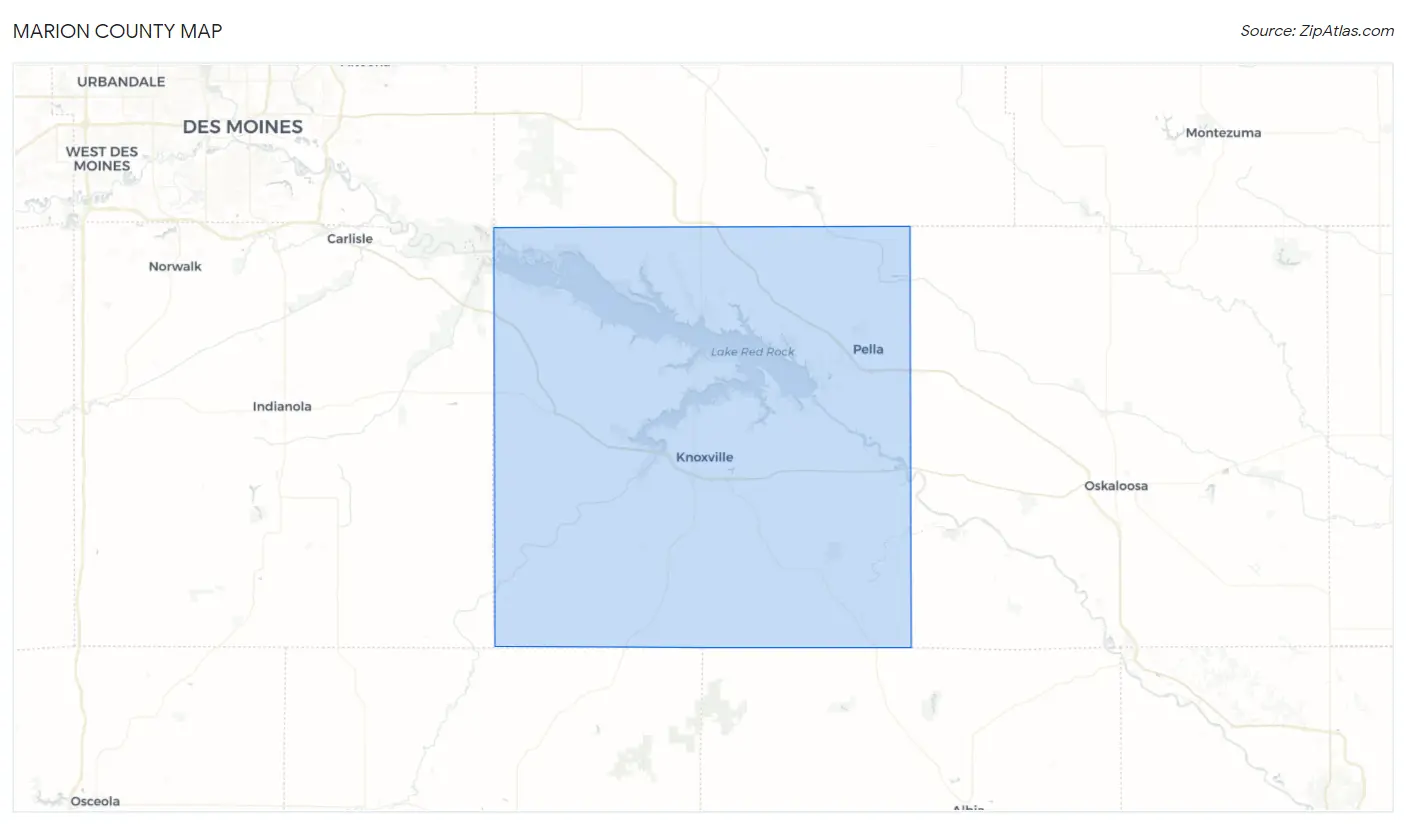
Marion County Map
Marion County Overview
$38,168
PER CAPITA INCOME
$90,188
AVG FAMILY INCOME
$74,193
AVG HOUSEHOLD INCOME
38.0%
WAGE / INCOME GAP [ % ]
62.0¢/ $1
WAGE / INCOME GAP [ $ ]
$11,444
FAMILY INCOME DEFICIT
0.43
INEQUALITY / GINI INDEX
33,487
TOTAL POPULATION
16,755
MALE POPULATION
16,732
FEMALE POPULATION
100.14
MALES / 100 FEMALES
99.86
FEMALES / 100 MALES
39.8
MEDIAN AGE
2.8
AVG FAMILY SIZE
2.4
AVG HOUSEHOLD SIZE
17,210
LABOR FORCE [ PEOPLE ]
64.9%
PERCENT IN LABOR FORCE
2.3%
UNEMPLOYMENT RATE
Income in Marion County
Income Overview in Marion County
Per Capita Income in Marion County is $38,168, while median incomes of families and households are $90,188 and $74,193 respectively.
| Characteristic | Number | Measure |
| Per Capita Income | 33,487 | $38,168 |
| Median Family Income | 9,260 | $90,188 |
| Mean Family Income | 9,260 | $110,671 |
| Median Household Income | 13,310 | $74,193 |
| Mean Household Income | 13,310 | $94,589 |
| Income Deficit | 9,260 | $11,444 |
| Wage / Income Gap (%) | 33,487 | 37.96% |
| Wage / Income Gap ($) | 33,487 | 62.04¢ per $1 |
| Gini / Inequality Index | 33,487 | 0.43 |
Earnings by Sex in Marion County
Average Earnings in Marion County are $44,319, $52,843 for men and $32,782 for women, a difference of 38.0%.
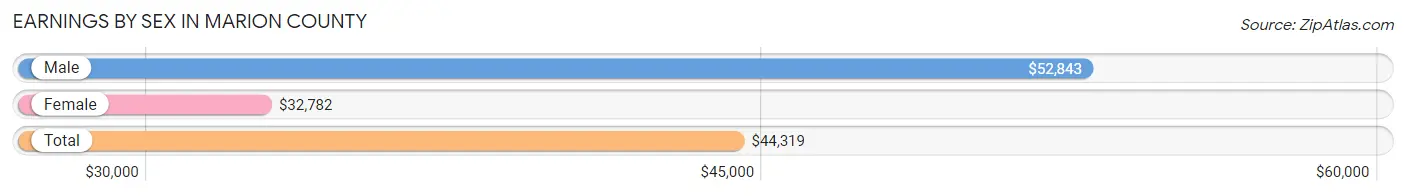
| Sex | Number | Average Earnings |
| Male | 10,051 (54.0%) | $52,843 |
| Female | 8,559 (46.0%) | $32,782 |
| Total | 18,610 (100.0%) | $44,319 |
Earnings by Sex by Income Bracket in Marion County
The most common earnings brackets in Marion County are $100,000+ for men (1,581 | 15.7%) and $2,499 or less for women (767 | 9.0%).
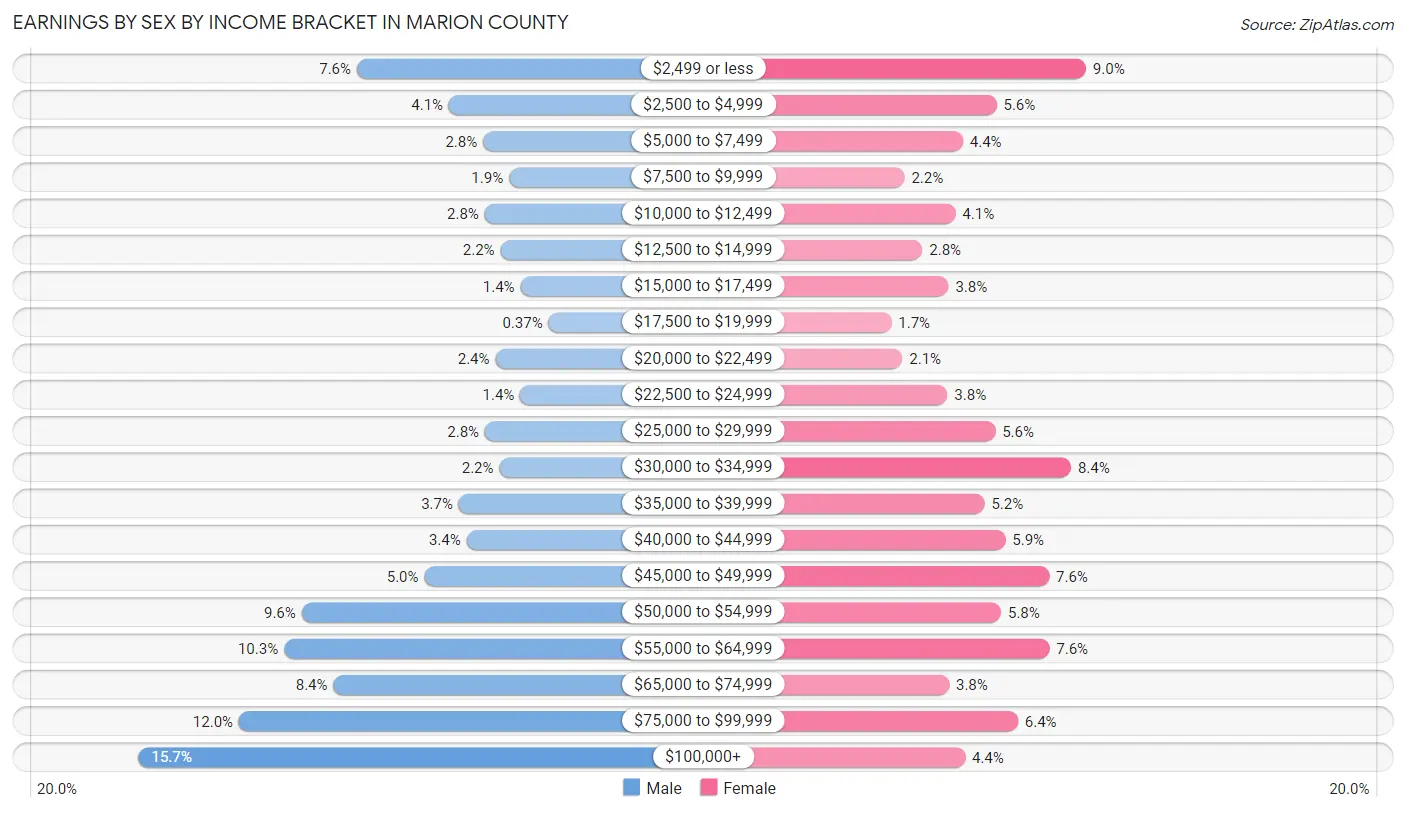
| Income | Male | Female |
| $2,499 or less | 759 (7.5%) | 767 (9.0%) |
| $2,500 to $4,999 | 412 (4.1%) | 480 (5.6%) |
| $5,000 to $7,499 | 283 (2.8%) | 372 (4.3%) |
| $7,500 to $9,999 | 186 (1.8%) | 185 (2.2%) |
| $10,000 to $12,499 | 277 (2.8%) | 348 (4.1%) |
| $12,500 to $14,999 | 218 (2.2%) | 242 (2.8%) |
| $15,000 to $17,499 | 143 (1.4%) | 326 (3.8%) |
| $17,500 to $19,999 | 37 (0.4%) | 143 (1.7%) |
| $20,000 to $22,499 | 237 (2.4%) | 178 (2.1%) |
| $22,500 to $24,999 | 144 (1.4%) | 323 (3.8%) |
| $25,000 to $29,999 | 276 (2.8%) | 476 (5.6%) |
| $30,000 to $34,999 | 222 (2.2%) | 719 (8.4%) |
| $35,000 to $39,999 | 375 (3.7%) | 442 (5.2%) |
| $40,000 to $44,999 | 346 (3.4%) | 508 (5.9%) |
| $45,000 to $49,999 | 505 (5.0%) | 649 (7.6%) |
| $50,000 to $54,999 | 967 (9.6%) | 495 (5.8%) |
| $55,000 to $64,999 | 1,033 (10.3%) | 650 (7.6%) |
| $65,000 to $74,999 | 847 (8.4%) | 328 (3.8%) |
| $75,000 to $99,999 | 1,203 (12.0%) | 549 (6.4%) |
| $100,000+ | 1,581 (15.7%) | 379 (4.4%) |
| Total | 10,051 (100.0%) | 8,559 (100.0%) |
Earnings by Sex by Educational Attainment in Marion County
Average earnings in Marion County are $59,809 for men and $40,033 for women, a difference of 33.1%. Men with an educational attainment of graduate degree enjoy the highest average annual earnings of $86,250, while those with less than high school education earn the least with $30,441. Women with an educational attainment of graduate degree earn the most with the average annual earnings of $74,531, while those with high school diploma education have the smallest earnings of $28,668.
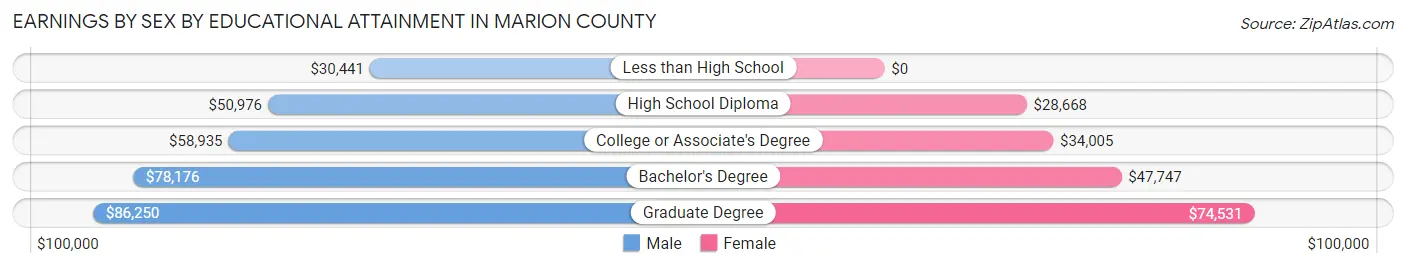
| Educational Attainment | Male Income | Female Income |
| Less than High School | $30,441 | $0 |
| High School Diploma | $50,976 | $28,668 |
| College or Associate's Degree | $58,935 | $34,005 |
| Bachelor's Degree | $78,176 | $47,747 |
| Graduate Degree | $86,250 | $74,531 |
| Total | $59,809 | $40,033 |
Family Income in Marion County
Family Income Brackets in Marion County
According to the Marion County family income data, there are 2,065 families falling into the $100,000 to $149,999 income range, which is the most common income bracket and makes up 22.3% of all families. Conversely, the less than $10,000 income bracket is the least frequent group with only 130 families (1.4%) belonging to this category.
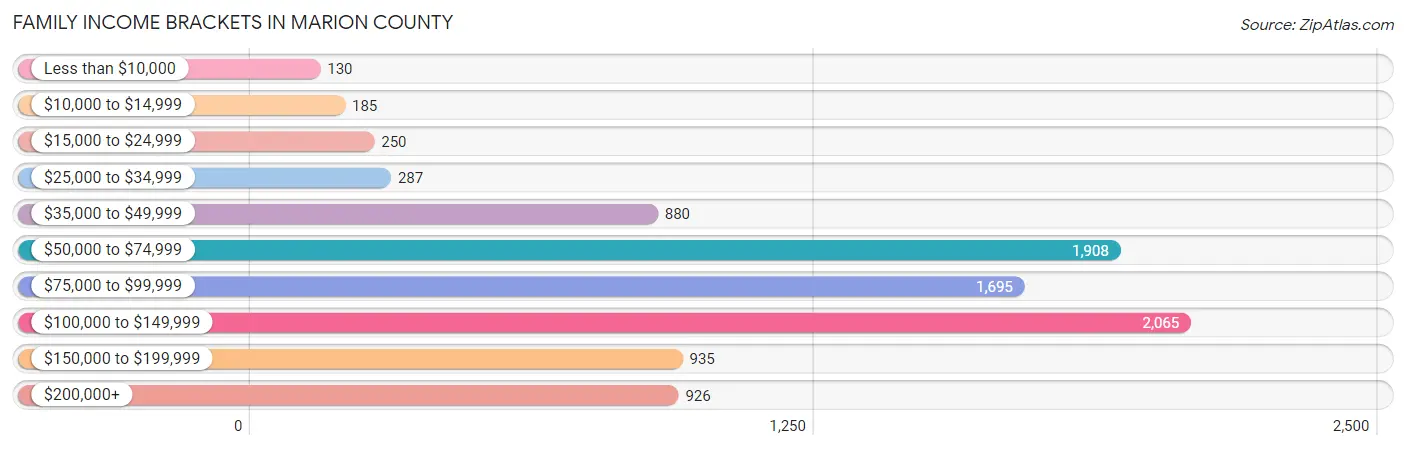
| Income Bracket | # Families | % Families |
| Less than $10,000 | 130 | 1.4% |
| $10,000 to $14,999 | 185 | 2.0% |
| $15,000 to $24,999 | 250 | 2.7% |
| $25,000 to $34,999 | 287 | 3.1% |
| $35,000 to $49,999 | 880 | 9.5% |
| $50,000 to $74,999 | 1,908 | 20.6% |
| $75,000 to $99,999 | 1,695 | 18.3% |
| $100,000 to $149,999 | 2,065 | 22.3% |
| $150,000 to $199,999 | 935 | 10.1% |
| $200,000+ | 926 | 10.0% |
Family Income by Famaliy Size in Marion County
5-person families (769 | 8.3%) account for the highest median family income in Marion County with $117,159 per family, while 2-person families (4,475 | 48.3%) have the highest median income of $37,900 per family member.
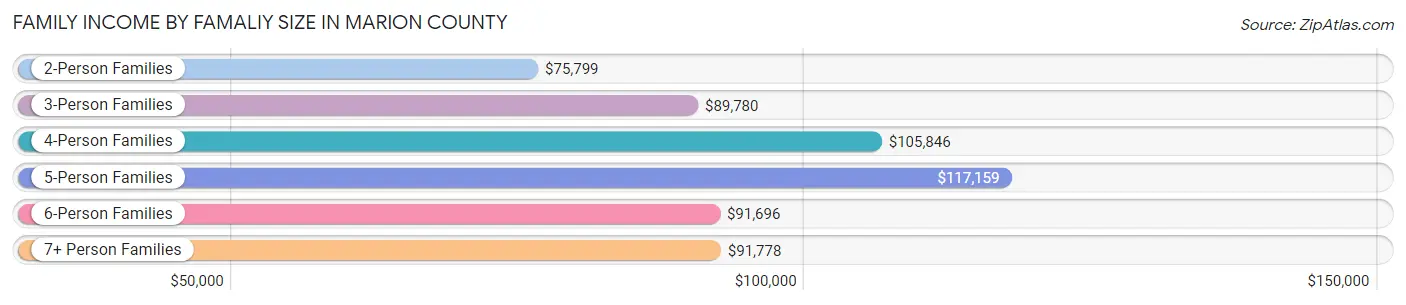
| Income Bracket | # Families | Median Income |
| 2-Person Families | 4,475 (48.3%) | $75,799 |
| 3-Person Families | 1,869 (20.2%) | $89,780 |
| 4-Person Families | 1,757 (19.0%) | $105,846 |
| 5-Person Families | 769 (8.3%) | $117,159 |
| 6-Person Families | 223 (2.4%) | $91,696 |
| 7+ Person Families | 167 (1.8%) | $91,778 |
| Total | 9,260 (100.0%) | $90,188 |
Family Income by Number of Earners in Marion County
The median family income in Marion County is $90,188, with families comprising 3+ earners (1,060) having the highest median family income of $141,429, while families with no earners (1,335) have the lowest median family income of $56,977, accounting for 11.5% and 14.4% of families, respectively.
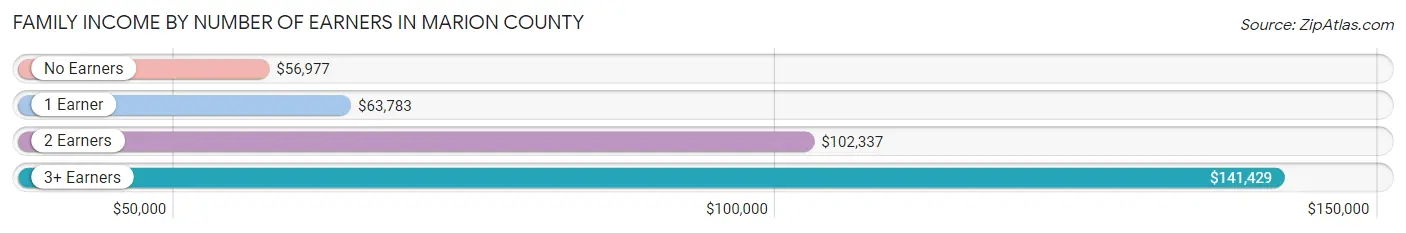
| Number of Earners | # Families | Median Income |
| No Earners | 1,335 (14.4%) | $56,977 |
| 1 Earner | 2,722 (29.4%) | $63,783 |
| 2 Earners | 4,143 (44.7%) | $102,337 |
| 3+ Earners | 1,060 (11.5%) | $141,429 |
| Total | 9,260 (100.0%) | $90,188 |
Household Income in Marion County
Household Income Brackets in Marion County
With 2,622 households falling in the category, the $50,000 to $74,999 income range is the most frequent in Marion County, accounting for 19.7% of all households. In contrast, only 439 households (3.3%) fall into the less than $10,000 income bracket, making it the least populous group.
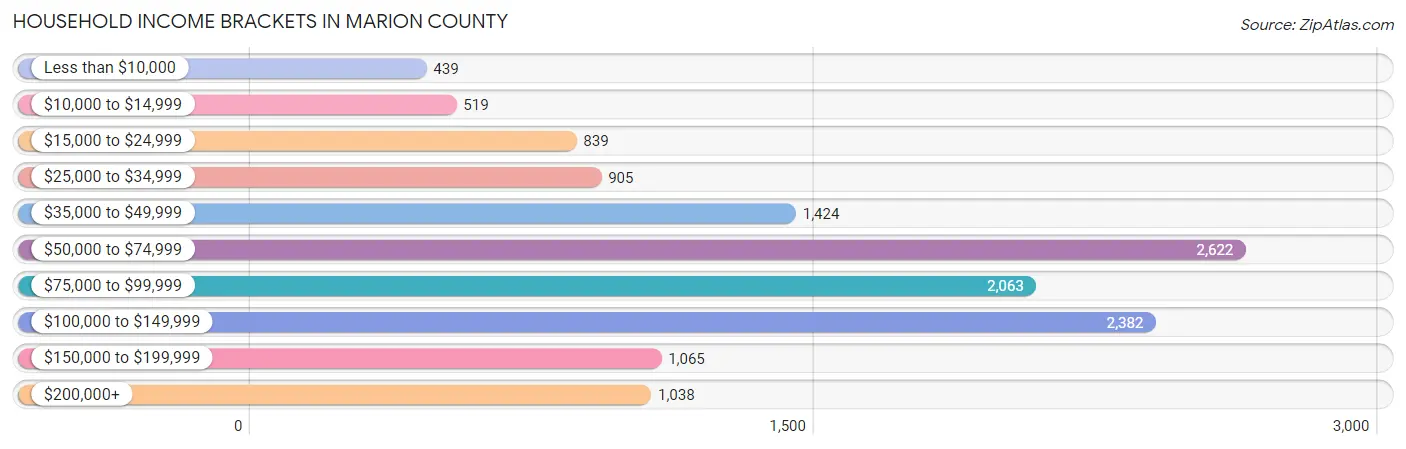
| Income Bracket | # Households | % Households |
| Less than $10,000 | 439 | 3.3% |
| $10,000 to $14,999 | 519 | 3.9% |
| $15,000 to $24,999 | 839 | 6.3% |
| $25,000 to $34,999 | 905 | 6.8% |
| $35,000 to $49,999 | 1,424 | 10.7% |
| $50,000 to $74,999 | 2,622 | 19.7% |
| $75,000 to $99,999 | 2,063 | 15.5% |
| $100,000 to $149,999 | 2,382 | 17.9% |
| $150,000 to $199,999 | 1,065 | 8.0% |
| $200,000+ | 1,038 | 7.8% |
Household Income by Householder Age in Marion County
The median household income in Marion County is $74,193, with the highest median household income of $93,876 found in the 25 to 44 years age bracket for the primary householder. A total of 4,023 households (30.2%) fall into this category. Meanwhile, the 65+ years age bracket for the primary householder has the lowest median household income of $55,000, with 3,972 households (29.8%) in this group.
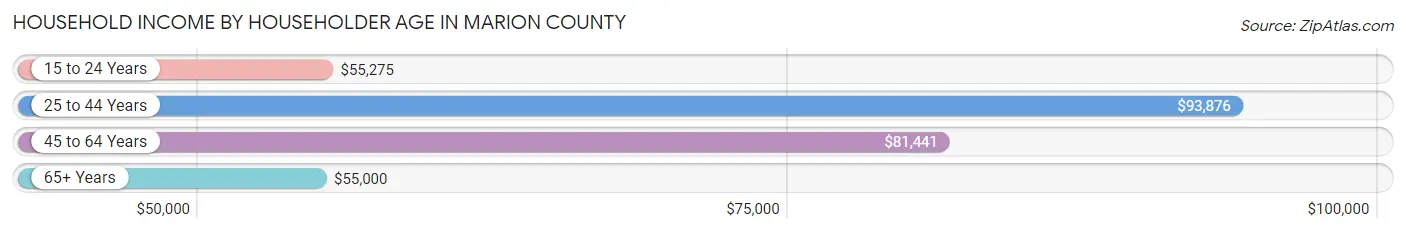
| Income Bracket | # Households | Median Income |
| 15 to 24 Years | 687 (5.2%) | $55,275 |
| 25 to 44 Years | 4,023 (30.2%) | $93,876 |
| 45 to 64 Years | 4,628 (34.8%) | $81,441 |
| 65+ Years | 3,972 (29.8%) | $55,000 |
| Total | 13,310 (100.0%) | $74,193 |
Poverty in Marion County
Income Below Poverty by Sex and Age in Marion County
With 6.3% poverty level for males and 9.1% for females among the residents of Marion County, 15 year old males and 18 to 24 year old females are the most vulnerable to poverty, with 74 males (28.7%) and 223 females (22.3%) in their respective age groups living below the poverty level.
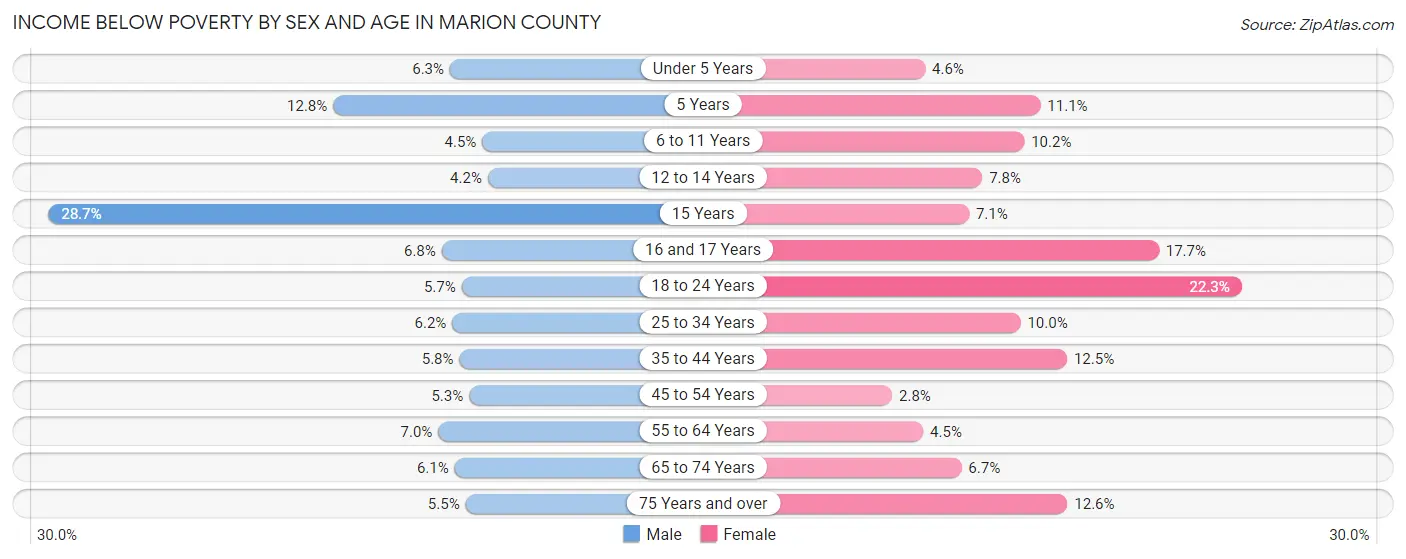
| Age Bracket | Male | Female |
| Under 5 Years | 59 (6.3%) | 42 (4.6%) |
| 5 Years | 20 (12.8%) | 24 (11.1%) |
| 6 to 11 Years | 57 (4.5%) | 137 (10.2%) |
| 12 to 14 Years | 30 (4.2%) | 46 (7.8%) |
| 15 Years | 74 (28.7%) | 26 (7.1%) |
| 16 and 17 Years | 31 (6.8%) | 66 (17.6%) |
| 18 to 24 Years | 66 (5.7%) | 223 (22.3%) |
| 25 to 34 Years | 111 (6.2%) | 171 (10.0%) |
| 35 to 44 Years | 119 (5.8%) | 248 (12.5%) |
| 45 to 54 Years | 106 (5.2%) | 54 (2.8%) |
| 55 to 64 Years | 160 (7.0%) | 98 (4.5%) |
| 65 to 74 Years | 100 (6.1%) | 115 (6.7%) |
| 75 Years and over | 59 (5.4%) | 196 (12.6%) |
| Total | 992 (6.3%) | 1,446 (9.1%) |
Income Above Poverty by Sex and Age in Marion County
According to the poverty statistics in Marion County, males aged 12 to 14 years and females aged 45 to 54 years are the age groups that are most secure financially, with 95.8% of males and 97.2% of females in these age groups living above the poverty line.
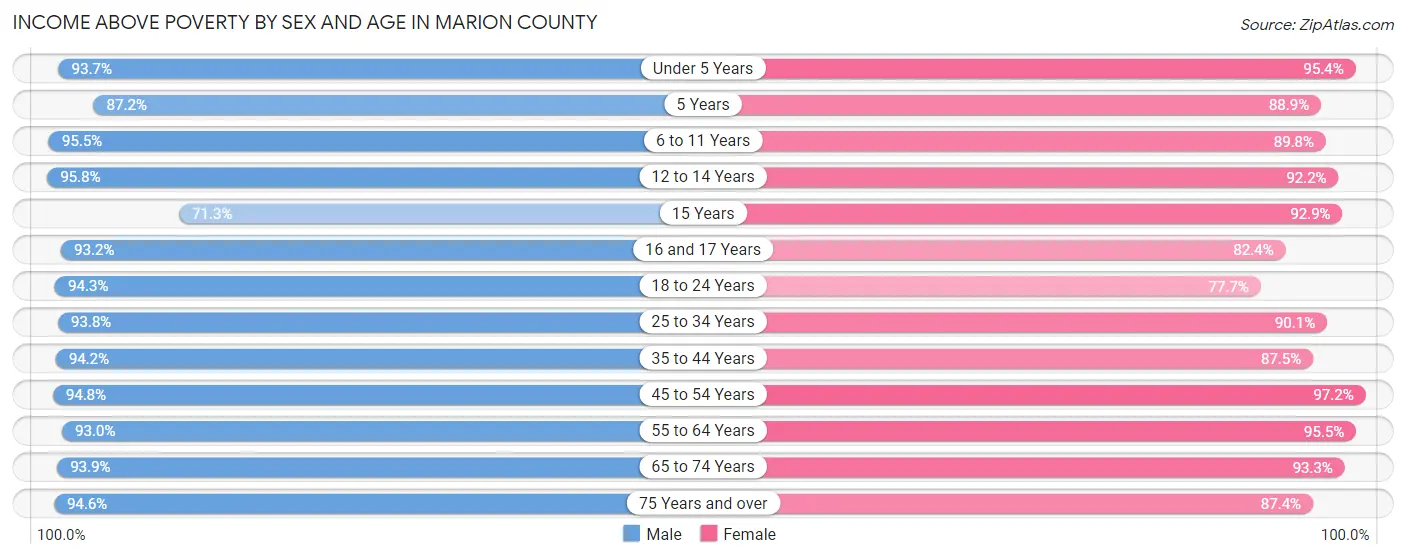
| Age Bracket | Male | Female |
| Under 5 Years | 875 (93.7%) | 864 (95.4%) |
| 5 Years | 136 (87.2%) | 193 (88.9%) |
| 6 to 11 Years | 1,205 (95.5%) | 1,212 (89.8%) |
| 12 to 14 Years | 683 (95.8%) | 542 (92.2%) |
| 15 Years | 184 (71.3%) | 341 (92.9%) |
| 16 and 17 Years | 426 (93.2%) | 308 (82.4%) |
| 18 to 24 Years | 1,099 (94.3%) | 779 (77.7%) |
| 25 to 34 Years | 1,682 (93.8%) | 1,548 (90.0%) |
| 35 to 44 Years | 1,937 (94.2%) | 1,729 (87.5%) |
| 45 to 54 Years | 1,913 (94.8%) | 1,876 (97.2%) |
| 55 to 64 Years | 2,135 (93.0%) | 2,067 (95.5%) |
| 65 to 74 Years | 1,549 (93.9%) | 1,612 (93.3%) |
| 75 Years and over | 1,023 (94.6%) | 1,365 (87.4%) |
| Total | 14,847 (93.7%) | 14,436 (90.9%) |
Income Below Poverty Among Married-Couple Families in Marion County
The poverty statistics for married-couple families in Marion County show that 2.1% or 165 of the total 7,884 families live below the poverty line. Families with 3 or 4 children have the highest poverty rate of 7.9%, comprising of 56 families. On the other hand, families with 5 or more children have the lowest poverty rate of 0.0%, which includes 0 families.
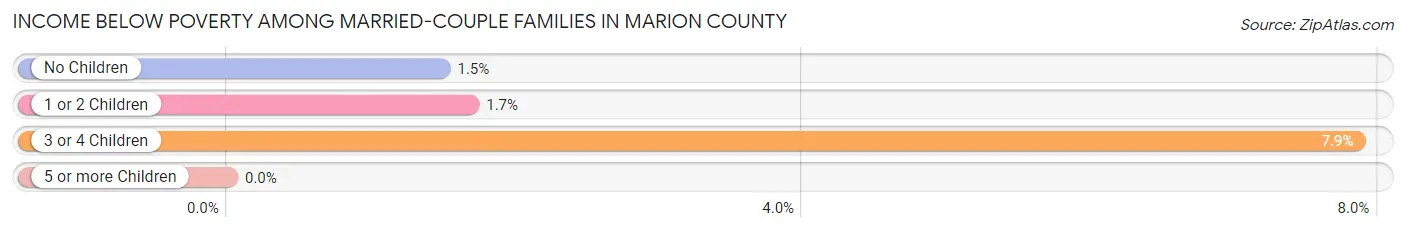
| Children | Above Poverty | Below Poverty |
| No Children | 4,454 (98.5%) | 67 (1.5%) |
| 1 or 2 Children | 2,458 (98.3%) | 42 (1.7%) |
| 3 or 4 Children | 657 (92.1%) | 56 (7.9%) |
| 5 or more Children | 150 (100.0%) | 0 (0.0%) |
| Total | 7,719 (97.9%) | 165 (2.1%) |
Income Below Poverty Among Single-Parent Households in Marion County
According to the poverty data in Marion County, 14.3% or 73 single-father households and 28.1% or 243 single-mother households are living below the poverty line. Among single-father households, those with 1 or 2 children have the highest poverty rate, with 56 households (17.5%) experiencing poverty. Likewise, among single-mother households, those with 3 or 4 children have the highest poverty rate, with 91 households (59.9%) falling below the poverty line.
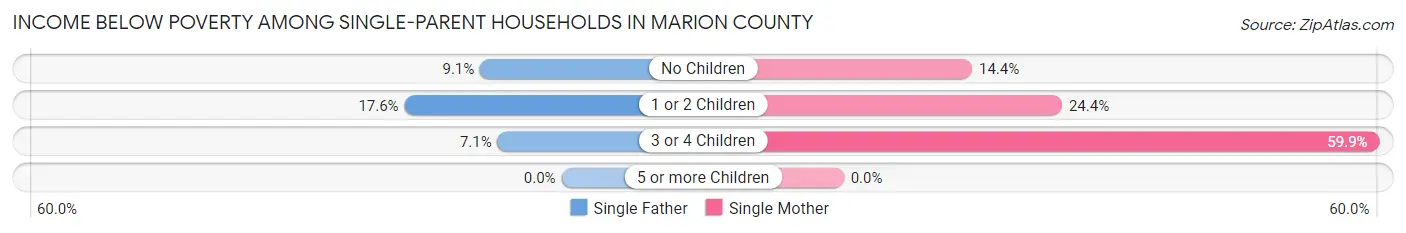
| Children | Single Father | Single Mother |
| No Children | 15 (9.1%) | 31 (14.3%) |
| 1 or 2 Children | 56 (17.5%) | 121 (24.4%) |
| 3 or 4 Children | 2 (7.1%) | 91 (59.9%) |
| 5 or more Children | 0 (0.0%) | 0 (0.0%) |
| Total | 73 (14.3%) | 243 (28.1%) |
Income Below Poverty Among Married-Couple vs Single-Parent Households in Marion County
The poverty data for Marion County shows that 165 of the married-couple family households (2.1%) and 316 of the single-parent households (23.0%) are living below the poverty level. Within the married-couple family households, those with 3 or 4 children have the highest poverty rate, with 56 households (7.9%) falling below the poverty line. Among the single-parent households, those with 3 or 4 children have the highest poverty rate, with 93 household (51.7%) living below poverty.
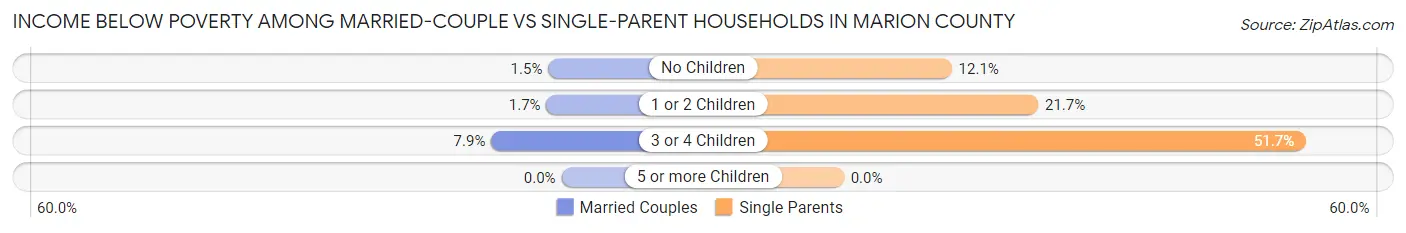
| Children | Married-Couple Families | Single-Parent Households |
| No Children | 67 (1.5%) | 46 (12.1%) |
| 1 or 2 Children | 42 (1.7%) | 177 (21.7%) |
| 3 or 4 Children | 56 (7.9%) | 93 (51.7%) |
| 5 or more Children | 0 (0.0%) | 0 (0.0%) |
| Total | 165 (2.1%) | 316 (23.0%) |
Race in Marion County
The most populous races in Marion County are White / Caucasian (31,774 | 94.9%), Two or more Races (947 | 2.8%), and Hispanic or Latino (735 | 2.2%).
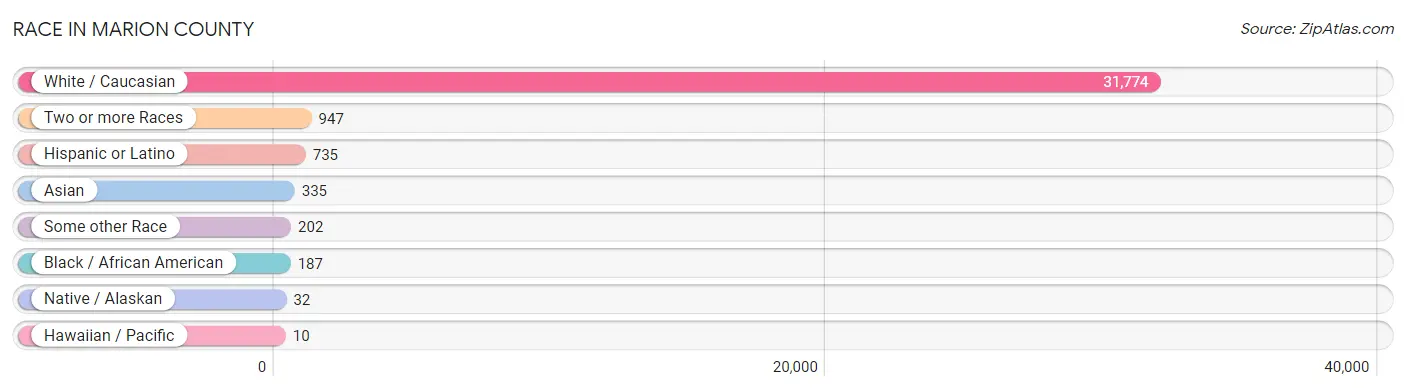
| Race | # Population | % Population |
| Asian | 335 | 1.0% |
| Black / African American | 187 | 0.6% |
| Hawaiian / Pacific | 10 | 0.0% |
| Hispanic or Latino | 735 | 2.2% |
| Native / Alaskan | 32 | 0.1% |
| White / Caucasian | 31,774 | 94.9% |
| Two or more Races | 947 | 2.8% |
| Some other Race | 202 | 0.6% |
| Total | 33,487 | 100.0% |
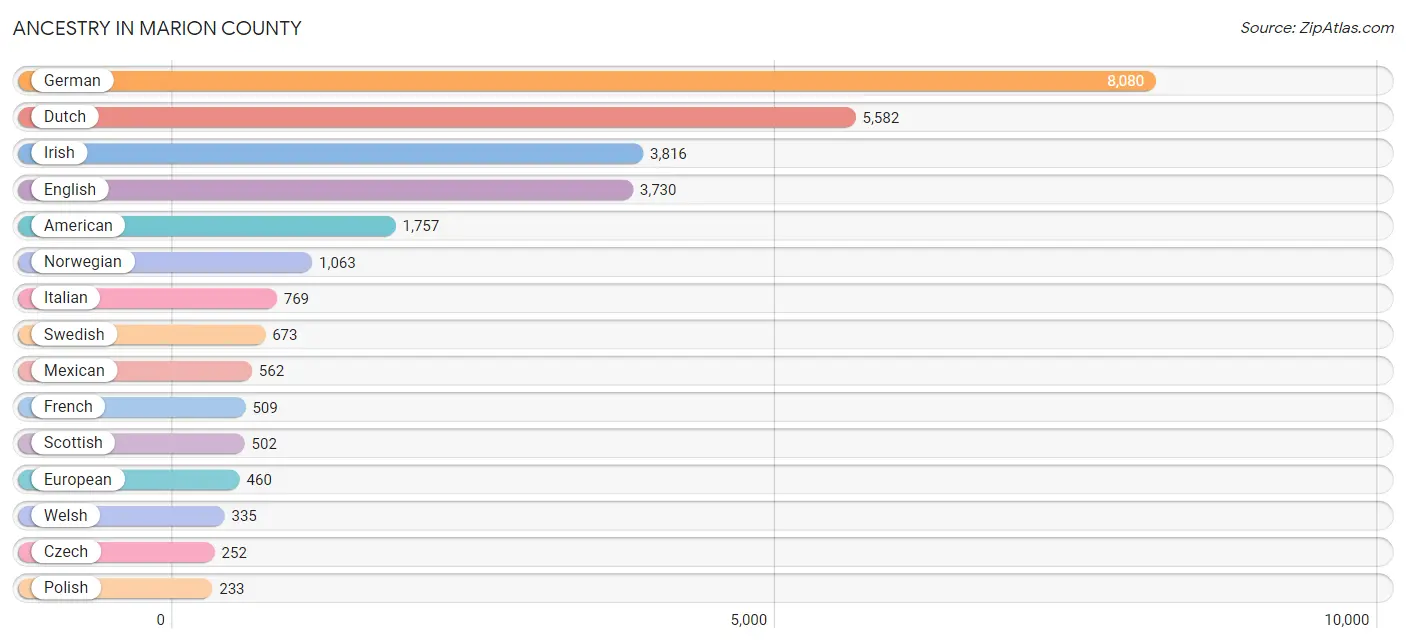
Ancestry in Marion County
The most populous ancestries reported in Marion County are German (8,080 | 24.1%), Dutch (5,582 | 16.7%), Irish (3,816 | 11.4%), English (3,730 | 11.1%), and American (1,757 | 5.2%), together accounting for 68.6% of all Marion County residents.
| Ancestry | # Population | % Population |
| African | 25 | 0.1% |
| American | 1,757 | 5.2% |
| Apache | 3 | 0.0% |
| Arab | 24 | 0.1% |
| Argentinean | 9 | 0.0% |
| Australian | 45 | 0.1% |
| Austrian | 32 | 0.1% |
| Basque | 13 | 0.0% |
| Belgian | 81 | 0.2% |
| Bhutanese | 96 | 0.3% |
| Brazilian | 8 | 0.0% |
| British | 207 | 0.6% |
| Burmese | 149 | 0.4% |
| Canadian | 16 | 0.1% |
| Central American | 7 | 0.0% |
| Central American Indian | 42 | 0.1% |
| Cherokee | 117 | 0.4% |
| Choctaw | 17 | 0.1% |
| Cree | 33 | 0.1% |
| Croatian | 33 | 0.1% |
| Czech | 252 | 0.7% |
| Czechoslovakian | 45 | 0.1% |
| Danish | 195 | 0.6% |
| Dominican | 36 | 0.1% |
| Dutch | 5,582 | 16.7% |
| Eastern European | 22 | 0.1% |
| English | 3,730 | 11.1% |
| European | 460 | 1.4% |
| Finnish | 31 | 0.1% |
| French | 509 | 1.5% |
| French Canadian | 31 | 0.1% |
| German | 8,080 | 24.1% |
| Greek | 76 | 0.2% |
| Guatemalan | 2 | 0.0% |
| Hungarian | 9 | 0.0% |
| Indian (Asian) | 22 | 0.1% |
| Indonesian | 78 | 0.2% |
| Irish | 3,816 | 11.4% |
| Iroquois | 11 | 0.0% |
| Italian | 769 | 2.3% |
| Japanese | 32 | 0.1% |
| Korean | 55 | 0.2% |
| Lebanese | 6 | 0.0% |
| Lithuanian | 14 | 0.0% |
| Malaysian | 28 | 0.1% |
| Mexican | 562 | 1.7% |
| Native Hawaiian | 25 | 0.1% |
| New Zealander | 8 | 0.0% |
| Northern European | 49 | 0.2% |
| Norwegian | 1,063 | 3.2% |
| Pennsylvania German | 24 | 0.1% |
| Polish | 233 | 0.7% |
| Portuguese | 19 | 0.1% |
| Puerto Rican | 36 | 0.1% |
| Russian | 182 | 0.5% |
| Salvadoran | 5 | 0.0% |
| Samoan | 14 | 0.0% |
| Scandinavian | 130 | 0.4% |
| Scotch-Irish | 81 | 0.2% |
| Scottish | 502 | 1.5% |
| Sioux | 2 | 0.0% |
| Slovak | 2 | 0.0% |
| South American | 9 | 0.0% |
| Spaniard | 44 | 0.1% |
| Spanish | 15 | 0.0% |
| Sri Lankan | 12 | 0.0% |
| Subsaharan African | 25 | 0.1% |
| Swedish | 673 | 2.0% |
| Swiss | 159 | 0.5% |
| Thai | 85 | 0.3% |
| Ukrainian | 22 | 0.1% |
| Welsh | 335 | 1.0% | View All 72 Rows |
Immigrants in Marion County
The most numerous immigrant groups reported in Marion County came from Asia (254 | 0.8%), Europe (171 | 0.5%), South Eastern Asia (154 | 0.5%), Western Europe (108 | 0.3%), and Latin America (103 | 0.3%), together accounting for 2.4% of all Marion County residents.
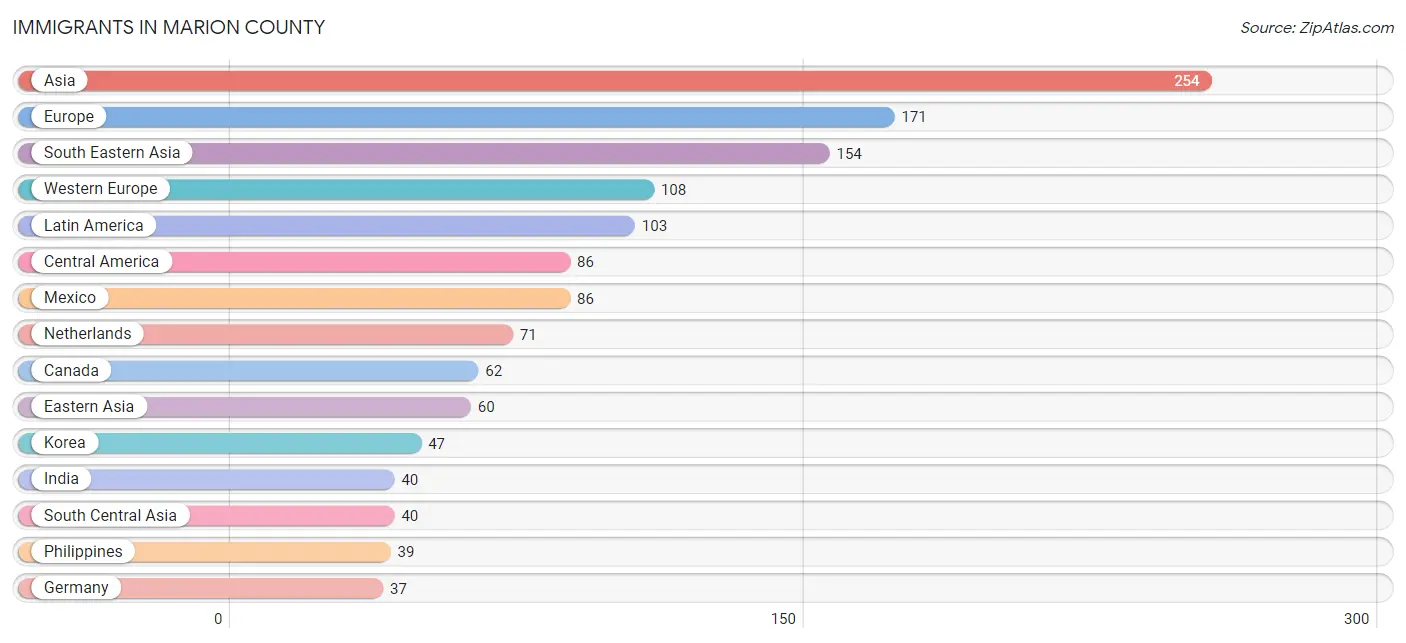
| Immigration Origin | # Population | % Population |
| Africa | 25 | 0.1% |
| Argentina | 9 | 0.0% |
| Asia | 254 | 0.8% |
| Brazil | 8 | 0.0% |
| Cambodia | 12 | 0.0% |
| Canada | 62 | 0.2% |
| Central America | 86 | 0.3% |
| China | 13 | 0.0% |
| Congo | 25 | 0.1% |
| Eastern Asia | 60 | 0.2% |
| Eastern Europe | 25 | 0.1% |
| England | 13 | 0.0% |
| Europe | 171 | 0.5% |
| Germany | 37 | 0.1% |
| India | 40 | 0.1% |
| Korea | 47 | 0.1% |
| Laos | 25 | 0.1% |
| Latin America | 103 | 0.3% |
| Mexico | 86 | 0.3% |
| Middle Africa | 25 | 0.1% |
| Netherlands | 71 | 0.2% |
| Northern Europe | 23 | 0.1% |
| Oceania | 8 | 0.0% |
| Philippines | 39 | 0.1% |
| Russia | 6 | 0.0% |
| South America | 17 | 0.1% |
| South Central Asia | 40 | 0.1% |
| South Eastern Asia | 154 | 0.5% |
| Southern Europe | 15 | 0.0% |
| Spain | 15 | 0.0% |
| Sweden | 6 | 0.0% |
| Ukraine | 19 | 0.1% |
| Western Europe | 108 | 0.3% | View All 33 Rows |
Sex and Age in Marion County
Sex and Age in Marion County
The most populous age groups in Marion County are 10 to 14 Years (1,377 | 8.2%) for men and 15 to 19 Years (1,261 | 7.5%) for women.
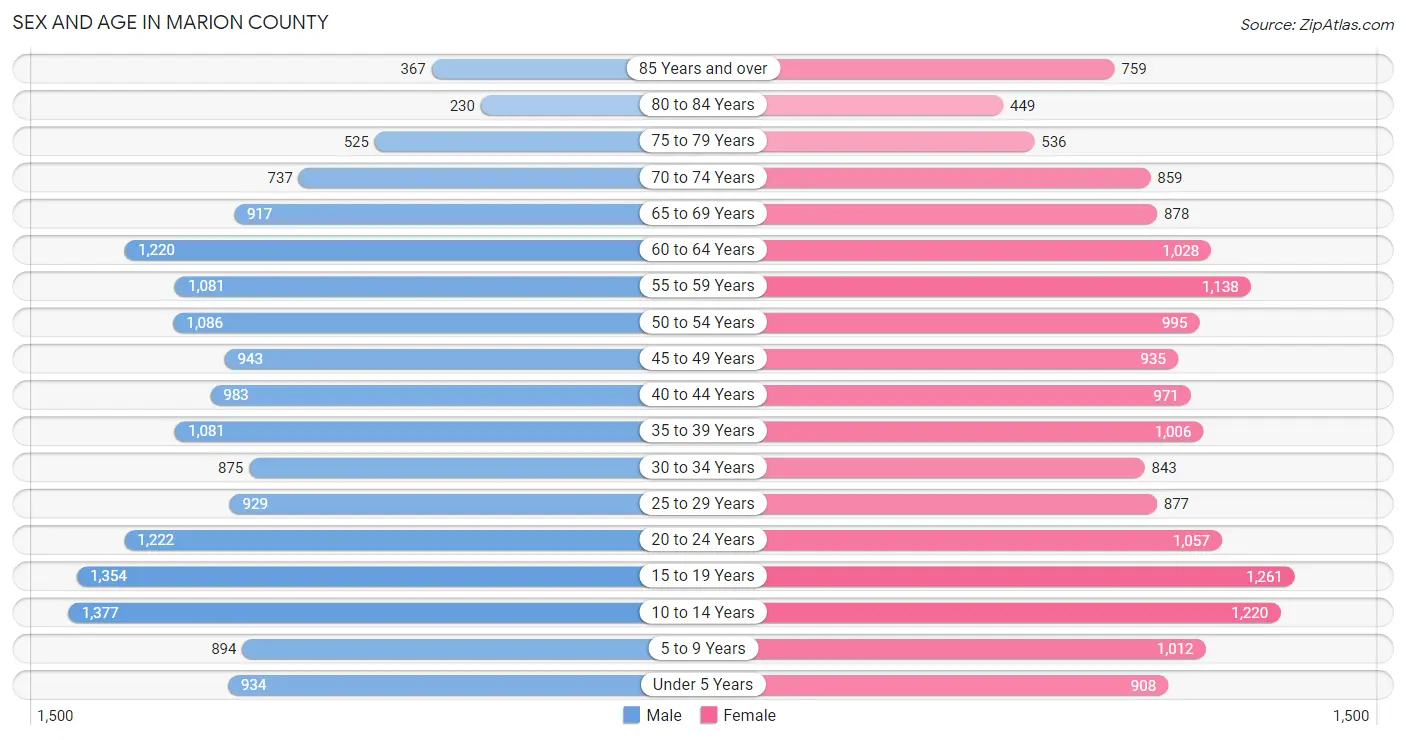
| Age Bracket | Male | Female |
| Under 5 Years | 934 (5.6%) | 908 (5.4%) |
| 5 to 9 Years | 894 (5.3%) | 1,012 (6.0%) |
| 10 to 14 Years | 1,377 (8.2%) | 1,220 (7.3%) |
| 15 to 19 Years | 1,354 (8.1%) | 1,261 (7.5%) |
| 20 to 24 Years | 1,222 (7.3%) | 1,057 (6.3%) |
| 25 to 29 Years | 929 (5.5%) | 877 (5.2%) |
| 30 to 34 Years | 875 (5.2%) | 843 (5.0%) |
| 35 to 39 Years | 1,081 (6.5%) | 1,006 (6.0%) |
| 40 to 44 Years | 983 (5.9%) | 971 (5.8%) |
| 45 to 49 Years | 943 (5.6%) | 935 (5.6%) |
| 50 to 54 Years | 1,086 (6.5%) | 995 (5.9%) |
| 55 to 59 Years | 1,081 (6.5%) | 1,138 (6.8%) |
| 60 to 64 Years | 1,220 (7.3%) | 1,028 (6.1%) |
| 65 to 69 Years | 917 (5.5%) | 878 (5.2%) |
| 70 to 74 Years | 737 (4.4%) | 859 (5.1%) |
| 75 to 79 Years | 525 (3.1%) | 536 (3.2%) |
| 80 to 84 Years | 230 (1.4%) | 449 (2.7%) |
| 85 Years and over | 367 (2.2%) | 759 (4.5%) |
| Total | 16,755 (100.0%) | 16,732 (100.0%) |
Families and Households in Marion County
Median Family Size in Marion County
The median family size in Marion County is 2.84 persons per family, with married-couple families (7,884 | 85.1%) accounting for the largest median family size of 2.87 persons per family. On the other hand, single male/father families (512 | 5.5%) represent the smallest median family size with 2.48 persons per family.
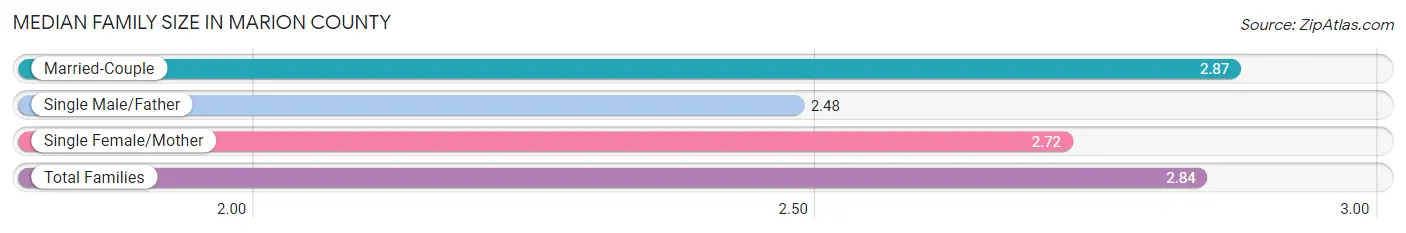
| Family Type | # Families | Family Size |
| Married-Couple | 7,884 (85.1%) | 2.87 |
| Single Male/Father | 512 (5.5%) | 2.48 |
| Single Female/Mother | 864 (9.3%) | 2.72 |
| Total Families | 9,260 (100.0%) | 2.84 |
Median Household Size in Marion County
The median household size in Marion County is 2.39 persons per household, with single male/father households (512 | 3.8%) accounting for the largest median household size of 3.1 persons per household. non-family households (4,050 | 30.4%) represent the smallest median household size with 1.24 persons per household.
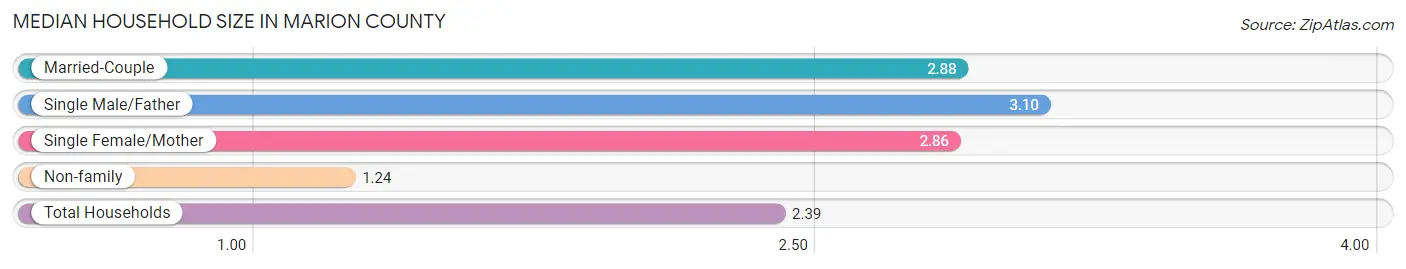
| Household Type | # Households | Household Size |
| Married-Couple | 7,884 (59.2%) | 2.88 |
| Single Male/Father | 512 (3.8%) | 3.10 |
| Single Female/Mother | 864 (6.5%) | 2.86 |
| Non-family | 4,050 (30.4%) | 1.24 |
| Total Households | 13,310 (100.0%) | 2.39 |
Household Size by Marriage Status in Marion County
Out of a total of 13,310 households in Marion County, 9,260 (69.6%) are family households, while 4,050 (30.4%) are nonfamily households. The most numerous type of family households are 2-person households, comprising 4,387, and the most common type of nonfamily households are 1-person households, comprising 3,337.
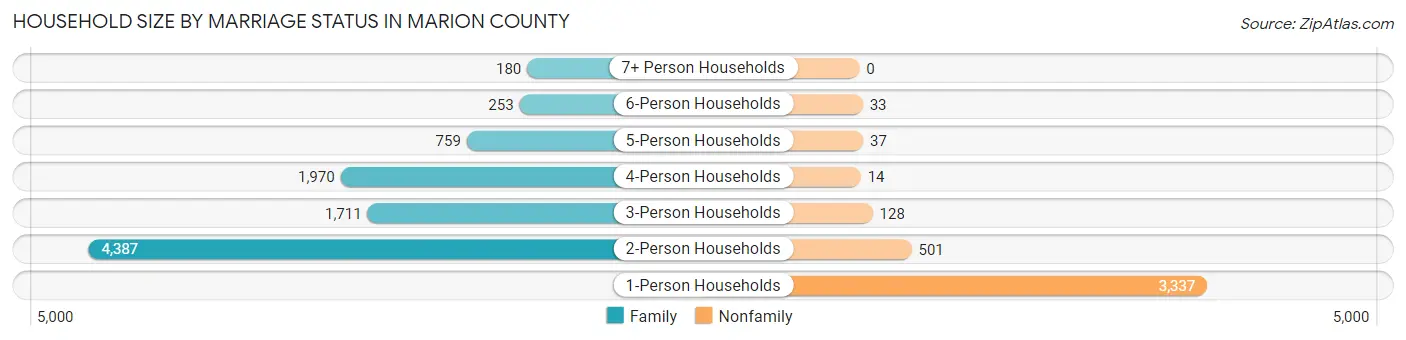
| Household Size | Family Households | Nonfamily Households |
| 1-Person Households | - | 3,337 (25.1%) |
| 2-Person Households | 4,387 (33.0%) | 501 (3.8%) |
| 3-Person Households | 1,711 (12.9%) | 128 (1.0%) |
| 4-Person Households | 1,970 (14.8%) | 14 (0.1%) |
| 5-Person Households | 759 (5.7%) | 37 (0.3%) |
| 6-Person Households | 253 (1.9%) | 33 (0.3%) |
| 7+ Person Households | 180 (1.3%) | 0 (0.0%) |
| Total | 9,260 (69.6%) | 4,050 (30.4%) |
Female Fertility in Marion County
Fertility by Age in Marion County
Average fertility rate in Marion County is 43.0 births per 1,000 women. Women in the age bracket of 20 to 34 years have the highest fertility rate with 101.0 births per 1,000 women. Women in the age bracket of 20 to 34 years acount for 90.1% of all women with births.
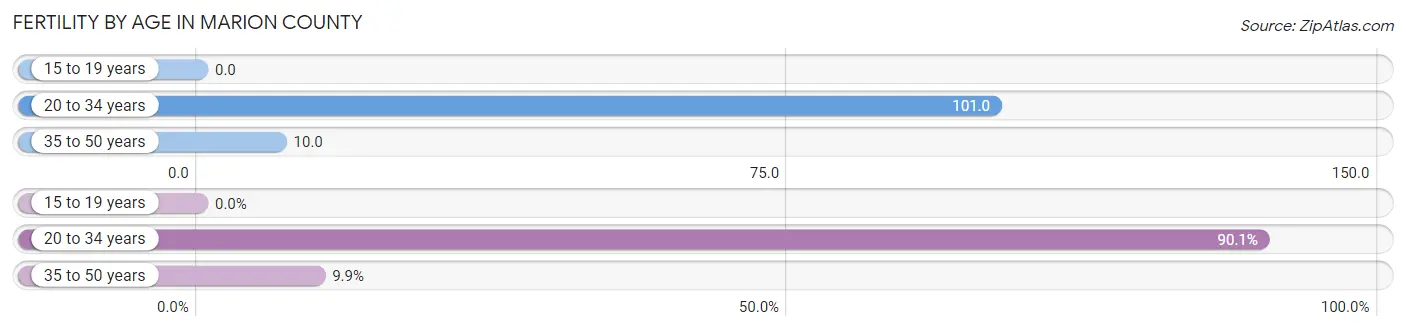
| Age Bracket | Women with Births | Births / 1,000 Women |
| 15 to 19 years | 0 (0.0%) | 0.0 |
| 20 to 34 years | 281 (90.1%) | 101.0 |
| 35 to 50 years | 31 (9.9%) | 10.0 |
| Total | 312 (100.0%) | 43.0 |
Fertility by Age by Marriage Status in Marion County
75.3% of women with births (312) in Marion County are married. The highest percentage of unmarried women with births falls into 20 to 34 years age bracket with 27.4% of them unmarried at the time of birth, while the lowest percentage of unmarried women with births belong to 35 to 50 years age bracket with 0.0% of them unmarried.
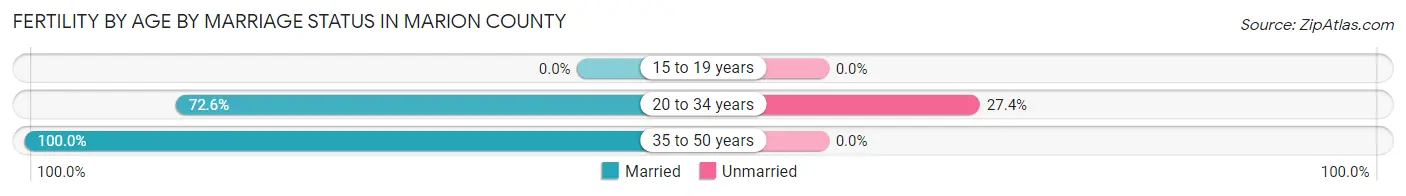
| Age Bracket | Married | Unmarried |
| 15 to 19 years | 0 (0.0%) | 0 (0.0%) |
| 20 to 34 years | 204 (72.6%) | 77 (27.4%) |
| 35 to 50 years | 31 (100.0%) | 0 (0.0%) |
| Total | 235 (75.3%) | 77 (24.7%) |
Fertility by Education in Marion County
Average fertility rate in Marion County is 43.0 births per 1,000 women. Women with the education attainment of high school diploma have the highest fertility rate of 84.0 births per 1,000 women, while women with the education attainment of less than high school have the lowest fertility at 1.0 births per 1,000 women. Women with the education attainment of high school diploma represent 35.3% of all women with births.
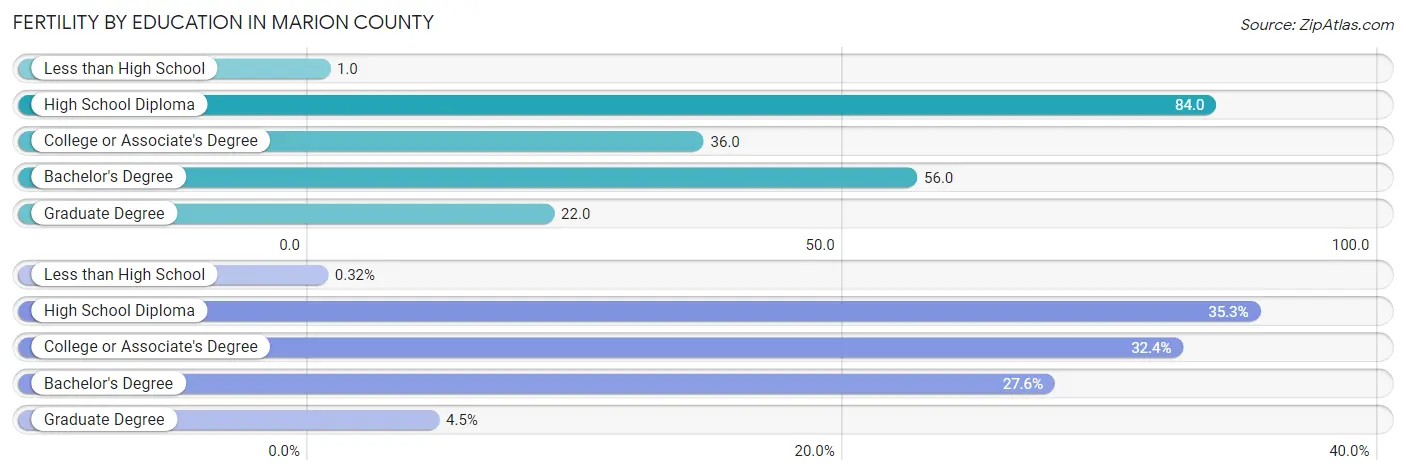
| Educational Attainment | Women with Births | Births / 1,000 Women |
| Less than High School | 1 (0.3%) | 1.0 |
| High School Diploma | 110 (35.3%) | 84.0 |
| College or Associate's Degree | 101 (32.4%) | 36.0 |
| Bachelor's Degree | 86 (27.6%) | 56.0 |
| Graduate Degree | 14 (4.5%) | 22.0 |
| Total | 312 (100.0%) | 43.0 |
Fertility by Education by Marriage Status in Marion County
24.7% of women with births in Marion County are unmarried. Women with the educational attainment of less than high school are most likely to be married with 100.0% of them married at childbirth, while women with the educational attainment of graduate degree are least likely to be married with 57.1% of them unmarried at childbirth.
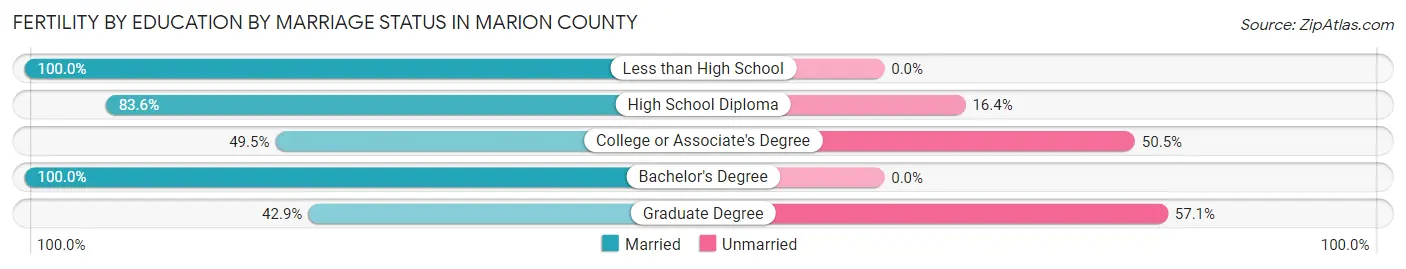
| Educational Attainment | Married | Unmarried |
| Less than High School | 1 (100.0%) | 0 (0.0%) |
| High School Diploma | 92 (83.6%) | 18 (16.4%) |
| College or Associate's Degree | 50 (49.5%) | 51 (50.5%) |
| Bachelor's Degree | 86 (100.0%) | 0 (0.0%) |
| Graduate Degree | 6 (42.9%) | 8 (57.1%) |
| Total | 235 (75.3%) | 77 (24.7%) |
Employment Characteristics in Marion County
Employment by Class of Employer in Marion County
Among the 16,435 employed individuals in Marion County, private company employees (10,658 | 64.8%), not-for-profit organizations (1,850 | 11.3%), and local government employees (1,564 | 9.5%) make up the most common classes of employment.
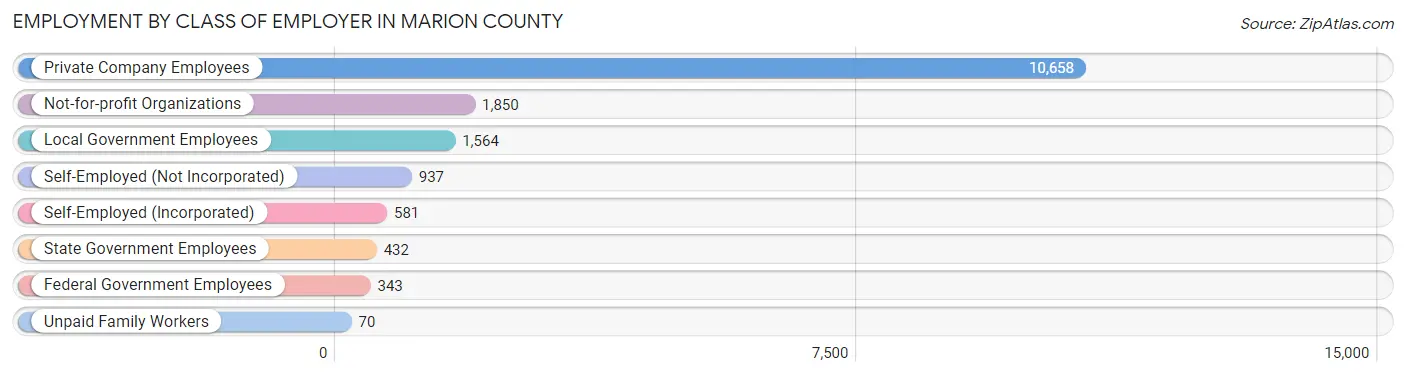
| Employer Class | # Employees | % Employees |
| Private Company Employees | 10,658 | 64.8% |
| Self-Employed (Incorporated) | 581 | 3.5% |
| Self-Employed (Not Incorporated) | 937 | 5.7% |
| Not-for-profit Organizations | 1,850 | 11.3% |
| Local Government Employees | 1,564 | 9.5% |
| State Government Employees | 432 | 2.6% |
| Federal Government Employees | 343 | 2.1% |
| Unpaid Family Workers | 70 | 0.4% |
| Total | 16,435 | 100.0% |
Employment Status by Age in Marion County
According to the labor force statistics for Marion County, out of the total population over 16 years of age (26,517), 64.9% or 17,210 individuals are in the labor force, with 2.3% or 396 of them unemployed. The age group with the highest labor force participation rate is 35 to 44 years, with 91.1% or 3,681 individuals in the labor force. Within the labor force, the 16 to 19 years age range has the highest percentage of unemployed individuals, with 7.7% or 80 of them being unemployed.
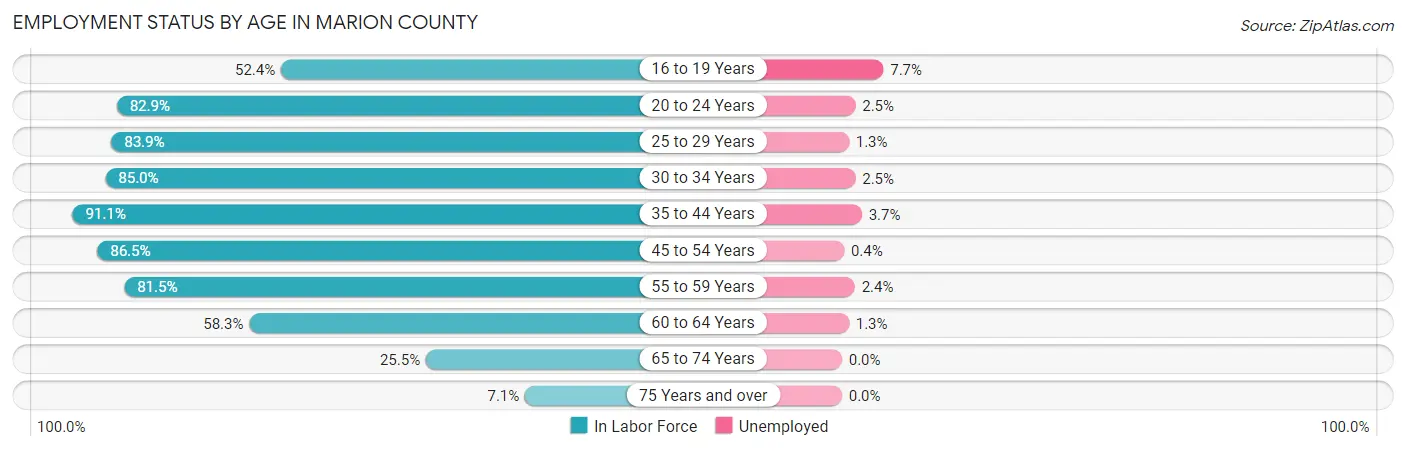
| Age Bracket | In Labor Force | Unemployed |
| 16 to 19 Years | 1,043 (52.4%) | 80 (7.7%) |
| 20 to 24 Years | 1,889 (82.9%) | 47 (2.5%) |
| 25 to 29 Years | 1,515 (83.9%) | 20 (1.3%) |
| 30 to 34 Years | 1,460 (85.0%) | 36 (2.5%) |
| 35 to 44 Years | 3,681 (91.1%) | 136 (3.7%) |
| 45 to 54 Years | 3,425 (86.5%) | 14 (0.4%) |
| 55 to 59 Years | 1,808 (81.5%) | 43 (2.4%) |
| 60 to 64 Years | 1,311 (58.3%) | 17 (1.3%) |
| 65 to 74 Years | 865 (25.5%) | 0 (0.0%) |
| 75 Years and over | 203 (7.1%) | 0 (0.0%) |
| Total | 17,210 (64.9%) | 396 (2.3%) |
Employment Status by Educational Attainment in Marion County
According to labor force statistics for Marion County, 82.5% of individuals (13,193) out of the total population between 25 and 64 years of age (15,991) are in the labor force, with 2.0% or 264 of them being unemployed. The group with the highest labor force participation rate are those with the educational attainment of bachelor's degree or higher, with 89.2% or 4,879 individuals in the labor force. Within the labor force, individuals with less than high school education have the highest percentage of unemployment, with 7.3% or 34 of them being unemployed.
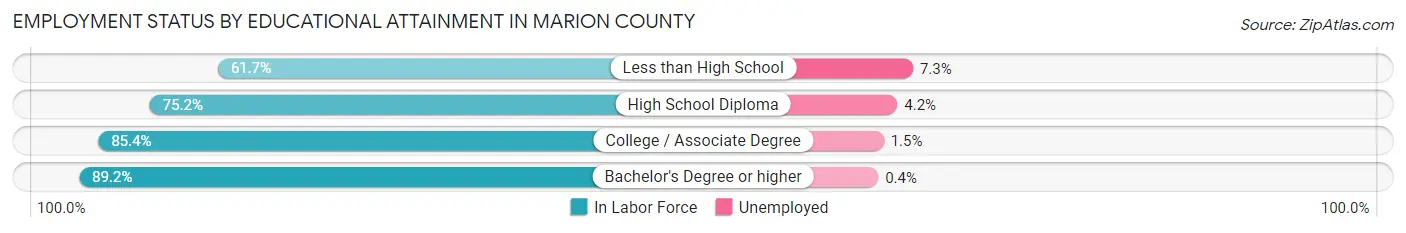
| Educational Attainment | In Labor Force | Unemployed |
| Less than High School | 465 (61.7%) | 55 (7.3%) |
| High School Diploma | 3,557 (75.2%) | 199 (4.2%) |
| College / Associate Degree | 4,302 (85.4%) | 76 (1.5%) |
| Bachelor's Degree or higher | 4,879 (89.2%) | 22 (0.4%) |
| Total | 13,193 (82.5%) | 320 (2.0%) |
Employment Occupations by Sex in Marion County
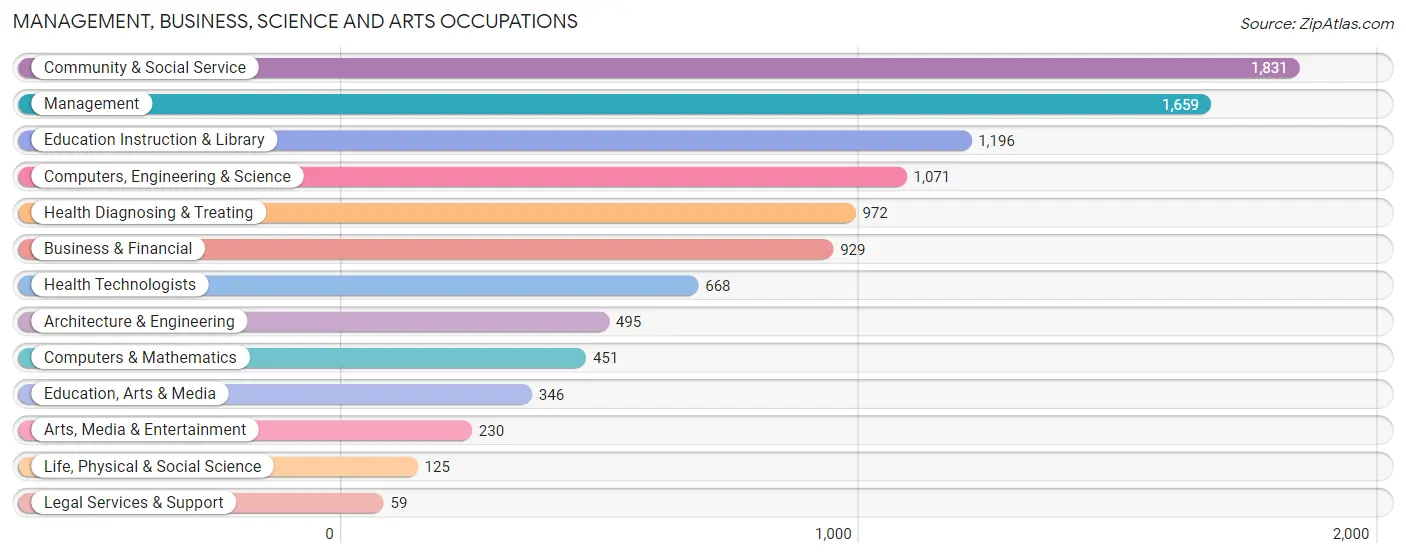
Management, Business, Science and Arts Occupations
The most common Management, Business, Science and Arts occupations in Marion County are Community & Social Service (1,831 | 10.9%), Management (1,659 | 9.9%), Education Instruction & Library (1,196 | 7.1%), Computers, Engineering & Science (1,071 | 6.4%), and Health Diagnosing & Treating (972 | 5.8%).
Management, Business, Science and Arts Occupations by Sex
Within the Management, Business, Science and Arts occupations in Marion County, the most male-oriented occupations are Architecture & Engineering (95.8%), Computers, Engineering & Science (90.1%), and Computers & Mathematics (87.1%), while the most female-oriented occupations are Education Instruction & Library (73.2%), Community & Social Service (64.2%), and Health Technologists (63.2%).
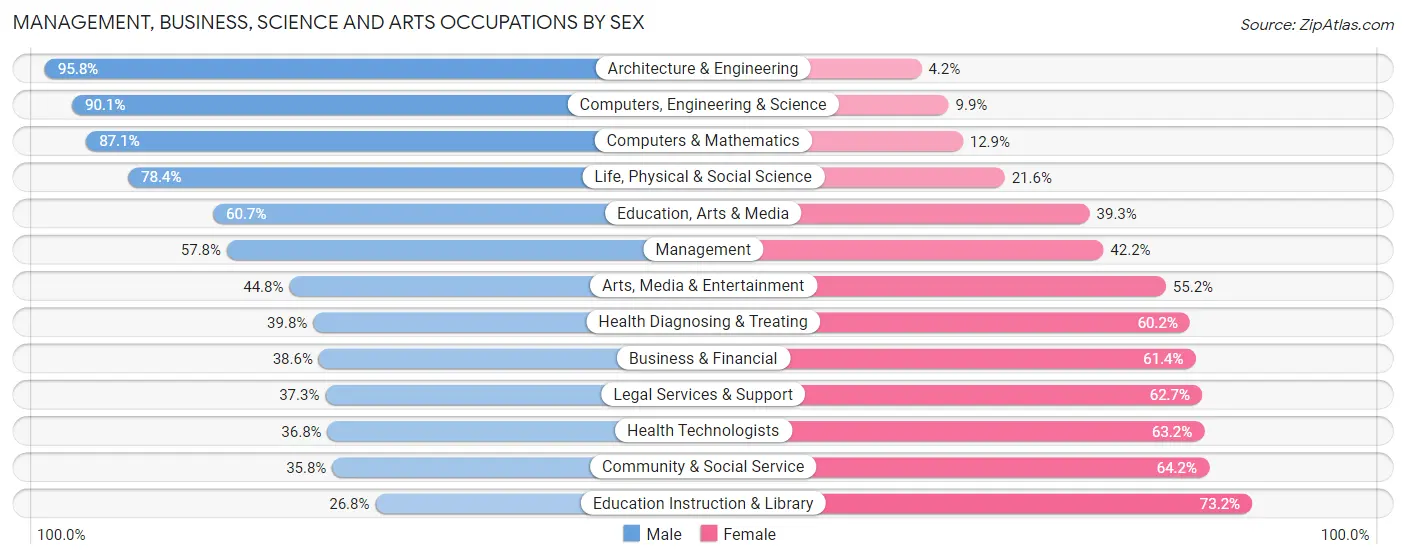
| Occupation | Male | Female |
| Management | 959 (57.8%) | 700 (42.2%) |
| Business & Financial | 359 (38.6%) | 570 (61.4%) |
| Computers, Engineering & Science | 965 (90.1%) | 106 (9.9%) |
| Computers & Mathematics | 393 (87.1%) | 58 (12.9%) |
| Architecture & Engineering | 474 (95.8%) | 21 (4.2%) |
| Life, Physical & Social Science | 98 (78.4%) | 27 (21.6%) |
| Community & Social Service | 656 (35.8%) | 1,175 (64.2%) |
| Education, Arts & Media | 210 (60.7%) | 136 (39.3%) |
| Legal Services & Support | 22 (37.3%) | 37 (62.7%) |
| Education Instruction & Library | 321 (26.8%) | 875 (73.2%) |
| Arts, Media & Entertainment | 103 (44.8%) | 127 (55.2%) |
| Health Diagnosing & Treating | 387 (39.8%) | 585 (60.2%) |
| Health Technologists | 246 (36.8%) | 422 (63.2%) |
| Total (Category) | 3,326 (51.5%) | 3,136 (48.5%) |
| Total (Overall) | 8,871 (52.9%) | 7,901 (47.1%) |
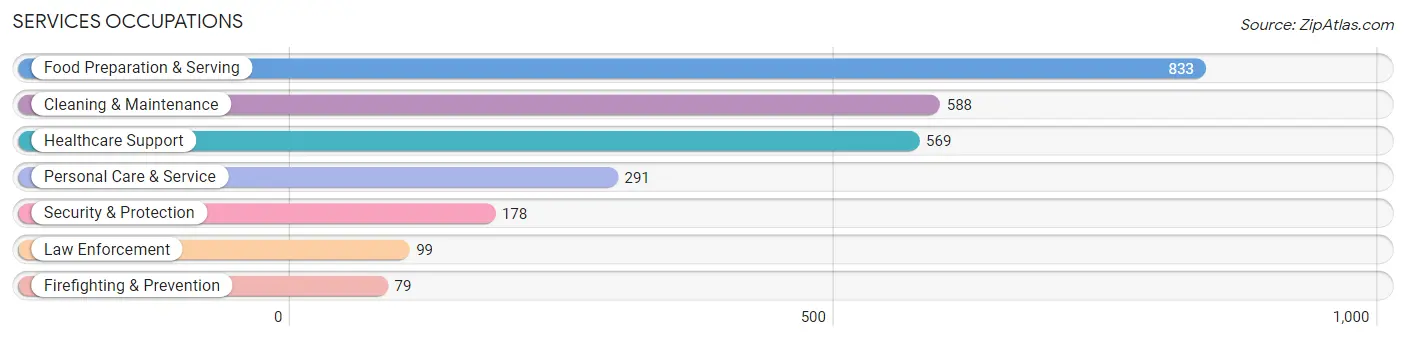
Services Occupations
The most common Services occupations in Marion County are Food Preparation & Serving (833 | 5.0%), Cleaning & Maintenance (588 | 3.5%), Healthcare Support (569 | 3.4%), Personal Care & Service (291 | 1.7%), and Security & Protection (178 | 1.1%).
Services Occupations by Sex
Within the Services occupations in Marion County, the most male-oriented occupations are Firefighting & Prevention (86.1%), Security & Protection (80.3%), and Law Enforcement (75.8%), while the most female-oriented occupations are Personal Care & Service (89.0%), Healthcare Support (83.3%), and Food Preparation & Serving (66.0%).
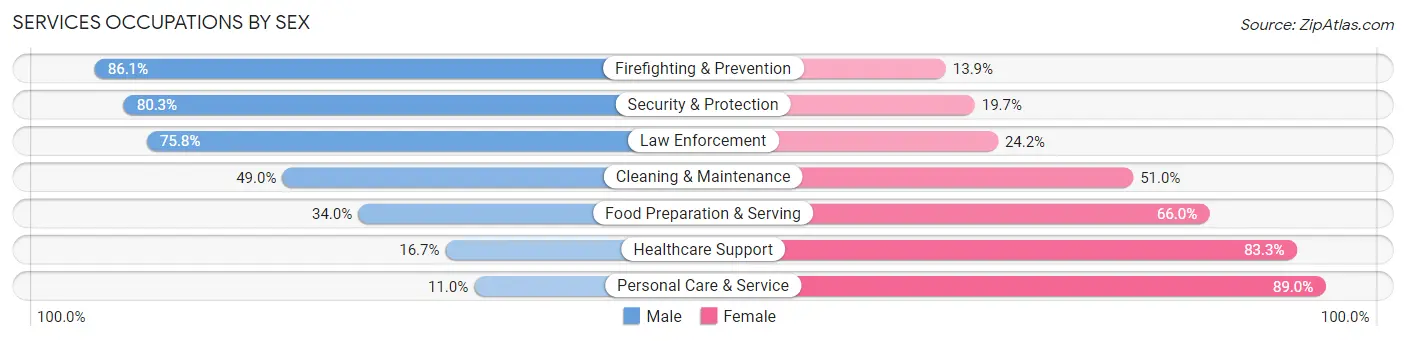
| Occupation | Male | Female |
| Healthcare Support | 95 (16.7%) | 474 (83.3%) |
| Security & Protection | 143 (80.3%) | 35 (19.7%) |
| Firefighting & Prevention | 68 (86.1%) | 11 (13.9%) |
| Law Enforcement | 75 (75.8%) | 24 (24.2%) |
| Food Preparation & Serving | 283 (34.0%) | 550 (66.0%) |
| Cleaning & Maintenance | 288 (49.0%) | 300 (51.0%) |
| Personal Care & Service | 32 (11.0%) | 259 (89.0%) |
| Total (Category) | 841 (34.2%) | 1,618 (65.8%) |
| Total (Overall) | 8,871 (52.9%) | 7,901 (47.1%) |
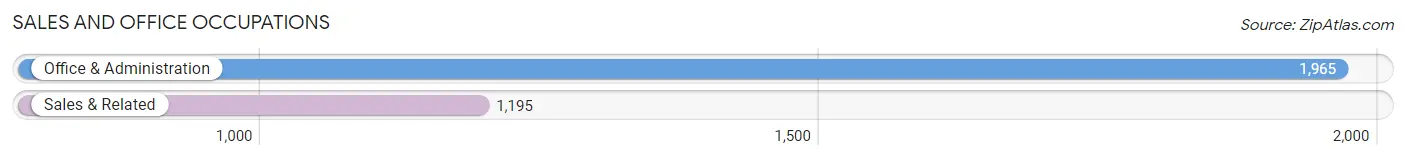
Sales and Office Occupations
The most common Sales and Office occupations in Marion County are Office & Administration (1,965 | 11.7%), and Sales & Related (1,195 | 7.1%).
Sales and Office Occupations by Sex
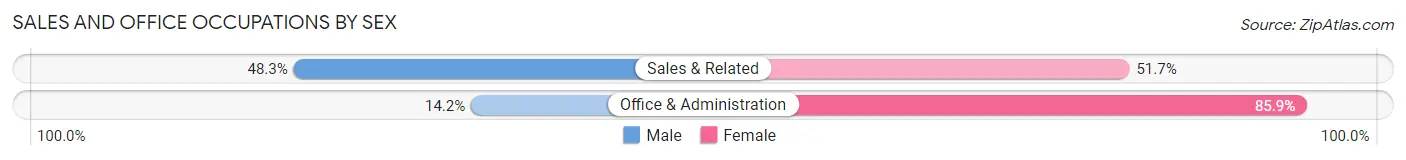
| Occupation | Male | Female |
| Sales & Related | 577 (48.3%) | 618 (51.7%) |
| Office & Administration | 278 (14.1%) | 1,687 (85.9%) |
| Total (Category) | 855 (27.1%) | 2,305 (72.9%) |
| Total (Overall) | 8,871 (52.9%) | 7,901 (47.1%) |
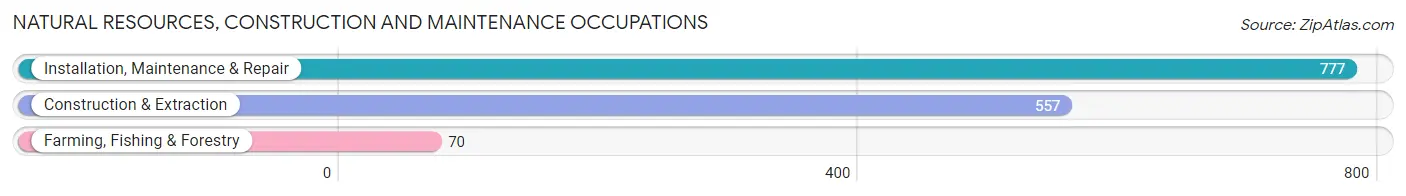
Natural Resources, Construction and Maintenance Occupations
The most common Natural Resources, Construction and Maintenance occupations in Marion County are Installation, Maintenance & Repair (777 | 4.6%), Construction & Extraction (557 | 3.3%), and Farming, Fishing & Forestry (70 | 0.4%).
Natural Resources, Construction and Maintenance Occupations by Sex
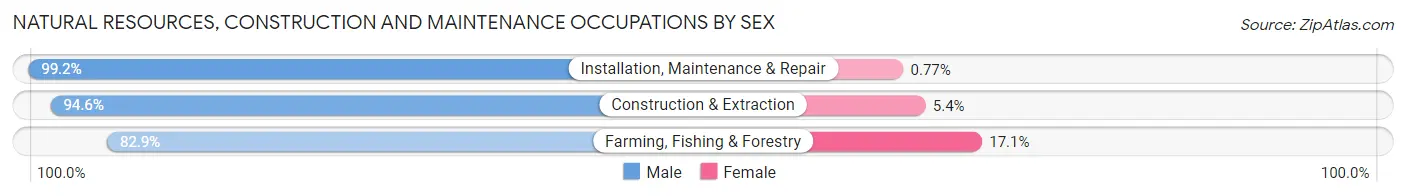
| Occupation | Male | Female |
| Farming, Fishing & Forestry | 58 (82.9%) | 12 (17.1%) |
| Construction & Extraction | 527 (94.6%) | 30 (5.4%) |
| Installation, Maintenance & Repair | 771 (99.2%) | 6 (0.8%) |
| Total (Category) | 1,356 (96.6%) | 48 (3.4%) |
| Total (Overall) | 8,871 (52.9%) | 7,901 (47.1%) |
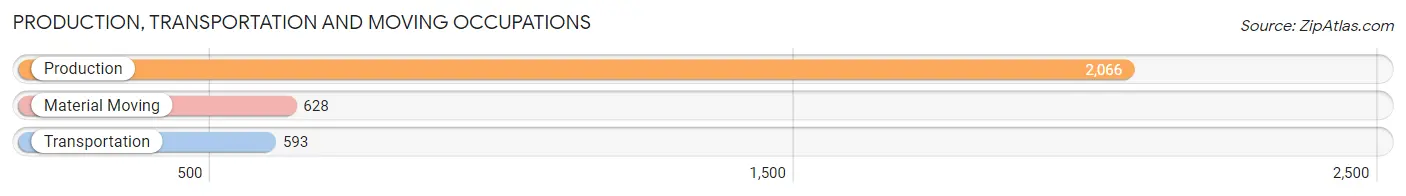
Production, Transportation and Moving Occupations
The most common Production, Transportation and Moving occupations in Marion County are Production (2,066 | 12.3%), Material Moving (628 | 3.7%), and Transportation (593 | 3.5%).
Production, Transportation and Moving Occupations by Sex
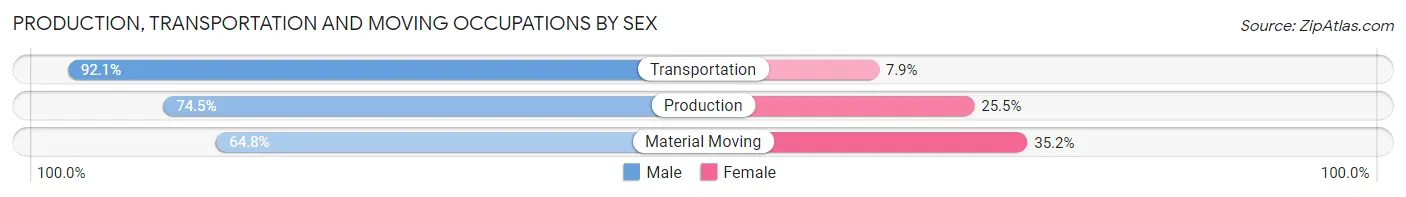
| Occupation | Male | Female |
| Production | 1,540 (74.5%) | 526 (25.5%) |
| Transportation | 546 (92.1%) | 47 (7.9%) |
| Material Moving | 407 (64.8%) | 221 (35.2%) |
| Total (Category) | 2,493 (75.8%) | 794 (24.2%) |
| Total (Overall) | 8,871 (52.9%) | 7,901 (47.1%) |
Employment Industries by Sex in Marion County
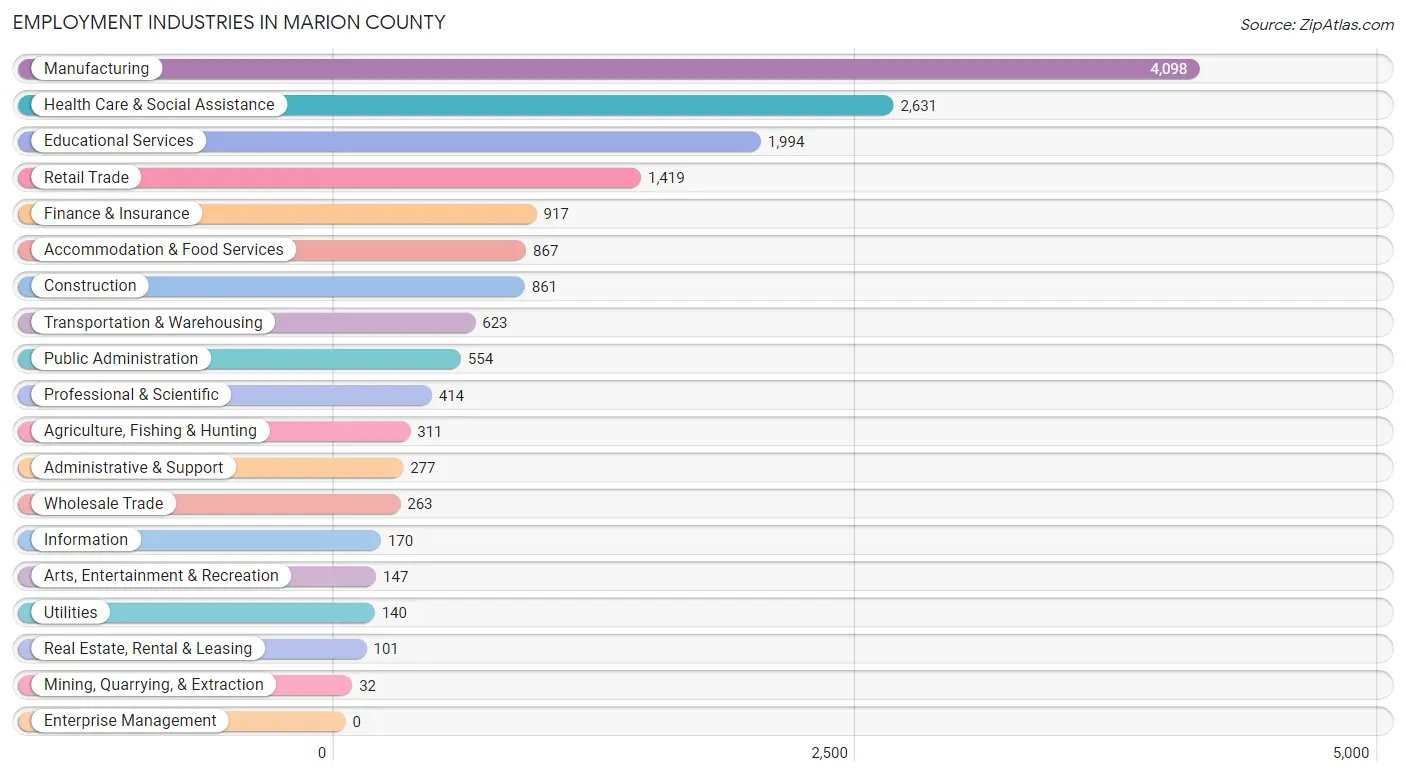
Employment Industries in Marion County
The major employment industries in Marion County include Manufacturing (4,098 | 24.4%), Health Care & Social Assistance (2,631 | 15.7%), Educational Services (1,994 | 11.9%), Retail Trade (1,419 | 8.5%), and Finance & Insurance (917 | 5.5%).
Employment Industries by Sex in Marion County
The Marion County industries that see more men than women are Utilities (90.7%), Mining, Quarrying, & Extraction (90.6%), and Agriculture, Fishing & Hunting (89.4%), whereas the industries that tend to have a higher number of women are Health Care & Social Assistance (76.7%), Finance & Insurance (74.7%), and Real Estate, Rental & Leasing (66.3%).
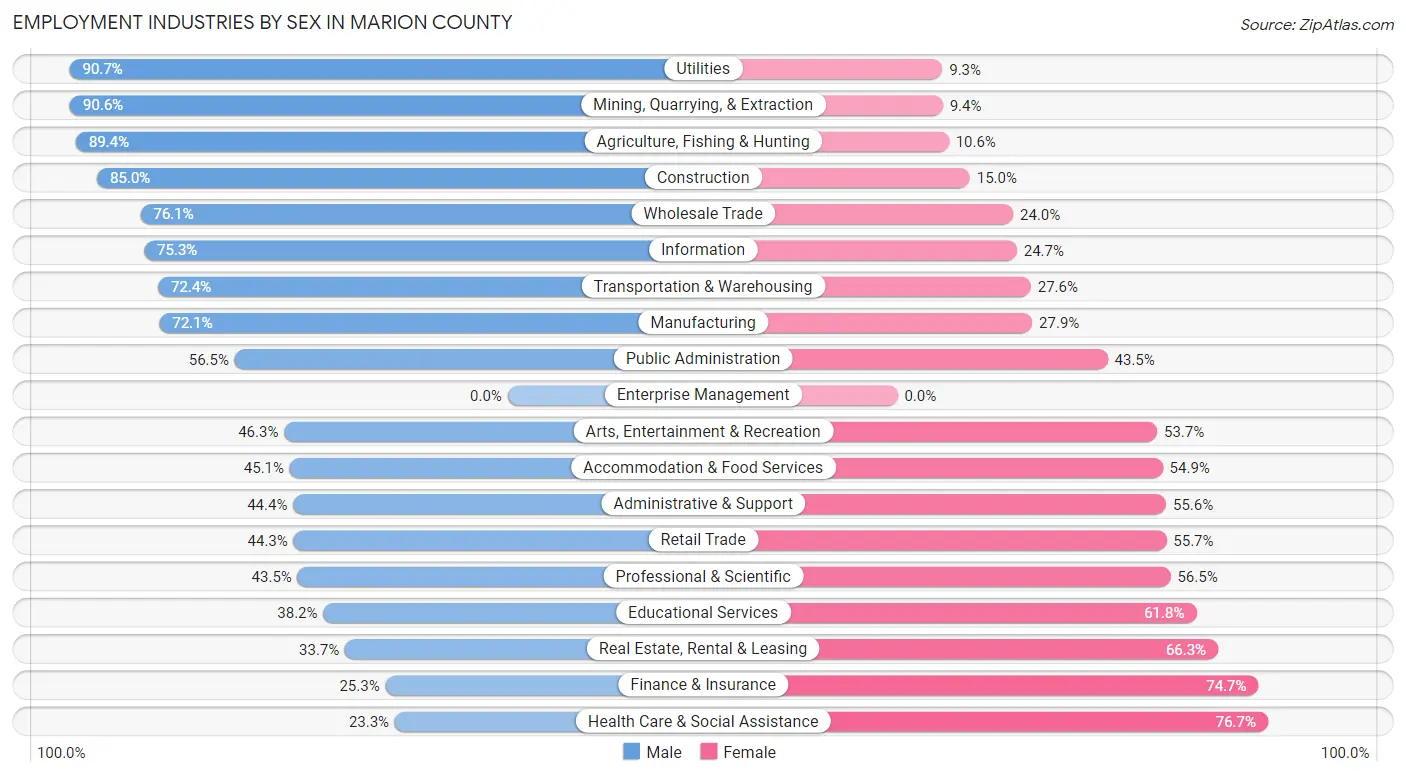
| Industry | Male | Female |
| Agriculture, Fishing & Hunting | 278 (89.4%) | 33 (10.6%) |
| Mining, Quarrying, & Extraction | 29 (90.6%) | 3 (9.4%) |
| Construction | 732 (85.0%) | 129 (15.0%) |
| Manufacturing | 2,955 (72.1%) | 1,143 (27.9%) |
| Wholesale Trade | 200 (76.0%) | 63 (23.9%) |
| Retail Trade | 629 (44.3%) | 790 (55.7%) |
| Transportation & Warehousing | 451 (72.4%) | 172 (27.6%) |
| Utilities | 127 (90.7%) | 13 (9.3%) |
| Information | 128 (75.3%) | 42 (24.7%) |
| Finance & Insurance | 232 (25.3%) | 685 (74.7%) |
| Real Estate, Rental & Leasing | 34 (33.7%) | 67 (66.3%) |
| Professional & Scientific | 180 (43.5%) | 234 (56.5%) |
| Enterprise Management | 0 (0.0%) | 0 (0.0%) |
| Administrative & Support | 123 (44.4%) | 154 (55.6%) |
| Educational Services | 761 (38.2%) | 1,233 (61.8%) |
| Health Care & Social Assistance | 614 (23.3%) | 2,017 (76.7%) |
| Arts, Entertainment & Recreation | 68 (46.3%) | 79 (53.7%) |
| Accommodation & Food Services | 391 (45.1%) | 476 (54.9%) |
| Public Administration | 313 (56.5%) | 241 (43.5%) |
| Total | 8,871 (52.9%) | 7,901 (47.1%) |
Education in Marion County
School Enrollment in Marion County
The most common levels of schooling among the 8,555 students in Marion County are middle school (2,095 | 24.5%), college / undergraduate (1,951 | 22.8%), and high school (1,791 | 20.9%).
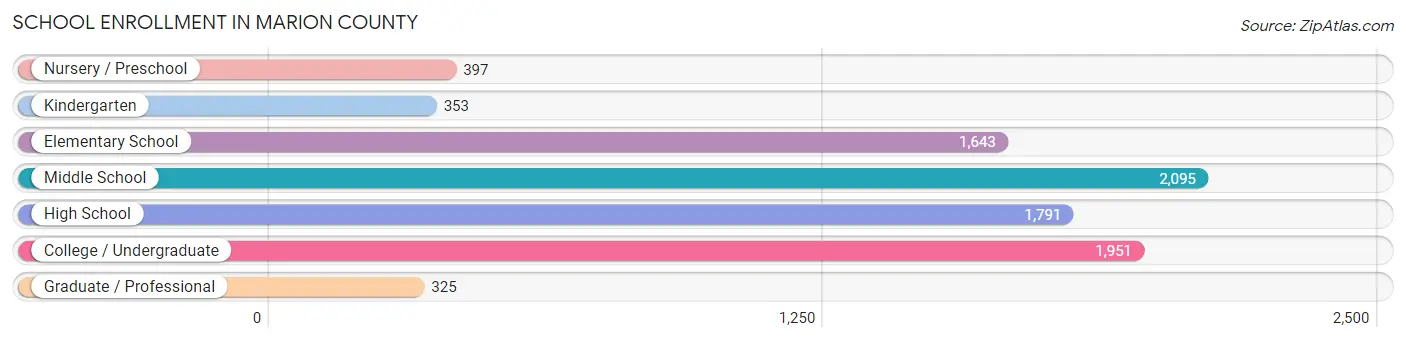
| School Level | # Students | % Students |
| Nursery / Preschool | 397 | 4.6% |
| Kindergarten | 353 | 4.1% |
| Elementary School | 1,643 | 19.2% |
| Middle School | 2,095 | 24.5% |
| High School | 1,791 | 20.9% |
| College / Undergraduate | 1,951 | 22.8% |
| Graduate / Professional | 325 | 3.8% |
| Total | 8,555 | 100.0% |
School Enrollment by Age by Funding Source in Marion County
Out of a total of 8,555 students who are enrolled in schools in Marion County, 2,524 (29.5%) attend a private institution, while the remaining 6,031 (70.5%) are enrolled in public schools. The age group of 20 to 24 year olds has the highest likelihood of being enrolled in private schools, with 663 (79.8% in the age bracket) enrolled. Conversely, the age group of 3 to 4 year olds has the lowest likelihood of being enrolled in a private school, with 263 (94.3% in the age bracket) attending a public institution.
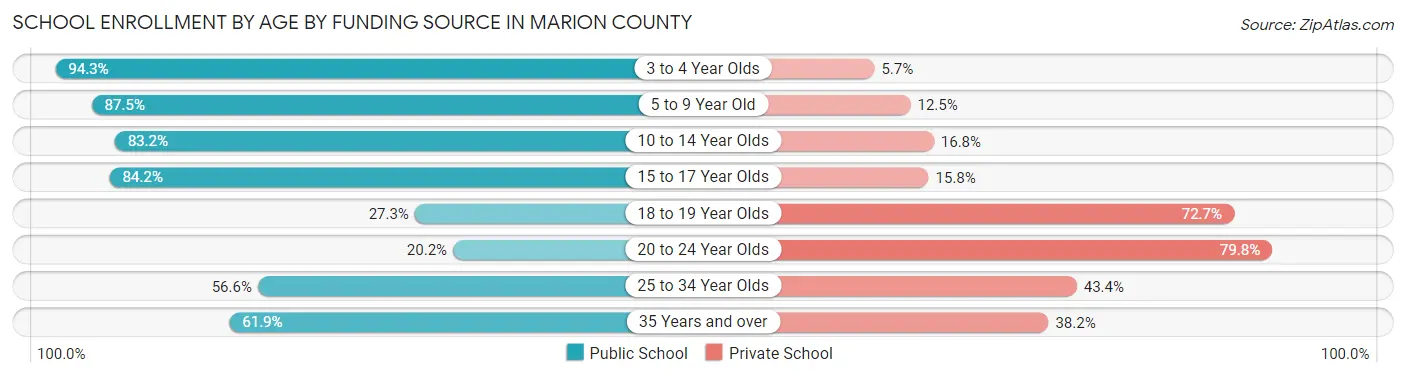
| Age Bracket | Public School | Private School |
| 3 to 4 Year Olds | 263 (94.3%) | 16 (5.7%) |
| 5 to 9 Year Old | 1,602 (87.5%) | 228 (12.5%) |
| 10 to 14 Year Olds | 2,140 (83.2%) | 432 (16.8%) |
| 15 to 17 Year Olds | 1,213 (84.2%) | 228 (15.8%) |
| 18 to 19 Year Olds | 266 (27.3%) | 707 (72.7%) |
| 20 to 24 Year Olds | 168 (20.2%) | 663 (79.8%) |
| 25 to 34 Year Olds | 129 (56.6%) | 99 (43.4%) |
| 35 Years and over | 248 (61.9%) | 153 (38.2%) |
| Total | 6,031 (70.5%) | 2,524 (29.5%) |
Educational Attainment by Field of Study in Marion County
Education (1,539 | 20.3%), business (1,455 | 19.2%), science & technology (913 | 12.0%), arts & humanities (652 | 8.6%), and engineering (507 | 6.7%) are the most common fields of study among 7,597 individuals in Marion County who have obtained a bachelor's degree or higher.
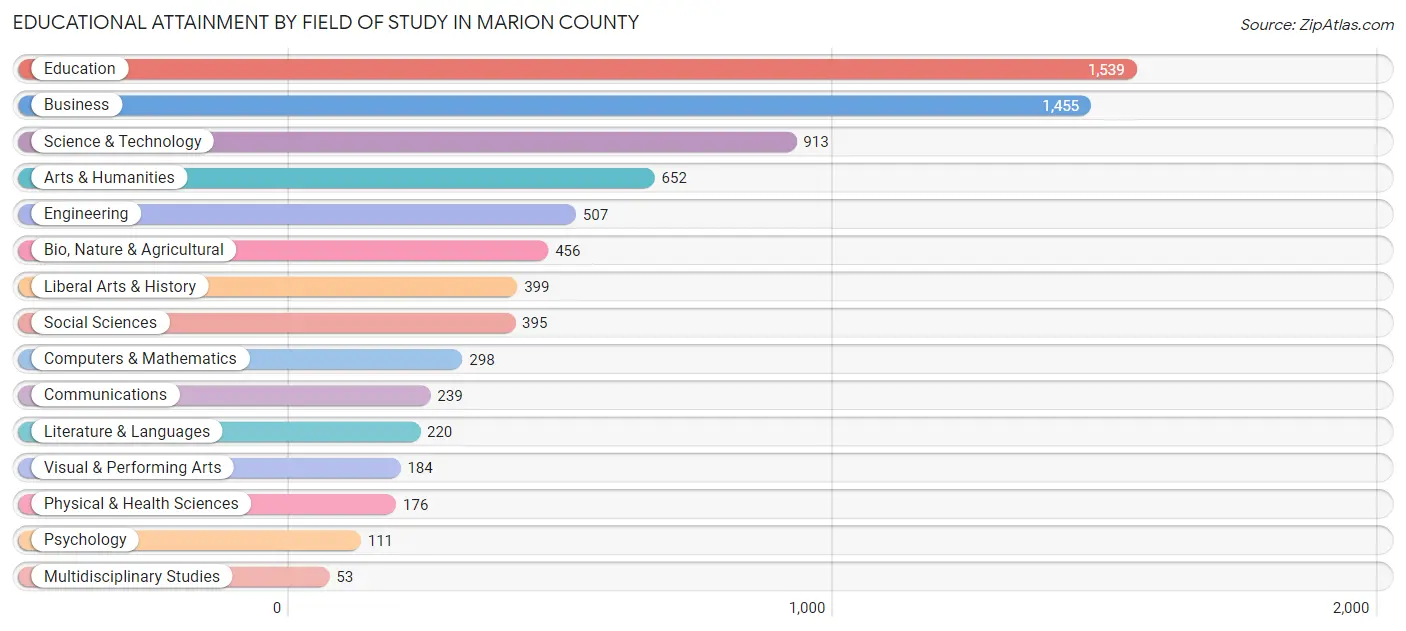
| Field of Study | # Graduates | % Graduates |
| Computers & Mathematics | 298 | 3.9% |
| Bio, Nature & Agricultural | 456 | 6.0% |
| Physical & Health Sciences | 176 | 2.3% |
| Psychology | 111 | 1.5% |
| Social Sciences | 395 | 5.2% |
| Engineering | 507 | 6.7% |
| Multidisciplinary Studies | 53 | 0.7% |
| Science & Technology | 913 | 12.0% |
| Business | 1,455 | 19.2% |
| Education | 1,539 | 20.3% |
| Literature & Languages | 220 | 2.9% |
| Liberal Arts & History | 399 | 5.2% |
| Visual & Performing Arts | 184 | 2.4% |
| Communications | 239 | 3.2% |
| Arts & Humanities | 652 | 8.6% |
| Total | 7,597 | 100.0% |
Transportation & Commute in Marion County
Vehicle Availability by Sex in Marion County
The most prevalent vehicle ownership categories in Marion County are males with 2 vehicles (3,744, accounting for 45.4%) and females with 2 vehicles (2,958, making up 50.8%).
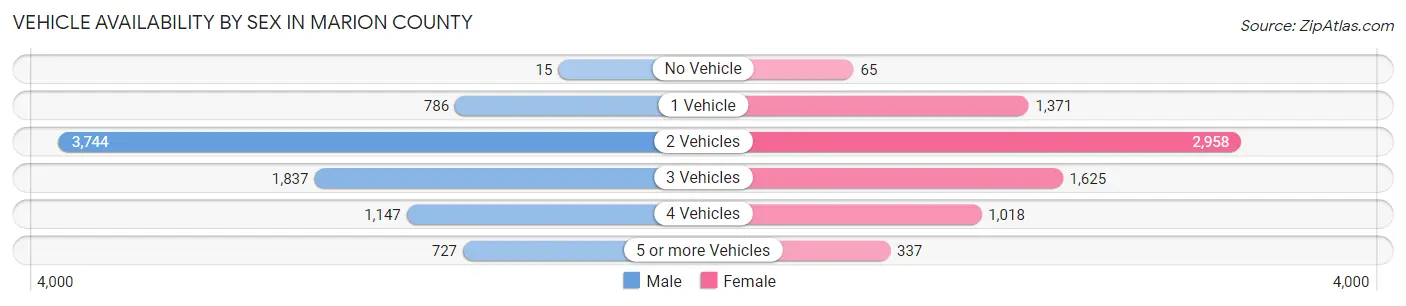
| Vehicles Available | Male | Female |
| No Vehicle | 15 (0.2%) | 65 (0.9%) |
| 1 Vehicle | 786 (9.5%) | 1,371 (18.6%) |
| 2 Vehicles | 3,744 (45.4%) | 2,958 (40.1%) |
| 3 Vehicles | 1,837 (22.3%) | 1,625 (22.0%) |
| 4 Vehicles | 1,147 (13.9%) | 1,018 (13.8%) |
| 5 or more Vehicles | 727 (8.8%) | 337 (4.6%) |
| Total | 8,256 (100.0%) | 7,374 (100.0%) |
Commute Time in Marion County
The most frequently occuring commute durations in Marion County are 5 to 9 minutes (3,634 commuters, 23.9%), 10 to 14 minutes (2,041 commuters, 13.4%), and less than 5 minutes (1,712 commuters, 11.3%).
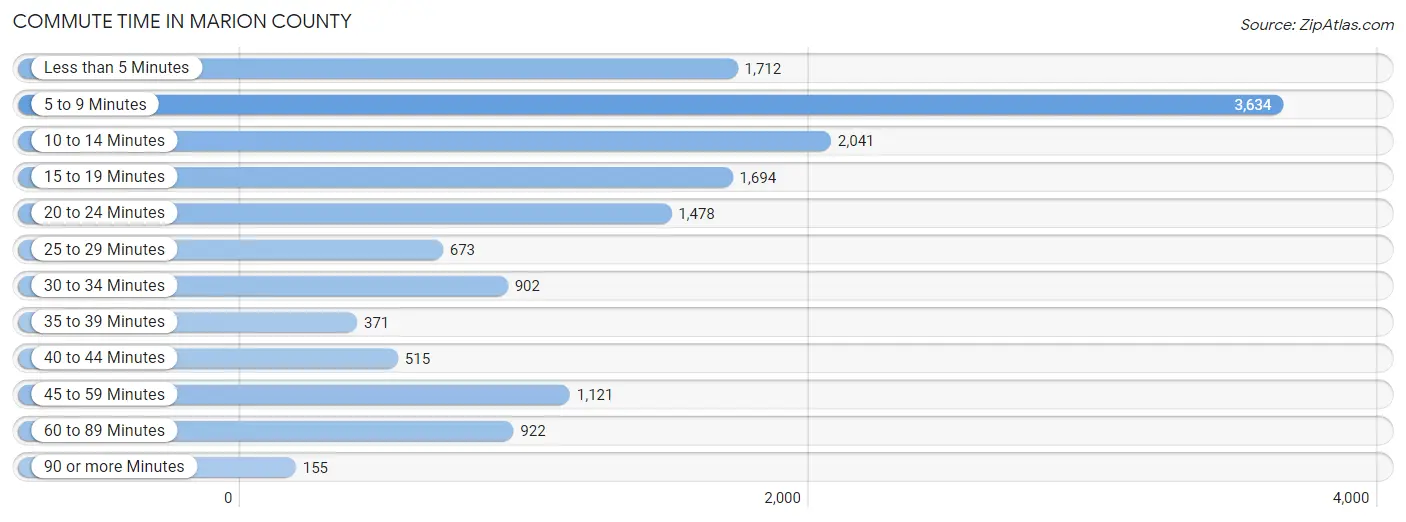
| Commute Time | # Commuters | % Commuters |
| Less than 5 Minutes | 1,712 | 11.3% |
| 5 to 9 Minutes | 3,634 | 23.9% |
| 10 to 14 Minutes | 2,041 | 13.4% |
| 15 to 19 Minutes | 1,694 | 11.1% |
| 20 to 24 Minutes | 1,478 | 9.7% |
| 25 to 29 Minutes | 673 | 4.4% |
| 30 to 34 Minutes | 902 | 5.9% |
| 35 to 39 Minutes | 371 | 2.4% |
| 40 to 44 Minutes | 515 | 3.4% |
| 45 to 59 Minutes | 1,121 | 7.4% |
| 60 to 89 Minutes | 922 | 6.1% |
| 90 or more Minutes | 155 | 1.0% |
Commute Time by Sex in Marion County
The most common commute times in Marion County are 5 to 9 minutes (1,873 commuters, 22.8%) for males and 5 to 9 minutes (1,761 commuters, 25.2%) for females.
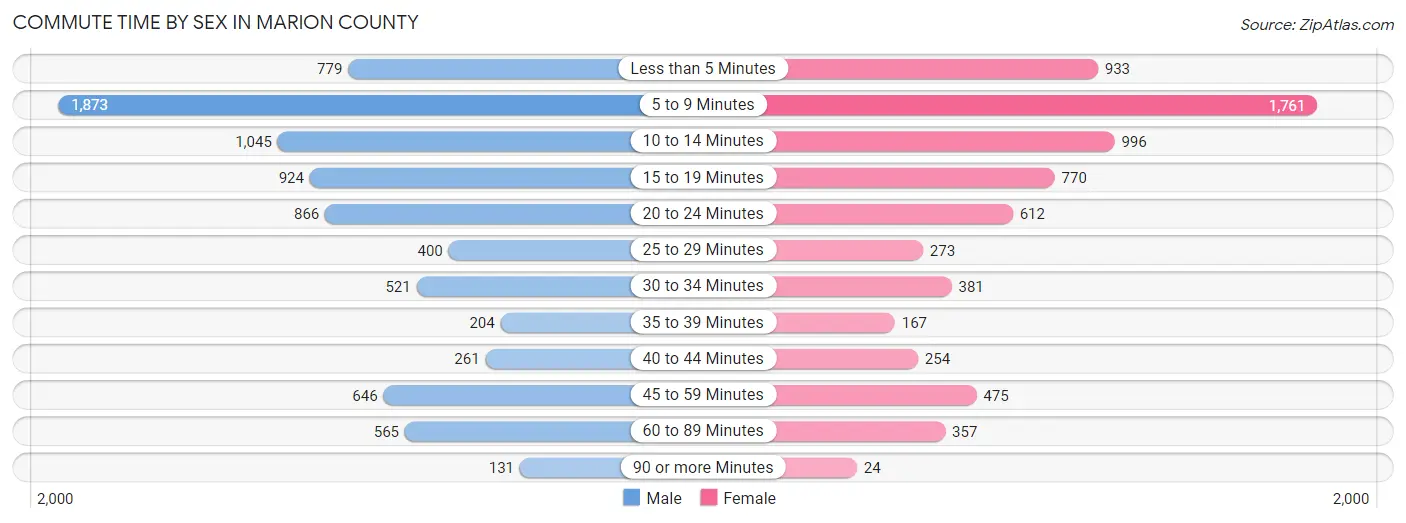
| Commute Time | Male | Female |
| Less than 5 Minutes | 779 (9.5%) | 933 (13.3%) |
| 5 to 9 Minutes | 1,873 (22.8%) | 1,761 (25.2%) |
| 10 to 14 Minutes | 1,045 (12.7%) | 996 (14.2%) |
| 15 to 19 Minutes | 924 (11.3%) | 770 (11.0%) |
| 20 to 24 Minutes | 866 (10.5%) | 612 (8.7%) |
| 25 to 29 Minutes | 400 (4.9%) | 273 (3.9%) |
| 30 to 34 Minutes | 521 (6.3%) | 381 (5.4%) |
| 35 to 39 Minutes | 204 (2.5%) | 167 (2.4%) |
| 40 to 44 Minutes | 261 (3.2%) | 254 (3.6%) |
| 45 to 59 Minutes | 646 (7.9%) | 475 (6.8%) |
| 60 to 89 Minutes | 565 (6.9%) | 357 (5.1%) |
| 90 or more Minutes | 131 (1.6%) | 24 (0.3%) |
Time of Departure to Work by Sex in Marion County
The most frequent times of departure to work in Marion County are 6:30 AM to 6:59 AM (1,141, 13.9%) for males and 7:30 AM to 7:59 AM (1,211, 17.3%) for females.
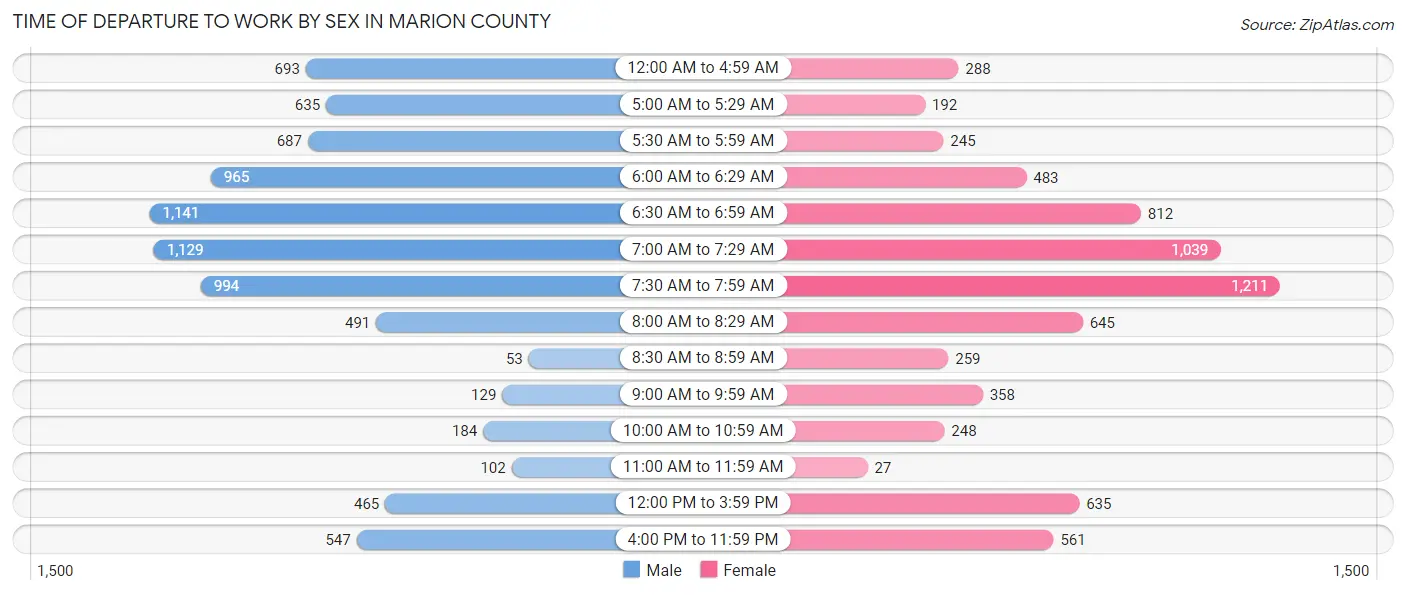
| Time of Departure | Male | Female |
| 12:00 AM to 4:59 AM | 693 (8.4%) | 288 (4.1%) |
| 5:00 AM to 5:29 AM | 635 (7.7%) | 192 (2.7%) |
| 5:30 AM to 5:59 AM | 687 (8.4%) | 245 (3.5%) |
| 6:00 AM to 6:29 AM | 965 (11.7%) | 483 (6.9%) |
| 6:30 AM to 6:59 AM | 1,141 (13.9%) | 812 (11.6%) |
| 7:00 AM to 7:29 AM | 1,129 (13.7%) | 1,039 (14.8%) |
| 7:30 AM to 7:59 AM | 994 (12.1%) | 1,211 (17.3%) |
| 8:00 AM to 8:29 AM | 491 (6.0%) | 645 (9.2%) |
| 8:30 AM to 8:59 AM | 53 (0.6%) | 259 (3.7%) |
| 9:00 AM to 9:59 AM | 129 (1.6%) | 358 (5.1%) |
| 10:00 AM to 10:59 AM | 184 (2.2%) | 248 (3.5%) |
| 11:00 AM to 11:59 AM | 102 (1.2%) | 27 (0.4%) |
| 12:00 PM to 3:59 PM | 465 (5.7%) | 635 (9.1%) |
| 4:00 PM to 11:59 PM | 547 (6.7%) | 561 (8.0%) |
| Total | 8,215 (100.0%) | 7,003 (100.0%) |
Housing Occupancy in Marion County
Occupancy by Ownership in Marion County
Of the total 13,310 dwellings in Marion County, owner-occupied units account for 10,262 (77.1%), while renter-occupied units make up 3,048 (22.9%).
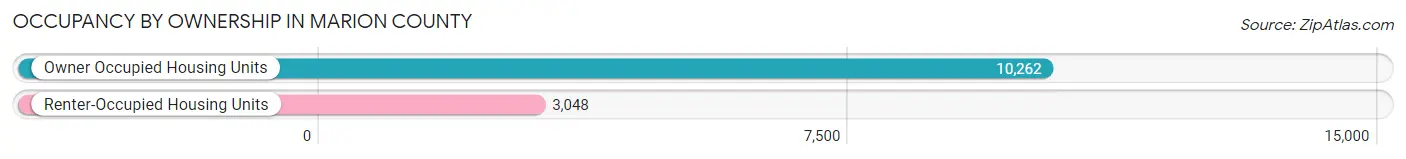
| Occupancy | # Housing Units | % Housing Units |
| Owner Occupied Housing Units | 10,262 | 77.1% |
| Renter-Occupied Housing Units | 3,048 | 22.9% |
| Total Occupied Housing Units | 13,310 | 100.0% |
Occupancy by Household Size in Marion County
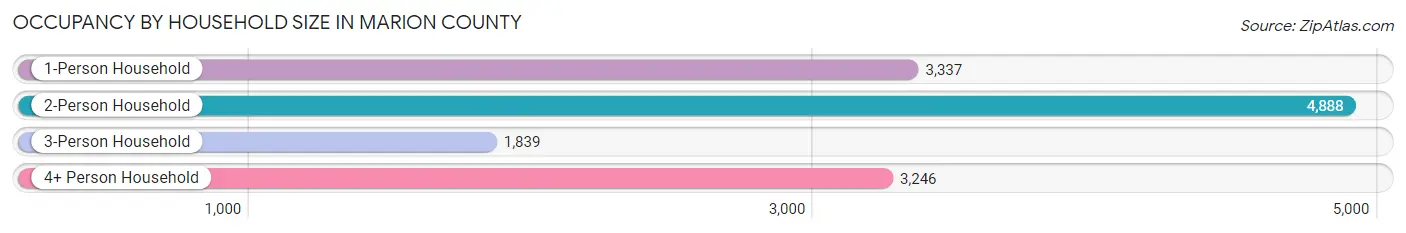
| Household Size | # Housing Units | % Housing Units |
| 1-Person Household | 3,337 | 25.1% |
| 2-Person Household | 4,888 | 36.7% |
| 3-Person Household | 1,839 | 13.8% |
| 4+ Person Household | 3,246 | 24.4% |
| Total Housing Units | 13,310 | 100.0% |
Occupancy by Ownership by Household Size in Marion County
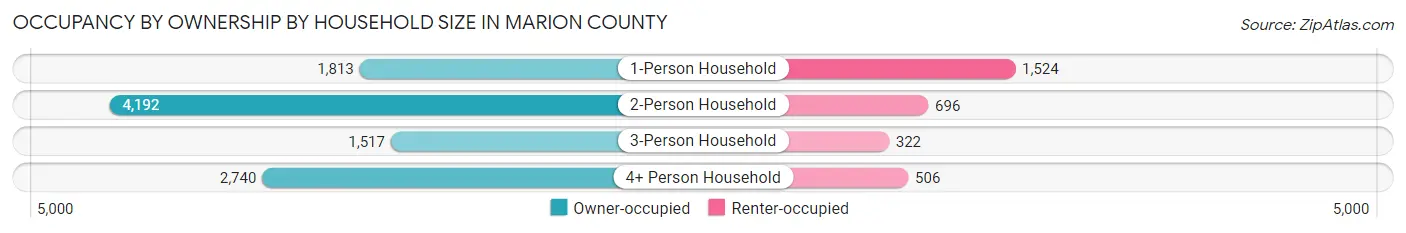
| Household Size | Owner-occupied | Renter-occupied |
| 1-Person Household | 1,813 (54.3%) | 1,524 (45.7%) |
| 2-Person Household | 4,192 (85.8%) | 696 (14.2%) |
| 3-Person Household | 1,517 (82.5%) | 322 (17.5%) |
| 4+ Person Household | 2,740 (84.4%) | 506 (15.6%) |
| Total Housing Units | 10,262 (77.1%) | 3,048 (22.9%) |
Occupancy by Educational Attainment in Marion County
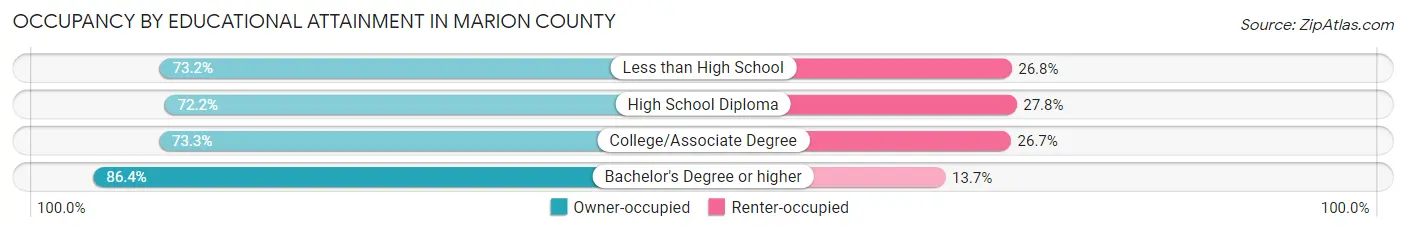
| Household Size | Owner-occupied | Renter-occupied |
| Less than High School | 563 (73.2%) | 206 (26.8%) |
| High School Diploma | 2,849 (72.2%) | 1,096 (27.8%) |
| College/Associate Degree | 3,230 (73.3%) | 1,174 (26.7%) |
| Bachelor's Degree or higher | 3,620 (86.4%) | 572 (13.7%) |
Occupancy by Age of Householder in Marion County
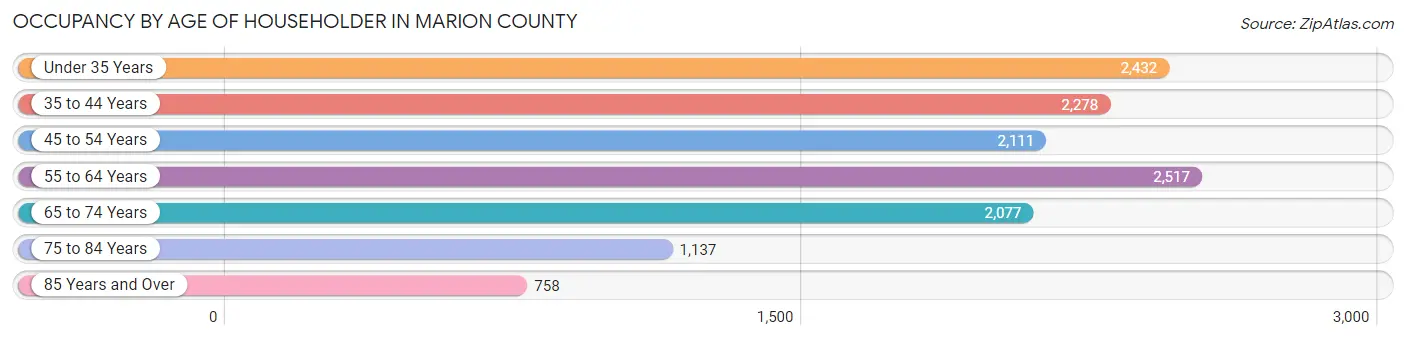
| Age Bracket | # Households | % Households |
| Under 35 Years | 2,432 | 18.3% |
| 35 to 44 Years | 2,278 | 17.1% |
| 45 to 54 Years | 2,111 | 15.9% |
| 55 to 64 Years | 2,517 | 18.9% |
| 65 to 74 Years | 2,077 | 15.6% |
| 75 to 84 Years | 1,137 | 8.5% |
| 85 Years and Over | 758 | 5.7% |
| Total | 13,310 | 100.0% |
Housing Finances in Marion County
Median Income by Occupancy in Marion County
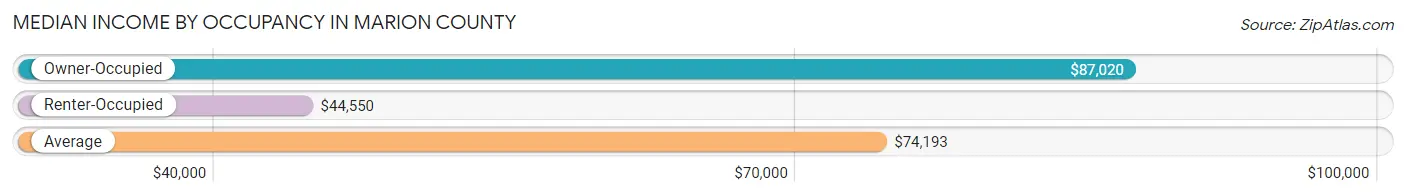
| Occupancy Type | # Households | Median Income |
| Owner-Occupied | 10,262 (77.1%) | $87,020 |
| Renter-Occupied | 3,048 (22.9%) | $44,550 |
| Average | 13,310 (100.0%) | $74,193 |
Occupancy by Householder Income Bracket in Marion County
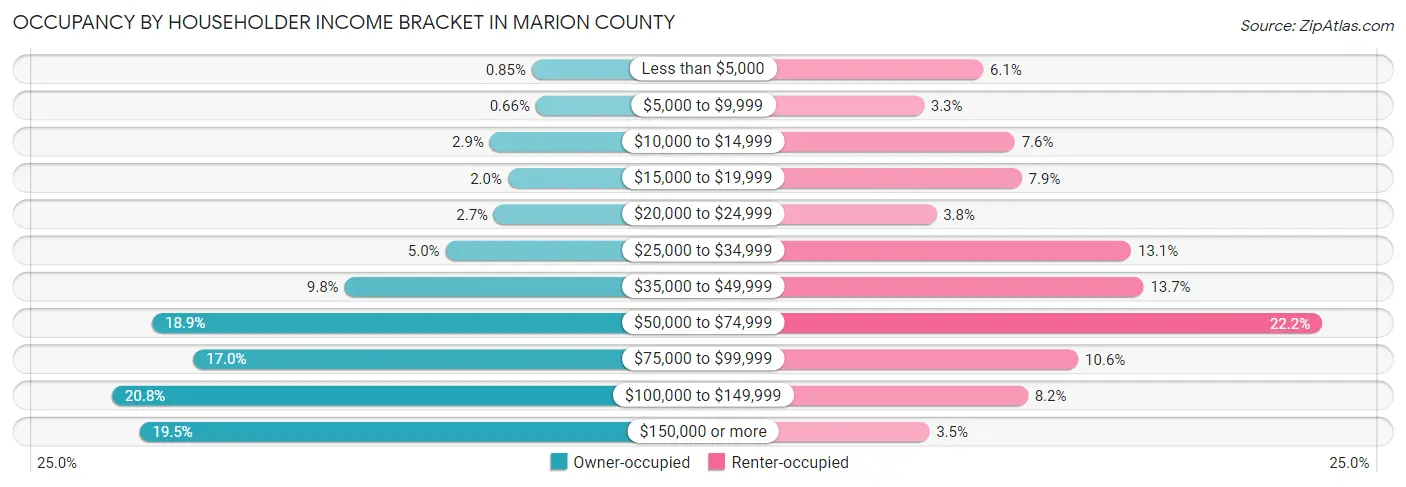
| Income Bracket | Owner-occupied | Renter-occupied |
| Less than $5,000 | 87 (0.9%) | 185 (6.1%) |
| $5,000 to $9,999 | 68 (0.7%) | 99 (3.3%) |
| $10,000 to $14,999 | 292 (2.9%) | 231 (7.6%) |
| $15,000 to $19,999 | 204 (2.0%) | 241 (7.9%) |
| $20,000 to $24,999 | 272 (2.6%) | 117 (3.8%) |
| $25,000 to $34,999 | 509 (5.0%) | 400 (13.1%) |
| $35,000 to $49,999 | 1,003 (9.8%) | 418 (13.7%) |
| $50,000 to $74,999 | 1,943 (18.9%) | 677 (22.2%) |
| $75,000 to $99,999 | 1,741 (17.0%) | 323 (10.6%) |
| $100,000 to $149,999 | 2,139 (20.8%) | 250 (8.2%) |
| $150,000 or more | 2,004 (19.5%) | 107 (3.5%) |
| Total | 10,262 (100.0%) | 3,048 (100.0%) |
Monthly Housing Cost Tiers in Marion County
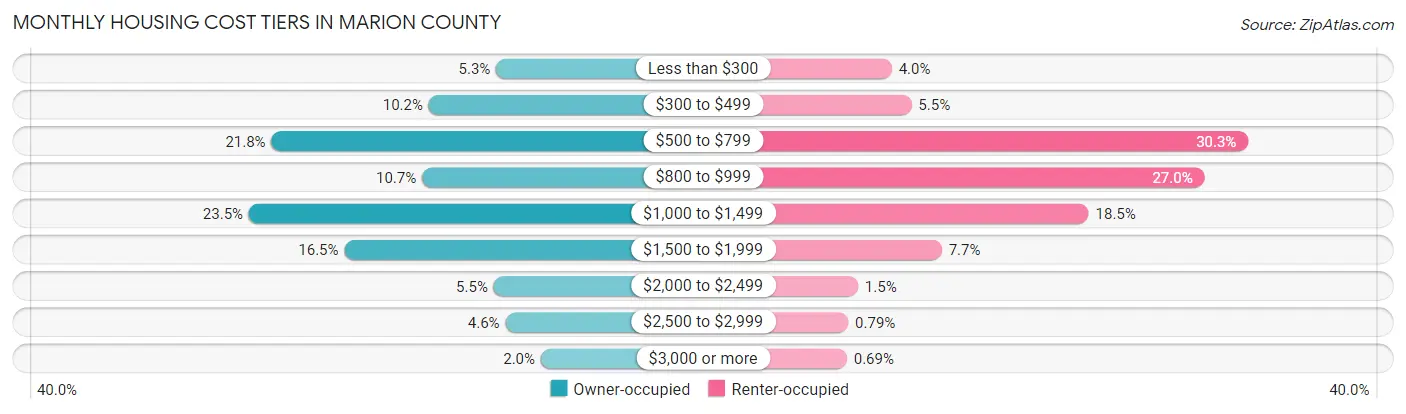
| Monthly Cost | Owner-occupied | Renter-occupied |
| Less than $300 | 541 (5.3%) | 122 (4.0%) |
| $300 to $499 | 1,050 (10.2%) | 166 (5.4%) |
| $500 to $799 | 2,239 (21.8%) | 922 (30.2%) |
| $800 to $999 | 1,101 (10.7%) | 824 (27.0%) |
| $1,000 to $1,499 | 2,410 (23.5%) | 564 (18.5%) |
| $1,500 to $1,999 | 1,688 (16.5%) | 234 (7.7%) |
| $2,000 to $2,499 | 559 (5.4%) | 46 (1.5%) |
| $2,500 to $2,999 | 471 (4.6%) | 24 (0.8%) |
| $3,000 or more | 203 (2.0%) | 21 (0.7%) |
| Total | 10,262 (100.0%) | 3,048 (100.0%) |
Physical Housing Characteristics in Marion County
Housing Structures in Marion County
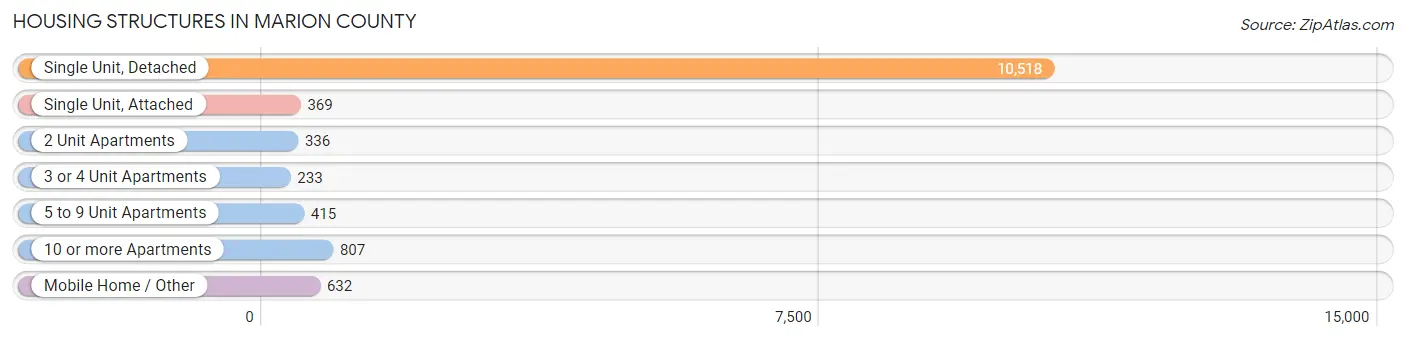
| Structure Type | # Housing Units | % Housing Units |
| Single Unit, Detached | 10,518 | 79.0% |
| Single Unit, Attached | 369 | 2.8% |
| 2 Unit Apartments | 336 | 2.5% |
| 3 or 4 Unit Apartments | 233 | 1.8% |
| 5 to 9 Unit Apartments | 415 | 3.1% |
| 10 or more Apartments | 807 | 6.1% |
| Mobile Home / Other | 632 | 4.8% |
| Total | 13,310 | 100.0% |
Housing Structures by Occupancy in Marion County
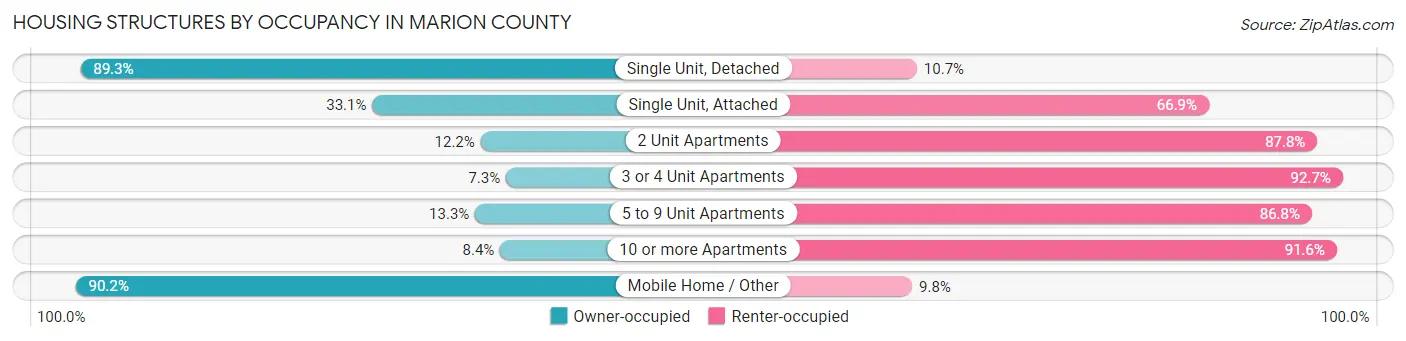
| Structure Type | Owner-occupied | Renter-occupied |
| Single Unit, Detached | 9,389 (89.3%) | 1,129 (10.7%) |
| Single Unit, Attached | 122 (33.1%) | 247 (66.9%) |
| 2 Unit Apartments | 41 (12.2%) | 295 (87.8%) |
| 3 or 4 Unit Apartments | 17 (7.3%) | 216 (92.7%) |
| 5 to 9 Unit Apartments | 55 (13.3%) | 360 (86.8%) |
| 10 or more Apartments | 68 (8.4%) | 739 (91.6%) |
| Mobile Home / Other | 570 (90.2%) | 62 (9.8%) |
| Total | 10,262 (77.1%) | 3,048 (22.9%) |
Housing Structures by Number of Rooms in Marion County
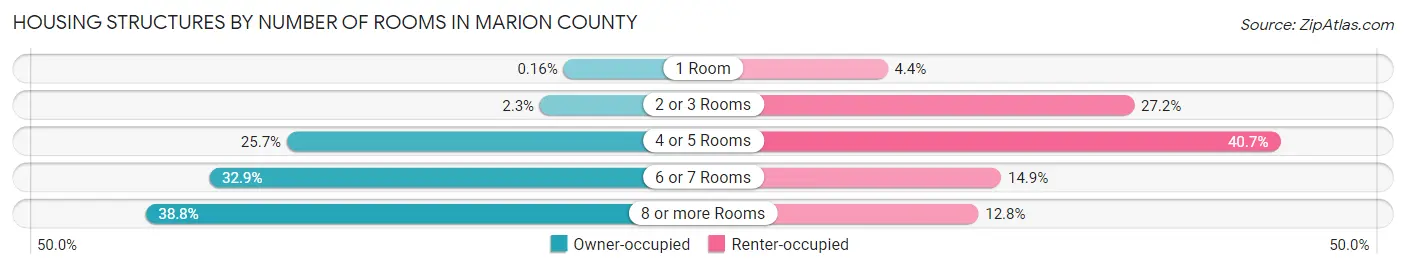
| Number of Rooms | Owner-occupied | Renter-occupied |
| 1 Room | 16 (0.2%) | 134 (4.4%) |
| 2 or 3 Rooms | 240 (2.3%) | 829 (27.2%) |
| 4 or 5 Rooms | 2,641 (25.7%) | 1,241 (40.7%) |
| 6 or 7 Rooms | 3,380 (32.9%) | 454 (14.9%) |
| 8 or more Rooms | 3,985 (38.8%) | 390 (12.8%) |
| Total | 10,262 (100.0%) | 3,048 (100.0%) |
Housing Structure by Heating Type in Marion County
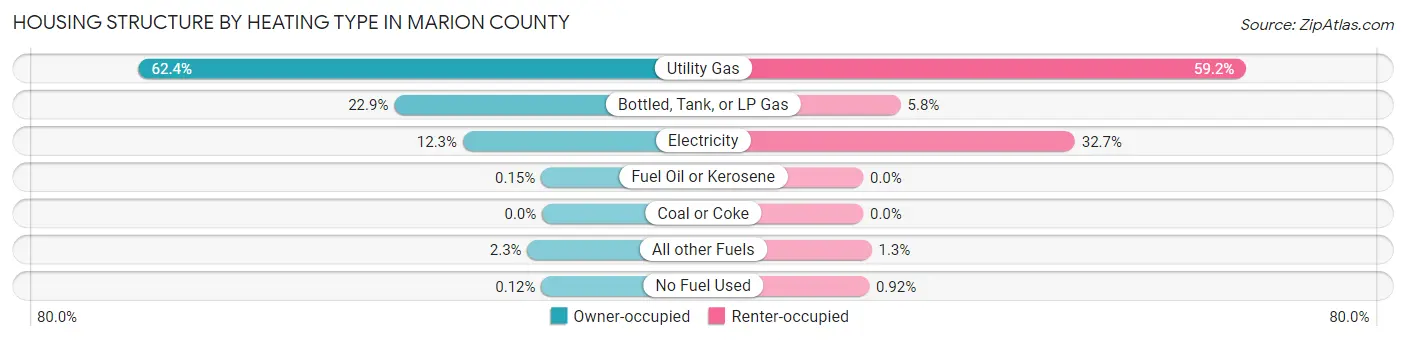
| Heating Type | Owner-occupied | Renter-occupied |
| Utility Gas | 6,399 (62.4%) | 1,805 (59.2%) |
| Bottled, Tank, or LP Gas | 2,346 (22.9%) | 177 (5.8%) |
| Electricity | 1,257 (12.2%) | 998 (32.7%) |
| Fuel Oil or Kerosene | 15 (0.2%) | 0 (0.0%) |
| Coal or Coke | 0 (0.0%) | 0 (0.0%) |
| All other Fuels | 233 (2.3%) | 40 (1.3%) |
| No Fuel Used | 12 (0.1%) | 28 (0.9%) |
| Total | 10,262 (100.0%) | 3,048 (100.0%) |
Household Vehicle Usage in Marion County
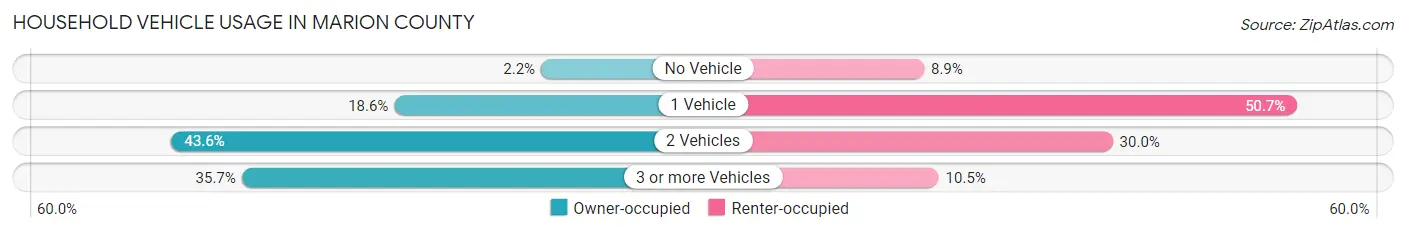
| Vehicles per Household | Owner-occupied | Renter-occupied |
| No Vehicle | 222 (2.2%) | 270 (8.9%) |
| 1 Vehicle | 1,909 (18.6%) | 1,544 (50.7%) |
| 2 Vehicles | 4,469 (43.5%) | 914 (30.0%) |
| 3 or more Vehicles | 3,662 (35.7%) | 320 (10.5%) |
| Total | 10,262 (100.0%) | 3,048 (100.0%) |
Real Estate & Mortgages in Marion County
Real Estate and Mortgage Overview in Marion County
| Characteristic | Without Mortgage | With Mortgage |
| Housing Units | 4,219 | 6,043 |
| Median Property Value | $177,700 | $200,900 |
| Median Household Income | $60,669 | $1,540 |
| Monthly Housing Costs | $569 | $203 |
| Real Estate Taxes | $2,703 | $259 |
Property Value by Mortgage Status in Marion County
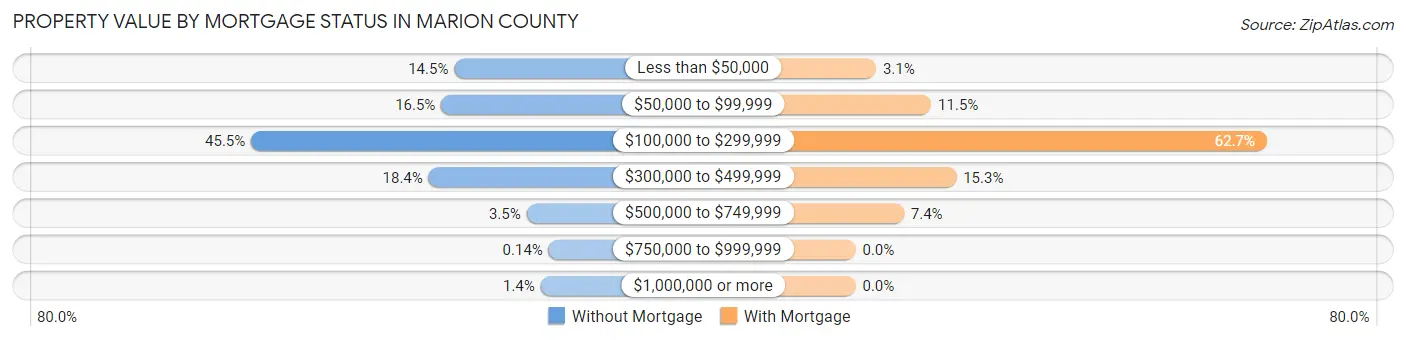
| Property Value | Without Mortgage | With Mortgage |
| Less than $50,000 | 613 (14.5%) | 188 (3.1%) |
| $50,000 to $99,999 | 697 (16.5%) | 696 (11.5%) |
| $100,000 to $299,999 | 1,919 (45.5%) | 3,787 (62.7%) |
| $300,000 to $499,999 | 778 (18.4%) | 927 (15.3%) |
| $500,000 to $749,999 | 148 (3.5%) | 445 (7.4%) |
| $750,000 to $999,999 | 6 (0.1%) | 0 (0.0%) |
| $1,000,000 or more | 58 (1.4%) | 0 (0.0%) |
| Total | 4,219 (100.0%) | 6,043 (100.0%) |
Household Income by Mortgage Status in Marion County
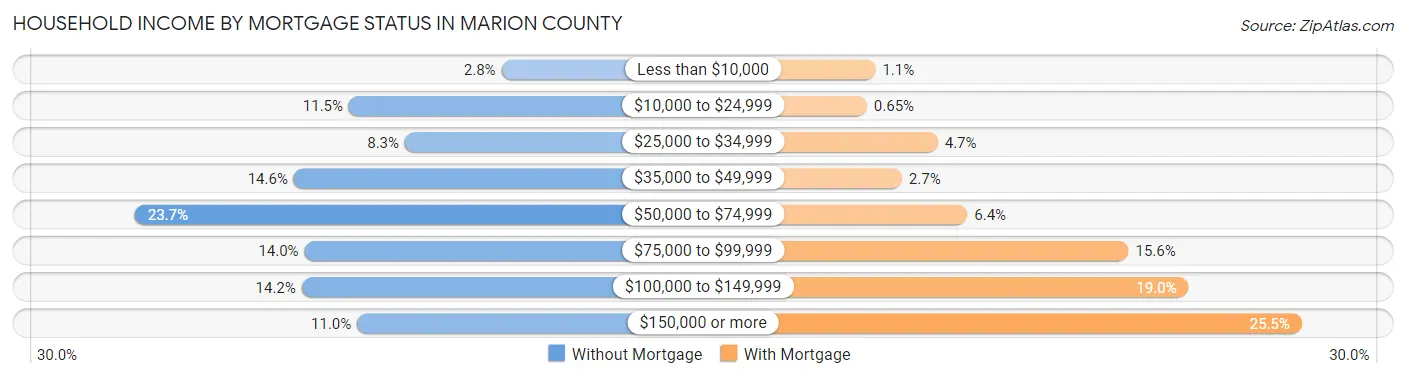
| Household Income | Without Mortgage | With Mortgage |
| Less than $10,000 | 116 (2.8%) | 69 (1.1%) |
| $10,000 to $24,999 | 484 (11.5%) | 39 (0.6%) |
| $25,000 to $34,999 | 349 (8.3%) | 284 (4.7%) |
| $35,000 to $49,999 | 617 (14.6%) | 160 (2.6%) |
| $50,000 to $74,999 | 1,000 (23.7%) | 386 (6.4%) |
| $75,000 to $99,999 | 591 (14.0%) | 943 (15.6%) |
| $100,000 to $149,999 | 598 (14.2%) | 1,150 (19.0%) |
| $150,000 or more | 464 (11.0%) | 1,541 (25.5%) |
| Total | 4,219 (100.0%) | 6,043 (100.0%) |
Property Value to Household Income Ratio in Marion County
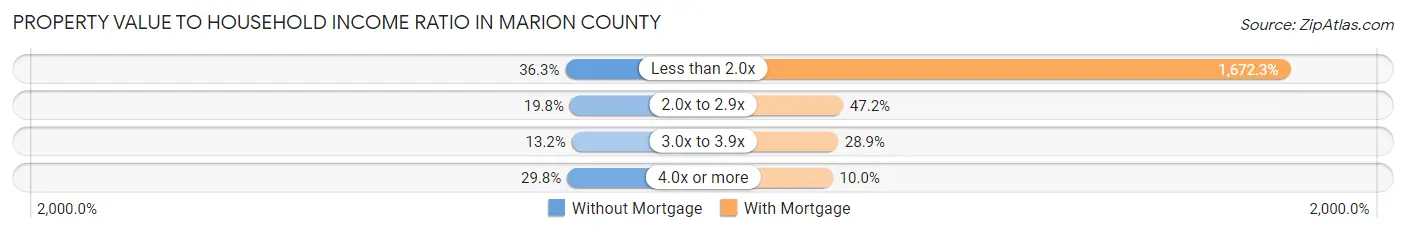
| Value-to-Income Ratio | Without Mortgage | With Mortgage |
| Less than 2.0x | 1,533 (36.3%) | 101,055 (1,672.3%) |
| 2.0x to 2.9x | 835 (19.8%) | 2,850 (47.2%) |
| 3.0x to 3.9x | 556 (13.2%) | 1,748 (28.9%) |
| 4.0x or more | 1,258 (29.8%) | 604 (10.0%) |
| Total | 4,219 (100.0%) | 6,043 (100.0%) |
Real Estate Taxes by Mortgage Status in Marion County
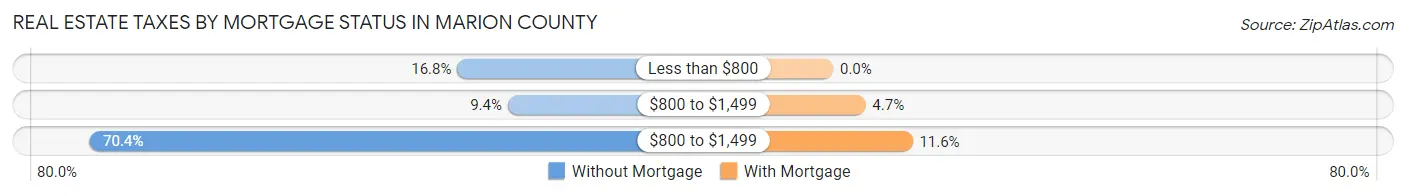
| Property Taxes | Without Mortgage | With Mortgage |
| Less than $800 | 708 (16.8%) | 0 (0.0%) |
| $800 to $1,499 | 396 (9.4%) | 286 (4.7%) |
| $800 to $1,499 | 2,971 (70.4%) | 701 (11.6%) |
| Total | 4,219 (100.0%) | 6,043 (100.0%) |
Health & Disability in Marion County
Health Insurance Coverage by Age in Marion County
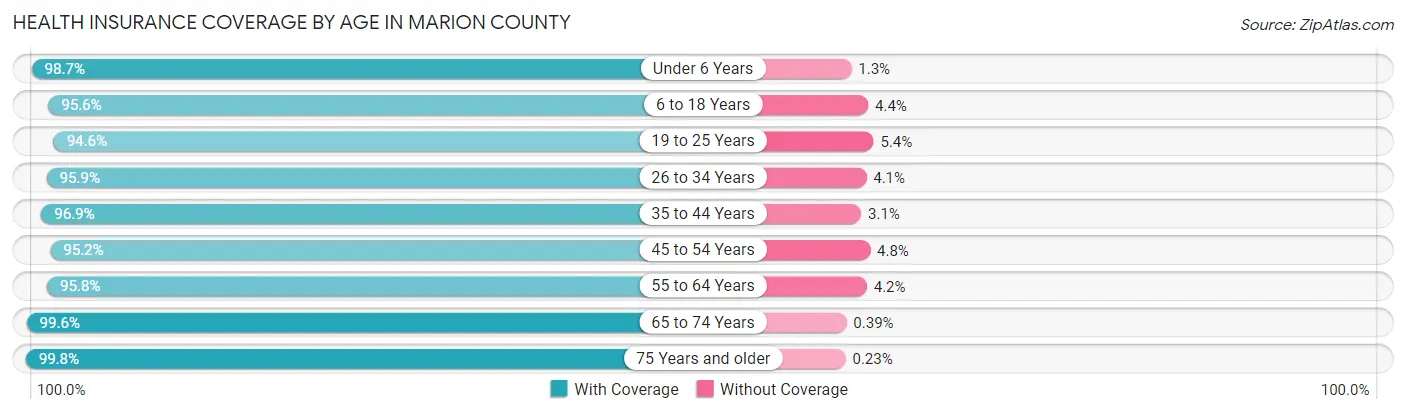
| Age Bracket | With Coverage | Without Coverage |
| Under 6 Years | 2,186 (98.7%) | 29 (1.3%) |
| 6 to 18 Years | 5,900 (95.6%) | 274 (4.4%) |
| 19 to 25 Years | 2,940 (94.6%) | 169 (5.4%) |
| 26 to 34 Years | 3,113 (95.9%) | 133 (4.1%) |
| 35 to 44 Years | 3,872 (96.9%) | 125 (3.1%) |
| 45 to 54 Years | 3,759 (95.2%) | 190 (4.8%) |
| 55 to 64 Years | 4,273 (95.8%) | 187 (4.2%) |
| 65 to 74 Years | 3,363 (99.6%) | 13 (0.4%) |
| 75 Years and older | 2,637 (99.8%) | 6 (0.2%) |
| Total | 32,043 (96.6%) | 1,126 (3.4%) |
Health Insurance Coverage by Citizenship Status in Marion County
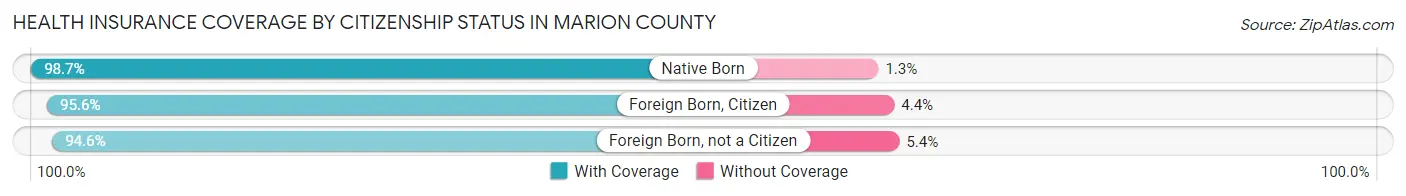
| Citizenship Status | With Coverage | Without Coverage |
| Native Born | 2,186 (98.7%) | 29 (1.3%) |
| Foreign Born, Citizen | 5,900 (95.6%) | 274 (4.4%) |
| Foreign Born, not a Citizen | 2,940 (94.6%) | 169 (5.4%) |
Health Insurance Coverage by Household Income in Marion County
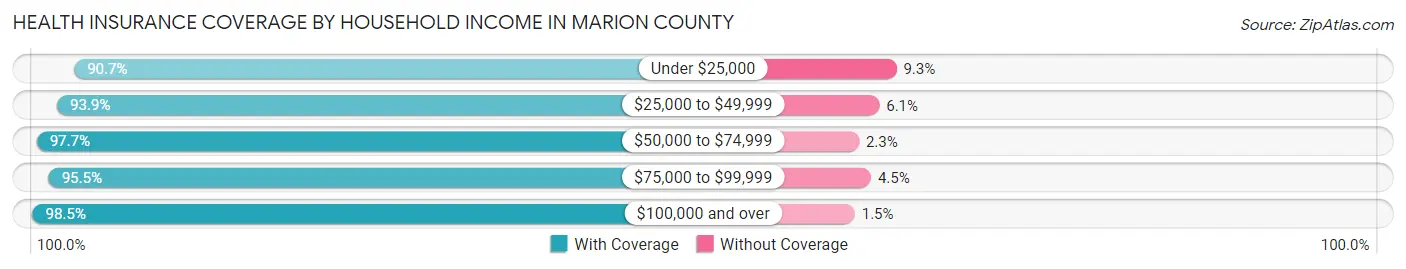
| Household Income | With Coverage | Without Coverage |
| Under $25,000 | 2,420 (90.7%) | 248 (9.3%) |
| $25,000 to $49,999 | 3,673 (93.9%) | 238 (6.1%) |
| $50,000 to $74,999 | 5,795 (97.7%) | 135 (2.3%) |
| $75,000 to $99,999 | 5,684 (95.5%) | 270 (4.5%) |
| $100,000 and over | 13,098 (98.5%) | 199 (1.5%) |
Public vs Private Health Insurance Coverage by Age in Marion County
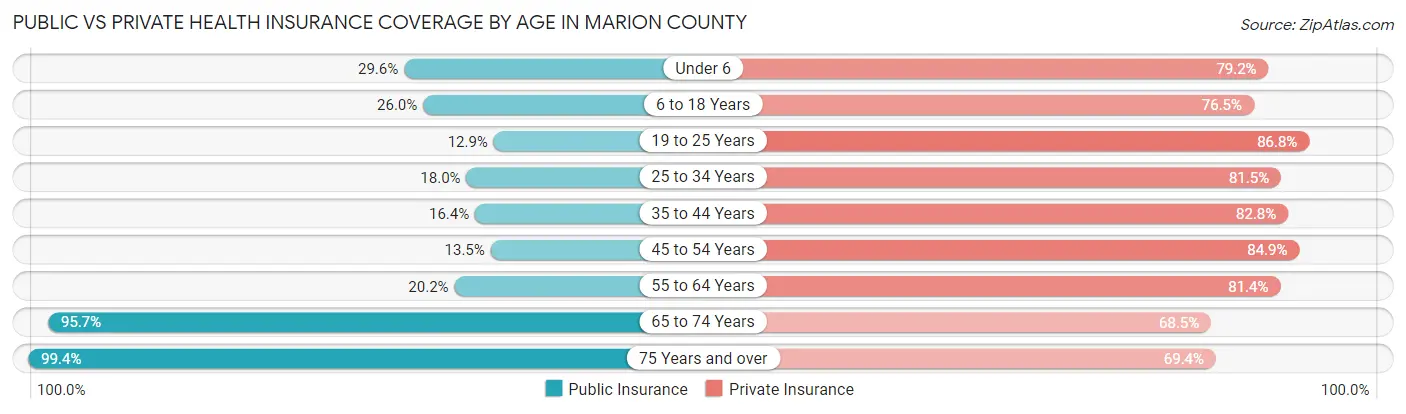
| Age Bracket | Public Insurance | Private Insurance |
| Under 6 | 655 (29.6%) | 1,754 (79.2%) |
| 6 to 18 Years | 1,607 (26.0%) | 4,722 (76.5%) |
| 19 to 25 Years | 402 (12.9%) | 2,697 (86.8%) |
| 25 to 34 Years | 584 (18.0%) | 2,646 (81.5%) |
| 35 to 44 Years | 655 (16.4%) | 3,311 (82.8%) |
| 45 to 54 Years | 533 (13.5%) | 3,353 (84.9%) |
| 55 to 64 Years | 902 (20.2%) | 3,630 (81.4%) |
| 65 to 74 Years | 3,230 (95.7%) | 2,314 (68.5%) |
| 75 Years and over | 2,626 (99.4%) | 1,835 (69.4%) |
| Total | 11,194 (33.8%) | 26,262 (79.2%) |
Disability Status by Sex by Age in Marion County
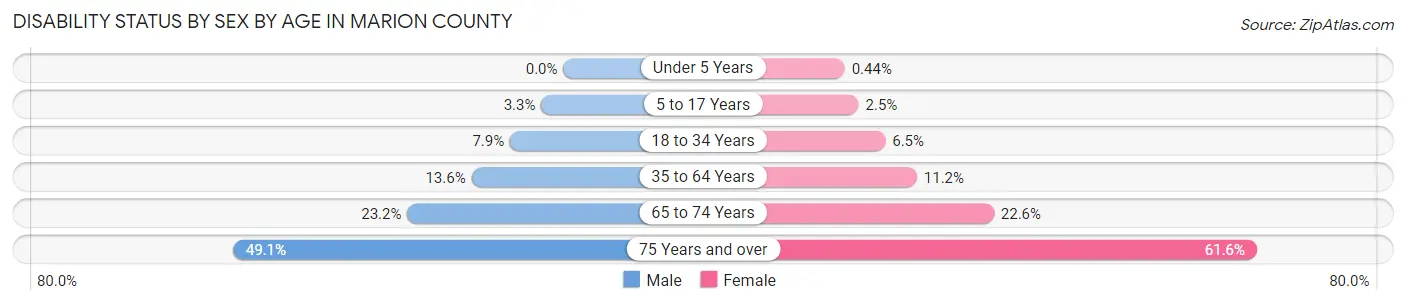
| Age Bracket | Male | Female |
| Under 5 Years | 0 (0.0%) | 4 (0.4%) |
| 5 to 17 Years | 98 (3.3%) | 74 (2.5%) |
| 18 to 34 Years | 289 (7.9%) | 213 (6.5%) |
| 35 to 64 Years | 869 (13.6%) | 673 (11.2%) |
| 65 to 74 Years | 382 (23.2%) | 390 (22.6%) |
| 75 Years and over | 531 (49.1%) | 962 (61.6%) |
Disability Class by Sex by Age in Marion County
Disability Class: Hearing Difficulty
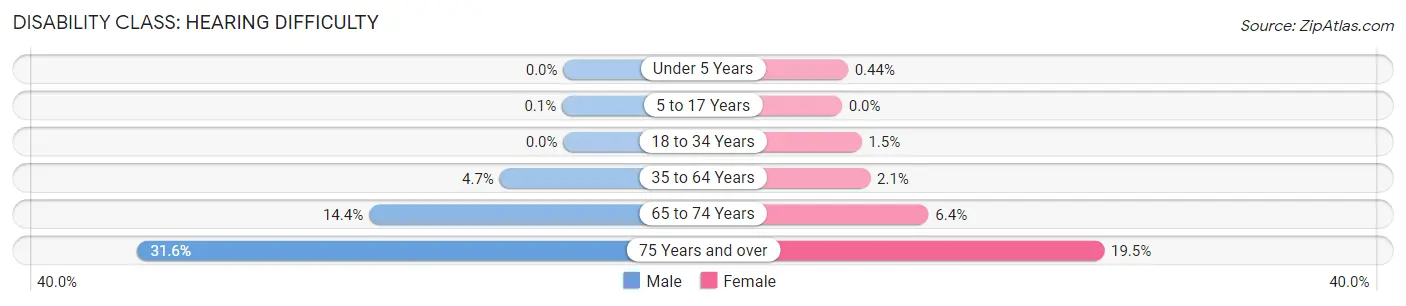
| Age Bracket | Male | Female |
| Under 5 Years | 0 (0.0%) | 4 (0.4%) |
| 5 to 17 Years | 3 (0.1%) | 0 (0.0%) |
| 18 to 34 Years | 0 (0.0%) | 48 (1.5%) |
| 35 to 64 Years | 301 (4.7%) | 127 (2.1%) |
| 65 to 74 Years | 238 (14.4%) | 111 (6.4%) |
| 75 Years and over | 342 (31.6%) | 304 (19.5%) |
Disability Class: Vision Difficulty
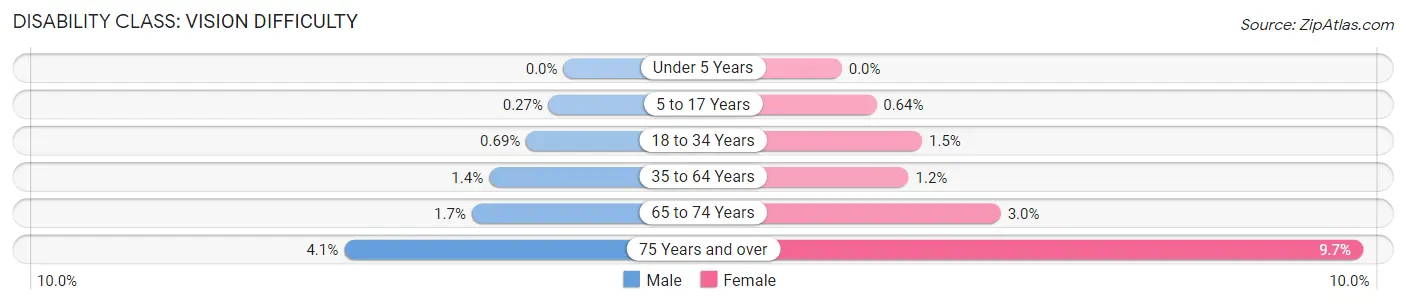
| Age Bracket | Male | Female |
| Under 5 Years | 0 (0.0%) | 0 (0.0%) |
| 5 to 17 Years | 8 (0.3%) | 19 (0.6%) |
| 18 to 34 Years | 25 (0.7%) | 49 (1.5%) |
| 35 to 64 Years | 88 (1.4%) | 75 (1.2%) |
| 65 to 74 Years | 28 (1.7%) | 51 (2.9%) |
| 75 Years and over | 44 (4.1%) | 151 (9.7%) |
Disability Class: Cognitive Difficulty
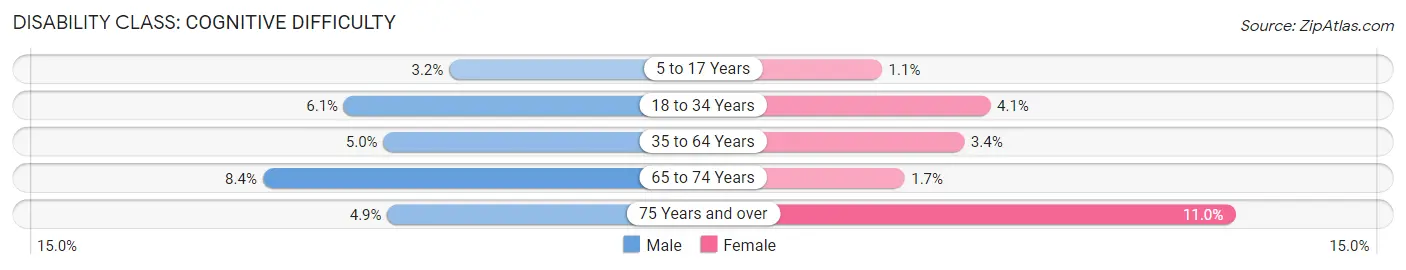
| Age Bracket | Male | Female |
| 5 to 17 Years | 95 (3.2%) | 33 (1.1%) |
| 18 to 34 Years | 223 (6.1%) | 136 (4.1%) |
| 35 to 64 Years | 319 (5.0%) | 205 (3.4%) |
| 65 to 74 Years | 138 (8.4%) | 30 (1.7%) |
| 75 Years and over | 53 (4.9%) | 171 (11.0%) |
Disability Class: Ambulatory Difficulty
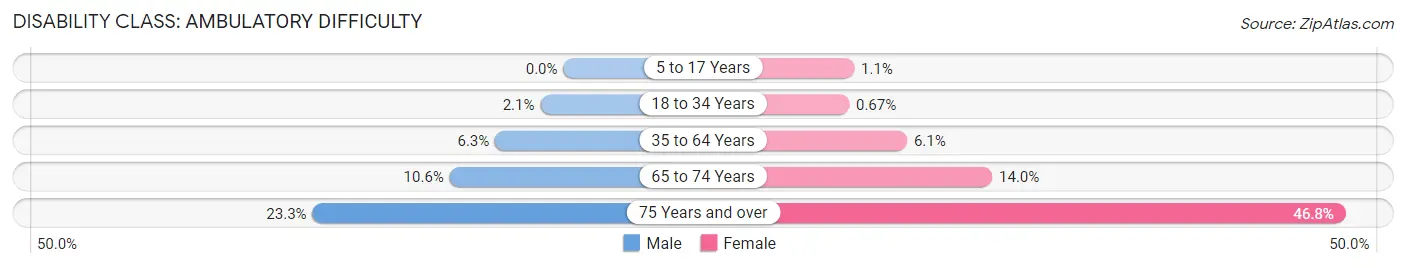
| Age Bracket | Male | Female |
| 5 to 17 Years | 0 (0.0%) | 34 (1.1%) |
| 18 to 34 Years | 78 (2.1%) | 22 (0.7%) |
| 35 to 64 Years | 403 (6.3%) | 365 (6.0%) |
| 65 to 74 Years | 174 (10.5%) | 241 (14.0%) |
| 75 Years and over | 252 (23.3%) | 730 (46.8%) |
Disability Class: Self-Care Difficulty
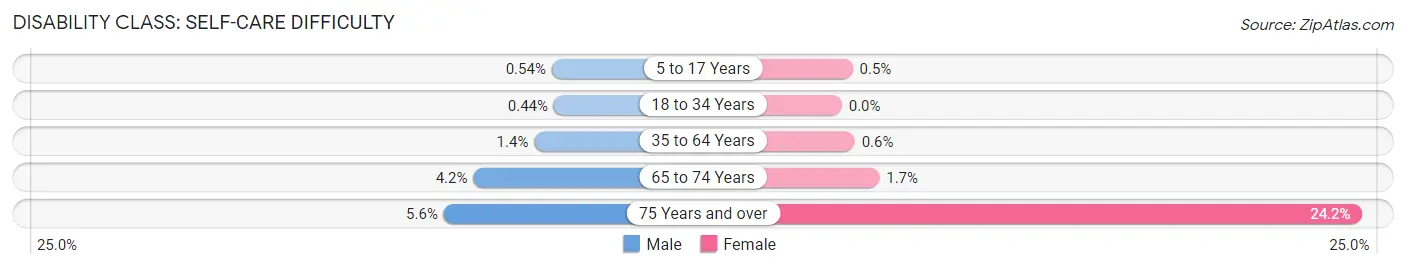
| Age Bracket | Male | Female |
| 5 to 17 Years | 16 (0.5%) | 15 (0.5%) |
| 18 to 34 Years | 16 (0.4%) | 0 (0.0%) |
| 35 to 64 Years | 86 (1.3%) | 36 (0.6%) |
| 65 to 74 Years | 69 (4.2%) | 30 (1.7%) |
| 75 Years and over | 60 (5.6%) | 377 (24.1%) |
Technology Access in Marion County
Computing Device Access in Marion County
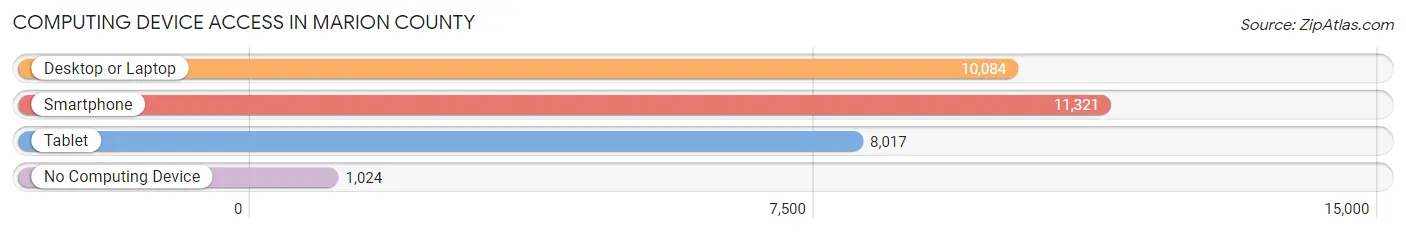
| Device Type | # Households | % Households |
| Desktop or Laptop | 10,084 | 75.8% |
| Smartphone | 11,321 | 85.1% |
| Tablet | 8,017 | 60.2% |
| No Computing Device | 1,024 | 7.7% |
| Total | 13,310 | 100.0% |
Internet Access in Marion County
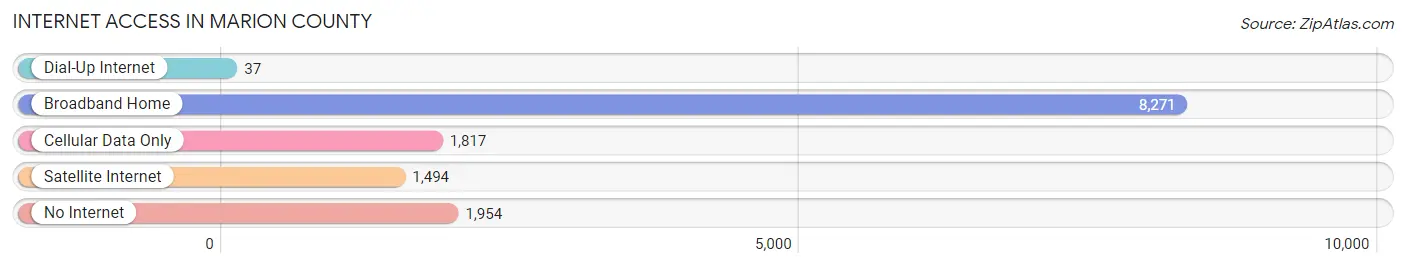
| Internet Type | # Households | % Households |
| Dial-Up Internet | 37 | 0.3% |
| Broadband Home | 8,271 | 62.1% |
| Cellular Data Only | 1,817 | 13.7% |
| Satellite Internet | 1,494 | 11.2% |
| No Internet | 1,954 | 14.7% |
| Total | 13,310 | 100.0% |
Marion County Summary
Marion County, Iowa is located in the south-central part of the state and is part of the Des Moines–West Des Moines Metropolitan Statistical Area. The county was established in 1845 and named after General Francis Marion, a Revolutionary War hero. As of the 2010 census, the population was 33,309, making it the sixth-most populous county in Iowa.
Geography
Marion County is located in the south-central part of Iowa and is bordered by Mahaska County to the north, Lucas County to the east, Monroe County to the south, and Warren County to the west. The county covers an area of 576 square miles and is mostly flat, with some rolling hills in the northern part of the county. The Des Moines River flows through the county, and there are several small lakes and ponds scattered throughout the area.
The county is divided into twelve townships: Cedar, Clay, Franklin, Grant, Harrison, Liberty, Lincoln, Monroe, Pleasant, Polk, Taylor, and Washington. The county seat is Knoxville, which is also the largest city in the county. Other cities in the county include Pella, Bussey, Harvey, and Melcher-Dallas.
Economy
Agriculture is the main economic driver in Marion County, with corn, soybeans, and hogs being the main crops. Other industries in the county include manufacturing, retail, and tourism. The county is home to several large employers, including Vermeer Manufacturing, Pella Corporation, and Pella Regional Health Center.
Demographics
As of the 2010 census, there were 33,309 people, 12,845 households, and 8,945 families living in Marion County. The population density was 58 people per square mile. The racial makeup of the county was 94.3% White, 1.3% African American, 0.3% Native American, 0.7% Asian, 0.1% Pacific Islander, 1.7% from other races, and 1.6% from two or more races. Hispanic or Latino of any race were 3.7% of the population.
The median income for a household in the county was $50,945 and the median income for a family was $60,945. The per capita income for the county was $24,845. About 5.3% of families and 7.2% of the population were below the poverty line, including 9.2% of those under age 18 and 6.2% of those age 65 or over.
Conclusion
Marion County, Iowa is a rural county located in the south-central part of the state. It is home to 33,309 people and is largely agricultural, with corn, soybeans, and hogs being the main crops. The county is also home to several large employers, including Vermeer Manufacturing, Pella Corporation, and Pella Regional Health Center. The population is mostly white, with a small percentage of African Americans, Native Americans, Asians, and Pacific Islanders. The median income for a household in the county is $50,945 and the per capita income is $24,845.
Common Questions
What is Per Capita Income in Marion County?
Per Capita income in Marion County is $38,168.
What is the Median Family Income in Marion County?
Median Family Income in Marion County is $90,188.
What is the Median Household income in Marion County?
Median Household Income in Marion County is $74,193.
What is Income or Wage Gap in Marion County?
Income or Wage Gap in Marion County is 38.0%.
Women in Marion County earn 62.0 cents for every dollar earned by a man.
What is Family Income Deficit in Marion County?
Family Income Deficit in Marion County is $11,444.
Families that are below poverty line in Marion County earn $11,444 less on average than the poverty threshold level.
What is Inequality or Gini Index in Marion County?
Inequality or Gini Index in Marion County is 0.43.
What is the Total Population of Marion County?
Total Population of Marion County is 33,487.
What is the Total Male Population of Marion County?
Total Male Population of Marion County is 16,755.
What is the Total Female Population of Marion County?
Total Female Population of Marion County is 16,732.
What is the Ratio of Males per 100 Females in Marion County?
There are 100.14 Males per 100 Females in Marion County.
What is the Ratio of Females per 100 Males in Marion County?
There are 99.86 Females per 100 Males in Marion County.
What is the Median Population Age in Marion County?
Median Population Age in Marion County is 39.8 Years.
What is the Average Family Size in Marion County
Average Family Size in Marion County is 2.8 People.
What is the Average Household Size in Marion County
Average Household Size in Marion County is 2.4 People.
How Large is the Labor Force in Marion County?
There are 17,210 People in the Labor Forcein in Marion County.
What is the Percentage of People in the Labor Force in Marion County?
64.9% of People are in the Labor Force in Marion County.
What is the Unemployment Rate in Marion County?
Unemployment Rate in Marion County is 2.3%.