Wapello County, IA Map & Demographics
Wapello County Map
Wapello County Overview
$30,025
PER CAPITA INCOME
$67,016
AVG FAMILY INCOME
$56,209
AVG HOUSEHOLD INCOME
22.2%
WAGE / INCOME GAP [ % ]
77.8¢/ $1
WAGE / INCOME GAP [ $ ]
$11,908
FAMILY INCOME DEFICIT
0.43
INEQUALITY / GINI INDEX
35,292
TOTAL POPULATION
17,753
MALE POPULATION
17,539
FEMALE POPULATION
101.22
MALES / 100 FEMALES
98.79
FEMALES / 100 MALES
39.4
MEDIAN AGE
3.0
AVG FAMILY SIZE
2.4
AVG HOUSEHOLD SIZE
17,243
LABOR FORCE [ PEOPLE ]
61.6%
PERCENT IN LABOR FORCE
4.4%
UNEMPLOYMENT RATE
Wapello County Area Codes
Income in Wapello County
Income Overview in Wapello County
Per Capita Income in Wapello County is $30,025, while median incomes of families and households are $67,016 and $56,209 respectively.
| Characteristic | Number | Measure |
| Per Capita Income | 35,292 | $30,025 |
| Median Family Income | 9,261 | $67,016 |
| Mean Family Income | 9,261 | $81,312 |
| Median Household Income | 14,193 | $56,209 |
| Mean Household Income | 14,193 | $72,293 |
| Income Deficit | 9,261 | $11,908 |
| Wage / Income Gap (%) | 35,292 | 22.16% |
| Wage / Income Gap ($) | 35,292 | 77.84¢ per $1 |
| Gini / Inequality Index | 35,292 | 0.43 |
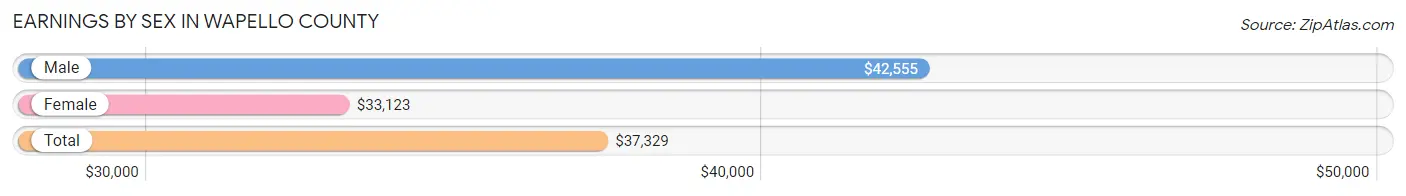
Earnings by Sex in Wapello County
Average Earnings in Wapello County are $37,329, $42,555 for men and $33,123 for women, a difference of 22.2%.
| Sex | Number | Average Earnings |
| Male | 9,862 (54.2%) | $42,555 |
| Female | 8,345 (45.8%) | $33,123 |
| Total | 18,207 (100.0%) | $37,329 |
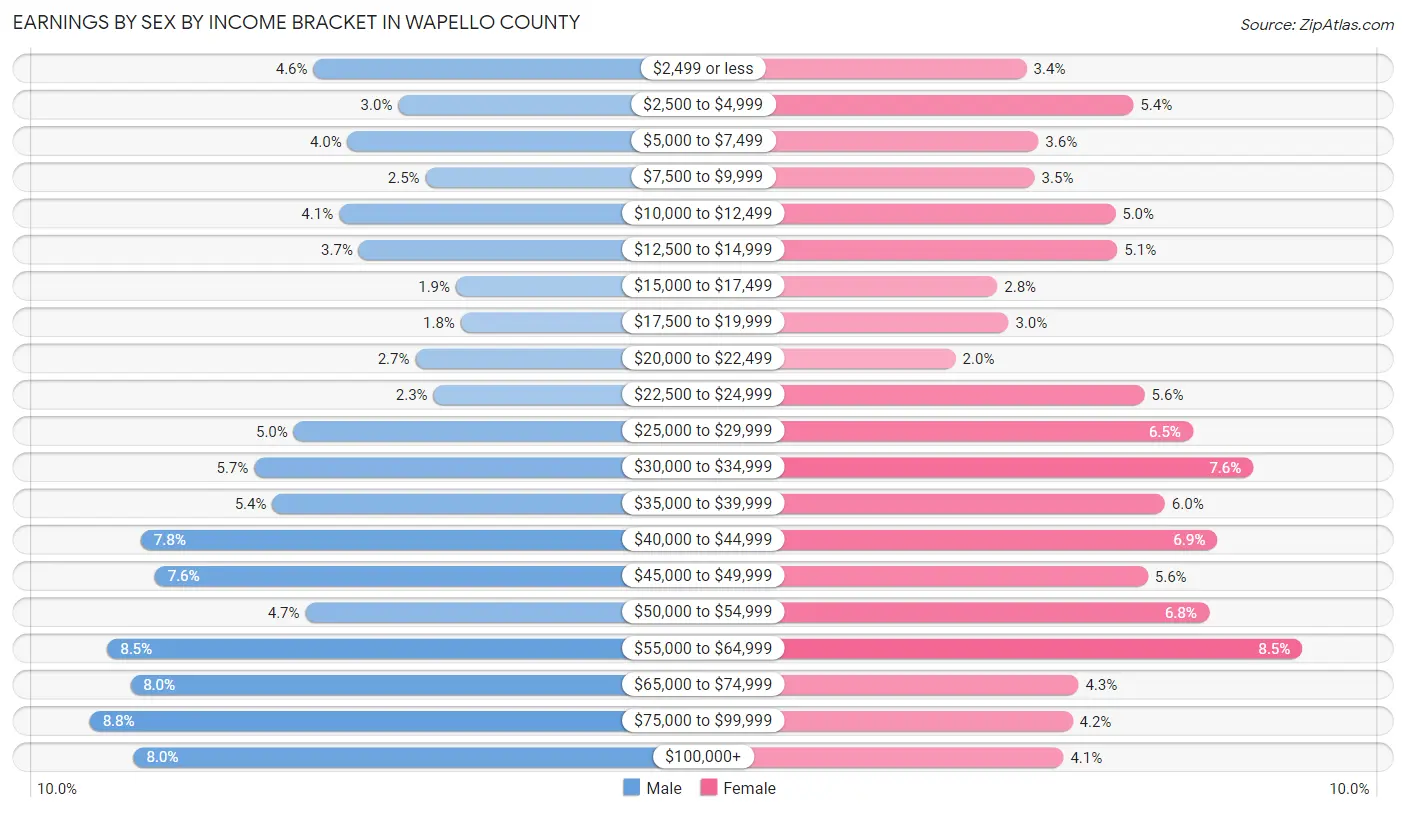
Earnings by Sex by Income Bracket in Wapello County
The most common earnings brackets in Wapello County are $75,000 to $99,999 for men (866 | 8.8%) and $55,000 to $64,999 for women (712 | 8.5%).
| Income | Male | Female |
| $2,499 or less | 453 (4.6%) | 281 (3.4%) |
| $2,500 to $4,999 | 296 (3.0%) | 448 (5.4%) |
| $5,000 to $7,499 | 390 (4.0%) | 300 (3.6%) |
| $7,500 to $9,999 | 246 (2.5%) | 294 (3.5%) |
| $10,000 to $12,499 | 405 (4.1%) | 420 (5.0%) |
| $12,500 to $14,999 | 369 (3.7%) | 423 (5.1%) |
| $15,000 to $17,499 | 189 (1.9%) | 235 (2.8%) |
| $17,500 to $19,999 | 180 (1.8%) | 253 (3.0%) |
| $20,000 to $22,499 | 264 (2.7%) | 170 (2.0%) |
| $22,500 to $24,999 | 231 (2.3%) | 466 (5.6%) |
| $25,000 to $29,999 | 489 (5.0%) | 541 (6.5%) |
| $30,000 to $34,999 | 562 (5.7%) | 635 (7.6%) |
| $35,000 to $39,999 | 529 (5.4%) | 497 (6.0%) |
| $40,000 to $44,999 | 771 (7.8%) | 579 (6.9%) |
| $45,000 to $49,999 | 746 (7.6%) | 471 (5.6%) |
| $50,000 to $54,999 | 467 (4.7%) | 566 (6.8%) |
| $55,000 to $64,999 | 833 (8.5%) | 712 (8.5%) |
| $65,000 to $74,999 | 791 (8.0%) | 362 (4.3%) |
| $75,000 to $99,999 | 866 (8.8%) | 353 (4.2%) |
| $100,000+ | 785 (8.0%) | 339 (4.1%) |
| Total | 9,862 (100.0%) | 8,345 (100.0%) |
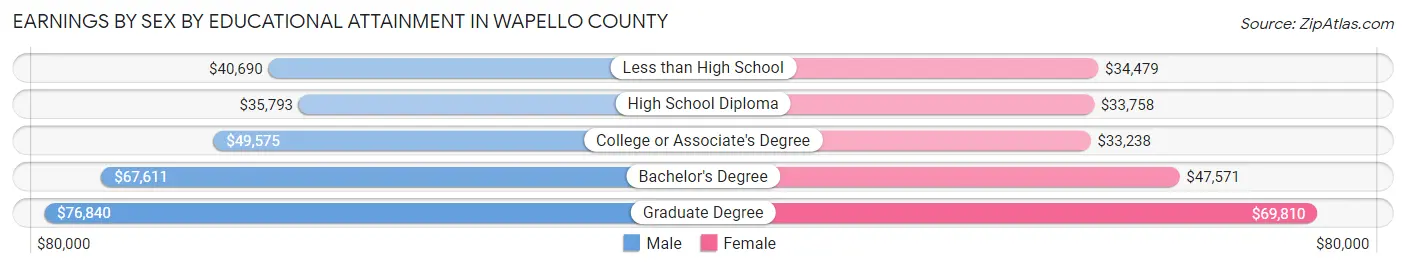
Earnings by Sex by Educational Attainment in Wapello County
Average earnings in Wapello County are $45,421 for men and $37,119 for women, a difference of 18.3%. Men with an educational attainment of graduate degree enjoy the highest average annual earnings of $76,840, while those with high school diploma education earn the least with $35,793. Women with an educational attainment of graduate degree earn the most with the average annual earnings of $69,810, while those with college or associate's degree education have the smallest earnings of $33,238.
| Educational Attainment | Male Income | Female Income |
| Less than High School | $40,690 | $34,479 |
| High School Diploma | $35,793 | $33,758 |
| College or Associate's Degree | $49,575 | $33,238 |
| Bachelor's Degree | $67,611 | $47,571 |
| Graduate Degree | $76,840 | $69,810 |
| Total | $45,421 | $37,119 |
Family Income in Wapello County
Family Income Brackets in Wapello County
According to the Wapello County family income data, there are 1,880 families falling into the $50,000 to $74,999 income range, which is the most common income bracket and makes up 20.3% of all families. Conversely, the $200,000+ income bracket is the least frequent group with only 250 families (2.7%) belonging to this category.
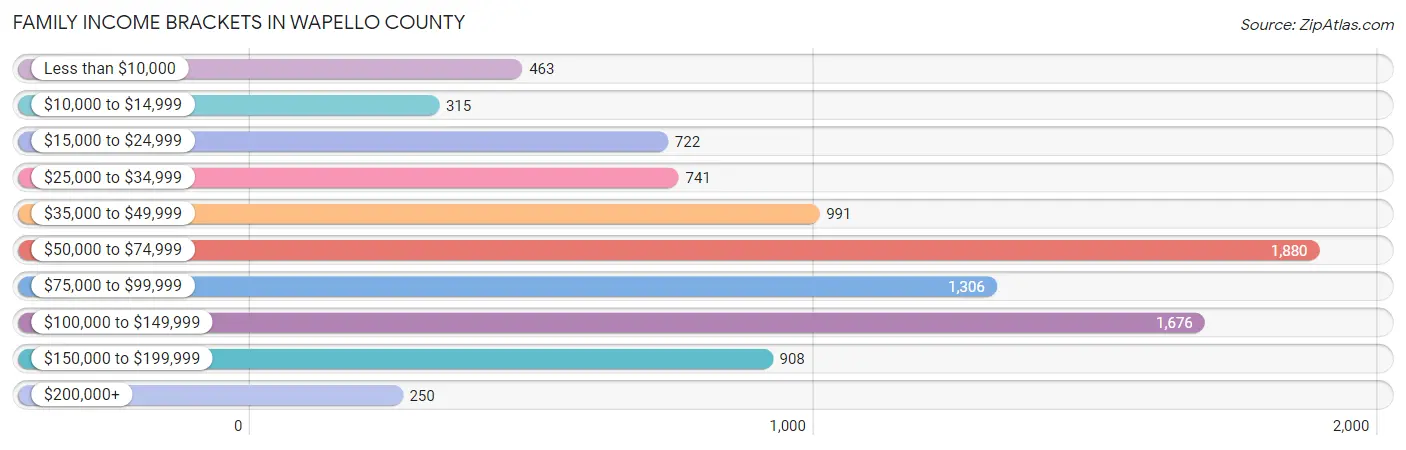
| Income Bracket | # Families | % Families |
| Less than $10,000 | 463 | 5.0% |
| $10,000 to $14,999 | 315 | 3.4% |
| $15,000 to $24,999 | 722 | 7.8% |
| $25,000 to $34,999 | 741 | 8.0% |
| $35,000 to $49,999 | 991 | 10.7% |
| $50,000 to $74,999 | 1,880 | 20.3% |
| $75,000 to $99,999 | 1,306 | 14.1% |
| $100,000 to $149,999 | 1,676 | 18.1% |
| $150,000 to $199,999 | 908 | 9.8% |
| $200,000+ | 250 | 2.7% |
Family Income by Famaliy Size in Wapello County
5-person families (633 | 6.8%) account for the highest median family income in Wapello County with $97,663 per family, while 2-person families (4,700 | 50.7%) have the highest median income of $30,427 per family member.
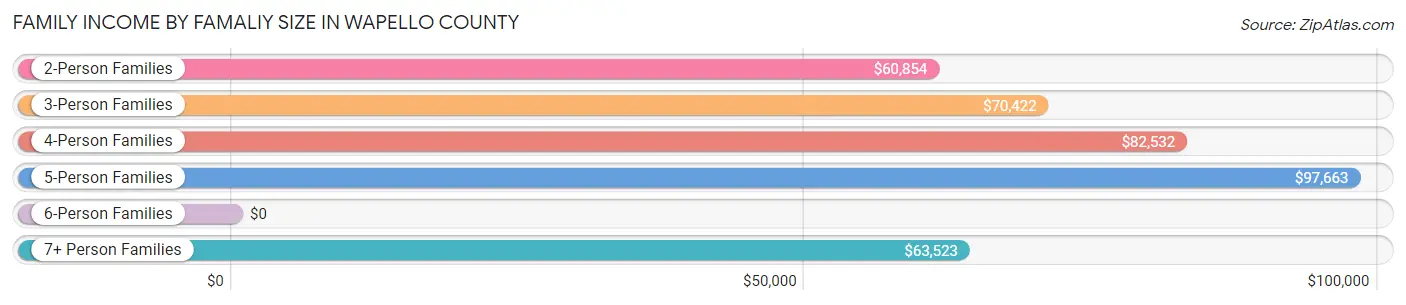
| Income Bracket | # Families | Median Income |
| 2-Person Families | 4,700 (50.7%) | $60,854 |
| 3-Person Families | 1,886 (20.4%) | $70,422 |
| 4-Person Families | 1,639 (17.7%) | $82,532 |
| 5-Person Families | 633 (6.8%) | $97,663 |
| 6-Person Families | 194 (2.1%) | $0 |
| 7+ Person Families | 209 (2.3%) | $63,523 |
| Total | 9,261 (100.0%) | $67,016 |
Family Income by Number of Earners in Wapello County
The median family income in Wapello County is $67,016, with families comprising 3+ earners (803) having the highest median family income of $118,750, while families with no earners (1,794) have the lowest median family income of $43,352, accounting for 8.7% and 19.4% of families, respectively.
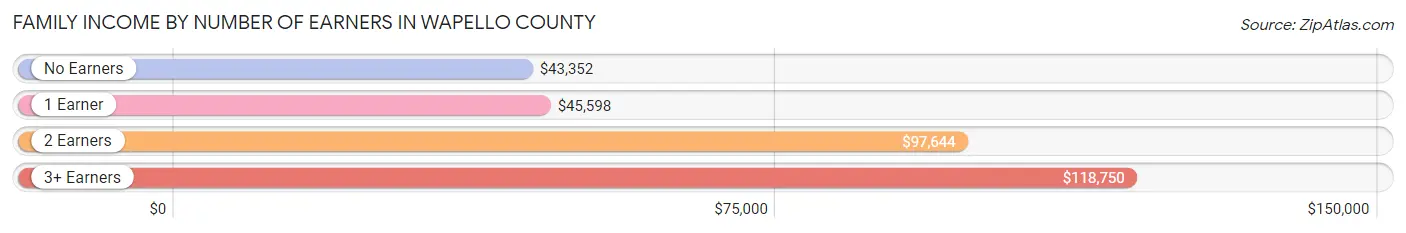
| Number of Earners | # Families | Median Income |
| No Earners | 1,794 (19.4%) | $43,352 |
| 1 Earner | 2,922 (31.6%) | $45,598 |
| 2 Earners | 3,742 (40.4%) | $97,644 |
| 3+ Earners | 803 (8.7%) | $118,750 |
| Total | 9,261 (100.0%) | $67,016 |
Household Income in Wapello County
Household Income Brackets in Wapello County
With 2,782 households falling in the category, the $50,000 to $74,999 income range is the most frequent in Wapello County, accounting for 19.6% of all households. In contrast, only 355 households (2.5%) fall into the $200,000+ income bracket, making it the least populous group.
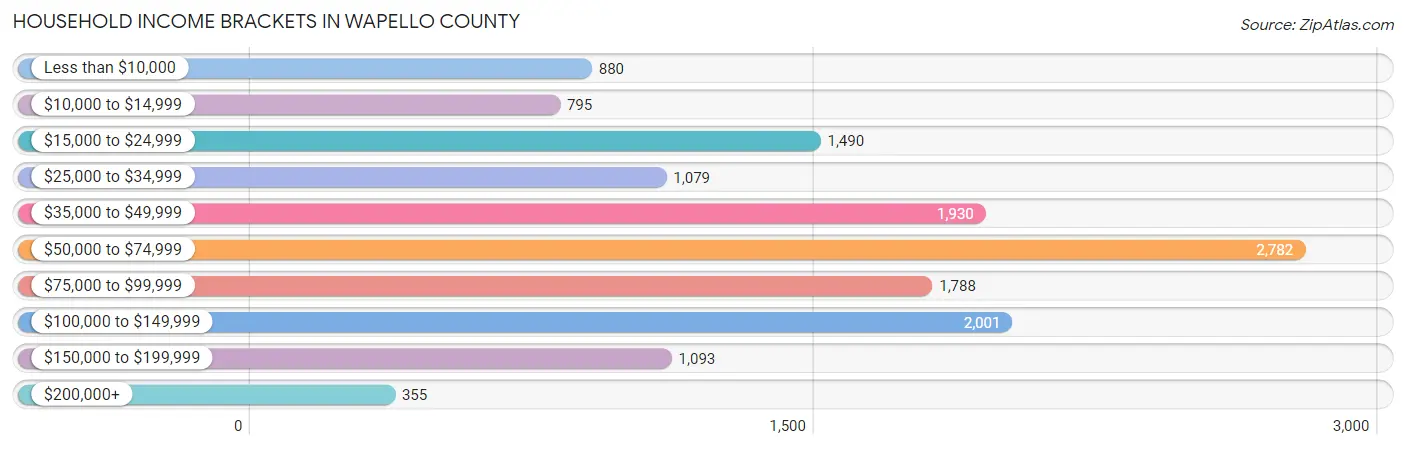
| Income Bracket | # Households | % Households |
| Less than $10,000 | 880 | 6.2% |
| $10,000 to $14,999 | 795 | 5.6% |
| $15,000 to $24,999 | 1,490 | 10.5% |
| $25,000 to $34,999 | 1,079 | 7.6% |
| $35,000 to $49,999 | 1,930 | 13.6% |
| $50,000 to $74,999 | 2,782 | 19.6% |
| $75,000 to $99,999 | 1,788 | 12.6% |
| $100,000 to $149,999 | 2,001 | 14.1% |
| $150,000 to $199,999 | 1,093 | 7.7% |
| $200,000+ | 355 | 2.5% |
Household Income by Householder Age in Wapello County
The median household income in Wapello County is $56,209, with the highest median household income of $66,258 found in the 45 to 64 years age bracket for the primary householder. A total of 5,292 households (37.3%) fall into this category. Meanwhile, the 15 to 24 years age bracket for the primary householder has the lowest median household income of $42,500, with 638 households (4.5%) in this group.
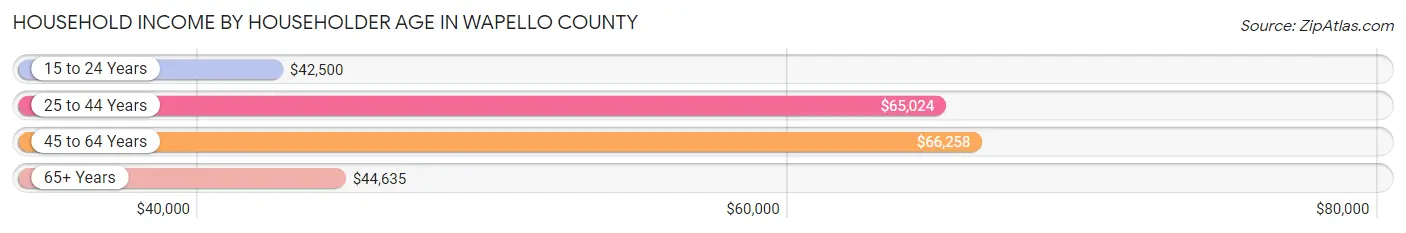
| Income Bracket | # Households | Median Income |
| 15 to 24 Years | 638 (4.5%) | $42,500 |
| 25 to 44 Years | 4,213 (29.7%) | $65,024 |
| 45 to 64 Years | 5,292 (37.3%) | $66,258 |
| 65+ Years | 4,050 (28.5%) | $44,635 |
| Total | 14,193 (100.0%) | $56,209 |
Poverty in Wapello County
Income Below Poverty by Sex and Age in Wapello County
With 17.8% poverty level for males and 17.1% for females among the residents of Wapello County, 6 to 11 year old males and 5 year old females are the most vulnerable to poverty, with 459 males (30.8%) and 73 females (53.3%) in their respective age groups living below the poverty level.
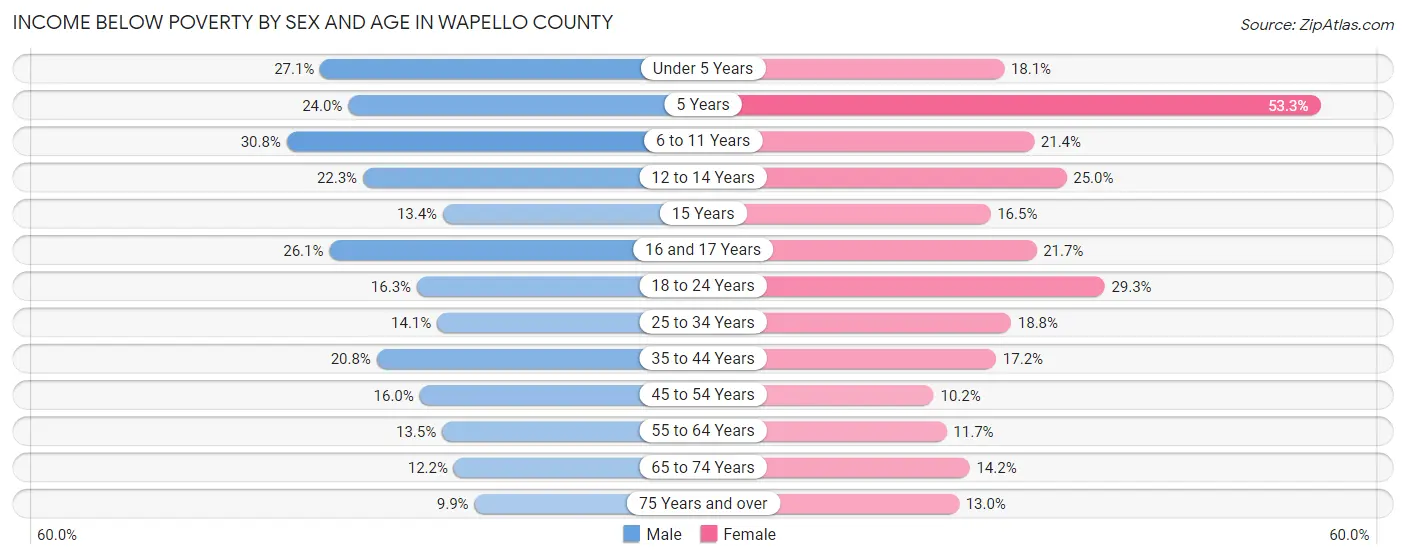
| Age Bracket | Male | Female |
| Under 5 Years | 283 (27.1%) | 196 (18.1%) |
| 5 Years | 86 (24.0%) | 73 (53.3%) |
| 6 to 11 Years | 459 (30.8%) | 258 (21.4%) |
| 12 to 14 Years | 123 (22.3%) | 189 (25.0%) |
| 15 Years | 35 (13.4%) | 41 (16.5%) |
| 16 and 17 Years | 128 (26.1%) | 100 (21.6%) |
| 18 to 24 Years | 208 (16.3%) | 384 (29.2%) |
| 25 to 34 Years | 333 (14.1%) | 400 (18.8%) |
| 35 to 44 Years | 438 (20.8%) | 333 (17.2%) |
| 45 to 54 Years | 344 (16.0%) | 225 (10.2%) |
| 55 to 64 Years | 319 (13.5%) | 276 (11.7%) |
| 65 to 74 Years | 218 (12.2%) | 258 (14.2%) |
| 75 Years and over | 100 (9.9%) | 194 (13.0%) |
| Total | 3,074 (17.8%) | 2,927 (17.1%) |
Income Above Poverty by Sex and Age in Wapello County
According to the poverty statistics in Wapello County, males aged 75 years and over and females aged 45 to 54 years are the age groups that are most secure financially, with 90.1% of males and 89.8% of females in these age groups living above the poverty line.
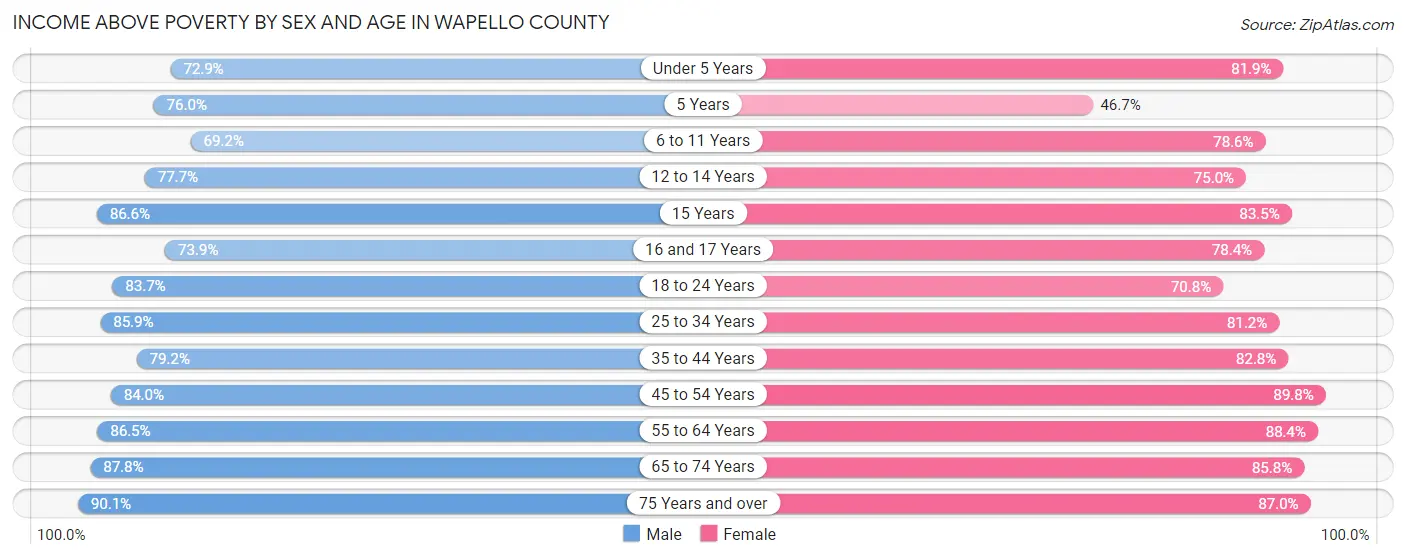
| Age Bracket | Male | Female |
| Under 5 Years | 762 (72.9%) | 889 (81.9%) |
| 5 Years | 273 (76.0%) | 64 (46.7%) |
| 6 to 11 Years | 1,031 (69.2%) | 948 (78.6%) |
| 12 to 14 Years | 428 (77.7%) | 567 (75.0%) |
| 15 Years | 226 (86.6%) | 207 (83.5%) |
| 16 and 17 Years | 363 (73.9%) | 362 (78.3%) |
| 18 to 24 Years | 1,067 (83.7%) | 929 (70.8%) |
| 25 to 34 Years | 2,036 (85.9%) | 1,724 (81.2%) |
| 35 to 44 Years | 1,669 (79.2%) | 1,607 (82.8%) |
| 45 to 54 Years | 1,805 (84.0%) | 1,977 (89.8%) |
| 55 to 64 Years | 2,043 (86.5%) | 2,093 (88.3%) |
| 65 to 74 Years | 1,569 (87.8%) | 1,556 (85.8%) |
| 75 Years and over | 910 (90.1%) | 1,296 (87.0%) |
| Total | 14,182 (82.2%) | 14,219 (82.9%) |
Income Below Poverty Among Married-Couple Families in Wapello County
The poverty statistics for married-couple families in Wapello County show that 5.6% or 369 of the total 6,583 families live below the poverty line. Families with 5 or more children have the highest poverty rate of 21.6%, comprising of 24 families. On the other hand, families with no children have the lowest poverty rate of 4.0%, which includes 169 families.
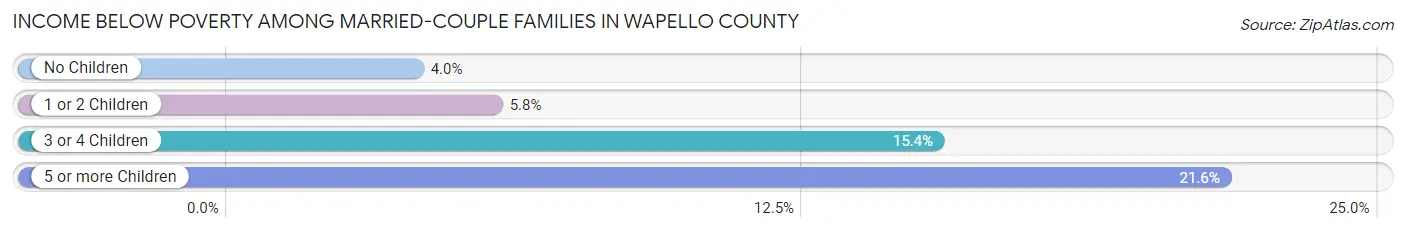
| Children | Above Poverty | Below Poverty |
| No Children | 4,009 (96.0%) | 169 (4.0%) |
| 1 or 2 Children | 1,733 (94.2%) | 106 (5.8%) |
| 3 or 4 Children | 385 (84.6%) | 70 (15.4%) |
| 5 or more Children | 87 (78.4%) | 24 (21.6%) |
| Total | 6,214 (94.4%) | 369 (5.6%) |
Income Below Poverty Among Single-Parent Households in Wapello County
According to the poverty data in Wapello County, 34.0% or 237 single-father households and 35.4% or 702 single-mother households are living below the poverty line. Among single-father households, those with 3 or 4 children have the highest poverty rate, with 43 households (57.3%) experiencing poverty. Likewise, among single-mother households, those with 5 or more children have the highest poverty rate, with 8 households (100.0%) falling below the poverty line.
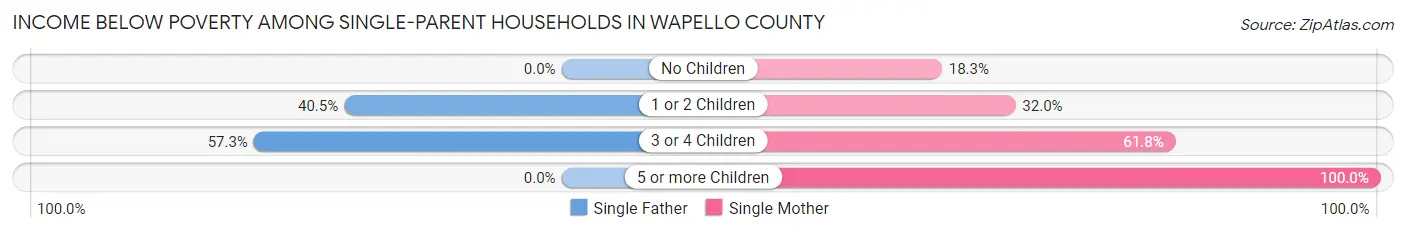
| Children | Single Father | Single Mother |
| No Children | 0 (0.0%) | 74 (18.3%) |
| 1 or 2 Children | 194 (40.5%) | 374 (32.0%) |
| 3 or 4 Children | 43 (57.3%) | 246 (61.8%) |
| 5 or more Children | 0 (0.0%) | 8 (100.0%) |
| Total | 237 (34.0%) | 702 (35.4%) |
Income Below Poverty Among Married-Couple vs Single-Parent Households in Wapello County
The poverty data for Wapello County shows that 369 of the married-couple family households (5.6%) and 939 of the single-parent households (35.1%) are living below the poverty level. Within the married-couple family households, those with 5 or more children have the highest poverty rate, with 24 households (21.6%) falling below the poverty line. Among the single-parent households, those with 5 or more children have the highest poverty rate, with 8 household (100.0%) living below poverty.
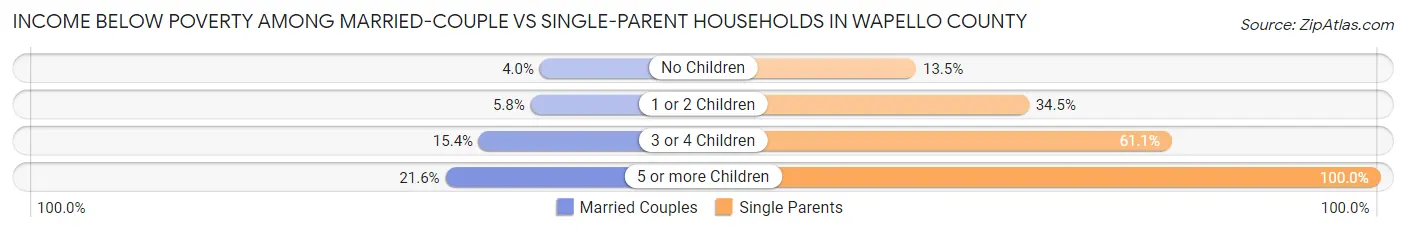
| Children | Married-Couple Families | Single-Parent Households |
| No Children | 169 (4.0%) | 74 (13.5%) |
| 1 or 2 Children | 106 (5.8%) | 568 (34.5%) |
| 3 or 4 Children | 70 (15.4%) | 289 (61.1%) |
| 5 or more Children | 24 (21.6%) | 8 (100.0%) |
| Total | 369 (5.6%) | 939 (35.1%) |
Race in Wapello County
The most populous races in Wapello County are White / Caucasian (30,266 | 85.8%), Hispanic or Latino (4,069 | 11.5%), and Two or more Races (1,753 | 5.0%).
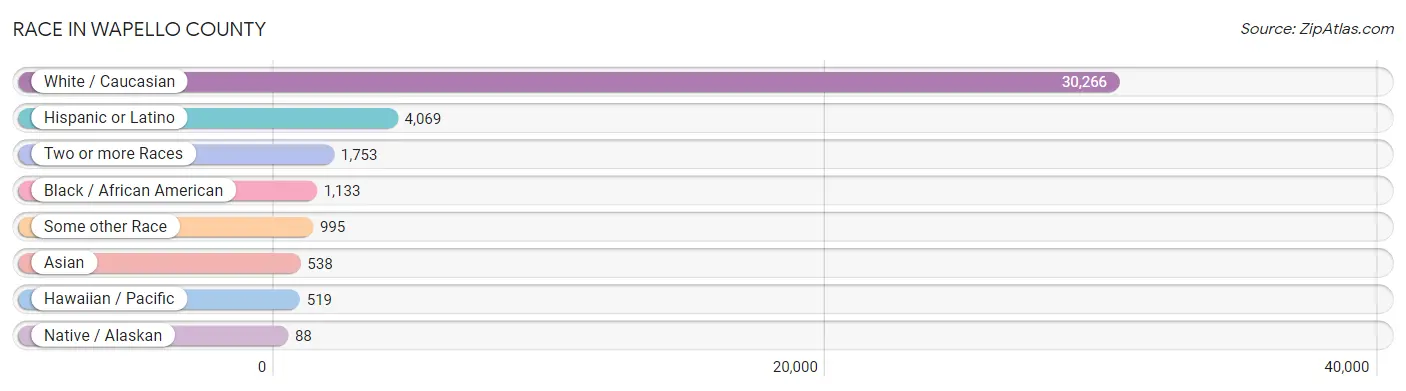
| Race | # Population | % Population |
| Asian | 538 | 1.5% |
| Black / African American | 1,133 | 3.2% |
| Hawaiian / Pacific | 519 | 1.5% |
| Hispanic or Latino | 4,069 | 11.5% |
| Native / Alaskan | 88 | 0.3% |
| White / Caucasian | 30,266 | 85.8% |
| Two or more Races | 1,753 | 5.0% |
| Some other Race | 995 | 2.8% |
| Total | 35,292 | 100.0% |
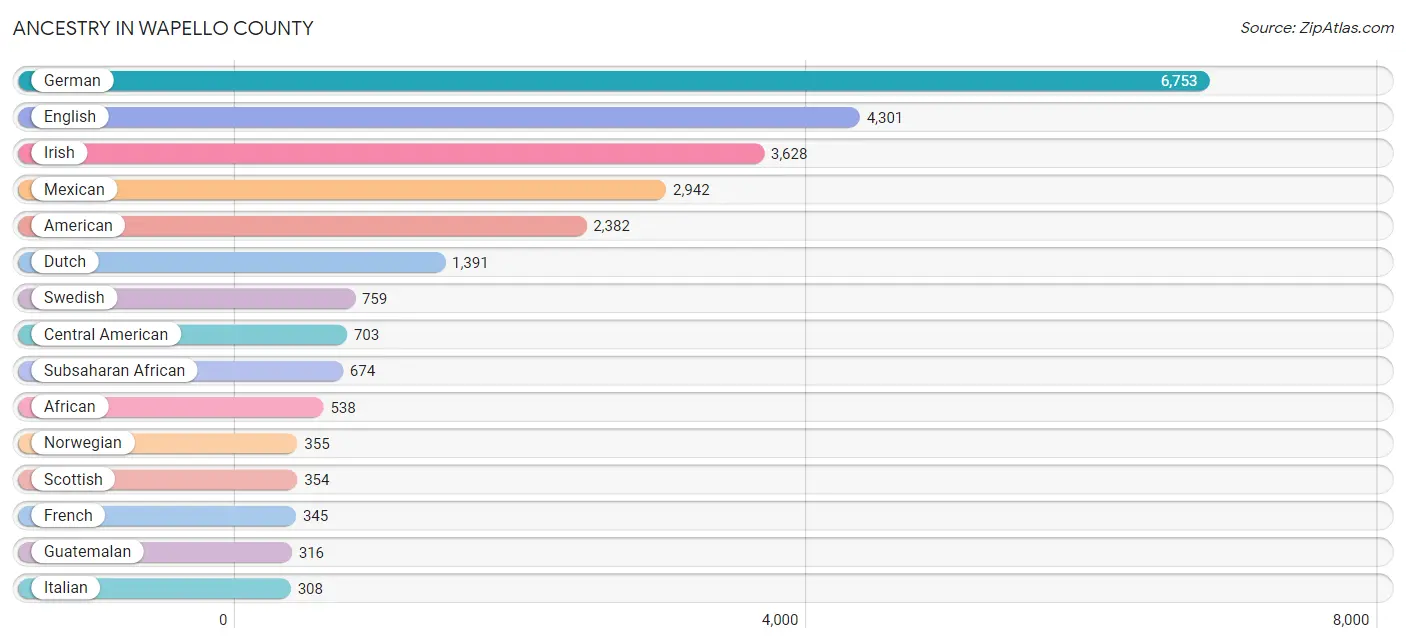
Ancestry in Wapello County
The most populous ancestries reported in Wapello County are German (6,753 | 19.1%), English (4,301 | 12.2%), Irish (3,628 | 10.3%), Mexican (2,942 | 8.3%), and American (2,382 | 6.8%), together accounting for 56.7% of all Wapello County residents.
| Ancestry | # Population | % Population |
| African | 538 | 1.5% |
| American | 2,382 | 6.8% |
| Arab | 69 | 0.2% |
| Austrian | 7 | 0.0% |
| Belgian | 30 | 0.1% |
| Bhutanese | 16 | 0.1% |
| Blackfeet | 14 | 0.0% |
| British | 286 | 0.8% |
| Bulgarian | 4 | 0.0% |
| Burmese | 131 | 0.4% |
| Cajun | 7 | 0.0% |
| Canadian | 25 | 0.1% |
| Central American | 703 | 2.0% |
| Central American Indian | 77 | 0.2% |
| Cherokee | 29 | 0.1% |
| Chippewa | 1 | 0.0% |
| Colombian | 4 | 0.0% |
| Croatian | 23 | 0.1% |
| Cuban | 199 | 0.6% |
| Czech | 100 | 0.3% |
| Czechoslovakian | 3 | 0.0% |
| Danish | 142 | 0.4% |
| Dutch | 1,391 | 3.9% |
| Eastern European | 23 | 0.1% |
| Egyptian | 1 | 0.0% |
| English | 4,301 | 12.2% |
| European | 302 | 0.9% |
| Fijian | 233 | 0.7% |
| Finnish | 11 | 0.0% |
| French | 345 | 1.0% |
| French Canadian | 105 | 0.3% |
| German | 6,753 | 19.1% |
| Greek | 145 | 0.4% |
| Guatemalan | 316 | 0.9% |
| Haitian | 34 | 0.1% |
| Honduran | 112 | 0.3% |
| Hungarian | 27 | 0.1% |
| Indian (Asian) | 44 | 0.1% |
| Indonesian | 48 | 0.1% |
| Irish | 3,628 | 10.3% |
| Israeli | 26 | 0.1% |
| Italian | 308 | 0.9% |
| Jamaican | 9 | 0.0% |
| Korean | 301 | 0.9% |
| Lithuanian | 8 | 0.0% |
| Macedonian | 55 | 0.2% |
| Malaysian | 66 | 0.2% |
| Marshallese | 285 | 0.8% |
| Mexican | 2,942 | 8.3% |
| Moroccan | 47 | 0.1% |
| Native Hawaiian | 8 | 0.0% |
| Nicaraguan | 24 | 0.1% |
| Northern European | 126 | 0.4% |
| Norwegian | 355 | 1.0% |
| Pakistani | 9 | 0.0% |
| Pennsylvania German | 4 | 0.0% |
| Polish | 19 | 0.1% |
| Puerto Rican | 115 | 0.3% |
| Russian | 19 | 0.1% |
| Salvadoran | 251 | 0.7% |
| Scandinavian | 21 | 0.1% |
| Scotch-Irish | 239 | 0.7% |
| Scottish | 354 | 1.0% |
| Serbian | 10 | 0.0% |
| Sioux | 33 | 0.1% |
| Slavic | 11 | 0.0% |
| Slovak | 35 | 0.1% |
| South American | 4 | 0.0% |
| Spaniard | 7 | 0.0% |
| Spanish | 32 | 0.1% |
| Subsaharan African | 674 | 1.9% |
| Sudanese | 136 | 0.4% |
| Swedish | 759 | 2.1% |
| Swiss | 43 | 0.1% |
| Thai | 32 | 0.1% |
| Tlingit-Haida | 8 | 0.0% |
| Ukrainian | 13 | 0.0% |
| Vietnamese | 8 | 0.0% |
| Welsh | 137 | 0.4% |
| Yaqui | 7 | 0.0% |
| Yugoslavian | 14 | 0.0% | View All 81 Rows |
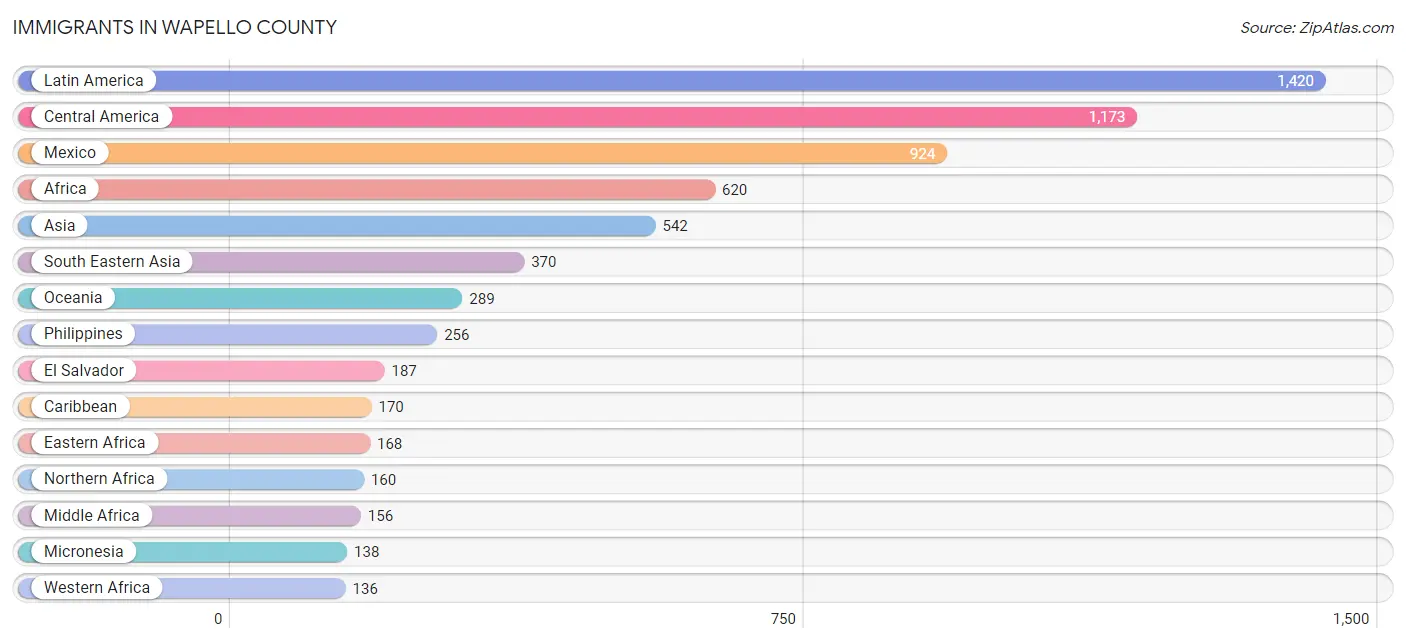
Immigrants in Wapello County
The most numerous immigrant groups reported in Wapello County came from Latin America (1,420 | 4.0%), Central America (1,173 | 3.3%), Mexico (924 | 2.6%), Africa (620 | 1.8%), and Asia (542 | 1.5%), together accounting for 13.3% of all Wapello County residents.
| Immigration Origin | # Population | % Population |
| Africa | 620 | 1.8% |
| Asia | 542 | 1.5% |
| Bangladesh | 8 | 0.0% |
| Brazil | 9 | 0.0% |
| Bulgaria | 4 | 0.0% |
| Cameroon | 73 | 0.2% |
| Canada | 8 | 0.0% |
| Caribbean | 170 | 0.5% |
| Central America | 1,173 | 3.3% |
| Colombia | 4 | 0.0% |
| Cuba | 118 | 0.3% |
| Eastern Africa | 168 | 0.5% |
| Eastern Asia | 53 | 0.2% |
| Eastern Europe | 59 | 0.2% |
| El Salvador | 187 | 0.5% |
| England | 16 | 0.1% |
| Eritrea | 80 | 0.2% |
| Ethiopia | 88 | 0.3% |
| Europe | 111 | 0.3% |
| Germany | 25 | 0.1% |
| Ghana | 18 | 0.1% |
| Guatemala | 54 | 0.2% |
| Haiti | 34 | 0.1% |
| India | 90 | 0.3% |
| Israel | 21 | 0.1% |
| Italy | 5 | 0.0% |
| Jamaica | 9 | 0.0% |
| Japan | 15 | 0.0% |
| Korea | 38 | 0.1% |
| Laos | 66 | 0.2% |
| Latin America | 1,420 | 4.0% |
| Liberia | 60 | 0.2% |
| Mexico | 924 | 2.6% |
| Micronesia | 138 | 0.4% |
| Middle Africa | 156 | 0.4% |
| Morocco | 55 | 0.2% |
| Nicaragua | 8 | 0.0% |
| Nigeria | 44 | 0.1% |
| North Macedonia | 55 | 0.2% |
| Northern Africa | 160 | 0.4% |
| Northern Europe | 16 | 0.1% |
| Oceania | 289 | 0.8% |
| Peru | 64 | 0.2% |
| Philippines | 256 | 0.7% |
| South America | 77 | 0.2% |
| South Central Asia | 98 | 0.3% |
| South Eastern Asia | 370 | 1.1% |
| Southern Europe | 5 | 0.0% |
| Sudan | 105 | 0.3% |
| Switzerland | 6 | 0.0% |
| Western Africa | 136 | 0.4% |
| Western Asia | 21 | 0.1% |
| Western Europe | 31 | 0.1% |
| Zaire | 83 | 0.2% | View All 54 Rows |
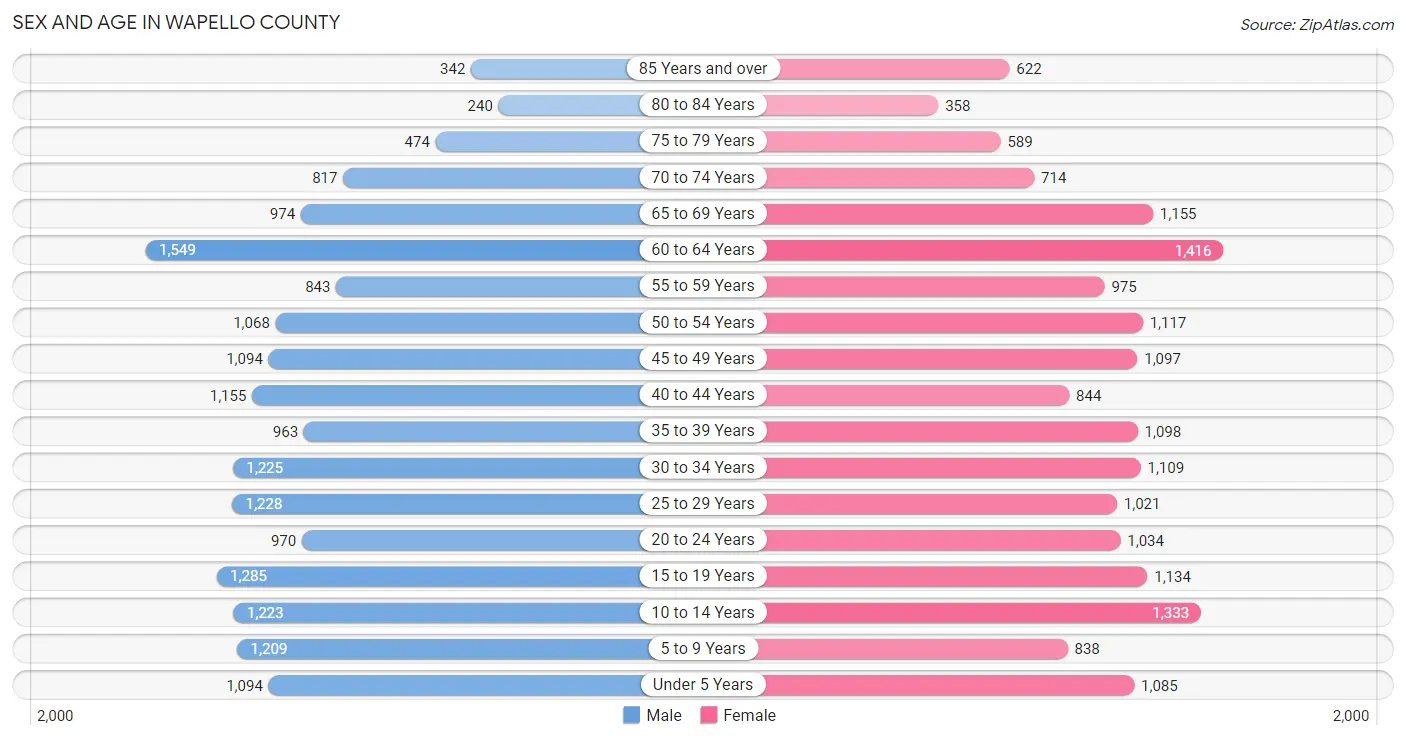
Sex and Age in Wapello County
Sex and Age in Wapello County
The most populous age groups in Wapello County are 60 to 64 Years (1,549 | 8.7%) for men and 60 to 64 Years (1,416 | 8.1%) for women.
| Age Bracket | Male | Female |
| Under 5 Years | 1,094 (6.2%) | 1,085 (6.2%) |
| 5 to 9 Years | 1,209 (6.8%) | 838 (4.8%) |
| 10 to 14 Years | 1,223 (6.9%) | 1,333 (7.6%) |
| 15 to 19 Years | 1,285 (7.2%) | 1,134 (6.5%) |
| 20 to 24 Years | 970 (5.5%) | 1,034 (5.9%) |
| 25 to 29 Years | 1,228 (6.9%) | 1,021 (5.8%) |
| 30 to 34 Years | 1,225 (6.9%) | 1,109 (6.3%) |
| 35 to 39 Years | 963 (5.4%) | 1,098 (6.3%) |
| 40 to 44 Years | 1,155 (6.5%) | 844 (4.8%) |
| 45 to 49 Years | 1,094 (6.2%) | 1,097 (6.2%) |
| 50 to 54 Years | 1,068 (6.0%) | 1,117 (6.4%) |
| 55 to 59 Years | 843 (4.8%) | 975 (5.6%) |
| 60 to 64 Years | 1,549 (8.7%) | 1,416 (8.1%) |
| 65 to 69 Years | 974 (5.5%) | 1,155 (6.6%) |
| 70 to 74 Years | 817 (4.6%) | 714 (4.1%) |
| 75 to 79 Years | 474 (2.7%) | 589 (3.4%) |
| 80 to 84 Years | 240 (1.3%) | 358 (2.0%) |
| 85 Years and over | 342 (1.9%) | 622 (3.5%) |
| Total | 17,753 (100.0%) | 17,539 (100.0%) |
Families and Households in Wapello County
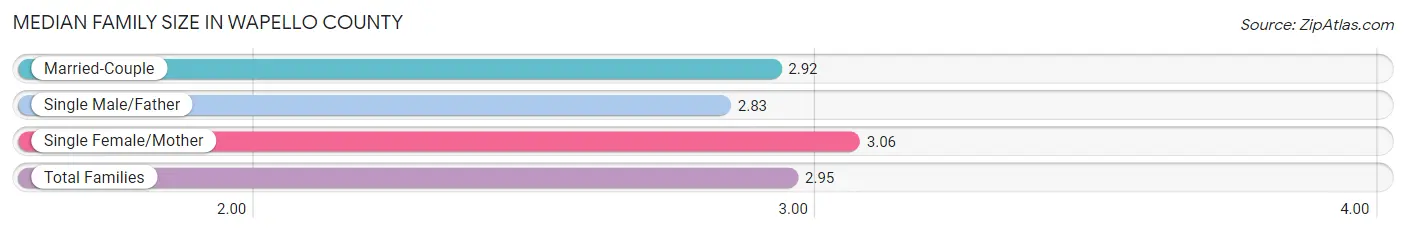
Median Family Size in Wapello County
The median family size in Wapello County is 2.95 persons per family, with single female/mother families (1,980 | 21.4%) accounting for the largest median family size of 3.06 persons per family. On the other hand, single male/father families (698 | 7.5%) represent the smallest median family size with 2.83 persons per family.
| Family Type | # Families | Family Size |
| Married-Couple | 6,583 (71.1%) | 2.92 |
| Single Male/Father | 698 (7.5%) | 2.83 |
| Single Female/Mother | 1,980 (21.4%) | 3.06 |
| Total Families | 9,261 (100.0%) | 2.95 |
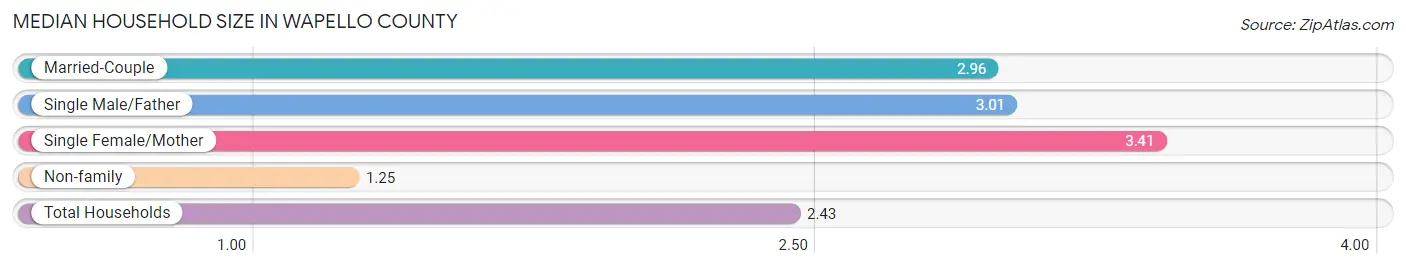
Median Household Size in Wapello County
The median household size in Wapello County is 2.43 persons per household, with single female/mother households (1,980 | 14.0%) accounting for the largest median household size of 3.41 persons per household. non-family households (4,932 | 34.7%) represent the smallest median household size with 1.25 persons per household.
| Household Type | # Households | Household Size |
| Married-Couple | 6,583 (46.4%) | 2.96 |
| Single Male/Father | 698 (4.9%) | 3.01 |
| Single Female/Mother | 1,980 (14.0%) | 3.41 |
| Non-family | 4,932 (34.7%) | 1.25 |
| Total Households | 14,193 (100.0%) | 2.43 |
Household Size by Marriage Status in Wapello County
Out of a total of 14,193 households in Wapello County, 9,261 (65.2%) are family households, while 4,932 (34.7%) are nonfamily households. The most numerous type of family households are 2-person households, comprising 4,451, and the most common type of nonfamily households are 1-person households, comprising 4,135.
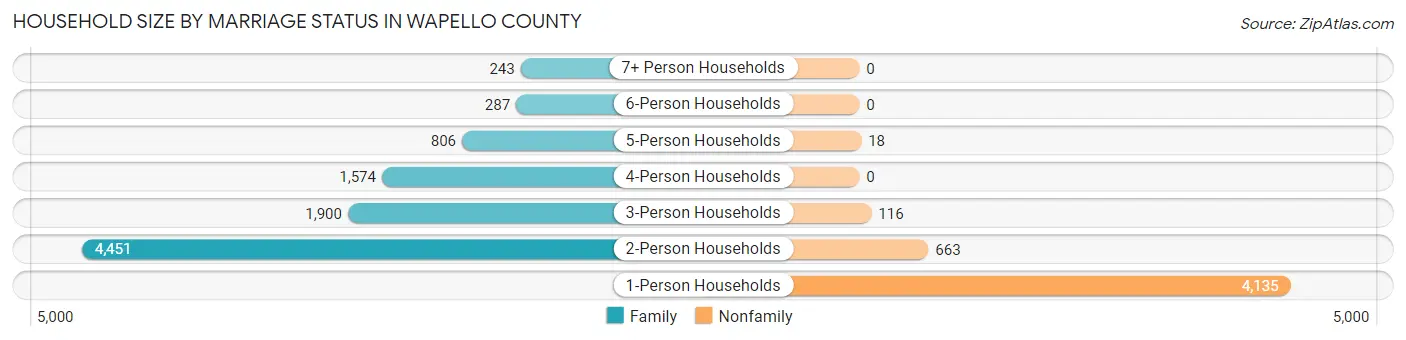
| Household Size | Family Households | Nonfamily Households |
| 1-Person Households | - | 4,135 (29.1%) |
| 2-Person Households | 4,451 (31.4%) | 663 (4.7%) |
| 3-Person Households | 1,900 (13.4%) | 116 (0.8%) |
| 4-Person Households | 1,574 (11.1%) | 0 (0.0%) |
| 5-Person Households | 806 (5.7%) | 18 (0.1%) |
| 6-Person Households | 287 (2.0%) | 0 (0.0%) |
| 7+ Person Households | 243 (1.7%) | 0 (0.0%) |
| Total | 9,261 (65.2%) | 4,932 (34.7%) |
Female Fertility in Wapello County
Fertility by Age in Wapello County
Average fertility rate in Wapello County is 72.0 births per 1,000 women. Women in the age bracket of 20 to 34 years have the highest fertility rate with 137.0 births per 1,000 women. Women in the age bracket of 20 to 34 years acount for 78.7% of all women with births.
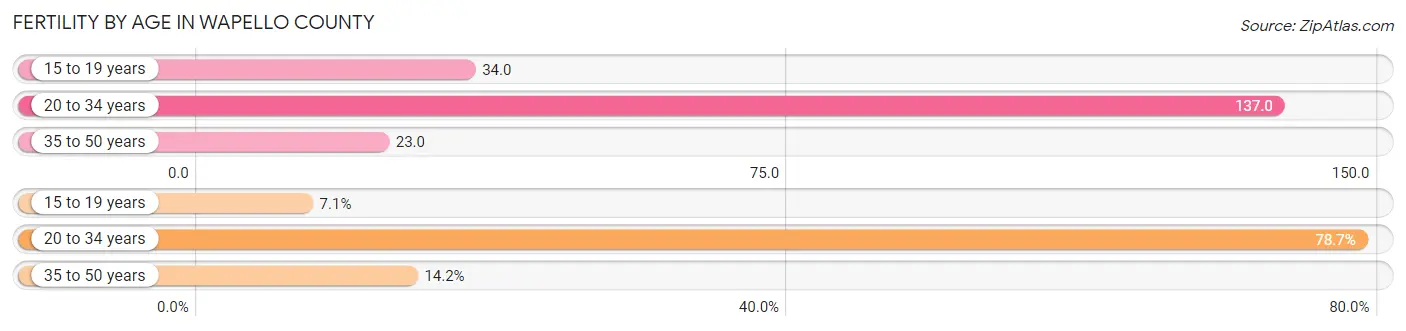
| Age Bracket | Women with Births | Births / 1,000 Women |
| 15 to 19 years | 39 (7.1%) | 34.0 |
| 20 to 34 years | 432 (78.7%) | 137.0 |
| 35 to 50 years | 78 (14.2%) | 23.0 |
| Total | 549 (100.0%) | 72.0 |
Fertility by Age by Marriage Status in Wapello County
55.6% of women with births (549) in Wapello County are married. The highest percentage of unmarried women with births falls into 20 to 34 years age bracket with 47.4% of them unmarried at the time of birth, while the lowest percentage of unmarried women with births belong to 35 to 50 years age bracket with 29.5% of them unmarried.
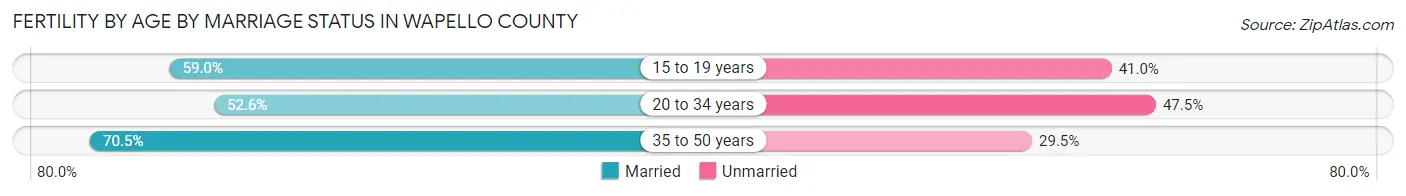
| Age Bracket | Married | Unmarried |
| 15 to 19 years | 23 (59.0%) | 16 (41.0%) |
| 20 to 34 years | 227 (52.5%) | 205 (47.4%) |
| 35 to 50 years | 55 (70.5%) | 23 (29.5%) |
| Total | 305 (55.6%) | 244 (44.4%) |
Fertility by Education in Wapello County
Average fertility rate in Wapello County is 72.0 births per 1,000 women. Women with the education attainment of graduate degree have the highest fertility rate of 122.0 births per 1,000 women, while women with the education attainment of bachelor's degree have the lowest fertility at 30.0 births per 1,000 women. Women with the education attainment of high school diploma represent 43.5% of all women with births.
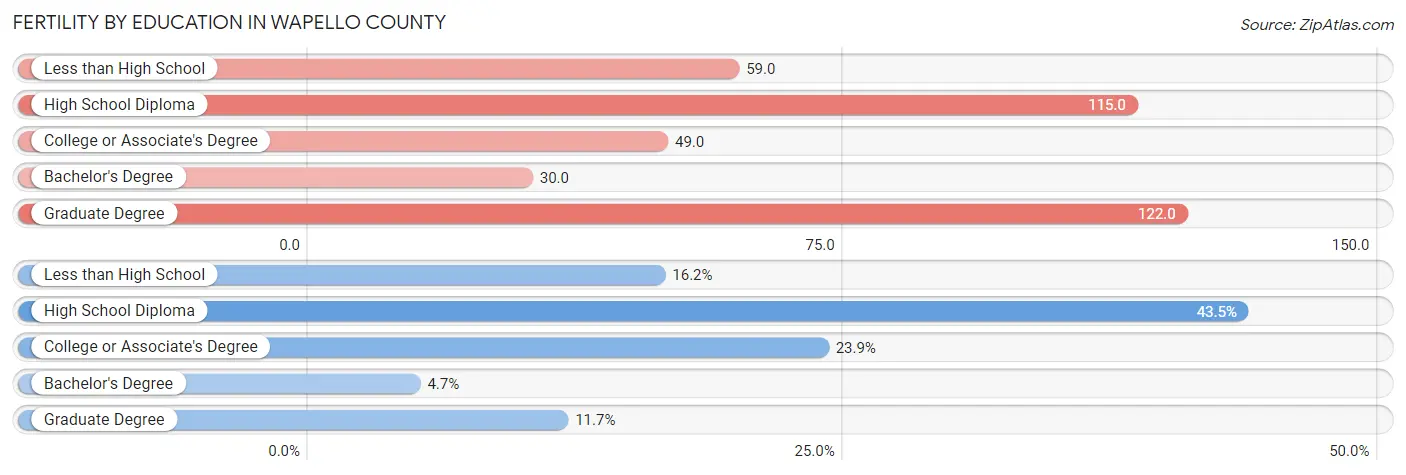
| Educational Attainment | Women with Births | Births / 1,000 Women |
| Less than High School | 89 (16.2%) | 59.0 |
| High School Diploma | 239 (43.5%) | 115.0 |
| College or Associate's Degree | 131 (23.9%) | 49.0 |
| Bachelor's Degree | 26 (4.7%) | 30.0 |
| Graduate Degree | 64 (11.7%) | 122.0 |
| Total | 549 (100.0%) | 72.0 |
Fertility by Education by Marriage Status in Wapello County
44.4% of women with births in Wapello County are unmarried. Women with the educational attainment of bachelor's degree are most likely to be married with 100.0% of them married at childbirth, while women with the educational attainment of high school diploma are least likely to be married with 60.3% of them unmarried at childbirth.
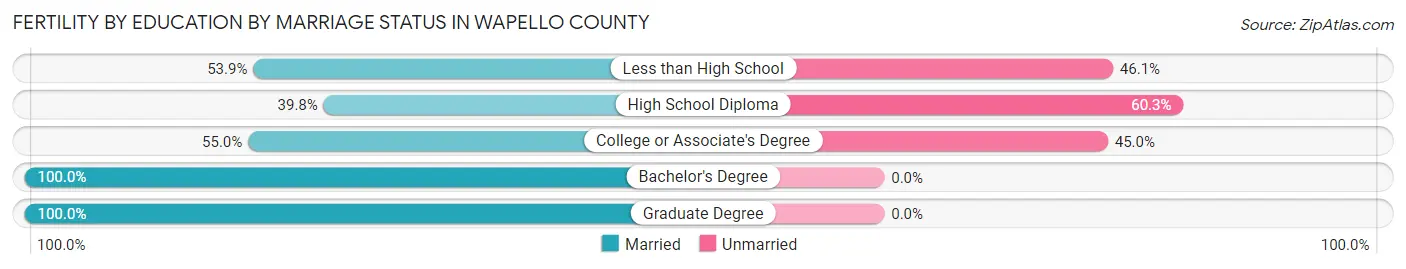
| Educational Attainment | Married | Unmarried |
| Less than High School | 48 (53.9%) | 41 (46.1%) |
| High School Diploma | 95 (39.8%) | 144 (60.3%) |
| College or Associate's Degree | 72 (55.0%) | 59 (45.0%) |
| Bachelor's Degree | 26 (100.0%) | 0 (0.0%) |
| Graduate Degree | 64 (100.0%) | 0 (0.0%) |
| Total | 305 (55.6%) | 244 (44.4%) |
Employment Characteristics in Wapello County
Employment by Class of Employer in Wapello County
Among the 16,045 employed individuals in Wapello County, private company employees (11,202 | 69.8%), not-for-profit organizations (1,362 | 8.5%), and local government employees (1,286 | 8.0%) make up the most common classes of employment.
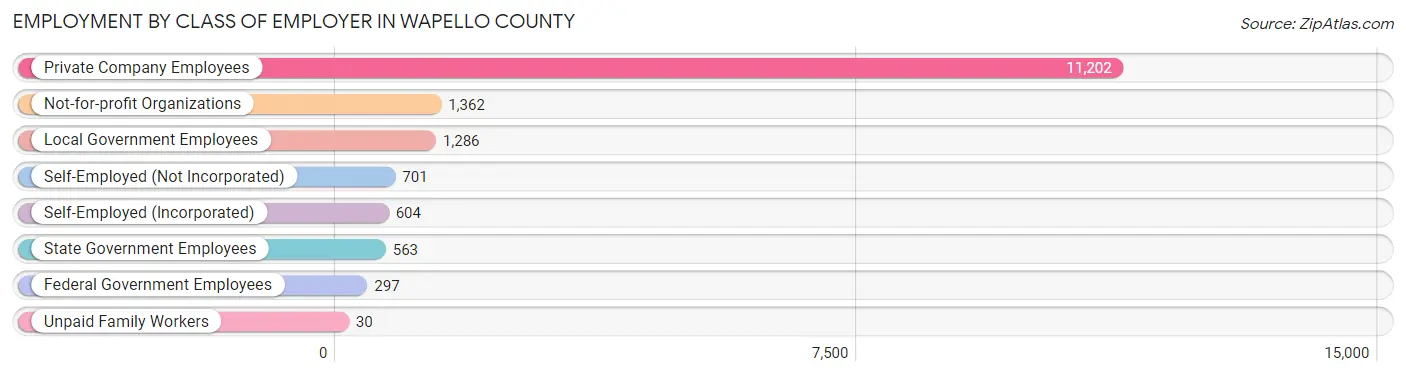
| Employer Class | # Employees | % Employees |
| Private Company Employees | 11,202 | 69.8% |
| Self-Employed (Incorporated) | 604 | 3.8% |
| Self-Employed (Not Incorporated) | 701 | 4.4% |
| Not-for-profit Organizations | 1,362 | 8.5% |
| Local Government Employees | 1,286 | 8.0% |
| State Government Employees | 563 | 3.5% |
| Federal Government Employees | 297 | 1.8% |
| Unpaid Family Workers | 30 | 0.2% |
| Total | 16,045 | 100.0% |
Employment Status by Age in Wapello County
According to the labor force statistics for Wapello County, out of the total population over 16 years of age (27,992), 61.6% or 17,243 individuals are in the labor force, with 4.4% or 759 of them unemployed. The age group with the highest labor force participation rate is 25 to 29 years, with 87.4% or 1,966 individuals in the labor force. Within the labor force, the 16 to 19 years age range has the highest percentage of unemployed individuals, with 11.3% or 122 of them being unemployed.
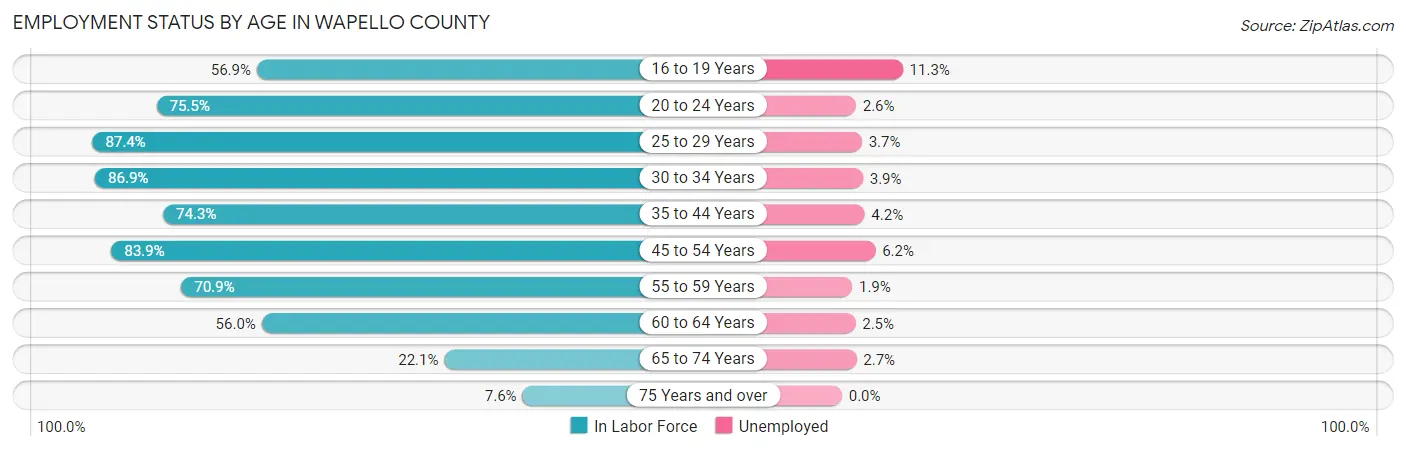
| Age Bracket | In Labor Force | Unemployed |
| 16 to 19 Years | 1,082 (56.9%) | 122 (11.3%) |
| 20 to 24 Years | 1,513 (75.5%) | 39 (2.6%) |
| 25 to 29 Years | 1,966 (87.4%) | 73 (3.7%) |
| 30 to 34 Years | 2,028 (86.9%) | 79 (3.9%) |
| 35 to 44 Years | 3,017 (74.3%) | 127 (4.2%) |
| 45 to 54 Years | 3,671 (83.9%) | 228 (6.2%) |
| 55 to 59 Years | 1,289 (70.9%) | 24 (1.9%) |
| 60 to 64 Years | 1,660 (56.0%) | 42 (2.5%) |
| 65 to 74 Years | 809 (22.1%) | 22 (2.7%) |
| 75 Years and over | 200 (7.6%) | 0 (0.0%) |
| Total | 17,243 (61.6%) | 759 (4.4%) |
Employment Status by Educational Attainment in Wapello County
According to labor force statistics for Wapello County, 76.6% of individuals (13,636) out of the total population between 25 and 64 years of age (17,802) are in the labor force, with 4.2% or 573 of them being unemployed. The group with the highest labor force participation rate are those with the educational attainment of bachelor's degree or higher, with 85.1% or 2,876 individuals in the labor force. Within the labor force, individuals with less than high school education have the highest percentage of unemployment, with 7.1% or 105 of them being unemployed.
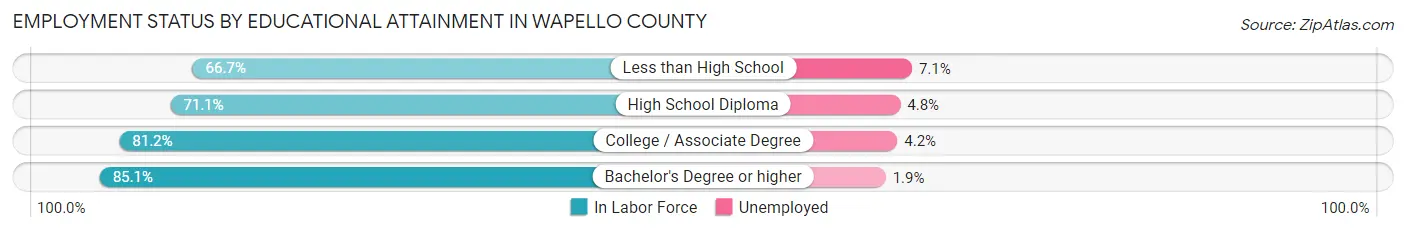
| Educational Attainment | In Labor Force | Unemployed |
| Less than High School | 1,479 (66.7%) | 157 (7.1%) |
| High School Diploma | 4,462 (71.1%) | 301 (4.8%) |
| College / Associate Degree | 4,815 (81.2%) | 249 (4.2%) |
| Bachelor's Degree or higher | 2,876 (85.1%) | 64 (1.9%) |
| Total | 13,636 (76.6%) | 748 (4.2%) |
Employment Occupations by Sex in Wapello County
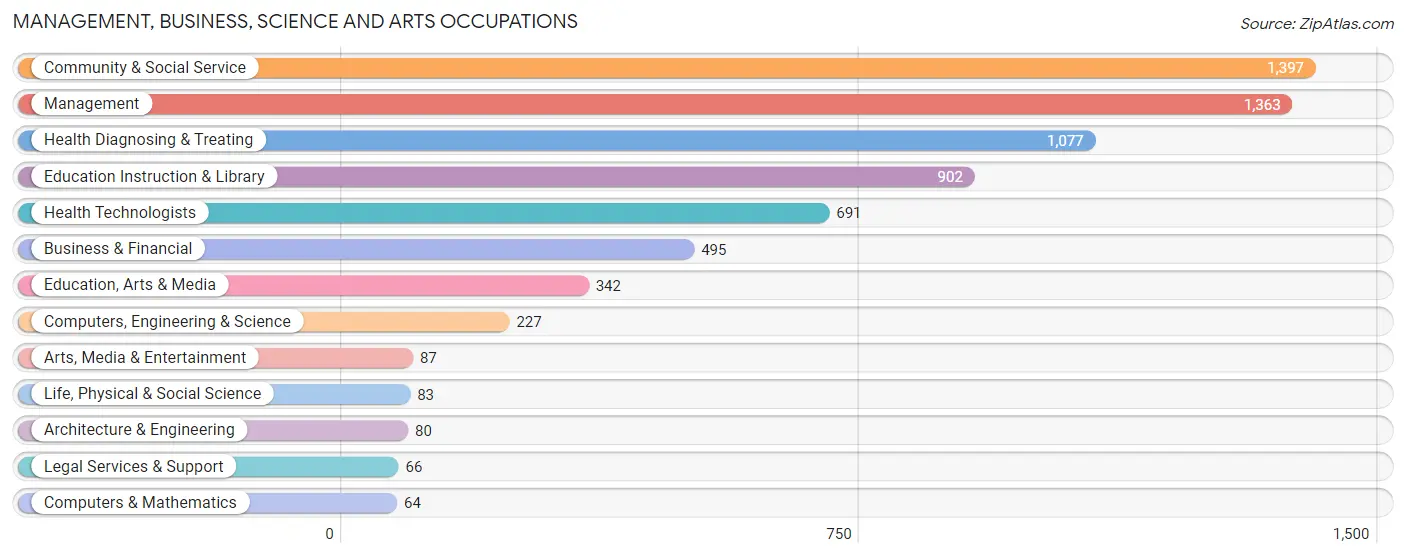
Management, Business, Science and Arts Occupations
The most common Management, Business, Science and Arts occupations in Wapello County are Community & Social Service (1,397 | 8.5%), Management (1,363 | 8.3%), Health Diagnosing & Treating (1,077 | 6.5%), Education Instruction & Library (902 | 5.5%), and Health Technologists (691 | 4.2%).
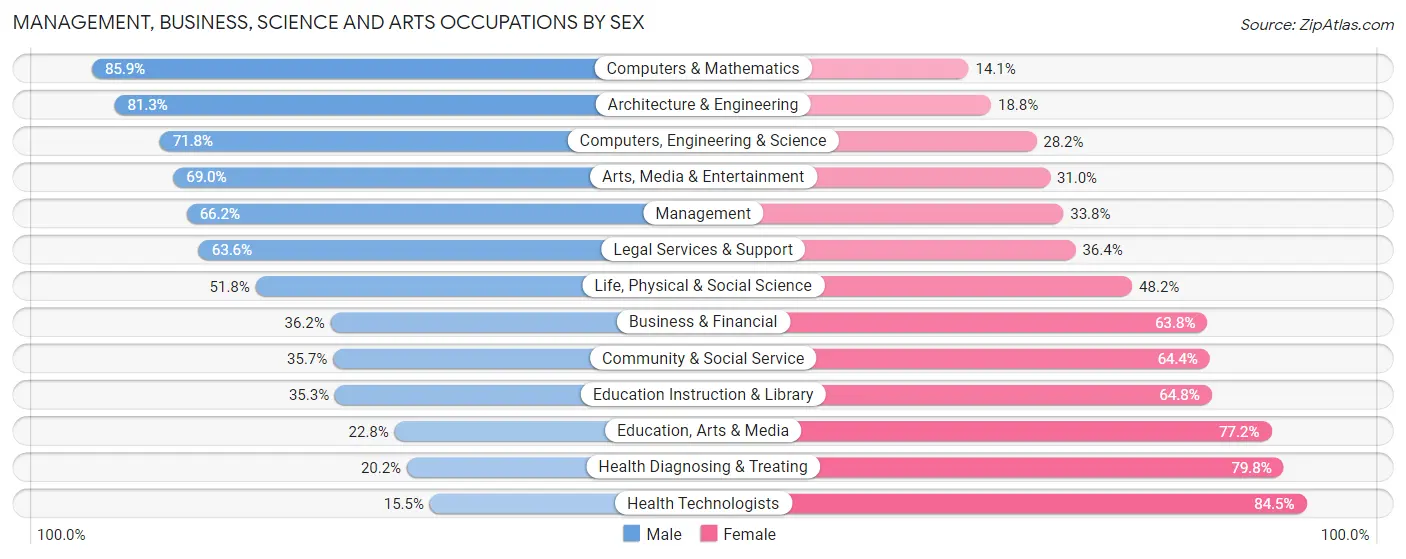
Management, Business, Science and Arts Occupations by Sex
Within the Management, Business, Science and Arts occupations in Wapello County, the most male-oriented occupations are Computers & Mathematics (85.9%), Architecture & Engineering (81.2%), and Computers, Engineering & Science (71.8%), while the most female-oriented occupations are Health Technologists (84.5%), Health Diagnosing & Treating (79.8%), and Education, Arts & Media (77.2%).
| Occupation | Male | Female |
| Management | 902 (66.2%) | 461 (33.8%) |
| Business & Financial | 179 (36.2%) | 316 (63.8%) |
| Computers, Engineering & Science | 163 (71.8%) | 64 (28.2%) |
| Computers & Mathematics | 55 (85.9%) | 9 (14.1%) |
| Architecture & Engineering | 65 (81.2%) | 15 (18.8%) |
| Life, Physical & Social Science | 43 (51.8%) | 40 (48.2%) |
| Community & Social Service | 498 (35.6%) | 899 (64.3%) |
| Education, Arts & Media | 78 (22.8%) | 264 (77.2%) |
| Legal Services & Support | 42 (63.6%) | 24 (36.4%) |
| Education Instruction & Library | 318 (35.2%) | 584 (64.7%) |
| Arts, Media & Entertainment | 60 (69.0%) | 27 (31.0%) |
| Health Diagnosing & Treating | 218 (20.2%) | 859 (79.8%) |
| Health Technologists | 107 (15.5%) | 584 (84.5%) |
| Total (Category) | 1,960 (43.0%) | 2,599 (57.0%) |
| Total (Overall) | 8,984 (54.5%) | 7,484 (45.5%) |
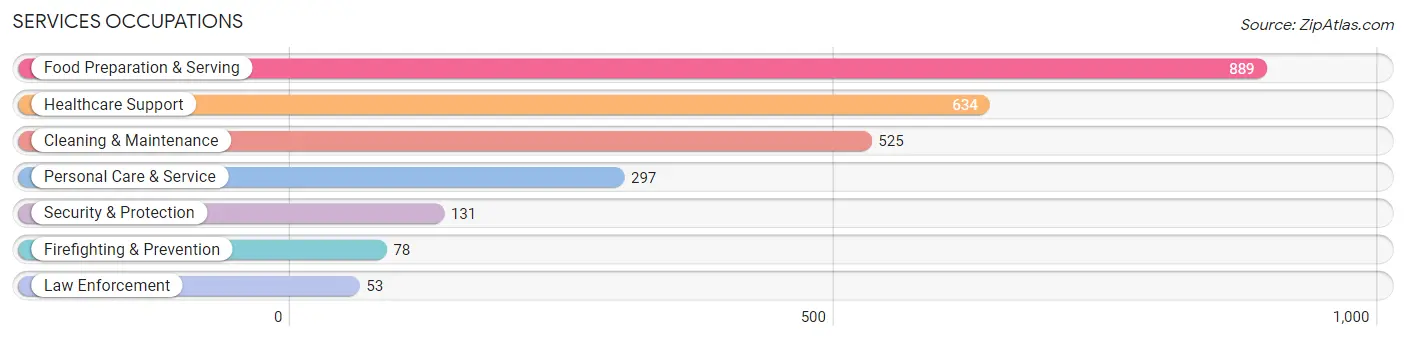
Services Occupations
The most common Services occupations in Wapello County are Food Preparation & Serving (889 | 5.4%), Healthcare Support (634 | 3.8%), Cleaning & Maintenance (525 | 3.2%), Personal Care & Service (297 | 1.8%), and Security & Protection (131 | 0.8%).
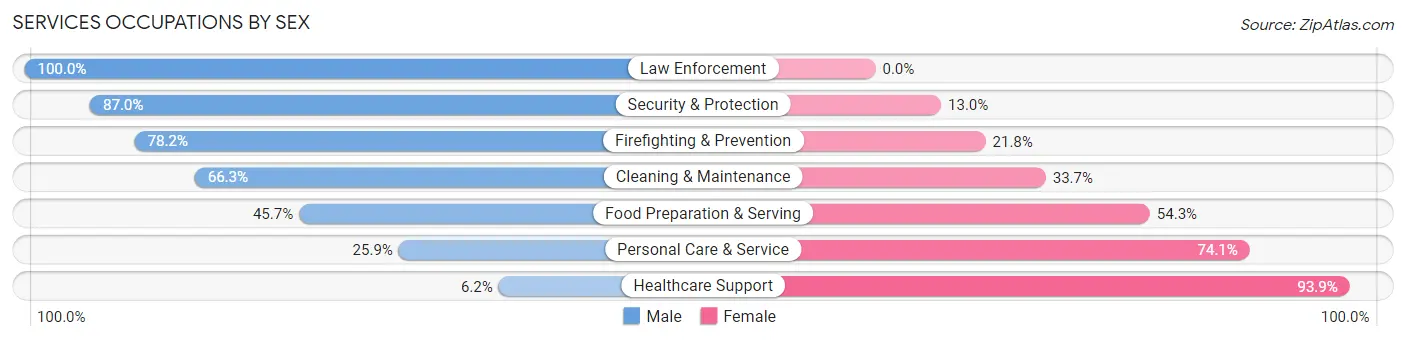
Services Occupations by Sex
Within the Services occupations in Wapello County, the most male-oriented occupations are Law Enforcement (100.0%), Security & Protection (87.0%), and Firefighting & Prevention (78.2%), while the most female-oriented occupations are Healthcare Support (93.9%), Personal Care & Service (74.1%), and Food Preparation & Serving (54.3%).
| Occupation | Male | Female |
| Healthcare Support | 39 (6.1%) | 595 (93.9%) |
| Security & Protection | 114 (87.0%) | 17 (13.0%) |
| Firefighting & Prevention | 61 (78.2%) | 17 (21.8%) |
| Law Enforcement | 53 (100.0%) | 0 (0.0%) |
| Food Preparation & Serving | 406 (45.7%) | 483 (54.3%) |
| Cleaning & Maintenance | 348 (66.3%) | 177 (33.7%) |
| Personal Care & Service | 77 (25.9%) | 220 (74.1%) |
| Total (Category) | 984 (39.7%) | 1,492 (60.3%) |
| Total (Overall) | 8,984 (54.5%) | 7,484 (45.5%) |
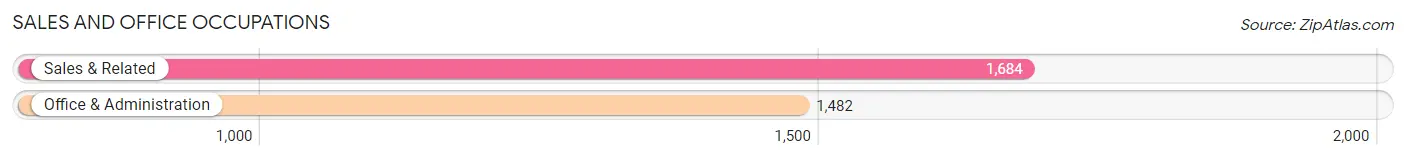
Sales and Office Occupations
The most common Sales and Office occupations in Wapello County are Sales & Related (1,684 | 10.2%), and Office & Administration (1,482 | 9.0%).
Sales and Office Occupations by Sex
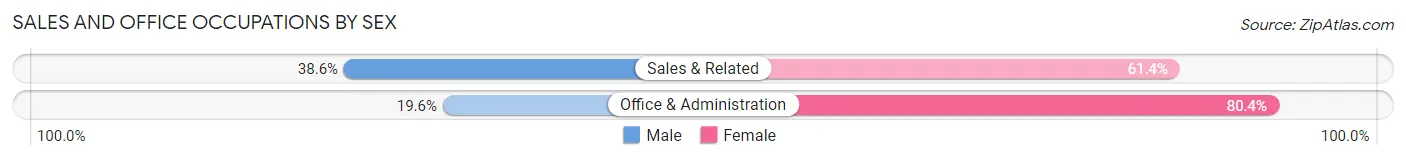
| Occupation | Male | Female |
| Sales & Related | 650 (38.6%) | 1,034 (61.4%) |
| Office & Administration | 290 (19.6%) | 1,192 (80.4%) |
| Total (Category) | 940 (29.7%) | 2,226 (70.3%) |
| Total (Overall) | 8,984 (54.5%) | 7,484 (45.5%) |
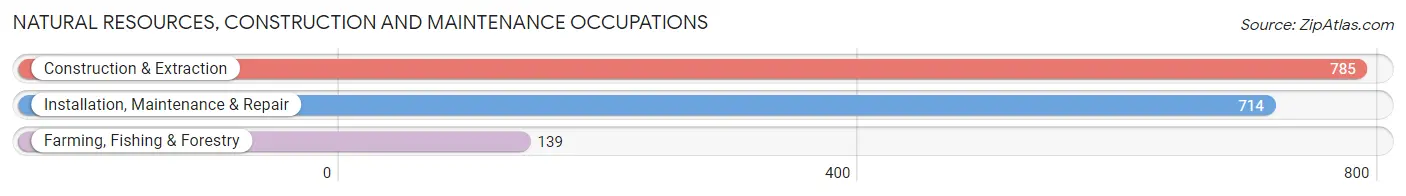
Natural Resources, Construction and Maintenance Occupations
The most common Natural Resources, Construction and Maintenance occupations in Wapello County are Construction & Extraction (785 | 4.8%), Installation, Maintenance & Repair (714 | 4.3%), and Farming, Fishing & Forestry (139 | 0.8%).
Natural Resources, Construction and Maintenance Occupations by Sex
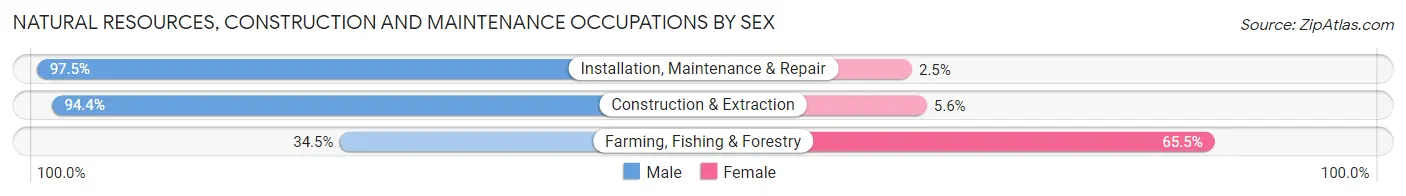
| Occupation | Male | Female |
| Farming, Fishing & Forestry | 48 (34.5%) | 91 (65.5%) |
| Construction & Extraction | 741 (94.4%) | 44 (5.6%) |
| Installation, Maintenance & Repair | 696 (97.5%) | 18 (2.5%) |
| Total (Category) | 1,485 (90.7%) | 153 (9.3%) |
| Total (Overall) | 8,984 (54.5%) | 7,484 (45.5%) |
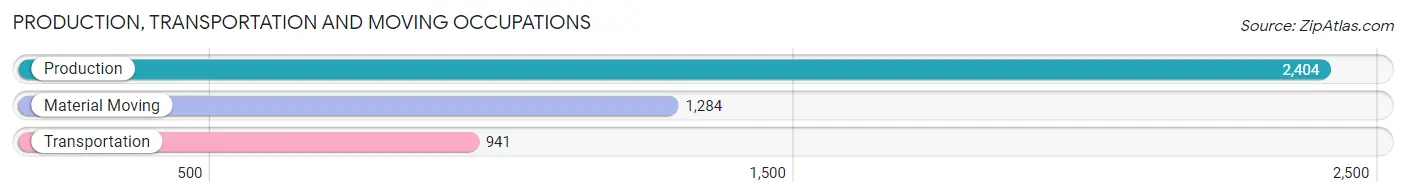
Production, Transportation and Moving Occupations
The most common Production, Transportation and Moving occupations in Wapello County are Production (2,404 | 14.6%), Material Moving (1,284 | 7.8%), and Transportation (941 | 5.7%).
Production, Transportation and Moving Occupations by Sex
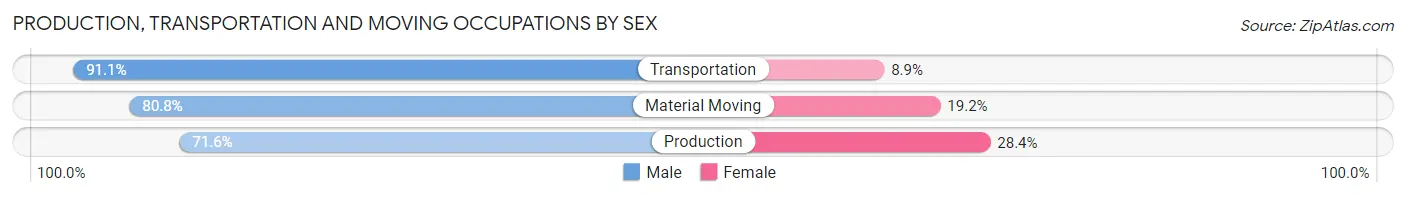
| Occupation | Male | Female |
| Production | 1,721 (71.6%) | 683 (28.4%) |
| Transportation | 857 (91.1%) | 84 (8.9%) |
| Material Moving | 1,037 (80.8%) | 247 (19.2%) |
| Total (Category) | 3,615 (78.1%) | 1,014 (21.9%) |
| Total (Overall) | 8,984 (54.5%) | 7,484 (45.5%) |
Employment Industries by Sex in Wapello County
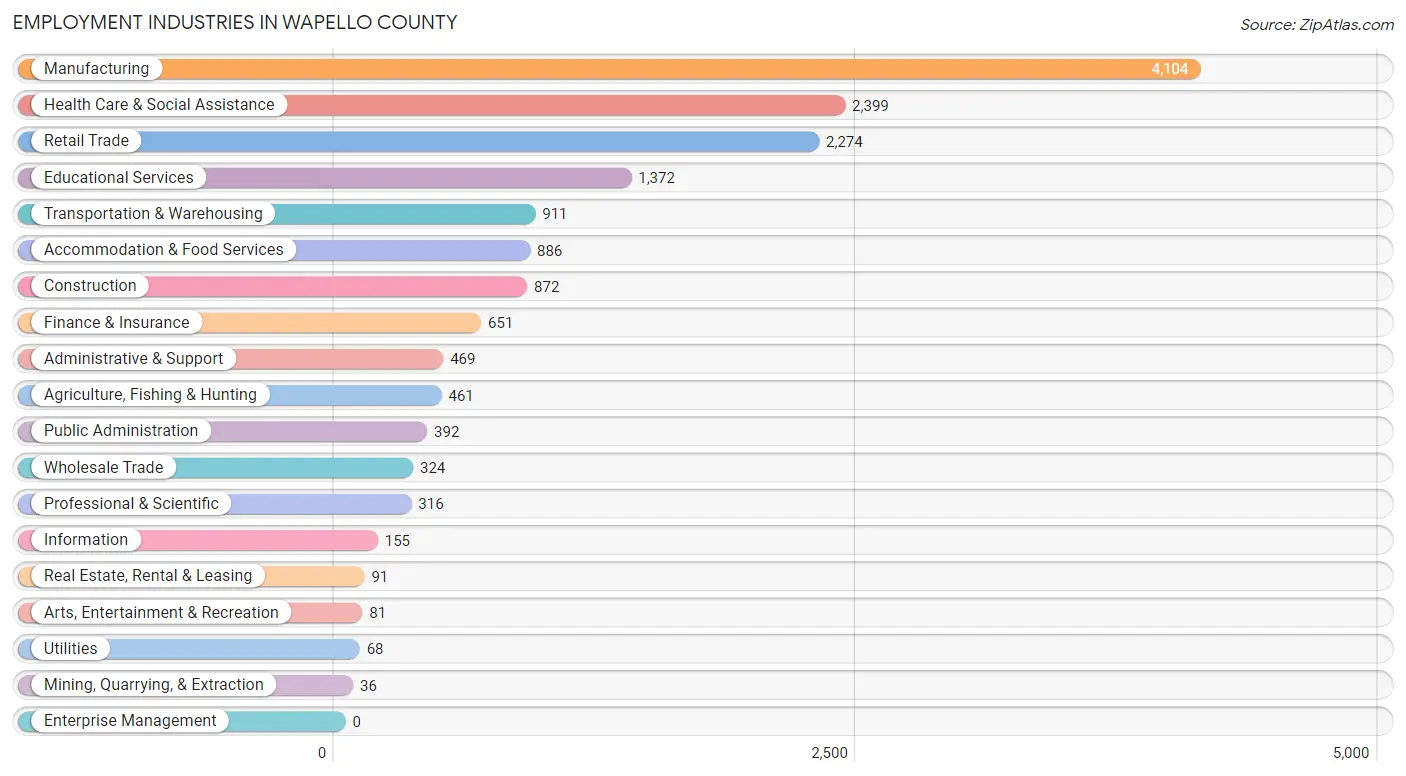
Employment Industries in Wapello County
The major employment industries in Wapello County include Manufacturing (4,104 | 24.9%), Health Care & Social Assistance (2,399 | 14.6%), Retail Trade (2,274 | 13.8%), Educational Services (1,372 | 8.3%), and Transportation & Warehousing (911 | 5.5%).
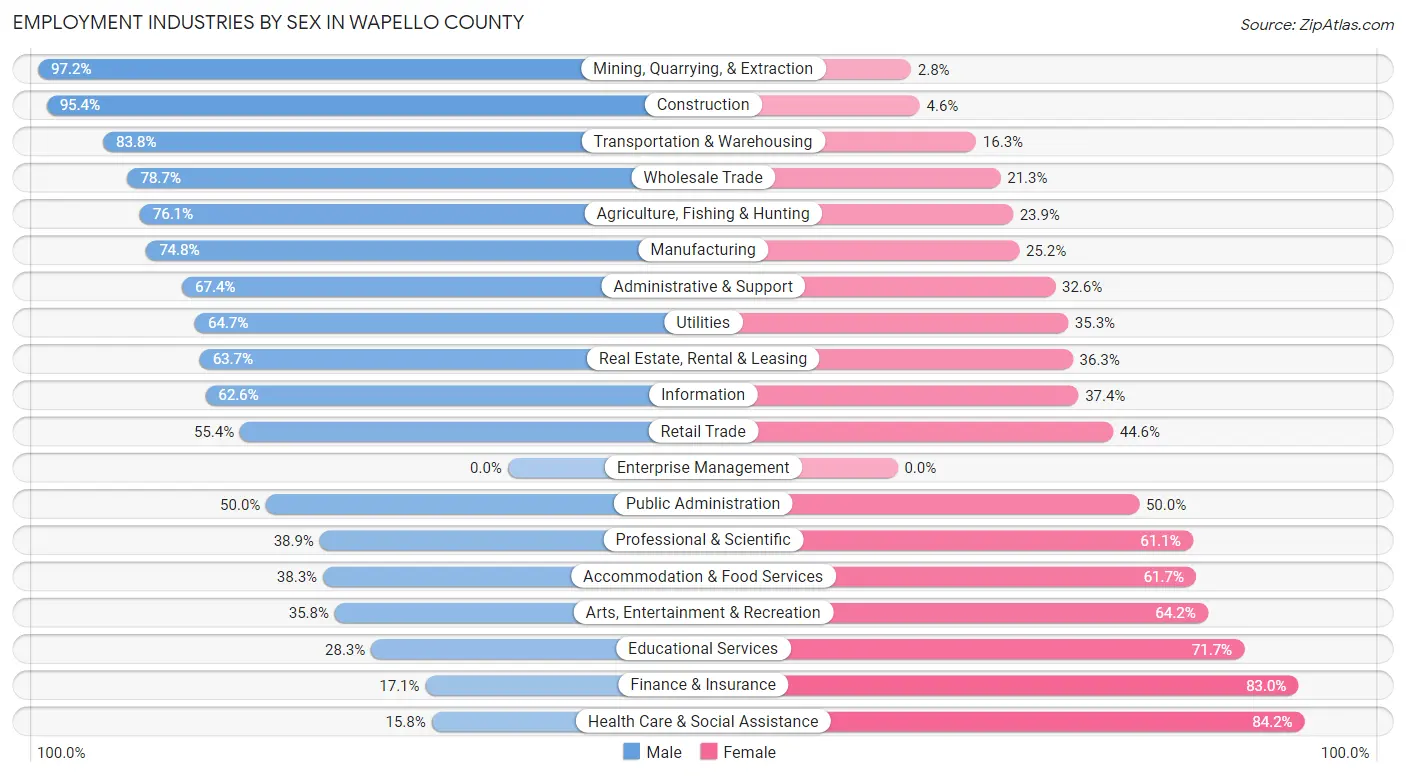
Employment Industries by Sex in Wapello County
The Wapello County industries that see more men than women are Mining, Quarrying, & Extraction (97.2%), Construction (95.4%), and Transportation & Warehousing (83.8%), whereas the industries that tend to have a higher number of women are Health Care & Social Assistance (84.2%), Finance & Insurance (83.0%), and Educational Services (71.7%).
| Industry | Male | Female |
| Agriculture, Fishing & Hunting | 351 (76.1%) | 110 (23.9%) |
| Mining, Quarrying, & Extraction | 35 (97.2%) | 1 (2.8%) |
| Construction | 832 (95.4%) | 40 (4.6%) |
| Manufacturing | 3,070 (74.8%) | 1,034 (25.2%) |
| Wholesale Trade | 255 (78.7%) | 69 (21.3%) |
| Retail Trade | 1,260 (55.4%) | 1,014 (44.6%) |
| Transportation & Warehousing | 763 (83.8%) | 148 (16.3%) |
| Utilities | 44 (64.7%) | 24 (35.3%) |
| Information | 97 (62.6%) | 58 (37.4%) |
| Finance & Insurance | 111 (17.1%) | 540 (83.0%) |
| Real Estate, Rental & Leasing | 58 (63.7%) | 33 (36.3%) |
| Professional & Scientific | 123 (38.9%) | 193 (61.1%) |
| Enterprise Management | 0 (0.0%) | 0 (0.0%) |
| Administrative & Support | 316 (67.4%) | 153 (32.6%) |
| Educational Services | 388 (28.3%) | 984 (71.7%) |
| Health Care & Social Assistance | 378 (15.8%) | 2,021 (84.2%) |
| Arts, Entertainment & Recreation | 29 (35.8%) | 52 (64.2%) |
| Accommodation & Food Services | 339 (38.3%) | 547 (61.7%) |
| Public Administration | 196 (50.0%) | 196 (50.0%) |
| Total | 8,984 (54.5%) | 7,484 (45.5%) |
Education in Wapello County
School Enrollment in Wapello County
The most common levels of schooling among the 8,161 students in Wapello County are middle school (1,925 | 23.6%), high school (1,907 | 23.4%), and elementary school (1,655 | 20.3%).
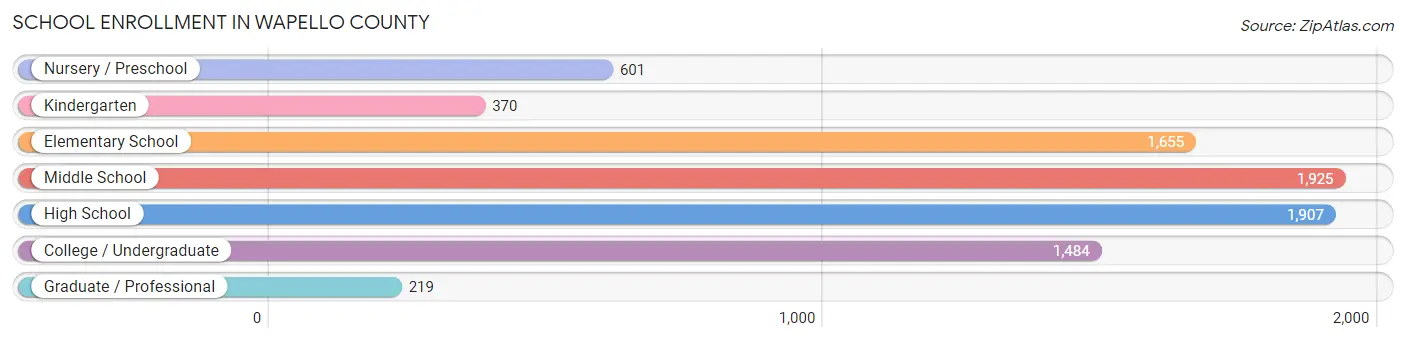
| School Level | # Students | % Students |
| Nursery / Preschool | 601 | 7.4% |
| Kindergarten | 370 | 4.5% |
| Elementary School | 1,655 | 20.3% |
| Middle School | 1,925 | 23.6% |
| High School | 1,907 | 23.4% |
| College / Undergraduate | 1,484 | 18.2% |
| Graduate / Professional | 219 | 2.7% |
| Total | 8,161 | 100.0% |
School Enrollment by Age by Funding Source in Wapello County
Out of a total of 8,161 students who are enrolled in schools in Wapello County, 718 (8.8%) attend a private institution, while the remaining 7,443 (91.2%) are enrolled in public schools. The age group of 35 years and over has the highest likelihood of being enrolled in private schools, with 156 (45.4% in the age bracket) enrolled. Conversely, the age group of 25 to 34 year olds has the lowest likelihood of being enrolled in a private school, with 429 (98.6% in the age bracket) attending a public institution.
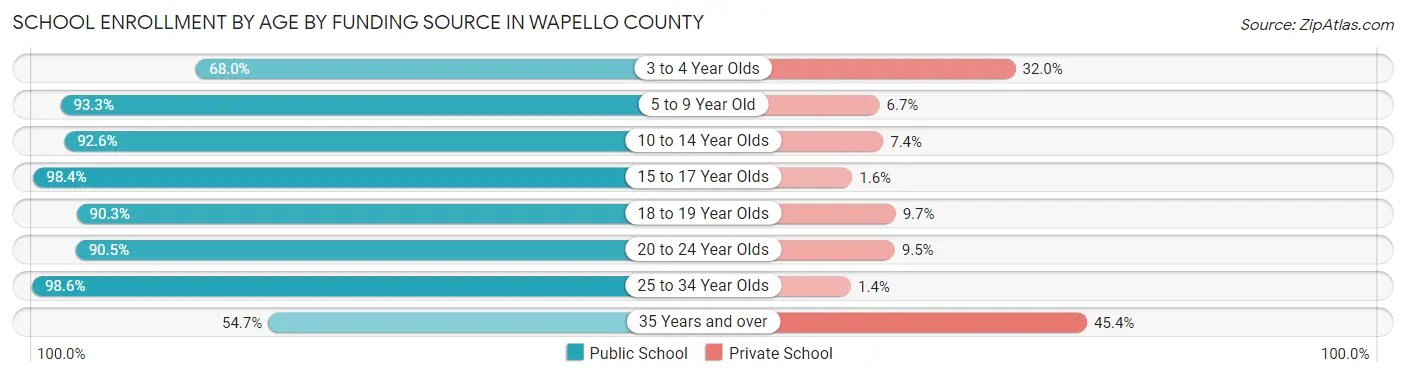
| Age Bracket | Public School | Private School |
| 3 to 4 Year Olds | 223 (68.0%) | 105 (32.0%) |
| 5 to 9 Year Old | 1,884 (93.3%) | 135 (6.7%) |
| 10 to 14 Year Olds | 2,310 (92.6%) | 184 (7.4%) |
| 15 to 17 Year Olds | 1,333 (98.4%) | 22 (1.6%) |
| 18 to 19 Year Olds | 531 (90.3%) | 57 (9.7%) |
| 20 to 24 Year Olds | 541 (90.5%) | 57 (9.5%) |
| 25 to 34 Year Olds | 429 (98.6%) | 6 (1.4%) |
| 35 Years and over | 188 (54.6%) | 156 (45.4%) |
| Total | 7,443 (91.2%) | 718 (8.8%) |
Educational Attainment by Field of Study in Wapello County
Education (1,060 | 21.4%), business (789 | 16.0%), science & technology (666 | 13.5%), psychology (428 | 8.7%), and liberal arts & history (360 | 7.3%) are the most common fields of study among 4,944 individuals in Wapello County who have obtained a bachelor's degree or higher.
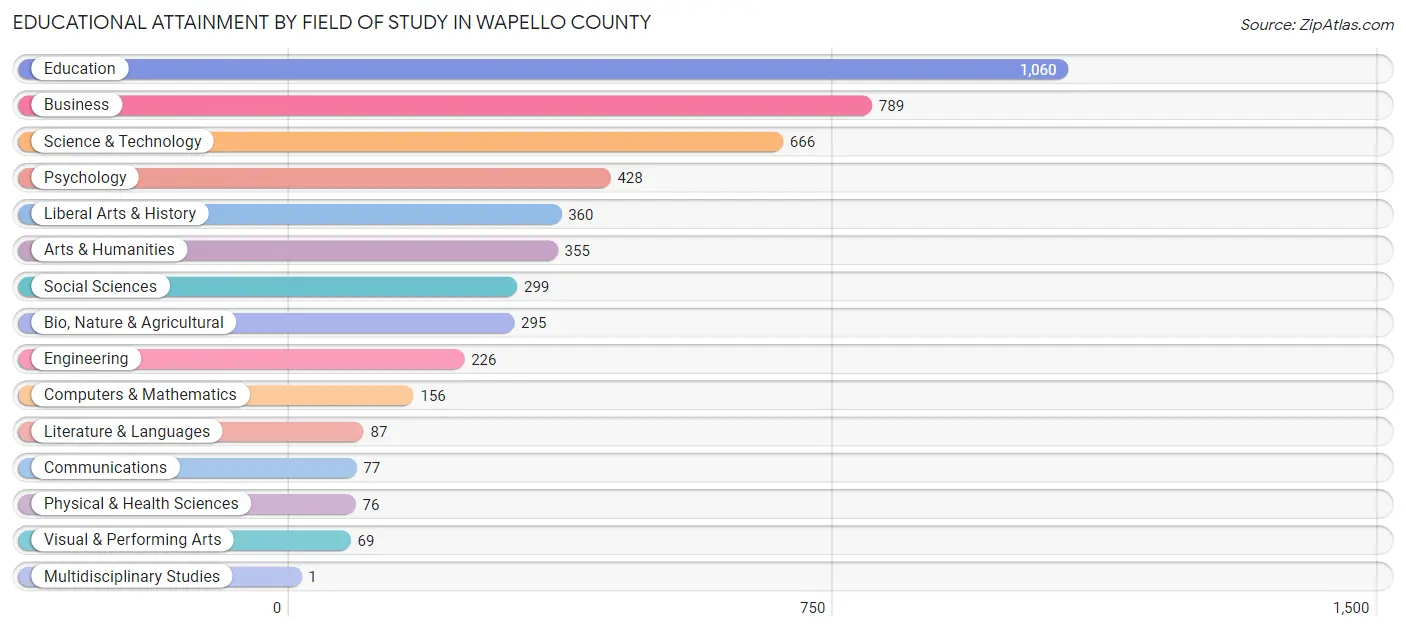
| Field of Study | # Graduates | % Graduates |
| Computers & Mathematics | 156 | 3.2% |
| Bio, Nature & Agricultural | 295 | 6.0% |
| Physical & Health Sciences | 76 | 1.5% |
| Psychology | 428 | 8.7% |
| Social Sciences | 299 | 6.0% |
| Engineering | 226 | 4.6% |
| Multidisciplinary Studies | 1 | 0.0% |
| Science & Technology | 666 | 13.5% |
| Business | 789 | 16.0% |
| Education | 1,060 | 21.4% |
| Literature & Languages | 87 | 1.8% |
| Liberal Arts & History | 360 | 7.3% |
| Visual & Performing Arts | 69 | 1.4% |
| Communications | 77 | 1.6% |
| Arts & Humanities | 355 | 7.2% |
| Total | 4,944 | 100.0% |
Transportation & Commute in Wapello County
Vehicle Availability by Sex in Wapello County
The most prevalent vehicle ownership categories in Wapello County are males with 2 vehicles (3,086, accounting for 35.5%) and females with 2 vehicles (2,626, making up 42.9%).
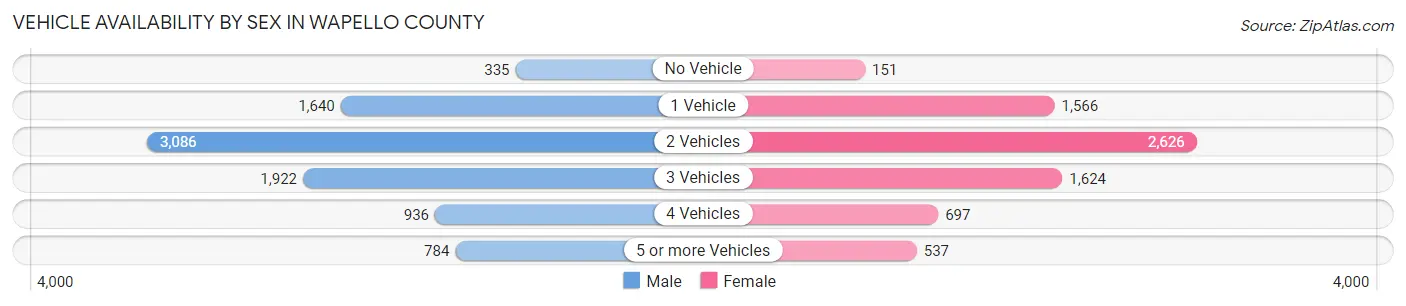
| Vehicles Available | Male | Female |
| No Vehicle | 335 (3.8%) | 151 (2.1%) |
| 1 Vehicle | 1,640 (18.8%) | 1,566 (21.7%) |
| 2 Vehicles | 3,086 (35.5%) | 2,626 (36.5%) |
| 3 Vehicles | 1,922 (22.1%) | 1,624 (22.6%) |
| 4 Vehicles | 936 (10.7%) | 697 (9.7%) |
| 5 or more Vehicles | 784 (9.0%) | 537 (7.5%) |
| Total | 8,703 (100.0%) | 7,201 (100.0%) |
Commute Time in Wapello County
The most frequently occuring commute durations in Wapello County are 5 to 9 minutes (3,353 commuters, 21.8%), 10 to 14 minutes (3,219 commuters, 20.9%), and 15 to 19 minutes (2,787 commuters, 18.1%).
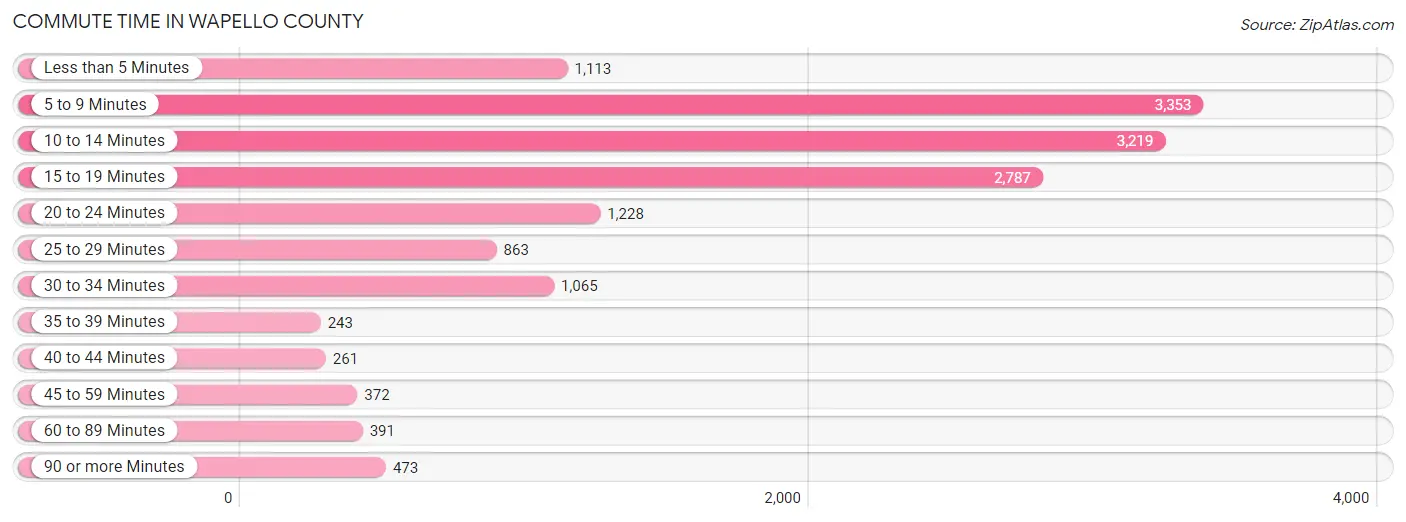
| Commute Time | # Commuters | % Commuters |
| Less than 5 Minutes | 1,113 | 7.2% |
| 5 to 9 Minutes | 3,353 | 21.8% |
| 10 to 14 Minutes | 3,219 | 20.9% |
| 15 to 19 Minutes | 2,787 | 18.1% |
| 20 to 24 Minutes | 1,228 | 8.0% |
| 25 to 29 Minutes | 863 | 5.6% |
| 30 to 34 Minutes | 1,065 | 6.9% |
| 35 to 39 Minutes | 243 | 1.6% |
| 40 to 44 Minutes | 261 | 1.7% |
| 45 to 59 Minutes | 372 | 2.4% |
| 60 to 89 Minutes | 391 | 2.5% |
| 90 or more Minutes | 473 | 3.1% |
Commute Time by Sex in Wapello County
The most common commute times in Wapello County are 5 to 9 minutes (1,759 commuters, 20.8%) for males and 10 to 14 minutes (1,666 commuters, 24.2%) for females.
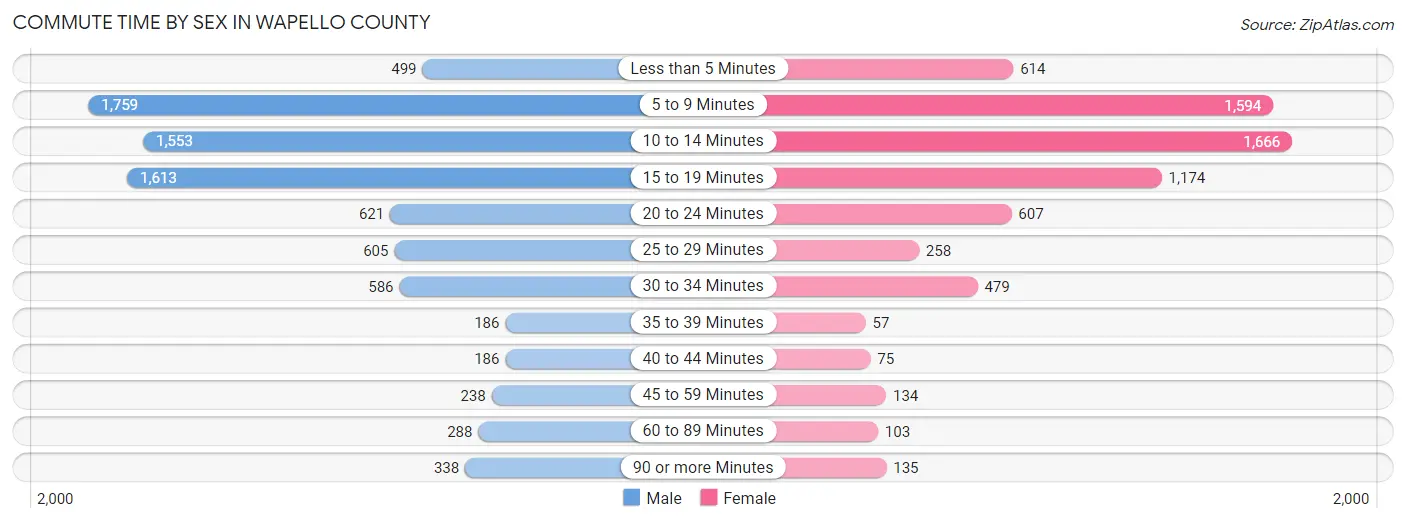
| Commute Time | Male | Female |
| Less than 5 Minutes | 499 (5.9%) | 614 (8.9%) |
| 5 to 9 Minutes | 1,759 (20.8%) | 1,594 (23.1%) |
| 10 to 14 Minutes | 1,553 (18.3%) | 1,666 (24.2%) |
| 15 to 19 Minutes | 1,613 (19.0%) | 1,174 (17.0%) |
| 20 to 24 Minutes | 621 (7.3%) | 607 (8.8%) |
| 25 to 29 Minutes | 605 (7.1%) | 258 (3.7%) |
| 30 to 34 Minutes | 586 (6.9%) | 479 (7.0%) |
| 35 to 39 Minutes | 186 (2.2%) | 57 (0.8%) |
| 40 to 44 Minutes | 186 (2.2%) | 75 (1.1%) |
| 45 to 59 Minutes | 238 (2.8%) | 134 (1.9%) |
| 60 to 89 Minutes | 288 (3.4%) | 103 (1.5%) |
| 90 or more Minutes | 338 (4.0%) | 135 (2.0%) |
Time of Departure to Work by Sex in Wapello County
The most frequent times of departure to work in Wapello County are 12:00 PM to 3:59 PM (1,292, 15.2%) for males and 7:30 AM to 7:59 AM (1,181, 17.1%) for females.
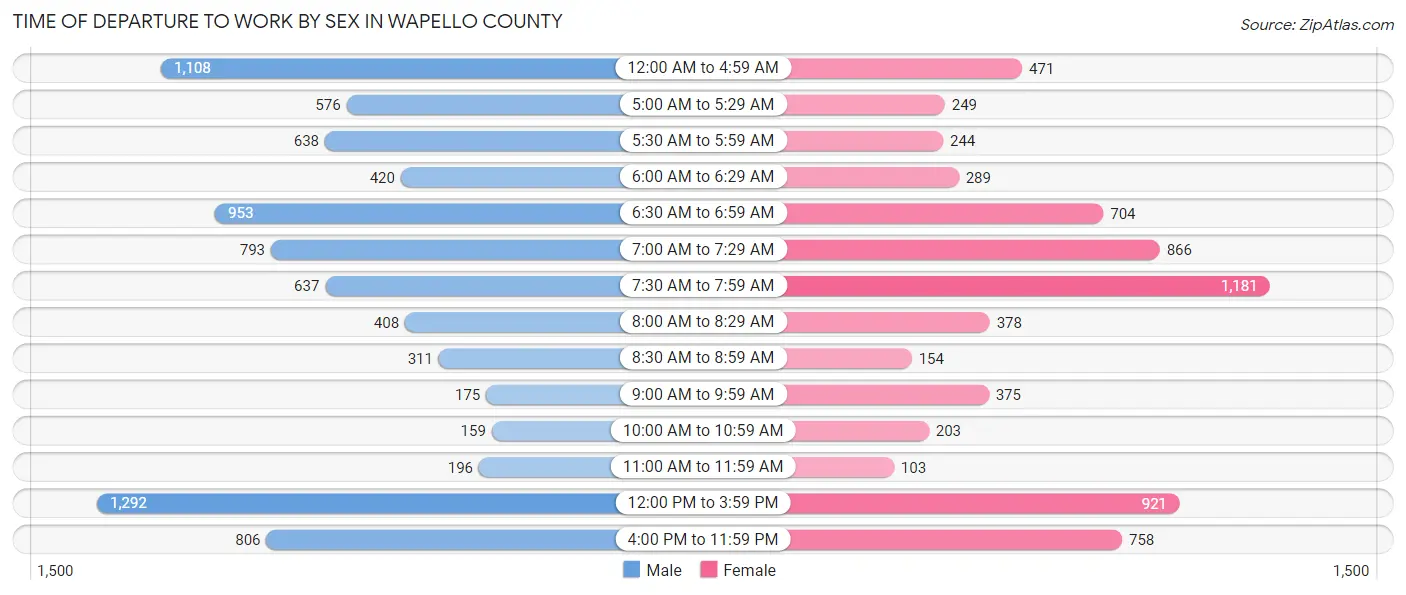
| Time of Departure | Male | Female |
| 12:00 AM to 4:59 AM | 1,108 (13.1%) | 471 (6.8%) |
| 5:00 AM to 5:29 AM | 576 (6.8%) | 249 (3.6%) |
| 5:30 AM to 5:59 AM | 638 (7.5%) | 244 (3.5%) |
| 6:00 AM to 6:29 AM | 420 (5.0%) | 289 (4.2%) |
| 6:30 AM to 6:59 AM | 953 (11.3%) | 704 (10.2%) |
| 7:00 AM to 7:29 AM | 793 (9.4%) | 866 (12.6%) |
| 7:30 AM to 7:59 AM | 637 (7.5%) | 1,181 (17.1%) |
| 8:00 AM to 8:29 AM | 408 (4.8%) | 378 (5.5%) |
| 8:30 AM to 8:59 AM | 311 (3.7%) | 154 (2.2%) |
| 9:00 AM to 9:59 AM | 175 (2.1%) | 375 (5.4%) |
| 10:00 AM to 10:59 AM | 159 (1.9%) | 203 (2.9%) |
| 11:00 AM to 11:59 AM | 196 (2.3%) | 103 (1.5%) |
| 12:00 PM to 3:59 PM | 1,292 (15.2%) | 921 (13.4%) |
| 4:00 PM to 11:59 PM | 806 (9.5%) | 758 (11.0%) |
| Total | 8,472 (100.0%) | 6,896 (100.0%) |
Housing Occupancy in Wapello County
Occupancy by Ownership in Wapello County
Of the total 14,193 dwellings in Wapello County, owner-occupied units account for 9,413 (66.3%), while renter-occupied units make up 4,780 (33.7%).
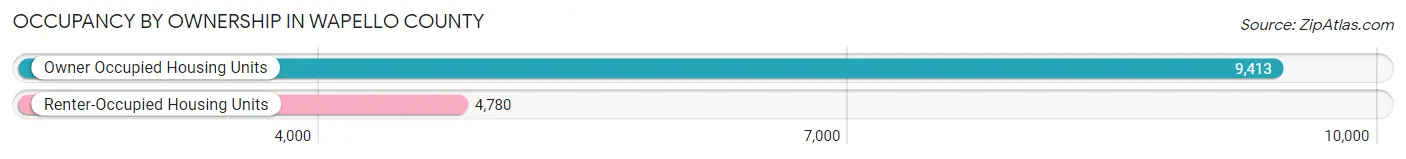
| Occupancy | # Housing Units | % Housing Units |
| Owner Occupied Housing Units | 9,413 | 66.3% |
| Renter-Occupied Housing Units | 4,780 | 33.7% |
| Total Occupied Housing Units | 14,193 | 100.0% |
Occupancy by Household Size in Wapello County
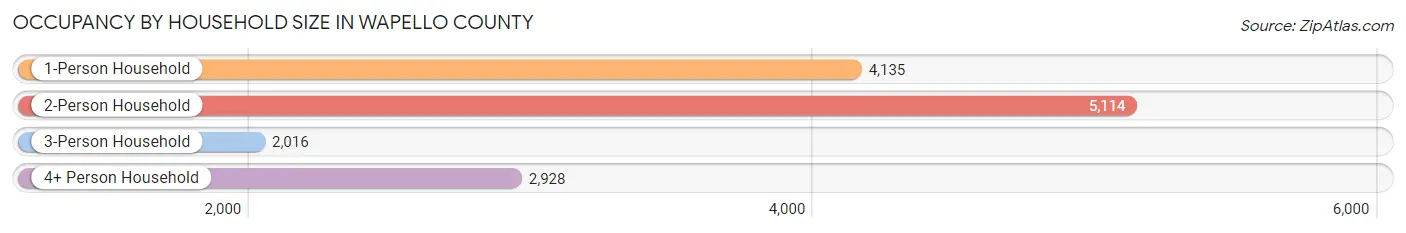
| Household Size | # Housing Units | % Housing Units |
| 1-Person Household | 4,135 | 29.1% |
| 2-Person Household | 5,114 | 36.0% |
| 3-Person Household | 2,016 | 14.2% |
| 4+ Person Household | 2,928 | 20.6% |
| Total Housing Units | 14,193 | 100.0% |
Occupancy by Ownership by Household Size in Wapello County
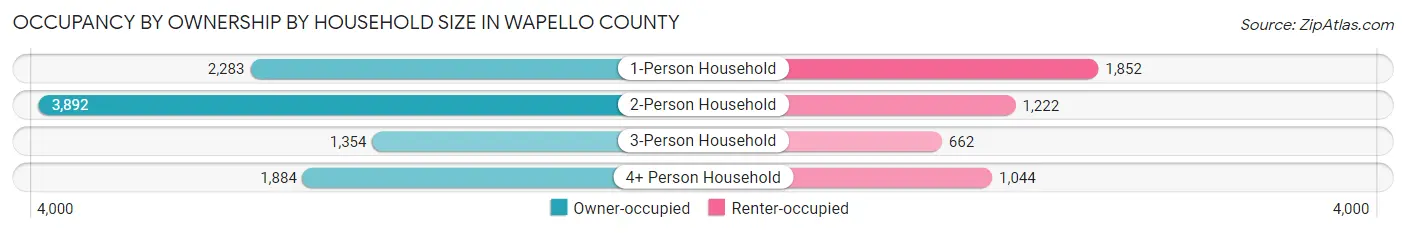
| Household Size | Owner-occupied | Renter-occupied |
| 1-Person Household | 2,283 (55.2%) | 1,852 (44.8%) |
| 2-Person Household | 3,892 (76.1%) | 1,222 (23.9%) |
| 3-Person Household | 1,354 (67.2%) | 662 (32.8%) |
| 4+ Person Household | 1,884 (64.3%) | 1,044 (35.7%) |
| Total Housing Units | 9,413 (66.3%) | 4,780 (33.7%) |
Occupancy by Educational Attainment in Wapello County
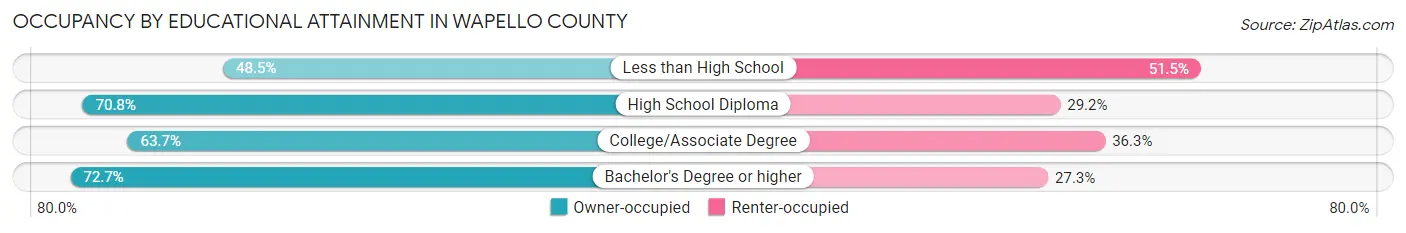
| Household Size | Owner-occupied | Renter-occupied |
| Less than High School | 734 (48.5%) | 779 (51.5%) |
| High School Diploma | 3,461 (70.8%) | 1,428 (29.2%) |
| College/Associate Degree | 3,151 (63.7%) | 1,798 (36.3%) |
| Bachelor's Degree or higher | 2,067 (72.7%) | 775 (27.3%) |
Occupancy by Age of Householder in Wapello County
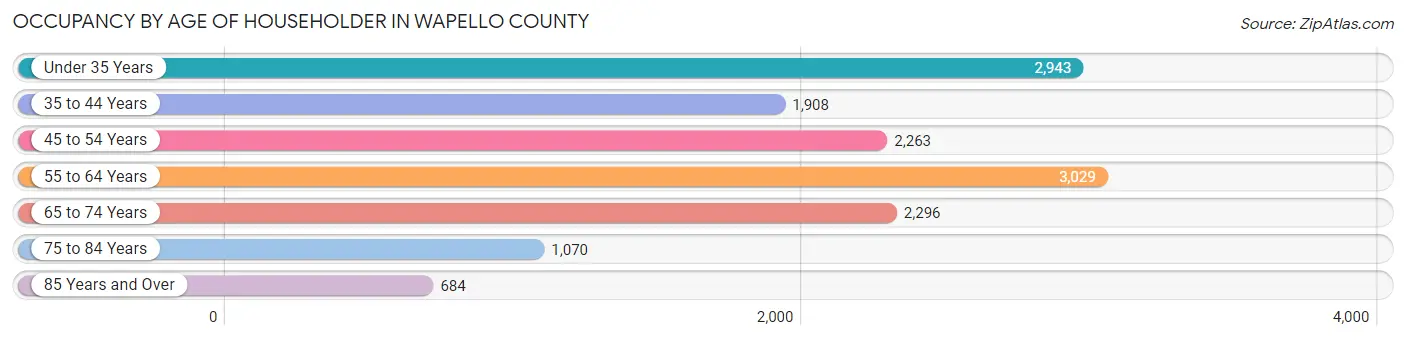
| Age Bracket | # Households | % Households |
| Under 35 Years | 2,943 | 20.7% |
| 35 to 44 Years | 1,908 | 13.4% |
| 45 to 54 Years | 2,263 | 15.9% |
| 55 to 64 Years | 3,029 | 21.3% |
| 65 to 74 Years | 2,296 | 16.2% |
| 75 to 84 Years | 1,070 | 7.5% |
| 85 Years and Over | 684 | 4.8% |
| Total | 14,193 | 100.0% |
Housing Finances in Wapello County
Median Income by Occupancy in Wapello County
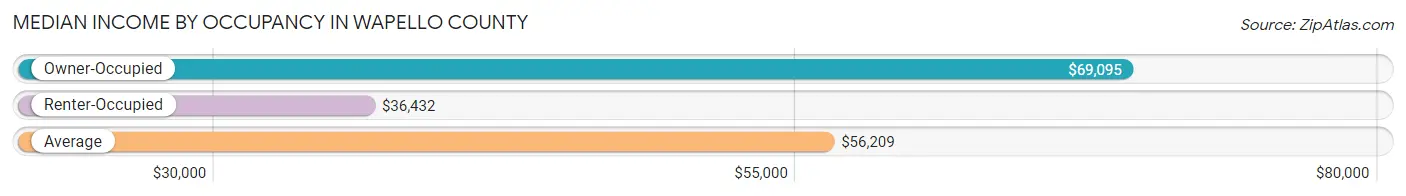
| Occupancy Type | # Households | Median Income |
| Owner-Occupied | 9,413 (66.3%) | $69,095 |
| Renter-Occupied | 4,780 (33.7%) | $36,432 |
| Average | 14,193 (100.0%) | $56,209 |
Occupancy by Householder Income Bracket in Wapello County
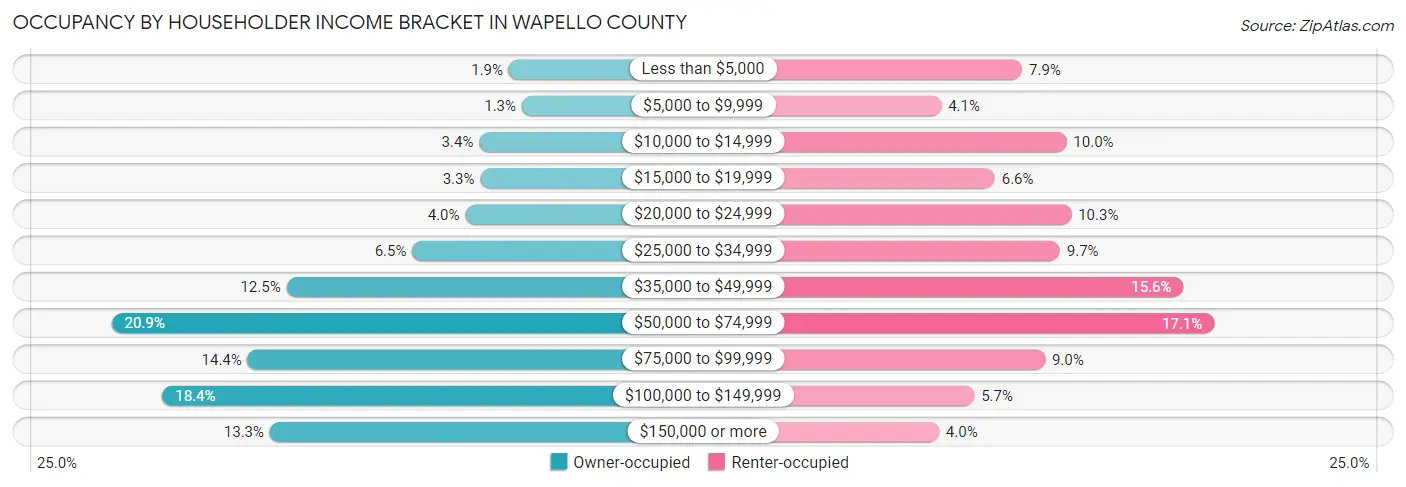
| Income Bracket | Owner-occupied | Renter-occupied |
| Less than $5,000 | 183 (1.9%) | 379 (7.9%) |
| $5,000 to $9,999 | 124 (1.3%) | 195 (4.1%) |
| $10,000 to $14,999 | 315 (3.4%) | 480 (10.0%) |
| $15,000 to $19,999 | 311 (3.3%) | 317 (6.6%) |
| $20,000 to $24,999 | 377 (4.0%) | 491 (10.3%) |
| $25,000 to $34,999 | 616 (6.5%) | 465 (9.7%) |
| $35,000 to $49,999 | 1,179 (12.5%) | 746 (15.6%) |
| $50,000 to $74,999 | 1,964 (20.9%) | 816 (17.1%) |
| $75,000 to $99,999 | 1,354 (14.4%) | 431 (9.0%) |
| $100,000 to $149,999 | 1,736 (18.4%) | 270 (5.7%) |
| $150,000 or more | 1,254 (13.3%) | 190 (4.0%) |
| Total | 9,413 (100.0%) | 4,780 (100.0%) |
Monthly Housing Cost Tiers in Wapello County
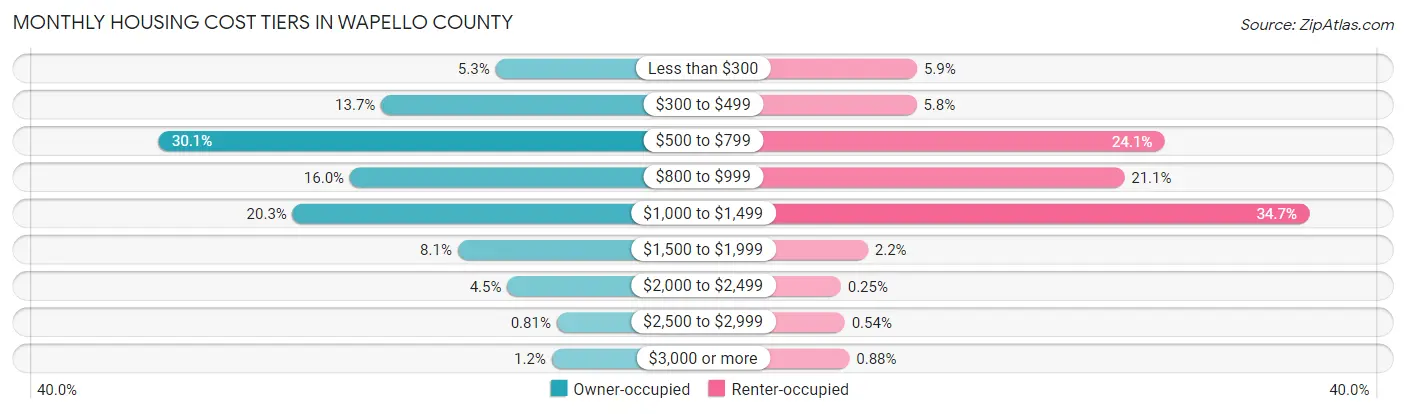
| Monthly Cost | Owner-occupied | Renter-occupied |
| Less than $300 | 501 (5.3%) | 280 (5.9%) |
| $300 to $499 | 1,293 (13.7%) | 278 (5.8%) |
| $500 to $799 | 2,834 (30.1%) | 1,150 (24.1%) |
| $800 to $999 | 1,510 (16.0%) | 1,010 (21.1%) |
| $1,000 to $1,499 | 1,907 (20.3%) | 1,659 (34.7%) |
| $1,500 to $1,999 | 762 (8.1%) | 107 (2.2%) |
| $2,000 to $2,499 | 419 (4.4%) | 12 (0.3%) |
| $2,500 to $2,999 | 76 (0.8%) | 26 (0.5%) |
| $3,000 or more | 111 (1.2%) | 42 (0.9%) |
| Total | 9,413 (100.0%) | 4,780 (100.0%) |
Physical Housing Characteristics in Wapello County
Housing Structures in Wapello County
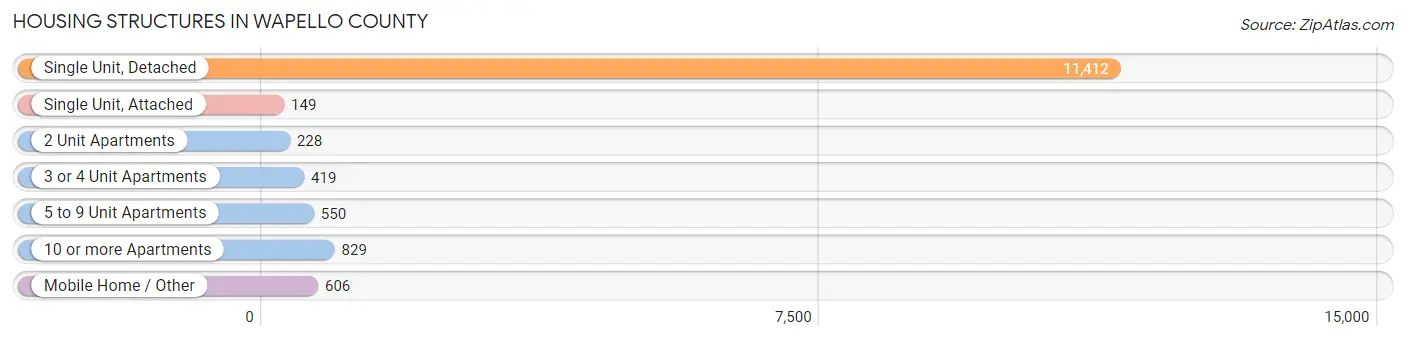
| Structure Type | # Housing Units | % Housing Units |
| Single Unit, Detached | 11,412 | 80.4% |
| Single Unit, Attached | 149 | 1.1% |
| 2 Unit Apartments | 228 | 1.6% |
| 3 or 4 Unit Apartments | 419 | 2.9% |
| 5 to 9 Unit Apartments | 550 | 3.9% |
| 10 or more Apartments | 829 | 5.8% |
| Mobile Home / Other | 606 | 4.3% |
| Total | 14,193 | 100.0% |
Housing Structures by Occupancy in Wapello County
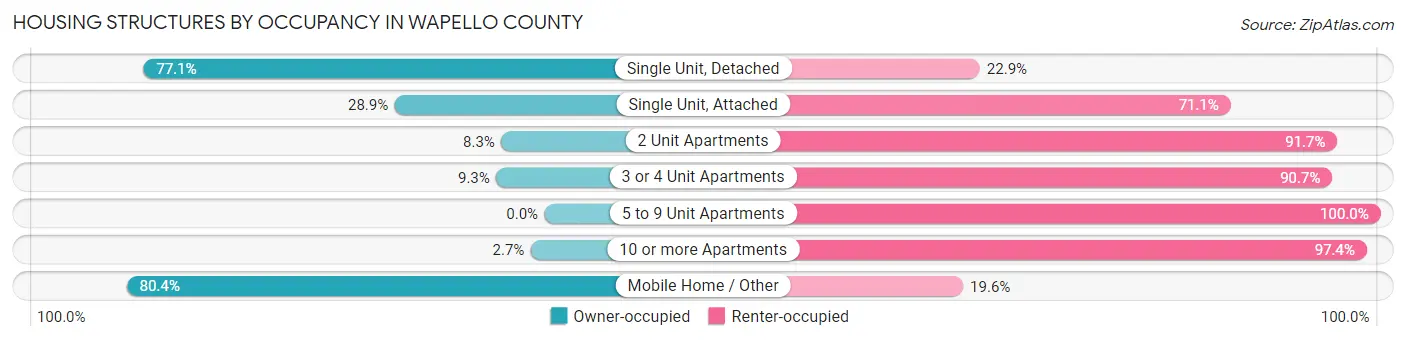
| Structure Type | Owner-occupied | Renter-occupied |
| Single Unit, Detached | 8,803 (77.1%) | 2,609 (22.9%) |
| Single Unit, Attached | 43 (28.9%) | 106 (71.1%) |
| 2 Unit Apartments | 19 (8.3%) | 209 (91.7%) |
| 3 or 4 Unit Apartments | 39 (9.3%) | 380 (90.7%) |
| 5 to 9 Unit Apartments | 0 (0.0%) | 550 (100.0%) |
| 10 or more Apartments | 22 (2.6%) | 807 (97.4%) |
| Mobile Home / Other | 487 (80.4%) | 119 (19.6%) |
| Total | 9,413 (66.3%) | 4,780 (33.7%) |
Housing Structures by Number of Rooms in Wapello County
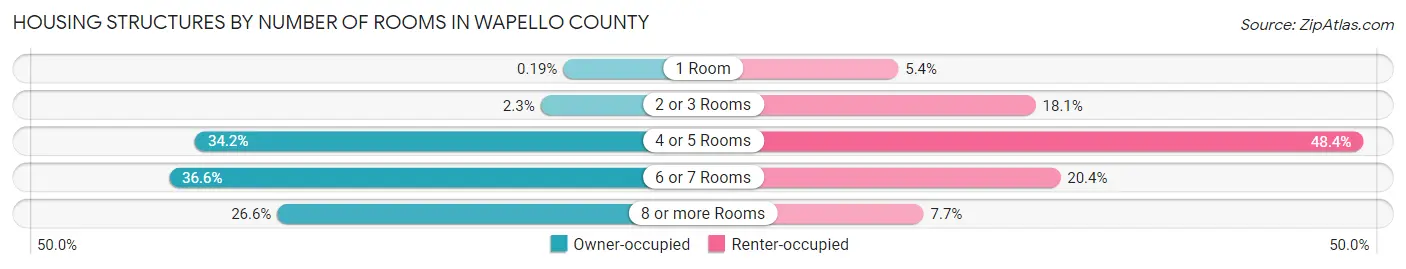
| Number of Rooms | Owner-occupied | Renter-occupied |
| 1 Room | 18 (0.2%) | 258 (5.4%) |
| 2 or 3 Rooms | 216 (2.3%) | 865 (18.1%) |
| 4 or 5 Rooms | 3,222 (34.2%) | 2,313 (48.4%) |
| 6 or 7 Rooms | 3,449 (36.6%) | 974 (20.4%) |
| 8 or more Rooms | 2,508 (26.6%) | 370 (7.7%) |
| Total | 9,413 (100.0%) | 4,780 (100.0%) |
Housing Structure by Heating Type in Wapello County
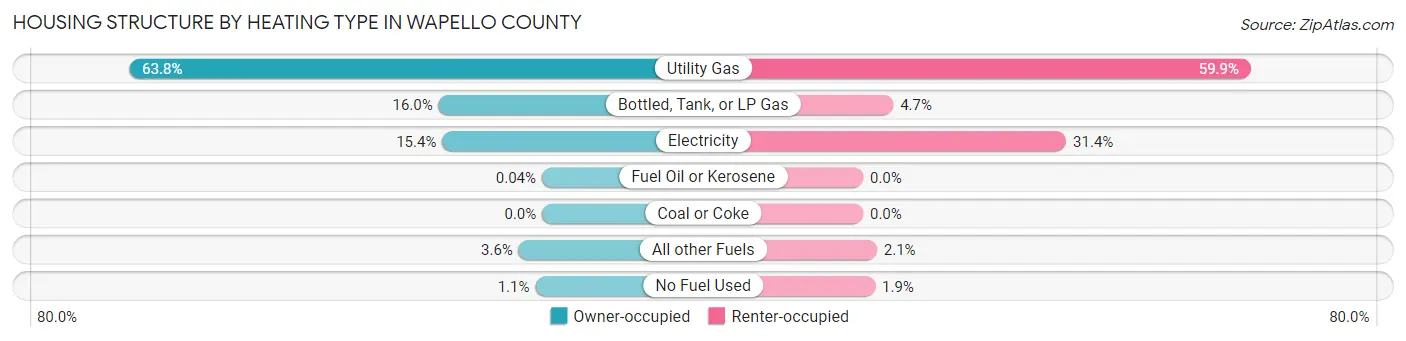
| Heating Type | Owner-occupied | Renter-occupied |
| Utility Gas | 6,009 (63.8%) | 2,865 (59.9%) |
| Bottled, Tank, or LP Gas | 1,507 (16.0%) | 223 (4.7%) |
| Electricity | 1,453 (15.4%) | 1,501 (31.4%) |
| Fuel Oil or Kerosene | 4 (0.0%) | 0 (0.0%) |
| Coal or Coke | 0 (0.0%) | 0 (0.0%) |
| All other Fuels | 341 (3.6%) | 102 (2.1%) |
| No Fuel Used | 99 (1.1%) | 89 (1.9%) |
| Total | 9,413 (100.0%) | 4,780 (100.0%) |
Household Vehicle Usage in Wapello County
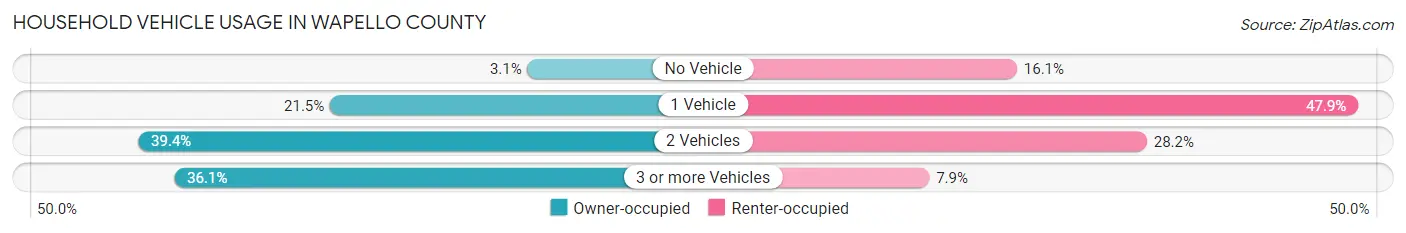
| Vehicles per Household | Owner-occupied | Renter-occupied |
| No Vehicle | 287 (3.0%) | 767 (16.1%) |
| 1 Vehicle | 2,022 (21.5%) | 2,290 (47.9%) |
| 2 Vehicles | 3,711 (39.4%) | 1,347 (28.2%) |
| 3 or more Vehicles | 3,393 (36.0%) | 376 (7.9%) |
| Total | 9,413 (100.0%) | 4,780 (100.0%) |
Real Estate & Mortgages in Wapello County
Real Estate and Mortgage Overview in Wapello County
| Characteristic | Without Mortgage | With Mortgage |
| Housing Units | 4,608 | 4,805 |
| Median Property Value | $99,700 | $112,600 |
| Median Household Income | $56,678 | $795 |
| Monthly Housing Costs | $561 | $111 |
| Real Estate Taxes | $1,863 | $74 |
Property Value by Mortgage Status in Wapello County
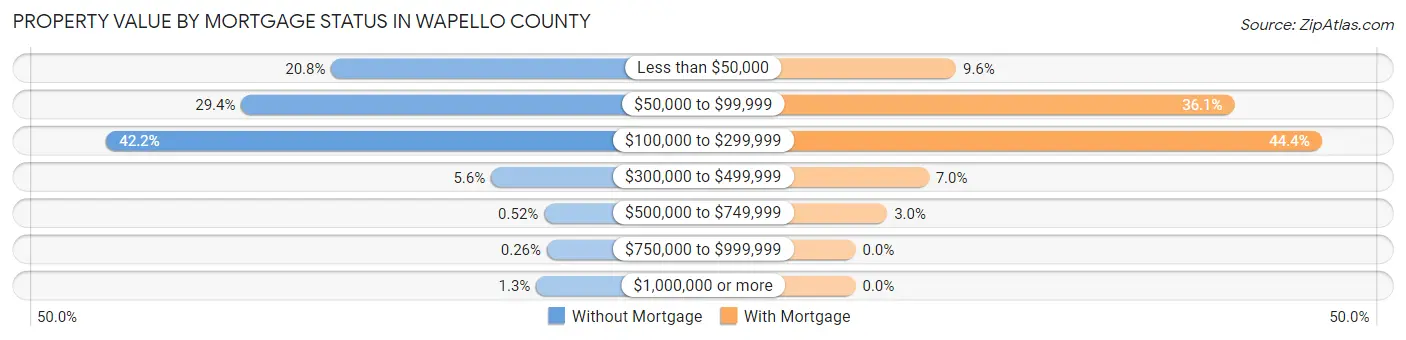
| Property Value | Without Mortgage | With Mortgage |
| Less than $50,000 | 958 (20.8%) | 460 (9.6%) |
| $50,000 to $99,999 | 1,353 (29.4%) | 1,733 (36.1%) |
| $100,000 to $299,999 | 1,945 (42.2%) | 2,132 (44.4%) |
| $300,000 to $499,999 | 257 (5.6%) | 335 (7.0%) |
| $500,000 to $749,999 | 24 (0.5%) | 145 (3.0%) |
| $750,000 to $999,999 | 12 (0.3%) | 0 (0.0%) |
| $1,000,000 or more | 59 (1.3%) | 0 (0.0%) |
| Total | 4,608 (100.0%) | 4,805 (100.0%) |
Household Income by Mortgage Status in Wapello County
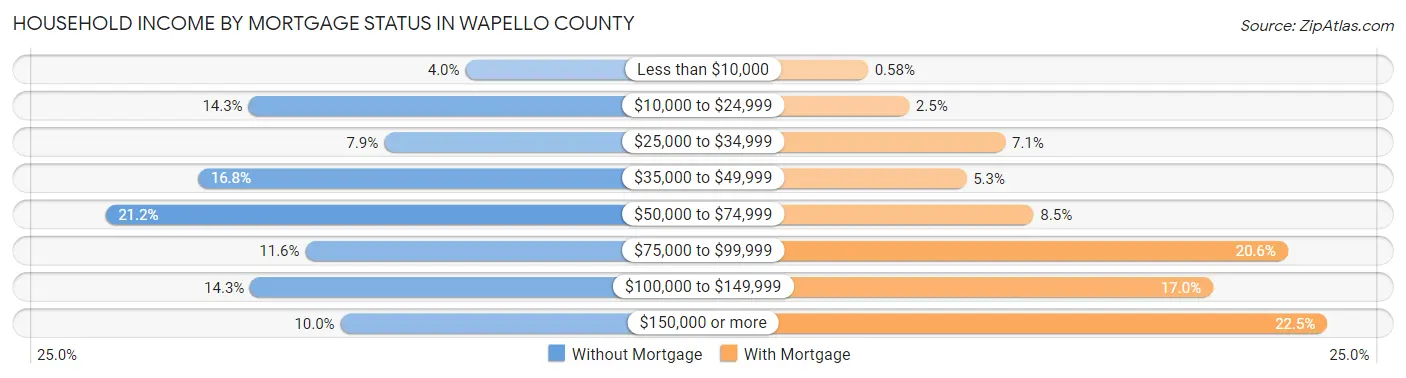
| Household Income | Without Mortgage | With Mortgage |
| Less than $10,000 | 185 (4.0%) | 28 (0.6%) |
| $10,000 to $24,999 | 661 (14.3%) | 122 (2.5%) |
| $25,000 to $34,999 | 363 (7.9%) | 342 (7.1%) |
| $35,000 to $49,999 | 772 (16.8%) | 253 (5.3%) |
| $50,000 to $74,999 | 975 (21.2%) | 407 (8.5%) |
| $75,000 to $99,999 | 536 (11.6%) | 989 (20.6%) |
| $100,000 to $149,999 | 657 (14.3%) | 818 (17.0%) |
| $150,000 or more | 459 (10.0%) | 1,079 (22.5%) |
| Total | 4,608 (100.0%) | 4,805 (100.0%) |
Property Value to Household Income Ratio in Wapello County
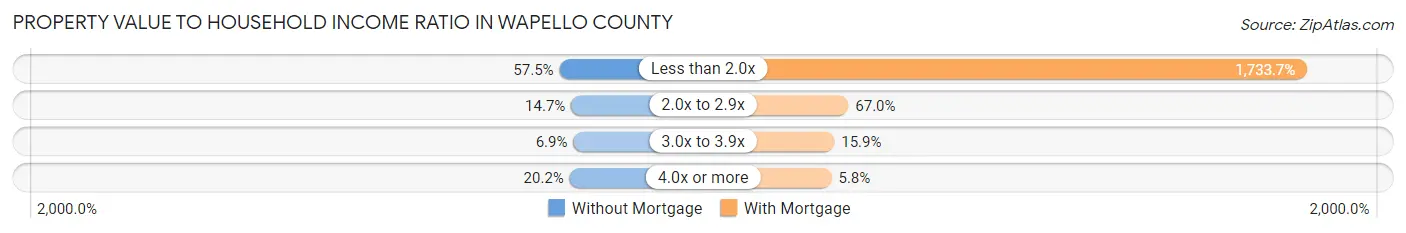
| Value-to-Income Ratio | Without Mortgage | With Mortgage |
| Less than 2.0x | 2,649 (57.5%) | 83,304 (1,733.7%) |
| 2.0x to 2.9x | 677 (14.7%) | 3,219 (67.0%) |
| 3.0x to 3.9x | 319 (6.9%) | 766 (15.9%) |
| 4.0x or more | 932 (20.2%) | 279 (5.8%) |
| Total | 4,608 (100.0%) | 4,805 (100.0%) |
Real Estate Taxes by Mortgage Status in Wapello County
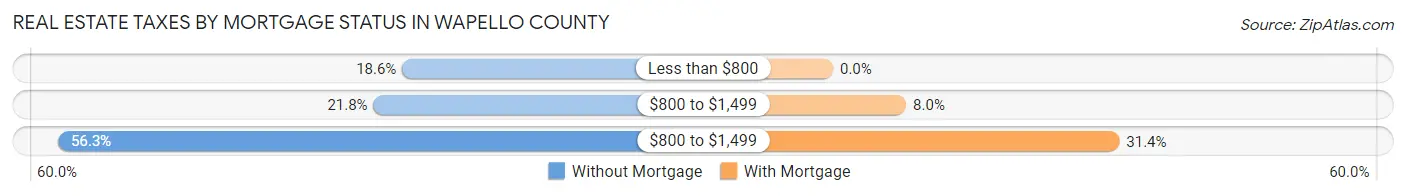
| Property Taxes | Without Mortgage | With Mortgage |
| Less than $800 | 858 (18.6%) | 0 (0.0%) |
| $800 to $1,499 | 1,003 (21.8%) | 385 (8.0%) |
| $800 to $1,499 | 2,596 (56.3%) | 1,508 (31.4%) |
| Total | 4,608 (100.0%) | 4,805 (100.0%) |
Health & Disability in Wapello County
Health Insurance Coverage by Age in Wapello County
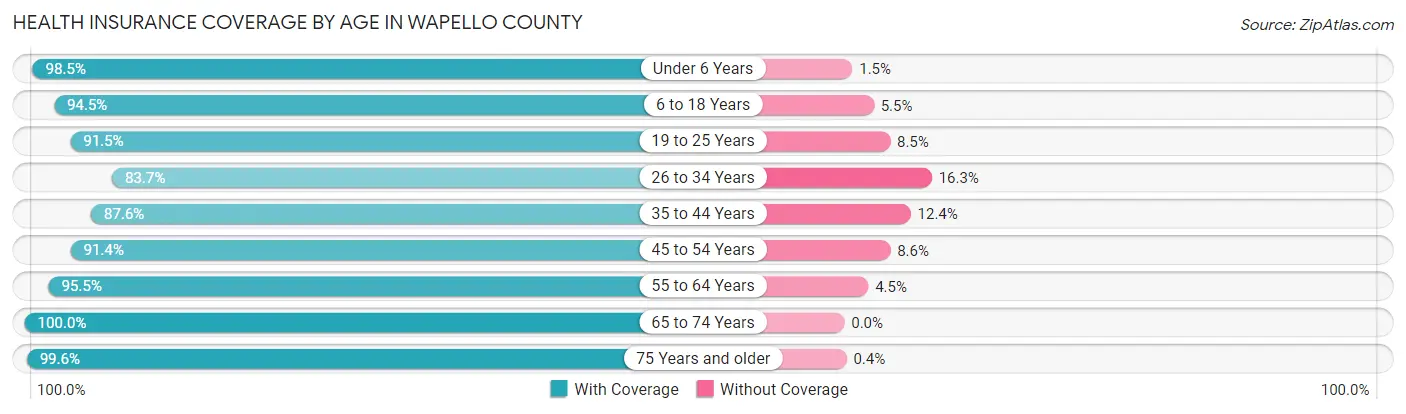
| Age Bracket | With Coverage | Without Coverage |
| Under 6 Years | 2,638 (98.5%) | 40 (1.5%) |
| 6 to 18 Years | 5,757 (94.5%) | 334 (5.5%) |
| 19 to 25 Years | 2,594 (91.5%) | 242 (8.5%) |
| 26 to 34 Years | 3,409 (83.7%) | 664 (16.3%) |
| 35 to 44 Years | 3,535 (87.6%) | 499 (12.4%) |
| 45 to 54 Years | 3,978 (91.4%) | 373 (8.6%) |
| 55 to 64 Years | 4,520 (95.5%) | 211 (4.5%) |
| 65 to 74 Years | 3,601 (100.0%) | 0 (0.0%) |
| 75 Years and older | 2,490 (99.6%) | 10 (0.4%) |
| Total | 32,522 (93.2%) | 2,373 (6.8%) |
Health Insurance Coverage by Citizenship Status in Wapello County
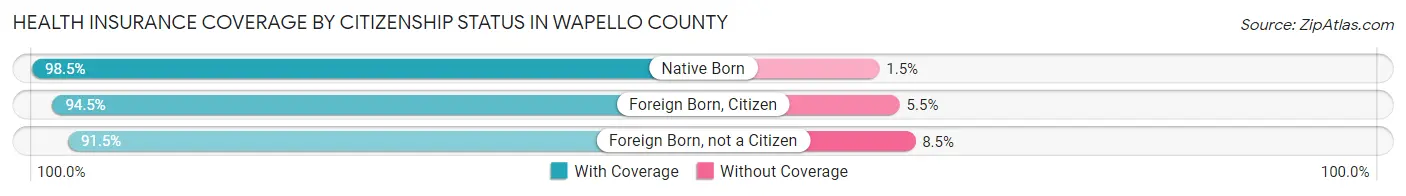
| Citizenship Status | With Coverage | Without Coverage |
| Native Born | 2,638 (98.5%) | 40 (1.5%) |
| Foreign Born, Citizen | 5,757 (94.5%) | 334 (5.5%) |
| Foreign Born, not a Citizen | 2,594 (91.5%) | 242 (8.5%) |
Health Insurance Coverage by Household Income in Wapello County
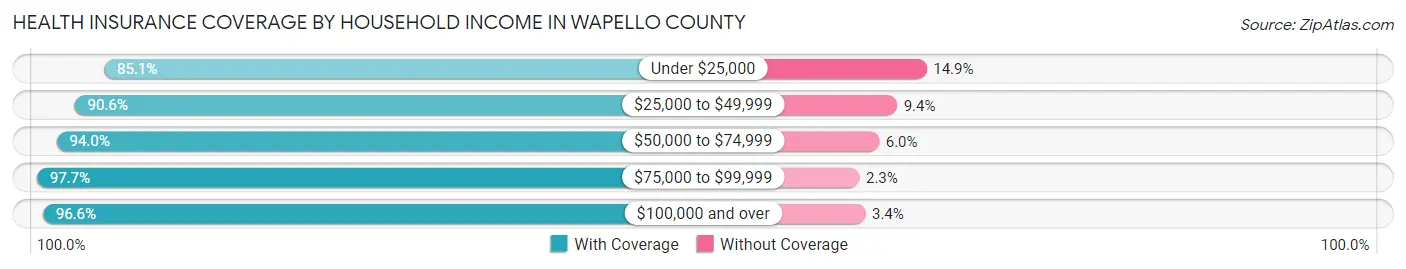
| Household Income | With Coverage | Without Coverage |
| Under $25,000 | 5,171 (85.1%) | 905 (14.9%) |
| $25,000 to $49,999 | 5,596 (90.6%) | 578 (9.4%) |
| $50,000 to $74,999 | 6,493 (94.0%) | 414 (6.0%) |
| $75,000 to $99,999 | 4,517 (97.7%) | 106 (2.3%) |
| $100,000 and over | 10,307 (96.6%) | 365 (3.4%) |
Public vs Private Health Insurance Coverage by Age in Wapello County
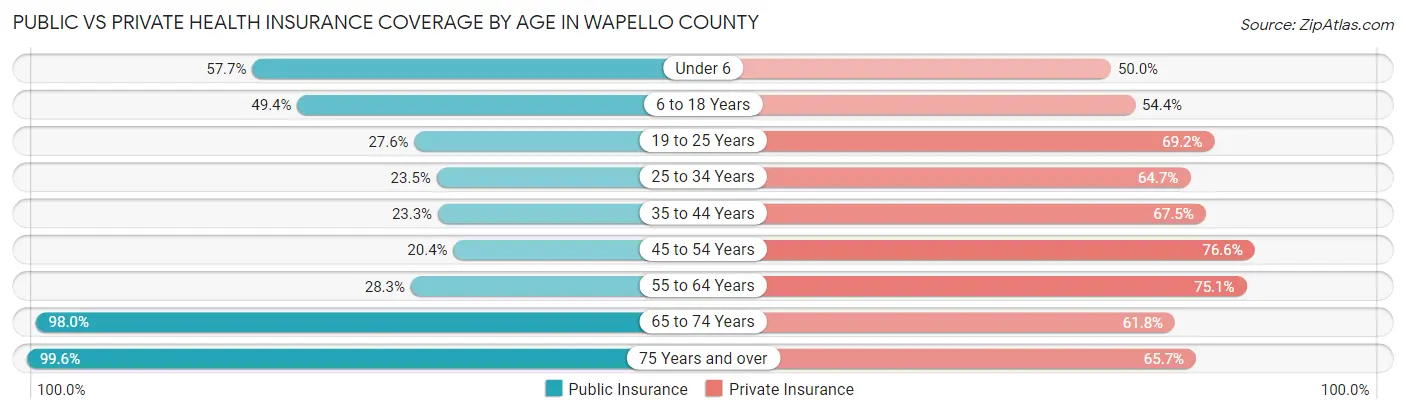
| Age Bracket | Public Insurance | Private Insurance |
| Under 6 | 1,546 (57.7%) | 1,338 (50.0%) |
| 6 to 18 Years | 3,007 (49.4%) | 3,314 (54.4%) |
| 19 to 25 Years | 784 (27.6%) | 1,961 (69.2%) |
| 25 to 34 Years | 958 (23.5%) | 2,633 (64.6%) |
| 35 to 44 Years | 939 (23.3%) | 2,724 (67.5%) |
| 45 to 54 Years | 888 (20.4%) | 3,333 (76.6%) |
| 55 to 64 Years | 1,340 (28.3%) | 3,552 (75.1%) |
| 65 to 74 Years | 3,527 (98.0%) | 2,226 (61.8%) |
| 75 Years and over | 2,490 (99.6%) | 1,643 (65.7%) |
| Total | 15,479 (44.4%) | 22,724 (65.1%) |
Disability Status by Sex by Age in Wapello County
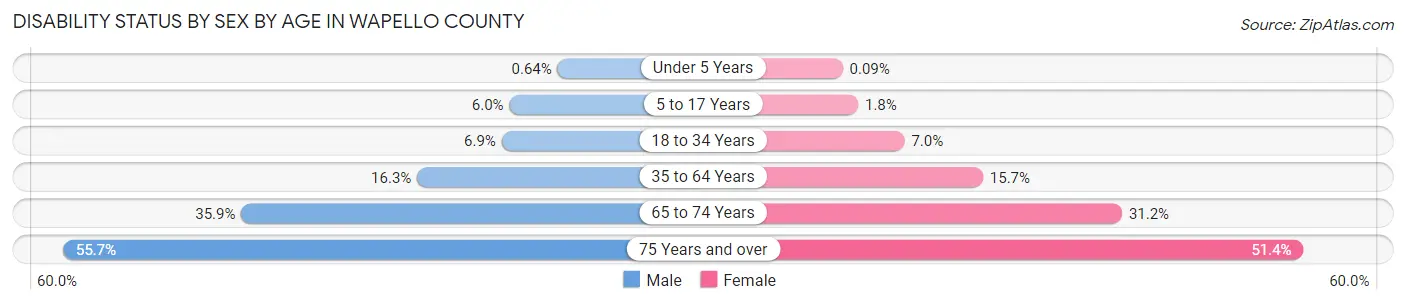
| Age Bracket | Male | Female |
| Under 5 Years | 7 (0.6%) | 1 (0.1%) |
| 5 to 17 Years | 191 (6.0%) | 52 (1.8%) |
| 18 to 34 Years | 265 (6.9%) | 250 (7.0%) |
| 35 to 64 Years | 1,075 (16.3%) | 1,023 (15.7%) |
| 65 to 74 Years | 641 (35.9%) | 566 (31.2%) |
| 75 Years and over | 563 (55.7%) | 766 (51.4%) |
Disability Class by Sex by Age in Wapello County
Disability Class: Hearing Difficulty
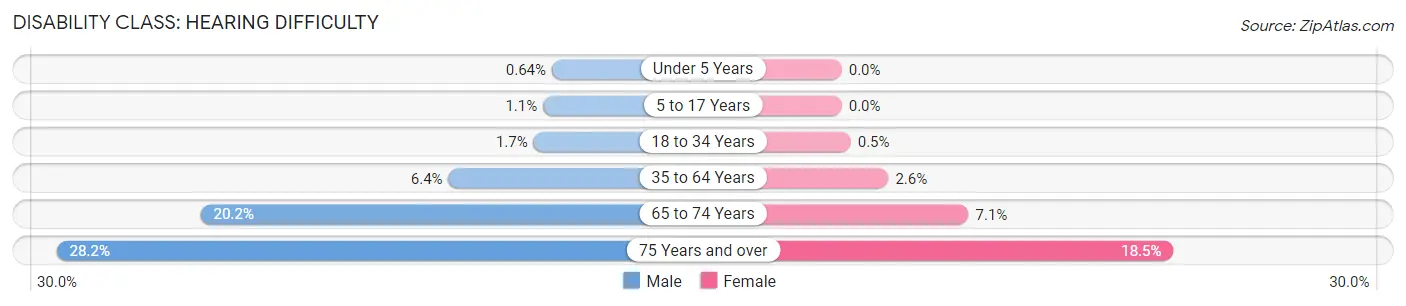
| Age Bracket | Male | Female |
| Under 5 Years | 7 (0.6%) | 0 (0.0%) |
| 5 to 17 Years | 36 (1.1%) | 0 (0.0%) |
| 18 to 34 Years | 64 (1.7%) | 18 (0.5%) |
| 35 to 64 Years | 423 (6.4%) | 169 (2.6%) |
| 65 to 74 Years | 361 (20.2%) | 128 (7.1%) |
| 75 Years and over | 285 (28.2%) | 275 (18.5%) |
Disability Class: Vision Difficulty
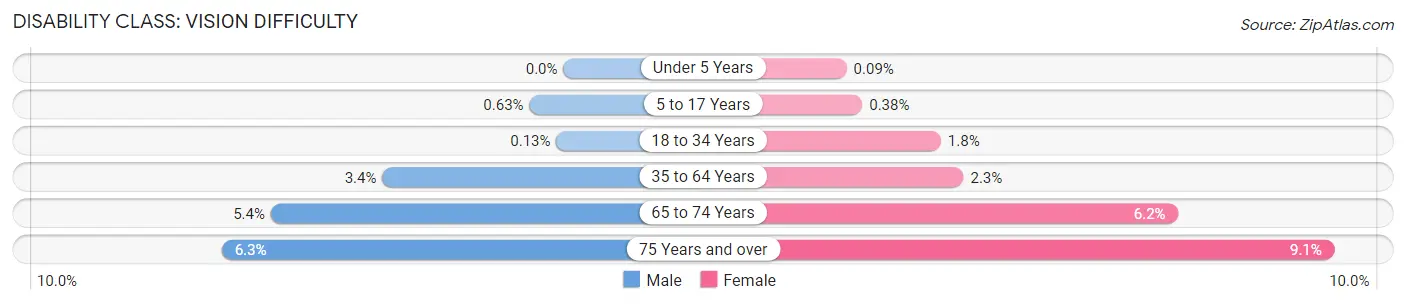
| Age Bracket | Male | Female |
| Under 5 Years | 0 (0.0%) | 1 (0.1%) |
| 5 to 17 Years | 20 (0.6%) | 11 (0.4%) |
| 18 to 34 Years | 5 (0.1%) | 66 (1.8%) |
| 35 to 64 Years | 222 (3.4%) | 147 (2.3%) |
| 65 to 74 Years | 97 (5.4%) | 113 (6.2%) |
| 75 Years and over | 64 (6.3%) | 136 (9.1%) |
Disability Class: Cognitive Difficulty
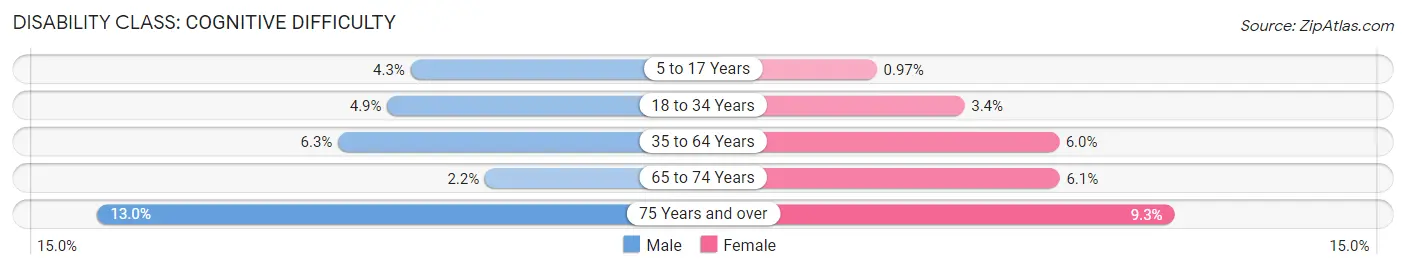
| Age Bracket | Male | Female |
| 5 to 17 Years | 135 (4.3%) | 28 (1.0%) |
| 18 to 34 Years | 189 (4.9%) | 122 (3.4%) |
| 35 to 64 Years | 414 (6.3%) | 393 (6.0%) |
| 65 to 74 Years | 39 (2.2%) | 110 (6.1%) |
| 75 Years and over | 131 (13.0%) | 138 (9.3%) |
Disability Class: Ambulatory Difficulty
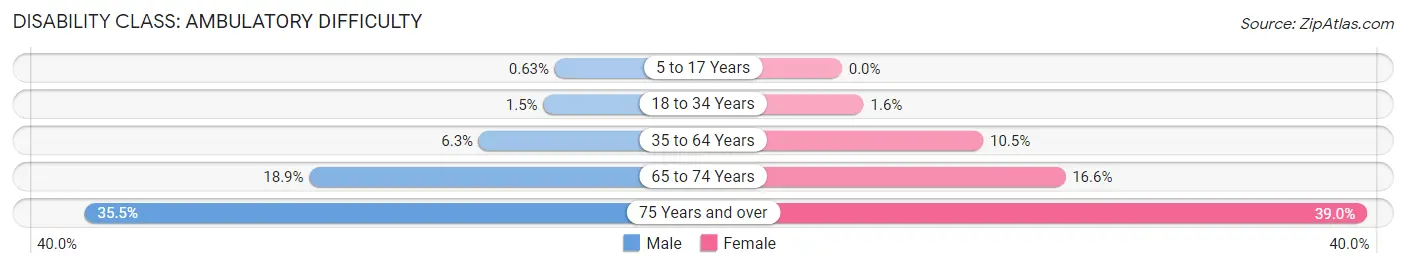
| Age Bracket | Male | Female |
| 5 to 17 Years | 20 (0.6%) | 0 (0.0%) |
| 18 to 34 Years | 57 (1.5%) | 58 (1.6%) |
| 35 to 64 Years | 414 (6.3%) | 683 (10.5%) |
| 65 to 74 Years | 337 (18.9%) | 301 (16.6%) |
| 75 Years and over | 359 (35.5%) | 581 (39.0%) |
Disability Class: Self-Care Difficulty
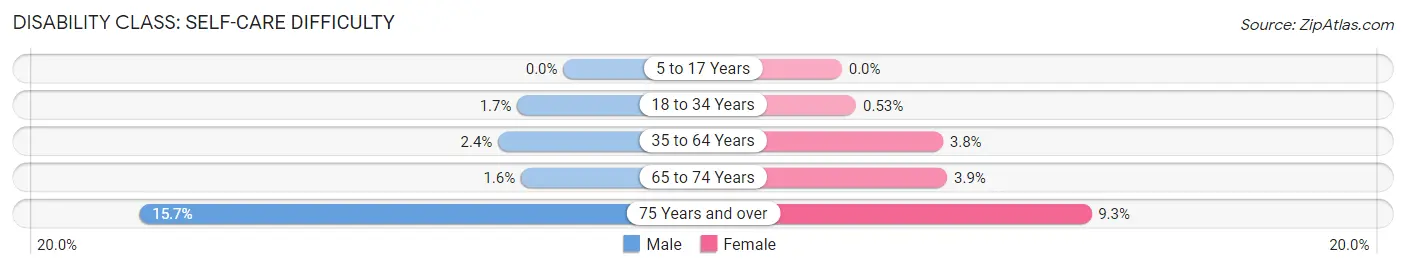
| Age Bracket | Male | Female |
| 5 to 17 Years | 0 (0.0%) | 0 (0.0%) |
| 18 to 34 Years | 66 (1.7%) | 19 (0.5%) |
| 35 to 64 Years | 160 (2.4%) | 244 (3.7%) |
| 65 to 74 Years | 28 (1.6%) | 71 (3.9%) |
| 75 Years and over | 159 (15.7%) | 138 (9.3%) |
Technology Access in Wapello County
Computing Device Access in Wapello County
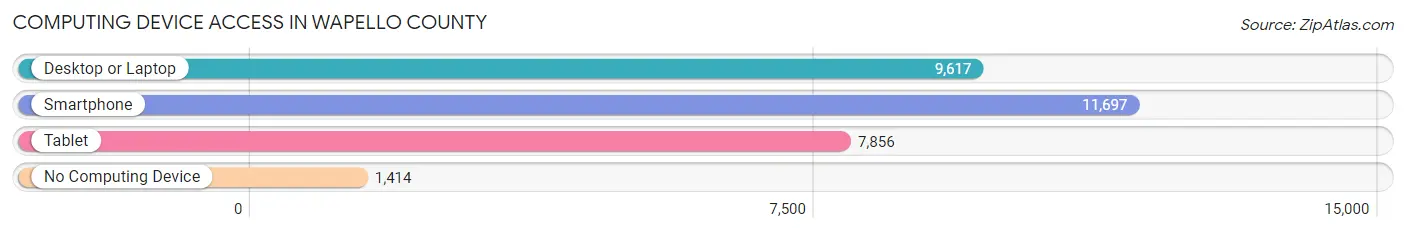
| Device Type | # Households | % Households |
| Desktop or Laptop | 9,617 | 67.8% |
| Smartphone | 11,697 | 82.4% |
| Tablet | 7,856 | 55.3% |
| No Computing Device | 1,414 | 10.0% |
| Total | 14,193 | 100.0% |
Internet Access in Wapello County
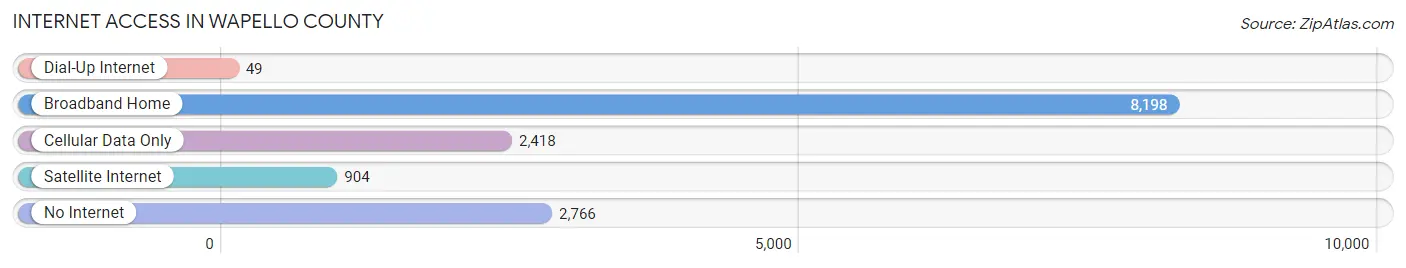
| Internet Type | # Households | % Households |
| Dial-Up Internet | 49 | 0.4% |
| Broadband Home | 8,198 | 57.8% |
| Cellular Data Only | 2,418 | 17.0% |
| Satellite Internet | 904 | 6.4% |
| No Internet | 2,766 | 19.5% |
| Total | 14,193 | 100.0% |
Wapello County Summary
Wapello County, Iowa is located in the southeastern corner of the state and is part of the Ottumwa, IA-MO Micropolitan Statistical Area. The county was established in 1843 and named after Chief Wapello of the Meskwaki tribe. The county seat is Ottumwa, the largest city in the county. As of the 2010 census, the population of Wapello County was 35,625.
Geography
Wapello County is located in the southeastern corner of Iowa and is bordered by Davis County to the north, Jefferson County to the east, Van Buren County to the south, and Appanoose County to the west. The county covers an area of 576 square miles and is mostly flat with some rolling hills. The Des Moines River runs through the county and is a major source of recreation. The county is also home to several small lakes and ponds.
Climate
Wapello County has a humid continental climate with hot, humid summers and cold, dry winters. The average annual temperature is 50°F and the average annual precipitation is 36 inches.
Demographics
As of the 2010 census, the population of Wapello County was 35,625. The racial makeup of the county was 92.3% White, 4.2% African American, 0.4% Native American, 0.7% Asian, 0.1% Pacific Islander, 1.2% from other races, and 1.1% from two or more races. Hispanic or Latino of any race were 3.2% of the population.
The median income for a household in the county was $41,945 and the median income for a family was $50,945. The per capita income for the county was $20,945. About 10.2% of families and 13.2% of the population were below the poverty line, including 17.2% of those under age 18 and 8.2% of those age 65 or over.
Economy
Wapello County’s economy is largely based on agriculture and manufacturing. The county is home to several large farms and agricultural businesses, including the John Deere Ottumwa Works, which produces agricultural equipment. The county is also home to several manufacturing companies, including the Ottumwa Regional Airport, which produces aircraft parts.
The county is also home to several retail businesses, including several large shopping centers and malls. The county is also home to several restaurants, hotels, and other tourist attractions.
The county is served by the Ottumwa Regional Airport, which provides air service to the region. The county is also served by several major highways, including Interstate 80, U.S. Route 63, and U.S. Route 34.
Conclusion
Wapello County, Iowa is located in the southeastern corner of the state and is part of the Ottumwa, IA-MO Micropolitan Statistical Area. The county was established in 1843 and named after Chief Wapello of the Meskwaki tribe. The county has a population of 35,625 and is mostly flat with some rolling hills. The county’s economy is largely based on agriculture and manufacturing, and the county is served by the Ottumwa Regional Airport and several major highways.
Common Questions
What is Per Capita Income in Wapello County?
Per Capita income in Wapello County is $30,025.
What is the Median Family Income in Wapello County?
Median Family Income in Wapello County is $67,016.
What is the Median Household income in Wapello County?
Median Household Income in Wapello County is $56,209.
What is Income or Wage Gap in Wapello County?
Income or Wage Gap in Wapello County is 22.2%.
Women in Wapello County earn 77.8 cents for every dollar earned by a man.
What is Family Income Deficit in Wapello County?
Family Income Deficit in Wapello County is $11,908.
Families that are below poverty line in Wapello County earn $11,908 less on average than the poverty threshold level.
What is Inequality or Gini Index in Wapello County?
Inequality or Gini Index in Wapello County is 0.43.
What is the Total Population of Wapello County?
Total Population of Wapello County is 35,292.
What is the Total Male Population of Wapello County?
Total Male Population of Wapello County is 17,753.
What is the Total Female Population of Wapello County?
Total Female Population of Wapello County is 17,539.
What is the Ratio of Males per 100 Females in Wapello County?
There are 101.22 Males per 100 Females in Wapello County.
What is the Ratio of Females per 100 Males in Wapello County?
There are 98.79 Females per 100 Males in Wapello County.
What is the Median Population Age in Wapello County?
Median Population Age in Wapello County is 39.4 Years.
What is the Average Family Size in Wapello County
Average Family Size in Wapello County is 3.0 People.
What is the Average Household Size in Wapello County
Average Household Size in Wapello County is 2.4 People.
How Large is the Labor Force in Wapello County?
There are 17,243 People in the Labor Forcein in Wapello County.
What is the Percentage of People in the Labor Force in Wapello County?
61.6% of People are in the Labor Force in Wapello County.
What is the Unemployment Rate in Wapello County?
Unemployment Rate in Wapello County is 4.4%.