Dallas County, IA Map & Demographics
Dallas County Map
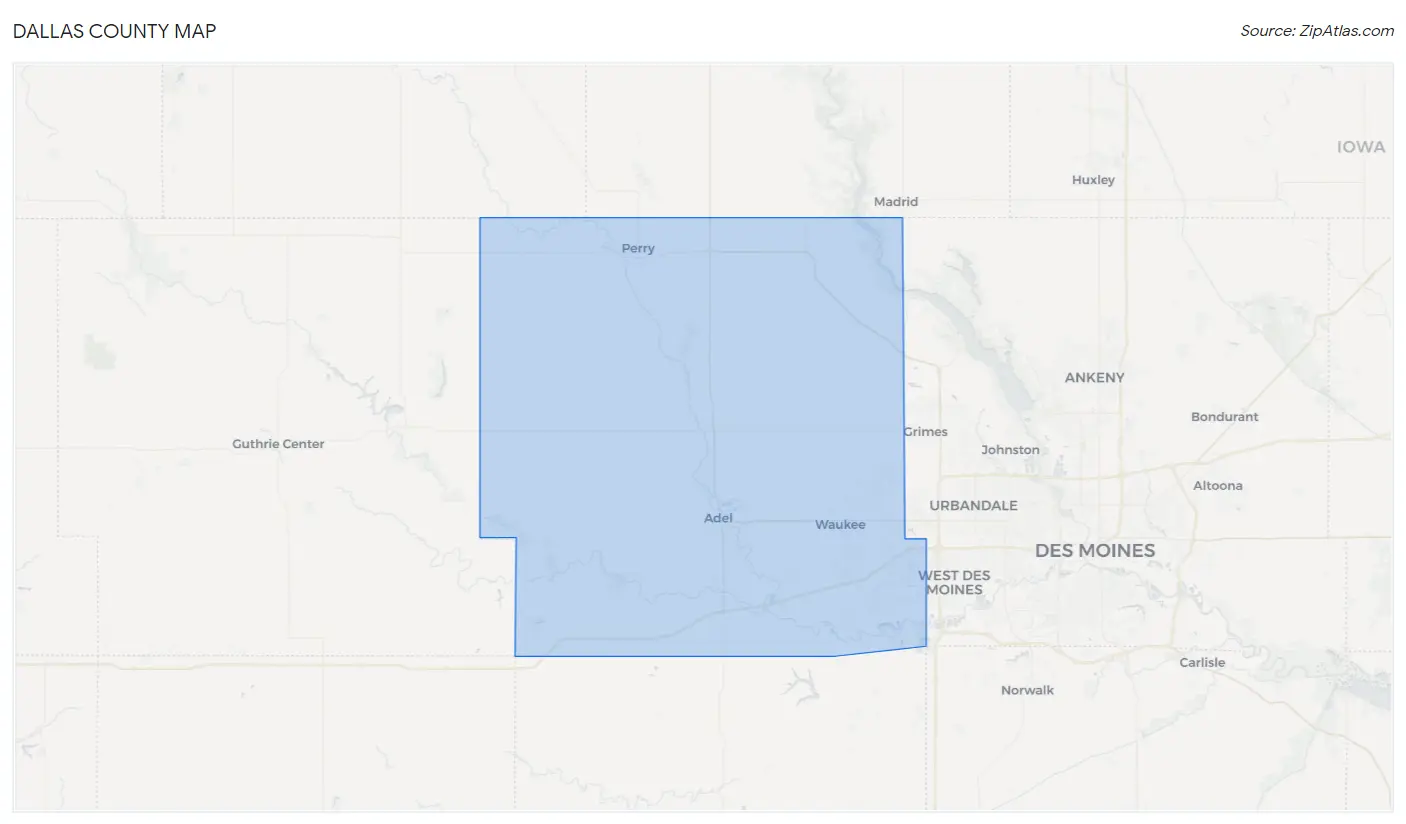
Dallas County Overview
$51,347
PER CAPITA INCOME
$130,231
AVG FAMILY INCOME
$99,533
AVG HOUSEHOLD INCOME
30.4%
WAGE / INCOME GAP [ % ]
69.6¢/ $1
WAGE / INCOME GAP [ $ ]
$10,687
FAMILY INCOME DEFICIT
0.44
INEQUALITY / GINI INDEX
100,367
TOTAL POPULATION
49,977
MALE POPULATION
50,390
FEMALE POPULATION
99.18
MALES / 100 FEMALES
100.83
FEMALES / 100 MALES
35.6
MEDIAN AGE
3.2
AVG FAMILY SIZE
2.5
AVG HOUSEHOLD SIZE
57,215
LABOR FORCE [ PEOPLE ]
75.4%
PERCENT IN LABOR FORCE
3.0%
UNEMPLOYMENT RATE
Income in Dallas County
Income Overview in Dallas County
Per Capita Income in Dallas County is $51,347, while median incomes of families and households are $130,231 and $99,533 respectively.
| Characteristic | Number | Measure |
| Per Capita Income | 100,367 | $51,347 |
| Median Family Income | 25,650 | $130,231 |
| Mean Family Income | 25,650 | $157,380 |
| Median Household Income | 39,386 | $99,533 |
| Mean Household Income | 39,386 | $130,223 |
| Income Deficit | 25,650 | $10,687 |
| Wage / Income Gap (%) | 100,367 | 30.43% |
| Wage / Income Gap ($) | 100,367 | 69.57¢ per $1 |
| Gini / Inequality Index | 100,367 | 0.44 |
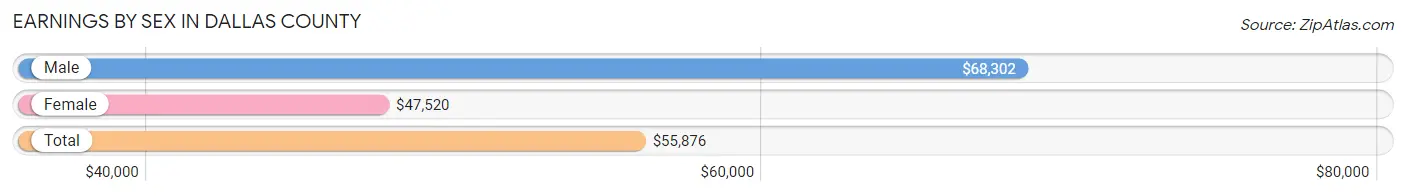
Earnings by Sex in Dallas County
Average Earnings in Dallas County are $55,876, $68,302 for men and $47,520 for women, a difference of 30.4%.
| Sex | Number | Average Earnings |
| Male | 31,265 (53.0%) | $68,302 |
| Female | 27,729 (47.0%) | $47,520 |
| Total | 58,994 (100.0%) | $55,876 |
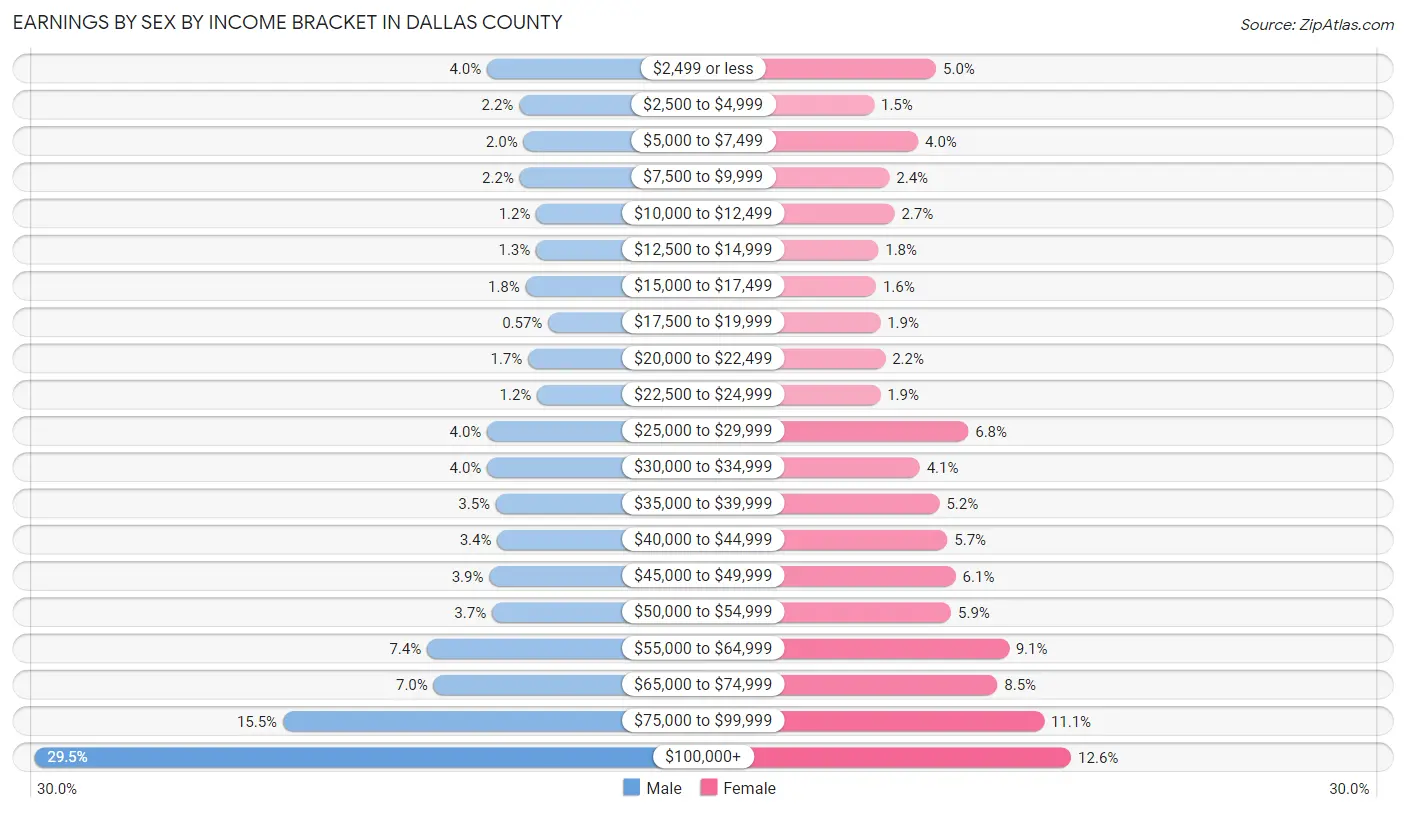
Earnings by Sex by Income Bracket in Dallas County
The most common earnings brackets in Dallas County are $100,000+ for men (9,207 | 29.4%) and $100,000+ for women (3,497 | 12.6%).
| Income | Male | Female |
| $2,499 or less | 1,254 (4.0%) | 1,393 (5.0%) |
| $2,500 to $4,999 | 687 (2.2%) | 423 (1.5%) |
| $5,000 to $7,499 | 612 (2.0%) | 1,112 (4.0%) |
| $7,500 to $9,999 | 680 (2.2%) | 663 (2.4%) |
| $10,000 to $12,499 | 387 (1.2%) | 744 (2.7%) |
| $12,500 to $14,999 | 392 (1.3%) | 491 (1.8%) |
| $15,000 to $17,499 | 576 (1.8%) | 454 (1.6%) |
| $17,500 to $19,999 | 179 (0.6%) | 520 (1.9%) |
| $20,000 to $22,499 | 532 (1.7%) | 600 (2.2%) |
| $22,500 to $24,999 | 372 (1.2%) | 521 (1.9%) |
| $25,000 to $29,999 | 1,250 (4.0%) | 1,893 (6.8%) |
| $30,000 to $34,999 | 1,250 (4.0%) | 1,137 (4.1%) |
| $35,000 to $39,999 | 1,096 (3.5%) | 1,446 (5.2%) |
| $40,000 to $44,999 | 1,072 (3.4%) | 1,568 (5.7%) |
| $45,000 to $49,999 | 1,214 (3.9%) | 1,698 (6.1%) |
| $50,000 to $54,999 | 1,165 (3.7%) | 1,626 (5.9%) |
| $55,000 to $64,999 | 2,308 (7.4%) | 2,523 (9.1%) |
| $65,000 to $74,999 | 2,192 (7.0%) | 2,347 (8.5%) |
| $75,000 to $99,999 | 4,840 (15.5%) | 3,073 (11.1%) |
| $100,000+ | 9,207 (29.4%) | 3,497 (12.6%) |
| Total | 31,265 (100.0%) | 27,729 (100.0%) |
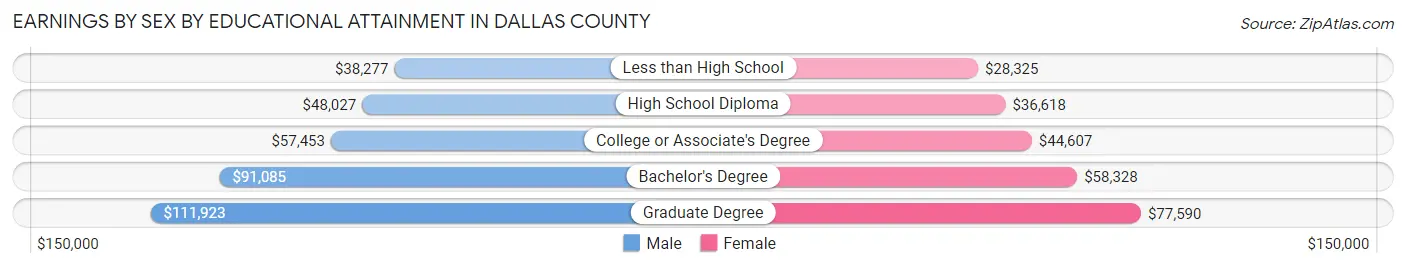
Earnings by Sex by Educational Attainment in Dallas County
Average earnings in Dallas County are $74,787 for men and $53,096 for women, a difference of 29.0%. Men with an educational attainment of graduate degree enjoy the highest average annual earnings of $111,923, while those with less than high school education earn the least with $38,277. Women with an educational attainment of graduate degree earn the most with the average annual earnings of $77,590, while those with less than high school education have the smallest earnings of $28,325.
| Educational Attainment | Male Income | Female Income |
| Less than High School | $38,277 | $28,325 |
| High School Diploma | $48,027 | $36,618 |
| College or Associate's Degree | $57,453 | $44,607 |
| Bachelor's Degree | $91,085 | $58,328 |
| Graduate Degree | $111,923 | $77,590 |
| Total | $74,787 | $53,096 |
Family Income in Dallas County
Family Income Brackets in Dallas County
According to the Dallas County family income data, there are 5,823 families falling into the $200,000+ income range, which is the most common income bracket and makes up 22.7% of all families. Conversely, the $10,000 to $14,999 income bracket is the least frequent group with only 231 families (0.9%) belonging to this category.
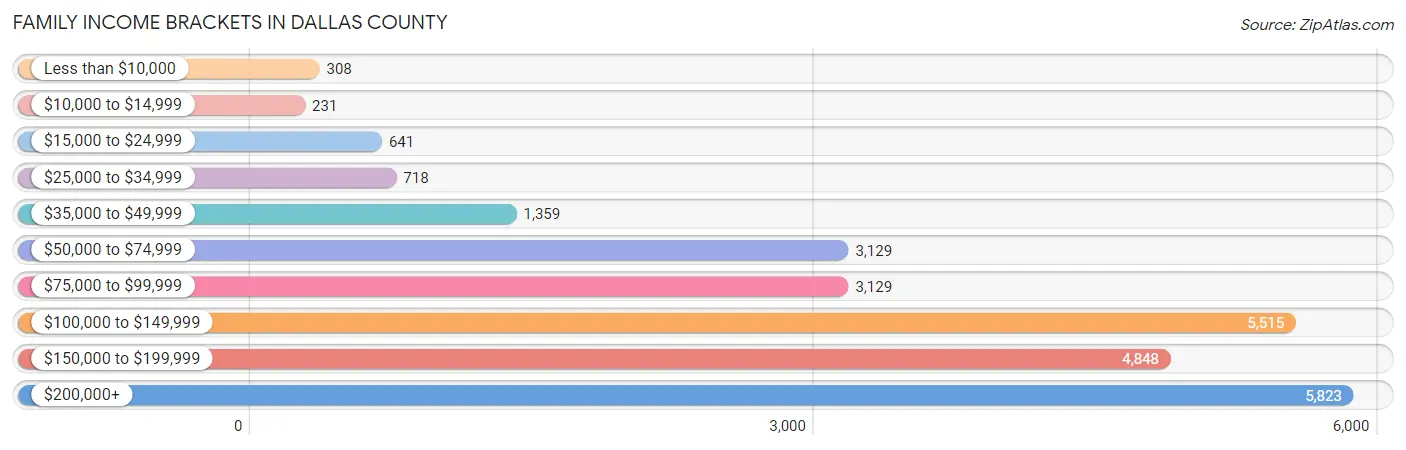
| Income Bracket | # Families | % Families |
| Less than $10,000 | 308 | 1.2% |
| $10,000 to $14,999 | 231 | 0.9% |
| $15,000 to $24,999 | 641 | 2.5% |
| $25,000 to $34,999 | 718 | 2.8% |
| $35,000 to $49,999 | 1,359 | 5.3% |
| $50,000 to $74,999 | 3,129 | 12.2% |
| $75,000 to $99,999 | 3,129 | 12.2% |
| $100,000 to $149,999 | 5,515 | 21.5% |
| $150,000 to $199,999 | 4,848 | 18.9% |
| $200,000+ | 5,823 | 22.7% |
Family Income by Famaliy Size in Dallas County
7+ person families (171 | 0.7%) account for the highest median family income in Dallas County with $205,208 per family, while 2-person families (10,672 | 41.6%) have the highest median income of $51,928 per family member.
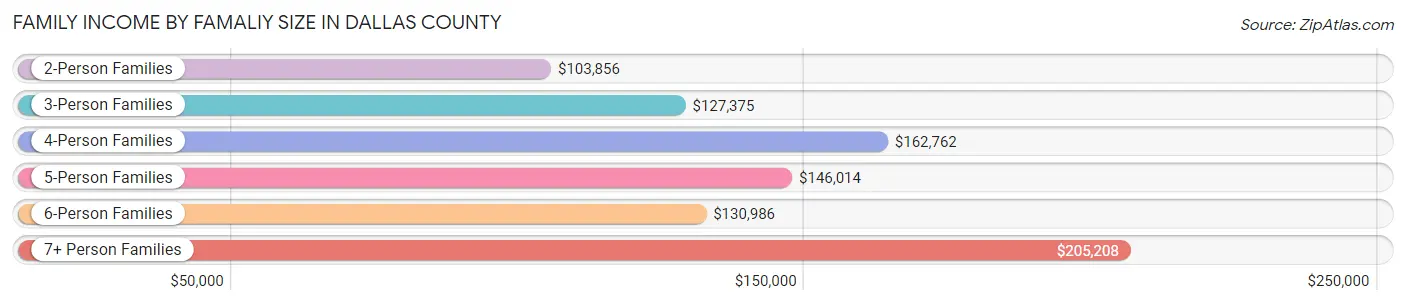
| Income Bracket | # Families | Median Income |
| 2-Person Families | 10,672 (41.6%) | $103,856 |
| 3-Person Families | 5,303 (20.7%) | $127,375 |
| 4-Person Families | 6,127 (23.9%) | $162,762 |
| 5-Person Families | 2,632 (10.3%) | $146,014 |
| 6-Person Families | 745 (2.9%) | $130,986 |
| 7+ Person Families | 171 (0.7%) | $205,208 |
| Total | 25,650 (100.0%) | $130,231 |
Family Income by Number of Earners in Dallas County
The median family income in Dallas County is $130,231, with families comprising 3+ earners (2,631) having the highest median family income of $164,210, while families with no earners (2,561) have the lowest median family income of $68,573, accounting for 10.3% and 10.0% of families, respectively.
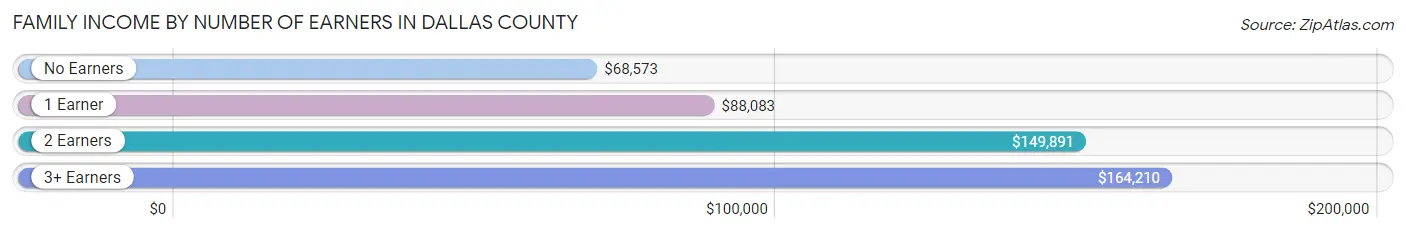
| Number of Earners | # Families | Median Income |
| No Earners | 2,561 (10.0%) | $68,573 |
| 1 Earner | 5,958 (23.2%) | $88,083 |
| 2 Earners | 14,500 (56.5%) | $149,891 |
| 3+ Earners | 2,631 (10.3%) | $164,210 |
| Total | 25,650 (100.0%) | $130,231 |
Household Income in Dallas County
Household Income Brackets in Dallas County
With 7,562 households falling in the category, the $100,000 to $149,999 income range is the most frequent in Dallas County, accounting for 19.2% of all households. In contrast, only 630 households (1.6%) fall into the $10,000 to $14,999 income bracket, making it the least populous group.
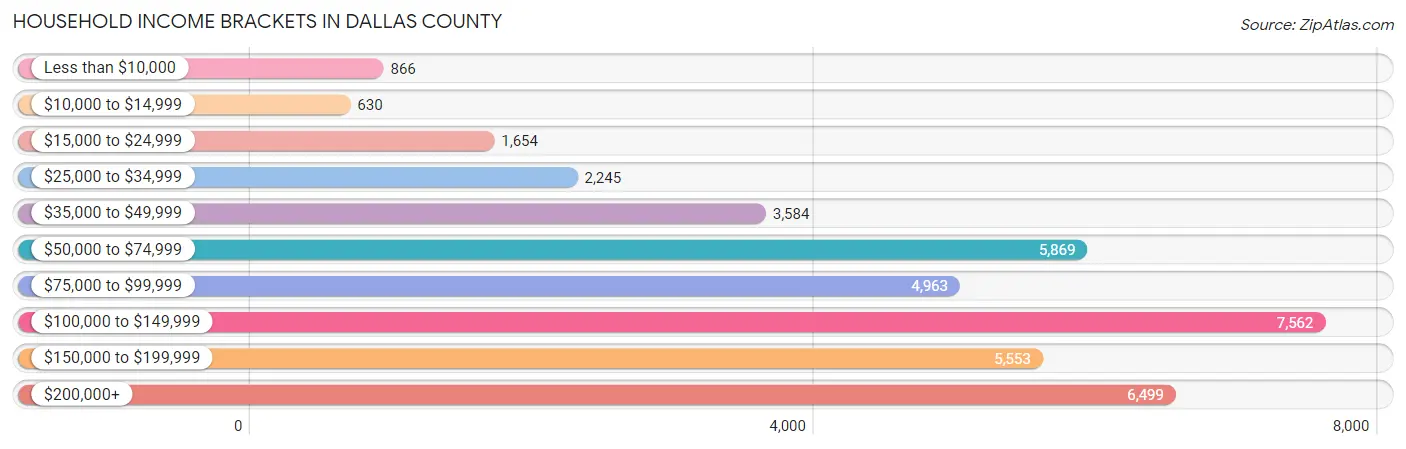
| Income Bracket | # Households | % Households |
| Less than $10,000 | 866 | 2.2% |
| $10,000 to $14,999 | 630 | 1.6% |
| $15,000 to $24,999 | 1,654 | 4.2% |
| $25,000 to $34,999 | 2,245 | 5.7% |
| $35,000 to $49,999 | 3,584 | 9.1% |
| $50,000 to $74,999 | 5,869 | 14.9% |
| $75,000 to $99,999 | 4,963 | 12.6% |
| $100,000 to $149,999 | 7,562 | 19.2% |
| $150,000 to $199,999 | 5,553 | 14.1% |
| $200,000+ | 6,499 | 16.5% |
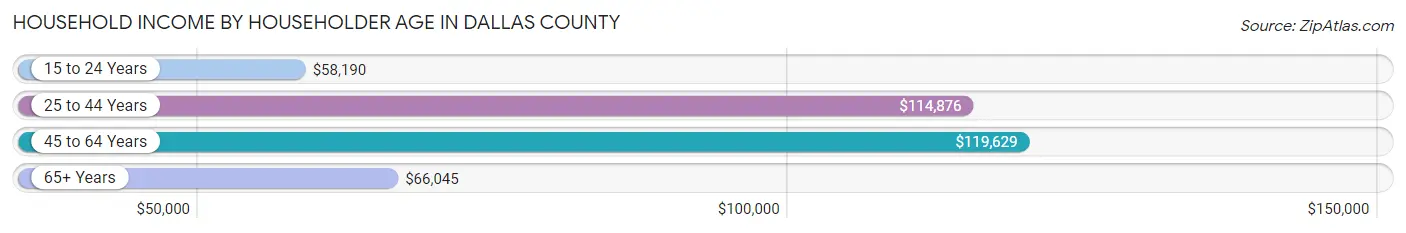
Household Income by Householder Age in Dallas County
The median household income in Dallas County is $99,533, with the highest median household income of $119,629 found in the 45 to 64 years age bracket for the primary householder. A total of 12,752 households (32.4%) fall into this category. Meanwhile, the 15 to 24 years age bracket for the primary householder has the lowest median household income of $58,190, with 2,190 households (5.6%) in this group.
| Income Bracket | # Households | Median Income |
| 15 to 24 Years | 2,190 (5.6%) | $58,190 |
| 25 to 44 Years | 16,671 (42.3%) | $114,876 |
| 45 to 64 Years | 12,752 (32.4%) | $119,629 |
| 65+ Years | 7,773 (19.7%) | $66,045 |
| Total | 39,386 (100.0%) | $99,533 |
Poverty in Dallas County
Income Below Poverty by Sex and Age in Dallas County
With 5.2% poverty level for males and 6.1% for females among the residents of Dallas County, 5 year old males and 18 to 24 year old females are the most vulnerable to poverty, with 102 males (13.3%) and 467 females (12.4%) in their respective age groups living below the poverty level.
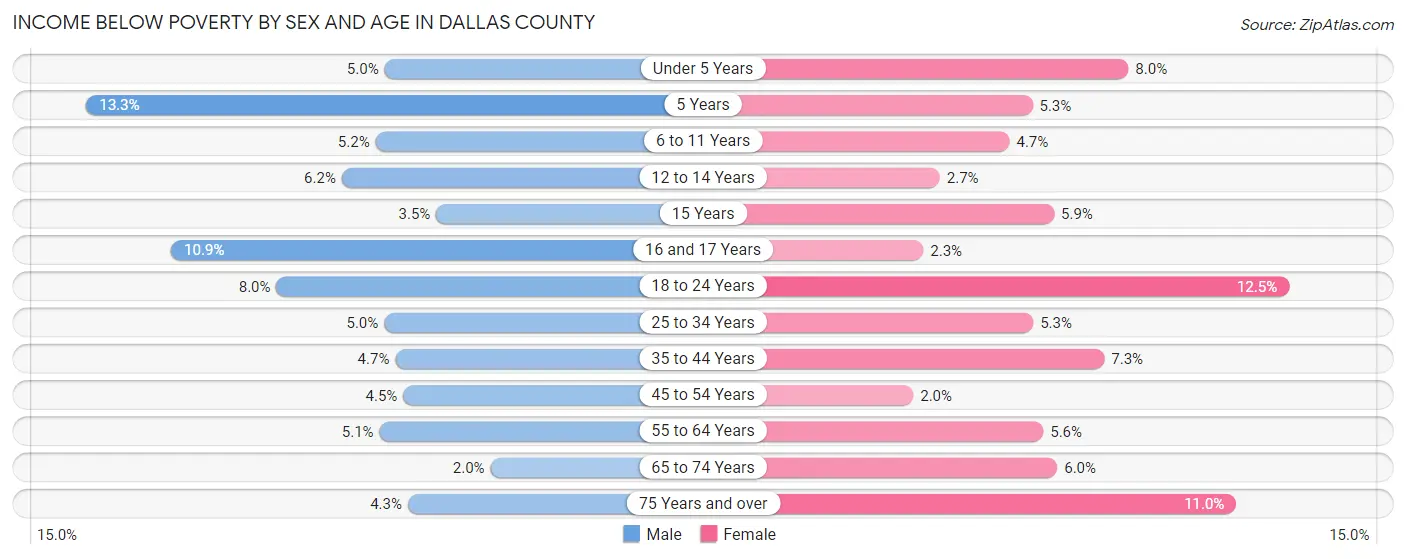
| Age Bracket | Male | Female |
| Under 5 Years | 178 (5.0%) | 274 (8.0%) |
| 5 Years | 102 (13.3%) | 37 (5.3%) |
| 6 to 11 Years | 268 (5.2%) | 236 (4.7%) |
| 12 to 14 Years | 129 (6.2%) | 52 (2.7%) |
| 15 Years | 32 (3.5%) | 51 (5.9%) |
| 16 and 17 Years | 133 (10.9%) | 30 (2.3%) |
| 18 to 24 Years | 308 (8.0%) | 467 (12.4%) |
| 25 to 34 Years | 360 (5.0%) | 378 (5.3%) |
| 35 to 44 Years | 390 (4.7%) | 595 (7.3%) |
| 45 to 54 Years | 285 (4.5%) | 121 (2.0%) |
| 55 to 64 Years | 260 (5.1%) | 286 (5.6%) |
| 65 to 74 Years | 68 (2.0%) | 234 (6.0%) |
| 75 Years and over | 79 (4.3%) | 304 (11.0%) |
| Total | 2,592 (5.2%) | 3,065 (6.1%) |
Income Above Poverty by Sex and Age in Dallas County
According to the poverty statistics in Dallas County, males aged 65 to 74 years and females aged 45 to 54 years are the age groups that are most secure financially, with 98.0% of males and 98.0% of females in these age groups living above the poverty line.
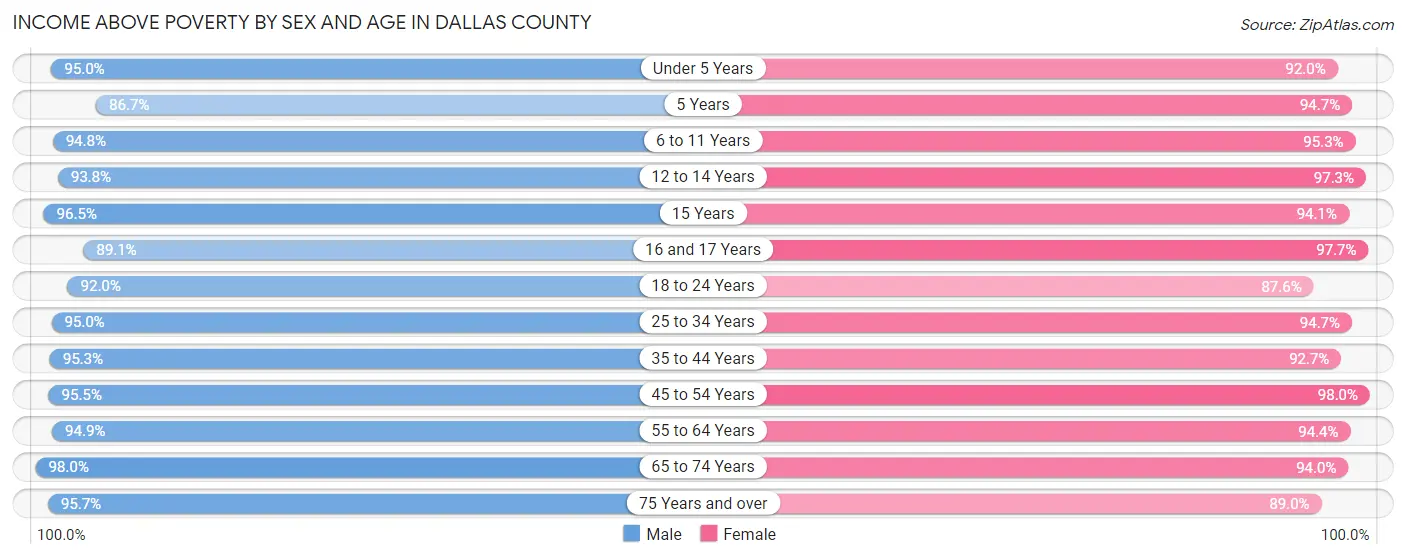
| Age Bracket | Male | Female |
| Under 5 Years | 3,396 (95.0%) | 3,158 (92.0%) |
| 5 Years | 666 (86.7%) | 660 (94.7%) |
| 6 to 11 Years | 4,860 (94.8%) | 4,817 (95.3%) |
| 12 to 14 Years | 1,963 (93.8%) | 1,850 (97.3%) |
| 15 Years | 872 (96.5%) | 812 (94.1%) |
| 16 and 17 Years | 1,085 (89.1%) | 1,292 (97.7%) |
| 18 to 24 Years | 3,546 (92.0%) | 3,283 (87.5%) |
| 25 to 34 Years | 6,854 (95.0%) | 6,708 (94.7%) |
| 35 to 44 Years | 7,952 (95.3%) | 7,544 (92.7%) |
| 45 to 54 Years | 6,099 (95.5%) | 5,956 (98.0%) |
| 55 to 64 Years | 4,816 (94.9%) | 4,815 (94.4%) |
| 65 to 74 Years | 3,277 (98.0%) | 3,667 (94.0%) |
| 75 Years and over | 1,747 (95.7%) | 2,465 (89.0%) |
| Total | 47,133 (94.8%) | 47,027 (93.9%) |
Income Below Poverty Among Married-Couple Families in Dallas County
The poverty statistics for married-couple families in Dallas County show that 2.4% or 506 of the total 21,321 families live below the poverty line. Families with 5 or more children have the highest poverty rate of 10.3%, comprising of 8 families. On the other hand, families with no children have the lowest poverty rate of 2.0%, which includes 201 families.
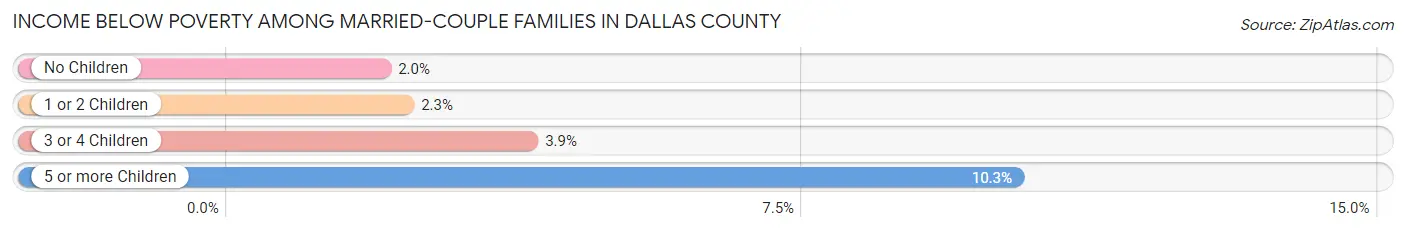
| Children | Above Poverty | Below Poverty |
| No Children | 9,844 (98.0%) | 201 (2.0%) |
| 1 or 2 Children | 8,550 (97.7%) | 201 (2.3%) |
| 3 or 4 Children | 2,351 (96.1%) | 96 (3.9%) |
| 5 or more Children | 70 (89.7%) | 8 (10.3%) |
| Total | 20,815 (97.6%) | 506 (2.4%) |
Income Below Poverty Among Single-Parent Households in Dallas County
According to the poverty data in Dallas County, 3.7% or 56 single-father households and 17.4% or 490 single-mother households are living below the poverty line. Among single-father households, those with 3 or 4 children have the highest poverty rate, with 12 households (5.1%) experiencing poverty. Likewise, among single-mother households, those with 5 or more children have the highest poverty rate, with 3 households (60.0%) falling below the poverty line.
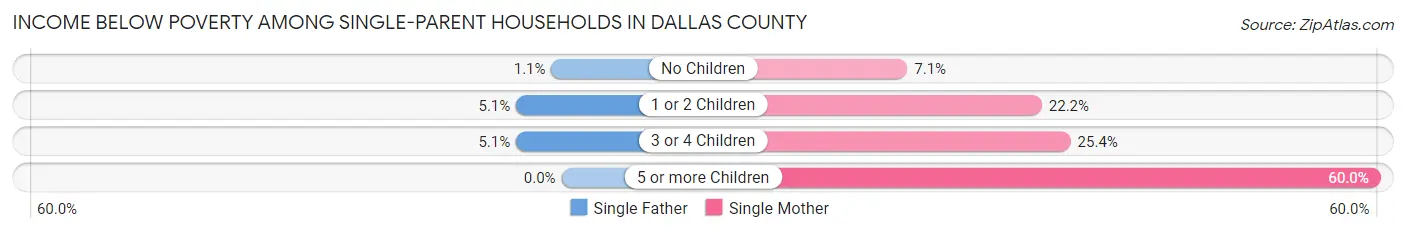
| Children | Single Father | Single Mother |
| No Children | 6 (1.1%) | 67 (7.1%) |
| 1 or 2 Children | 38 (5.1%) | 369 (22.2%) |
| 3 or 4 Children | 12 (5.1%) | 51 (25.4%) |
| 5 or more Children | 0 (0.0%) | 3 (60.0%) |
| Total | 56 (3.7%) | 490 (17.4%) |
Income Below Poverty Among Married-Couple vs Single-Parent Households in Dallas County
The poverty data for Dallas County shows that 506 of the married-couple family households (2.4%) and 546 of the single-parent households (12.6%) are living below the poverty level. Within the married-couple family households, those with 5 or more children have the highest poverty rate, with 8 households (10.3%) falling below the poverty line. Among the single-parent households, those with 5 or more children have the highest poverty rate, with 3 household (50.0%) living below poverty.
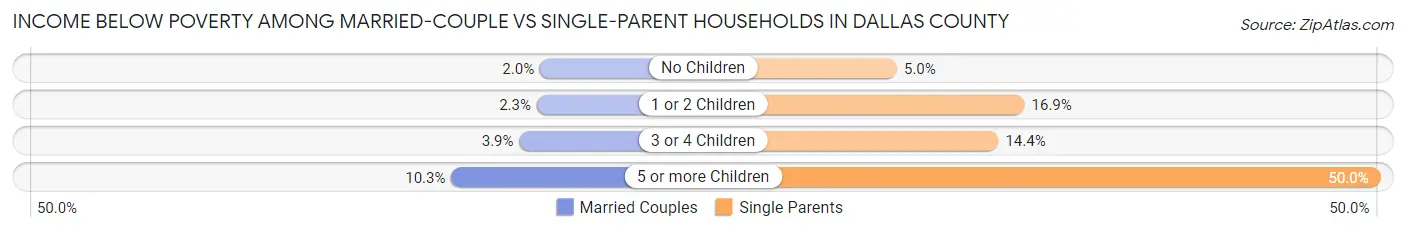
| Children | Married-Couple Families | Single-Parent Households |
| No Children | 201 (2.0%) | 73 (5.0%) |
| 1 or 2 Children | 201 (2.3%) | 407 (16.9%) |
| 3 or 4 Children | 96 (3.9%) | 63 (14.4%) |
| 5 or more Children | 8 (10.3%) | 3 (50.0%) |
| Total | 506 (2.4%) | 546 (12.6%) |
Race in Dallas County
The most populous races in Dallas County are White / Caucasian (85,828 | 85.5%), Hispanic or Latino (6,411 | 6.4%), and Two or more Races (5,876 | 5.9%).
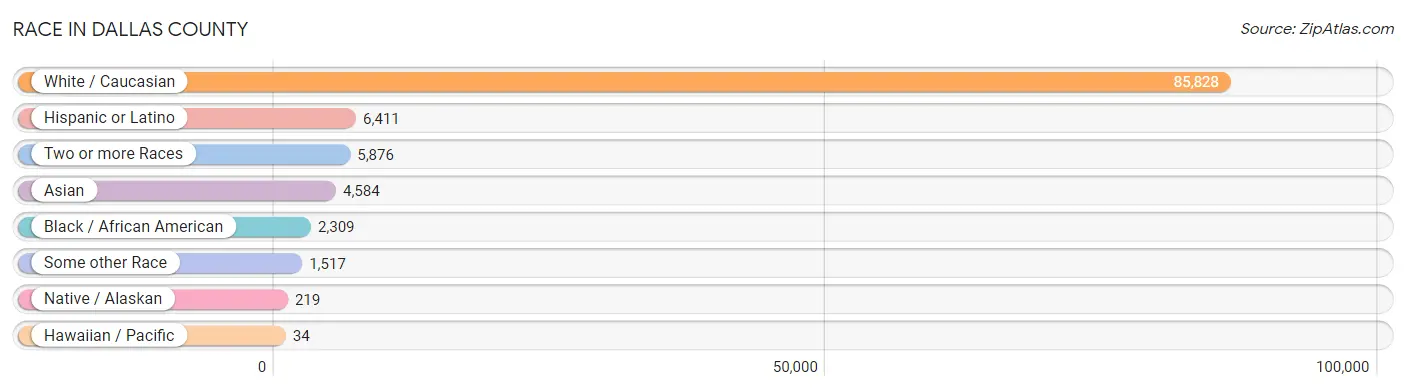
| Race | # Population | % Population |
| Asian | 4,584 | 4.6% |
| Black / African American | 2,309 | 2.3% |
| Hawaiian / Pacific | 34 | 0.0% |
| Hispanic or Latino | 6,411 | 6.4% |
| Native / Alaskan | 219 | 0.2% |
| White / Caucasian | 85,828 | 85.5% |
| Two or more Races | 5,876 | 5.9% |
| Some other Race | 1,517 | 1.5% |
| Total | 100,367 | 100.0% |
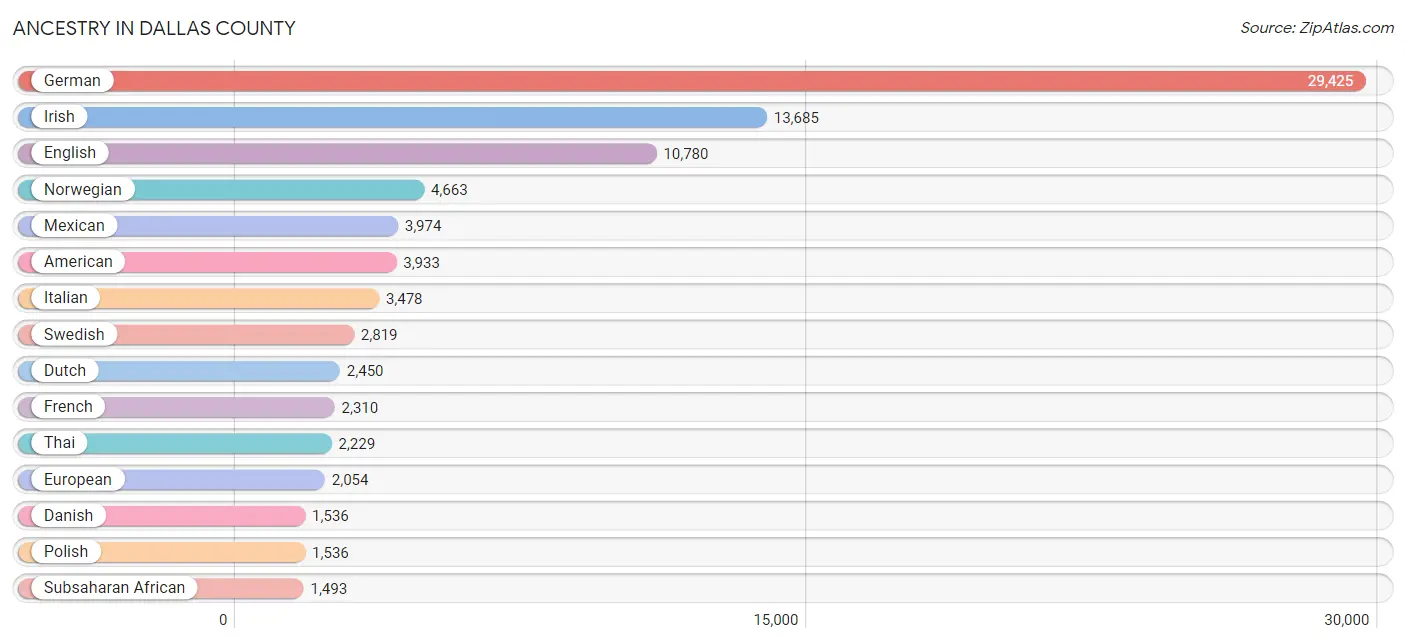
Ancestry in Dallas County
The most populous ancestries reported in Dallas County are German (29,425 | 29.3%), Irish (13,685 | 13.6%), English (10,780 | 10.7%), Norwegian (4,663 | 4.6%), and Mexican (3,974 | 4.0%), together accounting for 62.3% of all Dallas County residents.
| Ancestry | # Population | % Population |
| Afghan | 94 | 0.1% |
| African | 743 | 0.7% |
| American | 3,933 | 3.9% |
| Apache | 7 | 0.0% |
| Arab | 1,072 | 1.1% |
| Argentinean | 16 | 0.0% |
| Armenian | 18 | 0.0% |
| Australian | 24 | 0.0% |
| Austrian | 175 | 0.2% |
| Belgian | 105 | 0.1% |
| Bhutanese | 2 | 0.0% |
| Bolivian | 24 | 0.0% |
| Brazilian | 24 | 0.0% |
| British | 623 | 0.6% |
| Burmese | 887 | 0.9% |
| Canadian | 69 | 0.1% |
| Central American | 708 | 0.7% |
| Cherokee | 170 | 0.2% |
| Cheyenne | 43 | 0.0% |
| Chilean | 171 | 0.2% |
| Chippewa | 5 | 0.0% |
| Colombian | 272 | 0.3% |
| Comanche | 76 | 0.1% |
| Costa Rican | 83 | 0.1% |
| Croatian | 75 | 0.1% |
| Cuban | 97 | 0.1% |
| Czech | 598 | 0.6% |
| Czechoslovakian | 170 | 0.2% |
| Danish | 1,536 | 1.5% |
| Dominican | 11 | 0.0% |
| Dutch | 2,450 | 2.4% |
| Eastern European | 227 | 0.2% |
| Ecuadorian | 175 | 0.2% |
| Egyptian | 65 | 0.1% |
| English | 10,780 | 10.7% |
| European | 2,054 | 2.1% |
| Filipino | 50 | 0.1% |
| Finnish | 226 | 0.2% |
| French | 2,310 | 2.3% |
| French Canadian | 183 | 0.2% |
| German | 29,425 | 29.3% |
| Ghanaian | 213 | 0.2% |
| Greek | 68 | 0.1% |
| Guatemalan | 146 | 0.2% |
| Haitian | 28 | 0.0% |
| Honduran | 51 | 0.1% |
| Hungarian | 135 | 0.1% |
| Indian (Asian) | 591 | 0.6% |
| Iraqi | 134 | 0.1% |
| Irish | 13,685 | 13.6% |
| Iroquois | 4 | 0.0% |
| Israeli | 5 | 0.0% |
| Italian | 3,478 | 3.5% |
| Jamaican | 3 | 0.0% |
| Kenyan | 40 | 0.0% |
| Kiowa | 22 | 0.0% |
| Korean | 672 | 0.7% |
| Laotian | 32 | 0.0% |
| Latvian | 16 | 0.0% |
| Lebanese | 81 | 0.1% |
| Liberian | 124 | 0.1% |
| Lithuanian | 112 | 0.1% |
| Luxembourger | 252 | 0.3% |
| Macedonian | 73 | 0.1% |
| Malaysian | 463 | 0.5% |
| Mexican | 3,974 | 4.0% |
| Mexican American Indian | 114 | 0.1% |
| Mongolian | 94 | 0.1% |
| Native Hawaiian | 145 | 0.1% |
| Navajo | 12 | 0.0% |
| Nicaraguan | 177 | 0.2% |
| Nigerian | 32 | 0.0% |
| Northern European | 180 | 0.2% |
| Norwegian | 4,663 | 4.6% |
| Pakistani | 8 | 0.0% |
| Palestinian | 59 | 0.1% |
| Panamanian | 3 | 0.0% |
| Peruvian | 284 | 0.3% |
| Polish | 1,536 | 1.5% |
| Portuguese | 298 | 0.3% |
| Puerto Rican | 317 | 0.3% |
| Romanian | 230 | 0.2% |
| Russian | 360 | 0.4% |
| Salvadoran | 248 | 0.3% |
| Scandinavian | 748 | 0.7% |
| Scotch-Irish | 440 | 0.4% |
| Scottish | 1,386 | 1.4% |
| Sierra Leonean | 13 | 0.0% |
| Sioux | 20 | 0.0% |
| Slavic | 154 | 0.2% |
| Slovak | 124 | 0.1% |
| Slovene | 151 | 0.2% |
| South American | 977 | 1.0% |
| South American Indian | 4 | 0.0% |
| Spaniard | 55 | 0.1% |
| Spanish | 95 | 0.1% |
| Sri Lankan | 357 | 0.4% |
| Subsaharan African | 1,493 | 1.5% |
| Sudanese | 116 | 0.1% |
| Swedish | 2,819 | 2.8% |
| Swiss | 692 | 0.7% |
| Syrian | 3 | 0.0% |
| Thai | 2,229 | 2.2% |
| Turkish | 20 | 0.0% |
| Ugandan | 71 | 0.1% |
| Ukrainian | 66 | 0.1% |
| Venezuelan | 35 | 0.0% |
| Welsh | 719 | 0.7% |
| Yugoslavian | 752 | 0.7% | View All 109 Rows |
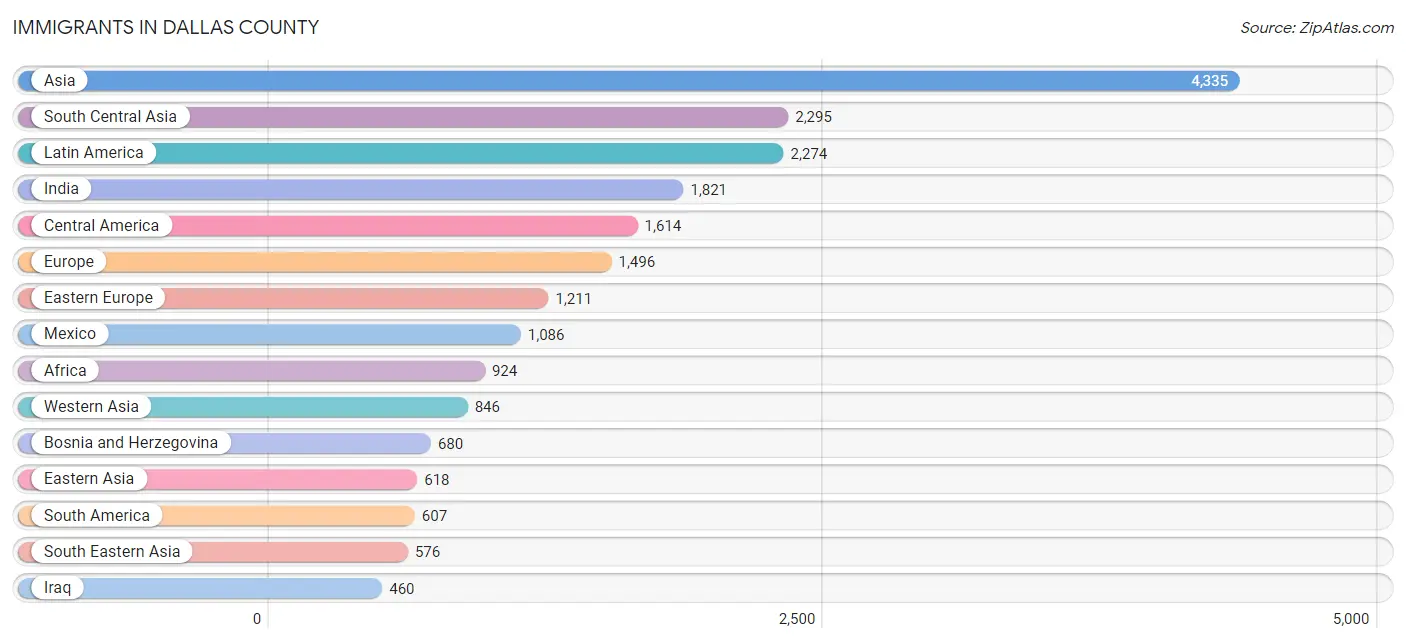
Immigrants in Dallas County
The most numerous immigrant groups reported in Dallas County came from Asia (4,335 | 4.3%), South Central Asia (2,295 | 2.3%), Latin America (2,274 | 2.3%), India (1,821 | 1.8%), and Central America (1,614 | 1.6%), together accounting for 12.3% of all Dallas County residents.
| Immigration Origin | # Population | % Population |
| Afghanistan | 46 | 0.1% |
| Africa | 924 | 0.9% |
| Asia | 4,335 | 4.3% |
| Australia | 97 | 0.1% |
| Austria | 19 | 0.0% |
| Azores | 2 | 0.0% |
| Belgium | 11 | 0.0% |
| Bosnia and Herzegovina | 680 | 0.7% |
| Brazil | 223 | 0.2% |
| Cameroon | 7 | 0.0% |
| Canada | 156 | 0.2% |
| Caribbean | 53 | 0.1% |
| Central America | 1,614 | 1.6% |
| Chile | 43 | 0.0% |
| China | 227 | 0.2% |
| Colombia | 192 | 0.2% |
| Costa Rica | 11 | 0.0% |
| Croatia | 25 | 0.0% |
| Dominican Republic | 11 | 0.0% |
| Eastern Africa | 319 | 0.3% |
| Eastern Asia | 618 | 0.6% |
| Eastern Europe | 1,211 | 1.2% |
| Ecuador | 60 | 0.1% |
| Egypt | 51 | 0.1% |
| El Salvador | 416 | 0.4% |
| Europe | 1,496 | 1.5% |
| Germany | 86 | 0.1% |
| Ghana | 19 | 0.0% |
| Greece | 3 | 0.0% |
| Guatemala | 33 | 0.0% |
| Haiti | 28 | 0.0% |
| Honduras | 6 | 0.0% |
| Hong Kong | 38 | 0.0% |
| India | 1,821 | 1.8% |
| Indonesia | 57 | 0.1% |
| Iraq | 460 | 0.5% |
| Italy | 14 | 0.0% |
| Japan | 33 | 0.0% |
| Jordan | 146 | 0.2% |
| Kenya | 114 | 0.1% |
| Korea | 358 | 0.4% |
| Kuwait | 72 | 0.1% |
| Laos | 123 | 0.1% |
| Latin America | 2,274 | 2.3% |
| Lebanon | 54 | 0.1% |
| Liberia | 178 | 0.2% |
| Malaysia | 113 | 0.1% |
| Mexico | 1,086 | 1.1% |
| Middle Africa | 90 | 0.1% |
| Moldova | 115 | 0.1% |
| Nepal | 206 | 0.2% |
| Nicaragua | 62 | 0.1% |
| Nigeria | 67 | 0.1% |
| Northern Africa | 164 | 0.2% |
| Northern Europe | 44 | 0.0% |
| Oceania | 105 | 0.1% |
| Peru | 78 | 0.1% |
| Philippines | 157 | 0.2% |
| Poland | 21 | 0.0% |
| Portugal | 2 | 0.0% |
| Romania | 45 | 0.0% |
| Russia | 98 | 0.1% |
| Saudi Arabia | 12 | 0.0% |
| Sierra Leone | 35 | 0.0% |
| South Africa | 6 | 0.0% |
| South America | 607 | 0.6% |
| South Central Asia | 2,295 | 2.3% |
| South Eastern Asia | 576 | 0.6% |
| Southern Europe | 110 | 0.1% |
| Spain | 91 | 0.1% |
| Sudan | 64 | 0.1% |
| Sweden | 2 | 0.0% |
| Switzerland | 15 | 0.0% |
| Syria | 34 | 0.0% |
| Taiwan | 23 | 0.0% |
| Trinidad and Tobago | 14 | 0.0% |
| Turkey | 8 | 0.0% |
| Uganda | 48 | 0.1% |
| Ukraine | 53 | 0.1% |
| Venezuela | 11 | 0.0% |
| Vietnam | 126 | 0.1% |
| Western Africa | 333 | 0.3% |
| Western Asia | 846 | 0.8% |
| Western Europe | 131 | 0.1% |
| Yemen | 24 | 0.0% |
| Zaire | 83 | 0.1% | View All 86 Rows |
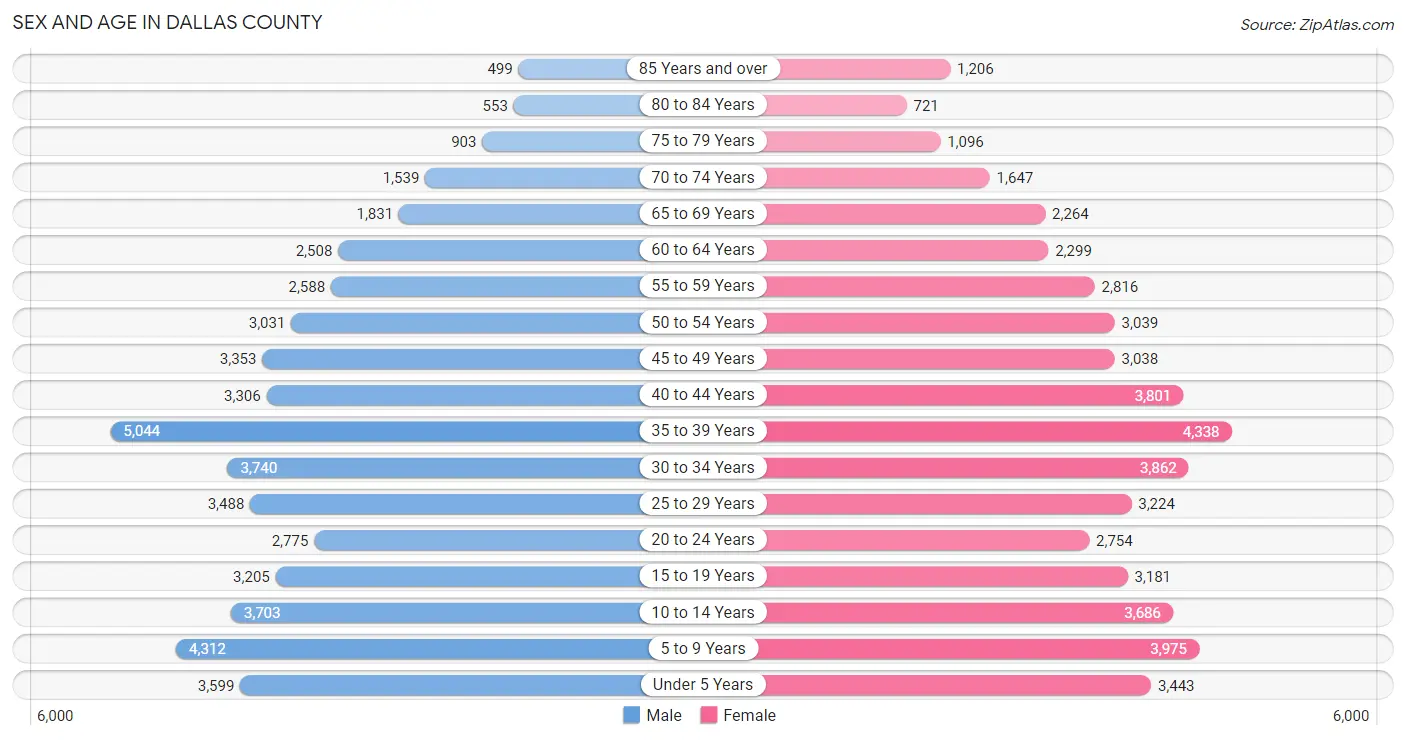
Sex and Age in Dallas County
Sex and Age in Dallas County
The most populous age groups in Dallas County are 35 to 39 Years (5,044 | 10.1%) for men and 35 to 39 Years (4,338 | 8.6%) for women.
| Age Bracket | Male | Female |
| Under 5 Years | 3,599 (7.2%) | 3,443 (6.8%) |
| 5 to 9 Years | 4,312 (8.6%) | 3,975 (7.9%) |
| 10 to 14 Years | 3,703 (7.4%) | 3,686 (7.3%) |
| 15 to 19 Years | 3,205 (6.4%) | 3,181 (6.3%) |
| 20 to 24 Years | 2,775 (5.6%) | 2,754 (5.5%) |
| 25 to 29 Years | 3,488 (7.0%) | 3,224 (6.4%) |
| 30 to 34 Years | 3,740 (7.5%) | 3,862 (7.7%) |
| 35 to 39 Years | 5,044 (10.1%) | 4,338 (8.6%) |
| 40 to 44 Years | 3,306 (6.6%) | 3,801 (7.5%) |
| 45 to 49 Years | 3,353 (6.7%) | 3,038 (6.0%) |
| 50 to 54 Years | 3,031 (6.1%) | 3,039 (6.0%) |
| 55 to 59 Years | 2,588 (5.2%) | 2,816 (5.6%) |
| 60 to 64 Years | 2,508 (5.0%) | 2,299 (4.6%) |
| 65 to 69 Years | 1,831 (3.7%) | 2,264 (4.5%) |
| 70 to 74 Years | 1,539 (3.1%) | 1,647 (3.3%) |
| 75 to 79 Years | 903 (1.8%) | 1,096 (2.2%) |
| 80 to 84 Years | 553 (1.1%) | 721 (1.4%) |
| 85 Years and over | 499 (1.0%) | 1,206 (2.4%) |
| Total | 49,977 (100.0%) | 50,390 (100.0%) |
Families and Households in Dallas County
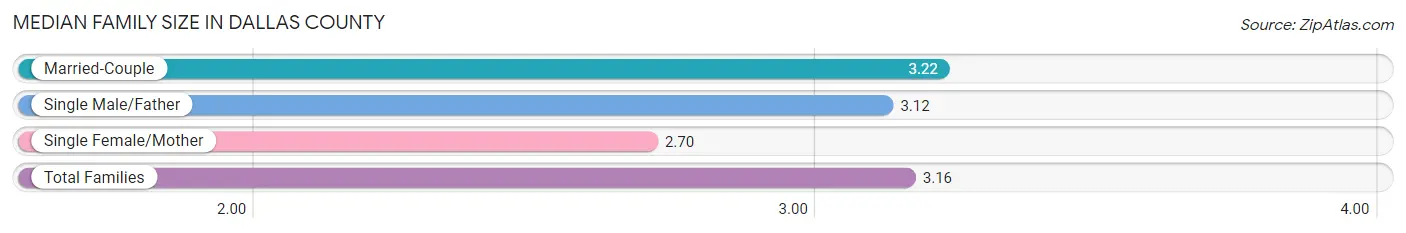
Median Family Size in Dallas County
The median family size in Dallas County is 3.16 persons per family, with married-couple families (21,321 | 83.1%) accounting for the largest median family size of 3.22 persons per family. On the other hand, single female/mother families (2,813 | 11.0%) represent the smallest median family size with 2.70 persons per family.
| Family Type | # Families | Family Size |
| Married-Couple | 21,321 (83.1%) | 3.22 |
| Single Male/Father | 1,516 (5.9%) | 3.12 |
| Single Female/Mother | 2,813 (11.0%) | 2.70 |
| Total Families | 25,650 (100.0%) | 3.16 |
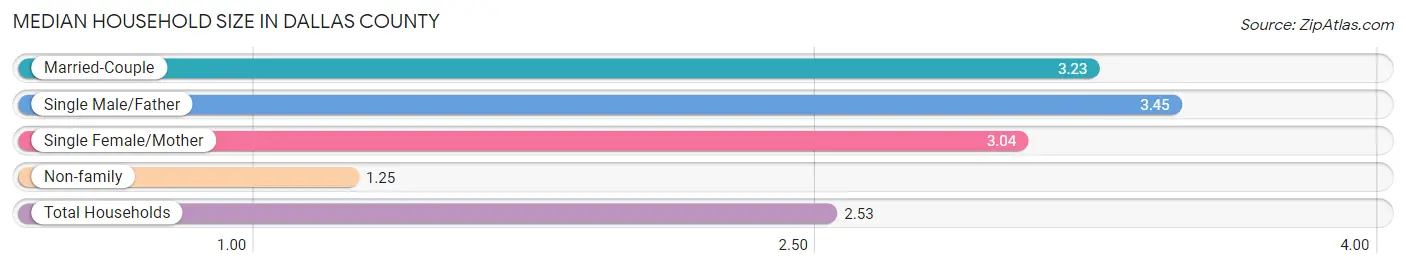
Median Household Size in Dallas County
The median household size in Dallas County is 2.53 persons per household, with single male/father households (1,516 | 3.8%) accounting for the largest median household size of 3.45 persons per household. non-family households (13,736 | 34.9%) represent the smallest median household size with 1.25 persons per household.
| Household Type | # Households | Household Size |
| Married-Couple | 21,321 (54.1%) | 3.23 |
| Single Male/Father | 1,516 (3.8%) | 3.45 |
| Single Female/Mother | 2,813 (7.1%) | 3.04 |
| Non-family | 13,736 (34.9%) | 1.25 |
| Total Households | 39,386 (100.0%) | 2.53 |
Household Size by Marriage Status in Dallas County
Out of a total of 39,386 households in Dallas County, 25,650 (65.1%) are family households, while 13,736 (34.9%) are nonfamily households. The most numerous type of family households are 2-person households, comprising 9,960, and the most common type of nonfamily households are 1-person households, comprising 10,582.
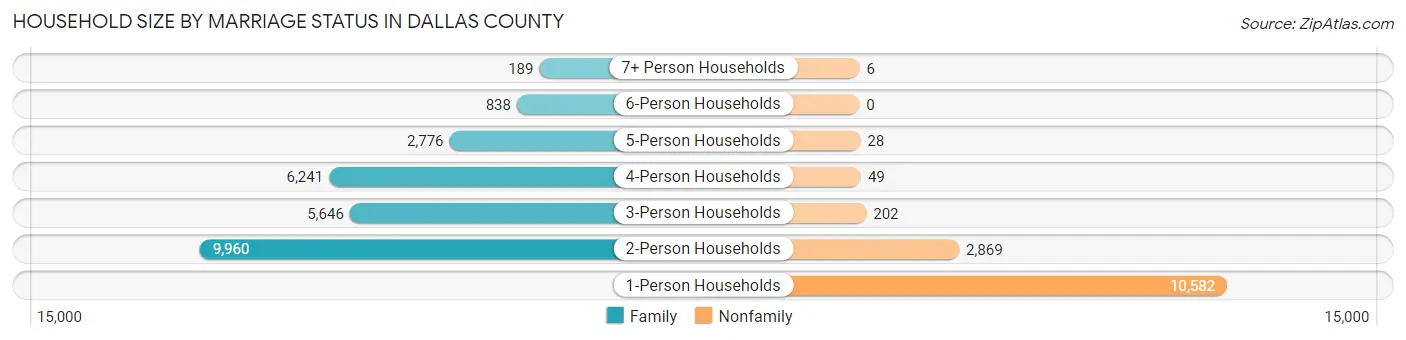
| Household Size | Family Households | Nonfamily Households |
| 1-Person Households | - | 10,582 (26.9%) |
| 2-Person Households | 9,960 (25.3%) | 2,869 (7.3%) |
| 3-Person Households | 5,646 (14.3%) | 202 (0.5%) |
| 4-Person Households | 6,241 (15.9%) | 49 (0.1%) |
| 5-Person Households | 2,776 (7.0%) | 28 (0.1%) |
| 6-Person Households | 838 (2.1%) | 0 (0.0%) |
| 7+ Person Households | 189 (0.5%) | 6 (0.0%) |
| Total | 25,650 (65.1%) | 13,736 (34.9%) |
Female Fertility in Dallas County
Fertility by Age in Dallas County
Average fertility rate in Dallas County is 65.0 births per 1,000 women. Women in the age bracket of 20 to 34 years have the highest fertility rate with 115.0 births per 1,000 women. Women in the age bracket of 20 to 34 years acount for 70.2% of all women with births.
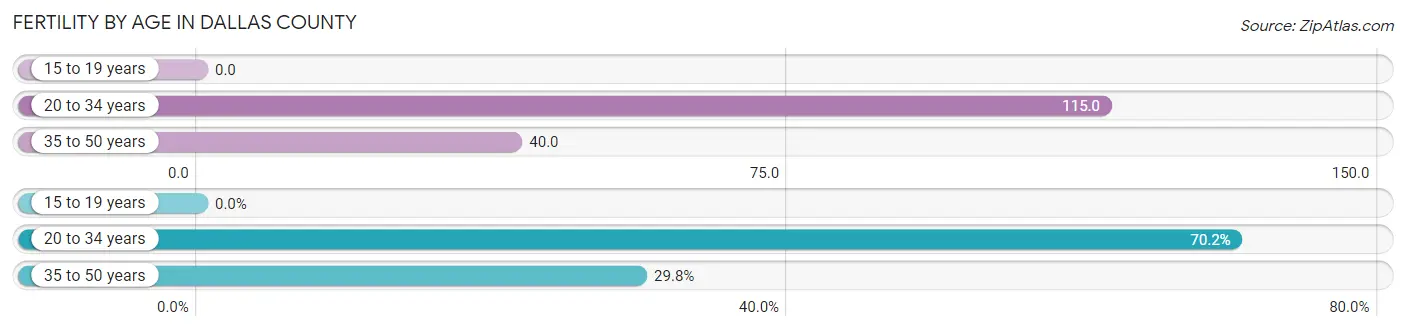
| Age Bracket | Women with Births | Births / 1,000 Women |
| 15 to 19 years | 0 (0.0%) | 0.0 |
| 20 to 34 years | 1,133 (70.2%) | 115.0 |
| 35 to 50 years | 481 (29.8%) | 40.0 |
| Total | 1,614 (100.0%) | 65.0 |
Fertility by Age by Marriage Status in Dallas County
86.0% of women with births (1,614) in Dallas County are married. The highest percentage of unmarried women with births falls into 20 to 34 years age bracket with 19.9% of them unmarried at the time of birth, while the lowest percentage of unmarried women with births belong to 35 to 50 years age bracket with 0.0% of them unmarried.
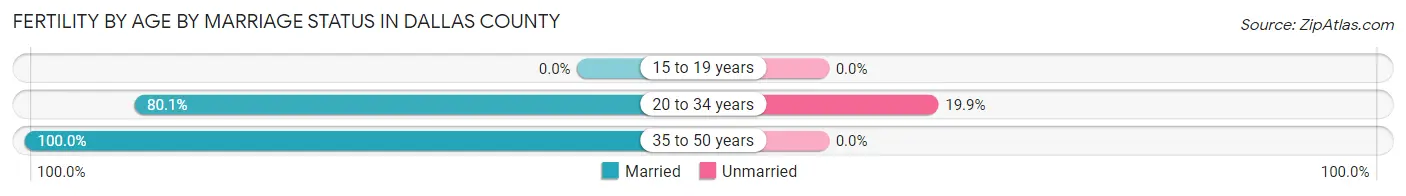
| Age Bracket | Married | Unmarried |
| 15 to 19 years | 0 (0.0%) | 0 (0.0%) |
| 20 to 34 years | 908 (80.1%) | 225 (19.9%) |
| 35 to 50 years | 481 (100.0%) | 0 (0.0%) |
| Total | 1,388 (86.0%) | 226 (14.0%) |
Fertility by Education in Dallas County
Average fertility rate in Dallas County is 65.0 births per 1,000 women. Women with the education attainment of bachelor's degree have the highest fertility rate of 78.0 births per 1,000 women, while women with the education attainment of less than high school have the lowest fertility at 22.0 births per 1,000 women. Women with the education attainment of bachelor's degree represent 43.1% of all women with births.
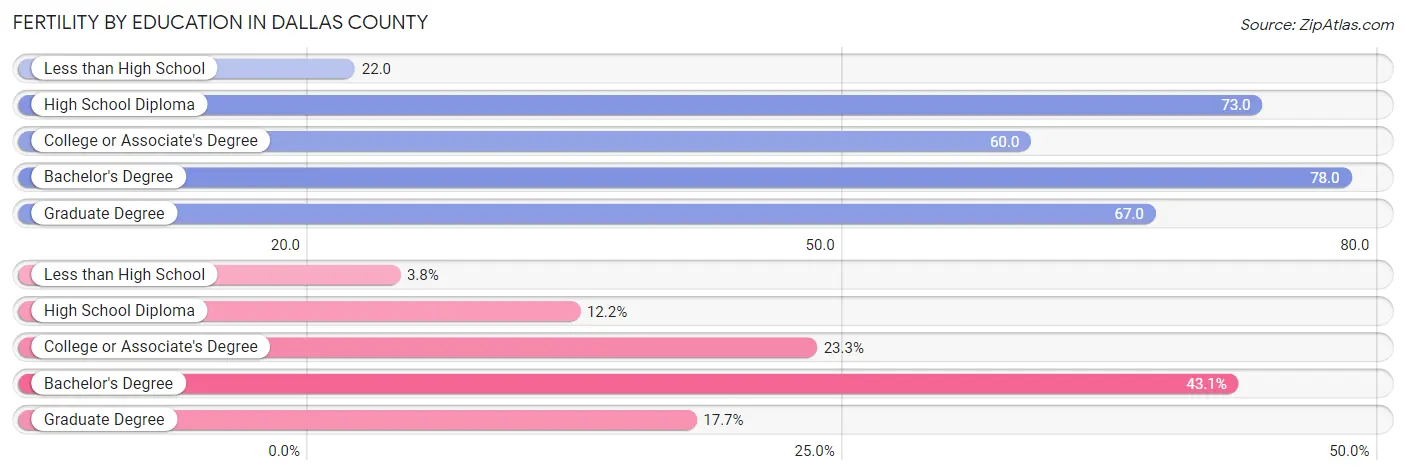
| Educational Attainment | Women with Births | Births / 1,000 Women |
| Less than High School | 61 (3.8%) | 22.0 |
| High School Diploma | 197 (12.2%) | 73.0 |
| College or Associate's Degree | 376 (23.3%) | 60.0 |
| Bachelor's Degree | 695 (43.1%) | 78.0 |
| Graduate Degree | 285 (17.7%) | 67.0 |
| Total | 1,614 (100.0%) | 65.0 |
Fertility by Education by Marriage Status in Dallas County
14.0% of women with births in Dallas County are unmarried. Women with the educational attainment of less than high school are most likely to be married with 100.0% of them married at childbirth, while women with the educational attainment of college or associate's degree are least likely to be married with 27.9% of them unmarried at childbirth.
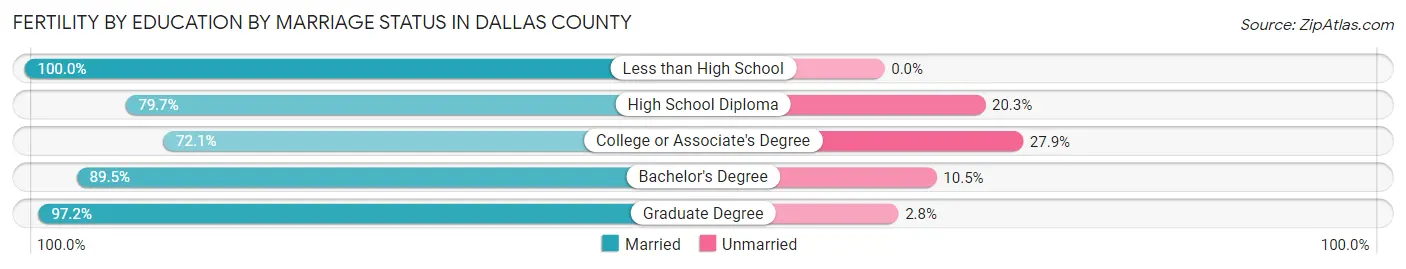
| Educational Attainment | Married | Unmarried |
| Less than High School | 61 (100.0%) | 0 (0.0%) |
| High School Diploma | 157 (79.7%) | 40 (20.3%) |
| College or Associate's Degree | 271 (72.1%) | 105 (27.9%) |
| Bachelor's Degree | 622 (89.5%) | 73 (10.5%) |
| Graduate Degree | 277 (97.2%) | 8 (2.8%) |
| Total | 1,388 (86.0%) | 226 (14.0%) |
Employment Characteristics in Dallas County
Employment by Class of Employer in Dallas County
Among the 54,746 employed individuals in Dallas County, private company employees (37,812 | 69.1%), not-for-profit organizations (4,528 | 8.3%), and local government employees (3,747 | 6.8%) make up the most common classes of employment.
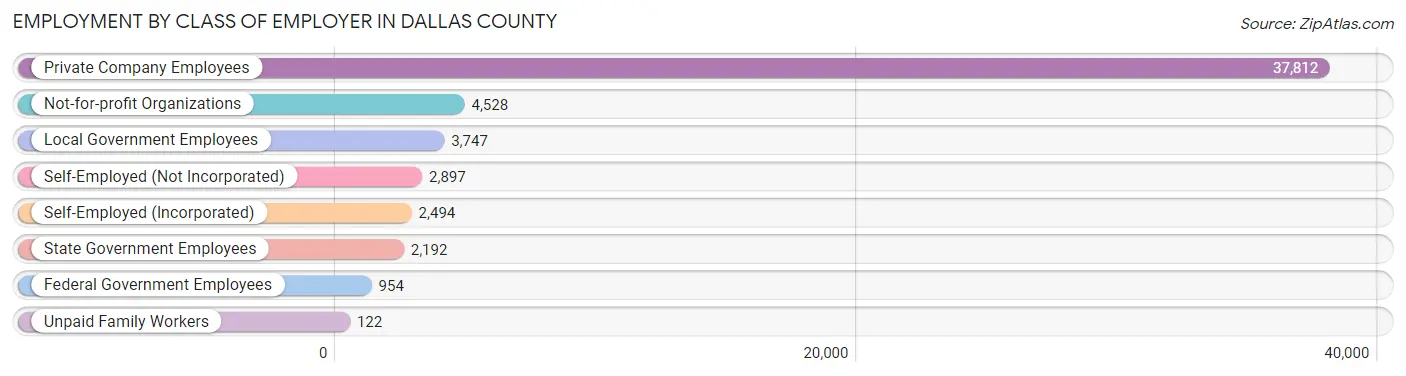
| Employer Class | # Employees | % Employees |
| Private Company Employees | 37,812 | 69.1% |
| Self-Employed (Incorporated) | 2,494 | 4.6% |
| Self-Employed (Not Incorporated) | 2,897 | 5.3% |
| Not-for-profit Organizations | 4,528 | 8.3% |
| Local Government Employees | 3,747 | 6.8% |
| State Government Employees | 2,192 | 4.0% |
| Federal Government Employees | 954 | 1.7% |
| Unpaid Family Workers | 122 | 0.2% |
| Total | 54,746 | 100.0% |
Employment Status by Age in Dallas County
According to the labor force statistics for Dallas County, out of the total population over 16 years of age (75,882), 75.4% or 57,215 individuals are in the labor force, with 3.0% or 1,716 of them unemployed. The age group with the highest labor force participation rate is 25 to 29 years, with 93.2% or 6,256 individuals in the labor force. Within the labor force, the 16 to 19 years age range has the highest percentage of unemployed individuals, with 15.4% or 404 of them being unemployed.
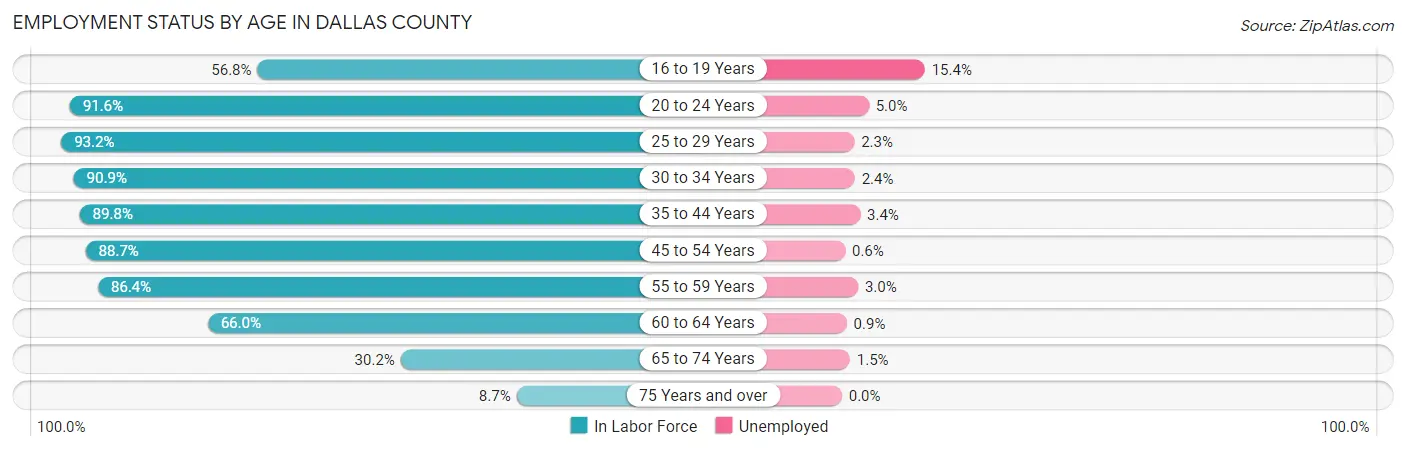
| Age Bracket | In Labor Force | Unemployed |
| 16 to 19 Years | 2,624 (56.8%) | 404 (15.4%) |
| 20 to 24 Years | 5,065 (91.6%) | 253 (5.0%) |
| 25 to 29 Years | 6,256 (93.2%) | 144 (2.3%) |
| 30 to 34 Years | 6,910 (90.9%) | 166 (2.4%) |
| 35 to 44 Years | 14,807 (89.8%) | 503 (3.4%) |
| 45 to 54 Years | 11,053 (88.7%) | 66 (0.6%) |
| 55 to 59 Years | 4,669 (86.4%) | 140 (3.0%) |
| 60 to 64 Years | 3,173 (66.0%) | 29 (0.9%) |
| 65 to 74 Years | 2,199 (30.2%) | 33 (1.5%) |
| 75 Years and over | 433 (8.7%) | 0 (0.0%) |
| Total | 57,215 (75.4%) | 1,716 (3.0%) |
Employment Status by Educational Attainment in Dallas County
According to labor force statistics for Dallas County, 87.6% of individuals (46,844) out of the total population between 25 and 64 years of age (53,475) are in the labor force, with 2.2% or 1,031 of them being unemployed. The group with the highest labor force participation rate are those with the educational attainment of bachelor's degree or higher, with 90.6% or 26,841 individuals in the labor force. Within the labor force, individuals with high school diploma education have the highest percentage of unemployment, with 5.2% or 359 of them being unemployed.
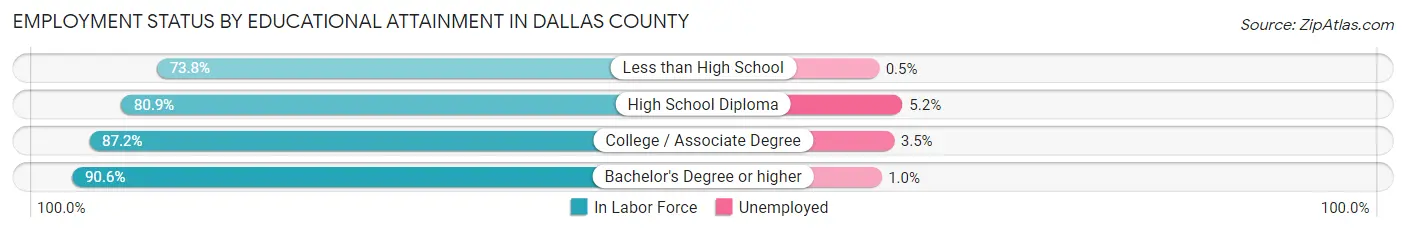
| Educational Attainment | In Labor Force | Unemployed |
| Less than High School | 1,345 (73.8%) | 9 (0.5%) |
| High School Diploma | 6,897 (80.9%) | 443 (5.2%) |
| College / Associate Degree | 11,773 (87.2%) | 473 (3.5%) |
| Bachelor's Degree or higher | 26,841 (90.6%) | 296 (1.0%) |
| Total | 46,844 (87.6%) | 1,176 (2.2%) |
Employment Occupations by Sex in Dallas County
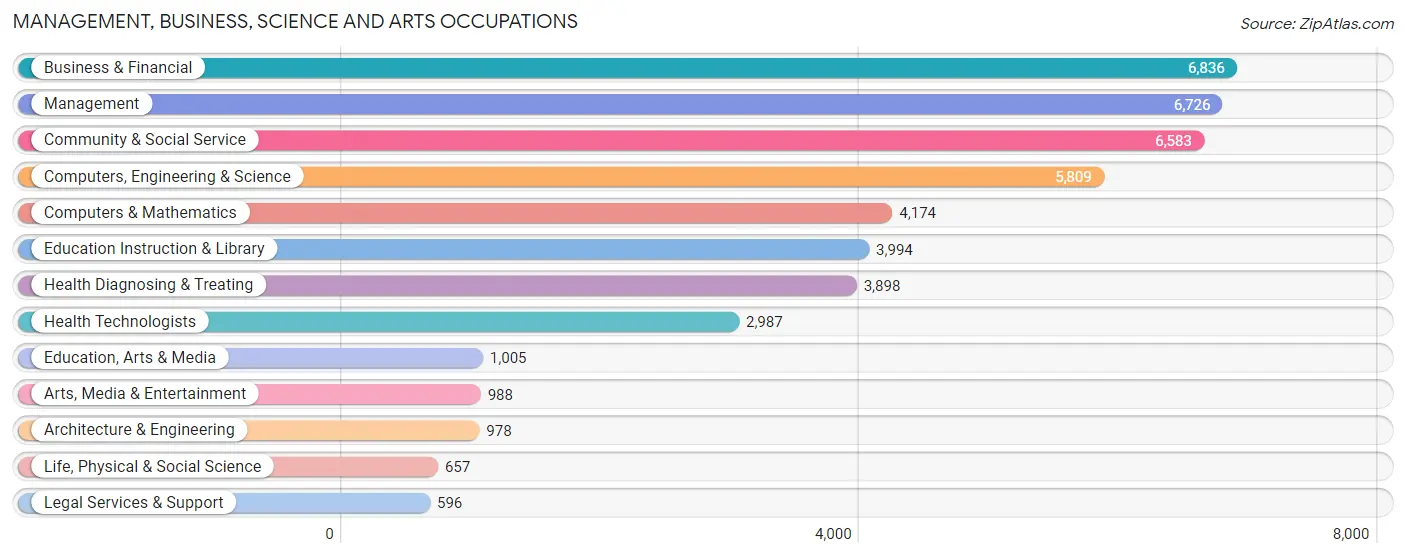
Management, Business, Science and Arts Occupations
The most common Management, Business, Science and Arts occupations in Dallas County are Business & Financial (6,836 | 12.3%), Management (6,726 | 12.1%), Community & Social Service (6,583 | 11.9%), Computers, Engineering & Science (5,809 | 10.5%), and Computers & Mathematics (4,174 | 7.5%).
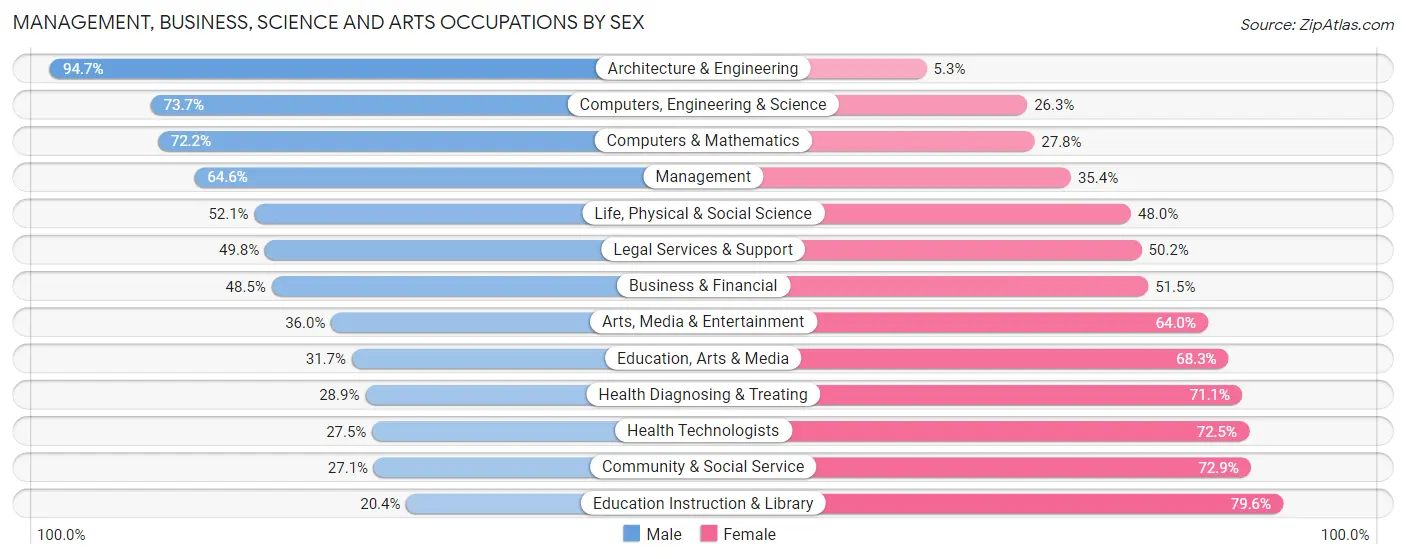
Management, Business, Science and Arts Occupations by Sex
Within the Management, Business, Science and Arts occupations in Dallas County, the most male-oriented occupations are Architecture & Engineering (94.7%), Computers, Engineering & Science (73.7%), and Computers & Mathematics (72.2%), while the most female-oriented occupations are Education Instruction & Library (79.6%), Community & Social Service (72.9%), and Health Technologists (72.5%).
| Occupation | Male | Female |
| Management | 4,343 (64.6%) | 2,383 (35.4%) |
| Business & Financial | 3,313 (48.5%) | 3,523 (51.5%) |
| Computers, Engineering & Science | 4,282 (73.7%) | 1,527 (26.3%) |
| Computers & Mathematics | 3,014 (72.2%) | 1,160 (27.8%) |
| Architecture & Engineering | 926 (94.7%) | 52 (5.3%) |
| Life, Physical & Social Science | 342 (52.0%) | 315 (47.9%) |
| Community & Social Service | 1,786 (27.1%) | 4,797 (72.9%) |
| Education, Arts & Media | 319 (31.7%) | 686 (68.3%) |
| Legal Services & Support | 297 (49.8%) | 299 (50.2%) |
| Education Instruction & Library | 814 (20.4%) | 3,180 (79.6%) |
| Arts, Media & Entertainment | 356 (36.0%) | 632 (64.0%) |
| Health Diagnosing & Treating | 1,128 (28.9%) | 2,770 (71.1%) |
| Health Technologists | 821 (27.5%) | 2,166 (72.5%) |
| Total (Category) | 14,852 (49.7%) | 15,000 (50.2%) |
| Total (Overall) | 29,476 (53.2%) | 25,920 (46.8%) |
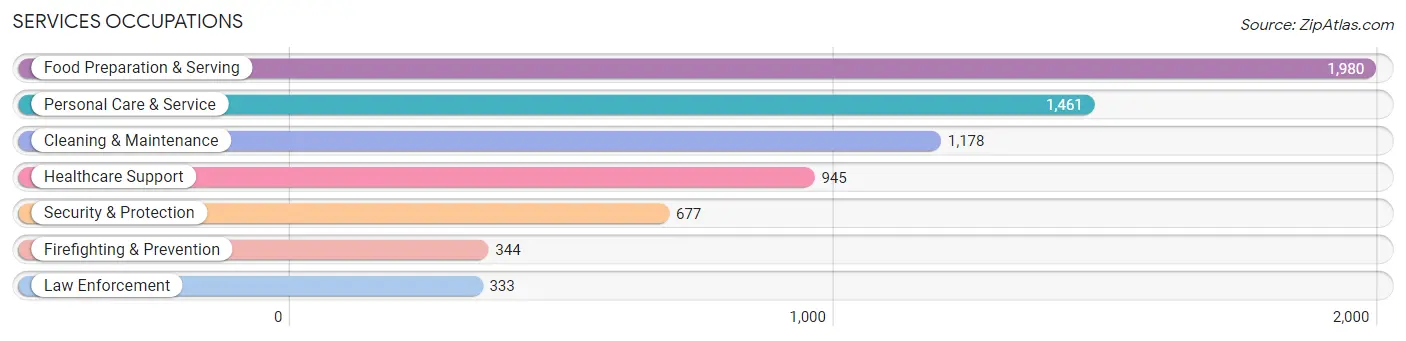
Services Occupations
The most common Services occupations in Dallas County are Food Preparation & Serving (1,980 | 3.6%), Personal Care & Service (1,461 | 2.6%), Cleaning & Maintenance (1,178 | 2.1%), Healthcare Support (945 | 1.7%), and Security & Protection (677 | 1.2%).
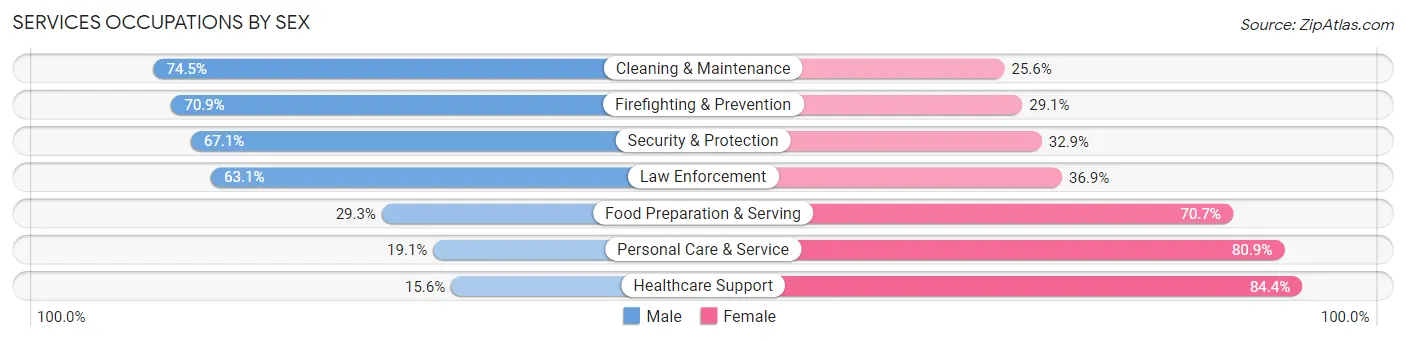
Services Occupations by Sex
Within the Services occupations in Dallas County, the most male-oriented occupations are Cleaning & Maintenance (74.5%), Firefighting & Prevention (70.9%), and Security & Protection (67.1%), while the most female-oriented occupations are Healthcare Support (84.4%), Personal Care & Service (80.9%), and Food Preparation & Serving (70.7%).
| Occupation | Male | Female |
| Healthcare Support | 147 (15.6%) | 798 (84.4%) |
| Security & Protection | 454 (67.1%) | 223 (32.9%) |
| Firefighting & Prevention | 244 (70.9%) | 100 (29.1%) |
| Law Enforcement | 210 (63.1%) | 123 (36.9%) |
| Food Preparation & Serving | 580 (29.3%) | 1,400 (70.7%) |
| Cleaning & Maintenance | 877 (74.5%) | 301 (25.6%) |
| Personal Care & Service | 279 (19.1%) | 1,182 (80.9%) |
| Total (Category) | 2,337 (37.4%) | 3,904 (62.5%) |
| Total (Overall) | 29,476 (53.2%) | 25,920 (46.8%) |
Sales and Office Occupations
The most common Sales and Office occupations in Dallas County are Office & Administration (5,516 | 10.0%), and Sales & Related (5,070 | 9.1%).

Sales and Office Occupations by Sex

| Occupation | Male | Female |
| Sales & Related | 3,087 (60.9%) | 1,983 (39.1%) |
| Office & Administration | 1,821 (33.0%) | 3,695 (67.0%) |
| Total (Category) | 4,908 (46.4%) | 5,678 (53.6%) |
| Total (Overall) | 29,476 (53.2%) | 25,920 (46.8%) |
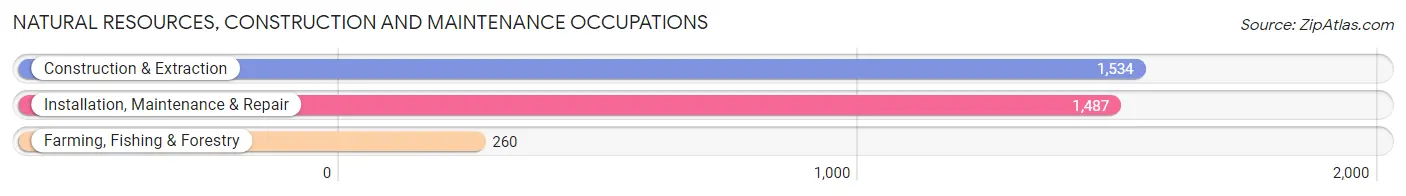
Natural Resources, Construction and Maintenance Occupations
The most common Natural Resources, Construction and Maintenance occupations in Dallas County are Construction & Extraction (1,534 | 2.8%), Installation, Maintenance & Repair (1,487 | 2.7%), and Farming, Fishing & Forestry (260 | 0.5%).
Natural Resources, Construction and Maintenance Occupations by Sex
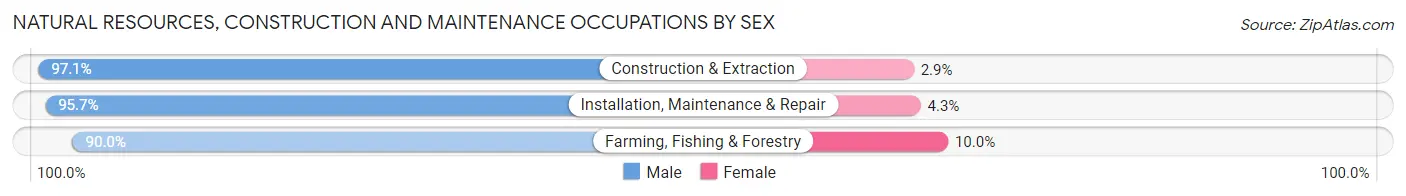
| Occupation | Male | Female |
| Farming, Fishing & Forestry | 234 (90.0%) | 26 (10.0%) |
| Construction & Extraction | 1,490 (97.1%) | 44 (2.9%) |
| Installation, Maintenance & Repair | 1,423 (95.7%) | 64 (4.3%) |
| Total (Category) | 3,147 (95.9%) | 134 (4.1%) |
| Total (Overall) | 29,476 (53.2%) | 25,920 (46.8%) |
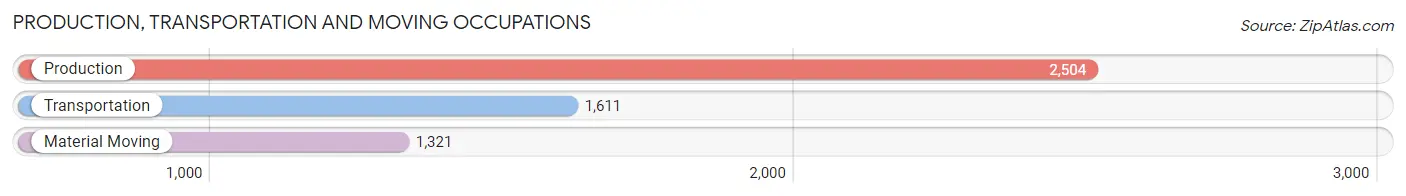
Production, Transportation and Moving Occupations
The most common Production, Transportation and Moving occupations in Dallas County are Production (2,504 | 4.5%), Transportation (1,611 | 2.9%), and Material Moving (1,321 | 2.4%).
Production, Transportation and Moving Occupations by Sex
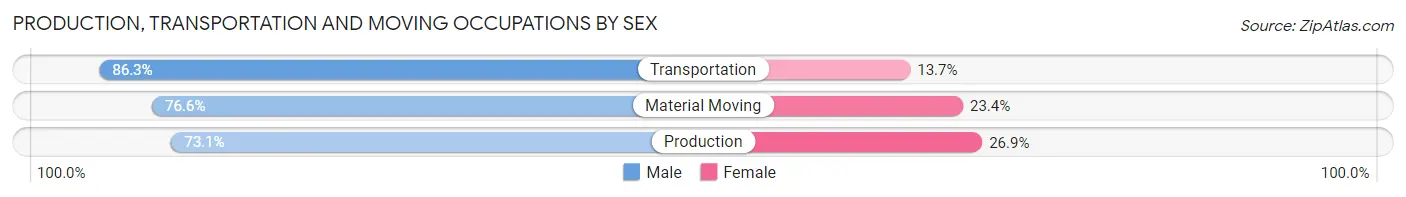
| Occupation | Male | Female |
| Production | 1,830 (73.1%) | 674 (26.9%) |
| Transportation | 1,390 (86.3%) | 221 (13.7%) |
| Material Moving | 1,012 (76.6%) | 309 (23.4%) |
| Total (Category) | 4,232 (77.8%) | 1,204 (22.2%) |
| Total (Overall) | 29,476 (53.2%) | 25,920 (46.8%) |
Employment Industries by Sex in Dallas County
Employment Industries in Dallas County
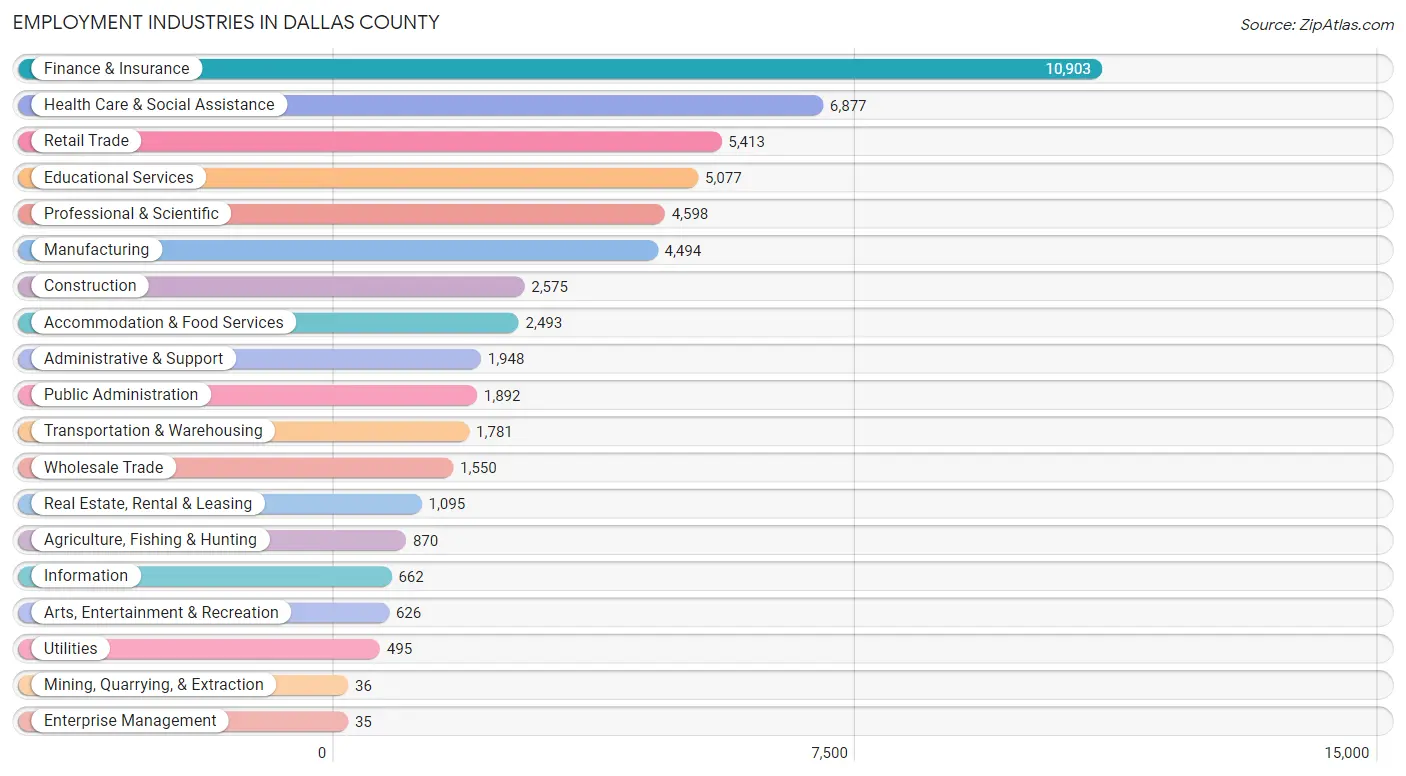
The major employment industries in Dallas County include Finance & Insurance (10,903 | 19.7%), Health Care & Social Assistance (6,877 | 12.4%), Retail Trade (5,413 | 9.8%), Educational Services (5,077 | 9.2%), and Professional & Scientific (4,598 | 8.3%).
Employment Industries by Sex in Dallas County
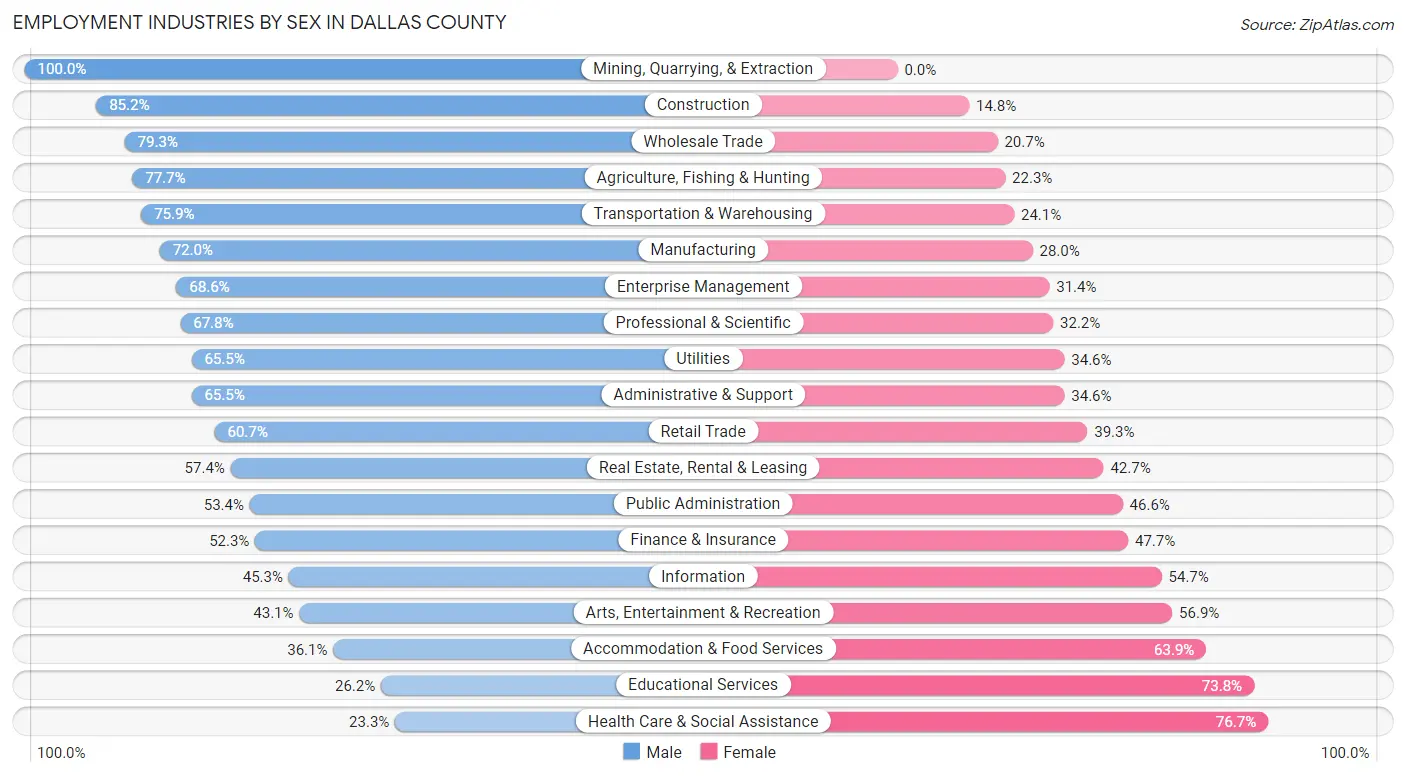
The Dallas County industries that see more men than women are Mining, Quarrying, & Extraction (100.0%), Construction (85.2%), and Wholesale Trade (79.3%), whereas the industries that tend to have a higher number of women are Health Care & Social Assistance (76.7%), Educational Services (73.8%), and Accommodation & Food Services (63.9%).
| Industry | Male | Female |
| Agriculture, Fishing & Hunting | 676 (77.7%) | 194 (22.3%) |
| Mining, Quarrying, & Extraction | 36 (100.0%) | 0 (0.0%) |
| Construction | 2,193 (85.2%) | 382 (14.8%) |
| Manufacturing | 3,237 (72.0%) | 1,257 (28.0%) |
| Wholesale Trade | 1,229 (79.3%) | 321 (20.7%) |
| Retail Trade | 3,285 (60.7%) | 2,128 (39.3%) |
| Transportation & Warehousing | 1,351 (75.9%) | 430 (24.1%) |
| Utilities | 324 (65.4%) | 171 (34.5%) |
| Information | 300 (45.3%) | 362 (54.7%) |
| Finance & Insurance | 5,699 (52.3%) | 5,204 (47.7%) |
| Real Estate, Rental & Leasing | 628 (57.4%) | 467 (42.6%) |
| Professional & Scientific | 3,116 (67.8%) | 1,482 (32.2%) |
| Enterprise Management | 24 (68.6%) | 11 (31.4%) |
| Administrative & Support | 1,275 (65.4%) | 673 (34.5%) |
| Educational Services | 1,331 (26.2%) | 3,746 (73.8%) |
| Health Care & Social Assistance | 1,602 (23.3%) | 5,275 (76.7%) |
| Arts, Entertainment & Recreation | 270 (43.1%) | 356 (56.9%) |
| Accommodation & Food Services | 900 (36.1%) | 1,593 (63.9%) |
| Public Administration | 1,010 (53.4%) | 882 (46.6%) |
| Total | 29,476 (53.2%) | 25,920 (46.8%) |
Education in Dallas County
School Enrollment in Dallas County
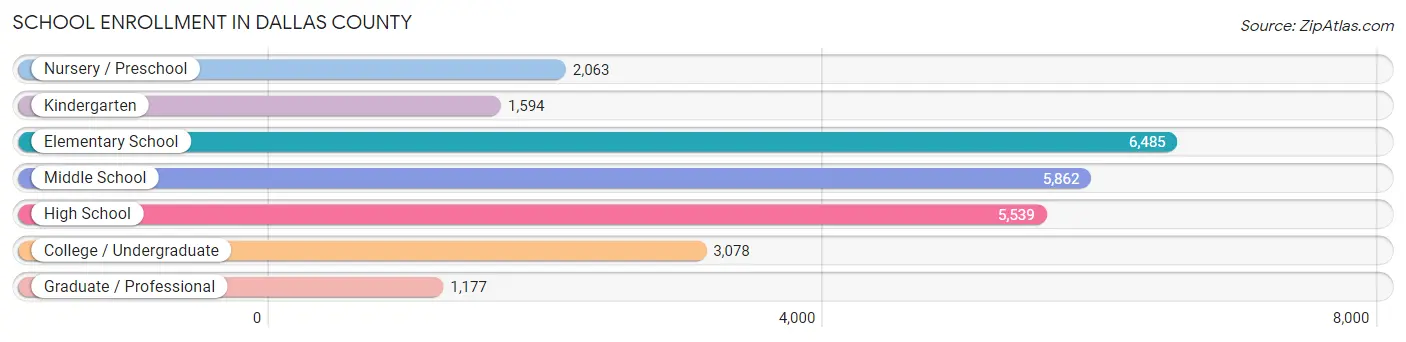
The most common levels of schooling among the 25,798 students in Dallas County are elementary school (6,485 | 25.1%), middle school (5,862 | 22.7%), and high school (5,539 | 21.5%).
| School Level | # Students | % Students |
| Nursery / Preschool | 2,063 | 8.0% |
| Kindergarten | 1,594 | 6.2% |
| Elementary School | 6,485 | 25.1% |
| Middle School | 5,862 | 22.7% |
| High School | 5,539 | 21.5% |
| College / Undergraduate | 3,078 | 11.9% |
| Graduate / Professional | 1,177 | 4.6% |
| Total | 25,798 | 100.0% |
School Enrollment by Age by Funding Source in Dallas County
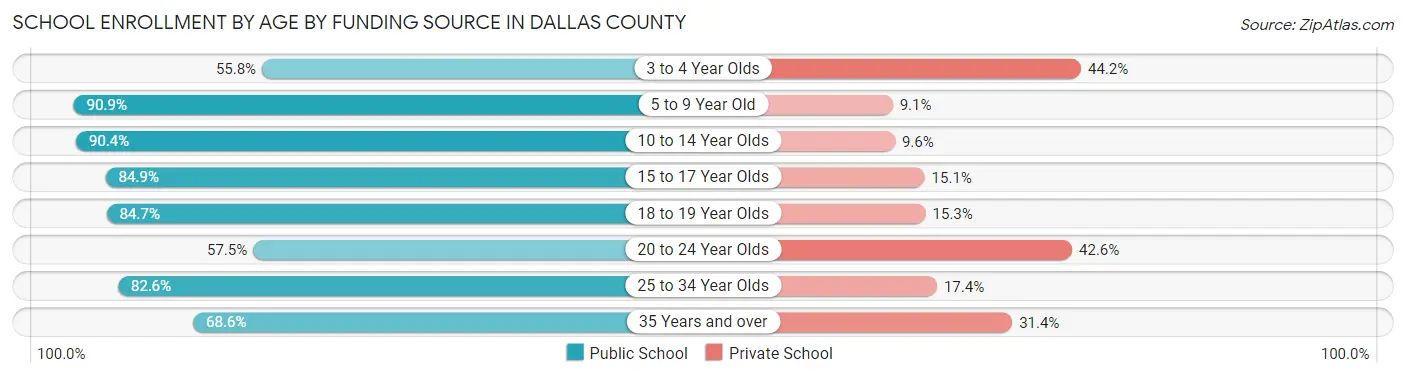
Out of a total of 25,798 students who are enrolled in schools in Dallas County, 3,973 (15.4%) attend a private institution, while the remaining 21,825 (84.6%) are enrolled in public schools. The age group of 3 to 4 year olds has the highest likelihood of being enrolled in private schools, with 565 (44.2% in the age bracket) enrolled. Conversely, the age group of 5 to 9 year old has the lowest likelihood of being enrolled in a private school, with 7,279 (90.9% in the age bracket) attending a public institution.
| Age Bracket | Public School | Private School |
| 3 to 4 Year Olds | 713 (55.8%) | 565 (44.2%) |
| 5 to 9 Year Old | 7,279 (90.9%) | 731 (9.1%) |
| 10 to 14 Year Olds | 6,584 (90.4%) | 696 (9.6%) |
| 15 to 17 Year Olds | 3,619 (84.9%) | 643 (15.1%) |
| 18 to 19 Year Olds | 1,205 (84.7%) | 217 (15.3%) |
| 20 to 24 Year Olds | 841 (57.5%) | 623 (42.5%) |
| 25 to 34 Year Olds | 941 (82.6%) | 198 (17.4%) |
| 35 Years and over | 647 (68.6%) | 296 (31.4%) |
| Total | 21,825 (84.6%) | 3,973 (15.4%) |
Educational Attainment by Field of Study in Dallas County
Business (10,242 | 27.6%), education (4,210 | 11.3%), bio, nature & agricultural (3,096 | 8.3%), arts & humanities (2,755 | 7.4%), and science & technology (2,725 | 7.3%) are the most common fields of study among 37,176 individuals in Dallas County who have obtained a bachelor's degree or higher.
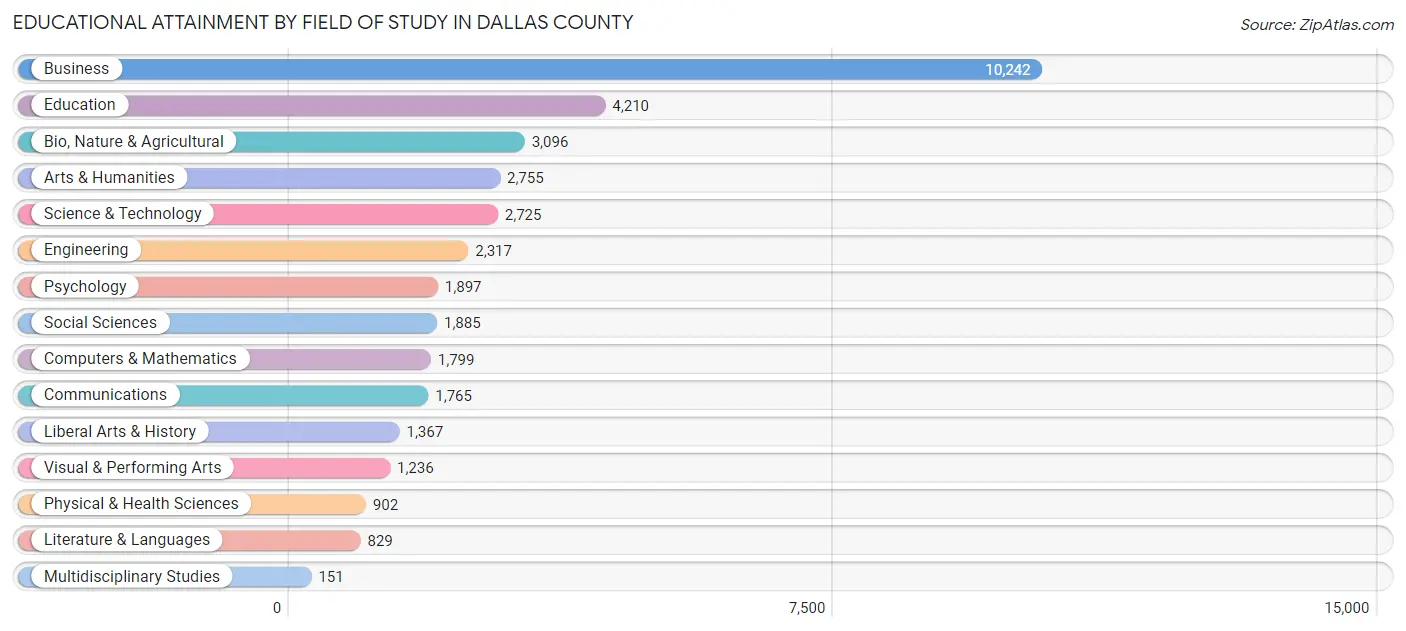
| Field of Study | # Graduates | % Graduates |
| Computers & Mathematics | 1,799 | 4.8% |
| Bio, Nature & Agricultural | 3,096 | 8.3% |
| Physical & Health Sciences | 902 | 2.4% |
| Psychology | 1,897 | 5.1% |
| Social Sciences | 1,885 | 5.1% |
| Engineering | 2,317 | 6.2% |
| Multidisciplinary Studies | 151 | 0.4% |
| Science & Technology | 2,725 | 7.3% |
| Business | 10,242 | 27.6% |
| Education | 4,210 | 11.3% |
| Literature & Languages | 829 | 2.2% |
| Liberal Arts & History | 1,367 | 3.7% |
| Visual & Performing Arts | 1,236 | 3.3% |
| Communications | 1,765 | 4.8% |
| Arts & Humanities | 2,755 | 7.4% |
| Total | 37,176 | 100.0% |
Transportation & Commute in Dallas County
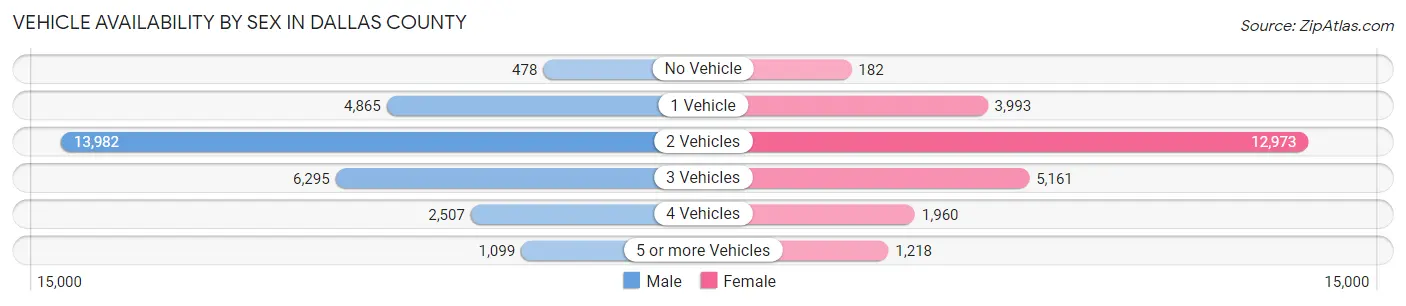
Vehicle Availability by Sex in Dallas County
The most prevalent vehicle ownership categories in Dallas County are males with 2 vehicles (13,982, accounting for 47.8%) and females with 2 vehicles (12,973, making up 54.9%).
| Vehicles Available | Male | Female |
| No Vehicle | 478 (1.6%) | 182 (0.7%) |
| 1 Vehicle | 4,865 (16.7%) | 3,993 (15.7%) |
| 2 Vehicles | 13,982 (47.8%) | 12,973 (50.9%) |
| 3 Vehicles | 6,295 (21.5%) | 5,161 (20.3%) |
| 4 Vehicles | 2,507 (8.6%) | 1,960 (7.7%) |
| 5 or more Vehicles | 1,099 (3.8%) | 1,218 (4.8%) |
| Total | 29,226 (100.0%) | 25,487 (100.0%) |
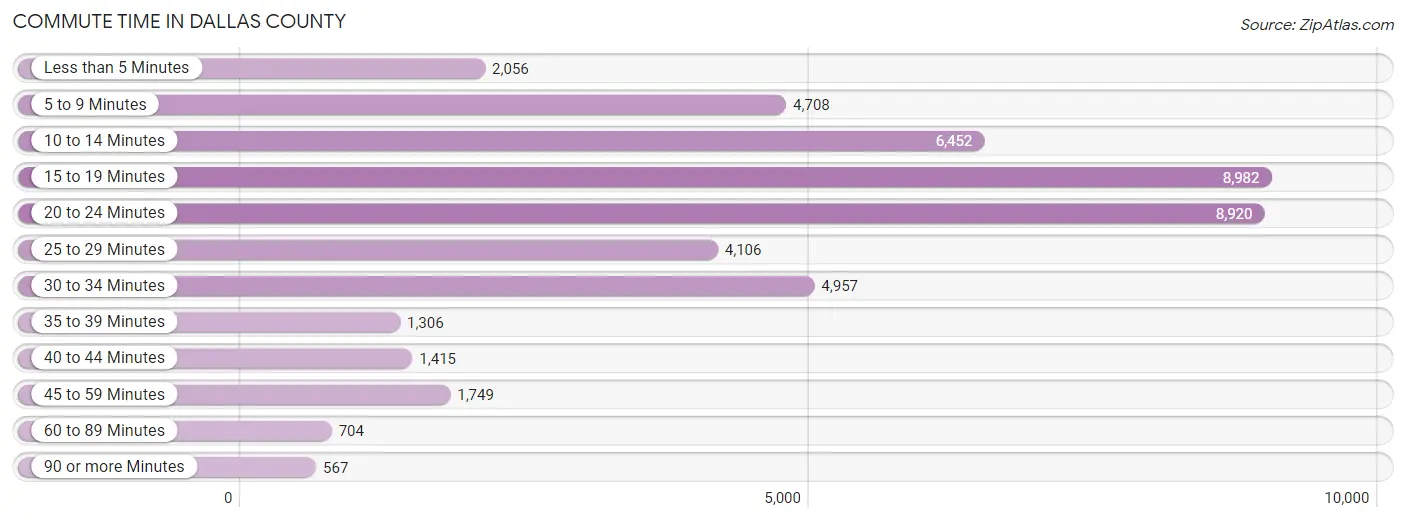
Commute Time in Dallas County
The most frequently occuring commute durations in Dallas County are 15 to 19 minutes (8,982 commuters, 19.6%), 20 to 24 minutes (8,920 commuters, 19.4%), and 10 to 14 minutes (6,452 commuters, 14.1%).
| Commute Time | # Commuters | % Commuters |
| Less than 5 Minutes | 2,056 | 4.5% |
| 5 to 9 Minutes | 4,708 | 10.2% |
| 10 to 14 Minutes | 6,452 | 14.1% |
| 15 to 19 Minutes | 8,982 | 19.6% |
| 20 to 24 Minutes | 8,920 | 19.4% |
| 25 to 29 Minutes | 4,106 | 8.9% |
| 30 to 34 Minutes | 4,957 | 10.8% |
| 35 to 39 Minutes | 1,306 | 2.8% |
| 40 to 44 Minutes | 1,415 | 3.1% |
| 45 to 59 Minutes | 1,749 | 3.8% |
| 60 to 89 Minutes | 704 | 1.5% |
| 90 or more Minutes | 567 | 1.2% |
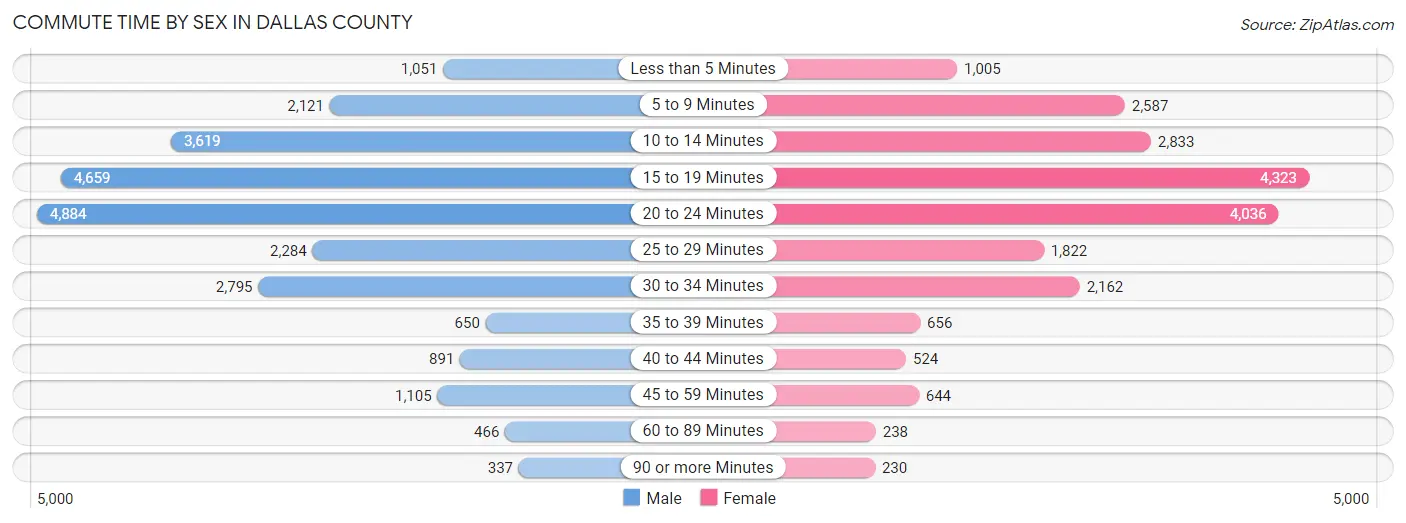
Commute Time by Sex in Dallas County
The most common commute times in Dallas County are 20 to 24 minutes (4,884 commuters, 19.6%) for males and 15 to 19 minutes (4,323 commuters, 20.5%) for females.
| Commute Time | Male | Female |
| Less than 5 Minutes | 1,051 (4.2%) | 1,005 (4.8%) |
| 5 to 9 Minutes | 2,121 (8.5%) | 2,587 (12.3%) |
| 10 to 14 Minutes | 3,619 (14.6%) | 2,833 (13.5%) |
| 15 to 19 Minutes | 4,659 (18.7%) | 4,323 (20.5%) |
| 20 to 24 Minutes | 4,884 (19.6%) | 4,036 (19.2%) |
| 25 to 29 Minutes | 2,284 (9.2%) | 1,822 (8.6%) |
| 30 to 34 Minutes | 2,795 (11.2%) | 2,162 (10.3%) |
| 35 to 39 Minutes | 650 (2.6%) | 656 (3.1%) |
| 40 to 44 Minutes | 891 (3.6%) | 524 (2.5%) |
| 45 to 59 Minutes | 1,105 (4.4%) | 644 (3.1%) |
| 60 to 89 Minutes | 466 (1.9%) | 238 (1.1%) |
| 90 or more Minutes | 337 (1.4%) | 230 (1.1%) |
Time of Departure to Work by Sex in Dallas County
The most frequent times of departure to work in Dallas County are 7:30 AM to 7:59 AM (4,432, 17.8%) for males and 7:30 AM to 7:59 AM (4,181, 19.9%) for females.
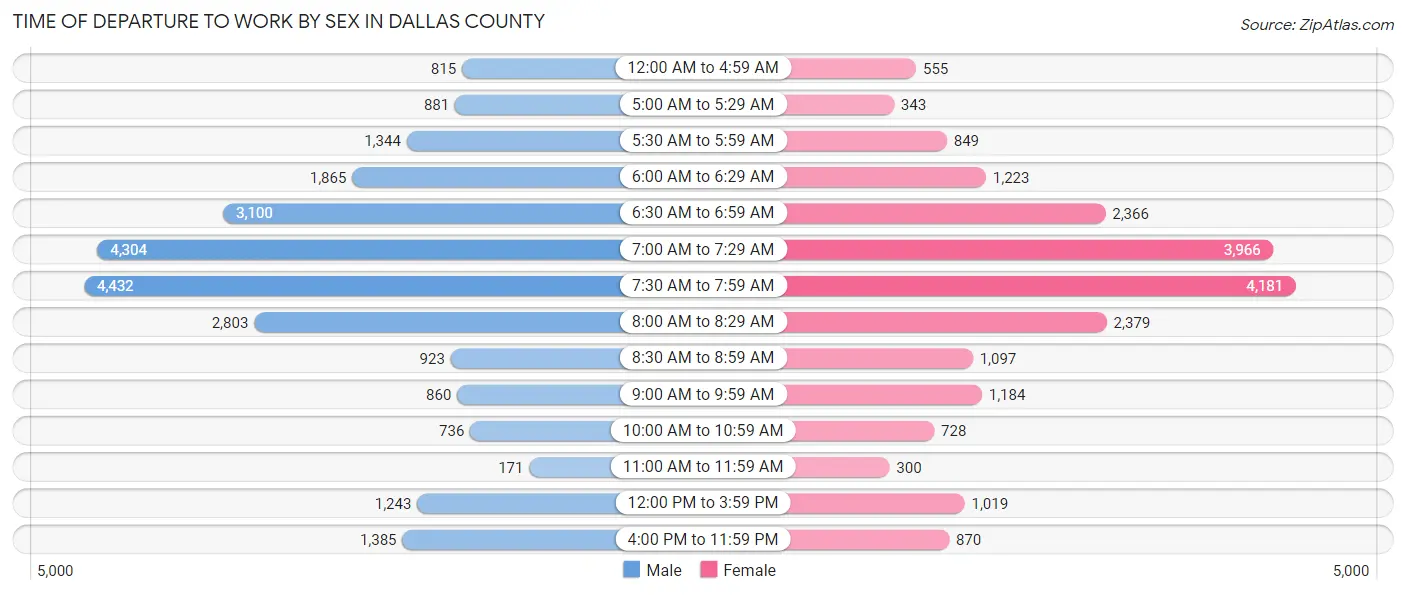
| Time of Departure | Male | Female |
| 12:00 AM to 4:59 AM | 815 (3.3%) | 555 (2.6%) |
| 5:00 AM to 5:29 AM | 881 (3.5%) | 343 (1.6%) |
| 5:30 AM to 5:59 AM | 1,344 (5.4%) | 849 (4.0%) |
| 6:00 AM to 6:29 AM | 1,865 (7.5%) | 1,223 (5.8%) |
| 6:30 AM to 6:59 AM | 3,100 (12.5%) | 2,366 (11.2%) |
| 7:00 AM to 7:29 AM | 4,304 (17.3%) | 3,966 (18.8%) |
| 7:30 AM to 7:59 AM | 4,432 (17.8%) | 4,181 (19.9%) |
| 8:00 AM to 8:29 AM | 2,803 (11.3%) | 2,379 (11.3%) |
| 8:30 AM to 8:59 AM | 923 (3.7%) | 1,097 (5.2%) |
| 9:00 AM to 9:59 AM | 860 (3.5%) | 1,184 (5.6%) |
| 10:00 AM to 10:59 AM | 736 (3.0%) | 728 (3.5%) |
| 11:00 AM to 11:59 AM | 171 (0.7%) | 300 (1.4%) |
| 12:00 PM to 3:59 PM | 1,243 (5.0%) | 1,019 (4.8%) |
| 4:00 PM to 11:59 PM | 1,385 (5.6%) | 870 (4.1%) |
| Total | 24,862 (100.0%) | 21,060 (100.0%) |
Housing Occupancy in Dallas County
Occupancy by Ownership in Dallas County
Of the total 39,386 dwellings in Dallas County, owner-occupied units account for 27,728 (70.4%), while renter-occupied units make up 11,658 (29.6%).
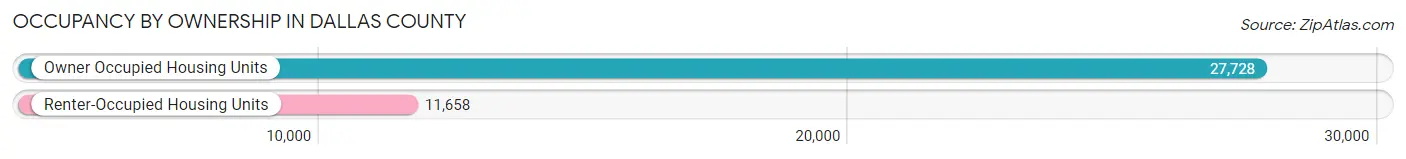
| Occupancy | # Housing Units | % Housing Units |
| Owner Occupied Housing Units | 27,728 | 70.4% |
| Renter-Occupied Housing Units | 11,658 | 29.6% |
| Total Occupied Housing Units | 39,386 | 100.0% |
Occupancy by Household Size in Dallas County
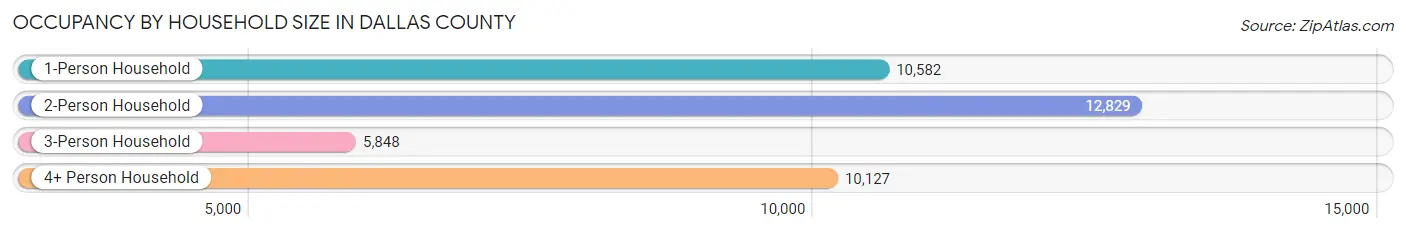
| Household Size | # Housing Units | % Housing Units |
| 1-Person Household | 10,582 | 26.9% |
| 2-Person Household | 12,829 | 32.6% |
| 3-Person Household | 5,848 | 14.8% |
| 4+ Person Household | 10,127 | 25.7% |
| Total Housing Units | 39,386 | 100.0% |
Occupancy by Ownership by Household Size in Dallas County
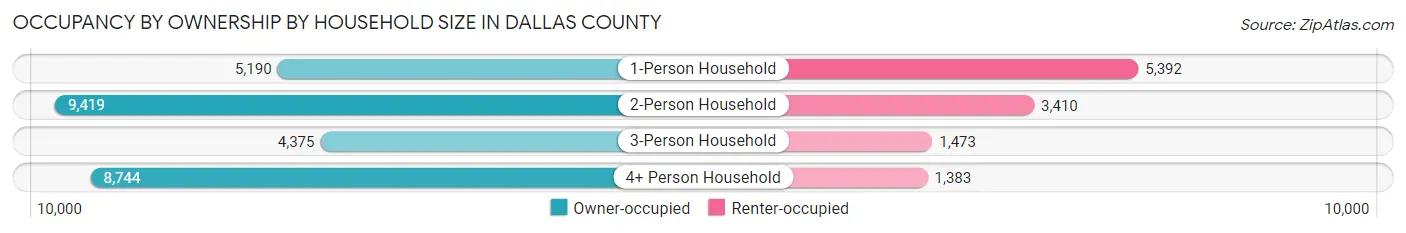
| Household Size | Owner-occupied | Renter-occupied |
| 1-Person Household | 5,190 (49.0%) | 5,392 (50.9%) |
| 2-Person Household | 9,419 (73.4%) | 3,410 (26.6%) |
| 3-Person Household | 4,375 (74.8%) | 1,473 (25.2%) |
| 4+ Person Household | 8,744 (86.3%) | 1,383 (13.7%) |
| Total Housing Units | 27,728 (70.4%) | 11,658 (29.6%) |
Occupancy by Educational Attainment in Dallas County
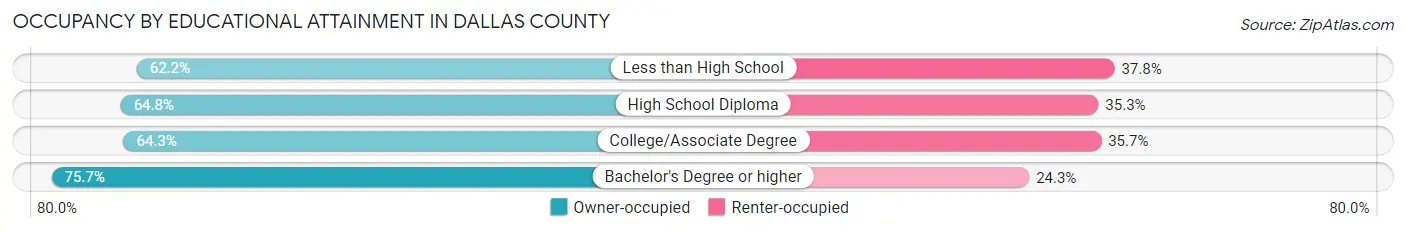
| Household Size | Owner-occupied | Renter-occupied |
| Less than High School | 747 (62.2%) | 454 (37.8%) |
| High School Diploma | 4,235 (64.7%) | 2,306 (35.2%) |
| College/Associate Degree | 6,856 (64.3%) | 3,806 (35.7%) |
| Bachelor's Degree or higher | 15,890 (75.7%) | 5,092 (24.3%) |
Occupancy by Age of Householder in Dallas County
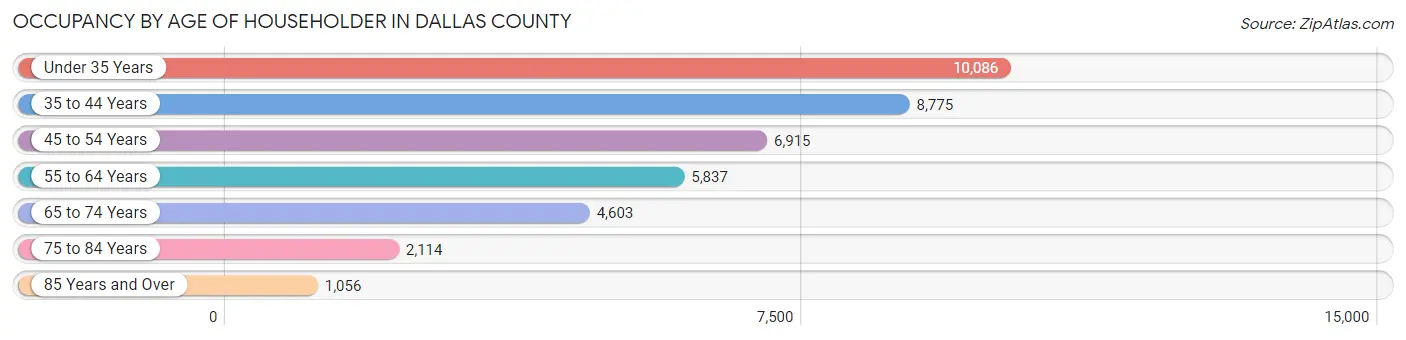
| Age Bracket | # Households | % Households |
| Under 35 Years | 10,086 | 25.6% |
| 35 to 44 Years | 8,775 | 22.3% |
| 45 to 54 Years | 6,915 | 17.6% |
| 55 to 64 Years | 5,837 | 14.8% |
| 65 to 74 Years | 4,603 | 11.7% |
| 75 to 84 Years | 2,114 | 5.4% |
| 85 Years and Over | 1,056 | 2.7% |
| Total | 39,386 | 100.0% |
Housing Finances in Dallas County
Median Income by Occupancy in Dallas County
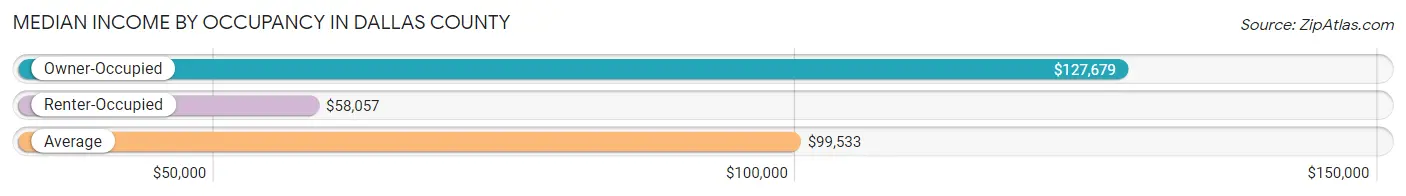
| Occupancy Type | # Households | Median Income |
| Owner-Occupied | 27,728 (70.4%) | $127,679 |
| Renter-Occupied | 11,658 (29.6%) | $58,057 |
| Average | 39,386 (100.0%) | $99,533 |
Occupancy by Householder Income Bracket in Dallas County
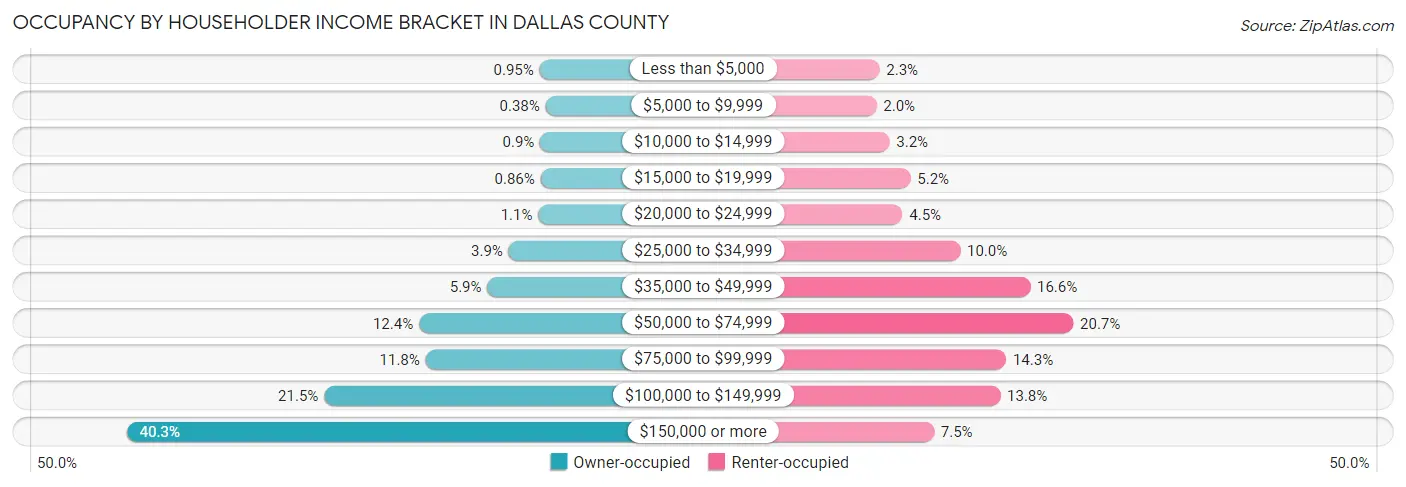
| Income Bracket | Owner-occupied | Renter-occupied |
| Less than $5,000 | 264 (0.9%) | 265 (2.3%) |
| $5,000 to $9,999 | 106 (0.4%) | 231 (2.0%) |
| $10,000 to $14,999 | 250 (0.9%) | 375 (3.2%) |
| $15,000 to $19,999 | 239 (0.9%) | 609 (5.2%) |
| $20,000 to $24,999 | 300 (1.1%) | 520 (4.5%) |
| $25,000 to $34,999 | 1,081 (3.9%) | 1,160 (10.0%) |
| $35,000 to $49,999 | 1,644 (5.9%) | 1,937 (16.6%) |
| $50,000 to $74,999 | 3,450 (12.4%) | 2,415 (20.7%) |
| $75,000 to $99,999 | 3,274 (11.8%) | 1,671 (14.3%) |
| $100,000 to $149,999 | 5,952 (21.5%) | 1,605 (13.8%) |
| $150,000 or more | 11,168 (40.3%) | 870 (7.5%) |
| Total | 27,728 (100.0%) | 11,658 (100.0%) |
Monthly Housing Cost Tiers in Dallas County
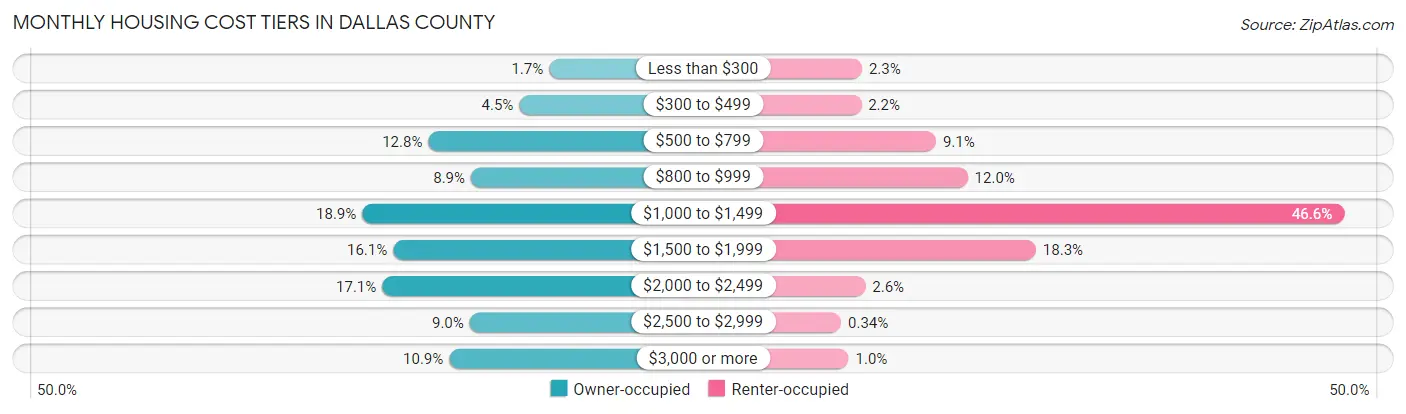
| Monthly Cost | Owner-occupied | Renter-occupied |
| Less than $300 | 478 (1.7%) | 263 (2.3%) |
| $300 to $499 | 1,240 (4.5%) | 255 (2.2%) |
| $500 to $799 | 3,561 (12.8%) | 1,057 (9.1%) |
| $800 to $999 | 2,472 (8.9%) | 1,398 (12.0%) |
| $1,000 to $1,499 | 5,250 (18.9%) | 5,436 (46.6%) |
| $1,500 to $1,999 | 4,458 (16.1%) | 2,130 (18.3%) |
| $2,000 to $2,499 | 4,738 (17.1%) | 300 (2.6%) |
| $2,500 to $2,999 | 2,503 (9.0%) | 40 (0.3%) |
| $3,000 or more | 3,028 (10.9%) | 120 (1.0%) |
| Total | 27,728 (100.0%) | 11,658 (100.0%) |
Physical Housing Characteristics in Dallas County
Housing Structures in Dallas County
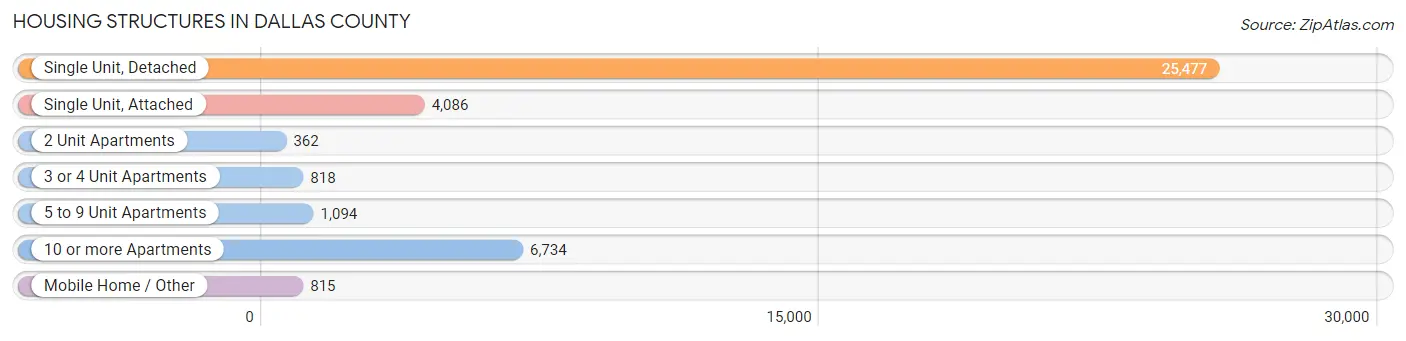
| Structure Type | # Housing Units | % Housing Units |
| Single Unit, Detached | 25,477 | 64.7% |
| Single Unit, Attached | 4,086 | 10.4% |
| 2 Unit Apartments | 362 | 0.9% |
| 3 or 4 Unit Apartments | 818 | 2.1% |
| 5 to 9 Unit Apartments | 1,094 | 2.8% |
| 10 or more Apartments | 6,734 | 17.1% |
| Mobile Home / Other | 815 | 2.1% |
| Total | 39,386 | 100.0% |
Housing Structures by Occupancy in Dallas County
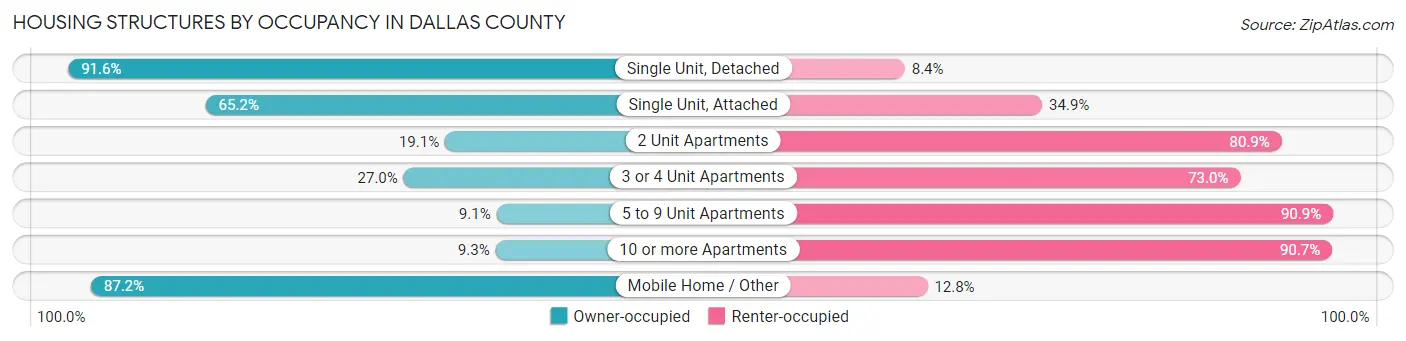
| Structure Type | Owner-occupied | Renter-occupied |
| Single Unit, Detached | 23,337 (91.6%) | 2,140 (8.4%) |
| Single Unit, Attached | 2,662 (65.1%) | 1,424 (34.8%) |
| 2 Unit Apartments | 69 (19.1%) | 293 (80.9%) |
| 3 or 4 Unit Apartments | 221 (27.0%) | 597 (73.0%) |
| 5 to 9 Unit Apartments | 100 (9.1%) | 994 (90.9%) |
| 10 or more Apartments | 628 (9.3%) | 6,106 (90.7%) |
| Mobile Home / Other | 711 (87.2%) | 104 (12.8%) |
| Total | 27,728 (70.4%) | 11,658 (29.6%) |
Housing Structures by Number of Rooms in Dallas County
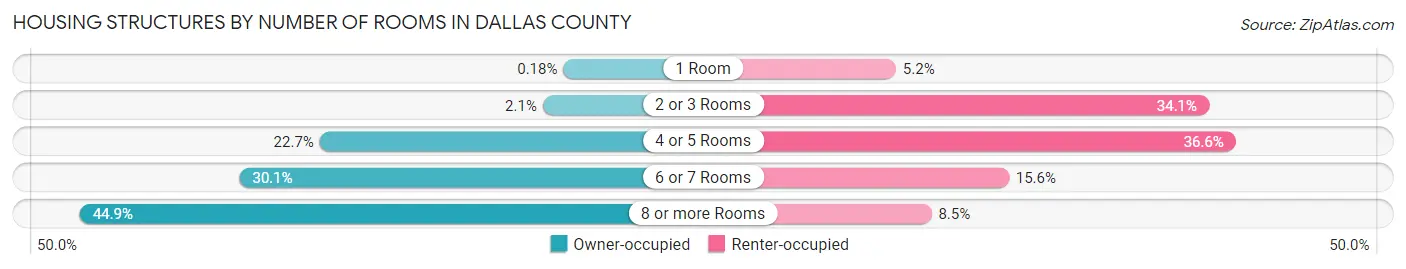
| Number of Rooms | Owner-occupied | Renter-occupied |
| 1 Room | 50 (0.2%) | 604 (5.2%) |
| 2 or 3 Rooms | 576 (2.1%) | 3,978 (34.1%) |
| 4 or 5 Rooms | 6,297 (22.7%) | 4,267 (36.6%) |
| 6 or 7 Rooms | 8,356 (30.1%) | 1,821 (15.6%) |
| 8 or more Rooms | 12,449 (44.9%) | 988 (8.5%) |
| Total | 27,728 (100.0%) | 11,658 (100.0%) |
Housing Structure by Heating Type in Dallas County
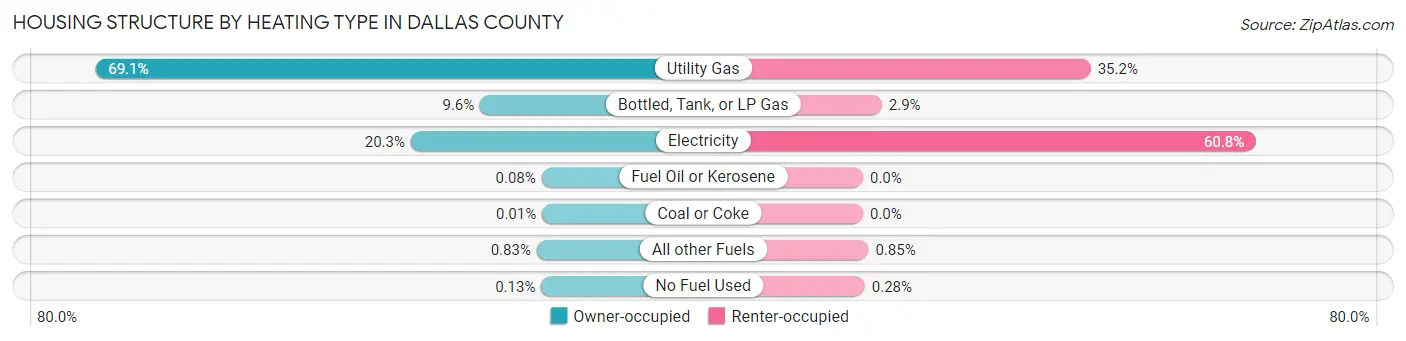
| Heating Type | Owner-occupied | Renter-occupied |
| Utility Gas | 19,153 (69.1%) | 4,104 (35.2%) |
| Bottled, Tank, or LP Gas | 2,655 (9.6%) | 339 (2.9%) |
| Electricity | 5,628 (20.3%) | 7,083 (60.8%) |
| Fuel Oil or Kerosene | 23 (0.1%) | 0 (0.0%) |
| Coal or Coke | 3 (0.0%) | 0 (0.0%) |
| All other Fuels | 231 (0.8%) | 99 (0.9%) |
| No Fuel Used | 35 (0.1%) | 33 (0.3%) |
| Total | 27,728 (100.0%) | 11,658 (100.0%) |
Household Vehicle Usage in Dallas County
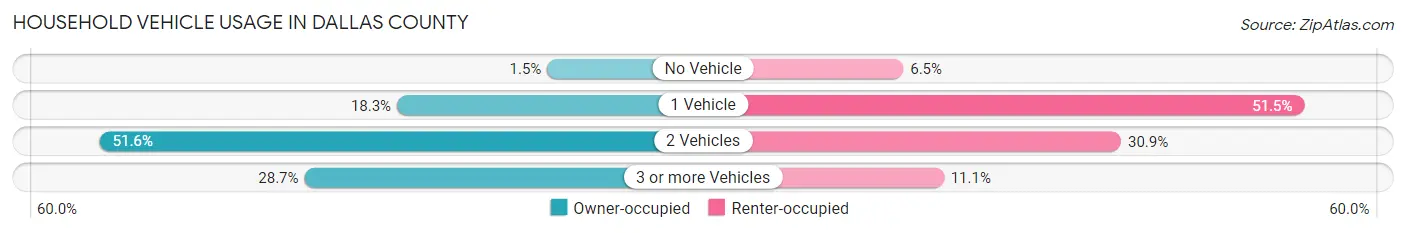
| Vehicles per Household | Owner-occupied | Renter-occupied |
| No Vehicle | 405 (1.5%) | 763 (6.5%) |
| 1 Vehicle | 5,071 (18.3%) | 5,999 (51.5%) |
| 2 Vehicles | 14,306 (51.6%) | 3,606 (30.9%) |
| 3 or more Vehicles | 7,946 (28.7%) | 1,290 (11.1%) |
| Total | 27,728 (100.0%) | 11,658 (100.0%) |
Real Estate & Mortgages in Dallas County
Real Estate and Mortgage Overview in Dallas County
| Characteristic | Without Mortgage | With Mortgage |
| Housing Units | 8,073 | 19,655 |
| Median Property Value | $276,400 | $329,000 |
| Median Household Income | $86,936 | $8,759 |
| Monthly Housing Costs | $735 | $2,976 |
| Real Estate Taxes | $4,084 | $884 |
Property Value by Mortgage Status in Dallas County
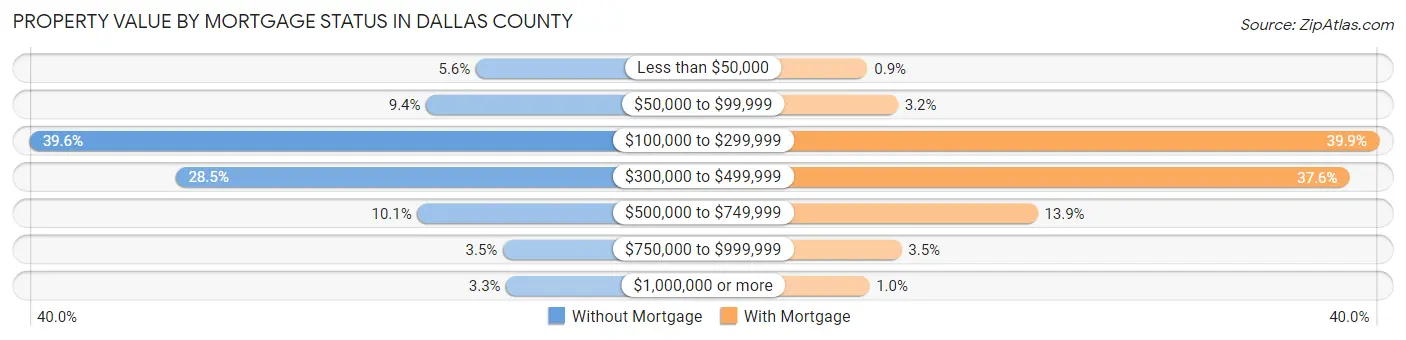
| Property Value | Without Mortgage | With Mortgage |
| Less than $50,000 | 452 (5.6%) | 176 (0.9%) |
| $50,000 to $99,999 | 758 (9.4%) | 632 (3.2%) |
| $100,000 to $299,999 | 3,198 (39.6%) | 7,837 (39.9%) |
| $300,000 to $499,999 | 2,301 (28.5%) | 7,395 (37.6%) |
| $500,000 to $749,999 | 812 (10.1%) | 2,725 (13.9%) |
| $750,000 to $999,999 | 286 (3.5%) | 685 (3.5%) |
| $1,000,000 or more | 266 (3.3%) | 205 (1.0%) |
| Total | 8,073 (100.0%) | 19,655 (100.0%) |
Household Income by Mortgage Status in Dallas County
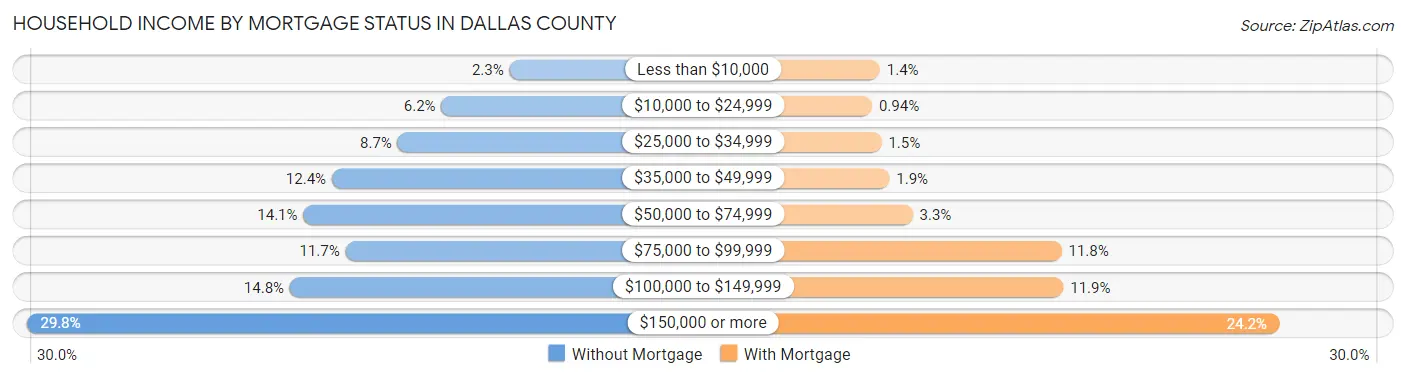
| Household Income | Without Mortgage | With Mortgage |
| Less than $10,000 | 185 (2.3%) | 273 (1.4%) |
| $10,000 to $24,999 | 499 (6.2%) | 185 (0.9%) |
| $25,000 to $34,999 | 701 (8.7%) | 290 (1.5%) |
| $35,000 to $49,999 | 1,004 (12.4%) | 380 (1.9%) |
| $50,000 to $74,999 | 1,136 (14.1%) | 640 (3.3%) |
| $75,000 to $99,999 | 941 (11.7%) | 2,314 (11.8%) |
| $100,000 to $149,999 | 1,198 (14.8%) | 2,333 (11.9%) |
| $150,000 or more | 2,409 (29.8%) | 4,754 (24.2%) |
| Total | 8,073 (100.0%) | 19,655 (100.0%) |
Property Value to Household Income Ratio in Dallas County
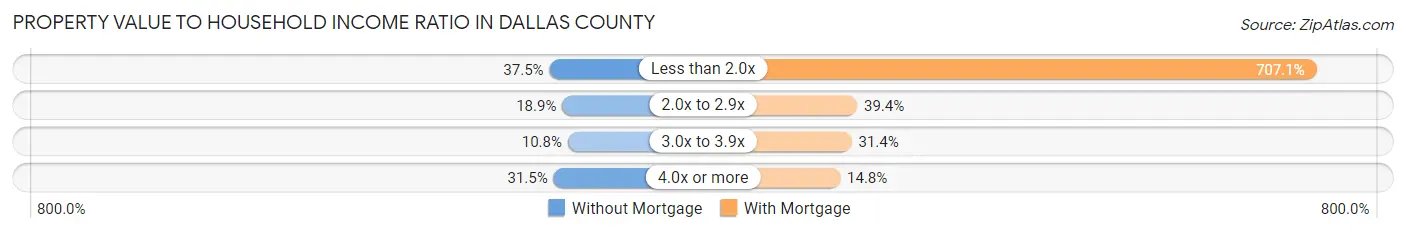
| Value-to-Income Ratio | Without Mortgage | With Mortgage |
| Less than 2.0x | 3,031 (37.5%) | 138,981 (707.1%) |
| 2.0x to 2.9x | 1,525 (18.9%) | 7,744 (39.4%) |
| 3.0x to 3.9x | 874 (10.8%) | 6,173 (31.4%) |
| 4.0x or more | 2,544 (31.5%) | 2,903 (14.8%) |
| Total | 8,073 (100.0%) | 19,655 (100.0%) |
Real Estate Taxes by Mortgage Status in Dallas County
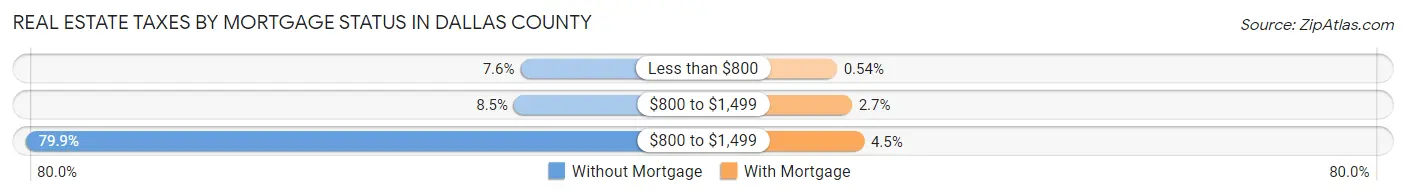
| Property Taxes | Without Mortgage | With Mortgage |
| Less than $800 | 611 (7.6%) | 107 (0.5%) |
| $800 to $1,499 | 687 (8.5%) | 537 (2.7%) |
| $800 to $1,499 | 6,446 (79.8%) | 888 (4.5%) |
| Total | 8,073 (100.0%) | 19,655 (100.0%) |
Health & Disability in Dallas County
Health Insurance Coverage by Age in Dallas County
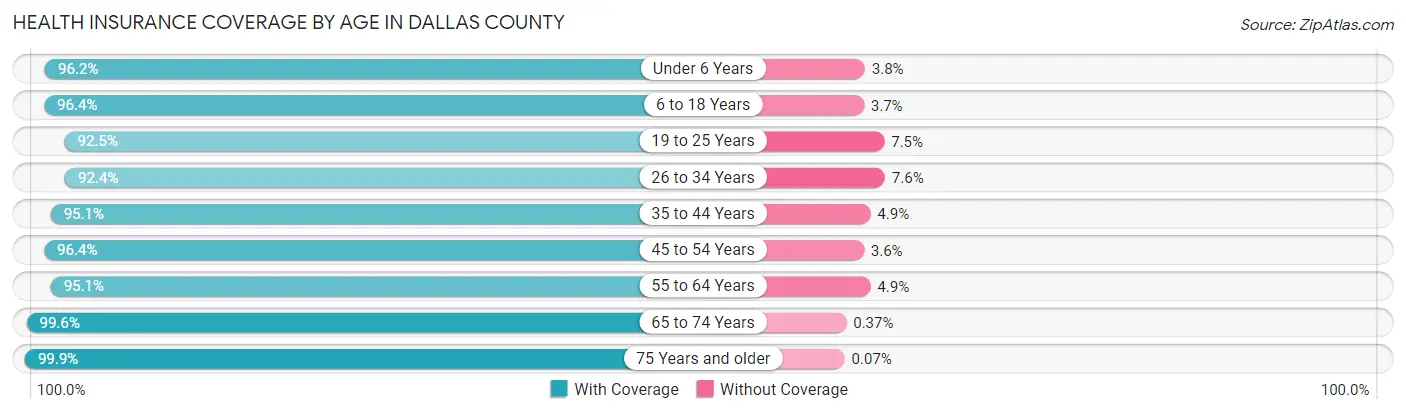
| Age Bracket | With Coverage | Without Coverage |
| Under 6 Years | 8,187 (96.2%) | 326 (3.8%) |
| 6 to 18 Years | 18,990 (96.4%) | 720 (3.6%) |
| 19 to 25 Years | 7,022 (92.5%) | 566 (7.5%) |
| 26 to 34 Years | 12,122 (92.4%) | 993 (7.6%) |
| 35 to 44 Years | 15,630 (95.1%) | 800 (4.9%) |
| 45 to 54 Years | 12,004 (96.4%) | 454 (3.6%) |
| 55 to 64 Years | 9,681 (95.1%) | 496 (4.9%) |
| 65 to 74 Years | 7,219 (99.6%) | 27 (0.4%) |
| 75 Years and older | 4,592 (99.9%) | 3 (0.1%) |
| Total | 95,447 (95.6%) | 4,385 (4.4%) |
Health Insurance Coverage by Citizenship Status in Dallas County
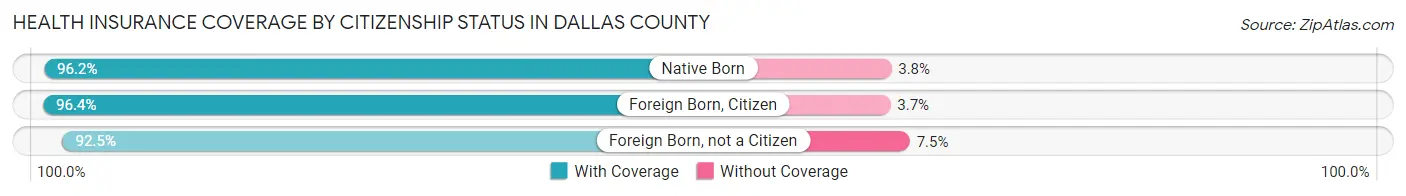
| Citizenship Status | With Coverage | Without Coverage |
| Native Born | 8,187 (96.2%) | 326 (3.8%) |
| Foreign Born, Citizen | 18,990 (96.4%) | 720 (3.6%) |
| Foreign Born, not a Citizen | 7,022 (92.5%) | 566 (7.5%) |
Health Insurance Coverage by Household Income in Dallas County
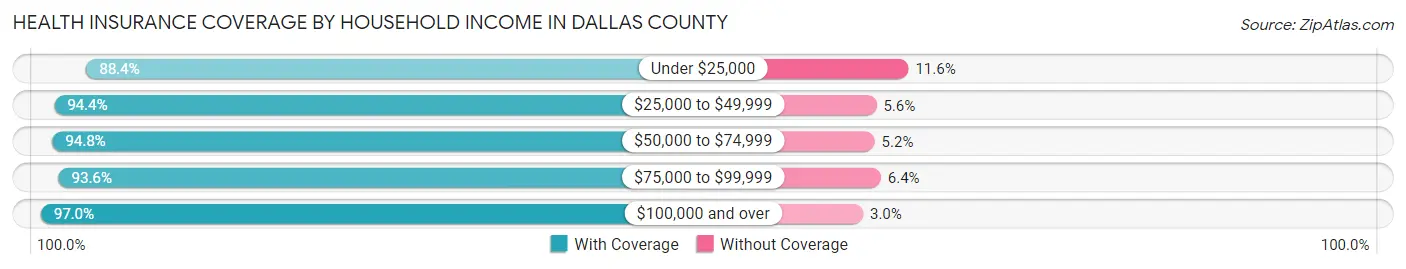
| Household Income | With Coverage | Without Coverage |
| Under $25,000 | 4,576 (88.4%) | 598 (11.6%) |
| $25,000 to $49,999 | 9,017 (94.4%) | 531 (5.6%) |
| $50,000 to $74,999 | 11,547 (94.8%) | 636 (5.2%) |
| $75,000 to $99,999 | 11,192 (93.6%) | 763 (6.4%) |
| $100,000 and over | 58,991 (97.0%) | 1,847 (3.0%) |
Public vs Private Health Insurance Coverage by Age in Dallas County
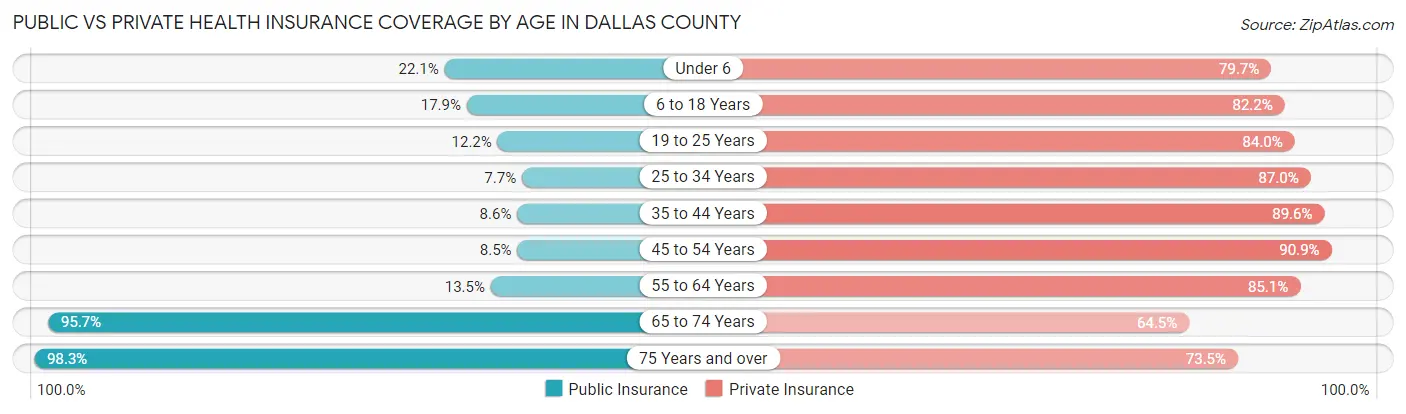
| Age Bracket | Public Insurance | Private Insurance |
| Under 6 | 1,877 (22.1%) | 6,783 (79.7%) |
| 6 to 18 Years | 3,532 (17.9%) | 16,196 (82.2%) |
| 19 to 25 Years | 926 (12.2%) | 6,377 (84.0%) |
| 25 to 34 Years | 1,007 (7.7%) | 11,412 (87.0%) |
| 35 to 44 Years | 1,406 (8.6%) | 14,713 (89.5%) |
| 45 to 54 Years | 1,063 (8.5%) | 11,321 (90.9%) |
| 55 to 64 Years | 1,371 (13.5%) | 8,656 (85.1%) |
| 65 to 74 Years | 6,933 (95.7%) | 4,671 (64.5%) |
| 75 Years and over | 4,515 (98.3%) | 3,378 (73.5%) |
| Total | 22,630 (22.7%) | 83,507 (83.7%) |
Disability Status by Sex by Age in Dallas County
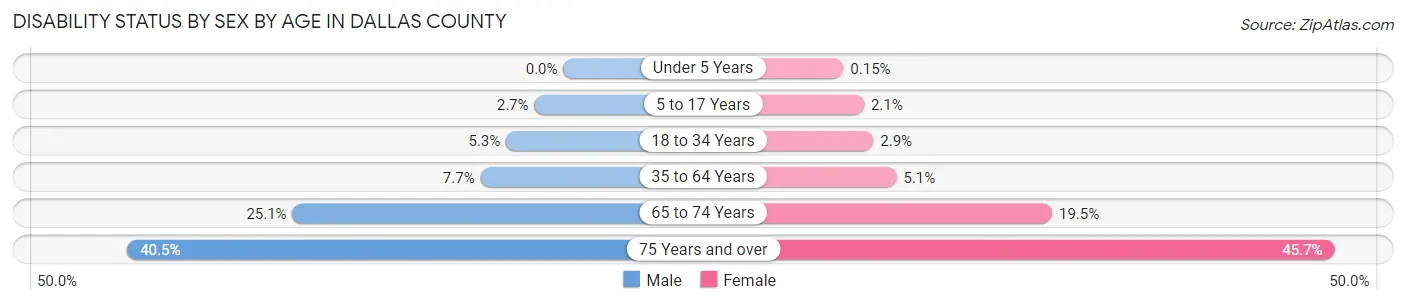
| Age Bracket | Male | Female |
| Under 5 Years | 0 (0.0%) | 5 (0.2%) |
| 5 to 17 Years | 273 (2.7%) | 203 (2.1%) |
| 18 to 34 Years | 588 (5.3%) | 317 (2.9%) |
| 35 to 64 Years | 1,520 (7.7%) | 978 (5.1%) |
| 65 to 74 Years | 841 (25.1%) | 761 (19.5%) |
| 75 Years and over | 739 (40.5%) | 1,266 (45.7%) |
Disability Class by Sex by Age in Dallas County
Disability Class: Hearing Difficulty
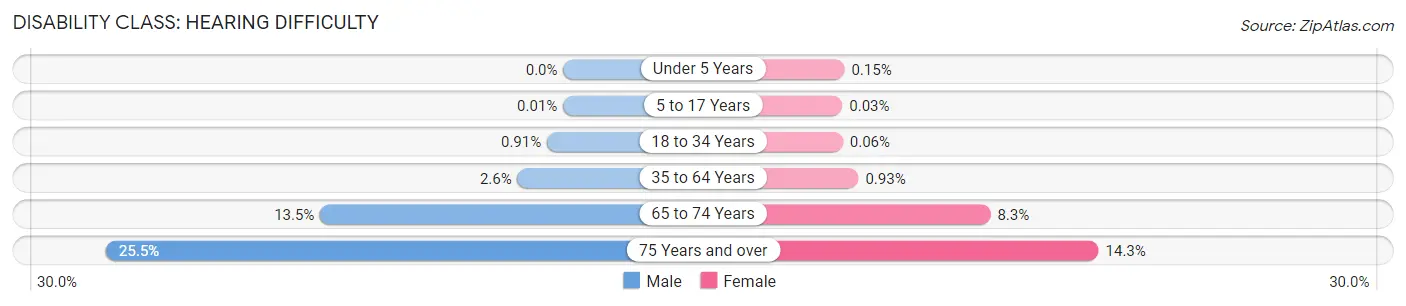
| Age Bracket | Male | Female |
| Under 5 Years | 0 (0.0%) | 5 (0.2%) |
| 5 to 17 Years | 1 (0.0%) | 3 (0.0%) |
| 18 to 34 Years | 101 (0.9%) | 6 (0.1%) |
| 35 to 64 Years | 505 (2.5%) | 180 (0.9%) |
| 65 to 74 Years | 453 (13.5%) | 323 (8.3%) |
| 75 Years and over | 465 (25.5%) | 396 (14.3%) |
Disability Class: Vision Difficulty
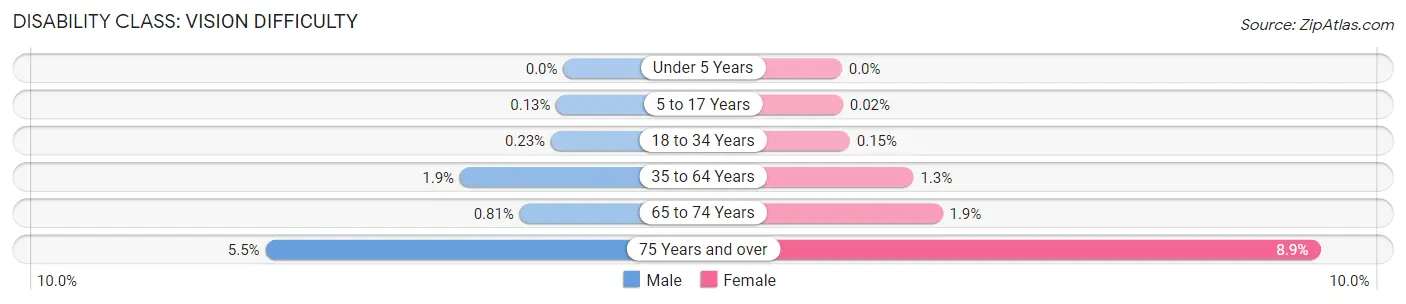
| Age Bracket | Male | Female |
| Under 5 Years | 0 (0.0%) | 0 (0.0%) |
| 5 to 17 Years | 13 (0.1%) | 2 (0.0%) |
| 18 to 34 Years | 25 (0.2%) | 16 (0.2%) |
| 35 to 64 Years | 380 (1.9%) | 256 (1.3%) |
| 65 to 74 Years | 27 (0.8%) | 73 (1.9%) |
| 75 Years and over | 101 (5.5%) | 246 (8.9%) |
Disability Class: Cognitive Difficulty
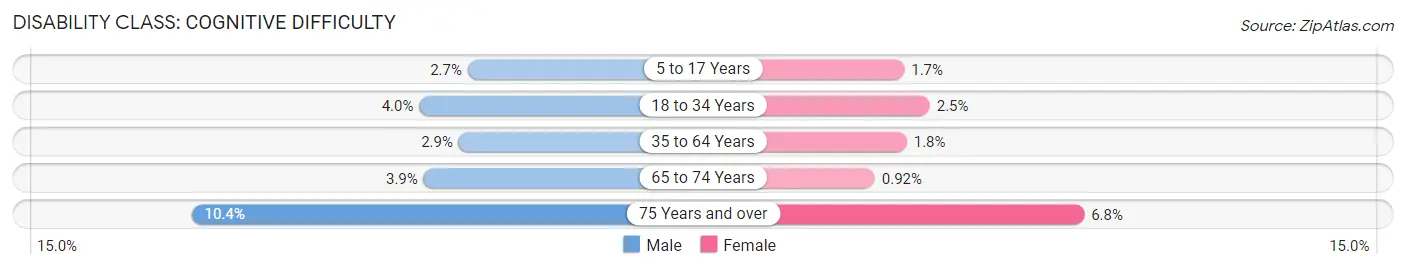
| Age Bracket | Male | Female |
| 5 to 17 Years | 270 (2.7%) | 171 (1.7%) |
| 18 to 34 Years | 444 (4.0%) | 266 (2.5%) |
| 35 to 64 Years | 575 (2.9%) | 350 (1.8%) |
| 65 to 74 Years | 130 (3.9%) | 36 (0.9%) |
| 75 Years and over | 189 (10.3%) | 187 (6.8%) |
Disability Class: Ambulatory Difficulty
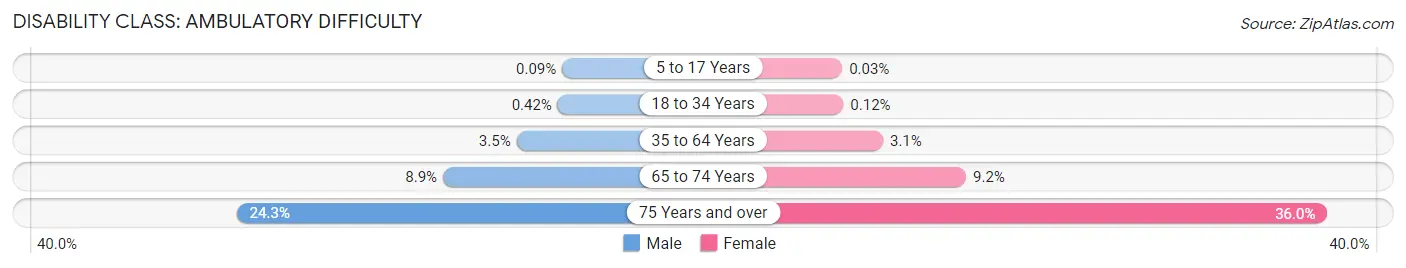
| Age Bracket | Male | Female |
| 5 to 17 Years | 9 (0.1%) | 3 (0.0%) |
| 18 to 34 Years | 46 (0.4%) | 13 (0.1%) |
| 35 to 64 Years | 688 (3.5%) | 591 (3.1%) |
| 65 to 74 Years | 299 (8.9%) | 360 (9.2%) |
| 75 Years and over | 443 (24.3%) | 998 (36.0%) |
Disability Class: Self-Care Difficulty
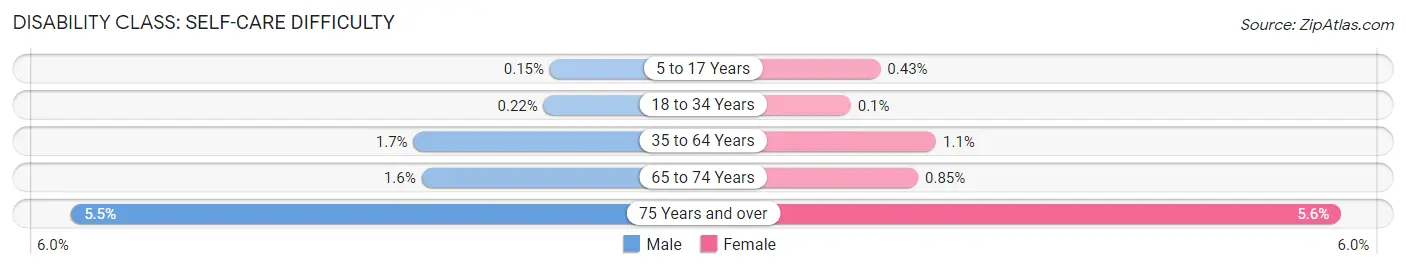
| Age Bracket | Male | Female |
| 5 to 17 Years | 15 (0.2%) | 42 (0.4%) |
| 18 to 34 Years | 24 (0.2%) | 11 (0.1%) |
| 35 to 64 Years | 331 (1.7%) | 203 (1.1%) |
| 65 to 74 Years | 53 (1.6%) | 33 (0.9%) |
| 75 Years and over | 100 (5.5%) | 154 (5.6%) |
Technology Access in Dallas County
Computing Device Access in Dallas County
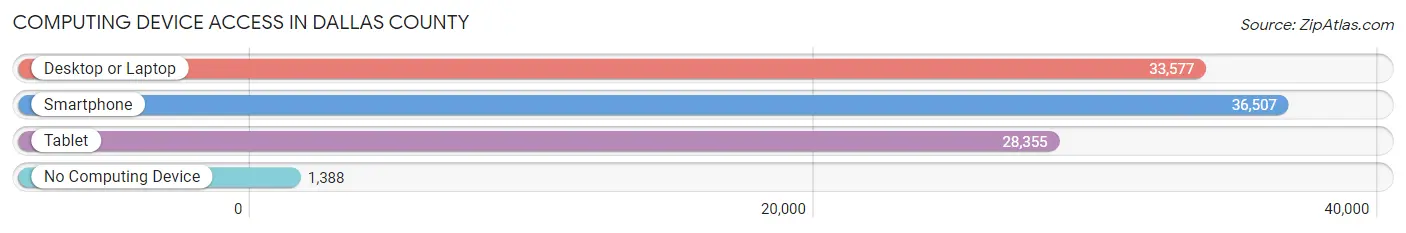
| Device Type | # Households | % Households |
| Desktop or Laptop | 33,577 | 85.3% |
| Smartphone | 36,507 | 92.7% |
| Tablet | 28,355 | 72.0% |
| No Computing Device | 1,388 | 3.5% |
| Total | 39,386 | 100.0% |
Internet Access in Dallas County
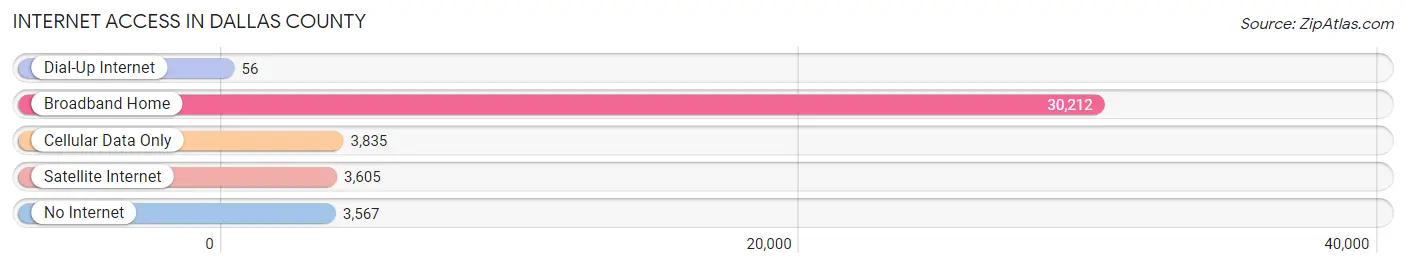
| Internet Type | # Households | % Households |
| Dial-Up Internet | 56 | 0.1% |
| Broadband Home | 30,212 | 76.7% |
| Cellular Data Only | 3,835 | 9.7% |
| Satellite Internet | 3,605 | 9.1% |
| No Internet | 3,567 | 9.1% |
| Total | 39,386 | 100.0% |
Dallas County Summary
Dallas County, Iowa is located in the south-central part of the state and is part of the Des Moines–West Des Moines Metropolitan Statistical Area. The county was established in 1846 and is named after George M. Dallas, the 11th Vice President of the United States. As of the 2010 census, the population was 66,135, making it the fifth-most populous county in Iowa.
Geography
Dallas County is located in the south-central part of Iowa and is bordered by Madison County to the north, Polk County to the east, Warren County to the south, and Guthrie County to the west. The county has a total area of 576 square miles, of which 573 square miles is land and 3.2 square miles is water. The county is drained by the Des Moines River and its tributaries, including the Raccoon River, which flows through the county's largest city, Des Moines.
The county is mostly flat, with some rolling hills in the northern and western parts. The highest point in the county is located in the northwest corner, at an elevation of 1,068 feet. The county is home to several state parks, including Ledges State Park, which is located in the northern part of the county and features a 500-foot sandstone cliff.
Demographics
As of the 2010 census, there were 66,135 people, 25,945 households, and 17,845 families residing in the county. The population density was 115.3 people per square mile. There were 27,845 housing units at an average density of 48.5 per square mile. The racial makeup of the county was 87.2% White, 6.3% African American, 0.4% Native American, 2.7% Asian, 0.1% Pacific Islander, 1.3% from other races, and 2.1% from two or more races. Hispanic or Latino of any race were 4.2% of the population.
The median income for a household in the county was $50,945 and the median income for a family was $63,945. The per capita income for the county was $25,945. About 5.2% of families and 7.7% of the population were below the poverty line, including 10.2% of those under age 18 and 5.2% of those age 65 or over.
Economy
Dallas County is home to a diverse economy, with a mix of manufacturing, agriculture, and services. The county is home to several major employers, including Principal Financial Group, Meredith Corporation, and Wells Fargo. The county is also home to several agricultural businesses, including Pioneer Hi-Bred International, a seed production company, and the Iowa State Fairgrounds, which hosts the annual Iowa State Fair.
The county is also home to several educational institutions, including Des Moines Area Community College, Drake University, and Grand View University. The county is also home to several medical centers, including MercyOne Des Moines Medical Center and Iowa Methodist Medical Center.
Conclusion
Dallas County, Iowa is a diverse and vibrant county located in the south-central part of the state. The county is home to a diverse economy, with a mix of manufacturing, agriculture, and services. The county is also home to several educational institutions, medical centers, and major employers. As of the 2010 census, the population was 66,135, making it the fifth-most populous county in Iowa.
Common Questions
What is Per Capita Income in Dallas County?
Per Capita income in Dallas County is $51,347.
What is the Median Family Income in Dallas County?
Median Family Income in Dallas County is $130,231.
What is the Median Household income in Dallas County?
Median Household Income in Dallas County is $99,533.
What is Income or Wage Gap in Dallas County?
Income or Wage Gap in Dallas County is 30.4%.
Women in Dallas County earn 69.6 cents for every dollar earned by a man.
What is Family Income Deficit in Dallas County?
Family Income Deficit in Dallas County is $10,687.
Families that are below poverty line in Dallas County earn $10,687 less on average than the poverty threshold level.
What is Inequality or Gini Index in Dallas County?
Inequality or Gini Index in Dallas County is 0.44.
What is the Total Population of Dallas County?
Total Population of Dallas County is 100,367.
What is the Total Male Population of Dallas County?
Total Male Population of Dallas County is 49,977.
What is the Total Female Population of Dallas County?
Total Female Population of Dallas County is 50,390.
What is the Ratio of Males per 100 Females in Dallas County?
There are 99.18 Males per 100 Females in Dallas County.
What is the Ratio of Females per 100 Males in Dallas County?
There are 100.83 Females per 100 Males in Dallas County.
What is the Median Population Age in Dallas County?
Median Population Age in Dallas County is 35.6 Years.
What is the Average Family Size in Dallas County
Average Family Size in Dallas County is 3.2 People.
What is the Average Household Size in Dallas County
Average Household Size in Dallas County is 2.5 People.
How Large is the Labor Force in Dallas County?
There are 57,215 People in the Labor Forcein in Dallas County.
What is the Percentage of People in the Labor Force in Dallas County?
75.4% of People are in the Labor Force in Dallas County.
What is the Unemployment Rate in Dallas County?
Unemployment Rate in Dallas County is 3.0%.