Bremer County, IA Map & Demographics
Bremer County Map
Bremer County Overview
$40,912
PER CAPITA INCOME
$98,823
AVG FAMILY INCOME
$84,727
AVG HOUSEHOLD INCOME
33.9%
WAGE / INCOME GAP [ % ]
66.1¢/ $1
WAGE / INCOME GAP [ $ ]
$12,350
FAMILY INCOME DEFICIT
0.41
INEQUALITY / GINI INDEX
25,012
TOTAL POPULATION
12,529
MALE POPULATION
12,483
FEMALE POPULATION
100.37
MALES / 100 FEMALES
99.63
FEMALES / 100 MALES
38.9
MEDIAN AGE
2.9
AVG FAMILY SIZE
2.4
AVG HOUSEHOLD SIZE
13,356
LABOR FORCE [ PEOPLE ]
66.7%
PERCENT IN LABOR FORCE
3.2%
UNEMPLOYMENT RATE
Income in Bremer County
Income Overview in Bremer County
Per Capita Income in Bremer County is $40,912, while median incomes of families and households are $98,823 and $84,727 respectively.
| Characteristic | Number | Measure |
| Per Capita Income | 25,012 | $40,912 |
| Median Family Income | 6,630 | $98,823 |
| Mean Family Income | 6,630 | $121,524 |
| Median Household Income | 9,684 | $84,727 |
| Mean Household Income | 9,684 | $102,454 |
| Income Deficit | 6,630 | $12,350 |
| Wage / Income Gap (%) | 25,012 | 33.93% |
| Wage / Income Gap ($) | 25,012 | 66.07¢ per $1 |
| Gini / Inequality Index | 25,012 | 0.41 |
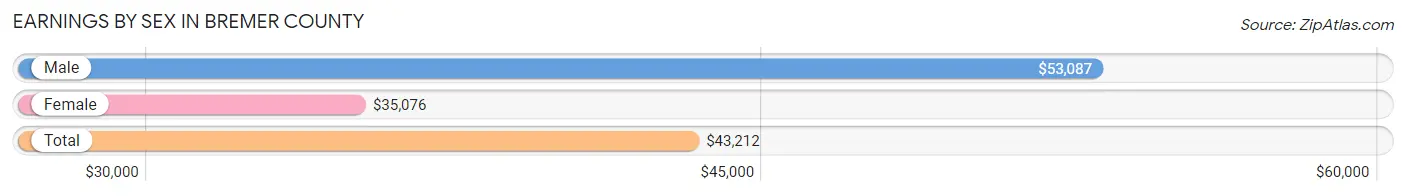
Earnings by Sex in Bremer County
Average Earnings in Bremer County are $43,212, $53,087 for men and $35,076 for women, a difference of 33.9%.
| Sex | Number | Average Earnings |
| Male | 7,568 (52.9%) | $53,087 |
| Female | 6,731 (47.1%) | $35,076 |
| Total | 14,299 (100.0%) | $43,212 |
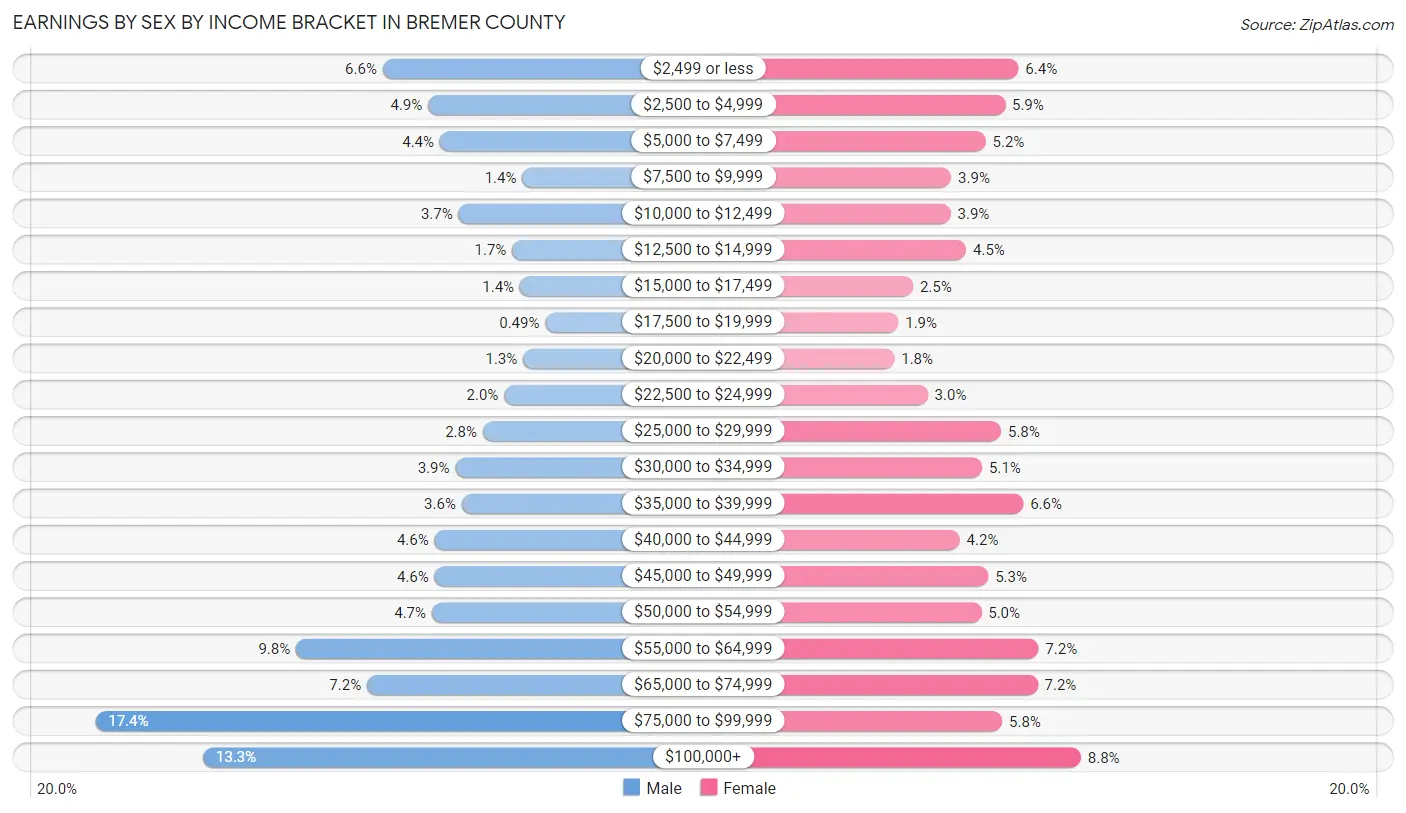
Earnings by Sex by Income Bracket in Bremer County
The most common earnings brackets in Bremer County are $75,000 to $99,999 for men (1,313 | 17.3%) and $100,000+ for women (590 | 8.8%).
| Income | Male | Female |
| $2,499 or less | 498 (6.6%) | 433 (6.4%) |
| $2,500 to $4,999 | 369 (4.9%) | 399 (5.9%) |
| $5,000 to $7,499 | 336 (4.4%) | 350 (5.2%) |
| $7,500 to $9,999 | 102 (1.3%) | 263 (3.9%) |
| $10,000 to $12,499 | 283 (3.7%) | 262 (3.9%) |
| $12,500 to $14,999 | 131 (1.7%) | 301 (4.5%) |
| $15,000 to $17,499 | 109 (1.4%) | 167 (2.5%) |
| $17,500 to $19,999 | 37 (0.5%) | 130 (1.9%) |
| $20,000 to $22,499 | 100 (1.3%) | 120 (1.8%) |
| $22,500 to $24,999 | 154 (2.0%) | 204 (3.0%) |
| $25,000 to $29,999 | 214 (2.8%) | 389 (5.8%) |
| $30,000 to $34,999 | 292 (3.9%) | 341 (5.1%) |
| $35,000 to $39,999 | 274 (3.6%) | 445 (6.6%) |
| $40,000 to $44,999 | 351 (4.6%) | 285 (4.2%) |
| $45,000 to $49,999 | 351 (4.6%) | 357 (5.3%) |
| $50,000 to $54,999 | 359 (4.7%) | 339 (5.0%) |
| $55,000 to $64,999 | 744 (9.8%) | 483 (7.2%) |
| $65,000 to $74,999 | 543 (7.2%) | 481 (7.1%) |
| $75,000 to $99,999 | 1,313 (17.3%) | 392 (5.8%) |
| $100,000+ | 1,008 (13.3%) | 590 (8.8%) |
| Total | 7,568 (100.0%) | 6,731 (100.0%) |
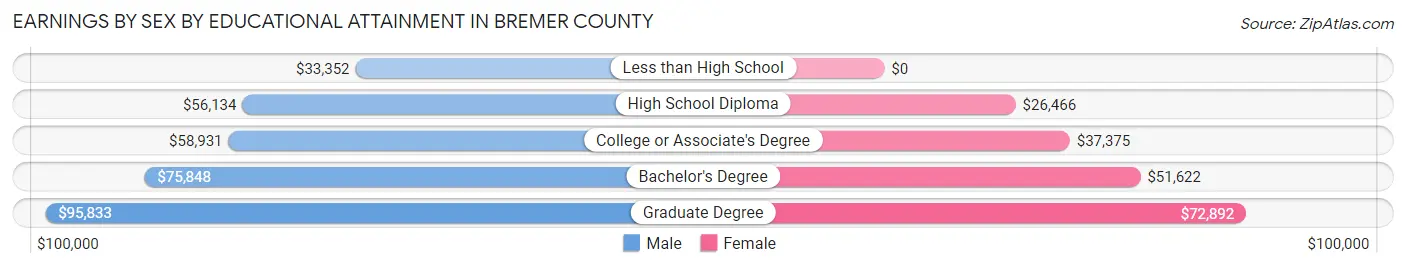
Earnings by Sex by Educational Attainment in Bremer County
Average earnings in Bremer County are $61,907 for men and $43,114 for women, a difference of 30.4%. Men with an educational attainment of graduate degree enjoy the highest average annual earnings of $95,833, while those with less than high school education earn the least with $33,352. Women with an educational attainment of graduate degree earn the most with the average annual earnings of $72,892, while those with high school diploma education have the smallest earnings of $26,466.
| Educational Attainment | Male Income | Female Income |
| Less than High School | $33,352 | $0 |
| High School Diploma | $56,134 | $26,466 |
| College or Associate's Degree | $58,931 | $37,375 |
| Bachelor's Degree | $75,848 | $51,622 |
| Graduate Degree | $95,833 | $72,892 |
| Total | $61,907 | $43,114 |
Family Income in Bremer County
Family Income Brackets in Bremer County
According to the Bremer County family income data, there are 1,876 families falling into the $100,000 to $149,999 income range, which is the most common income bracket and makes up 28.3% of all families. Conversely, the $10,000 to $14,999 income bracket is the least frequent group with only 40 families (0.6%) belonging to this category.
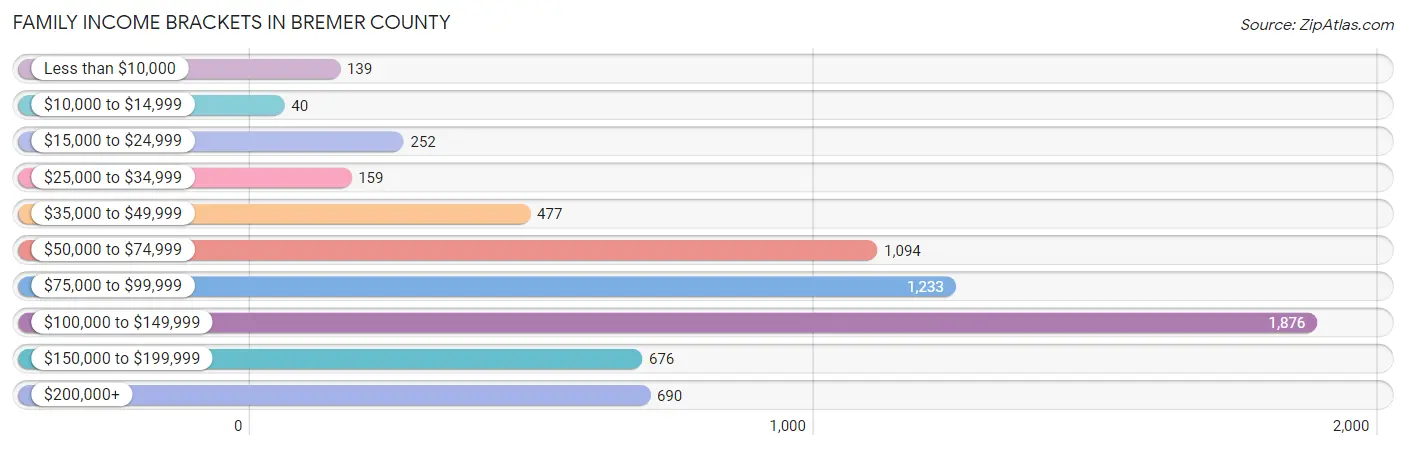
| Income Bracket | # Families | % Families |
| Less than $10,000 | 139 | 2.1% |
| $10,000 to $14,999 | 40 | 0.6% |
| $15,000 to $24,999 | 252 | 3.8% |
| $25,000 to $34,999 | 159 | 2.4% |
| $35,000 to $49,999 | 477 | 7.2% |
| $50,000 to $74,999 | 1,094 | 16.5% |
| $75,000 to $99,999 | 1,233 | 18.6% |
| $100,000 to $149,999 | 1,876 | 28.3% |
| $150,000 to $199,999 | 676 | 10.2% |
| $200,000+ | 690 | 10.4% |
Family Income by Famaliy Size in Bremer County
5-person families (641 | 9.7%) account for the highest median family income in Bremer County with $131,339 per family, while 2-person families (3,644 | 55.0%) have the highest median income of $43,354 per family member.
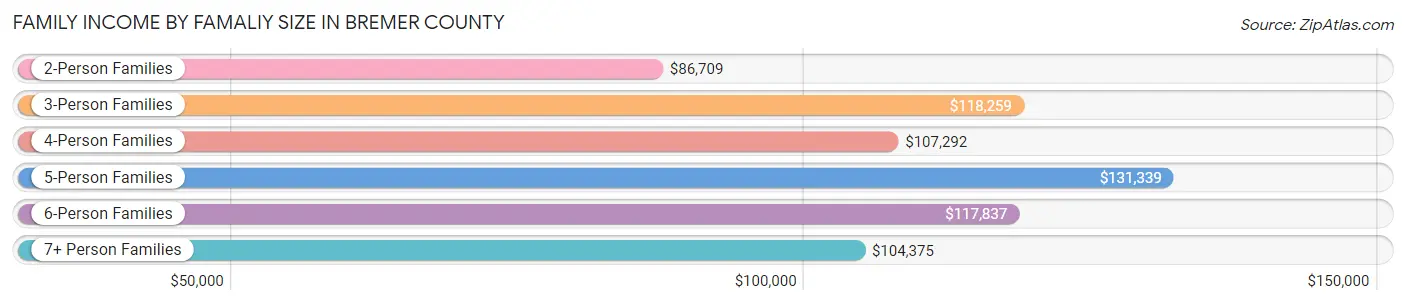
| Income Bracket | # Families | Median Income |
| 2-Person Families | 3,644 (55.0%) | $86,709 |
| 3-Person Families | 1,039 (15.7%) | $118,259 |
| 4-Person Families | 1,072 (16.2%) | $107,292 |
| 5-Person Families | 641 (9.7%) | $131,339 |
| 6-Person Families | 197 (3.0%) | $117,837 |
| 7+ Person Families | 37 (0.6%) | $104,375 |
| Total | 6,630 (100.0%) | $98,823 |
Family Income by Number of Earners in Bremer County
The median family income in Bremer County is $98,823, with families comprising 3+ earners (588) having the highest median family income of $134,928, while families with no earners (1,105) have the lowest median family income of $58,288, accounting for 8.9% and 16.7% of families, respectively.
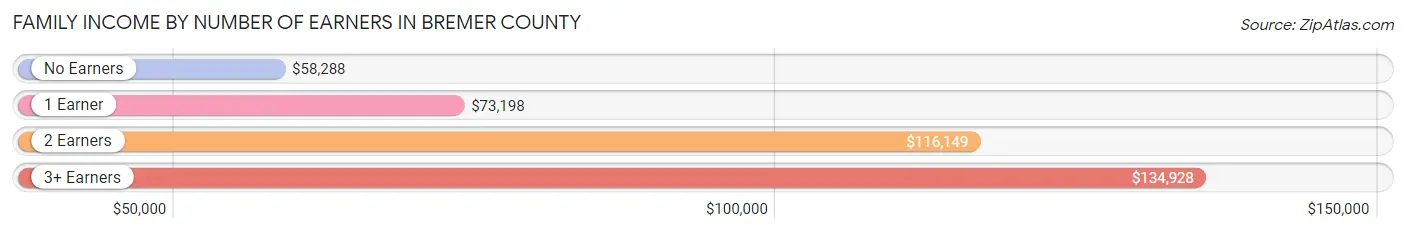
| Number of Earners | # Families | Median Income |
| No Earners | 1,105 (16.7%) | $58,288 |
| 1 Earner | 1,650 (24.9%) | $73,198 |
| 2 Earners | 3,287 (49.6%) | $116,149 |
| 3+ Earners | 588 (8.9%) | $134,928 |
| Total | 6,630 (100.0%) | $98,823 |
Household Income in Bremer County
Household Income Brackets in Bremer County
With 2,189 households falling in the category, the $100,000 to $149,999 income range is the most frequent in Bremer County, accounting for 22.6% of all households. In contrast, only 184 households (1.9%) fall into the $10,000 to $14,999 income bracket, making it the least populous group.
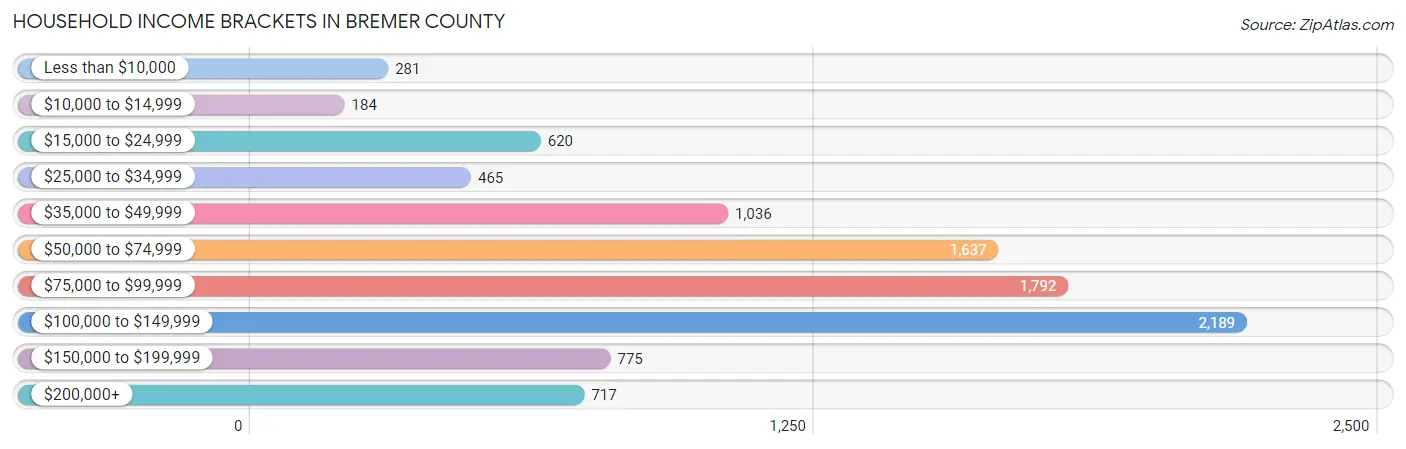
| Income Bracket | # Households | % Households |
| Less than $10,000 | 281 | 2.9% |
| $10,000 to $14,999 | 184 | 1.9% |
| $15,000 to $24,999 | 620 | 6.4% |
| $25,000 to $34,999 | 465 | 4.8% |
| $35,000 to $49,999 | 1,036 | 10.7% |
| $50,000 to $74,999 | 1,637 | 16.9% |
| $75,000 to $99,999 | 1,792 | 18.5% |
| $100,000 to $149,999 | 2,189 | 22.6% |
| $150,000 to $199,999 | 775 | 8.0% |
| $200,000+ | 717 | 7.4% |
Household Income by Householder Age in Bremer County
The median household income in Bremer County is $84,727, with the highest median household income of $96,950 found in the 45 to 64 years age bracket for the primary householder. A total of 3,364 households (34.7%) fall into this category. Meanwhile, the 15 to 24 years age bracket for the primary householder has the lowest median household income of $47,337, with 307 households (3.2%) in this group.
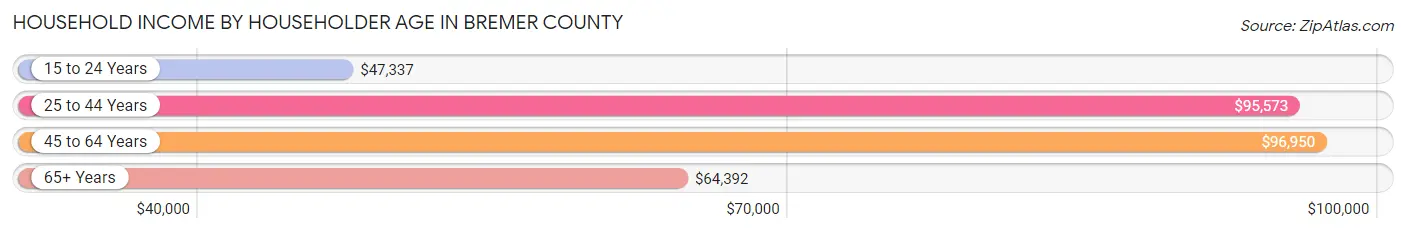
| Income Bracket | # Households | Median Income |
| 15 to 24 Years | 307 (3.2%) | $47,337 |
| 25 to 44 Years | 3,039 (31.4%) | $95,573 |
| 45 to 64 Years | 3,364 (34.7%) | $96,950 |
| 65+ Years | 2,974 (30.7%) | $64,392 |
| Total | 9,684 (100.0%) | $84,727 |
Poverty in Bremer County
Income Below Poverty by Sex and Age in Bremer County
With 5.6% poverty level for males and 7.6% for females among the residents of Bremer County, 5 year old males and 18 to 24 year old females are the most vulnerable to poverty, with 64 males (35.4%) and 224 females (23.8%) in their respective age groups living below the poverty level.
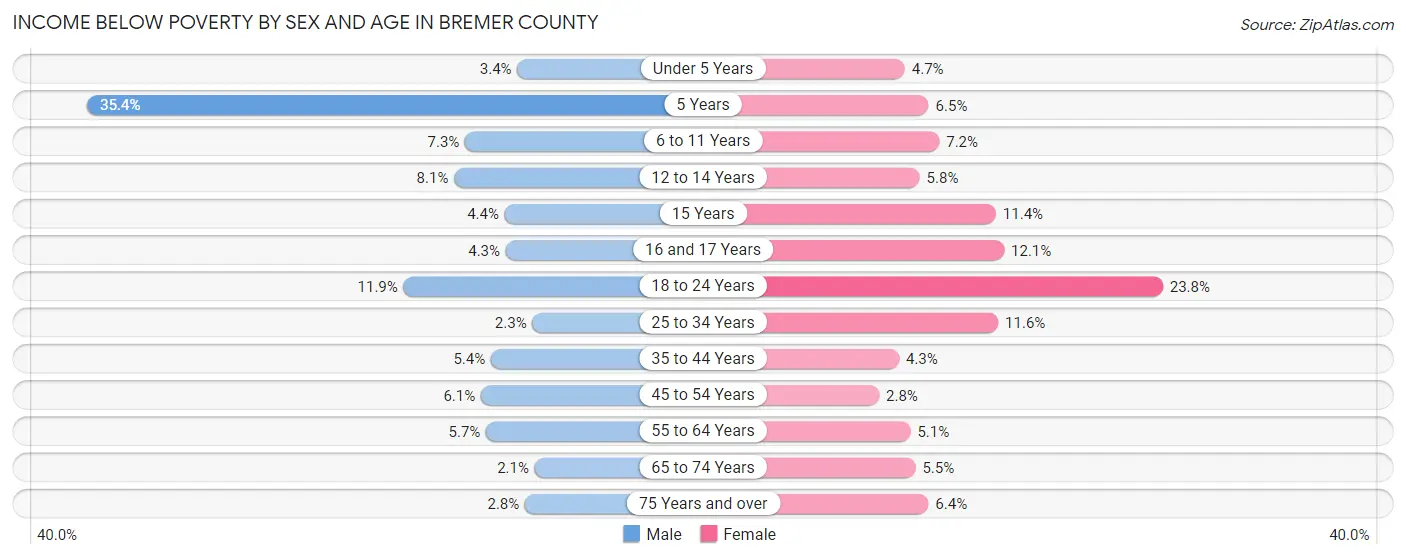
| Age Bracket | Male | Female |
| Under 5 Years | 25 (3.4%) | 31 (4.7%) |
| 5 Years | 64 (35.4%) | 12 (6.5%) |
| 6 to 11 Years | 73 (7.3%) | 72 (7.2%) |
| 12 to 14 Years | 37 (8.1%) | 24 (5.8%) |
| 15 Years | 6 (4.3%) | 23 (11.4%) |
| 16 and 17 Years | 16 (4.3%) | 30 (12.0%) |
| 18 to 24 Years | 81 (11.9%) | 224 (23.8%) |
| 25 to 34 Years | 31 (2.3%) | 152 (11.6%) |
| 35 to 44 Years | 86 (5.4%) | 66 (4.3%) |
| 45 to 54 Years | 88 (6.1%) | 37 (2.8%) |
| 55 to 64 Years | 86 (5.7%) | 78 (5.1%) |
| 65 to 74 Years | 27 (2.1%) | 71 (5.5%) |
| 75 Years and over | 25 (2.8%) | 76 (6.4%) |
| Total | 645 (5.6%) | 896 (7.6%) |
Income Above Poverty by Sex and Age in Bremer County
According to the poverty statistics in Bremer County, males aged 65 to 74 years and females aged 45 to 54 years are the age groups that are most secure financially, with 97.9% of males and 97.2% of females in these age groups living above the poverty line.
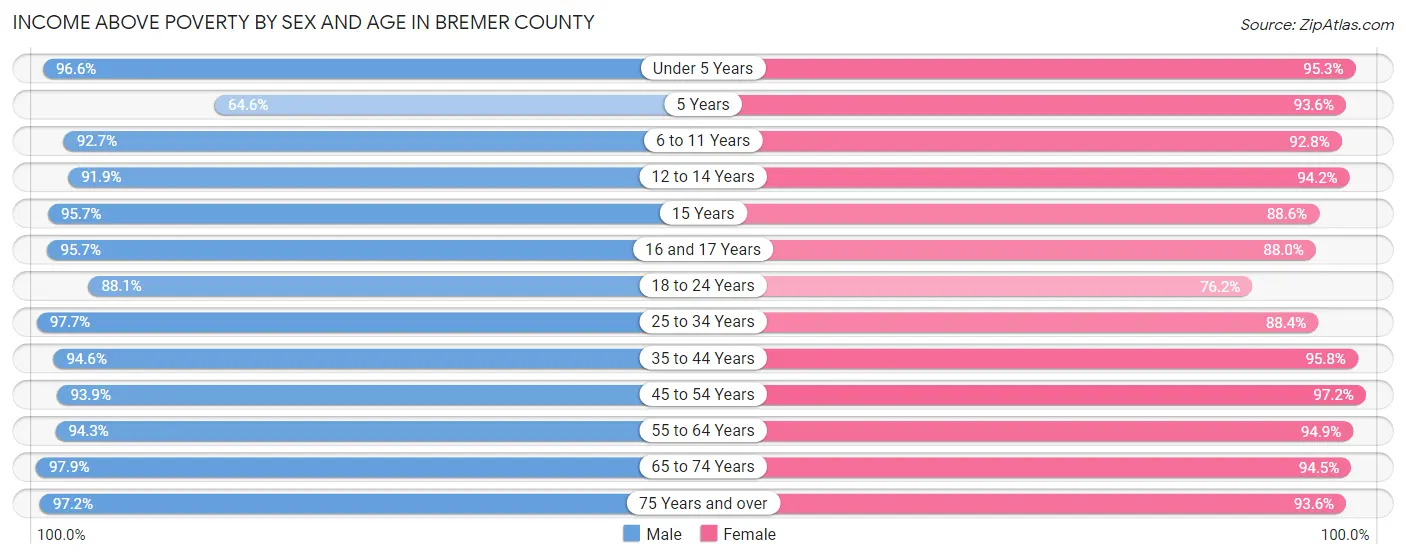
| Age Bracket | Male | Female |
| Under 5 Years | 708 (96.6%) | 632 (95.3%) |
| 5 Years | 117 (64.6%) | 174 (93.5%) |
| 6 to 11 Years | 929 (92.7%) | 922 (92.8%) |
| 12 to 14 Years | 420 (91.9%) | 391 (94.2%) |
| 15 Years | 132 (95.7%) | 178 (88.6%) |
| 16 and 17 Years | 359 (95.7%) | 219 (87.9%) |
| 18 to 24 Years | 602 (88.1%) | 716 (76.2%) |
| 25 to 34 Years | 1,322 (97.7%) | 1,157 (88.4%) |
| 35 to 44 Years | 1,515 (94.6%) | 1,486 (95.8%) |
| 45 to 54 Years | 1,353 (93.9%) | 1,298 (97.2%) |
| 55 to 64 Years | 1,415 (94.3%) | 1,452 (94.9%) |
| 65 to 74 Years | 1,249 (97.9%) | 1,226 (94.5%) |
| 75 Years and over | 855 (97.2%) | 1,106 (93.6%) |
| Total | 10,976 (94.5%) | 10,957 (92.4%) |
Income Below Poverty Among Married-Couple Families in Bremer County
The poverty statistics for married-couple families in Bremer County show that 1.7% or 97 of the total 5,585 families live below the poverty line. Families with 3 or 4 children have the highest poverty rate of 2.0%, comprising of 13 families. On the other hand, families with 5 or more children have the lowest poverty rate of 0.0%, which includes 0 families.
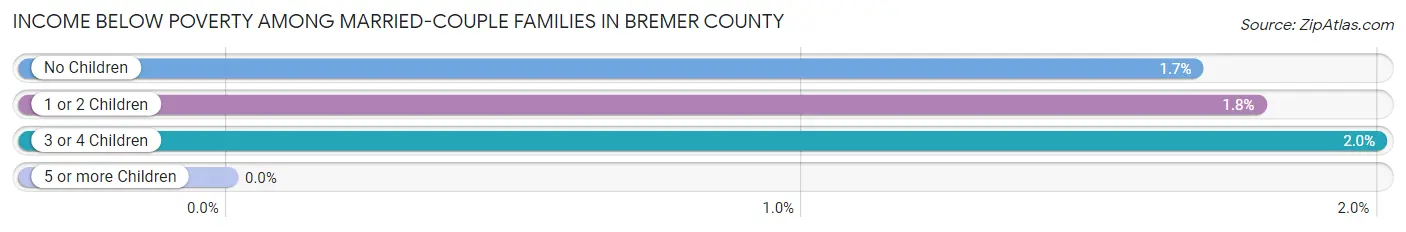
| Children | Above Poverty | Below Poverty |
| No Children | 3,396 (98.3%) | 58 (1.7%) |
| 1 or 2 Children | 1,428 (98.2%) | 26 (1.8%) |
| 3 or 4 Children | 637 (98.0%) | 13 (2.0%) |
| 5 or more Children | 27 (100.0%) | 0 (0.0%) |
| Total | 5,488 (98.3%) | 97 (1.7%) |
Income Below Poverty Among Single-Parent Households in Bremer County
According to the poverty data in Bremer County, 10.2% or 35 single-father households and 21.1% or 148 single-mother households are living below the poverty line. Among single-father households, those with 3 or 4 children have the highest poverty rate, with 8 households (21.6%) experiencing poverty. Likewise, among single-mother households, those with 3 or 4 children have the highest poverty rate, with 76 households (69.1%) falling below the poverty line.
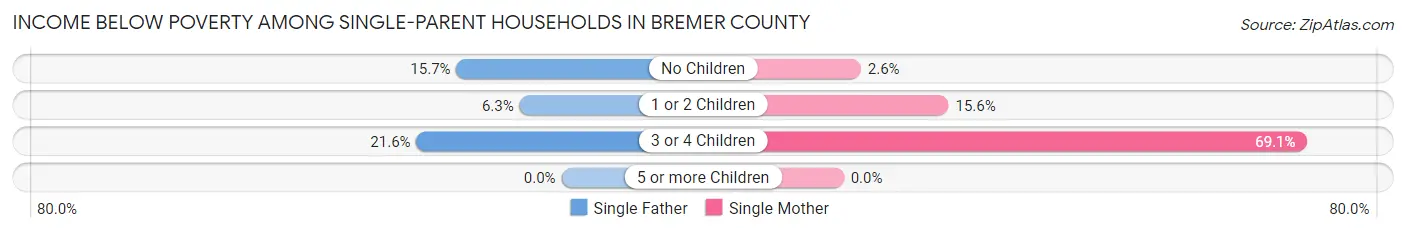
| Children | Single Father | Single Mother |
| No Children | 13 (15.7%) | 4 (2.6%) |
| 1 or 2 Children | 14 (6.2%) | 68 (15.6%) |
| 3 or 4 Children | 8 (21.6%) | 76 (69.1%) |
| 5 or more Children | 0 (0.0%) | 0 (0.0%) |
| Total | 35 (10.2%) | 148 (21.1%) |
Income Below Poverty Among Married-Couple vs Single-Parent Households in Bremer County
The poverty data for Bremer County shows that 97 of the married-couple family households (1.7%) and 183 of the single-parent households (17.5%) are living below the poverty level. Within the married-couple family households, those with 3 or 4 children have the highest poverty rate, with 13 households (2.0%) falling below the poverty line. Among the single-parent households, those with 3 or 4 children have the highest poverty rate, with 84 household (57.1%) living below poverty.
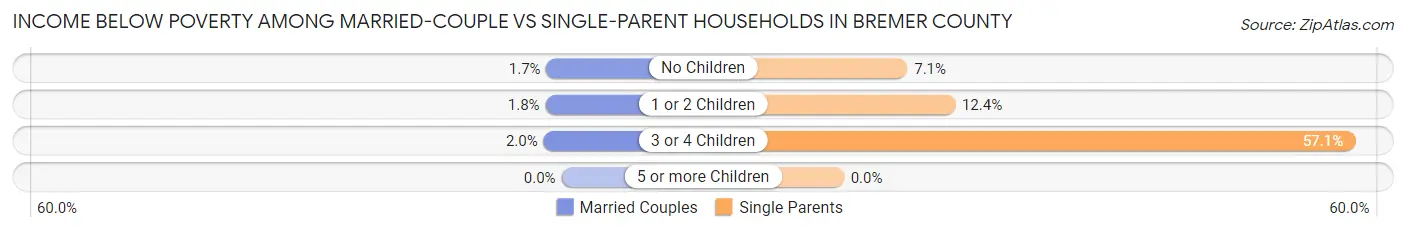
| Children | Married-Couple Families | Single-Parent Households |
| No Children | 58 (1.7%) | 17 (7.1%) |
| 1 or 2 Children | 26 (1.8%) | 82 (12.4%) |
| 3 or 4 Children | 13 (2.0%) | 84 (57.1%) |
| 5 or more Children | 0 (0.0%) | 0 (0.0%) |
| Total | 97 (1.7%) | 183 (17.5%) |
Race in Bremer County
The most populous races in Bremer County are White / Caucasian (23,454 | 93.8%), Two or more Races (699 | 2.8%), and Hispanic or Latino (464 | 1.9%).
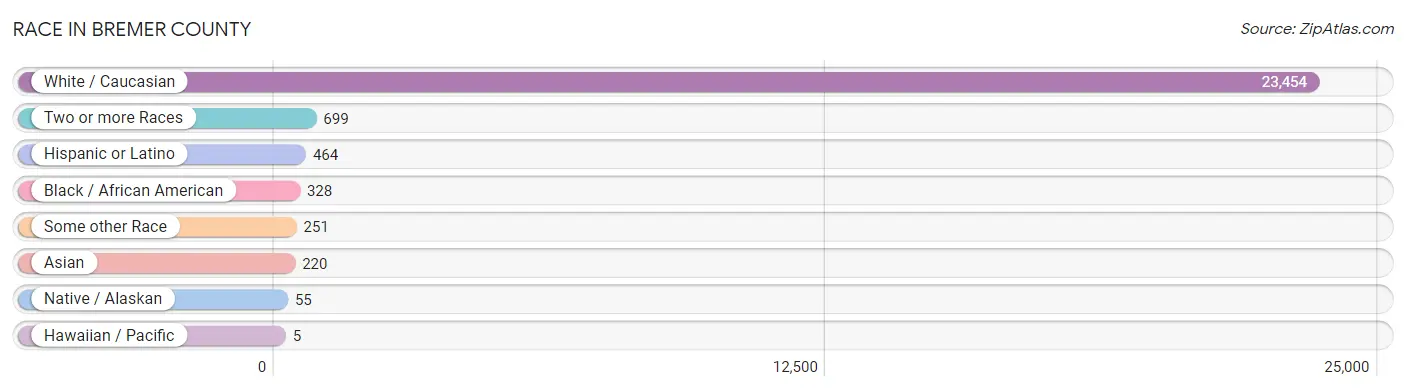
| Race | # Population | % Population |
| Asian | 220 | 0.9% |
| Black / African American | 328 | 1.3% |
| Hawaiian / Pacific | 5 | 0.0% |
| Hispanic or Latino | 464 | 1.9% |
| Native / Alaskan | 55 | 0.2% |
| White / Caucasian | 23,454 | 93.8% |
| Two or more Races | 699 | 2.8% |
| Some other Race | 251 | 1.0% |
| Total | 25,012 | 100.0% |
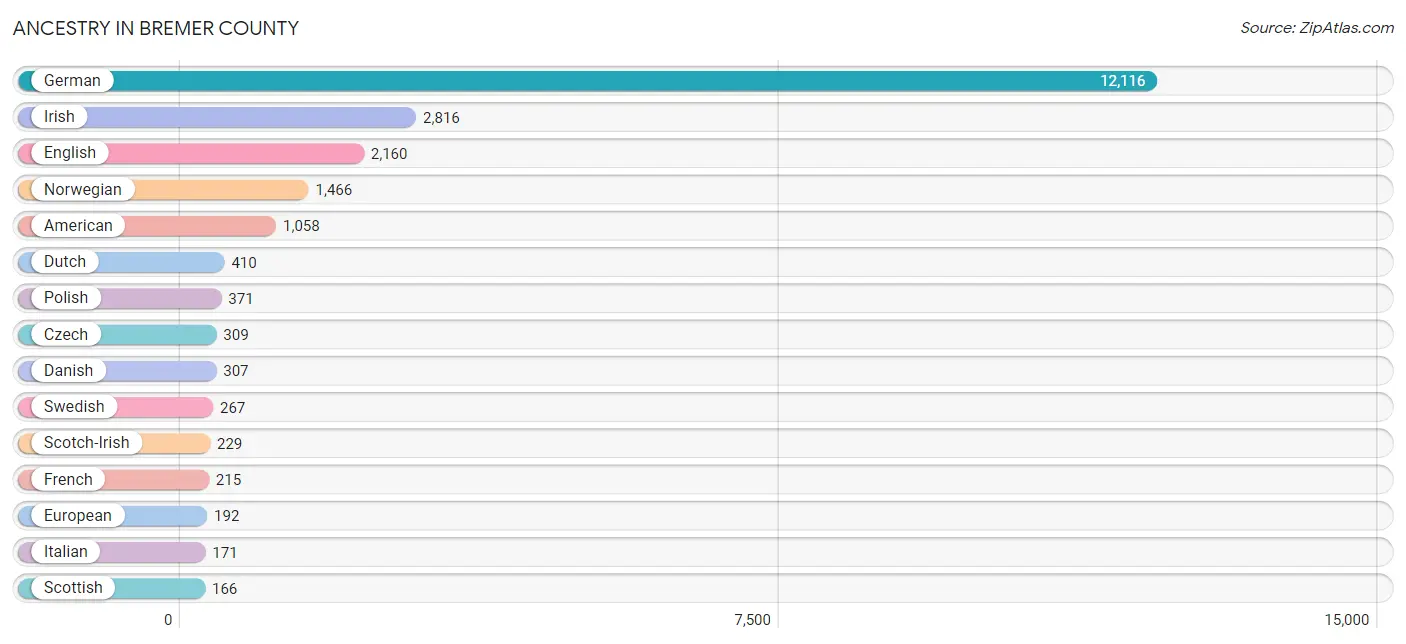
Ancestry in Bremer County
The most populous ancestries reported in Bremer County are German (12,116 | 48.4%), Irish (2,816 | 11.3%), English (2,160 | 8.6%), Norwegian (1,466 | 5.9%), and American (1,058 | 4.2%), together accounting for 78.4% of all Bremer County residents.
| Ancestry | # Population | % Population |
| African | 87 | 0.4% |
| American | 1,058 | 4.2% |
| Arab | 18 | 0.1% |
| Austrian | 82 | 0.3% |
| Belgian | 25 | 0.1% |
| Bhutanese | 52 | 0.2% |
| British | 82 | 0.3% |
| Burmese | 95 | 0.4% |
| Cambodian | 12 | 0.1% |
| Canadian | 6 | 0.0% |
| Central American | 55 | 0.2% |
| Central American Indian | 9 | 0.0% |
| Cherokee | 2 | 0.0% |
| Chippewa | 14 | 0.1% |
| Colombian | 96 | 0.4% |
| Croatian | 60 | 0.2% |
| Cuban | 19 | 0.1% |
| Czech | 309 | 1.2% |
| Czechoslovakian | 25 | 0.1% |
| Danish | 307 | 1.2% |
| Dominican | 31 | 0.1% |
| Dutch | 410 | 1.6% |
| Eastern European | 11 | 0.0% |
| English | 2,160 | 8.6% |
| Ethiopian | 3 | 0.0% |
| European | 192 | 0.8% |
| Finnish | 21 | 0.1% |
| French | 215 | 0.9% |
| French American Indian | 1 | 0.0% |
| French Canadian | 130 | 0.5% |
| German | 12,116 | 48.4% |
| Greek | 50 | 0.2% |
| Guamanian / Chamorro | 13 | 0.1% |
| Guatemalan | 45 | 0.2% |
| Hungarian | 70 | 0.3% |
| Indian (Asian) | 110 | 0.4% |
| Irish | 2,816 | 11.3% |
| Iroquois | 1 | 0.0% |
| Italian | 171 | 0.7% |
| Japanese | 33 | 0.1% |
| Kenyan | 2 | 0.0% |
| Korean | 44 | 0.2% |
| Laotian | 7 | 0.0% |
| Lebanese | 6 | 0.0% |
| Luxembourger | 13 | 0.1% |
| Malaysian | 4 | 0.0% |
| Mexican | 113 | 0.4% |
| Native Hawaiian | 46 | 0.2% |
| Nigerian | 2 | 0.0% |
| Northern European | 7 | 0.0% |
| Norwegian | 1,466 | 5.9% |
| Pakistani | 38 | 0.2% |
| Pennsylvania German | 4 | 0.0% |
| Polish | 371 | 1.5% |
| Portuguese | 21 | 0.1% |
| Puerto Rican | 116 | 0.5% |
| Romanian | 12 | 0.1% |
| Russian | 39 | 0.2% |
| Salvadoran | 10 | 0.0% |
| Scandinavian | 113 | 0.4% |
| Scotch-Irish | 229 | 0.9% |
| Scottish | 166 | 0.7% |
| Seminole | 2 | 0.0% |
| Sioux | 43 | 0.2% |
| Slovak | 11 | 0.0% |
| South American | 96 | 0.4% |
| Spanish | 8 | 0.0% |
| Sri Lankan | 2 | 0.0% |
| Subsaharan African | 107 | 0.4% |
| Swedish | 267 | 1.1% |
| Swiss | 31 | 0.1% |
| Syrian | 6 | 0.0% |
| Welsh | 128 | 0.5% |
| Yugoslavian | 23 | 0.1% | View All 74 Rows |
Immigrants in Bremer County
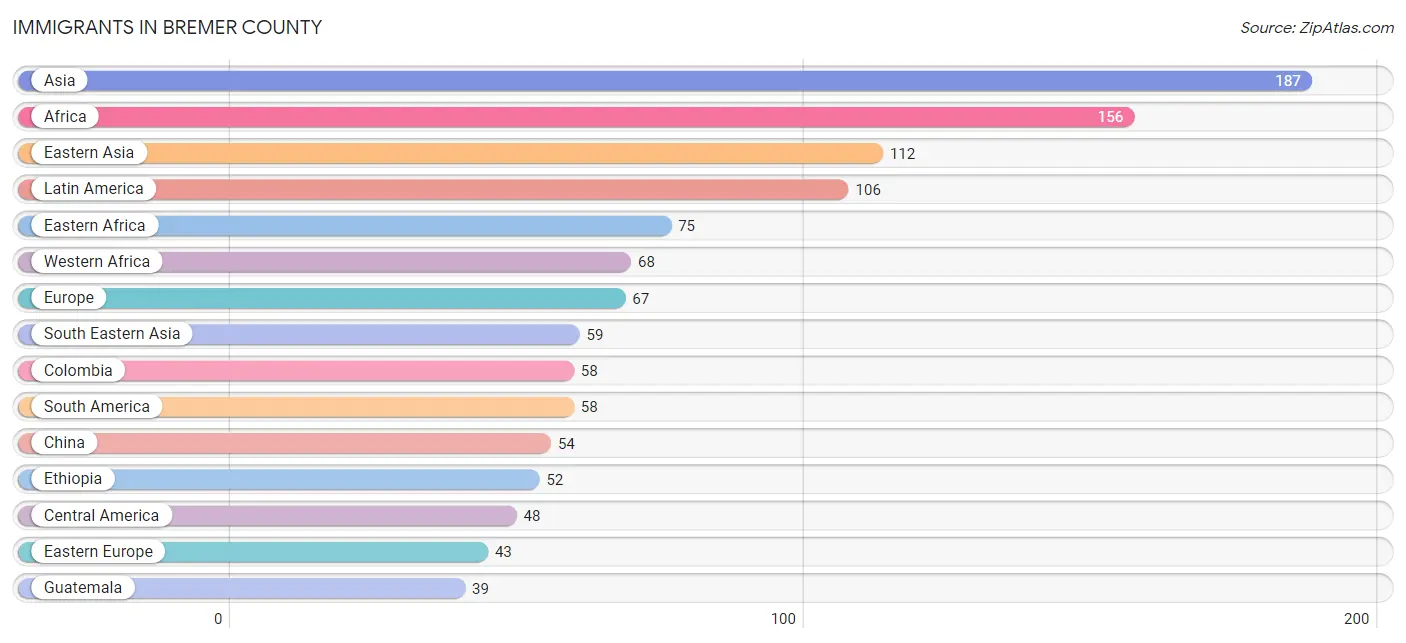
The most numerous immigrant groups reported in Bremer County came from Asia (187 | 0.7%), Africa (156 | 0.6%), Eastern Asia (112 | 0.4%), Latin America (106 | 0.4%), and Eastern Africa (75 | 0.3%), together accounting for 2.5% of all Bremer County residents.
| Immigration Origin | # Population | % Population |
| Africa | 156 | 0.6% |
| Asia | 187 | 0.7% |
| Bosnia and Herzegovina | 18 | 0.1% |
| Cambodia | 20 | 0.1% |
| Canada | 9 | 0.0% |
| Central America | 48 | 0.2% |
| China | 54 | 0.2% |
| Colombia | 58 | 0.2% |
| Congo | 7 | 0.0% |
| Eastern Africa | 75 | 0.3% |
| Eastern Asia | 112 | 0.4% |
| Eastern Europe | 43 | 0.2% |
| El Salvador | 4 | 0.0% |
| Eritrea | 21 | 0.1% |
| Ethiopia | 52 | 0.2% |
| Europe | 67 | 0.3% |
| Germany | 13 | 0.1% |
| Guatemala | 39 | 0.2% |
| India | 8 | 0.0% |
| Japan | 19 | 0.1% |
| Jordan | 6 | 0.0% |
| Kenya | 2 | 0.0% |
| Korea | 27 | 0.1% |
| Latin America | 106 | 0.4% |
| Lebanon | 2 | 0.0% |
| Mexico | 5 | 0.0% |
| Middle Africa | 7 | 0.0% |
| Northern Europe | 3 | 0.0% |
| Norway | 3 | 0.0% |
| Philippines | 1 | 0.0% |
| Russia | 25 | 0.1% |
| Sierra Leone | 6 | 0.0% |
| South America | 58 | 0.2% |
| South Central Asia | 8 | 0.0% |
| South Eastern Asia | 59 | 0.2% |
| Switzerland | 8 | 0.0% |
| Thailand | 38 | 0.2% |
| Western Africa | 68 | 0.3% |
| Western Asia | 8 | 0.0% |
| Western Europe | 21 | 0.1% | View All 40 Rows |
Sex and Age in Bremer County
Sex and Age in Bremer County
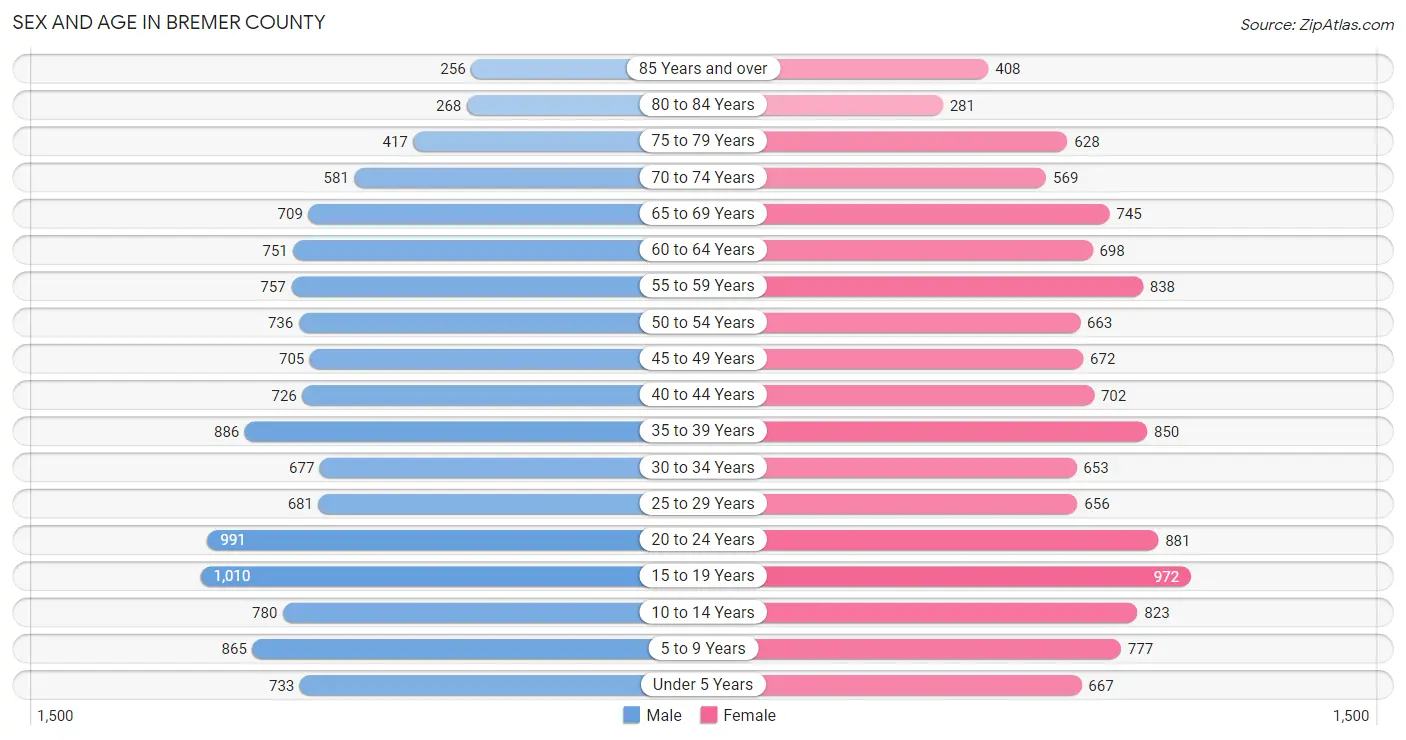
The most populous age groups in Bremer County are 15 to 19 Years (1,010 | 8.1%) for men and 15 to 19 Years (972 | 7.8%) for women.
| Age Bracket | Male | Female |
| Under 5 Years | 733 (5.9%) | 667 (5.3%) |
| 5 to 9 Years | 865 (6.9%) | 777 (6.2%) |
| 10 to 14 Years | 780 (6.2%) | 823 (6.6%) |
| 15 to 19 Years | 1,010 (8.1%) | 972 (7.8%) |
| 20 to 24 Years | 991 (7.9%) | 881 (7.1%) |
| 25 to 29 Years | 681 (5.4%) | 656 (5.3%) |
| 30 to 34 Years | 677 (5.4%) | 653 (5.2%) |
| 35 to 39 Years | 886 (7.1%) | 850 (6.8%) |
| 40 to 44 Years | 726 (5.8%) | 702 (5.6%) |
| 45 to 49 Years | 705 (5.6%) | 672 (5.4%) |
| 50 to 54 Years | 736 (5.9%) | 663 (5.3%) |
| 55 to 59 Years | 757 (6.0%) | 838 (6.7%) |
| 60 to 64 Years | 751 (6.0%) | 698 (5.6%) |
| 65 to 69 Years | 709 (5.7%) | 745 (6.0%) |
| 70 to 74 Years | 581 (4.6%) | 569 (4.6%) |
| 75 to 79 Years | 417 (3.3%) | 628 (5.0%) |
| 80 to 84 Years | 268 (2.1%) | 281 (2.2%) |
| 85 Years and over | 256 (2.0%) | 408 (3.3%) |
| Total | 12,529 (100.0%) | 12,483 (100.0%) |
Families and Households in Bremer County
Median Family Size in Bremer County
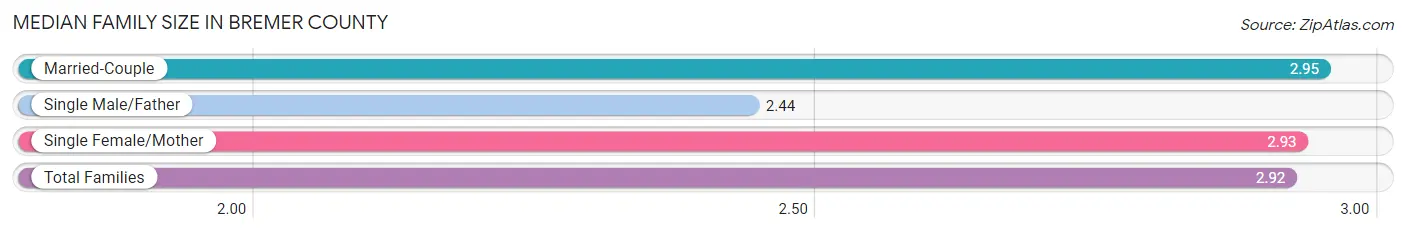
The median family size in Bremer County is 2.92 persons per family, with married-couple families (5,585 | 84.2%) accounting for the largest median family size of 2.95 persons per family. On the other hand, single male/father families (344 | 5.2%) represent the smallest median family size with 2.44 persons per family.
| Family Type | # Families | Family Size |
| Married-Couple | 5,585 (84.2%) | 2.95 |
| Single Male/Father | 344 (5.2%) | 2.44 |
| Single Female/Mother | 701 (10.6%) | 2.93 |
| Total Families | 6,630 (100.0%) | 2.92 |
Median Household Size in Bremer County
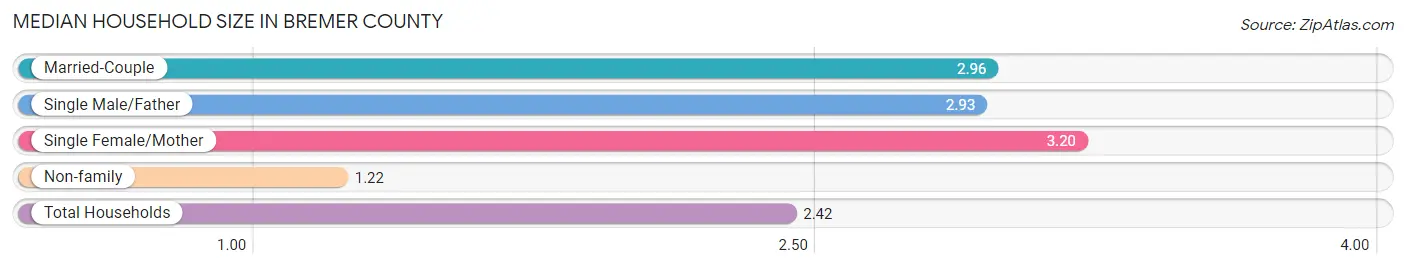
The median household size in Bremer County is 2.42 persons per household, with single female/mother households (701 | 7.2%) accounting for the largest median household size of 3.2 persons per household. non-family households (3,054 | 31.5%) represent the smallest median household size with 1.22 persons per household.
| Household Type | # Households | Household Size |
| Married-Couple | 5,585 (57.7%) | 2.96 |
| Single Male/Father | 344 (3.5%) | 2.93 |
| Single Female/Mother | 701 (7.2%) | 3.20 |
| Non-family | 3,054 (31.5%) | 1.22 |
| Total Households | 9,684 (100.0%) | 2.42 |
Household Size by Marriage Status in Bremer County
Out of a total of 9,684 households in Bremer County, 6,630 (68.5%) are family households, while 3,054 (31.5%) are nonfamily households. The most numerous type of family households are 2-person households, comprising 3,443, and the most common type of nonfamily households are 1-person households, comprising 2,621.
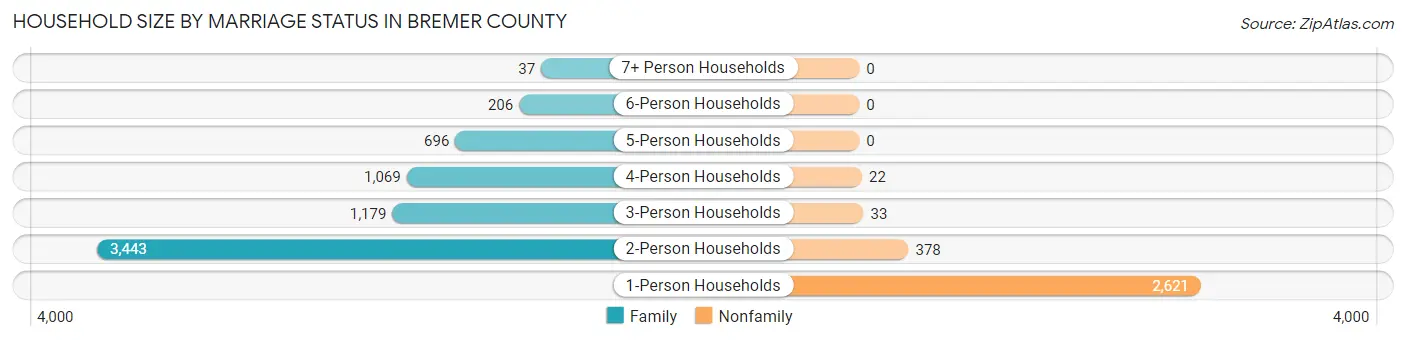
| Household Size | Family Households | Nonfamily Households |
| 1-Person Households | - | 2,621 (27.1%) |
| 2-Person Households | 3,443 (35.5%) | 378 (3.9%) |
| 3-Person Households | 1,179 (12.2%) | 33 (0.3%) |
| 4-Person Households | 1,069 (11.0%) | 22 (0.2%) |
| 5-Person Households | 696 (7.2%) | 0 (0.0%) |
| 6-Person Households | 206 (2.1%) | 0 (0.0%) |
| 7+ Person Households | 37 (0.4%) | 0 (0.0%) |
| Total | 6,630 (68.5%) | 3,054 (31.5%) |
Female Fertility in Bremer County
Fertility by Age in Bremer County
Average fertility rate in Bremer County is 53.0 births per 1,000 women. Women in the age bracket of 20 to 34 years have the highest fertility rate with 96.0 births per 1,000 women. Women in the age bracket of 20 to 34 years acount for 71.7% of all women with births.
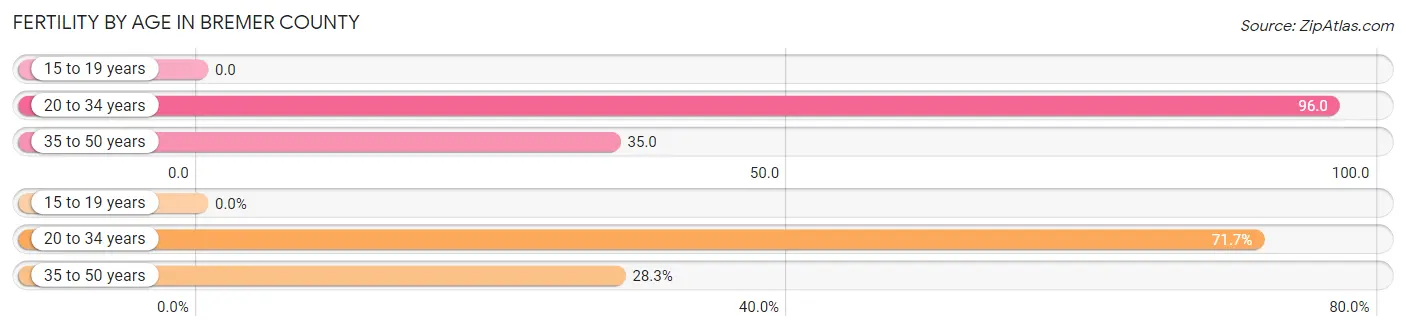
| Age Bracket | Women with Births | Births / 1,000 Women |
| 15 to 19 years | 0 (0.0%) | 0.0 |
| 20 to 34 years | 210 (71.7%) | 96.0 |
| 35 to 50 years | 83 (28.3%) | 35.0 |
| Total | 293 (100.0%) | 53.0 |
Fertility by Age by Marriage Status in Bremer County
90.1% of women with births (293) in Bremer County are married. The highest percentage of unmarried women with births falls into 20 to 34 years age bracket with 13.8% of them unmarried at the time of birth, while the lowest percentage of unmarried women with births belong to 35 to 50 years age bracket with 0.0% of them unmarried.
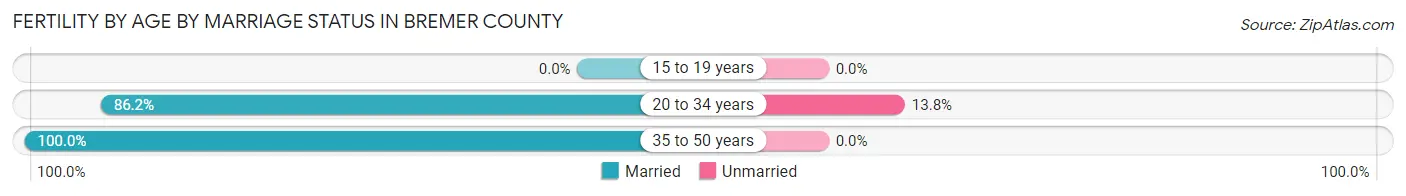
| Age Bracket | Married | Unmarried |
| 15 to 19 years | 0 (0.0%) | 0 (0.0%) |
| 20 to 34 years | 181 (86.2%) | 29 (13.8%) |
| 35 to 50 years | 83 (100.0%) | 0 (0.0%) |
| Total | 264 (90.1%) | 29 (9.9%) |
Fertility by Education in Bremer County
Average fertility rate in Bremer County is 53.0 births per 1,000 women. Women with the education attainment of graduate degree have the highest fertility rate of 126.0 births per 1,000 women, while women with the education attainment of less than high school have the lowest fertility at 22.0 births per 1,000 women. Women with the education attainment of college or associate's degree represent 35.1% of all women with births.
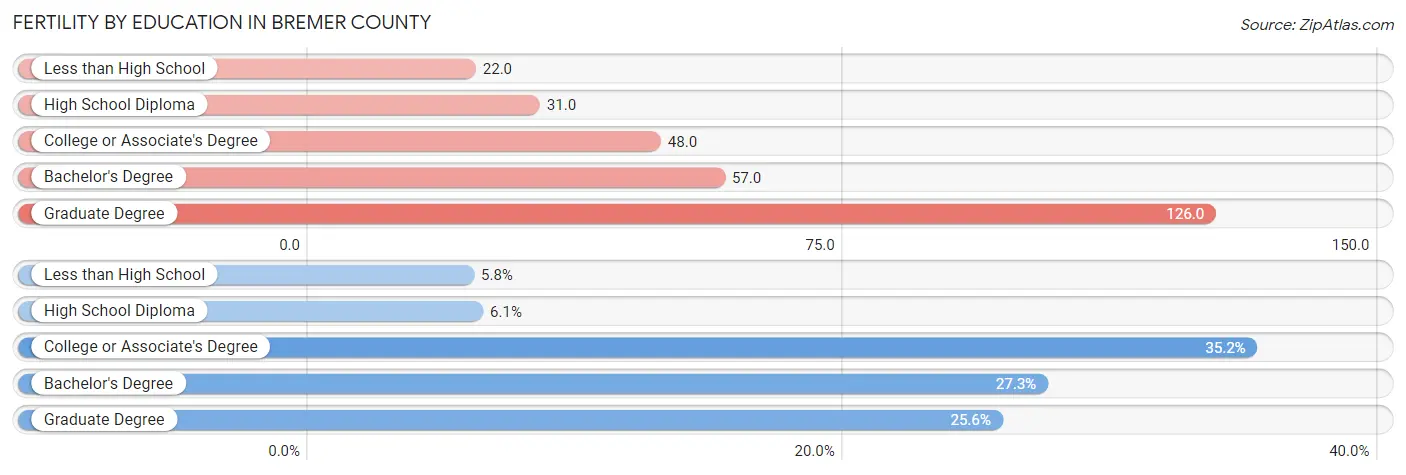
| Educational Attainment | Women with Births | Births / 1,000 Women |
| Less than High School | 17 (5.8%) | 22.0 |
| High School Diploma | 18 (6.1%) | 31.0 |
| College or Associate's Degree | 103 (35.1%) | 48.0 |
| Bachelor's Degree | 80 (27.3%) | 57.0 |
| Graduate Degree | 75 (25.6%) | 126.0 |
| Total | 293 (100.0%) | 53.0 |
Fertility by Education by Marriage Status in Bremer County
9.9% of women with births in Bremer County are unmarried. Women with the educational attainment of less than high school are most likely to be married with 100.0% of them married at childbirth, while women with the educational attainment of high school diploma are least likely to be married with 16.7% of them unmarried at childbirth.
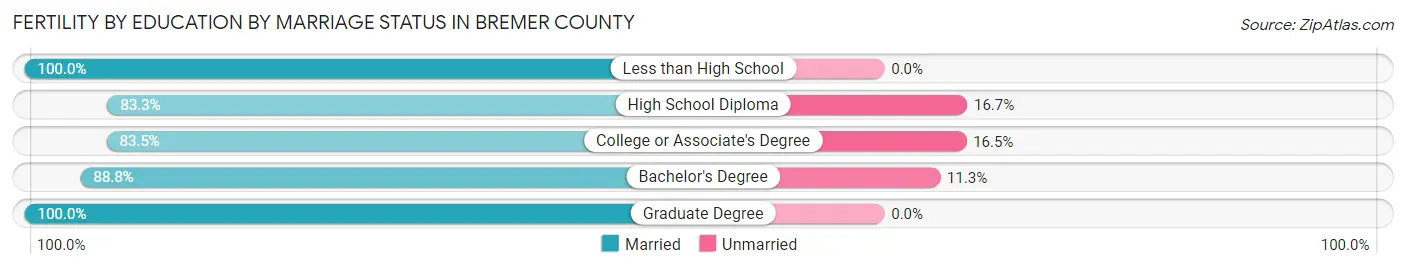
| Educational Attainment | Married | Unmarried |
| Less than High School | 17 (100.0%) | 0 (0.0%) |
| High School Diploma | 15 (83.3%) | 3 (16.7%) |
| College or Associate's Degree | 86 (83.5%) | 17 (16.5%) |
| Bachelor's Degree | 71 (88.7%) | 9 (11.3%) |
| Graduate Degree | 75 (100.0%) | 0 (0.0%) |
| Total | 264 (90.1%) | 29 (9.9%) |
Employment Characteristics in Bremer County
Employment by Class of Employer in Bremer County
Among the 12,544 employed individuals in Bremer County, private company employees (8,001 | 63.8%), not-for-profit organizations (1,545 | 12.3%), and local government employees (1,054 | 8.4%) make up the most common classes of employment.
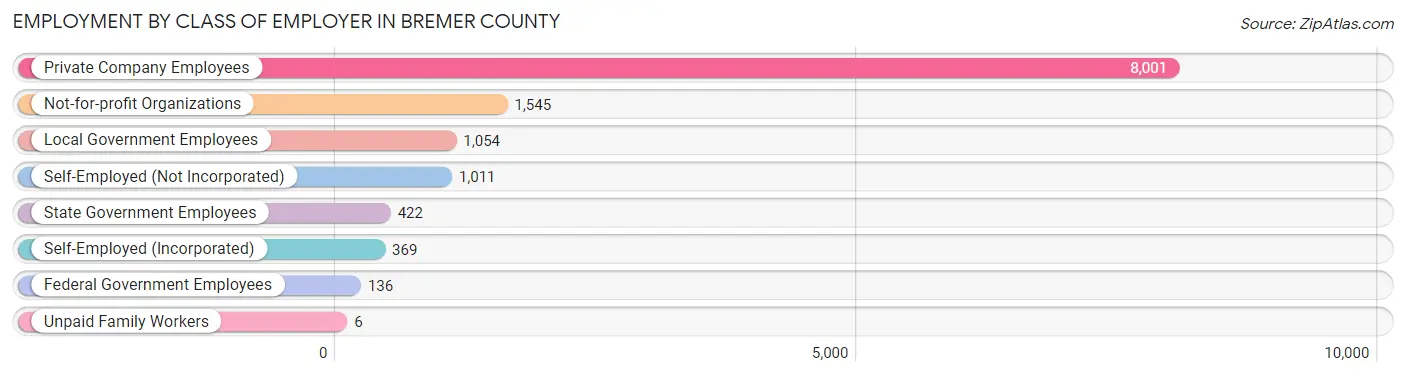
| Employer Class | # Employees | % Employees |
| Private Company Employees | 8,001 | 63.8% |
| Self-Employed (Incorporated) | 369 | 2.9% |
| Self-Employed (Not Incorporated) | 1,011 | 8.1% |
| Not-for-profit Organizations | 1,545 | 12.3% |
| Local Government Employees | 1,054 | 8.4% |
| State Government Employees | 422 | 3.4% |
| Federal Government Employees | 136 | 1.1% |
| Unpaid Family Workers | 6 | 0.1% |
| Total | 12,544 | 100.0% |
Employment Status by Age in Bremer County
According to the labor force statistics for Bremer County, out of the total population over 16 years of age (20,024), 66.7% or 13,356 individuals are in the labor force, with 3.2% or 427 of them unemployed. The age group with the highest labor force participation rate is 30 to 34 years, with 92.2% or 1,226 individuals in the labor force. Within the labor force, the 16 to 19 years age range has the highest percentage of unemployed individuals, with 8.7% or 77 of them being unemployed.
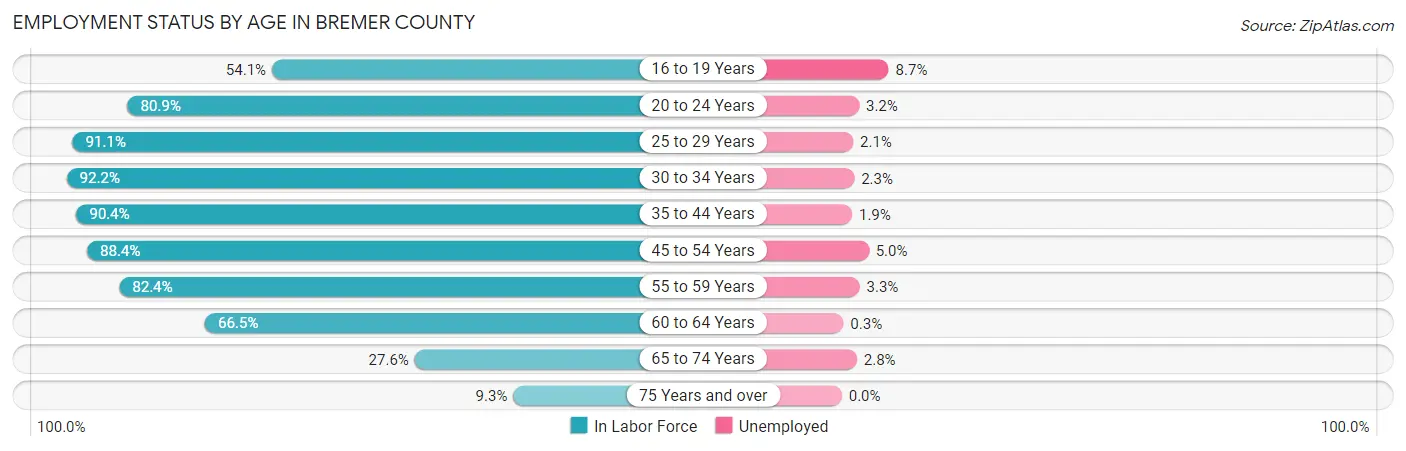
| Age Bracket | In Labor Force | Unemployed |
| 16 to 19 Years | 887 (54.1%) | 77 (8.7%) |
| 20 to 24 Years | 1,514 (80.9%) | 48 (3.2%) |
| 25 to 29 Years | 1,218 (91.1%) | 26 (2.1%) |
| 30 to 34 Years | 1,226 (92.2%) | 28 (2.3%) |
| 35 to 44 Years | 2,860 (90.4%) | 54 (1.9%) |
| 45 to 54 Years | 2,454 (88.4%) | 123 (5.0%) |
| 55 to 59 Years | 1,314 (82.4%) | 43 (3.3%) |
| 60 to 64 Years | 964 (66.5%) | 3 (0.3%) |
| 65 to 74 Years | 719 (27.6%) | 20 (2.8%) |
| 75 Years and over | 210 (9.3%) | 0 (0.0%) |
| Total | 13,356 (66.7%) | 427 (3.2%) |
Employment Status by Educational Attainment in Bremer County
According to labor force statistics for Bremer County, 86.1% of individuals (10,032) out of the total population between 25 and 64 years of age (11,651) are in the labor force, with 2.8% or 281 of them being unemployed. The group with the highest labor force participation rate are those with the educational attainment of bachelor's degree or higher, with 91.3% or 4,167 individuals in the labor force. Within the labor force, individuals with less than high school education have the highest percentage of unemployment, with 5.1% or 17 of them being unemployed.
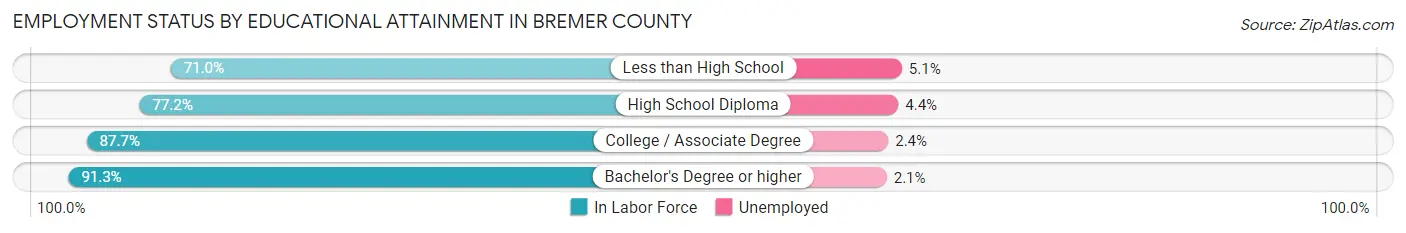
| Educational Attainment | In Labor Force | Unemployed |
| Less than High School | 333 (71.0%) | 24 (5.1%) |
| High School Diploma | 1,968 (77.2%) | 112 (4.4%) |
| College / Associate Degree | 3,569 (87.7%) | 98 (2.4%) |
| Bachelor's Degree or higher | 4,167 (91.3%) | 96 (2.1%) |
| Total | 10,032 (86.1%) | 326 (2.8%) |
Employment Occupations by Sex in Bremer County
Management, Business, Science and Arts Occupations
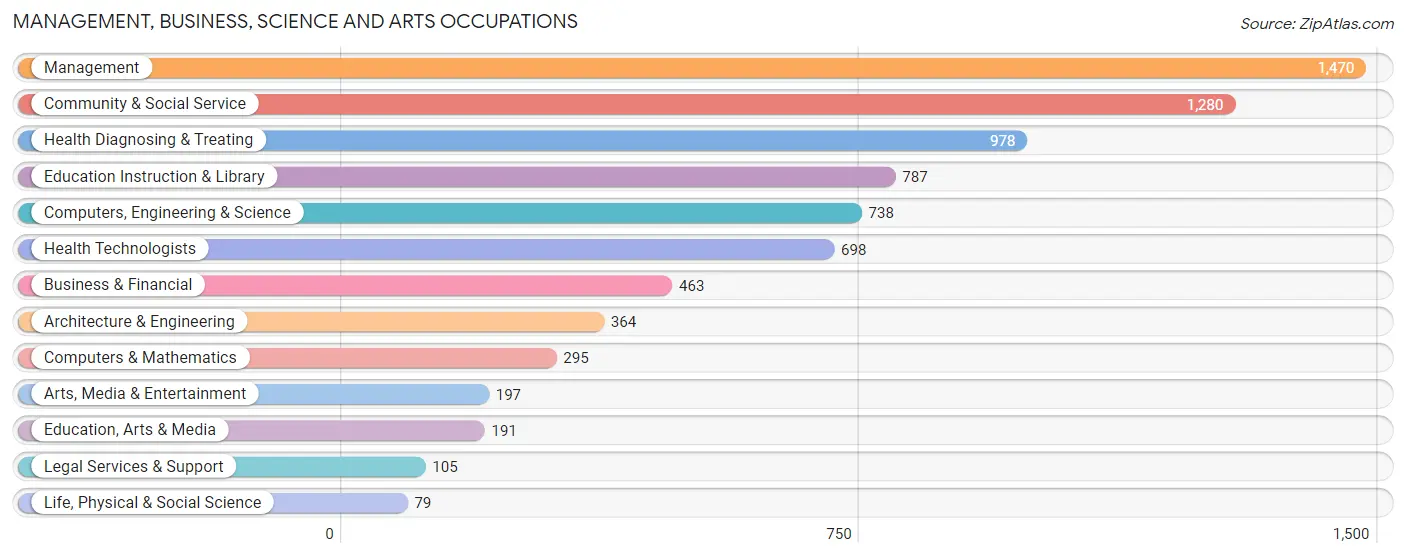
The most common Management, Business, Science and Arts occupations in Bremer County are Management (1,470 | 11.4%), Community & Social Service (1,280 | 9.9%), Health Diagnosing & Treating (978 | 7.6%), Education Instruction & Library (787 | 6.1%), and Computers, Engineering & Science (738 | 5.7%).
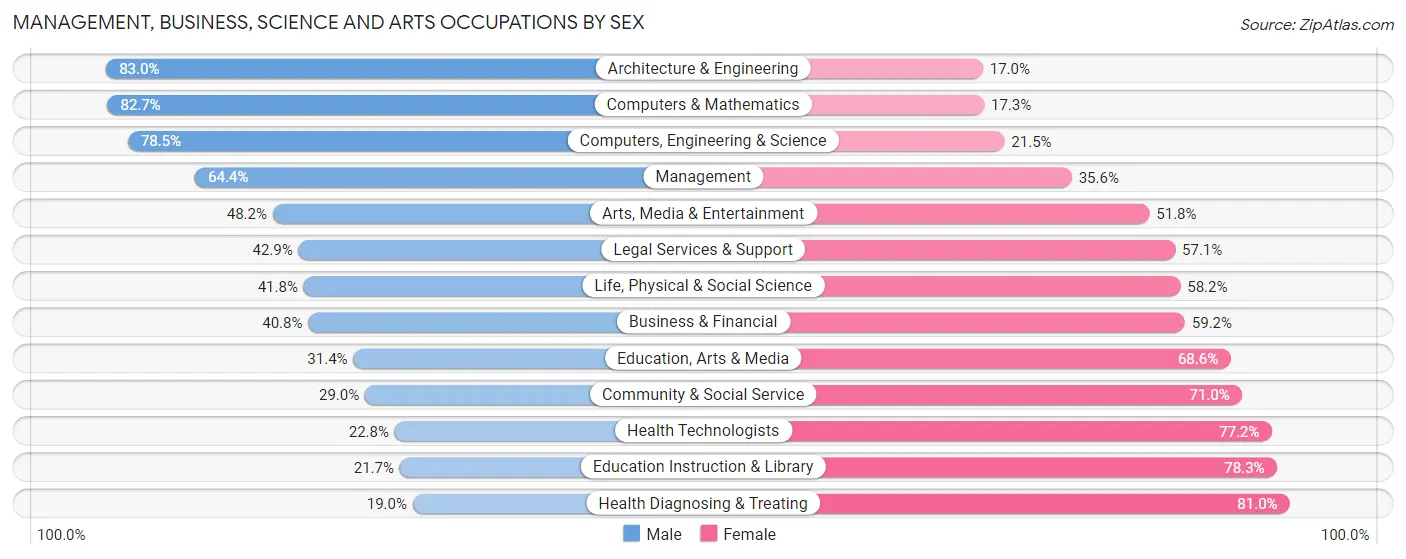
Management, Business, Science and Arts Occupations by Sex
Within the Management, Business, Science and Arts occupations in Bremer County, the most male-oriented occupations are Architecture & Engineering (83.0%), Computers & Mathematics (82.7%), and Computers, Engineering & Science (78.5%), while the most female-oriented occupations are Health Diagnosing & Treating (81.0%), Education Instruction & Library (78.3%), and Health Technologists (77.2%).
| Occupation | Male | Female |
| Management | 947 (64.4%) | 523 (35.6%) |
| Business & Financial | 189 (40.8%) | 274 (59.2%) |
| Computers, Engineering & Science | 579 (78.5%) | 159 (21.5%) |
| Computers & Mathematics | 244 (82.7%) | 51 (17.3%) |
| Architecture & Engineering | 302 (83.0%) | 62 (17.0%) |
| Life, Physical & Social Science | 33 (41.8%) | 46 (58.2%) |
| Community & Social Service | 371 (29.0%) | 909 (71.0%) |
| Education, Arts & Media | 60 (31.4%) | 131 (68.6%) |
| Legal Services & Support | 45 (42.9%) | 60 (57.1%) |
| Education Instruction & Library | 171 (21.7%) | 616 (78.3%) |
| Arts, Media & Entertainment | 95 (48.2%) | 102 (51.8%) |
| Health Diagnosing & Treating | 186 (19.0%) | 792 (81.0%) |
| Health Technologists | 159 (22.8%) | 539 (77.2%) |
| Total (Category) | 2,272 (46.1%) | 2,657 (53.9%) |
| Total (Overall) | 6,810 (52.7%) | 6,118 (47.3%) |
Services Occupations
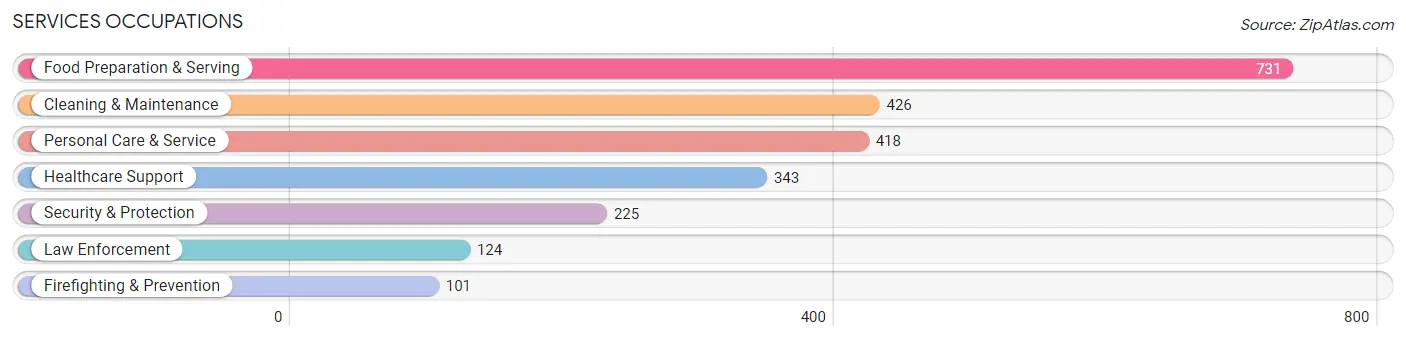
The most common Services occupations in Bremer County are Food Preparation & Serving (731 | 5.7%), Cleaning & Maintenance (426 | 3.3%), Personal Care & Service (418 | 3.2%), Healthcare Support (343 | 2.6%), and Security & Protection (225 | 1.7%).
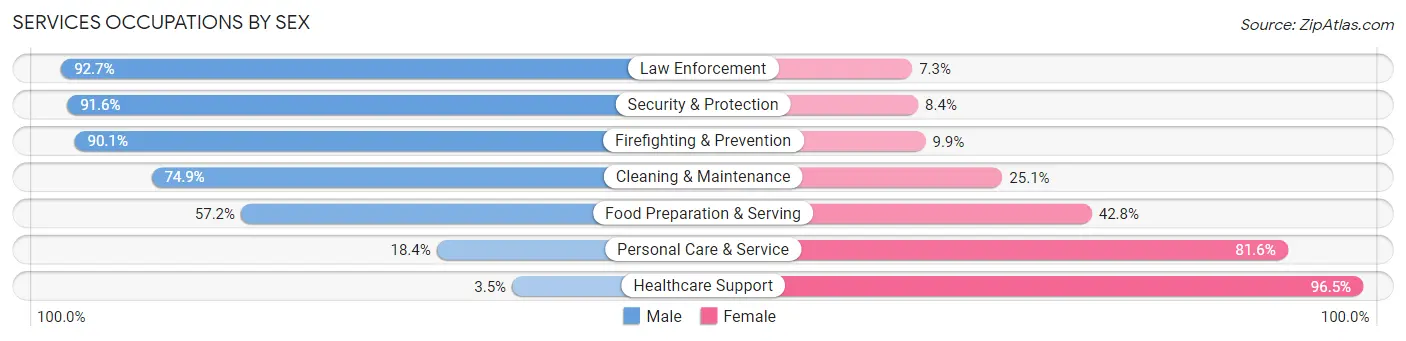
Services Occupations by Sex
Within the Services occupations in Bremer County, the most male-oriented occupations are Law Enforcement (92.7%), Security & Protection (91.6%), and Firefighting & Prevention (90.1%), while the most female-oriented occupations are Healthcare Support (96.5%), Personal Care & Service (81.6%), and Food Preparation & Serving (42.8%).
| Occupation | Male | Female |
| Healthcare Support | 12 (3.5%) | 331 (96.5%) |
| Security & Protection | 206 (91.6%) | 19 (8.4%) |
| Firefighting & Prevention | 91 (90.1%) | 10 (9.9%) |
| Law Enforcement | 115 (92.7%) | 9 (7.3%) |
| Food Preparation & Serving | 418 (57.2%) | 313 (42.8%) |
| Cleaning & Maintenance | 319 (74.9%) | 107 (25.1%) |
| Personal Care & Service | 77 (18.4%) | 341 (81.6%) |
| Total (Category) | 1,032 (48.2%) | 1,111 (51.8%) |
| Total (Overall) | 6,810 (52.7%) | 6,118 (47.3%) |
Sales and Office Occupations
The most common Sales and Office occupations in Bremer County are Office & Administration (1,359 | 10.5%), and Sales & Related (895 | 6.9%).
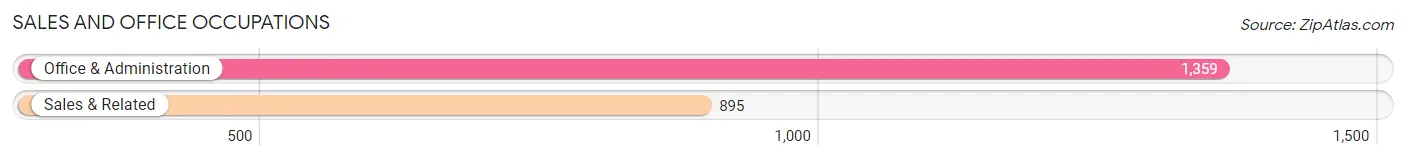
Sales and Office Occupations by Sex
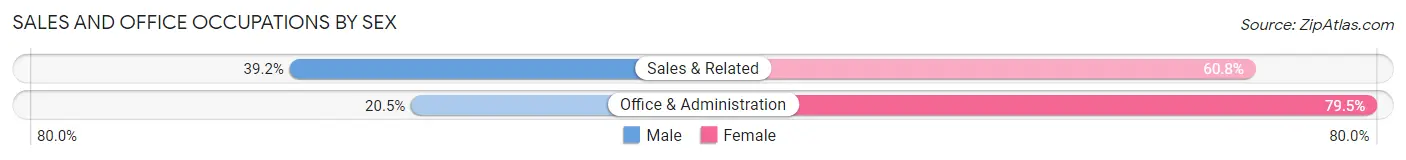
| Occupation | Male | Female |
| Sales & Related | 351 (39.2%) | 544 (60.8%) |
| Office & Administration | 279 (20.5%) | 1,080 (79.5%) |
| Total (Category) | 630 (28.0%) | 1,624 (72.1%) |
| Total (Overall) | 6,810 (52.7%) | 6,118 (47.3%) |
Natural Resources, Construction and Maintenance Occupations
The most common Natural Resources, Construction and Maintenance occupations in Bremer County are Construction & Extraction (458 | 3.5%), Installation, Maintenance & Repair (433 | 3.4%), and Farming, Fishing & Forestry (186 | 1.4%).
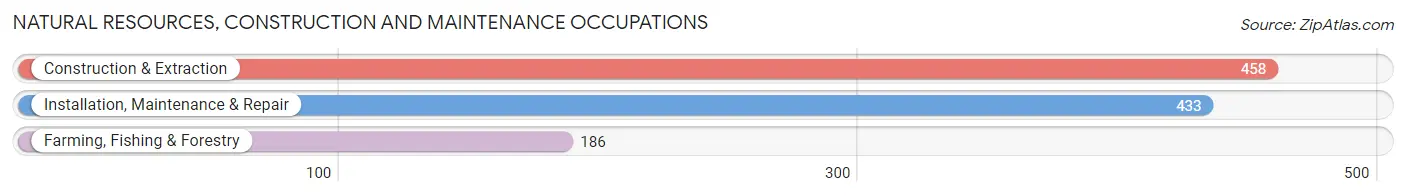
Natural Resources, Construction and Maintenance Occupations by Sex
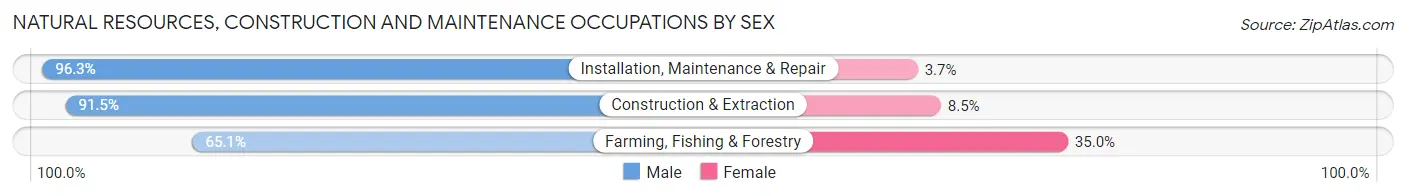
| Occupation | Male | Female |
| Farming, Fishing & Forestry | 121 (65.0%) | 65 (34.9%) |
| Construction & Extraction | 419 (91.5%) | 39 (8.5%) |
| Installation, Maintenance & Repair | 417 (96.3%) | 16 (3.7%) |
| Total (Category) | 957 (88.9%) | 120 (11.1%) |
| Total (Overall) | 6,810 (52.7%) | 6,118 (47.3%) |
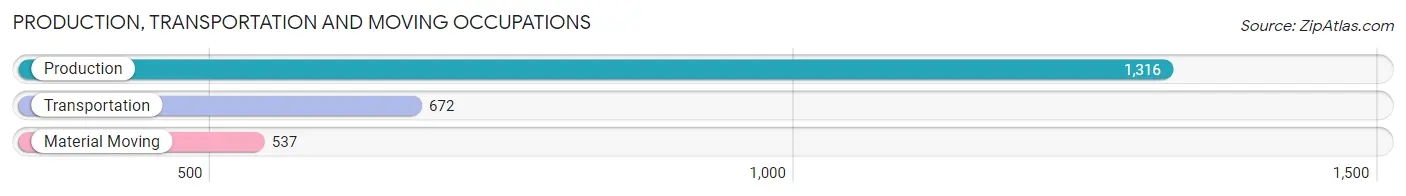
Production, Transportation and Moving Occupations
The most common Production, Transportation and Moving occupations in Bremer County are Production (1,316 | 10.2%), Transportation (672 | 5.2%), and Material Moving (537 | 4.2%).
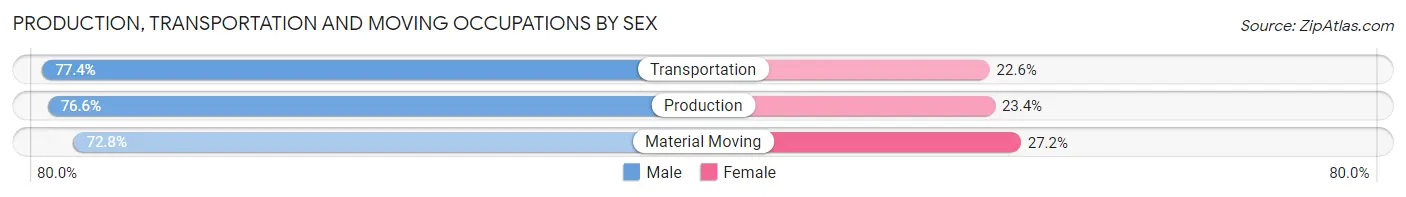
Production, Transportation and Moving Occupations by Sex
| Occupation | Male | Female |
| Production | 1,008 (76.6%) | 308 (23.4%) |
| Transportation | 520 (77.4%) | 152 (22.6%) |
| Material Moving | 391 (72.8%) | 146 (27.2%) |
| Total (Category) | 1,919 (76.0%) | 606 (24.0%) |
| Total (Overall) | 6,810 (52.7%) | 6,118 (47.3%) |
Employment Industries by Sex in Bremer County
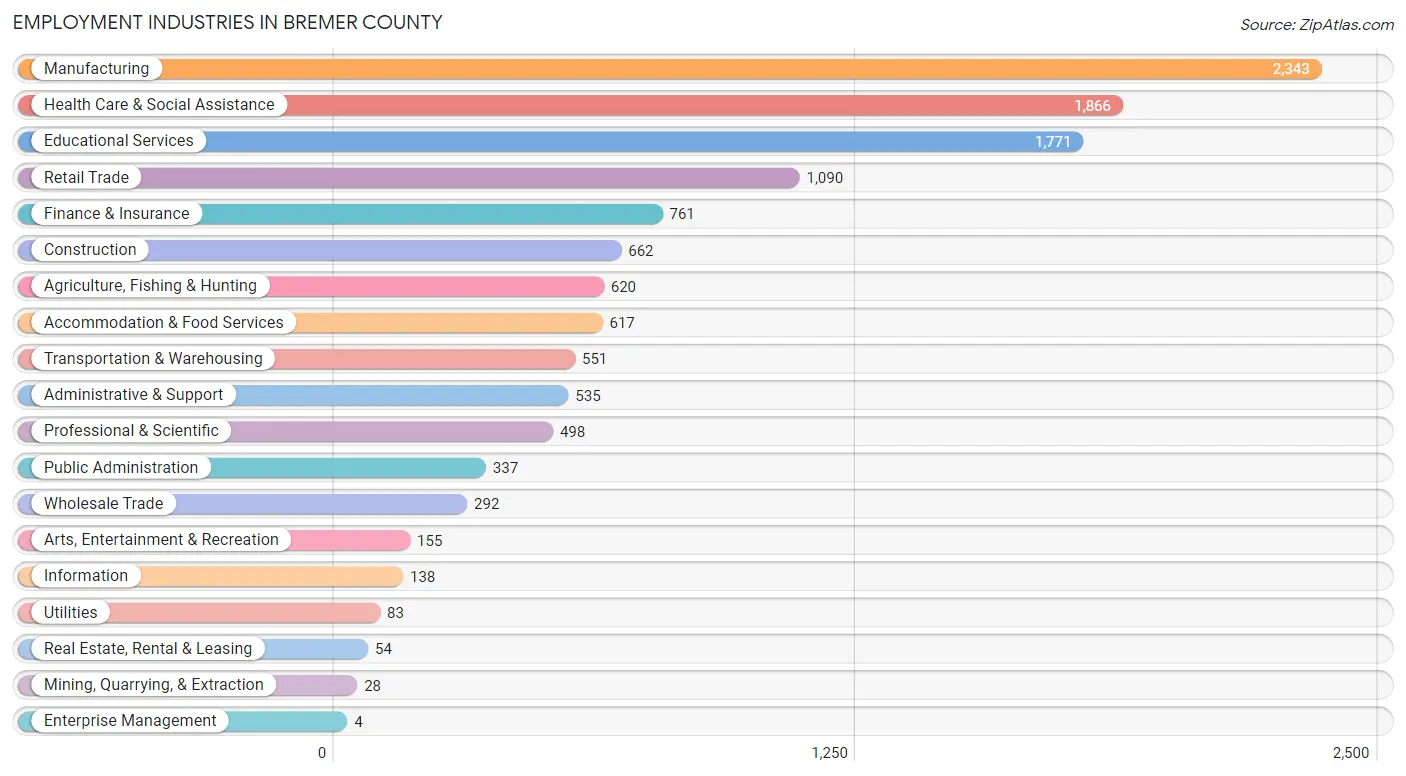
Employment Industries in Bremer County
The major employment industries in Bremer County include Manufacturing (2,343 | 18.1%), Health Care & Social Assistance (1,866 | 14.4%), Educational Services (1,771 | 13.7%), Retail Trade (1,090 | 8.4%), and Finance & Insurance (761 | 5.9%).
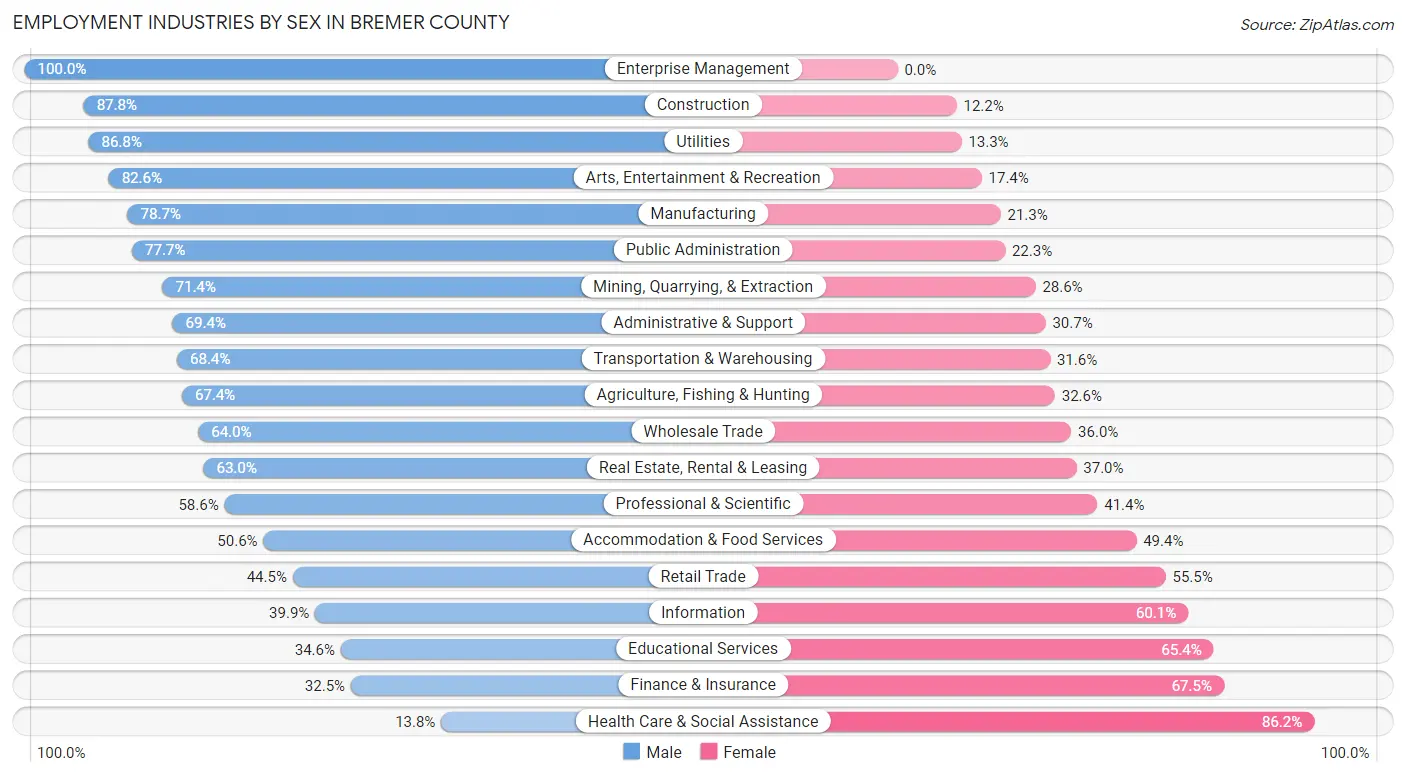
Employment Industries by Sex in Bremer County
The Bremer County industries that see more men than women are Enterprise Management (100.0%), Construction (87.8%), and Utilities (86.8%), whereas the industries that tend to have a higher number of women are Health Care & Social Assistance (86.2%), Finance & Insurance (67.5%), and Educational Services (65.4%).
| Industry | Male | Female |
| Agriculture, Fishing & Hunting | 418 (67.4%) | 202 (32.6%) |
| Mining, Quarrying, & Extraction | 20 (71.4%) | 8 (28.6%) |
| Construction | 581 (87.8%) | 81 (12.2%) |
| Manufacturing | 1,843 (78.7%) | 500 (21.3%) |
| Wholesale Trade | 187 (64.0%) | 105 (36.0%) |
| Retail Trade | 485 (44.5%) | 605 (55.5%) |
| Transportation & Warehousing | 377 (68.4%) | 174 (31.6%) |
| Utilities | 72 (86.8%) | 11 (13.3%) |
| Information | 55 (39.9%) | 83 (60.1%) |
| Finance & Insurance | 247 (32.5%) | 514 (67.5%) |
| Real Estate, Rental & Leasing | 34 (63.0%) | 20 (37.0%) |
| Professional & Scientific | 292 (58.6%) | 206 (41.4%) |
| Enterprise Management | 4 (100.0%) | 0 (0.0%) |
| Administrative & Support | 371 (69.4%) | 164 (30.6%) |
| Educational Services | 612 (34.6%) | 1,159 (65.4%) |
| Health Care & Social Assistance | 257 (13.8%) | 1,609 (86.2%) |
| Arts, Entertainment & Recreation | 128 (82.6%) | 27 (17.4%) |
| Accommodation & Food Services | 312 (50.6%) | 305 (49.4%) |
| Public Administration | 262 (77.7%) | 75 (22.3%) |
| Total | 6,810 (52.7%) | 6,118 (47.3%) |
Education in Bremer County
School Enrollment in Bremer County
The most common levels of schooling among the 6,916 students in Bremer County are college / undergraduate (2,027 | 29.3%), high school (1,350 | 19.5%), and elementary school (1,249 | 18.1%).
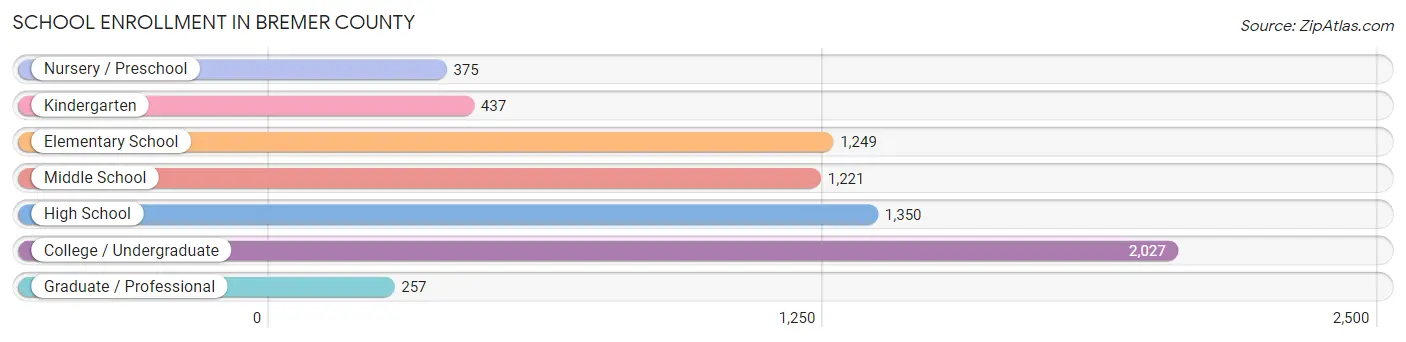
| School Level | # Students | % Students |
| Nursery / Preschool | 375 | 5.4% |
| Kindergarten | 437 | 6.3% |
| Elementary School | 1,249 | 18.1% |
| Middle School | 1,221 | 17.6% |
| High School | 1,350 | 19.5% |
| College / Undergraduate | 2,027 | 29.3% |
| Graduate / Professional | 257 | 3.7% |
| Total | 6,916 | 100.0% |
School Enrollment by Age by Funding Source in Bremer County
Out of a total of 6,916 students who are enrolled in schools in Bremer County, 1,985 (28.7%) attend a private institution, while the remaining 4,931 (71.3%) are enrolled in public schools. The age group of 20 to 24 year olds has the highest likelihood of being enrolled in private schools, with 977 (80.2% in the age bracket) enrolled. Conversely, the age group of 15 to 17 year olds has the lowest likelihood of being enrolled in a private school, with 967 (99.0% in the age bracket) attending a public institution.
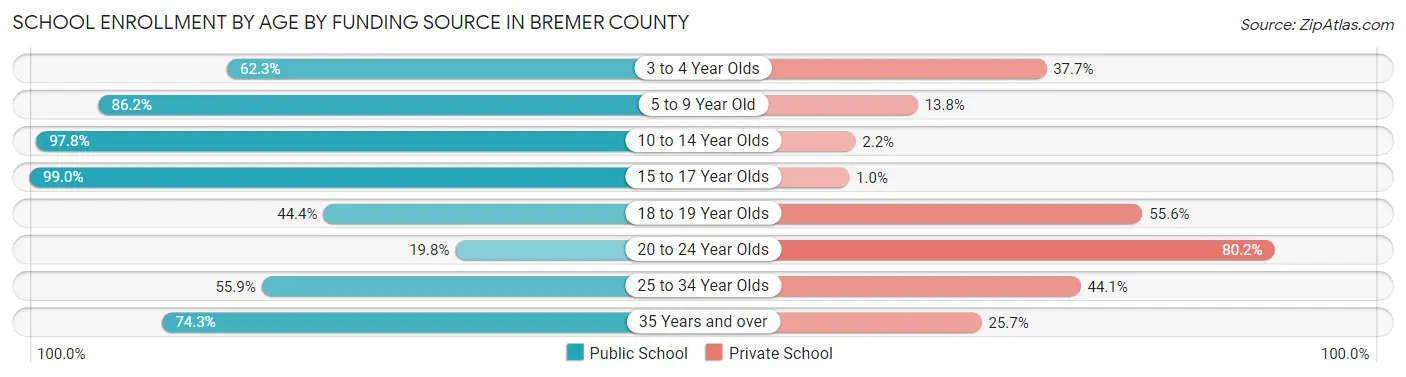
| Age Bracket | Public School | Private School |
| 3 to 4 Year Olds | 170 (62.3%) | 103 (37.7%) |
| 5 to 9 Year Old | 1,338 (86.2%) | 214 (13.8%) |
| 10 to 14 Year Olds | 1,531 (97.8%) | 34 (2.2%) |
| 15 to 17 Year Olds | 967 (99.0%) | 10 (1.0%) |
| 18 to 19 Year Olds | 401 (44.4%) | 503 (55.6%) |
| 20 to 24 Year Olds | 241 (19.8%) | 977 (80.2%) |
| 25 to 34 Year Olds | 95 (55.9%) | 75 (44.1%) |
| 35 Years and over | 191 (74.3%) | 66 (25.7%) |
| Total | 4,931 (71.3%) | 1,985 (28.7%) |
Educational Attainment by Field of Study in Bremer County
Education (1,289 | 21.4%), business (968 | 16.1%), science & technology (754 | 12.5%), bio, nature & agricultural (673 | 11.2%), and arts & humanities (419 | 7.0%) are the most common fields of study among 6,019 individuals in Bremer County who have obtained a bachelor's degree or higher.
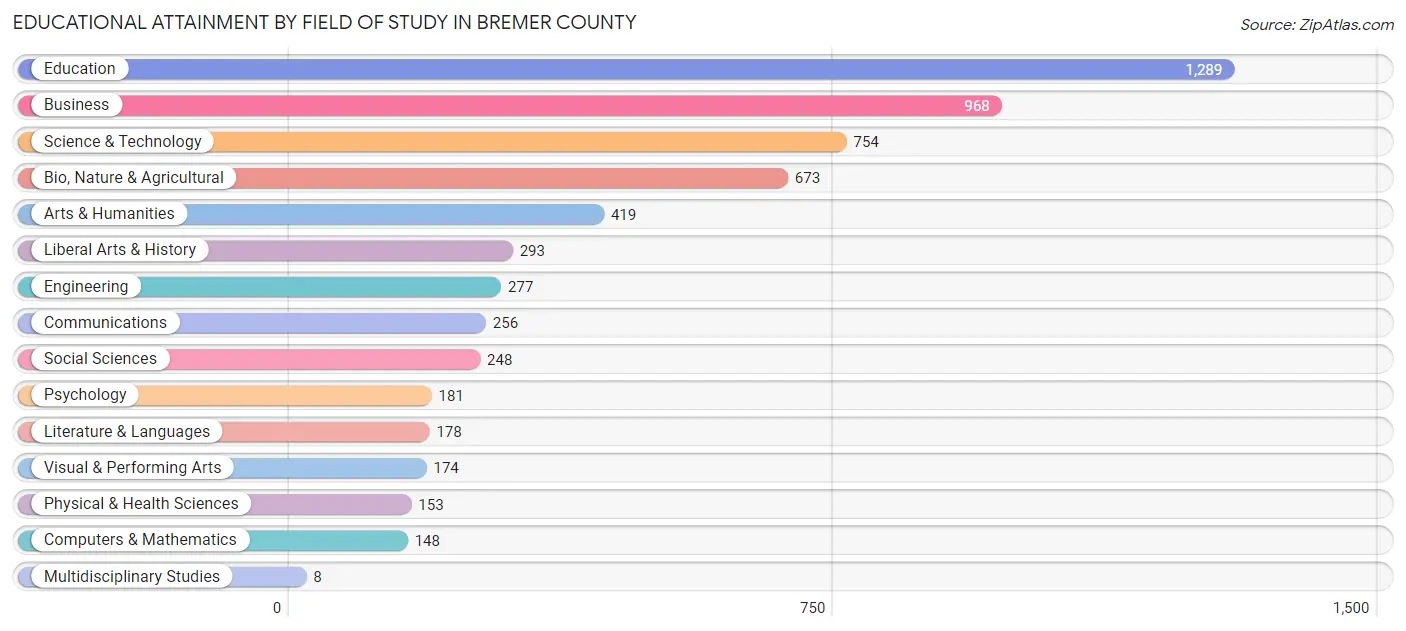
| Field of Study | # Graduates | % Graduates |
| Computers & Mathematics | 148 | 2.5% |
| Bio, Nature & Agricultural | 673 | 11.2% |
| Physical & Health Sciences | 153 | 2.5% |
| Psychology | 181 | 3.0% |
| Social Sciences | 248 | 4.1% |
| Engineering | 277 | 4.6% |
| Multidisciplinary Studies | 8 | 0.1% |
| Science & Technology | 754 | 12.5% |
| Business | 968 | 16.1% |
| Education | 1,289 | 21.4% |
| Literature & Languages | 178 | 3.0% |
| Liberal Arts & History | 293 | 4.9% |
| Visual & Performing Arts | 174 | 2.9% |
| Communications | 256 | 4.3% |
| Arts & Humanities | 419 | 7.0% |
| Total | 6,019 | 100.0% |
Transportation & Commute in Bremer County
Vehicle Availability by Sex in Bremer County
The most prevalent vehicle ownership categories in Bremer County are males with 2 vehicles (2,576, accounting for 41.3%) and females with 2 vehicles (2,397, making up 45.3%).
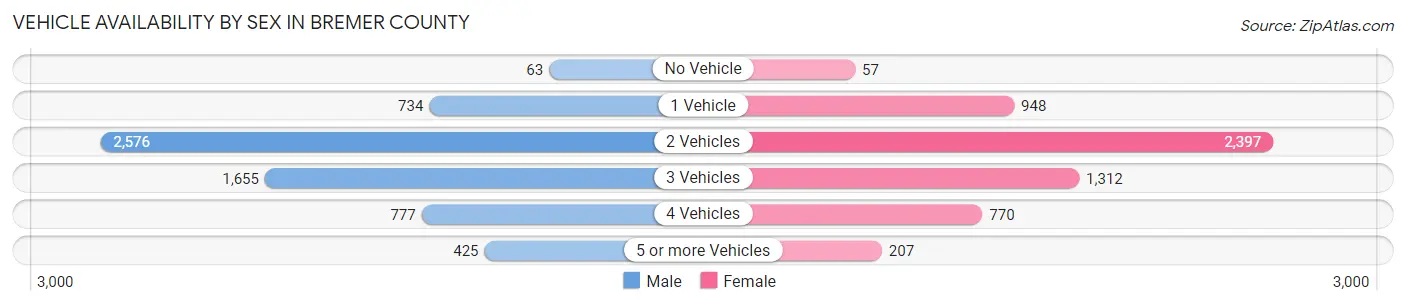
| Vehicles Available | Male | Female |
| No Vehicle | 63 (1.0%) | 57 (1.0%) |
| 1 Vehicle | 734 (11.8%) | 948 (16.7%) |
| 2 Vehicles | 2,576 (41.3%) | 2,397 (42.1%) |
| 3 Vehicles | 1,655 (26.6%) | 1,312 (23.1%) |
| 4 Vehicles | 777 (12.5%) | 770 (13.5%) |
| 5 or more Vehicles | 425 (6.8%) | 207 (3.6%) |
| Total | 6,230 (100.0%) | 5,691 (100.0%) |
Commute Time in Bremer County
The most frequently occuring commute durations in Bremer County are 5 to 9 minutes (1,847 commuters, 16.2%), 10 to 14 minutes (1,549 commuters, 13.6%), and 20 to 24 minutes (1,467 commuters, 12.9%).
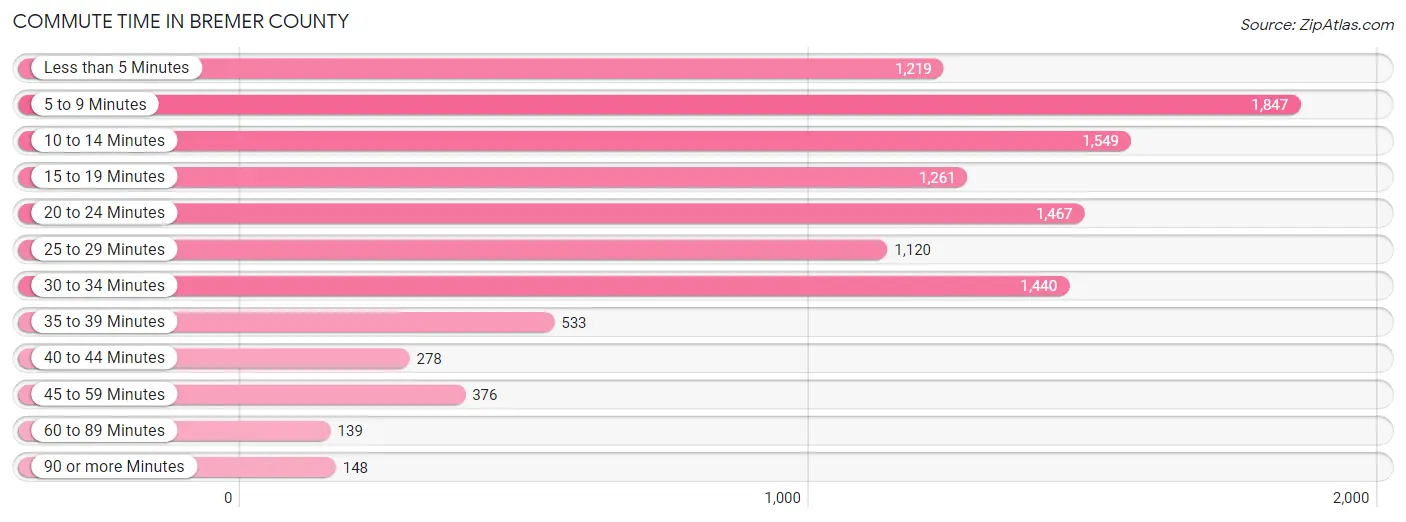
| Commute Time | # Commuters | % Commuters |
| Less than 5 Minutes | 1,219 | 10.7% |
| 5 to 9 Minutes | 1,847 | 16.2% |
| 10 to 14 Minutes | 1,549 | 13.6% |
| 15 to 19 Minutes | 1,261 | 11.1% |
| 20 to 24 Minutes | 1,467 | 12.9% |
| 25 to 29 Minutes | 1,120 | 9.8% |
| 30 to 34 Minutes | 1,440 | 12.7% |
| 35 to 39 Minutes | 533 | 4.7% |
| 40 to 44 Minutes | 278 | 2.4% |
| 45 to 59 Minutes | 376 | 3.3% |
| 60 to 89 Minutes | 139 | 1.2% |
| 90 or more Minutes | 148 | 1.3% |
Commute Time by Sex in Bremer County
The most common commute times in Bremer County are 5 to 9 minutes (973 commuters, 16.0%) for males and 10 to 14 minutes (1,007 commuters, 19.0%) for females.
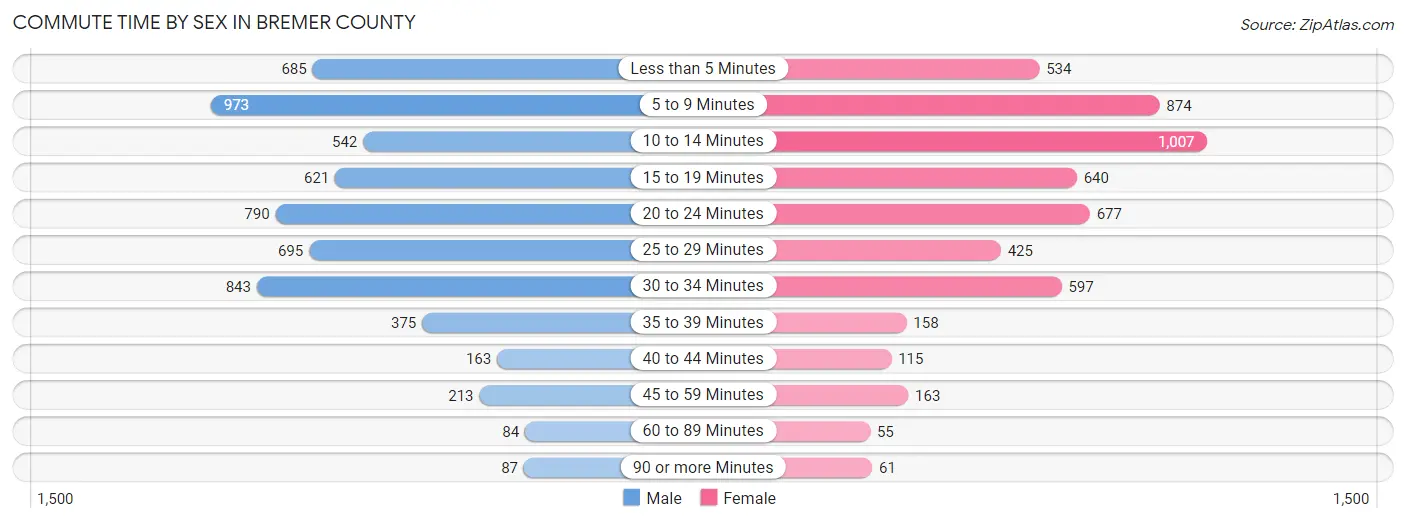
| Commute Time | Male | Female |
| Less than 5 Minutes | 685 (11.3%) | 534 (10.1%) |
| 5 to 9 Minutes | 973 (16.0%) | 874 (16.5%) |
| 10 to 14 Minutes | 542 (8.9%) | 1,007 (19.0%) |
| 15 to 19 Minutes | 621 (10.2%) | 640 (12.1%) |
| 20 to 24 Minutes | 790 (13.0%) | 677 (12.8%) |
| 25 to 29 Minutes | 695 (11.5%) | 425 (8.0%) |
| 30 to 34 Minutes | 843 (13.9%) | 597 (11.3%) |
| 35 to 39 Minutes | 375 (6.2%) | 158 (3.0%) |
| 40 to 44 Minutes | 163 (2.7%) | 115 (2.2%) |
| 45 to 59 Minutes | 213 (3.5%) | 163 (3.1%) |
| 60 to 89 Minutes | 84 (1.4%) | 55 (1.0%) |
| 90 or more Minutes | 87 (1.4%) | 61 (1.1%) |
Time of Departure to Work by Sex in Bremer County
The most frequent times of departure to work in Bremer County are 6:30 AM to 6:59 AM (787, 13.0%) for males and 7:30 AM to 7:59 AM (985, 18.6%) for females.
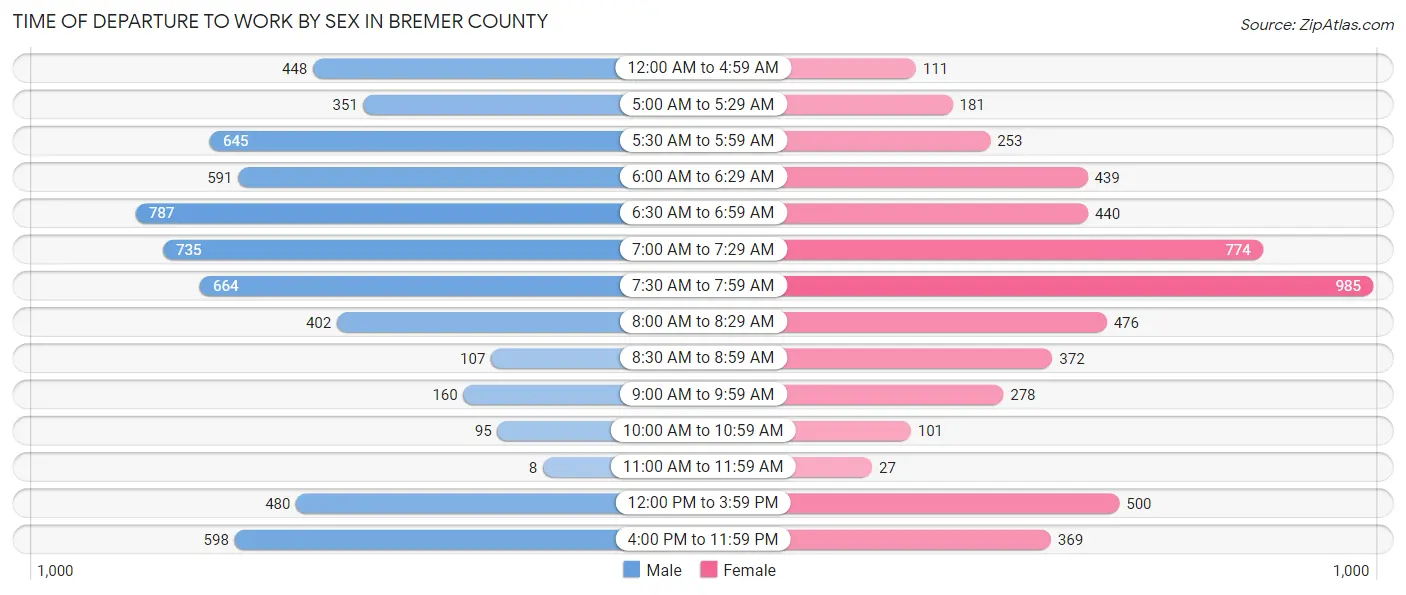
| Time of Departure | Male | Female |
| 12:00 AM to 4:59 AM | 448 (7.4%) | 111 (2.1%) |
| 5:00 AM to 5:29 AM | 351 (5.8%) | 181 (3.4%) |
| 5:30 AM to 5:59 AM | 645 (10.6%) | 253 (4.8%) |
| 6:00 AM to 6:29 AM | 591 (9.7%) | 439 (8.3%) |
| 6:30 AM to 6:59 AM | 787 (13.0%) | 440 (8.3%) |
| 7:00 AM to 7:29 AM | 735 (12.1%) | 774 (14.6%) |
| 7:30 AM to 7:59 AM | 664 (10.9%) | 985 (18.6%) |
| 8:00 AM to 8:29 AM | 402 (6.6%) | 476 (9.0%) |
| 8:30 AM to 8:59 AM | 107 (1.8%) | 372 (7.0%) |
| 9:00 AM to 9:59 AM | 160 (2.6%) | 278 (5.2%) |
| 10:00 AM to 10:59 AM | 95 (1.6%) | 101 (1.9%) |
| 11:00 AM to 11:59 AM | 8 (0.1%) | 27 (0.5%) |
| 12:00 PM to 3:59 PM | 480 (7.9%) | 500 (9.4%) |
| 4:00 PM to 11:59 PM | 598 (9.9%) | 369 (7.0%) |
| Total | 6,071 (100.0%) | 5,306 (100.0%) |
Housing Occupancy in Bremer County
Occupancy by Ownership in Bremer County
Of the total 9,684 dwellings in Bremer County, owner-occupied units account for 8,092 (83.6%), while renter-occupied units make up 1,592 (16.4%).
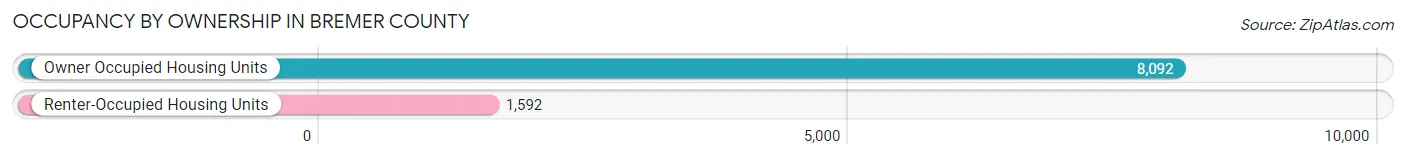
| Occupancy | # Housing Units | % Housing Units |
| Owner Occupied Housing Units | 8,092 | 83.6% |
| Renter-Occupied Housing Units | 1,592 | 16.4% |
| Total Occupied Housing Units | 9,684 | 100.0% |
Occupancy by Household Size in Bremer County
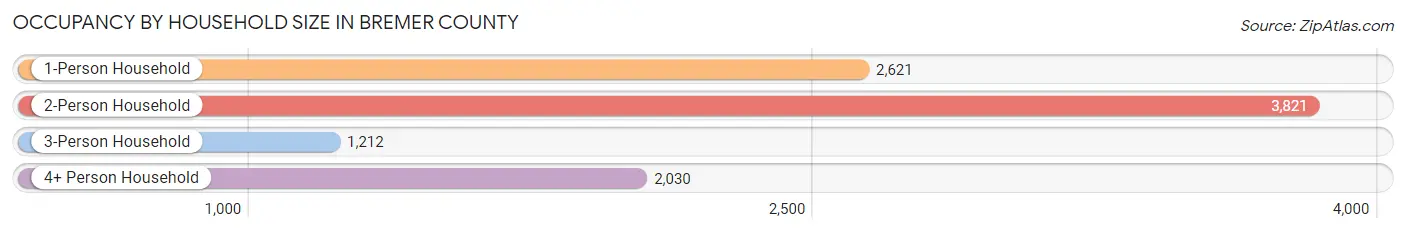
| Household Size | # Housing Units | % Housing Units |
| 1-Person Household | 2,621 | 27.1% |
| 2-Person Household | 3,821 | 39.5% |
| 3-Person Household | 1,212 | 12.5% |
| 4+ Person Household | 2,030 | 21.0% |
| Total Housing Units | 9,684 | 100.0% |
Occupancy by Ownership by Household Size in Bremer County
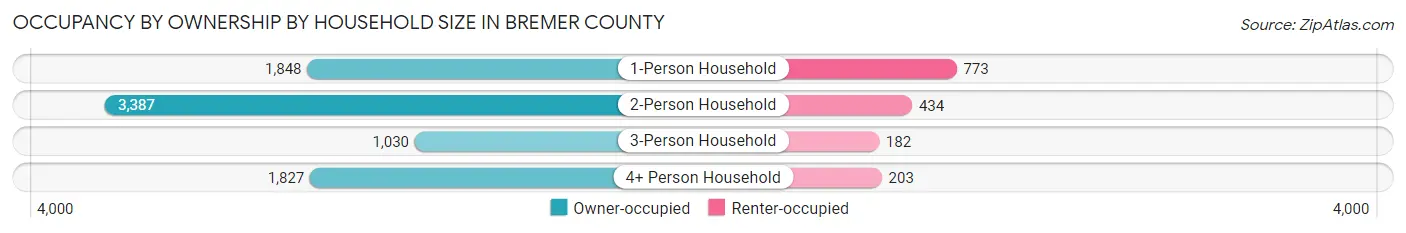
| Household Size | Owner-occupied | Renter-occupied |
| 1-Person Household | 1,848 (70.5%) | 773 (29.5%) |
| 2-Person Household | 3,387 (88.6%) | 434 (11.4%) |
| 3-Person Household | 1,030 (85.0%) | 182 (15.0%) |
| 4+ Person Household | 1,827 (90.0%) | 203 (10.0%) |
| Total Housing Units | 8,092 (83.6%) | 1,592 (16.4%) |
Occupancy by Educational Attainment in Bremer County
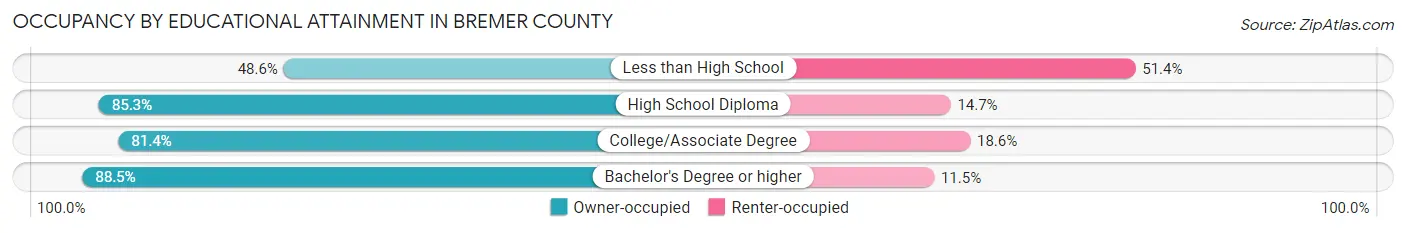
| Household Size | Owner-occupied | Renter-occupied |
| Less than High School | 195 (48.6%) | 206 (51.4%) |
| High School Diploma | 2,292 (85.3%) | 396 (14.7%) |
| College/Associate Degree | 2,668 (81.4%) | 610 (18.6%) |
| Bachelor's Degree or higher | 2,937 (88.5%) | 380 (11.5%) |
Occupancy by Age of Householder in Bremer County
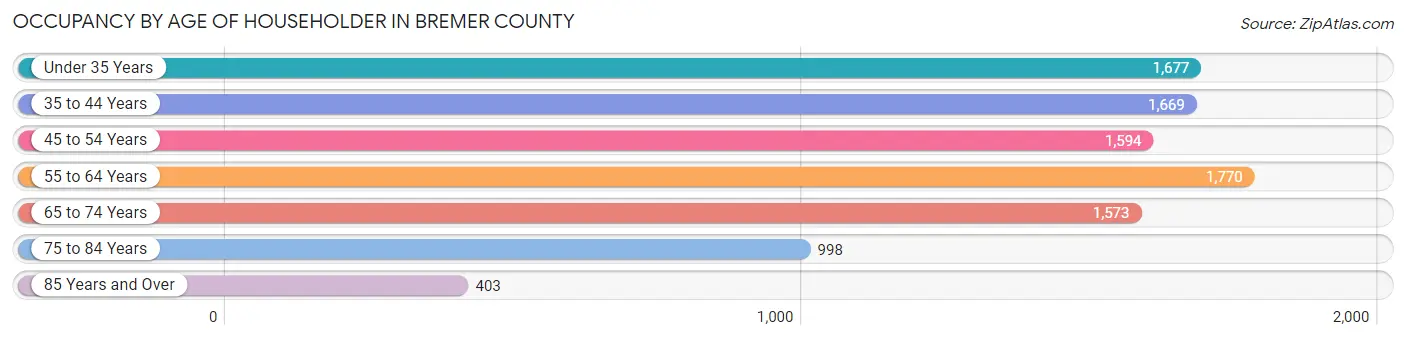
| Age Bracket | # Households | % Households |
| Under 35 Years | 1,677 | 17.3% |
| 35 to 44 Years | 1,669 | 17.2% |
| 45 to 54 Years | 1,594 | 16.5% |
| 55 to 64 Years | 1,770 | 18.3% |
| 65 to 74 Years | 1,573 | 16.2% |
| 75 to 84 Years | 998 | 10.3% |
| 85 Years and Over | 403 | 4.2% |
| Total | 9,684 | 100.0% |
Housing Finances in Bremer County
Median Income by Occupancy in Bremer County
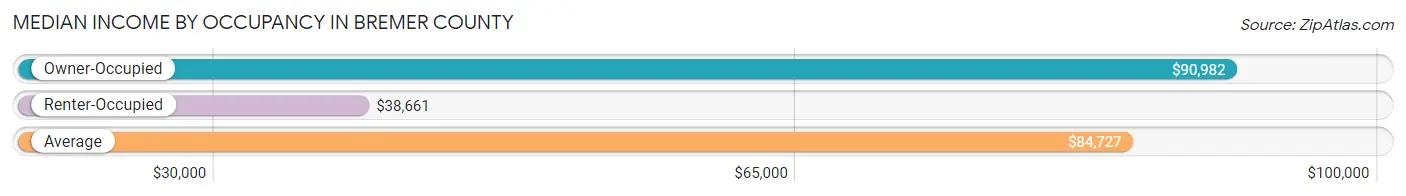
| Occupancy Type | # Households | Median Income |
| Owner-Occupied | 8,092 (83.6%) | $90,982 |
| Renter-Occupied | 1,592 (16.4%) | $38,661 |
| Average | 9,684 (100.0%) | $84,727 |
Occupancy by Householder Income Bracket in Bremer County
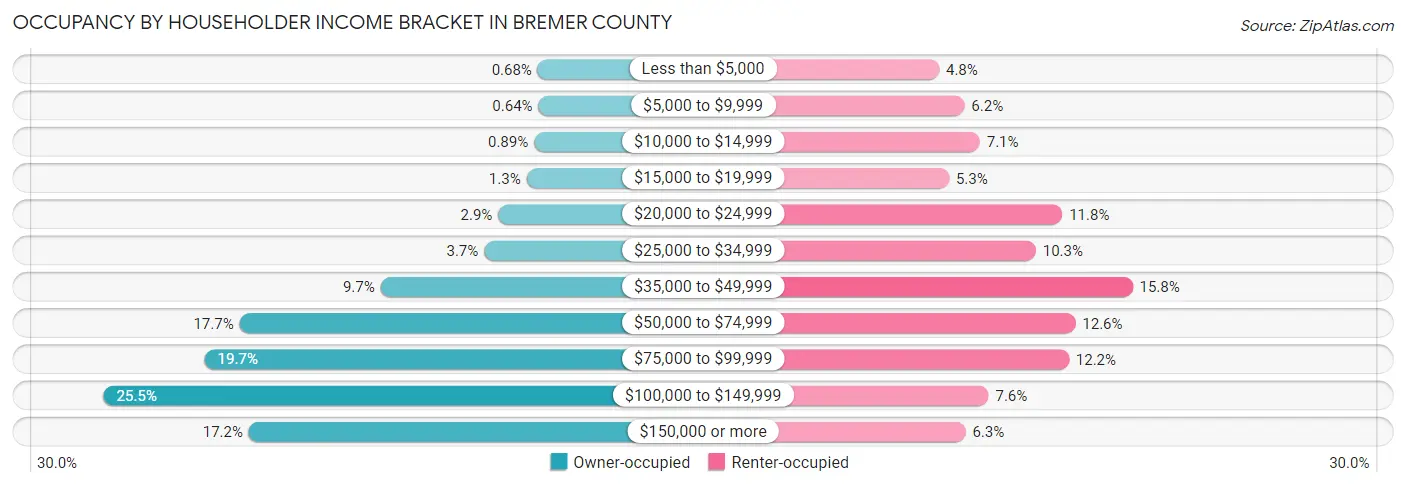
| Income Bracket | Owner-occupied | Renter-occupied |
| Less than $5,000 | 55 (0.7%) | 76 (4.8%) |
| $5,000 to $9,999 | 52 (0.6%) | 99 (6.2%) |
| $10,000 to $14,999 | 72 (0.9%) | 113 (7.1%) |
| $15,000 to $19,999 | 107 (1.3%) | 85 (5.3%) |
| $20,000 to $24,999 | 238 (2.9%) | 188 (11.8%) |
| $25,000 to $34,999 | 303 (3.7%) | 164 (10.3%) |
| $35,000 to $49,999 | 782 (9.7%) | 252 (15.8%) |
| $50,000 to $74,999 | 1,434 (17.7%) | 200 (12.6%) |
| $75,000 to $99,999 | 1,595 (19.7%) | 194 (12.2%) |
| $100,000 to $149,999 | 2,063 (25.5%) | 121 (7.6%) |
| $150,000 or more | 1,391 (17.2%) | 100 (6.3%) |
| Total | 8,092 (100.0%) | 1,592 (100.0%) |
Monthly Housing Cost Tiers in Bremer County
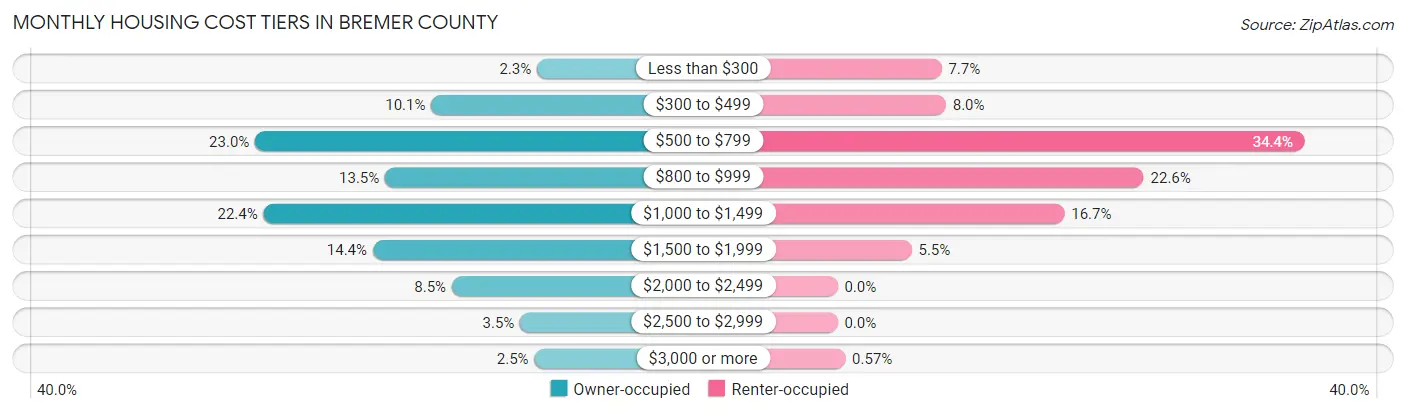
| Monthly Cost | Owner-occupied | Renter-occupied |
| Less than $300 | 183 (2.3%) | 122 (7.7%) |
| $300 to $499 | 813 (10.1%) | 127 (8.0%) |
| $500 to $799 | 1,863 (23.0%) | 548 (34.4%) |
| $800 to $999 | 1,088 (13.5%) | 359 (22.6%) |
| $1,000 to $1,499 | 1,813 (22.4%) | 266 (16.7%) |
| $1,500 to $1,999 | 1,161 (14.3%) | 87 (5.5%) |
| $2,000 to $2,499 | 690 (8.5%) | 0 (0.0%) |
| $2,500 to $2,999 | 283 (3.5%) | 0 (0.0%) |
| $3,000 or more | 198 (2.5%) | 9 (0.6%) |
| Total | 8,092 (100.0%) | 1,592 (100.0%) |
Physical Housing Characteristics in Bremer County
Housing Structures in Bremer County
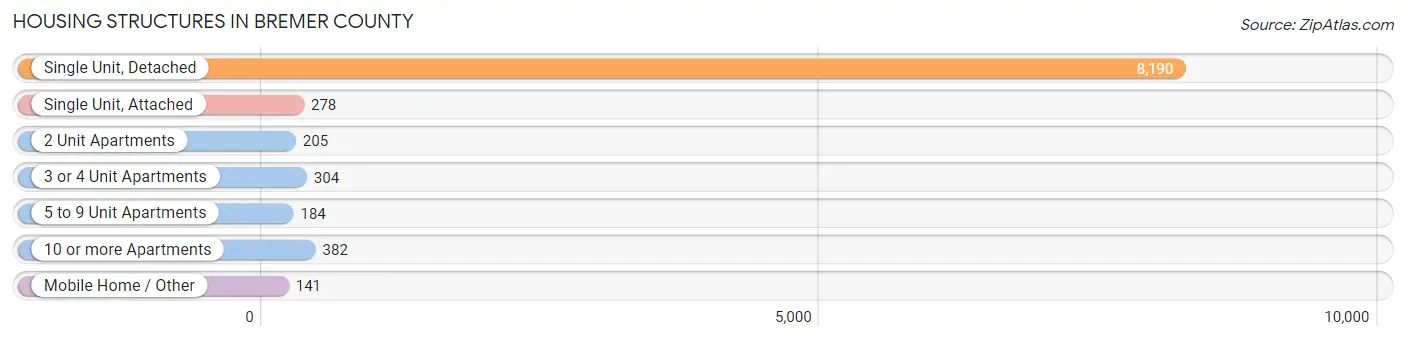
| Structure Type | # Housing Units | % Housing Units |
| Single Unit, Detached | 8,190 | 84.6% |
| Single Unit, Attached | 278 | 2.9% |
| 2 Unit Apartments | 205 | 2.1% |
| 3 or 4 Unit Apartments | 304 | 3.1% |
| 5 to 9 Unit Apartments | 184 | 1.9% |
| 10 or more Apartments | 382 | 3.9% |
| Mobile Home / Other | 141 | 1.5% |
| Total | 9,684 | 100.0% |
Housing Structures by Occupancy in Bremer County
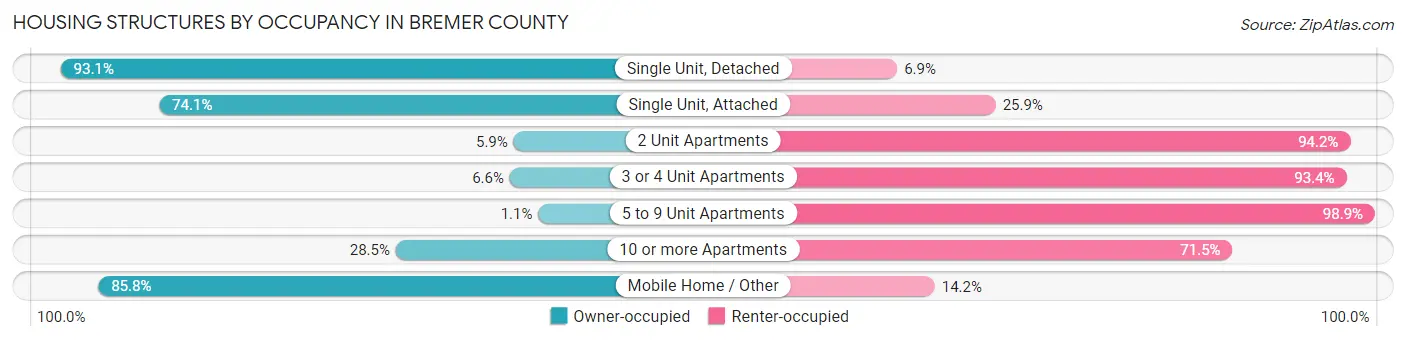
| Structure Type | Owner-occupied | Renter-occupied |
| Single Unit, Detached | 7,622 (93.1%) | 568 (6.9%) |
| Single Unit, Attached | 206 (74.1%) | 72 (25.9%) |
| 2 Unit Apartments | 12 (5.9%) | 193 (94.2%) |
| 3 or 4 Unit Apartments | 20 (6.6%) | 284 (93.4%) |
| 5 to 9 Unit Apartments | 2 (1.1%) | 182 (98.9%) |
| 10 or more Apartments | 109 (28.5%) | 273 (71.5%) |
| Mobile Home / Other | 121 (85.8%) | 20 (14.2%) |
| Total | 8,092 (83.6%) | 1,592 (16.4%) |
Housing Structures by Number of Rooms in Bremer County
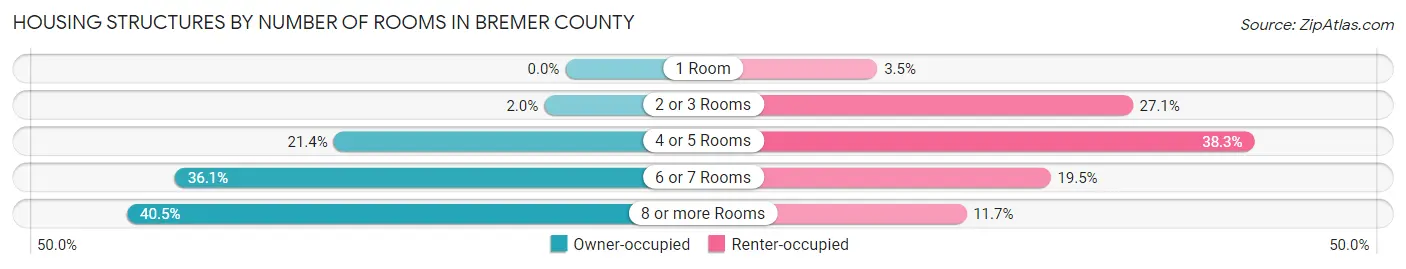
| Number of Rooms | Owner-occupied | Renter-occupied |
| 1 Room | 0 (0.0%) | 55 (3.5%) |
| 2 or 3 Rooms | 159 (2.0%) | 431 (27.1%) |
| 4 or 5 Rooms | 1,734 (21.4%) | 610 (38.3%) |
| 6 or 7 Rooms | 2,921 (36.1%) | 310 (19.5%) |
| 8 or more Rooms | 3,278 (40.5%) | 186 (11.7%) |
| Total | 8,092 (100.0%) | 1,592 (100.0%) |
Housing Structure by Heating Type in Bremer County
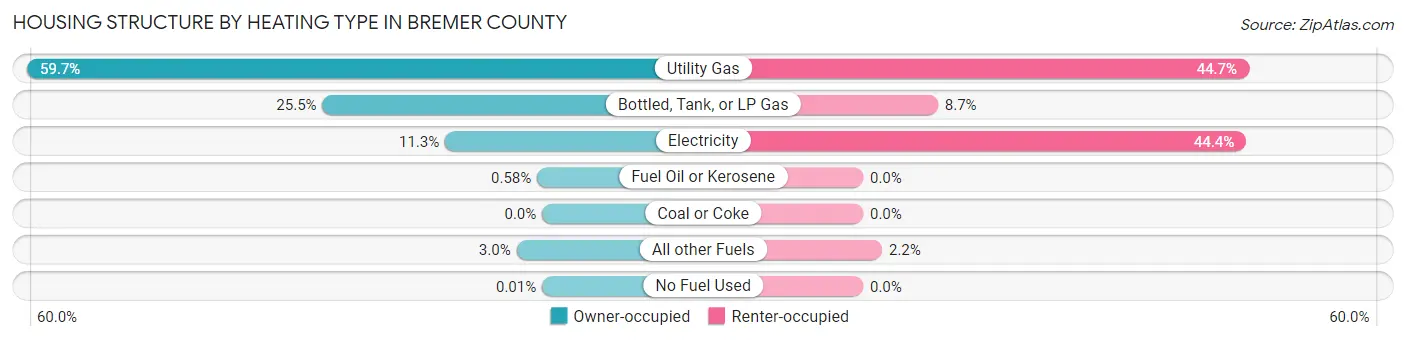
| Heating Type | Owner-occupied | Renter-occupied |
| Utility Gas | 4,833 (59.7%) | 712 (44.7%) |
| Bottled, Tank, or LP Gas | 2,061 (25.5%) | 138 (8.7%) |
| Electricity | 910 (11.3%) | 707 (44.4%) |
| Fuel Oil or Kerosene | 47 (0.6%) | 0 (0.0%) |
| Coal or Coke | 0 (0.0%) | 0 (0.0%) |
| All other Fuels | 240 (3.0%) | 35 (2.2%) |
| No Fuel Used | 1 (0.0%) | 0 (0.0%) |
| Total | 8,092 (100.0%) | 1,592 (100.0%) |
Household Vehicle Usage in Bremer County
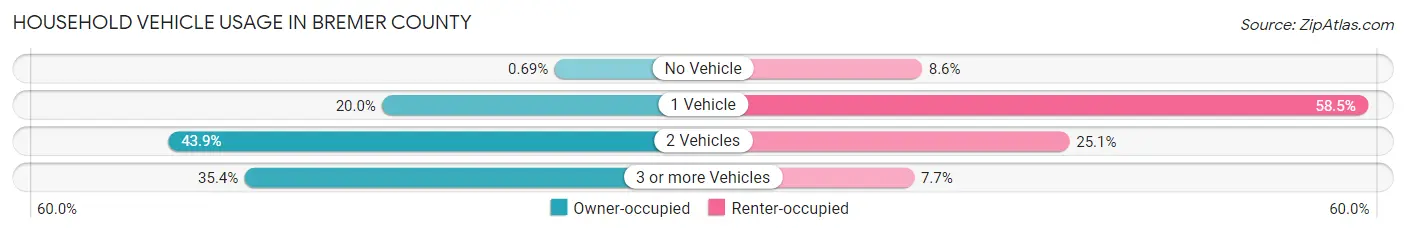
| Vehicles per Household | Owner-occupied | Renter-occupied |
| No Vehicle | 56 (0.7%) | 137 (8.6%) |
| 1 Vehicle | 1,618 (20.0%) | 932 (58.5%) |
| 2 Vehicles | 3,553 (43.9%) | 400 (25.1%) |
| 3 or more Vehicles | 2,865 (35.4%) | 123 (7.7%) |
| Total | 8,092 (100.0%) | 1,592 (100.0%) |
Real Estate & Mortgages in Bremer County
Real Estate and Mortgage Overview in Bremer County
| Characteristic | Without Mortgage | With Mortgage |
| Housing Units | 3,304 | 4,788 |
| Median Property Value | $203,300 | $202,100 |
| Median Household Income | $77,610 | $869 |
| Monthly Housing Costs | $623 | $198 |
| Real Estate Taxes | $2,915 | $53 |
Property Value by Mortgage Status in Bremer County
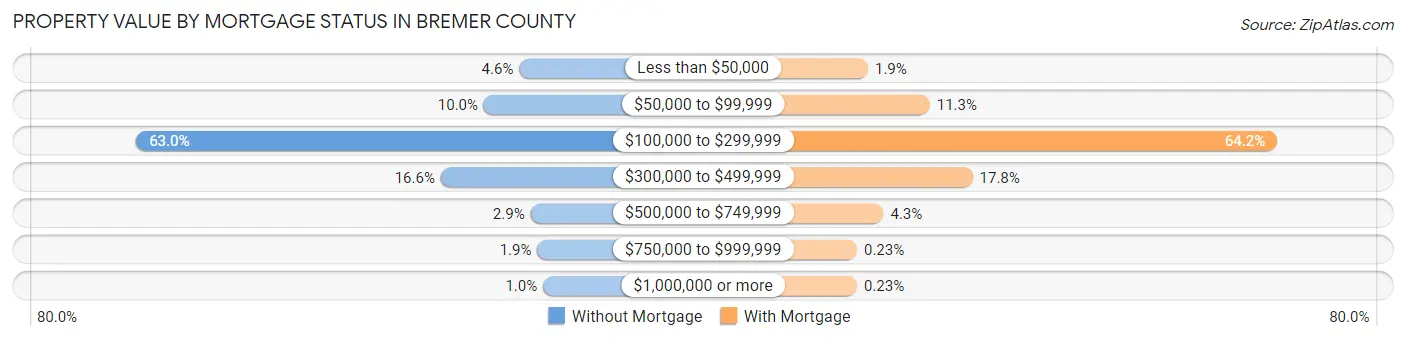
| Property Value | Without Mortgage | With Mortgage |
| Less than $50,000 | 153 (4.6%) | 91 (1.9%) |
| $50,000 to $99,999 | 331 (10.0%) | 542 (11.3%) |
| $100,000 to $299,999 | 2,081 (63.0%) | 3,075 (64.2%) |
| $300,000 to $499,999 | 548 (16.6%) | 854 (17.8%) |
| $500,000 to $749,999 | 96 (2.9%) | 204 (4.3%) |
| $750,000 to $999,999 | 62 (1.9%) | 11 (0.2%) |
| $1,000,000 or more | 33 (1.0%) | 11 (0.2%) |
| Total | 3,304 (100.0%) | 4,788 (100.0%) |
Household Income by Mortgage Status in Bremer County
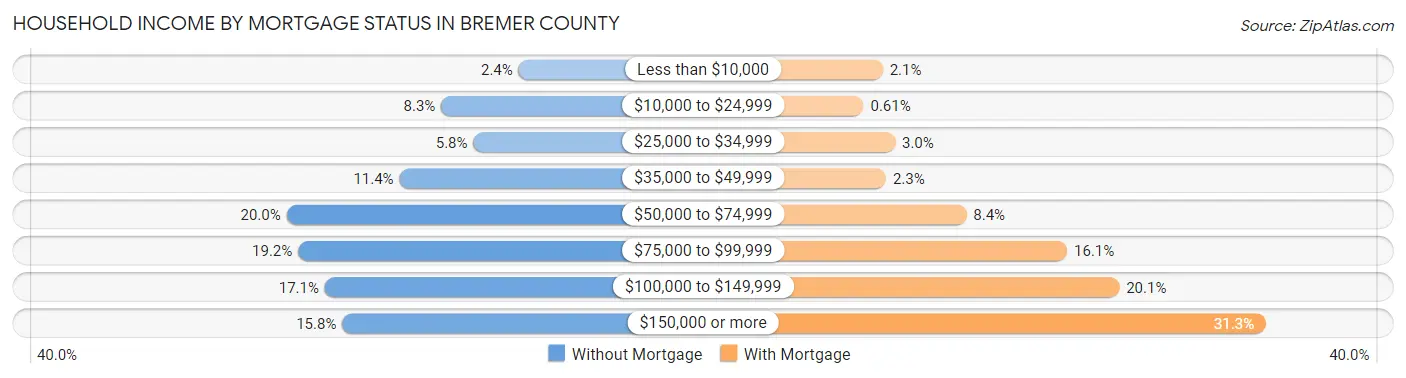
| Household Income | Without Mortgage | With Mortgage |
| Less than $10,000 | 78 (2.4%) | 99 (2.1%) |
| $10,000 to $24,999 | 273 (8.3%) | 29 (0.6%) |
| $25,000 to $34,999 | 192 (5.8%) | 144 (3.0%) |
| $35,000 to $49,999 | 378 (11.4%) | 111 (2.3%) |
| $50,000 to $74,999 | 662 (20.0%) | 404 (8.4%) |
| $75,000 to $99,999 | 633 (19.2%) | 772 (16.1%) |
| $100,000 to $149,999 | 566 (17.1%) | 962 (20.1%) |
| $150,000 or more | 522 (15.8%) | 1,497 (31.3%) |
| Total | 3,304 (100.0%) | 4,788 (100.0%) |
Property Value to Household Income Ratio in Bremer County
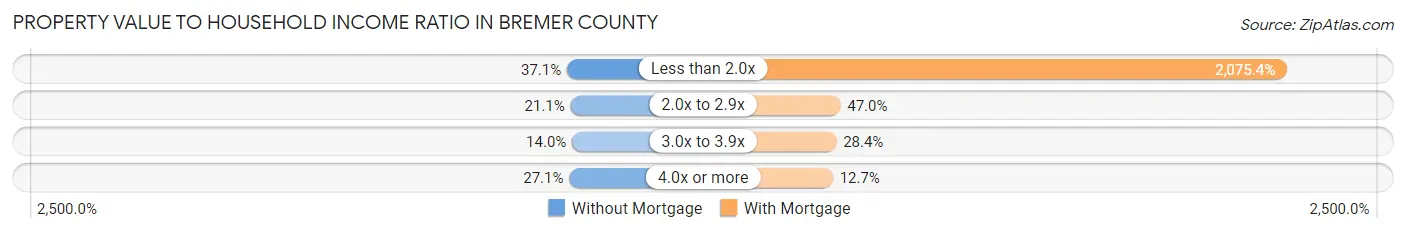
| Value-to-Income Ratio | Without Mortgage | With Mortgage |
| Less than 2.0x | 1,227 (37.1%) | 99,369 (2,075.4%) |
| 2.0x to 2.9x | 696 (21.1%) | 2,250 (47.0%) |
| 3.0x to 3.9x | 461 (14.0%) | 1,360 (28.4%) |
| 4.0x or more | 894 (27.1%) | 607 (12.7%) |
| Total | 3,304 (100.0%) | 4,788 (100.0%) |
Real Estate Taxes by Mortgage Status in Bremer County
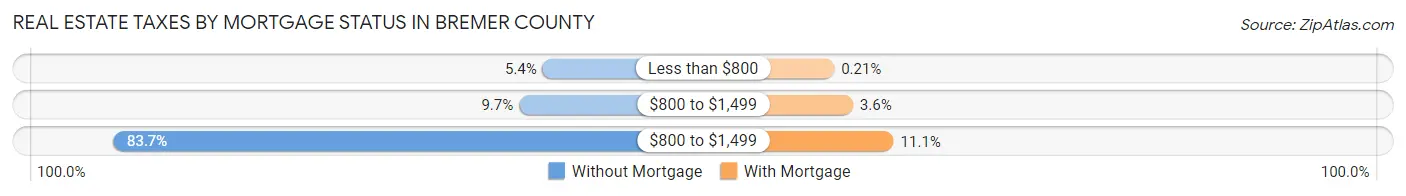
| Property Taxes | Without Mortgage | With Mortgage |
| Less than $800 | 178 (5.4%) | 10 (0.2%) |
| $800 to $1,499 | 320 (9.7%) | 174 (3.6%) |
| $800 to $1,499 | 2,765 (83.7%) | 530 (11.1%) |
| Total | 3,304 (100.0%) | 4,788 (100.0%) |
Health & Disability in Bremer County
Health Insurance Coverage by Age in Bremer County
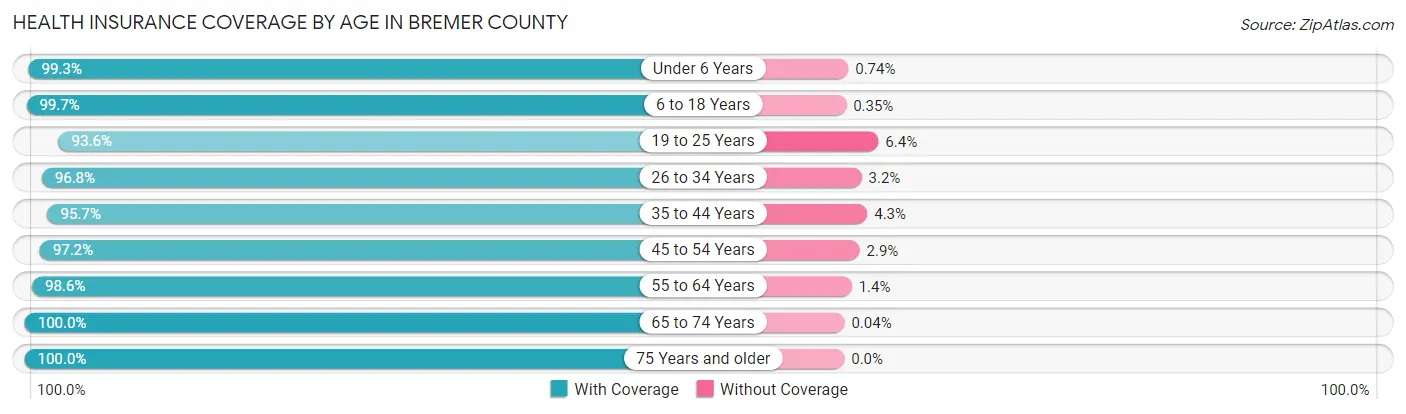
| Age Bracket | With Coverage | Without Coverage |
| Under 6 Years | 1,754 (99.3%) | 13 (0.7%) |
| 6 to 18 Years | 4,330 (99.7%) | 15 (0.4%) |
| 19 to 25 Years | 2,431 (93.6%) | 165 (6.4%) |
| 26 to 34 Years | 2,315 (96.8%) | 77 (3.2%) |
| 35 to 44 Years | 3,013 (95.7%) | 135 (4.3%) |
| 45 to 54 Years | 2,697 (97.2%) | 79 (2.9%) |
| 55 to 64 Years | 2,978 (98.6%) | 42 (1.4%) |
| 65 to 74 Years | 2,572 (100.0%) | 1 (0.0%) |
| 75 Years and older | 2,062 (100.0%) | 0 (0.0%) |
| Total | 24,152 (97.9%) | 527 (2.1%) |
Health Insurance Coverage by Citizenship Status in Bremer County
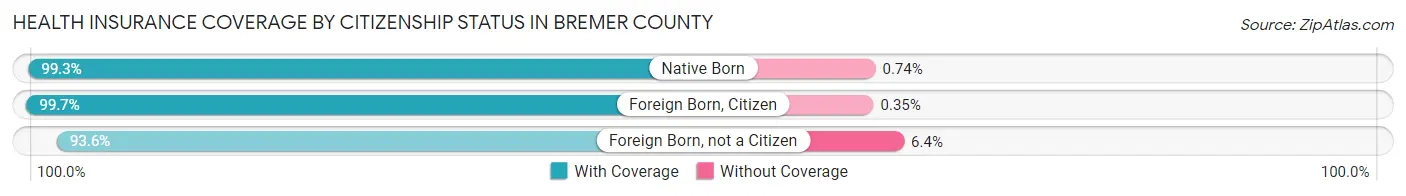
| Citizenship Status | With Coverage | Without Coverage |
| Native Born | 1,754 (99.3%) | 13 (0.7%) |
| Foreign Born, Citizen | 4,330 (99.7%) | 15 (0.4%) |
| Foreign Born, not a Citizen | 2,431 (93.6%) | 165 (6.4%) |
Health Insurance Coverage by Household Income in Bremer County
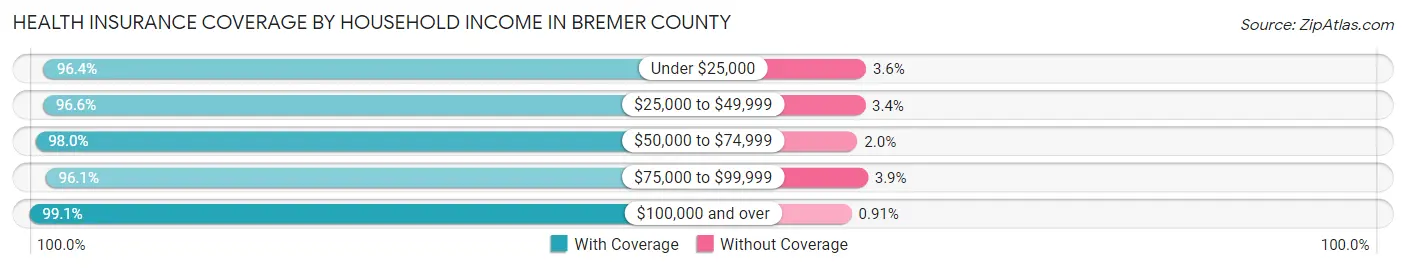
| Household Income | With Coverage | Without Coverage |
| Under $25,000 | 1,554 (96.4%) | 58 (3.6%) |
| $25,000 to $49,999 | 2,841 (96.6%) | 101 (3.4%) |
| $50,000 to $74,999 | 3,307 (98.0%) | 67 (2.0%) |
| $75,000 to $99,999 | 4,127 (96.1%) | 169 (3.9%) |
| $100,000 and over | 11,135 (99.1%) | 102 (0.9%) |
Public vs Private Health Insurance Coverage by Age in Bremer County
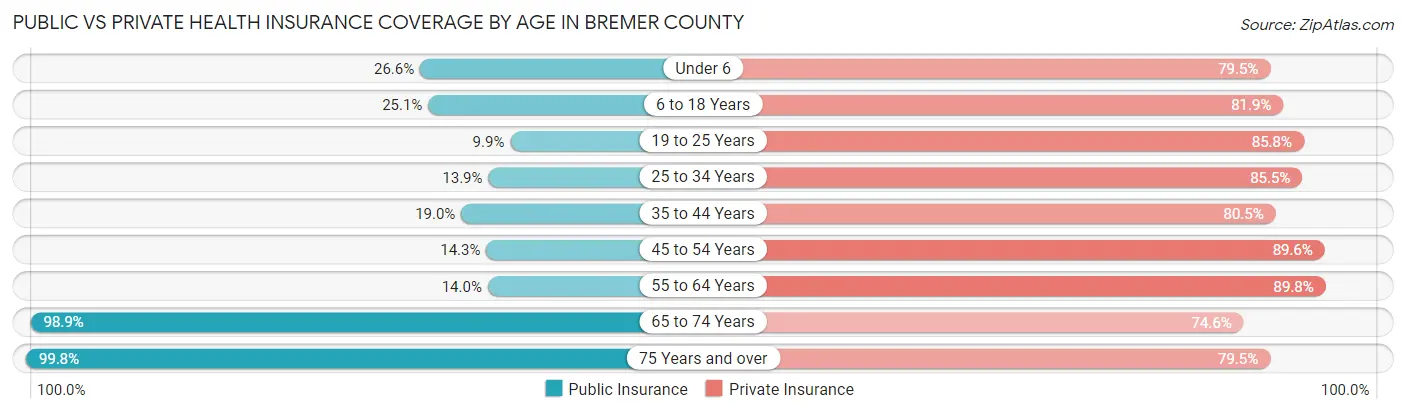
| Age Bracket | Public Insurance | Private Insurance |
| Under 6 | 470 (26.6%) | 1,405 (79.5%) |
| 6 to 18 Years | 1,090 (25.1%) | 3,560 (81.9%) |
| 19 to 25 Years | 256 (9.9%) | 2,226 (85.8%) |
| 25 to 34 Years | 333 (13.9%) | 2,044 (85.5%) |
| 35 to 44 Years | 597 (19.0%) | 2,534 (80.5%) |
| 45 to 54 Years | 397 (14.3%) | 2,488 (89.6%) |
| 55 to 64 Years | 424 (14.0%) | 2,712 (89.8%) |
| 65 to 74 Years | 2,545 (98.9%) | 1,919 (74.6%) |
| 75 Years and over | 2,057 (99.8%) | 1,639 (79.5%) |
| Total | 8,169 (33.1%) | 20,527 (83.2%) |
Disability Status by Sex by Age in Bremer County
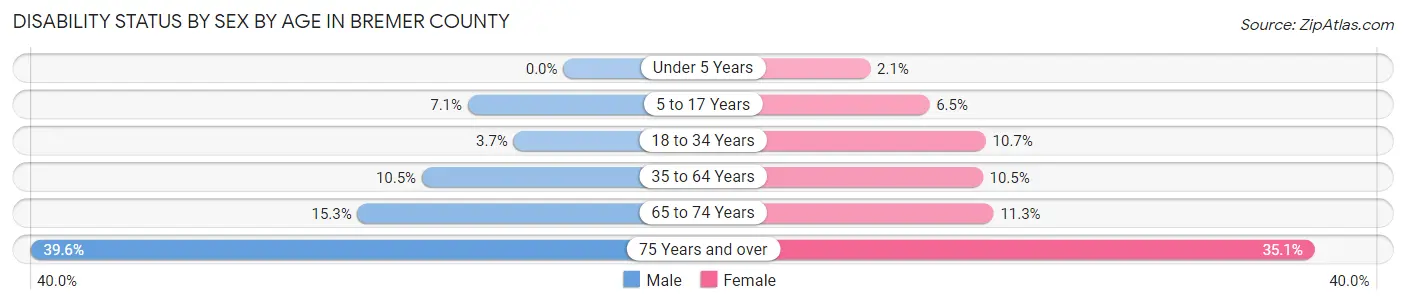
| Age Bracket | Male | Female |
| Under 5 Years | 0 (0.0%) | 14 (2.1%) |
| 5 to 17 Years | 153 (7.1%) | 133 (6.5%) |
| 18 to 34 Years | 103 (3.7%) | 288 (10.7%) |
| 35 to 64 Years | 476 (10.5%) | 461 (10.4%) |
| 65 to 74 Years | 195 (15.3%) | 146 (11.3%) |
| 75 Years and over | 348 (39.6%) | 415 (35.1%) |
Disability Class by Sex by Age in Bremer County
Disability Class: Hearing Difficulty
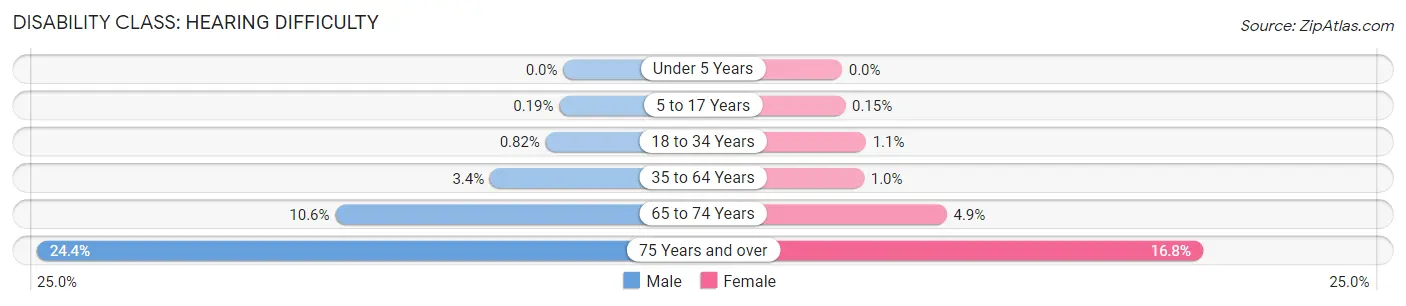
| Age Bracket | Male | Female |
| Under 5 Years | 0 (0.0%) | 0 (0.0%) |
| 5 to 17 Years | 4 (0.2%) | 3 (0.2%) |
| 18 to 34 Years | 23 (0.8%) | 30 (1.1%) |
| 35 to 64 Years | 154 (3.4%) | 45 (1.0%) |
| 65 to 74 Years | 135 (10.6%) | 63 (4.9%) |
| 75 Years and over | 215 (24.4%) | 198 (16.8%) |
Disability Class: Vision Difficulty
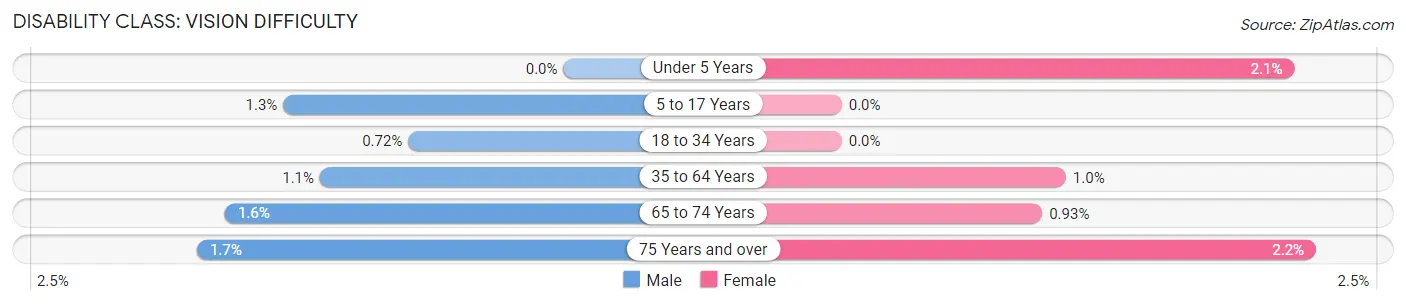
| Age Bracket | Male | Female |
| Under 5 Years | 0 (0.0%) | 14 (2.1%) |
| 5 to 17 Years | 28 (1.3%) | 0 (0.0%) |
| 18 to 34 Years | 20 (0.7%) | 0 (0.0%) |
| 35 to 64 Years | 51 (1.1%) | 46 (1.0%) |
| 65 to 74 Years | 20 (1.6%) | 12 (0.9%) |
| 75 Years and over | 15 (1.7%) | 26 (2.2%) |
Disability Class: Cognitive Difficulty
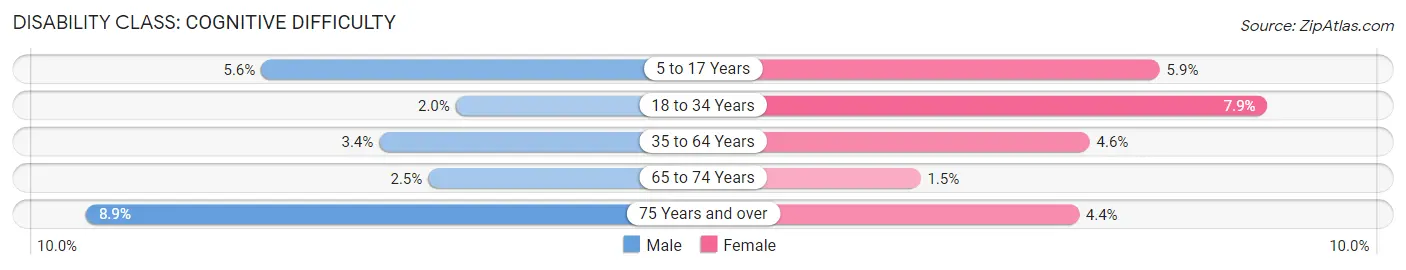
| Age Bracket | Male | Female |
| 5 to 17 Years | 121 (5.6%) | 121 (5.9%) |
| 18 to 34 Years | 56 (2.0%) | 213 (7.9%) |
| 35 to 64 Years | 155 (3.4%) | 203 (4.6%) |
| 65 to 74 Years | 32 (2.5%) | 19 (1.5%) |
| 75 Years and over | 78 (8.9%) | 52 (4.4%) |
Disability Class: Ambulatory Difficulty
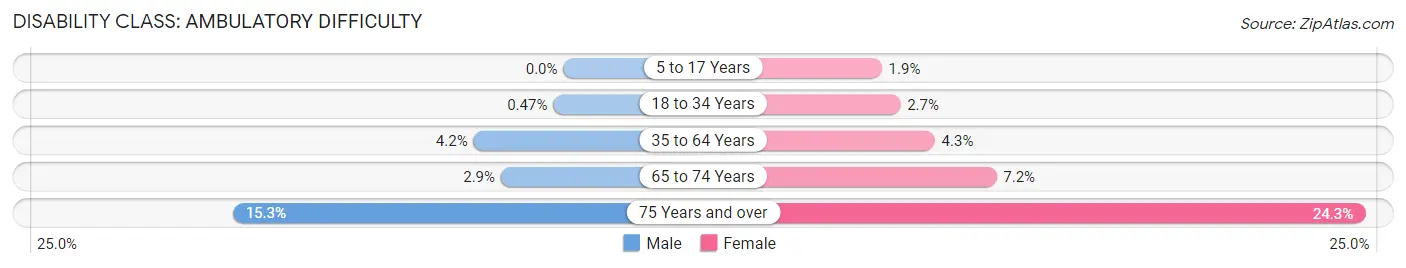
| Age Bracket | Male | Female |
| 5 to 17 Years | 0 (0.0%) | 38 (1.8%) |
| 18 to 34 Years | 13 (0.5%) | 73 (2.7%) |
| 35 to 64 Years | 189 (4.2%) | 190 (4.3%) |
| 65 to 74 Years | 37 (2.9%) | 93 (7.2%) |
| 75 Years and over | 135 (15.3%) | 287 (24.3%) |
Disability Class: Self-Care Difficulty
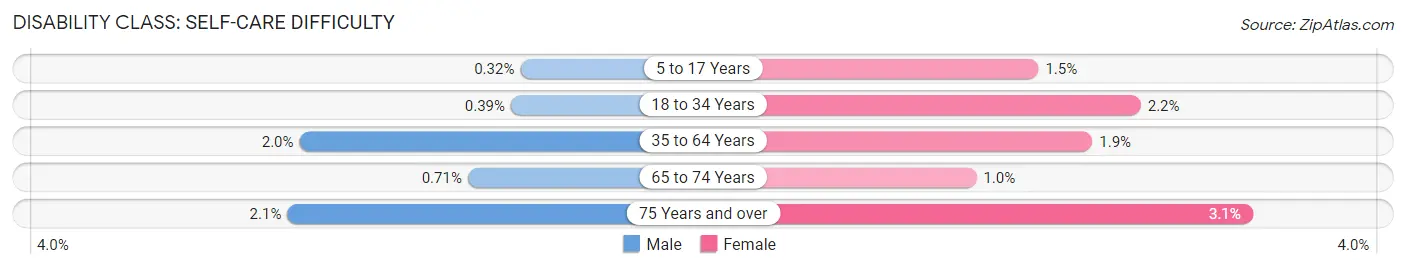
| Age Bracket | Male | Female |
| 5 to 17 Years | 7 (0.3%) | 30 (1.5%) |
| 18 to 34 Years | 11 (0.4%) | 60 (2.2%) |
| 35 to 64 Years | 89 (2.0%) | 82 (1.9%) |
| 65 to 74 Years | 9 (0.7%) | 13 (1.0%) |
| 75 Years and over | 18 (2.1%) | 36 (3.0%) |
Technology Access in Bremer County
Computing Device Access in Bremer County
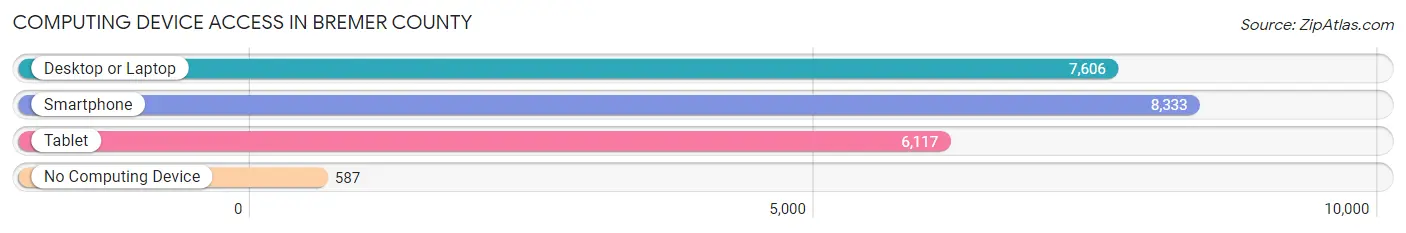
| Device Type | # Households | % Households |
| Desktop or Laptop | 7,606 | 78.5% |
| Smartphone | 8,333 | 86.1% |
| Tablet | 6,117 | 63.2% |
| No Computing Device | 587 | 6.1% |
| Total | 9,684 | 100.0% |
Internet Access in Bremer County
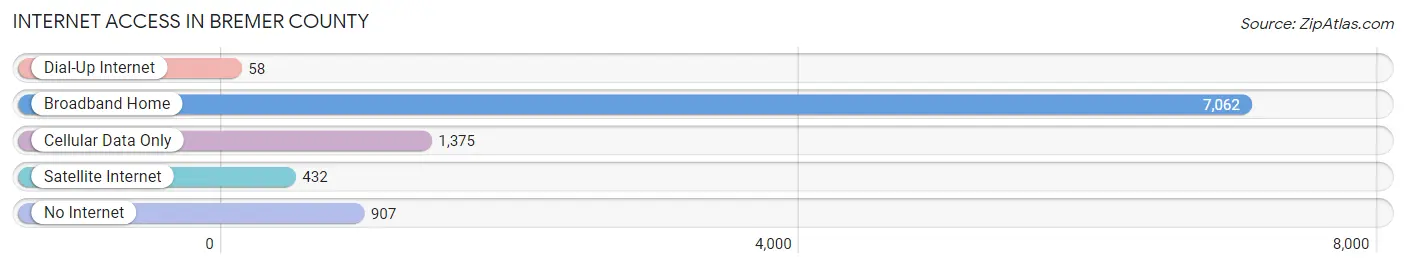
| Internet Type | # Households | % Households |
| Dial-Up Internet | 58 | 0.6% |
| Broadband Home | 7,062 | 72.9% |
| Cellular Data Only | 1,375 | 14.2% |
| Satellite Internet | 432 | 4.5% |
| No Internet | 907 | 9.4% |
| Total | 9,684 | 100.0% |
Bremer County Summary
Bremer County is located in the northeastern corner of Iowa, and is part of the Waterloo-Cedar Falls Metropolitan Statistical Area. The county was established in 1851 and is named after Friedrich Bremer, a German immigrant who settled in the area in 1845. As of the 2010 census, the population of Bremer County was 24,276.
Geography
Bremer County is located in the northeastern corner of Iowa, and is bordered by Black Hawk County to the north, Buchanan County to the east, Fayette County to the south, and Butler County to the west. The county covers an area of 576 square miles, of which 574 square miles is land and 2 square miles is water. The county is located in the Driftless Area, which is characterized by its rolling hills and valleys. The Wapsipinicon River flows through the county, and is a popular destination for fishing, canoeing, and kayaking.
The county is home to several parks and recreational areas, including Bremer County Park, which features a campground, picnic areas, and a playground. Other parks in the county include Cedar Valley Park, which offers camping, fishing, and hiking, and the Wapsipinicon State Park, which features a beach, picnic areas, and a boat ramp.
Demographics
As of the 2010 census, the population of Bremer County was 24,276, with a population density of 42.2 people per square mile. The racial makeup of the county was 94.2% White, 1.3% African American, 0.3% Native American, 0.7% Asian, 0.1% Pacific Islander, 2.2% from other races, and 1.2% from two or more races. Hispanic or Latino of any race were 4.2% of the population.
The median household income in Bremer County was $50,945, and the median family income was $60,945. The per capita income was $24,845. About 6.2% of families and 8.7% of the population were below the poverty line, including 10.2% of those under age 18 and 8.2% of those age 65 or over.
Economy
The economy of Bremer County is largely based on agriculture, manufacturing, and services. The county is home to several large agricultural operations, including the Bremer County Pork Producers, which is one of the largest pork producers in the state. Other major agricultural products include corn, soybeans, hay, and livestock.
Manufacturing is also an important part of the economy, with several large companies located in the county. These include John Deere, which produces agricultural equipment, and the Wapsipinicon Mill, which produces paper products.
The service sector is also an important part of the economy, with several large employers located in the county. These include the University of Northern Iowa, which is located in Cedar Falls, and the Waterloo-Cedar Falls Courier, which is the largest newspaper in the area.
Conclusion
Bremer County is located in the northeastern corner of Iowa and is part of the Waterloo-Cedar Falls Metropolitan Statistical Area. The county was established in 1851 and is named after Friedrich Bremer, a German immigrant who settled in the area in 1845. As of the 2010 census, the population of Bremer County was 24,276. The economy of Bremer County is largely based on agriculture, manufacturing, and services. The county is home to several large agricultural operations, manufacturing companies, and service sector employers.
Common Questions
What is Per Capita Income in Bremer County?
Per Capita income in Bremer County is $40,912.
What is the Median Family Income in Bremer County?
Median Family Income in Bremer County is $98,823.
What is the Median Household income in Bremer County?
Median Household Income in Bremer County is $84,727.
What is Income or Wage Gap in Bremer County?
Income or Wage Gap in Bremer County is 33.9%.
Women in Bremer County earn 66.1 cents for every dollar earned by a man.
What is Family Income Deficit in Bremer County?
Family Income Deficit in Bremer County is $12,350.
Families that are below poverty line in Bremer County earn $12,350 less on average than the poverty threshold level.
What is Inequality or Gini Index in Bremer County?
Inequality or Gini Index in Bremer County is 0.41.
What is the Total Population of Bremer County?
Total Population of Bremer County is 25,012.
What is the Total Male Population of Bremer County?
Total Male Population of Bremer County is 12,529.
What is the Total Female Population of Bremer County?
Total Female Population of Bremer County is 12,483.
What is the Ratio of Males per 100 Females in Bremer County?
There are 100.37 Males per 100 Females in Bremer County.
What is the Ratio of Females per 100 Males in Bremer County?
There are 99.63 Females per 100 Males in Bremer County.
What is the Median Population Age in Bremer County?
Median Population Age in Bremer County is 38.9 Years.
What is the Average Family Size in Bremer County
Average Family Size in Bremer County is 2.9 People.
What is the Average Household Size in Bremer County
Average Household Size in Bremer County is 2.4 People.
How Large is the Labor Force in Bremer County?
There are 13,356 People in the Labor Forcein in Bremer County.
What is the Percentage of People in the Labor Force in Bremer County?
66.7% of People are in the Labor Force in Bremer County.
What is the Unemployment Rate in Bremer County?
Unemployment Rate in Bremer County is 3.2%.