Urbandale, IA Map & Demographics
Urbandale Map
Urbandale Overview
$51,170
PER CAPITA INCOME
$134,872
AVG FAMILY INCOME
$111,888
AVG HOUSEHOLD INCOME
29.4%
WAGE / INCOME GAP [ % ]
70.6¢/ $1
WAGE / INCOME GAP [ $ ]
0.40
INEQUALITY / GINI INDEX
45,591
TOTAL POPULATION
23,005
MALE POPULATION
22,586
FEMALE POPULATION
101.86
MALES / 100 FEMALES
98.18
FEMALES / 100 MALES
38.9
MEDIAN AGE
3.1
AVG FAMILY SIZE
2.6
AVG HOUSEHOLD SIZE
24,917
LABOR FORCE [ PEOPLE ]
70.9%
PERCENT IN LABOR FORCE
2.1%
UNEMPLOYMENT RATE
Urbandale Area Codes
Income in Urbandale
Income Overview in Urbandale
Per Capita Income in Urbandale is $51,170, while median incomes of families and households are $134,872 and $111,888 respectively.
| Characteristic | Number | Measure |
| Per Capita Income | 45,591 | $51,170 |
| Median Family Income | 12,609 | $134,872 |
| Mean Family Income | 12,609 | $156,002 |
| Median Household Income | 17,163 | $111,888 |
| Mean Household Income | 17,163 | $135,104 |
| Income Deficit | 12,609 | $0 |
| Wage / Income Gap (%) | 45,591 | 29.43% |
| Wage / Income Gap ($) | 45,591 | 70.57¢ per $1 |
| Gini / Inequality Index | 45,591 | 0.40 |
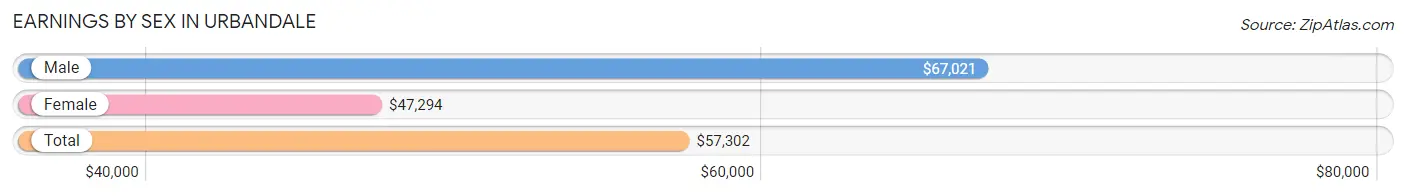
Earnings by Sex in Urbandale
Average Earnings in Urbandale are $57,302, $67,021 for men and $47,294 for women, a difference of 29.4%.
| Sex | Number | Average Earnings |
| Male | 14,153 (54.3%) | $67,021 |
| Female | 11,915 (45.7%) | $47,294 |
| Total | 26,068 (100.0%) | $57,302 |
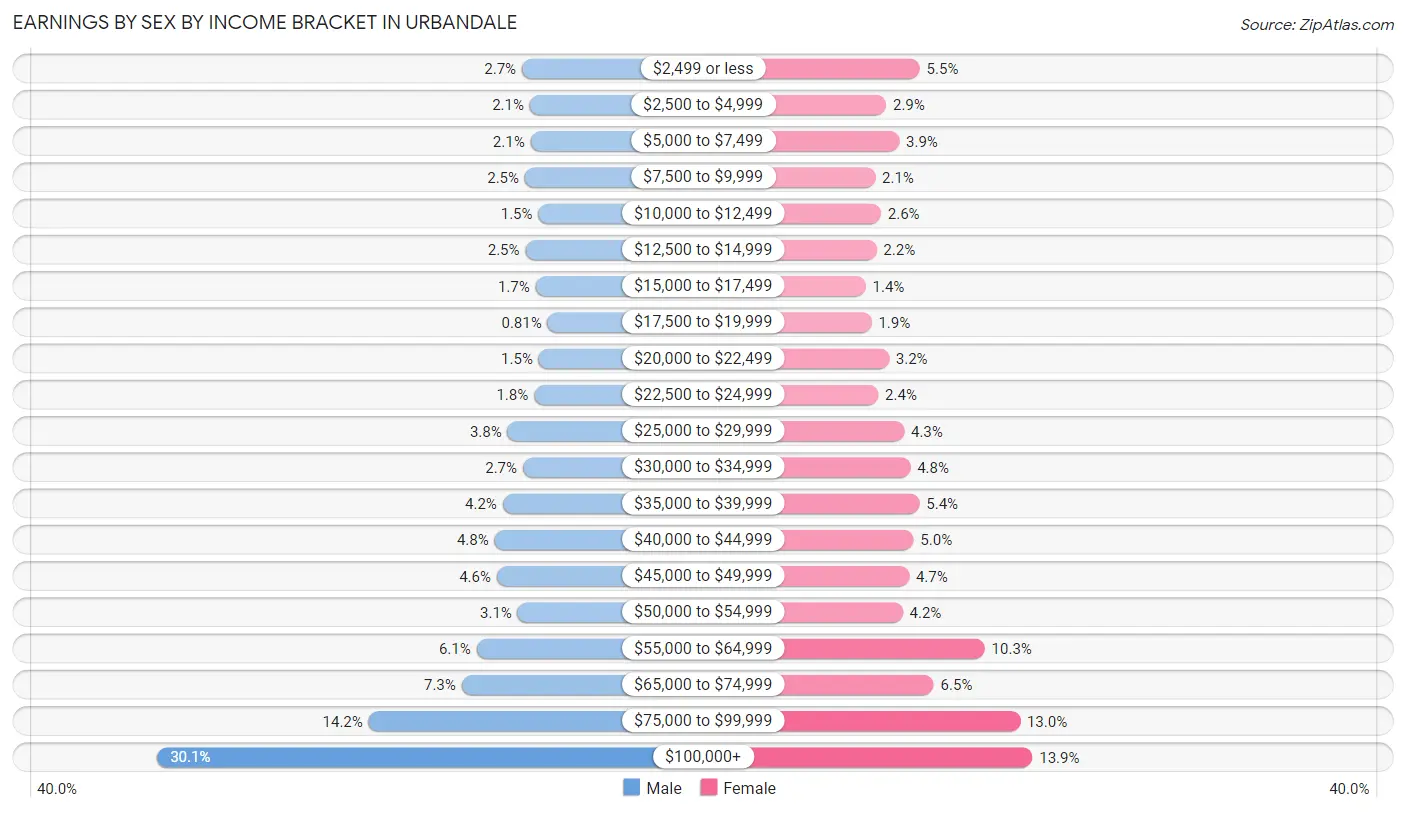
Earnings by Sex by Income Bracket in Urbandale
The most common earnings brackets in Urbandale are $100,000+ for men (4,255 | 30.1%) and $100,000+ for women (1,656 | 13.9%).
| Income | Male | Female |
| $2,499 or less | 387 (2.7%) | 650 (5.5%) |
| $2,500 to $4,999 | 303 (2.1%) | 350 (2.9%) |
| $5,000 to $7,499 | 296 (2.1%) | 467 (3.9%) |
| $7,500 to $9,999 | 355 (2.5%) | 253 (2.1%) |
| $10,000 to $12,499 | 212 (1.5%) | 304 (2.5%) |
| $12,500 to $14,999 | 349 (2.5%) | 264 (2.2%) |
| $15,000 to $17,499 | 242 (1.7%) | 168 (1.4%) |
| $17,500 to $19,999 | 114 (0.8%) | 221 (1.8%) |
| $20,000 to $22,499 | 208 (1.5%) | 375 (3.2%) |
| $22,500 to $24,999 | 258 (1.8%) | 280 (2.4%) |
| $25,000 to $29,999 | 539 (3.8%) | 511 (4.3%) |
| $30,000 to $34,999 | 377 (2.7%) | 566 (4.8%) |
| $35,000 to $39,999 | 590 (4.2%) | 648 (5.4%) |
| $40,000 to $44,999 | 677 (4.8%) | 595 (5.0%) |
| $45,000 to $49,999 | 653 (4.6%) | 555 (4.7%) |
| $50,000 to $54,999 | 431 (3.0%) | 498 (4.2%) |
| $55,000 to $64,999 | 868 (6.1%) | 1,231 (10.3%) |
| $65,000 to $74,999 | 1,026 (7.2%) | 776 (6.5%) |
| $75,000 to $99,999 | 2,013 (14.2%) | 1,547 (13.0%) |
| $100,000+ | 4,255 (30.1%) | 1,656 (13.9%) |
| Total | 14,153 (100.0%) | 11,915 (100.0%) |
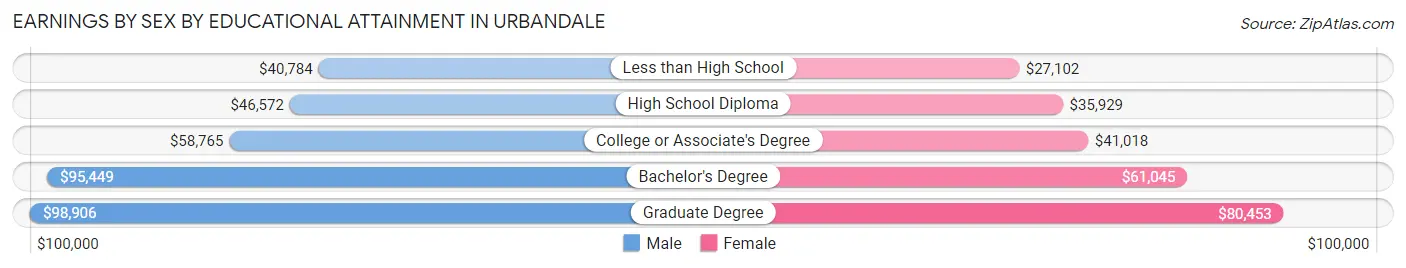
Earnings by Sex by Educational Attainment in Urbandale
Average earnings in Urbandale are $73,300 for men and $54,229 for women, a difference of 26.0%. Men with an educational attainment of graduate degree enjoy the highest average annual earnings of $98,906, while those with less than high school education earn the least with $40,784. Women with an educational attainment of graduate degree earn the most with the average annual earnings of $80,453, while those with less than high school education have the smallest earnings of $27,102.
| Educational Attainment | Male Income | Female Income |
| Less than High School | $40,784 | $27,102 |
| High School Diploma | $46,572 | $35,929 |
| College or Associate's Degree | $58,765 | $41,018 |
| Bachelor's Degree | $95,449 | $61,045 |
| Graduate Degree | $98,906 | $80,453 |
| Total | $73,300 | $54,229 |
Family Income in Urbandale
Family Income Brackets in Urbandale
According to the Urbandale family income data, there are 3,165 families falling into the $200,000+ income range, which is the most common income bracket and makes up 25.1% of all families. Conversely, the $10,000 to $14,999 income bracket is the least frequent group with only 113 families (0.9%) belonging to this category.
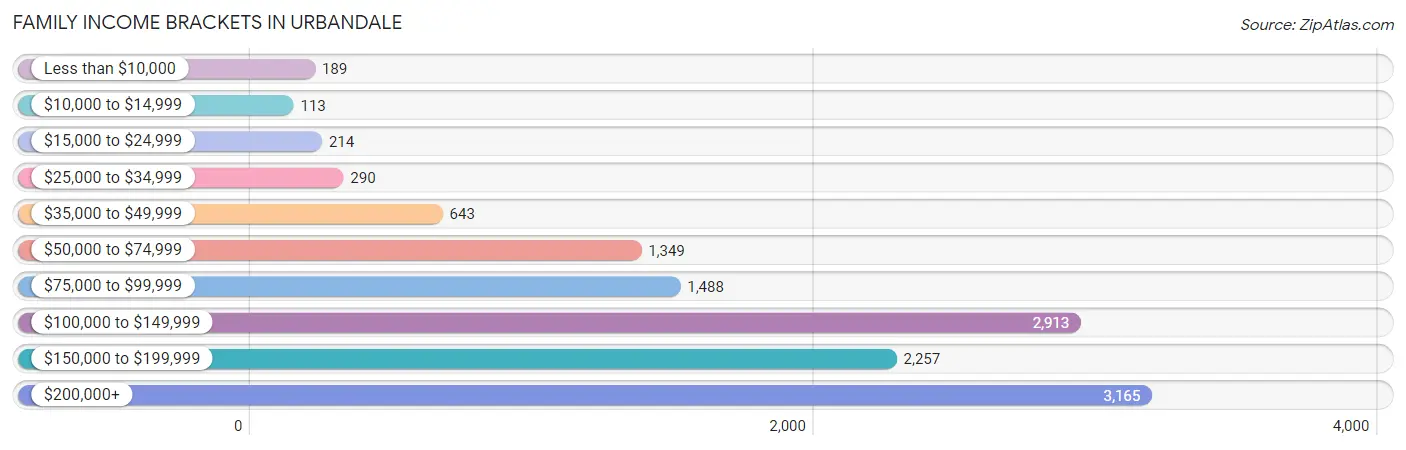
| Income Bracket | # Families | % Families |
| Less than $10,000 | 189 | 1.5% |
| $10,000 to $14,999 | 113 | 0.9% |
| $15,000 to $24,999 | 214 | 1.7% |
| $25,000 to $34,999 | 290 | 2.3% |
| $35,000 to $49,999 | 643 | 5.1% |
| $50,000 to $74,999 | 1,349 | 10.7% |
| $75,000 to $99,999 | 1,488 | 11.8% |
| $100,000 to $149,999 | 2,913 | 23.1% |
| $150,000 to $199,999 | 2,257 | 17.9% |
| $200,000+ | 3,165 | 25.1% |
Family Income by Famaliy Size in Urbandale
4-person families (2,914 | 23.1%) account for the highest median family income in Urbandale with $181,429 per family, while 2-person families (5,635 | 44.7%) have the highest median income of $56,903 per family member.
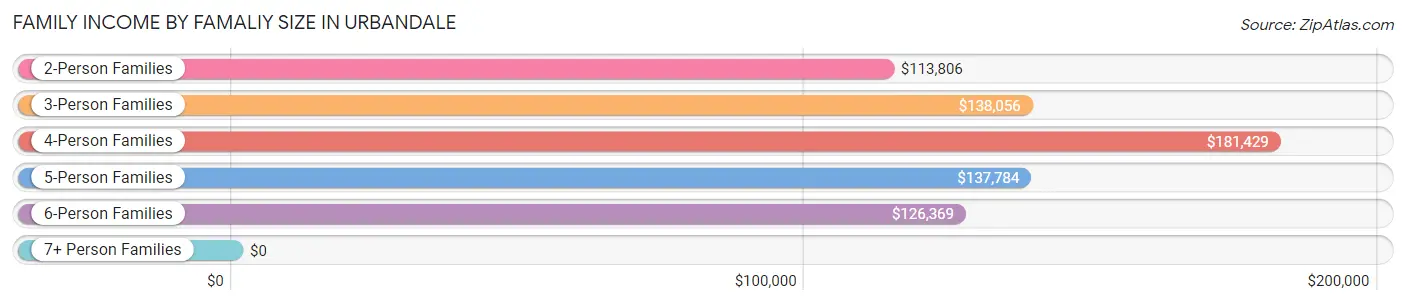
| Income Bracket | # Families | Median Income |
| 2-Person Families | 5,635 (44.7%) | $113,806 |
| 3-Person Families | 2,494 (19.8%) | $138,056 |
| 4-Person Families | 2,914 (23.1%) | $181,429 |
| 5-Person Families | 1,226 (9.7%) | $137,784 |
| 6-Person Families | 291 (2.3%) | $126,369 |
| 7+ Person Families | 49 (0.4%) | $0 |
| Total | 12,609 (100.0%) | $134,872 |
Family Income by Number of Earners in Urbandale
The median family income in Urbandale is $134,872, with families comprising 3+ earners (1,530) having the highest median family income of $177,667, while families with no earners (1,556) have the lowest median family income of $74,444, accounting for 12.1% and 12.3% of families, respectively.
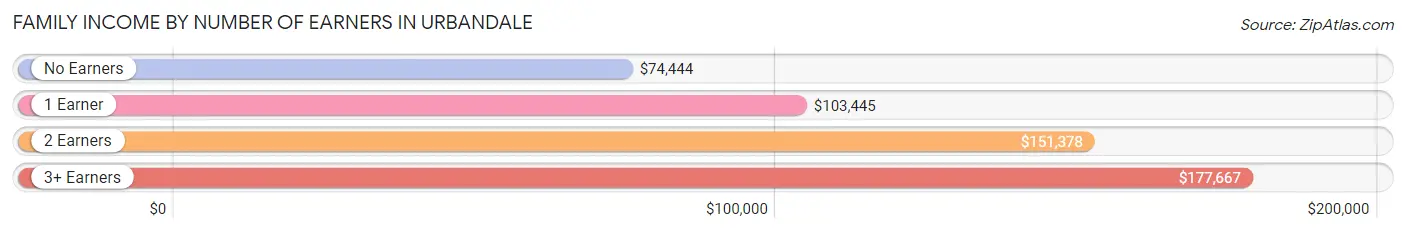
| Number of Earners | # Families | Median Income |
| No Earners | 1,556 (12.3%) | $74,444 |
| 1 Earner | 3,033 (24.0%) | $103,445 |
| 2 Earners | 6,490 (51.5%) | $151,378 |
| 3+ Earners | 1,530 (12.1%) | $177,667 |
| Total | 12,609 (100.0%) | $134,872 |
Household Income in Urbandale
Household Income Brackets in Urbandale
With 3,673 households falling in the category, the $100,000 to $149,999 income range is the most frequent in Urbandale, accounting for 21.4% of all households. In contrast, only 240 households (1.4%) fall into the $10,000 to $14,999 income bracket, making it the least populous group.
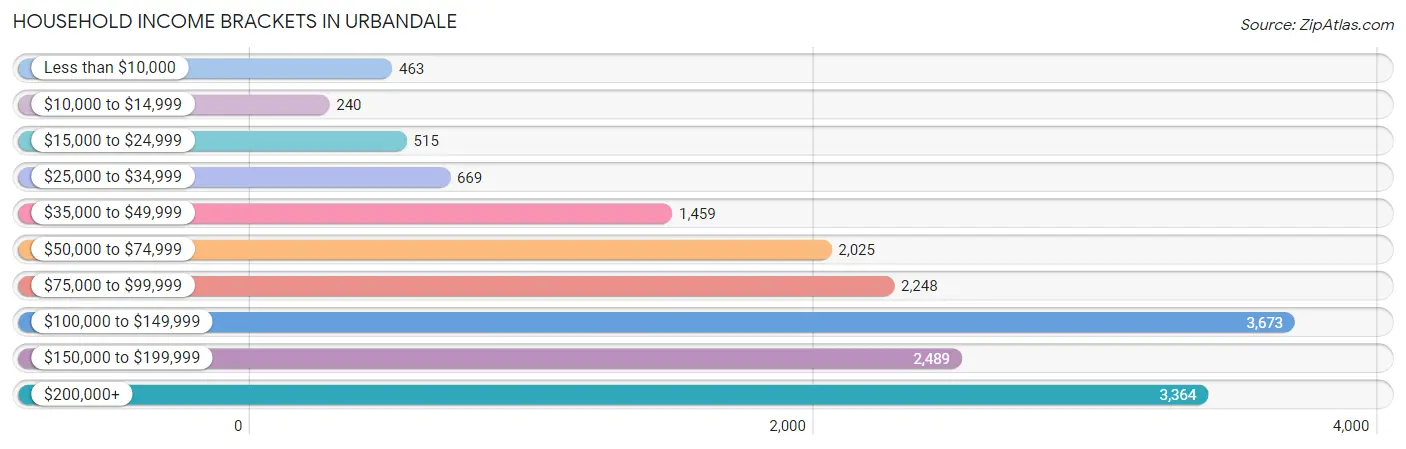
| Income Bracket | # Households | % Households |
| Less than $10,000 | 463 | 2.7% |
| $10,000 to $14,999 | 240 | 1.4% |
| $15,000 to $24,999 | 515 | 3.0% |
| $25,000 to $34,999 | 669 | 3.9% |
| $35,000 to $49,999 | 1,459 | 8.5% |
| $50,000 to $74,999 | 2,025 | 11.8% |
| $75,000 to $99,999 | 2,248 | 13.1% |
| $100,000 to $149,999 | 3,673 | 21.4% |
| $150,000 to $199,999 | 2,489 | 14.5% |
| $200,000+ | 3,364 | 19.6% |
Household Income by Householder Age in Urbandale
The median household income in Urbandale is $111,888, with the highest median household income of $134,696 found in the 45 to 64 years age bracket for the primary householder. A total of 6,772 households (39.5%) fall into this category. Meanwhile, the 15 to 24 years age bracket for the primary householder has the lowest median household income of $78,801, with 413 households (2.4%) in this group.
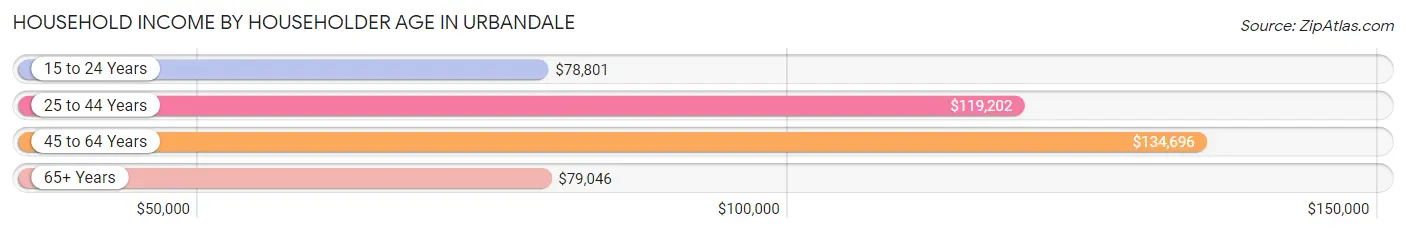
| Income Bracket | # Households | Median Income |
| 15 to 24 Years | 413 (2.4%) | $78,801 |
| 25 to 44 Years | 6,192 (36.1%) | $119,202 |
| 45 to 64 Years | 6,772 (39.5%) | $134,696 |
| 65+ Years | 3,786 (22.1%) | $79,046 |
| Total | 17,163 (100.0%) | $111,888 |
Poverty in Urbandale
Income Below Poverty by Sex and Age in Urbandale
With 5.8% poverty level for males and 5.2% for females among the residents of Urbandale, 75 year old and over males and under 5 year old females are the most vulnerable to poverty, with 111 males (13.1%) and 123 females (8.4%) in their respective age groups living below the poverty level.
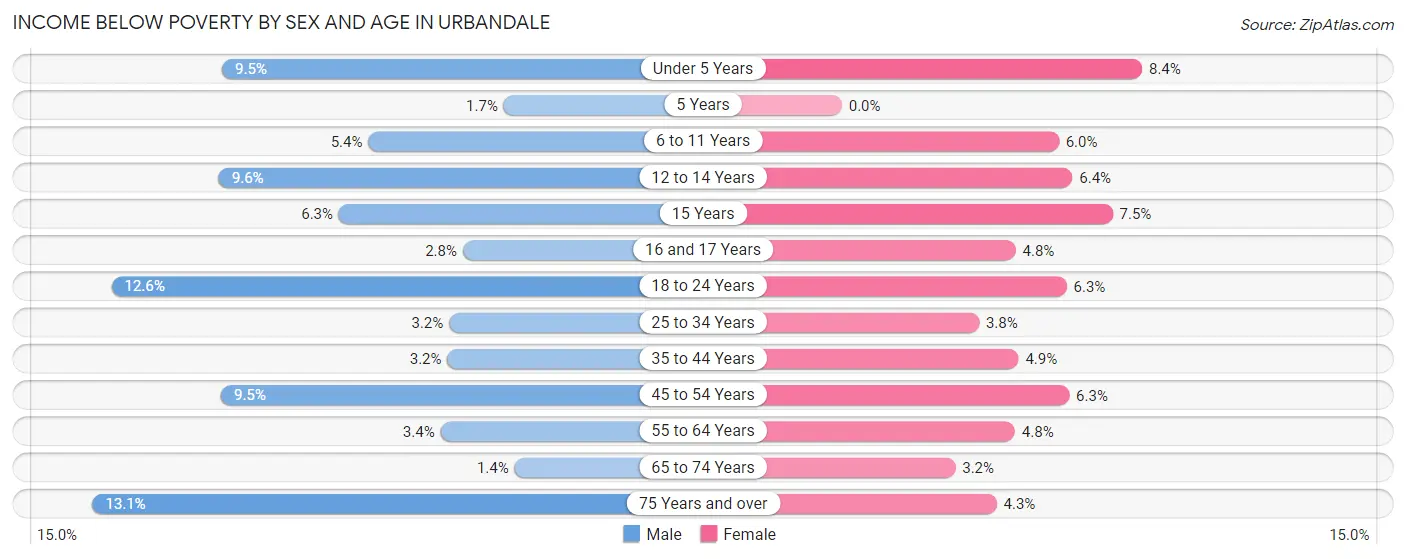
| Age Bracket | Male | Female |
| Under 5 Years | 136 (9.5%) | 123 (8.4%) |
| 5 Years | 7 (1.7%) | 0 (0.0%) |
| 6 to 11 Years | 102 (5.4%) | 139 (6.0%) |
| 12 to 14 Years | 97 (9.6%) | 54 (6.4%) |
| 15 Years | 16 (6.2%) | 34 (7.5%) |
| 16 and 17 Years | 23 (2.8%) | 31 (4.8%) |
| 18 to 24 Years | 171 (12.6%) | 79 (6.3%) |
| 25 to 34 Years | 93 (3.2%) | 95 (3.8%) |
| 35 to 44 Years | 117 (3.2%) | 163 (4.9%) |
| 45 to 54 Years | 312 (9.5%) | 184 (6.3%) |
| 55 to 64 Years | 97 (3.4%) | 155 (4.8%) |
| 65 to 74 Years | 29 (1.4%) | 63 (3.2%) |
| 75 Years and over | 111 (13.1%) | 53 (4.3%) |
| Total | 1,311 (5.8%) | 1,173 (5.2%) |
Income Above Poverty by Sex and Age in Urbandale
According to the poverty statistics in Urbandale, males aged 65 to 74 years and females aged 5 years are the age groups that are most secure financially, with 98.6% of males and 100.0% of females in these age groups living above the poverty line.
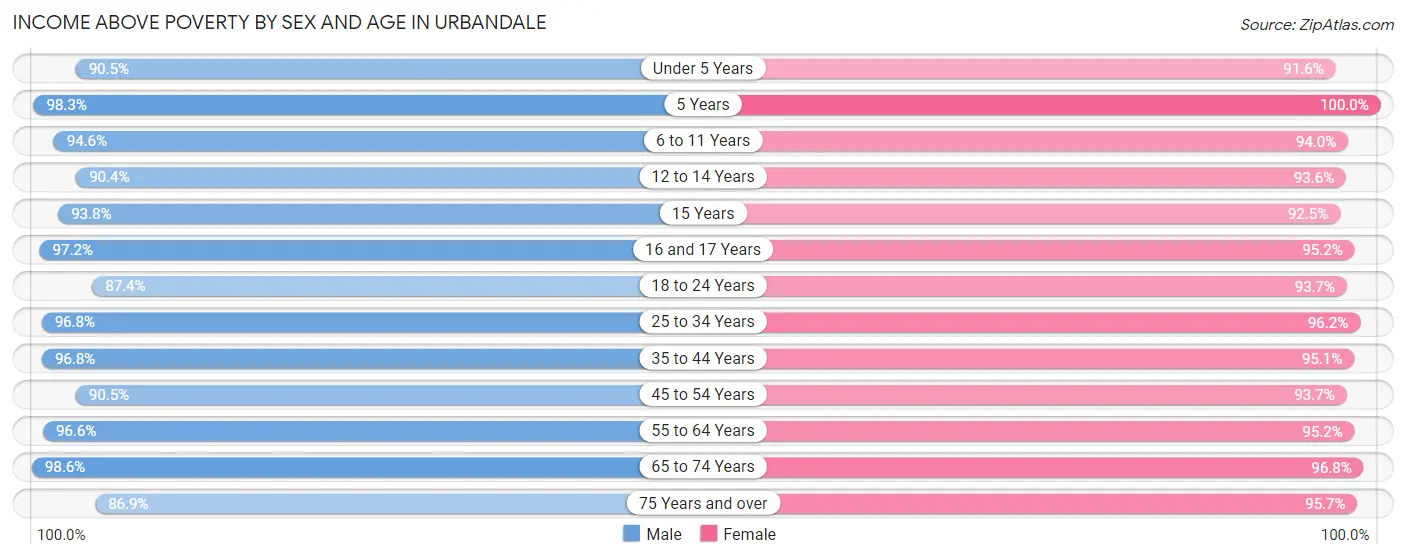
| Age Bracket | Male | Female |
| Under 5 Years | 1,296 (90.5%) | 1,348 (91.6%) |
| 5 Years | 414 (98.3%) | 267 (100.0%) |
| 6 to 11 Years | 1,778 (94.6%) | 2,164 (94.0%) |
| 12 to 14 Years | 914 (90.4%) | 787 (93.6%) |
| 15 Years | 240 (93.8%) | 417 (92.5%) |
| 16 and 17 Years | 799 (97.2%) | 609 (95.2%) |
| 18 to 24 Years | 1,188 (87.4%) | 1,183 (93.7%) |
| 25 to 34 Years | 2,827 (96.8%) | 2,395 (96.2%) |
| 35 to 44 Years | 3,504 (96.8%) | 3,151 (95.1%) |
| 45 to 54 Years | 2,963 (90.5%) | 2,722 (93.7%) |
| 55 to 64 Years | 2,740 (96.6%) | 3,064 (95.2%) |
| 65 to 74 Years | 2,109 (98.6%) | 1,933 (96.8%) |
| 75 Years and over | 736 (86.9%) | 1,176 (95.7%) |
| Total | 21,508 (94.3%) | 21,216 (94.8%) |
Income Below Poverty Among Married-Couple Families in Urbandale
The poverty statistics for married-couple families in Urbandale show that 2.5% or 264 of the total 10,382 families live below the poverty line. Families with 3 or 4 children have the highest poverty rate of 6.4%, comprising of 68 families. On the other hand, families with 5 or more children have the lowest poverty rate of 0.0%, which includes 0 families.
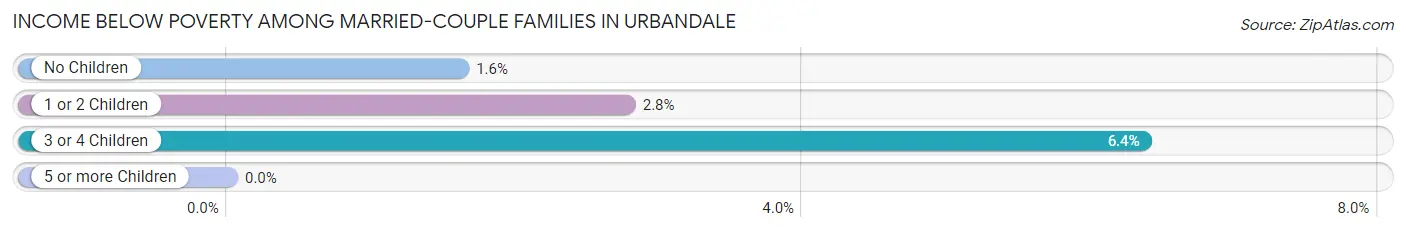
| Children | Above Poverty | Below Poverty |
| No Children | 5,246 (98.4%) | 86 (1.6%) |
| 1 or 2 Children | 3,861 (97.2%) | 110 (2.8%) |
| 3 or 4 Children | 1,002 (93.6%) | 68 (6.4%) |
| 5 or more Children | 9 (100.0%) | 0 (0.0%) |
| Total | 10,118 (97.5%) | 264 (2.5%) |
Income Below Poverty Among Single-Parent Households in Urbandale
According to the poverty data in Urbandale, 6.5% or 45 single-father households and 13.9% or 213 single-mother households are living below the poverty line. Among single-father households, those with 1 or 2 children have the highest poverty rate, with 45 households (19.2%) experiencing poverty. Likewise, among single-mother households, those with 5 or more children have the highest poverty rate, with 12 households (100.0%) falling below the poverty line.
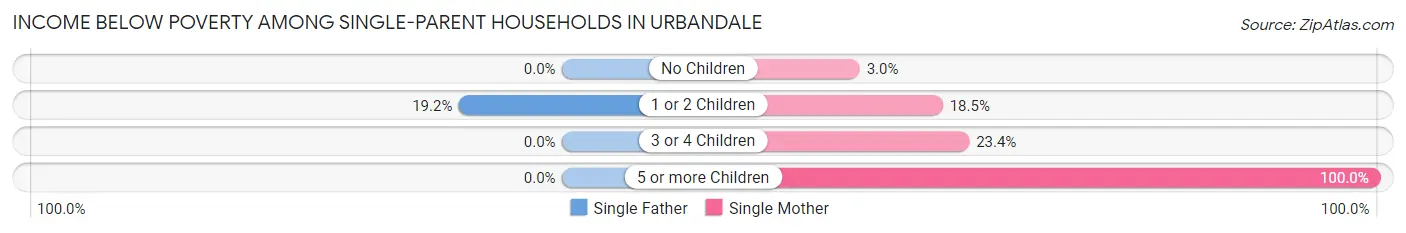
| Children | Single Father | Single Mother |
| No Children | 0 (0.0%) | 17 (3.0%) |
| 1 or 2 Children | 45 (19.2%) | 148 (18.4%) |
| 3 or 4 Children | 0 (0.0%) | 36 (23.4%) |
| 5 or more Children | 0 (0.0%) | 12 (100.0%) |
| Total | 45 (6.5%) | 213 (13.9%) |
Income Below Poverty Among Married-Couple vs Single-Parent Households in Urbandale
The poverty data for Urbandale shows that 264 of the married-couple family households (2.5%) and 258 of the single-parent households (11.6%) are living below the poverty level. Within the married-couple family households, those with 3 or 4 children have the highest poverty rate, with 68 households (6.4%) falling below the poverty line. Among the single-parent households, those with 5 or more children have the highest poverty rate, with 12 household (100.0%) living below poverty.
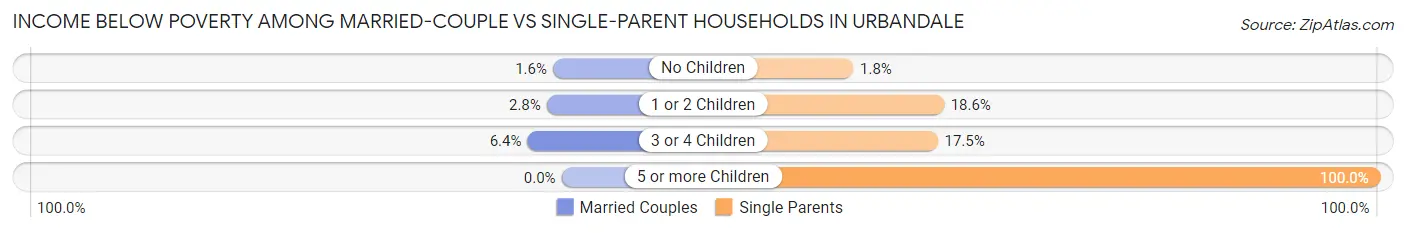
| Children | Married-Couple Families | Single-Parent Households |
| No Children | 86 (1.6%) | 17 (1.8%) |
| 1 or 2 Children | 110 (2.8%) | 193 (18.6%) |
| 3 or 4 Children | 68 (6.4%) | 36 (17.5%) |
| 5 or more Children | 0 (0.0%) | 12 (100.0%) |
| Total | 264 (2.5%) | 258 (11.6%) |
Race in Urbandale
The most populous races in Urbandale are White / Caucasian (39,173 | 85.9%), Hispanic or Latino (2,617 | 5.7%), and Asian (2,382 | 5.2%).
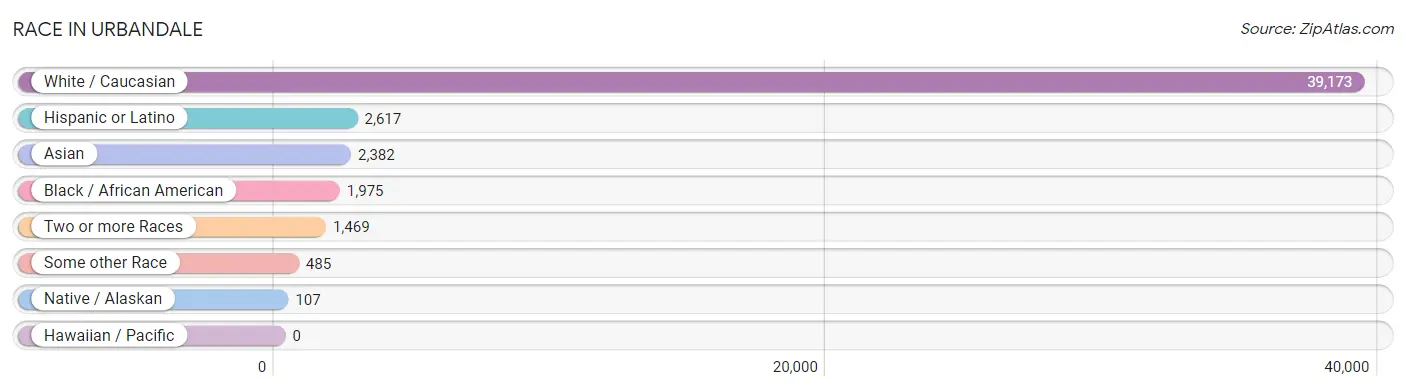
| Race | # Population | % Population |
| Asian | 2,382 | 5.2% |
| Black / African American | 1,975 | 4.3% |
| Hawaiian / Pacific | 0 | 0.0% |
| Hispanic or Latino | 2,617 | 5.7% |
| Native / Alaskan | 107 | 0.2% |
| White / Caucasian | 39,173 | 85.9% |
| Two or more Races | 1,469 | 3.2% |
| Some other Race | 485 | 1.1% |
| Total | 45,591 | 100.0% |
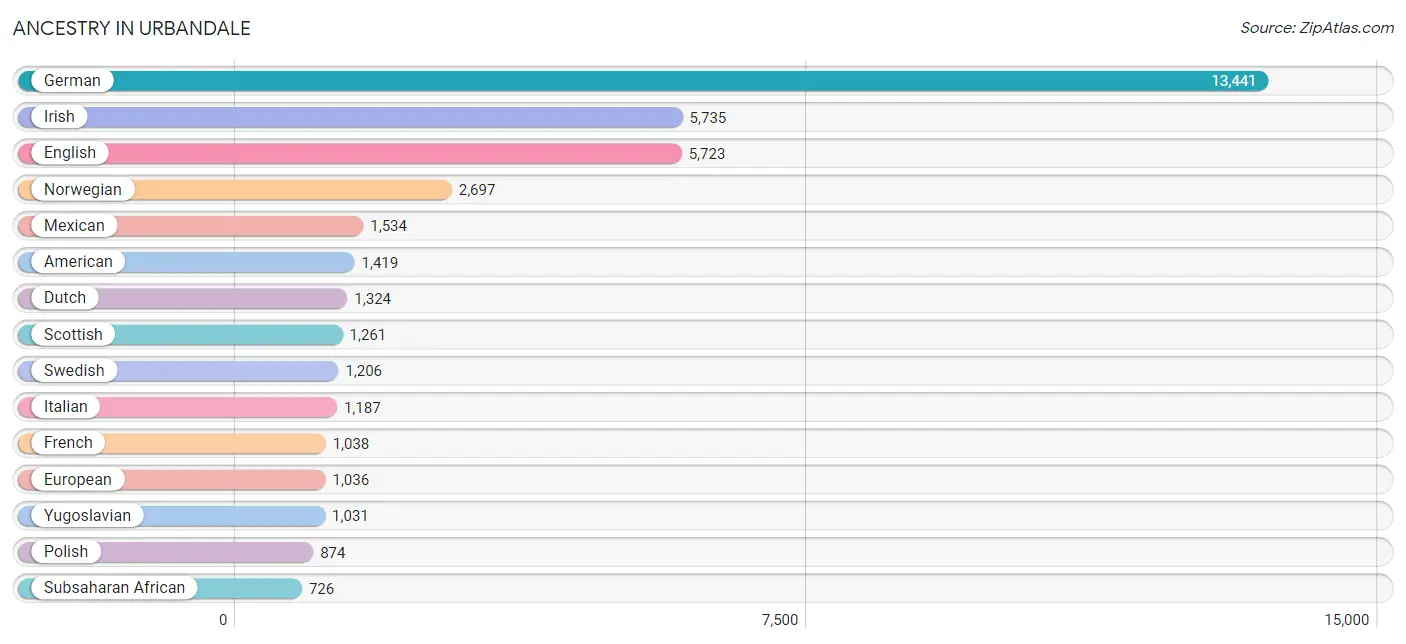
Ancestry in Urbandale
The most populous ancestries reported in Urbandale are German (13,441 | 29.5%), Irish (5,735 | 12.6%), English (5,723 | 12.6%), Norwegian (2,697 | 5.9%), and Mexican (1,534 | 3.4%), together accounting for 63.9% of all Urbandale residents.
| Ancestry | # Population | % Population |
| African | 241 | 0.5% |
| American | 1,419 | 3.1% |
| Arab | 224 | 0.5% |
| Assyrian / Chaldean / Syriac | 23 | 0.1% |
| Australian | 15 | 0.0% |
| Austrian | 44 | 0.1% |
| Belgian | 49 | 0.1% |
| Bhutanese | 32 | 0.1% |
| Blackfeet | 57 | 0.1% |
| Bolivian | 24 | 0.1% |
| British | 209 | 0.5% |
| Bulgarian | 4 | 0.0% |
| Burmese | 212 | 0.5% |
| Canadian | 124 | 0.3% |
| Central American | 220 | 0.5% |
| Cherokee | 29 | 0.1% |
| Choctaw | 16 | 0.0% |
| Colombian | 22 | 0.1% |
| Costa Rican | 83 | 0.2% |
| Croatian | 180 | 0.4% |
| Cuban | 50 | 0.1% |
| Czech | 495 | 1.1% |
| Czechoslovakian | 41 | 0.1% |
| Danish | 712 | 1.6% |
| Dutch | 1,324 | 2.9% |
| Eastern European | 117 | 0.3% |
| Ecuadorian | 23 | 0.1% |
| English | 5,723 | 12.6% |
| Ethiopian | 31 | 0.1% |
| European | 1,036 | 2.3% |
| Filipino | 50 | 0.1% |
| Finnish | 19 | 0.0% |
| French | 1,038 | 2.3% |
| French American Indian | 2 | 0.0% |
| French Canadian | 29 | 0.1% |
| German | 13,441 | 29.5% |
| Ghanaian | 43 | 0.1% |
| Greek | 41 | 0.1% |
| Guatemalan | 11 | 0.0% |
| Honduran | 21 | 0.1% |
| Hungarian | 117 | 0.3% |
| Indian (Asian) | 467 | 1.0% |
| Indonesian | 451 | 1.0% |
| Iraqi | 62 | 0.1% |
| Irish | 5,735 | 12.6% |
| Italian | 1,187 | 2.6% |
| Jamaican | 115 | 0.3% |
| Kenyan | 52 | 0.1% |
| Korean | 101 | 0.2% |
| Latvian | 25 | 0.1% |
| Lebanese | 150 | 0.3% |
| Liberian | 222 | 0.5% |
| Lithuanian | 122 | 0.3% |
| Luxembourger | 123 | 0.3% |
| Macedonian | 7 | 0.0% |
| Malaysian | 251 | 0.5% |
| Mexican | 1,534 | 3.4% |
| Navajo | 8 | 0.0% |
| Nigerian | 8 | 0.0% |
| Northern European | 120 | 0.3% |
| Norwegian | 2,697 | 5.9% |
| Pakistani | 46 | 0.1% |
| Panamanian | 11 | 0.0% |
| Pennsylvania German | 9 | 0.0% |
| Peruvian | 29 | 0.1% |
| Polish | 874 | 1.9% |
| Portuguese | 7 | 0.0% |
| Puerto Rican | 571 | 1.3% |
| Russian | 77 | 0.2% |
| Salvadoran | 94 | 0.2% |
| Scandinavian | 506 | 1.1% |
| Scotch-Irish | 238 | 0.5% |
| Scottish | 1,261 | 2.8% |
| Serbian | 66 | 0.1% |
| Sioux | 64 | 0.1% |
| Slavic | 11 | 0.0% |
| South American | 98 | 0.2% |
| Spaniard | 55 | 0.1% |
| Spanish | 61 | 0.1% |
| Sri Lankan | 337 | 0.7% |
| Subsaharan African | 726 | 1.6% |
| Sudanese | 120 | 0.3% |
| Swedish | 1,206 | 2.6% |
| Swiss | 358 | 0.8% |
| Thai | 374 | 0.8% |
| Turkish | 11 | 0.0% |
| Ukrainian | 7 | 0.0% |
| Welsh | 425 | 0.9% |
| Yugoslavian | 1,031 | 2.3% | View All 89 Rows |
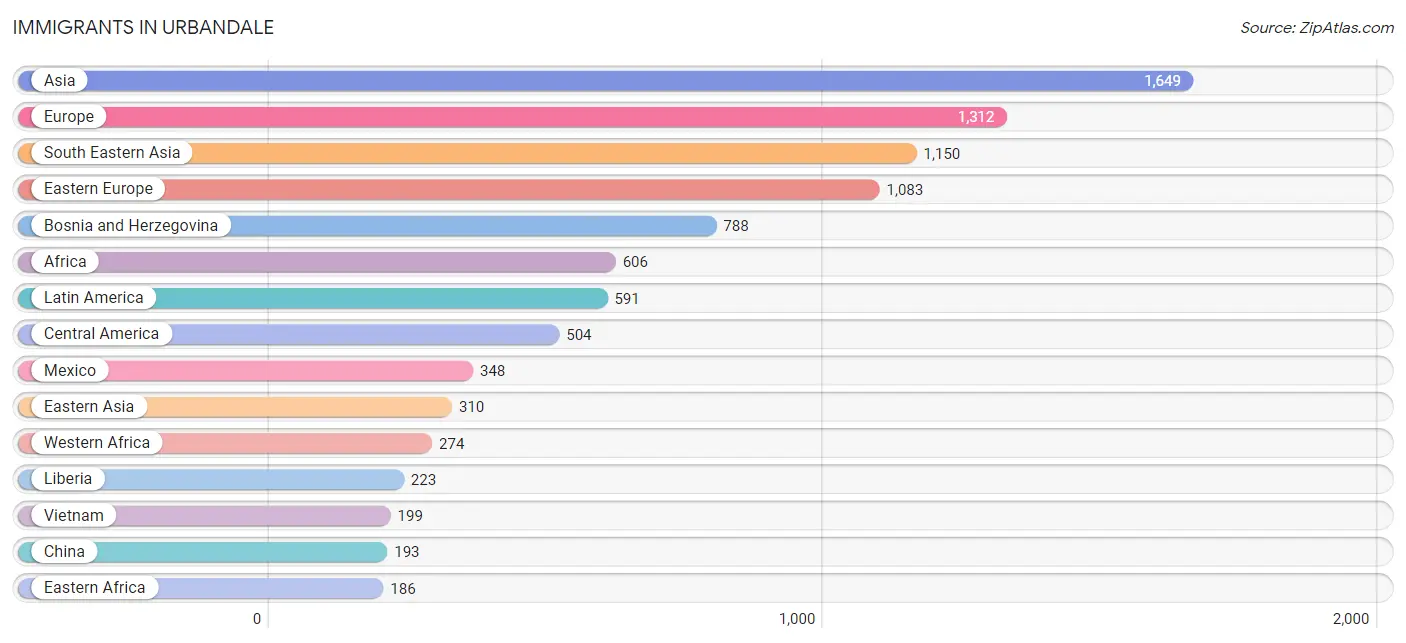
Immigrants in Urbandale
The most numerous immigrant groups reported in Urbandale came from Asia (1,649 | 3.6%), Europe (1,312 | 2.9%), South Eastern Asia (1,150 | 2.5%), Eastern Europe (1,083 | 2.4%), and Bosnia and Herzegovina (788 | 1.7%), together accounting for 13.1% of all Urbandale residents.
| Immigration Origin | # Population | % Population |
| Africa | 606 | 1.3% |
| Asia | 1,649 | 3.6% |
| Australia | 10 | 0.0% |
| Bosnia and Herzegovina | 788 | 1.7% |
| Brazil | 15 | 0.0% |
| Bulgaria | 4 | 0.0% |
| Canada | 76 | 0.2% |
| Caribbean | 33 | 0.1% |
| Central America | 504 | 1.1% |
| China | 193 | 0.4% |
| Colombia | 22 | 0.1% |
| Congo | 9 | 0.0% |
| Costa Rica | 10 | 0.0% |
| Croatia | 32 | 0.1% |
| Eastern Africa | 186 | 0.4% |
| Eastern Asia | 310 | 0.7% |
| Eastern Europe | 1,083 | 2.4% |
| El Salvador | 44 | 0.1% |
| England | 24 | 0.1% |
| Ethiopia | 13 | 0.0% |
| Europe | 1,312 | 2.9% |
| Germany | 62 | 0.1% |
| Ghana | 43 | 0.1% |
| Guatemala | 25 | 0.1% |
| Honduras | 71 | 0.2% |
| Hong Kong | 38 | 0.1% |
| India | 111 | 0.2% |
| Indonesia | 25 | 0.1% |
| Iraq | 62 | 0.1% |
| Italy | 11 | 0.0% |
| Jamaica | 33 | 0.1% |
| Kenya | 42 | 0.1% |
| Korea | 117 | 0.3% |
| Laos | 185 | 0.4% |
| Latin America | 591 | 1.3% |
| Liberia | 223 | 0.5% |
| Malaysia | 48 | 0.1% |
| Mexico | 348 | 0.8% |
| Middle Africa | 71 | 0.2% |
| Moldova | 55 | 0.1% |
| Nepal | 16 | 0.0% |
| Nigeria | 8 | 0.0% |
| Northern Africa | 63 | 0.1% |
| Northern Europe | 132 | 0.3% |
| Norway | 52 | 0.1% |
| Oceania | 10 | 0.0% |
| Panama | 6 | 0.0% |
| Peru | 10 | 0.0% |
| Philippines | 83 | 0.2% |
| Somalia | 131 | 0.3% |
| South America | 54 | 0.1% |
| South Central Asia | 127 | 0.3% |
| South Eastern Asia | 1,150 | 2.5% |
| Southern Europe | 35 | 0.1% |
| Spain | 24 | 0.1% |
| Sudan | 63 | 0.1% |
| Taiwan | 35 | 0.1% |
| Ukraine | 30 | 0.1% |
| Venezuela | 7 | 0.0% |
| Vietnam | 199 | 0.4% |
| Western Africa | 274 | 0.6% |
| Western Asia | 62 | 0.1% |
| Western Europe | 62 | 0.1% |
| Zaire | 62 | 0.1% | View All 64 Rows |
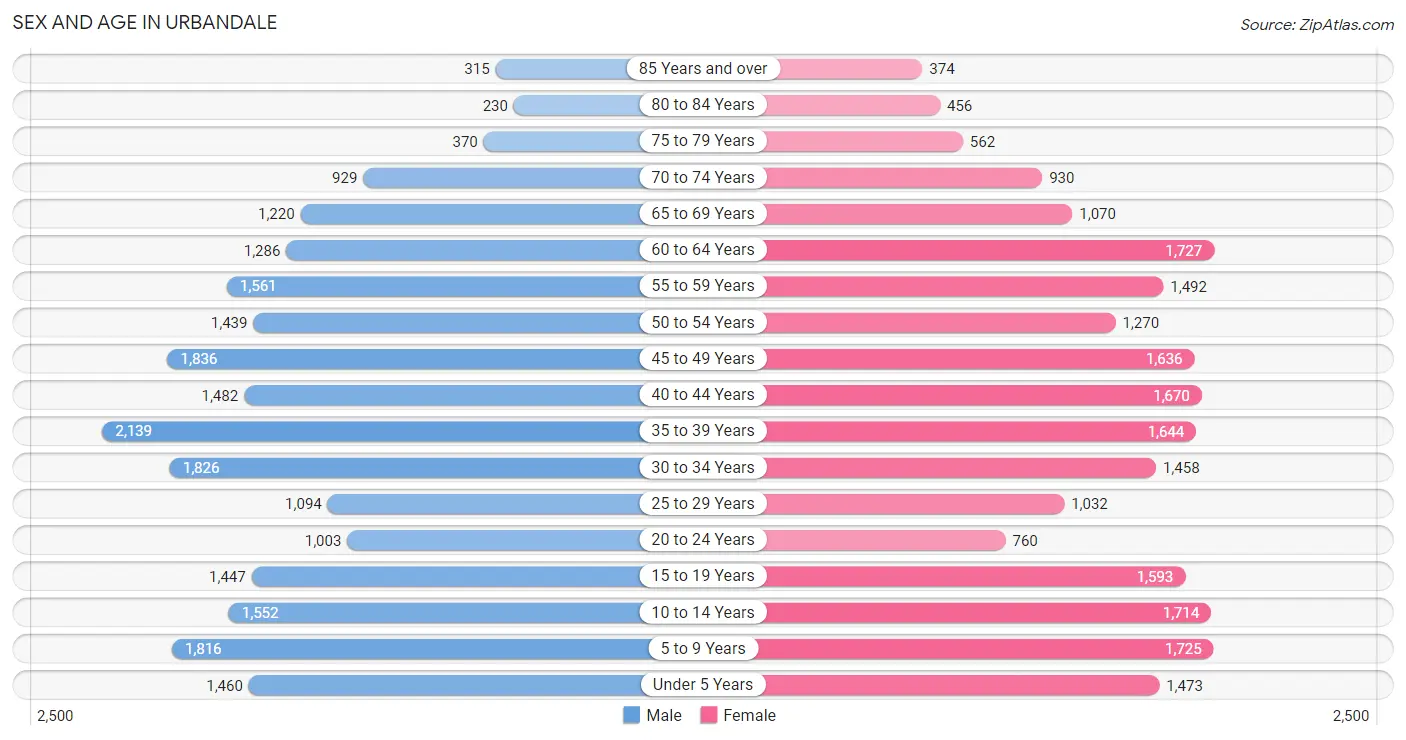
Sex and Age in Urbandale
Sex and Age in Urbandale
The most populous age groups in Urbandale are 35 to 39 Years (2,139 | 9.3%) for men and 60 to 64 Years (1,727 | 7.6%) for women.
| Age Bracket | Male | Female |
| Under 5 Years | 1,460 (6.4%) | 1,473 (6.5%) |
| 5 to 9 Years | 1,816 (7.9%) | 1,725 (7.6%) |
| 10 to 14 Years | 1,552 (6.8%) | 1,714 (7.6%) |
| 15 to 19 Years | 1,447 (6.3%) | 1,593 (7.0%) |
| 20 to 24 Years | 1,003 (4.4%) | 760 (3.4%) |
| 25 to 29 Years | 1,094 (4.8%) | 1,032 (4.6%) |
| 30 to 34 Years | 1,826 (7.9%) | 1,458 (6.5%) |
| 35 to 39 Years | 2,139 (9.3%) | 1,644 (7.3%) |
| 40 to 44 Years | 1,482 (6.4%) | 1,670 (7.4%) |
| 45 to 49 Years | 1,836 (8.0%) | 1,636 (7.2%) |
| 50 to 54 Years | 1,439 (6.3%) | 1,270 (5.6%) |
| 55 to 59 Years | 1,561 (6.8%) | 1,492 (6.6%) |
| 60 to 64 Years | 1,286 (5.6%) | 1,727 (7.6%) |
| 65 to 69 Years | 1,220 (5.3%) | 1,070 (4.7%) |
| 70 to 74 Years | 929 (4.0%) | 930 (4.1%) |
| 75 to 79 Years | 370 (1.6%) | 562 (2.5%) |
| 80 to 84 Years | 230 (1.0%) | 456 (2.0%) |
| 85 Years and over | 315 (1.4%) | 374 (1.7%) |
| Total | 23,005 (100.0%) | 22,586 (100.0%) |
Families and Households in Urbandale
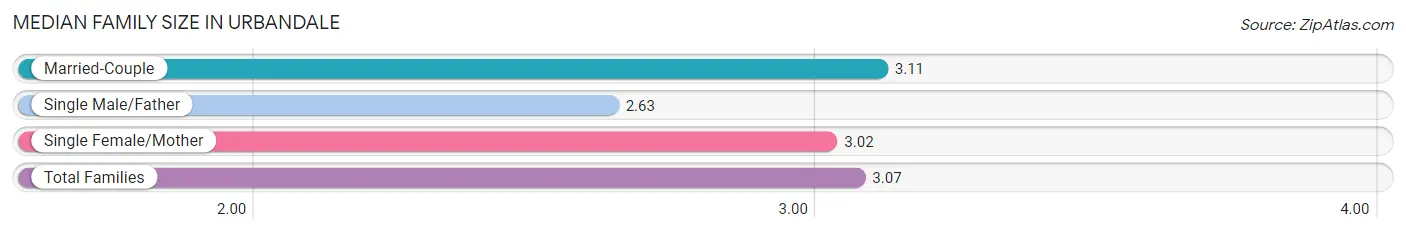
Median Family Size in Urbandale
The median family size in Urbandale is 3.07 persons per family, with married-couple families (10,382 | 82.3%) accounting for the largest median family size of 3.11 persons per family. On the other hand, single male/father families (690 | 5.5%) represent the smallest median family size with 2.63 persons per family.
| Family Type | # Families | Family Size |
| Married-Couple | 10,382 (82.3%) | 3.11 |
| Single Male/Father | 690 (5.5%) | 2.63 |
| Single Female/Mother | 1,537 (12.2%) | 3.02 |
| Total Families | 12,609 (100.0%) | 3.07 |
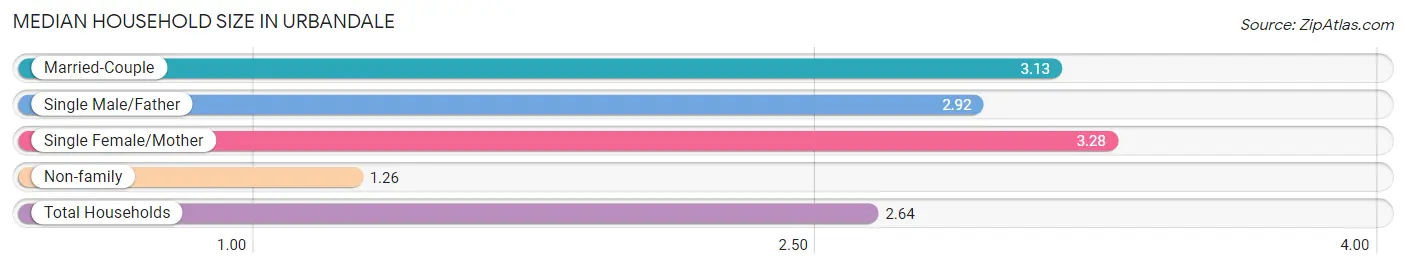
Median Household Size in Urbandale
The median household size in Urbandale is 2.64 persons per household, with single female/mother households (1,537 | 9.0%) accounting for the largest median household size of 3.28 persons per household. non-family households (4,554 | 26.5%) represent the smallest median household size with 1.26 persons per household.
| Household Type | # Households | Household Size |
| Married-Couple | 10,382 (60.5%) | 3.13 |
| Single Male/Father | 690 (4.0%) | 2.92 |
| Single Female/Mother | 1,537 (9.0%) | 3.28 |
| Non-family | 4,554 (26.5%) | 1.26 |
| Total Households | 17,163 (100.0%) | 2.64 |
Household Size by Marriage Status in Urbandale
Out of a total of 17,163 households in Urbandale, 12,609 (73.5%) are family households, while 4,554 (26.5%) are nonfamily households. The most numerous type of family households are 2-person households, comprising 5,322, and the most common type of nonfamily households are 1-person households, comprising 3,526.
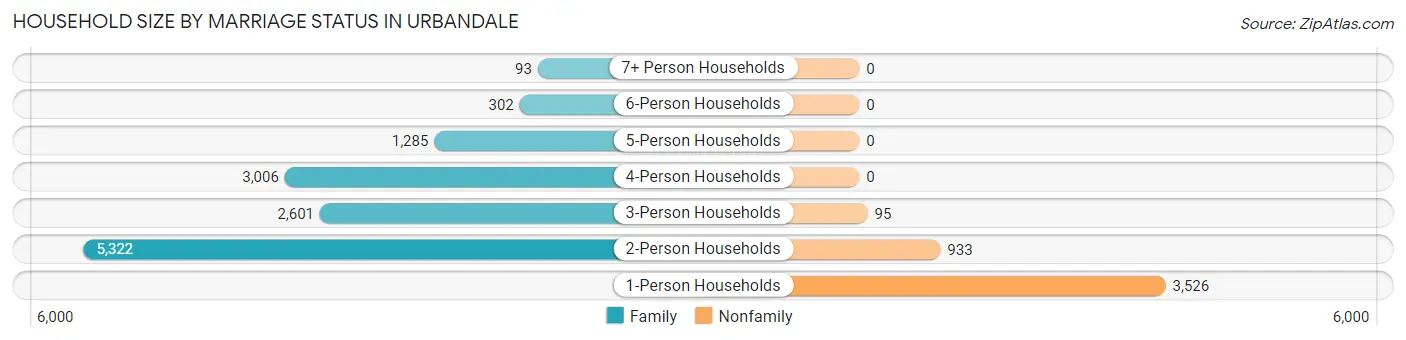
| Household Size | Family Households | Nonfamily Households |
| 1-Person Households | - | 3,526 (20.5%) |
| 2-Person Households | 5,322 (31.0%) | 933 (5.4%) |
| 3-Person Households | 2,601 (15.1%) | 95 (0.5%) |
| 4-Person Households | 3,006 (17.5%) | 0 (0.0%) |
| 5-Person Households | 1,285 (7.5%) | 0 (0.0%) |
| 6-Person Households | 302 (1.8%) | 0 (0.0%) |
| 7+ Person Households | 93 (0.5%) | 0 (0.0%) |
| Total | 12,609 (73.5%) | 4,554 (26.5%) |
Female Fertility in Urbandale
Fertility by Age in Urbandale
Average fertility rate in Urbandale is 60.0 births per 1,000 women. Women in the age bracket of 20 to 34 years have the highest fertility rate with 97.0 births per 1,000 women. Women in the age bracket of 20 to 34 years acount for 51.8% of all women with births.
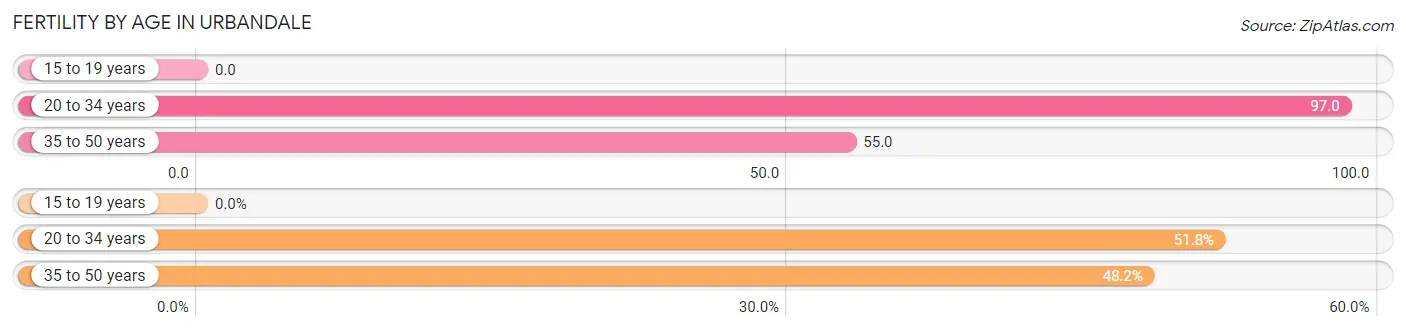
| Age Bracket | Women with Births | Births / 1,000 Women |
| 15 to 19 years | 0 (0.0%) | 0.0 |
| 20 to 34 years | 315 (51.8%) | 97.0 |
| 35 to 50 years | 293 (48.2%) | 55.0 |
| Total | 608 (100.0%) | 60.0 |
Fertility by Age by Marriage Status in Urbandale
79.9% of women with births (608) in Urbandale are married. The highest percentage of unmarried women with births falls into 20 to 34 years age bracket with 28.9% of them unmarried at the time of birth, while the lowest percentage of unmarried women with births belong to 35 to 50 years age bracket with 10.6% of them unmarried.
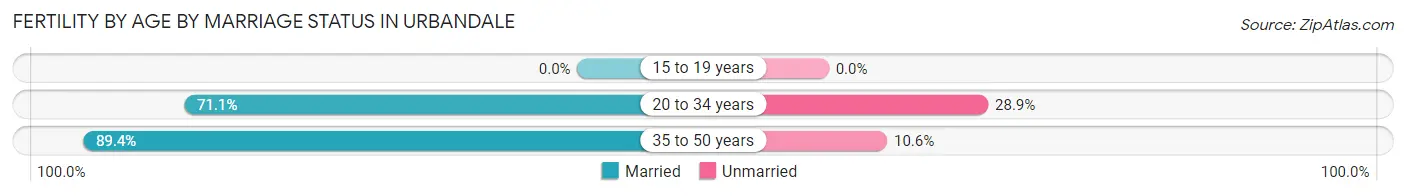
| Age Bracket | Married | Unmarried |
| 15 to 19 years | 0 (0.0%) | 0 (0.0%) |
| 20 to 34 years | 224 (71.1%) | 91 (28.9%) |
| 35 to 50 years | 262 (89.4%) | 31 (10.6%) |
| Total | 486 (79.9%) | 122 (20.1%) |
Fertility by Education in Urbandale
Average fertility rate in Urbandale is 60.0 births per 1,000 women. Women with the education attainment of graduate degree have the highest fertility rate of 110.0 births per 1,000 women, while women with the education attainment of college or associate's degree have the lowest fertility at 31.0 births per 1,000 women. Women with the education attainment of graduate degree represent 32.7% of all women with births.
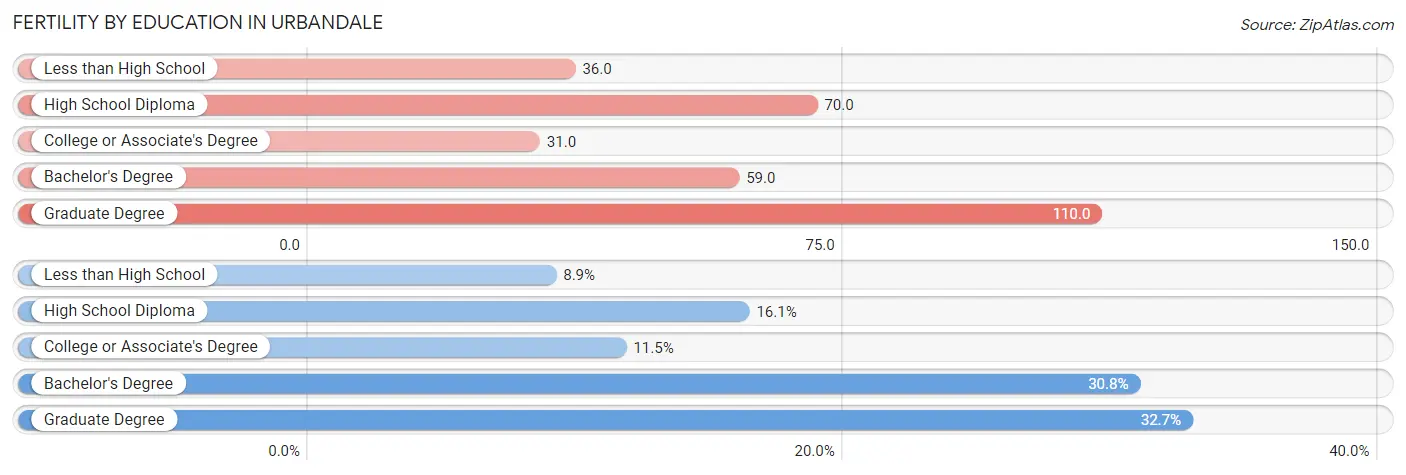
| Educational Attainment | Women with Births | Births / 1,000 Women |
| Less than High School | 54 (8.9%) | 36.0 |
| High School Diploma | 98 (16.1%) | 70.0 |
| College or Associate's Degree | 70 (11.5%) | 31.0 |
| Bachelor's Degree | 187 (30.8%) | 59.0 |
| Graduate Degree | 199 (32.7%) | 110.0 |
| Total | 608 (100.0%) | 60.0 |
Fertility by Education by Marriage Status in Urbandale
20.1% of women with births in Urbandale are unmarried. Women with the educational attainment of less than high school are most likely to be married with 100.0% of them married at childbirth, while women with the educational attainment of high school diploma are least likely to be married with 82.7% of them unmarried at childbirth.
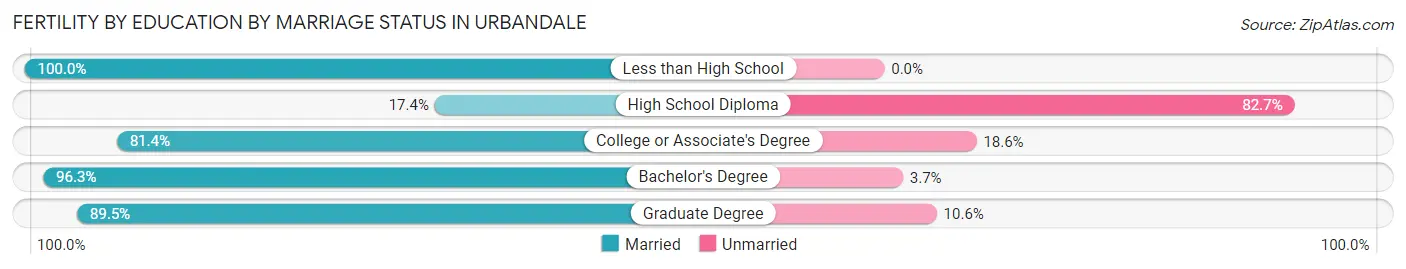
| Educational Attainment | Married | Unmarried |
| Less than High School | 54 (100.0%) | 0 (0.0%) |
| High School Diploma | 17 (17.3%) | 81 (82.7%) |
| College or Associate's Degree | 57 (81.4%) | 13 (18.6%) |
| Bachelor's Degree | 180 (96.3%) | 7 (3.7%) |
| Graduate Degree | 178 (89.4%) | 21 (10.5%) |
| Total | 486 (79.9%) | 122 (20.1%) |
Employment Characteristics in Urbandale
Employment by Class of Employer in Urbandale
Among the 24,192 employed individuals in Urbandale, private company employees (16,600 | 68.6%), not-for-profit organizations (2,173 | 9.0%), and local government employees (1,663 | 6.9%) make up the most common classes of employment.
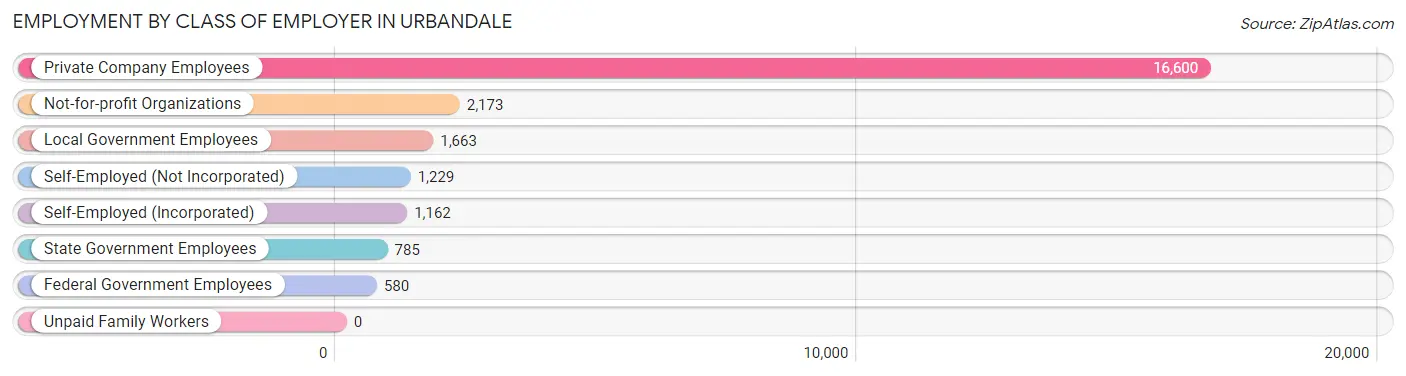
| Employer Class | # Employees | % Employees |
| Private Company Employees | 16,600 | 68.6% |
| Self-Employed (Incorporated) | 1,162 | 4.8% |
| Self-Employed (Not Incorporated) | 1,229 | 5.1% |
| Not-for-profit Organizations | 2,173 | 9.0% |
| Local Government Employees | 1,663 | 6.9% |
| State Government Employees | 785 | 3.2% |
| Federal Government Employees | 580 | 2.4% |
| Unpaid Family Workers | 0 | 0.0% |
| Total | 24,192 | 100.0% |
Employment Status by Age in Urbandale
According to the labor force statistics for Urbandale, out of the total population over 16 years of age (35,144), 70.9% or 24,917 individuals are in the labor force, with 2.1% or 523 of them unemployed. The age group with the highest labor force participation rate is 30 to 34 years, with 93.8% or 3,080 individuals in the labor force. Within the labor force, the 16 to 19 years age range has the highest percentage of unemployed individuals, with 7.8% or 83 of them being unemployed.
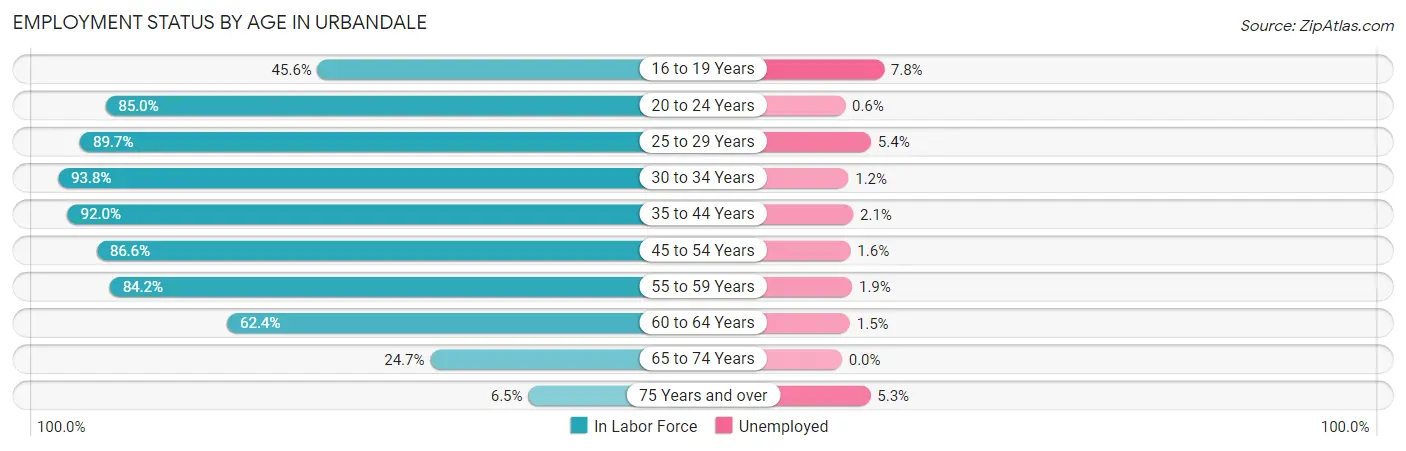
| Age Bracket | In Labor Force | Unemployed |
| 16 to 19 Years | 1,064 (45.6%) | 83 (7.8%) |
| 20 to 24 Years | 1,499 (85.0%) | 9 (0.6%) |
| 25 to 29 Years | 1,907 (89.7%) | 103 (5.4%) |
| 30 to 34 Years | 3,080 (93.8%) | 37 (1.2%) |
| 35 to 44 Years | 6,380 (92.0%) | 134 (2.1%) |
| 45 to 54 Years | 5,353 (86.6%) | 86 (1.6%) |
| 55 to 59 Years | 2,571 (84.2%) | 49 (1.9%) |
| 60 to 64 Years | 1,880 (62.4%) | 28 (1.5%) |
| 65 to 74 Years | 1,025 (24.7%) | 0 (0.0%) |
| 75 Years and over | 150 (6.5%) | 8 (5.3%) |
| Total | 24,917 (70.9%) | 523 (2.1%) |
Employment Status by Educational Attainment in Urbandale
According to labor force statistics for Urbandale, 86.1% of individuals (21,174) out of the total population between 25 and 64 years of age (24,592) are in the labor force, with 2.1% or 445 of them being unemployed. The group with the highest labor force participation rate are those with the educational attainment of bachelor's degree or higher, with 88.7% or 11,780 individuals in the labor force. Within the labor force, individuals with less than high school education have the highest percentage of unemployment, with 6.6% or 57 of them being unemployed.
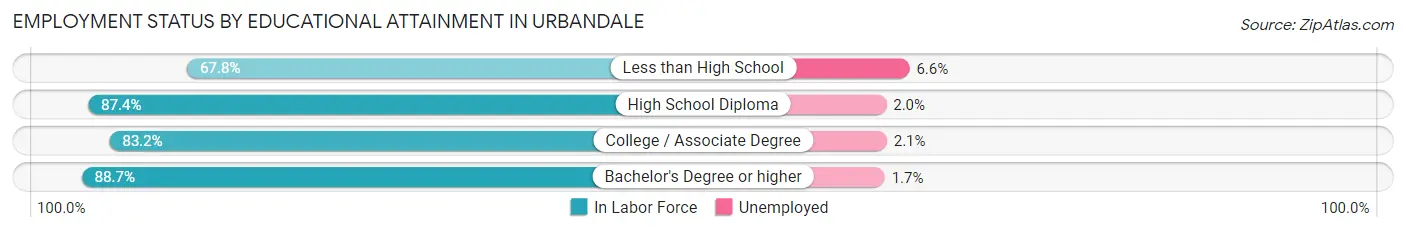
| Educational Attainment | In Labor Force | Unemployed |
| Less than High School | 858 (67.8%) | 84 (6.6%) |
| High School Diploma | 3,621 (87.4%) | 83 (2.0%) |
| College / Associate Degree | 4,910 (83.2%) | 124 (2.1%) |
| Bachelor's Degree or higher | 11,780 (88.7%) | 226 (1.7%) |
| Total | 21,174 (86.1%) | 516 (2.1%) |
Employment Occupations by Sex in Urbandale
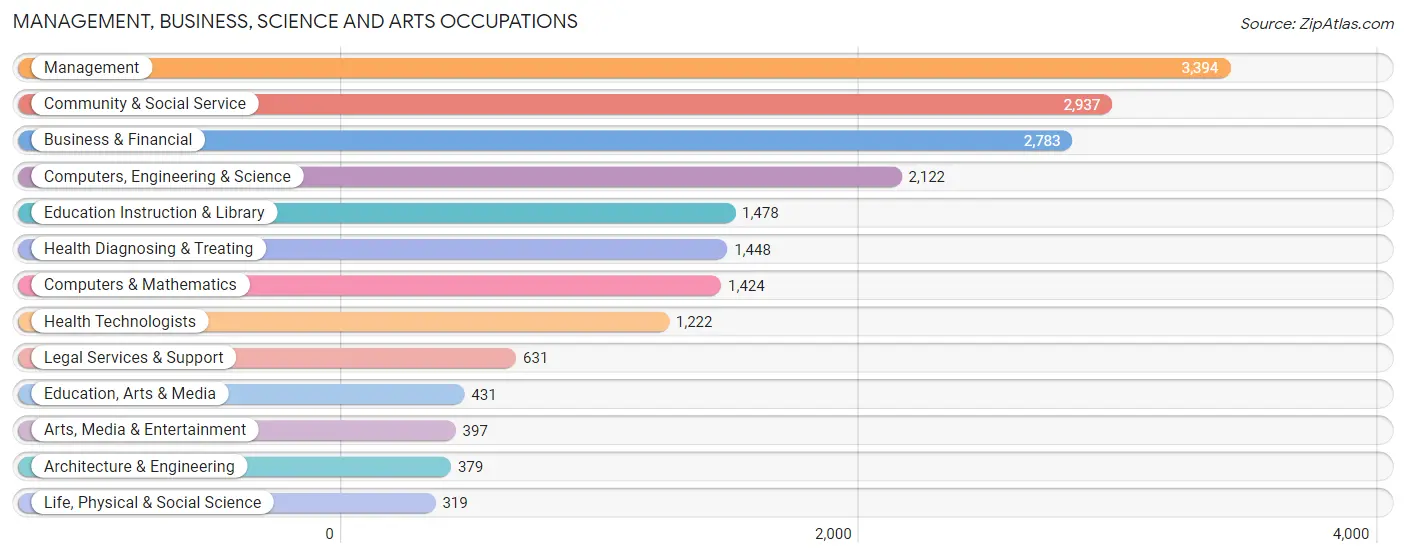
Management, Business, Science and Arts Occupations
The most common Management, Business, Science and Arts occupations in Urbandale are Management (3,394 | 14.0%), Community & Social Service (2,937 | 12.1%), Business & Financial (2,783 | 11.5%), Computers, Engineering & Science (2,122 | 8.8%), and Education Instruction & Library (1,478 | 6.1%).
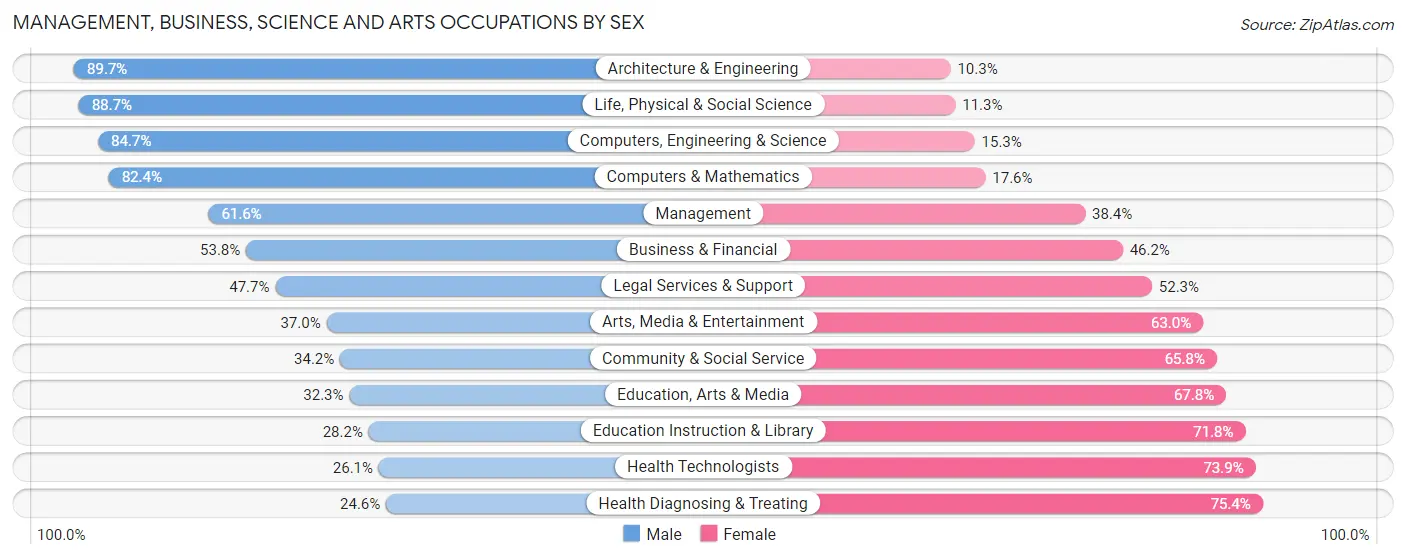
Management, Business, Science and Arts Occupations by Sex
Within the Management, Business, Science and Arts occupations in Urbandale, the most male-oriented occupations are Architecture & Engineering (89.7%), Life, Physical & Social Science (88.7%), and Computers, Engineering & Science (84.7%), while the most female-oriented occupations are Health Diagnosing & Treating (75.4%), Health Technologists (73.9%), and Education Instruction & Library (71.8%).
| Occupation | Male | Female |
| Management | 2,092 (61.6%) | 1,302 (38.4%) |
| Business & Financial | 1,497 (53.8%) | 1,286 (46.2%) |
| Computers, Engineering & Science | 1,797 (84.7%) | 325 (15.3%) |
| Computers & Mathematics | 1,174 (82.4%) | 250 (17.6%) |
| Architecture & Engineering | 340 (89.7%) | 39 (10.3%) |
| Life, Physical & Social Science | 283 (88.7%) | 36 (11.3%) |
| Community & Social Service | 1,004 (34.2%) | 1,933 (65.8%) |
| Education, Arts & Media | 139 (32.3%) | 292 (67.7%) |
| Legal Services & Support | 301 (47.7%) | 330 (52.3%) |
| Education Instruction & Library | 417 (28.2%) | 1,061 (71.8%) |
| Arts, Media & Entertainment | 147 (37.0%) | 250 (63.0%) |
| Health Diagnosing & Treating | 356 (24.6%) | 1,092 (75.4%) |
| Health Technologists | 319 (26.1%) | 903 (73.9%) |
| Total (Category) | 6,746 (53.2%) | 5,938 (46.8%) |
| Total (Overall) | 13,309 (55.0%) | 10,898 (45.0%) |
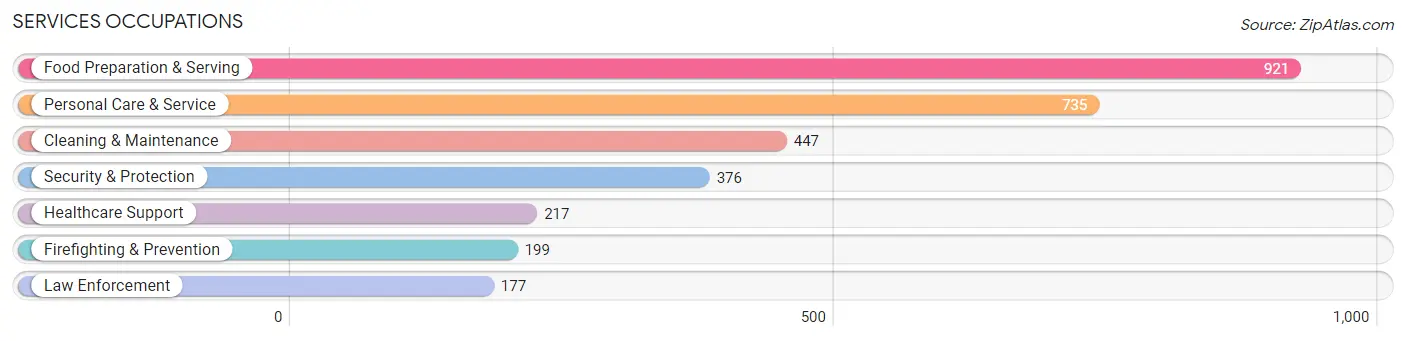
Services Occupations
The most common Services occupations in Urbandale are Food Preparation & Serving (921 | 3.8%), Personal Care & Service (735 | 3.0%), Cleaning & Maintenance (447 | 1.8%), Security & Protection (376 | 1.5%), and Healthcare Support (217 | 0.9%).
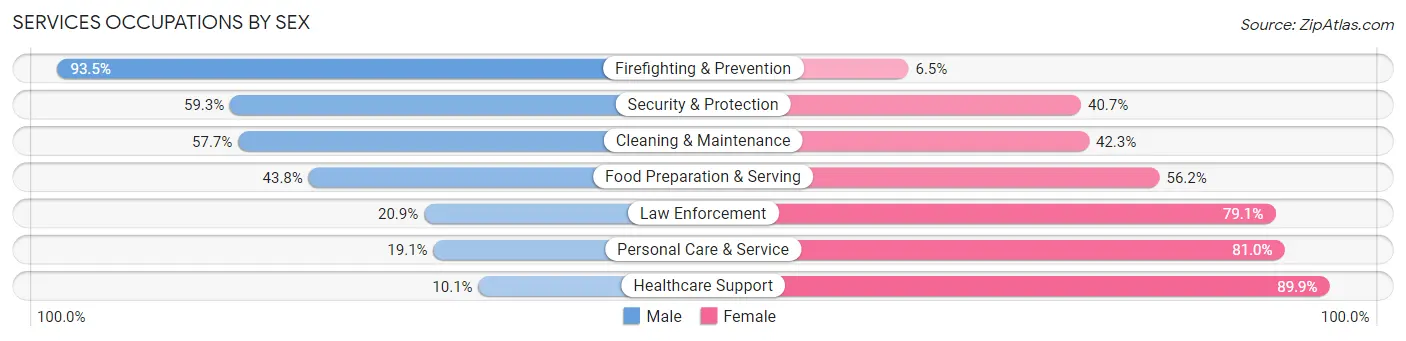
Services Occupations by Sex
Within the Services occupations in Urbandale, the most male-oriented occupations are Firefighting & Prevention (93.5%), Security & Protection (59.3%), and Cleaning & Maintenance (57.7%), while the most female-oriented occupations are Healthcare Support (89.9%), Personal Care & Service (80.9%), and Law Enforcement (79.1%).
| Occupation | Male | Female |
| Healthcare Support | 22 (10.1%) | 195 (89.9%) |
| Security & Protection | 223 (59.3%) | 153 (40.7%) |
| Firefighting & Prevention | 186 (93.5%) | 13 (6.5%) |
| Law Enforcement | 37 (20.9%) | 140 (79.1%) |
| Food Preparation & Serving | 403 (43.8%) | 518 (56.2%) |
| Cleaning & Maintenance | 258 (57.7%) | 189 (42.3%) |
| Personal Care & Service | 140 (19.1%) | 595 (80.9%) |
| Total (Category) | 1,046 (38.8%) | 1,650 (61.2%) |
| Total (Overall) | 13,309 (55.0%) | 10,898 (45.0%) |
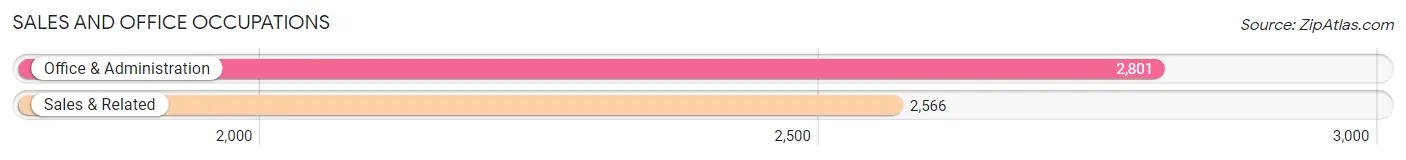
Sales and Office Occupations
The most common Sales and Office occupations in Urbandale are Office & Administration (2,801 | 11.6%), and Sales & Related (2,566 | 10.6%).
Sales and Office Occupations by Sex
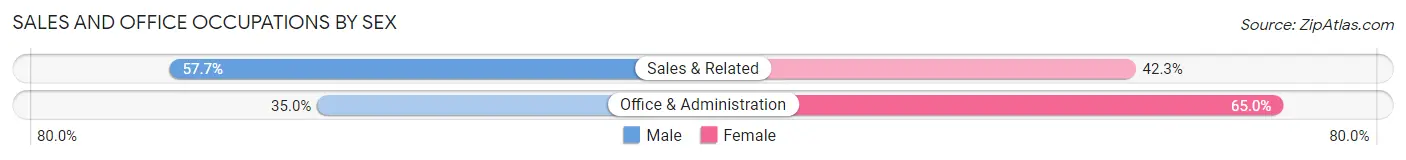
| Occupation | Male | Female |
| Sales & Related | 1,480 (57.7%) | 1,086 (42.3%) |
| Office & Administration | 980 (35.0%) | 1,821 (65.0%) |
| Total (Category) | 2,460 (45.8%) | 2,907 (54.2%) |
| Total (Overall) | 13,309 (55.0%) | 10,898 (45.0%) |
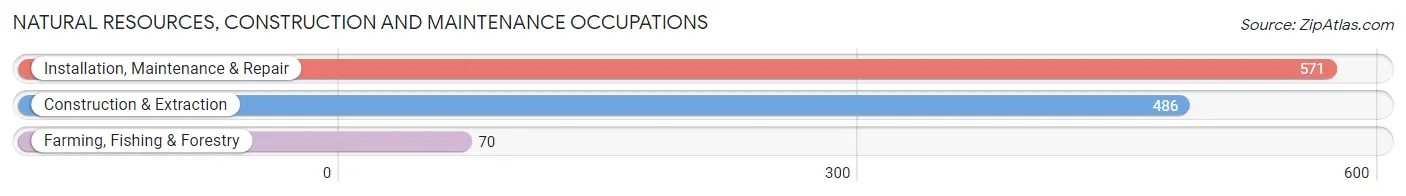
Natural Resources, Construction and Maintenance Occupations
The most common Natural Resources, Construction and Maintenance occupations in Urbandale are Installation, Maintenance & Repair (571 | 2.4%), Construction & Extraction (486 | 2.0%), and Farming, Fishing & Forestry (70 | 0.3%).
Natural Resources, Construction and Maintenance Occupations by Sex
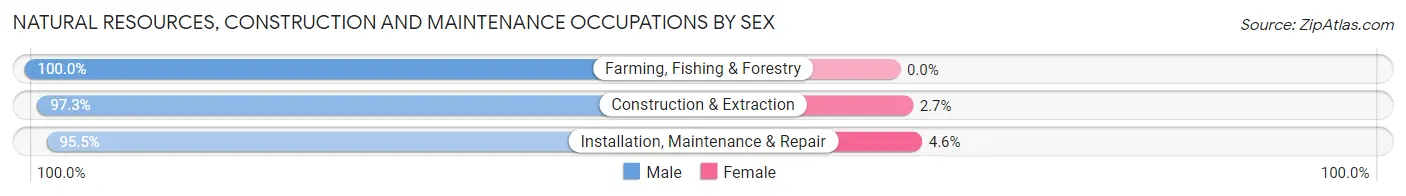
| Occupation | Male | Female |
| Farming, Fishing & Forestry | 70 (100.0%) | 0 (0.0%) |
| Construction & Extraction | 473 (97.3%) | 13 (2.7%) |
| Installation, Maintenance & Repair | 545 (95.5%) | 26 (4.5%) |
| Total (Category) | 1,088 (96.5%) | 39 (3.5%) |
| Total (Overall) | 13,309 (55.0%) | 10,898 (45.0%) |
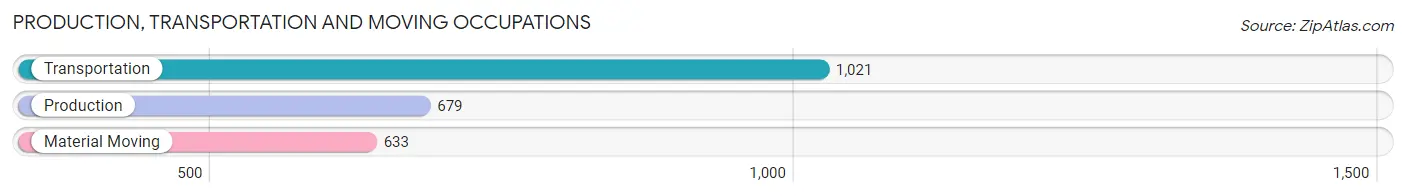
Production, Transportation and Moving Occupations
The most common Production, Transportation and Moving occupations in Urbandale are Transportation (1,021 | 4.2%), Production (679 | 2.8%), and Material Moving (633 | 2.6%).
Production, Transportation and Moving Occupations by Sex
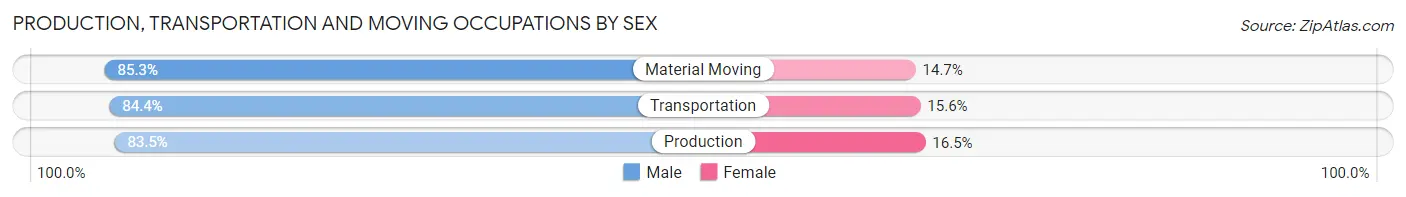
| Occupation | Male | Female |
| Production | 567 (83.5%) | 112 (16.5%) |
| Transportation | 862 (84.4%) | 159 (15.6%) |
| Material Moving | 540 (85.3%) | 93 (14.7%) |
| Total (Category) | 1,969 (84.4%) | 364 (15.6%) |
| Total (Overall) | 13,309 (55.0%) | 10,898 (45.0%) |
Employment Industries by Sex in Urbandale
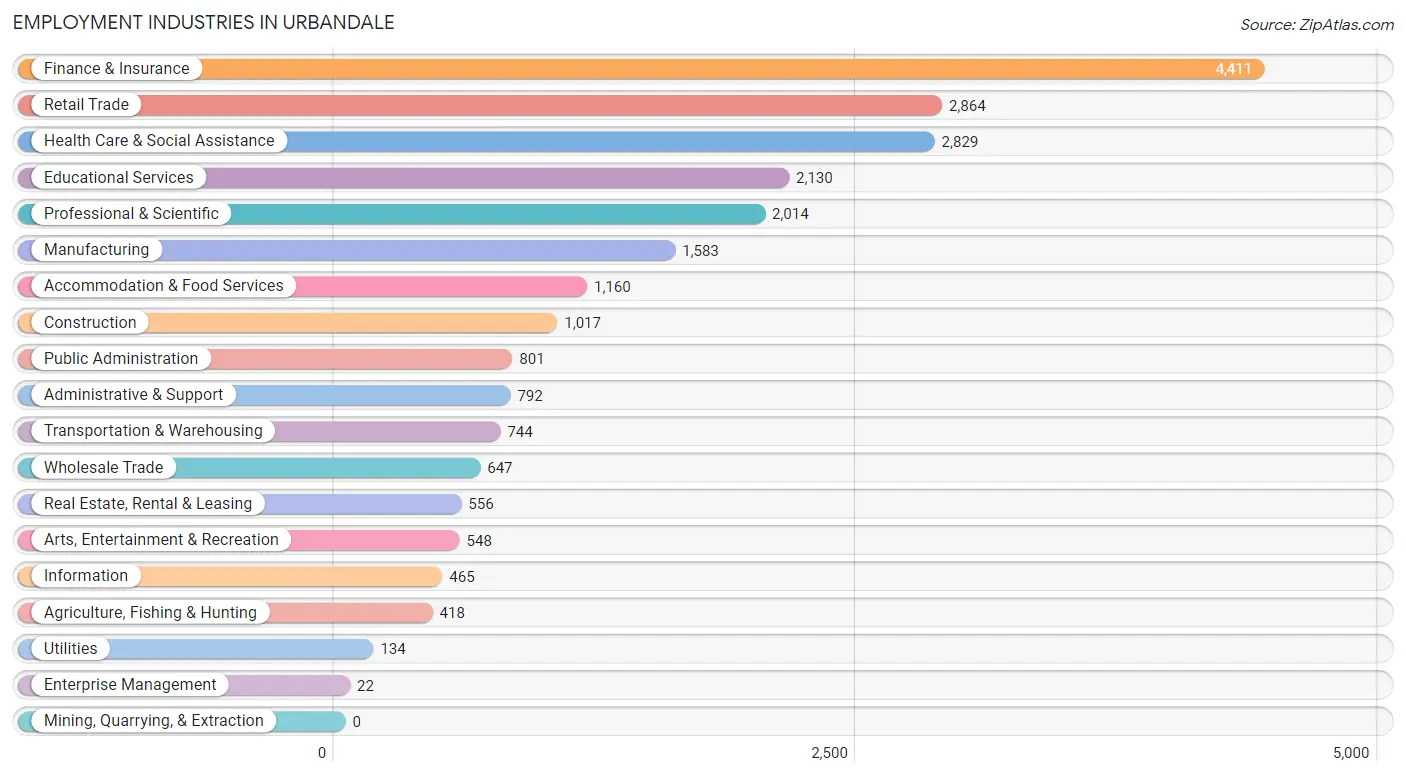
Employment Industries in Urbandale
The major employment industries in Urbandale include Finance & Insurance (4,411 | 18.2%), Retail Trade (2,864 | 11.8%), Health Care & Social Assistance (2,829 | 11.7%), Educational Services (2,130 | 8.8%), and Professional & Scientific (2,014 | 8.3%).
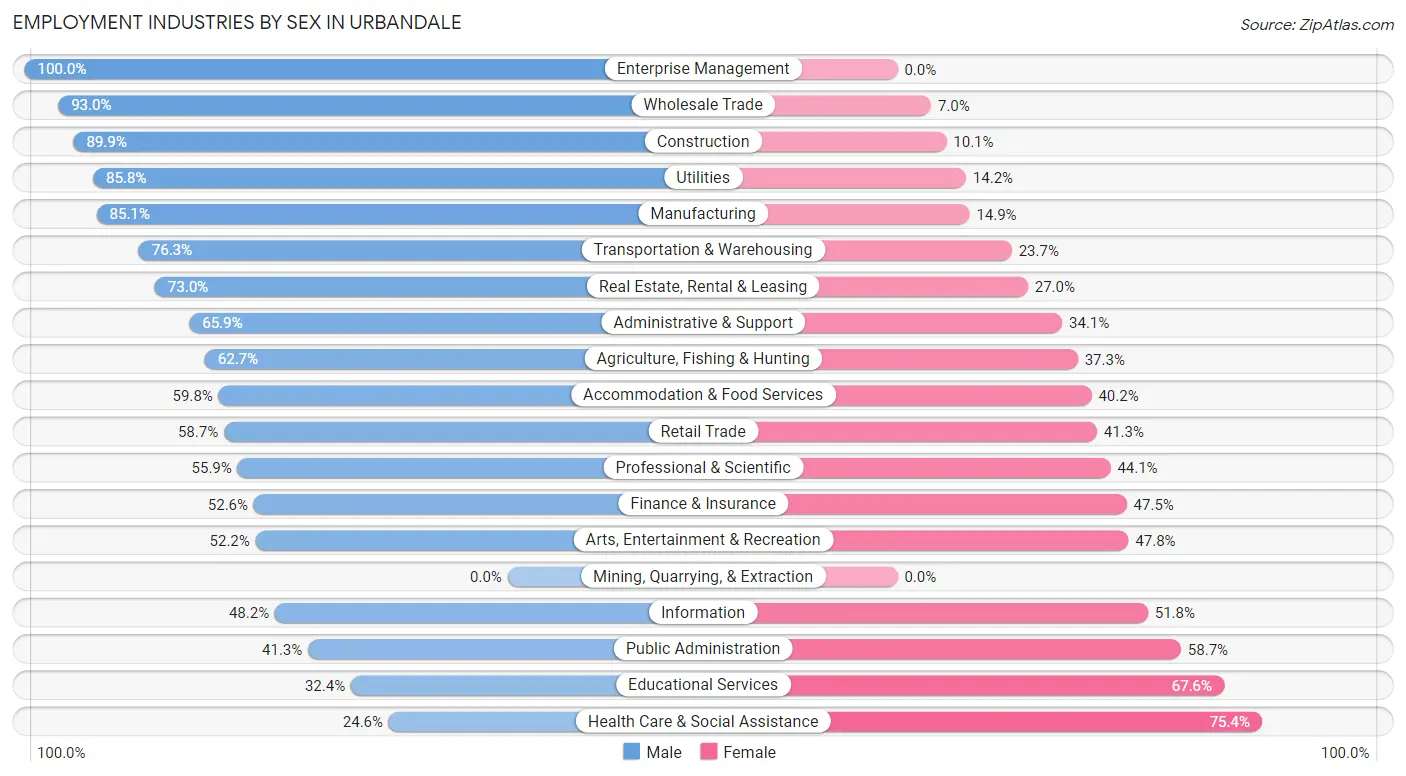
Employment Industries by Sex in Urbandale
The Urbandale industries that see more men than women are Enterprise Management (100.0%), Wholesale Trade (93.0%), and Construction (89.9%), whereas the industries that tend to have a higher number of women are Health Care & Social Assistance (75.4%), Educational Services (67.6%), and Public Administration (58.7%).
| Industry | Male | Female |
| Agriculture, Fishing & Hunting | 262 (62.7%) | 156 (37.3%) |
| Mining, Quarrying, & Extraction | 0 (0.0%) | 0 (0.0%) |
| Construction | 914 (89.9%) | 103 (10.1%) |
| Manufacturing | 1,347 (85.1%) | 236 (14.9%) |
| Wholesale Trade | 602 (93.0%) | 45 (7.0%) |
| Retail Trade | 1,682 (58.7%) | 1,182 (41.3%) |
| Transportation & Warehousing | 568 (76.3%) | 176 (23.7%) |
| Utilities | 115 (85.8%) | 19 (14.2%) |
| Information | 224 (48.2%) | 241 (51.8%) |
| Finance & Insurance | 2,318 (52.5%) | 2,093 (47.4%) |
| Real Estate, Rental & Leasing | 406 (73.0%) | 150 (27.0%) |
| Professional & Scientific | 1,126 (55.9%) | 888 (44.1%) |
| Enterprise Management | 22 (100.0%) | 0 (0.0%) |
| Administrative & Support | 522 (65.9%) | 270 (34.1%) |
| Educational Services | 691 (32.4%) | 1,439 (67.6%) |
| Health Care & Social Assistance | 696 (24.6%) | 2,133 (75.4%) |
| Arts, Entertainment & Recreation | 286 (52.2%) | 262 (47.8%) |
| Accommodation & Food Services | 694 (59.8%) | 466 (40.2%) |
| Public Administration | 331 (41.3%) | 470 (58.7%) |
| Total | 13,309 (55.0%) | 10,898 (45.0%) |
Education in Urbandale
School Enrollment in Urbandale
The most common levels of schooling among the 11,637 students in Urbandale are high school (2,915 | 25.1%), elementary school (2,729 | 23.4%), and middle school (2,574 | 22.1%).
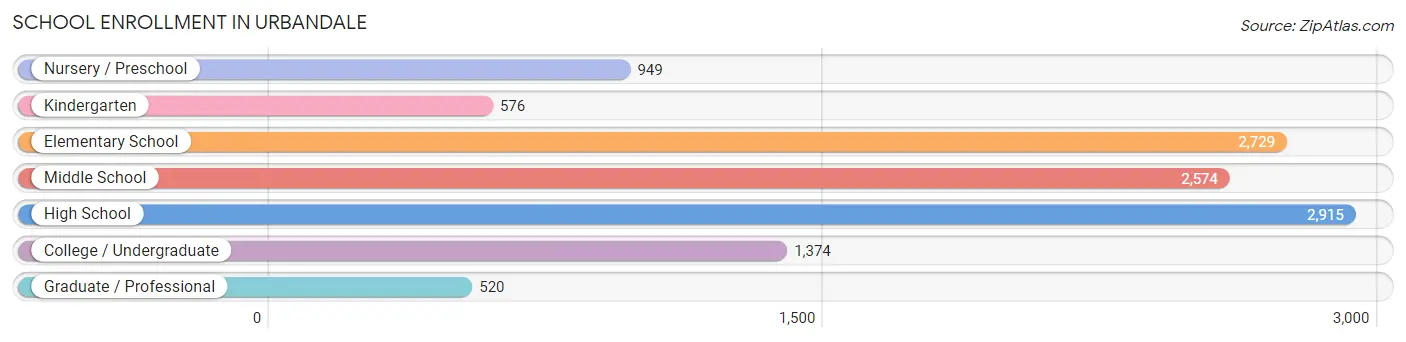
| School Level | # Students | % Students |
| Nursery / Preschool | 949 | 8.2% |
| Kindergarten | 576 | 5.0% |
| Elementary School | 2,729 | 23.4% |
| Middle School | 2,574 | 22.1% |
| High School | 2,915 | 25.1% |
| College / Undergraduate | 1,374 | 11.8% |
| Graduate / Professional | 520 | 4.5% |
| Total | 11,637 | 100.0% |
School Enrollment by Age by Funding Source in Urbandale
Out of a total of 11,637 students who are enrolled in schools in Urbandale, 1,932 (16.6%) attend a private institution, while the remaining 9,705 (83.4%) are enrolled in public schools. The age group of 3 to 4 year olds has the highest likelihood of being enrolled in private schools, with 267 (49.5% in the age bracket) enrolled. Conversely, the age group of 20 to 24 year olds has the lowest likelihood of being enrolled in a private school, with 676 (89.8% in the age bracket) attending a public institution.
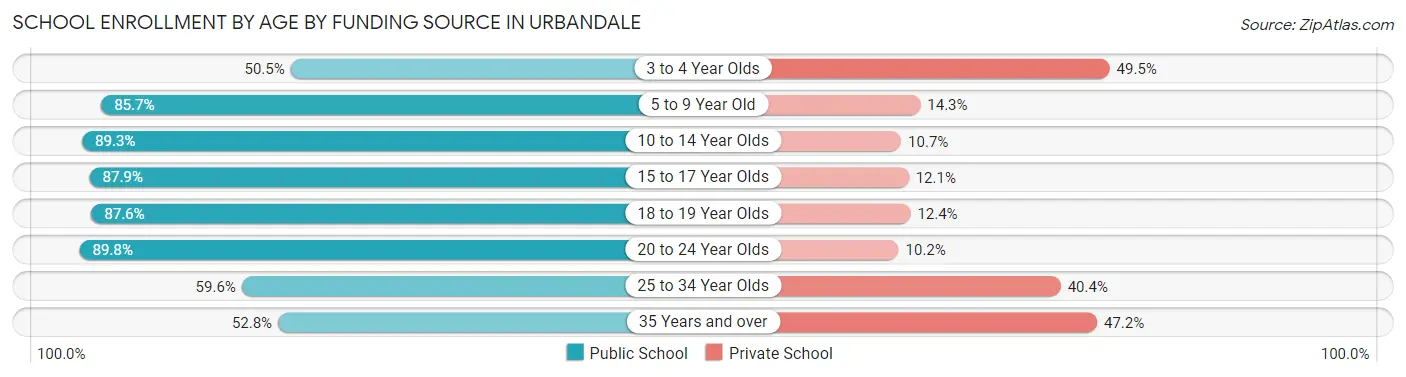
| Age Bracket | Public School | Private School |
| 3 to 4 Year Olds | 272 (50.5%) | 267 (49.5%) |
| 5 to 9 Year Old | 2,869 (85.7%) | 478 (14.3%) |
| 10 to 14 Year Olds | 2,901 (89.3%) | 348 (10.7%) |
| 15 to 17 Year Olds | 1,885 (87.9%) | 260 (12.1%) |
| 18 to 19 Year Olds | 556 (87.6%) | 79 (12.4%) |
| 20 to 24 Year Olds | 676 (89.8%) | 77 (10.2%) |
| 25 to 34 Year Olds | 302 (59.6%) | 205 (40.4%) |
| 35 Years and over | 244 (52.8%) | 218 (47.2%) |
| Total | 9,705 (83.4%) | 1,932 (16.6%) |
Educational Attainment by Field of Study in Urbandale
Business (4,852 | 26.7%), education (2,493 | 13.7%), bio, nature & agricultural (1,498 | 8.3%), science & technology (1,314 | 7.2%), and communications (1,176 | 6.5%) are the most common fields of study among 18,153 individuals in Urbandale who have obtained a bachelor's degree or higher.
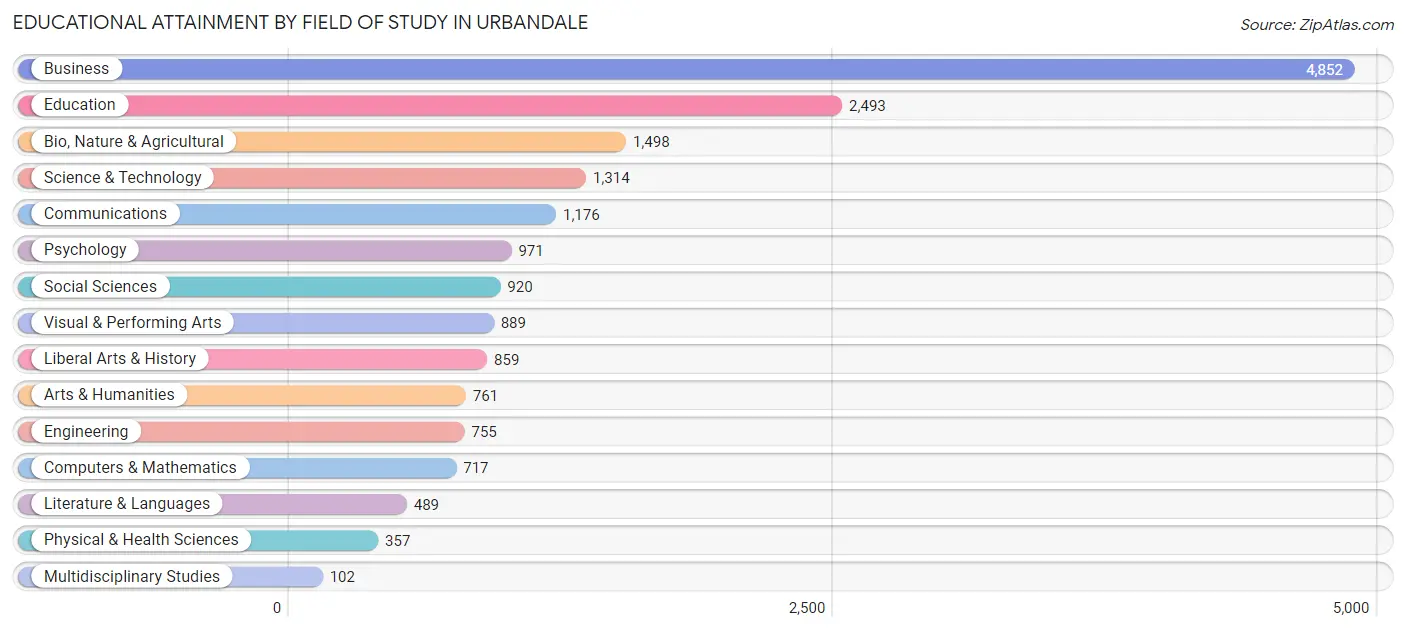
| Field of Study | # Graduates | % Graduates |
| Computers & Mathematics | 717 | 4.0% |
| Bio, Nature & Agricultural | 1,498 | 8.3% |
| Physical & Health Sciences | 357 | 2.0% |
| Psychology | 971 | 5.3% |
| Social Sciences | 920 | 5.1% |
| Engineering | 755 | 4.2% |
| Multidisciplinary Studies | 102 | 0.6% |
| Science & Technology | 1,314 | 7.2% |
| Business | 4,852 | 26.7% |
| Education | 2,493 | 13.7% |
| Literature & Languages | 489 | 2.7% |
| Liberal Arts & History | 859 | 4.7% |
| Visual & Performing Arts | 889 | 4.9% |
| Communications | 1,176 | 6.5% |
| Arts & Humanities | 761 | 4.2% |
| Total | 18,153 | 100.0% |
Transportation & Commute in Urbandale
Vehicle Availability by Sex in Urbandale
The most prevalent vehicle ownership categories in Urbandale are males with 2 vehicles (6,986, accounting for 52.2%) and females with 2 vehicles (5,491, making up 64.7%).
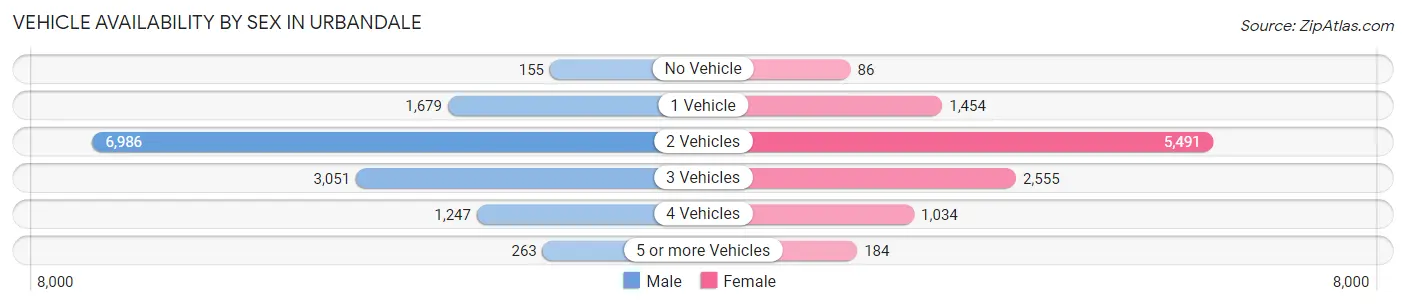
| Vehicles Available | Male | Female |
| No Vehicle | 155 (1.2%) | 86 (0.8%) |
| 1 Vehicle | 1,679 (12.6%) | 1,454 (13.5%) |
| 2 Vehicles | 6,986 (52.2%) | 5,491 (50.8%) |
| 3 Vehicles | 3,051 (22.8%) | 2,555 (23.6%) |
| 4 Vehicles | 1,247 (9.3%) | 1,034 (9.6%) |
| 5 or more Vehicles | 263 (2.0%) | 184 (1.7%) |
| Total | 13,381 (100.0%) | 10,804 (100.0%) |
Commute Time in Urbandale
The most frequently occuring commute durations in Urbandale are 15 to 19 minutes (5,110 commuters, 24.7%), 20 to 24 minutes (4,556 commuters, 22.0%), and 10 to 14 minutes (3,737 commuters, 18.1%).
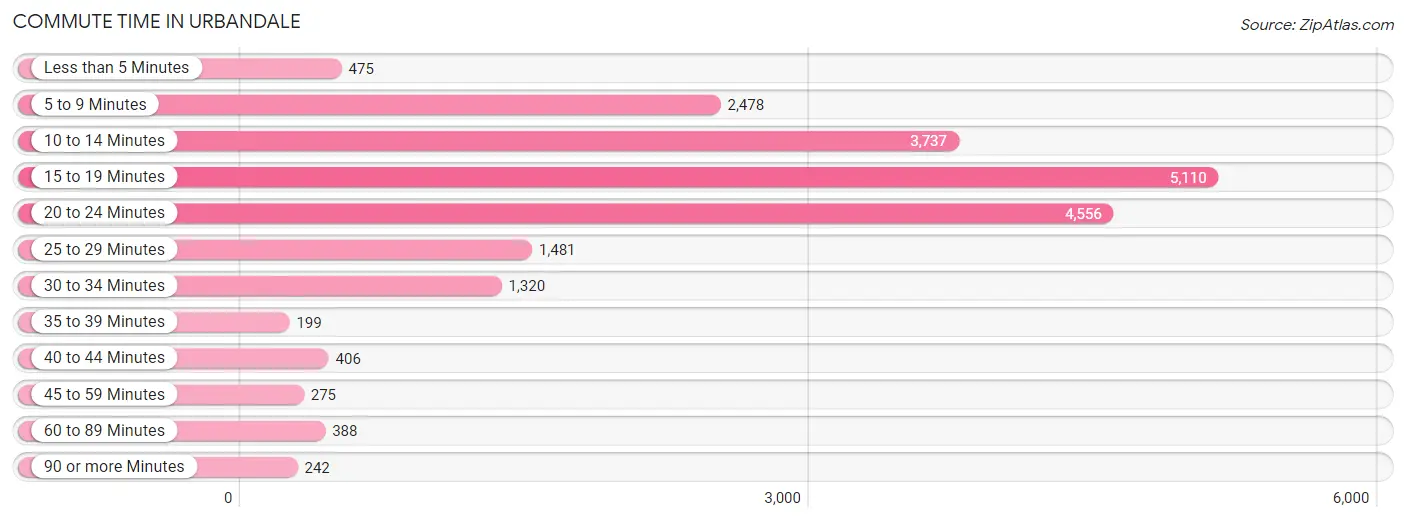
| Commute Time | # Commuters | % Commuters |
| Less than 5 Minutes | 475 | 2.3% |
| 5 to 9 Minutes | 2,478 | 12.0% |
| 10 to 14 Minutes | 3,737 | 18.1% |
| 15 to 19 Minutes | 5,110 | 24.7% |
| 20 to 24 Minutes | 4,556 | 22.0% |
| 25 to 29 Minutes | 1,481 | 7.2% |
| 30 to 34 Minutes | 1,320 | 6.4% |
| 35 to 39 Minutes | 199 | 1.0% |
| 40 to 44 Minutes | 406 | 2.0% |
| 45 to 59 Minutes | 275 | 1.3% |
| 60 to 89 Minutes | 388 | 1.9% |
| 90 or more Minutes | 242 | 1.2% |
Commute Time by Sex in Urbandale
The most common commute times in Urbandale are 15 to 19 minutes (2,887 commuters, 25.3%) for males and 15 to 19 minutes (2,223 commuters, 24.0%) for females.
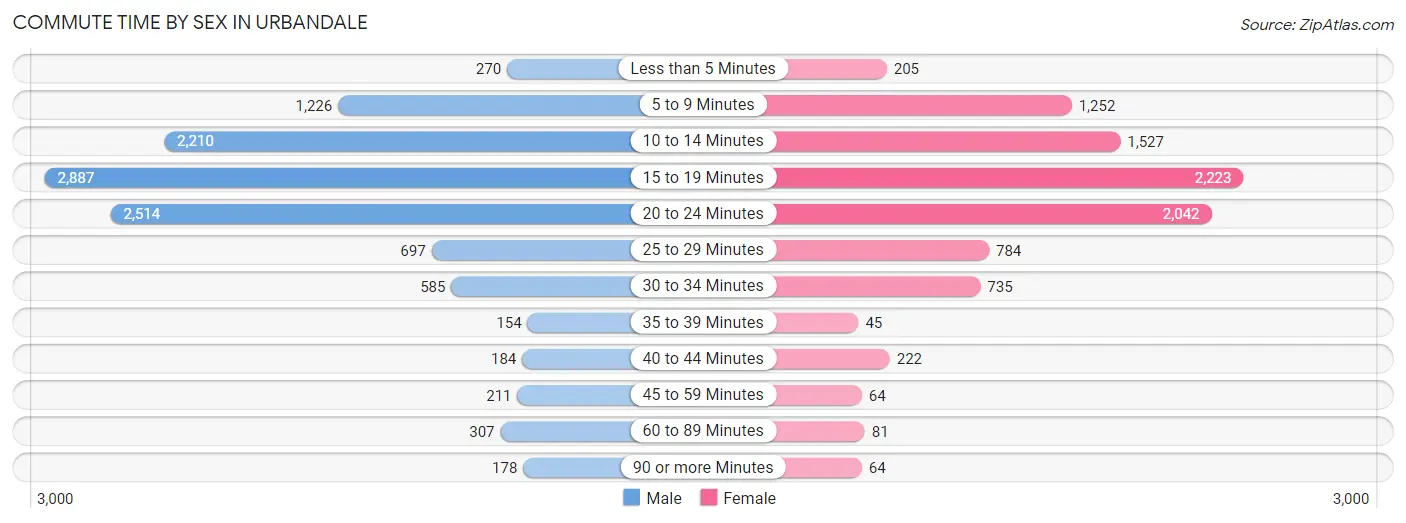
| Commute Time | Male | Female |
| Less than 5 Minutes | 270 (2.4%) | 205 (2.2%) |
| 5 to 9 Minutes | 1,226 (10.7%) | 1,252 (13.5%) |
| 10 to 14 Minutes | 2,210 (19.4%) | 1,527 (16.5%) |
| 15 to 19 Minutes | 2,887 (25.3%) | 2,223 (24.0%) |
| 20 to 24 Minutes | 2,514 (22.0%) | 2,042 (22.1%) |
| 25 to 29 Minutes | 697 (6.1%) | 784 (8.5%) |
| 30 to 34 Minutes | 585 (5.1%) | 735 (8.0%) |
| 35 to 39 Minutes | 154 (1.3%) | 45 (0.5%) |
| 40 to 44 Minutes | 184 (1.6%) | 222 (2.4%) |
| 45 to 59 Minutes | 211 (1.8%) | 64 (0.7%) |
| 60 to 89 Minutes | 307 (2.7%) | 81 (0.9%) |
| 90 or more Minutes | 178 (1.6%) | 64 (0.7%) |
Time of Departure to Work by Sex in Urbandale
The most frequent times of departure to work in Urbandale are 7:30 AM to 7:59 AM (2,139, 18.7%) for males and 7:30 AM to 7:59 AM (2,112, 22.9%) for females.
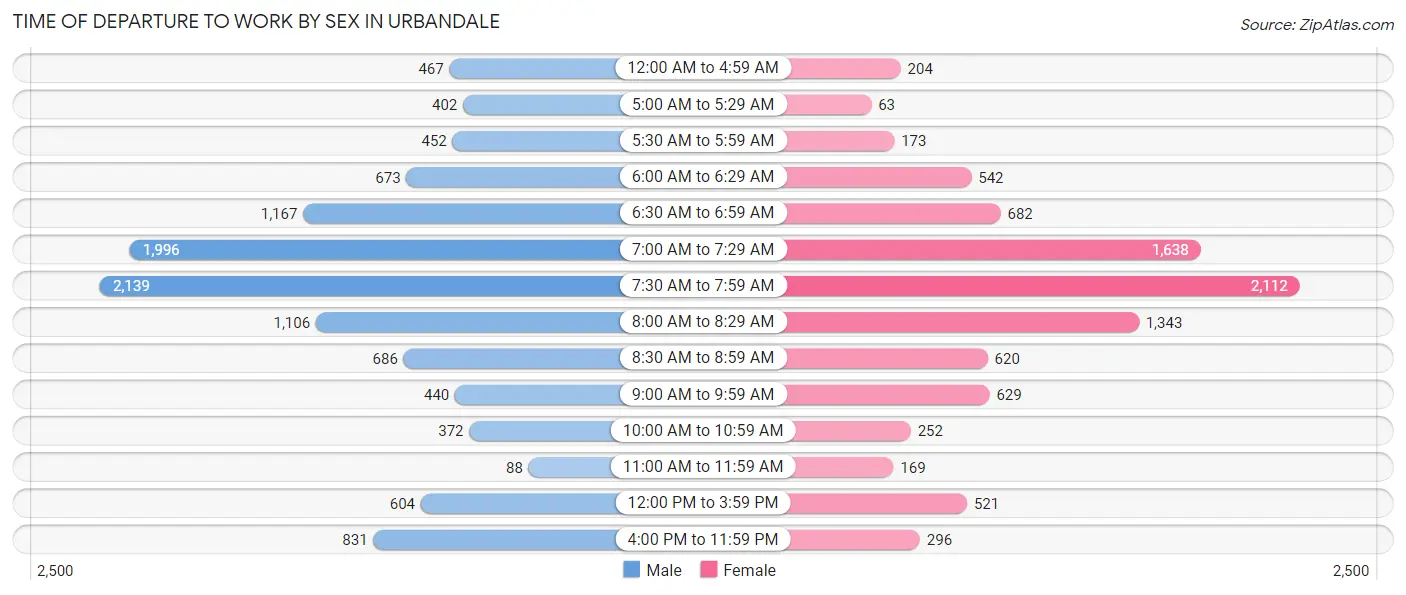
| Time of Departure | Male | Female |
| 12:00 AM to 4:59 AM | 467 (4.1%) | 204 (2.2%) |
| 5:00 AM to 5:29 AM | 402 (3.5%) | 63 (0.7%) |
| 5:30 AM to 5:59 AM | 452 (4.0%) | 173 (1.9%) |
| 6:00 AM to 6:29 AM | 673 (5.9%) | 542 (5.9%) |
| 6:30 AM to 6:59 AM | 1,167 (10.2%) | 682 (7.4%) |
| 7:00 AM to 7:29 AM | 1,996 (17.5%) | 1,638 (17.7%) |
| 7:30 AM to 7:59 AM | 2,139 (18.7%) | 2,112 (22.9%) |
| 8:00 AM to 8:29 AM | 1,106 (9.7%) | 1,343 (14.5%) |
| 8:30 AM to 8:59 AM | 686 (6.0%) | 620 (6.7%) |
| 9:00 AM to 9:59 AM | 440 (3.8%) | 629 (6.8%) |
| 10:00 AM to 10:59 AM | 372 (3.3%) | 252 (2.7%) |
| 11:00 AM to 11:59 AM | 88 (0.8%) | 169 (1.8%) |
| 12:00 PM to 3:59 PM | 604 (5.3%) | 521 (5.6%) |
| 4:00 PM to 11:59 PM | 831 (7.3%) | 296 (3.2%) |
| Total | 11,423 (100.0%) | 9,244 (100.0%) |
Housing Occupancy in Urbandale
Occupancy by Ownership in Urbandale
Of the total 17,163 dwellings in Urbandale, owner-occupied units account for 13,479 (78.5%), while renter-occupied units make up 3,684 (21.5%).
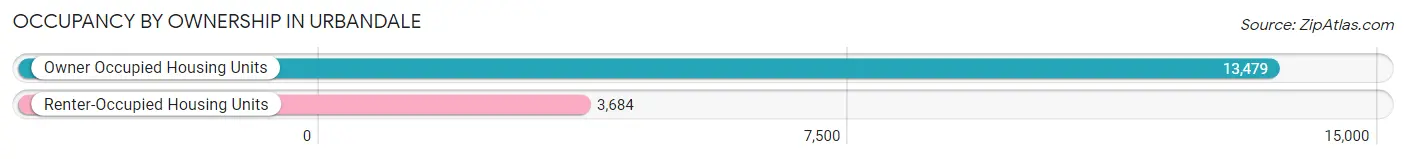
| Occupancy | # Housing Units | % Housing Units |
| Owner Occupied Housing Units | 13,479 | 78.5% |
| Renter-Occupied Housing Units | 3,684 | 21.5% |
| Total Occupied Housing Units | 17,163 | 100.0% |
Occupancy by Household Size in Urbandale
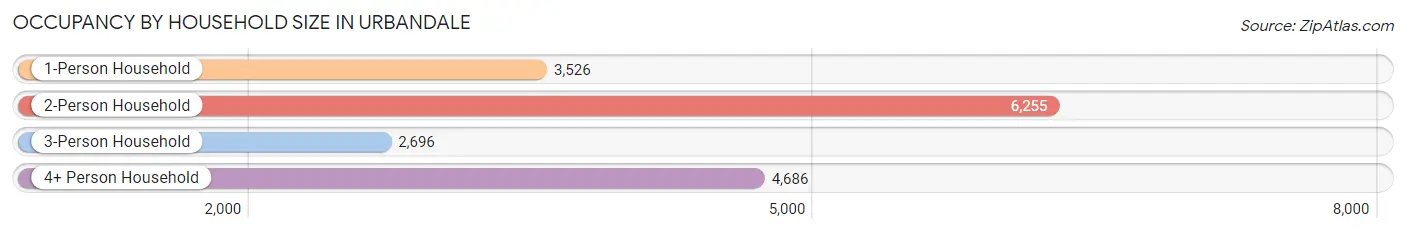
| Household Size | # Housing Units | % Housing Units |
| 1-Person Household | 3,526 | 20.5% |
| 2-Person Household | 6,255 | 36.4% |
| 3-Person Household | 2,696 | 15.7% |
| 4+ Person Household | 4,686 | 27.3% |
| Total Housing Units | 17,163 | 100.0% |
Occupancy by Ownership by Household Size in Urbandale
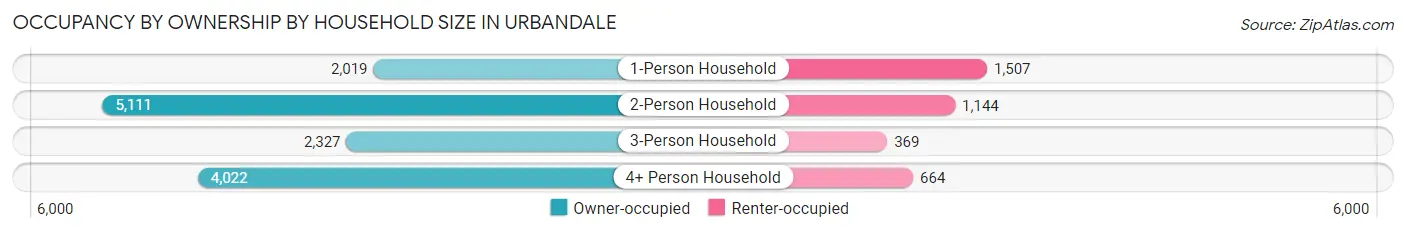
| Household Size | Owner-occupied | Renter-occupied |
| 1-Person Household | 2,019 (57.3%) | 1,507 (42.7%) |
| 2-Person Household | 5,111 (81.7%) | 1,144 (18.3%) |
| 3-Person Household | 2,327 (86.3%) | 369 (13.7%) |
| 4+ Person Household | 4,022 (85.8%) | 664 (14.2%) |
| Total Housing Units | 13,479 (78.5%) | 3,684 (21.5%) |
Occupancy by Educational Attainment in Urbandale
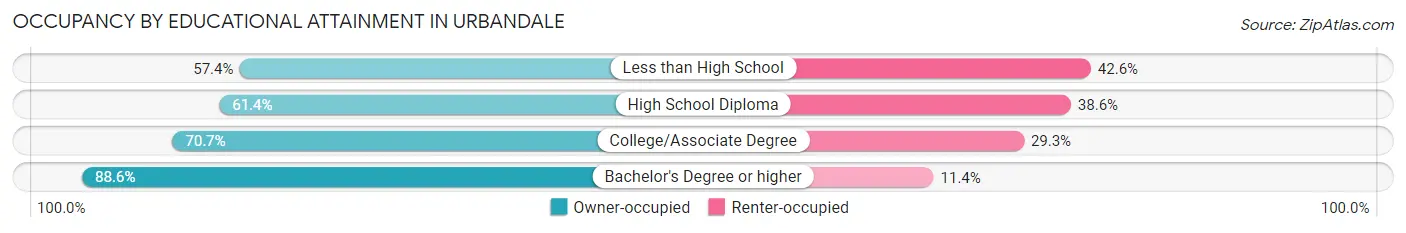
| Household Size | Owner-occupied | Renter-occupied |
| Less than High School | 394 (57.4%) | 292 (42.6%) |
| High School Diploma | 1,714 (61.4%) | 1,078 (38.6%) |
| College/Associate Degree | 2,980 (70.7%) | 1,235 (29.3%) |
| Bachelor's Degree or higher | 8,391 (88.6%) | 1,079 (11.4%) |
Occupancy by Age of Householder in Urbandale
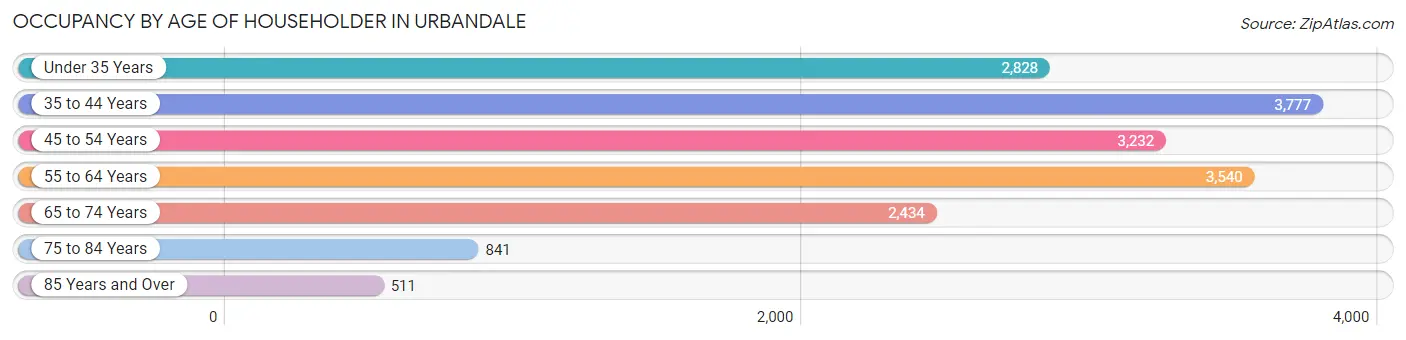
| Age Bracket | # Households | % Households |
| Under 35 Years | 2,828 | 16.5% |
| 35 to 44 Years | 3,777 | 22.0% |
| 45 to 54 Years | 3,232 | 18.8% |
| 55 to 64 Years | 3,540 | 20.6% |
| 65 to 74 Years | 2,434 | 14.2% |
| 75 to 84 Years | 841 | 4.9% |
| 85 Years and Over | 511 | 3.0% |
| Total | 17,163 | 100.0% |
Housing Finances in Urbandale
Median Income by Occupancy in Urbandale
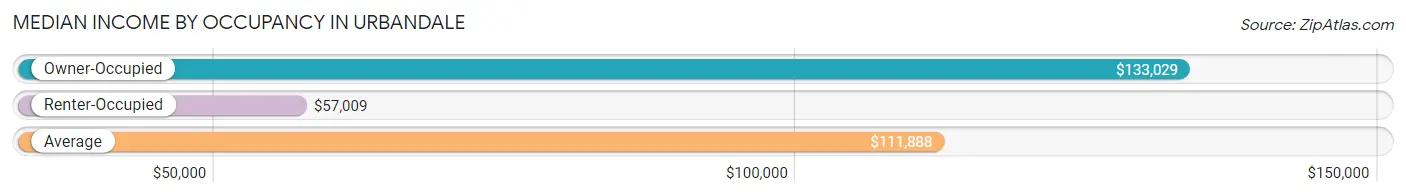
| Occupancy Type | # Households | Median Income |
| Owner-Occupied | 13,479 (78.5%) | $133,029 |
| Renter-Occupied | 3,684 (21.5%) | $57,009 |
| Average | 17,163 (100.0%) | $111,888 |
Occupancy by Householder Income Bracket in Urbandale
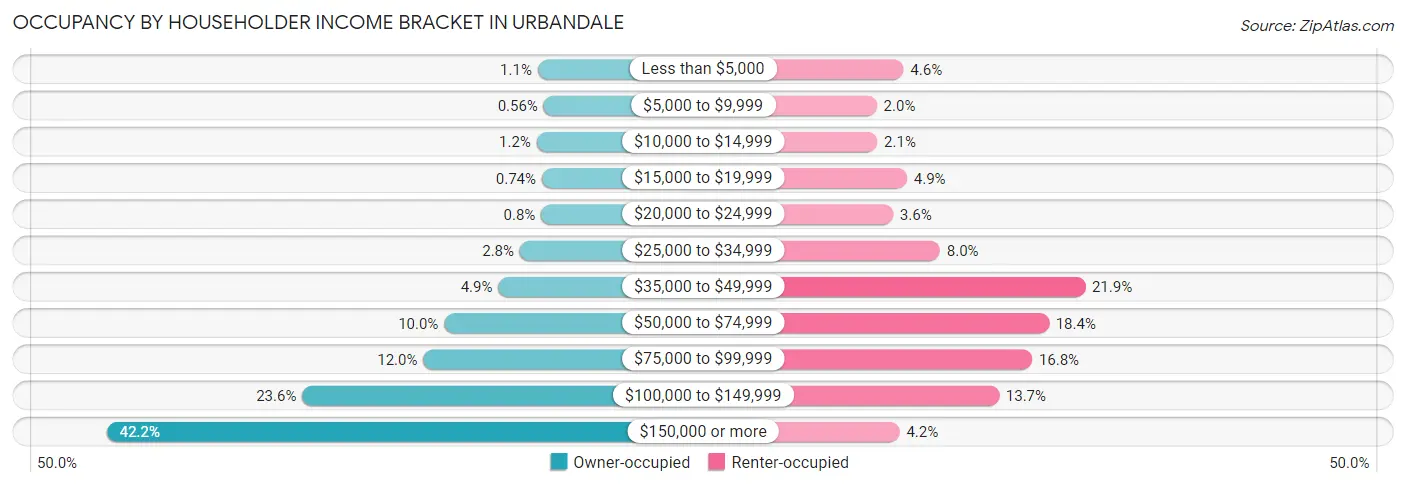
| Income Bracket | Owner-occupied | Renter-occupied |
| Less than $5,000 | 152 (1.1%) | 168 (4.6%) |
| $5,000 to $9,999 | 76 (0.6%) | 74 (2.0%) |
| $10,000 to $14,999 | 166 (1.2%) | 76 (2.1%) |
| $15,000 to $19,999 | 100 (0.7%) | 180 (4.9%) |
| $20,000 to $24,999 | 108 (0.8%) | 131 (3.6%) |
| $25,000 to $34,999 | 381 (2.8%) | 296 (8.0%) |
| $35,000 to $49,999 | 659 (4.9%) | 805 (21.8%) |
| $50,000 to $74,999 | 1,353 (10.0%) | 678 (18.4%) |
| $75,000 to $99,999 | 1,622 (12.0%) | 619 (16.8%) |
| $100,000 to $149,999 | 3,175 (23.6%) | 503 (13.7%) |
| $150,000 or more | 5,687 (42.2%) | 154 (4.2%) |
| Total | 13,479 (100.0%) | 3,684 (100.0%) |
Monthly Housing Cost Tiers in Urbandale
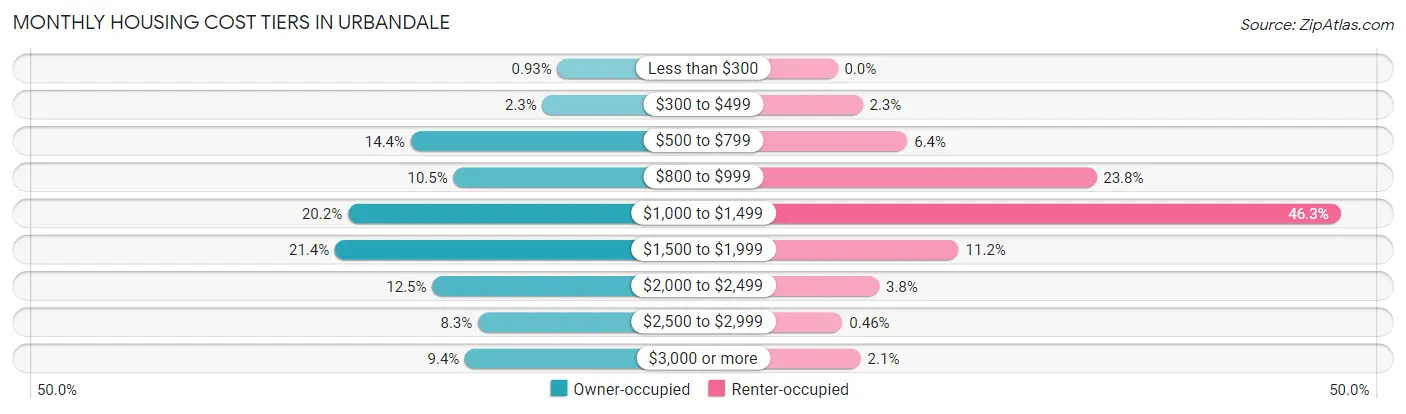
| Monthly Cost | Owner-occupied | Renter-occupied |
| Less than $300 | 126 (0.9%) | 0 (0.0%) |
| $300 to $499 | 312 (2.3%) | 85 (2.3%) |
| $500 to $799 | 1,947 (14.4%) | 237 (6.4%) |
| $800 to $999 | 1,416 (10.5%) | 878 (23.8%) |
| $1,000 to $1,499 | 2,727 (20.2%) | 1,706 (46.3%) |
| $1,500 to $1,999 | 2,887 (21.4%) | 411 (11.2%) |
| $2,000 to $2,499 | 1,680 (12.5%) | 141 (3.8%) |
| $2,500 to $2,999 | 1,112 (8.3%) | 17 (0.5%) |
| $3,000 or more | 1,272 (9.4%) | 79 (2.1%) |
| Total | 13,479 (100.0%) | 3,684 (100.0%) |
Physical Housing Characteristics in Urbandale
Housing Structures in Urbandale
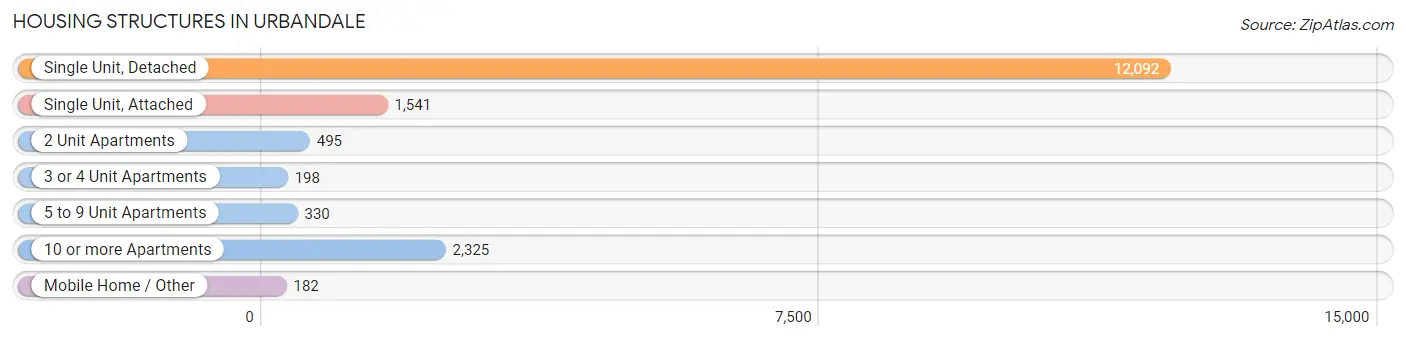
| Structure Type | # Housing Units | % Housing Units |
| Single Unit, Detached | 12,092 | 70.5% |
| Single Unit, Attached | 1,541 | 9.0% |
| 2 Unit Apartments | 495 | 2.9% |
| 3 or 4 Unit Apartments | 198 | 1.1% |
| 5 to 9 Unit Apartments | 330 | 1.9% |
| 10 or more Apartments | 2,325 | 13.6% |
| Mobile Home / Other | 182 | 1.1% |
| Total | 17,163 | 100.0% |
Housing Structures by Occupancy in Urbandale
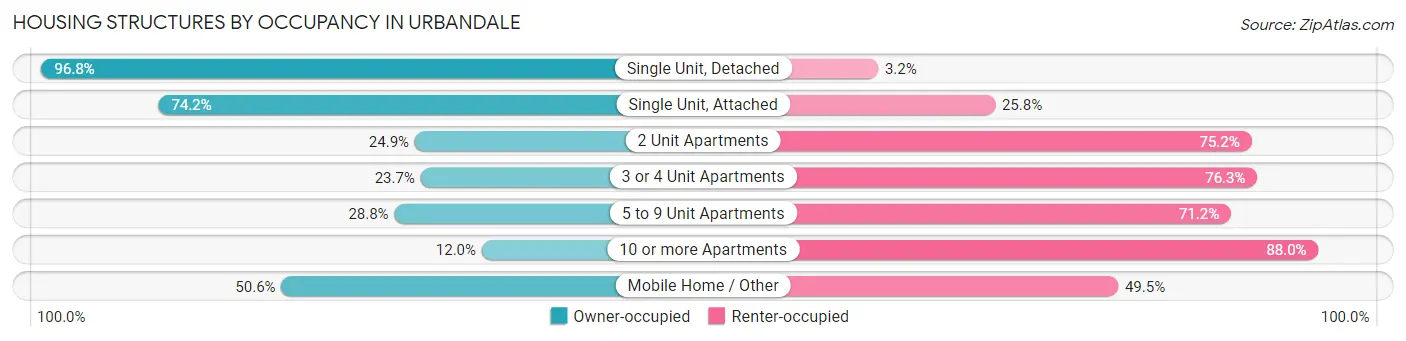
| Structure Type | Owner-occupied | Renter-occupied |
| Single Unit, Detached | 11,700 (96.8%) | 392 (3.2%) |
| Single Unit, Attached | 1,144 (74.2%) | 397 (25.8%) |
| 2 Unit Apartments | 123 (24.8%) | 372 (75.1%) |
| 3 or 4 Unit Apartments | 47 (23.7%) | 151 (76.3%) |
| 5 to 9 Unit Apartments | 95 (28.8%) | 235 (71.2%) |
| 10 or more Apartments | 278 (12.0%) | 2,047 (88.0%) |
| Mobile Home / Other | 92 (50.5%) | 90 (49.4%) |
| Total | 13,479 (78.5%) | 3,684 (21.5%) |
Housing Structures by Number of Rooms in Urbandale
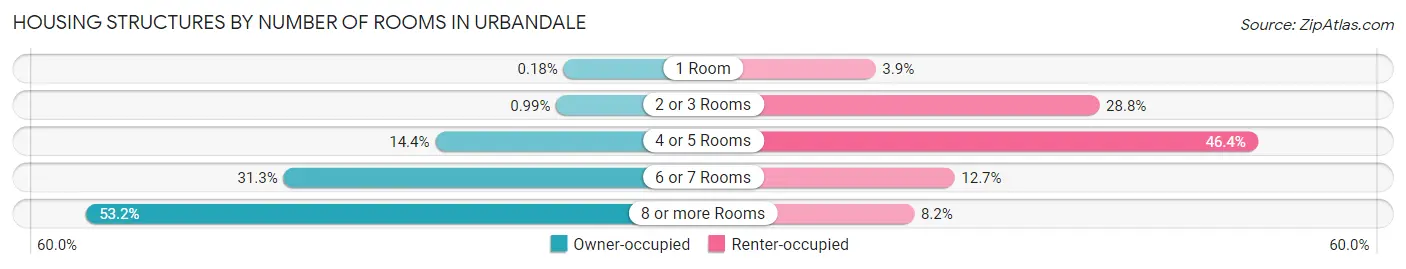
| Number of Rooms | Owner-occupied | Renter-occupied |
| 1 Room | 24 (0.2%) | 145 (3.9%) |
| 2 or 3 Rooms | 133 (1.0%) | 1,060 (28.8%) |
| 4 or 5 Rooms | 1,944 (14.4%) | 1,708 (46.4%) |
| 6 or 7 Rooms | 4,213 (31.3%) | 468 (12.7%) |
| 8 or more Rooms | 7,165 (53.2%) | 303 (8.2%) |
| Total | 13,479 (100.0%) | 3,684 (100.0%) |
Housing Structure by Heating Type in Urbandale
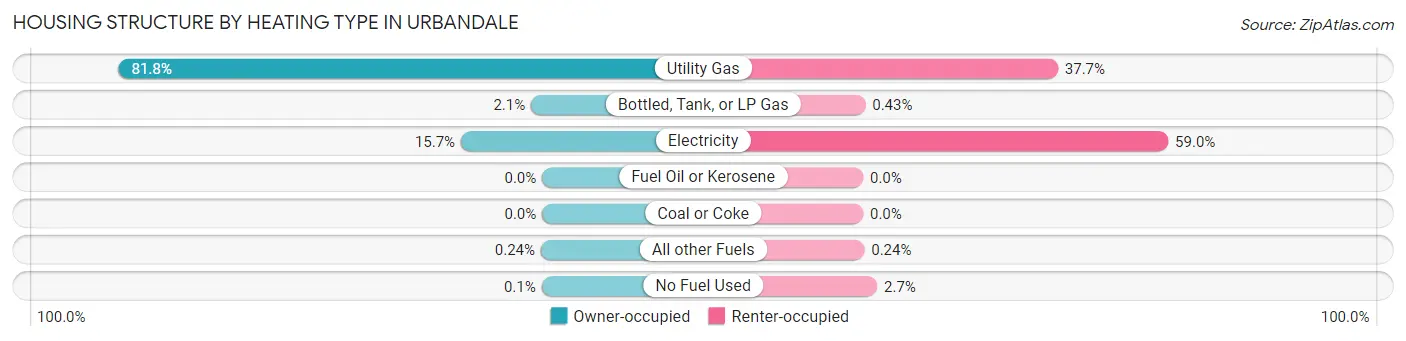
| Heating Type | Owner-occupied | Renter-occupied |
| Utility Gas | 11,031 (81.8%) | 1,387 (37.7%) |
| Bottled, Tank, or LP Gas | 288 (2.1%) | 16 (0.4%) |
| Electricity | 2,114 (15.7%) | 2,172 (59.0%) |
| Fuel Oil or Kerosene | 0 (0.0%) | 0 (0.0%) |
| Coal or Coke | 0 (0.0%) | 0 (0.0%) |
| All other Fuels | 32 (0.2%) | 9 (0.2%) |
| No Fuel Used | 14 (0.1%) | 100 (2.7%) |
| Total | 13,479 (100.0%) | 3,684 (100.0%) |
Household Vehicle Usage in Urbandale
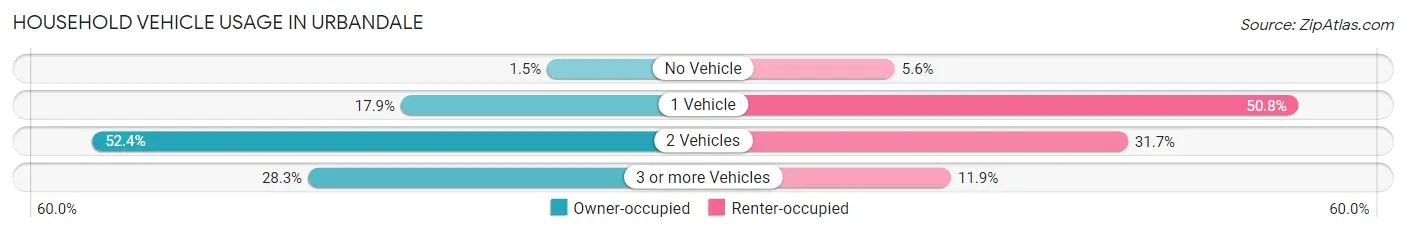
| Vehicles per Household | Owner-occupied | Renter-occupied |
| No Vehicle | 198 (1.5%) | 206 (5.6%) |
| 1 Vehicle | 2,406 (17.8%) | 1,872 (50.8%) |
| 2 Vehicles | 7,066 (52.4%) | 1,168 (31.7%) |
| 3 or more Vehicles | 3,809 (28.3%) | 438 (11.9%) |
| Total | 13,479 (100.0%) | 3,684 (100.0%) |
Real Estate & Mortgages in Urbandale
Real Estate and Mortgage Overview in Urbandale
| Characteristic | Without Mortgage | With Mortgage |
| Housing Units | 4,279 | 9,200 |
| Median Property Value | $281,900 | $308,200 |
| Median Household Income | $107,117 | $4,199 |
| Monthly Housing Costs | $792 | $1,241 |
| Real Estate Taxes | $5,115 | $53 |
Property Value by Mortgage Status in Urbandale
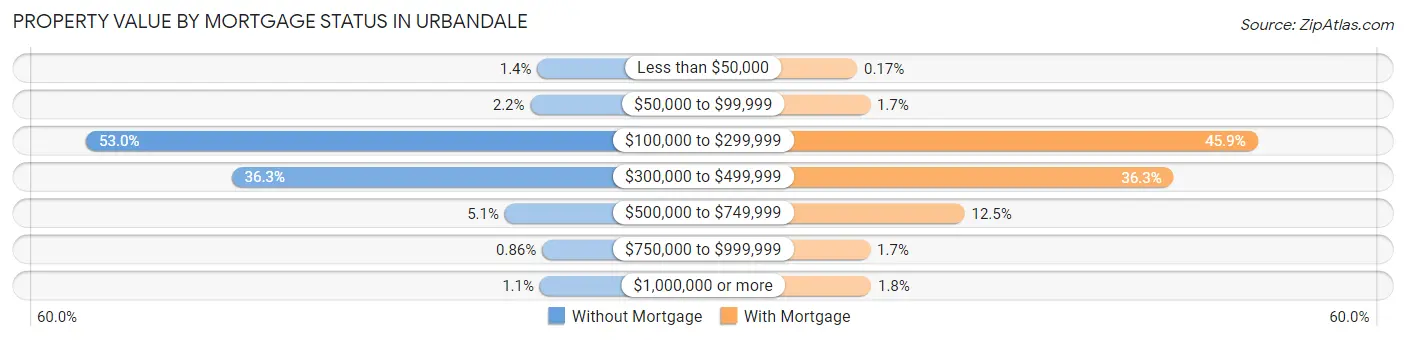
| Property Value | Without Mortgage | With Mortgage |
| Less than $50,000 | 60 (1.4%) | 16 (0.2%) |
| $50,000 to $99,999 | 94 (2.2%) | 152 (1.7%) |
| $100,000 to $299,999 | 2,266 (53.0%) | 4,226 (45.9%) |
| $300,000 to $499,999 | 1,555 (36.3%) | 3,343 (36.3%) |
| $500,000 to $749,999 | 219 (5.1%) | 1,146 (12.5%) |
| $750,000 to $999,999 | 37 (0.9%) | 154 (1.7%) |
| $1,000,000 or more | 48 (1.1%) | 163 (1.8%) |
| Total | 4,279 (100.0%) | 9,200 (100.0%) |
Household Income by Mortgage Status in Urbandale
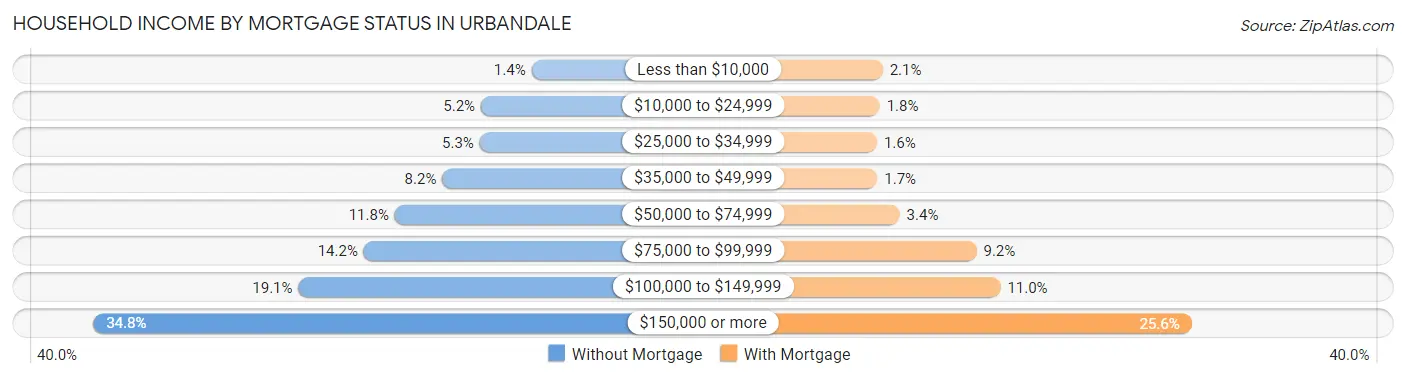
| Household Income | Without Mortgage | With Mortgage |
| Less than $10,000 | 59 (1.4%) | 190 (2.1%) |
| $10,000 to $24,999 | 224 (5.2%) | 169 (1.8%) |
| $25,000 to $34,999 | 228 (5.3%) | 150 (1.6%) |
| $35,000 to $49,999 | 350 (8.2%) | 153 (1.7%) |
| $50,000 to $74,999 | 505 (11.8%) | 309 (3.4%) |
| $75,000 to $99,999 | 606 (14.2%) | 848 (9.2%) |
| $100,000 to $149,999 | 819 (19.1%) | 1,016 (11.0%) |
| $150,000 or more | 1,488 (34.8%) | 2,356 (25.6%) |
| Total | 4,279 (100.0%) | 9,200 (100.0%) |
Property Value to Household Income Ratio in Urbandale
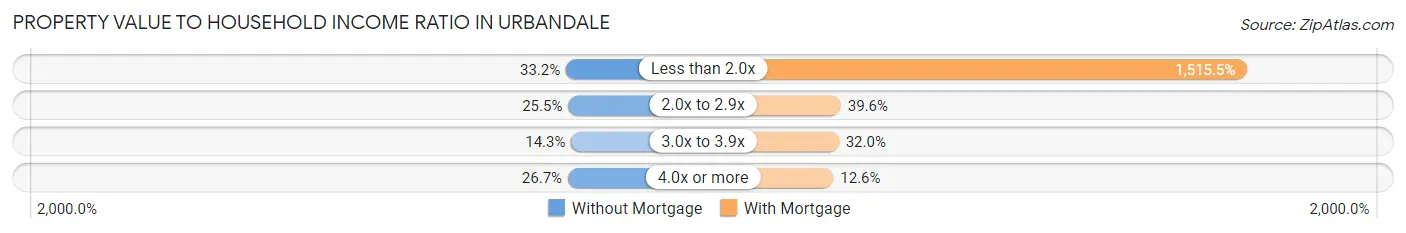
| Value-to-Income Ratio | Without Mortgage | With Mortgage |
| Less than 2.0x | 1,422 (33.2%) | 139,423 (1,515.5%) |
| 2.0x to 2.9x | 1,089 (25.5%) | 3,644 (39.6%) |
| 3.0x to 3.9x | 611 (14.3%) | 2,939 (32.0%) |
| 4.0x or more | 1,141 (26.7%) | 1,155 (12.6%) |
| Total | 4,279 (100.0%) | 9,200 (100.0%) |
Real Estate Taxes by Mortgage Status in Urbandale
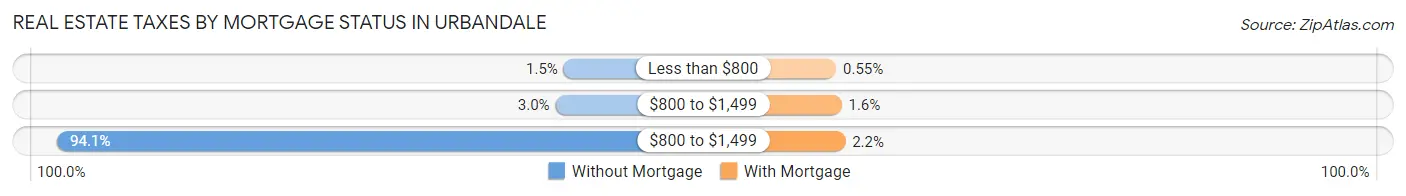
| Property Taxes | Without Mortgage | With Mortgage |
| Less than $800 | 66 (1.5%) | 51 (0.5%) |
| $800 to $1,499 | 130 (3.0%) | 143 (1.5%) |
| $800 to $1,499 | 4,025 (94.1%) | 204 (2.2%) |
| Total | 4,279 (100.0%) | 9,200 (100.0%) |
Health & Disability in Urbandale
Health Insurance Coverage by Age in Urbandale
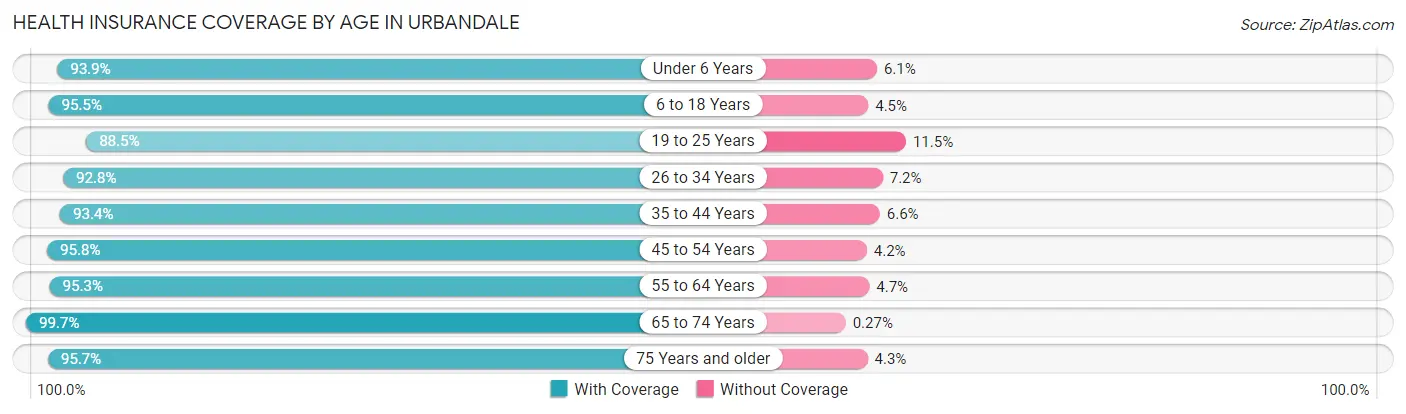
| Age Bracket | With Coverage | Without Coverage |
| Under 6 Years | 3,401 (93.9%) | 221 (6.1%) |
| 6 to 18 Years | 8,448 (95.5%) | 395 (4.5%) |
| 19 to 25 Years | 2,078 (88.5%) | 270 (11.5%) |
| 26 to 34 Years | 4,746 (92.8%) | 367 (7.2%) |
| 35 to 44 Years | 6,384 (93.4%) | 453 (6.6%) |
| 45 to 54 Years | 5,870 (95.8%) | 258 (4.2%) |
| 55 to 64 Years | 5,773 (95.3%) | 283 (4.7%) |
| 65 to 74 Years | 4,123 (99.7%) | 11 (0.3%) |
| 75 Years and older | 1,986 (95.7%) | 90 (4.3%) |
| Total | 42,809 (94.8%) | 2,348 (5.2%) |
Health Insurance Coverage by Citizenship Status in Urbandale
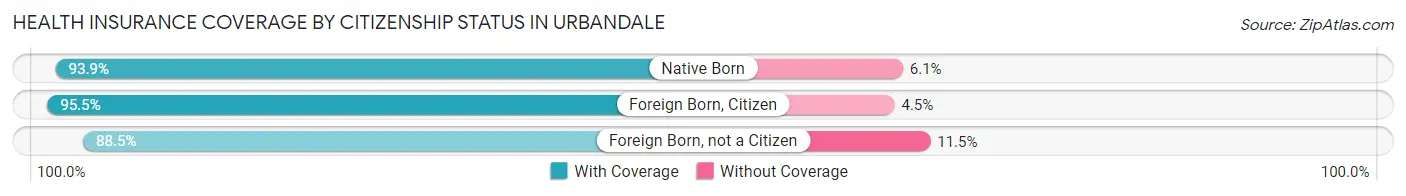
| Citizenship Status | With Coverage | Without Coverage |
| Native Born | 3,401 (93.9%) | 221 (6.1%) |
| Foreign Born, Citizen | 8,448 (95.5%) | 395 (4.5%) |
| Foreign Born, not a Citizen | 2,078 (88.5%) | 270 (11.5%) |
Health Insurance Coverage by Household Income in Urbandale
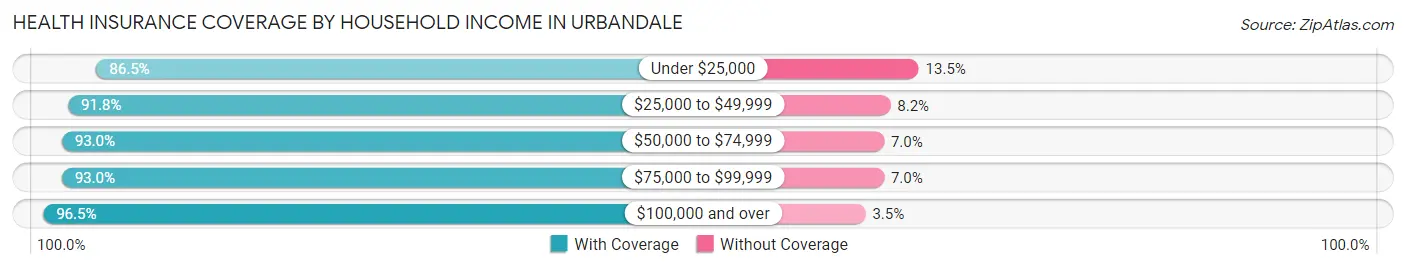
| Household Income | With Coverage | Without Coverage |
| Under $25,000 | 1,755 (86.5%) | 273 (13.5%) |
| $25,000 to $49,999 | 3,577 (91.8%) | 318 (8.2%) |
| $50,000 to $74,999 | 4,006 (93.0%) | 300 (7.0%) |
| $75,000 to $99,999 | 5,949 (93.0%) | 445 (7.0%) |
| $100,000 and over | 27,474 (96.5%) | 995 (3.5%) |
Public vs Private Health Insurance Coverage by Age in Urbandale
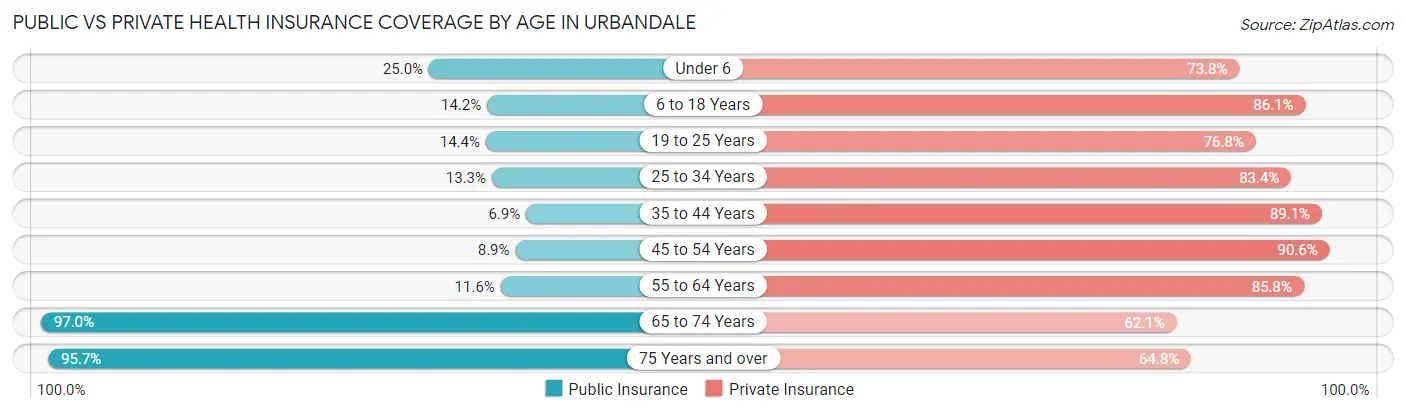
| Age Bracket | Public Insurance | Private Insurance |
| Under 6 | 904 (25.0%) | 2,672 (73.8%) |
| 6 to 18 Years | 1,253 (14.2%) | 7,609 (86.1%) |
| 19 to 25 Years | 338 (14.4%) | 1,804 (76.8%) |
| 25 to 34 Years | 679 (13.3%) | 4,265 (83.4%) |
| 35 to 44 Years | 474 (6.9%) | 6,093 (89.1%) |
| 45 to 54 Years | 546 (8.9%) | 5,549 (90.5%) |
| 55 to 64 Years | 705 (11.6%) | 5,193 (85.8%) |
| 65 to 74 Years | 4,009 (97.0%) | 2,569 (62.1%) |
| 75 Years and over | 1,986 (95.7%) | 1,346 (64.8%) |
| Total | 10,894 (24.1%) | 37,100 (82.2%) |
Disability Status by Sex by Age in Urbandale
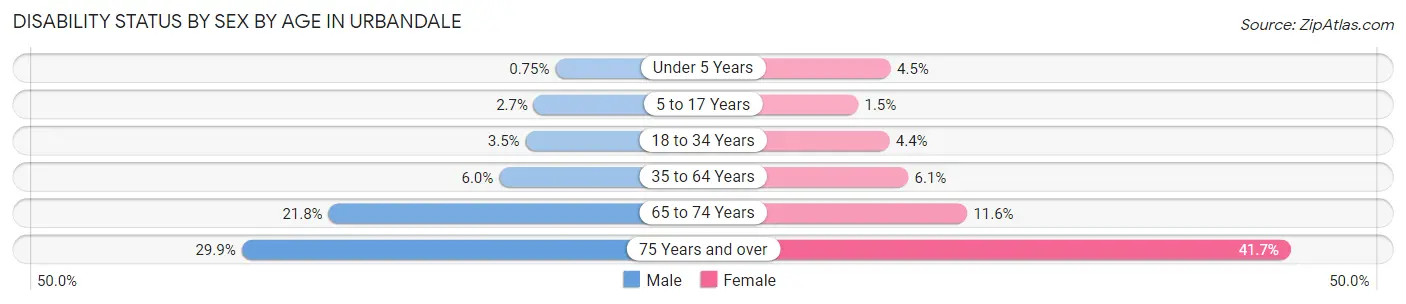
| Age Bracket | Male | Female |
| Under 5 Years | 11 (0.7%) | 66 (4.5%) |
| 5 to 17 Years | 122 (2.7%) | 66 (1.5%) |
| 18 to 34 Years | 150 (3.5%) | 164 (4.4%) |
| 35 to 64 Years | 571 (6.0%) | 577 (6.1%) |
| 65 to 74 Years | 466 (21.8%) | 231 (11.6%) |
| 75 Years and over | 253 (29.9%) | 512 (41.7%) |
Disability Class by Sex by Age in Urbandale
Disability Class: Hearing Difficulty
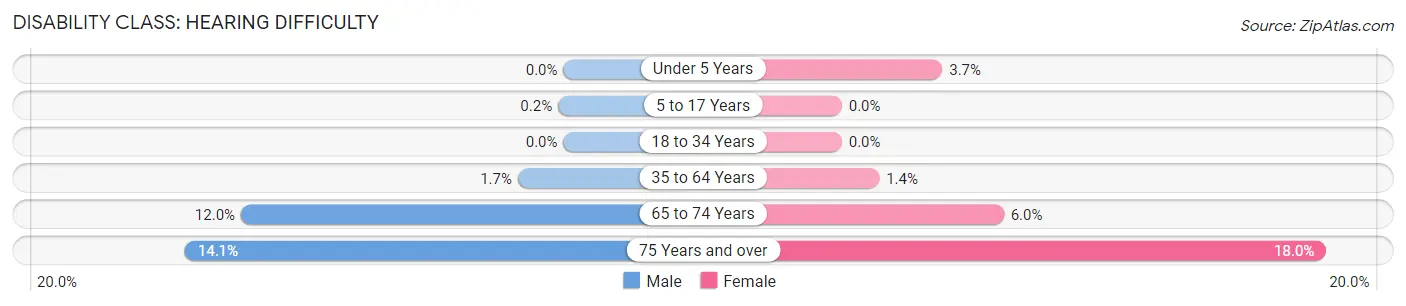
| Age Bracket | Male | Female |
| Under 5 Years | 0 (0.0%) | 55 (3.7%) |
| 5 to 17 Years | 9 (0.2%) | 0 (0.0%) |
| 18 to 34 Years | 0 (0.0%) | 0 (0.0%) |
| 35 to 64 Years | 162 (1.7%) | 131 (1.4%) |
| 65 to 74 Years | 256 (12.0%) | 120 (6.0%) |
| 75 Years and over | 119 (14.1%) | 221 (18.0%) |
Disability Class: Vision Difficulty
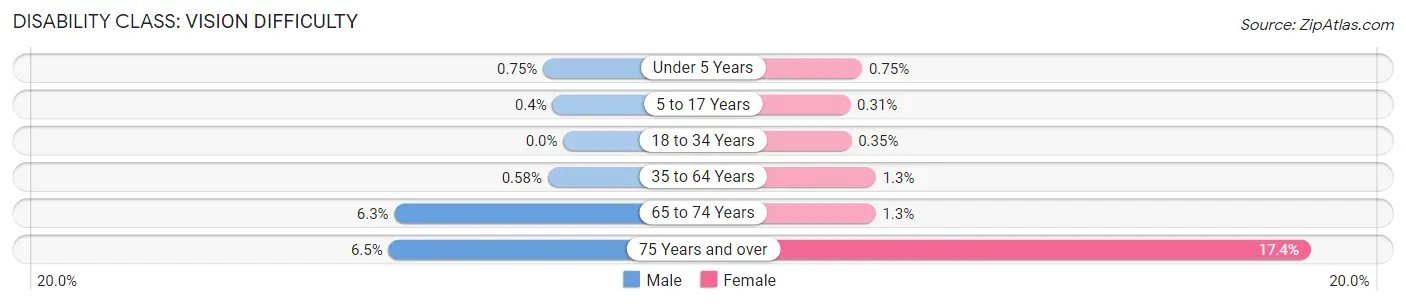
| Age Bracket | Male | Female |
| Under 5 Years | 11 (0.7%) | 11 (0.7%) |
| 5 to 17 Years | 18 (0.4%) | 14 (0.3%) |
| 18 to 34 Years | 0 (0.0%) | 13 (0.4%) |
| 35 to 64 Years | 56 (0.6%) | 119 (1.3%) |
| 65 to 74 Years | 134 (6.3%) | 25 (1.3%) |
| 75 Years and over | 55 (6.5%) | 214 (17.4%) |
Disability Class: Cognitive Difficulty
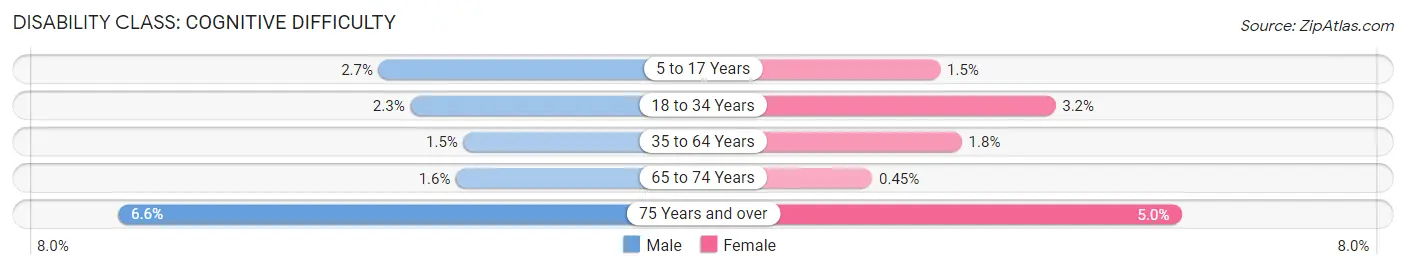
| Age Bracket | Male | Female |
| 5 to 17 Years | 122 (2.7%) | 66 (1.5%) |
| 18 to 34 Years | 97 (2.3%) | 119 (3.2%) |
| 35 to 64 Years | 142 (1.5%) | 168 (1.8%) |
| 65 to 74 Years | 34 (1.6%) | 9 (0.4%) |
| 75 Years and over | 56 (6.6%) | 62 (5.0%) |
Disability Class: Ambulatory Difficulty
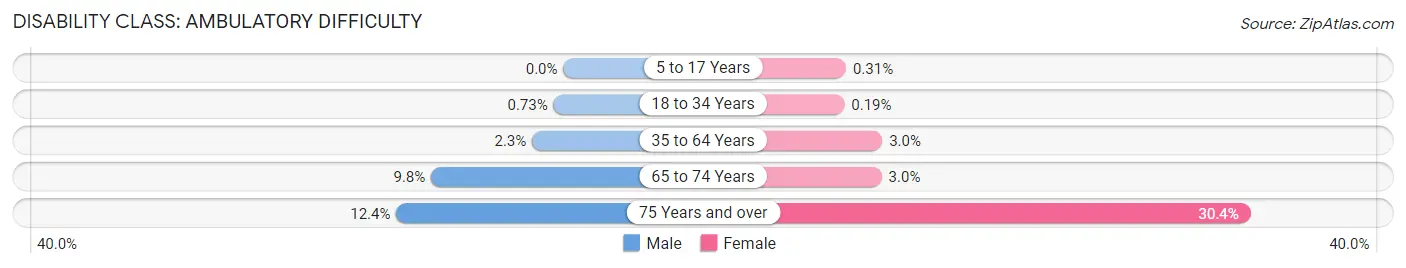
| Age Bracket | Male | Female |
| 5 to 17 Years | 0 (0.0%) | 14 (0.3%) |
| 18 to 34 Years | 31 (0.7%) | 7 (0.2%) |
| 35 to 64 Years | 222 (2.3%) | 283 (3.0%) |
| 65 to 74 Years | 210 (9.8%) | 59 (3.0%) |
| 75 Years and over | 105 (12.4%) | 373 (30.3%) |
Disability Class: Self-Care Difficulty
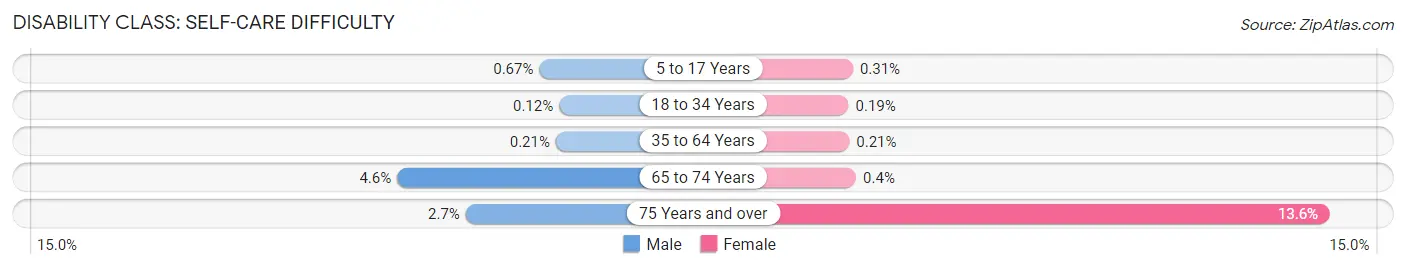
| Age Bracket | Male | Female |
| 5 to 17 Years | 30 (0.7%) | 14 (0.3%) |
| 18 to 34 Years | 5 (0.1%) | 7 (0.2%) |
| 35 to 64 Years | 20 (0.2%) | 20 (0.2%) |
| 65 to 74 Years | 99 (4.6%) | 8 (0.4%) |
| 75 Years and over | 23 (2.7%) | 167 (13.6%) |
Technology Access in Urbandale
Computing Device Access in Urbandale
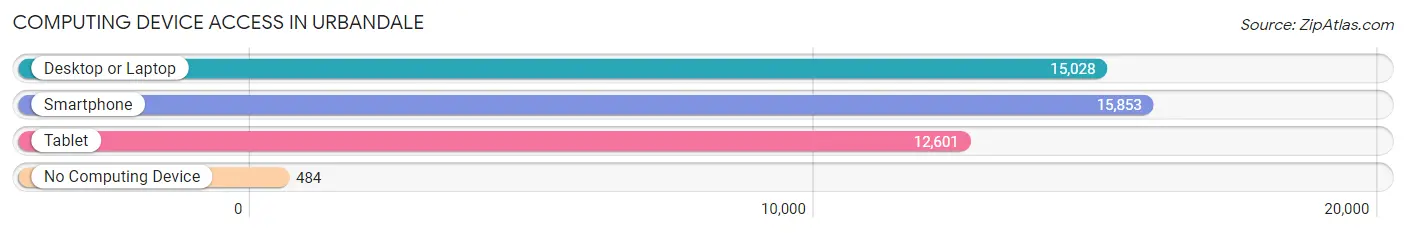
| Device Type | # Households | % Households |
| Desktop or Laptop | 15,028 | 87.6% |
| Smartphone | 15,853 | 92.4% |
| Tablet | 12,601 | 73.4% |
| No Computing Device | 484 | 2.8% |
| Total | 17,163 | 100.0% |
Internet Access in Urbandale
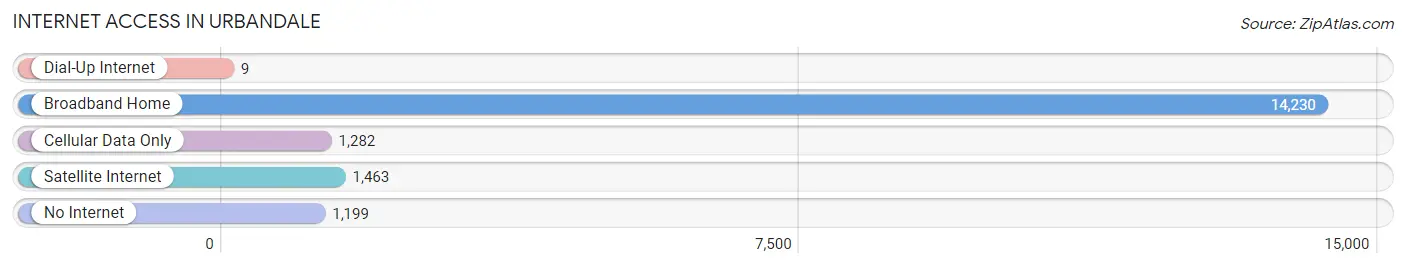
| Internet Type | # Households | % Households |
| Dial-Up Internet | 9 | 0.1% |
| Broadband Home | 14,230 | 82.9% |
| Cellular Data Only | 1,282 | 7.5% |
| Satellite Internet | 1,463 | 8.5% |
| No Internet | 1,199 | 7.0% |
| Total | 17,163 | 100.0% |
Urbandale Summary
UrbanDale, Iowa is a city located in Polk and Dallas counties in the state of Iowa. It is a suburb of Des Moines, the state capital, and is part of the Des Moines metropolitan area. As of the 2010 census, the city had a population of 39,463, making it the ninth-largest city in Iowa.
History
UrbanDale was founded in the late 1950s as a planned community. The city was named after the two major highways that intersected in the area, U.S. Route 6 (Urban Highway) and Iowa Highway 141 (Dale Avenue). The city was incorporated in 1959 and has grown steadily since then.
Geography
UrbanDale is located in central Iowa, approximately 15 miles west of Des Moines. It is situated in the Des Moines metropolitan area, which is part of the larger Greater Des Moines area. The city is bordered by Clive to the north, West Des Moines to the east, Grimes to the south, and Johnston to the west.
The city has a total area of 16.2 square miles, of which 16.1 square miles is land and 0.1 square miles is water. The terrain is generally flat, with some rolling hills in the northern and western parts of the city.
Economy
UrbanDale is a major economic center in the Des Moines metropolitan area. The city is home to several large employers, including Wells Fargo, Nationwide Insurance, and the Principal Financial Group. The city also has a thriving retail sector, with several large shopping centers and malls.
The city's economy is also supported by a strong manufacturing base. Major employers in this sector include John Deere, Rockwell Collins, and Vermeer Manufacturing.
Demographics
As of the 2010 census, there were 39,463 people, 15,845 households, and 10,845 families residing in the city. The population density was 2,444.3 people per square mile. The racial makeup of the city was 87.2% White, 4.3% African American, 0.3% Native American, 4.2% Asian, 0.1% Pacific Islander, 1.7% from other races, and 2.4% from two or more races. Hispanic or Latino of any race were 4.7% of the population.
The median income for a household in the city was $68,945, and the median income for a family was $81,945. The per capita income for the city was $33,945. About 3.2% of families and 4.7% of the population were below the poverty line, including 5.3% of those under age 18 and 4.2% of those age 65 or over.
UrbanDale is a diverse city, with a variety of cultures and backgrounds represented. The city is home to a large number of immigrants, with the largest groups coming from Mexico, India, and China. The city also has a large population of young professionals, drawn to the city by its strong economy and vibrant culture.
Common Questions
What is Per Capita Income in Urbandale?
Per Capita income in Urbandale is $51,170.
What is the Median Family Income in Urbandale?
Median Family Income in Urbandale is $134,872.
What is the Median Household income in Urbandale?
Median Household Income in Urbandale is $111,888.
What is Income or Wage Gap in Urbandale?
Income or Wage Gap in Urbandale is 29.4%.
Women in Urbandale earn 70.6 cents for every dollar earned by a man.
What is Inequality or Gini Index in Urbandale?
Inequality or Gini Index in Urbandale is 0.40.
What is the Total Population of Urbandale?
Total Population of Urbandale is 45,591.
What is the Total Male Population of Urbandale?
Total Male Population of Urbandale is 23,005.
What is the Total Female Population of Urbandale?
Total Female Population of Urbandale is 22,586.
What is the Ratio of Males per 100 Females in Urbandale?
There are 101.86 Males per 100 Females in Urbandale.
What is the Ratio of Females per 100 Males in Urbandale?
There are 98.18 Females per 100 Males in Urbandale.
What is the Median Population Age in Urbandale?
Median Population Age in Urbandale is 38.9 Years.
What is the Average Family Size in Urbandale
Average Family Size in Urbandale is 3.1 People.
What is the Average Household Size in Urbandale
Average Household Size in Urbandale is 2.6 People.
How Large is the Labor Force in Urbandale?
There are 24,917 People in the Labor Forcein in Urbandale.
What is the Percentage of People in the Labor Force in Urbandale?
70.9% of People are in the Labor Force in Urbandale.
What is the Unemployment Rate in Urbandale?
Unemployment Rate in Urbandale is 2.1%.