Burlington, IA Map & Demographics
Burlington Map
Burlington Overview
$33,842
PER CAPITA INCOME
$66,147
AVG FAMILY INCOME
$51,628
AVG HOUSEHOLD INCOME
27.6%
WAGE / INCOME GAP [ % ]
72.4¢/ $1
WAGE / INCOME GAP [ $ ]
0.48
INEQUALITY / GINI INDEX
23,976
TOTAL POPULATION
11,603
MALE POPULATION
12,373
FEMALE POPULATION
93.78
MALES / 100 FEMALES
106.64
FEMALES / 100 MALES
42.9
MEDIAN AGE
2.7
AVG FAMILY SIZE
2.1
AVG HOUSEHOLD SIZE
11,527
LABOR FORCE [ PEOPLE ]
59.1%
PERCENT IN LABOR FORCE
4.0%
UNEMPLOYMENT RATE
Burlington Zip Codes
Burlington Area Codes
Income in Burlington
Income Overview in Burlington
Per Capita Income in Burlington is $33,842, while median incomes of families and households are $66,147 and $51,628 respectively.
| Characteristic | Number | Measure |
| Per Capita Income | 23,976 | $33,842 |
| Median Family Income | 6,351 | $66,147 |
| Mean Family Income | 6,351 | $91,078 |
| Median Household Income | 11,207 | $51,628 |
| Mean Household Income | 11,207 | $72,747 |
| Income Deficit | 6,351 | $0 |
| Wage / Income Gap (%) | 23,976 | 27.61% |
| Wage / Income Gap ($) | 23,976 | 72.39¢ per $1 |
| Gini / Inequality Index | 23,976 | 0.48 |
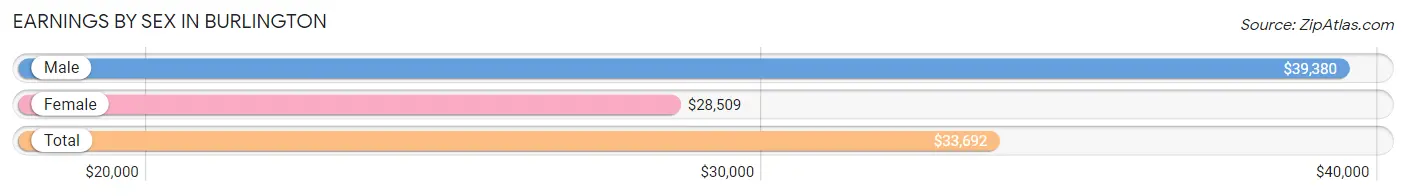
Earnings by Sex in Burlington
Average Earnings in Burlington are $33,692, $39,380 for men and $28,509 for women, a difference of 27.6%.
| Sex | Number | Average Earnings |
| Male | 6,291 (51.5%) | $39,380 |
| Female | 5,918 (48.5%) | $28,509 |
| Total | 12,209 (100.0%) | $33,692 |
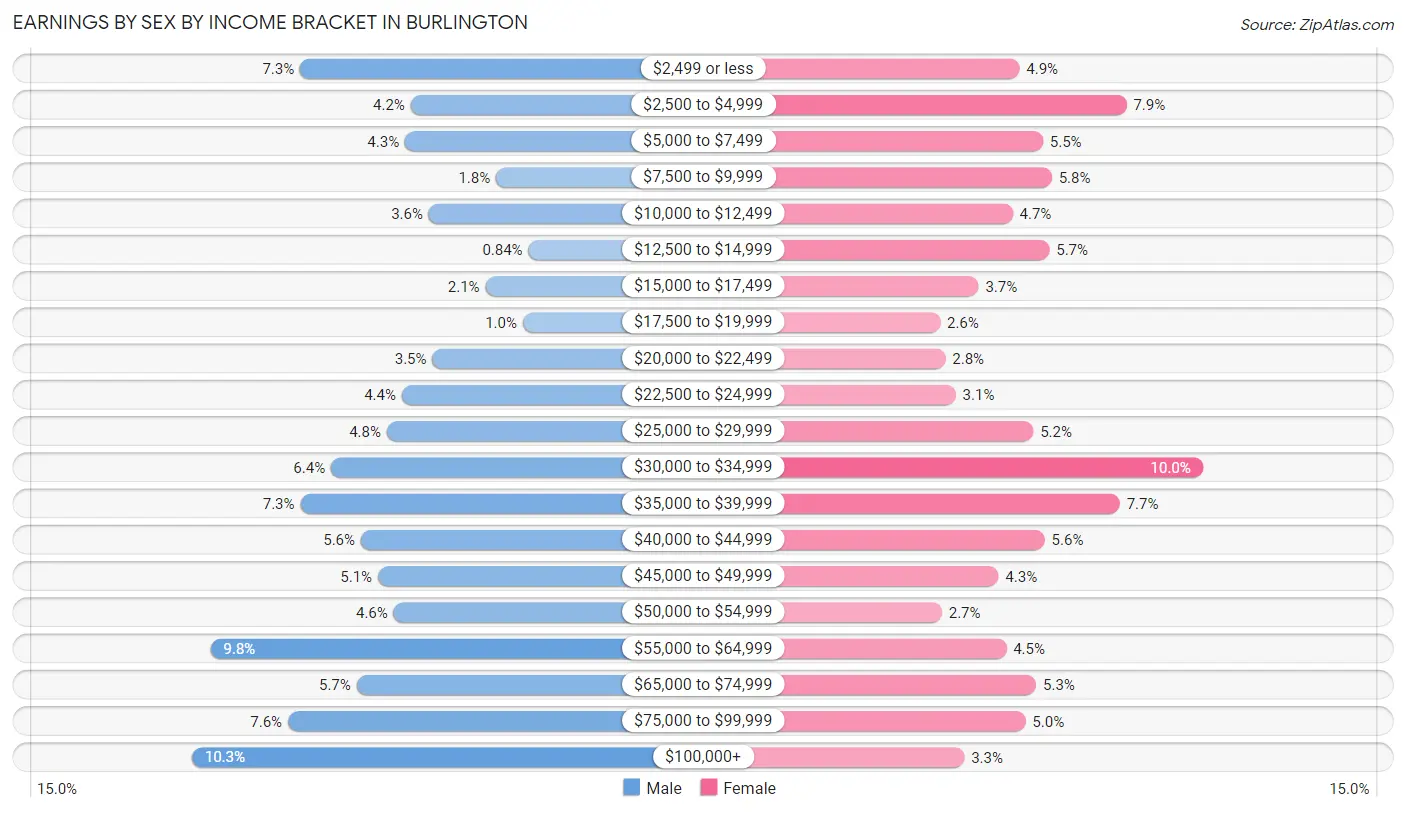
Earnings by Sex by Income Bracket in Burlington
The most common earnings brackets in Burlington are $100,000+ for men (648 | 10.3%) and $30,000 to $34,999 for women (592 | 10.0%).
| Income | Male | Female |
| $2,499 or less | 457 (7.3%) | 287 (4.9%) |
| $2,500 to $4,999 | 261 (4.2%) | 465 (7.9%) |
| $5,000 to $7,499 | 271 (4.3%) | 326 (5.5%) |
| $7,500 to $9,999 | 110 (1.8%) | 341 (5.8%) |
| $10,000 to $12,499 | 229 (3.6%) | 276 (4.7%) |
| $12,500 to $14,999 | 53 (0.8%) | 337 (5.7%) |
| $15,000 to $17,499 | 129 (2.1%) | 219 (3.7%) |
| $17,500 to $19,999 | 63 (1.0%) | 155 (2.6%) |
| $20,000 to $22,499 | 223 (3.5%) | 164 (2.8%) |
| $22,500 to $24,999 | 277 (4.4%) | 181 (3.1%) |
| $25,000 to $29,999 | 303 (4.8%) | 310 (5.2%) |
| $30,000 to $34,999 | 402 (6.4%) | 592 (10.0%) |
| $35,000 to $39,999 | 456 (7.2%) | 454 (7.7%) |
| $40,000 to $44,999 | 349 (5.6%) | 329 (5.6%) |
| $45,000 to $49,999 | 319 (5.1%) | 252 (4.3%) |
| $50,000 to $54,999 | 291 (4.6%) | 158 (2.7%) |
| $55,000 to $64,999 | 615 (9.8%) | 265 (4.5%) |
| $65,000 to $74,999 | 357 (5.7%) | 315 (5.3%) |
| $75,000 to $99,999 | 478 (7.6%) | 297 (5.0%) |
| $100,000+ | 648 (10.3%) | 195 (3.3%) |
| Total | 6,291 (100.0%) | 5,918 (100.0%) |
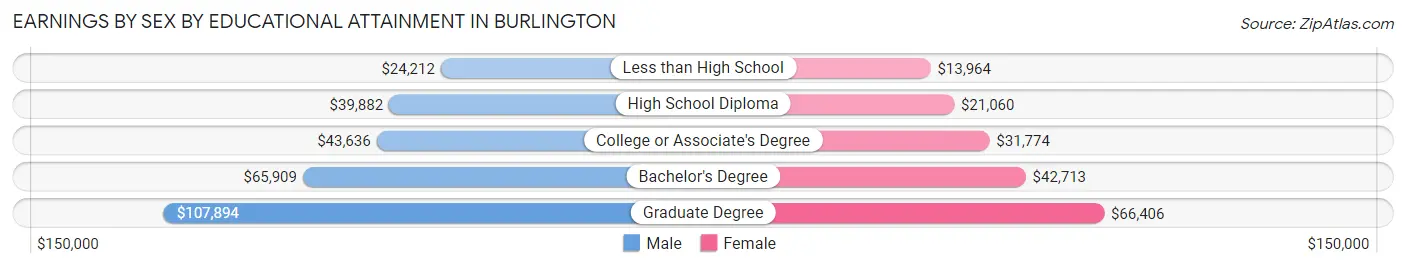
Earnings by Sex by Educational Attainment in Burlington
Average earnings in Burlington are $44,578 for men and $31,741 for women, a difference of 28.8%. Men with an educational attainment of graduate degree enjoy the highest average annual earnings of $107,894, while those with less than high school education earn the least with $24,212. Women with an educational attainment of graduate degree earn the most with the average annual earnings of $66,406, while those with less than high school education have the smallest earnings of $13,964.
| Educational Attainment | Male Income | Female Income |
| Less than High School | $24,212 | $13,964 |
| High School Diploma | $39,882 | $21,060 |
| College or Associate's Degree | $43,636 | $31,774 |
| Bachelor's Degree | $65,909 | $42,713 |
| Graduate Degree | $107,894 | $66,406 |
| Total | $44,578 | $31,741 |
Family Income in Burlington
Family Income Brackets in Burlington
According to the Burlington family income data, there are 1,245 families falling into the $75,000 to $99,999 income range, which is the most common income bracket and makes up 19.6% of all families. Conversely, the $10,000 to $14,999 income bracket is the least frequent group with only 254 families (4.0%) belonging to this category.
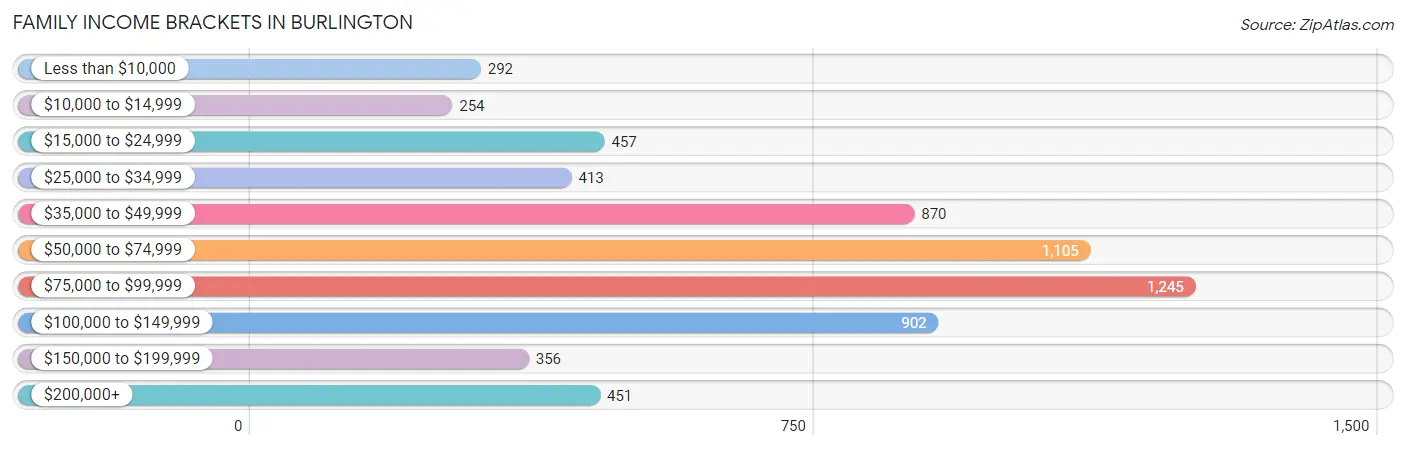
| Income Bracket | # Families | % Families |
| Less than $10,000 | 292 | 4.6% |
| $10,000 to $14,999 | 254 | 4.0% |
| $15,000 to $24,999 | 457 | 7.2% |
| $25,000 to $34,999 | 413 | 6.5% |
| $35,000 to $49,999 | 870 | 13.7% |
| $50,000 to $74,999 | 1,105 | 17.4% |
| $75,000 to $99,999 | 1,245 | 19.6% |
| $100,000 to $149,999 | 902 | 14.2% |
| $150,000 to $199,999 | 356 | 5.6% |
| $200,000+ | 451 | 7.1% |
Family Income by Famaliy Size in Burlington
5-person families (421 | 6.6%) account for the highest median family income in Burlington with $93,180 per family, while 2-person families (3,533 | 55.6%) have the highest median income of $33,887 per family member.
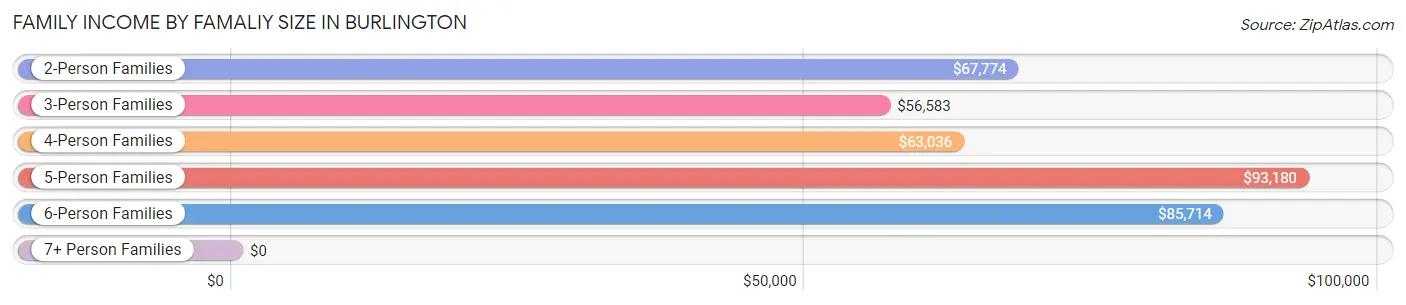
| Income Bracket | # Families | Median Income |
| 2-Person Families | 3,533 (55.6%) | $67,774 |
| 3-Person Families | 1,322 (20.8%) | $56,583 |
| 4-Person Families | 907 (14.3%) | $63,036 |
| 5-Person Families | 421 (6.6%) | $93,180 |
| 6-Person Families | 136 (2.1%) | $85,714 |
| 7+ Person Families | 32 (0.5%) | $0 |
| Total | 6,351 (100.0%) | $66,147 |
Family Income by Number of Earners in Burlington
The median family income in Burlington is $66,147, with families comprising 2 earners (2,254) having the highest median family income of $91,958, while families with 1 earner (2,617) have the lowest median family income of $44,890, accounting for 35.5% and 41.2% of families, respectively.
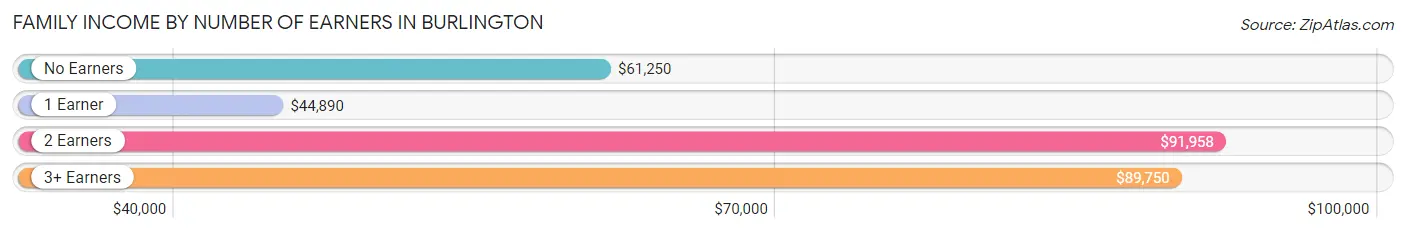
| Number of Earners | # Families | Median Income |
| No Earners | 1,008 (15.9%) | $61,250 |
| 1 Earner | 2,617 (41.2%) | $44,890 |
| 2 Earners | 2,254 (35.5%) | $91,958 |
| 3+ Earners | 472 (7.4%) | $89,750 |
| Total | 6,351 (100.0%) | $66,147 |
Household Income in Burlington
Household Income Brackets in Burlington
With 1,972 households falling in the category, the $50,000 to $74,999 income range is the most frequent in Burlington, accounting for 17.6% of all households. In contrast, only 493 households (4.4%) fall into the $200,000+ income bracket, making it the least populous group.
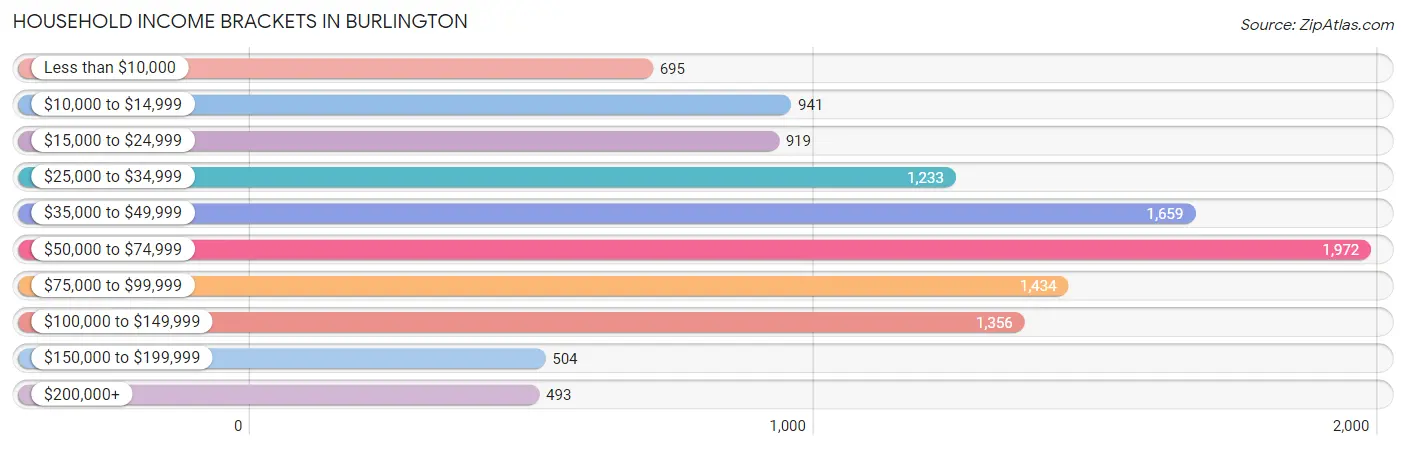
| Income Bracket | # Households | % Households |
| Less than $10,000 | 695 | 6.2% |
| $10,000 to $14,999 | 941 | 8.4% |
| $15,000 to $24,999 | 919 | 8.2% |
| $25,000 to $34,999 | 1,233 | 11.0% |
| $35,000 to $49,999 | 1,659 | 14.8% |
| $50,000 to $74,999 | 1,972 | 17.6% |
| $75,000 to $99,999 | 1,434 | 12.8% |
| $100,000 to $149,999 | 1,356 | 12.1% |
| $150,000 to $199,999 | 504 | 4.5% |
| $200,000+ | 493 | 4.4% |
Household Income by Householder Age in Burlington
The median household income in Burlington is $51,628, with the highest median household income of $61,384 found in the 45 to 64 years age bracket for the primary householder. A total of 3,738 households (33.4%) fall into this category. Meanwhile, the 15 to 24 years age bracket for the primary householder has the lowest median household income of $35,168, with 543 households (4.9%) in this group.
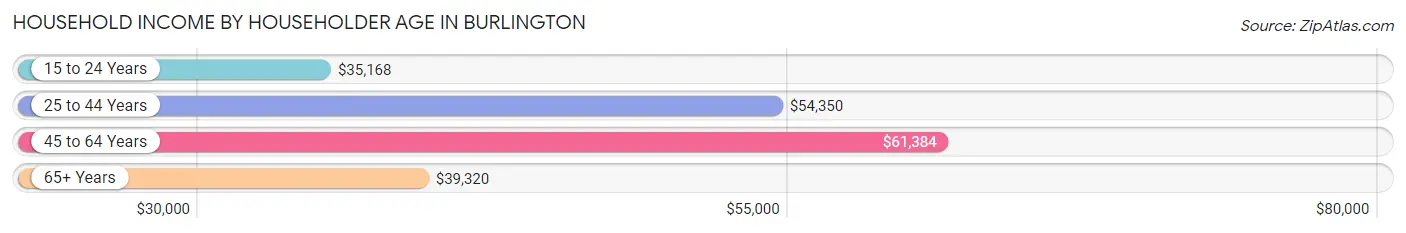
| Income Bracket | # Households | Median Income |
| 15 to 24 Years | 543 (4.9%) | $35,168 |
| 25 to 44 Years | 3,170 (28.3%) | $54,350 |
| 45 to 64 Years | 3,738 (33.4%) | $61,384 |
| 65+ Years | 3,756 (33.5%) | $39,320 |
| Total | 11,207 (100.0%) | $51,628 |
Poverty in Burlington
Income Below Poverty by Sex and Age in Burlington
With 13.8% poverty level for males and 21.6% for females among the residents of Burlington, under 5 year old males and 5 year old females are the most vulnerable to poverty, with 214 males (40.8%) and 100 females (62.1%) in their respective age groups living below the poverty level.
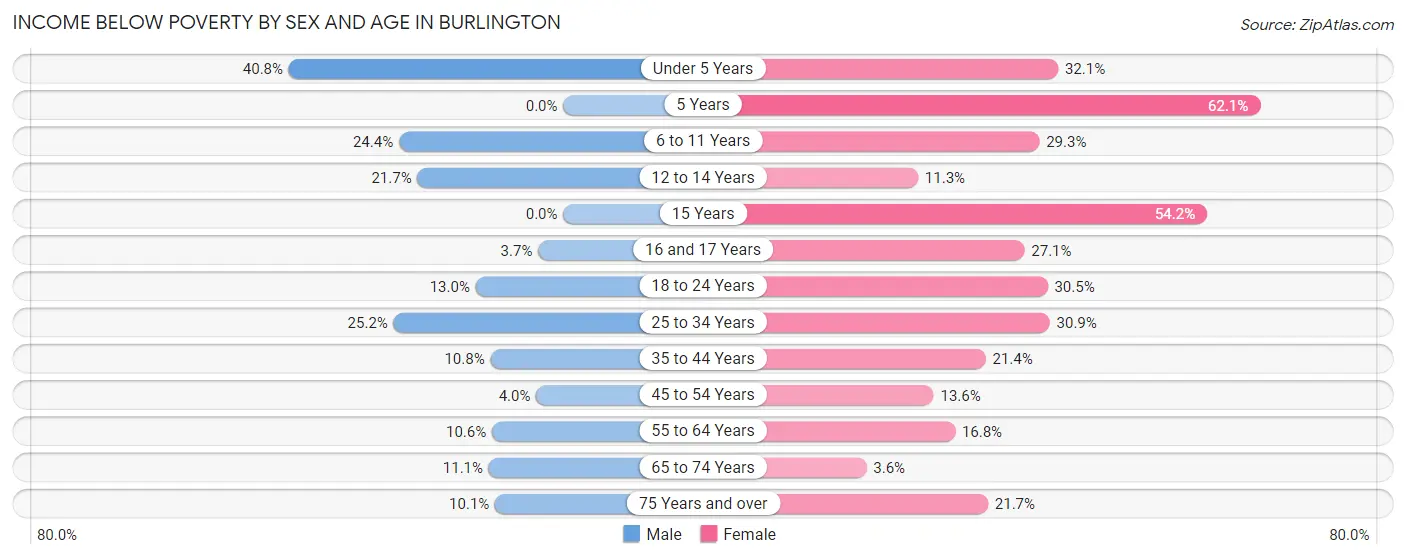
| Age Bracket | Male | Female |
| Under 5 Years | 214 (40.8%) | 208 (32.1%) |
| 5 Years | 0 (0.0%) | 100 (62.1%) |
| 6 to 11 Years | 219 (24.4%) | 263 (29.3%) |
| 12 to 14 Years | 60 (21.7%) | 52 (11.3%) |
| 15 Years | 0 (0.0%) | 90 (54.2%) |
| 16 and 17 Years | 18 (3.7%) | 109 (27.1%) |
| 18 to 24 Years | 105 (13.0%) | 277 (30.5%) |
| 25 to 34 Years | 314 (25.2%) | 457 (30.9%) |
| 35 to 44 Years | 144 (10.8%) | 306 (21.3%) |
| 45 to 54 Years | 50 (4.0%) | 169 (13.6%) |
| 55 to 64 Years | 182 (10.6%) | 302 (16.8%) |
| 65 to 74 Years | 183 (11.1%) | 54 (3.6%) |
| 75 Years and over | 87 (10.1%) | 264 (21.7%) |
| Total | 1,576 (13.8%) | 2,651 (21.6%) |
Income Above Poverty by Sex and Age in Burlington
According to the poverty statistics in Burlington, males aged 5 years and females aged 65 to 74 years are the age groups that are most secure financially, with 100.0% of males and 96.4% of females in these age groups living above the poverty line.
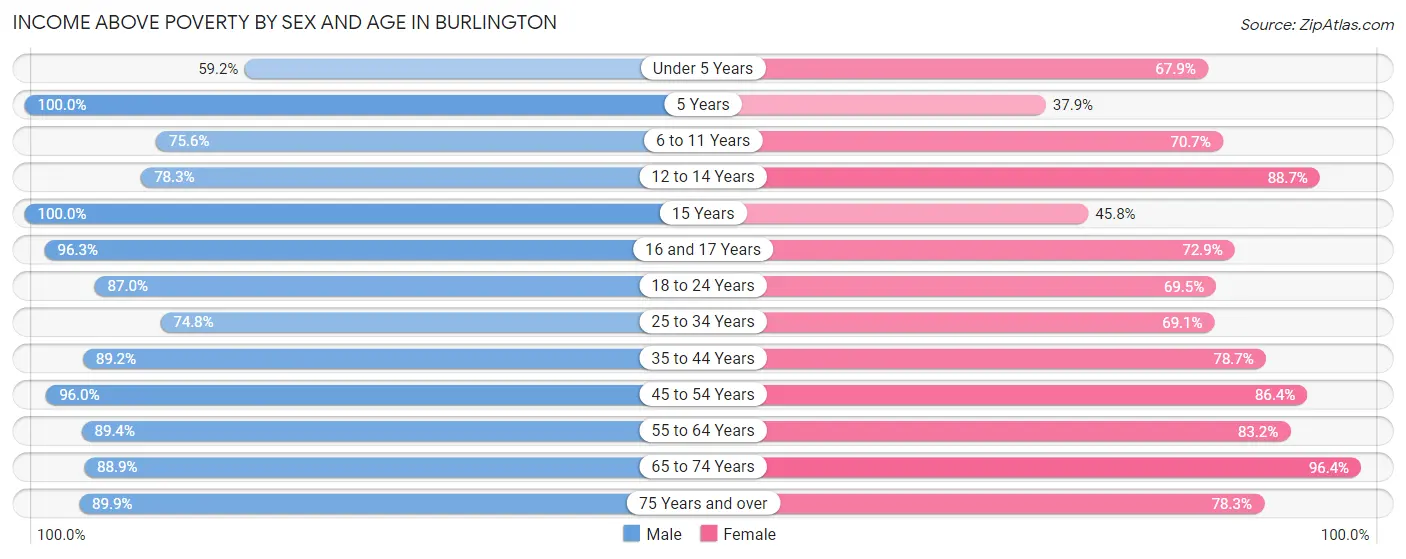
| Age Bracket | Male | Female |
| Under 5 Years | 311 (59.2%) | 440 (67.9%) |
| 5 Years | 311 (100.0%) | 61 (37.9%) |
| 6 to 11 Years | 678 (75.6%) | 634 (70.7%) |
| 12 to 14 Years | 217 (78.3%) | 408 (88.7%) |
| 15 Years | 48 (100.0%) | 76 (45.8%) |
| 16 and 17 Years | 464 (96.3%) | 293 (72.9%) |
| 18 to 24 Years | 702 (87.0%) | 630 (69.5%) |
| 25 to 34 Years | 932 (74.8%) | 1,024 (69.1%) |
| 35 to 44 Years | 1,187 (89.2%) | 1,127 (78.6%) |
| 45 to 54 Years | 1,195 (96.0%) | 1,071 (86.4%) |
| 55 to 64 Years | 1,536 (89.4%) | 1,496 (83.2%) |
| 65 to 74 Years | 1,472 (88.9%) | 1,431 (96.4%) |
| 75 Years and over | 772 (89.9%) | 953 (78.3%) |
| Total | 9,825 (86.2%) | 9,644 (78.4%) |
Income Below Poverty Among Married-Couple Families in Burlington
The poverty statistics for married-couple families in Burlington show that 4.5% or 180 of the total 4,000 families live below the poverty line. Families with 3 or 4 children have the highest poverty rate of 8.4%, comprising of 25 families. On the other hand, families with no children have the lowest poverty rate of 3.7%, which includes 100 families.
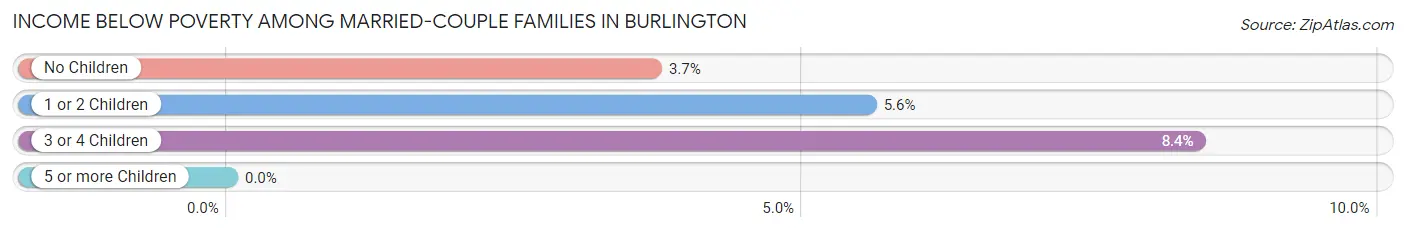
| Children | Above Poverty | Below Poverty |
| No Children | 2,613 (96.3%) | 100 (3.7%) |
| 1 or 2 Children | 935 (94.4%) | 55 (5.6%) |
| 3 or 4 Children | 272 (91.6%) | 25 (8.4%) |
| 5 or more Children | 0 (0.0%) | 0 (0.0%) |
| Total | 3,820 (95.5%) | 180 (4.5%) |
Income Below Poverty Among Single-Parent Households in Burlington
According to the poverty data in Burlington, 18.0% or 135 single-father households and 41.3% or 661 single-mother households are living below the poverty line. Among single-father households, those with 1 or 2 children have the highest poverty rate, with 135 households (45.2%) experiencing poverty. Likewise, among single-mother households, those with 3 or 4 children have the highest poverty rate, with 246 households (84.5%) falling below the poverty line.
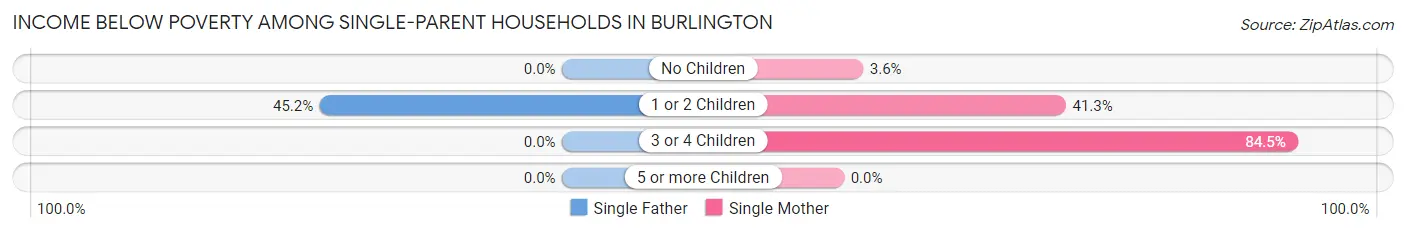
| Children | Single Father | Single Mother |
| No Children | 0 (0.0%) | 12 (3.6%) |
| 1 or 2 Children | 135 (45.2%) | 403 (41.3%) |
| 3 or 4 Children | 0 (0.0%) | 246 (84.5%) |
| 5 or more Children | 0 (0.0%) | 0 (0.0%) |
| Total | 135 (18.0%) | 661 (41.3%) |
Income Below Poverty Among Married-Couple vs Single-Parent Households in Burlington
The poverty data for Burlington shows that 180 of the married-couple family households (4.5%) and 796 of the single-parent households (33.9%) are living below the poverty level. Within the married-couple family households, those with 3 or 4 children have the highest poverty rate, with 25 households (8.4%) falling below the poverty line. Among the single-parent households, those with 3 or 4 children have the highest poverty rate, with 246 household (65.9%) living below poverty.
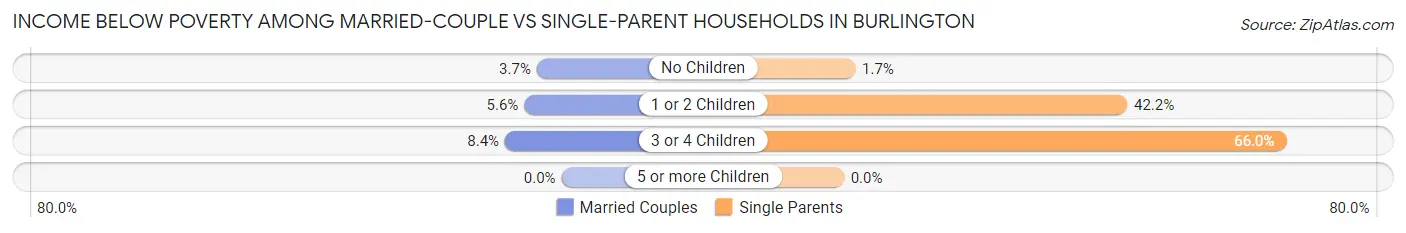
| Children | Married-Couple Families | Single-Parent Households |
| No Children | 100 (3.7%) | 12 (1.7%) |
| 1 or 2 Children | 55 (5.6%) | 538 (42.2%) |
| 3 or 4 Children | 25 (8.4%) | 246 (65.9%) |
| 5 or more Children | 0 (0.0%) | 0 (0.0%) |
| Total | 180 (4.5%) | 796 (33.9%) |
Race in Burlington
The most populous races in Burlington are White / Caucasian (20,711 | 86.4%), Black / African American (1,393 | 5.8%), and Two or more Races (1,315 | 5.5%).
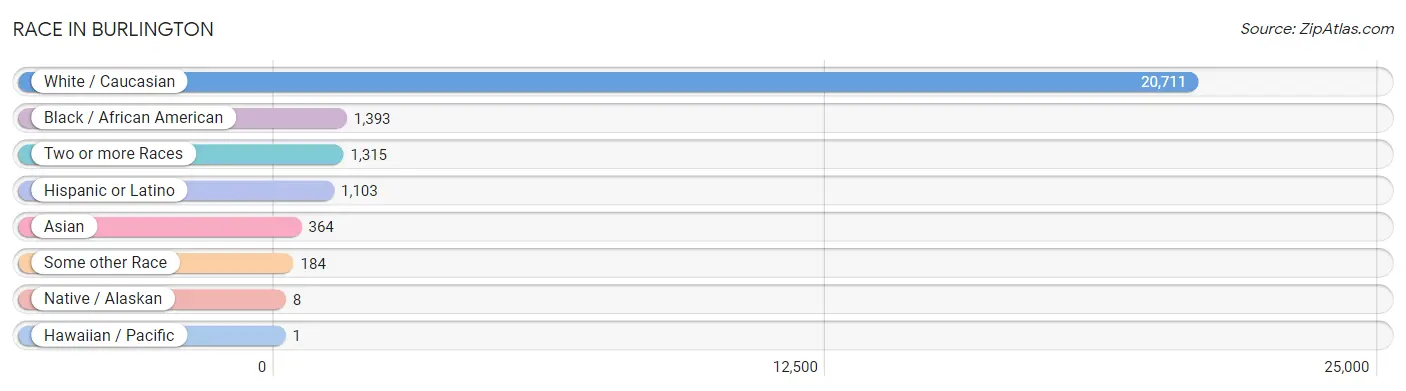
| Race | # Population | % Population |
| Asian | 364 | 1.5% |
| Black / African American | 1,393 | 5.8% |
| Hawaiian / Pacific | 1 | 0.0% |
| Hispanic or Latino | 1,103 | 4.6% |
| Native / Alaskan | 8 | 0.0% |
| White / Caucasian | 20,711 | 86.4% |
| Two or more Races | 1,315 | 5.5% |
| Some other Race | 184 | 0.8% |
| Total | 23,976 | 100.0% |
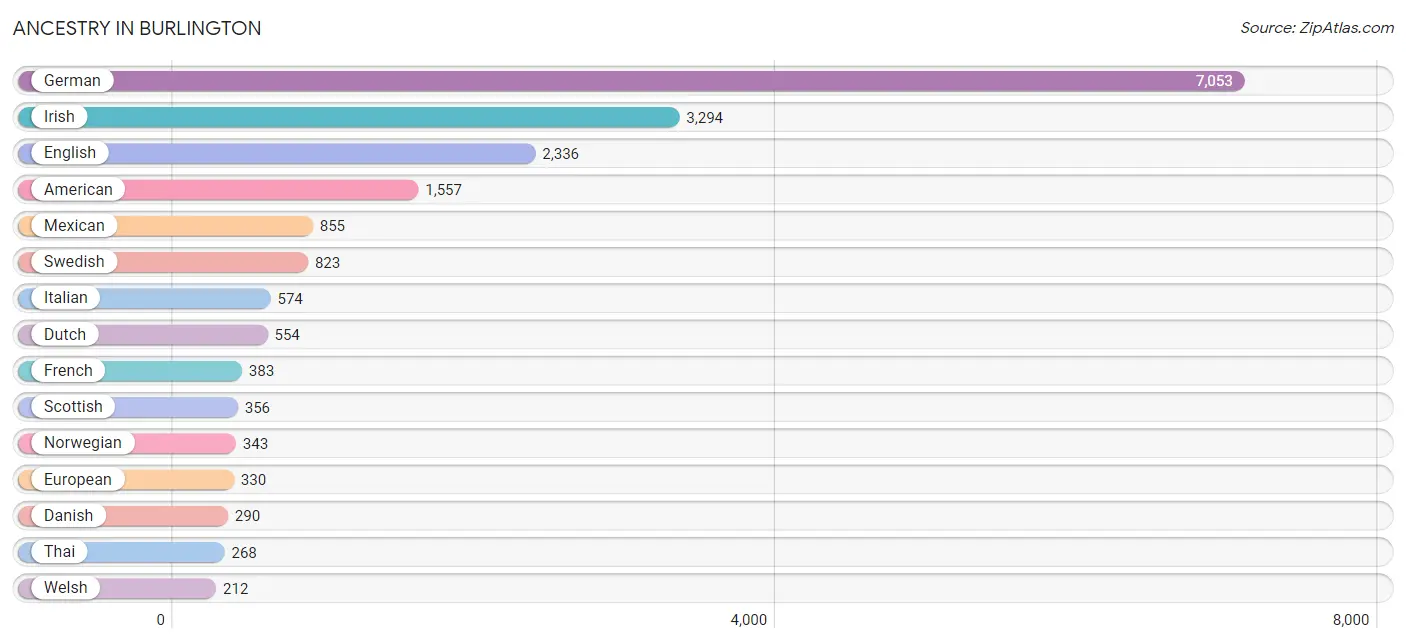
Ancestry in Burlington
The most populous ancestries reported in Burlington are German (7,053 | 29.4%), Irish (3,294 | 13.7%), English (2,336 | 9.7%), American (1,557 | 6.5%), and Mexican (855 | 3.6%), together accounting for 63.0% of all Burlington residents.
| Ancestry | # Population | % Population |
| African | 77 | 0.3% |
| American | 1,557 | 6.5% |
| Arab | 73 | 0.3% |
| Australian | 19 | 0.1% |
| Austrian | 27 | 0.1% |
| Belgian | 6 | 0.0% |
| British | 78 | 0.3% |
| Burmese | 34 | 0.1% |
| Canadian | 54 | 0.2% |
| Celtic | 23 | 0.1% |
| Central American | 32 | 0.1% |
| Cherokee | 84 | 0.4% |
| Chickasaw | 8 | 0.0% |
| Croatian | 23 | 0.1% |
| Cuban | 21 | 0.1% |
| Czech | 104 | 0.4% |
| Czechoslovakian | 14 | 0.1% |
| Danish | 290 | 1.2% |
| Dutch | 554 | 2.3% |
| Eastern European | 25 | 0.1% |
| Ecuadorian | 19 | 0.1% |
| Egyptian | 73 | 0.3% |
| English | 2,336 | 9.7% |
| European | 330 | 1.4% |
| French | 383 | 1.6% |
| French Canadian | 53 | 0.2% |
| German | 7,053 | 29.4% |
| Greek | 19 | 0.1% |
| Guamanian / Chamorro | 1 | 0.0% |
| Guatemalan | 32 | 0.1% |
| Hungarian | 37 | 0.2% |
| Indian (Asian) | 50 | 0.2% |
| Inupiat | 15 | 0.1% |
| Irish | 3,294 | 13.7% |
| Italian | 574 | 2.4% |
| Kenyan | 45 | 0.2% |
| Korean | 71 | 0.3% |
| Mexican | 855 | 3.6% |
| Nigerian | 17 | 0.1% |
| Northern European | 56 | 0.2% |
| Norwegian | 343 | 1.4% |
| Pakistani | 12 | 0.1% |
| Pennsylvania German | 96 | 0.4% |
| Polish | 200 | 0.8% |
| Portuguese | 10 | 0.0% |
| Puerto Rican | 67 | 0.3% |
| Romanian | 38 | 0.2% |
| Russian | 14 | 0.1% |
| Scandinavian | 46 | 0.2% |
| Scotch-Irish | 183 | 0.8% |
| Scottish | 356 | 1.5% |
| Serbian | 10 | 0.0% |
| Slovak | 13 | 0.1% |
| Slovene | 8 | 0.0% |
| South American | 19 | 0.1% |
| Spanish | 43 | 0.2% |
| Subsaharan African | 139 | 0.6% |
| Swedish | 823 | 3.4% |
| Swiss | 131 | 0.5% |
| Thai | 268 | 1.1% |
| Ukrainian | 17 | 0.1% |
| Welsh | 212 | 0.9% | View All 62 Rows |
Immigrants in Burlington
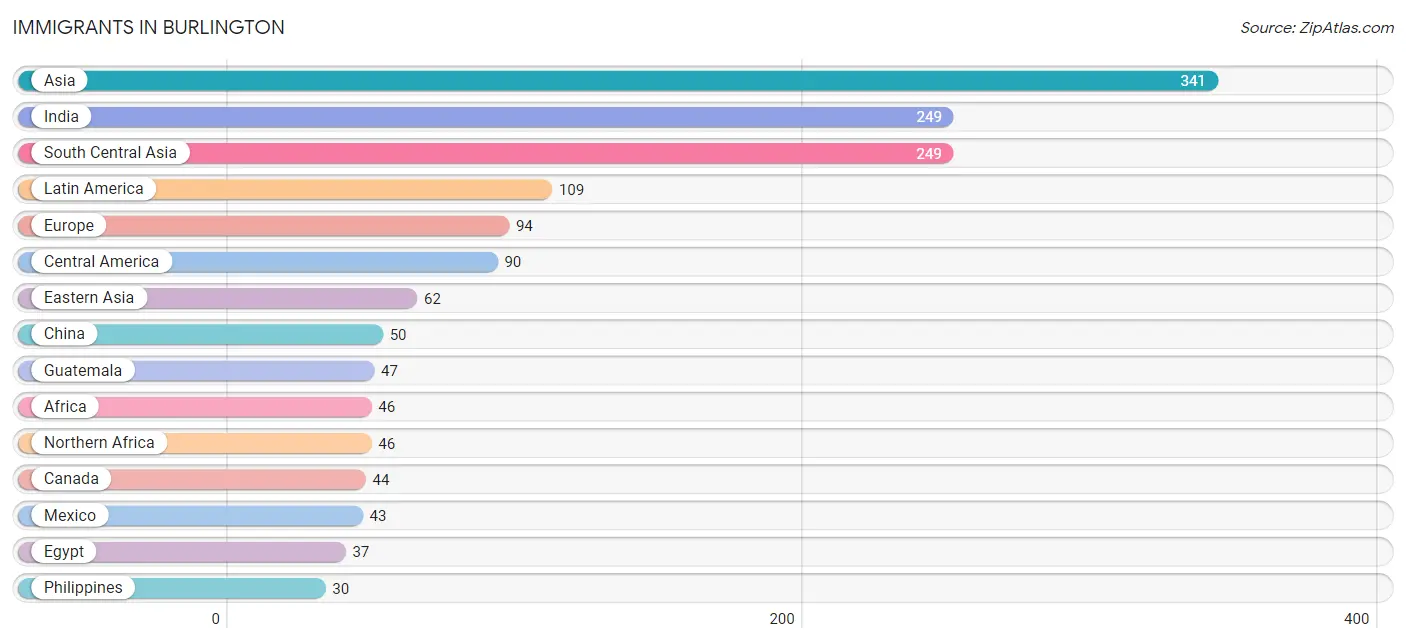
The most numerous immigrant groups reported in Burlington came from Asia (341 | 1.4%), India (249 | 1.0%), South Central Asia (249 | 1.0%), Latin America (109 | 0.4%), and Europe (94 | 0.4%), together accounting for 4.3% of all Burlington residents.
| Immigration Origin | # Population | % Population |
| Africa | 46 | 0.2% |
| Asia | 341 | 1.4% |
| Australia | 19 | 0.1% |
| Canada | 44 | 0.2% |
| Central America | 90 | 0.4% |
| China | 50 | 0.2% |
| Eastern Asia | 62 | 0.3% |
| Eastern Europe | 25 | 0.1% |
| Ecuador | 19 | 0.1% |
| Egypt | 37 | 0.2% |
| England | 19 | 0.1% |
| Europe | 94 | 0.4% |
| Germany | 28 | 0.1% |
| Greece | 12 | 0.1% |
| Guatemala | 47 | 0.2% |
| India | 249 | 1.0% |
| Korea | 12 | 0.1% |
| Latin America | 109 | 0.4% |
| Mexico | 43 | 0.2% |
| Northern Africa | 46 | 0.2% |
| Northern Europe | 19 | 0.1% |
| Oceania | 19 | 0.1% |
| Philippines | 30 | 0.1% |
| Portugal | 10 | 0.0% |
| Romania | 14 | 0.1% |
| Russia | 11 | 0.1% |
| South America | 19 | 0.1% |
| South Central Asia | 249 | 1.0% |
| South Eastern Asia | 30 | 0.1% |
| Southern Europe | 22 | 0.1% |
| Western Europe | 28 | 0.1% | View All 31 Rows |
Sex and Age in Burlington
Sex and Age in Burlington
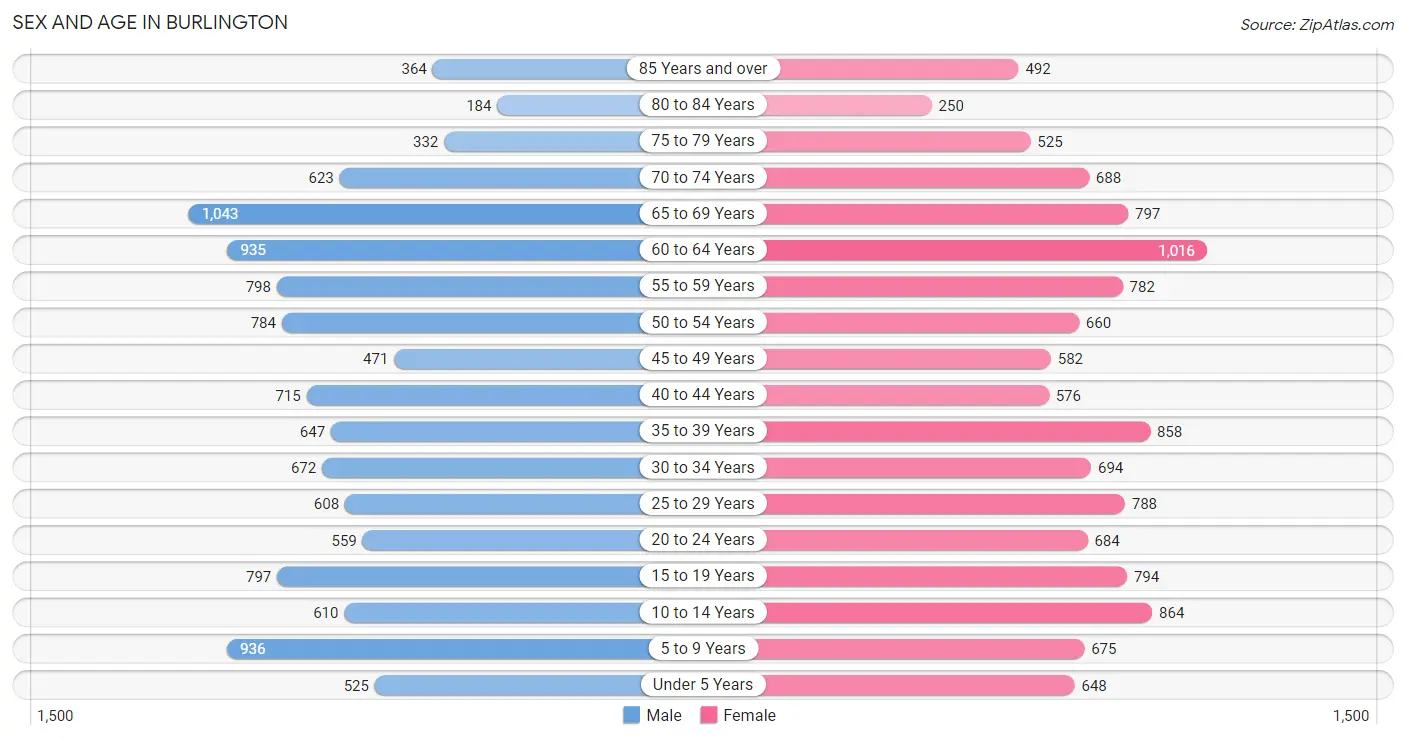
The most populous age groups in Burlington are 65 to 69 Years (1,043 | 9.0%) for men and 60 to 64 Years (1,016 | 8.2%) for women.
| Age Bracket | Male | Female |
| Under 5 Years | 525 (4.5%) | 648 (5.2%) |
| 5 to 9 Years | 936 (8.1%) | 675 (5.5%) |
| 10 to 14 Years | 610 (5.3%) | 864 (7.0%) |
| 15 to 19 Years | 797 (6.9%) | 794 (6.4%) |
| 20 to 24 Years | 559 (4.8%) | 684 (5.5%) |
| 25 to 29 Years | 608 (5.2%) | 788 (6.4%) |
| 30 to 34 Years | 672 (5.8%) | 694 (5.6%) |
| 35 to 39 Years | 647 (5.6%) | 858 (6.9%) |
| 40 to 44 Years | 715 (6.2%) | 576 (4.7%) |
| 45 to 49 Years | 471 (4.1%) | 582 (4.7%) |
| 50 to 54 Years | 784 (6.8%) | 660 (5.3%) |
| 55 to 59 Years | 798 (6.9%) | 782 (6.3%) |
| 60 to 64 Years | 935 (8.1%) | 1,016 (8.2%) |
| 65 to 69 Years | 1,043 (9.0%) | 797 (6.4%) |
| 70 to 74 Years | 623 (5.4%) | 688 (5.6%) |
| 75 to 79 Years | 332 (2.9%) | 525 (4.2%) |
| 80 to 84 Years | 184 (1.6%) | 250 (2.0%) |
| 85 Years and over | 364 (3.1%) | 492 (4.0%) |
| Total | 11,603 (100.0%) | 12,373 (100.0%) |
Families and Households in Burlington
Median Family Size in Burlington
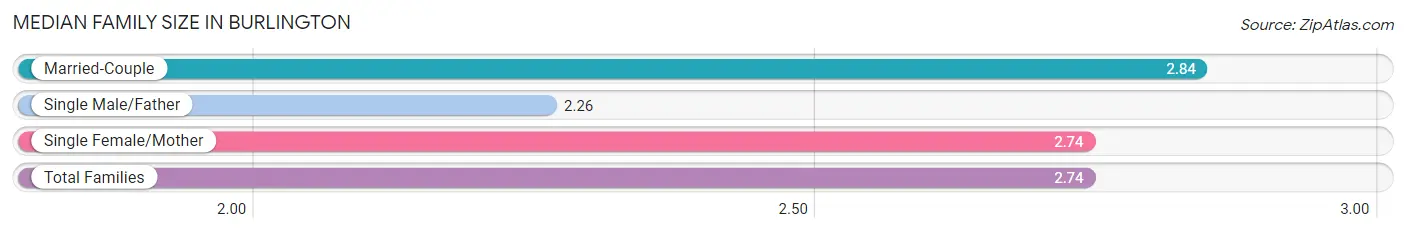
The median family size in Burlington is 2.74 persons per family, with married-couple families (4,000 | 63.0%) accounting for the largest median family size of 2.84 persons per family. On the other hand, single male/father families (749 | 11.8%) represent the smallest median family size with 2.26 persons per family.
| Family Type | # Families | Family Size |
| Married-Couple | 4,000 (63.0%) | 2.84 |
| Single Male/Father | 749 (11.8%) | 2.26 |
| Single Female/Mother | 1,602 (25.2%) | 2.74 |
| Total Families | 6,351 (100.0%) | 2.74 |
Median Household Size in Burlington
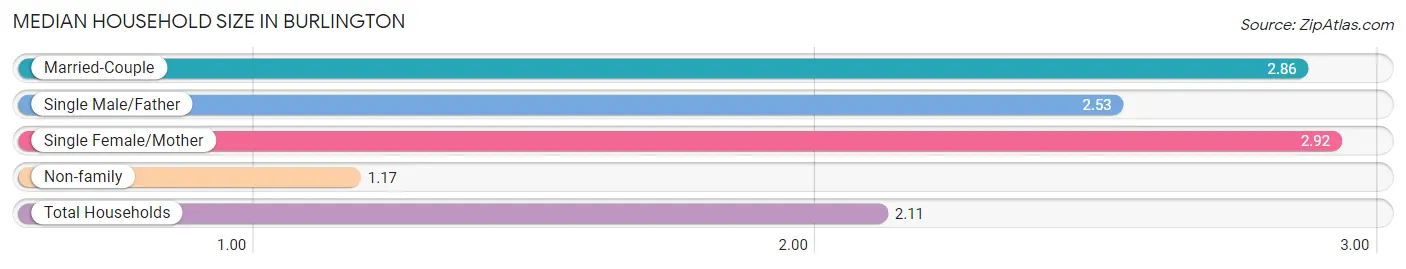
The median household size in Burlington is 2.11 persons per household, with single female/mother households (1,602 | 14.3%) accounting for the largest median household size of 2.92 persons per household. non-family households (4,856 | 43.3%) represent the smallest median household size with 1.17 persons per household.
| Household Type | # Households | Household Size |
| Married-Couple | 4,000 (35.7%) | 2.86 |
| Single Male/Father | 749 (6.7%) | 2.53 |
| Single Female/Mother | 1,602 (14.3%) | 2.92 |
| Non-family | 4,856 (43.3%) | 1.17 |
| Total Households | 11,207 (100.0%) | 2.11 |
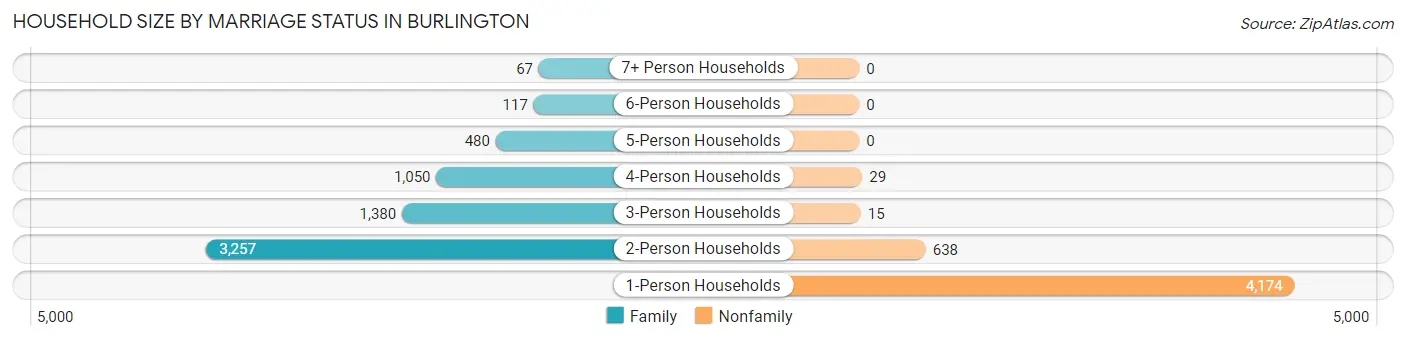
Household Size by Marriage Status in Burlington
Out of a total of 11,207 households in Burlington, 6,351 (56.7%) are family households, while 4,856 (43.3%) are nonfamily households. The most numerous type of family households are 2-person households, comprising 3,257, and the most common type of nonfamily households are 1-person households, comprising 4,174.
| Household Size | Family Households | Nonfamily Households |
| 1-Person Households | - | 4,174 (37.2%) |
| 2-Person Households | 3,257 (29.1%) | 638 (5.7%) |
| 3-Person Households | 1,380 (12.3%) | 15 (0.1%) |
| 4-Person Households | 1,050 (9.4%) | 29 (0.3%) |
| 5-Person Households | 480 (4.3%) | 0 (0.0%) |
| 6-Person Households | 117 (1.0%) | 0 (0.0%) |
| 7+ Person Households | 67 (0.6%) | 0 (0.0%) |
| Total | 6,351 (56.7%) | 4,856 (43.3%) |
Female Fertility in Burlington
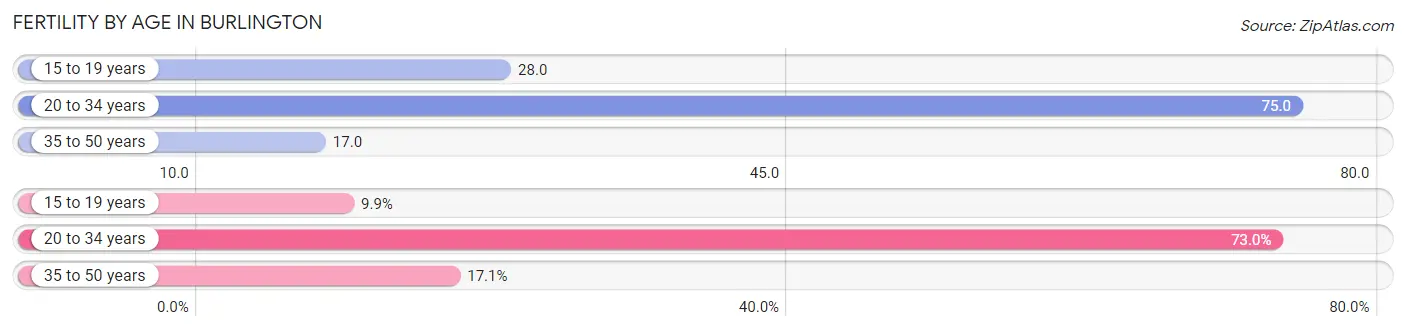
Fertility by Age in Burlington
Average fertility rate in Burlington is 43.0 births per 1,000 women. Women in the age bracket of 20 to 34 years have the highest fertility rate with 75.0 births per 1,000 women. Women in the age bracket of 20 to 34 years acount for 73.0% of all women with births.
| Age Bracket | Women with Births | Births / 1,000 Women |
| 15 to 19 years | 22 (9.9%) | 28.0 |
| 20 to 34 years | 162 (73.0%) | 75.0 |
| 35 to 50 years | 38 (17.1%) | 17.0 |
| Total | 222 (100.0%) | 43.0 |
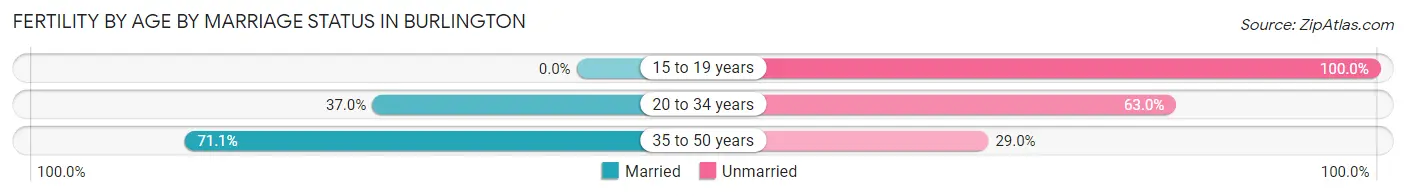
Fertility by Age by Marriage Status in Burlington
39.2% of women with births (222) in Burlington are married. The highest percentage of unmarried women with births falls into 15 to 19 years age bracket with 100.0% of them unmarried at the time of birth, while the lowest percentage of unmarried women with births belong to 35 to 50 years age bracket with 28.9% of them unmarried.
| Age Bracket | Married | Unmarried |
| 15 to 19 years | 0 (0.0%) | 22 (100.0%) |
| 20 to 34 years | 60 (37.0%) | 102 (63.0%) |
| 35 to 50 years | 27 (71.1%) | 11 (28.9%) |
| Total | 87 (39.2%) | 135 (60.8%) |
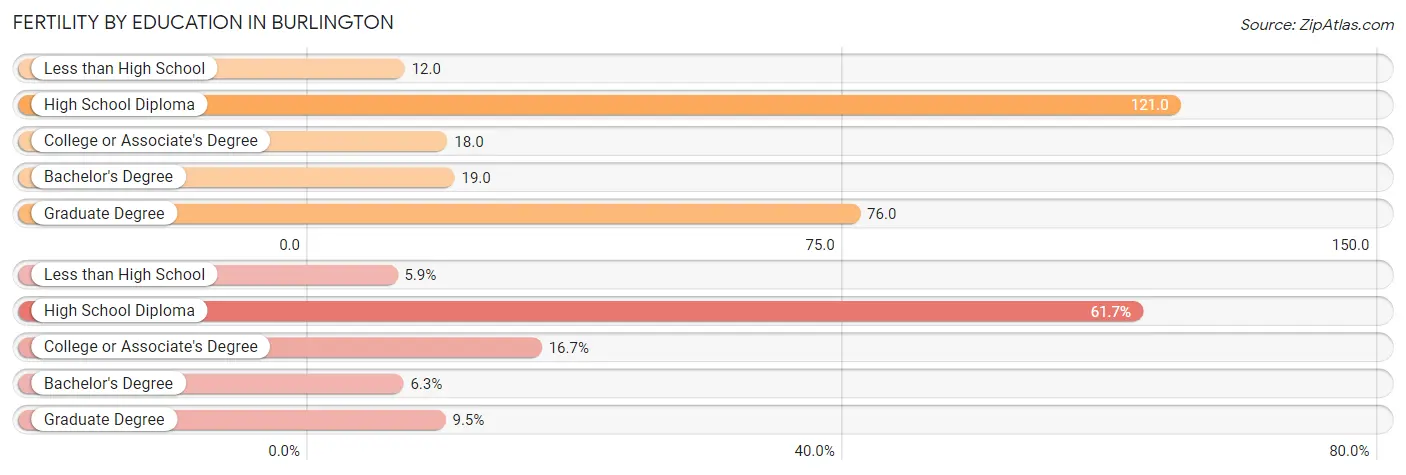
Fertility by Education in Burlington
Average fertility rate in Burlington is 43.0 births per 1,000 women. Women with the education attainment of high school diploma have the highest fertility rate of 121.0 births per 1,000 women, while women with the education attainment of less than high school have the lowest fertility at 12.0 births per 1,000 women. Women with the education attainment of high school diploma represent 61.7% of all women with births.
| Educational Attainment | Women with Births | Births / 1,000 Women |
| Less than High School | 13 (5.9%) | 12.0 |
| High School Diploma | 137 (61.7%) | 121.0 |
| College or Associate's Degree | 37 (16.7%) | 18.0 |
| Bachelor's Degree | 14 (6.3%) | 19.0 |
| Graduate Degree | 21 (9.5%) | 76.0 |
| Total | 222 (100.0%) | 43.0 |
Fertility by Education by Marriage Status in Burlington
60.8% of women with births in Burlington are unmarried. Women with the educational attainment of bachelor's degree are most likely to be married with 100.0% of them married at childbirth, while women with the educational attainment of less than high school are least likely to be married with 100.0% of them unmarried at childbirth.
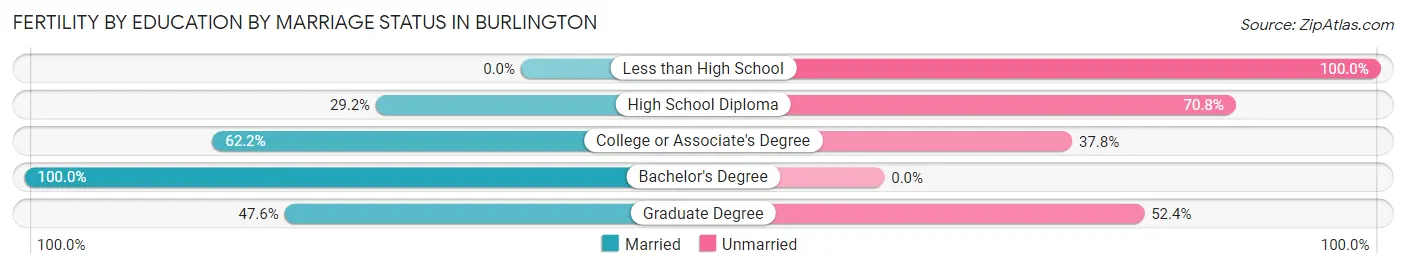
| Educational Attainment | Married | Unmarried |
| Less than High School | 0 (0.0%) | 13 (100.0%) |
| High School Diploma | 40 (29.2%) | 97 (70.8%) |
| College or Associate's Degree | 23 (62.2%) | 14 (37.8%) |
| Bachelor's Degree | 14 (100.0%) | 0 (0.0%) |
| Graduate Degree | 10 (47.6%) | 11 (52.4%) |
| Total | 87 (39.2%) | 135 (60.8%) |
Employment Characteristics in Burlington
Employment by Class of Employer in Burlington
Among the 10,937 employed individuals in Burlington, private company employees (7,578 | 69.3%), local government employees (986 | 9.0%), and not-for-profit organizations (980 | 9.0%) make up the most common classes of employment.
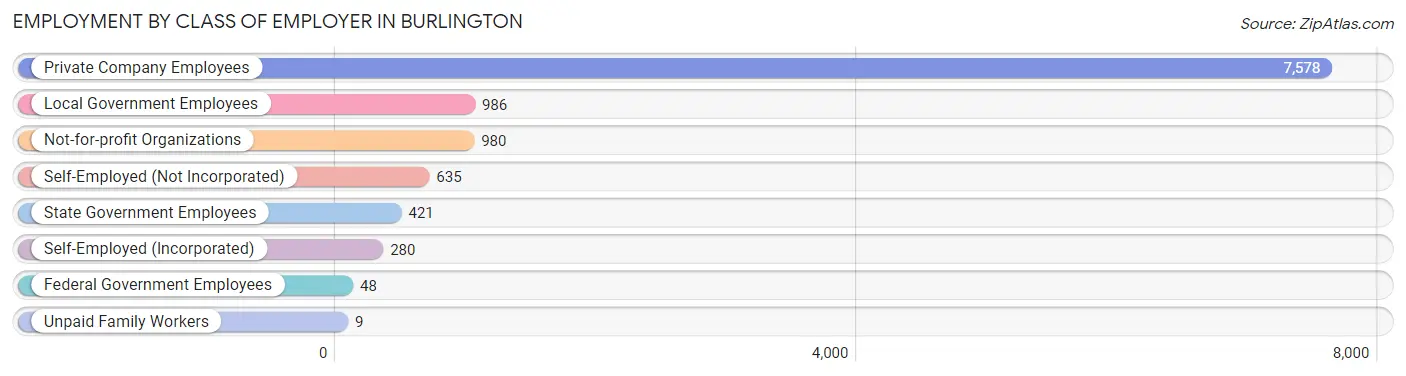
| Employer Class | # Employees | % Employees |
| Private Company Employees | 7,578 | 69.3% |
| Self-Employed (Incorporated) | 280 | 2.6% |
| Self-Employed (Not Incorporated) | 635 | 5.8% |
| Not-for-profit Organizations | 980 | 9.0% |
| Local Government Employees | 986 | 9.0% |
| State Government Employees | 421 | 3.8% |
| Federal Government Employees | 48 | 0.4% |
| Unpaid Family Workers | 9 | 0.1% |
| Total | 10,937 | 100.0% |
Employment Status by Age in Burlington
According to the labor force statistics for Burlington, out of the total population over 16 years of age (19,504), 59.1% or 11,527 individuals are in the labor force, with 4.0% or 461 of them unemployed. The age group with the highest labor force participation rate is 35 to 44 years, with 86.3% or 2,413 individuals in the labor force. Within the labor force, the 20 to 24 years age range has the highest percentage of unemployed individuals, with 10.8% or 110 of them being unemployed.
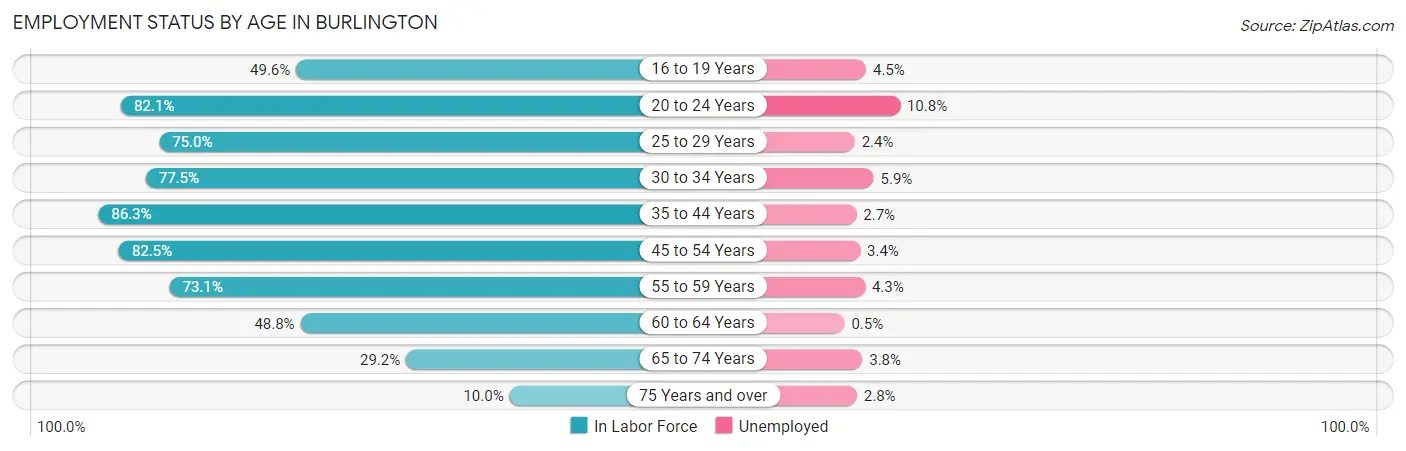
| Age Bracket | In Labor Force | Unemployed |
| 16 to 19 Years | 683 (49.6%) | 31 (4.5%) |
| 20 to 24 Years | 1,021 (82.1%) | 110 (10.8%) |
| 25 to 29 Years | 1,047 (75.0%) | 25 (2.4%) |
| 30 to 34 Years | 1,059 (77.5%) | 62 (5.9%) |
| 35 to 44 Years | 2,413 (86.3%) | 65 (2.7%) |
| 45 to 54 Years | 2,060 (82.5%) | 70 (3.4%) |
| 55 to 59 Years | 1,155 (73.1%) | 50 (4.3%) |
| 60 to 64 Years | 952 (48.8%) | 5 (0.5%) |
| 65 to 74 Years | 920 (29.2%) | 35 (3.8%) |
| 75 Years and over | 215 (10.0%) | 6 (2.8%) |
| Total | 11,527 (59.1%) | 461 (4.0%) |
Employment Status by Educational Attainment in Burlington
According to labor force statistics for Burlington, 75.0% of individuals (8,690) out of the total population between 25 and 64 years of age (11,586) are in the labor force, with 3.2% or 278 of them being unemployed. The group with the highest labor force participation rate are those with the educational attainment of bachelor's degree or higher, with 89.0% or 2,152 individuals in the labor force. Within the labor force, individuals with less than high school education have the highest percentage of unemployment, with 15.3% or 88 of them being unemployed.
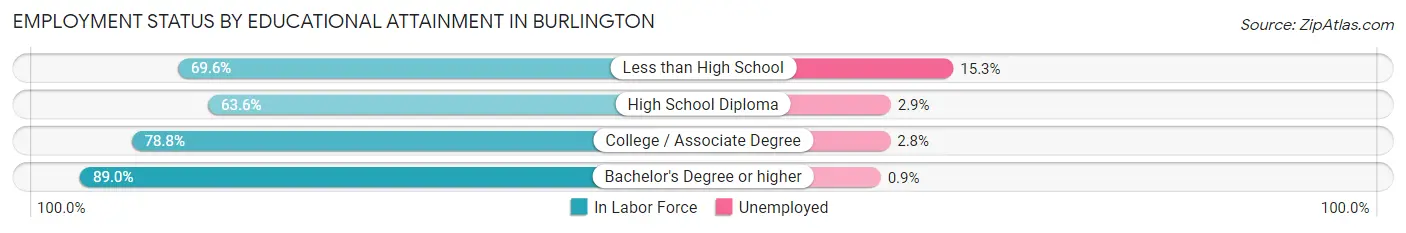
| Educational Attainment | In Labor Force | Unemployed |
| Less than High School | 577 (69.6%) | 127 (15.3%) |
| High School Diploma | 2,576 (63.6%) | 117 (2.9%) |
| College / Associate Degree | 3,379 (78.8%) | 120 (2.8%) |
| Bachelor's Degree or higher | 2,152 (89.0%) | 22 (0.9%) |
| Total | 8,690 (75.0%) | 371 (3.2%) |
Employment Occupations by Sex in Burlington
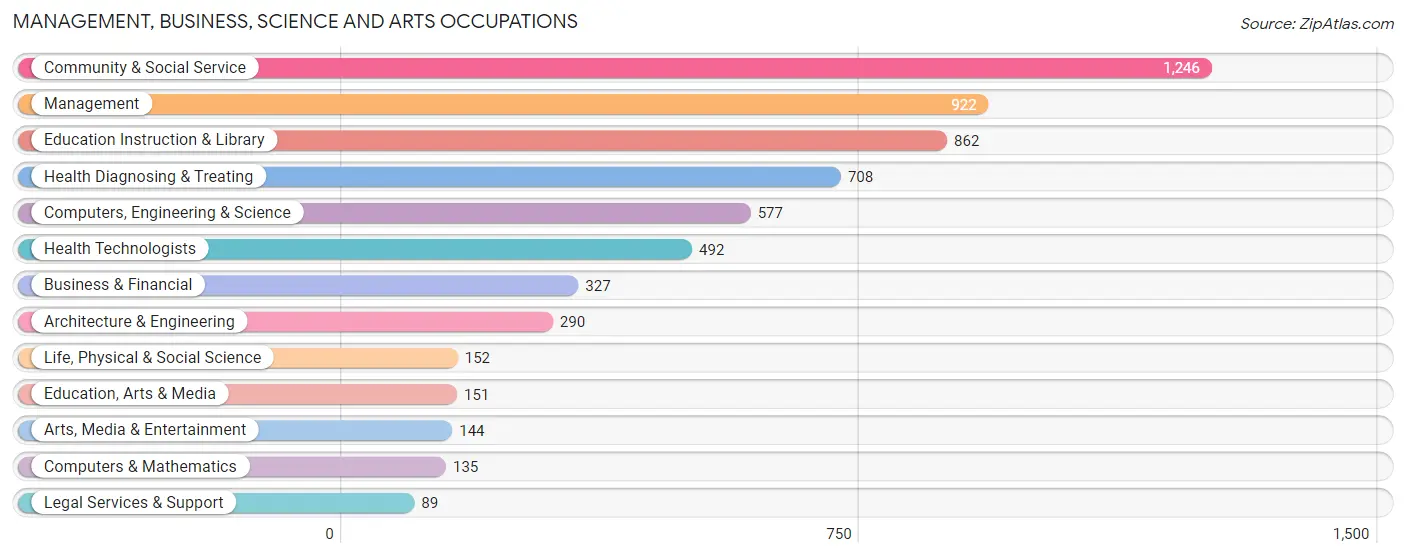
Management, Business, Science and Arts Occupations
The most common Management, Business, Science and Arts occupations in Burlington are Community & Social Service (1,246 | 11.3%), Management (922 | 8.3%), Education Instruction & Library (862 | 7.8%), Health Diagnosing & Treating (708 | 6.4%), and Computers, Engineering & Science (577 | 5.2%).
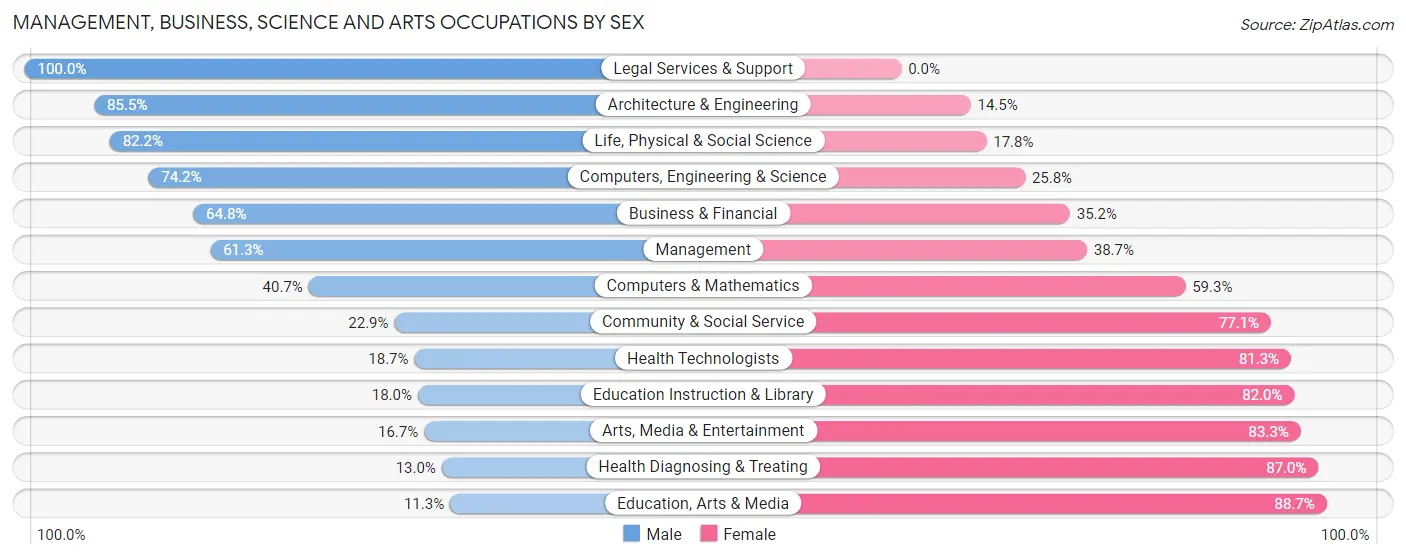
Management, Business, Science and Arts Occupations by Sex
Within the Management, Business, Science and Arts occupations in Burlington, the most male-oriented occupations are Legal Services & Support (100.0%), Architecture & Engineering (85.5%), and Life, Physical & Social Science (82.2%), while the most female-oriented occupations are Education, Arts & Media (88.7%), Health Diagnosing & Treating (87.0%), and Arts, Media & Entertainment (83.3%).
| Occupation | Male | Female |
| Management | 565 (61.3%) | 357 (38.7%) |
| Business & Financial | 212 (64.8%) | 115 (35.2%) |
| Computers, Engineering & Science | 428 (74.2%) | 149 (25.8%) |
| Computers & Mathematics | 55 (40.7%) | 80 (59.3%) |
| Architecture & Engineering | 248 (85.5%) | 42 (14.5%) |
| Life, Physical & Social Science | 125 (82.2%) | 27 (17.8%) |
| Community & Social Service | 285 (22.9%) | 961 (77.1%) |
| Education, Arts & Media | 17 (11.3%) | 134 (88.7%) |
| Legal Services & Support | 89 (100.0%) | 0 (0.0%) |
| Education Instruction & Library | 155 (18.0%) | 707 (82.0%) |
| Arts, Media & Entertainment | 24 (16.7%) | 120 (83.3%) |
| Health Diagnosing & Treating | 92 (13.0%) | 616 (87.0%) |
| Health Technologists | 92 (18.7%) | 400 (81.3%) |
| Total (Category) | 1,582 (41.8%) | 2,198 (58.2%) |
| Total (Overall) | 5,675 (51.3%) | 5,386 (48.7%) |
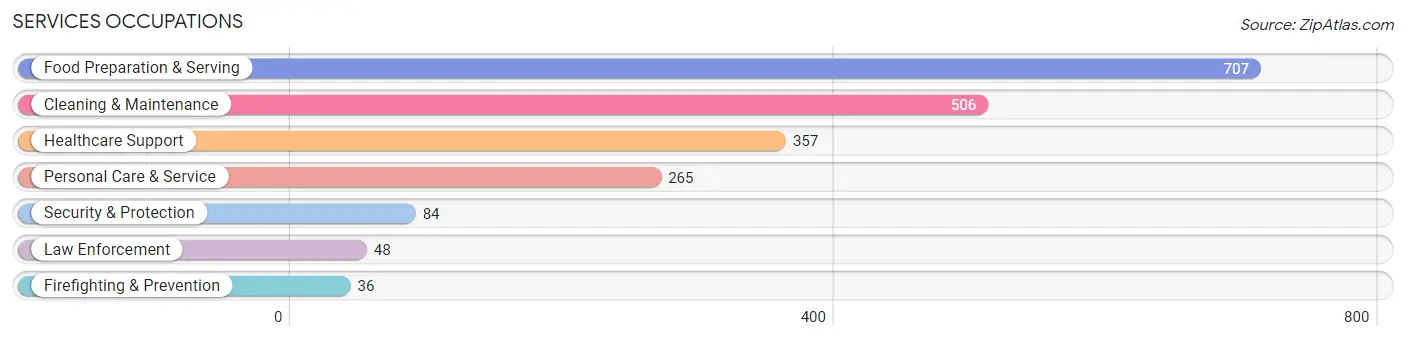
Services Occupations
The most common Services occupations in Burlington are Food Preparation & Serving (707 | 6.4%), Cleaning & Maintenance (506 | 4.6%), Healthcare Support (357 | 3.2%), Personal Care & Service (265 | 2.4%), and Security & Protection (84 | 0.8%).
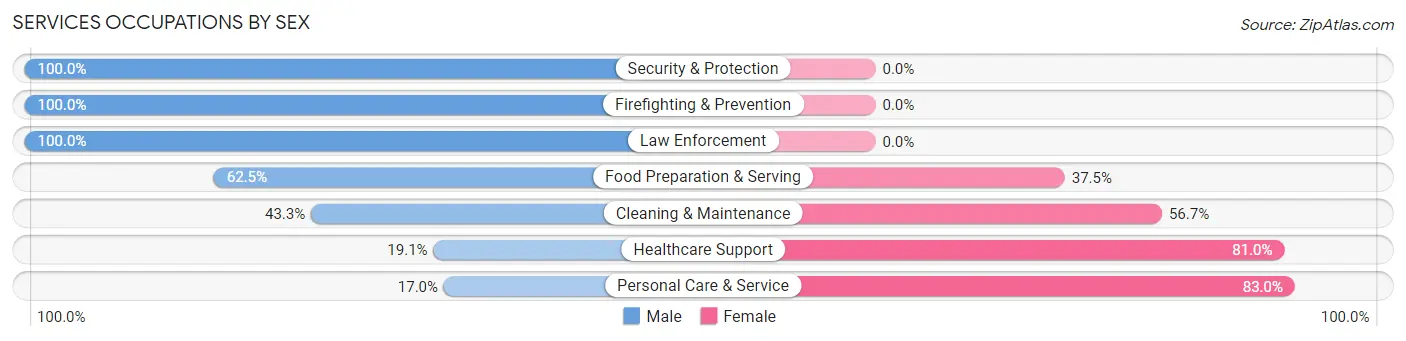
Services Occupations by Sex
Within the Services occupations in Burlington, the most male-oriented occupations are Security & Protection (100.0%), Firefighting & Prevention (100.0%), and Law Enforcement (100.0%), while the most female-oriented occupations are Personal Care & Service (83.0%), Healthcare Support (80.9%), and Cleaning & Maintenance (56.7%).
| Occupation | Male | Female |
| Healthcare Support | 68 (19.1%) | 289 (80.9%) |
| Security & Protection | 84 (100.0%) | 0 (0.0%) |
| Firefighting & Prevention | 36 (100.0%) | 0 (0.0%) |
| Law Enforcement | 48 (100.0%) | 0 (0.0%) |
| Food Preparation & Serving | 442 (62.5%) | 265 (37.5%) |
| Cleaning & Maintenance | 219 (43.3%) | 287 (56.7%) |
| Personal Care & Service | 45 (17.0%) | 220 (83.0%) |
| Total (Category) | 858 (44.7%) | 1,061 (55.3%) |
| Total (Overall) | 5,675 (51.3%) | 5,386 (48.7%) |
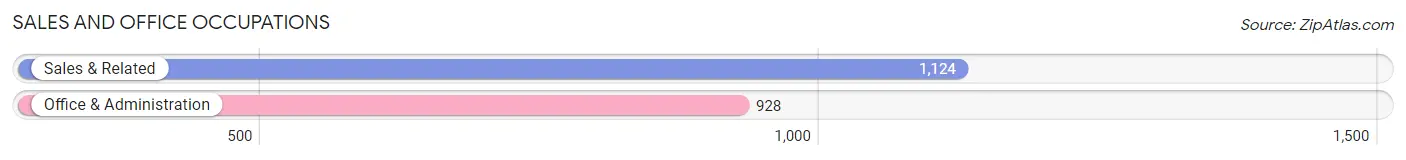
Sales and Office Occupations
The most common Sales and Office occupations in Burlington are Sales & Related (1,124 | 10.2%), and Office & Administration (928 | 8.4%).
Sales and Office Occupations by Sex
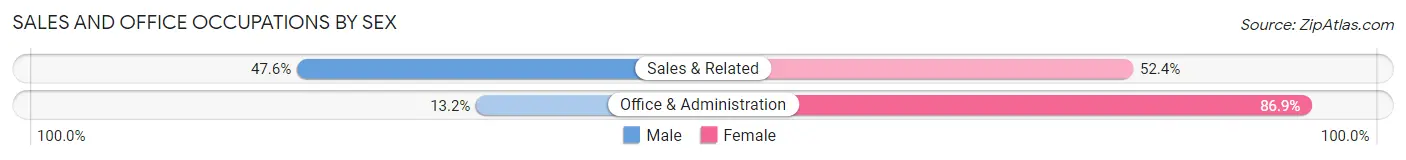
| Occupation | Male | Female |
| Sales & Related | 535 (47.6%) | 589 (52.4%) |
| Office & Administration | 122 (13.2%) | 806 (86.9%) |
| Total (Category) | 657 (32.0%) | 1,395 (68.0%) |
| Total (Overall) | 5,675 (51.3%) | 5,386 (48.7%) |
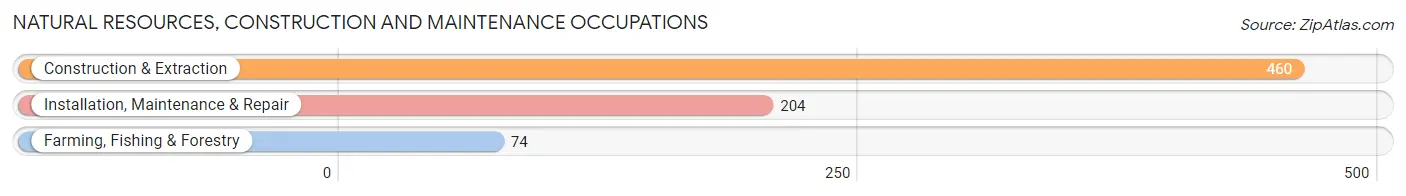
Natural Resources, Construction and Maintenance Occupations
The most common Natural Resources, Construction and Maintenance occupations in Burlington are Construction & Extraction (460 | 4.2%), Installation, Maintenance & Repair (204 | 1.8%), and Farming, Fishing & Forestry (74 | 0.7%).
Natural Resources, Construction and Maintenance Occupations by Sex
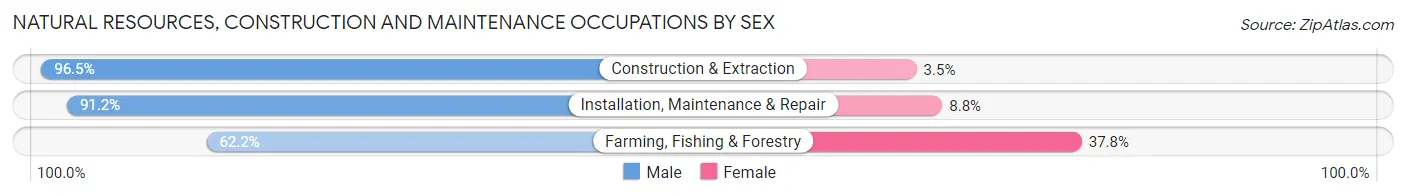
| Occupation | Male | Female |
| Farming, Fishing & Forestry | 46 (62.2%) | 28 (37.8%) |
| Construction & Extraction | 444 (96.5%) | 16 (3.5%) |
| Installation, Maintenance & Repair | 186 (91.2%) | 18 (8.8%) |
| Total (Category) | 676 (91.6%) | 62 (8.4%) |
| Total (Overall) | 5,675 (51.3%) | 5,386 (48.7%) |
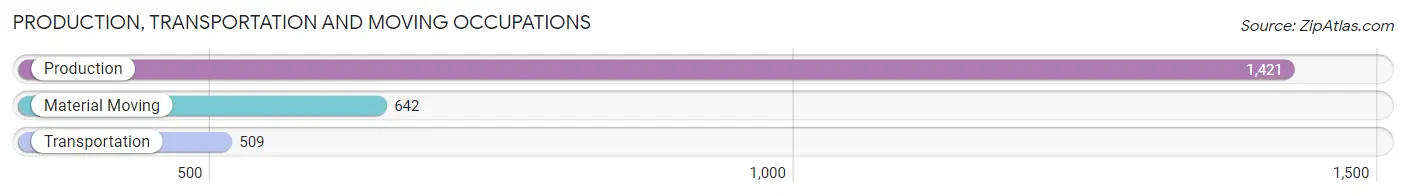
Production, Transportation and Moving Occupations
The most common Production, Transportation and Moving occupations in Burlington are Production (1,421 | 12.9%), Material Moving (642 | 5.8%), and Transportation (509 | 4.6%).
Production, Transportation and Moving Occupations by Sex
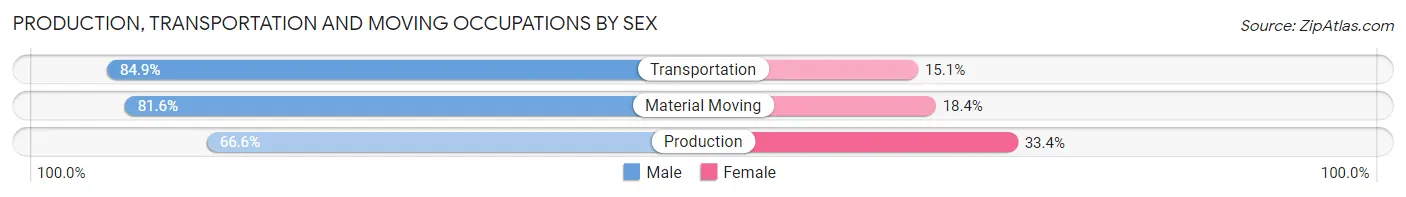
| Occupation | Male | Female |
| Production | 946 (66.6%) | 475 (33.4%) |
| Transportation | 432 (84.9%) | 77 (15.1%) |
| Material Moving | 524 (81.6%) | 118 (18.4%) |
| Total (Category) | 1,902 (74.0%) | 670 (26.1%) |
| Total (Overall) | 5,675 (51.3%) | 5,386 (48.7%) |
Employment Industries by Sex in Burlington
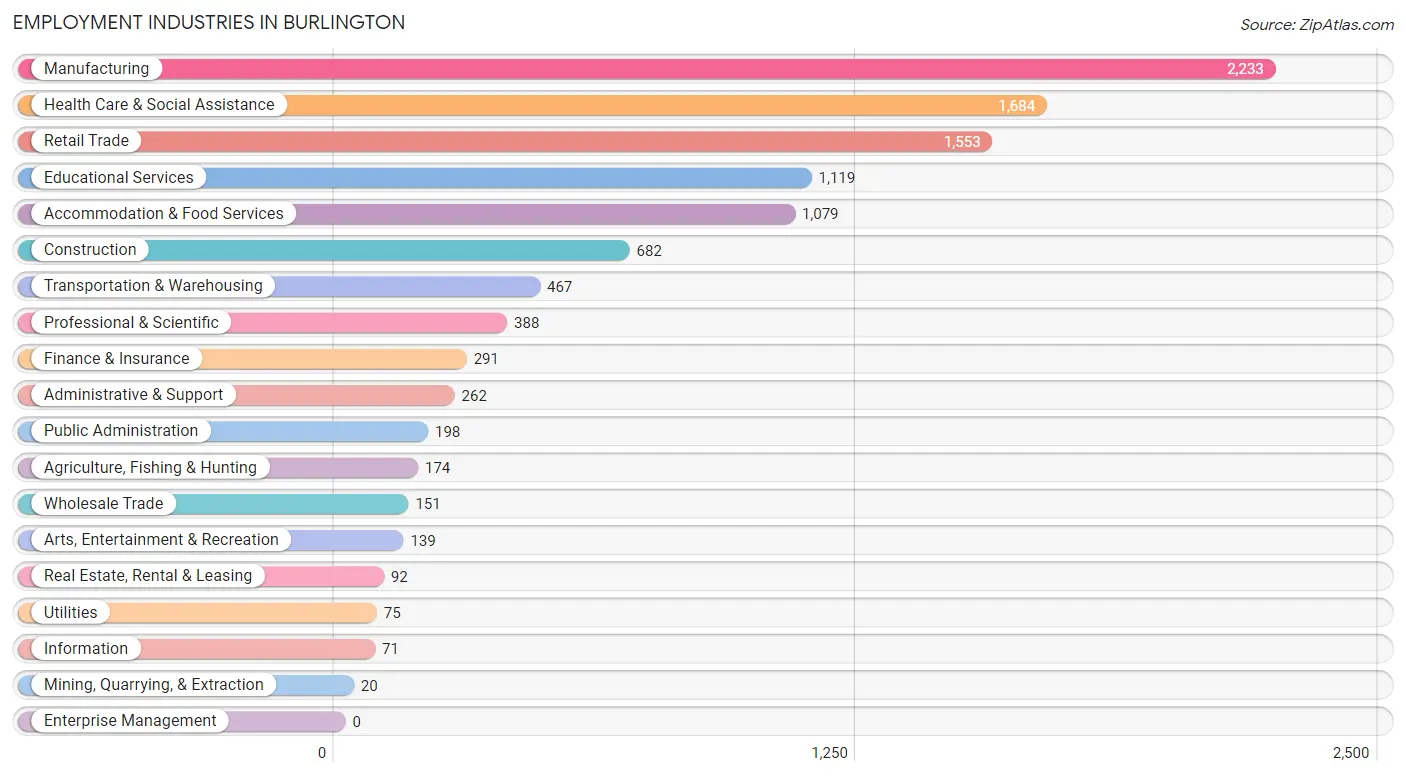
Employment Industries in Burlington
The major employment industries in Burlington include Manufacturing (2,233 | 20.2%), Health Care & Social Assistance (1,684 | 15.2%), Retail Trade (1,553 | 14.0%), Educational Services (1,119 | 10.1%), and Accommodation & Food Services (1,079 | 9.8%).
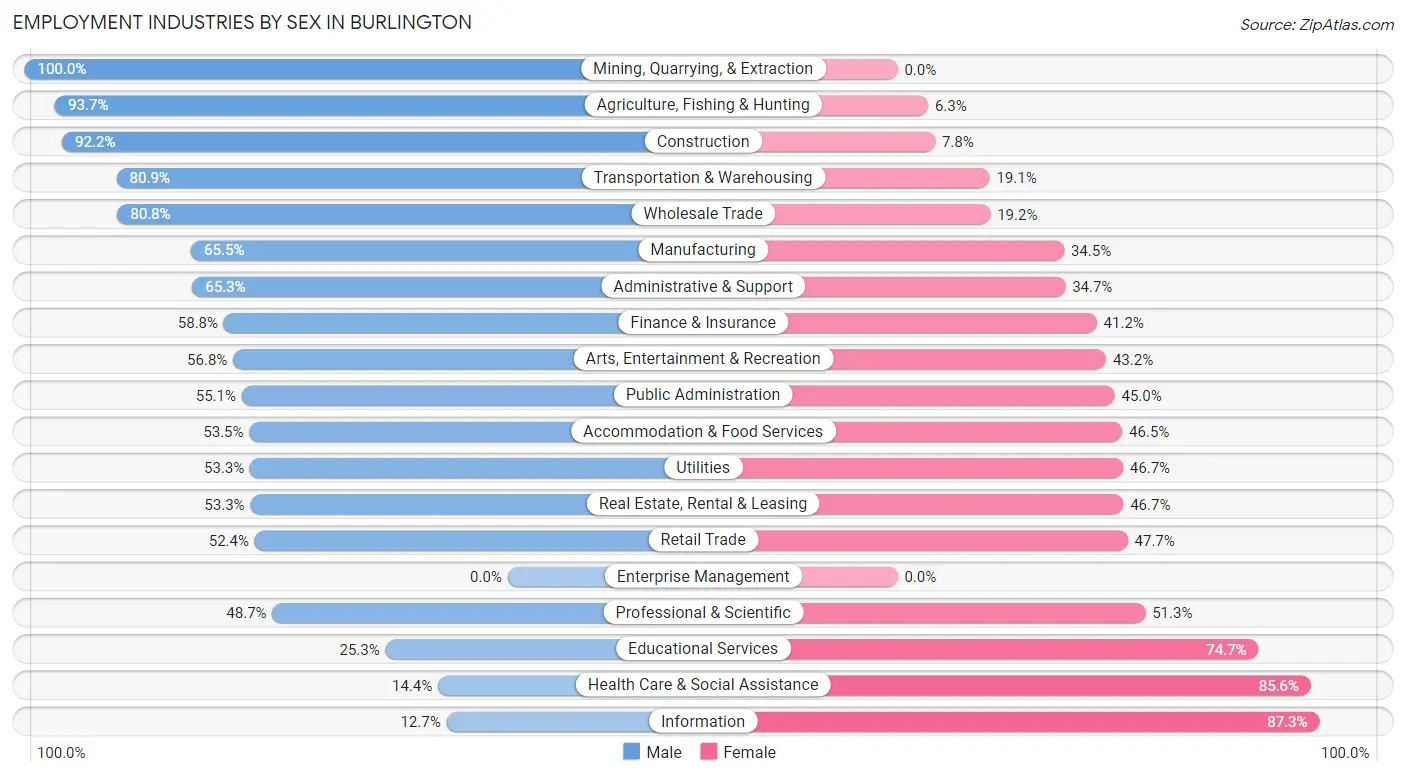
Employment Industries by Sex in Burlington
The Burlington industries that see more men than women are Mining, Quarrying, & Extraction (100.0%), Agriculture, Fishing & Hunting (93.7%), and Construction (92.2%), whereas the industries that tend to have a higher number of women are Information (87.3%), Health Care & Social Assistance (85.6%), and Educational Services (74.7%).
| Industry | Male | Female |
| Agriculture, Fishing & Hunting | 163 (93.7%) | 11 (6.3%) |
| Mining, Quarrying, & Extraction | 20 (100.0%) | 0 (0.0%) |
| Construction | 629 (92.2%) | 53 (7.8%) |
| Manufacturing | 1,463 (65.5%) | 770 (34.5%) |
| Wholesale Trade | 122 (80.8%) | 29 (19.2%) |
| Retail Trade | 813 (52.3%) | 740 (47.6%) |
| Transportation & Warehousing | 378 (80.9%) | 89 (19.1%) |
| Utilities | 40 (53.3%) | 35 (46.7%) |
| Information | 9 (12.7%) | 62 (87.3%) |
| Finance & Insurance | 171 (58.8%) | 120 (41.2%) |
| Real Estate, Rental & Leasing | 49 (53.3%) | 43 (46.7%) |
| Professional & Scientific | 189 (48.7%) | 199 (51.3%) |
| Enterprise Management | 0 (0.0%) | 0 (0.0%) |
| Administrative & Support | 171 (65.3%) | 91 (34.7%) |
| Educational Services | 283 (25.3%) | 836 (74.7%) |
| Health Care & Social Assistance | 243 (14.4%) | 1,441 (85.6%) |
| Arts, Entertainment & Recreation | 79 (56.8%) | 60 (43.2%) |
| Accommodation & Food Services | 577 (53.5%) | 502 (46.5%) |
| Public Administration | 109 (55.0%) | 89 (45.0%) |
| Total | 5,675 (51.3%) | 5,386 (48.7%) |
Education in Burlington
School Enrollment in Burlington
The most common levels of schooling among the 4,964 students in Burlington are high school (1,271 | 25.6%), middle school (1,190 | 24.0%), and elementary school (1,163 | 23.4%).
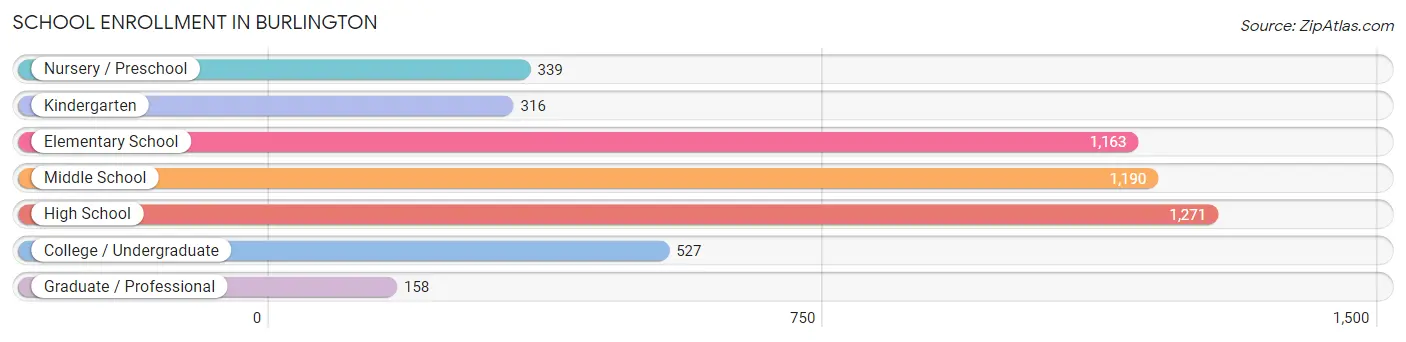
| School Level | # Students | % Students |
| Nursery / Preschool | 339 | 6.8% |
| Kindergarten | 316 | 6.4% |
| Elementary School | 1,163 | 23.4% |
| Middle School | 1,190 | 24.0% |
| High School | 1,271 | 25.6% |
| College / Undergraduate | 527 | 10.6% |
| Graduate / Professional | 158 | 3.2% |
| Total | 4,964 | 100.0% |
School Enrollment by Age by Funding Source in Burlington
Out of a total of 4,964 students who are enrolled in schools in Burlington, 576 (11.6%) attend a private institution, while the remaining 4,388 (88.4%) are enrolled in public schools. The age group of 25 to 34 year olds has the highest likelihood of being enrolled in private schools, with 80 (52.6% in the age bracket) enrolled. Conversely, the age group of 18 to 19 year olds has the lowest likelihood of being enrolled in a private school, with 226 (97.8% in the age bracket) attending a public institution.
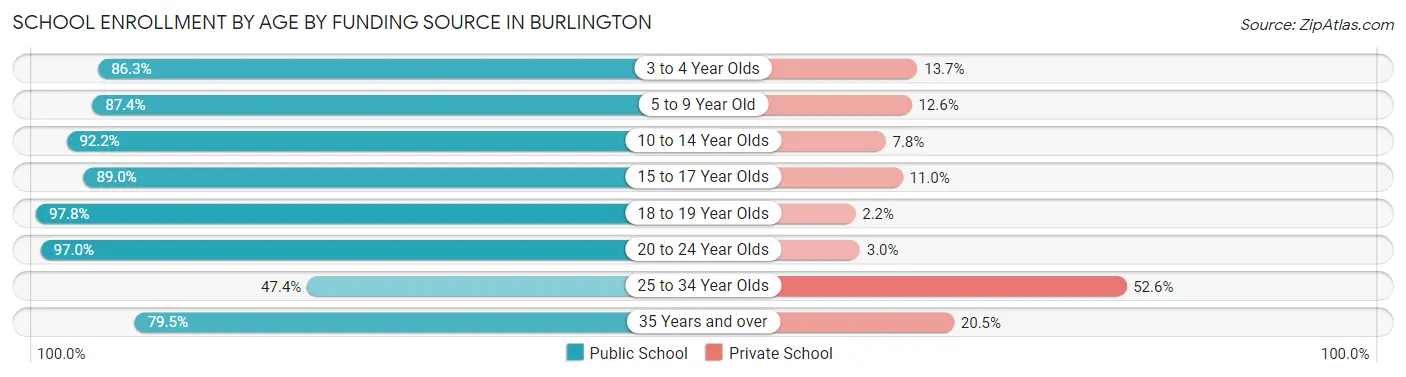
| Age Bracket | Public School | Private School |
| 3 to 4 Year Olds | 195 (86.3%) | 31 (13.7%) |
| 5 to 9 Year Old | 1,266 (87.4%) | 183 (12.6%) |
| 10 to 14 Year Olds | 1,359 (92.2%) | 115 (7.8%) |
| 15 to 17 Year Olds | 893 (89.0%) | 110 (11.0%) |
| 18 to 19 Year Olds | 226 (97.8%) | 5 (2.2%) |
| 20 to 24 Year Olds | 194 (97.0%) | 6 (3.0%) |
| 25 to 34 Year Olds | 72 (47.4%) | 80 (52.6%) |
| 35 Years and over | 182 (79.5%) | 47 (20.5%) |
| Total | 4,388 (88.4%) | 576 (11.6%) |
Educational Attainment by Field of Study in Burlington
Education (867 | 21.7%), business (810 | 20.3%), science & technology (436 | 10.9%), bio, nature & agricultural (312 | 7.8%), and social sciences (246 | 6.1%) are the most common fields of study among 3,997 individuals in Burlington who have obtained a bachelor's degree or higher.
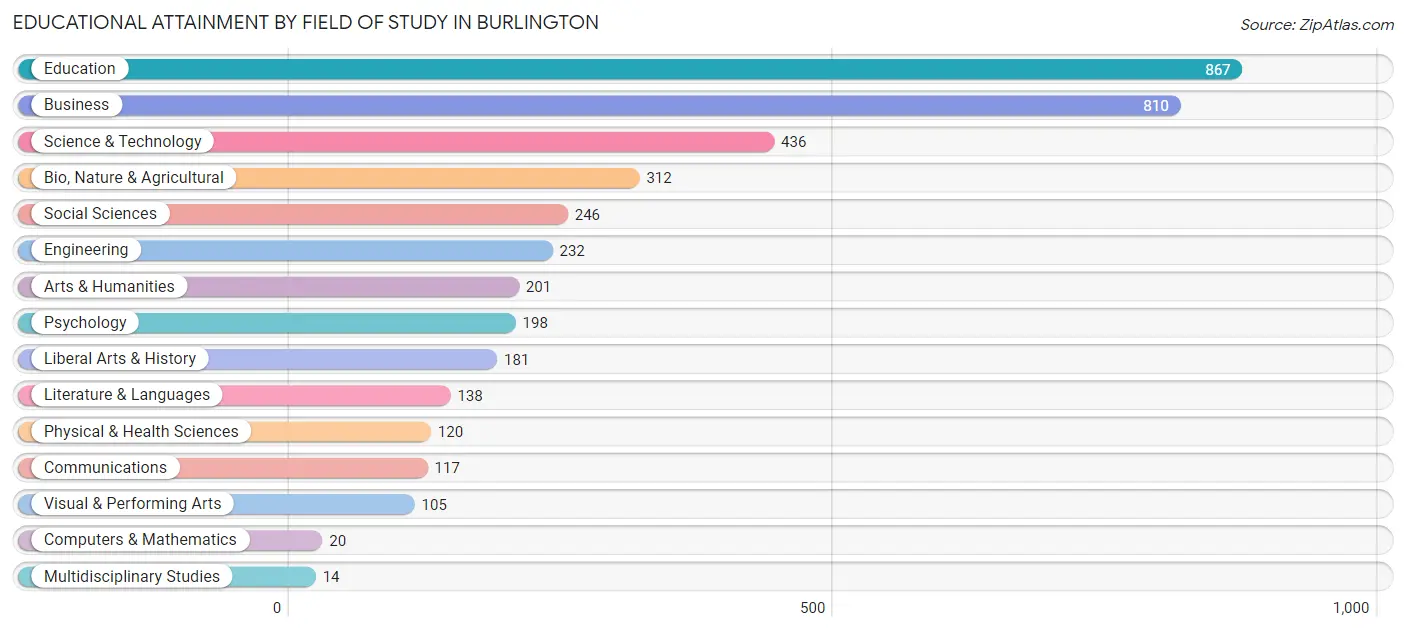
| Field of Study | # Graduates | % Graduates |
| Computers & Mathematics | 20 | 0.5% |
| Bio, Nature & Agricultural | 312 | 7.8% |
| Physical & Health Sciences | 120 | 3.0% |
| Psychology | 198 | 5.0% |
| Social Sciences | 246 | 6.1% |
| Engineering | 232 | 5.8% |
| Multidisciplinary Studies | 14 | 0.4% |
| Science & Technology | 436 | 10.9% |
| Business | 810 | 20.3% |
| Education | 867 | 21.7% |
| Literature & Languages | 138 | 3.5% |
| Liberal Arts & History | 181 | 4.5% |
| Visual & Performing Arts | 105 | 2.6% |
| Communications | 117 | 2.9% |
| Arts & Humanities | 201 | 5.0% |
| Total | 3,997 | 100.0% |
Transportation & Commute in Burlington
Vehicle Availability by Sex in Burlington
The most prevalent vehicle ownership categories in Burlington are males with 2 vehicles (2,310, accounting for 40.9%) and females with 2 vehicles (2,012, making up 43.7%).
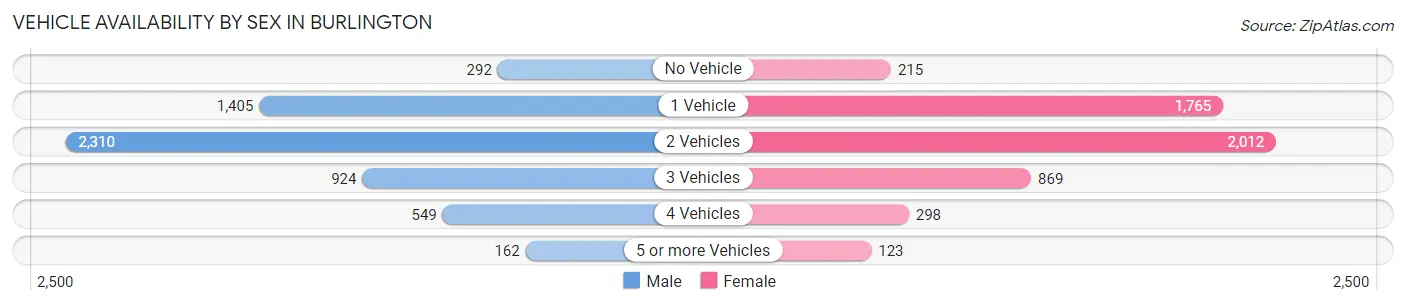
| Vehicles Available | Male | Female |
| No Vehicle | 292 (5.2%) | 215 (4.1%) |
| 1 Vehicle | 1,405 (24.9%) | 1,765 (33.4%) |
| 2 Vehicles | 2,310 (40.9%) | 2,012 (38.1%) |
| 3 Vehicles | 924 (16.4%) | 869 (16.5%) |
| 4 Vehicles | 549 (9.7%) | 298 (5.6%) |
| 5 or more Vehicles | 162 (2.9%) | 123 (2.3%) |
| Total | 5,642 (100.0%) | 5,282 (100.0%) |
Commute Time in Burlington
The most frequently occuring commute durations in Burlington are 10 to 14 minutes (3,473 commuters, 33.1%), 5 to 9 minutes (2,842 commuters, 27.1%), and 15 to 19 minutes (1,804 commuters, 17.2%).
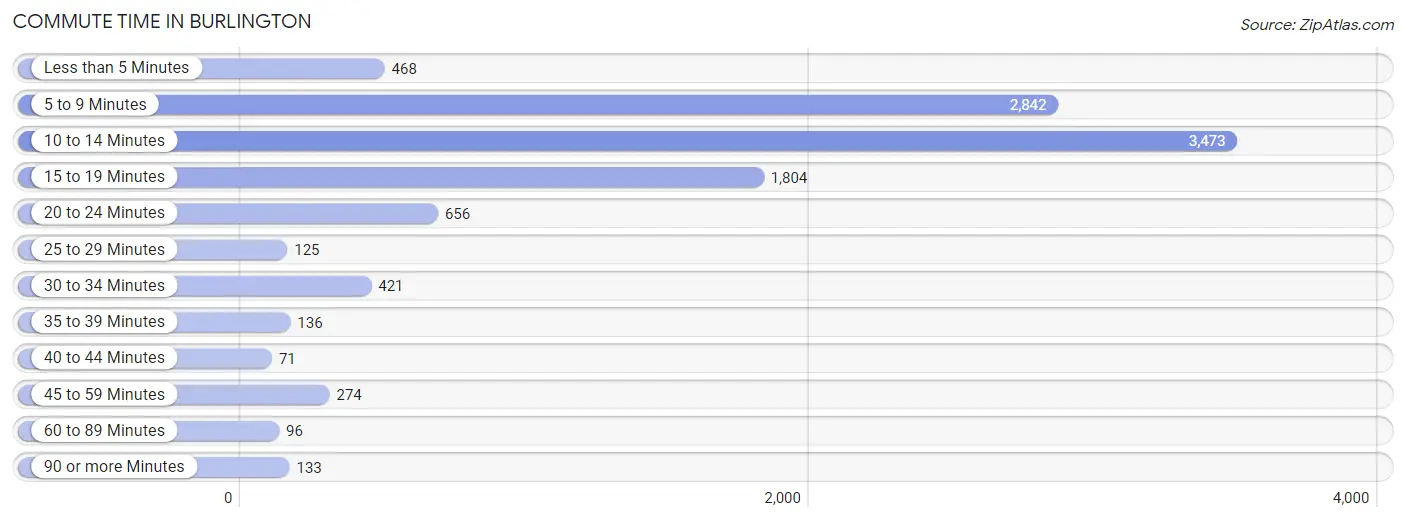
| Commute Time | # Commuters | % Commuters |
| Less than 5 Minutes | 468 | 4.5% |
| 5 to 9 Minutes | 2,842 | 27.1% |
| 10 to 14 Minutes | 3,473 | 33.1% |
| 15 to 19 Minutes | 1,804 | 17.2% |
| 20 to 24 Minutes | 656 | 6.2% |
| 25 to 29 Minutes | 125 | 1.2% |
| 30 to 34 Minutes | 421 | 4.0% |
| 35 to 39 Minutes | 136 | 1.3% |
| 40 to 44 Minutes | 71 | 0.7% |
| 45 to 59 Minutes | 274 | 2.6% |
| 60 to 89 Minutes | 96 | 0.9% |
| 90 or more Minutes | 133 | 1.3% |
Commute Time by Sex in Burlington
The most common commute times in Burlington are 10 to 14 minutes (1,631 commuters, 30.0%) for males and 10 to 14 minutes (1,842 commuters, 36.3%) for females.
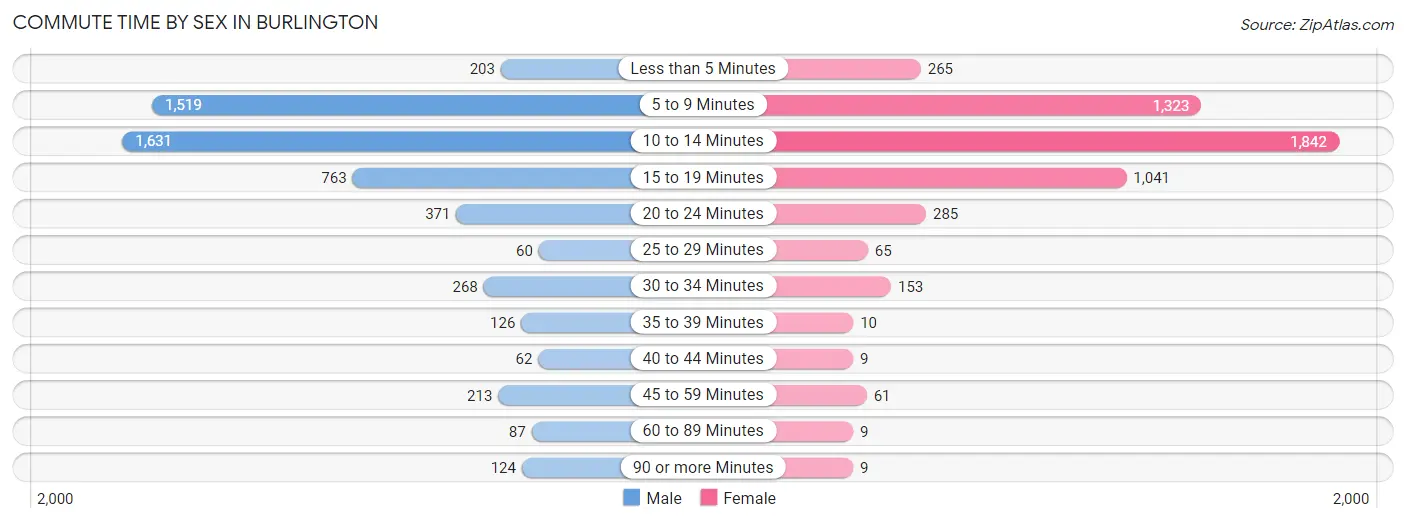
| Commute Time | Male | Female |
| Less than 5 Minutes | 203 (3.7%) | 265 (5.2%) |
| 5 to 9 Minutes | 1,519 (28.0%) | 1,323 (26.1%) |
| 10 to 14 Minutes | 1,631 (30.0%) | 1,842 (36.3%) |
| 15 to 19 Minutes | 763 (14.1%) | 1,041 (20.5%) |
| 20 to 24 Minutes | 371 (6.8%) | 285 (5.6%) |
| 25 to 29 Minutes | 60 (1.1%) | 65 (1.3%) |
| 30 to 34 Minutes | 268 (4.9%) | 153 (3.0%) |
| 35 to 39 Minutes | 126 (2.3%) | 10 (0.2%) |
| 40 to 44 Minutes | 62 (1.1%) | 9 (0.2%) |
| 45 to 59 Minutes | 213 (3.9%) | 61 (1.2%) |
| 60 to 89 Minutes | 87 (1.6%) | 9 (0.2%) |
| 90 or more Minutes | 124 (2.3%) | 9 (0.2%) |
Time of Departure to Work by Sex in Burlington
The most frequent times of departure to work in Burlington are 7:30 AM to 7:59 AM (814, 15.0%) for males and 7:30 AM to 7:59 AM (830, 16.4%) for females.
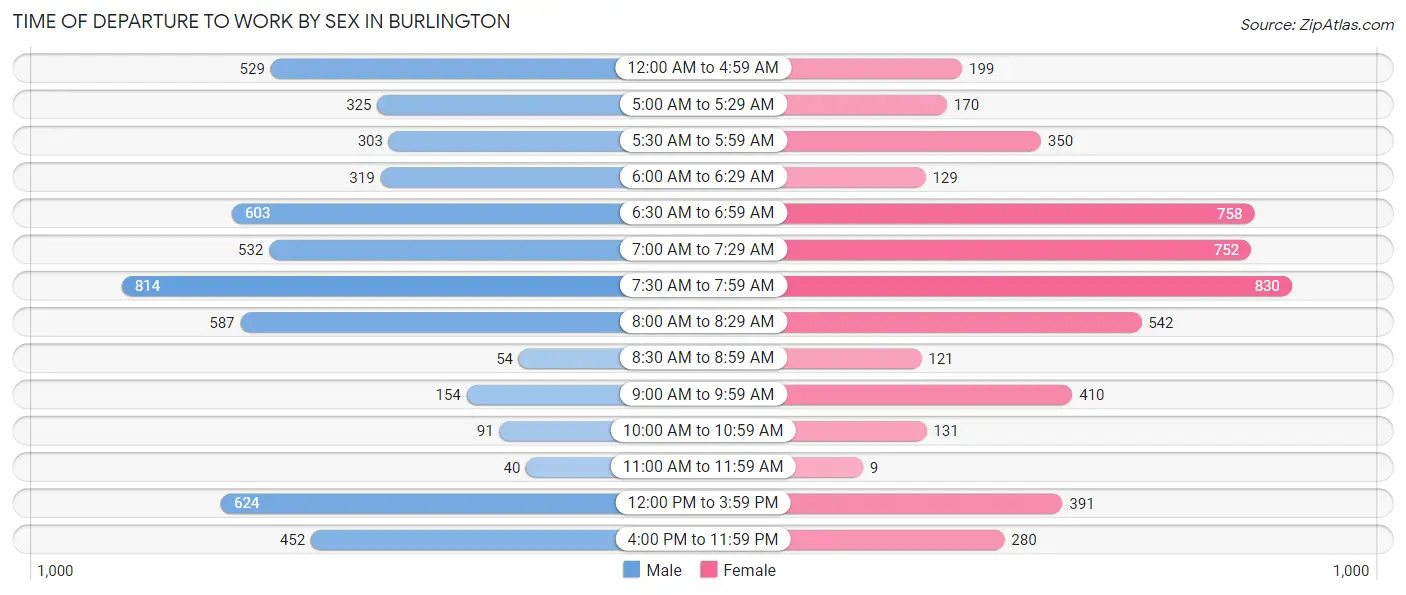
| Time of Departure | Male | Female |
| 12:00 AM to 4:59 AM | 529 (9.8%) | 199 (3.9%) |
| 5:00 AM to 5:29 AM | 325 (6.0%) | 170 (3.4%) |
| 5:30 AM to 5:59 AM | 303 (5.6%) | 350 (6.9%) |
| 6:00 AM to 6:29 AM | 319 (5.9%) | 129 (2.5%) |
| 6:30 AM to 6:59 AM | 603 (11.1%) | 758 (14.9%) |
| 7:00 AM to 7:29 AM | 532 (9.8%) | 752 (14.8%) |
| 7:30 AM to 7:59 AM | 814 (15.0%) | 830 (16.4%) |
| 8:00 AM to 8:29 AM | 587 (10.8%) | 542 (10.7%) |
| 8:30 AM to 8:59 AM | 54 (1.0%) | 121 (2.4%) |
| 9:00 AM to 9:59 AM | 154 (2.8%) | 410 (8.1%) |
| 10:00 AM to 10:59 AM | 91 (1.7%) | 131 (2.6%) |
| 11:00 AM to 11:59 AM | 40 (0.7%) | 9 (0.2%) |
| 12:00 PM to 3:59 PM | 624 (11.5%) | 391 (7.7%) |
| 4:00 PM to 11:59 PM | 452 (8.3%) | 280 (5.5%) |
| Total | 5,427 (100.0%) | 5,072 (100.0%) |
Housing Occupancy in Burlington
Occupancy by Ownership in Burlington
Of the total 11,207 dwellings in Burlington, owner-occupied units account for 7,489 (66.8%), while renter-occupied units make up 3,718 (33.2%).
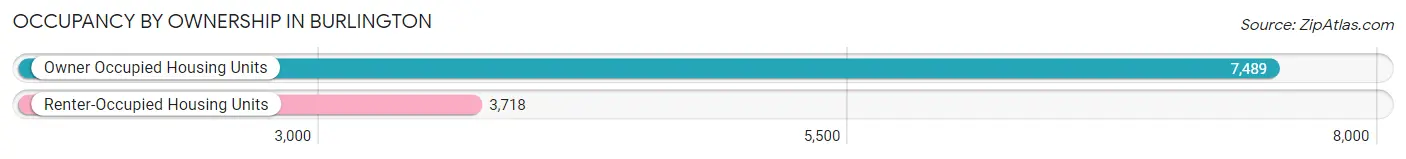
| Occupancy | # Housing Units | % Housing Units |
| Owner Occupied Housing Units | 7,489 | 66.8% |
| Renter-Occupied Housing Units | 3,718 | 33.2% |
| Total Occupied Housing Units | 11,207 | 100.0% |
Occupancy by Household Size in Burlington
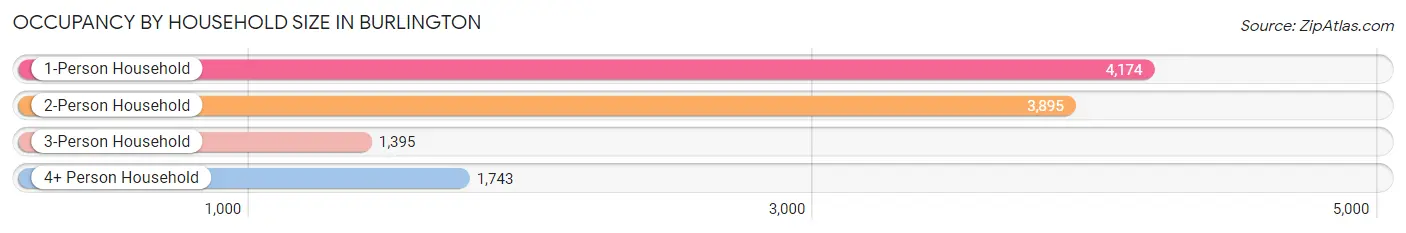
| Household Size | # Housing Units | % Housing Units |
| 1-Person Household | 4,174 | 37.2% |
| 2-Person Household | 3,895 | 34.8% |
| 3-Person Household | 1,395 | 12.4% |
| 4+ Person Household | 1,743 | 15.5% |
| Total Housing Units | 11,207 | 100.0% |
Occupancy by Ownership by Household Size in Burlington
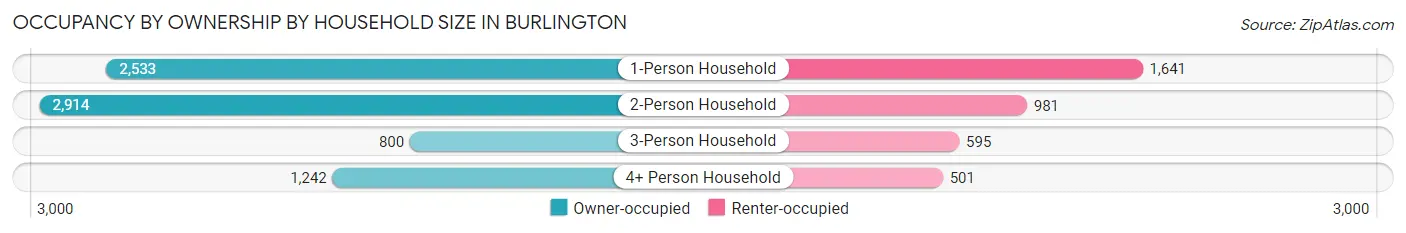
| Household Size | Owner-occupied | Renter-occupied |
| 1-Person Household | 2,533 (60.7%) | 1,641 (39.3%) |
| 2-Person Household | 2,914 (74.8%) | 981 (25.2%) |
| 3-Person Household | 800 (57.4%) | 595 (42.6%) |
| 4+ Person Household | 1,242 (71.3%) | 501 (28.7%) |
| Total Housing Units | 7,489 (66.8%) | 3,718 (33.2%) |
Occupancy by Educational Attainment in Burlington
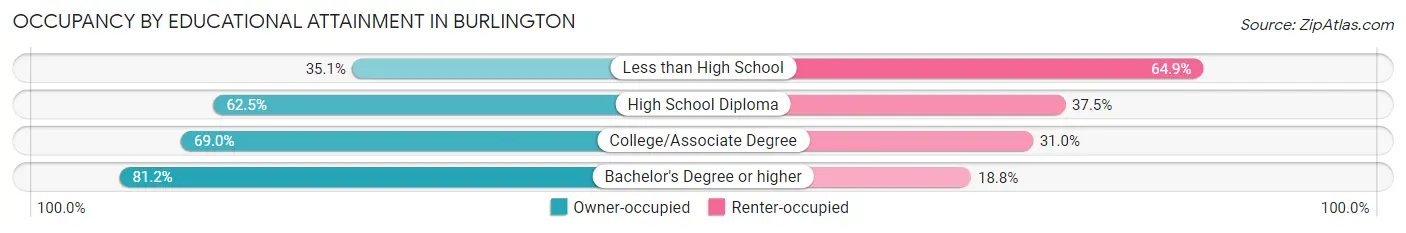
| Household Size | Owner-occupied | Renter-occupied |
| Less than High School | 311 (35.1%) | 574 (64.9%) |
| High School Diploma | 2,302 (62.5%) | 1,379 (37.5%) |
| College/Associate Degree | 2,908 (69.0%) | 1,309 (31.0%) |
| Bachelor's Degree or higher | 1,968 (81.2%) | 456 (18.8%) |
Occupancy by Age of Householder in Burlington
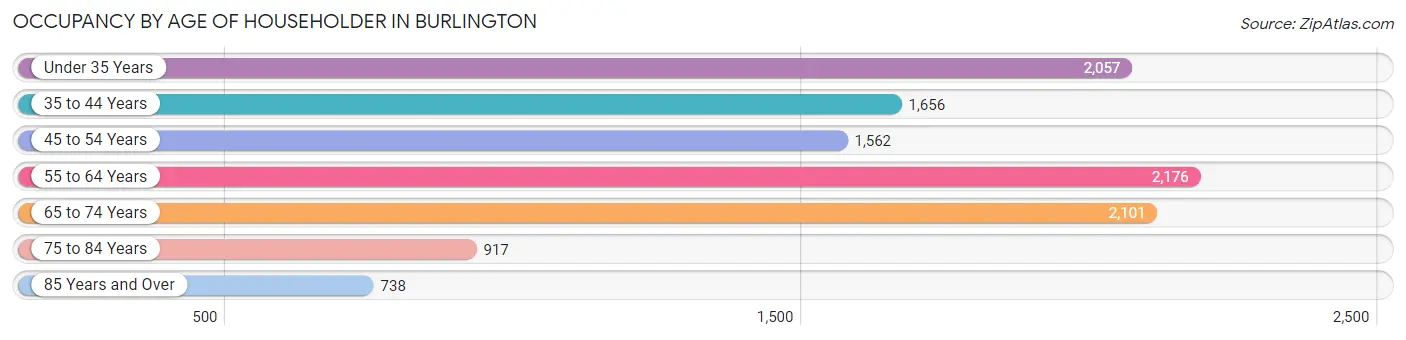
| Age Bracket | # Households | % Households |
| Under 35 Years | 2,057 | 18.3% |
| 35 to 44 Years | 1,656 | 14.8% |
| 45 to 54 Years | 1,562 | 13.9% |
| 55 to 64 Years | 2,176 | 19.4% |
| 65 to 74 Years | 2,101 | 18.8% |
| 75 to 84 Years | 917 | 8.2% |
| 85 Years and Over | 738 | 6.6% |
| Total | 11,207 | 100.0% |
Housing Finances in Burlington
Median Income by Occupancy in Burlington
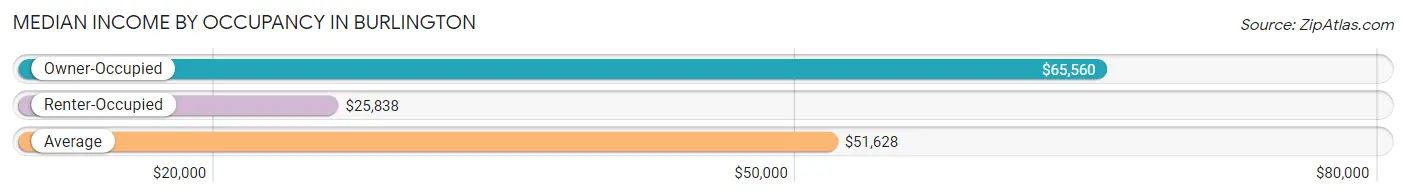
| Occupancy Type | # Households | Median Income |
| Owner-Occupied | 7,489 (66.8%) | $65,560 |
| Renter-Occupied | 3,718 (33.2%) | $25,838 |
| Average | 11,207 (100.0%) | $51,628 |
Occupancy by Householder Income Bracket in Burlington
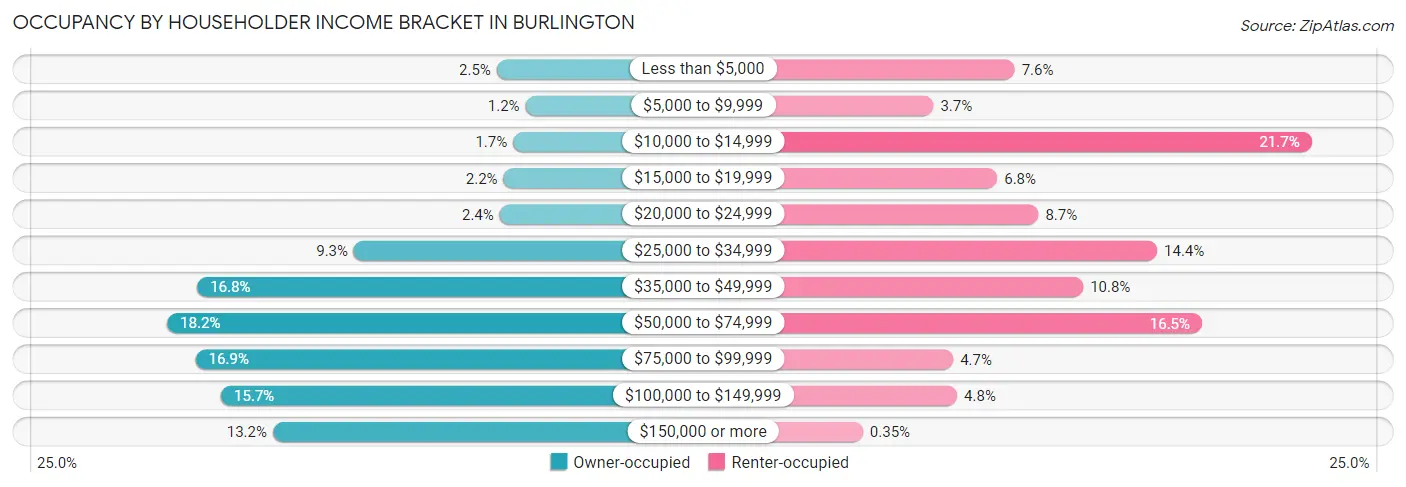
| Income Bracket | Owner-occupied | Renter-occupied |
| Less than $5,000 | 189 (2.5%) | 282 (7.6%) |
| $5,000 to $9,999 | 86 (1.1%) | 138 (3.7%) |
| $10,000 to $14,999 | 130 (1.7%) | 807 (21.7%) |
| $15,000 to $19,999 | 165 (2.2%) | 251 (6.8%) |
| $20,000 to $24,999 | 178 (2.4%) | 324 (8.7%) |
| $25,000 to $34,999 | 698 (9.3%) | 534 (14.4%) |
| $35,000 to $49,999 | 1,257 (16.8%) | 403 (10.8%) |
| $50,000 to $74,999 | 1,364 (18.2%) | 613 (16.5%) |
| $75,000 to $99,999 | 1,263 (16.9%) | 173 (4.6%) |
| $100,000 to $149,999 | 1,172 (15.7%) | 180 (4.8%) |
| $150,000 or more | 987 (13.2%) | 13 (0.4%) |
| Total | 7,489 (100.0%) | 3,718 (100.0%) |
Monthly Housing Cost Tiers in Burlington
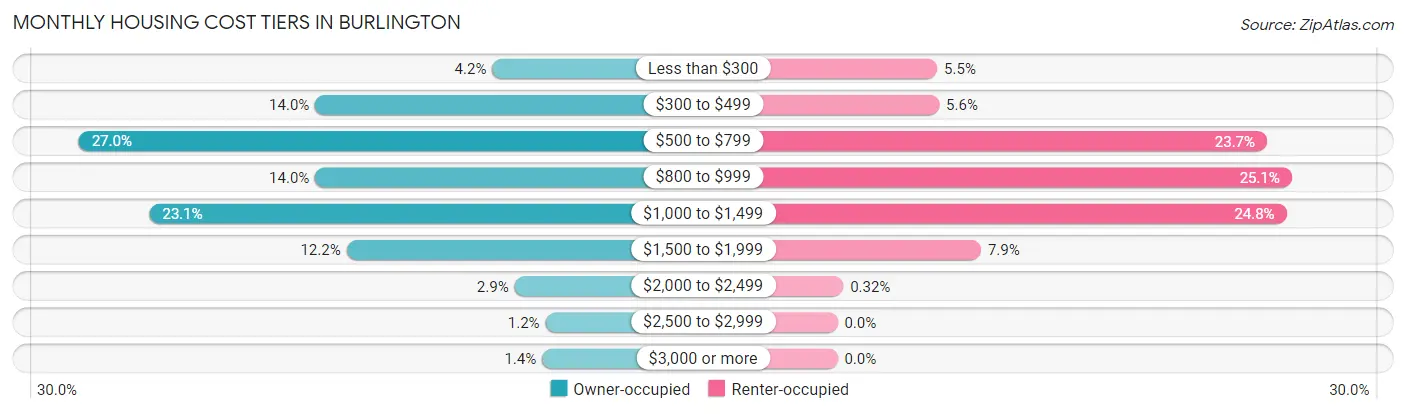
| Monthly Cost | Owner-occupied | Renter-occupied |
| Less than $300 | 312 (4.2%) | 205 (5.5%) |
| $300 to $499 | 1,045 (14.0%) | 209 (5.6%) |
| $500 to $799 | 2,023 (27.0%) | 882 (23.7%) |
| $800 to $999 | 1,045 (14.0%) | 933 (25.1%) |
| $1,000 to $1,499 | 1,731 (23.1%) | 922 (24.8%) |
| $1,500 to $1,999 | 915 (12.2%) | 295 (7.9%) |
| $2,000 to $2,499 | 220 (2.9%) | 12 (0.3%) |
| $2,500 to $2,999 | 92 (1.2%) | 0 (0.0%) |
| $3,000 or more | 106 (1.4%) | 0 (0.0%) |
| Total | 7,489 (100.0%) | 3,718 (100.0%) |
Physical Housing Characteristics in Burlington
Housing Structures in Burlington
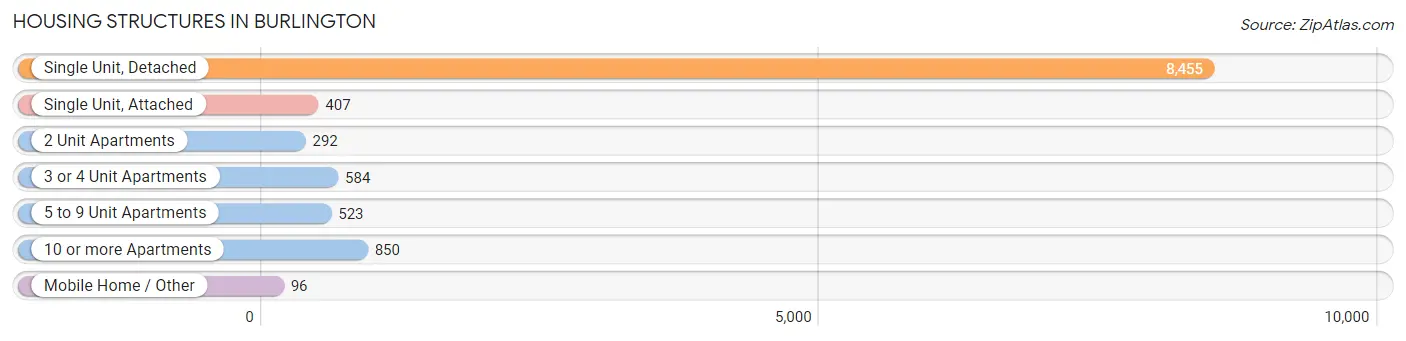
| Structure Type | # Housing Units | % Housing Units |
| Single Unit, Detached | 8,455 | 75.4% |
| Single Unit, Attached | 407 | 3.6% |
| 2 Unit Apartments | 292 | 2.6% |
| 3 or 4 Unit Apartments | 584 | 5.2% |
| 5 to 9 Unit Apartments | 523 | 4.7% |
| 10 or more Apartments | 850 | 7.6% |
| Mobile Home / Other | 96 | 0.9% |
| Total | 11,207 | 100.0% |
Housing Structures by Occupancy in Burlington

| Structure Type | Owner-occupied | Renter-occupied |
| Single Unit, Detached | 7,029 (83.1%) | 1,426 (16.9%) |
| Single Unit, Attached | 219 (53.8%) | 188 (46.2%) |
| 2 Unit Apartments | 43 (14.7%) | 249 (85.3%) |
| 3 or 4 Unit Apartments | 69 (11.8%) | 515 (88.2%) |
| 5 to 9 Unit Apartments | 37 (7.1%) | 486 (92.9%) |
| 10 or more Apartments | 33 (3.9%) | 817 (96.1%) |
| Mobile Home / Other | 59 (61.5%) | 37 (38.5%) |
| Total | 7,489 (66.8%) | 3,718 (33.2%) |
Housing Structures by Number of Rooms in Burlington
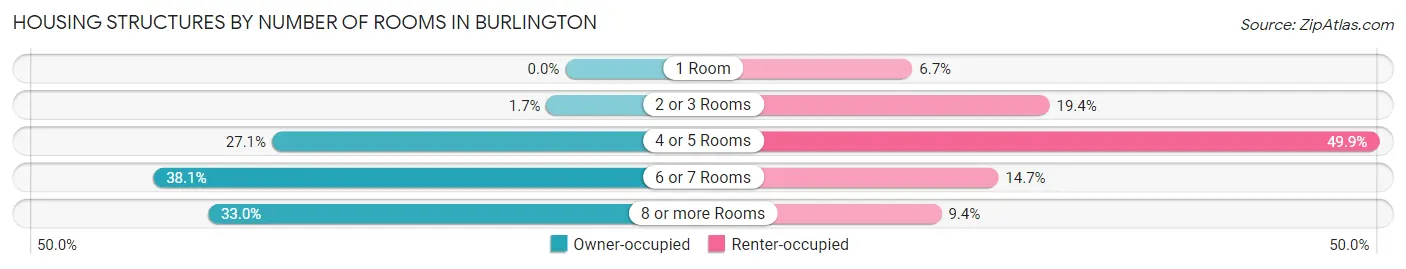
| Number of Rooms | Owner-occupied | Renter-occupied |
| 1 Room | 0 (0.0%) | 249 (6.7%) |
| 2 or 3 Rooms | 130 (1.7%) | 721 (19.4%) |
| 4 or 5 Rooms | 2,032 (27.1%) | 1,854 (49.9%) |
| 6 or 7 Rooms | 2,853 (38.1%) | 545 (14.7%) |
| 8 or more Rooms | 2,474 (33.0%) | 349 (9.4%) |
| Total | 7,489 (100.0%) | 3,718 (100.0%) |
Housing Structure by Heating Type in Burlington
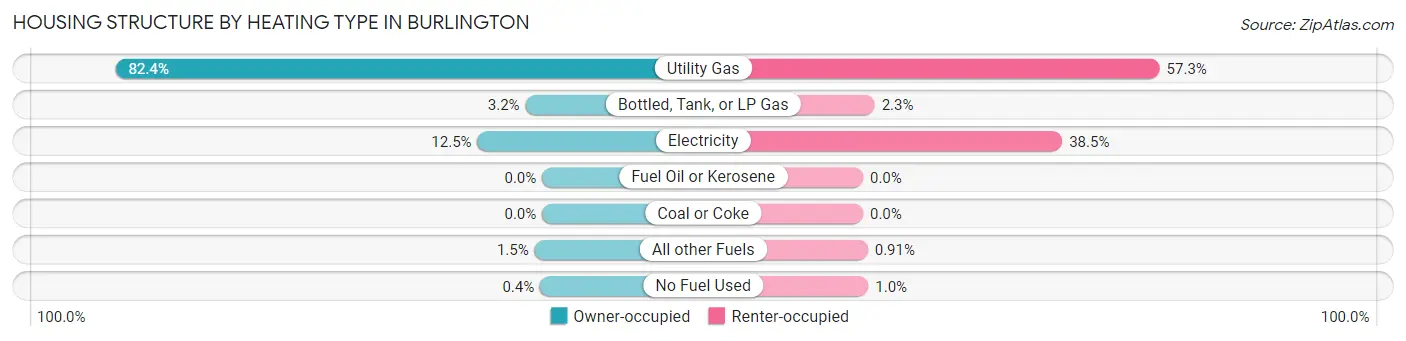
| Heating Type | Owner-occupied | Renter-occupied |
| Utility Gas | 6,173 (82.4%) | 2,131 (57.3%) |
| Bottled, Tank, or LP Gas | 241 (3.2%) | 84 (2.3%) |
| Electricity | 936 (12.5%) | 1,431 (38.5%) |
| Fuel Oil or Kerosene | 0 (0.0%) | 0 (0.0%) |
| Coal or Coke | 0 (0.0%) | 0 (0.0%) |
| All other Fuels | 109 (1.5%) | 34 (0.9%) |
| No Fuel Used | 30 (0.4%) | 38 (1.0%) |
| Total | 7,489 (100.0%) | 3,718 (100.0%) |
Household Vehicle Usage in Burlington
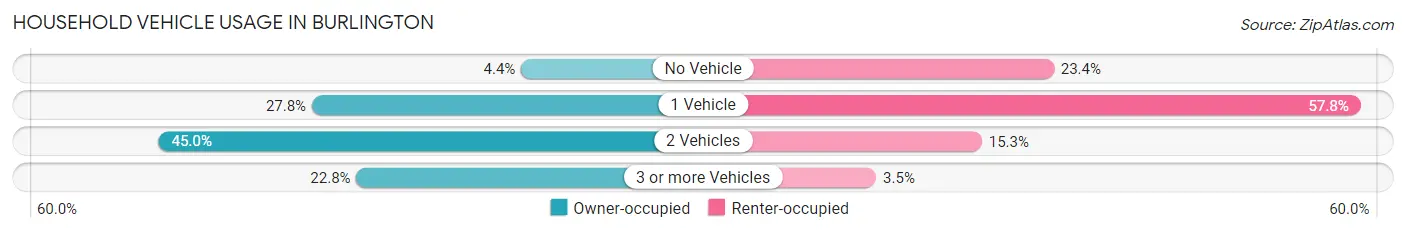
| Vehicles per Household | Owner-occupied | Renter-occupied |
| No Vehicle | 327 (4.4%) | 870 (23.4%) |
| 1 Vehicle | 2,083 (27.8%) | 2,148 (57.8%) |
| 2 Vehicles | 3,369 (45.0%) | 570 (15.3%) |
| 3 or more Vehicles | 1,710 (22.8%) | 130 (3.5%) |
| Total | 7,489 (100.0%) | 3,718 (100.0%) |
Real Estate & Mortgages in Burlington
Real Estate and Mortgage Overview in Burlington
| Characteristic | Without Mortgage | With Mortgage |
| Housing Units | 3,504 | 3,985 |
| Median Property Value | $99,100 | $120,600 |
| Median Household Income | $47,900 | $601 |
| Monthly Housing Costs | $573 | $106 |
| Real Estate Taxes | $1,775 | $104 |
Property Value by Mortgage Status in Burlington
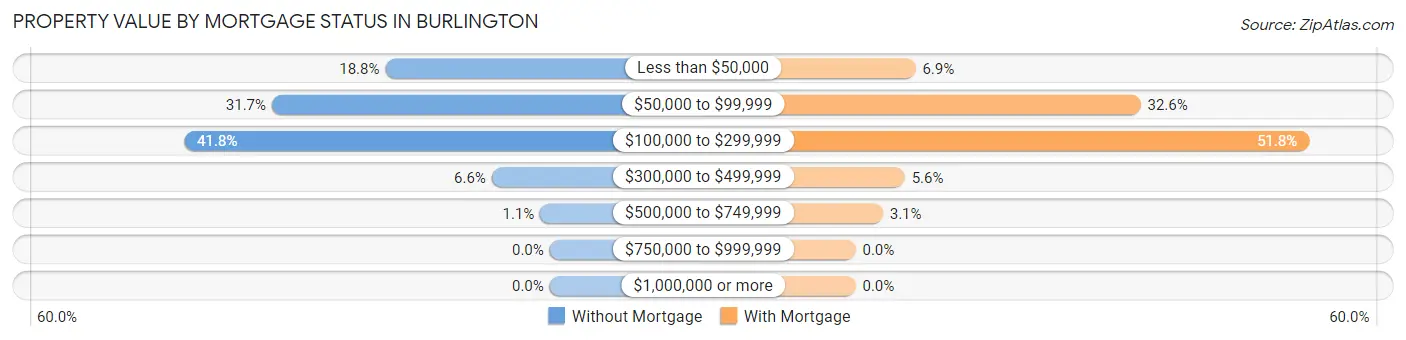
| Property Value | Without Mortgage | With Mortgage |
| Less than $50,000 | 658 (18.8%) | 273 (6.9%) |
| $50,000 to $99,999 | 1,112 (31.7%) | 1,298 (32.6%) |
| $100,000 to $299,999 | 1,464 (41.8%) | 2,066 (51.8%) |
| $300,000 to $499,999 | 232 (6.6%) | 224 (5.6%) |
| $500,000 to $749,999 | 38 (1.1%) | 124 (3.1%) |
| $750,000 to $999,999 | 0 (0.0%) | 0 (0.0%) |
| $1,000,000 or more | 0 (0.0%) | 0 (0.0%) |
| Total | 3,504 (100.0%) | 3,985 (100.0%) |
Household Income by Mortgage Status in Burlington
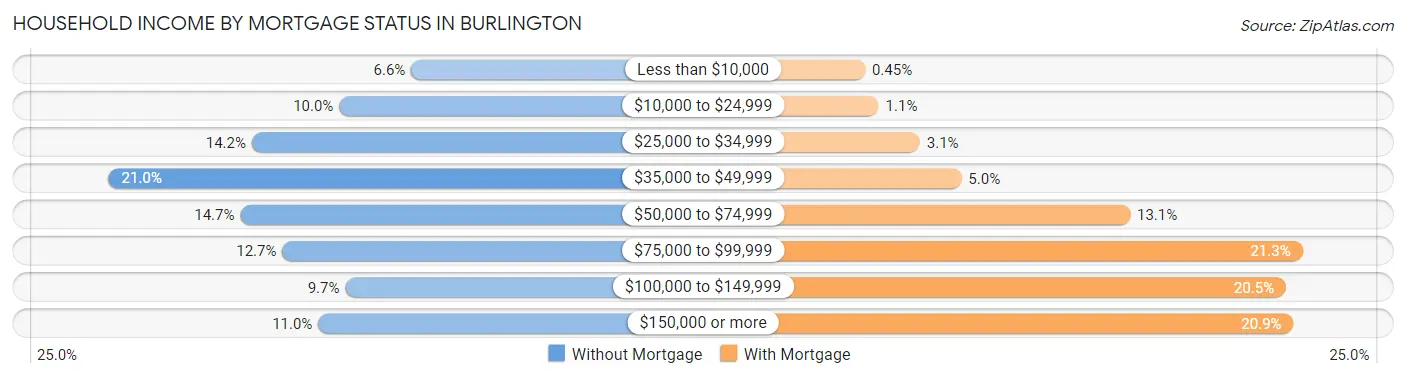
| Household Income | Without Mortgage | With Mortgage |
| Less than $10,000 | 231 (6.6%) | 18 (0.4%) |
| $10,000 to $24,999 | 351 (10.0%) | 44 (1.1%) |
| $25,000 to $34,999 | 497 (14.2%) | 122 (3.1%) |
| $35,000 to $49,999 | 736 (21.0%) | 201 (5.0%) |
| $50,000 to $74,999 | 516 (14.7%) | 521 (13.1%) |
| $75,000 to $99,999 | 446 (12.7%) | 848 (21.3%) |
| $100,000 to $149,999 | 341 (9.7%) | 817 (20.5%) |
| $150,000 or more | 386 (11.0%) | 831 (20.8%) |
| Total | 3,504 (100.0%) | 3,985 (100.0%) |
Property Value to Household Income Ratio in Burlington
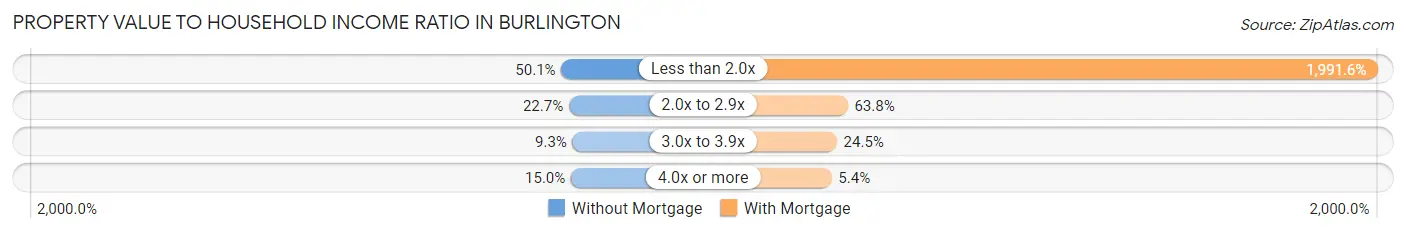
| Value-to-Income Ratio | Without Mortgage | With Mortgage |
| Less than 2.0x | 1,757 (50.1%) | 79,366 (1,991.6%) |
| 2.0x to 2.9x | 794 (22.7%) | 2,542 (63.8%) |
| 3.0x to 3.9x | 325 (9.3%) | 978 (24.5%) |
| 4.0x or more | 524 (14.9%) | 216 (5.4%) |
| Total | 3,504 (100.0%) | 3,985 (100.0%) |
Real Estate Taxes by Mortgage Status in Burlington
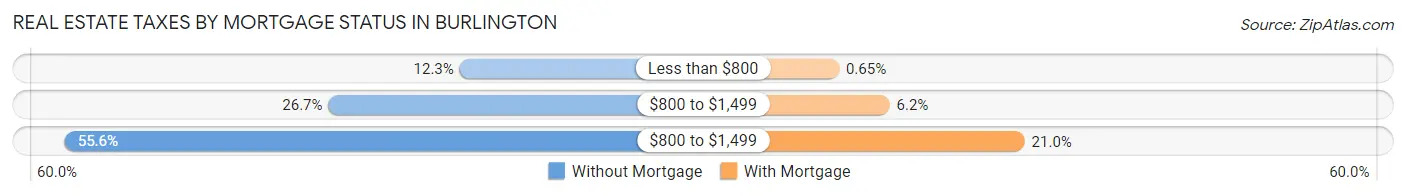
| Property Taxes | Without Mortgage | With Mortgage |
| Less than $800 | 432 (12.3%) | 26 (0.6%) |
| $800 to $1,499 | 936 (26.7%) | 247 (6.2%) |
| $800 to $1,499 | 1,948 (55.6%) | 837 (21.0%) |
| Total | 3,504 (100.0%) | 3,985 (100.0%) |
Health & Disability in Burlington
Health Insurance Coverage by Age in Burlington
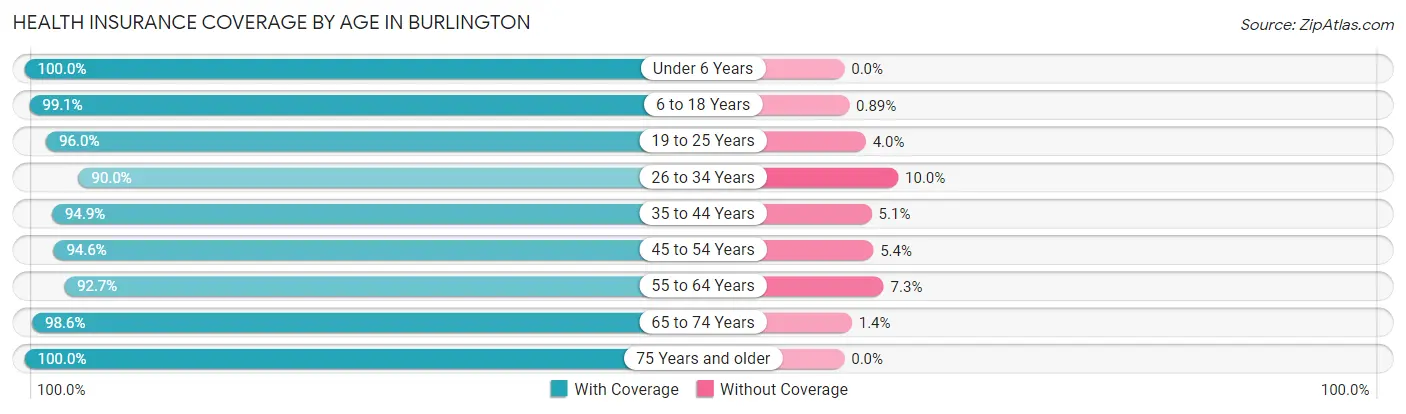
| Age Bracket | With Coverage | Without Coverage |
| Under 6 Years | 1,645 (100.0%) | 0 (0.0%) |
| 6 to 18 Years | 3,905 (99.1%) | 35 (0.9%) |
| 19 to 25 Years | 1,729 (96.0%) | 72 (4.0%) |
| 26 to 34 Years | 2,169 (90.0%) | 242 (10.0%) |
| 35 to 44 Years | 2,623 (94.9%) | 141 (5.1%) |
| 45 to 54 Years | 2,351 (94.6%) | 134 (5.4%) |
| 55 to 64 Years | 3,258 (92.7%) | 258 (7.3%) |
| 65 to 74 Years | 3,096 (98.6%) | 44 (1.4%) |
| 75 Years and older | 2,076 (100.0%) | 0 (0.0%) |
| Total | 22,852 (96.1%) | 926 (3.9%) |
Health Insurance Coverage by Citizenship Status in Burlington
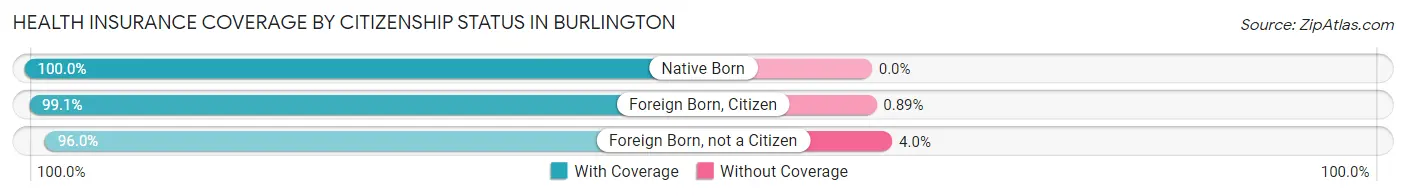
| Citizenship Status | With Coverage | Without Coverage |
| Native Born | 1,645 (100.0%) | 0 (0.0%) |
| Foreign Born, Citizen | 3,905 (99.1%) | 35 (0.9%) |
| Foreign Born, not a Citizen | 1,729 (96.0%) | 72 (4.0%) |
Health Insurance Coverage by Household Income in Burlington
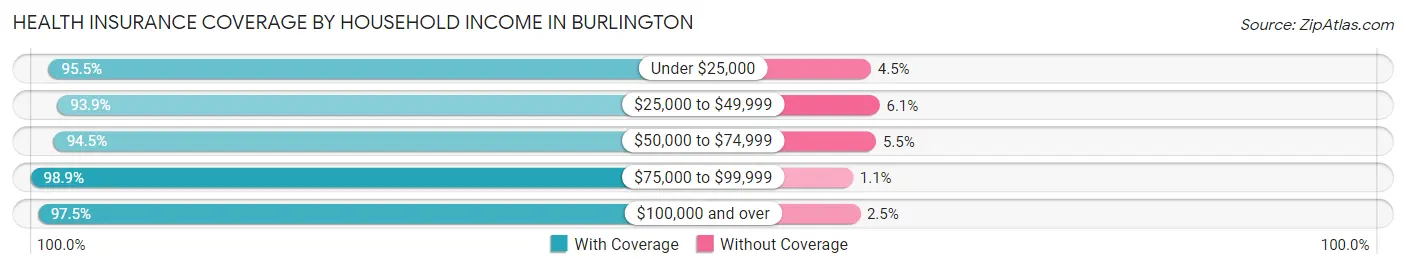
| Household Income | With Coverage | Without Coverage |
| Under $25,000 | 3,935 (95.5%) | 186 (4.5%) |
| $25,000 to $49,999 | 4,660 (93.9%) | 305 (6.1%) |
| $50,000 to $74,999 | 4,174 (94.5%) | 241 (5.5%) |
| $75,000 to $99,999 | 4,207 (98.9%) | 48 (1.1%) |
| $100,000 and over | 5,779 (97.5%) | 146 (2.5%) |
Public vs Private Health Insurance Coverage by Age in Burlington
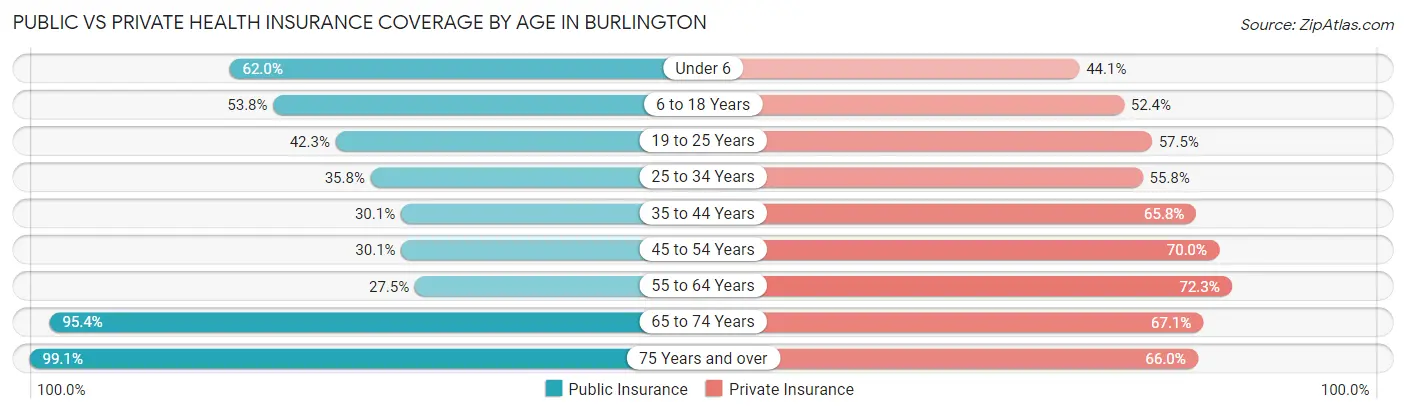
| Age Bracket | Public Insurance | Private Insurance |
| Under 6 | 1,019 (62.0%) | 725 (44.1%) |
| 6 to 18 Years | 2,121 (53.8%) | 2,063 (52.4%) |
| 19 to 25 Years | 761 (42.2%) | 1,036 (57.5%) |
| 25 to 34 Years | 862 (35.7%) | 1,346 (55.8%) |
| 35 to 44 Years | 833 (30.1%) | 1,818 (65.8%) |
| 45 to 54 Years | 747 (30.1%) | 1,739 (70.0%) |
| 55 to 64 Years | 968 (27.5%) | 2,543 (72.3%) |
| 65 to 74 Years | 2,995 (95.4%) | 2,106 (67.1%) |
| 75 Years and over | 2,057 (99.1%) | 1,371 (66.0%) |
| Total | 12,363 (52.0%) | 14,747 (62.0%) |
Disability Status by Sex by Age in Burlington
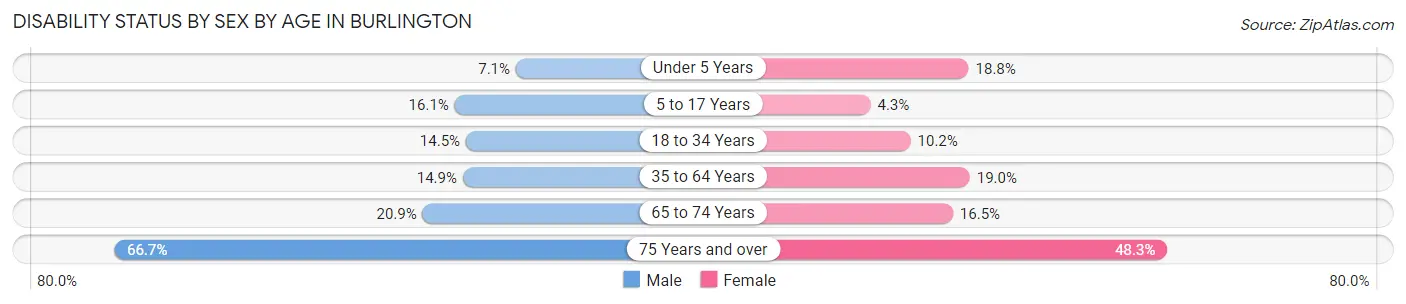
| Age Bracket | Male | Female |
| Under 5 Years | 37 (7.0%) | 122 (18.8%) |
| 5 to 17 Years | 335 (16.1%) | 90 (4.3%) |
| 18 to 34 Years | 297 (14.5%) | 244 (10.2%) |
| 35 to 64 Years | 641 (14.9%) | 850 (19.0%) |
| 65 to 74 Years | 346 (20.9%) | 245 (16.5%) |
| 75 Years and over | 573 (66.7%) | 588 (48.3%) |
Disability Class by Sex by Age in Burlington
Disability Class: Hearing Difficulty
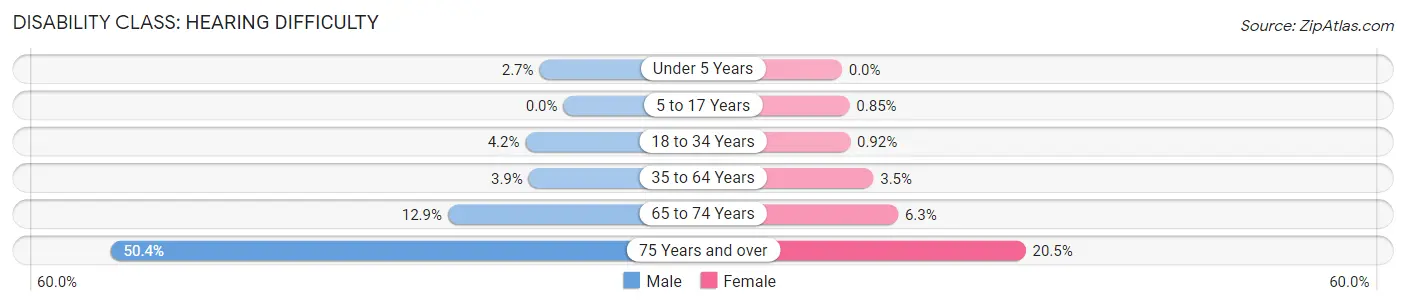
| Age Bracket | Male | Female |
| Under 5 Years | 14 (2.7%) | 0 (0.0%) |
| 5 to 17 Years | 0 (0.0%) | 18 (0.9%) |
| 18 to 34 Years | 87 (4.2%) | 22 (0.9%) |
| 35 to 64 Years | 166 (3.9%) | 157 (3.5%) |
| 65 to 74 Years | 213 (12.9%) | 93 (6.3%) |
| 75 Years and over | 433 (50.4%) | 249 (20.5%) |
Disability Class: Vision Difficulty
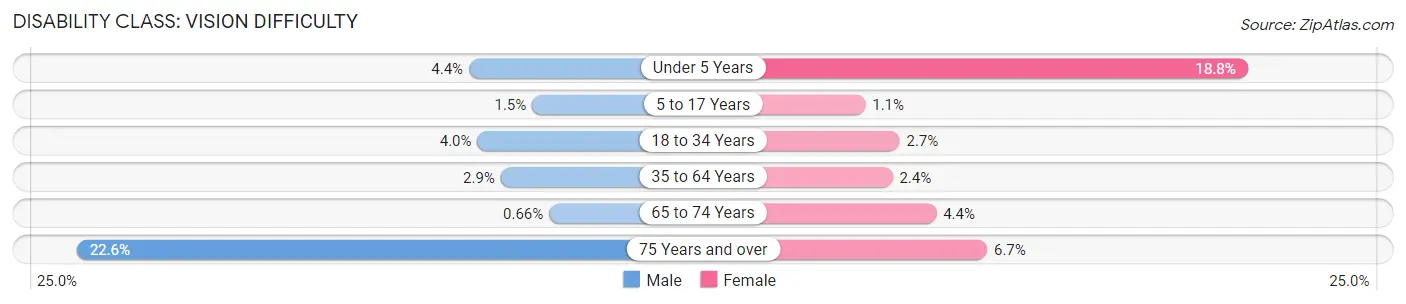
| Age Bracket | Male | Female |
| Under 5 Years | 23 (4.4%) | 122 (18.8%) |
| 5 to 17 Years | 30 (1.5%) | 23 (1.1%) |
| 18 to 34 Years | 82 (4.0%) | 64 (2.7%) |
| 35 to 64 Years | 125 (2.9%) | 105 (2.4%) |
| 65 to 74 Years | 11 (0.7%) | 65 (4.4%) |
| 75 Years and over | 194 (22.6%) | 82 (6.7%) |
Disability Class: Cognitive Difficulty
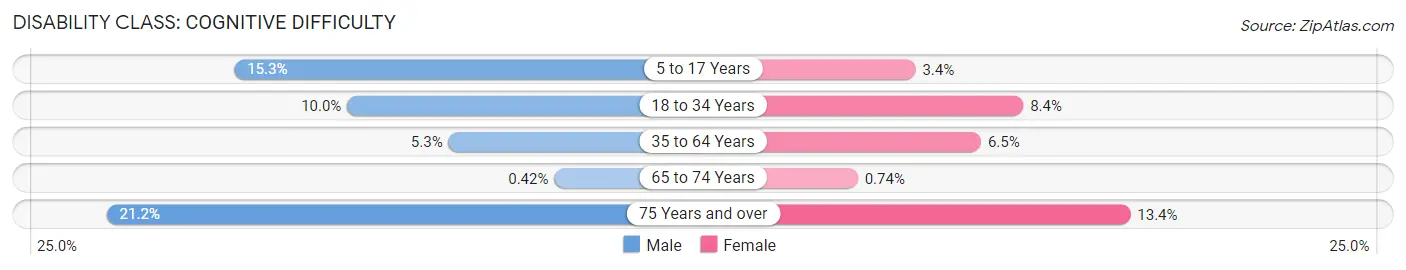
| Age Bracket | Male | Female |
| 5 to 17 Years | 317 (15.3%) | 72 (3.4%) |
| 18 to 34 Years | 206 (10.0%) | 201 (8.4%) |
| 35 to 64 Years | 229 (5.3%) | 289 (6.5%) |
| 65 to 74 Years | 7 (0.4%) | 11 (0.7%) |
| 75 Years and over | 182 (21.2%) | 163 (13.4%) |
Disability Class: Ambulatory Difficulty
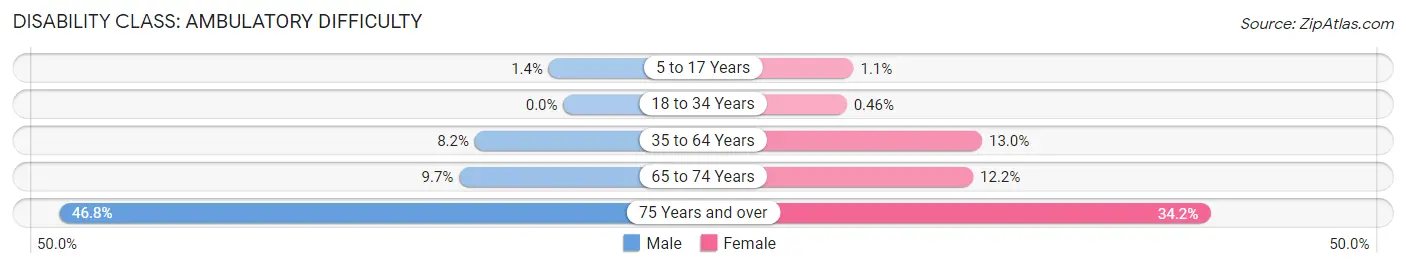
| Age Bracket | Male | Female |
| 5 to 17 Years | 28 (1.3%) | 23 (1.1%) |
| 18 to 34 Years | 0 (0.0%) | 11 (0.5%) |
| 35 to 64 Years | 353 (8.2%) | 582 (13.0%) |
| 65 to 74 Years | 160 (9.7%) | 181 (12.2%) |
| 75 Years and over | 402 (46.8%) | 416 (34.2%) |
Disability Class: Self-Care Difficulty
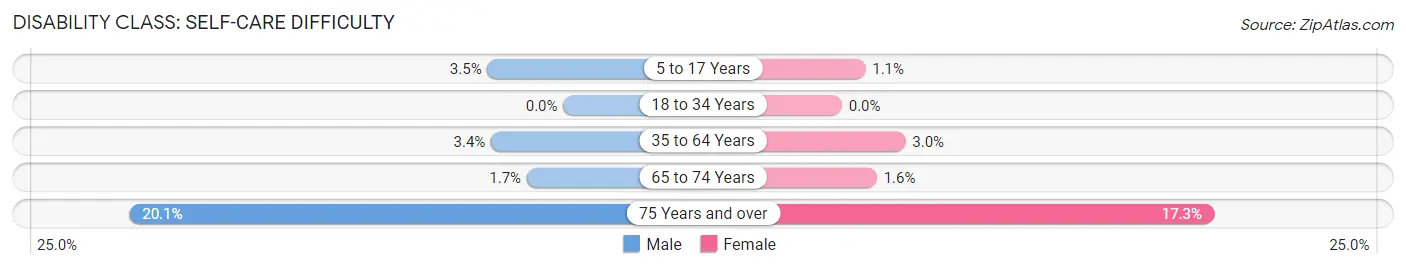
| Age Bracket | Male | Female |
| 5 to 17 Years | 73 (3.5%) | 23 (1.1%) |
| 18 to 34 Years | 0 (0.0%) | 0 (0.0%) |
| 35 to 64 Years | 144 (3.4%) | 132 (2.9%) |
| 65 to 74 Years | 28 (1.7%) | 24 (1.6%) |
| 75 Years and over | 173 (20.1%) | 210 (17.3%) |
Technology Access in Burlington
Computing Device Access in Burlington
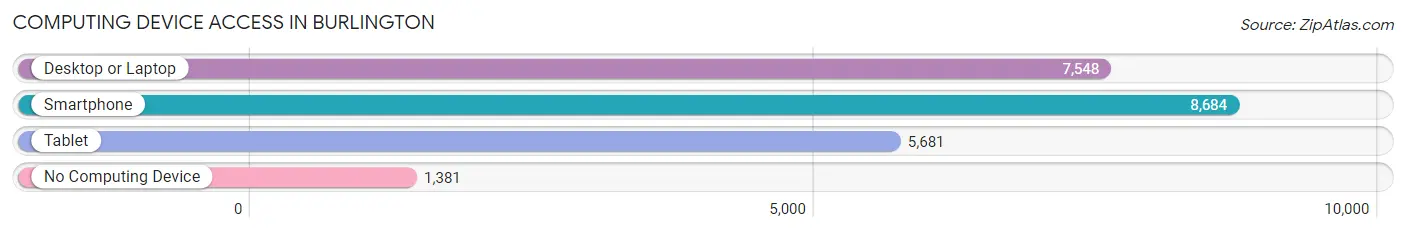
| Device Type | # Households | % Households |
| Desktop or Laptop | 7,548 | 67.3% |
| Smartphone | 8,684 | 77.5% |
| Tablet | 5,681 | 50.7% |
| No Computing Device | 1,381 | 12.3% |
| Total | 11,207 | 100.0% |
Internet Access in Burlington
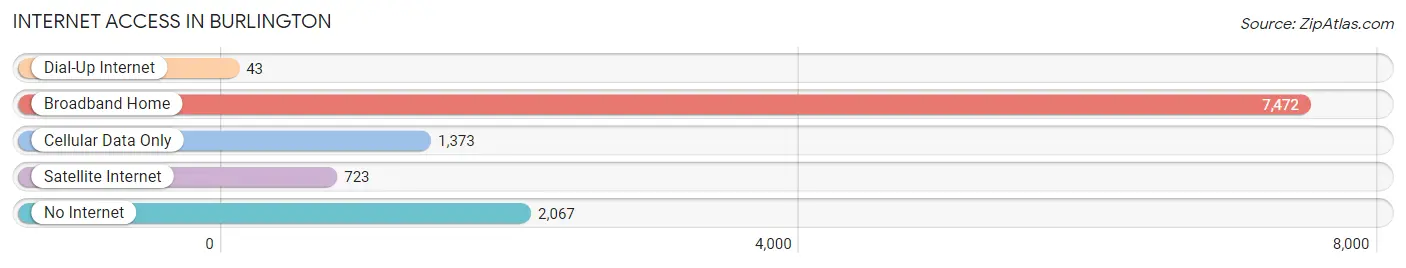
| Internet Type | # Households | % Households |
| Dial-Up Internet | 43 | 0.4% |
| Broadband Home | 7,472 | 66.7% |
| Cellular Data Only | 1,373 | 12.2% |
| Satellite Internet | 723 | 6.5% |
| No Internet | 2,067 | 18.4% |
| Total | 11,207 | 100.0% |
Burlington Summary
Burlington, Iowa is a city located in Des Moines County, Iowa, United States. It is the county seat of Des Moines County and is located along the Mississippi River. The population was 25,663 at the 2010 census, making it the largest city in the county.
Geography
Burlington is located at 40°48'17" North, 91°10'2" West (40.804722, -91.167222). According to the United States Census Bureau, the city has a total area of 11.2 square miles (29.0 km2), of which 10.9 square miles (28.2 km2) is land and 0.3 square miles (0.8 km2) is water.
The city is situated on the west bank of the Mississippi River, and is bordered by the cities of West Burlington and Middletown to the north, and the cities of Danville and Mediapolis to the south. The city is also located near the Iowa-Illinois border, and is approximately 25 miles (40 km) south of the Quad Cities.
History
Burlington was founded in 1833 by settlers from Burlington, Vermont. The city was named after the original Burlington, and was incorporated in 1837. The city quickly grew and became an important port on the Mississippi River. During the Civil War, the city was a major supply center for the Union Army.
In the late 19th century, Burlington became an important railroad hub, and the city's economy was largely based on the railroad industry. The city was also home to several large manufacturing companies, including the Burlington Car Works, which produced railroad cars.
Economy
Today, Burlington is a major industrial and commercial center in the region. The city is home to several large employers, including Great River Medical Center, Burlington Northern Santa Fe Railroad, and the Burlington Community School District. The city also has a thriving retail sector, with several large shopping centers and malls.
The city's economy is also supported by a strong agricultural sector. The surrounding area is home to several large farms, and the city is a major producer of corn, soybeans, and other crops.
Demographics
As of the 2010 census, there were 25,663 people, 10,845 households, and 6,541 families residing in the city. The population density was 2,346.2 people per square mile (906.2/km2). There were 11,845 housing units at an average density of 1,082.2 per square mile (417.9/km2). The racial makeup of the city was 87.2% White, 8.2% African American, 0.3% Native American, 1.2% Asian, 0.7% from other races, and 2.4% from two or more races. Hispanic or Latino of any race were 2.7% of the population.
There were 10,845 households, out of which 28.2% had children under the age of 18 living with them, 43.2% were married couples living together, 13.7% had a female householder with no husband present, and 38.7% were non-families. 32.3% of all households were made up of individuals, and 13.2% had someone living alone who was 65 years of age or older. The average household size was 2.33 and the average family size was 2.94.
In the city, the population was spread out, with 23.7% under the age of 18, 9.2% from 18 to 24, 28.2% from 25 to 44, 22.7% from 45 to 64, and 16.2% who were 65 years of age or older. The median age was 37 years. For every 100 females, there were 91.2 males. For every 100 females age 18 and over, there were 87.3 males.
The median income for a household in the city was $35,945, and the median income for a family was $45,945. Males had a median income of $32,945 versus $25,945 for females. The per capita income for the city was $19,945. About 8.7% of families and 11.2% of the population were below the poverty line, including 15.2% of those under age 18 and 8.2% of those age 65 or over.
Common Questions
What is Per Capita Income in Burlington?
Per Capita income in Burlington is $33,842.
What is the Median Family Income in Burlington?
Median Family Income in Burlington is $66,147.
What is the Median Household income in Burlington?
Median Household Income in Burlington is $51,628.
What is Income or Wage Gap in Burlington?
Income or Wage Gap in Burlington is 27.6%.
Women in Burlington earn 72.4 cents for every dollar earned by a man.
What is Inequality or Gini Index in Burlington?
Inequality or Gini Index in Burlington is 0.48.
What is the Total Population of Burlington?
Total Population of Burlington is 23,976.
What is the Total Male Population of Burlington?
Total Male Population of Burlington is 11,603.
What is the Total Female Population of Burlington?
Total Female Population of Burlington is 12,373.
What is the Ratio of Males per 100 Females in Burlington?
There are 93.78 Males per 100 Females in Burlington.
What is the Ratio of Females per 100 Males in Burlington?
There are 106.64 Females per 100 Males in Burlington.
What is the Median Population Age in Burlington?
Median Population Age in Burlington is 42.9 Years.
What is the Average Family Size in Burlington
Average Family Size in Burlington is 2.7 People.
What is the Average Household Size in Burlington
Average Household Size in Burlington is 2.1 People.
How Large is the Labor Force in Burlington?
There are 11,527 People in the Labor Forcein in Burlington.
What is the Percentage of People in the Labor Force in Burlington?
59.1% of People are in the Labor Force in Burlington.
What is the Unemployment Rate in Burlington?
Unemployment Rate in Burlington is 4.0%.