Cedar Rapids, IA Map & Demographics
Cedar Rapids Map
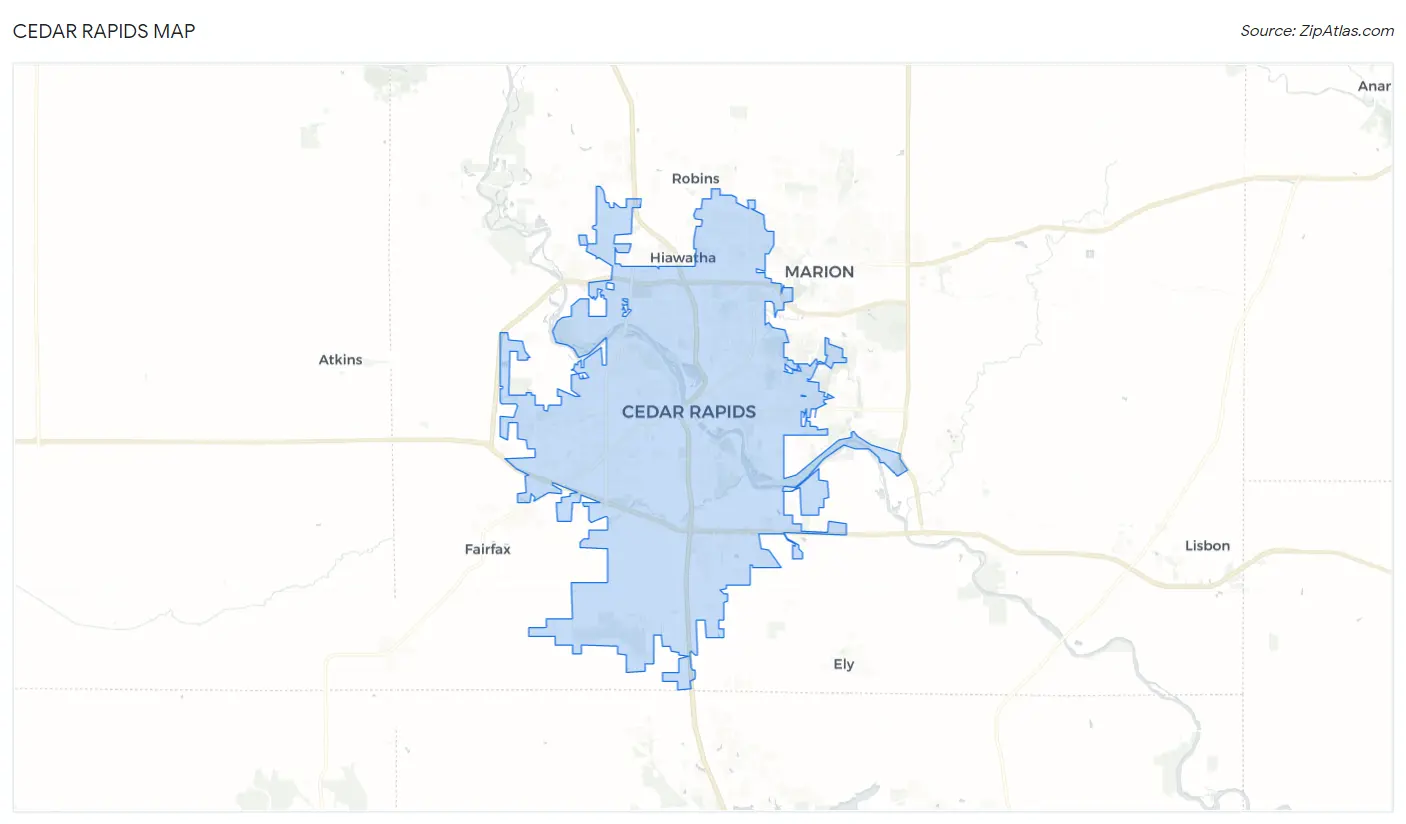
Cedar Rapids Overview
$38,585
PER CAPITA INCOME
$86,756
AVG FAMILY INCOME
$66,895
AVG HOUSEHOLD INCOME
28.4%
WAGE / INCOME GAP [ % ]
71.6¢/ $1
WAGE / INCOME GAP [ $ ]
$9,978
FAMILY INCOME DEFICIT
0.44
INEQUALITY / GINI INDEX
136,929
TOTAL POPULATION
68,131
MALE POPULATION
68,798
FEMALE POPULATION
99.03
MALES / 100 FEMALES
100.98
FEMALES / 100 MALES
37.0
MEDIAN AGE
3.0
AVG FAMILY SIZE
2.3
AVG HOUSEHOLD SIZE
76,178
LABOR FORCE [ PEOPLE ]
68.6%
PERCENT IN LABOR FORCE
3.9%
UNEMPLOYMENT RATE
Cedar Rapids Area Codes
Income in Cedar Rapids
Income Overview in Cedar Rapids
Per Capita Income in Cedar Rapids is $38,585, while median incomes of families and households are $86,756 and $66,895 respectively.
| Characteristic | Number | Measure |
| Per Capita Income | 136,929 | $38,585 |
| Median Family Income | 33,177 | $86,756 |
| Mean Family Income | 33,177 | $110,016 |
| Median Household Income | 58,283 | $66,895 |
| Mean Household Income | 58,283 | $88,981 |
| Income Deficit | 33,177 | $9,978 |
| Wage / Income Gap (%) | 136,929 | 28.39% |
| Wage / Income Gap ($) | 136,929 | 71.61¢ per $1 |
| Gini / Inequality Index | 136,929 | 0.44 |
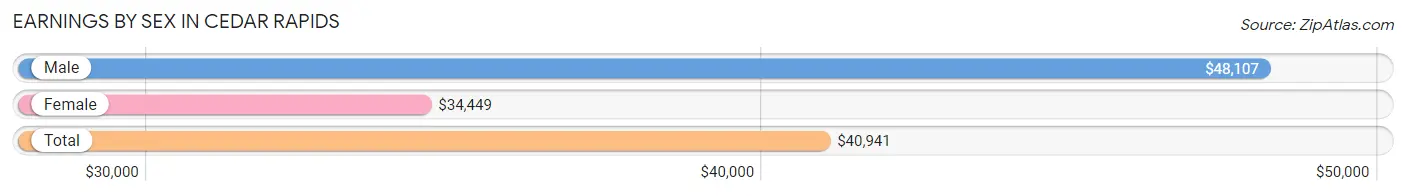
Earnings by Sex in Cedar Rapids
Average Earnings in Cedar Rapids are $40,941, $48,107 for men and $34,449 for women, a difference of 28.4%.
| Sex | Number | Average Earnings |
| Male | 41,191 (51.8%) | $48,107 |
| Female | 38,263 (48.2%) | $34,449 |
| Total | 79,454 (100.0%) | $40,941 |
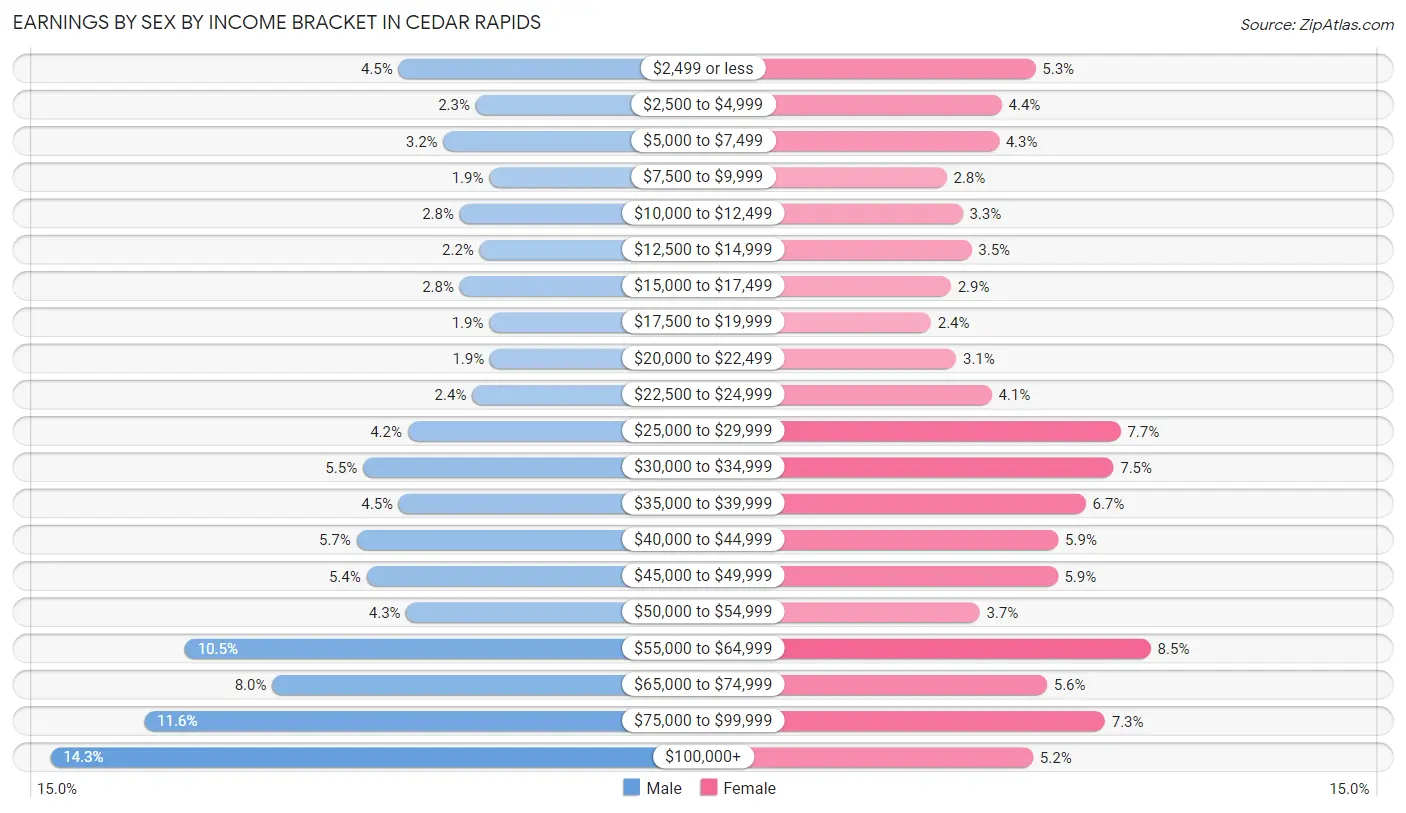
Earnings by Sex by Income Bracket in Cedar Rapids
The most common earnings brackets in Cedar Rapids are $100,000+ for men (5,882 | 14.3%) and $55,000 to $64,999 for women (3,269 | 8.5%).
| Income | Male | Female |
| $2,499 or less | 1,848 (4.5%) | 2,028 (5.3%) |
| $2,500 to $4,999 | 956 (2.3%) | 1,666 (4.3%) |
| $5,000 to $7,499 | 1,331 (3.2%) | 1,632 (4.3%) |
| $7,500 to $9,999 | 801 (1.9%) | 1,070 (2.8%) |
| $10,000 to $12,499 | 1,142 (2.8%) | 1,245 (3.3%) |
| $12,500 to $14,999 | 909 (2.2%) | 1,338 (3.5%) |
| $15,000 to $17,499 | 1,142 (2.8%) | 1,116 (2.9%) |
| $17,500 to $19,999 | 800 (1.9%) | 903 (2.4%) |
| $20,000 to $22,499 | 790 (1.9%) | 1,175 (3.1%) |
| $22,500 to $24,999 | 998 (2.4%) | 1,556 (4.1%) |
| $25,000 to $29,999 | 1,741 (4.2%) | 2,944 (7.7%) |
| $30,000 to $34,999 | 2,263 (5.5%) | 2,864 (7.5%) |
| $35,000 to $39,999 | 1,846 (4.5%) | 2,566 (6.7%) |
| $40,000 to $44,999 | 2,335 (5.7%) | 2,271 (5.9%) |
| $45,000 to $49,999 | 2,219 (5.4%) | 2,267 (5.9%) |
| $50,000 to $54,999 | 1,759 (4.3%) | 1,428 (3.7%) |
| $55,000 to $64,999 | 4,323 (10.5%) | 3,269 (8.5%) |
| $65,000 to $74,999 | 3,313 (8.0%) | 2,149 (5.6%) |
| $75,000 to $99,999 | 4,793 (11.6%) | 2,775 (7.2%) |
| $100,000+ | 5,882 (14.3%) | 2,001 (5.2%) |
| Total | 41,191 (100.0%) | 38,263 (100.0%) |
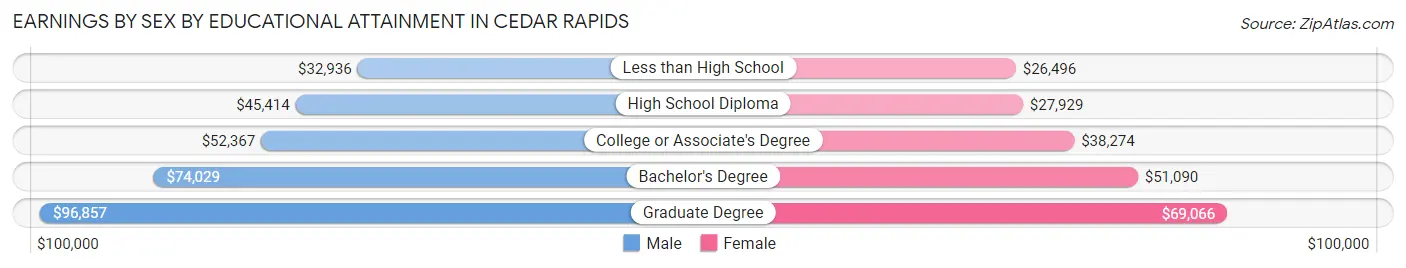
Earnings by Sex by Educational Attainment in Cedar Rapids
Average earnings in Cedar Rapids are $55,994 for men and $39,859 for women, a difference of 28.8%. Men with an educational attainment of graduate degree enjoy the highest average annual earnings of $96,857, while those with less than high school education earn the least with $32,936. Women with an educational attainment of graduate degree earn the most with the average annual earnings of $69,066, while those with less than high school education have the smallest earnings of $26,496.
| Educational Attainment | Male Income | Female Income |
| Less than High School | $32,936 | $26,496 |
| High School Diploma | $45,414 | $27,929 |
| College or Associate's Degree | $52,367 | $38,274 |
| Bachelor's Degree | $74,029 | $51,090 |
| Graduate Degree | $96,857 | $69,066 |
| Total | $55,994 | $39,859 |
Family Income in Cedar Rapids
Family Income Brackets in Cedar Rapids
According to the Cedar Rapids family income data, there are 6,536 families falling into the $100,000 to $149,999 income range, which is the most common income bracket and makes up 19.7% of all families. Conversely, the $10,000 to $14,999 income bracket is the least frequent group with only 498 families (1.5%) belonging to this category.
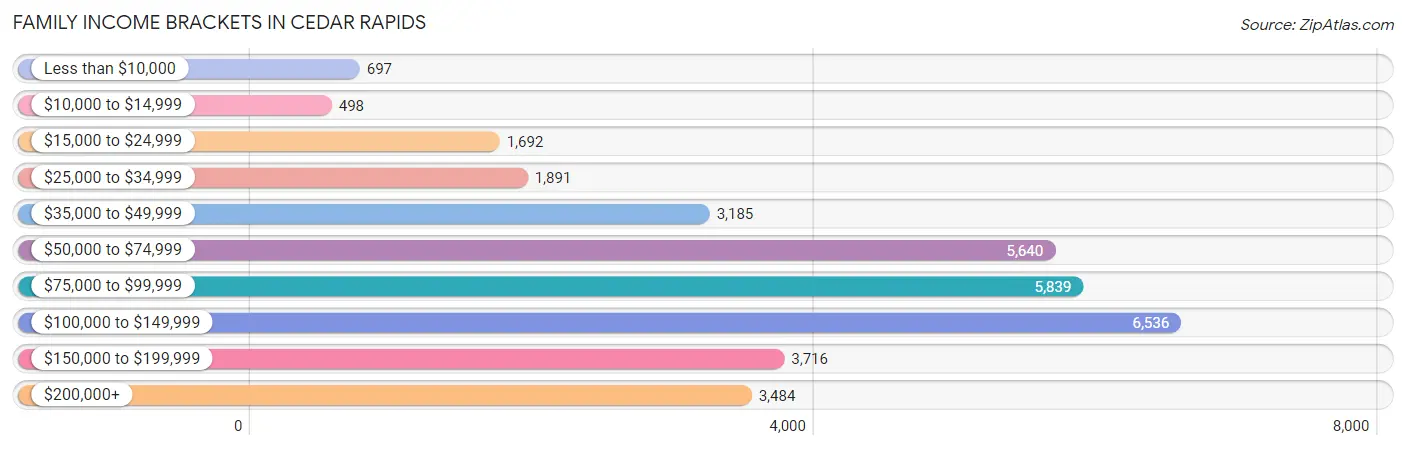
| Income Bracket | # Families | % Families |
| Less than $10,000 | 697 | 2.1% |
| $10,000 to $14,999 | 498 | 1.5% |
| $15,000 to $24,999 | 1,692 | 5.1% |
| $25,000 to $34,999 | 1,891 | 5.7% |
| $35,000 to $49,999 | 3,185 | 9.6% |
| $50,000 to $74,999 | 5,640 | 17.0% |
| $75,000 to $99,999 | 5,839 | 17.6% |
| $100,000 to $149,999 | 6,536 | 19.7% |
| $150,000 to $199,999 | 3,716 | 11.2% |
| $200,000+ | 3,484 | 10.5% |
Family Income by Famaliy Size in Cedar Rapids
4-person families (5,236 | 15.8%) account for the highest median family income in Cedar Rapids with $113,664 per family, while 2-person families (16,899 | 50.9%) have the highest median income of $38,983 per family member.
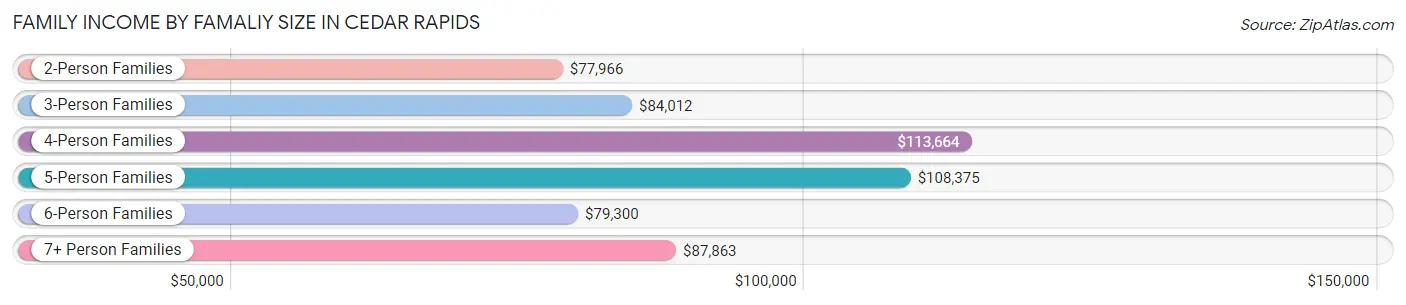
| Income Bracket | # Families | Median Income |
| 2-Person Families | 16,899 (50.9%) | $77,966 |
| 3-Person Families | 7,461 (22.5%) | $84,012 |
| 4-Person Families | 5,236 (15.8%) | $113,664 |
| 5-Person Families | 2,450 (7.4%) | $108,375 |
| 6-Person Families | 646 (1.9%) | $79,300 |
| 7+ Person Families | 485 (1.5%) | $87,863 |
| Total | 33,177 (100.0%) | $86,756 |
Family Income by Number of Earners in Cedar Rapids
The median family income in Cedar Rapids is $86,756, with families comprising 3+ earners (3,526) having the highest median family income of $137,470, while families with no earners (4,434) have the lowest median family income of $52,830, accounting for 10.6% and 13.4% of families, respectively.
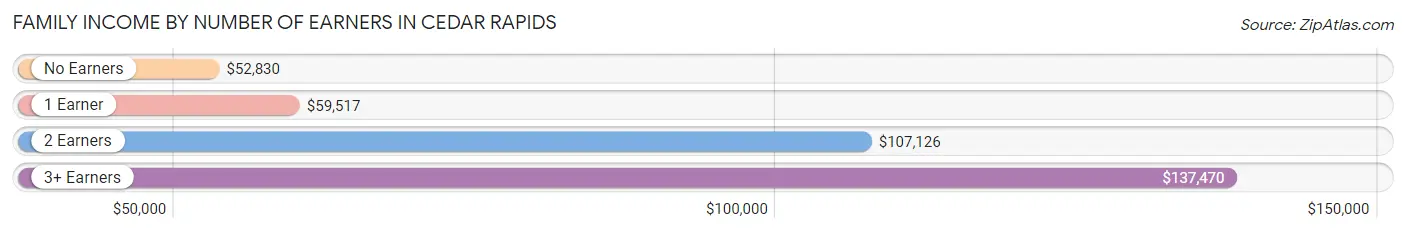
| Number of Earners | # Families | Median Income |
| No Earners | 4,434 (13.4%) | $52,830 |
| 1 Earner | 9,992 (30.1%) | $59,517 |
| 2 Earners | 15,225 (45.9%) | $107,126 |
| 3+ Earners | 3,526 (10.6%) | $137,470 |
| Total | 33,177 (100.0%) | $86,756 |
Household Income in Cedar Rapids
Household Income Brackets in Cedar Rapids
With 10,549 households falling in the category, the $50,000 to $74,999 income range is the most frequent in Cedar Rapids, accounting for 18.1% of all households. In contrast, only 1,982 households (3.4%) fall into the $10,000 to $14,999 income bracket, making it the least populous group.
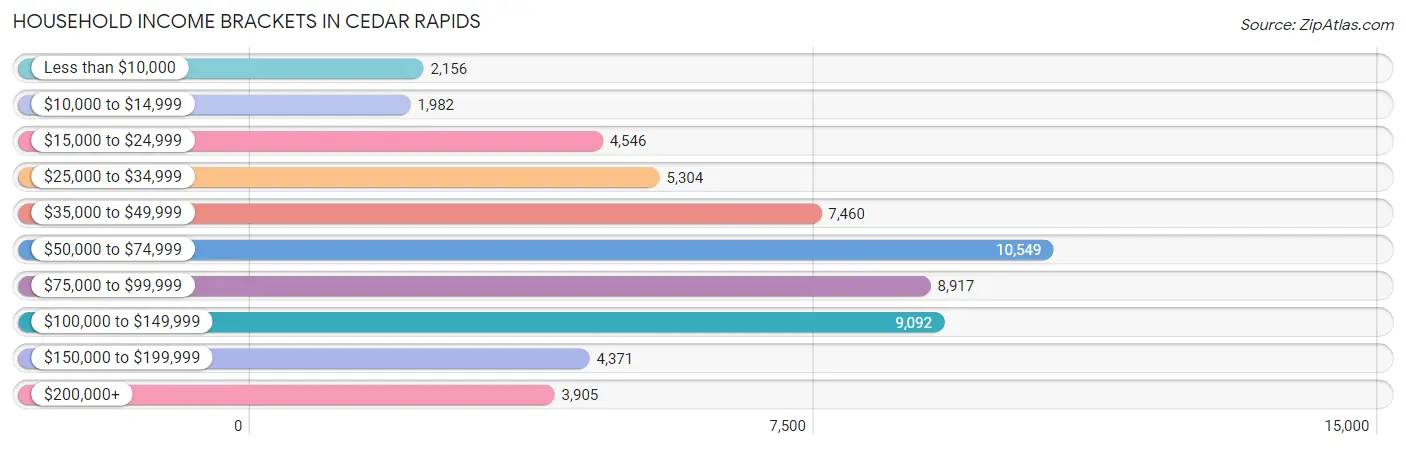
| Income Bracket | # Households | % Households |
| Less than $10,000 | 2,156 | 3.7% |
| $10,000 to $14,999 | 1,982 | 3.4% |
| $15,000 to $24,999 | 4,546 | 7.8% |
| $25,000 to $34,999 | 5,304 | 9.1% |
| $35,000 to $49,999 | 7,460 | 12.8% |
| $50,000 to $74,999 | 10,549 | 18.1% |
| $75,000 to $99,999 | 8,917 | 15.3% |
| $100,000 to $149,999 | 9,092 | 15.6% |
| $150,000 to $199,999 | 4,371 | 7.5% |
| $200,000+ | 3,905 | 6.7% |
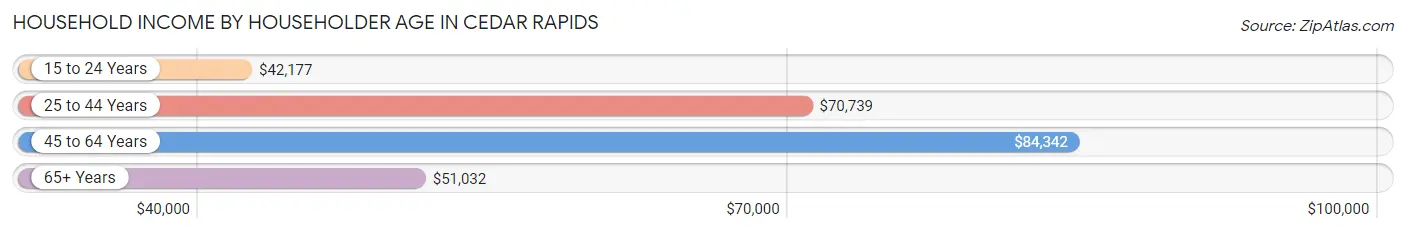
Household Income by Householder Age in Cedar Rapids
The median household income in Cedar Rapids is $66,895, with the highest median household income of $84,342 found in the 45 to 64 years age bracket for the primary householder. A total of 19,340 households (33.2%) fall into this category. Meanwhile, the 15 to 24 years age bracket for the primary householder has the lowest median household income of $42,177, with 3,849 households (6.6%) in this group.
| Income Bracket | # Households | Median Income |
| 15 to 24 Years | 3,849 (6.6%) | $42,177 |
| 25 to 44 Years | 20,978 (36.0%) | $70,739 |
| 45 to 64 Years | 19,340 (33.2%) | $84,342 |
| 65+ Years | 14,116 (24.2%) | $51,032 |
| Total | 58,283 (100.0%) | $66,895 |
Poverty in Cedar Rapids
Income Below Poverty by Sex and Age in Cedar Rapids
With 10.2% poverty level for males and 12.5% for females among the residents of Cedar Rapids, 15 year old males and 18 to 24 year old females are the most vulnerable to poverty, with 163 males (20.9%) and 1,721 females (26.4%) in their respective age groups living below the poverty level.
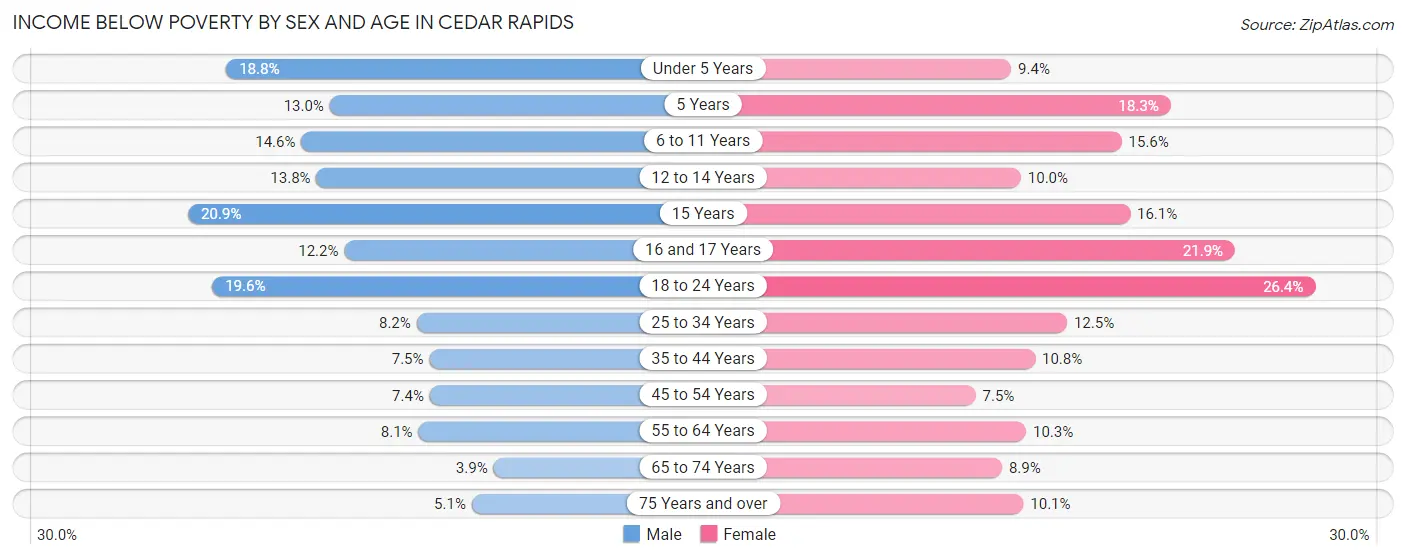
| Age Bracket | Male | Female |
| Under 5 Years | 775 (18.8%) | 370 (9.4%) |
| 5 Years | 114 (13.0%) | 132 (18.3%) |
| 6 to 11 Years | 705 (14.6%) | 658 (15.6%) |
| 12 to 14 Years | 362 (13.8%) | 240 (10.0%) |
| 15 Years | 163 (20.9%) | 118 (16.1%) |
| 16 and 17 Years | 208 (12.2%) | 390 (21.9%) |
| 18 to 24 Years | 1,281 (19.6%) | 1,721 (26.4%) |
| 25 to 34 Years | 824 (8.2%) | 1,237 (12.5%) |
| 35 to 44 Years | 701 (7.5%) | 960 (10.8%) |
| 45 to 54 Years | 593 (7.4%) | 576 (7.4%) |
| 55 to 64 Years | 660 (8.1%) | 816 (10.3%) |
| 65 to 74 Years | 227 (3.9%) | 602 (8.9%) |
| 75 Years and over | 174 (5.1%) | 553 (10.1%) |
| Total | 6,787 (10.2%) | 8,373 (12.5%) |
Income Above Poverty by Sex and Age in Cedar Rapids
According to the poverty statistics in Cedar Rapids, males aged 65 to 74 years and females aged 45 to 54 years are the age groups that are most secure financially, with 96.1% of males and 92.5% of females in these age groups living above the poverty line.
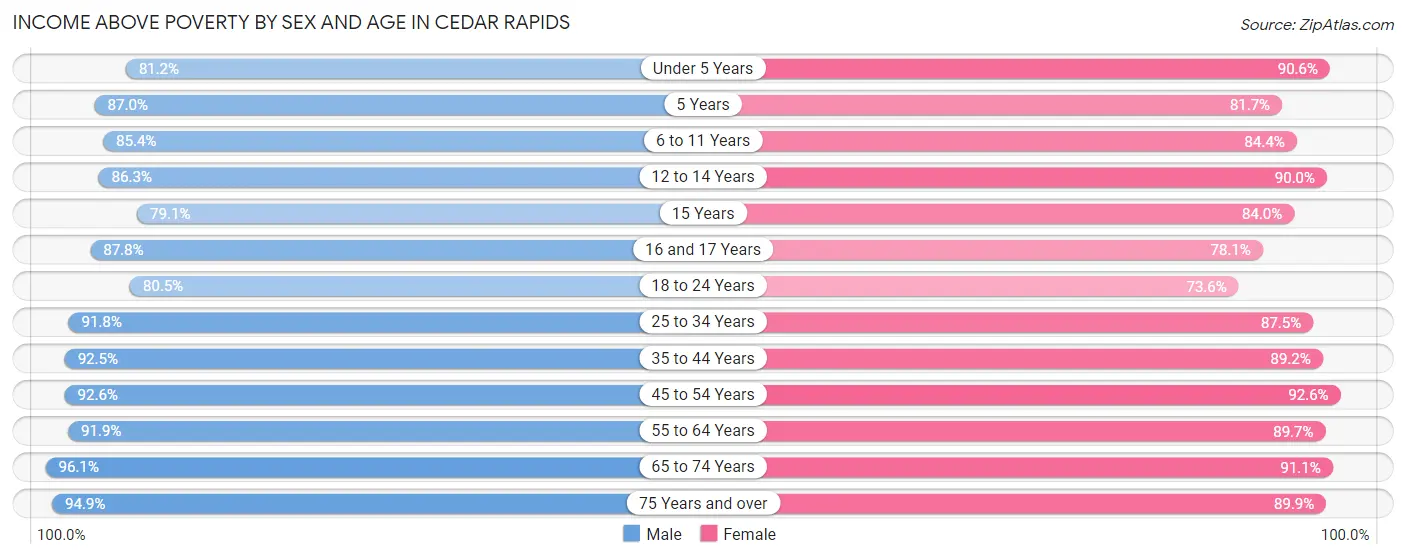
| Age Bracket | Male | Female |
| Under 5 Years | 3,353 (81.2%) | 3,553 (90.6%) |
| 5 Years | 762 (87.0%) | 589 (81.7%) |
| 6 to 11 Years | 4,127 (85.4%) | 3,566 (84.4%) |
| 12 to 14 Years | 2,270 (86.3%) | 2,167 (90.0%) |
| 15 Years | 617 (79.1%) | 617 (84.0%) |
| 16 and 17 Years | 1,497 (87.8%) | 1,392 (78.1%) |
| 18 to 24 Years | 5,272 (80.4%) | 4,807 (73.6%) |
| 25 to 34 Years | 9,258 (91.8%) | 8,631 (87.5%) |
| 35 to 44 Years | 8,694 (92.5%) | 7,963 (89.2%) |
| 45 to 54 Years | 7,379 (92.6%) | 7,151 (92.5%) |
| 55 to 64 Years | 7,523 (91.9%) | 7,136 (89.7%) |
| 65 to 74 Years | 5,605 (96.1%) | 6,149 (91.1%) |
| 75 Years and over | 3,237 (94.9%) | 4,915 (89.9%) |
| Total | 59,594 (89.8%) | 58,636 (87.5%) |
Income Below Poverty Among Married-Couple Families in Cedar Rapids
The poverty statistics for married-couple families in Cedar Rapids show that 3.0% or 714 of the total 23,794 families live below the poverty line. Families with 5 or more children have the highest poverty rate of 13.9%, comprising of 20 families. On the other hand, families with 1 or 2 children have the lowest poverty rate of 2.5%, which includes 187 families.
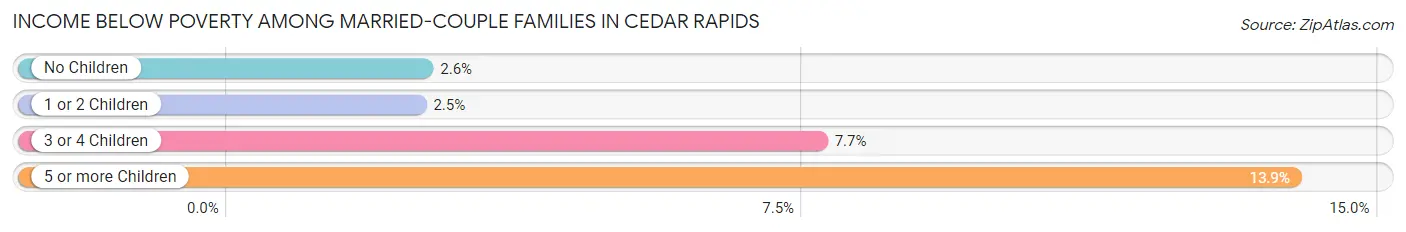
| Children | Above Poverty | Below Poverty |
| No Children | 13,816 (97.5%) | 362 (2.5%) |
| 1 or 2 Children | 7,401 (97.5%) | 187 (2.5%) |
| 3 or 4 Children | 1,739 (92.3%) | 145 (7.7%) |
| 5 or more Children | 124 (86.1%) | 20 (13.9%) |
| Total | 23,080 (97.0%) | 714 (3.0%) |
Income Below Poverty Among Single-Parent Households in Cedar Rapids
According to the poverty data in Cedar Rapids, 13.2% or 417 single-father households and 20.3% or 1,266 single-mother households are living below the poverty line. Among single-father households, those with 3 or 4 children have the highest poverty rate, with 61 households (52.6%) experiencing poverty. Likewise, among single-mother households, those with 3 or 4 children have the highest poverty rate, with 324 households (59.2%) falling below the poverty line.
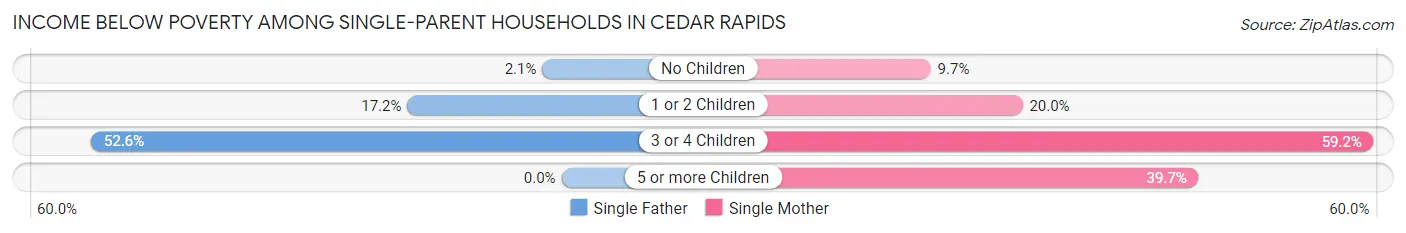
| Children | Single Father | Single Mother |
| No Children | 23 (2.1%) | 205 (9.7%) |
| 1 or 2 Children | 333 (17.2%) | 689 (20.0%) |
| 3 or 4 Children | 61 (52.6%) | 324 (59.2%) |
| 5 or more Children | 0 (0.0%) | 48 (39.7%) |
| Total | 417 (13.2%) | 1,266 (20.3%) |
Income Below Poverty Among Married-Couple vs Single-Parent Households in Cedar Rapids
The poverty data for Cedar Rapids shows that 714 of the married-couple family households (3.0%) and 1,683 of the single-parent households (17.9%) are living below the poverty level. Within the married-couple family households, those with 5 or more children have the highest poverty rate, with 20 households (13.9%) falling below the poverty line. Among the single-parent households, those with 3 or 4 children have the highest poverty rate, with 385 household (58.1%) living below poverty.
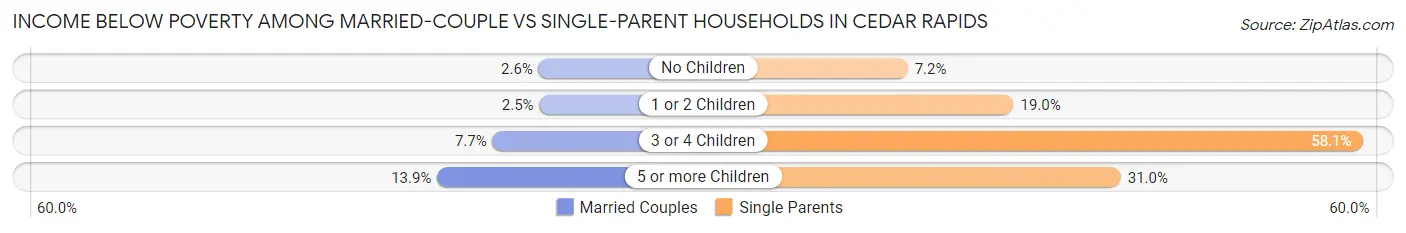
| Children | Married-Couple Families | Single-Parent Households |
| No Children | 362 (2.5%) | 228 (7.2%) |
| 1 or 2 Children | 187 (2.5%) | 1,022 (19.0%) |
| 3 or 4 Children | 145 (7.7%) | 385 (58.1%) |
| 5 or more Children | 20 (13.9%) | 48 (31.0%) |
| Total | 714 (3.0%) | 1,683 (17.9%) |
Race in Cedar Rapids
The most populous races in Cedar Rapids are White / Caucasian (110,725 | 80.9%), Black / African American (11,847 | 8.6%), and Two or more Races (8,241 | 6.0%).
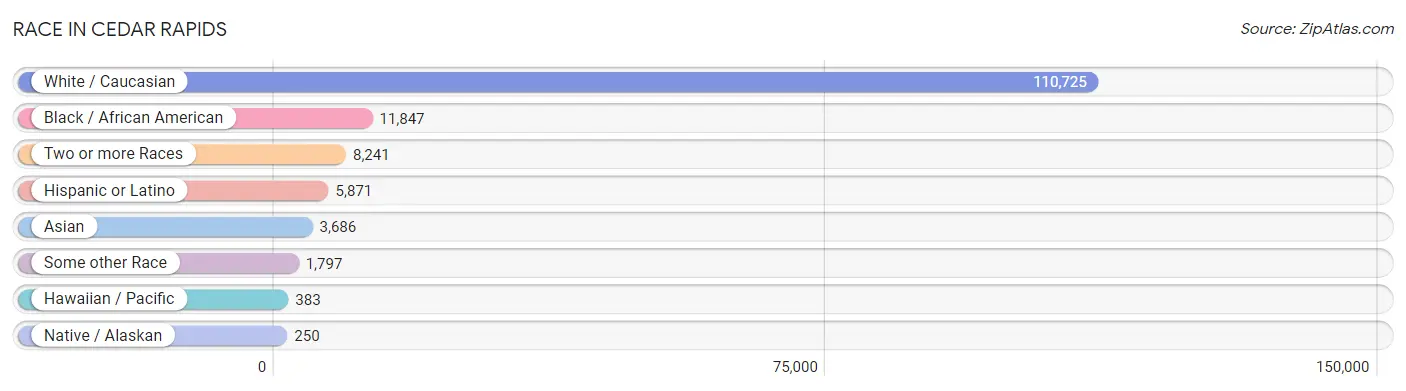
| Race | # Population | % Population |
| Asian | 3,686 | 2.7% |
| Black / African American | 11,847 | 8.6% |
| Hawaiian / Pacific | 383 | 0.3% |
| Hispanic or Latino | 5,871 | 4.3% |
| Native / Alaskan | 250 | 0.2% |
| White / Caucasian | 110,725 | 80.9% |
| Two or more Races | 8,241 | 6.0% |
| Some other Race | 1,797 | 1.3% |
| Total | 136,929 | 100.0% |
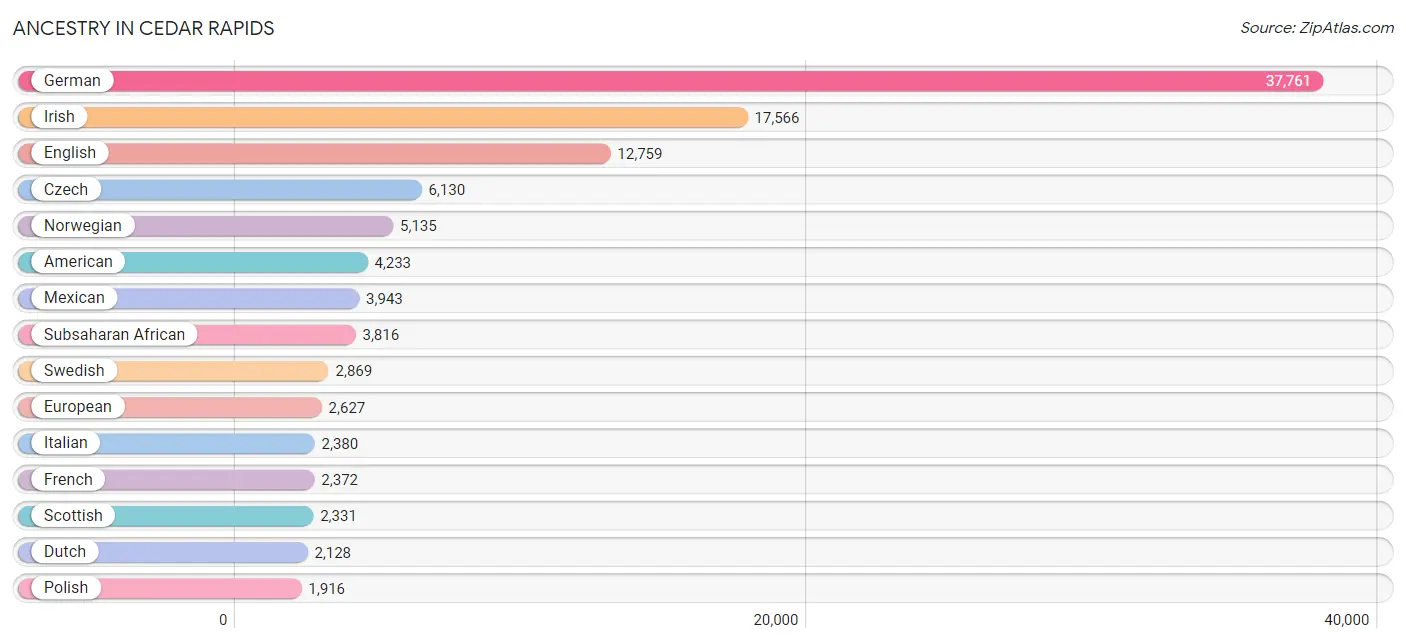
Ancestry in Cedar Rapids
The most populous ancestries reported in Cedar Rapids are German (37,761 | 27.6%), Irish (17,566 | 12.8%), English (12,759 | 9.3%), Czech (6,130 | 4.5%), and Norwegian (5,135 | 3.7%), together accounting for 58.0% of all Cedar Rapids residents.
| Ancestry | # Population | % Population |
| African | 1,189 | 0.9% |
| Alaska Native | 2 | 0.0% |
| Albanian | 95 | 0.1% |
| American | 4,233 | 3.1% |
| Apache | 41 | 0.0% |
| Arab | 1,449 | 1.1% |
| Armenian | 110 | 0.1% |
| Austrian | 234 | 0.2% |
| Bangladeshi | 15 | 0.0% |
| Belgian | 384 | 0.3% |
| Bhutanese | 244 | 0.2% |
| Blackfeet | 6 | 0.0% |
| Brazilian | 27 | 0.0% |
| British | 1,158 | 0.9% |
| Burmese | 236 | 0.2% |
| Canadian | 159 | 0.1% |
| Celtic | 31 | 0.0% |
| Central American | 617 | 0.4% |
| Cherokee | 468 | 0.3% |
| Chilean | 28 | 0.0% |
| Chippewa | 65 | 0.1% |
| Choctaw | 81 | 0.1% |
| Colombian | 25 | 0.0% |
| Croatian | 40 | 0.0% |
| Crow | 1 | 0.0% |
| Cuban | 82 | 0.1% |
| Czech | 6,130 | 4.5% |
| Czechoslovakian | 223 | 0.2% |
| Danish | 1,064 | 0.8% |
| Dominican | 31 | 0.0% |
| Dutch | 2,128 | 1.5% |
| Eastern European | 192 | 0.1% |
| Ecuadorian | 96 | 0.1% |
| Egyptian | 36 | 0.0% |
| English | 12,759 | 9.3% |
| Estonian | 23 | 0.0% |
| European | 2,627 | 1.9% |
| Finnish | 94 | 0.1% |
| French | 2,372 | 1.7% |
| French American Indian | 3 | 0.0% |
| French Canadian | 236 | 0.2% |
| German | 37,761 | 27.6% |
| Ghanaian | 98 | 0.1% |
| Greek | 204 | 0.2% |
| Guatemalan | 395 | 0.3% |
| Haitian | 68 | 0.1% |
| Honduran | 35 | 0.0% |
| Hungarian | 181 | 0.1% |
| Indian (Asian) | 410 | 0.3% |
| Indonesian | 225 | 0.2% |
| Inupiat | 1 | 0.0% |
| Iranian | 6 | 0.0% |
| Iraqi | 12 | 0.0% |
| Irish | 17,566 | 12.8% |
| Italian | 2,380 | 1.7% |
| Jamaican | 118 | 0.1% |
| Japanese | 7 | 0.0% |
| Kenyan | 36 | 0.0% |
| Korean | 400 | 0.3% |
| Laotian | 155 | 0.1% |
| Latvian | 12 | 0.0% |
| Lebanese | 1,090 | 0.8% |
| Liberian | 30 | 0.0% |
| Lithuanian | 60 | 0.0% |
| Luxembourger | 91 | 0.1% |
| Macedonian | 9 | 0.0% |
| Malaysian | 283 | 0.2% |
| Maltese | 18 | 0.0% |
| Mexican | 3,943 | 2.9% |
| Mexican American Indian | 6 | 0.0% |
| Moroccan | 80 | 0.1% |
| Native Hawaiian | 33 | 0.0% |
| Navajo | 13 | 0.0% |
| Nicaraguan | 89 | 0.1% |
| Nigerian | 286 | 0.2% |
| Northern European | 449 | 0.3% |
| Norwegian | 5,135 | 3.7% |
| Pakistani | 39 | 0.0% |
| Panamanian | 38 | 0.0% |
| Pennsylvania German | 144 | 0.1% |
| Peruvian | 117 | 0.1% |
| Polish | 1,916 | 1.4% |
| Portuguese | 43 | 0.0% |
| Puerto Rican | 394 | 0.3% |
| Romanian | 9 | 0.0% |
| Russian | 175 | 0.1% |
| Salvadoran | 60 | 0.0% |
| Scandinavian | 866 | 0.6% |
| Scotch-Irish | 1,087 | 0.8% |
| Scottish | 2,331 | 1.7% |
| Sioux | 71 | 0.1% |
| Slavic | 55 | 0.0% |
| Slovak | 156 | 0.1% |
| Slovene | 97 | 0.1% |
| South African | 76 | 0.1% |
| South American | 297 | 0.2% |
| Spaniard | 232 | 0.2% |
| Spanish | 86 | 0.1% |
| Sri Lankan | 498 | 0.4% |
| Subsaharan African | 3,816 | 2.8% |
| Sudanese | 191 | 0.1% |
| Swedish | 2,869 | 2.1% |
| Swiss | 481 | 0.4% |
| Syrian | 92 | 0.1% |
| Thai | 1,466 | 1.1% |
| Tlingit-Haida | 30 | 0.0% |
| Turkish | 31 | 0.0% |
| Ukrainian | 233 | 0.2% |
| Venezuelan | 31 | 0.0% |
| Vietnamese | 57 | 0.0% |
| Welsh | 956 | 0.7% |
| Yugoslavian | 42 | 0.0% |
| Yup'ik | 13 | 0.0% |
| Zimbabwean | 143 | 0.1% | View All 114 Rows |
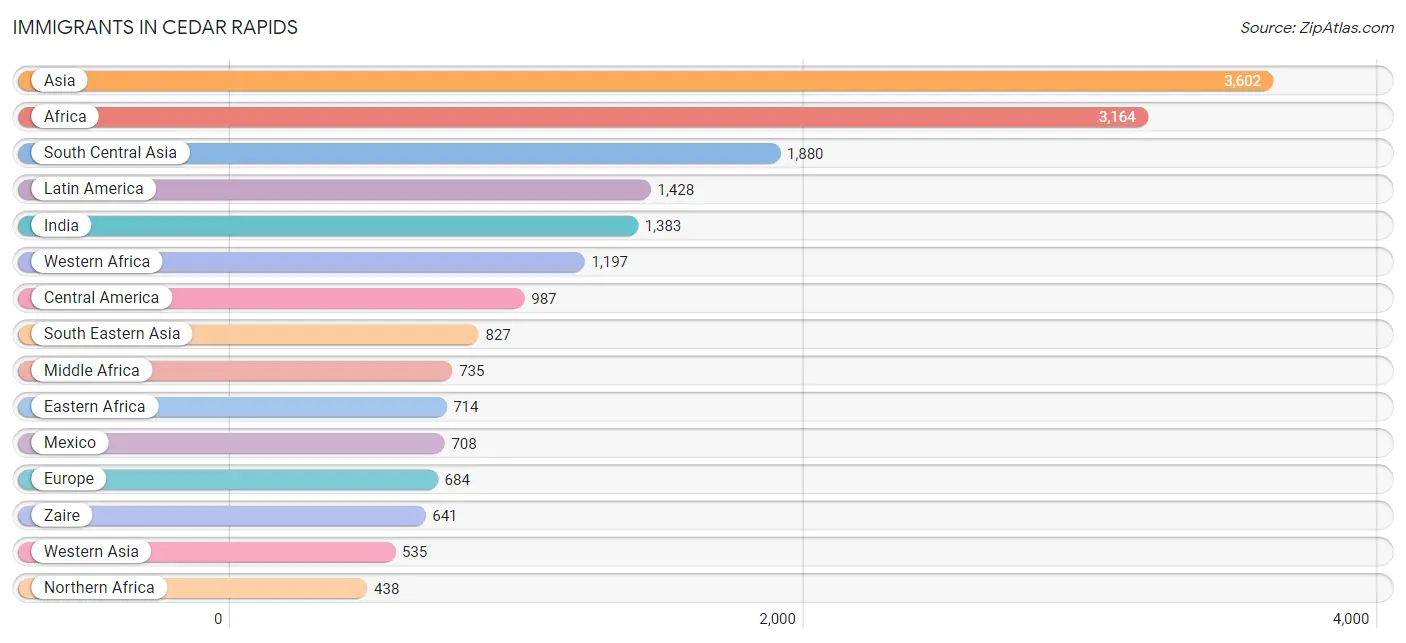
Immigrants in Cedar Rapids
The most numerous immigrant groups reported in Cedar Rapids came from Asia (3,602 | 2.6%), Africa (3,164 | 2.3%), South Central Asia (1,880 | 1.4%), Latin America (1,428 | 1.0%), and India (1,383 | 1.0%), together accounting for 8.4% of all Cedar Rapids residents.
| Immigration Origin | # Population | % Population |
| Africa | 3,164 | 2.3% |
| Armenia | 41 | 0.0% |
| Asia | 3,602 | 2.6% |
| Australia | 34 | 0.0% |
| Bangladesh | 101 | 0.1% |
| Bosnia and Herzegovina | 42 | 0.0% |
| Brazil | 26 | 0.0% |
| Bulgaria | 40 | 0.0% |
| Canada | 187 | 0.1% |
| Caribbean | 213 | 0.2% |
| Central America | 987 | 0.7% |
| Chile | 28 | 0.0% |
| China | 218 | 0.2% |
| Colombia | 1 | 0.0% |
| Congo | 94 | 0.1% |
| Cuba | 26 | 0.0% |
| Czechoslovakia | 5 | 0.0% |
| Eastern Africa | 714 | 0.5% |
| Eastern Asia | 360 | 0.3% |
| Eastern Europe | 308 | 0.2% |
| Ecuador | 96 | 0.1% |
| El Salvador | 48 | 0.0% |
| Eritrea | 12 | 0.0% |
| Ethiopia | 99 | 0.1% |
| Europe | 684 | 0.5% |
| France | 30 | 0.0% |
| Germany | 149 | 0.1% |
| Ghana | 98 | 0.1% |
| Guatemala | 172 | 0.1% |
| Haiti | 93 | 0.1% |
| Honduras | 59 | 0.0% |
| Hong Kong | 6 | 0.0% |
| Hungary | 15 | 0.0% |
| India | 1,383 | 1.0% |
| Indonesia | 58 | 0.0% |
| Iran | 6 | 0.0% |
| Iraq | 24 | 0.0% |
| Italy | 52 | 0.0% |
| Jamaica | 54 | 0.0% |
| Japan | 18 | 0.0% |
| Kenya | 118 | 0.1% |
| Korea | 124 | 0.1% |
| Kuwait | 33 | 0.0% |
| Laos | 126 | 0.1% |
| Latin America | 1,428 | 1.0% |
| Lebanon | 366 | 0.3% |
| Liberia | 255 | 0.2% |
| Mexico | 708 | 0.5% |
| Micronesia | 168 | 0.1% |
| Middle Africa | 735 | 0.5% |
| Morocco | 82 | 0.1% |
| Nepal | 73 | 0.1% |
| Netherlands | 17 | 0.0% |
| Nigeria | 286 | 0.2% |
| Northern Africa | 438 | 0.3% |
| Northern Europe | 96 | 0.1% |
| Oceania | 202 | 0.2% |
| Pakistan | 12 | 0.0% |
| Peru | 54 | 0.0% |
| Philippines | 109 | 0.1% |
| Poland | 19 | 0.0% |
| Russia | 53 | 0.0% |
| Saudi Arabia | 37 | 0.0% |
| Scotland | 10 | 0.0% |
| Sierra Leone | 21 | 0.0% |
| South Africa | 62 | 0.1% |
| South America | 228 | 0.2% |
| South Central Asia | 1,880 | 1.4% |
| South Eastern Asia | 827 | 0.6% |
| Southern Europe | 84 | 0.1% |
| Spain | 32 | 0.0% |
| Sri Lanka | 46 | 0.0% |
| Sudan | 298 | 0.2% |
| Sweden | 63 | 0.1% |
| Taiwan | 11 | 0.0% |
| Thailand | 31 | 0.0% |
| Turkey | 34 | 0.0% |
| Ukraine | 72 | 0.1% |
| Venezuela | 23 | 0.0% |
| Vietnam | 345 | 0.3% |
| West Indies | 40 | 0.0% |
| Western Africa | 1,197 | 0.9% |
| Western Asia | 535 | 0.4% |
| Western Europe | 196 | 0.1% |
| Zaire | 641 | 0.5% |
| Zimbabwe | 55 | 0.0% | View All 86 Rows |
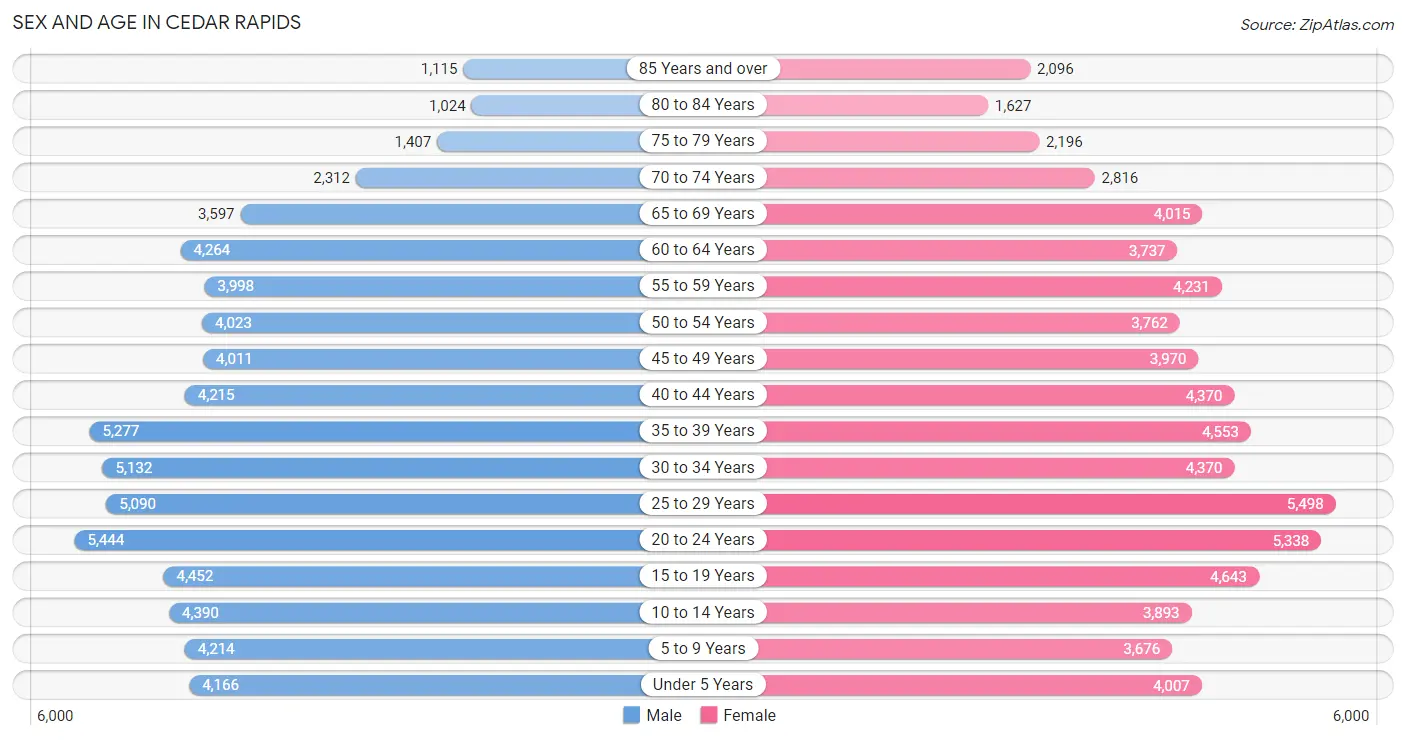
Sex and Age in Cedar Rapids
Sex and Age in Cedar Rapids
The most populous age groups in Cedar Rapids are 20 to 24 Years (5,444 | 8.0%) for men and 25 to 29 Years (5,498 | 8.0%) for women.
| Age Bracket | Male | Female |
| Under 5 Years | 4,166 (6.1%) | 4,007 (5.8%) |
| 5 to 9 Years | 4,214 (6.2%) | 3,676 (5.3%) |
| 10 to 14 Years | 4,390 (6.4%) | 3,893 (5.7%) |
| 15 to 19 Years | 4,452 (6.5%) | 4,643 (6.8%) |
| 20 to 24 Years | 5,444 (8.0%) | 5,338 (7.8%) |
| 25 to 29 Years | 5,090 (7.5%) | 5,498 (8.0%) |
| 30 to 34 Years | 5,132 (7.5%) | 4,370 (6.4%) |
| 35 to 39 Years | 5,277 (7.7%) | 4,553 (6.6%) |
| 40 to 44 Years | 4,215 (6.2%) | 4,370 (6.4%) |
| 45 to 49 Years | 4,011 (5.9%) | 3,970 (5.8%) |
| 50 to 54 Years | 4,023 (5.9%) | 3,762 (5.5%) |
| 55 to 59 Years | 3,998 (5.9%) | 4,231 (6.1%) |
| 60 to 64 Years | 4,264 (6.3%) | 3,737 (5.4%) |
| 65 to 69 Years | 3,597 (5.3%) | 4,015 (5.8%) |
| 70 to 74 Years | 2,312 (3.4%) | 2,816 (4.1%) |
| 75 to 79 Years | 1,407 (2.1%) | 2,196 (3.2%) |
| 80 to 84 Years | 1,024 (1.5%) | 1,627 (2.4%) |
| 85 Years and over | 1,115 (1.6%) | 2,096 (3.0%) |
| Total | 68,131 (100.0%) | 68,798 (100.0%) |
Families and Households in Cedar Rapids
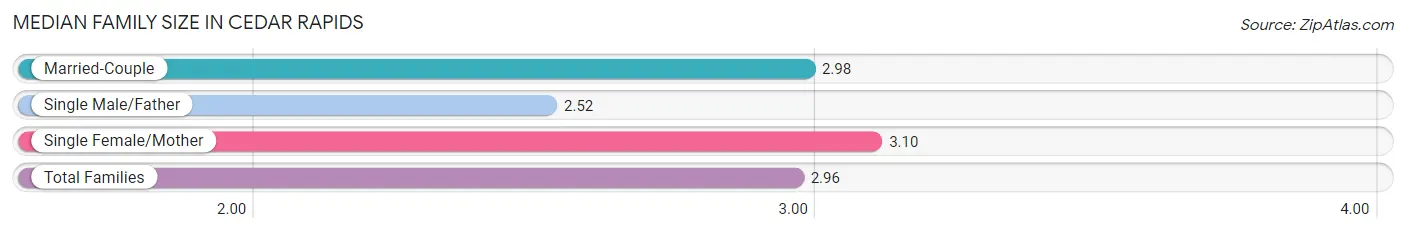
Median Family Size in Cedar Rapids
The median family size in Cedar Rapids is 2.96 persons per family, with single female/mother families (6,226 | 18.8%) accounting for the largest median family size of 3.1 persons per family. On the other hand, single male/father families (3,157 | 9.5%) represent the smallest median family size with 2.52 persons per family.
| Family Type | # Families | Family Size |
| Married-Couple | 23,794 (71.7%) | 2.98 |
| Single Male/Father | 3,157 (9.5%) | 2.52 |
| Single Female/Mother | 6,226 (18.8%) | 3.10 |
| Total Families | 33,177 (100.0%) | 2.96 |
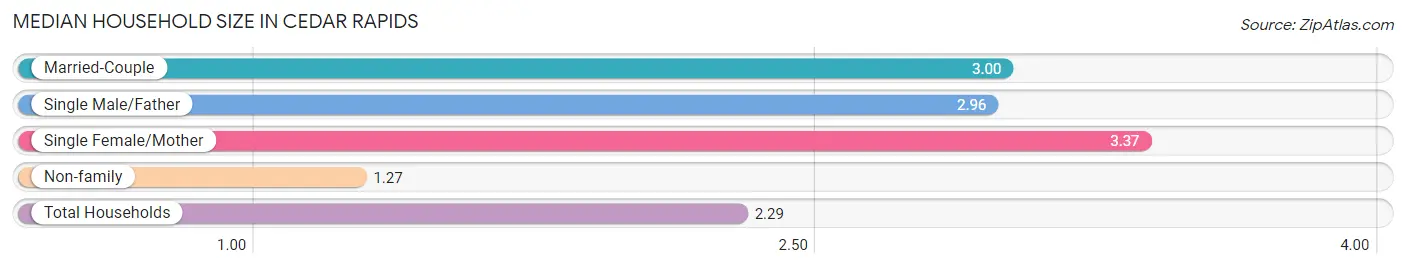
Median Household Size in Cedar Rapids
The median household size in Cedar Rapids is 2.29 persons per household, with single female/mother households (6,226 | 10.7%) accounting for the largest median household size of 3.37 persons per household. non-family households (25,106 | 43.1%) represent the smallest median household size with 1.27 persons per household.
| Household Type | # Households | Household Size |
| Married-Couple | 23,794 (40.8%) | 3.00 |
| Single Male/Father | 3,157 (5.4%) | 2.96 |
| Single Female/Mother | 6,226 (10.7%) | 3.37 |
| Non-family | 25,106 (43.1%) | 1.27 |
| Total Households | 58,283 (100.0%) | 2.29 |
Household Size by Marriage Status in Cedar Rapids
Out of a total of 58,283 households in Cedar Rapids, 33,177 (56.9%) are family households, while 25,106 (43.1%) are nonfamily households. The most numerous type of family households are 2-person households, comprising 15,576, and the most common type of nonfamily households are 1-person households, comprising 19,759.
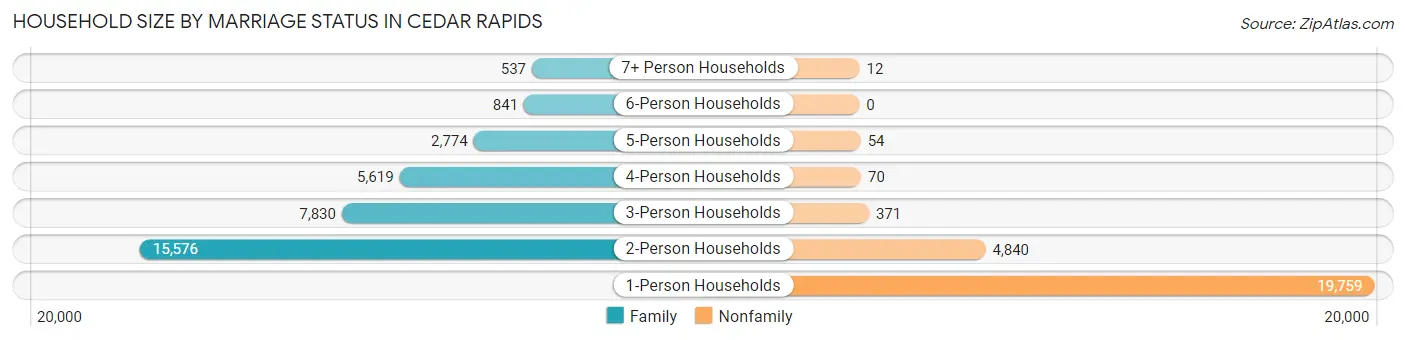
| Household Size | Family Households | Nonfamily Households |
| 1-Person Households | - | 19,759 (33.9%) |
| 2-Person Households | 15,576 (26.7%) | 4,840 (8.3%) |
| 3-Person Households | 7,830 (13.4%) | 371 (0.6%) |
| 4-Person Households | 5,619 (9.6%) | 70 (0.1%) |
| 5-Person Households | 2,774 (4.8%) | 54 (0.1%) |
| 6-Person Households | 841 (1.4%) | 0 (0.0%) |
| 7+ Person Households | 537 (0.9%) | 12 (0.0%) |
| Total | 33,177 (56.9%) | 25,106 (43.1%) |
Female Fertility in Cedar Rapids
Fertility by Age in Cedar Rapids
Average fertility rate in Cedar Rapids is 59.0 births per 1,000 women. Women in the age bracket of 20 to 34 years have the highest fertility rate with 86.0 births per 1,000 women. Women in the age bracket of 20 to 34 years acount for 66.3% of all women with births.
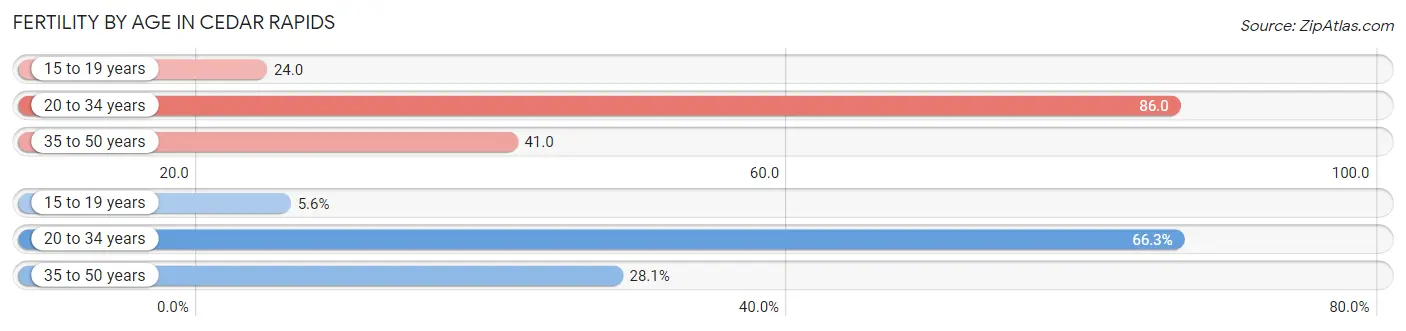
| Age Bracket | Women with Births | Births / 1,000 Women |
| 15 to 19 years | 111 (5.6%) | 24.0 |
| 20 to 34 years | 1,312 (66.3%) | 86.0 |
| 35 to 50 years | 557 (28.1%) | 41.0 |
| Total | 1,980 (100.0%) | 59.0 |
Fertility by Age by Marriage Status in Cedar Rapids
67.6% of women with births (1,980) in Cedar Rapids are married. The highest percentage of unmarried women with births falls into 15 to 19 years age bracket with 100.0% of them unmarried at the time of birth, while the lowest percentage of unmarried women with births belong to 35 to 50 years age bracket with 20.3% of them unmarried.
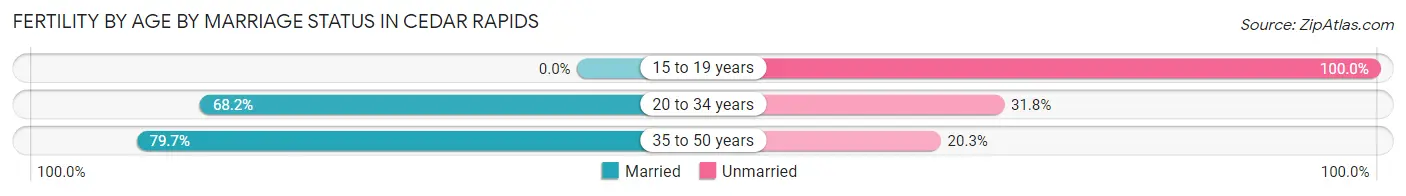
| Age Bracket | Married | Unmarried |
| 15 to 19 years | 0 (0.0%) | 111 (100.0%) |
| 20 to 34 years | 895 (68.2%) | 417 (31.8%) |
| 35 to 50 years | 444 (79.7%) | 113 (20.3%) |
| Total | 1,338 (67.6%) | 642 (32.4%) |
Fertility by Education in Cedar Rapids
Average fertility rate in Cedar Rapids is 59.0 births per 1,000 women. Women with the education attainment of graduate degree have the highest fertility rate of 97.0 births per 1,000 women, while women with the education attainment of college or associate's degree have the lowest fertility at 43.0 births per 1,000 women. Women with the education attainment of college or associate's degree represent 26.0% of all women with births.
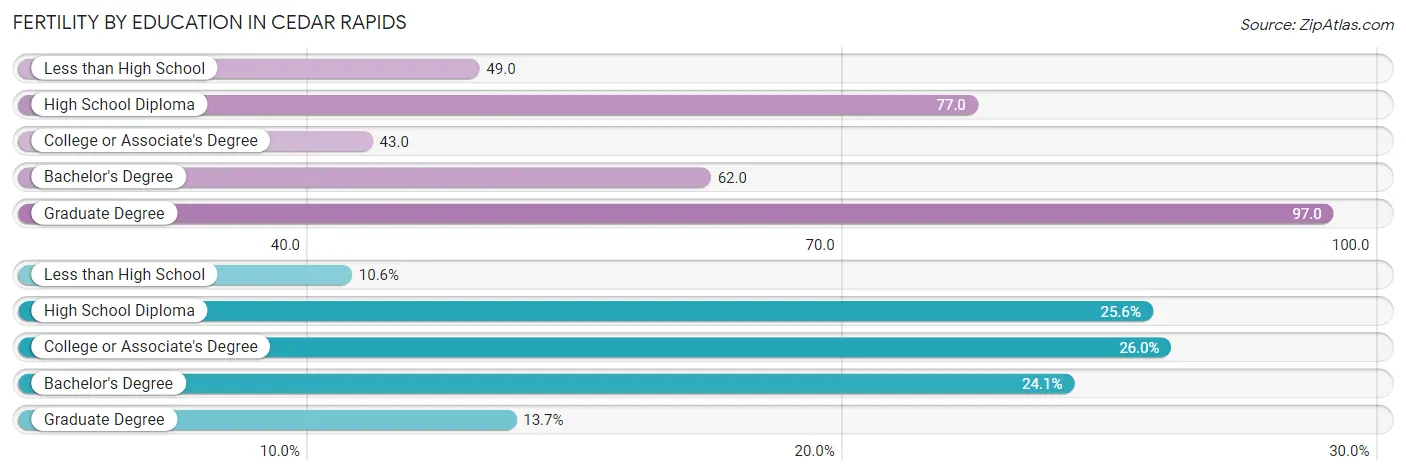
| Educational Attainment | Women with Births | Births / 1,000 Women |
| Less than High School | 210 (10.6%) | 49.0 |
| High School Diploma | 507 (25.6%) | 77.0 |
| College or Associate's Degree | 514 (26.0%) | 43.0 |
| Bachelor's Degree | 478 (24.1%) | 62.0 |
| Graduate Degree | 271 (13.7%) | 97.0 |
| Total | 1,980 (100.0%) | 59.0 |
Fertility by Education by Marriage Status in Cedar Rapids
32.4% of women with births in Cedar Rapids are unmarried. Women with the educational attainment of bachelor's degree are most likely to be married with 95.8% of them married at childbirth, while women with the educational attainment of less than high school are least likely to be married with 78.1% of them unmarried at childbirth.
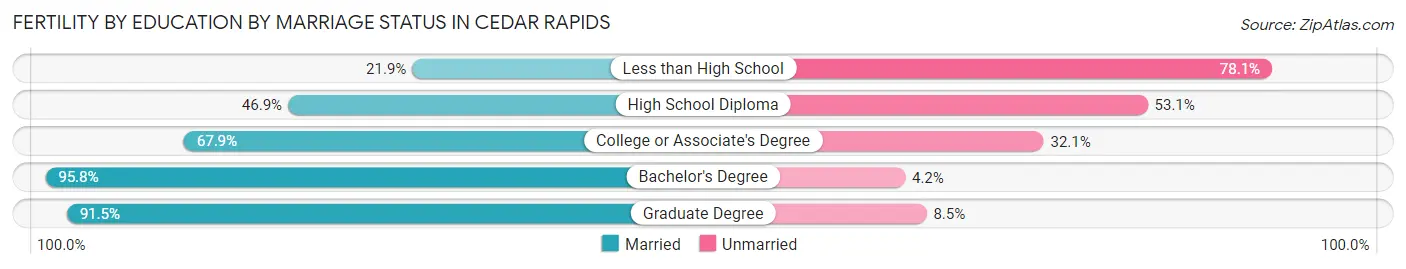
| Educational Attainment | Married | Unmarried |
| Less than High School | 46 (21.9%) | 164 (78.1%) |
| High School Diploma | 238 (46.9%) | 269 (53.1%) |
| College or Associate's Degree | 349 (67.9%) | 165 (32.1%) |
| Bachelor's Degree | 458 (95.8%) | 20 (4.2%) |
| Graduate Degree | 248 (91.5%) | 23 (8.5%) |
| Total | 1,338 (67.6%) | 642 (32.4%) |
Employment Characteristics in Cedar Rapids
Employment by Class of Employer in Cedar Rapids
Among the 71,877 employed individuals in Cedar Rapids, private company employees (53,402 | 74.3%), not-for-profit organizations (6,593 | 9.2%), and local government employees (3,665 | 5.1%) make up the most common classes of employment.
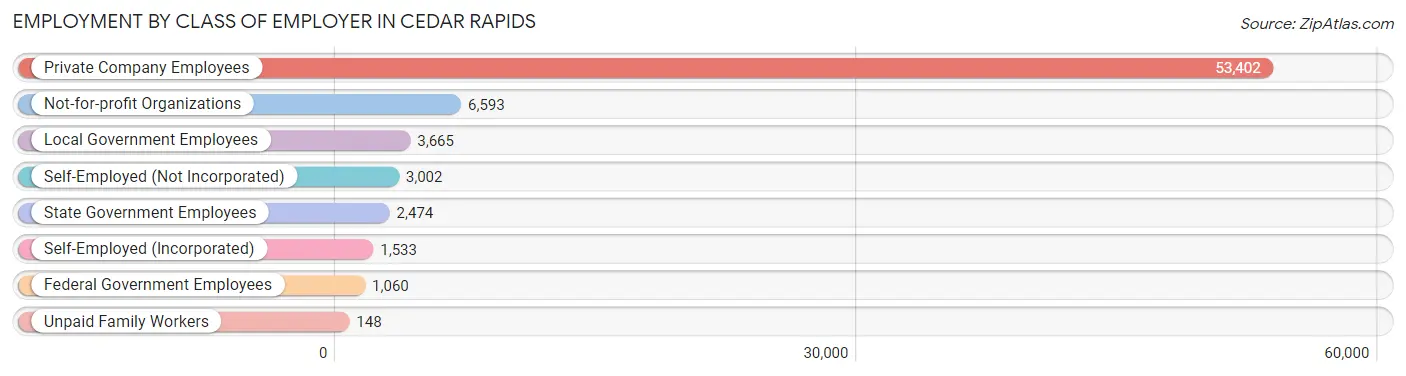
| Employer Class | # Employees | % Employees |
| Private Company Employees | 53,402 | 74.3% |
| Self-Employed (Incorporated) | 1,533 | 2.1% |
| Self-Employed (Not Incorporated) | 3,002 | 4.2% |
| Not-for-profit Organizations | 6,593 | 9.2% |
| Local Government Employees | 3,665 | 5.1% |
| State Government Employees | 2,474 | 3.4% |
| Federal Government Employees | 1,060 | 1.5% |
| Unpaid Family Workers | 148 | 0.2% |
| Total | 71,877 | 100.0% |
Employment Status by Age in Cedar Rapids
According to the labor force statistics for Cedar Rapids, out of the total population over 16 years of age (111,047), 68.6% or 76,178 individuals are in the labor force, with 3.9% or 2,971 of them unemployed. The age group with the highest labor force participation rate is 35 to 44 years, with 89.4% or 16,463 individuals in the labor force. Within the labor force, the 16 to 19 years age range has the highest percentage of unemployed individuals, with 8.8% or 337 of them being unemployed.
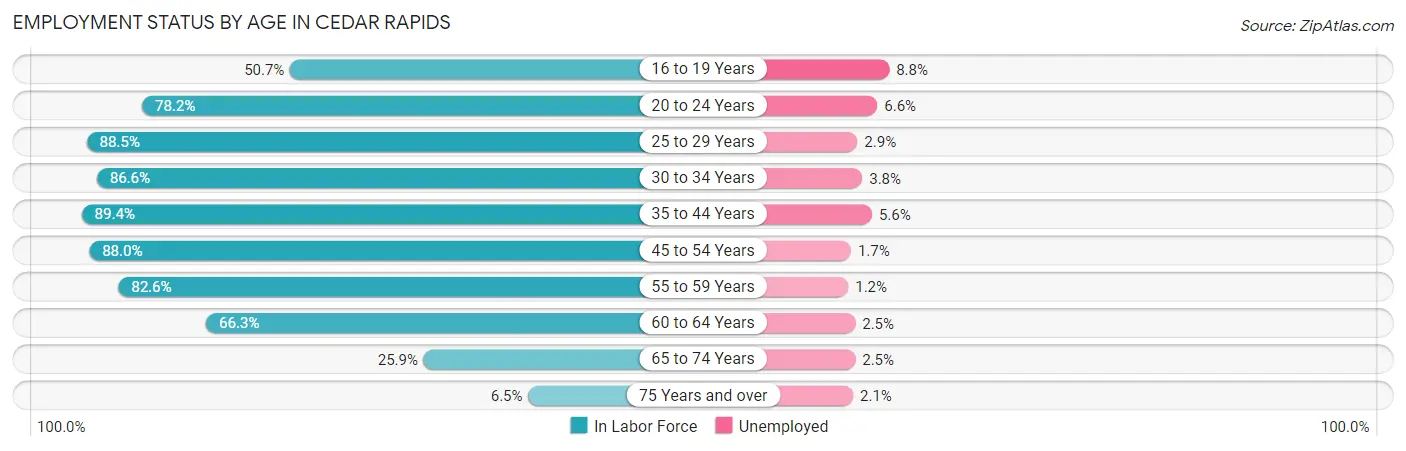
| Age Bracket | In Labor Force | Unemployed |
| 16 to 19 Years | 3,832 (50.7%) | 337 (8.8%) |
| 20 to 24 Years | 8,432 (78.2%) | 557 (6.6%) |
| 25 to 29 Years | 9,370 (88.5%) | 272 (2.9%) |
| 30 to 34 Years | 8,229 (86.6%) | 313 (3.8%) |
| 35 to 44 Years | 16,463 (89.4%) | 922 (5.6%) |
| 45 to 54 Years | 13,874 (88.0%) | 236 (1.7%) |
| 55 to 59 Years | 6,797 (82.6%) | 82 (1.2%) |
| 60 to 64 Years | 5,305 (66.3%) | 133 (2.5%) |
| 65 to 74 Years | 3,300 (25.9%) | 82 (2.5%) |
| 75 Years and over | 615 (6.5%) | 13 (2.1%) |
| Total | 76,178 (68.6%) | 2,971 (3.9%) |
Employment Status by Educational Attainment in Cedar Rapids
According to labor force statistics for Cedar Rapids, 85.2% of individuals (60,067) out of the total population between 25 and 64 years of age (70,501) are in the labor force, with 3.3% or 1,982 of them being unemployed. The group with the highest labor force participation rate are those with the educational attainment of bachelor's degree or higher, with 90.5% or 22,125 individuals in the labor force. Within the labor force, individuals with high school diploma education have the highest percentage of unemployment, with 4.3% or 557 of them being unemployed.
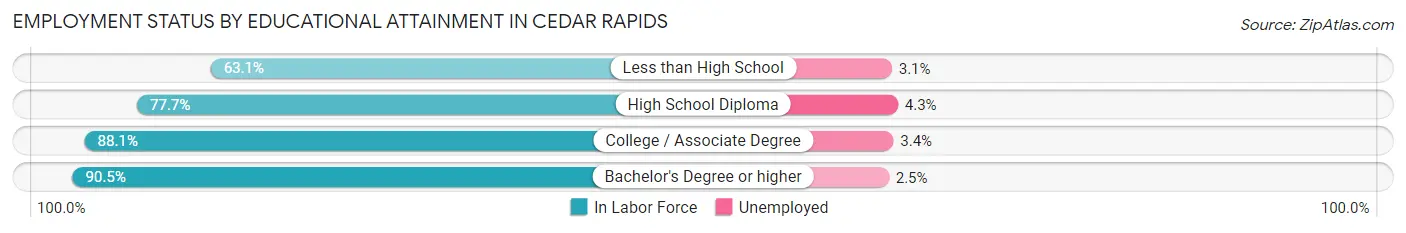
| Educational Attainment | In Labor Force | Unemployed |
| Less than High School | 2,371 (63.1%) | 116 (3.1%) |
| High School Diploma | 12,948 (77.7%) | 717 (4.3%) |
| College / Associate Degree | 22,582 (88.1%) | 871 (3.4%) |
| Bachelor's Degree or higher | 22,125 (90.5%) | 611 (2.5%) |
| Total | 60,067 (85.2%) | 2,327 (3.3%) |
Employment Occupations by Sex in Cedar Rapids
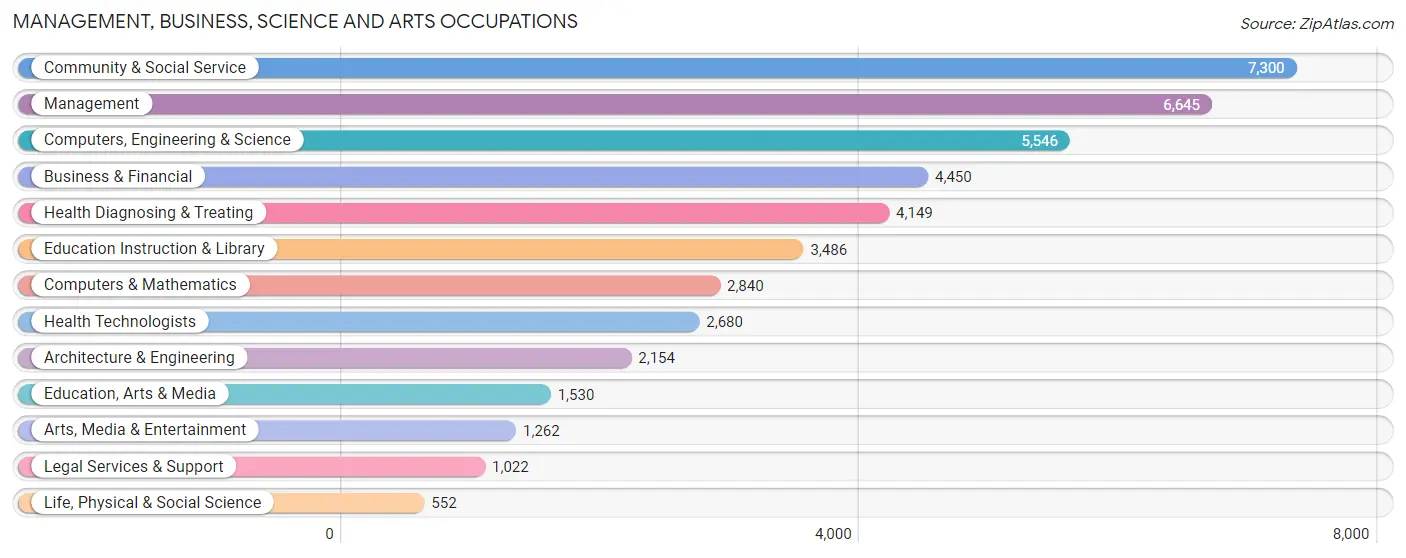
Management, Business, Science and Arts Occupations
The most common Management, Business, Science and Arts occupations in Cedar Rapids are Community & Social Service (7,300 | 10.0%), Management (6,645 | 9.1%), Computers, Engineering & Science (5,546 | 7.6%), Business & Financial (4,450 | 6.1%), and Health Diagnosing & Treating (4,149 | 5.7%).
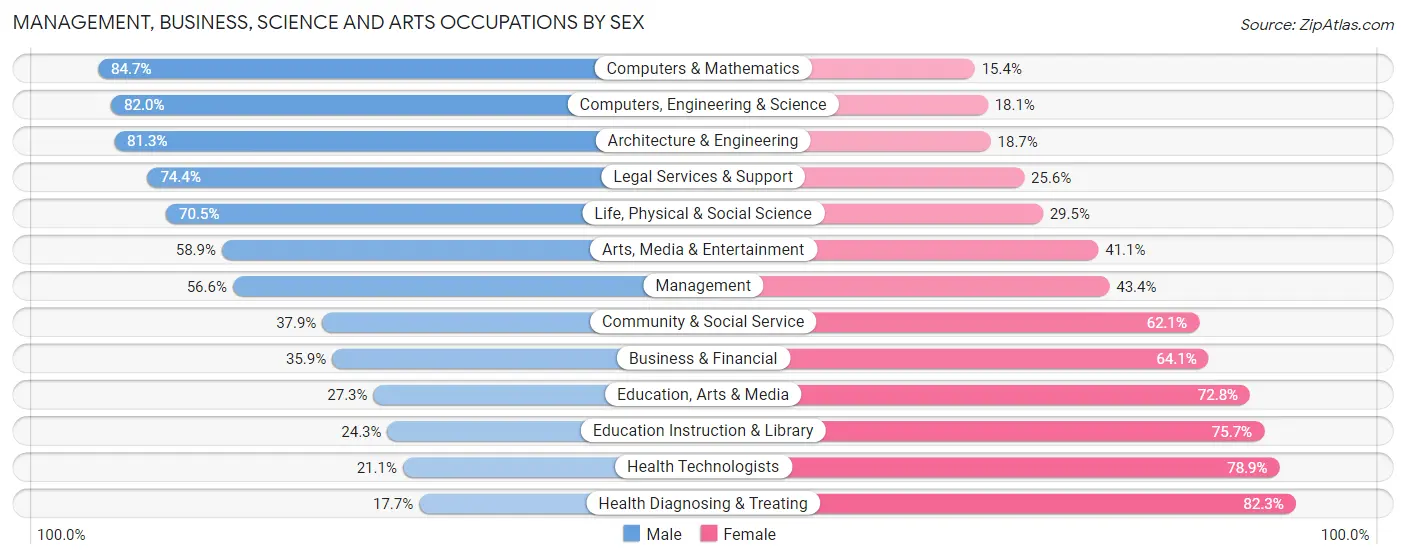
Management, Business, Science and Arts Occupations by Sex
Within the Management, Business, Science and Arts occupations in Cedar Rapids, the most male-oriented occupations are Computers & Mathematics (84.7%), Computers, Engineering & Science (82.0%), and Architecture & Engineering (81.3%), while the most female-oriented occupations are Health Diagnosing & Treating (82.3%), Health Technologists (78.9%), and Education Instruction & Library (75.7%).
| Occupation | Male | Female |
| Management | 3,760 (56.6%) | 2,885 (43.4%) |
| Business & Financial | 1,596 (35.9%) | 2,854 (64.1%) |
| Computers, Engineering & Science | 4,545 (82.0%) | 1,001 (18.0%) |
| Computers & Mathematics | 2,404 (84.7%) | 436 (15.3%) |
| Architecture & Engineering | 1,752 (81.3%) | 402 (18.7%) |
| Life, Physical & Social Science | 389 (70.5%) | 163 (29.5%) |
| Community & Social Service | 2,768 (37.9%) | 4,532 (62.1%) |
| Education, Arts & Media | 417 (27.3%) | 1,113 (72.8%) |
| Legal Services & Support | 760 (74.4%) | 262 (25.6%) |
| Education Instruction & Library | 848 (24.3%) | 2,638 (75.7%) |
| Arts, Media & Entertainment | 743 (58.9%) | 519 (41.1%) |
| Health Diagnosing & Treating | 735 (17.7%) | 3,414 (82.3%) |
| Health Technologists | 566 (21.1%) | 2,114 (78.9%) |
| Total (Category) | 13,404 (47.7%) | 14,686 (52.3%) |
| Total (Overall) | 37,966 (51.8%) | 35,271 (48.2%) |
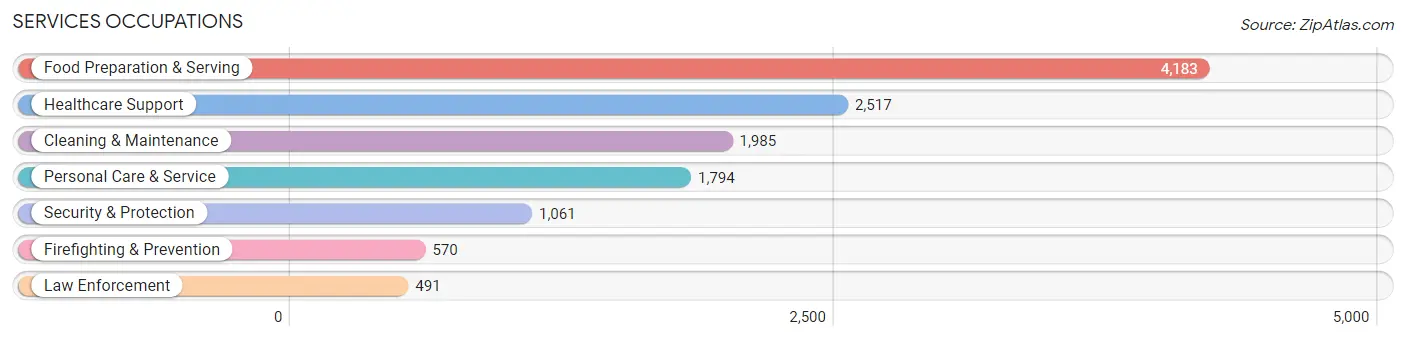
Services Occupations
The most common Services occupations in Cedar Rapids are Food Preparation & Serving (4,183 | 5.7%), Healthcare Support (2,517 | 3.4%), Cleaning & Maintenance (1,985 | 2.7%), Personal Care & Service (1,794 | 2.5%), and Security & Protection (1,061 | 1.5%).
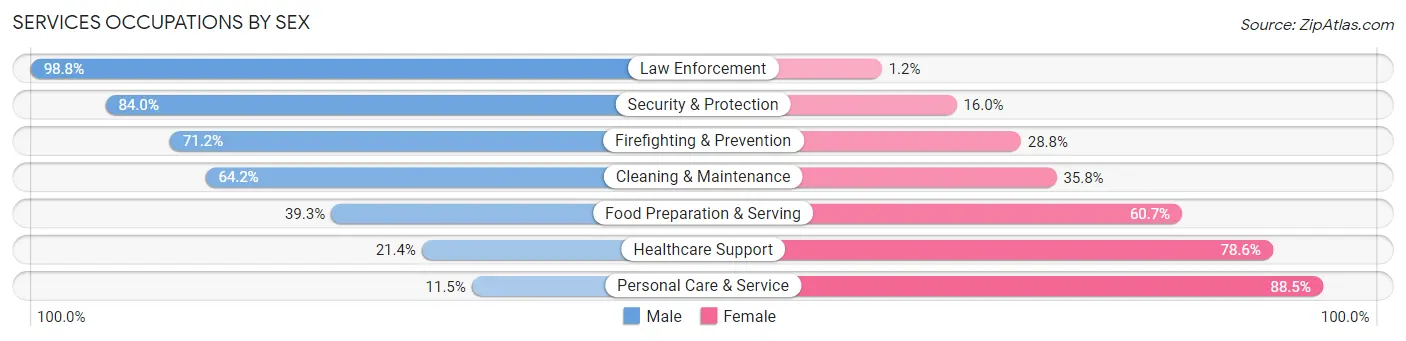
Services Occupations by Sex
Within the Services occupations in Cedar Rapids, the most male-oriented occupations are Law Enforcement (98.8%), Security & Protection (84.0%), and Firefighting & Prevention (71.2%), while the most female-oriented occupations are Personal Care & Service (88.5%), Healthcare Support (78.6%), and Food Preparation & Serving (60.7%).
| Occupation | Male | Female |
| Healthcare Support | 538 (21.4%) | 1,979 (78.6%) |
| Security & Protection | 891 (84.0%) | 170 (16.0%) |
| Firefighting & Prevention | 406 (71.2%) | 164 (28.8%) |
| Law Enforcement | 485 (98.8%) | 6 (1.2%) |
| Food Preparation & Serving | 1,645 (39.3%) | 2,538 (60.7%) |
| Cleaning & Maintenance | 1,274 (64.2%) | 711 (35.8%) |
| Personal Care & Service | 206 (11.5%) | 1,588 (88.5%) |
| Total (Category) | 4,554 (39.5%) | 6,986 (60.5%) |
| Total (Overall) | 37,966 (51.8%) | 35,271 (48.2%) |
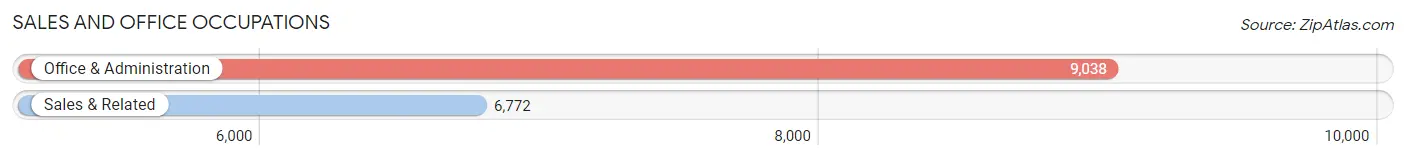
Sales and Office Occupations
The most common Sales and Office occupations in Cedar Rapids are Office & Administration (9,038 | 12.3%), and Sales & Related (6,772 | 9.2%).
Sales and Office Occupations by Sex
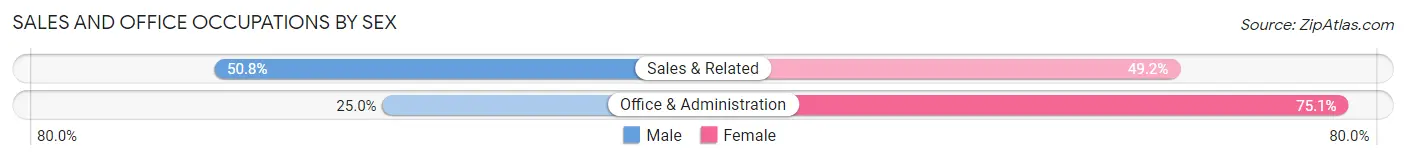
| Occupation | Male | Female |
| Sales & Related | 3,443 (50.8%) | 3,329 (49.2%) |
| Office & Administration | 2,255 (24.9%) | 6,783 (75.0%) |
| Total (Category) | 5,698 (36.0%) | 10,112 (64.0%) |
| Total (Overall) | 37,966 (51.8%) | 35,271 (48.2%) |
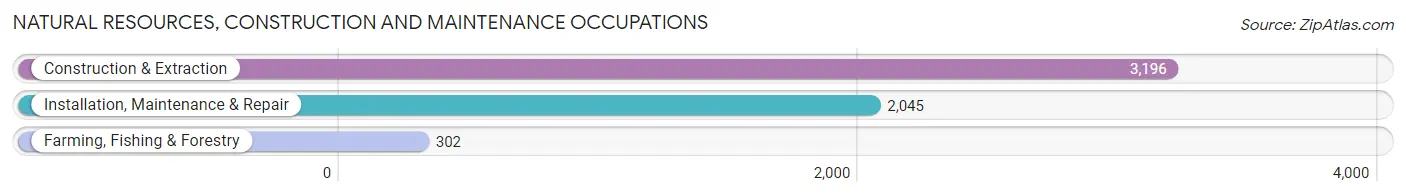
Natural Resources, Construction and Maintenance Occupations
The most common Natural Resources, Construction and Maintenance occupations in Cedar Rapids are Construction & Extraction (3,196 | 4.4%), Installation, Maintenance & Repair (2,045 | 2.8%), and Farming, Fishing & Forestry (302 | 0.4%).
Natural Resources, Construction and Maintenance Occupations by Sex
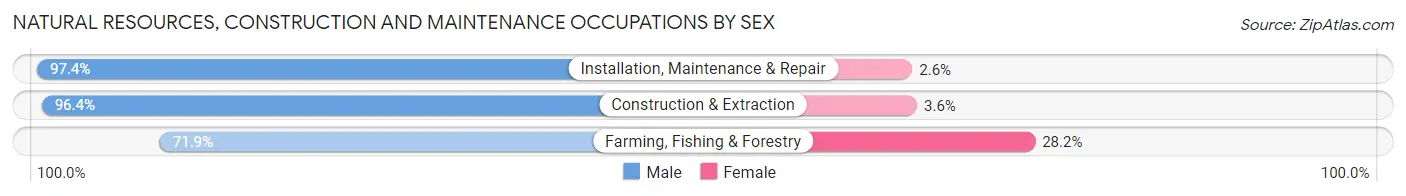
| Occupation | Male | Female |
| Farming, Fishing & Forestry | 217 (71.9%) | 85 (28.1%) |
| Construction & Extraction | 3,082 (96.4%) | 114 (3.6%) |
| Installation, Maintenance & Repair | 1,992 (97.4%) | 53 (2.6%) |
| Total (Category) | 5,291 (95.5%) | 252 (4.5%) |
| Total (Overall) | 37,966 (51.8%) | 35,271 (48.2%) |
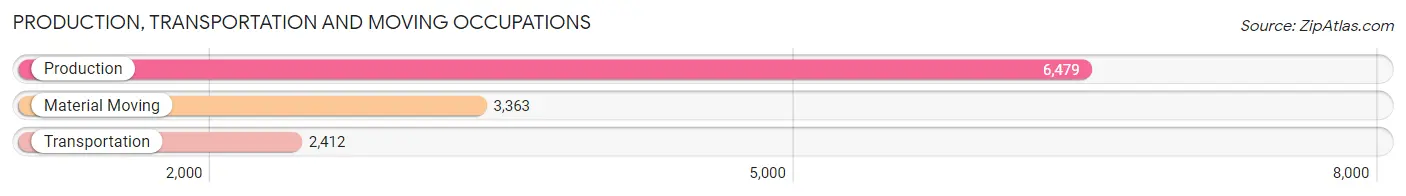
Production, Transportation and Moving Occupations
The most common Production, Transportation and Moving occupations in Cedar Rapids are Production (6,479 | 8.8%), Material Moving (3,363 | 4.6%), and Transportation (2,412 | 3.3%).
Production, Transportation and Moving Occupations by Sex
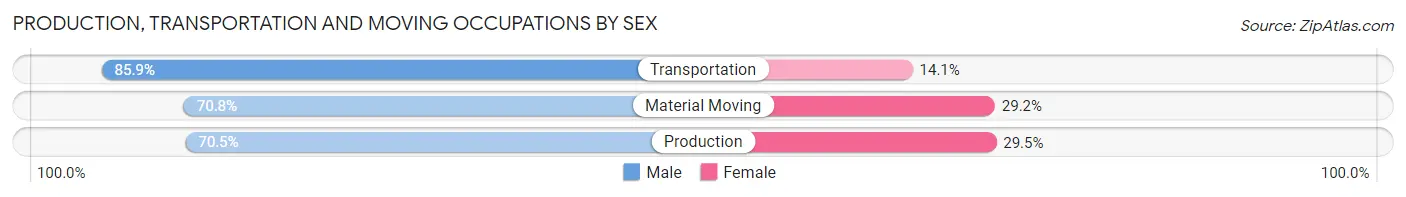
| Occupation | Male | Female |
| Production | 4,568 (70.5%) | 1,911 (29.5%) |
| Transportation | 2,071 (85.9%) | 341 (14.1%) |
| Material Moving | 2,380 (70.8%) | 983 (29.2%) |
| Total (Category) | 9,019 (73.6%) | 3,235 (26.4%) |
| Total (Overall) | 37,966 (51.8%) | 35,271 (48.2%) |
Employment Industries by Sex in Cedar Rapids
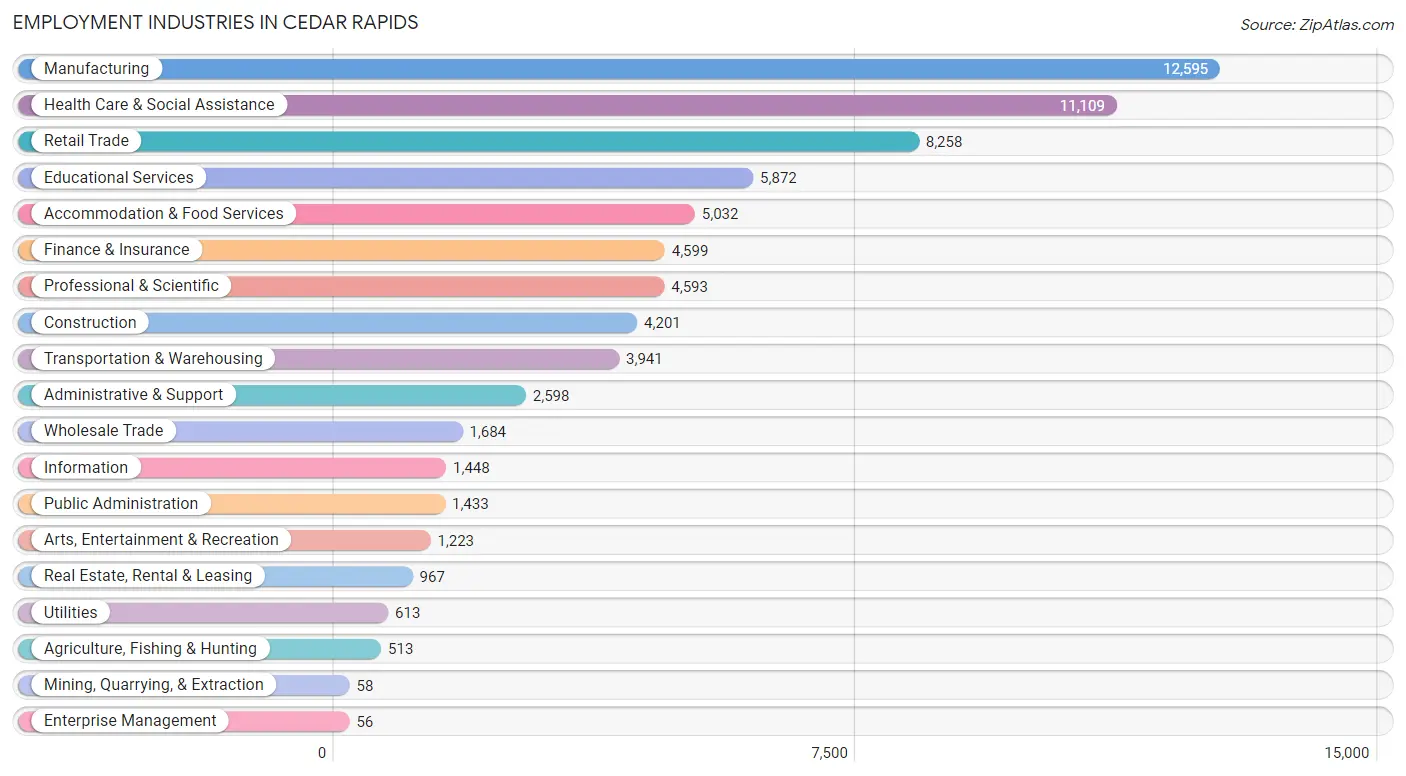
Employment Industries in Cedar Rapids
The major employment industries in Cedar Rapids include Manufacturing (12,595 | 17.2%), Health Care & Social Assistance (11,109 | 15.2%), Retail Trade (8,258 | 11.3%), Educational Services (5,872 | 8.0%), and Accommodation & Food Services (5,032 | 6.9%).
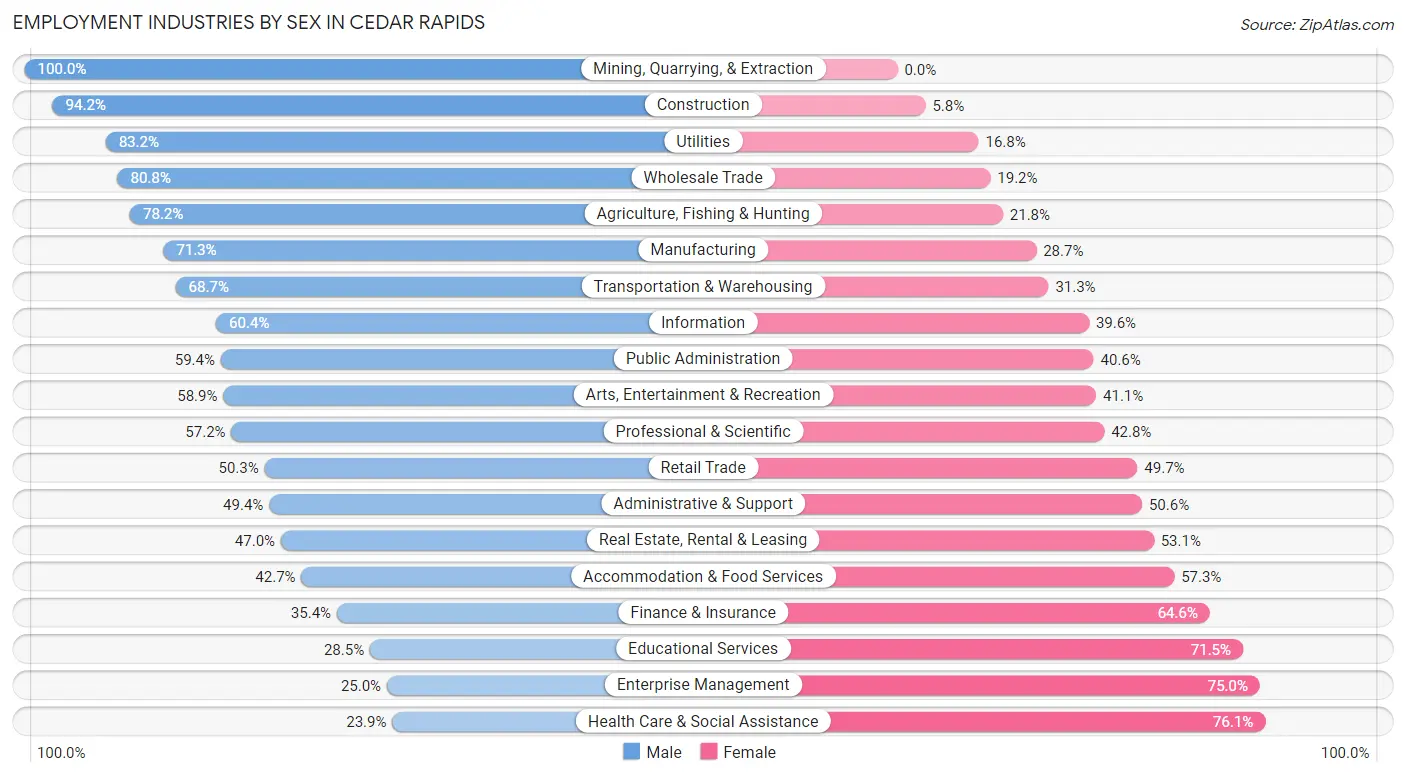
Employment Industries by Sex in Cedar Rapids
The Cedar Rapids industries that see more men than women are Mining, Quarrying, & Extraction (100.0%), Construction (94.2%), and Utilities (83.2%), whereas the industries that tend to have a higher number of women are Health Care & Social Assistance (76.1%), Enterprise Management (75.0%), and Educational Services (71.5%).
| Industry | Male | Female |
| Agriculture, Fishing & Hunting | 401 (78.2%) | 112 (21.8%) |
| Mining, Quarrying, & Extraction | 58 (100.0%) | 0 (0.0%) |
| Construction | 3,957 (94.2%) | 244 (5.8%) |
| Manufacturing | 8,977 (71.3%) | 3,618 (28.7%) |
| Wholesale Trade | 1,360 (80.8%) | 324 (19.2%) |
| Retail Trade | 4,156 (50.3%) | 4,102 (49.7%) |
| Transportation & Warehousing | 2,709 (68.7%) | 1,232 (31.3%) |
| Utilities | 510 (83.2%) | 103 (16.8%) |
| Information | 874 (60.4%) | 574 (39.6%) |
| Finance & Insurance | 1,626 (35.4%) | 2,973 (64.6%) |
| Real Estate, Rental & Leasing | 454 (46.9%) | 513 (53.0%) |
| Professional & Scientific | 2,627 (57.2%) | 1,966 (42.8%) |
| Enterprise Management | 14 (25.0%) | 42 (75.0%) |
| Administrative & Support | 1,283 (49.4%) | 1,315 (50.6%) |
| Educational Services | 1,674 (28.5%) | 4,198 (71.5%) |
| Health Care & Social Assistance | 2,654 (23.9%) | 8,455 (76.1%) |
| Arts, Entertainment & Recreation | 720 (58.9%) | 503 (41.1%) |
| Accommodation & Food Services | 2,149 (42.7%) | 2,883 (57.3%) |
| Public Administration | 851 (59.4%) | 582 (40.6%) |
| Total | 37,966 (51.8%) | 35,271 (48.2%) |
Education in Cedar Rapids
School Enrollment in Cedar Rapids
The most common levels of schooling among the 32,811 students in Cedar Rapids are college / undergraduate (7,557 | 23.0%), middle school (6,879 | 21.0%), and high school (6,825 | 20.8%).
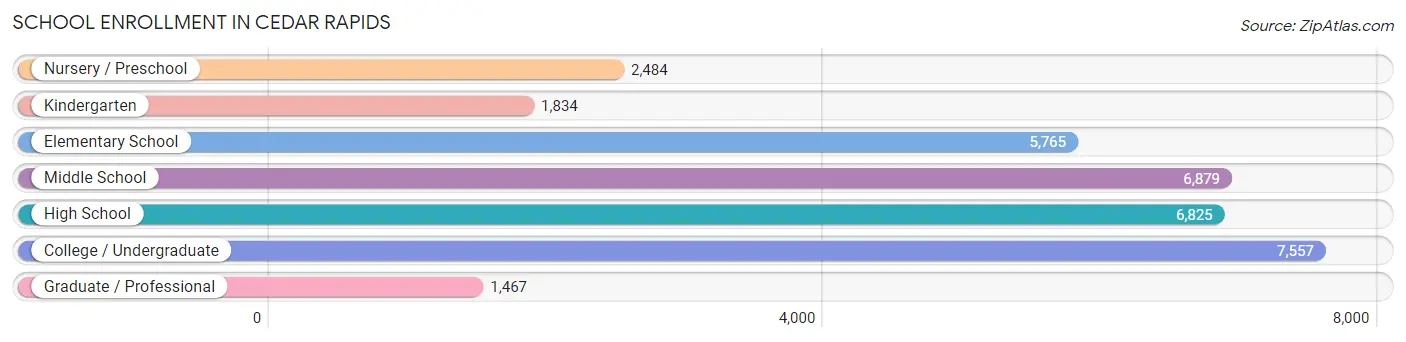
| School Level | # Students | % Students |
| Nursery / Preschool | 2,484 | 7.6% |
| Kindergarten | 1,834 | 5.6% |
| Elementary School | 5,765 | 17.6% |
| Middle School | 6,879 | 21.0% |
| High School | 6,825 | 20.8% |
| College / Undergraduate | 7,557 | 23.0% |
| Graduate / Professional | 1,467 | 4.5% |
| Total | 32,811 | 100.0% |
School Enrollment by Age by Funding Source in Cedar Rapids
Out of a total of 32,811 students who are enrolled in schools in Cedar Rapids, 6,300 (19.2%) attend a private institution, while the remaining 26,511 (80.8%) are enrolled in public schools. The age group of 18 to 19 year olds has the highest likelihood of being enrolled in private schools, with 1,263 (39.5% in the age bracket) enrolled. Conversely, the age group of 15 to 17 year olds has the lowest likelihood of being enrolled in a private school, with 4,551 (91.8% in the age bracket) attending a public institution.
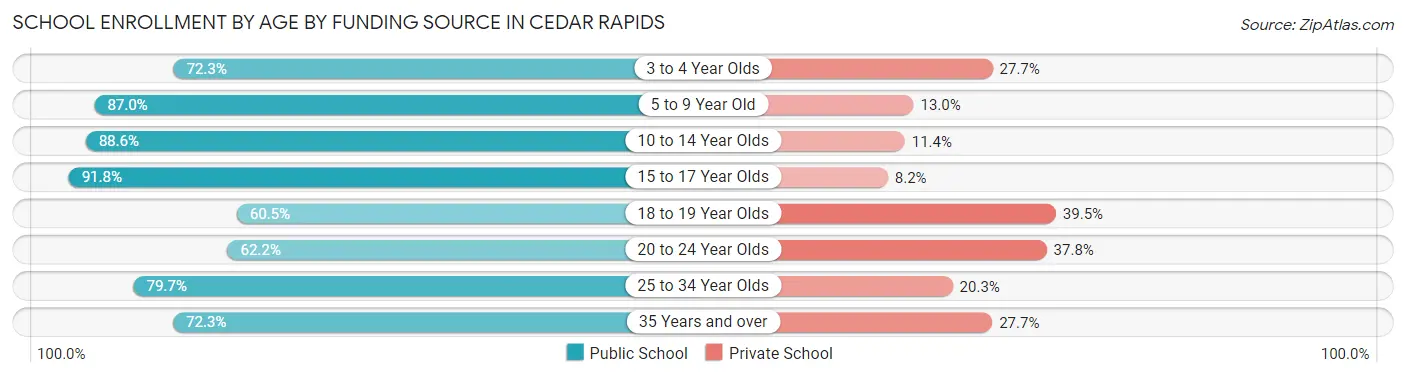
| Age Bracket | Public School | Private School |
| 3 to 4 Year Olds | 1,219 (72.3%) | 468 (27.7%) |
| 5 to 9 Year Old | 6,719 (87.0%) | 1,006 (13.0%) |
| 10 to 14 Year Olds | 7,252 (88.6%) | 932 (11.4%) |
| 15 to 17 Year Olds | 4,551 (91.8%) | 408 (8.2%) |
| 18 to 19 Year Olds | 1,932 (60.5%) | 1,263 (39.5%) |
| 20 to 24 Year Olds | 2,472 (62.2%) | 1,503 (37.8%) |
| 25 to 34 Year Olds | 1,339 (79.7%) | 341 (20.3%) |
| 35 Years and over | 1,017 (72.3%) | 389 (27.7%) |
| Total | 26,511 (80.8%) | 6,300 (19.2%) |
Educational Attainment by Field of Study in Cedar Rapids
Business (6,951 | 20.7%), education (3,951 | 11.8%), science & technology (3,385 | 10.1%), engineering (3,071 | 9.1%), and social sciences (2,262 | 6.7%) are the most common fields of study among 33,556 individuals in Cedar Rapids who have obtained a bachelor's degree or higher.
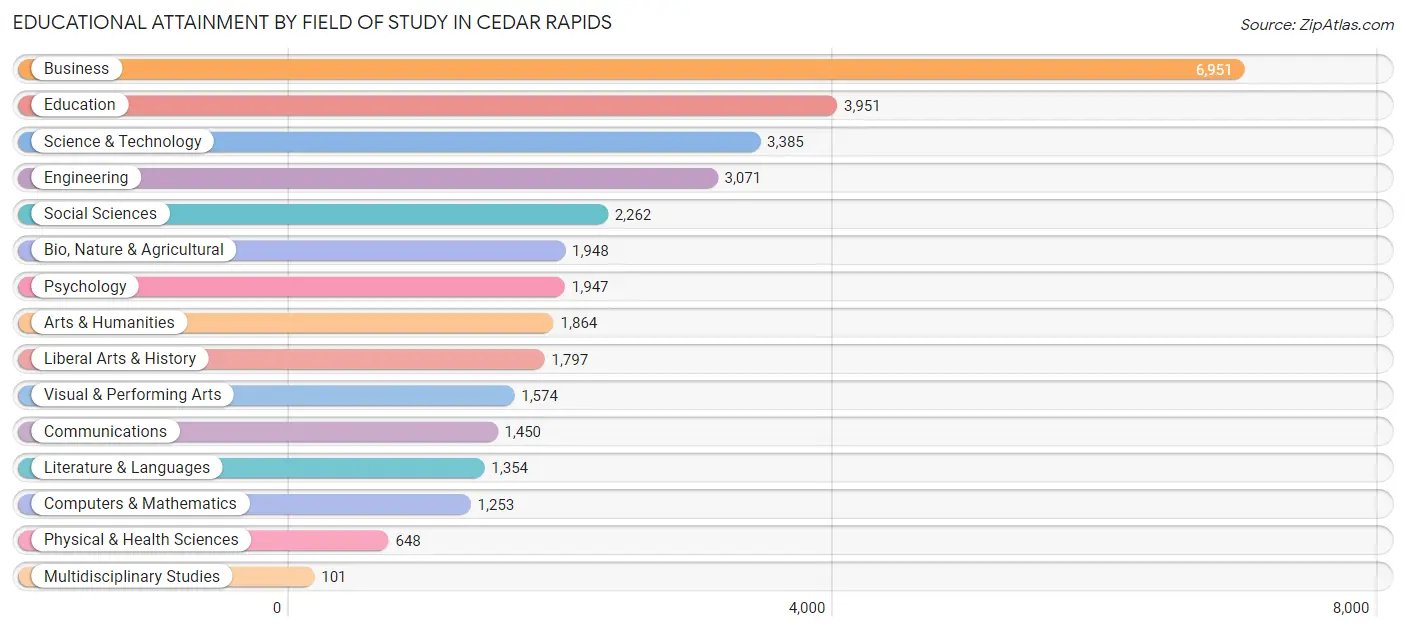
| Field of Study | # Graduates | % Graduates |
| Computers & Mathematics | 1,253 | 3.7% |
| Bio, Nature & Agricultural | 1,948 | 5.8% |
| Physical & Health Sciences | 648 | 1.9% |
| Psychology | 1,947 | 5.8% |
| Social Sciences | 2,262 | 6.7% |
| Engineering | 3,071 | 9.1% |
| Multidisciplinary Studies | 101 | 0.3% |
| Science & Technology | 3,385 | 10.1% |
| Business | 6,951 | 20.7% |
| Education | 3,951 | 11.8% |
| Literature & Languages | 1,354 | 4.0% |
| Liberal Arts & History | 1,797 | 5.4% |
| Visual & Performing Arts | 1,574 | 4.7% |
| Communications | 1,450 | 4.3% |
| Arts & Humanities | 1,864 | 5.6% |
| Total | 33,556 | 100.0% |
Transportation & Commute in Cedar Rapids
Vehicle Availability by Sex in Cedar Rapids
The most prevalent vehicle ownership categories in Cedar Rapids are males with 2 vehicles (17,263, accounting for 46.3%) and females with 2 vehicles (15,373, making up 50.9%).
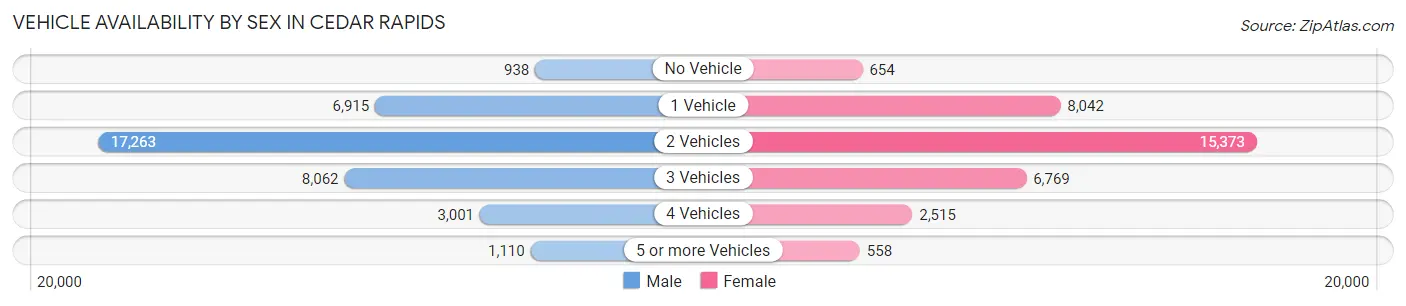
| Vehicles Available | Male | Female |
| No Vehicle | 938 (2.5%) | 654 (1.9%) |
| 1 Vehicle | 6,915 (18.5%) | 8,042 (23.7%) |
| 2 Vehicles | 17,263 (46.3%) | 15,373 (45.3%) |
| 3 Vehicles | 8,062 (21.6%) | 6,769 (20.0%) |
| 4 Vehicles | 3,001 (8.1%) | 2,515 (7.4%) |
| 5 or more Vehicles | 1,110 (3.0%) | 558 (1.7%) |
| Total | 37,289 (100.0%) | 33,911 (100.0%) |
Commute Time in Cedar Rapids
The most frequently occuring commute durations in Cedar Rapids are 10 to 14 minutes (16,512 commuters, 25.7%), 15 to 19 minutes (14,885 commuters, 23.2%), and 5 to 9 minutes (10,913 commuters, 17.0%).
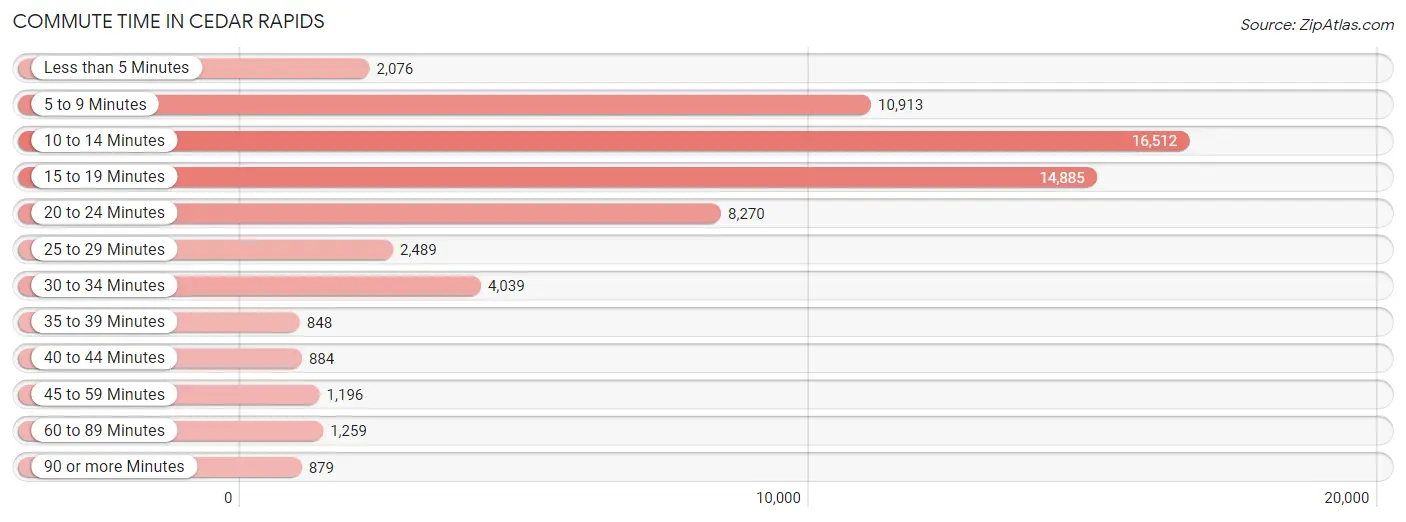
| Commute Time | # Commuters | % Commuters |
| Less than 5 Minutes | 2,076 | 3.2% |
| 5 to 9 Minutes | 10,913 | 17.0% |
| 10 to 14 Minutes | 16,512 | 25.7% |
| 15 to 19 Minutes | 14,885 | 23.2% |
| 20 to 24 Minutes | 8,270 | 12.9% |
| 25 to 29 Minutes | 2,489 | 3.9% |
| 30 to 34 Minutes | 4,039 | 6.3% |
| 35 to 39 Minutes | 848 | 1.3% |
| 40 to 44 Minutes | 884 | 1.4% |
| 45 to 59 Minutes | 1,196 | 1.9% |
| 60 to 89 Minutes | 1,259 | 2.0% |
| 90 or more Minutes | 879 | 1.4% |
Commute Time by Sex in Cedar Rapids
The most common commute times in Cedar Rapids are 10 to 14 minutes (8,706 commuters, 25.7%) for males and 10 to 14 minutes (7,806 commuters, 25.7%) for females.
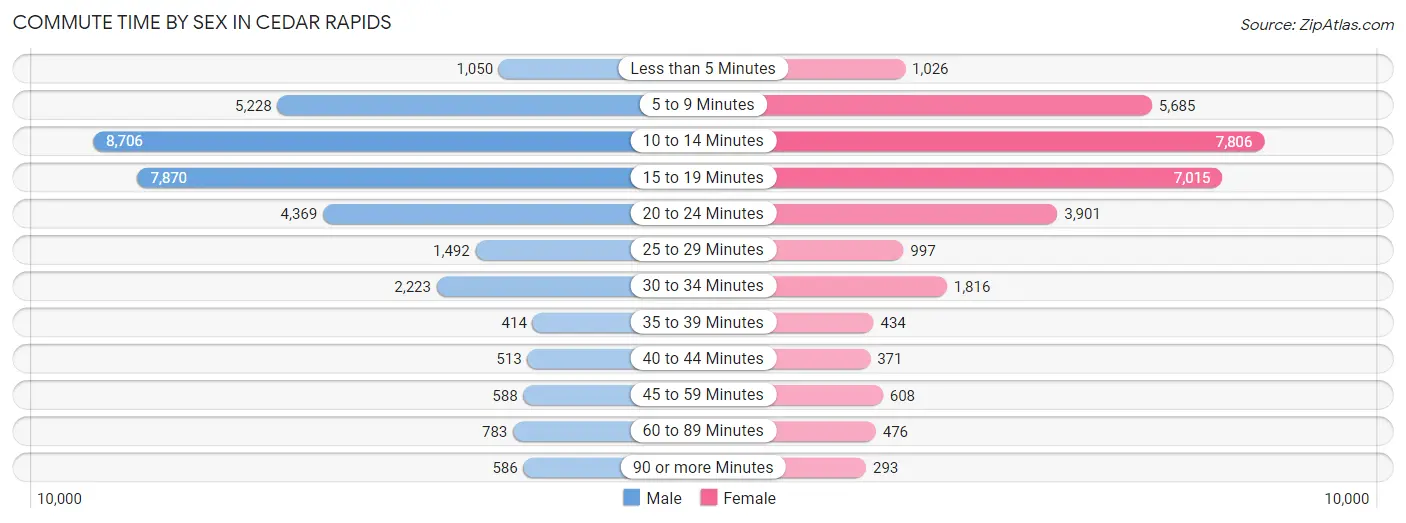
| Commute Time | Male | Female |
| Less than 5 Minutes | 1,050 (3.1%) | 1,026 (3.4%) |
| 5 to 9 Minutes | 5,228 (15.5%) | 5,685 (18.7%) |
| 10 to 14 Minutes | 8,706 (25.7%) | 7,806 (25.7%) |
| 15 to 19 Minutes | 7,870 (23.3%) | 7,015 (23.1%) |
| 20 to 24 Minutes | 4,369 (12.9%) | 3,901 (12.8%) |
| 25 to 29 Minutes | 1,492 (4.4%) | 997 (3.3%) |
| 30 to 34 Minutes | 2,223 (6.6%) | 1,816 (6.0%) |
| 35 to 39 Minutes | 414 (1.2%) | 434 (1.4%) |
| 40 to 44 Minutes | 513 (1.5%) | 371 (1.2%) |
| 45 to 59 Minutes | 588 (1.7%) | 608 (2.0%) |
| 60 to 89 Minutes | 783 (2.3%) | 476 (1.6%) |
| 90 or more Minutes | 586 (1.7%) | 293 (1.0%) |
Time of Departure to Work by Sex in Cedar Rapids
The most frequent times of departure to work in Cedar Rapids are 6:30 AM to 6:59 AM (4,534, 13.4%) for males and 7:30 AM to 7:59 AM (5,689, 18.7%) for females.
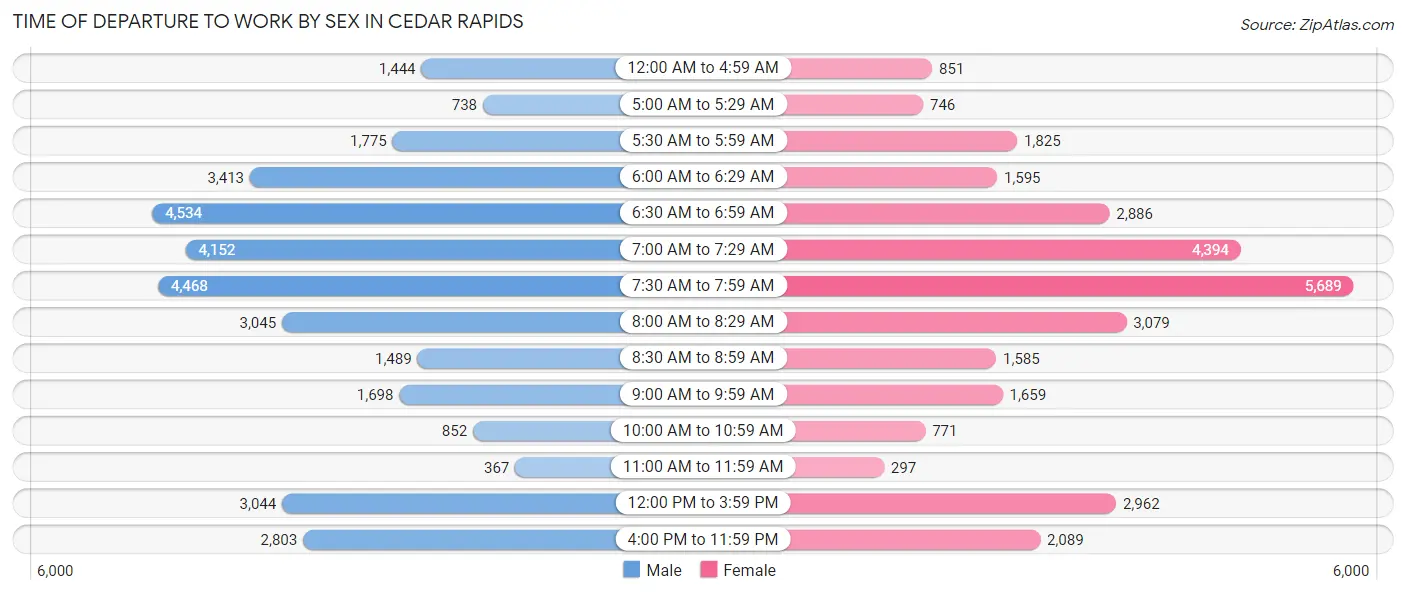
| Time of Departure | Male | Female |
| 12:00 AM to 4:59 AM | 1,444 (4.3%) | 851 (2.8%) |
| 5:00 AM to 5:29 AM | 738 (2.2%) | 746 (2.5%) |
| 5:30 AM to 5:59 AM | 1,775 (5.2%) | 1,825 (6.0%) |
| 6:00 AM to 6:29 AM | 3,413 (10.1%) | 1,595 (5.2%) |
| 6:30 AM to 6:59 AM | 4,534 (13.4%) | 2,886 (9.5%) |
| 7:00 AM to 7:29 AM | 4,152 (12.3%) | 4,394 (14.4%) |
| 7:30 AM to 7:59 AM | 4,468 (13.2%) | 5,689 (18.7%) |
| 8:00 AM to 8:29 AM | 3,045 (9.0%) | 3,079 (10.1%) |
| 8:30 AM to 8:59 AM | 1,489 (4.4%) | 1,585 (5.2%) |
| 9:00 AM to 9:59 AM | 1,698 (5.0%) | 1,659 (5.4%) |
| 10:00 AM to 10:59 AM | 852 (2.5%) | 771 (2.5%) |
| 11:00 AM to 11:59 AM | 367 (1.1%) | 297 (1.0%) |
| 12:00 PM to 3:59 PM | 3,044 (9.0%) | 2,962 (9.7%) |
| 4:00 PM to 11:59 PM | 2,803 (8.3%) | 2,089 (6.9%) |
| Total | 33,822 (100.0%) | 30,428 (100.0%) |
Housing Occupancy in Cedar Rapids
Occupancy by Ownership in Cedar Rapids
Of the total 58,283 dwellings in Cedar Rapids, owner-occupied units account for 40,552 (69.6%), while renter-occupied units make up 17,731 (30.4%).
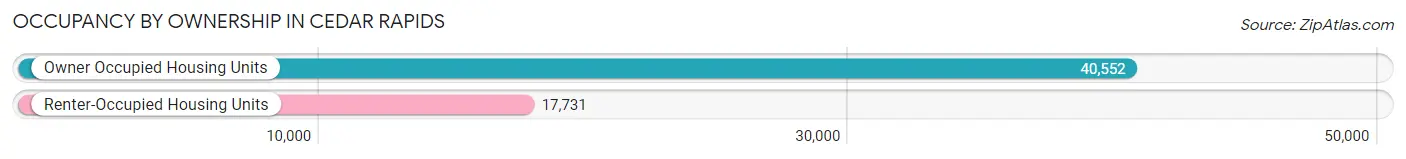
| Occupancy | # Housing Units | % Housing Units |
| Owner Occupied Housing Units | 40,552 | 69.6% |
| Renter-Occupied Housing Units | 17,731 | 30.4% |
| Total Occupied Housing Units | 58,283 | 100.0% |
Occupancy by Household Size in Cedar Rapids
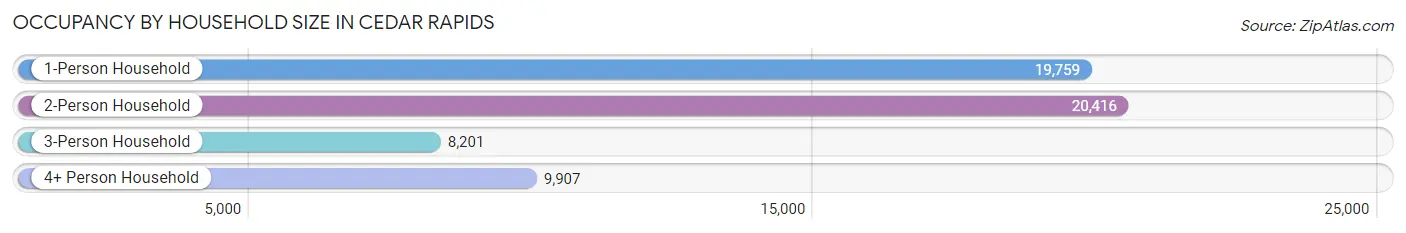
| Household Size | # Housing Units | % Housing Units |
| 1-Person Household | 19,759 | 33.9% |
| 2-Person Household | 20,416 | 35.0% |
| 3-Person Household | 8,201 | 14.1% |
| 4+ Person Household | 9,907 | 17.0% |
| Total Housing Units | 58,283 | 100.0% |
Occupancy by Ownership by Household Size in Cedar Rapids
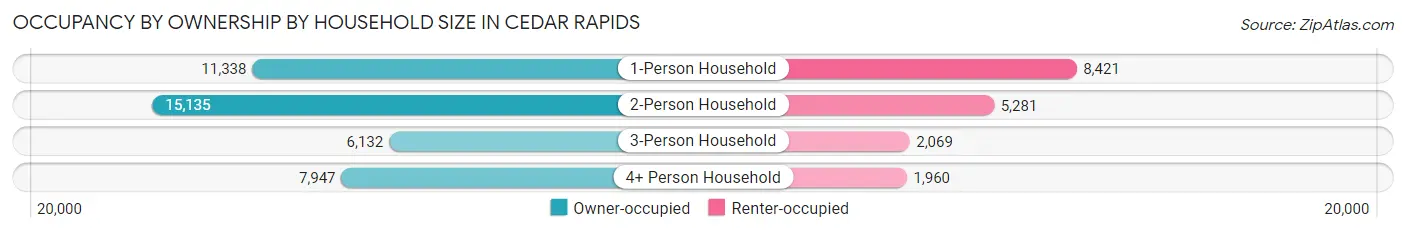
| Household Size | Owner-occupied | Renter-occupied |
| 1-Person Household | 11,338 (57.4%) | 8,421 (42.6%) |
| 2-Person Household | 15,135 (74.1%) | 5,281 (25.9%) |
| 3-Person Household | 6,132 (74.8%) | 2,069 (25.2%) |
| 4+ Person Household | 7,947 (80.2%) | 1,960 (19.8%) |
| Total Housing Units | 40,552 (69.6%) | 17,731 (30.4%) |
Occupancy by Educational Attainment in Cedar Rapids
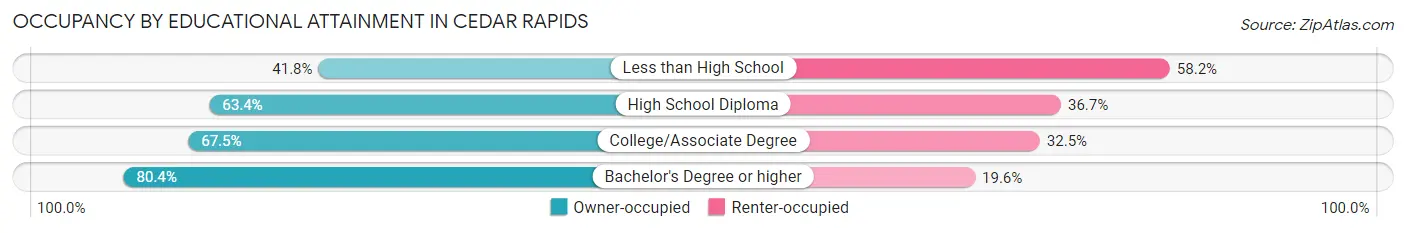
| Household Size | Owner-occupied | Renter-occupied |
| Less than High School | 1,257 (41.8%) | 1,753 (58.2%) |
| High School Diploma | 8,477 (63.3%) | 4,905 (36.6%) |
| College/Associate Degree | 15,021 (67.5%) | 7,220 (32.5%) |
| Bachelor's Degree or higher | 15,797 (80.4%) | 3,853 (19.6%) |
Occupancy by Age of Householder in Cedar Rapids
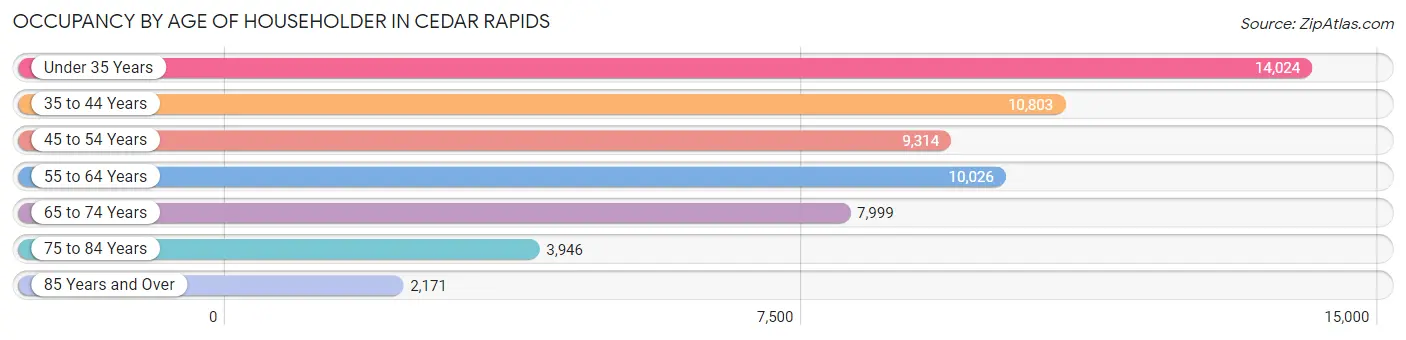
| Age Bracket | # Households | % Households |
| Under 35 Years | 14,024 | 24.1% |
| 35 to 44 Years | 10,803 | 18.5% |
| 45 to 54 Years | 9,314 | 16.0% |
| 55 to 64 Years | 10,026 | 17.2% |
| 65 to 74 Years | 7,999 | 13.7% |
| 75 to 84 Years | 3,946 | 6.8% |
| 85 Years and Over | 2,171 | 3.7% |
| Total | 58,283 | 100.0% |
Housing Finances in Cedar Rapids
Median Income by Occupancy in Cedar Rapids
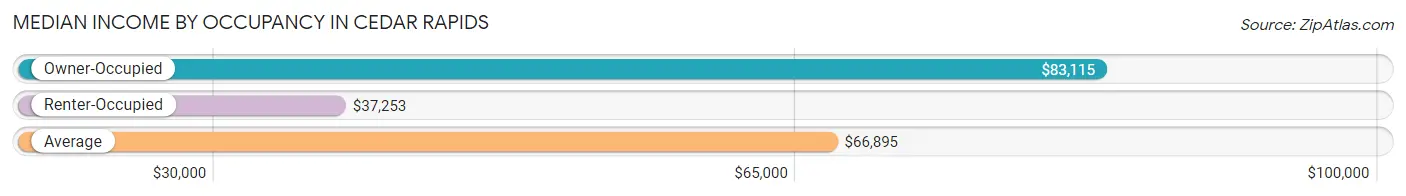
| Occupancy Type | # Households | Median Income |
| Owner-Occupied | 40,552 (69.6%) | $83,115 |
| Renter-Occupied | 17,731 (30.4%) | $37,253 |
| Average | 58,283 (100.0%) | $66,895 |
Occupancy by Householder Income Bracket in Cedar Rapids
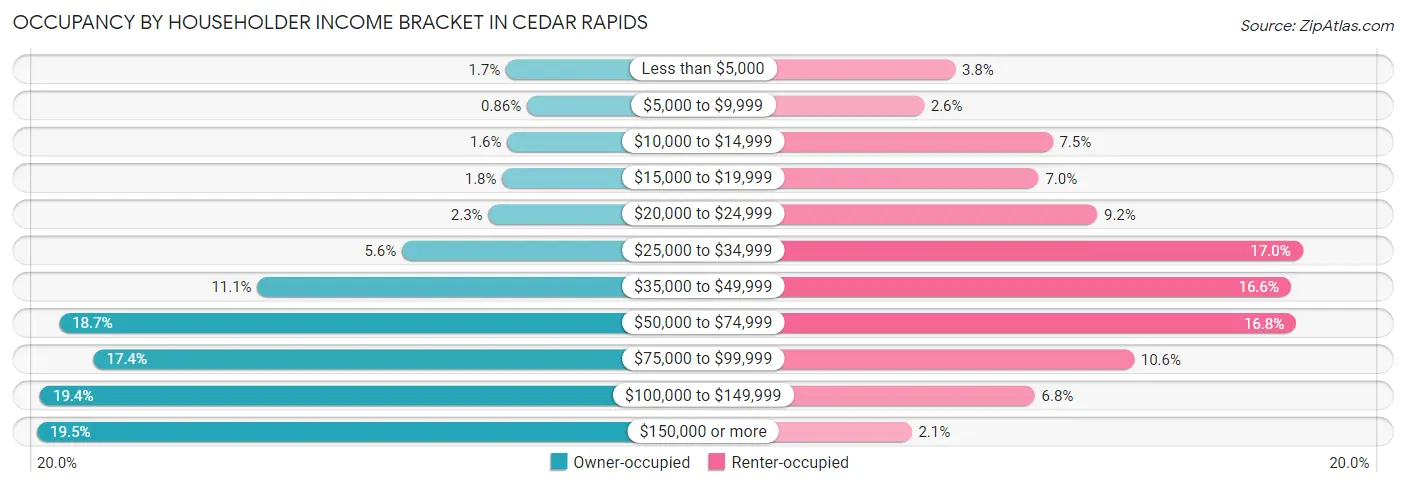
| Income Bracket | Owner-occupied | Renter-occupied |
| Less than $5,000 | 674 (1.7%) | 672 (3.8%) |
| $5,000 to $9,999 | 350 (0.9%) | 461 (2.6%) |
| $10,000 to $14,999 | 651 (1.6%) | 1,330 (7.5%) |
| $15,000 to $19,999 | 729 (1.8%) | 1,235 (7.0%) |
| $20,000 to $24,999 | 946 (2.3%) | 1,632 (9.2%) |
| $25,000 to $34,999 | 2,281 (5.6%) | 3,019 (17.0%) |
| $35,000 to $49,999 | 4,512 (11.1%) | 2,940 (16.6%) |
| $50,000 to $74,999 | 7,574 (18.7%) | 2,976 (16.8%) |
| $75,000 to $99,999 | 7,045 (17.4%) | 1,879 (10.6%) |
| $100,000 to $149,999 | 7,873 (19.4%) | 1,209 (6.8%) |
| $150,000 or more | 7,917 (19.5%) | 378 (2.1%) |
| Total | 40,552 (100.0%) | 17,731 (100.0%) |
Monthly Housing Cost Tiers in Cedar Rapids
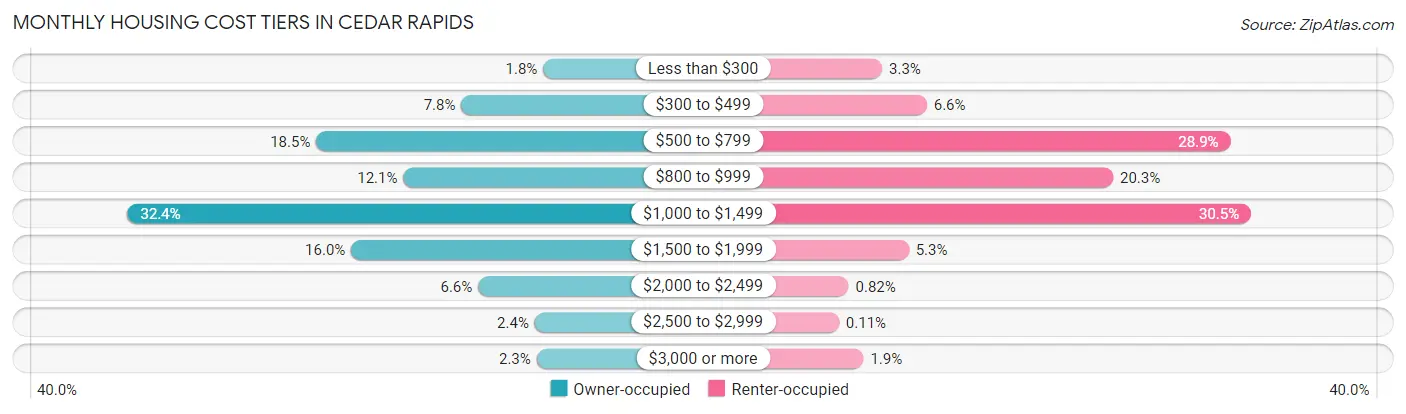
| Monthly Cost | Owner-occupied | Renter-occupied |
| Less than $300 | 735 (1.8%) | 584 (3.3%) |
| $300 to $499 | 3,180 (7.8%) | 1,167 (6.6%) |
| $500 to $799 | 7,512 (18.5%) | 5,131 (28.9%) |
| $800 to $999 | 4,912 (12.1%) | 3,599 (20.3%) |
| $1,000 to $1,499 | 13,151 (32.4%) | 5,401 (30.5%) |
| $1,500 to $1,999 | 6,470 (16.0%) | 930 (5.2%) |
| $2,000 to $2,499 | 2,678 (6.6%) | 145 (0.8%) |
| $2,500 to $2,999 | 985 (2.4%) | 19 (0.1%) |
| $3,000 or more | 929 (2.3%) | 340 (1.9%) |
| Total | 40,552 (100.0%) | 17,731 (100.0%) |
Physical Housing Characteristics in Cedar Rapids
Housing Structures in Cedar Rapids
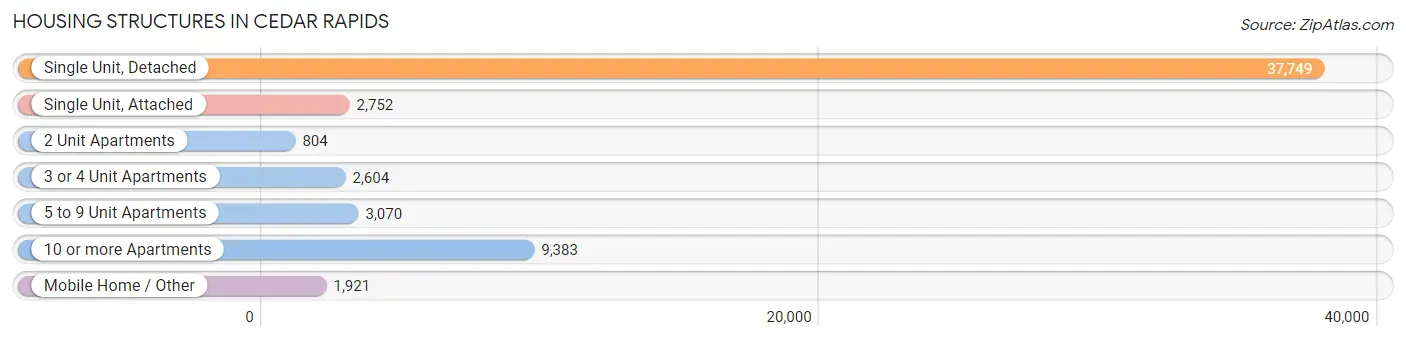
| Structure Type | # Housing Units | % Housing Units |
| Single Unit, Detached | 37,749 | 64.8% |
| Single Unit, Attached | 2,752 | 4.7% |
| 2 Unit Apartments | 804 | 1.4% |
| 3 or 4 Unit Apartments | 2,604 | 4.5% |
| 5 to 9 Unit Apartments | 3,070 | 5.3% |
| 10 or more Apartments | 9,383 | 16.1% |
| Mobile Home / Other | 1,921 | 3.3% |
| Total | 58,283 | 100.0% |
Housing Structures by Occupancy in Cedar Rapids
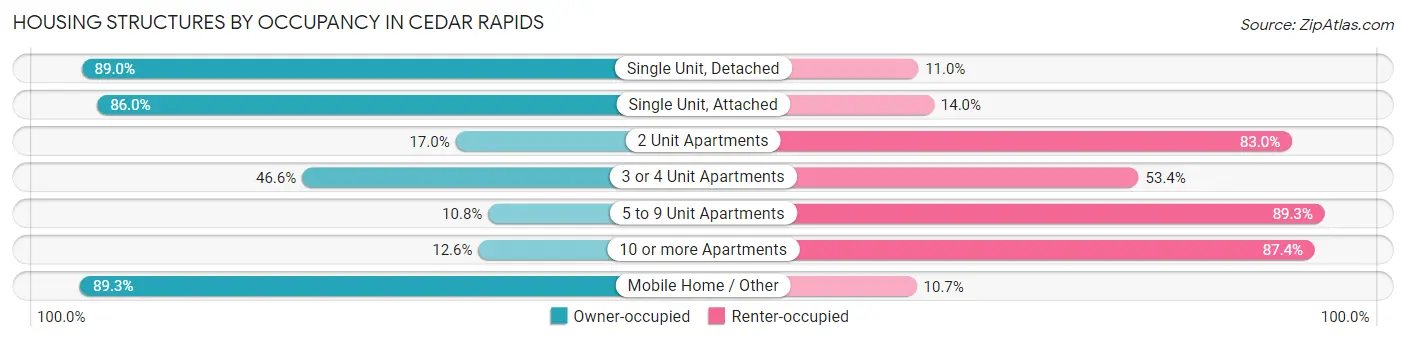
| Structure Type | Owner-occupied | Renter-occupied |
| Single Unit, Detached | 33,603 (89.0%) | 4,146 (11.0%) |
| Single Unit, Attached | 2,367 (86.0%) | 385 (14.0%) |
| 2 Unit Apartments | 137 (17.0%) | 667 (83.0%) |
| 3 or 4 Unit Apartments | 1,213 (46.6%) | 1,391 (53.4%) |
| 5 to 9 Unit Apartments | 330 (10.7%) | 2,740 (89.2%) |
| 10 or more Apartments | 1,186 (12.6%) | 8,197 (87.4%) |
| Mobile Home / Other | 1,716 (89.3%) | 205 (10.7%) |
| Total | 40,552 (69.6%) | 17,731 (30.4%) |
Housing Structures by Number of Rooms in Cedar Rapids
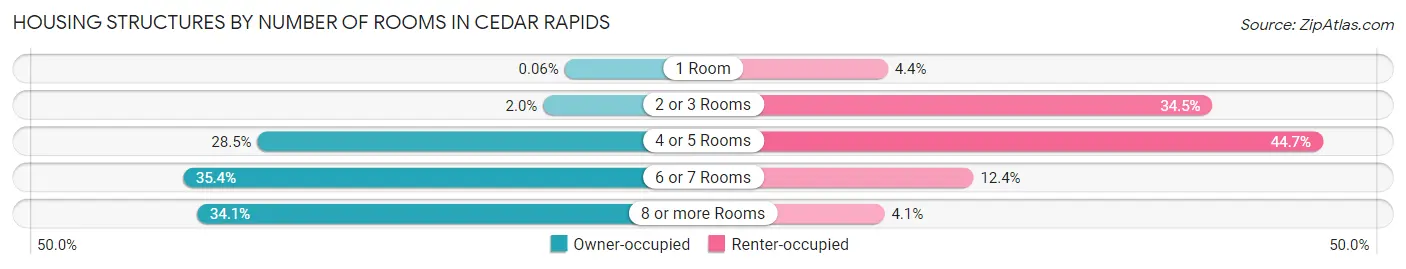
| Number of Rooms | Owner-occupied | Renter-occupied |
| 1 Room | 24 (0.1%) | 783 (4.4%) |
| 2 or 3 Rooms | 829 (2.0%) | 6,109 (34.4%) |
| 4 or 5 Rooms | 11,544 (28.5%) | 7,918 (44.7%) |
| 6 or 7 Rooms | 14,343 (35.4%) | 2,190 (12.3%) |
| 8 or more Rooms | 13,812 (34.1%) | 731 (4.1%) |
| Total | 40,552 (100.0%) | 17,731 (100.0%) |
Housing Structure by Heating Type in Cedar Rapids
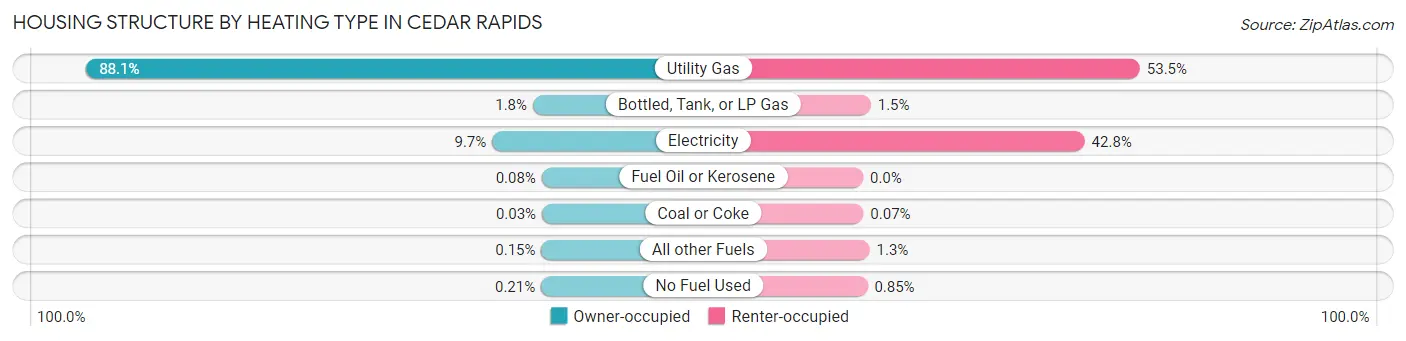
| Heating Type | Owner-occupied | Renter-occupied |
| Utility Gas | 35,721 (88.1%) | 9,484 (53.5%) |
| Bottled, Tank, or LP Gas | 723 (1.8%) | 266 (1.5%) |
| Electricity | 3,916 (9.7%) | 7,592 (42.8%) |
| Fuel Oil or Kerosene | 33 (0.1%) | 0 (0.0%) |
| Coal or Coke | 12 (0.0%) | 13 (0.1%) |
| All other Fuels | 62 (0.2%) | 226 (1.3%) |
| No Fuel Used | 85 (0.2%) | 150 (0.9%) |
| Total | 40,552 (100.0%) | 17,731 (100.0%) |
Household Vehicle Usage in Cedar Rapids
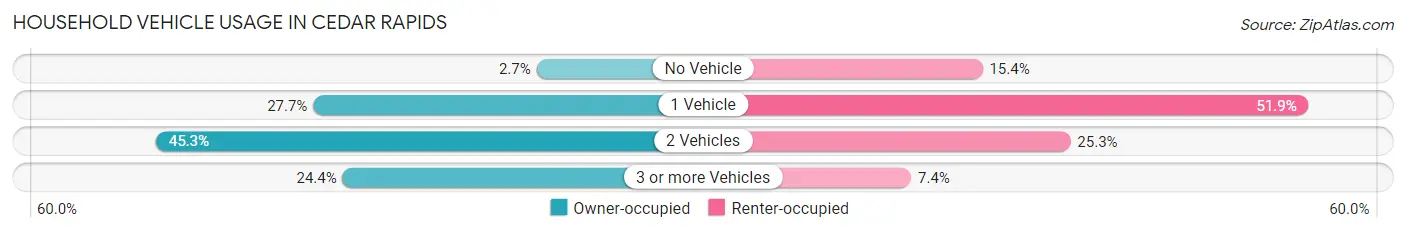
| Vehicles per Household | Owner-occupied | Renter-occupied |
| No Vehicle | 1,074 (2.6%) | 2,732 (15.4%) |
| 1 Vehicle | 11,222 (27.7%) | 9,207 (51.9%) |
| 2 Vehicles | 18,371 (45.3%) | 4,479 (25.3%) |
| 3 or more Vehicles | 9,885 (24.4%) | 1,313 (7.4%) |
| Total | 40,552 (100.0%) | 17,731 (100.0%) |
Real Estate & Mortgages in Cedar Rapids
Real Estate and Mortgage Overview in Cedar Rapids
| Characteristic | Without Mortgage | With Mortgage |
| Housing Units | 13,465 | 27,087 |
| Median Property Value | $161,300 | $170,800 |
| Median Household Income | $64,679 | $5,750 |
| Monthly Housing Costs | $620 | $929 |
| Real Estate Taxes | $2,836 | $449 |
Property Value by Mortgage Status in Cedar Rapids
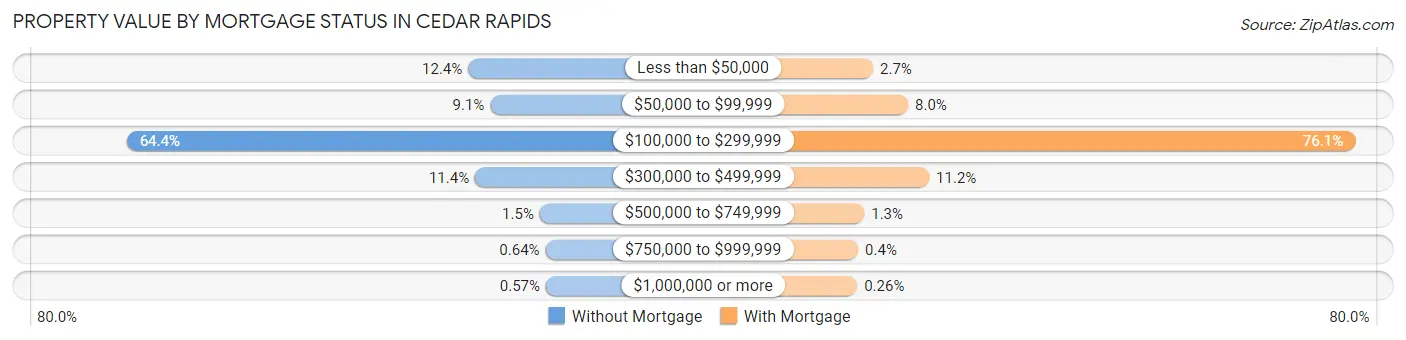
| Property Value | Without Mortgage | With Mortgage |
| Less than $50,000 | 1,673 (12.4%) | 724 (2.7%) |
| $50,000 to $99,999 | 1,219 (9.0%) | 2,169 (8.0%) |
| $100,000 to $299,999 | 8,677 (64.4%) | 20,617 (76.1%) |
| $300,000 to $499,999 | 1,531 (11.4%) | 3,039 (11.2%) |
| $500,000 to $749,999 | 202 (1.5%) | 360 (1.3%) |
| $750,000 to $999,999 | 86 (0.6%) | 108 (0.4%) |
| $1,000,000 or more | 77 (0.6%) | 70 (0.3%) |
| Total | 13,465 (100.0%) | 27,087 (100.0%) |
Household Income by Mortgage Status in Cedar Rapids
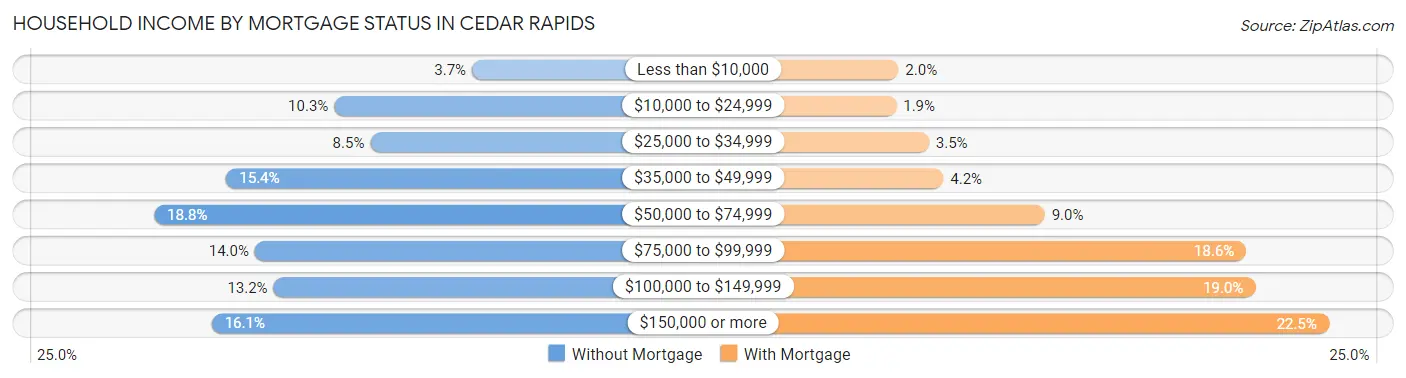
| Household Income | Without Mortgage | With Mortgage |
| Less than $10,000 | 498 (3.7%) | 553 (2.0%) |
| $10,000 to $24,999 | 1,381 (10.3%) | 526 (1.9%) |
| $25,000 to $34,999 | 1,150 (8.5%) | 945 (3.5%) |
| $35,000 to $49,999 | 2,072 (15.4%) | 1,131 (4.2%) |
| $50,000 to $74,999 | 2,536 (18.8%) | 2,440 (9.0%) |
| $75,000 to $99,999 | 1,891 (14.0%) | 5,038 (18.6%) |
| $100,000 to $149,999 | 1,770 (13.2%) | 5,154 (19.0%) |
| $150,000 or more | 2,167 (16.1%) | 6,103 (22.5%) |
| Total | 13,465 (100.0%) | 27,087 (100.0%) |
Property Value to Household Income Ratio in Cedar Rapids

| Value-to-Income Ratio | Without Mortgage | With Mortgage |
| Less than 2.0x | 5,798 (43.1%) | 91,733 (338.7%) |
| 2.0x to 2.9x | 2,652 (19.7%) | 14,067 (51.9%) |
| 3.0x to 3.9x | 1,278 (9.5%) | 6,573 (24.3%) |
| 4.0x or more | 3,539 (26.3%) | 3,007 (11.1%) |
| Total | 13,465 (100.0%) | 27,087 (100.0%) |
Real Estate Taxes by Mortgage Status in Cedar Rapids
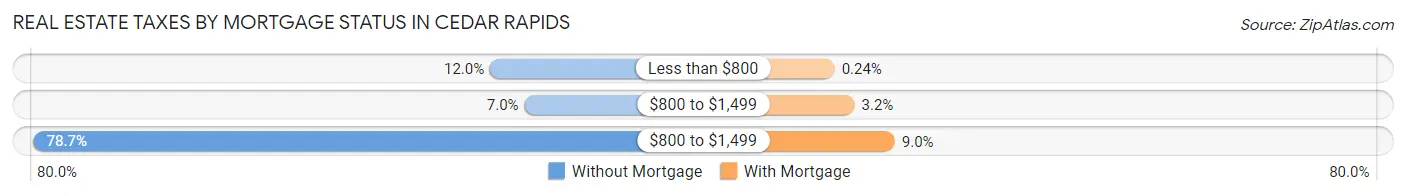
| Property Taxes | Without Mortgage | With Mortgage |
| Less than $800 | 1,615 (12.0%) | 64 (0.2%) |
| $800 to $1,499 | 939 (7.0%) | 854 (3.2%) |
| $800 to $1,499 | 10,594 (78.7%) | 2,445 (9.0%) |
| Total | 13,465 (100.0%) | 27,087 (100.0%) |
Health & Disability in Cedar Rapids
Health Insurance Coverage by Age in Cedar Rapids
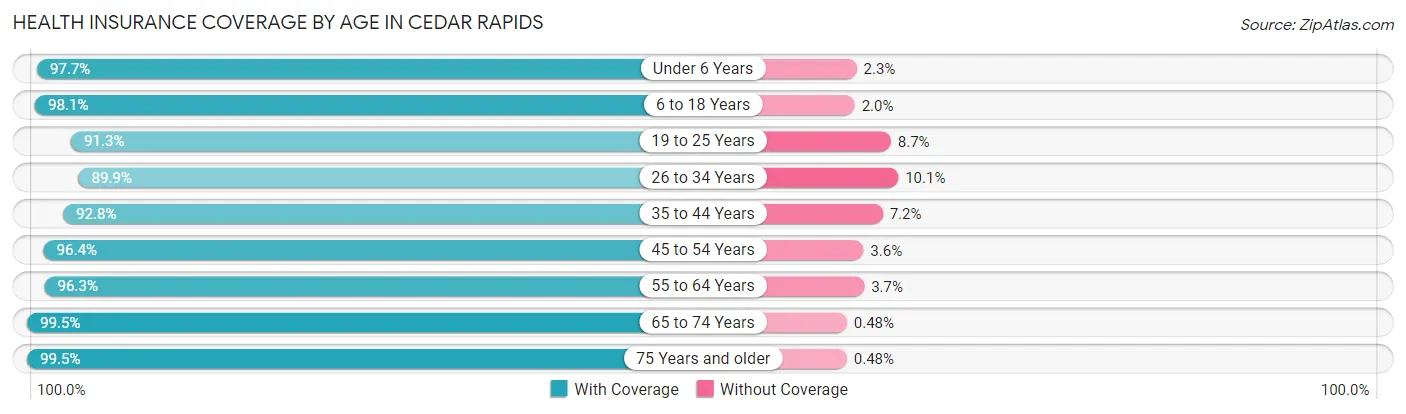
| Age Bracket | With Coverage | Without Coverage |
| Under 6 Years | 9,618 (97.7%) | 226 (2.3%) |
| 6 to 18 Years | 20,933 (98.1%) | 416 (1.9%) |
| 19 to 25 Years | 13,422 (91.3%) | 1,276 (8.7%) |
| 26 to 34 Years | 16,171 (89.9%) | 1,808 (10.1%) |
| 35 to 44 Years | 17,004 (92.8%) | 1,314 (7.2%) |
| 45 to 54 Years | 15,140 (96.4%) | 559 (3.6%) |
| 55 to 64 Years | 15,534 (96.3%) | 601 (3.7%) |
| 65 to 74 Years | 12,523 (99.5%) | 60 (0.5%) |
| 75 Years and older | 8,836 (99.5%) | 43 (0.5%) |
| Total | 129,181 (95.4%) | 6,303 (4.6%) |
Health Insurance Coverage by Citizenship Status in Cedar Rapids
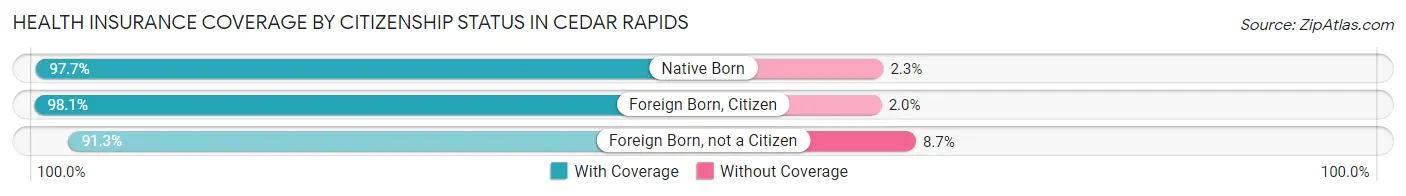
| Citizenship Status | With Coverage | Without Coverage |
| Native Born | 9,618 (97.7%) | 226 (2.3%) |
| Foreign Born, Citizen | 20,933 (98.1%) | 416 (1.9%) |
| Foreign Born, not a Citizen | 13,422 (91.3%) | 1,276 (8.7%) |
Health Insurance Coverage by Household Income in Cedar Rapids
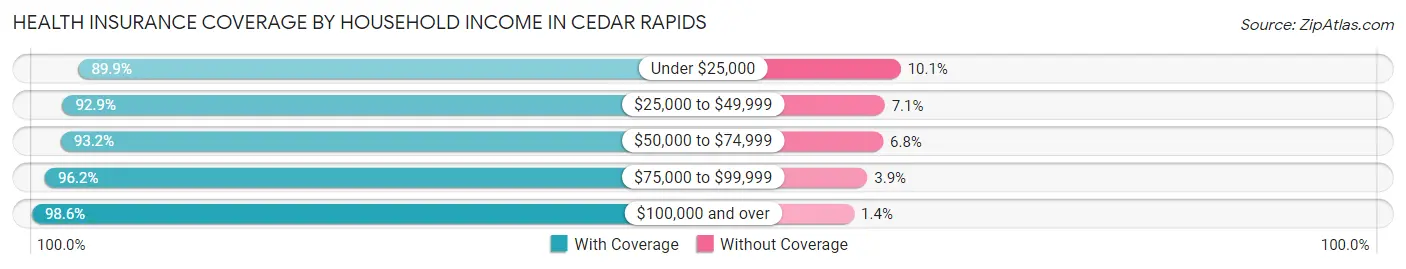
| Household Income | With Coverage | Without Coverage |
| Under $25,000 | 12,674 (89.9%) | 1,424 (10.1%) |
| $25,000 to $49,999 | 21,834 (92.9%) | 1,668 (7.1%) |
| $50,000 to $74,999 | 21,511 (93.2%) | 1,570 (6.8%) |
| $75,000 to $99,999 | 21,762 (96.2%) | 871 (3.8%) |
| $100,000 and over | 49,534 (98.6%) | 691 (1.4%) |
Public vs Private Health Insurance Coverage by Age in Cedar Rapids
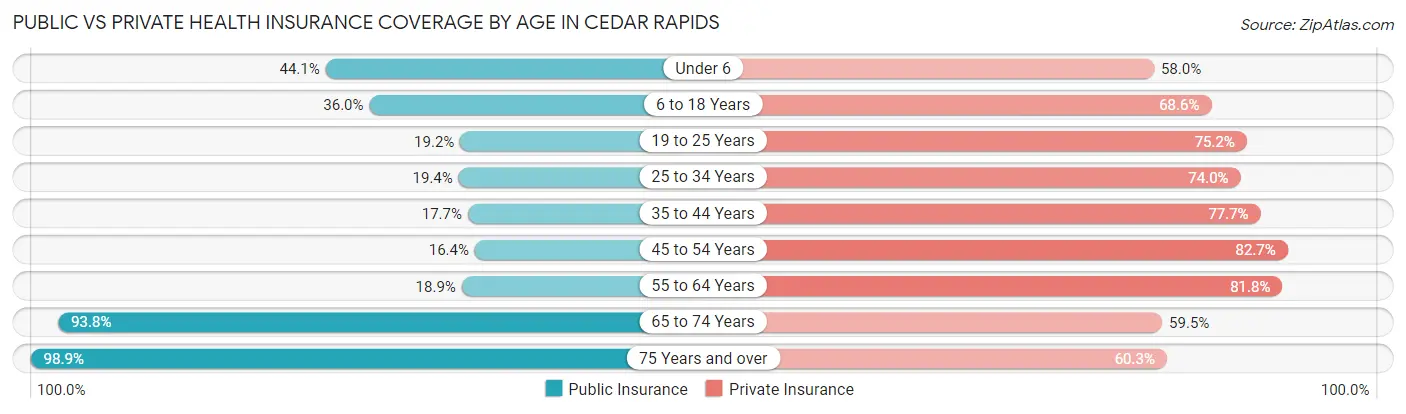
| Age Bracket | Public Insurance | Private Insurance |
| Under 6 | 4,345 (44.1%) | 5,705 (58.0%) |
| 6 to 18 Years | 7,687 (36.0%) | 14,638 (68.6%) |
| 19 to 25 Years | 2,815 (19.2%) | 11,046 (75.1%) |
| 25 to 34 Years | 3,495 (19.4%) | 13,301 (74.0%) |
| 35 to 44 Years | 3,248 (17.7%) | 14,234 (77.7%) |
| 45 to 54 Years | 2,580 (16.4%) | 12,989 (82.7%) |
| 55 to 64 Years | 3,046 (18.9%) | 13,190 (81.8%) |
| 65 to 74 Years | 11,803 (93.8%) | 7,482 (59.5%) |
| 75 Years and over | 8,779 (98.9%) | 5,355 (60.3%) |
| Total | 47,798 (35.3%) | 97,940 (72.3%) |
Disability Status by Sex by Age in Cedar Rapids
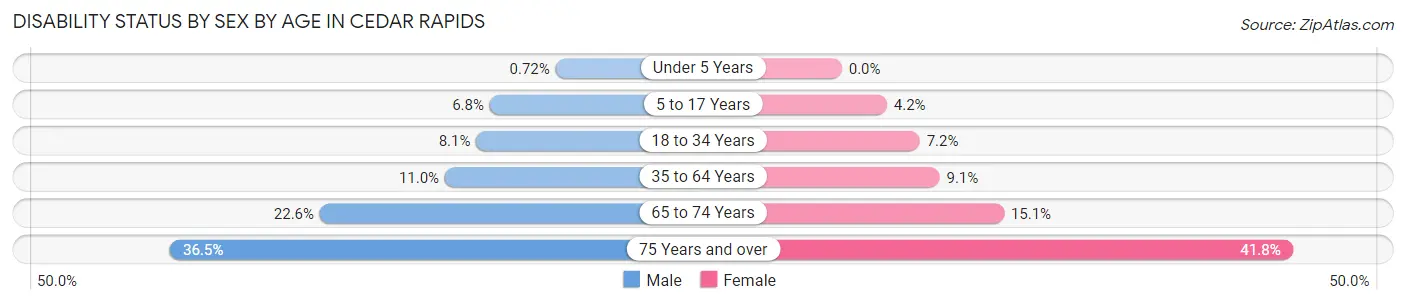
| Age Bracket | Male | Female |
| Under 5 Years | 30 (0.7%) | 0 (0.0%) |
| 5 to 17 Years | 754 (6.8%) | 421 (4.2%) |
| 18 to 34 Years | 1,396 (8.1%) | 1,252 (7.2%) |
| 35 to 64 Years | 2,808 (11.0%) | 2,231 (9.1%) |
| 65 to 74 Years | 1,318 (22.6%) | 1,016 (15.0%) |
| 75 Years and over | 1,245 (36.5%) | 2,287 (41.8%) |
Disability Class by Sex by Age in Cedar Rapids
Disability Class: Hearing Difficulty
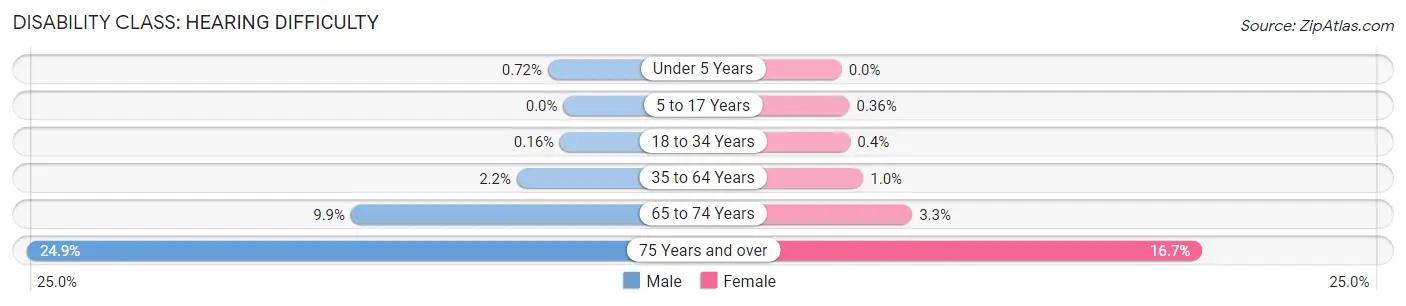
| Age Bracket | Male | Female |
| Under 5 Years | 30 (0.7%) | 0 (0.0%) |
| 5 to 17 Years | 0 (0.0%) | 36 (0.4%) |
| 18 to 34 Years | 27 (0.2%) | 70 (0.4%) |
| 35 to 64 Years | 552 (2.2%) | 247 (1.0%) |
| 65 to 74 Years | 575 (9.9%) | 221 (3.3%) |
| 75 Years and over | 849 (24.9%) | 914 (16.7%) |
Disability Class: Vision Difficulty
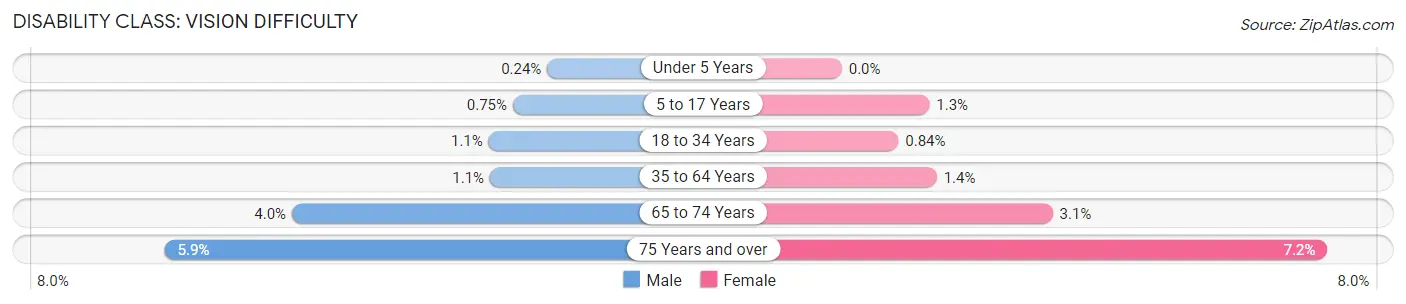
| Age Bracket | Male | Female |
| Under 5 Years | 10 (0.2%) | 0 (0.0%) |
| 5 to 17 Years | 83 (0.7%) | 131 (1.3%) |
| 18 to 34 Years | 192 (1.1%) | 146 (0.8%) |
| 35 to 64 Years | 278 (1.1%) | 347 (1.4%) |
| 65 to 74 Years | 235 (4.0%) | 211 (3.1%) |
| 75 Years and over | 202 (5.9%) | 394 (7.2%) |
Disability Class: Cognitive Difficulty
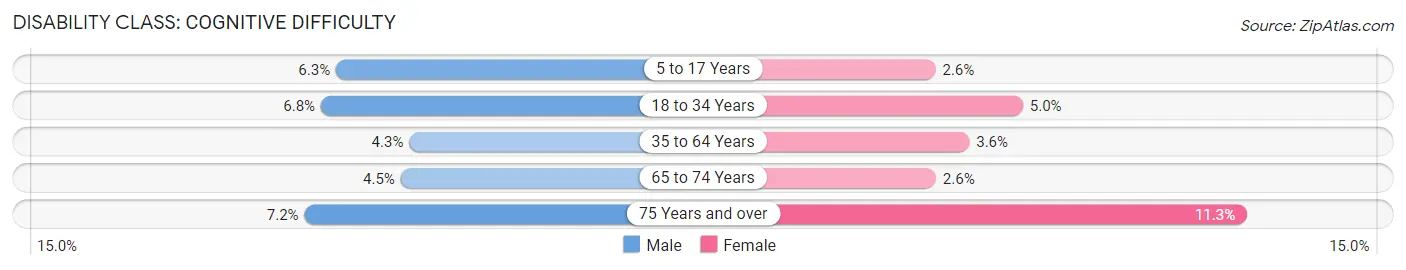
| Age Bracket | Male | Female |
| 5 to 17 Years | 699 (6.3%) | 263 (2.6%) |
| 18 to 34 Years | 1,167 (6.8%) | 873 (5.0%) |
| 35 to 64 Years | 1,097 (4.3%) | 873 (3.5%) |
| 65 to 74 Years | 264 (4.5%) | 177 (2.6%) |
| 75 Years and over | 246 (7.2%) | 617 (11.3%) |
Disability Class: Ambulatory Difficulty
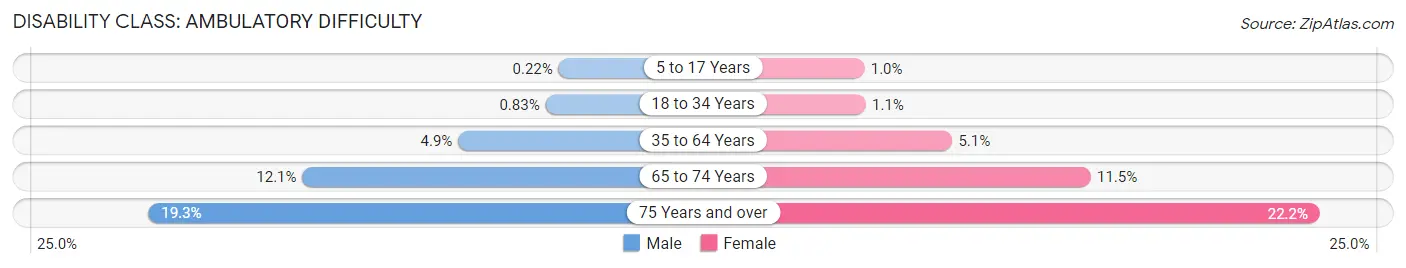
| Age Bracket | Male | Female |
| 5 to 17 Years | 24 (0.2%) | 103 (1.0%) |
| 18 to 34 Years | 143 (0.8%) | 187 (1.1%) |
| 35 to 64 Years | 1,247 (4.9%) | 1,253 (5.1%) |
| 65 to 74 Years | 706 (12.1%) | 778 (11.5%) |
| 75 Years and over | 657 (19.3%) | 1,213 (22.2%) |
Disability Class: Self-Care Difficulty
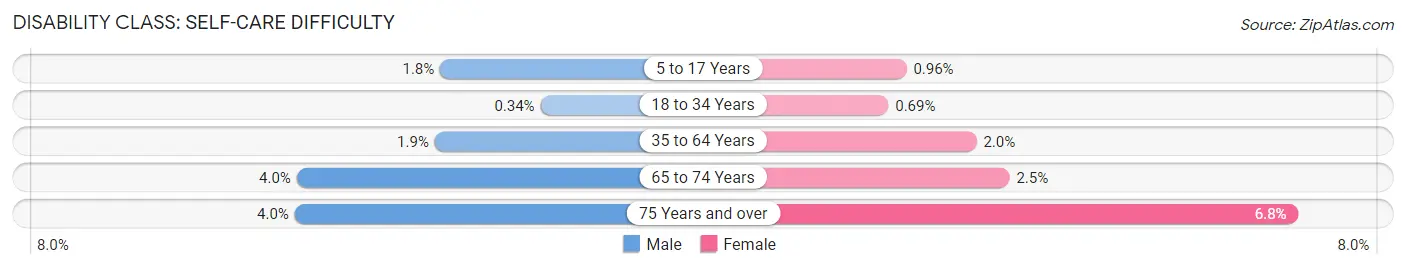
| Age Bracket | Male | Female |
| 5 to 17 Years | 202 (1.8%) | 97 (1.0%) |
| 18 to 34 Years | 59 (0.3%) | 120 (0.7%) |
| 35 to 64 Years | 487 (1.9%) | 493 (2.0%) |
| 65 to 74 Years | 231 (4.0%) | 168 (2.5%) |
| 75 Years and over | 136 (4.0%) | 371 (6.8%) |
Technology Access in Cedar Rapids
Computing Device Access in Cedar Rapids
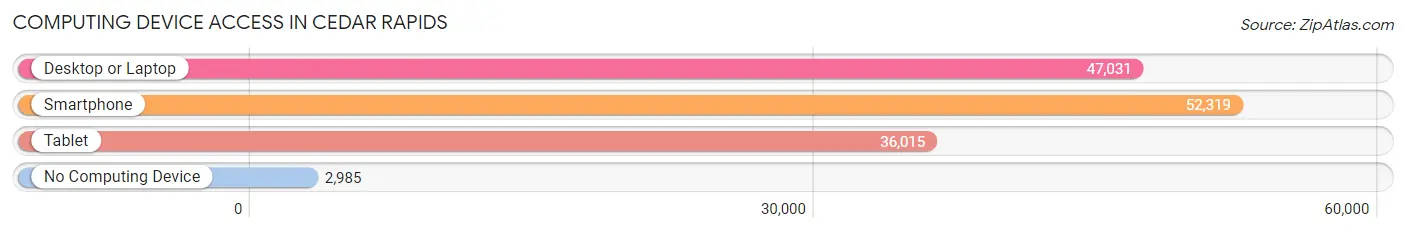
| Device Type | # Households | % Households |
| Desktop or Laptop | 47,031 | 80.7% |
| Smartphone | 52,319 | 89.8% |
| Tablet | 36,015 | 61.8% |
| No Computing Device | 2,985 | 5.1% |
| Total | 58,283 | 100.0% |
Internet Access in Cedar Rapids
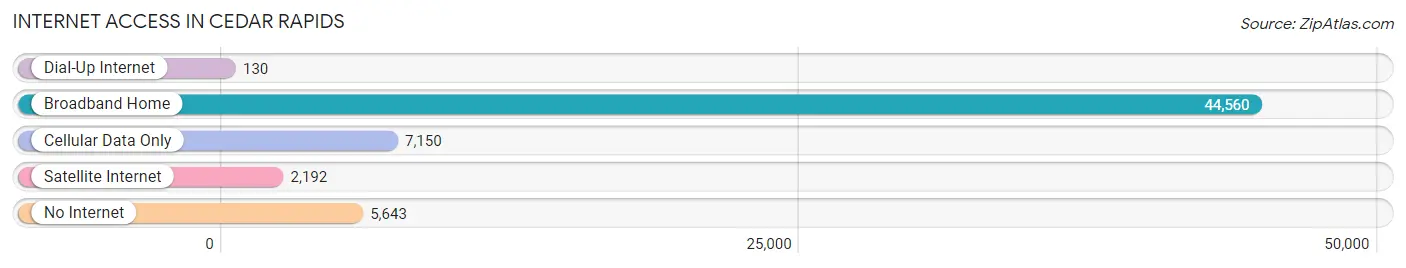
| Internet Type | # Households | % Households |
| Dial-Up Internet | 130 | 0.2% |
| Broadband Home | 44,560 | 76.4% |
| Cellular Data Only | 7,150 | 12.3% |
| Satellite Internet | 2,192 | 3.8% |
| No Internet | 5,643 | 9.7% |
| Total | 58,283 | 100.0% |
Cedar Rapids Summary
Cedar Rapids, Iowa is a city located in Linn County, Iowa, United States. It is the second largest city in the state and the county seat of Linn County. The city is situated on both banks of the Cedar River, approximately 20 miles (32 km) north of Iowa City and 100 miles (160 km) northeast of Des Moines, the state capital. As of the 2010 United States Census, the city had a population of 126,326, making it the second largest city in Iowa.
History
The area that is now Cedar Rapids was first settled in 1838 by George Flagg, a Quaker from New York. He named the settlement Columbus, after the explorer Christopher Columbus. In 1841, the settlement was renamed Cedar Rapids, after the Cedar River that flows through the city. The city was incorporated in 1849 and became the county seat of Linn County in 1851.
In the late 19th century, Cedar Rapids was a major industrial center, with several large factories producing a variety of products, including furniture, wagons, and farm implements. The city was also a major railroad hub, with several railroads connecting it to other cities in Iowa and the Midwest.
In the early 20th century, Cedar Rapids experienced a period of rapid growth, with its population increasing from just over 10,000 in 1900 to over 50,000 by 1920. This growth was largely due to the city’s booming manufacturing industry, which included the production of automobiles, farm equipment, and other products.
Geography
Cedar Rapids is located in east-central Iowa, in the heart of the Cedar River Valley. The city is situated on both banks of the Cedar River, approximately 20 miles (32 km) north of Iowa City and 100 miles (160 km) northeast of Des Moines, the state capital.
The city has a total area of 64.2 square miles (166.2 km2), of which 62.2 square miles (160.7 km2) is land and 2.0 square miles (5.2 km2) is water. The city is located in the humid continental climate zone, with hot, humid summers and cold, snowy winters.
Economy
Cedar Rapids is a major economic center in Iowa, with a diverse economy that includes manufacturing, finance, insurance, healthcare, and education. The city is home to several large companies, including Rockwell Collins, Quaker Oats, and Transamerica.
The city’s largest employer is the Rockwell Collins Company, which employs over 10,000 people in the Cedar Rapids area. Other major employers include the University of Iowa Hospitals and Clinics, Mercy Medical Center, and the Cedar Rapids Community School District.
Demographics
As of the 2010 United States Census, the city had a population of 126,326, making it the second largest city in Iowa. The population density was 1,988.3 people per square mile (766.3/km2). The racial makeup of the city was 84.2% White, 8.3% African American, 0.3% Native American, 2.7% Asian, 0.1% Pacific Islander, 1.7% from other races, and 2.1% from two or more races. Hispanic or Latino of any race were 4.7% of the population.
The median income for a household in the city was $45,919, and the median income for a family was $54,817. Males had a median income of $41,945 versus $30,945 for females. The per capita income for the city was $23,837. About 8.3% of families and 11.2% of the population were below the poverty line, including 15.2% of those under age 18 and 6.2% of those age 65 or over.
Common Questions
What is Per Capita Income in Cedar Rapids?
Per Capita income in Cedar Rapids is $38,585.
What is the Median Family Income in Cedar Rapids?
Median Family Income in Cedar Rapids is $86,756.
What is the Median Household income in Cedar Rapids?
Median Household Income in Cedar Rapids is $66,895.
What is Income or Wage Gap in Cedar Rapids?
Income or Wage Gap in Cedar Rapids is 28.4%.
Women in Cedar Rapids earn 71.6 cents for every dollar earned by a man.
What is Family Income Deficit in Cedar Rapids?
Family Income Deficit in Cedar Rapids is $9,978.
Families that are below poverty line in Cedar Rapids earn $9,978 less on average than the poverty threshold level.
What is Inequality or Gini Index in Cedar Rapids?
Inequality or Gini Index in Cedar Rapids is 0.44.
What is the Total Population of Cedar Rapids?
Total Population of Cedar Rapids is 136,929.
What is the Total Male Population of Cedar Rapids?
Total Male Population of Cedar Rapids is 68,131.
What is the Total Female Population of Cedar Rapids?
Total Female Population of Cedar Rapids is 68,798.
What is the Ratio of Males per 100 Females in Cedar Rapids?
There are 99.03 Males per 100 Females in Cedar Rapids.
What is the Ratio of Females per 100 Males in Cedar Rapids?
There are 100.98 Females per 100 Males in Cedar Rapids.
What is the Median Population Age in Cedar Rapids?
Median Population Age in Cedar Rapids is 37.0 Years.
What is the Average Family Size in Cedar Rapids
Average Family Size in Cedar Rapids is 3.0 People.
What is the Average Household Size in Cedar Rapids
Average Household Size in Cedar Rapids is 2.3 People.
How Large is the Labor Force in Cedar Rapids?
There are 76,178 People in the Labor Forcein in Cedar Rapids.
What is the Percentage of People in the Labor Force in Cedar Rapids?
68.6% of People are in the Labor Force in Cedar Rapids.
What is the Unemployment Rate in Cedar Rapids?
Unemployment Rate in Cedar Rapids is 3.9%.