Plymouth County, IA Map & Demographics
Plymouth County Map
Plymouth County Overview
$40,150
PER CAPITA INCOME
$94,094
AVG FAMILY INCOME
$79,963
AVG HOUSEHOLD INCOME
28.6%
WAGE / INCOME GAP [ % ]
71.4¢/ $1
WAGE / INCOME GAP [ $ ]
$6,892
FAMILY INCOME DEFICIT
0.41
INEQUALITY / GINI INDEX
25,621
TOTAL POPULATION
13,013
MALE POPULATION
12,608
FEMALE POPULATION
103.21
MALES / 100 FEMALES
96.89
FEMALES / 100 MALES
40.9
MEDIAN AGE
3.0
AVG FAMILY SIZE
2.5
AVG HOUSEHOLD SIZE
13,926
LABOR FORCE [ PEOPLE ]
69.5%
PERCENT IN LABOR FORCE
2.1%
UNEMPLOYMENT RATE
Plymouth County Area Codes
Income in Plymouth County
Income Overview in Plymouth County
Per Capita Income in Plymouth County is $40,150, while median incomes of families and households are $94,094 and $79,963 respectively.
| Characteristic | Number | Measure |
| Per Capita Income | 25,621 | $40,150 |
| Median Family Income | 7,152 | $94,094 |
| Mean Family Income | 7,152 | $114,073 |
| Median Household Income | 10,214 | $79,963 |
| Mean Household Income | 10,214 | $98,322 |
| Income Deficit | 7,152 | $6,892 |
| Wage / Income Gap (%) | 25,621 | 28.55% |
| Wage / Income Gap ($) | 25,621 | 71.45¢ per $1 |
| Gini / Inequality Index | 25,621 | 0.41 |
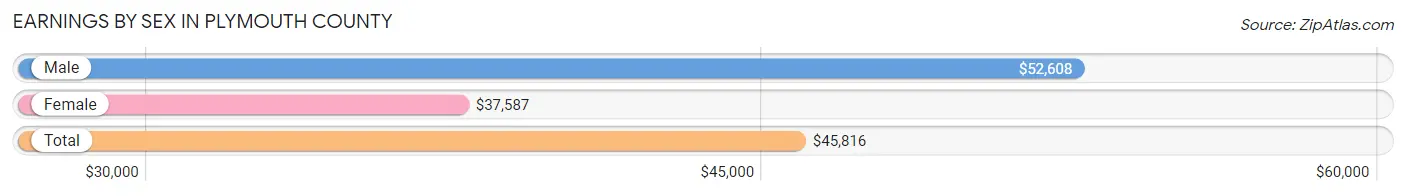
Earnings by Sex in Plymouth County
Average Earnings in Plymouth County are $45,816, $52,608 for men and $37,587 for women, a difference of 28.5%.
| Sex | Number | Average Earnings |
| Male | 7,969 (54.4%) | $52,608 |
| Female | 6,688 (45.6%) | $37,587 |
| Total | 14,657 (100.0%) | $45,816 |
Earnings by Sex by Income Bracket in Plymouth County
The most common earnings brackets in Plymouth County are $100,000+ for men (1,070 | 13.4%) and $55,000 to $64,999 for women (562 | 8.4%).
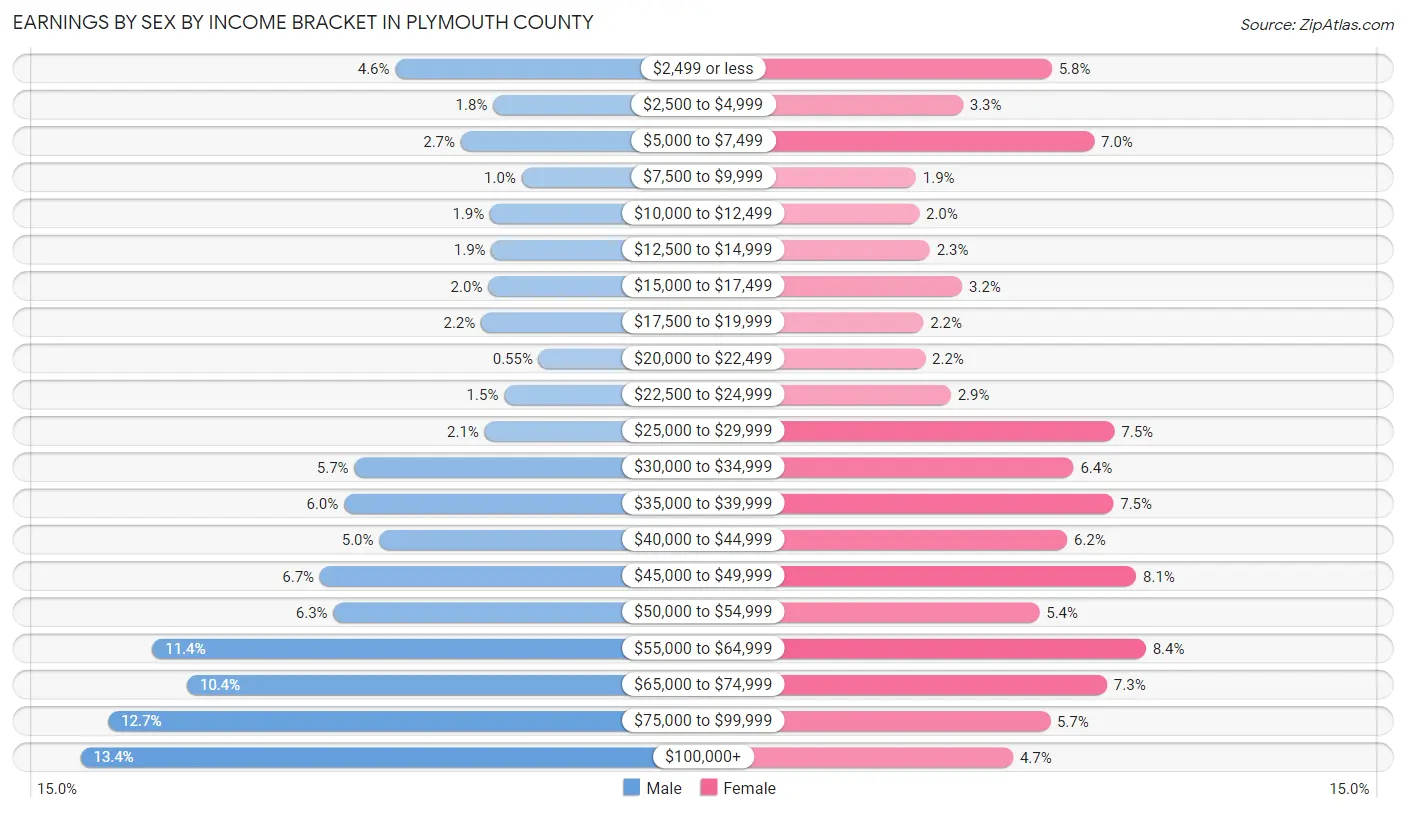
| Income | Male | Female |
| $2,499 or less | 365 (4.6%) | 385 (5.8%) |
| $2,500 to $4,999 | 146 (1.8%) | 218 (3.3%) |
| $5,000 to $7,499 | 218 (2.7%) | 465 (7.0%) |
| $7,500 to $9,999 | 82 (1.0%) | 130 (1.9%) |
| $10,000 to $12,499 | 153 (1.9%) | 136 (2.0%) |
| $12,500 to $14,999 | 150 (1.9%) | 156 (2.3%) |
| $15,000 to $17,499 | 157 (2.0%) | 217 (3.2%) |
| $17,500 to $19,999 | 173 (2.2%) | 144 (2.1%) |
| $20,000 to $22,499 | 44 (0.5%) | 147 (2.2%) |
| $22,500 to $24,999 | 121 (1.5%) | 195 (2.9%) |
| $25,000 to $29,999 | 165 (2.1%) | 503 (7.5%) |
| $30,000 to $34,999 | 457 (5.7%) | 426 (6.4%) |
| $35,000 to $39,999 | 480 (6.0%) | 501 (7.5%) |
| $40,000 to $44,999 | 401 (5.0%) | 414 (6.2%) |
| $45,000 to $49,999 | 534 (6.7%) | 544 (8.1%) |
| $50,000 to $54,999 | 504 (6.3%) | 362 (5.4%) |
| $55,000 to $64,999 | 909 (11.4%) | 562 (8.4%) |
| $65,000 to $74,999 | 832 (10.4%) | 489 (7.3%) |
| $75,000 to $99,999 | 1,008 (12.7%) | 382 (5.7%) |
| $100,000+ | 1,070 (13.4%) | 312 (4.7%) |
| Total | 7,969 (100.0%) | 6,688 (100.0%) |
Earnings by Sex by Educational Attainment in Plymouth County
Average earnings in Plymouth County are $57,968 for men and $41,642 for women, a difference of 28.2%. Men with an educational attainment of graduate degree enjoy the highest average annual earnings of $75,167, while those with less than high school education earn the least with $47,198. Women with an educational attainment of graduate degree earn the most with the average annual earnings of $66,492, while those with high school diploma education have the smallest earnings of $29,536.
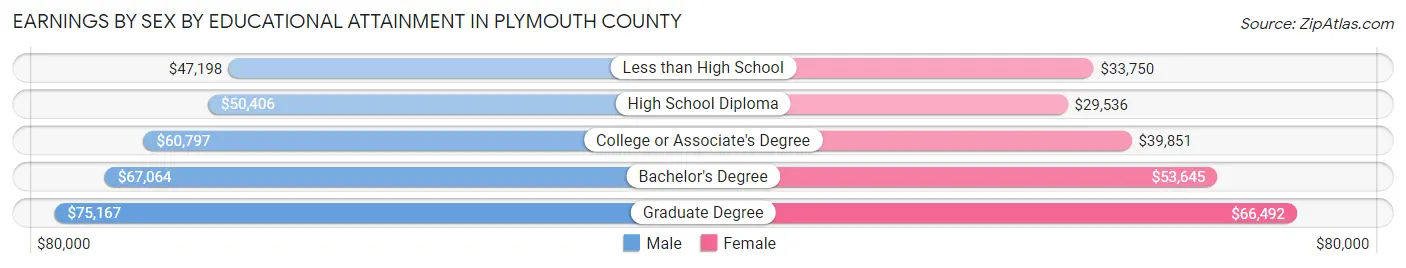
| Educational Attainment | Male Income | Female Income |
| Less than High School | $47,198 | $33,750 |
| High School Diploma | $50,406 | $29,536 |
| College or Associate's Degree | $60,797 | $39,851 |
| Bachelor's Degree | $67,064 | $53,645 |
| Graduate Degree | $75,167 | $66,492 |
| Total | $57,968 | $41,642 |
Family Income in Plymouth County
Family Income Brackets in Plymouth County
According to the Plymouth County family income data, there are 1,802 families falling into the $100,000 to $149,999 income range, which is the most common income bracket and makes up 25.2% of all families. Conversely, the less than $10,000 income bracket is the least frequent group with only 36 families (0.5%) belonging to this category.
| Income Bracket | # Families | % Families |
| Less than $10,000 | 36 | 0.5% |
| $10,000 to $14,999 | 72 | 1.0% |
| $15,000 to $24,999 | 272 | 3.8% |
| $25,000 to $34,999 | 236 | 3.3% |
| $35,000 to $49,999 | 465 | 6.5% |
| $50,000 to $74,999 | 1,445 | 20.2% |
| $75,000 to $99,999 | 1,302 | 18.2% |
| $100,000 to $149,999 | 1,802 | 25.2% |
| $150,000 to $199,999 | 780 | 10.9% |
| $200,000+ | 744 | 10.4% |
Family Income by Famaliy Size in Plymouth County
5-person families (794 | 11.1%) account for the highest median family income in Plymouth County with $126,667 per family, while 2-person families (3,692 | 51.6%) have the highest median income of $43,088 per family member.
| Income Bracket | # Families | Median Income |
| 2-Person Families | 3,692 (51.6%) | $86,176 |
| 3-Person Families | 1,183 (16.5%) | $89,458 |
| 4-Person Families | 1,257 (17.6%) | $103,147 |
| 5-Person Families | 794 (11.1%) | $126,667 |
| 6-Person Families | 144 (2.0%) | $122,500 |
| 7+ Person Families | 82 (1.1%) | $103,889 |
| Total | 7,152 (100.0%) | $94,094 |
Family Income by Number of Earners in Plymouth County
The median family income in Plymouth County is $94,094, with families comprising 3+ earners (889) having the highest median family income of $129,399, while families with no earners (892) have the lowest median family income of $57,321, accounting for 12.4% and 12.5% of families, respectively.
| Number of Earners | # Families | Median Income |
| No Earners | 892 (12.5%) | $57,321 |
| 1 Earner | 1,772 (24.8%) | $69,063 |
| 2 Earners | 3,599 (50.3%) | $109,136 |
| 3+ Earners | 889 (12.4%) | $129,399 |
| Total | 7,152 (100.0%) | $94,094 |
Household Income in Plymouth County
Household Income Brackets in Plymouth County
With 2,053 households falling in the category, the $100,000 to $149,999 income range is the most frequent in Plymouth County, accounting for 20.1% of all households. In contrast, only 235 households (2.3%) fall into the less than $10,000 income bracket, making it the least populous group.
| Income Bracket | # Households | % Households |
| Less than $10,000 | 235 | 2.3% |
| $10,000 to $14,999 | 306 | 3.0% |
| $15,000 to $24,999 | 776 | 7.6% |
| $25,000 to $34,999 | 531 | 5.2% |
| $35,000 to $49,999 | 981 | 9.6% |
| $50,000 to $74,999 | 1,879 | 18.4% |
| $75,000 to $99,999 | 1,747 | 17.1% |
| $100,000 to $149,999 | 2,053 | 20.1% |
| $150,000 to $199,999 | 868 | 8.5% |
| $200,000+ | 838 | 8.2% |
Household Income by Householder Age in Plymouth County
The median household income in Plymouth County is $79,963, with the highest median household income of $97,695 found in the 45 to 64 years age bracket for the primary householder. A total of 3,793 households (37.1%) fall into this category. Meanwhile, the 15 to 24 years age bracket for the primary householder has the lowest median household income of $46,849, with 446 households (4.4%) in this group.
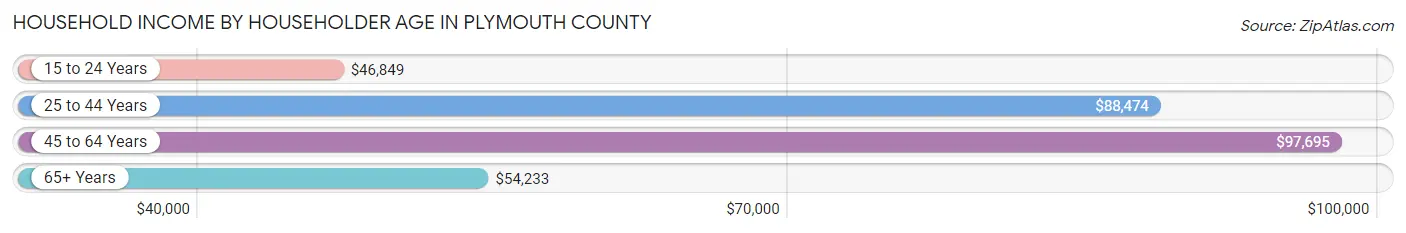
| Income Bracket | # Households | Median Income |
| 15 to 24 Years | 446 (4.4%) | $46,849 |
| 25 to 44 Years | 2,975 (29.1%) | $88,474 |
| 45 to 64 Years | 3,793 (37.1%) | $97,695 |
| 65+ Years | 3,000 (29.4%) | $54,233 |
| Total | 10,214 (100.0%) | $79,963 |
Poverty in Plymouth County
Income Below Poverty by Sex and Age in Plymouth County
With 5.0% poverty level for males and 6.4% for females among the residents of Plymouth County, 15 year old males and 75 year old and over females are the most vulnerable to poverty, with 59 males (23.7%) and 162 females (15.2%) in their respective age groups living below the poverty level.
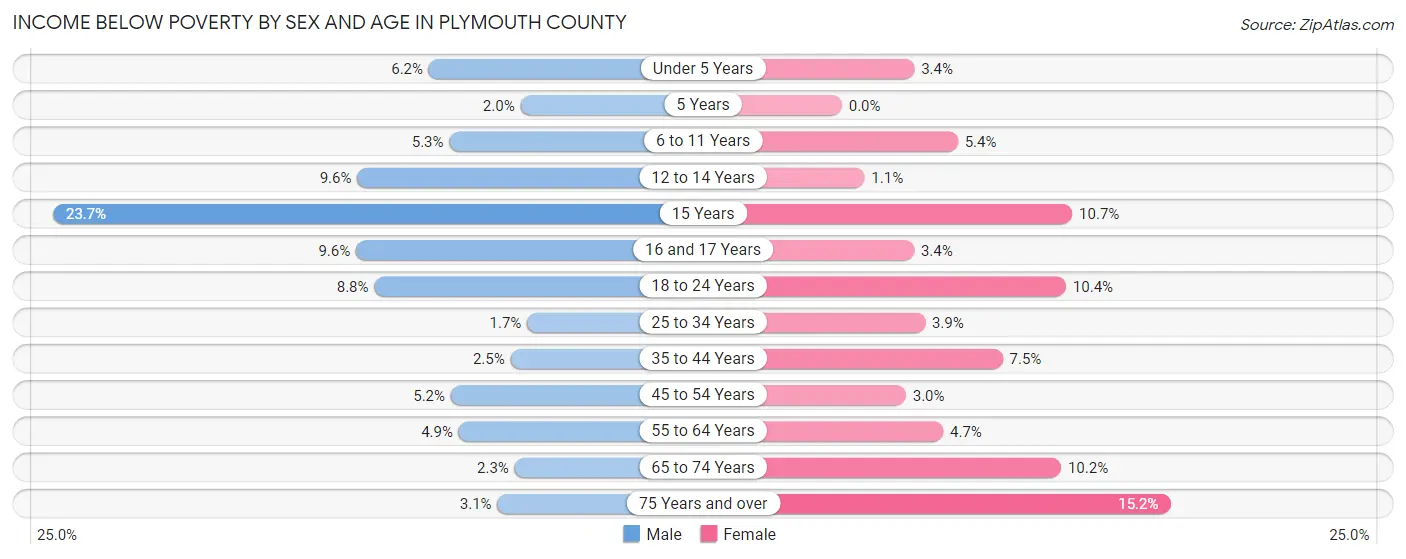
| Age Bracket | Male | Female |
| Under 5 Years | 50 (6.2%) | 23 (3.4%) |
| 5 Years | 5 (2.0%) | 0 (0.0%) |
| 6 to 11 Years | 53 (5.3%) | 50 (5.4%) |
| 12 to 14 Years | 50 (9.6%) | 7 (1.1%) |
| 15 Years | 59 (23.7%) | 17 (10.7%) |
| 16 and 17 Years | 40 (9.6%) | 12 (3.4%) |
| 18 to 24 Years | 92 (8.8%) | 94 (10.4%) |
| 25 to 34 Years | 23 (1.7%) | 49 (3.9%) |
| 35 to 44 Years | 39 (2.5%) | 116 (7.5%) |
| 45 to 54 Years | 85 (5.2%) | 43 (3.0%) |
| 55 to 64 Years | 89 (4.9%) | 81 (4.7%) |
| 65 to 74 Years | 30 (2.3%) | 138 (10.2%) |
| 75 Years and over | 26 (3.1%) | 162 (15.2%) |
| Total | 641 (5.0%) | 792 (6.4%) |
Income Above Poverty by Sex and Age in Plymouth County
According to the poverty statistics in Plymouth County, males aged 25 to 34 years and females aged 5 years are the age groups that are most secure financially, with 98.3% of males and 100.0% of females in these age groups living above the poverty line.
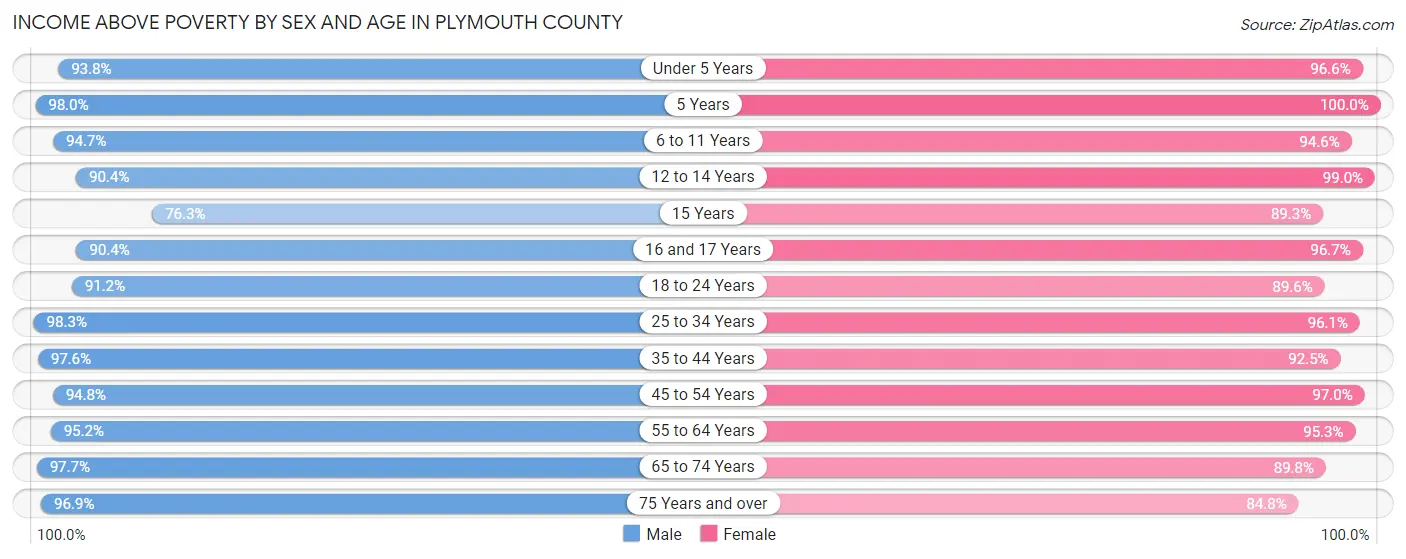
| Age Bracket | Male | Female |
| Under 5 Years | 751 (93.8%) | 662 (96.6%) |
| 5 Years | 246 (98.0%) | 245 (100.0%) |
| 6 to 11 Years | 948 (94.7%) | 880 (94.6%) |
| 12 to 14 Years | 473 (90.4%) | 660 (99.0%) |
| 15 Years | 190 (76.3%) | 142 (89.3%) |
| 16 and 17 Years | 376 (90.4%) | 346 (96.7%) |
| 18 to 24 Years | 957 (91.2%) | 810 (89.6%) |
| 25 to 34 Years | 1,350 (98.3%) | 1,221 (96.1%) |
| 35 to 44 Years | 1,556 (97.6%) | 1,439 (92.5%) |
| 45 to 54 Years | 1,543 (94.8%) | 1,405 (97.0%) |
| 55 to 64 Years | 1,746 (95.2%) | 1,644 (95.3%) |
| 65 to 74 Years | 1,300 (97.7%) | 1,219 (89.8%) |
| 75 Years and over | 824 (96.9%) | 901 (84.8%) |
| Total | 12,260 (95.0%) | 11,574 (93.6%) |
Income Below Poverty Among Married-Couple Families in Plymouth County
The poverty statistics for married-couple families in Plymouth County show that 1.9% or 113 of the total 6,060 families live below the poverty line. Families with 5 or more children have the highest poverty rate of 18.9%, comprising of 10 families. On the other hand, families with 3 or 4 children have the lowest poverty rate of 0.4%, which includes 3 families.
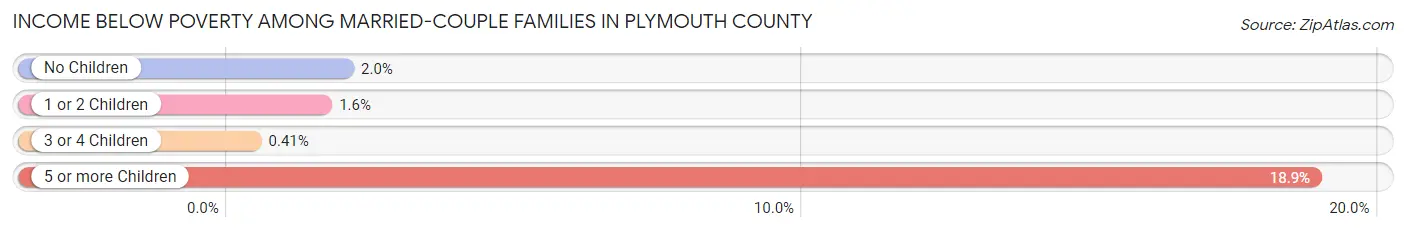
| Children | Above Poverty | Below Poverty |
| No Children | 3,492 (98.0%) | 72 (2.0%) |
| 1 or 2 Children | 1,677 (98.4%) | 28 (1.6%) |
| 3 or 4 Children | 735 (99.6%) | 3 (0.4%) |
| 5 or more Children | 43 (81.1%) | 10 (18.9%) |
| Total | 5,947 (98.1%) | 113 (1.9%) |
Income Below Poverty Among Single-Parent Households in Plymouth County
According to the poverty data in Plymouth County, 4.9% or 21 single-father households and 14.4% or 95 single-mother households are living below the poverty line. Among single-father households, those with 3 or 4 children have the highest poverty rate, with 5 households (13.5%) experiencing poverty. Likewise, among single-mother households, those with 3 or 4 children have the highest poverty rate, with 38 households (31.4%) falling below the poverty line.
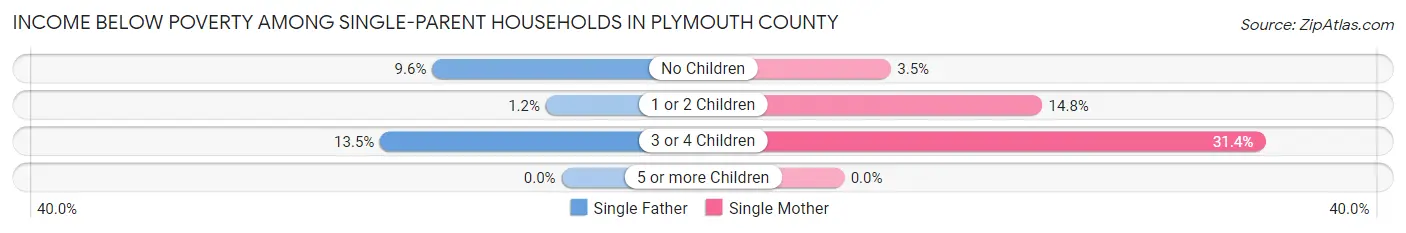
| Children | Single Father | Single Mother |
| No Children | 13 (9.6%) | 7 (3.5%) |
| 1 or 2 Children | 3 (1.2%) | 50 (14.7%) |
| 3 or 4 Children | 5 (13.5%) | 38 (31.4%) |
| 5 or more Children | 0 (0.0%) | 0 (0.0%) |
| Total | 21 (4.9%) | 95 (14.4%) |
Income Below Poverty Among Married-Couple vs Single-Parent Households in Plymouth County
The poverty data for Plymouth County shows that 113 of the married-couple family households (1.9%) and 116 of the single-parent households (10.6%) are living below the poverty level. Within the married-couple family households, those with 5 or more children have the highest poverty rate, with 10 households (18.9%) falling below the poverty line. Among the single-parent households, those with 3 or 4 children have the highest poverty rate, with 43 household (27.2%) living below poverty.
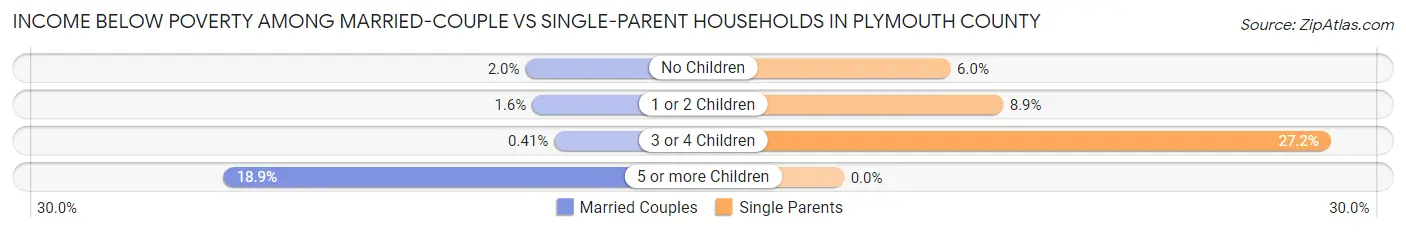
| Children | Married-Couple Families | Single-Parent Households |
| No Children | 72 (2.0%) | 20 (5.9%) |
| 1 or 2 Children | 28 (1.6%) | 53 (8.9%) |
| 3 or 4 Children | 3 (0.4%) | 43 (27.2%) |
| 5 or more Children | 10 (18.9%) | 0 (0.0%) |
| Total | 113 (1.9%) | 116 (10.6%) |
Race in Plymouth County
The most populous races in Plymouth County are White / Caucasian (23,643 | 92.3%), Hispanic or Latino (1,490 | 5.8%), and Two or more Races (693 | 2.7%).
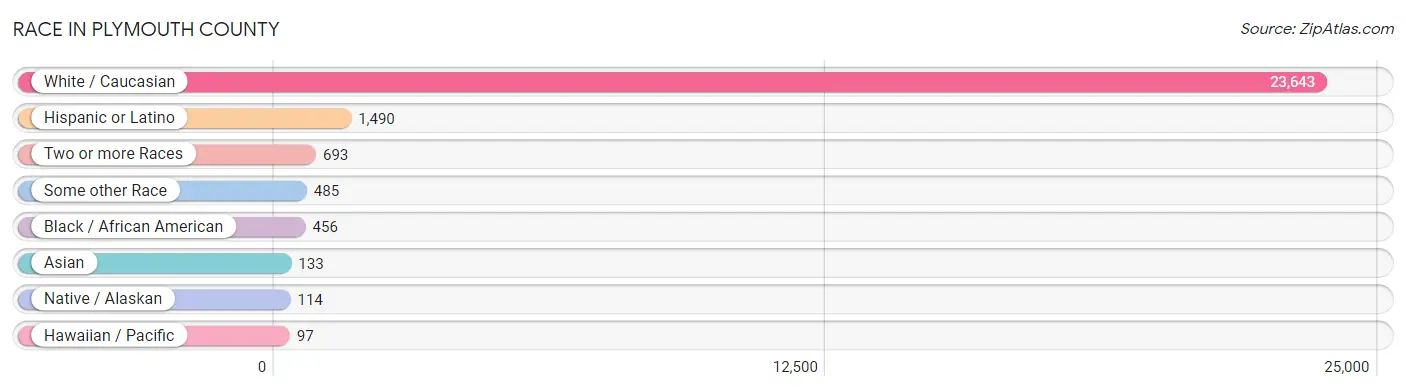
| Race | # Population | % Population |
| Asian | 133 | 0.5% |
| Black / African American | 456 | 1.8% |
| Hawaiian / Pacific | 97 | 0.4% |
| Hispanic or Latino | 1,490 | 5.8% |
| Native / Alaskan | 114 | 0.4% |
| White / Caucasian | 23,643 | 92.3% |
| Two or more Races | 693 | 2.7% |
| Some other Race | 485 | 1.9% |
| Total | 25,621 | 100.0% |
Ancestry in Plymouth County
The most populous ancestries reported in Plymouth County are German (11,016 | 43.0%), Irish (3,256 | 12.7%), English (1,509 | 5.9%), Dutch (1,497 | 5.8%), and American (1,085 | 4.2%), together accounting for 71.7% of all Plymouth County residents.
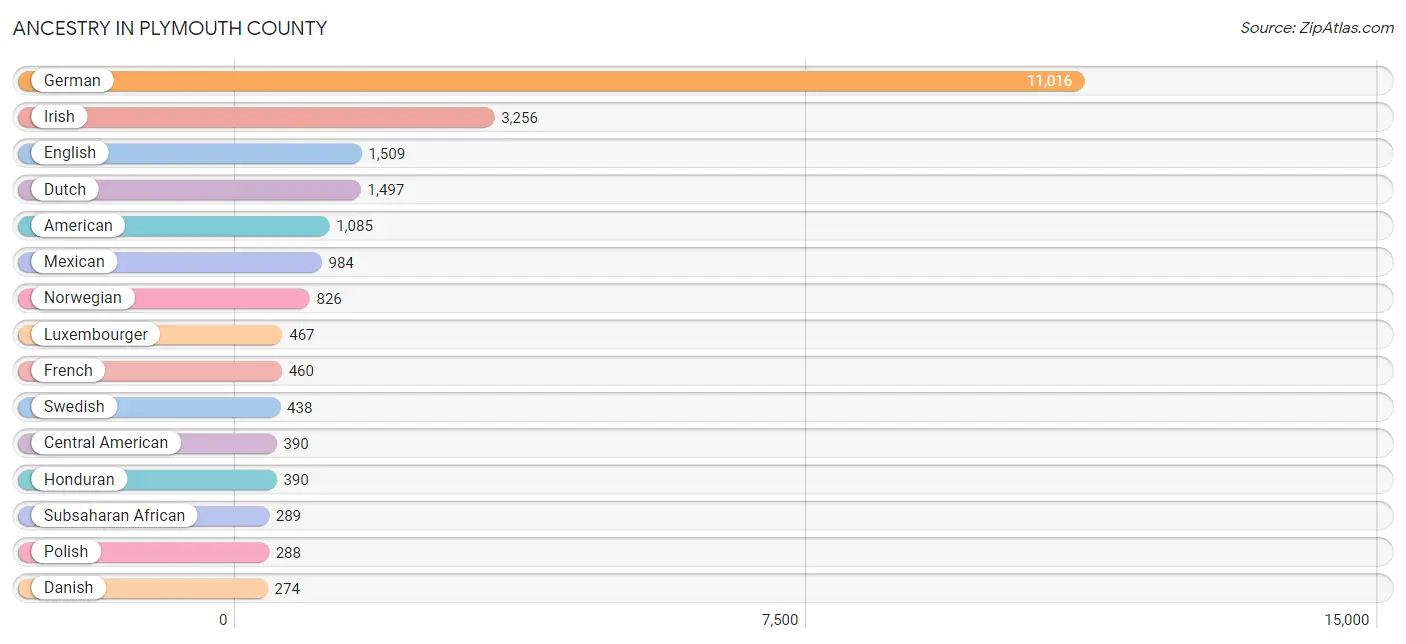
| Ancestry | # Population | % Population |
| African | 252 | 1.0% |
| American | 1,085 | 4.2% |
| Apache | 8 | 0.0% |
| Arab | 38 | 0.2% |
| Australian | 15 | 0.1% |
| Austrian | 3 | 0.0% |
| Belgian | 39 | 0.2% |
| Bhutanese | 5 | 0.0% |
| British | 51 | 0.2% |
| Bulgarian | 2 | 0.0% |
| Burmese | 11 | 0.0% |
| Canadian | 11 | 0.0% |
| Central American | 390 | 1.5% |
| Central American Indian | 36 | 0.1% |
| Choctaw | 2 | 0.0% |
| Colombian | 8 | 0.0% |
| Croatian | 10 | 0.0% |
| Czech | 225 | 0.9% |
| Czechoslovakian | 23 | 0.1% |
| Danish | 274 | 1.1% |
| Dominican | 36 | 0.1% |
| Dutch | 1,497 | 5.8% |
| Eastern European | 40 | 0.2% |
| English | 1,509 | 5.9% |
| European | 217 | 0.9% |
| Finnish | 3 | 0.0% |
| French | 460 | 1.8% |
| French Canadian | 75 | 0.3% |
| German | 11,016 | 43.0% |
| Greek | 44 | 0.2% |
| Honduran | 390 | 1.5% |
| Hungarian | 7 | 0.0% |
| Icelander | 1 | 0.0% |
| Inupiat | 17 | 0.1% |
| Irish | 3,256 | 12.7% |
| Italian | 239 | 0.9% |
| Korean | 109 | 0.4% |
| Lebanese | 22 | 0.1% |
| Lithuanian | 3 | 0.0% |
| Luxembourger | 467 | 1.8% |
| Malaysian | 53 | 0.2% |
| Mexican | 984 | 3.8% |
| Mexican American Indian | 54 | 0.2% |
| Native Hawaiian | 5 | 0.0% |
| Northern European | 15 | 0.1% |
| Norwegian | 826 | 3.2% |
| Pakistani | 2 | 0.0% |
| Polish | 288 | 1.1% |
| Portuguese | 15 | 0.1% |
| Puerto Rican | 7 | 0.0% |
| Romanian | 6 | 0.0% |
| Russian | 23 | 0.1% |
| Scandinavian | 129 | 0.5% |
| Scotch-Irish | 182 | 0.7% |
| Scottish | 232 | 0.9% |
| Seminole | 1 | 0.0% |
| Sioux | 97 | 0.4% |
| Somali | 9 | 0.0% |
| South African | 28 | 0.1% |
| South American | 8 | 0.0% |
| Spaniard | 16 | 0.1% |
| Spanish | 36 | 0.1% |
| Sri Lankan | 44 | 0.2% |
| Subsaharan African | 289 | 1.1% |
| Sudanese | 244 | 0.9% |
| Swedish | 438 | 1.7% |
| Swiss | 43 | 0.2% |
| Syrian | 16 | 0.1% |
| Thai | 7 | 0.0% |
| Ukrainian | 2 | 0.0% |
| Welsh | 89 | 0.4% | View All 71 Rows |
Immigrants in Plymouth County
The most numerous immigrant groups reported in Plymouth County came from Central America (667 | 2.6%), Latin America (667 | 2.6%), Mexico (392 | 1.5%), Africa (285 | 1.1%), and Honduras (275 | 1.1%), together accounting for 8.9% of all Plymouth County residents.
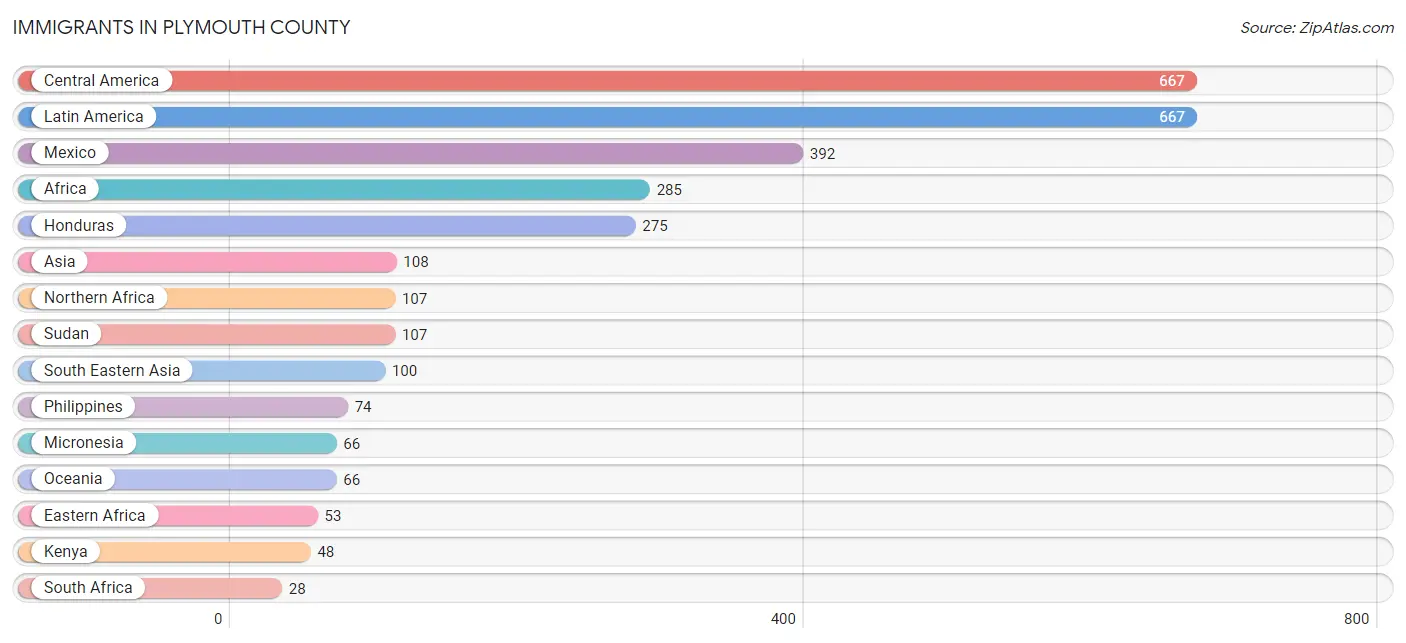
| Immigration Origin | # Population | % Population |
| Africa | 285 | 1.1% |
| Asia | 108 | 0.4% |
| Belgium | 2 | 0.0% |
| Central America | 667 | 2.6% |
| Eastern Africa | 53 | 0.2% |
| Eastern Asia | 1 | 0.0% |
| Europe | 26 | 0.1% |
| Germany | 10 | 0.0% |
| Greece | 14 | 0.1% |
| Honduras | 275 | 1.1% |
| India | 7 | 0.0% |
| Kenya | 48 | 0.2% |
| Korea | 1 | 0.0% |
| Laos | 24 | 0.1% |
| Latin America | 667 | 2.6% |
| Mexico | 392 | 1.5% |
| Micronesia | 66 | 0.3% |
| Northern Africa | 107 | 0.4% |
| Oceania | 66 | 0.3% |
| Philippines | 74 | 0.3% |
| Somalia | 5 | 0.0% |
| South Africa | 28 | 0.1% |
| South Central Asia | 7 | 0.0% |
| South Eastern Asia | 100 | 0.4% |
| Southern Europe | 14 | 0.1% |
| Sudan | 107 | 0.4% |
| Thailand | 2 | 0.0% |
| Western Europe | 12 | 0.1% | View All 28 Rows |
Sex and Age in Plymouth County
Sex and Age in Plymouth County
The most populous age groups in Plymouth County are 60 to 64 Years (1,071 | 8.2%) for men and 10 to 14 Years (1,012 | 8.0%) for women.
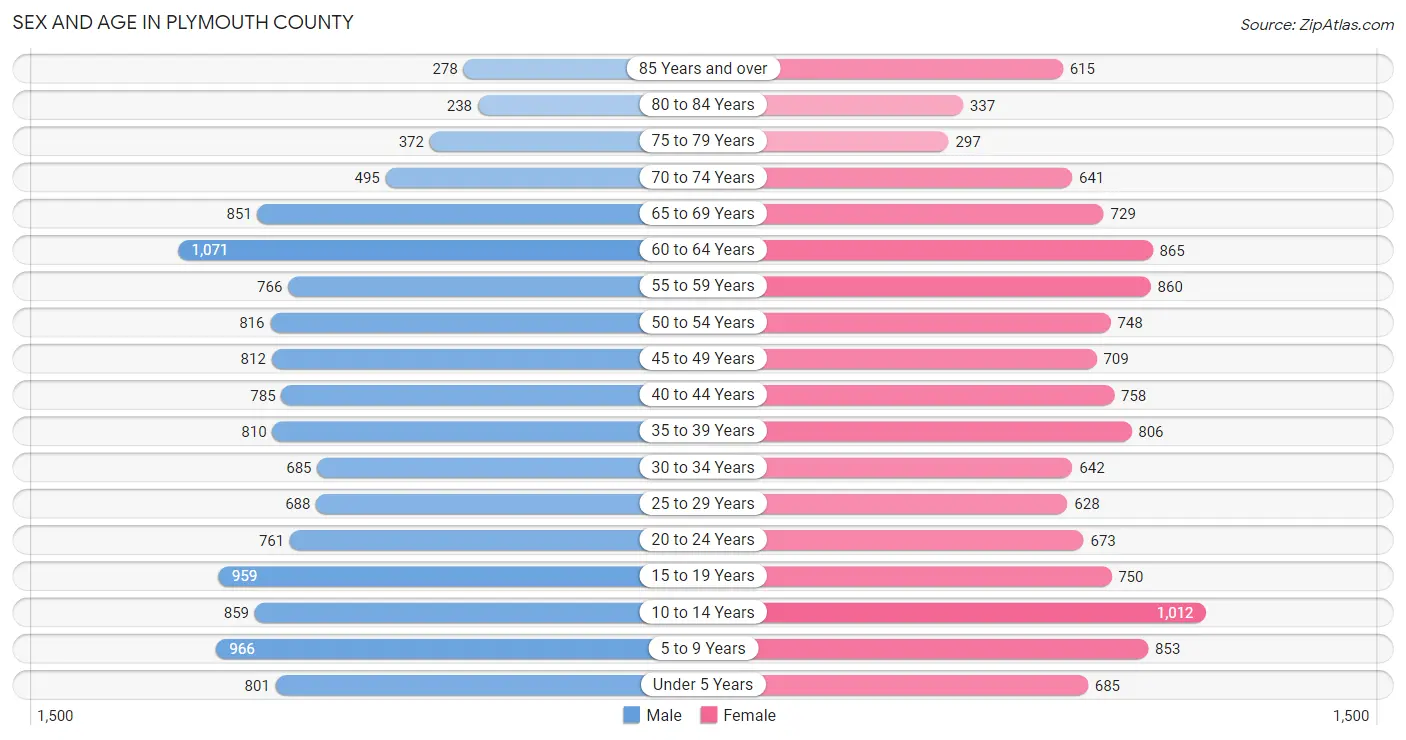
| Age Bracket | Male | Female |
| Under 5 Years | 801 (6.2%) | 685 (5.4%) |
| 5 to 9 Years | 966 (7.4%) | 853 (6.8%) |
| 10 to 14 Years | 859 (6.6%) | 1,012 (8.0%) |
| 15 to 19 Years | 959 (7.4%) | 750 (5.9%) |
| 20 to 24 Years | 761 (5.9%) | 673 (5.3%) |
| 25 to 29 Years | 688 (5.3%) | 628 (5.0%) |
| 30 to 34 Years | 685 (5.3%) | 642 (5.1%) |
| 35 to 39 Years | 810 (6.2%) | 806 (6.4%) |
| 40 to 44 Years | 785 (6.0%) | 758 (6.0%) |
| 45 to 49 Years | 812 (6.2%) | 709 (5.6%) |
| 50 to 54 Years | 816 (6.3%) | 748 (5.9%) |
| 55 to 59 Years | 766 (5.9%) | 860 (6.8%) |
| 60 to 64 Years | 1,071 (8.2%) | 865 (6.9%) |
| 65 to 69 Years | 851 (6.5%) | 729 (5.8%) |
| 70 to 74 Years | 495 (3.8%) | 641 (5.1%) |
| 75 to 79 Years | 372 (2.9%) | 297 (2.4%) |
| 80 to 84 Years | 238 (1.8%) | 337 (2.7%) |
| 85 Years and over | 278 (2.1%) | 615 (4.9%) |
| Total | 13,013 (100.0%) | 12,608 (100.0%) |
Families and Households in Plymouth County
Median Family Size in Plymouth County
The median family size in Plymouth County is 2.99 persons per family, with married-couple families (6,060 | 84.7%) accounting for the largest median family size of 3.07 persons per family. On the other hand, single male/father families (431 | 6.0%) represent the smallest median family size with 2.29 persons per family.
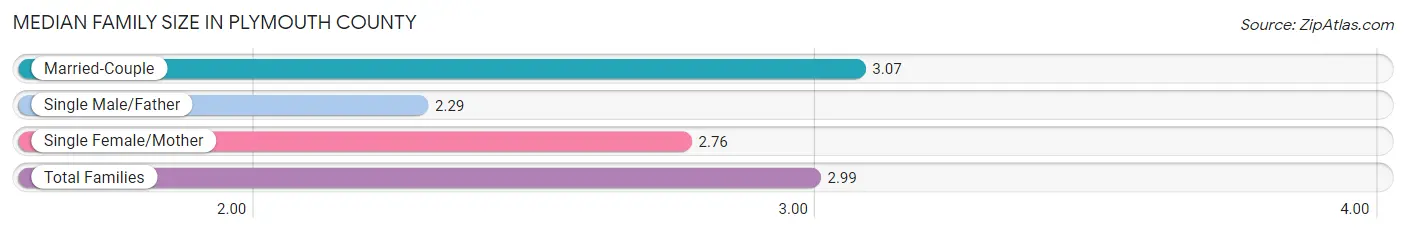
| Family Type | # Families | Family Size |
| Married-Couple | 6,060 (84.7%) | 3.07 |
| Single Male/Father | 431 (6.0%) | 2.29 |
| Single Female/Mother | 661 (9.2%) | 2.76 |
| Total Families | 7,152 (100.0%) | 2.99 |
Median Household Size in Plymouth County
The median household size in Plymouth County is 2.47 persons per household, with married-couple households (6,060 | 59.3%) accounting for the largest median household size of 3.08 persons per household. non-family households (3,062 | 30.0%) represent the smallest median household size with 1.12 persons per household.
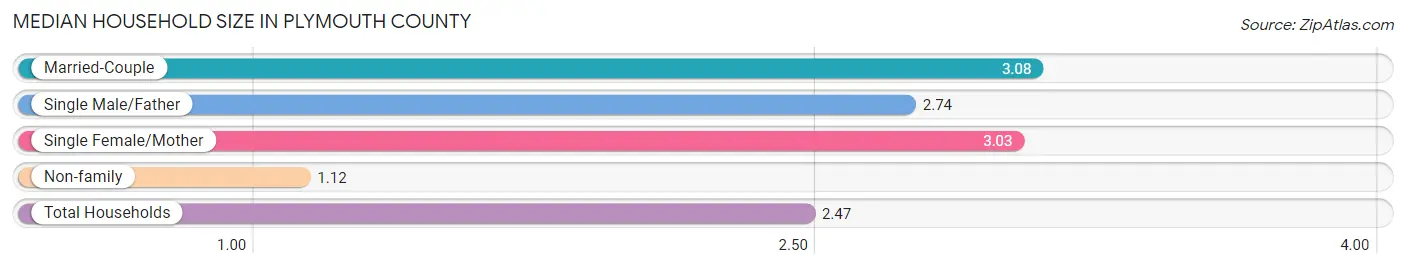
| Household Type | # Households | Household Size |
| Married-Couple | 6,060 (59.3%) | 3.08 |
| Single Male/Father | 431 (4.2%) | 2.74 |
| Single Female/Mother | 661 (6.5%) | 3.03 |
| Non-family | 3,062 (30.0%) | 1.12 |
| Total Households | 10,214 (100.0%) | 2.47 |
Household Size by Marriage Status in Plymouth County
Out of a total of 10,214 households in Plymouth County, 7,152 (70.0%) are family households, while 3,062 (30.0%) are nonfamily households. The most numerous type of family households are 2-person households, comprising 3,538, and the most common type of nonfamily households are 1-person households, comprising 2,719.
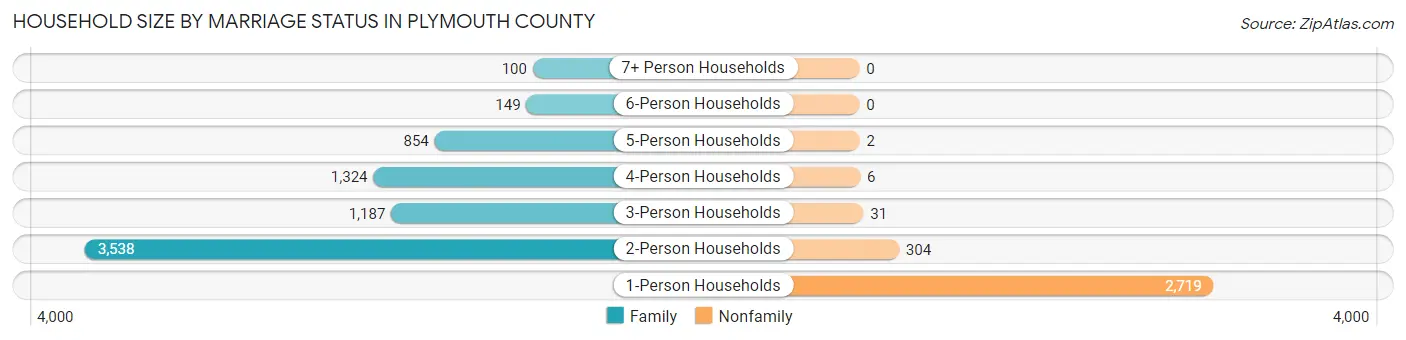
| Household Size | Family Households | Nonfamily Households |
| 1-Person Households | - | 2,719 (26.6%) |
| 2-Person Households | 3,538 (34.6%) | 304 (3.0%) |
| 3-Person Households | 1,187 (11.6%) | 31 (0.3%) |
| 4-Person Households | 1,324 (13.0%) | 6 (0.1%) |
| 5-Person Households | 854 (8.4%) | 2 (0.0%) |
| 6-Person Households | 149 (1.5%) | 0 (0.0%) |
| 7+ Person Households | 100 (1.0%) | 0 (0.0%) |
| Total | 7,152 (70.0%) | 3,062 (30.0%) |
Female Fertility in Plymouth County
Fertility by Age in Plymouth County
Average fertility rate in Plymouth County is 60.0 births per 1,000 women. Women in the age bracket of 20 to 34 years have the highest fertility rate with 132.0 births per 1,000 women. Women in the age bracket of 20 to 34 years acount for 84.3% of all women with births.
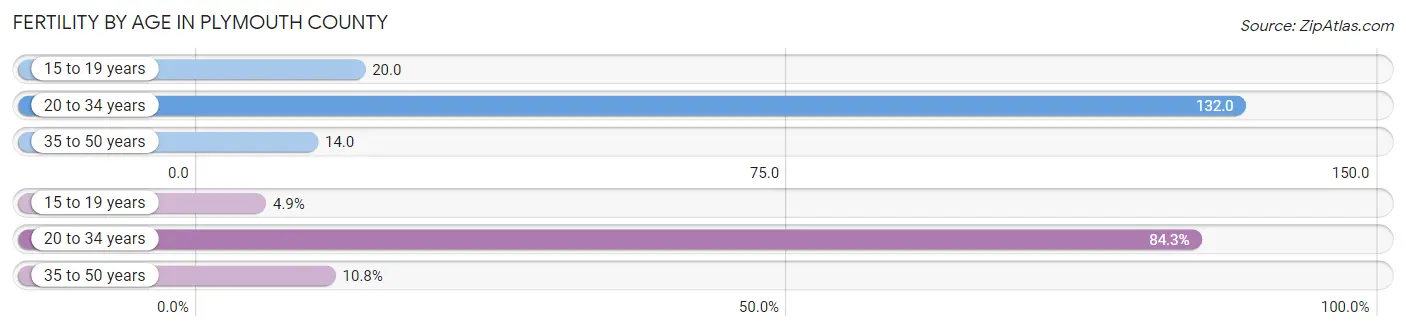
| Age Bracket | Women with Births | Births / 1,000 Women |
| 15 to 19 years | 15 (4.9%) | 20.0 |
| 20 to 34 years | 257 (84.3%) | 132.0 |
| 35 to 50 years | 33 (10.8%) | 14.0 |
| Total | 305 (100.0%) | 60.0 |
Fertility by Age by Marriage Status in Plymouth County
71.1% of women with births (305) in Plymouth County are married. The highest percentage of unmarried women with births falls into 15 to 19 years age bracket with 100.0% of them unmarried at the time of birth, while the lowest percentage of unmarried women with births belong to 35 to 50 years age bracket with 12.1% of them unmarried.
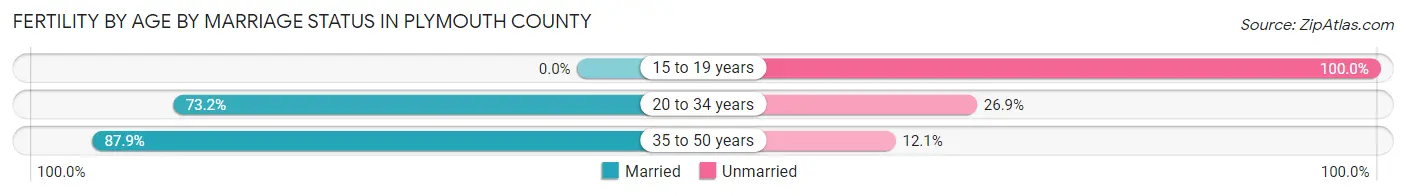
| Age Bracket | Married | Unmarried |
| 15 to 19 years | 0 (0.0%) | 15 (100.0%) |
| 20 to 34 years | 188 (73.2%) | 69 (26.9%) |
| 35 to 50 years | 29 (87.9%) | 4 (12.1%) |
| Total | 217 (71.2%) | 88 (28.8%) |
Fertility by Education in Plymouth County
Average fertility rate in Plymouth County is 60.0 births per 1,000 women. Women with the education attainment of bachelor's degree have the highest fertility rate of 90.0 births per 1,000 women, while women with the education attainment of less than high school have the lowest fertility at 38.0 births per 1,000 women. Women with the education attainment of bachelor's degree represent 33.1% of all women with births.
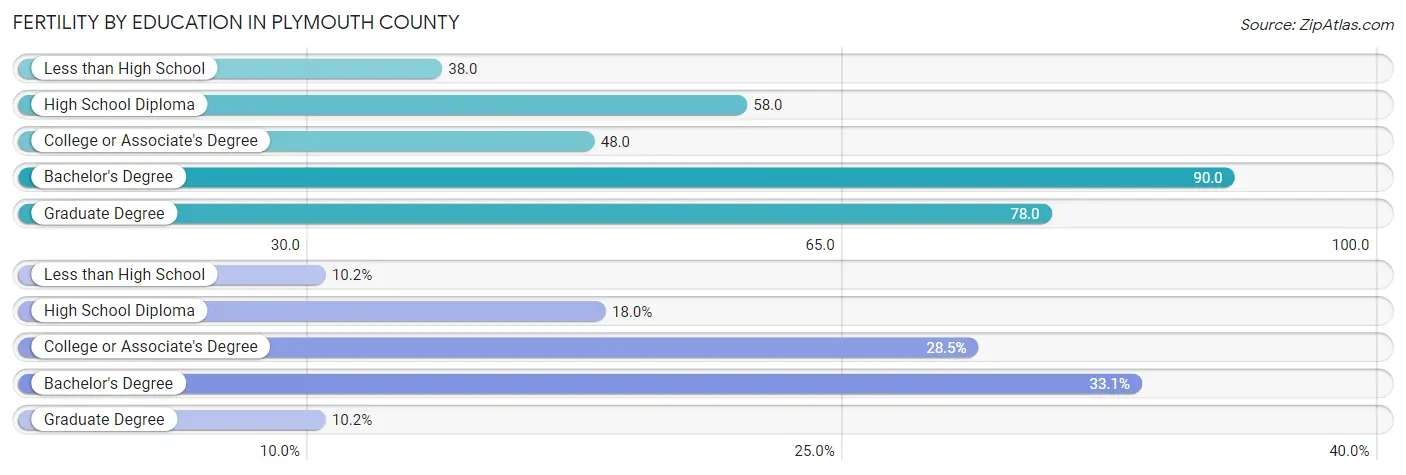
| Educational Attainment | Women with Births | Births / 1,000 Women |
| Less than High School | 31 (10.2%) | 38.0 |
| High School Diploma | 55 (18.0%) | 58.0 |
| College or Associate's Degree | 87 (28.5%) | 48.0 |
| Bachelor's Degree | 101 (33.1%) | 90.0 |
| Graduate Degree | 31 (10.2%) | 78.0 |
| Total | 305 (100.0%) | 60.0 |
Fertility by Education by Marriage Status in Plymouth County
28.8% of women with births in Plymouth County are unmarried. Women with the educational attainment of bachelor's degree are most likely to be married with 100.0% of them married at childbirth, while women with the educational attainment of less than high school are least likely to be married with 100.0% of them unmarried at childbirth.
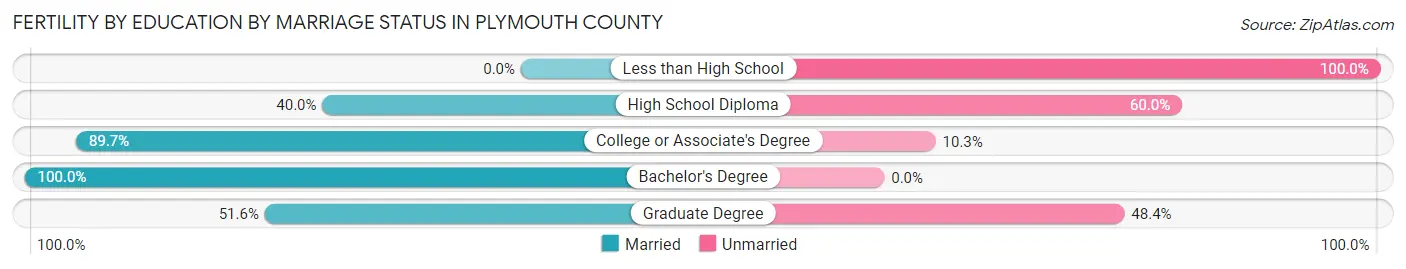
| Educational Attainment | Married | Unmarried |
| Less than High School | 0 (0.0%) | 31 (100.0%) |
| High School Diploma | 22 (40.0%) | 33 (60.0%) |
| College or Associate's Degree | 78 (89.7%) | 9 (10.3%) |
| Bachelor's Degree | 101 (100.0%) | 0 (0.0%) |
| Graduate Degree | 16 (51.6%) | 15 (48.4%) |
| Total | 217 (71.2%) | 88 (28.8%) |
Employment Characteristics in Plymouth County
Employment by Class of Employer in Plymouth County
Among the 13,441 employed individuals in Plymouth County, private company employees (8,831 | 65.7%), not-for-profit organizations (1,344 | 10.0%), and local government employees (929 | 6.9%) make up the most common classes of employment.
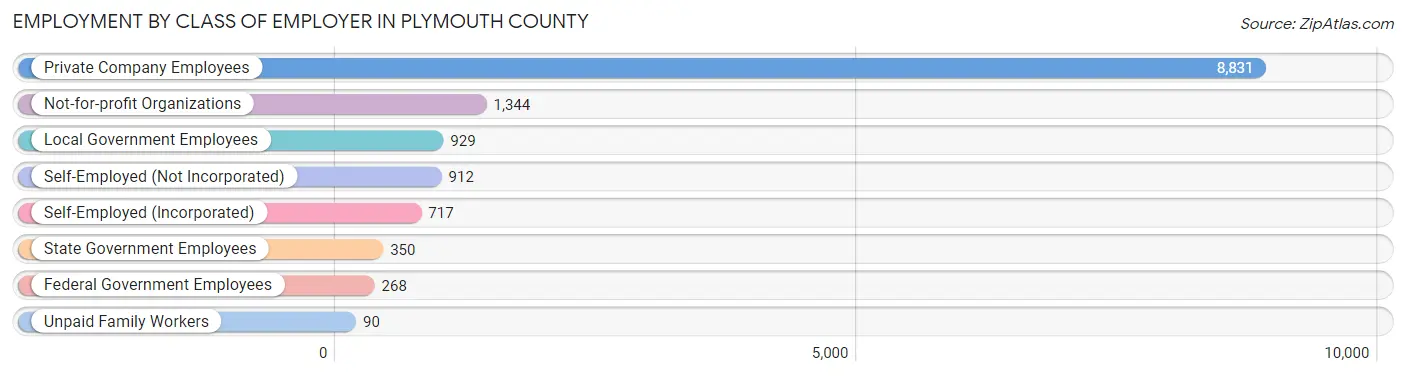
| Employer Class | # Employees | % Employees |
| Private Company Employees | 8,831 | 65.7% |
| Self-Employed (Incorporated) | 717 | 5.3% |
| Self-Employed (Not Incorporated) | 912 | 6.8% |
| Not-for-profit Organizations | 1,344 | 10.0% |
| Local Government Employees | 929 | 6.9% |
| State Government Employees | 350 | 2.6% |
| Federal Government Employees | 268 | 2.0% |
| Unpaid Family Workers | 90 | 0.7% |
| Total | 13,441 | 100.0% |
Employment Status by Age in Plymouth County
According to the labor force statistics for Plymouth County, out of the total population over 16 years of age (20,037), 69.5% or 13,926 individuals are in the labor force, with 2.1% or 292 of them unemployed. The age group with the highest labor force participation rate is 35 to 44 years, with 93.1% or 2,941 individuals in the labor force. Within the labor force, the 75 years and over age range has the highest percentage of unemployed individuals, with 9.8% or 16 of them being unemployed.
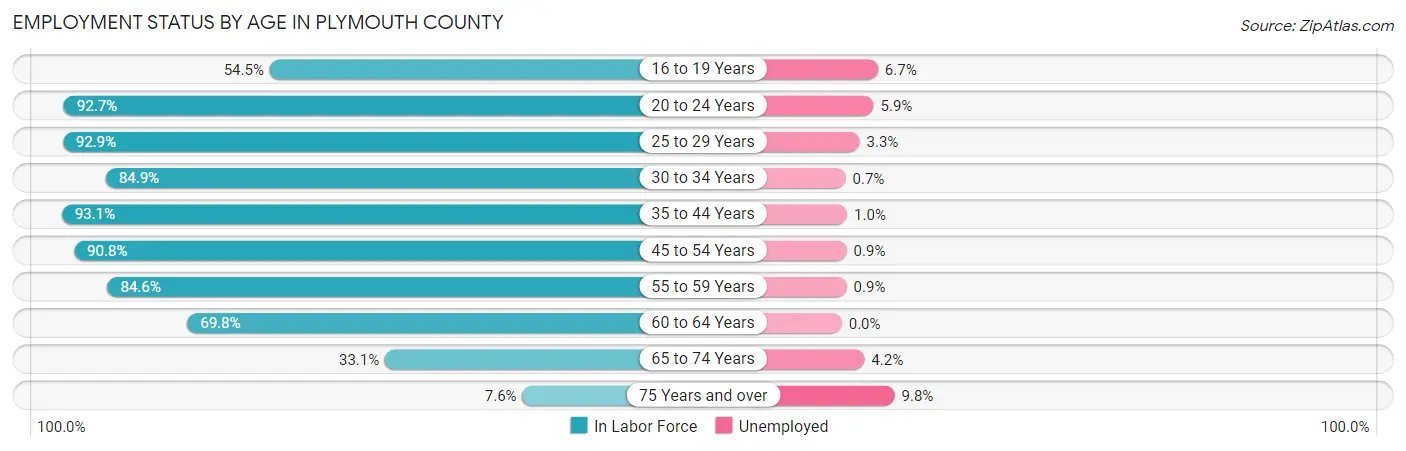
| Age Bracket | In Labor Force | Unemployed |
| 16 to 19 Years | 709 (54.5%) | 48 (6.7%) |
| 20 to 24 Years | 1,329 (92.7%) | 78 (5.9%) |
| 25 to 29 Years | 1,223 (92.9%) | 40 (3.3%) |
| 30 to 34 Years | 1,127 (84.9%) | 8 (0.7%) |
| 35 to 44 Years | 2,941 (93.1%) | 29 (1.0%) |
| 45 to 54 Years | 2,801 (90.8%) | 25 (0.9%) |
| 55 to 59 Years | 1,376 (84.6%) | 12 (0.9%) |
| 60 to 64 Years | 1,351 (69.8%) | 0 (0.0%) |
| 65 to 74 Years | 899 (33.1%) | 38 (4.2%) |
| 75 Years and over | 162 (7.6%) | 16 (9.8%) |
| Total | 13,926 (69.5%) | 292 (2.1%) |
Employment Status by Educational Attainment in Plymouth County
According to labor force statistics for Plymouth County, 86.9% of individuals (10,818) out of the total population between 25 and 64 years of age (12,449) are in the labor force, with 1.1% or 119 of them being unemployed. The group with the highest labor force participation rate are those with the educational attainment of bachelor's degree or higher, with 93.2% or 3,008 individuals in the labor force. Within the labor force, individuals with less than high school education have the highest percentage of unemployment, with 2.9% or 15 of them being unemployed.
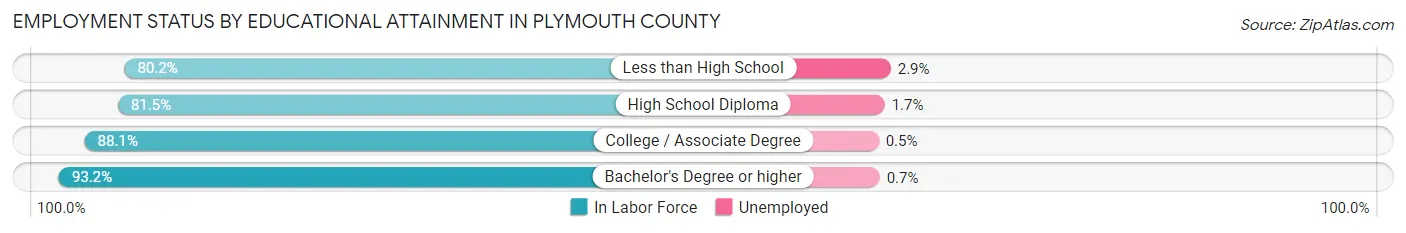
| Educational Attainment | In Labor Force | Unemployed |
| Less than High School | 509 (80.2%) | 18 (2.9%) |
| High School Diploma | 3,263 (81.5%) | 68 (1.7%) |
| College / Associate Degree | 4,037 (88.1%) | 23 (0.5%) |
| Bachelor's Degree or higher | 3,008 (93.2%) | 23 (0.7%) |
| Total | 10,818 (86.9%) | 137 (1.1%) |
Employment Occupations by Sex in Plymouth County
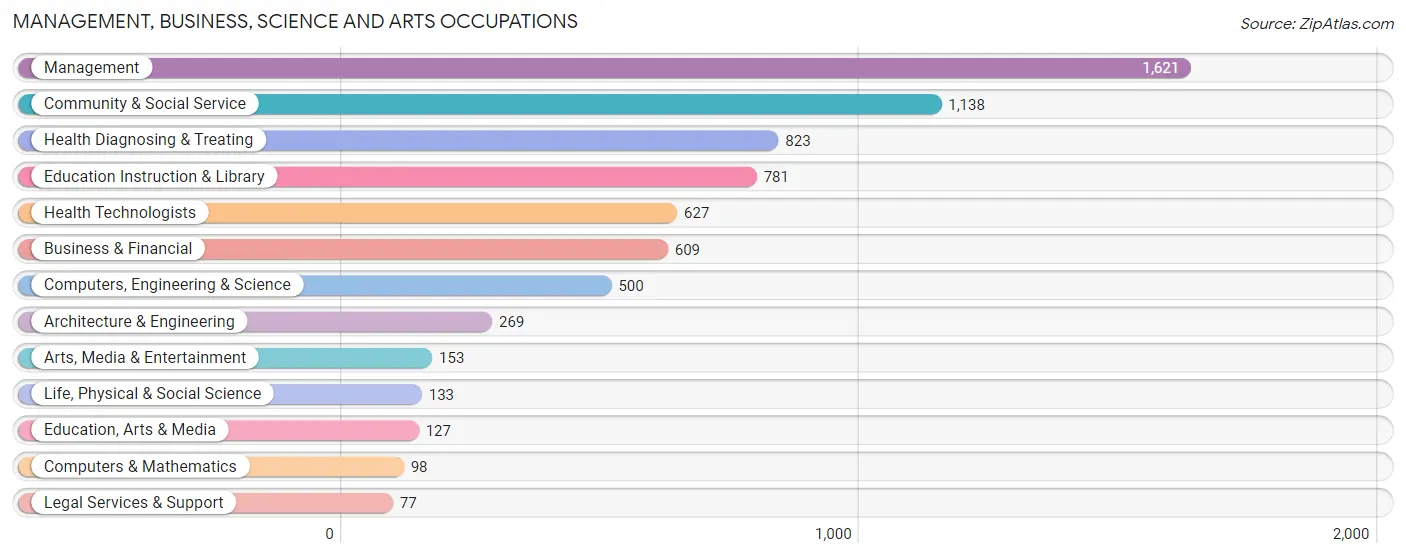
Management, Business, Science and Arts Occupations
The most common Management, Business, Science and Arts occupations in Plymouth County are Management (1,621 | 11.9%), Community & Social Service (1,138 | 8.4%), Health Diagnosing & Treating (823 | 6.1%), Education Instruction & Library (781 | 5.8%), and Health Technologists (627 | 4.6%).
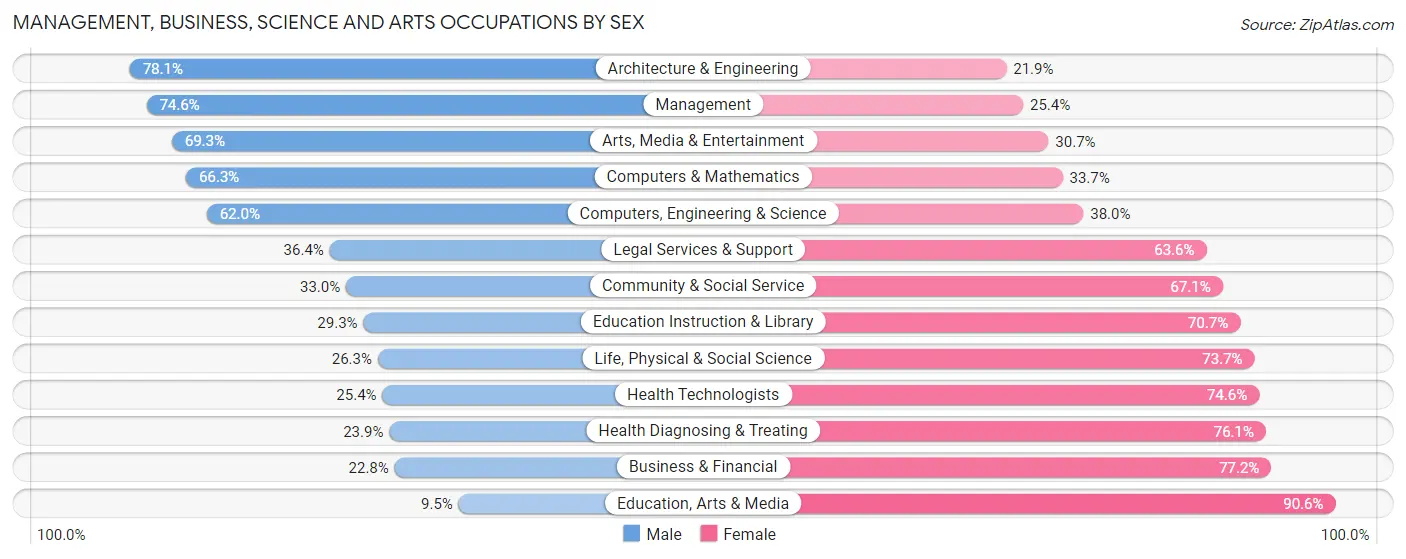
Management, Business, Science and Arts Occupations by Sex
Within the Management, Business, Science and Arts occupations in Plymouth County, the most male-oriented occupations are Architecture & Engineering (78.1%), Management (74.6%), and Arts, Media & Entertainment (69.3%), while the most female-oriented occupations are Education, Arts & Media (90.5%), Business & Financial (77.2%), and Health Diagnosing & Treating (76.1%).
| Occupation | Male | Female |
| Management | 1,209 (74.6%) | 412 (25.4%) |
| Business & Financial | 139 (22.8%) | 470 (77.2%) |
| Computers, Engineering & Science | 310 (62.0%) | 190 (38.0%) |
| Computers & Mathematics | 65 (66.3%) | 33 (33.7%) |
| Architecture & Engineering | 210 (78.1%) | 59 (21.9%) |
| Life, Physical & Social Science | 35 (26.3%) | 98 (73.7%) |
| Community & Social Service | 375 (33.0%) | 763 (67.0%) |
| Education, Arts & Media | 12 (9.5%) | 115 (90.5%) |
| Legal Services & Support | 28 (36.4%) | 49 (63.6%) |
| Education Instruction & Library | 229 (29.3%) | 552 (70.7%) |
| Arts, Media & Entertainment | 106 (69.3%) | 47 (30.7%) |
| Health Diagnosing & Treating | 197 (23.9%) | 626 (76.1%) |
| Health Technologists | 159 (25.4%) | 468 (74.6%) |
| Total (Category) | 2,230 (47.5%) | 2,461 (52.5%) |
| Total (Overall) | 7,431 (54.7%) | 6,148 (45.3%) |
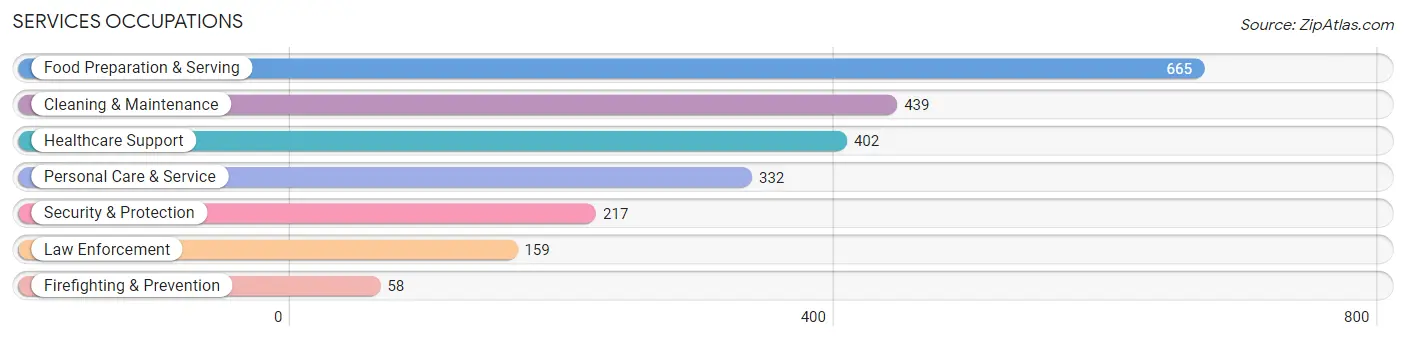
Services Occupations
The most common Services occupations in Plymouth County are Food Preparation & Serving (665 | 4.9%), Cleaning & Maintenance (439 | 3.2%), Healthcare Support (402 | 3.0%), Personal Care & Service (332 | 2.4%), and Security & Protection (217 | 1.6%).
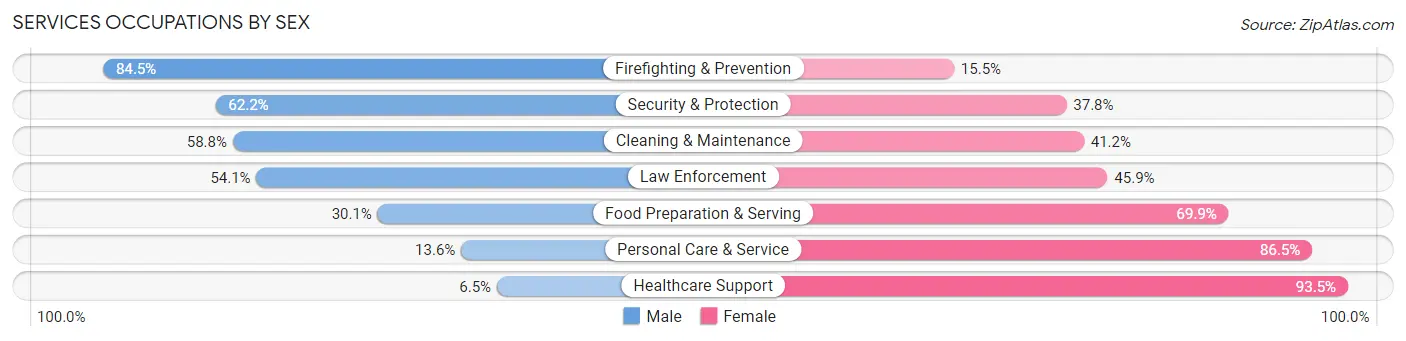
Services Occupations by Sex
Within the Services occupations in Plymouth County, the most male-oriented occupations are Firefighting & Prevention (84.5%), Security & Protection (62.2%), and Cleaning & Maintenance (58.8%), while the most female-oriented occupations are Healthcare Support (93.5%), Personal Care & Service (86.5%), and Food Preparation & Serving (69.9%).
| Occupation | Male | Female |
| Healthcare Support | 26 (6.5%) | 376 (93.5%) |
| Security & Protection | 135 (62.2%) | 82 (37.8%) |
| Firefighting & Prevention | 49 (84.5%) | 9 (15.5%) |
| Law Enforcement | 86 (54.1%) | 73 (45.9%) |
| Food Preparation & Serving | 200 (30.1%) | 465 (69.9%) |
| Cleaning & Maintenance | 258 (58.8%) | 181 (41.2%) |
| Personal Care & Service | 45 (13.6%) | 287 (86.5%) |
| Total (Category) | 664 (32.3%) | 1,391 (67.7%) |
| Total (Overall) | 7,431 (54.7%) | 6,148 (45.3%) |
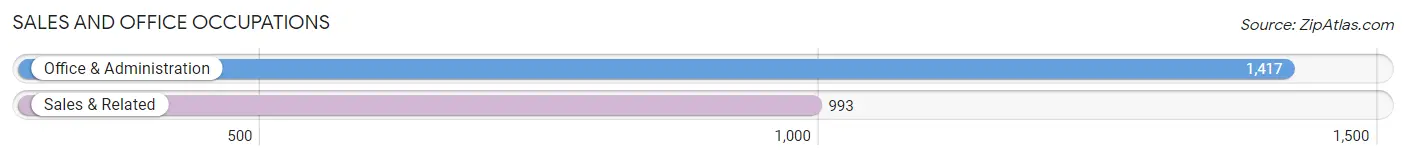
Sales and Office Occupations
The most common Sales and Office occupations in Plymouth County are Office & Administration (1,417 | 10.4%), and Sales & Related (993 | 7.3%).
Sales and Office Occupations by Sex
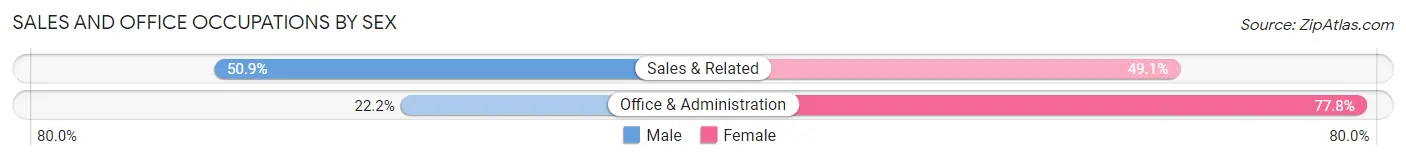
| Occupation | Male | Female |
| Sales & Related | 505 (50.9%) | 488 (49.1%) |
| Office & Administration | 314 (22.2%) | 1,103 (77.8%) |
| Total (Category) | 819 (34.0%) | 1,591 (66.0%) |
| Total (Overall) | 7,431 (54.7%) | 6,148 (45.3%) |
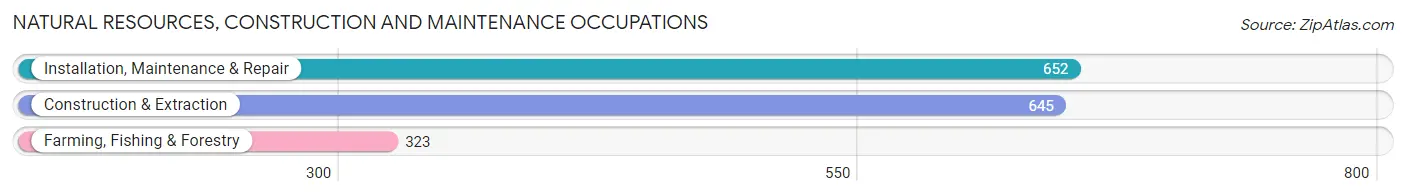
Natural Resources, Construction and Maintenance Occupations
The most common Natural Resources, Construction and Maintenance occupations in Plymouth County are Installation, Maintenance & Repair (652 | 4.8%), Construction & Extraction (645 | 4.8%), and Farming, Fishing & Forestry (323 | 2.4%).
Natural Resources, Construction and Maintenance Occupations by Sex
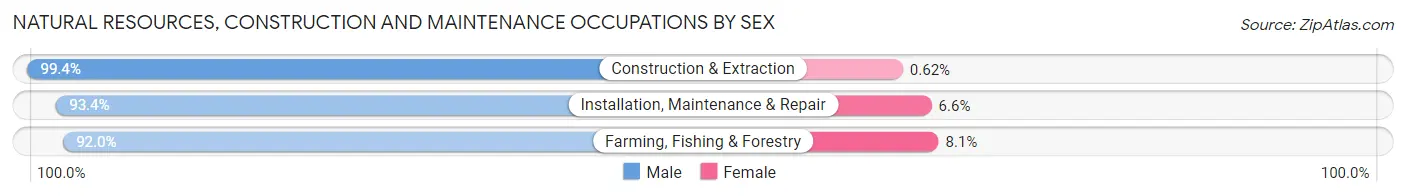
| Occupation | Male | Female |
| Farming, Fishing & Forestry | 297 (91.9%) | 26 (8.1%) |
| Construction & Extraction | 641 (99.4%) | 4 (0.6%) |
| Installation, Maintenance & Repair | 609 (93.4%) | 43 (6.6%) |
| Total (Category) | 1,547 (95.5%) | 73 (4.5%) |
| Total (Overall) | 7,431 (54.7%) | 6,148 (45.3%) |
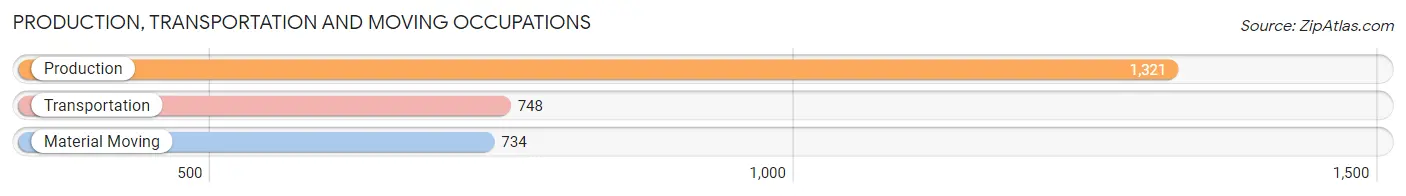
Production, Transportation and Moving Occupations
The most common Production, Transportation and Moving occupations in Plymouth County are Production (1,321 | 9.7%), Transportation (748 | 5.5%), and Material Moving (734 | 5.4%).
Production, Transportation and Moving Occupations by Sex
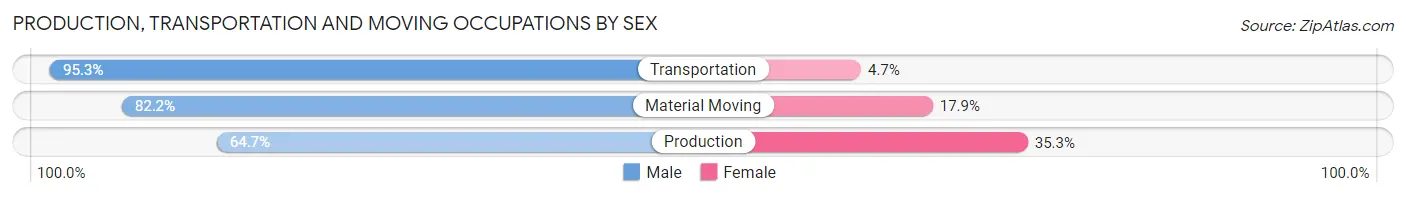
| Occupation | Male | Female |
| Production | 855 (64.7%) | 466 (35.3%) |
| Transportation | 713 (95.3%) | 35 (4.7%) |
| Material Moving | 603 (82.2%) | 131 (17.8%) |
| Total (Category) | 2,171 (77.4%) | 632 (22.6%) |
| Total (Overall) | 7,431 (54.7%) | 6,148 (45.3%) |
Employment Industries by Sex in Plymouth County
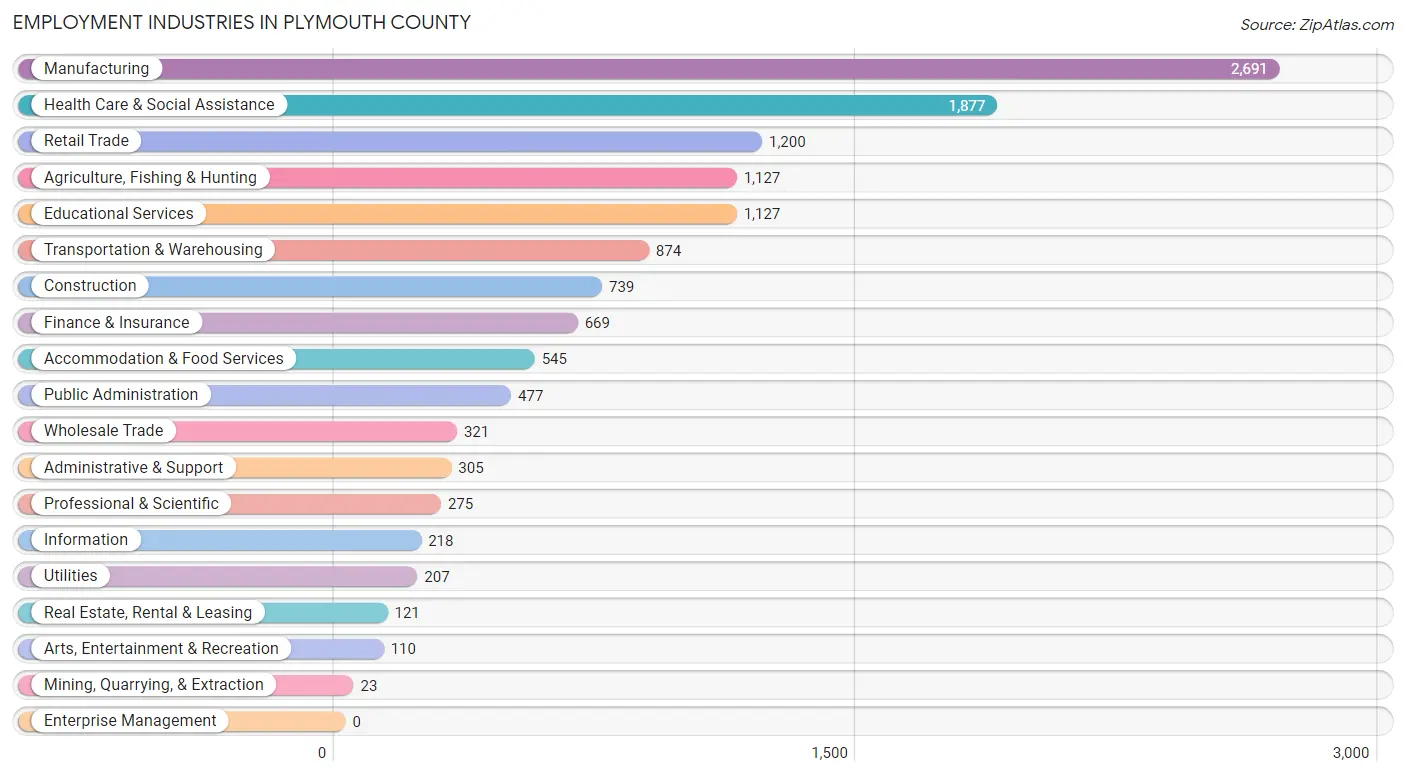
Employment Industries in Plymouth County
The major employment industries in Plymouth County include Manufacturing (2,691 | 19.8%), Health Care & Social Assistance (1,877 | 13.8%), Retail Trade (1,200 | 8.8%), Agriculture, Fishing & Hunting (1,127 | 8.3%), and Educational Services (1,127 | 8.3%).
Employment Industries by Sex in Plymouth County
The Plymouth County industries that see more men than women are Mining, Quarrying, & Extraction (100.0%), Construction (93.5%), and Agriculture, Fishing & Hunting (92.9%), whereas the industries that tend to have a higher number of women are Health Care & Social Assistance (88.0%), Real Estate, Rental & Leasing (82.6%), and Finance & Insurance (69.5%).
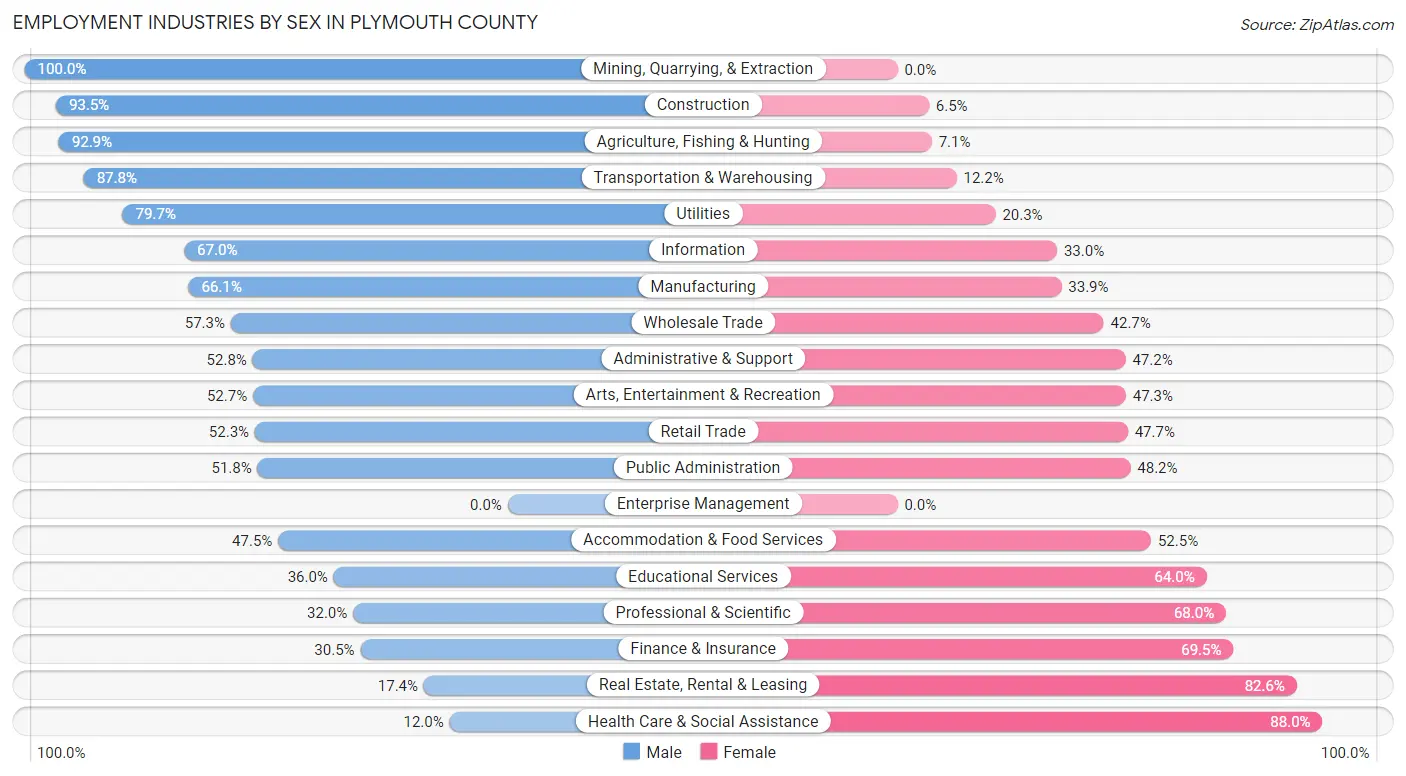
| Industry | Male | Female |
| Agriculture, Fishing & Hunting | 1,047 (92.9%) | 80 (7.1%) |
| Mining, Quarrying, & Extraction | 23 (100.0%) | 0 (0.0%) |
| Construction | 691 (93.5%) | 48 (6.5%) |
| Manufacturing | 1,778 (66.1%) | 913 (33.9%) |
| Wholesale Trade | 184 (57.3%) | 137 (42.7%) |
| Retail Trade | 628 (52.3%) | 572 (47.7%) |
| Transportation & Warehousing | 767 (87.8%) | 107 (12.2%) |
| Utilities | 165 (79.7%) | 42 (20.3%) |
| Information | 146 (67.0%) | 72 (33.0%) |
| Finance & Insurance | 204 (30.5%) | 465 (69.5%) |
| Real Estate, Rental & Leasing | 21 (17.4%) | 100 (82.6%) |
| Professional & Scientific | 88 (32.0%) | 187 (68.0%) |
| Enterprise Management | 0 (0.0%) | 0 (0.0%) |
| Administrative & Support | 161 (52.8%) | 144 (47.2%) |
| Educational Services | 406 (36.0%) | 721 (64.0%) |
| Health Care & Social Assistance | 226 (12.0%) | 1,651 (88.0%) |
| Arts, Entertainment & Recreation | 58 (52.7%) | 52 (47.3%) |
| Accommodation & Food Services | 259 (47.5%) | 286 (52.5%) |
| Public Administration | 247 (51.8%) | 230 (48.2%) |
| Total | 7,431 (54.7%) | 6,148 (45.3%) |
Education in Plymouth County
School Enrollment in Plymouth County
The most common levels of schooling among the 6,207 students in Plymouth County are high school (1,575 | 25.4%), middle school (1,448 | 23.3%), and elementary school (1,186 | 19.1%).
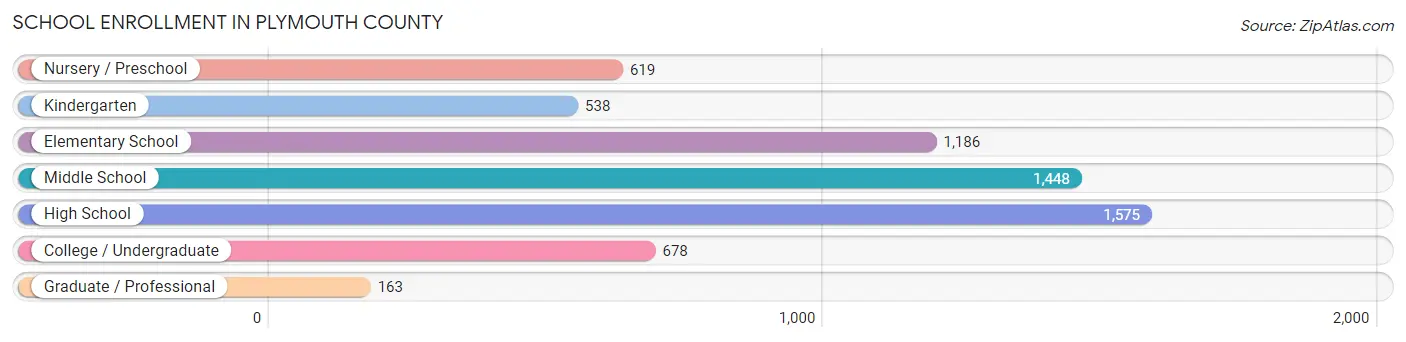
| School Level | # Students | % Students |
| Nursery / Preschool | 619 | 10.0% |
| Kindergarten | 538 | 8.7% |
| Elementary School | 1,186 | 19.1% |
| Middle School | 1,448 | 23.3% |
| High School | 1,575 | 25.4% |
| College / Undergraduate | 678 | 10.9% |
| Graduate / Professional | 163 | 2.6% |
| Total | 6,207 | 100.0% |
School Enrollment by Age by Funding Source in Plymouth County
Out of a total of 6,207 students who are enrolled in schools in Plymouth County, 925 (14.9%) attend a private institution, while the remaining 5,282 (85.1%) are enrolled in public schools. The age group of 5 to 9 year old has the highest likelihood of being enrolled in private schools, with 392 (22.2% in the age bracket) enrolled. Conversely, the age group of 18 to 19 year olds has the lowest likelihood of being enrolled in a private school, with 408 (95.6% in the age bracket) attending a public institution.
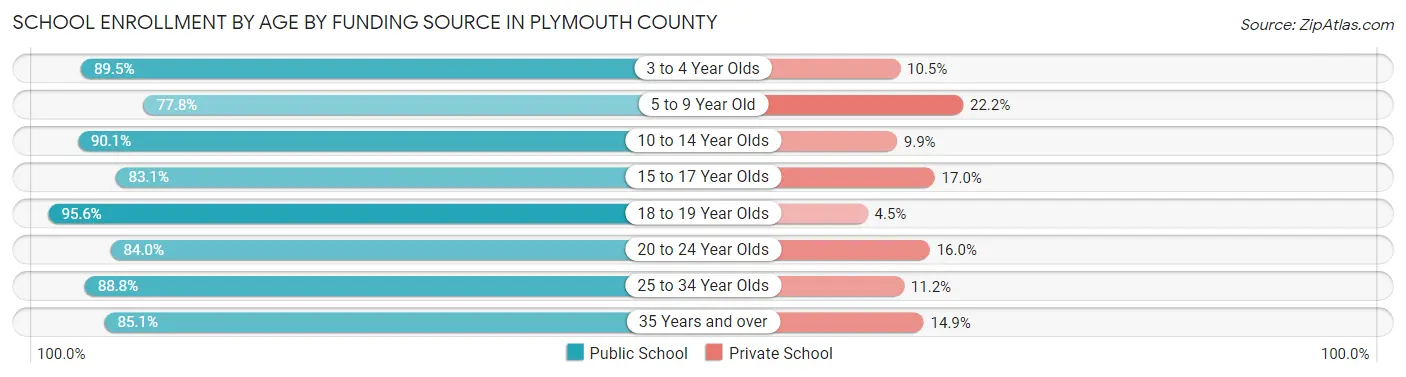
| Age Bracket | Public School | Private School |
| 3 to 4 Year Olds | 349 (89.5%) | 41 (10.5%) |
| 5 to 9 Year Old | 1,371 (77.8%) | 392 (22.2%) |
| 10 to 14 Year Olds | 1,581 (90.1%) | 174 (9.9%) |
| 15 to 17 Year Olds | 941 (83.1%) | 192 (17.0%) |
| 18 to 19 Year Olds | 408 (95.6%) | 19 (4.4%) |
| 20 to 24 Year Olds | 330 (84.0%) | 63 (16.0%) |
| 25 to 34 Year Olds | 182 (88.8%) | 23 (11.2%) |
| 35 Years and over | 120 (85.1%) | 21 (14.9%) |
| Total | 5,282 (85.1%) | 925 (14.9%) |
Educational Attainment by Field of Study in Plymouth County
Business (947 | 21.2%), education (862 | 19.3%), science & technology (711 | 15.9%), bio, nature & agricultural (383 | 8.6%), and arts & humanities (339 | 7.6%) are the most common fields of study among 4,462 individuals in Plymouth County who have obtained a bachelor's degree or higher.
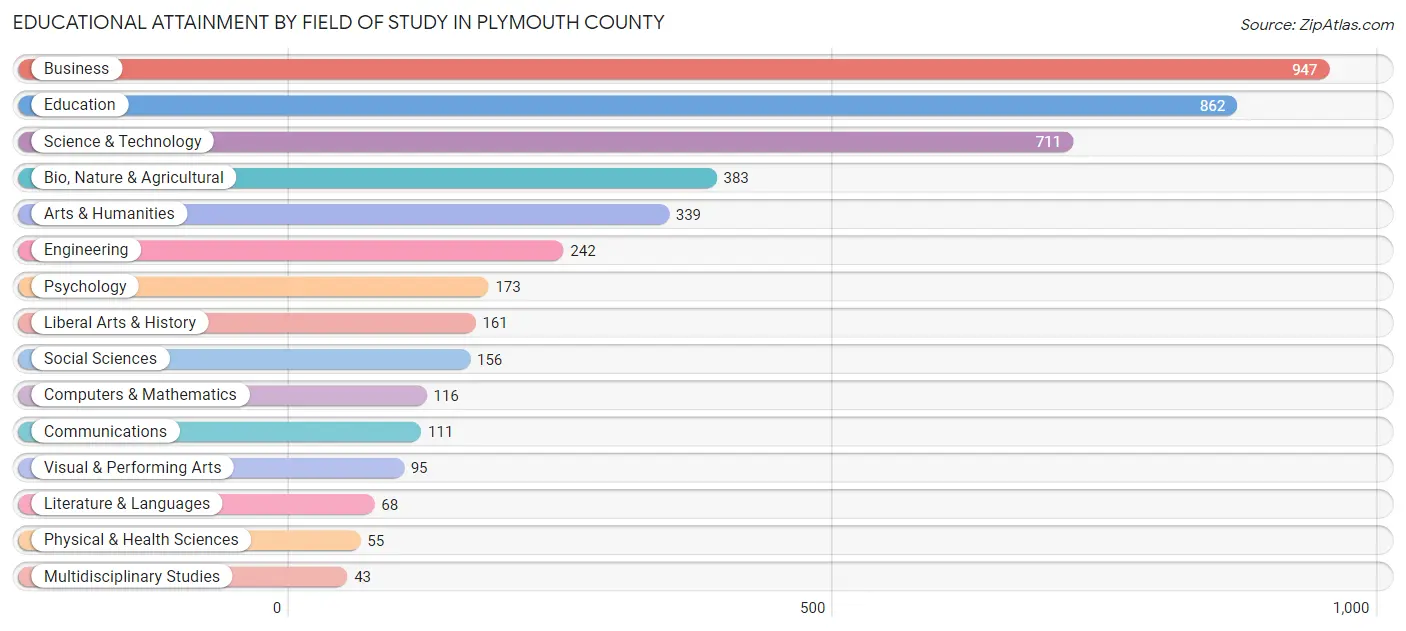
| Field of Study | # Graduates | % Graduates |
| Computers & Mathematics | 116 | 2.6% |
| Bio, Nature & Agricultural | 383 | 8.6% |
| Physical & Health Sciences | 55 | 1.2% |
| Psychology | 173 | 3.9% |
| Social Sciences | 156 | 3.5% |
| Engineering | 242 | 5.4% |
| Multidisciplinary Studies | 43 | 1.0% |
| Science & Technology | 711 | 15.9% |
| Business | 947 | 21.2% |
| Education | 862 | 19.3% |
| Literature & Languages | 68 | 1.5% |
| Liberal Arts & History | 161 | 3.6% |
| Visual & Performing Arts | 95 | 2.1% |
| Communications | 111 | 2.5% |
| Arts & Humanities | 339 | 7.6% |
| Total | 4,462 | 100.0% |
Transportation & Commute in Plymouth County
Vehicle Availability by Sex in Plymouth County
The most prevalent vehicle ownership categories in Plymouth County are males with 2 vehicles (2,763, accounting for 37.3%) and females with 2 vehicles (2,365, making up 45.9%).
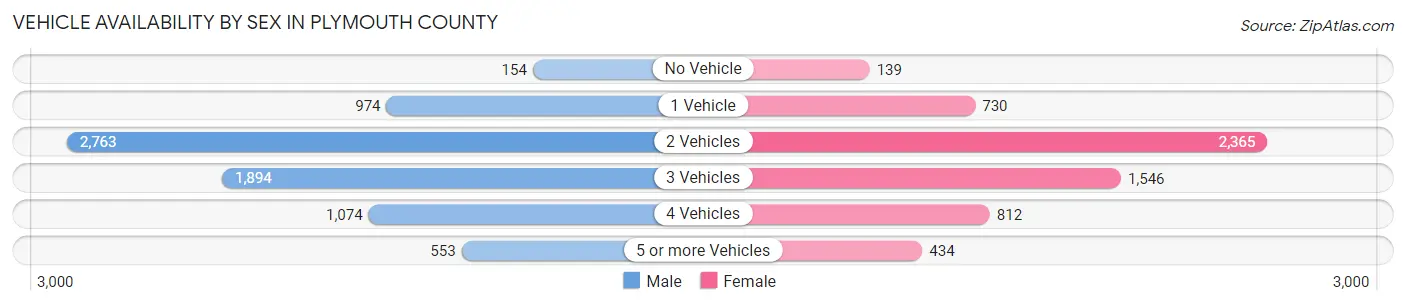
| Vehicles Available | Male | Female |
| No Vehicle | 154 (2.1%) | 139 (2.3%) |
| 1 Vehicle | 974 (13.1%) | 730 (12.1%) |
| 2 Vehicles | 2,763 (37.3%) | 2,365 (39.3%) |
| 3 Vehicles | 1,894 (25.6%) | 1,546 (25.7%) |
| 4 Vehicles | 1,074 (14.5%) | 812 (13.5%) |
| 5 or more Vehicles | 553 (7.5%) | 434 (7.2%) |
| Total | 7,412 (100.0%) | 6,026 (100.0%) |
Commute Time in Plymouth County
The most frequently occuring commute durations in Plymouth County are 5 to 9 minutes (2,660 commuters, 21.7%), 10 to 14 minutes (1,922 commuters, 15.7%), and 20 to 24 minutes (1,454 commuters, 11.8%).
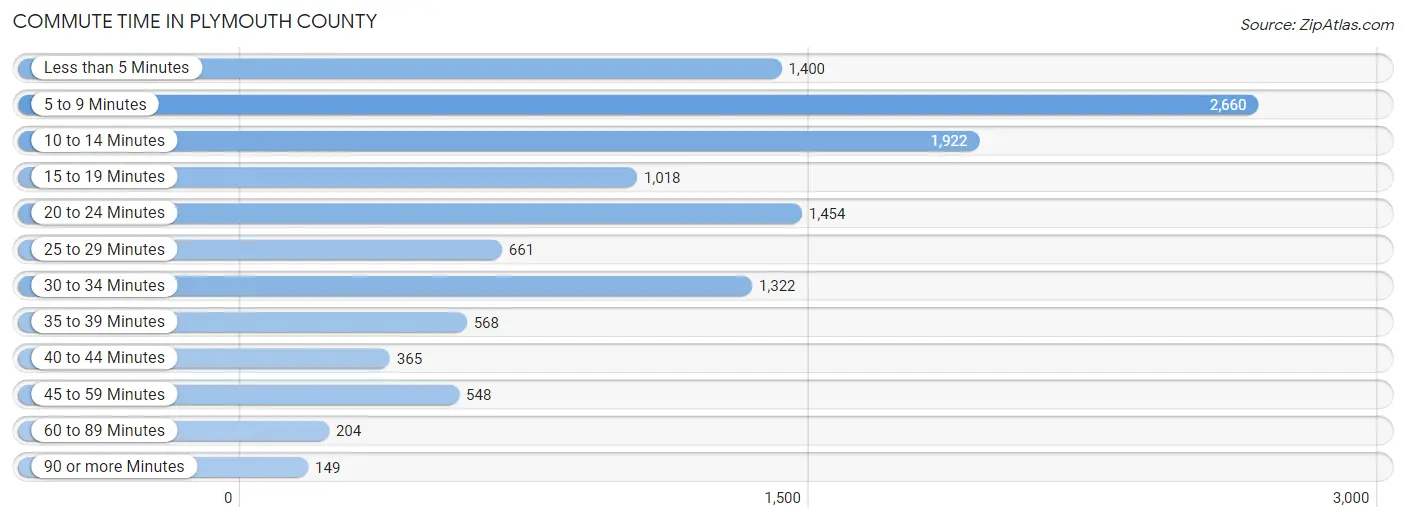
| Commute Time | # Commuters | % Commuters |
| Less than 5 Minutes | 1,400 | 11.4% |
| 5 to 9 Minutes | 2,660 | 21.7% |
| 10 to 14 Minutes | 1,922 | 15.7% |
| 15 to 19 Minutes | 1,018 | 8.3% |
| 20 to 24 Minutes | 1,454 | 11.8% |
| 25 to 29 Minutes | 661 | 5.4% |
| 30 to 34 Minutes | 1,322 | 10.8% |
| 35 to 39 Minutes | 568 | 4.6% |
| 40 to 44 Minutes | 365 | 3.0% |
| 45 to 59 Minutes | 548 | 4.5% |
| 60 to 89 Minutes | 204 | 1.7% |
| 90 or more Minutes | 149 | 1.2% |
Commute Time by Sex in Plymouth County
The most common commute times in Plymouth County are 5 to 9 minutes (1,564 commuters, 23.1%) for males and 5 to 9 minutes (1,096 commuters, 19.9%) for females.
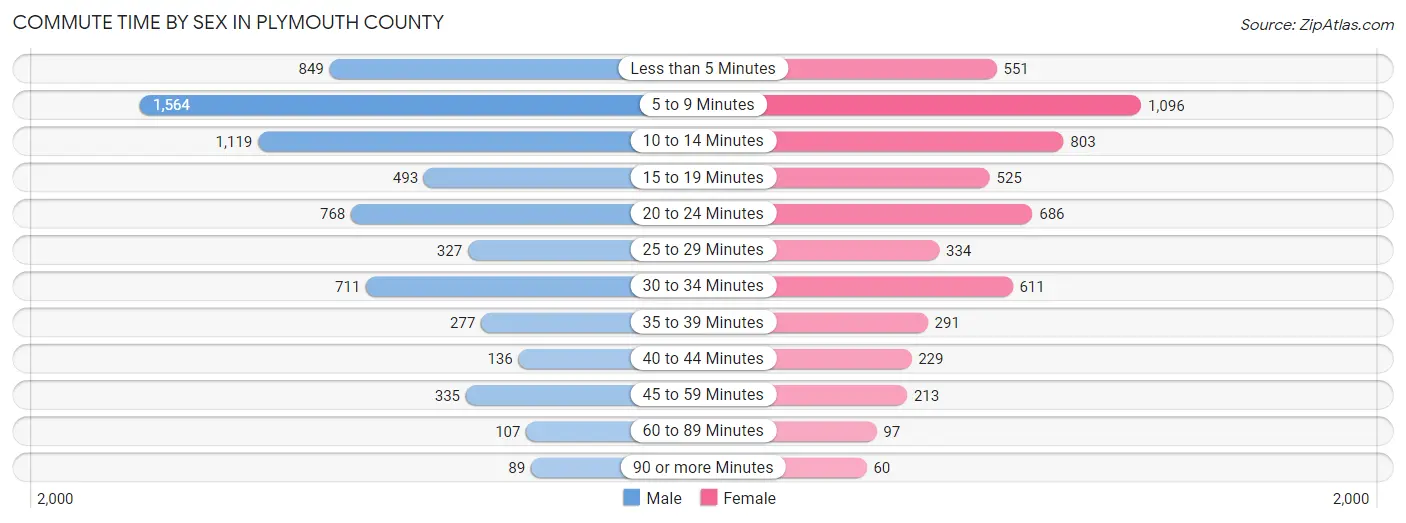
| Commute Time | Male | Female |
| Less than 5 Minutes | 849 (12.5%) | 551 (10.0%) |
| 5 to 9 Minutes | 1,564 (23.1%) | 1,096 (19.9%) |
| 10 to 14 Minutes | 1,119 (16.5%) | 803 (14.6%) |
| 15 to 19 Minutes | 493 (7.3%) | 525 (9.6%) |
| 20 to 24 Minutes | 768 (11.3%) | 686 (12.5%) |
| 25 to 29 Minutes | 327 (4.8%) | 334 (6.1%) |
| 30 to 34 Minutes | 711 (10.5%) | 611 (11.1%) |
| 35 to 39 Minutes | 277 (4.1%) | 291 (5.3%) |
| 40 to 44 Minutes | 136 (2.0%) | 229 (4.2%) |
| 45 to 59 Minutes | 335 (4.9%) | 213 (3.9%) |
| 60 to 89 Minutes | 107 (1.6%) | 97 (1.8%) |
| 90 or more Minutes | 89 (1.3%) | 60 (1.1%) |
Time of Departure to Work by Sex in Plymouth County
The most frequent times of departure to work in Plymouth County are 7:00 AM to 7:29 AM (1,109, 16.4%) for males and 7:00 AM to 7:29 AM (1,132, 20.6%) for females.
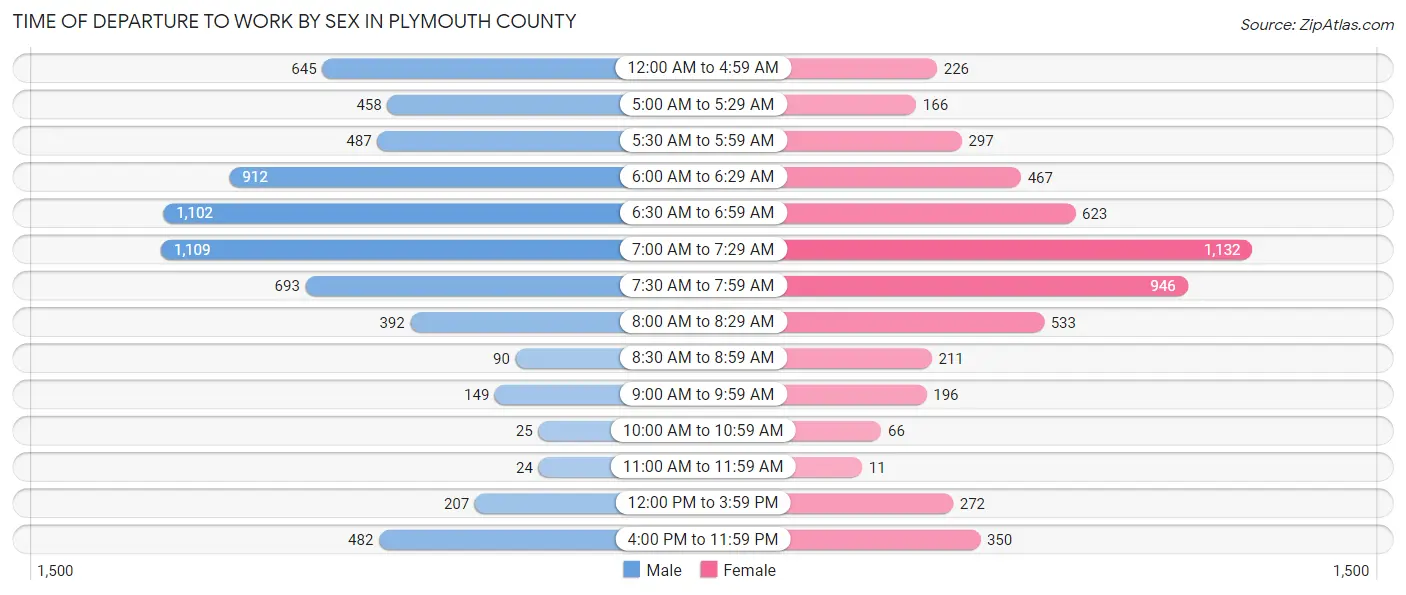
| Time of Departure | Male | Female |
| 12:00 AM to 4:59 AM | 645 (9.5%) | 226 (4.1%) |
| 5:00 AM to 5:29 AM | 458 (6.8%) | 166 (3.0%) |
| 5:30 AM to 5:59 AM | 487 (7.2%) | 297 (5.4%) |
| 6:00 AM to 6:29 AM | 912 (13.5%) | 467 (8.5%) |
| 6:30 AM to 6:59 AM | 1,102 (16.3%) | 623 (11.3%) |
| 7:00 AM to 7:29 AM | 1,109 (16.4%) | 1,132 (20.6%) |
| 7:30 AM to 7:59 AM | 693 (10.2%) | 946 (17.2%) |
| 8:00 AM to 8:29 AM | 392 (5.8%) | 533 (9.7%) |
| 8:30 AM to 8:59 AM | 90 (1.3%) | 211 (3.8%) |
| 9:00 AM to 9:59 AM | 149 (2.2%) | 196 (3.6%) |
| 10:00 AM to 10:59 AM | 25 (0.4%) | 66 (1.2%) |
| 11:00 AM to 11:59 AM | 24 (0.4%) | 11 (0.2%) |
| 12:00 PM to 3:59 PM | 207 (3.1%) | 272 (5.0%) |
| 4:00 PM to 11:59 PM | 482 (7.1%) | 350 (6.4%) |
| Total | 6,775 (100.0%) | 5,496 (100.0%) |
Housing Occupancy in Plymouth County
Occupancy by Ownership in Plymouth County
Of the total 10,214 dwellings in Plymouth County, owner-occupied units account for 7,694 (75.3%), while renter-occupied units make up 2,520 (24.7%).
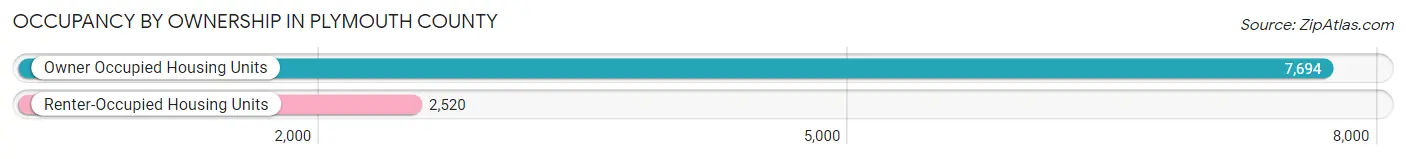
| Occupancy | # Housing Units | % Housing Units |
| Owner Occupied Housing Units | 7,694 | 75.3% |
| Renter-Occupied Housing Units | 2,520 | 24.7% |
| Total Occupied Housing Units | 10,214 | 100.0% |
Occupancy by Household Size in Plymouth County
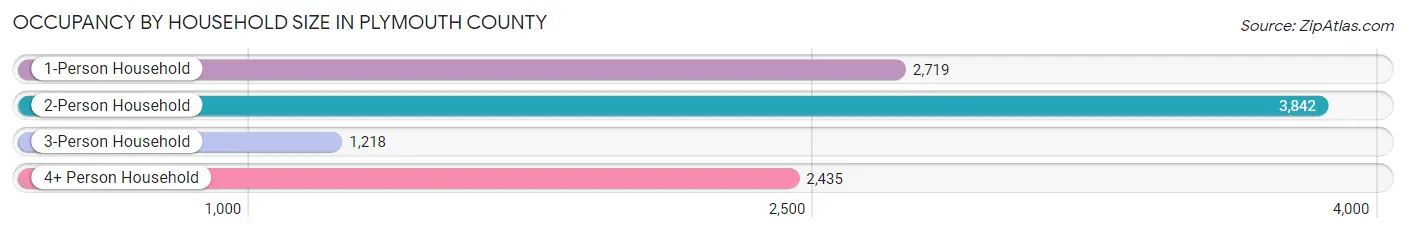
| Household Size | # Housing Units | % Housing Units |
| 1-Person Household | 2,719 | 26.6% |
| 2-Person Household | 3,842 | 37.6% |
| 3-Person Household | 1,218 | 11.9% |
| 4+ Person Household | 2,435 | 23.8% |
| Total Housing Units | 10,214 | 100.0% |
Occupancy by Ownership by Household Size in Plymouth County
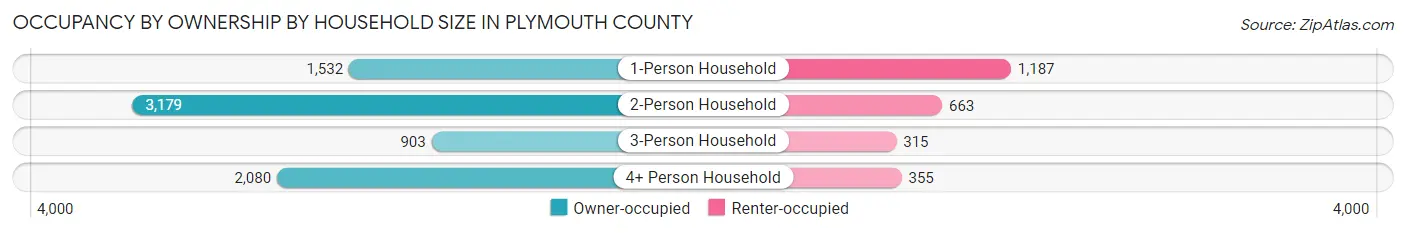
| Household Size | Owner-occupied | Renter-occupied |
| 1-Person Household | 1,532 (56.3%) | 1,187 (43.7%) |
| 2-Person Household | 3,179 (82.7%) | 663 (17.3%) |
| 3-Person Household | 903 (74.1%) | 315 (25.9%) |
| 4+ Person Household | 2,080 (85.4%) | 355 (14.6%) |
| Total Housing Units | 7,694 (75.3%) | 2,520 (24.7%) |
Occupancy by Educational Attainment in Plymouth County
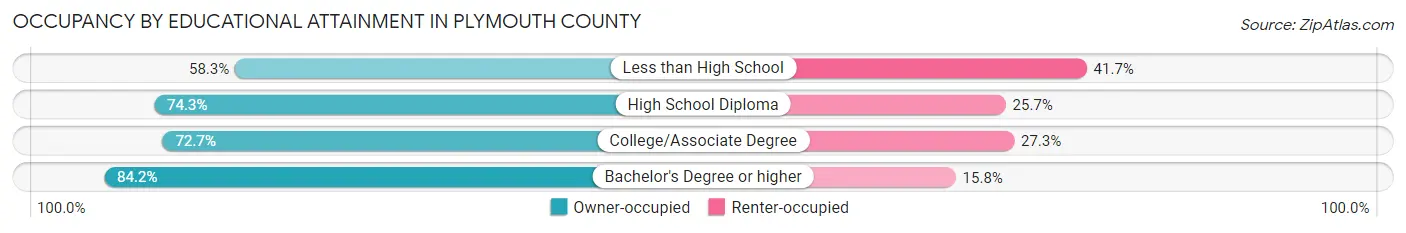
| Household Size | Owner-occupied | Renter-occupied |
| Less than High School | 303 (58.3%) | 217 (41.7%) |
| High School Diploma | 2,513 (74.3%) | 868 (25.7%) |
| College/Associate Degree | 2,761 (72.7%) | 1,039 (27.3%) |
| Bachelor's Degree or higher | 2,117 (84.2%) | 396 (15.8%) |
Occupancy by Age of Householder in Plymouth County
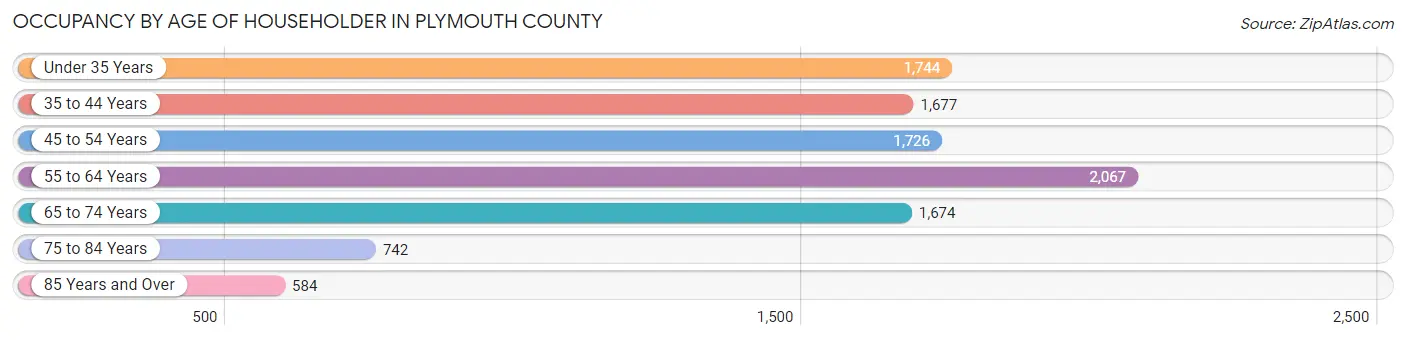
| Age Bracket | # Households | % Households |
| Under 35 Years | 1,744 | 17.1% |
| 35 to 44 Years | 1,677 | 16.4% |
| 45 to 54 Years | 1,726 | 16.9% |
| 55 to 64 Years | 2,067 | 20.2% |
| 65 to 74 Years | 1,674 | 16.4% |
| 75 to 84 Years | 742 | 7.3% |
| 85 Years and Over | 584 | 5.7% |
| Total | 10,214 | 100.0% |
Housing Finances in Plymouth County
Median Income by Occupancy in Plymouth County
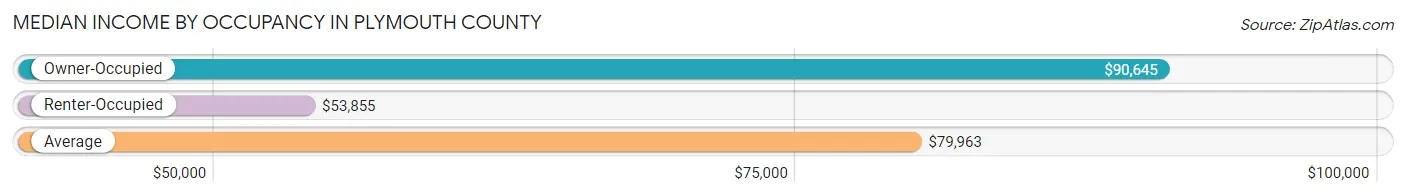
| Occupancy Type | # Households | Median Income |
| Owner-Occupied | 7,694 (75.3%) | $90,645 |
| Renter-Occupied | 2,520 (24.7%) | $53,855 |
| Average | 10,214 (100.0%) | $79,963 |
Occupancy by Householder Income Bracket in Plymouth County
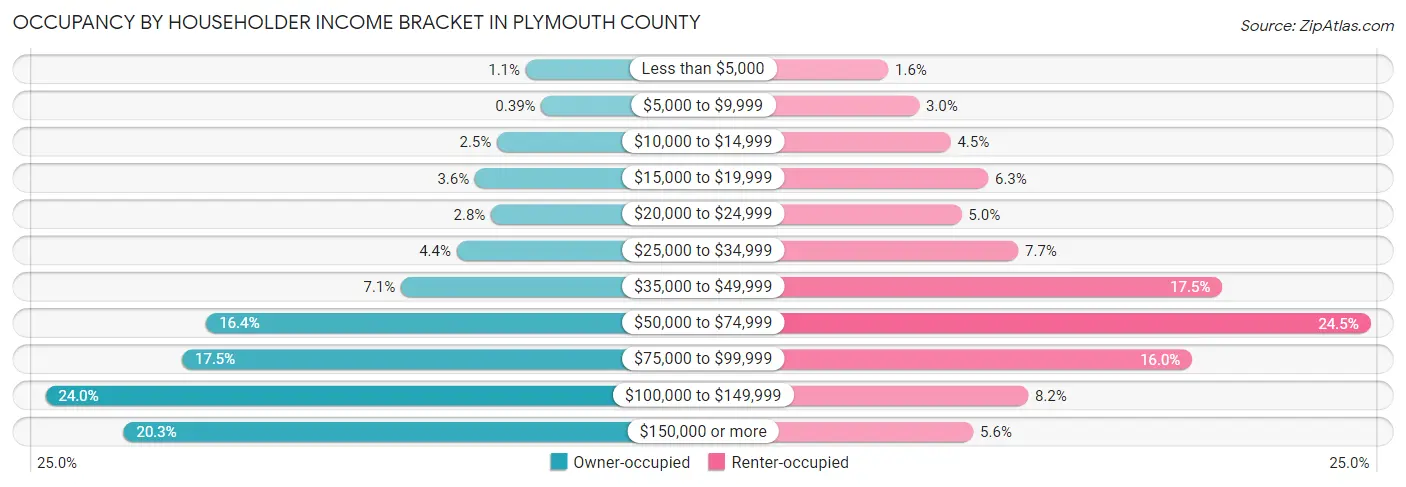
| Income Bracket | Owner-occupied | Renter-occupied |
| Less than $5,000 | 87 (1.1%) | 39 (1.5%) |
| $5,000 to $9,999 | 30 (0.4%) | 76 (3.0%) |
| $10,000 to $14,999 | 192 (2.5%) | 114 (4.5%) |
| $15,000 to $19,999 | 273 (3.5%) | 159 (6.3%) |
| $20,000 to $24,999 | 214 (2.8%) | 127 (5.0%) |
| $25,000 to $34,999 | 340 (4.4%) | 195 (7.7%) |
| $35,000 to $49,999 | 544 (7.1%) | 440 (17.5%) |
| $50,000 to $74,999 | 1,258 (16.4%) | 618 (24.5%) |
| $75,000 to $99,999 | 1,347 (17.5%) | 404 (16.0%) |
| $100,000 to $149,999 | 1,847 (24.0%) | 207 (8.2%) |
| $150,000 or more | 1,562 (20.3%) | 141 (5.6%) |
| Total | 7,694 (100.0%) | 2,520 (100.0%) |
Monthly Housing Cost Tiers in Plymouth County
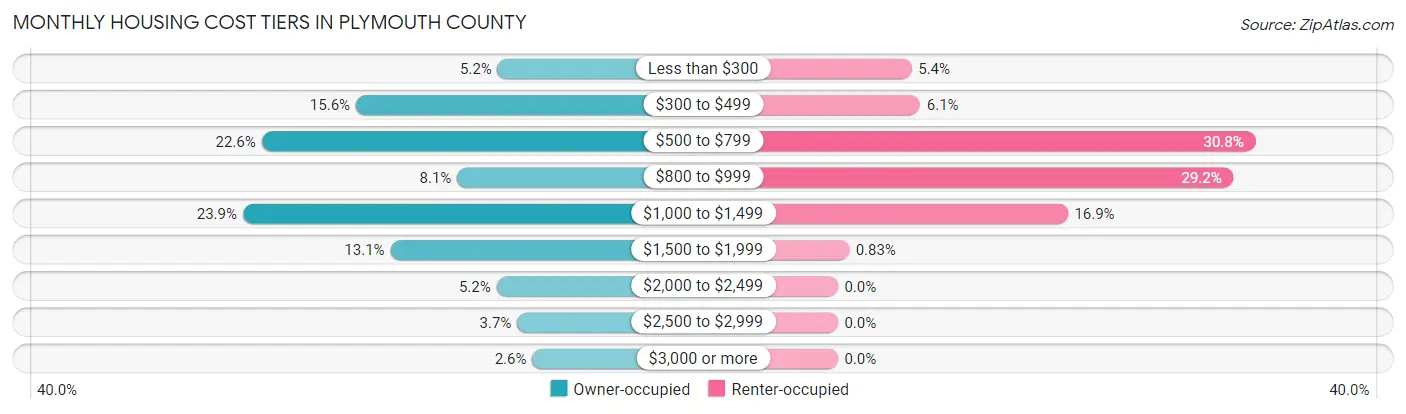
| Monthly Cost | Owner-occupied | Renter-occupied |
| Less than $300 | 397 (5.2%) | 137 (5.4%) |
| $300 to $499 | 1,200 (15.6%) | 153 (6.1%) |
| $500 to $799 | 1,735 (22.6%) | 776 (30.8%) |
| $800 to $999 | 626 (8.1%) | 735 (29.2%) |
| $1,000 to $1,499 | 1,841 (23.9%) | 427 (16.9%) |
| $1,500 to $1,999 | 1,005 (13.1%) | 21 (0.8%) |
| $2,000 to $2,499 | 403 (5.2%) | 0 (0.0%) |
| $2,500 to $2,999 | 286 (3.7%) | 0 (0.0%) |
| $3,000 or more | 201 (2.6%) | 0 (0.0%) |
| Total | 7,694 (100.0%) | 2,520 (100.0%) |
Physical Housing Characteristics in Plymouth County
Housing Structures in Plymouth County
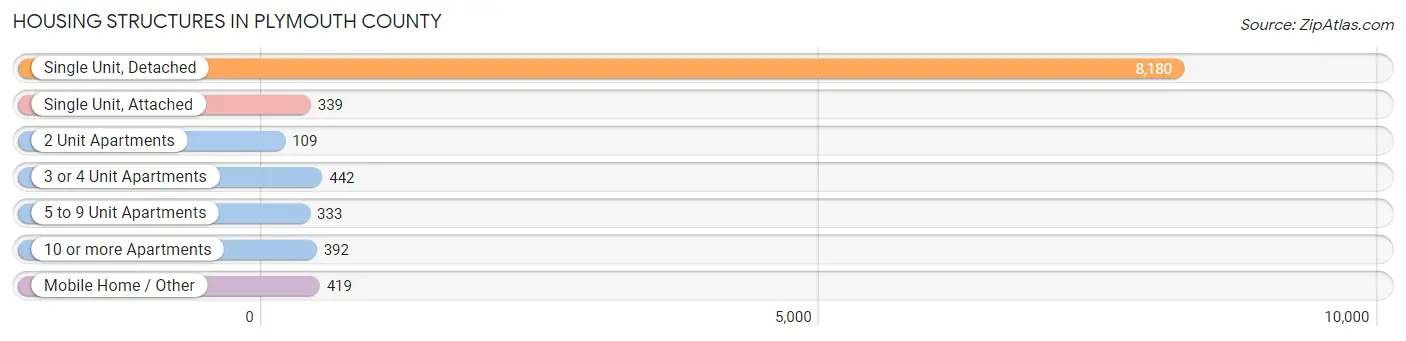
| Structure Type | # Housing Units | % Housing Units |
| Single Unit, Detached | 8,180 | 80.1% |
| Single Unit, Attached | 339 | 3.3% |
| 2 Unit Apartments | 109 | 1.1% |
| 3 or 4 Unit Apartments | 442 | 4.3% |
| 5 to 9 Unit Apartments | 333 | 3.3% |
| 10 or more Apartments | 392 | 3.8% |
| Mobile Home / Other | 419 | 4.1% |
| Total | 10,214 | 100.0% |
Housing Structures by Occupancy in Plymouth County
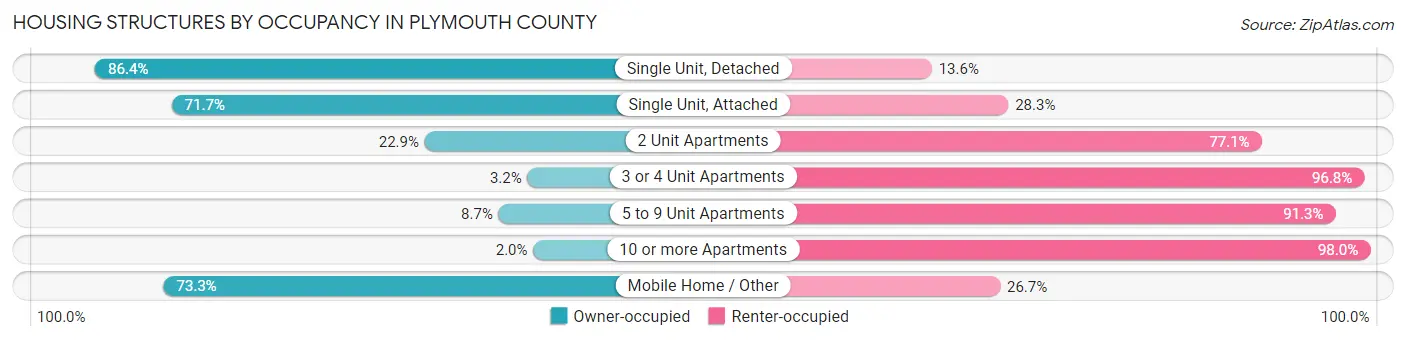
| Structure Type | Owner-occupied | Renter-occupied |
| Single Unit, Detached | 7,068 (86.4%) | 1,112 (13.6%) |
| Single Unit, Attached | 243 (71.7%) | 96 (28.3%) |
| 2 Unit Apartments | 25 (22.9%) | 84 (77.1%) |
| 3 or 4 Unit Apartments | 14 (3.2%) | 428 (96.8%) |
| 5 to 9 Unit Apartments | 29 (8.7%) | 304 (91.3%) |
| 10 or more Apartments | 8 (2.0%) | 384 (98.0%) |
| Mobile Home / Other | 307 (73.3%) | 112 (26.7%) |
| Total | 7,694 (75.3%) | 2,520 (24.7%) |
Housing Structures by Number of Rooms in Plymouth County
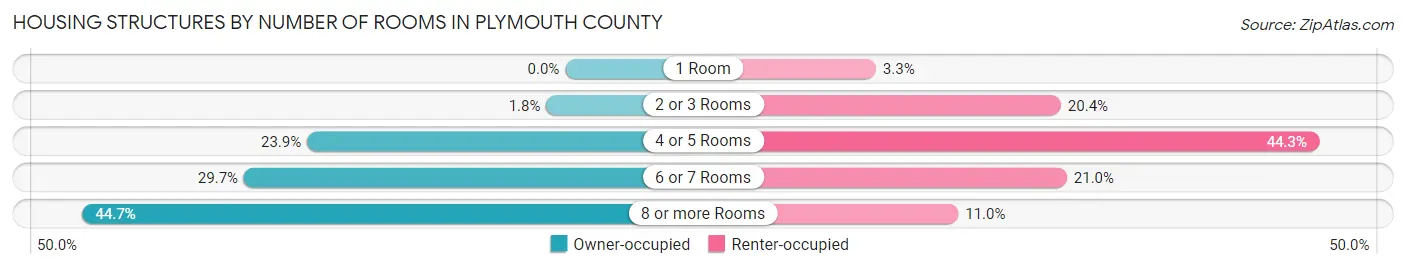
| Number of Rooms | Owner-occupied | Renter-occupied |
| 1 Room | 0 (0.0%) | 84 (3.3%) |
| 2 or 3 Rooms | 135 (1.8%) | 515 (20.4%) |
| 4 or 5 Rooms | 1,837 (23.9%) | 1,116 (44.3%) |
| 6 or 7 Rooms | 2,287 (29.7%) | 529 (21.0%) |
| 8 or more Rooms | 3,435 (44.7%) | 276 (11.0%) |
| Total | 7,694 (100.0%) | 2,520 (100.0%) |
Housing Structure by Heating Type in Plymouth County
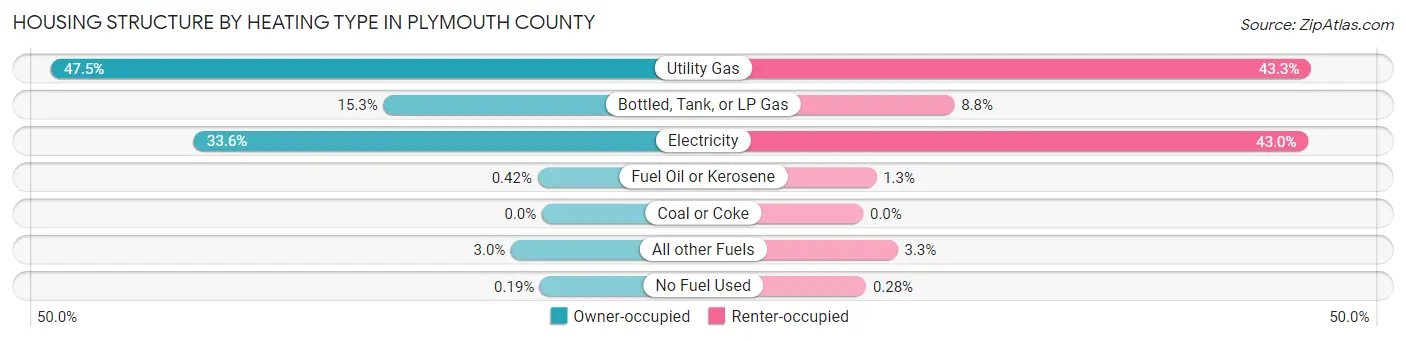
| Heating Type | Owner-occupied | Renter-occupied |
| Utility Gas | 3,651 (47.4%) | 1,091 (43.3%) |
| Bottled, Tank, or LP Gas | 1,178 (15.3%) | 222 (8.8%) |
| Electricity | 2,588 (33.6%) | 1,084 (43.0%) |
| Fuel Oil or Kerosene | 32 (0.4%) | 32 (1.3%) |
| Coal or Coke | 0 (0.0%) | 0 (0.0%) |
| All other Fuels | 230 (3.0%) | 84 (3.3%) |
| No Fuel Used | 15 (0.2%) | 7 (0.3%) |
| Total | 7,694 (100.0%) | 2,520 (100.0%) |
Household Vehicle Usage in Plymouth County
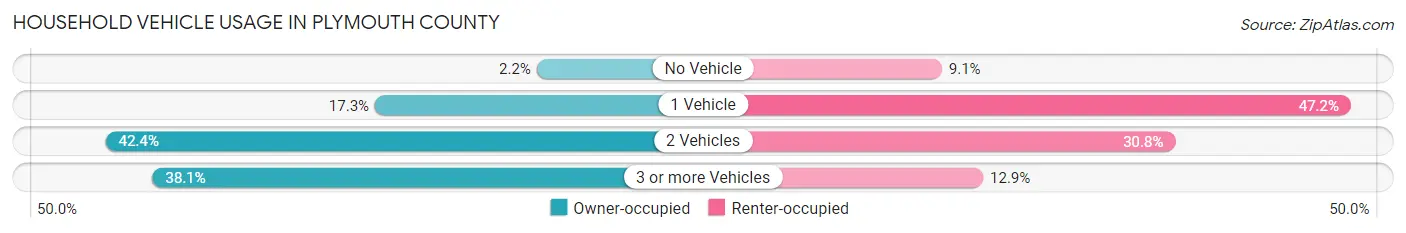
| Vehicles per Household | Owner-occupied | Renter-occupied |
| No Vehicle | 169 (2.2%) | 228 (9.0%) |
| 1 Vehicle | 1,331 (17.3%) | 1,190 (47.2%) |
| 2 Vehicles | 3,265 (42.4%) | 777 (30.8%) |
| 3 or more Vehicles | 2,929 (38.1%) | 325 (12.9%) |
| Total | 7,694 (100.0%) | 2,520 (100.0%) |
Real Estate & Mortgages in Plymouth County
Real Estate and Mortgage Overview in Plymouth County
| Characteristic | Without Mortgage | With Mortgage |
| Housing Units | 3,430 | 4,264 |
| Median Property Value | $189,200 | $211,900 |
| Median Household Income | $72,656 | $1,093 |
| Monthly Housing Costs | $521 | $187 |
| Real Estate Taxes | $2,195 | $27 |
Property Value by Mortgage Status in Plymouth County
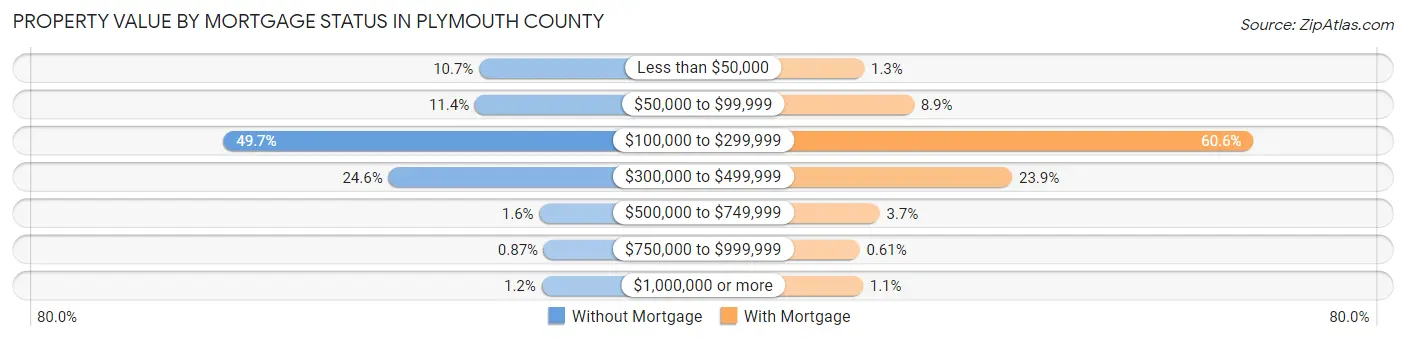
| Property Value | Without Mortgage | With Mortgage |
| Less than $50,000 | 368 (10.7%) | 55 (1.3%) |
| $50,000 to $99,999 | 390 (11.4%) | 378 (8.9%) |
| $100,000 to $299,999 | 1,705 (49.7%) | 2,585 (60.6%) |
| $300,000 to $499,999 | 842 (24.5%) | 1,017 (23.8%) |
| $500,000 to $749,999 | 53 (1.5%) | 156 (3.7%) |
| $750,000 to $999,999 | 30 (0.9%) | 26 (0.6%) |
| $1,000,000 or more | 42 (1.2%) | 47 (1.1%) |
| Total | 3,430 (100.0%) | 4,264 (100.0%) |
Household Income by Mortgage Status in Plymouth County
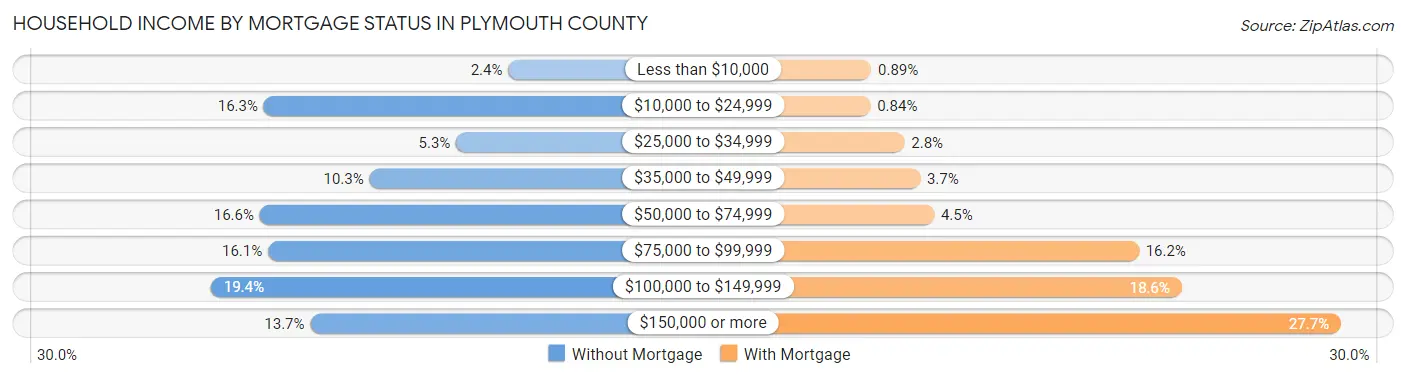
| Household Income | Without Mortgage | With Mortgage |
| Less than $10,000 | 81 (2.4%) | 38 (0.9%) |
| $10,000 to $24,999 | 560 (16.3%) | 36 (0.8%) |
| $25,000 to $34,999 | 183 (5.3%) | 119 (2.8%) |
| $35,000 to $49,999 | 353 (10.3%) | 157 (3.7%) |
| $50,000 to $74,999 | 568 (16.6%) | 191 (4.5%) |
| $75,000 to $99,999 | 552 (16.1%) | 690 (16.2%) |
| $100,000 to $149,999 | 664 (19.4%) | 795 (18.6%) |
| $150,000 or more | 469 (13.7%) | 1,183 (27.7%) |
| Total | 3,430 (100.0%) | 4,264 (100.0%) |
Property Value to Household Income Ratio in Plymouth County
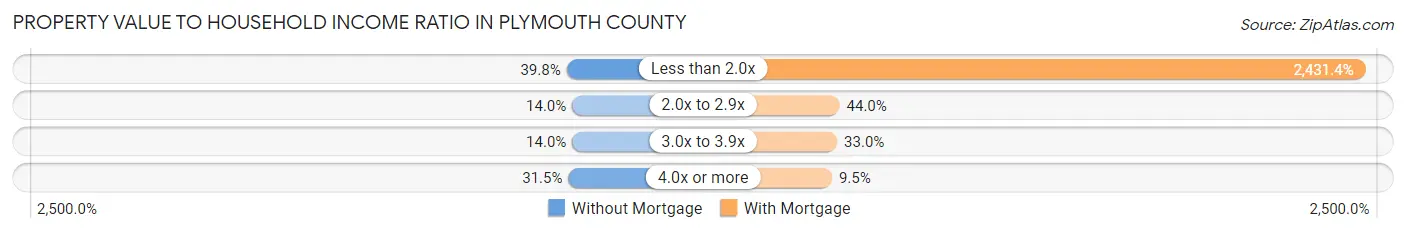
| Value-to-Income Ratio | Without Mortgage | With Mortgage |
| Less than 2.0x | 1,365 (39.8%) | 103,676 (2,431.4%) |
| 2.0x to 2.9x | 481 (14.0%) | 1,878 (44.0%) |
| 3.0x to 3.9x | 480 (14.0%) | 1,405 (33.0%) |
| 4.0x or more | 1,080 (31.5%) | 404 (9.5%) |
| Total | 3,430 (100.0%) | 4,264 (100.0%) |
Real Estate Taxes by Mortgage Status in Plymouth County
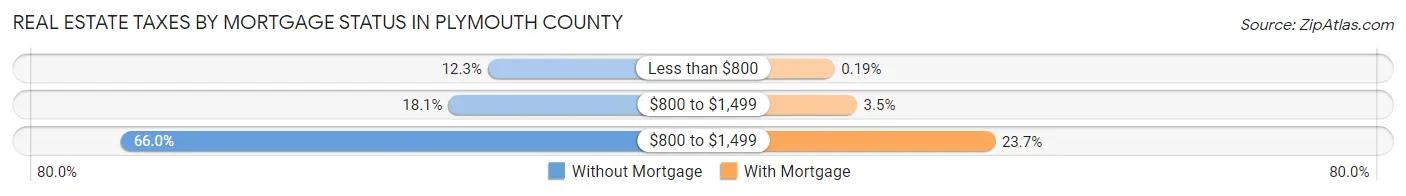
| Property Taxes | Without Mortgage | With Mortgage |
| Less than $800 | 423 (12.3%) | 8 (0.2%) |
| $800 to $1,499 | 620 (18.1%) | 147 (3.5%) |
| $800 to $1,499 | 2,262 (65.9%) | 1,009 (23.7%) |
| Total | 3,430 (100.0%) | 4,264 (100.0%) |
Health & Disability in Plymouth County
Health Insurance Coverage by Age in Plymouth County
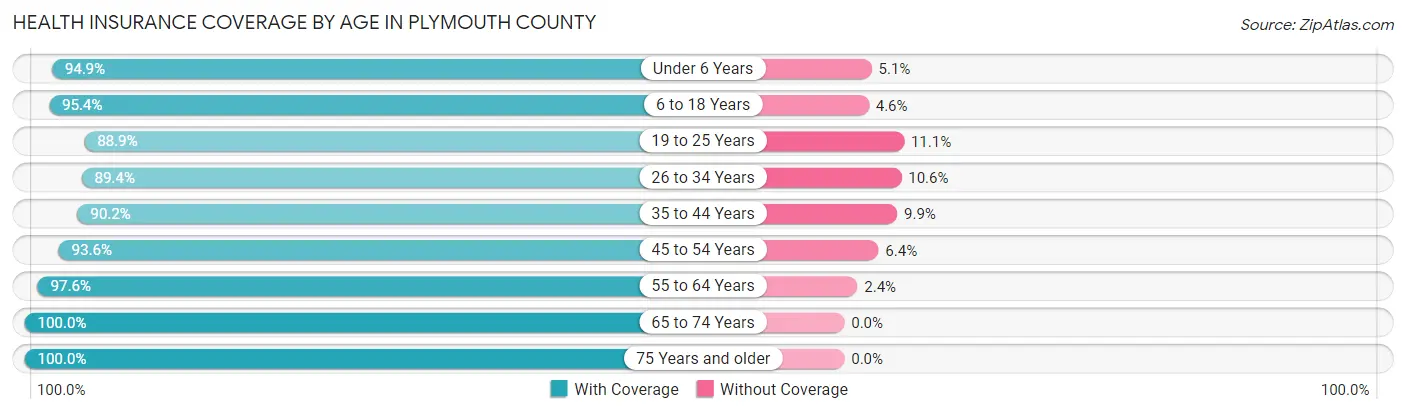
| Age Bracket | With Coverage | Without Coverage |
| Under 6 Years | 1,902 (94.9%) | 102 (5.1%) |
| 6 to 18 Years | 4,511 (95.4%) | 216 (4.6%) |
| 19 to 25 Years | 1,676 (88.9%) | 210 (11.1%) |
| 26 to 34 Years | 2,084 (89.4%) | 248 (10.6%) |
| 35 to 44 Years | 2,811 (90.1%) | 307 (9.9%) |
| 45 to 54 Years | 2,873 (93.6%) | 195 (6.4%) |
| 55 to 64 Years | 3,473 (97.6%) | 87 (2.4%) |
| 65 to 74 Years | 2,687 (100.0%) | 0 (0.0%) |
| 75 Years and older | 1,913 (100.0%) | 0 (0.0%) |
| Total | 23,930 (94.6%) | 1,365 (5.4%) |
Health Insurance Coverage by Citizenship Status in Plymouth County
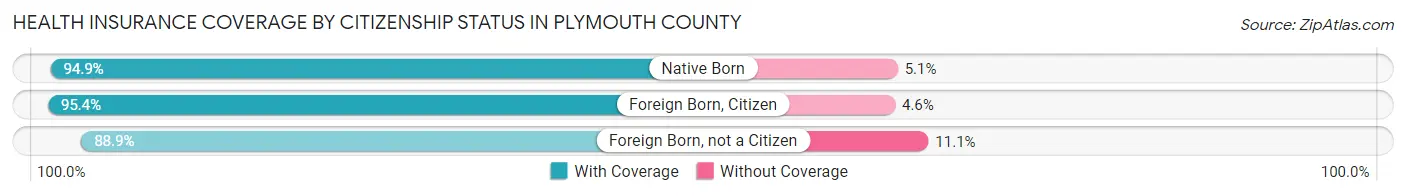
| Citizenship Status | With Coverage | Without Coverage |
| Native Born | 1,902 (94.9%) | 102 (5.1%) |
| Foreign Born, Citizen | 4,511 (95.4%) | 216 (4.6%) |
| Foreign Born, not a Citizen | 1,676 (88.9%) | 210 (11.1%) |
Health Insurance Coverage by Household Income in Plymouth County
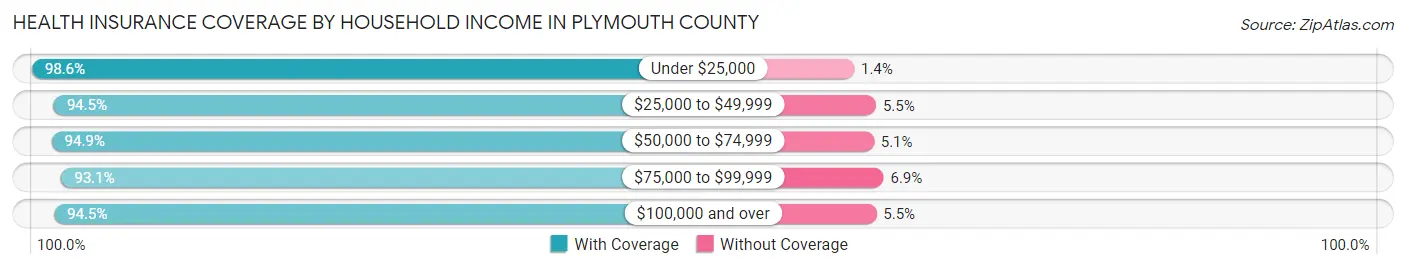
| Household Income | With Coverage | Without Coverage |
| Under $25,000 | 1,746 (98.6%) | 24 (1.4%) |
| $25,000 to $49,999 | 2,509 (94.5%) | 145 (5.5%) |
| $50,000 to $74,999 | 3,939 (94.9%) | 210 (5.1%) |
| $75,000 to $99,999 | 4,342 (93.1%) | 321 (6.9%) |
| $100,000 and over | 11,329 (94.5%) | 665 (5.5%) |
Public vs Private Health Insurance Coverage by Age in Plymouth County
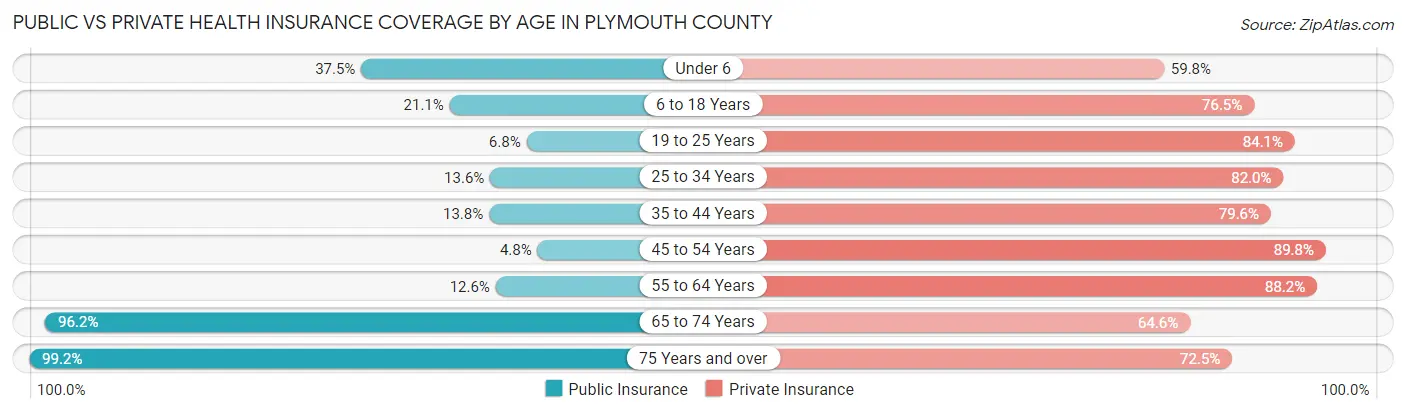
| Age Bracket | Public Insurance | Private Insurance |
| Under 6 | 752 (37.5%) | 1,198 (59.8%) |
| 6 to 18 Years | 998 (21.1%) | 3,617 (76.5%) |
| 19 to 25 Years | 129 (6.8%) | 1,586 (84.1%) |
| 25 to 34 Years | 317 (13.6%) | 1,911 (82.0%) |
| 35 to 44 Years | 430 (13.8%) | 2,483 (79.6%) |
| 45 to 54 Years | 147 (4.8%) | 2,756 (89.8%) |
| 55 to 64 Years | 447 (12.6%) | 3,140 (88.2%) |
| 65 to 74 Years | 2,585 (96.2%) | 1,737 (64.6%) |
| 75 Years and over | 1,897 (99.2%) | 1,386 (72.5%) |
| Total | 7,702 (30.4%) | 19,814 (78.3%) |
Disability Status by Sex by Age in Plymouth County
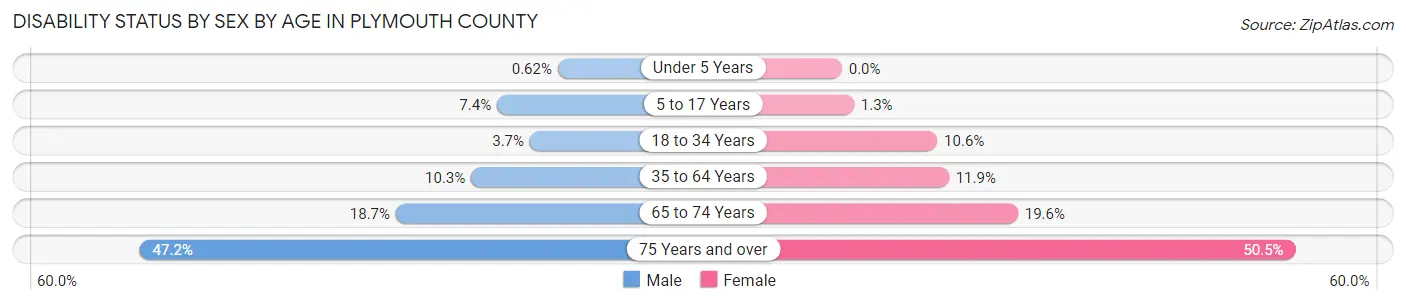
| Age Bracket | Male | Female |
| Under 5 Years | 5 (0.6%) | 0 (0.0%) |
| 5 to 17 Years | 184 (7.4%) | 32 (1.3%) |
| 18 to 34 Years | 90 (3.7%) | 231 (10.6%) |
| 35 to 64 Years | 516 (10.3%) | 562 (11.9%) |
| 65 to 74 Years | 248 (18.6%) | 266 (19.6%) |
| 75 Years and over | 401 (47.2%) | 537 (50.5%) |
Disability Class by Sex by Age in Plymouth County
Disability Class: Hearing Difficulty
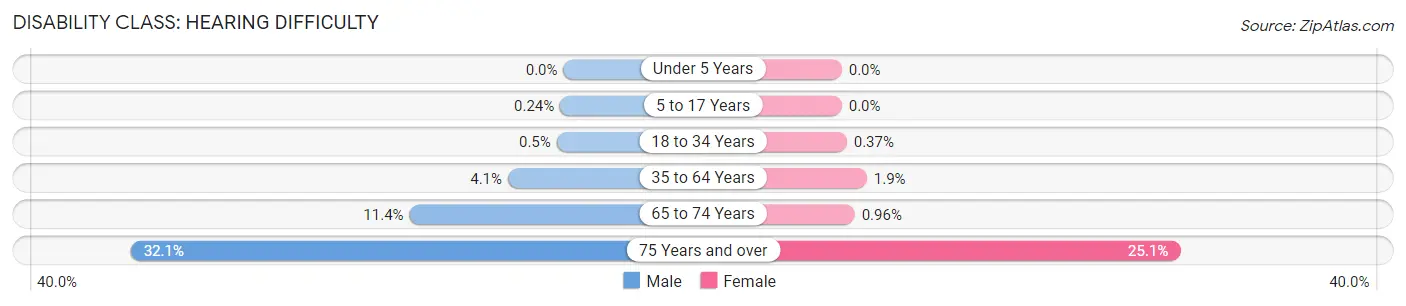
| Age Bracket | Male | Female |
| Under 5 Years | 0 (0.0%) | 0 (0.0%) |
| 5 to 17 Years | 6 (0.2%) | 0 (0.0%) |
| 18 to 34 Years | 12 (0.5%) | 8 (0.4%) |
| 35 to 64 Years | 207 (4.1%) | 88 (1.9%) |
| 65 to 74 Years | 152 (11.4%) | 13 (1.0%) |
| 75 Years and over | 273 (32.1%) | 267 (25.1%) |
Disability Class: Vision Difficulty
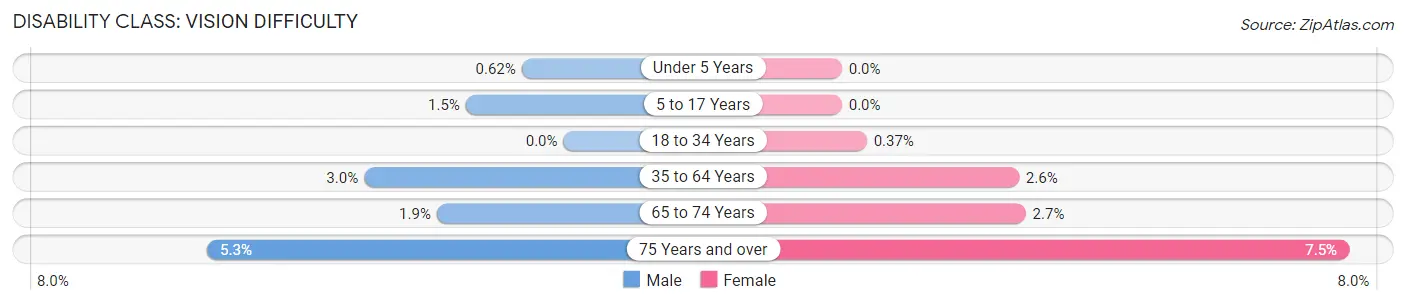
| Age Bracket | Male | Female |
| Under 5 Years | 5 (0.6%) | 0 (0.0%) |
| 5 to 17 Years | 36 (1.5%) | 0 (0.0%) |
| 18 to 34 Years | 0 (0.0%) | 8 (0.4%) |
| 35 to 64 Years | 149 (3.0%) | 124 (2.6%) |
| 65 to 74 Years | 25 (1.9%) | 37 (2.7%) |
| 75 Years and over | 45 (5.3%) | 80 (7.5%) |
Disability Class: Cognitive Difficulty
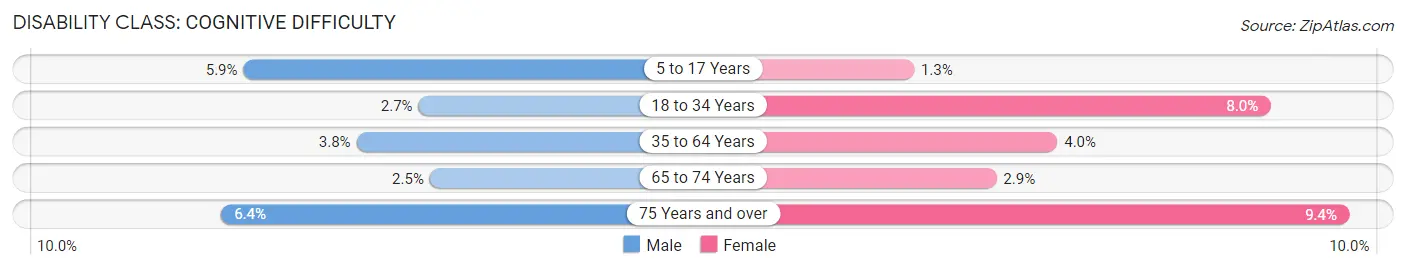
| Age Bracket | Male | Female |
| 5 to 17 Years | 148 (5.9%) | 32 (1.3%) |
| 18 to 34 Years | 65 (2.7%) | 173 (8.0%) |
| 35 to 64 Years | 193 (3.8%) | 189 (4.0%) |
| 65 to 74 Years | 33 (2.5%) | 39 (2.9%) |
| 75 Years and over | 54 (6.4%) | 100 (9.4%) |
Disability Class: Ambulatory Difficulty
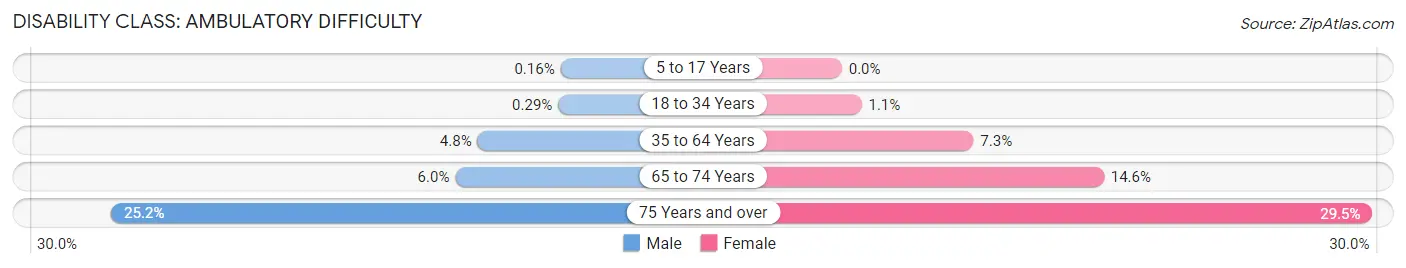
| Age Bracket | Male | Female |
| 5 to 17 Years | 4 (0.2%) | 0 (0.0%) |
| 18 to 34 Years | 7 (0.3%) | 24 (1.1%) |
| 35 to 64 Years | 240 (4.8%) | 346 (7.3%) |
| 65 to 74 Years | 80 (6.0%) | 198 (14.6%) |
| 75 Years and over | 214 (25.2%) | 314 (29.5%) |
Disability Class: Self-Care Difficulty
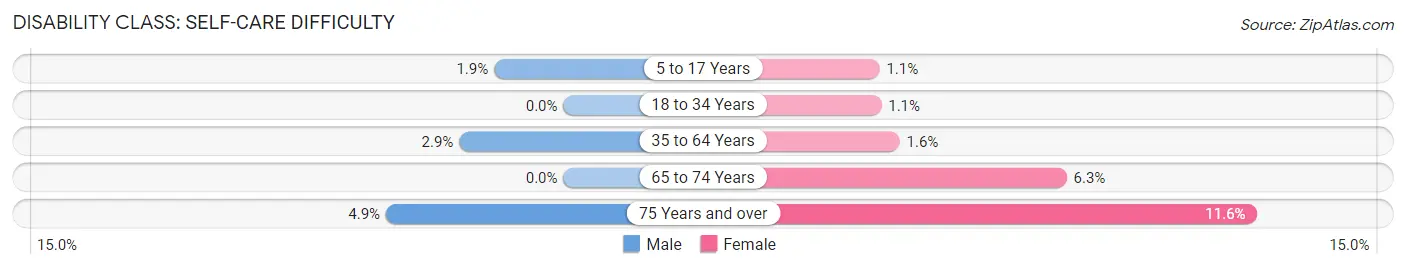
| Age Bracket | Male | Female |
| 5 to 17 Years | 48 (1.9%) | 25 (1.1%) |
| 18 to 34 Years | 0 (0.0%) | 24 (1.1%) |
| 35 to 64 Years | 146 (2.9%) | 76 (1.6%) |
| 65 to 74 Years | 0 (0.0%) | 85 (6.3%) |
| 75 Years and over | 42 (4.9%) | 123 (11.6%) |
Technology Access in Plymouth County
Computing Device Access in Plymouth County
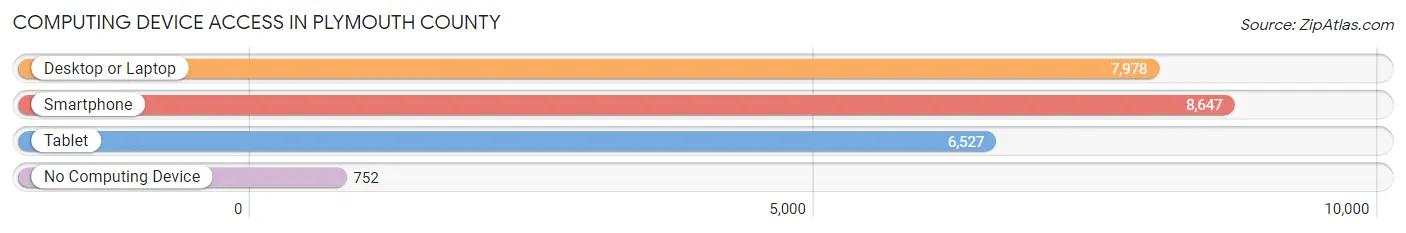
| Device Type | # Households | % Households |
| Desktop or Laptop | 7,978 | 78.1% |
| Smartphone | 8,647 | 84.7% |
| Tablet | 6,527 | 63.9% |
| No Computing Device | 752 | 7.4% |
| Total | 10,214 | 100.0% |
Internet Access in Plymouth County
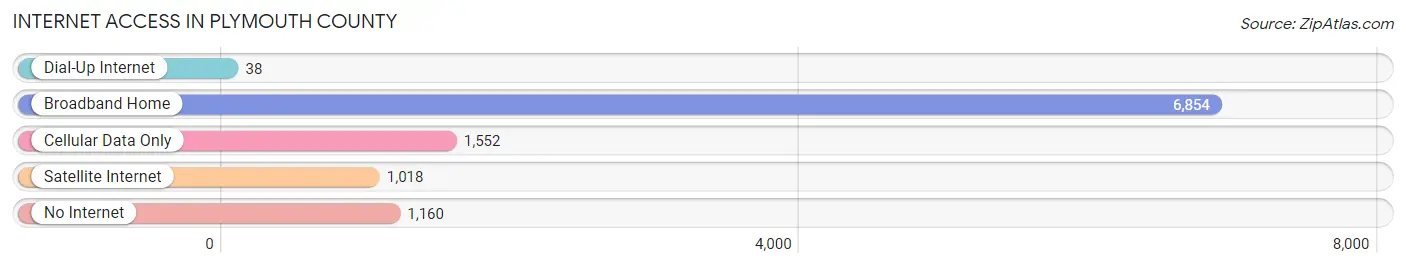
| Internet Type | # Households | % Households |
| Dial-Up Internet | 38 | 0.4% |
| Broadband Home | 6,854 | 67.1% |
| Cellular Data Only | 1,552 | 15.2% |
| Satellite Internet | 1,018 | 10.0% |
| No Internet | 1,160 | 11.4% |
| Total | 10,214 | 100.0% |
Plymouth County Summary
Plymouth County is located in the northwest corner of Iowa, and is bordered by Sioux County to the north, Woodbury County to the east, Cherokee County to the south, and Sioux County, Nebraska to the west. The county seat is Le Mars, and the county is named after Plymouth, Massachusetts. Plymouth County has a total area of 576 square miles, of which 575 square miles is land and 1 square mile is water.
Geography
Plymouth County is located in the Loess Hills region of Iowa, and is characterized by rolling hills and valleys. The county is drained by the Floyd River, which flows through the county from north to south. The Floyd River is a tributary of the Big Sioux River, which forms the western border of the county. The county is also home to several small lakes, including Little Sioux Lake, which is located in the northern part of the county.
The county is home to several state parks and wildlife areas, including Stone State Park, which is located in the northern part of the county. The park is home to a variety of wildlife, including deer, turkey, and waterfowl. The park also features several hiking trails, camping sites, and picnic areas.
Economy
Plymouth County has a diverse economy, with a mix of agriculture, manufacturing, and services. The county is home to several large employers, including Wells Enterprises, which is the largest ice cream manufacturer in the United States. The company is headquartered in Le Mars, and employs over 1,000 people in the county. Other major employers in the county include Tyson Foods, which operates a pork processing plant in Le Mars, and the Sioux City Stockyards, which is the largest livestock market in the state.
Agriculture is an important part of the county’s economy, and the county is home to several large farms. The county is a major producer of corn, soybeans, and hogs. Other agricultural products produced in the county include hay, oats, and wheat.
Demographics
As of the 2010 census, Plymouth County had a population of 24,986. The population was spread out, with 19.7% under the age of 18, 8.2% from 18 to 24, 24.2% from 25 to 44, 28.2% from 45 to 64, and 19.7% who were 65 years of age or older. The median age was 42.3 years.
The racial makeup of the county was 95.2% White, 0.7% African American, 0.3% Native American, 0.6% Asian, 0.1% Pacific Islander, 1.7% from other races, and 1.4% from two or more races. Hispanic or Latino of any race were 4.2% of the population.
The median income for a household in the county was $50,945, and the median income for a family was $60,945. The per capita income for the county was $25,845. About 6.2% of families and 8.7% of the population were below the poverty line, including 11.2% of those under age 18 and 6.2% of those age 65 or over.
Plymouth County is a rural county with a diverse economy and a population that is largely white and middle-class. The county is home to several large employers, and agriculture is an important part of the county’s economy. The county is also home to several state parks and wildlife areas, making it a popular destination for outdoor recreation.
Common Questions
What is Per Capita Income in Plymouth County?
Per Capita income in Plymouth County is $40,150.
What is the Median Family Income in Plymouth County?
Median Family Income in Plymouth County is $94,094.
What is the Median Household income in Plymouth County?
Median Household Income in Plymouth County is $79,963.
What is Income or Wage Gap in Plymouth County?
Income or Wage Gap in Plymouth County is 28.6%.
Women in Plymouth County earn 71.4 cents for every dollar earned by a man.
What is Family Income Deficit in Plymouth County?
Family Income Deficit in Plymouth County is $6,892.
Families that are below poverty line in Plymouth County earn $6,892 less on average than the poverty threshold level.
What is Inequality or Gini Index in Plymouth County?
Inequality or Gini Index in Plymouth County is 0.41.
What is the Total Population of Plymouth County?
Total Population of Plymouth County is 25,621.
What is the Total Male Population of Plymouth County?
Total Male Population of Plymouth County is 13,013.
What is the Total Female Population of Plymouth County?
Total Female Population of Plymouth County is 12,608.
What is the Ratio of Males per 100 Females in Plymouth County?
There are 103.21 Males per 100 Females in Plymouth County.
What is the Ratio of Females per 100 Males in Plymouth County?
There are 96.89 Females per 100 Males in Plymouth County.
What is the Median Population Age in Plymouth County?
Median Population Age in Plymouth County is 40.9 Years.
What is the Average Family Size in Plymouth County
Average Family Size in Plymouth County is 3.0 People.
What is the Average Household Size in Plymouth County
Average Household Size in Plymouth County is 2.5 People.
How Large is the Labor Force in Plymouth County?
There are 13,926 People in the Labor Forcein in Plymouth County.
What is the Percentage of People in the Labor Force in Plymouth County?
69.5% of People are in the Labor Force in Plymouth County.
What is the Unemployment Rate in Plymouth County?
Unemployment Rate in Plymouth County is 2.1%.