Zip Codes with the Highest Percentage of Population Employed in Food Preparation & Serving in Sandy, UT
RELATED REPORTS & OPTIONS
Food Preparation & Serving
Sandy
Compare Zip Codes
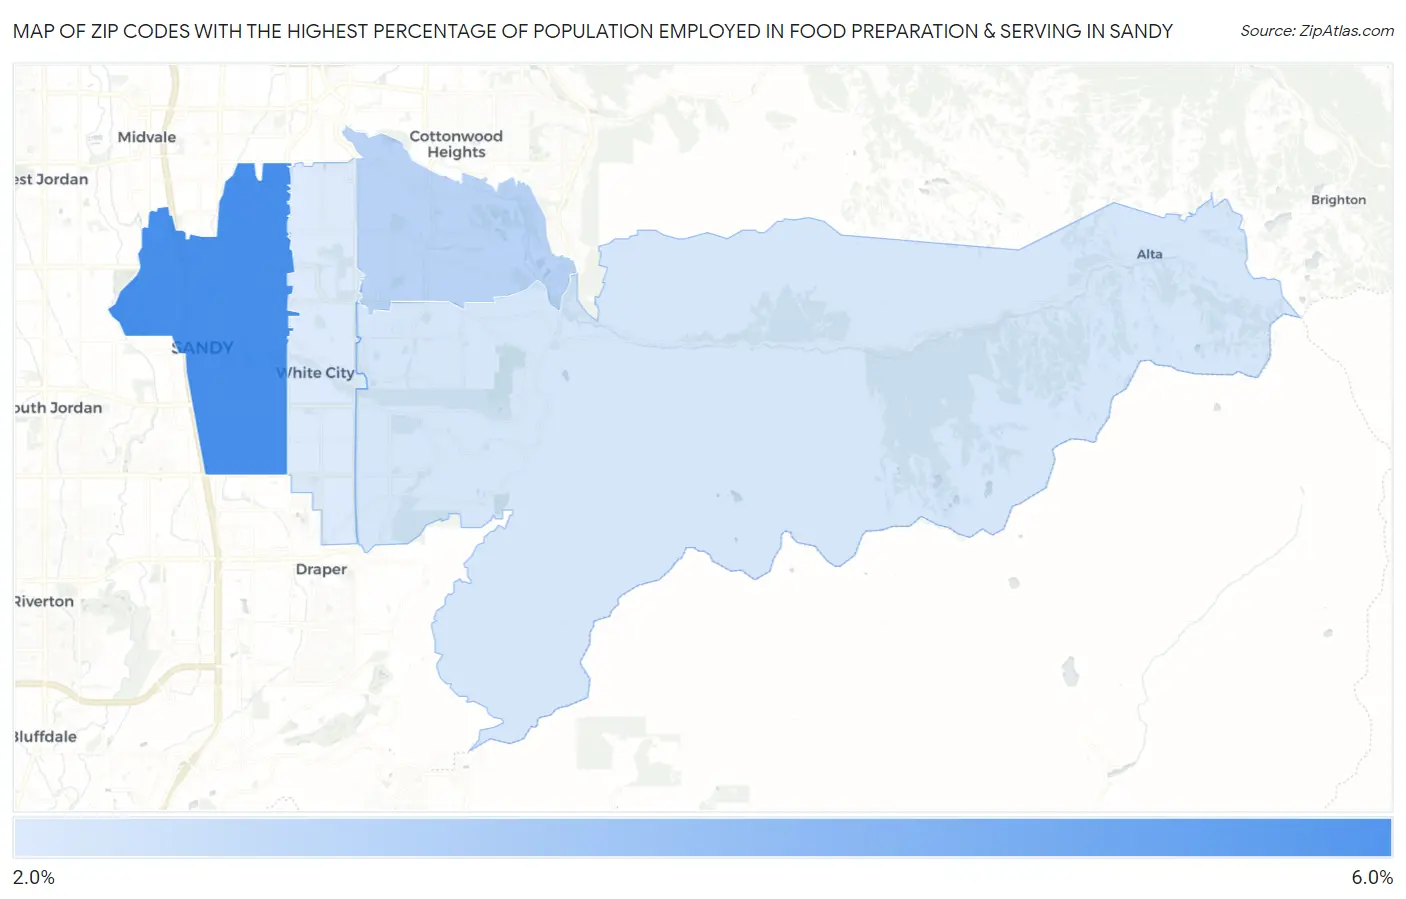
Map of Zip Codes with the Highest Percentage of Population Employed in Food Preparation & Serving in Sandy
2.9%
5.5%
Zip Codes with the Highest Percentage of Population Employed in Food Preparation & Serving in Sandy, UT
| Zip Code | % Employed | vs State | vs National | |
| 1. | 84070 | 5.5% | 4.5%(+0.920)#74 | 5.3%(+0.171)#11,196 |
| 2. | 84093 | 3.5% | 4.5%(-0.993)#151 | 5.3%(-1.74)#19,021 |
| 3. | 84092 | 3.1% | 4.5%(-1.46)#173 | 5.3%(-2.21)#20,973 |
| 4. | 84094 | 2.9% | 4.5%(-1.60)#175 | 5.3%(-2.35)#21,491 |
1
Common Questions
What are the Top 3 Zip Codes with the Highest Percentage of Population Employed in Food Preparation & Serving in Sandy, UT?
Top 3 Zip Codes with the Highest Percentage of Population Employed in Food Preparation & Serving in Sandy, UT are:
What zip code has the Highest Percentage of Population Employed in Food Preparation & Serving in Sandy, UT?
84070 has the Highest Percentage of Population Employed in Food Preparation & Serving in Sandy, UT with 5.5%.
What is the Percentage of Population Employed in Food Preparation & Serving in Sandy, UT?
Percentage of Population Employed in Food Preparation & Serving in Sandy is 3.8%.
What is the Percentage of Population Employed in Food Preparation & Serving in Utah?
Percentage of Population Employed in Food Preparation & Serving in Utah is 4.5%.
What is the Percentage of Population Employed in Food Preparation & Serving in the United States?
Percentage of Population Employed in Food Preparation & Serving in the United States is 5.3%.