Dammeron Valley, UT Map & Demographics
Dammeron Valley Map
Dammeron Valley Overview
$50,113
PER CAPITA INCOME
$105,694
AVG FAMILY INCOME
$71,458
AVG HOUSEHOLD INCOME
0.44
INEQUALITY / GINI INDEX
817
TOTAL POPULATION
439
MALE POPULATION
378
FEMALE POPULATION
116.14
MALES / 100 FEMALES
86.10
FEMALES / 100 MALES
61.9
MEDIAN AGE
2.7
AVG FAMILY SIZE
2.2
AVG HOUSEHOLD SIZE
130
LABOR FORCE [ PEOPLE ]
18.2%
PERCENT IN LABOR FORCE
Dammeron Valley Zip Codes
Dammeron Valley Area Codes
Income in Dammeron Valley
Income Overview in Dammeron Valley
Per Capita Income in Dammeron Valley is $50,113, while median incomes of families and households are $105,694 and $71,458 respectively.
| Characteristic | Number | Measure |
| Per Capita Income | 817 | $50,113 |
| Median Family Income | 267 | $105,694 |
| Mean Family Income | 267 | $128,600 |
| Median Household Income | 365 | $71,458 |
| Mean Household Income | 365 | $109,193 |
| Income Deficit | 267 | $0 |
| Wage / Income Gap (%) | 817 | 0.00% |
| Wage / Income Gap ($) | 817 | 100.00¢ per $1 |
| Gini / Inequality Index | 817 | 0.44 |
Earnings by Sex in Dammeron Valley
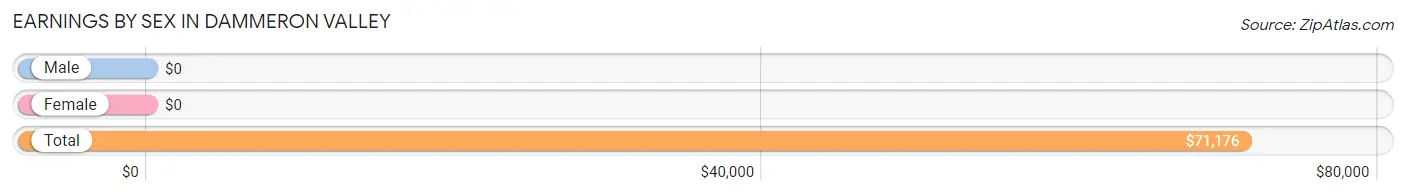
| Sex | Number | Average Earnings |
| Male | 88 (55.7%) | $0 |
| Female | 70 (44.3%) | $0 |
| Total | 158 (100.0%) | $71,176 |
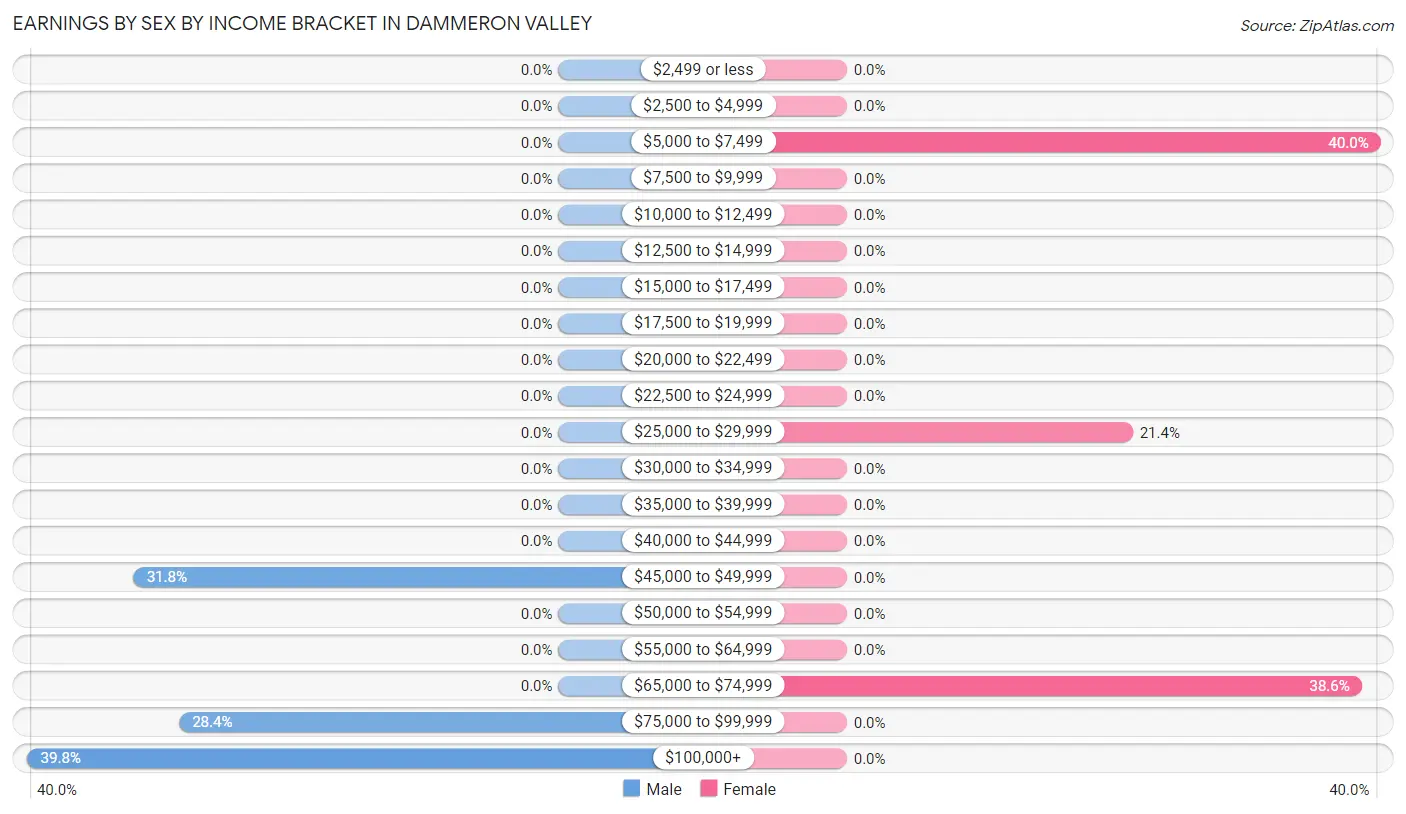
Earnings by Sex by Income Bracket in Dammeron Valley
The most common earnings brackets in Dammeron Valley are $100,000+ for men (35 | 39.8%) and $5,000 to $7,499 for women (28 | 40.0%).
| Income | Male | Female |
| $2,499 or less | 0 (0.0%) | 0 (0.0%) |
| $2,500 to $4,999 | 0 (0.0%) | 0 (0.0%) |
| $5,000 to $7,499 | 0 (0.0%) | 28 (40.0%) |
| $7,500 to $9,999 | 0 (0.0%) | 0 (0.0%) |
| $10,000 to $12,499 | 0 (0.0%) | 0 (0.0%) |
| $12,500 to $14,999 | 0 (0.0%) | 0 (0.0%) |
| $15,000 to $17,499 | 0 (0.0%) | 0 (0.0%) |
| $17,500 to $19,999 | 0 (0.0%) | 0 (0.0%) |
| $20,000 to $22,499 | 0 (0.0%) | 0 (0.0%) |
| $22,500 to $24,999 | 0 (0.0%) | 0 (0.0%) |
| $25,000 to $29,999 | 0 (0.0%) | 15 (21.4%) |
| $30,000 to $34,999 | 0 (0.0%) | 0 (0.0%) |
| $35,000 to $39,999 | 0 (0.0%) | 0 (0.0%) |
| $40,000 to $44,999 | 0 (0.0%) | 0 (0.0%) |
| $45,000 to $49,999 | 28 (31.8%) | 0 (0.0%) |
| $50,000 to $54,999 | 0 (0.0%) | 0 (0.0%) |
| $55,000 to $64,999 | 0 (0.0%) | 0 (0.0%) |
| $65,000 to $74,999 | 0 (0.0%) | 27 (38.6%) |
| $75,000 to $99,999 | 25 (28.4%) | 0 (0.0%) |
| $100,000+ | 35 (39.8%) | 0 (0.0%) |
| Total | 88 (100.0%) | 70 (100.0%) |
Earnings by Sex by Educational Attainment in Dammeron Valley
| Educational Attainment | Male Income | Female Income |
| Less than High School | - | - |
| High School Diploma | - | - |
| College or Associate's Degree | - | - |
| Bachelor's Degree | - | - |
| Graduate Degree | - | - |
| Total | - | - |
Family Income in Dammeron Valley
Family Income Brackets in Dammeron Valley
According to the Dammeron Valley family income data, there are 70 families falling into the $50,000 to $74,999 income range, which is the most common income bracket and makes up 26.2% of all families.
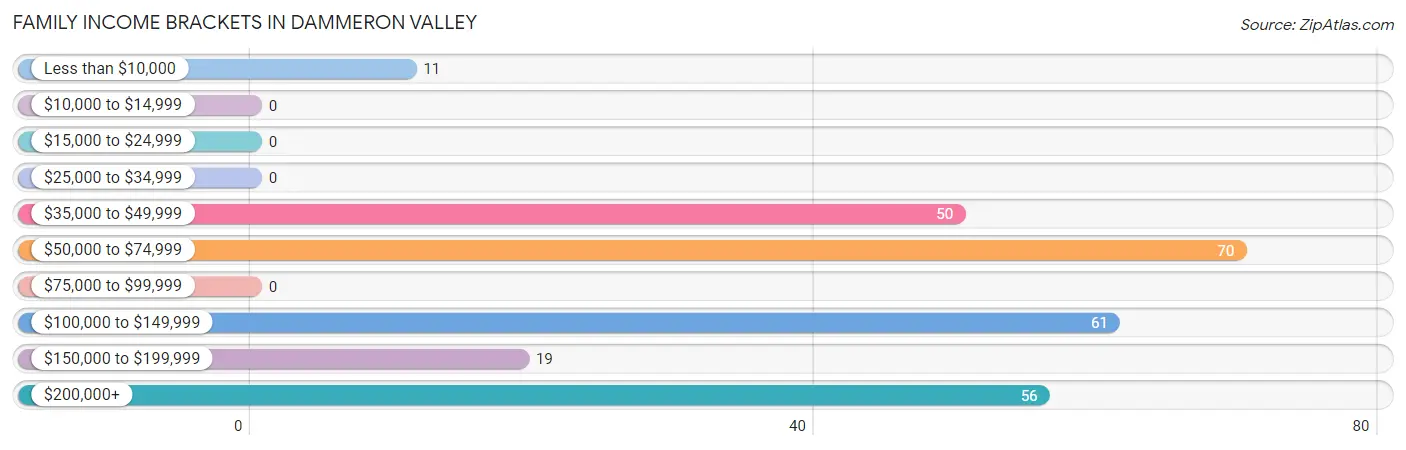
| Income Bracket | # Families | % Families |
| Less than $10,000 | 11 | 4.1% |
| $10,000 to $14,999 | 0 | 0.0% |
| $15,000 to $24,999 | 0 | 0.0% |
| $25,000 to $34,999 | 0 | 0.0% |
| $35,000 to $49,999 | 50 | 18.7% |
| $50,000 to $74,999 | 70 | 26.2% |
| $75,000 to $99,999 | 0 | 0.0% |
| $100,000 to $149,999 | 61 | 22.8% |
| $150,000 to $199,999 | 19 | 7.1% |
| $200,000+ | 56 | 21.0% |
Family Income by Famaliy Size in Dammeron Valley
2-person families (207 | 77.5%) account for the highest median family income in Dammeron Valley with $54,861 per family, while 2-person families (207 | 77.5%) have the highest median income of $27,430 per family member.
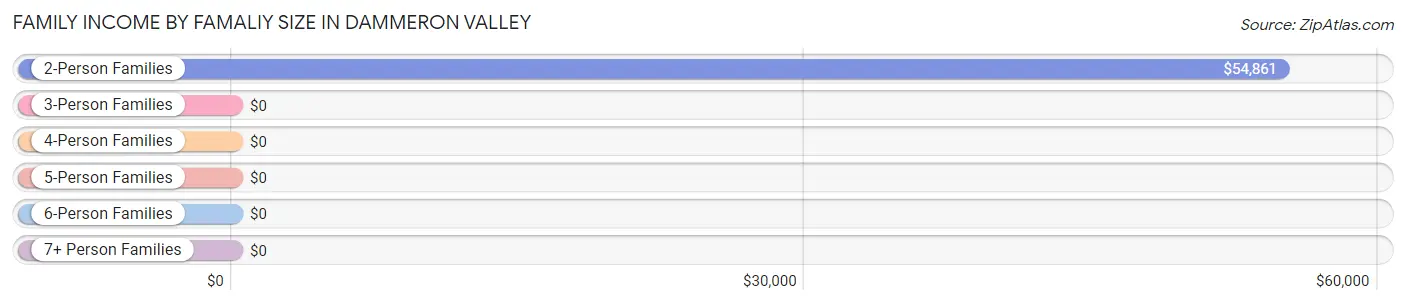
| Income Bracket | # Families | Median Income |
| 2-Person Families | 207 (77.5%) | $54,861 |
| 3-Person Families | 0 (0.0%) | $0 |
| 4-Person Families | 35 (13.1%) | $0 |
| 5-Person Families | 0 (0.0%) | $0 |
| 6-Person Families | 25 (9.4%) | $0 |
| 7+ Person Families | 0 (0.0%) | $0 |
| Total | 267 (100.0%) | $105,694 |
Family Income by Number of Earners in Dammeron Valley
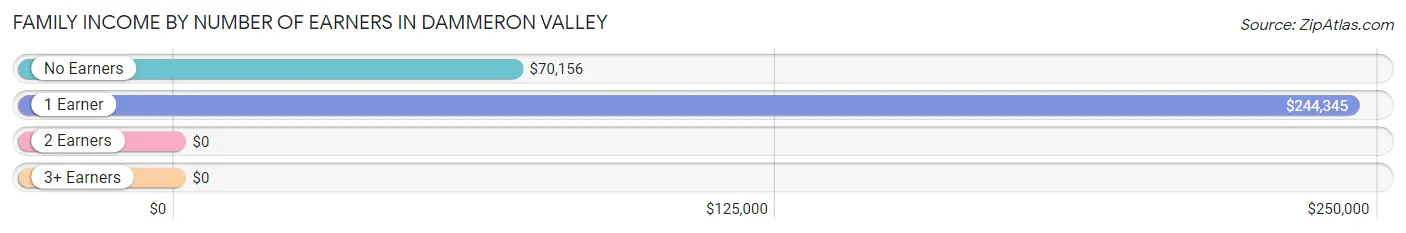
| Number of Earners | # Families | Median Income |
| No Earners | 158 (59.2%) | $70,156 |
| 1 Earner | 81 (30.3%) | $244,345 |
| 2 Earners | 28 (10.5%) | $0 |
| 3+ Earners | 0 (0.0%) | $0 |
| Total | 267 (100.0%) | $105,694 |
Household Income in Dammeron Valley
Household Income Brackets in Dammeron Valley
With 84 households falling in the category, the $50,000 to $74,999 income range is the most frequent in Dammeron Valley, accounting for 23.0% of all households.
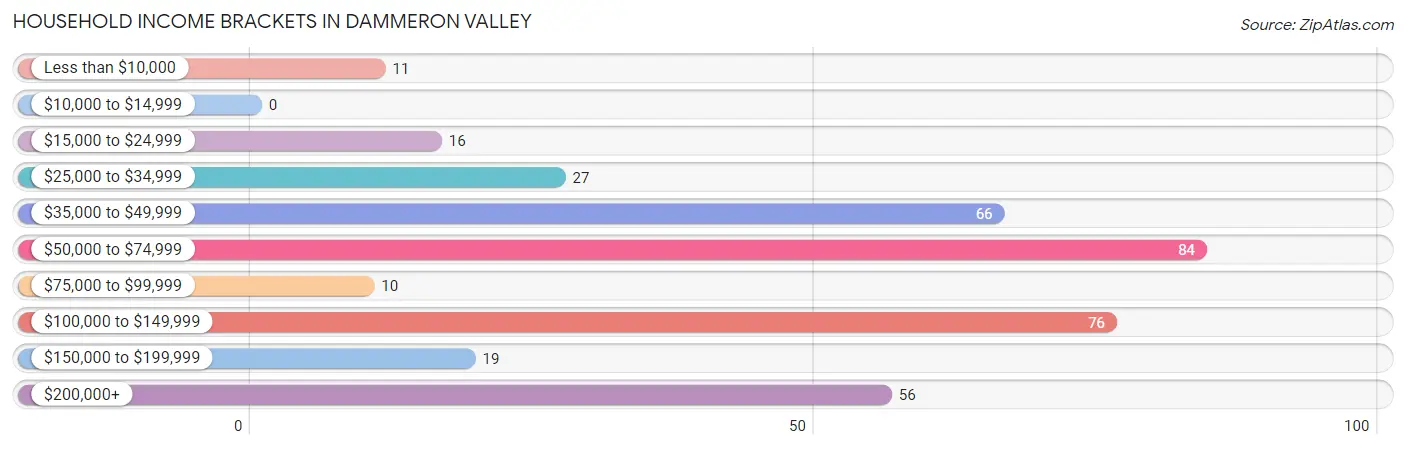
| Income Bracket | # Households | % Households |
| Less than $10,000 | 11 | 3.0% |
| $10,000 to $14,999 | 0 | 0.0% |
| $15,000 to $24,999 | 16 | 4.4% |
| $25,000 to $34,999 | 27 | 7.4% |
| $35,000 to $49,999 | 66 | 18.1% |
| $50,000 to $74,999 | 84 | 23.0% |
| $75,000 to $99,999 | 10 | 2.7% |
| $100,000 to $149,999 | 76 | 20.8% |
| $150,000 to $199,999 | 19 | 5.2% |
| $200,000+ | 56 | 15.3% |
Household Income by Householder Age in Dammeron Valley
The median household income in Dammeron Valley is $71,458, with the highest median household income of $200,000 found in the 25 to 44 years age bracket for the primary householder. A total of 70 households (19.2%) fall into this category.
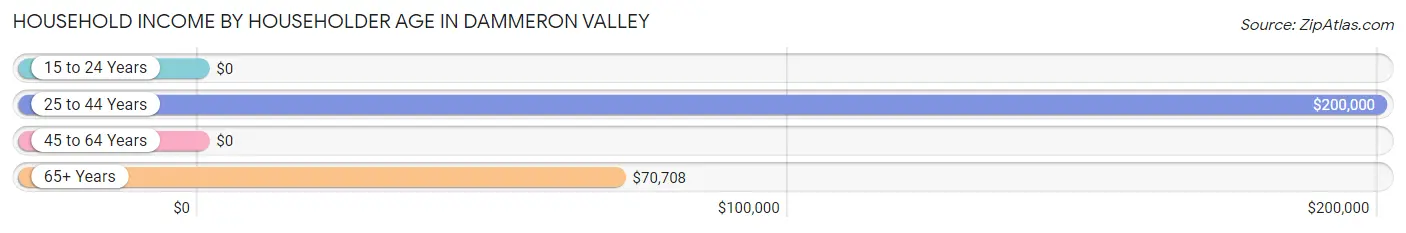
| Income Bracket | # Households | Median Income |
| 15 to 24 Years | 0 (0.0%) | $0 |
| 25 to 44 Years | 70 (19.2%) | $200,000 |
| 45 to 64 Years | 104 (28.5%) | $0 |
| 65+ Years | 191 (52.3%) | $70,708 |
| Total | 365 (100.0%) | $71,458 |
Poverty in Dammeron Valley
Income Below Poverty by Sex and Age in Dammeron Valley
With 2.5% poverty level for males and 2.9% for females among the residents of Dammeron Valley, 65 to 74 year old males and 65 to 74 year old females are the most vulnerable to poverty, with 11 males (7.6%) and 11 females (7.6%) in their respective age groups living below the poverty level.
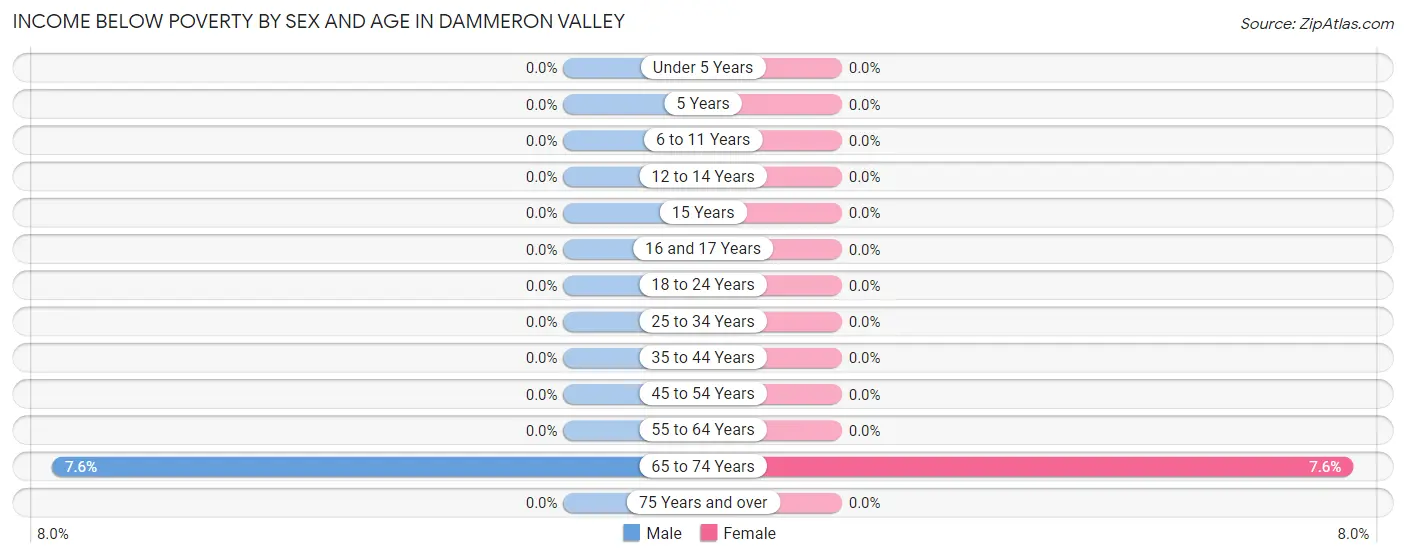
| Age Bracket | Male | Female |
| Under 5 Years | 0 (0.0%) | 0 (0.0%) |
| 5 Years | 0 (0.0%) | 0 (0.0%) |
| 6 to 11 Years | 0 (0.0%) | 0 (0.0%) |
| 12 to 14 Years | 0 (0.0%) | 0 (0.0%) |
| 15 Years | 0 (0.0%) | 0 (0.0%) |
| 16 and 17 Years | 0 (0.0%) | 0 (0.0%) |
| 18 to 24 Years | 0 (0.0%) | 0 (0.0%) |
| 25 to 34 Years | 0 (0.0%) | 0 (0.0%) |
| 35 to 44 Years | 0 (0.0%) | 0 (0.0%) |
| 45 to 54 Years | 0 (0.0%) | 0 (0.0%) |
| 55 to 64 Years | 0 (0.0%) | 0 (0.0%) |
| 65 to 74 Years | 11 (7.6%) | 11 (7.6%) |
| 75 Years and over | 0 (0.0%) | 0 (0.0%) |
| Total | 11 (2.5%) | 11 (2.9%) |
Income Above Poverty by Sex and Age in Dammeron Valley
According to the poverty statistics in Dammeron Valley, males aged under 5 years and females aged 25 to 34 years are the age groups that are most secure financially, with 100.0% of males and 100.0% of females in these age groups living above the poverty line.
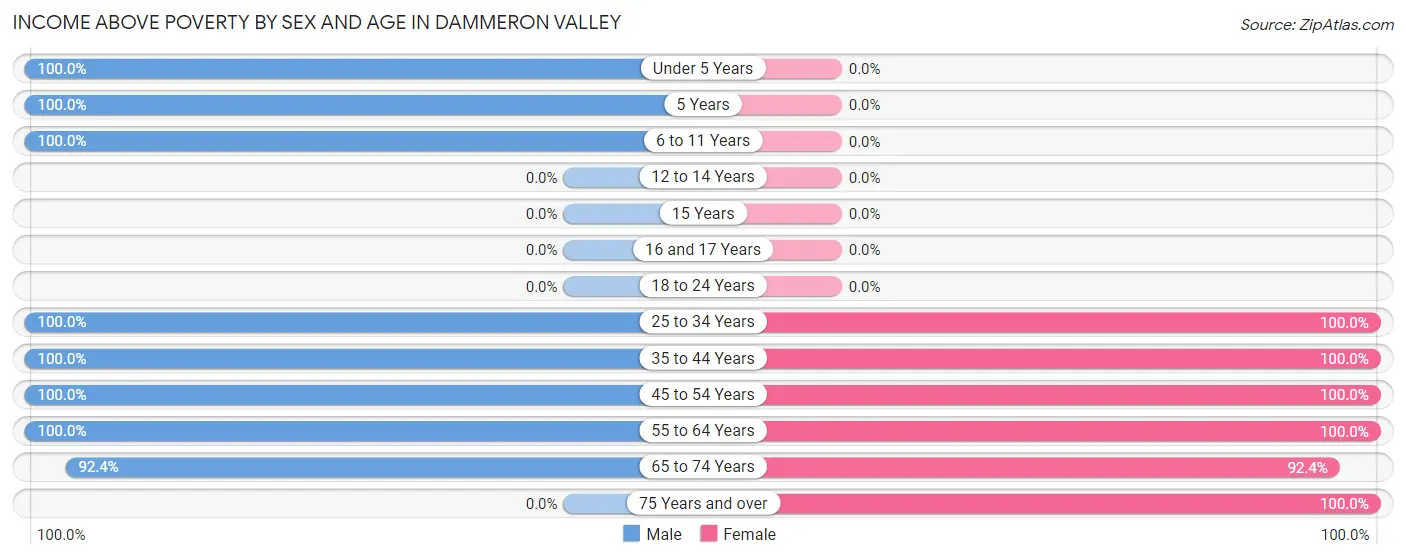
| Age Bracket | Male | Female |
| Under 5 Years | 46 (100.0%) | 0 (0.0%) |
| 5 Years | 32 (100.0%) | 0 (0.0%) |
| 6 to 11 Years | 23 (100.0%) | 0 (0.0%) |
| 12 to 14 Years | 0 (0.0%) | 0 (0.0%) |
| 15 Years | 0 (0.0%) | 0 (0.0%) |
| 16 and 17 Years | 0 (0.0%) | 0 (0.0%) |
| 18 to 24 Years | 0 (0.0%) | 0 (0.0%) |
| 25 to 34 Years | 25 (100.0%) | 24 (100.0%) |
| 35 to 44 Years | 35 (100.0%) | 49 (100.0%) |
| 45 to 54 Years | 28 (100.0%) | 61 (100.0%) |
| 55 to 64 Years | 105 (100.0%) | 72 (100.0%) |
| 65 to 74 Years | 134 (92.4%) | 134 (92.4%) |
| 75 Years and over | 0 (0.0%) | 27 (100.0%) |
| Total | 428 (97.5%) | 367 (97.1%) |
Income Below Poverty Among Married-Couple Families in Dammeron Valley
The poverty statistics for married-couple families in Dammeron Valley show that 4.1% or 11 of the total 267 families live below the poverty line. Families with no children have the highest poverty rate of 5.3%, comprising of 11 families. On the other hand, families with 1 or 2 children have the lowest poverty rate of 0.0%, which includes 0 families.
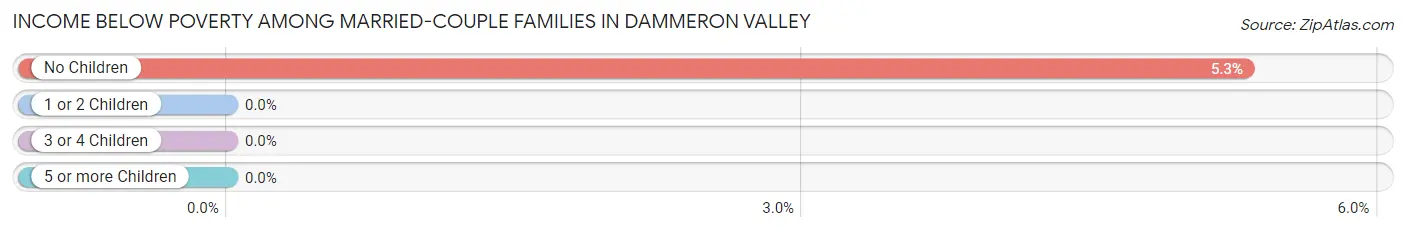
| Children | Above Poverty | Below Poverty |
| No Children | 196 (94.7%) | 11 (5.3%) |
| 1 or 2 Children | 60 (100.0%) | 0 (0.0%) |
| 3 or 4 Children | 0 (0.0%) | 0 (0.0%) |
| 5 or more Children | 0 (0.0%) | 0 (0.0%) |
| Total | 256 (95.9%) | 11 (4.1%) |
Income Below Poverty Among Single-Parent Households in Dammeron Valley
| Children | Single Father | Single Mother |
| No Children | 0 (0.0%) | 0 (0.0%) |
| 1 or 2 Children | 0 (0.0%) | 0 (0.0%) |
| 3 or 4 Children | 0 (0.0%) | 0 (0.0%) |
| 5 or more Children | 0 (0.0%) | 0 (0.0%) |
| Total | 0 (0.0%) | 0 (0.0%) |
Income Below Poverty Among Married-Couple vs Single-Parent Households in Dammeron Valley
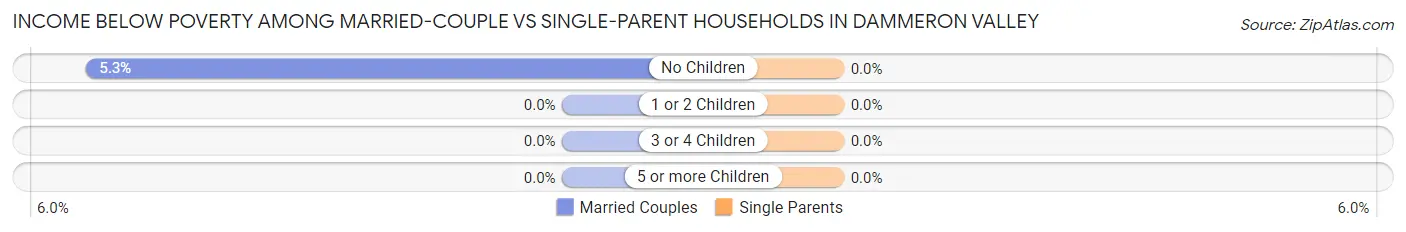
| Children | Married-Couple Families | Single-Parent Households |
| No Children | 11 (5.3%) | 0 (0.0%) |
| 1 or 2 Children | 0 (0.0%) | 0 (0.0%) |
| 3 or 4 Children | 0 (0.0%) | 0 (0.0%) |
| 5 or more Children | 0 (0.0%) | 0 (0.0%) |
| Total | 11 (4.1%) | 0 (0.0%) |
Race in Dammeron Valley
The most populous races in Dammeron Valley are White / Caucasian (796 | 97.4%), and Two or more Races (21 | 2.6%).
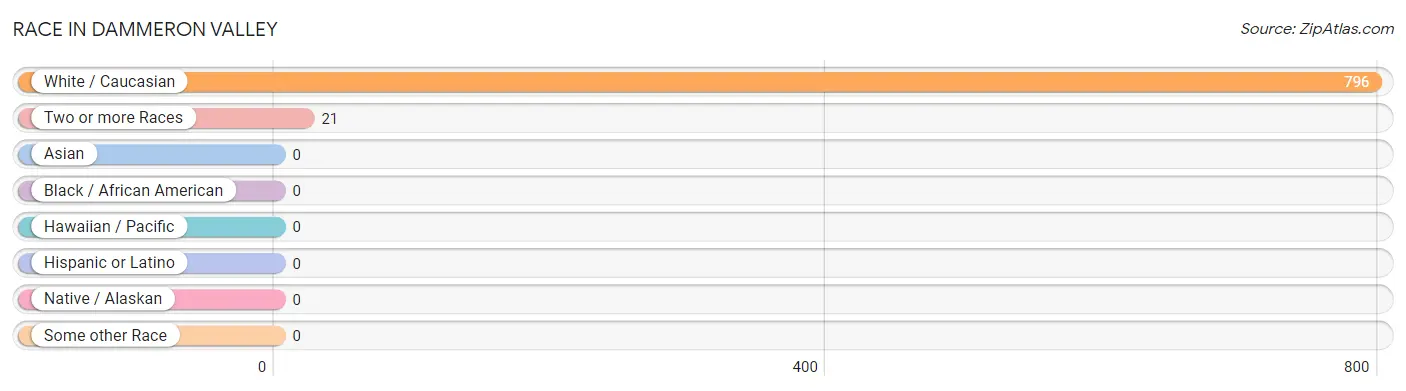
| Race | # Population | % Population |
| Asian | 0 | 0.0% |
| Black / African American | 0 | 0.0% |
| Hawaiian / Pacific | 0 | 0.0% |
| Hispanic or Latino | 0 | 0.0% |
| Native / Alaskan | 0 | 0.0% |
| White / Caucasian | 796 | 97.4% |
| Two or more Races | 21 | 2.6% |
| Some other Race | 0 | 0.0% |
| Total | 817 | 100.0% |
Ancestry in Dammeron Valley
The most populous ancestries reported in Dammeron Valley are English (315 | 38.6%), German (223 | 27.3%), Italian (130 | 15.9%), Irish (100 | 12.2%), and Polish (99 | 12.1%), together accounting for 106.1% of all Dammeron Valley residents.
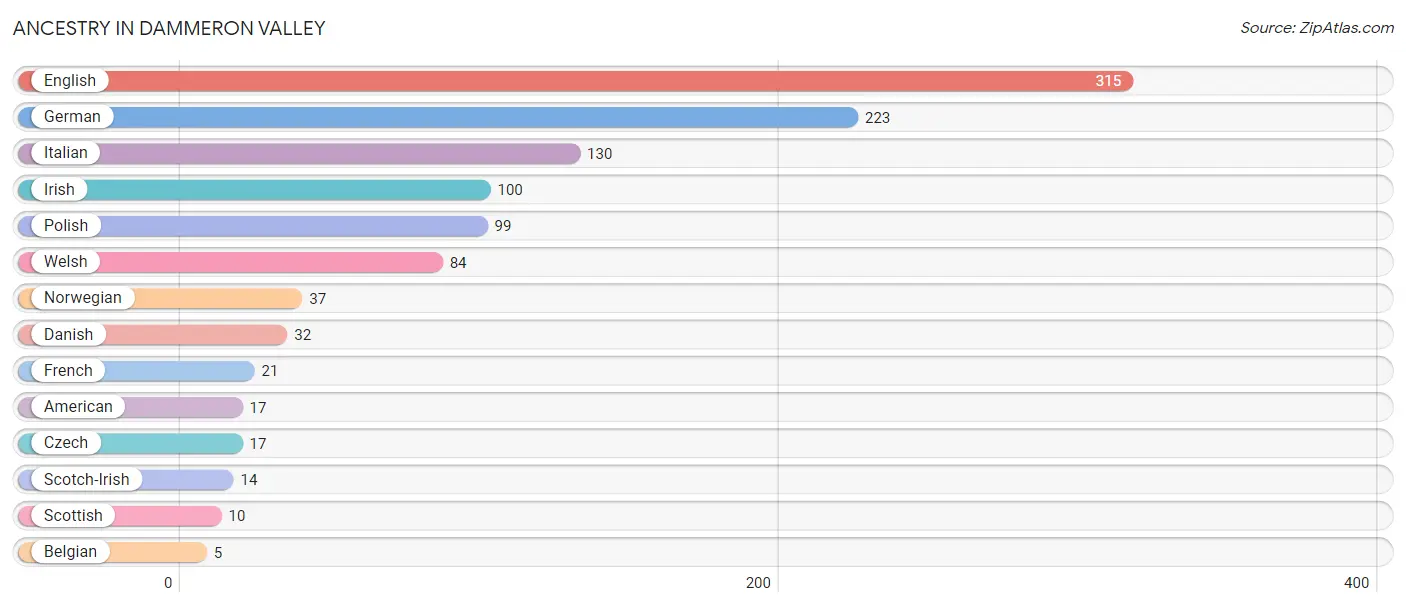
| Ancestry | # Population | % Population |
| American | 17 | 2.1% |
| Belgian | 5 | 0.6% |
| Czech | 17 | 2.1% |
| Danish | 32 | 3.9% |
| English | 315 | 38.6% |
| French | 21 | 2.6% |
| German | 223 | 27.3% |
| Irish | 100 | 12.2% |
| Italian | 130 | 15.9% |
| Norwegian | 37 | 4.5% |
| Polish | 99 | 12.1% |
| Scotch-Irish | 14 | 1.7% |
| Scottish | 10 | 1.2% |
| Welsh | 84 | 10.3% | View All 14 Rows |
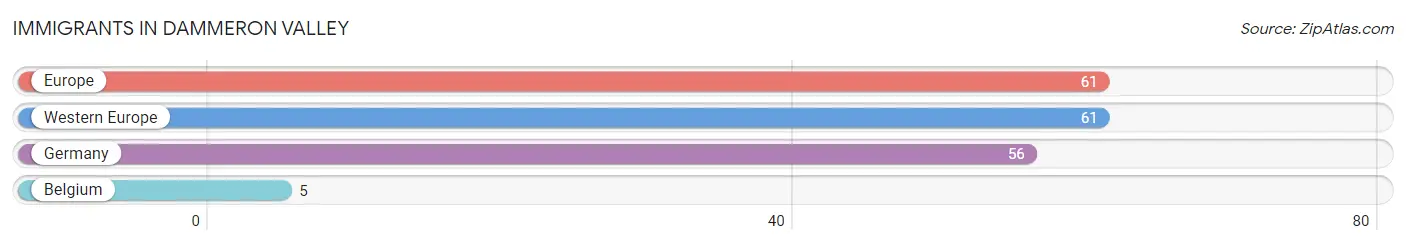
Immigrants in Dammeron Valley
The most numerous immigrant groups reported in Dammeron Valley came from Europe (61 | 7.5%), Western Europe (61 | 7.5%), Germany (56 | 6.9%), and Belgium (5 | 0.6%), together accounting for 22.4% of all Dammeron Valley residents.
| Immigration Origin | # Population | % Population |
| Belgium | 5 | 0.6% |
| Europe | 61 | 7.5% |
| Germany | 56 | 6.9% |
| Western Europe | 61 | 7.5% | View All 4 Rows |
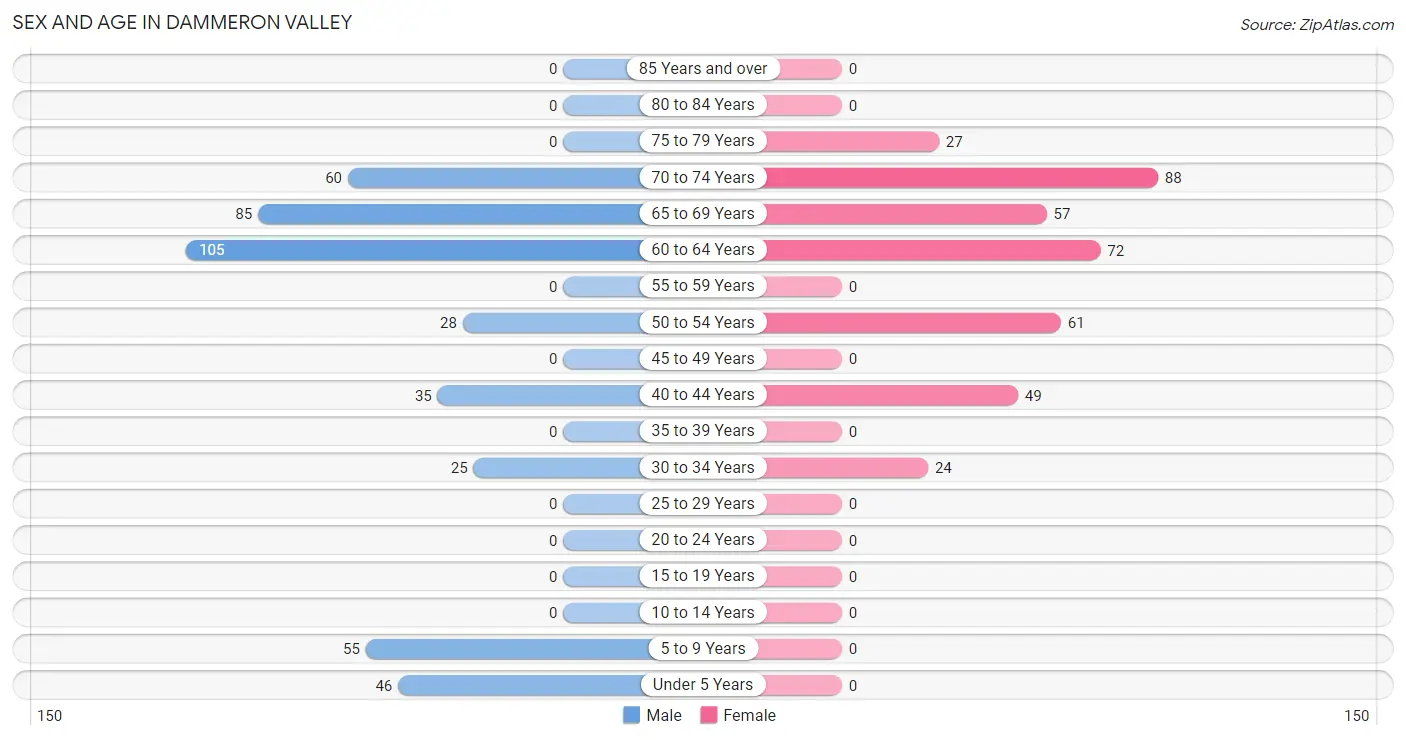
Sex and Age in Dammeron Valley
Sex and Age in Dammeron Valley
The most populous age groups in Dammeron Valley are 60 to 64 Years (105 | 23.9%) for men and 70 to 74 Years (88 | 23.3%) for women.
| Age Bracket | Male | Female |
| Under 5 Years | 46 (10.5%) | 0 (0.0%) |
| 5 to 9 Years | 55 (12.5%) | 0 (0.0%) |
| 10 to 14 Years | 0 (0.0%) | 0 (0.0%) |
| 15 to 19 Years | 0 (0.0%) | 0 (0.0%) |
| 20 to 24 Years | 0 (0.0%) | 0 (0.0%) |
| 25 to 29 Years | 0 (0.0%) | 0 (0.0%) |
| 30 to 34 Years | 25 (5.7%) | 24 (6.4%) |
| 35 to 39 Years | 0 (0.0%) | 0 (0.0%) |
| 40 to 44 Years | 35 (8.0%) | 49 (13.0%) |
| 45 to 49 Years | 0 (0.0%) | 0 (0.0%) |
| 50 to 54 Years | 28 (6.4%) | 61 (16.1%) |
| 55 to 59 Years | 0 (0.0%) | 0 (0.0%) |
| 60 to 64 Years | 105 (23.9%) | 72 (19.1%) |
| 65 to 69 Years | 85 (19.4%) | 57 (15.1%) |
| 70 to 74 Years | 60 (13.7%) | 88 (23.3%) |
| 75 to 79 Years | 0 (0.0%) | 27 (7.1%) |
| 80 to 84 Years | 0 (0.0%) | 0 (0.0%) |
| 85 Years and over | 0 (0.0%) | 0 (0.0%) |
| Total | 439 (100.0%) | 378 (100.0%) |
Families and Households in Dammeron Valley
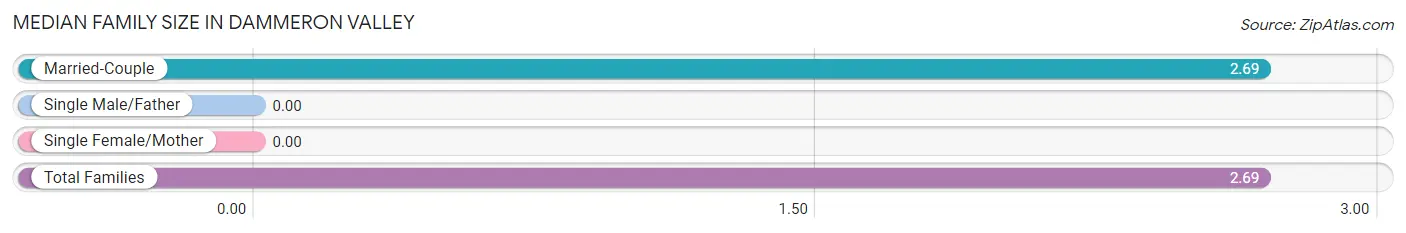
Median Family Size in Dammeron Valley
| Family Type | # Families | Family Size |
| Married-Couple | 267 (100.0%) | 2.69 |
| Single Male/Father | 0 (0.0%) | - |
| Single Female/Mother | 0 (0.0%) | - |
| Total Families | 267 (100.0%) | 2.69 |
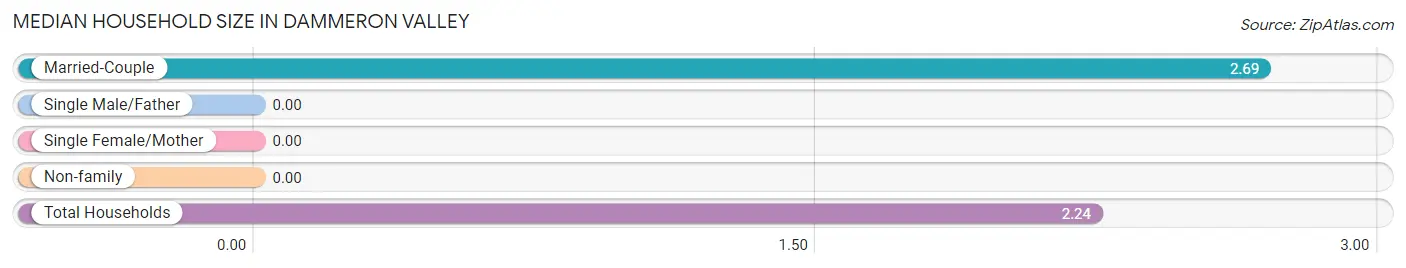
Median Household Size in Dammeron Valley
| Household Type | # Households | Household Size |
| Married-Couple | 267 (73.2%) | 2.69 |
| Single Male/Father | 0 (0.0%) | - |
| Single Female/Mother | 0 (0.0%) | - |
| Non-family | 98 (26.9%) | - |
| Total Households | 365 (100.0%) | 2.24 |
Household Size by Marriage Status in Dammeron Valley
Out of a total of 365 households in Dammeron Valley, 267 (73.2%) are family households, while 98 (26.9%) are nonfamily households. The most numerous type of family households are 2-person households, comprising 207, and the most common type of nonfamily households are 1-person households, comprising 98.
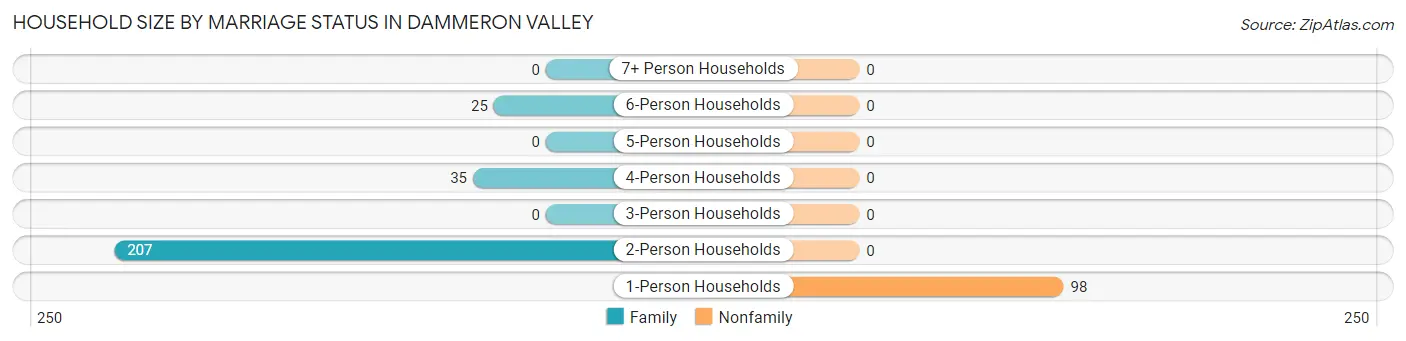
| Household Size | Family Households | Nonfamily Households |
| 1-Person Households | - | 98 (26.9%) |
| 2-Person Households | 207 (56.7%) | 0 (0.0%) |
| 3-Person Households | 0 (0.0%) | 0 (0.0%) |
| 4-Person Households | 35 (9.6%) | 0 (0.0%) |
| 5-Person Households | 0 (0.0%) | 0 (0.0%) |
| 6-Person Households | 25 (6.9%) | 0 (0.0%) |
| 7+ Person Households | 0 (0.0%) | 0 (0.0%) |
| Total | 267 (73.2%) | 98 (26.9%) |
Female Fertility in Dammeron Valley
Fertility by Age in Dammeron Valley
| Age Bracket | Women with Births | Births / 1,000 Women |
| 15 to 19 years | 0 (0.0%) | 0.0 |
| 20 to 34 years | 0 (0.0%) | 0.0 |
| 35 to 50 years | 0 (0.0%) | 0.0 |
| Total | 0 (0.0%) | 0.0 |
Fertility by Age by Marriage Status in Dammeron Valley
| Age Bracket | Married | Unmarried |
| 15 to 19 years | 0 (0.0%) | 0 (0.0%) |
| 20 to 34 years | 0 (0.0%) | 0 (0.0%) |
| 35 to 50 years | 0 (0.0%) | 0 (0.0%) |
| Total | 0 (0.0%) | 0 (0.0%) |
Fertility by Education in Dammeron Valley
| Educational Attainment | Women with Births | Births / 1,000 Women |
| Less than High School | 0 (0.0%) | 0.0 |
| High School Diploma | 0 (0.0%) | 0.0 |
| College or Associate's Degree | 0 (0.0%) | 0.0 |
| Bachelor's Degree | 0 (0.0%) | 0.0 |
| Graduate Degree | 0 (0.0%) | 0.0 |
| Total | 0 (0.0%) | 0.0 |
Fertility by Education by Marriage Status in Dammeron Valley
| Educational Attainment | Married | Unmarried |
| Less than High School | 0 (0.0%) | 0 (0.0%) |
| High School Diploma | 0 (0.0%) | 0 (0.0%) |
| College or Associate's Degree | 0 (0.0%) | 0 (0.0%) |
| Bachelor's Degree | 0 (0.0%) | 0 (0.0%) |
| Graduate Degree | 0 (0.0%) | 0 (0.0%) |
| Total | 0 (0.0%) | 0 (0.0%) |
Employment Characteristics in Dammeron Valley
Employment by Class of Employer in Dammeron Valley
Among the 130 employed individuals in Dammeron Valley, private company employees (92 | 70.8%), and self-employed (not incorporated) (38 | 29.2%) make up the most common classes of employment.
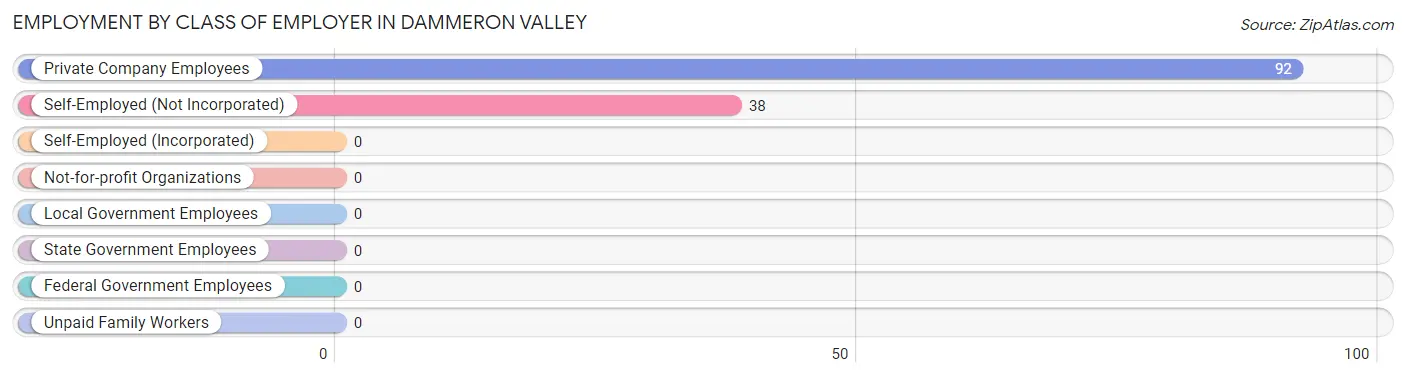
| Employer Class | # Employees | % Employees |
| Private Company Employees | 92 | 70.8% |
| Self-Employed (Incorporated) | 0 | 0.0% |
| Self-Employed (Not Incorporated) | 38 | 29.2% |
| Not-for-profit Organizations | 0 | 0.0% |
| Local Government Employees | 0 | 0.0% |
| State Government Employees | 0 | 0.0% |
| Federal Government Employees | 0 | 0.0% |
| Unpaid Family Workers | 0 | 0.0% |
| Total | 130 | 100.0% |
Employment Status by Age in Dammeron Valley
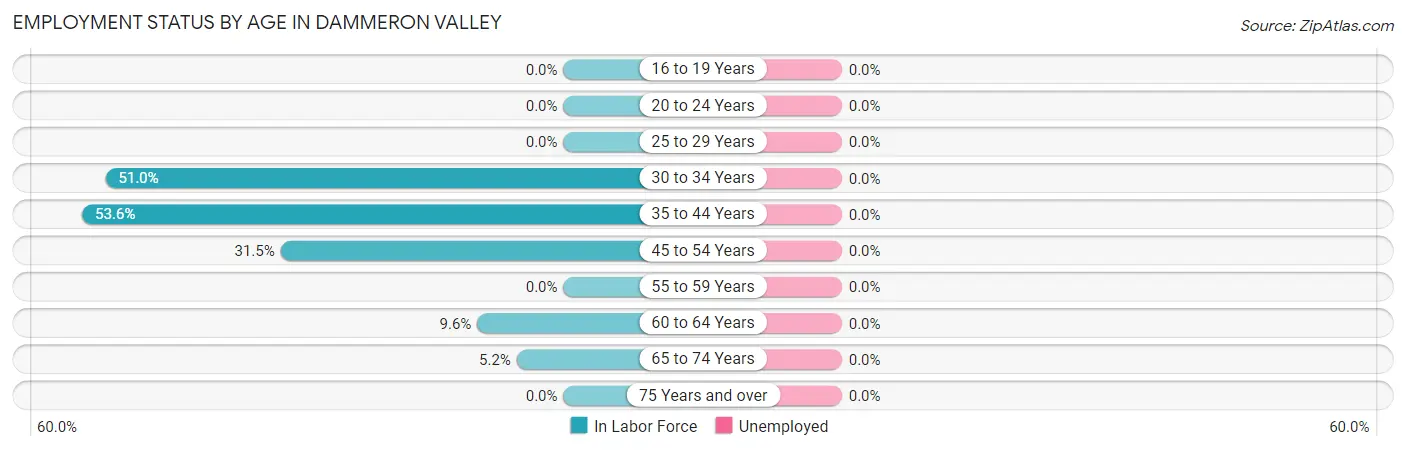
| Age Bracket | In Labor Force | Unemployed |
| 16 to 19 Years | 0 (0.0%) | 0 (0.0%) |
| 20 to 24 Years | 0 (0.0%) | 0 (0.0%) |
| 25 to 29 Years | 0 (0.0%) | 0 (0.0%) |
| 30 to 34 Years | 25 (51.0%) | 0 (0.0%) |
| 35 to 44 Years | 45 (53.6%) | 0 (0.0%) |
| 45 to 54 Years | 28 (31.5%) | 0 (0.0%) |
| 55 to 59 Years | 0 (0.0%) | 0 (0.0%) |
| 60 to 64 Years | 17 (9.6%) | 0 (0.0%) |
| 65 to 74 Years | 15 (5.2%) | 0 (0.0%) |
| 75 Years and over | 0 (0.0%) | 0 (0.0%) |
| Total | 130 (18.2%) | 0 (0.0%) |
Employment Status by Educational Attainment in Dammeron Valley
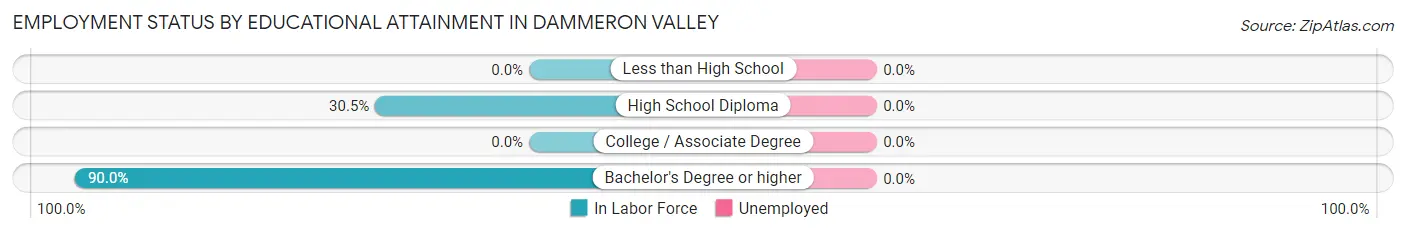
| Educational Attainment | In Labor Force | Unemployed |
| Less than High School | 0 (0.0%) | 0 (0.0%) |
| High School Diploma | 25 (30.5%) | 0 (0.0%) |
| College / Associate Degree | 0 (0.0%) | 0 (0.0%) |
| Bachelor's Degree or higher | 90 (90.0%) | 0 (0.0%) |
| Total | 115 (28.8%) | 0 (0.0%) |
Employment Occupations by Sex in Dammeron Valley
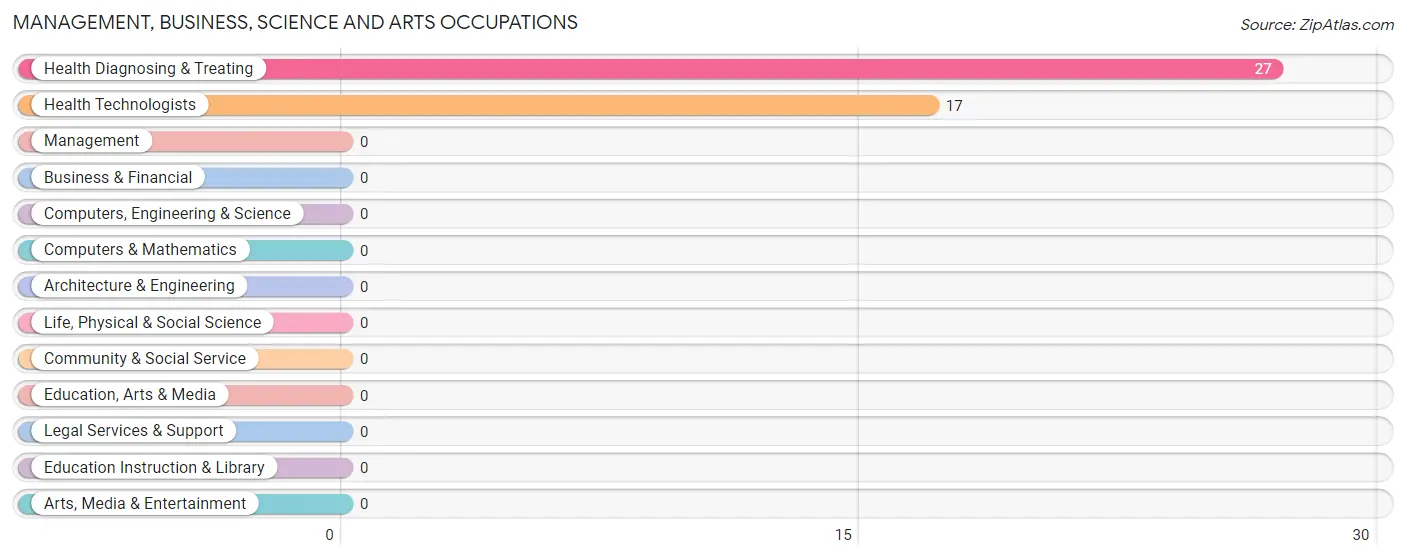
Management, Business, Science and Arts Occupations
The most common Management, Business, Science and Arts occupations in Dammeron Valley are Health Diagnosing & Treating (27 | 20.8%), and Health Technologists (17 | 13.1%).
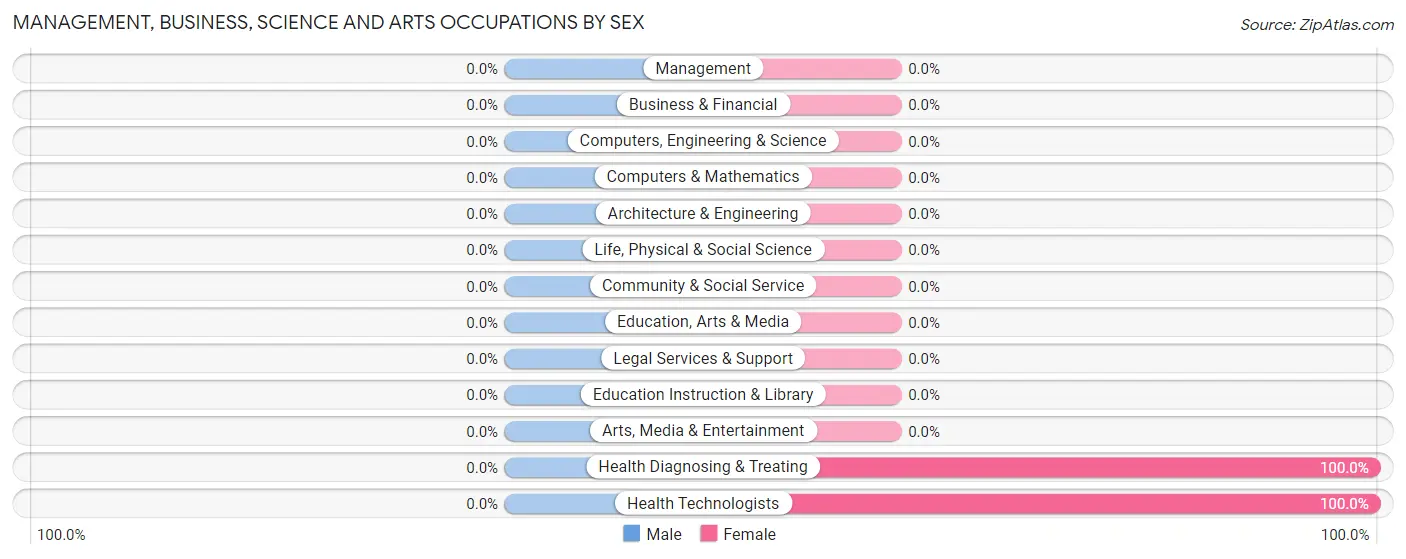
Management, Business, Science and Arts Occupations by Sex
| Occupation | Male | Female |
| Management | 0 (0.0%) | 0 (0.0%) |
| Business & Financial | 0 (0.0%) | 0 (0.0%) |
| Computers, Engineering & Science | 0 (0.0%) | 0 (0.0%) |
| Computers & Mathematics | 0 (0.0%) | 0 (0.0%) |
| Architecture & Engineering | 0 (0.0%) | 0 (0.0%) |
| Life, Physical & Social Science | 0 (0.0%) | 0 (0.0%) |
| Community & Social Service | 0 (0.0%) | 0 (0.0%) |
| Education, Arts & Media | 0 (0.0%) | 0 (0.0%) |
| Legal Services & Support | 0 (0.0%) | 0 (0.0%) |
| Education Instruction & Library | 0 (0.0%) | 0 (0.0%) |
| Arts, Media & Entertainment | 0 (0.0%) | 0 (0.0%) |
| Health Diagnosing & Treating | 0 (0.0%) | 27 (100.0%) |
| Health Technologists | 0 (0.0%) | 17 (100.0%) |
| Total (Category) | 0 (0.0%) | 27 (100.0%) |
| Total (Overall) | 88 (67.7%) | 42 (32.3%) |
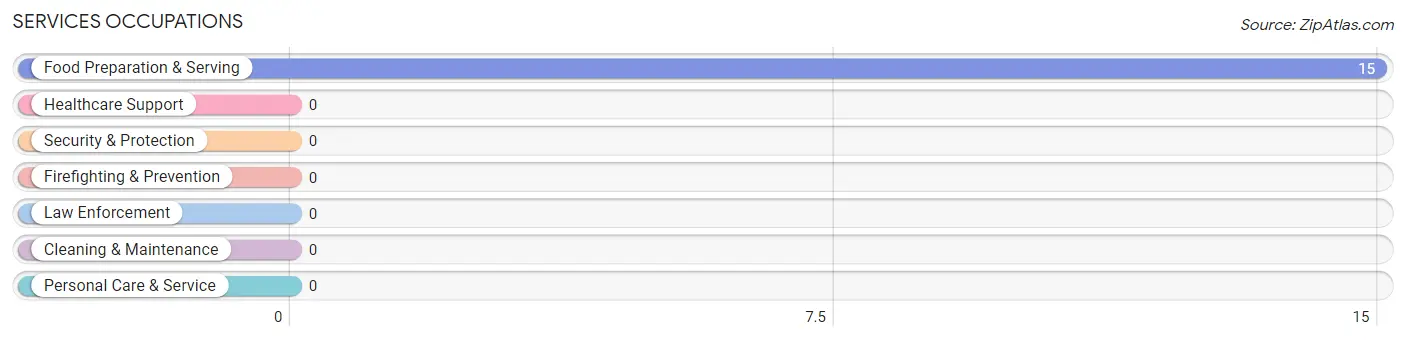
Services Occupations
The most common Services occupations in Dammeron Valley are , and Food Preparation & Serving (15 | 11.5%).
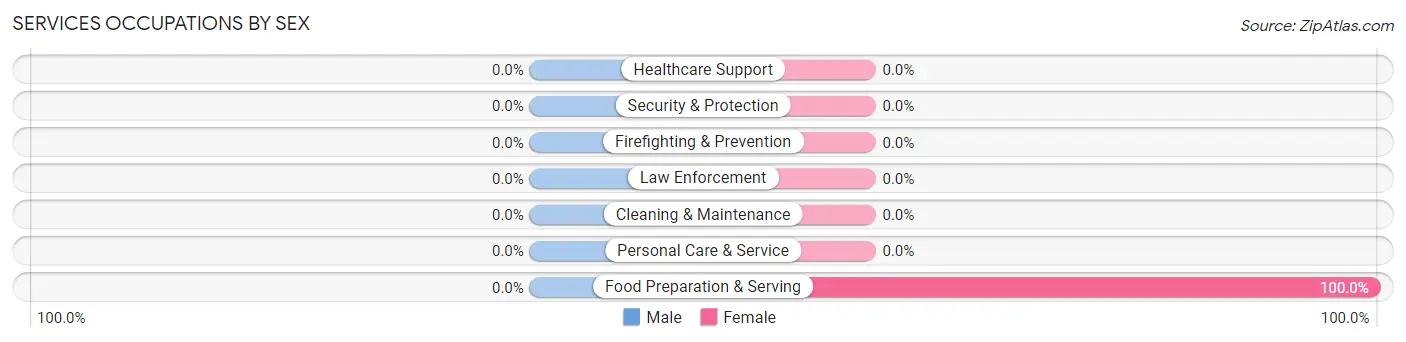
Services Occupations by Sex
| Occupation | Male | Female |
| Healthcare Support | 0 (0.0%) | 0 (0.0%) |
| Security & Protection | 0 (0.0%) | 0 (0.0%) |
| Firefighting & Prevention | 0 (0.0%) | 0 (0.0%) |
| Law Enforcement | 0 (0.0%) | 0 (0.0%) |
| Food Preparation & Serving | 0 (0.0%) | 15 (100.0%) |
| Cleaning & Maintenance | 0 (0.0%) | 0 (0.0%) |
| Personal Care & Service | 0 (0.0%) | 0 (0.0%) |
| Total (Category) | 0 (0.0%) | 15 (100.0%) |
| Total (Overall) | 88 (67.7%) | 42 (32.3%) |
Sales and Office Occupations
The most common Sales and Office occupations in Dammeron Valley are , and Sales & Related (25 | 19.2%).
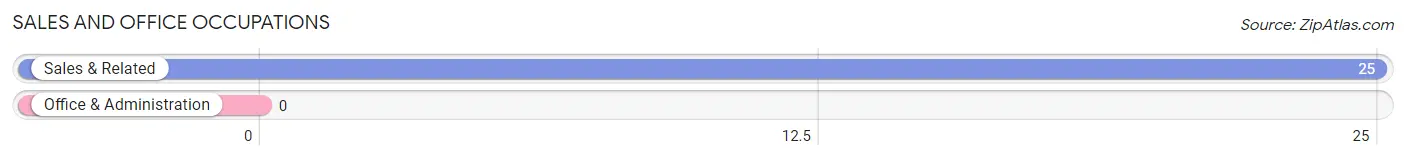
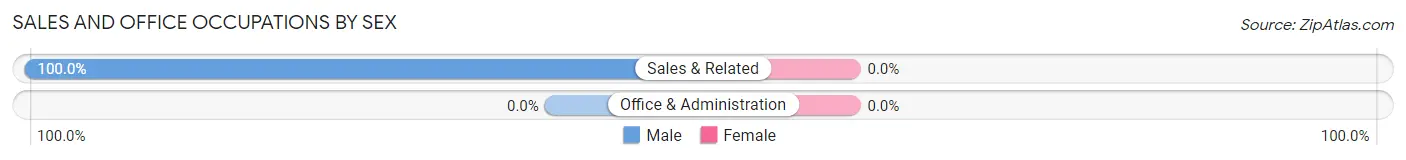
Sales and Office Occupations by Sex
| Occupation | Male | Female |
| Sales & Related | 25 (100.0%) | 0 (0.0%) |
| Office & Administration | 0 (0.0%) | 0 (0.0%) |
| Total (Category) | 25 (100.0%) | 0 (0.0%) |
| Total (Overall) | 88 (67.7%) | 42 (32.3%) |
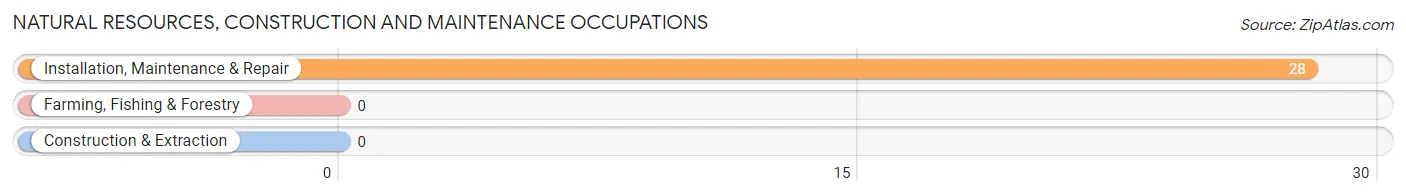
Natural Resources, Construction and Maintenance Occupations
The most common Natural Resources, Construction and Maintenance occupations in Dammeron Valley are , and Installation, Maintenance & Repair (28 | 21.5%).
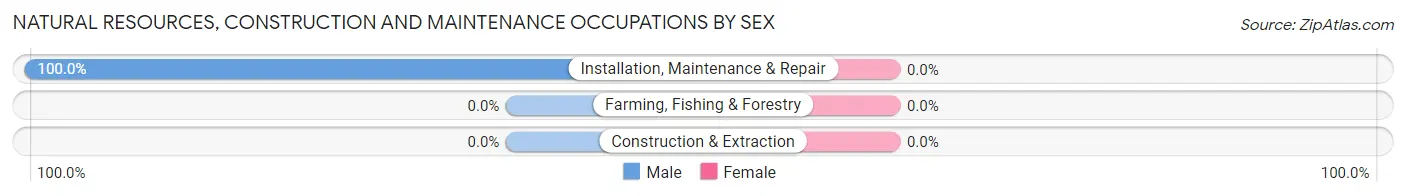
Natural Resources, Construction and Maintenance Occupations by Sex
| Occupation | Male | Female |
| Farming, Fishing & Forestry | 0 (0.0%) | 0 (0.0%) |
| Construction & Extraction | 0 (0.0%) | 0 (0.0%) |
| Installation, Maintenance & Repair | 28 (100.0%) | 0 (0.0%) |
| Total (Category) | 28 (100.0%) | 0 (0.0%) |
| Total (Overall) | 88 (67.7%) | 42 (32.3%) |
Production, Transportation and Moving Occupations
The most common Production, Transportation and Moving occupations in Dammeron Valley are , and Transportation (35 | 26.9%).
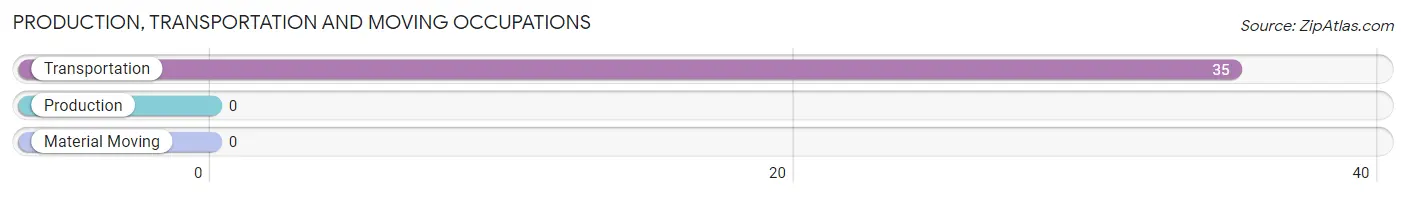
Production, Transportation and Moving Occupations by Sex
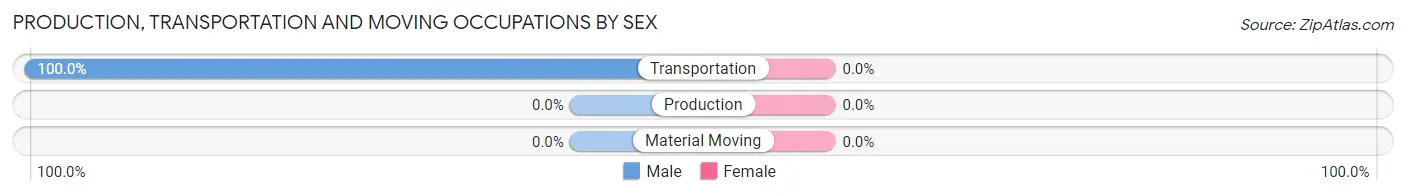
| Occupation | Male | Female |
| Production | 0 (0.0%) | 0 (0.0%) |
| Transportation | 35 (100.0%) | 0 (0.0%) |
| Material Moving | 0 (0.0%) | 0 (0.0%) |
| Total (Category) | 35 (100.0%) | 0 (0.0%) |
| Total (Overall) | 88 (67.7%) | 42 (32.3%) |
Employment Industries by Sex in Dammeron Valley
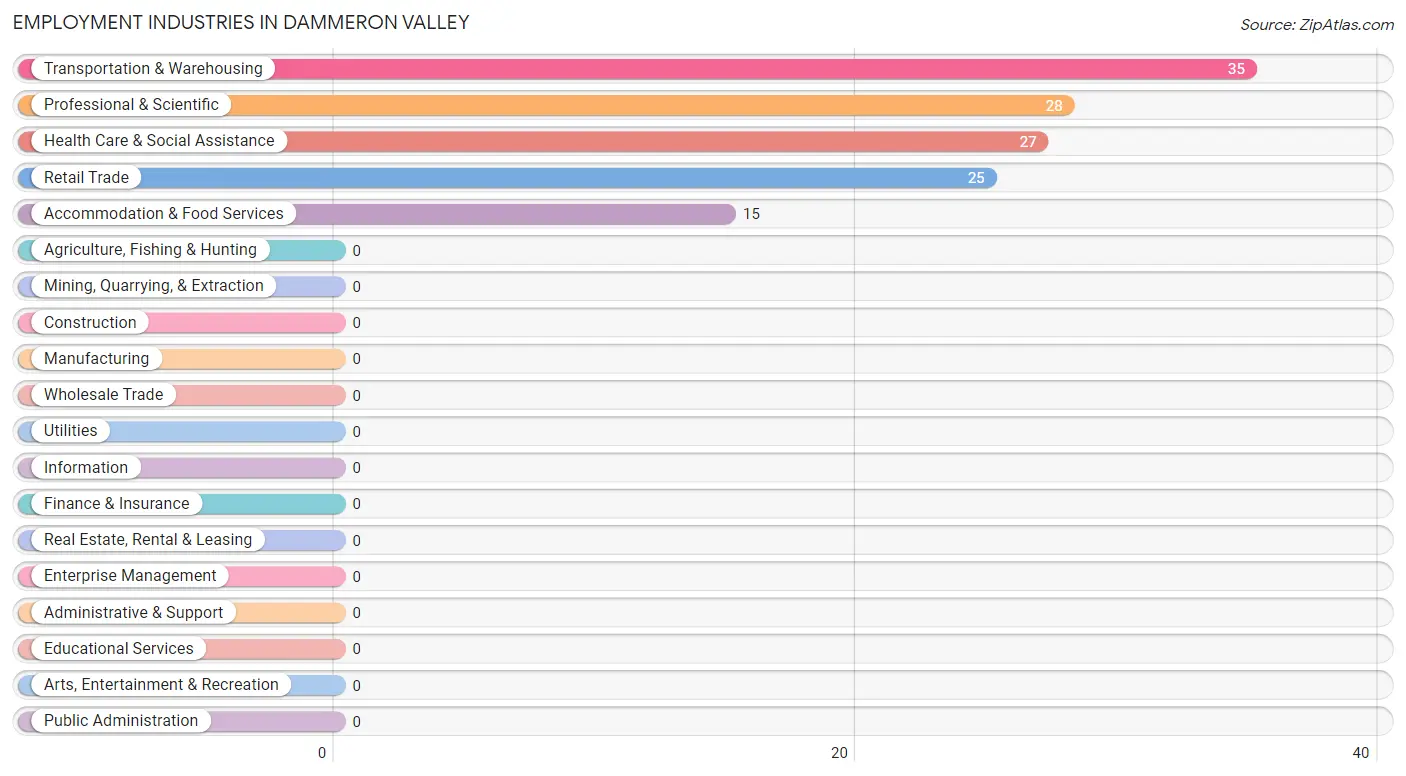
Employment Industries in Dammeron Valley
The major employment industries in Dammeron Valley include Transportation & Warehousing (35 | 26.9%), Professional & Scientific (28 | 21.5%), Health Care & Social Assistance (27 | 20.8%), Retail Trade (25 | 19.2%), and Accommodation & Food Services (15 | 11.5%).
Employment Industries by Sex in Dammeron Valley
The Dammeron Valley industries that see more men than women are Retail Trade (100.0%), Transportation & Warehousing (100.0%), and Professional & Scientific (100.0%), whereas the industries that tend to have a higher number of women are Health Care & Social Assistance (100.0%), and Accommodation & Food Services (100.0%).
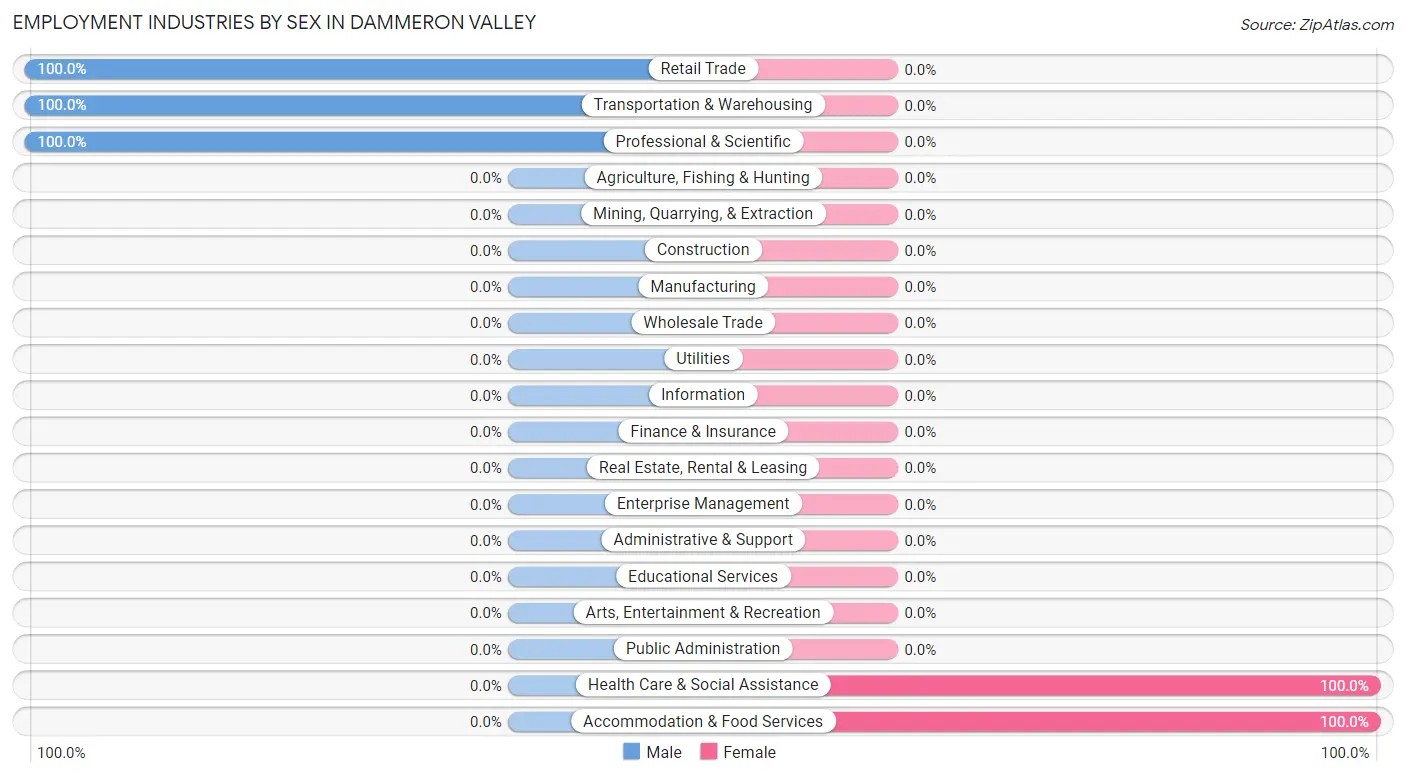
| Industry | Male | Female |
| Agriculture, Fishing & Hunting | 0 (0.0%) | 0 (0.0%) |
| Mining, Quarrying, & Extraction | 0 (0.0%) | 0 (0.0%) |
| Construction | 0 (0.0%) | 0 (0.0%) |
| Manufacturing | 0 (0.0%) | 0 (0.0%) |
| Wholesale Trade | 0 (0.0%) | 0 (0.0%) |
| Retail Trade | 25 (100.0%) | 0 (0.0%) |
| Transportation & Warehousing | 35 (100.0%) | 0 (0.0%) |
| Utilities | 0 (0.0%) | 0 (0.0%) |
| Information | 0 (0.0%) | 0 (0.0%) |
| Finance & Insurance | 0 (0.0%) | 0 (0.0%) |
| Real Estate, Rental & Leasing | 0 (0.0%) | 0 (0.0%) |
| Professional & Scientific | 28 (100.0%) | 0 (0.0%) |
| Enterprise Management | 0 (0.0%) | 0 (0.0%) |
| Administrative & Support | 0 (0.0%) | 0 (0.0%) |
| Educational Services | 0 (0.0%) | 0 (0.0%) |
| Health Care & Social Assistance | 0 (0.0%) | 27 (100.0%) |
| Arts, Entertainment & Recreation | 0 (0.0%) | 0 (0.0%) |
| Accommodation & Food Services | 0 (0.0%) | 15 (100.0%) |
| Public Administration | 0 (0.0%) | 0 (0.0%) |
| Total | 88 (67.7%) | 42 (32.3%) |
Education in Dammeron Valley
School Enrollment in Dammeron Valley
The most common levels of schooling among the 87 students in Dammeron Valley are nursery / preschool (59 | 67.8%), and graduate / professional (28 | 32.2%).
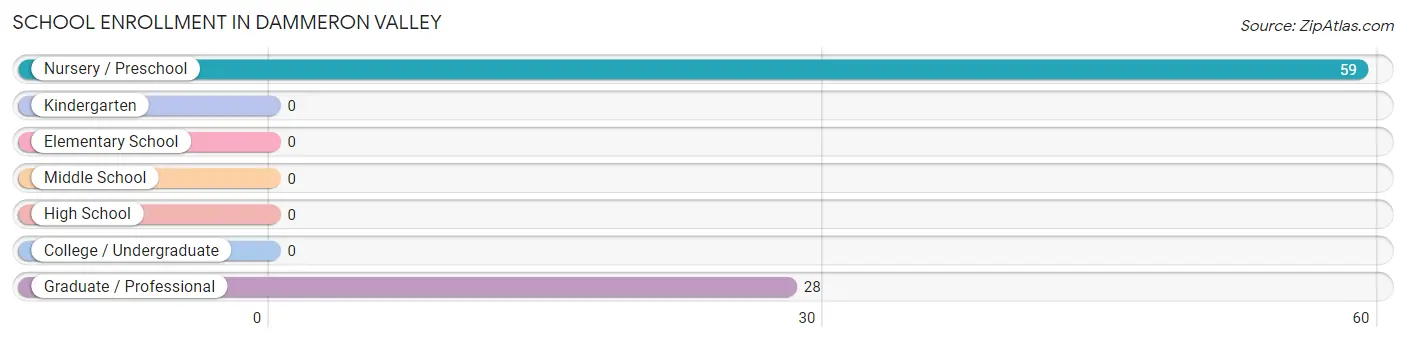
| School Level | # Students | % Students |
| Nursery / Preschool | 59 | 67.8% |
| Kindergarten | 0 | 0.0% |
| Elementary School | 0 | 0.0% |
| Middle School | 0 | 0.0% |
| High School | 0 | 0.0% |
| College / Undergraduate | 0 | 0.0% |
| Graduate / Professional | 28 | 32.2% |
| Total | 87 | 100.0% |
School Enrollment by Age by Funding Source in Dammeron Valley
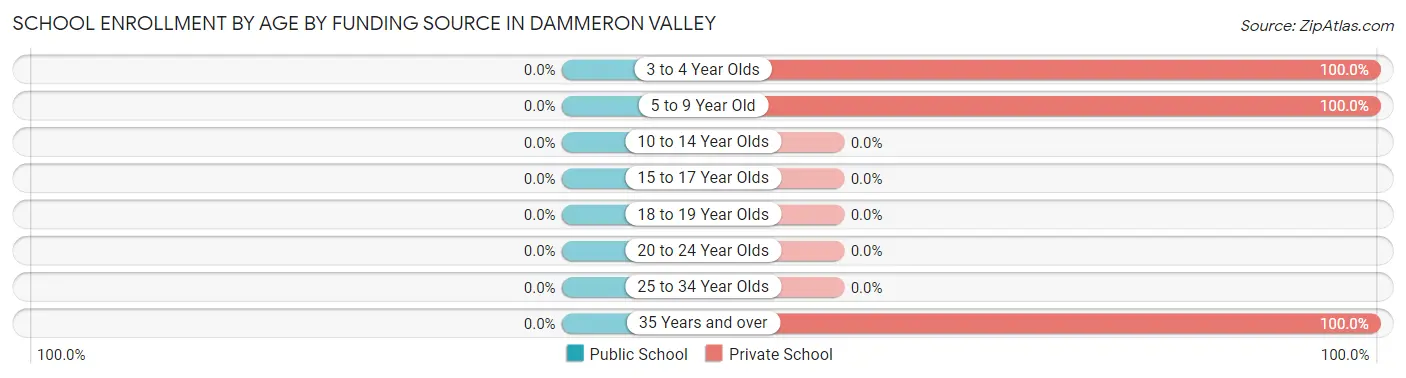
| Age Bracket | Public School | Private School |
| 3 to 4 Year Olds | 0 (0.0%) | 27 (100.0%) |
| 5 to 9 Year Old | 0 (0.0%) | 32 (100.0%) |
| 10 to 14 Year Olds | 0 (0.0%) | 0 (0.0%) |
| 15 to 17 Year Olds | 0 (0.0%) | 0 (0.0%) |
| 18 to 19 Year Olds | 0 (0.0%) | 0 (0.0%) |
| 20 to 24 Year Olds | 0 (0.0%) | 0 (0.0%) |
| 25 to 34 Year Olds | 0 (0.0%) | 0 (0.0%) |
| 35 Years and over | 0 (0.0%) | 28 (100.0%) |
| Total | 0 (0.0%) | 87 (100.0%) |
Educational Attainment by Field of Study in Dammeron Valley
Education (76 | 24.0%), business (56 | 17.7%), social sciences (50 | 15.8%), science & technology (43 | 13.6%), and engineering (28 | 8.8%) are the most common fields of study among 317 individuals in Dammeron Valley who have obtained a bachelor's degree or higher.
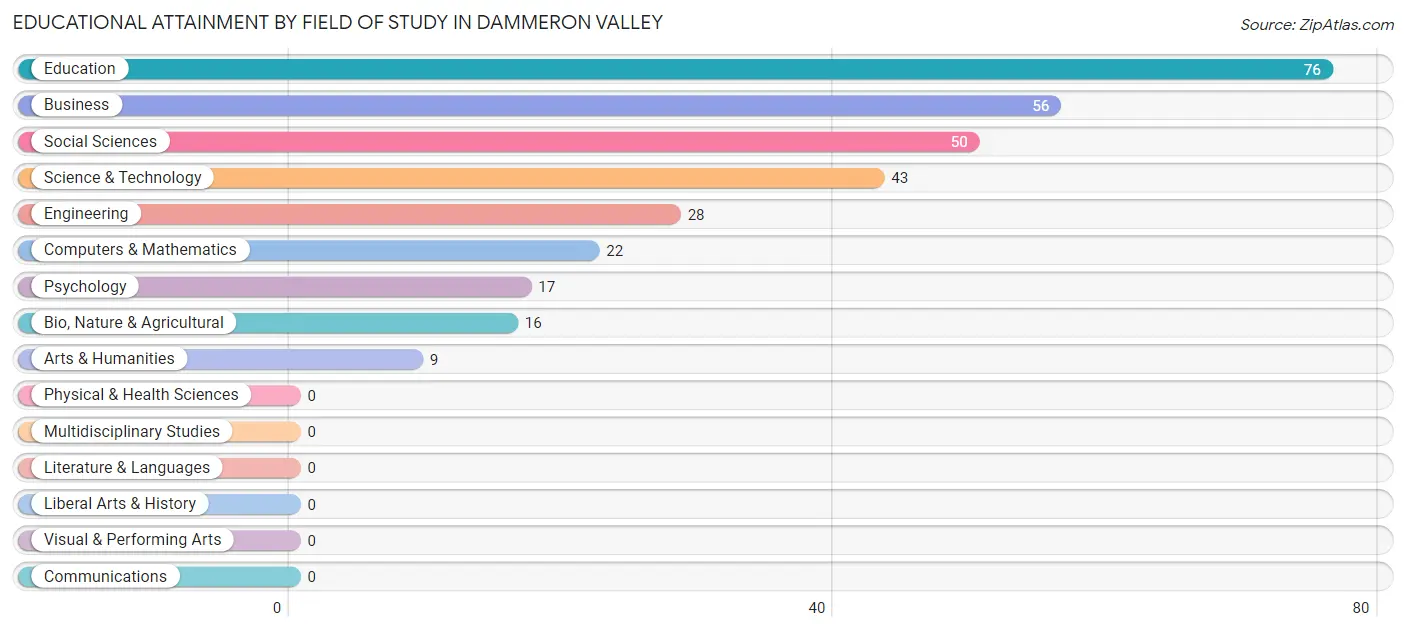
| Field of Study | # Graduates | % Graduates |
| Computers & Mathematics | 22 | 6.9% |
| Bio, Nature & Agricultural | 16 | 5.1% |
| Physical & Health Sciences | 0 | 0.0% |
| Psychology | 17 | 5.4% |
| Social Sciences | 50 | 15.8% |
| Engineering | 28 | 8.8% |
| Multidisciplinary Studies | 0 | 0.0% |
| Science & Technology | 43 | 13.6% |
| Business | 56 | 17.7% |
| Education | 76 | 24.0% |
| Literature & Languages | 0 | 0.0% |
| Liberal Arts & History | 0 | 0.0% |
| Visual & Performing Arts | 0 | 0.0% |
| Communications | 0 | 0.0% |
| Arts & Humanities | 9 | 2.8% |
| Total | 317 | 100.0% |
Transportation & Commute in Dammeron Valley
Vehicle Availability by Sex in Dammeron Valley
The most prevalent vehicle ownership categories in Dammeron Valley are males with 2 vehicles (53, accounting for 60.2%) and females with 2 vehicles (32, making up 126.2%).
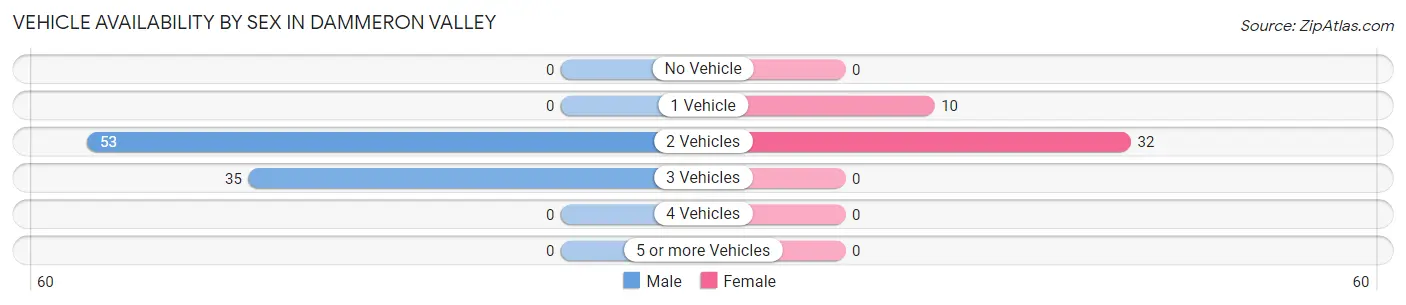
| Vehicles Available | Male | Female |
| No Vehicle | 0 (0.0%) | 0 (0.0%) |
| 1 Vehicle | 0 (0.0%) | 10 (23.8%) |
| 2 Vehicles | 53 (60.2%) | 32 (76.2%) |
| 3 Vehicles | 35 (39.8%) | 0 (0.0%) |
| 4 Vehicles | 0 (0.0%) | 0 (0.0%) |
| 5 or more Vehicles | 0 (0.0%) | 0 (0.0%) |
| Total | 88 (100.0%) | 42 (100.0%) |
Commute Time in Dammeron Valley
The most frequently occuring commute durations in Dammeron Valley are 90 or more minutes (60 commuters, 46.2%), 30 to 34 minutes (53 commuters, 40.8%), and 25 to 29 minutes (17 commuters, 13.1%).
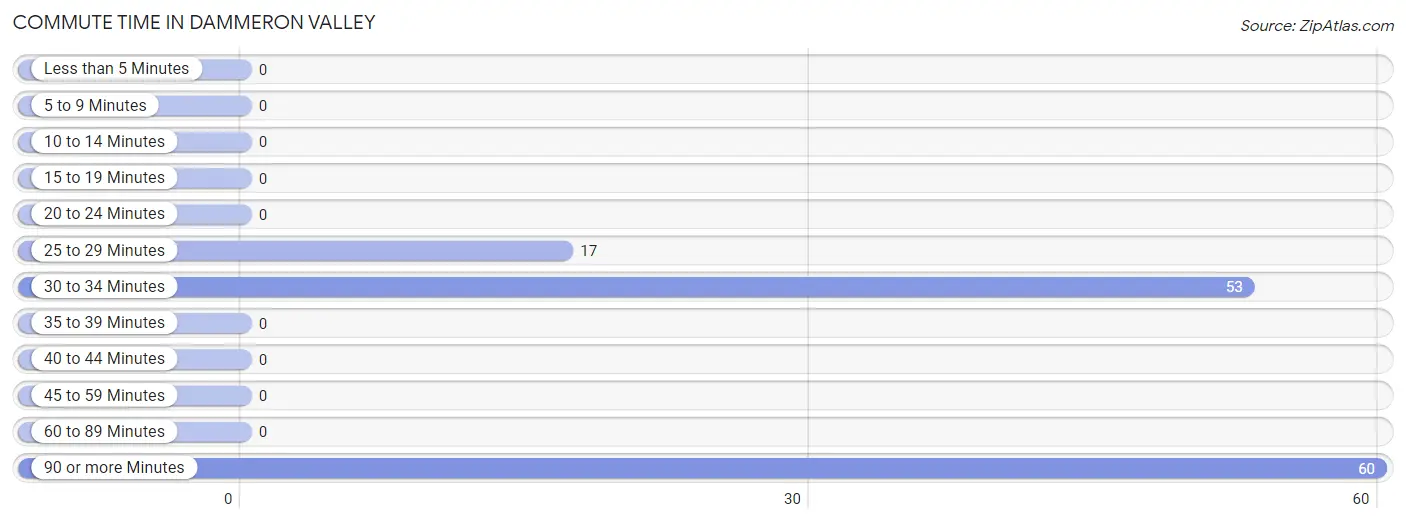
| Commute Time | # Commuters | % Commuters |
| Less than 5 Minutes | 0 | 0.0% |
| 5 to 9 Minutes | 0 | 0.0% |
| 10 to 14 Minutes | 0 | 0.0% |
| 15 to 19 Minutes | 0 | 0.0% |
| 20 to 24 Minutes | 0 | 0.0% |
| 25 to 29 Minutes | 17 | 13.1% |
| 30 to 34 Minutes | 53 | 40.8% |
| 35 to 39 Minutes | 0 | 0.0% |
| 40 to 44 Minutes | 0 | 0.0% |
| 45 to 59 Minutes | 0 | 0.0% |
| 60 to 89 Minutes | 0 | 0.0% |
| 90 or more Minutes | 60 | 46.2% |
Commute Time by Sex in Dammeron Valley
The most common commute times in Dammeron Valley are 90 or more minutes (60 commuters, 68.2%) for males and 30 to 34 minutes (25 commuters, 59.5%) for females.
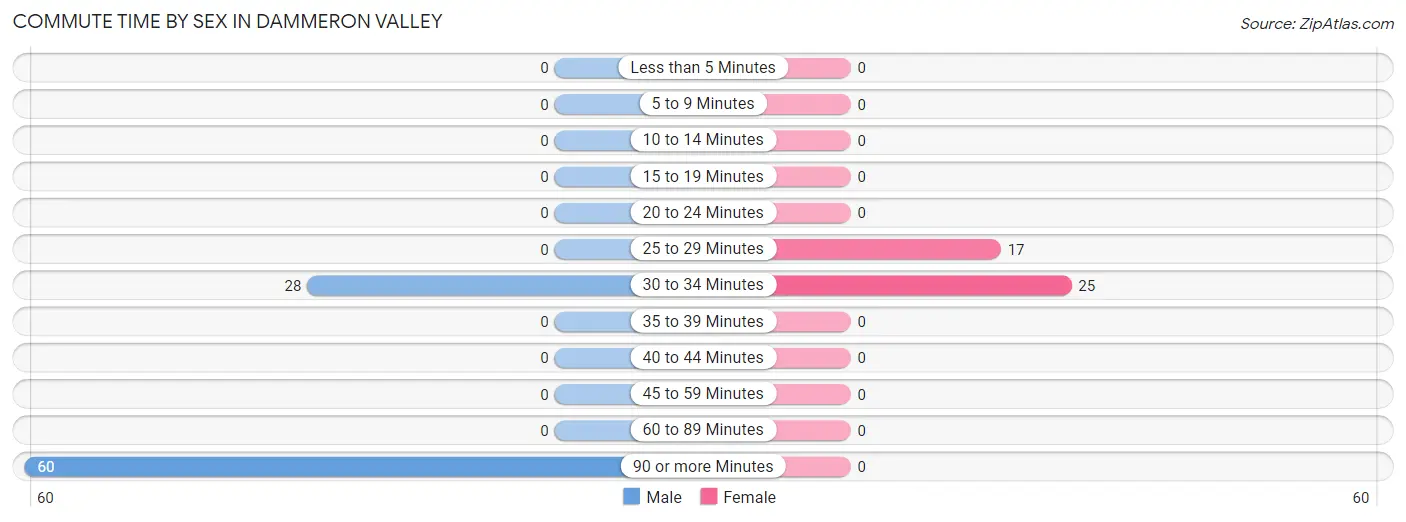
| Commute Time | Male | Female |
| Less than 5 Minutes | 0 (0.0%) | 0 (0.0%) |
| 5 to 9 Minutes | 0 (0.0%) | 0 (0.0%) |
| 10 to 14 Minutes | 0 (0.0%) | 0 (0.0%) |
| 15 to 19 Minutes | 0 (0.0%) | 0 (0.0%) |
| 20 to 24 Minutes | 0 (0.0%) | 0 (0.0%) |
| 25 to 29 Minutes | 0 (0.0%) | 17 (40.5%) |
| 30 to 34 Minutes | 28 (31.8%) | 25 (59.5%) |
| 35 to 39 Minutes | 0 (0.0%) | 0 (0.0%) |
| 40 to 44 Minutes | 0 (0.0%) | 0 (0.0%) |
| 45 to 59 Minutes | 0 (0.0%) | 0 (0.0%) |
| 60 to 89 Minutes | 0 (0.0%) | 0 (0.0%) |
| 90 or more Minutes | 60 (68.2%) | 0 (0.0%) |
Time of Departure to Work by Sex in Dammeron Valley
The most frequent times of departure to work in Dammeron Valley are 12:00 AM to 4:59 AM (35, 39.8%) for males and 7:30 AM to 7:59 AM (17, 40.5%) for females.
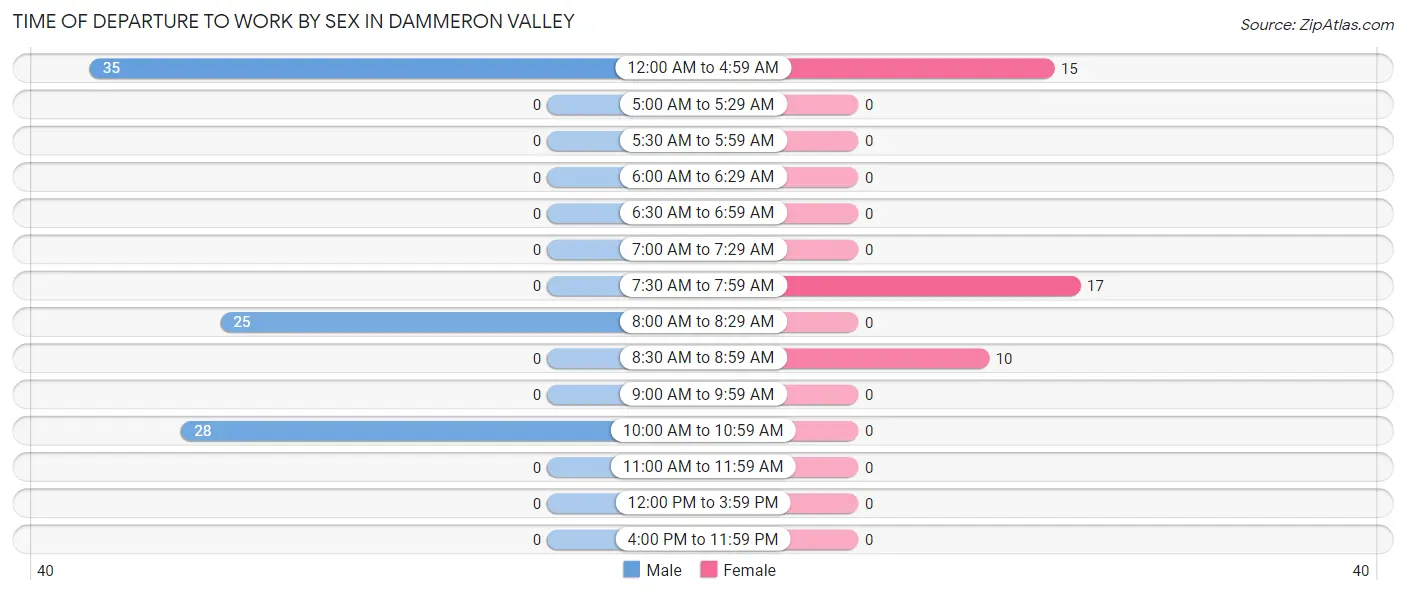
| Time of Departure | Male | Female |
| 12:00 AM to 4:59 AM | 35 (39.8%) | 15 (35.7%) |
| 5:00 AM to 5:29 AM | 0 (0.0%) | 0 (0.0%) |
| 5:30 AM to 5:59 AM | 0 (0.0%) | 0 (0.0%) |
| 6:00 AM to 6:29 AM | 0 (0.0%) | 0 (0.0%) |
| 6:30 AM to 6:59 AM | 0 (0.0%) | 0 (0.0%) |
| 7:00 AM to 7:29 AM | 0 (0.0%) | 0 (0.0%) |
| 7:30 AM to 7:59 AM | 0 (0.0%) | 17 (40.5%) |
| 8:00 AM to 8:29 AM | 25 (28.4%) | 0 (0.0%) |
| 8:30 AM to 8:59 AM | 0 (0.0%) | 10 (23.8%) |
| 9:00 AM to 9:59 AM | 0 (0.0%) | 0 (0.0%) |
| 10:00 AM to 10:59 AM | 28 (31.8%) | 0 (0.0%) |
| 11:00 AM to 11:59 AM | 0 (0.0%) | 0 (0.0%) |
| 12:00 PM to 3:59 PM | 0 (0.0%) | 0 (0.0%) |
| 4:00 PM to 11:59 PM | 0 (0.0%) | 0 (0.0%) |
| Total | 88 (100.0%) | 42 (100.0%) |
Housing Occupancy in Dammeron Valley
Occupancy by Ownership in Dammeron Valley
Of the total 365 dwellings in Dammeron Valley, owner-occupied units account for 365 (100.0%), while renter-occupied units make up 0 (0.0%).
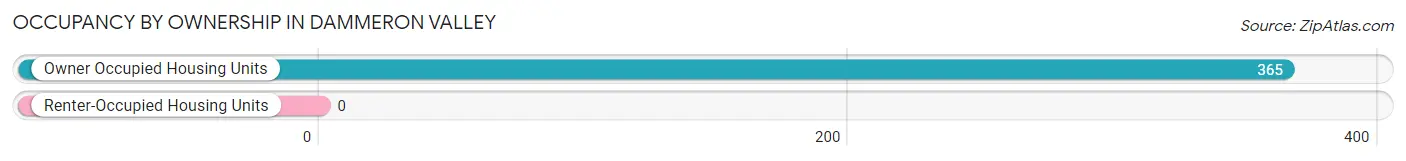
| Occupancy | # Housing Units | % Housing Units |
| Owner Occupied Housing Units | 365 | 100.0% |
| Renter-Occupied Housing Units | 0 | 0.0% |
| Total Occupied Housing Units | 365 | 100.0% |
Occupancy by Household Size in Dammeron Valley
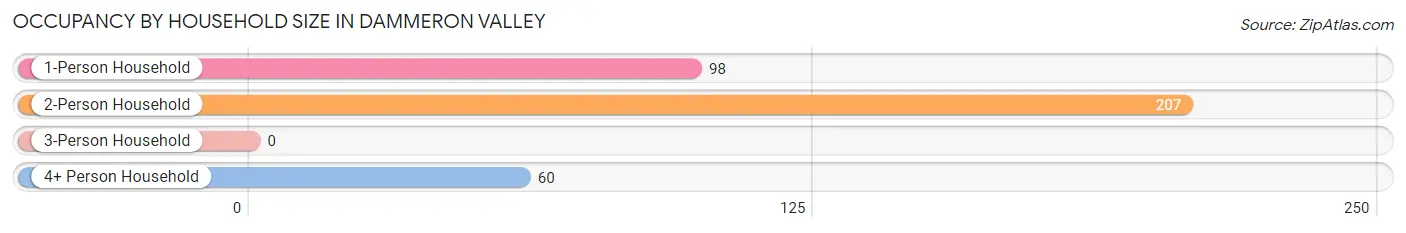
| Household Size | # Housing Units | % Housing Units |
| 1-Person Household | 98 | 26.9% |
| 2-Person Household | 207 | 56.7% |
| 3-Person Household | 0 | 0.0% |
| 4+ Person Household | 60 | 16.4% |
| Total Housing Units | 365 | 100.0% |
Occupancy by Ownership by Household Size in Dammeron Valley
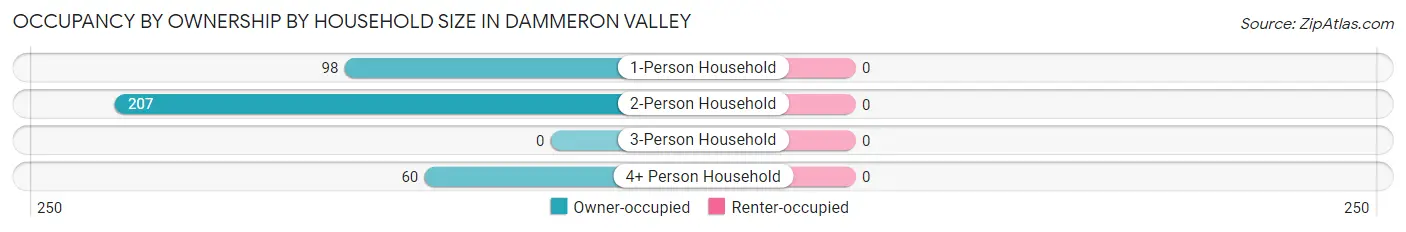
| Household Size | Owner-occupied | Renter-occupied |
| 1-Person Household | 98 (100.0%) | 0 (0.0%) |
| 2-Person Household | 207 (100.0%) | 0 (0.0%) |
| 3-Person Household | 0 (0.0%) | 0 (0.0%) |
| 4+ Person Household | 60 (100.0%) | 0 (0.0%) |
| Total Housing Units | 365 (100.0%) | 0 (0.0%) |
Occupancy by Educational Attainment in Dammeron Valley
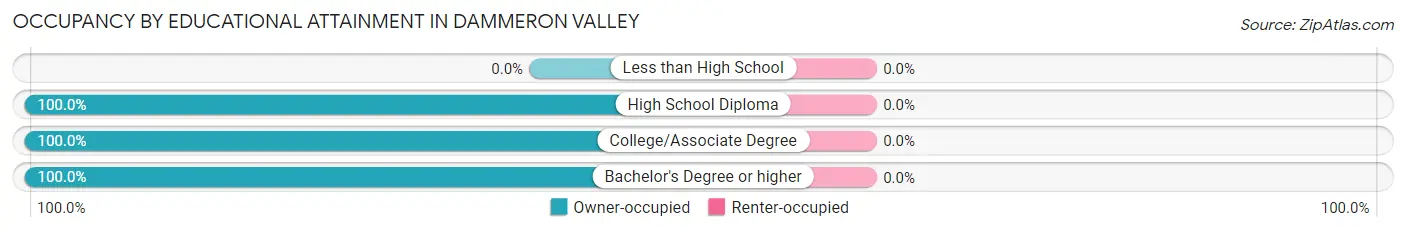
| Household Size | Owner-occupied | Renter-occupied |
| Less than High School | 0 (0.0%) | 0 (0.0%) |
| High School Diploma | 69 (100.0%) | 0 (0.0%) |
| College/Associate Degree | 92 (100.0%) | 0 (0.0%) |
| Bachelor's Degree or higher | 204 (100.0%) | 0 (0.0%) |
Occupancy by Age of Householder in Dammeron Valley
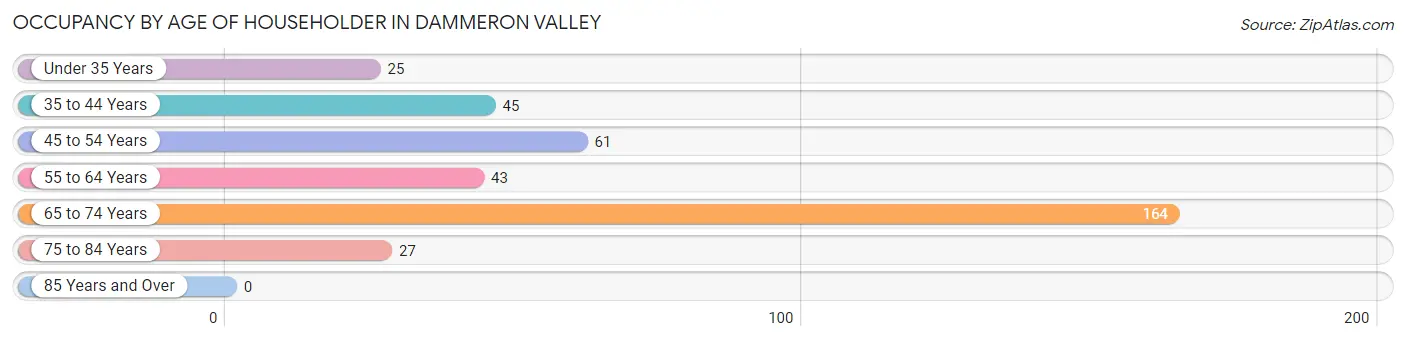
| Age Bracket | # Households | % Households |
| Under 35 Years | 25 | 6.9% |
| 35 to 44 Years | 45 | 12.3% |
| 45 to 54 Years | 61 | 16.7% |
| 55 to 64 Years | 43 | 11.8% |
| 65 to 74 Years | 164 | 44.9% |
| 75 to 84 Years | 27 | 7.4% |
| 85 Years and Over | 0 | 0.0% |
| Total | 365 | 100.0% |
Housing Finances in Dammeron Valley
Median Income by Occupancy in Dammeron Valley
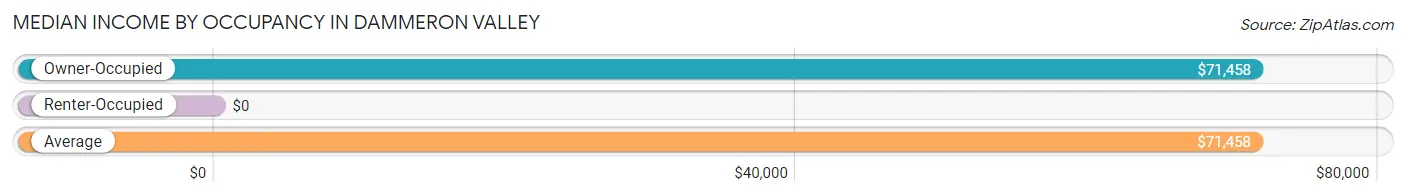
| Occupancy Type | # Households | Median Income |
| Owner-Occupied | 365 (100.0%) | $71,458 |
| Renter-Occupied | 0 (0.0%) | $0 |
| Average | 365 (100.0%) | $71,458 |
Occupancy by Householder Income Bracket in Dammeron Valley
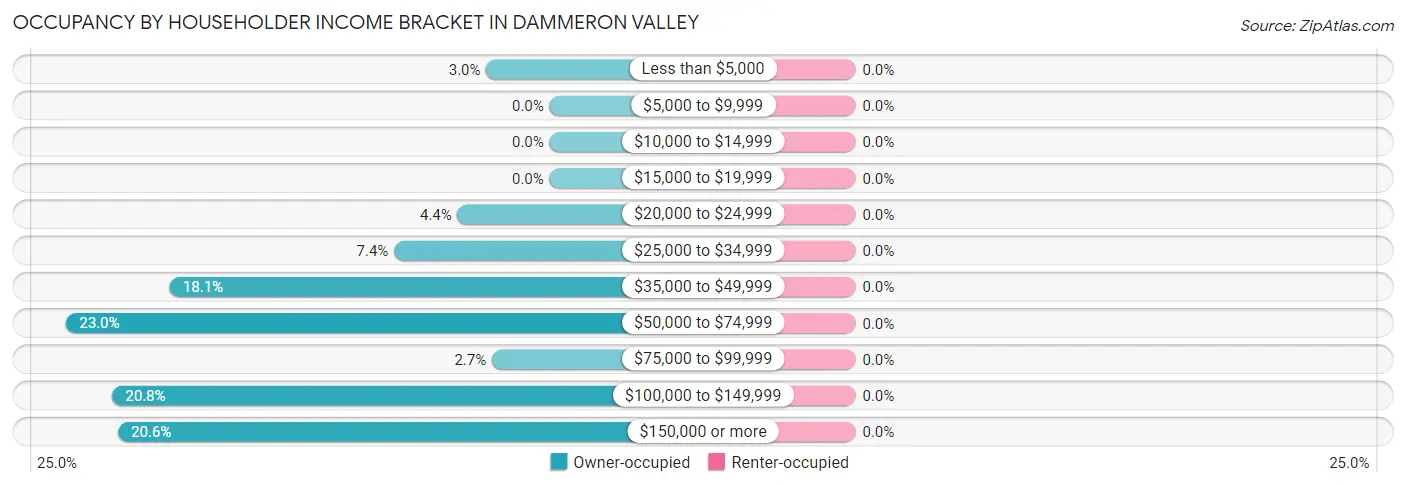
| Income Bracket | Owner-occupied | Renter-occupied |
| Less than $5,000 | 11 (3.0%) | 0 (0.0%) |
| $5,000 to $9,999 | 0 (0.0%) | 0 (0.0%) |
| $10,000 to $14,999 | 0 (0.0%) | 0 (0.0%) |
| $15,000 to $19,999 | 0 (0.0%) | 0 (0.0%) |
| $20,000 to $24,999 | 16 (4.4%) | 0 (0.0%) |
| $25,000 to $34,999 | 27 (7.4%) | 0 (0.0%) |
| $35,000 to $49,999 | 66 (18.1%) | 0 (0.0%) |
| $50,000 to $74,999 | 84 (23.0%) | 0 (0.0%) |
| $75,000 to $99,999 | 10 (2.7%) | 0 (0.0%) |
| $100,000 to $149,999 | 76 (20.8%) | 0 (0.0%) |
| $150,000 or more | 75 (20.5%) | 0 (0.0%) |
| Total | 365 (100.0%) | 0 (0.0%) |
Monthly Housing Cost Tiers in Dammeron Valley
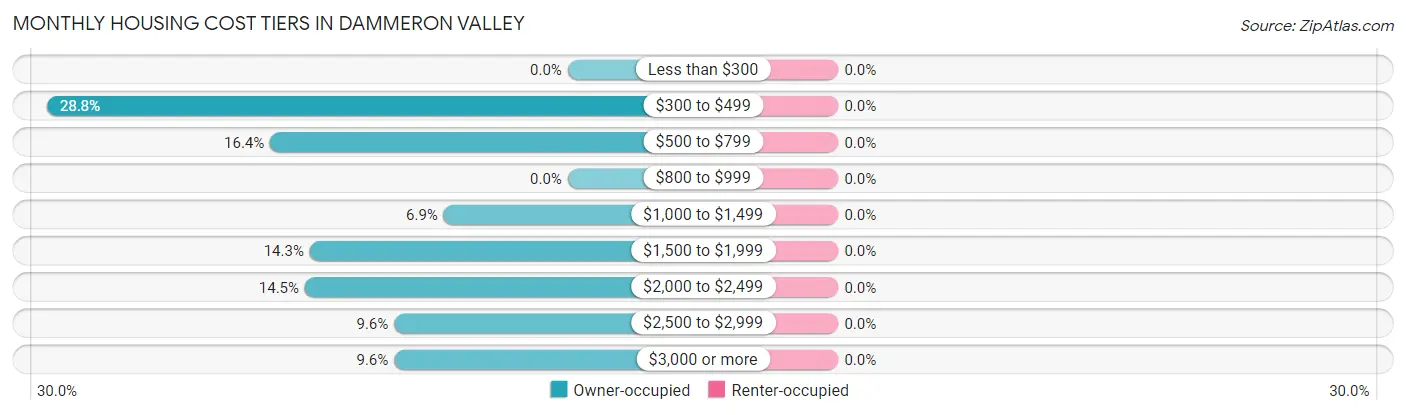
| Monthly Cost | Owner-occupied | Renter-occupied |
| Less than $300 | 0 (0.0%) | 0 (0.0%) |
| $300 to $499 | 105 (28.8%) | 0 (0.0%) |
| $500 to $799 | 60 (16.4%) | 0 (0.0%) |
| $800 to $999 | 0 (0.0%) | 0 (0.0%) |
| $1,000 to $1,499 | 25 (6.9%) | 0 (0.0%) |
| $1,500 to $1,999 | 52 (14.2%) | 0 (0.0%) |
| $2,000 to $2,499 | 53 (14.5%) | 0 (0.0%) |
| $2,500 to $2,999 | 35 (9.6%) | 0 (0.0%) |
| $3,000 or more | 35 (9.6%) | 0 (0.0%) |
| Total | 365 (100.0%) | 0 (0.0%) |
Physical Housing Characteristics in Dammeron Valley
Housing Structures in Dammeron Valley
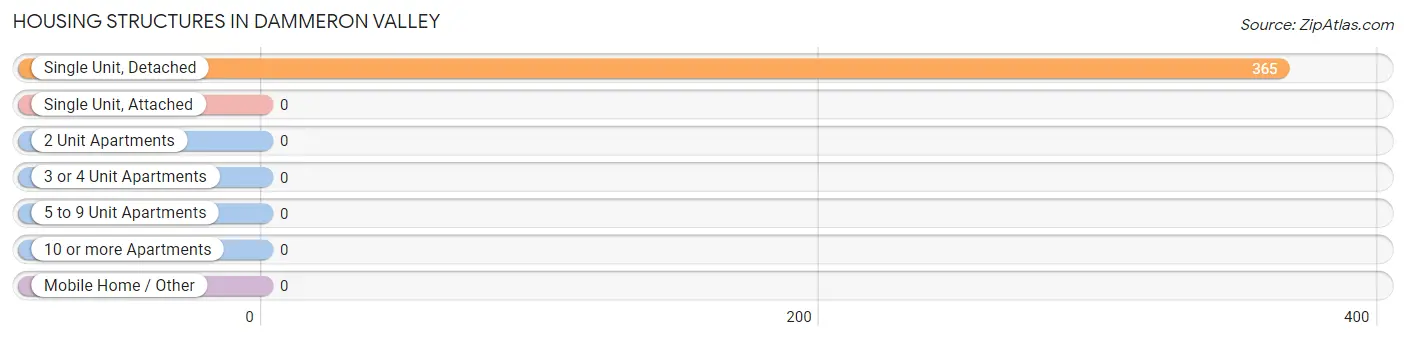
| Structure Type | # Housing Units | % Housing Units |
| Single Unit, Detached | 365 | 100.0% |
| Single Unit, Attached | 0 | 0.0% |
| 2 Unit Apartments | 0 | 0.0% |
| 3 or 4 Unit Apartments | 0 | 0.0% |
| 5 to 9 Unit Apartments | 0 | 0.0% |
| 10 or more Apartments | 0 | 0.0% |
| Mobile Home / Other | 0 | 0.0% |
| Total | 365 | 100.0% |
Housing Structures by Occupancy in Dammeron Valley
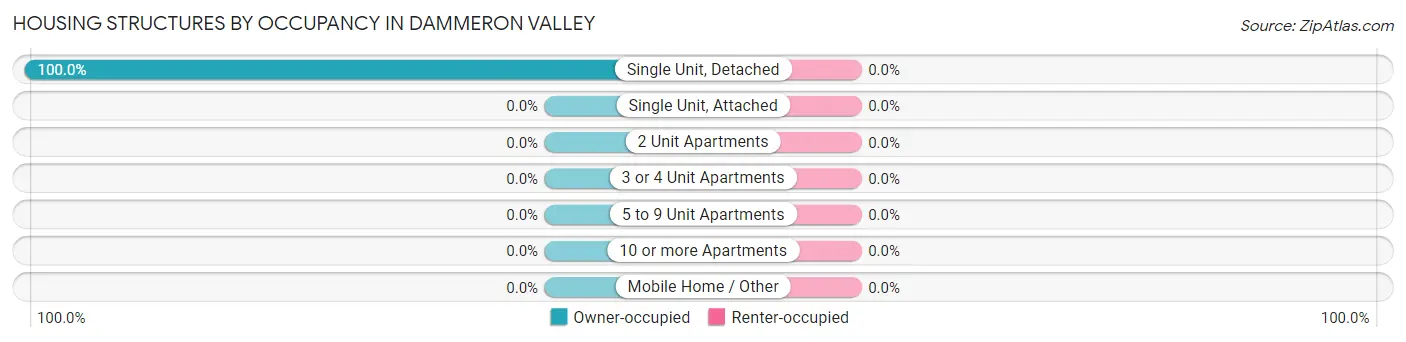
| Structure Type | Owner-occupied | Renter-occupied |
| Single Unit, Detached | 365 (100.0%) | 0 (0.0%) |
| Single Unit, Attached | 0 (0.0%) | 0 (0.0%) |
| 2 Unit Apartments | 0 (0.0%) | 0 (0.0%) |
| 3 or 4 Unit Apartments | 0 (0.0%) | 0 (0.0%) |
| 5 to 9 Unit Apartments | 0 (0.0%) | 0 (0.0%) |
| 10 or more Apartments | 0 (0.0%) | 0 (0.0%) |
| Mobile Home / Other | 0 (0.0%) | 0 (0.0%) |
| Total | 365 (100.0%) | 0 (0.0%) |
Housing Structures by Number of Rooms in Dammeron Valley
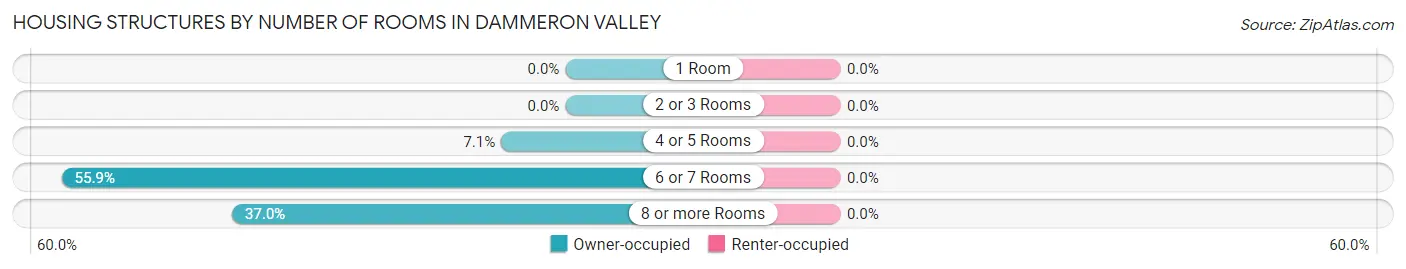
| Number of Rooms | Owner-occupied | Renter-occupied |
| 1 Room | 0 (0.0%) | 0 (0.0%) |
| 2 or 3 Rooms | 0 (0.0%) | 0 (0.0%) |
| 4 or 5 Rooms | 26 (7.1%) | 0 (0.0%) |
| 6 or 7 Rooms | 204 (55.9%) | 0 (0.0%) |
| 8 or more Rooms | 135 (37.0%) | 0 (0.0%) |
| Total | 365 (100.0%) | 0 (0.0%) |
Housing Structure by Heating Type in Dammeron Valley
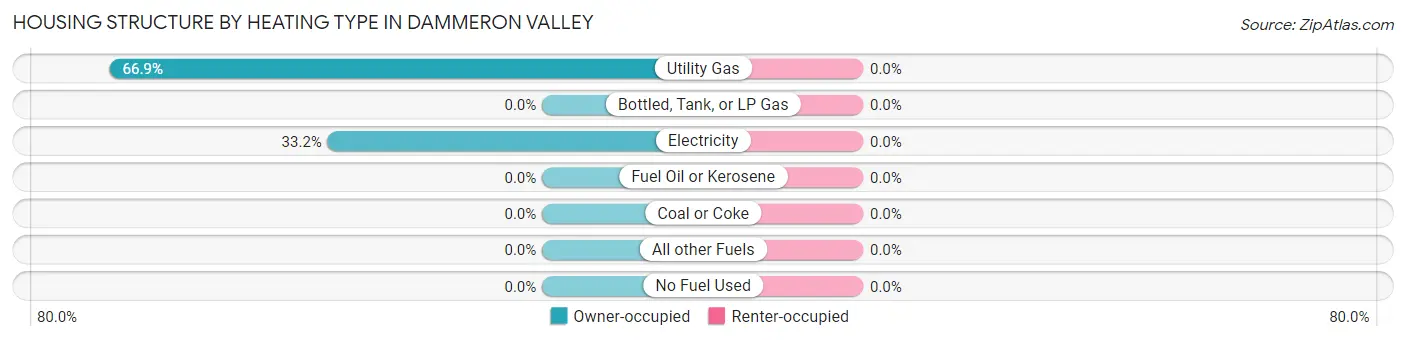
| Heating Type | Owner-occupied | Renter-occupied |
| Utility Gas | 244 (66.8%) | 0 (0.0%) |
| Bottled, Tank, or LP Gas | 0 (0.0%) | 0 (0.0%) |
| Electricity | 121 (33.2%) | 0 (0.0%) |
| Fuel Oil or Kerosene | 0 (0.0%) | 0 (0.0%) |
| Coal or Coke | 0 (0.0%) | 0 (0.0%) |
| All other Fuels | 0 (0.0%) | 0 (0.0%) |
| No Fuel Used | 0 (0.0%) | 0 (0.0%) |
| Total | 365 (100.0%) | 0 (0.0%) |
Household Vehicle Usage in Dammeron Valley
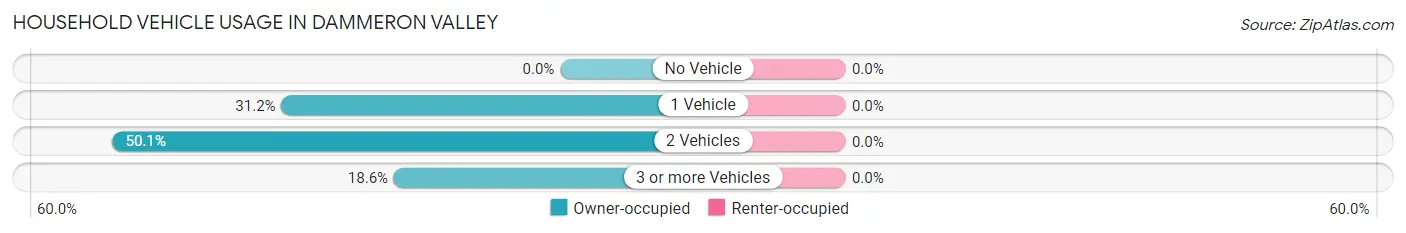
| Vehicles per Household | Owner-occupied | Renter-occupied |
| No Vehicle | 0 (0.0%) | 0 (0.0%) |
| 1 Vehicle | 114 (31.2%) | 0 (0.0%) |
| 2 Vehicles | 183 (50.1%) | 0 (0.0%) |
| 3 or more Vehicles | 68 (18.6%) | 0 (0.0%) |
| Total | 365 (100.0%) | 0 (0.0%) |
Real Estate & Mortgages in Dammeron Valley
Real Estate and Mortgage Overview in Dammeron Valley
| Characteristic | Without Mortgage | With Mortgage |
| Housing Units | 140 | 225 |
| Median Property Value | $514,400 | $481,400 |
| Median Household Income | - | - |
| Monthly Housing Costs | $477 | $35 |
| Real Estate Taxes | $3,014 | $25 |
Property Value by Mortgage Status in Dammeron Valley
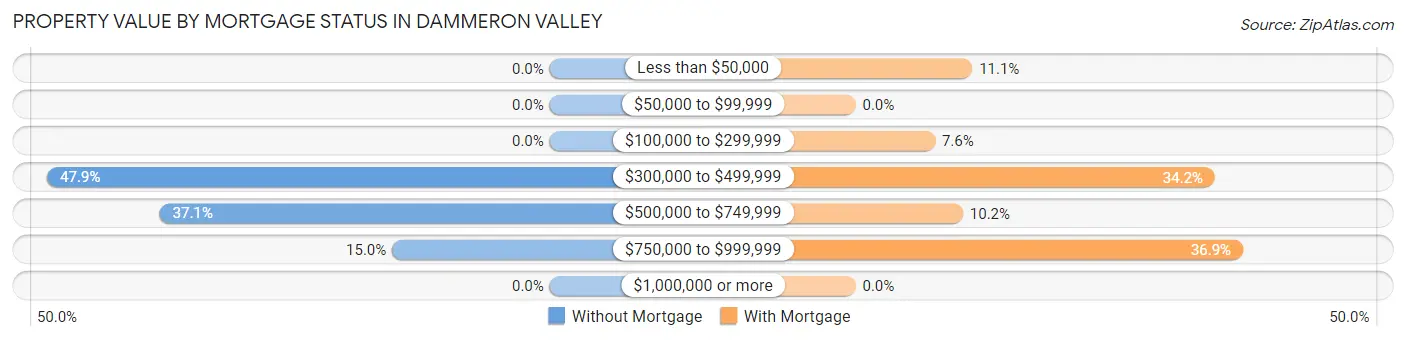
| Property Value | Without Mortgage | With Mortgage |
| Less than $50,000 | 0 (0.0%) | 25 (11.1%) |
| $50,000 to $99,999 | 0 (0.0%) | 0 (0.0%) |
| $100,000 to $299,999 | 0 (0.0%) | 17 (7.6%) |
| $300,000 to $499,999 | 67 (47.9%) | 77 (34.2%) |
| $500,000 to $749,999 | 52 (37.1%) | 23 (10.2%) |
| $750,000 to $999,999 | 21 (15.0%) | 83 (36.9%) |
| $1,000,000 or more | 0 (0.0%) | 0 (0.0%) |
| Total | 140 (100.0%) | 225 (100.0%) |
Household Income by Mortgage Status in Dammeron Valley
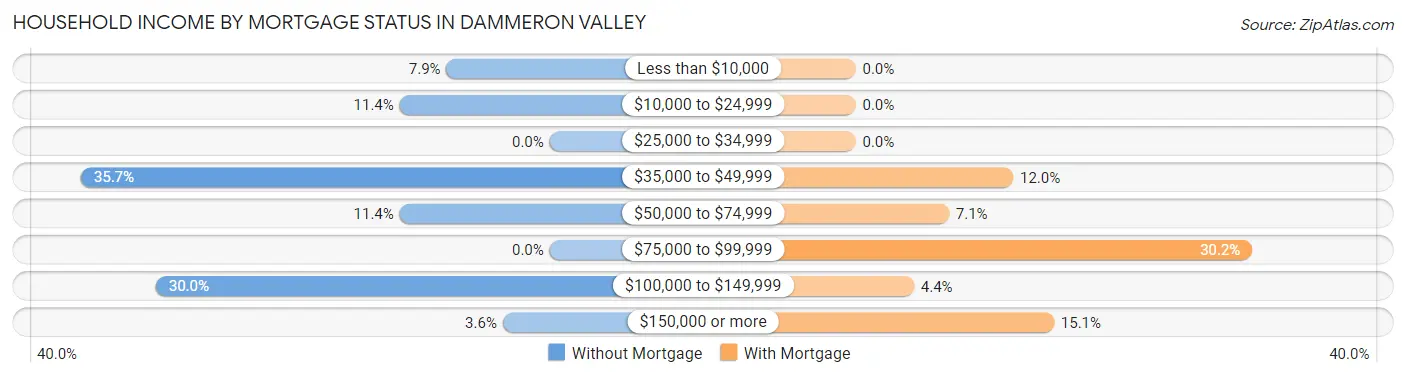
| Household Income | Without Mortgage | With Mortgage |
| Less than $10,000 | 11 (7.9%) | 0 (0.0%) |
| $10,000 to $24,999 | 16 (11.4%) | 0 (0.0%) |
| $25,000 to $34,999 | 0 (0.0%) | 0 (0.0%) |
| $35,000 to $49,999 | 50 (35.7%) | 27 (12.0%) |
| $50,000 to $74,999 | 16 (11.4%) | 16 (7.1%) |
| $75,000 to $99,999 | 0 (0.0%) | 68 (30.2%) |
| $100,000 to $149,999 | 42 (30.0%) | 10 (4.4%) |
| $150,000 or more | 5 (3.6%) | 34 (15.1%) |
| Total | 140 (100.0%) | 225 (100.0%) |
Property Value to Household Income Ratio in Dammeron Valley
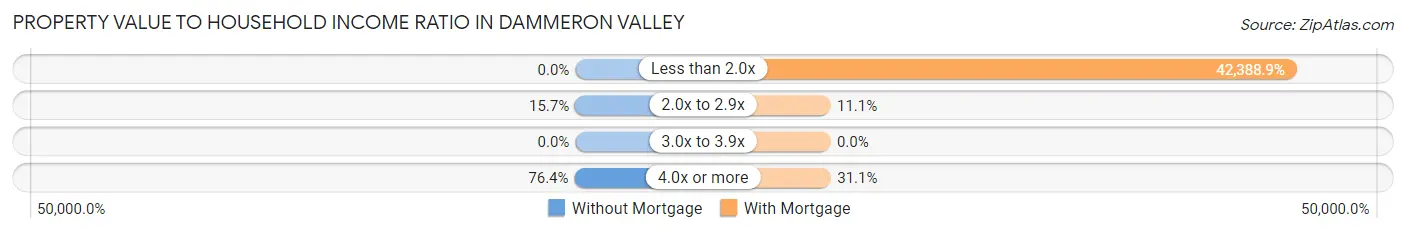
| Value-to-Income Ratio | Without Mortgage | With Mortgage |
| Less than 2.0x | 0 (0.0%) | 95,375 (42,388.9%) |
| 2.0x to 2.9x | 22 (15.7%) | 25 (11.1%) |
| 3.0x to 3.9x | 0 (0.0%) | 0 (0.0%) |
| 4.0x or more | 107 (76.4%) | 70 (31.1%) |
| Total | 140 (100.0%) | 225 (100.0%) |
Real Estate Taxes by Mortgage Status in Dammeron Valley
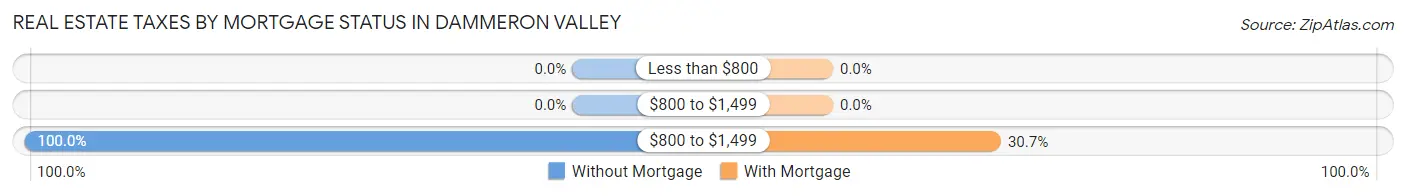
| Property Taxes | Without Mortgage | With Mortgage |
| Less than $800 | 0 (0.0%) | 0 (0.0%) |
| $800 to $1,499 | 0 (0.0%) | 0 (0.0%) |
| $800 to $1,499 | 140 (100.0%) | 69 (30.7%) |
| Total | 140 (100.0%) | 225 (100.0%) |
Health & Disability in Dammeron Valley
Health Insurance Coverage by Age in Dammeron Valley
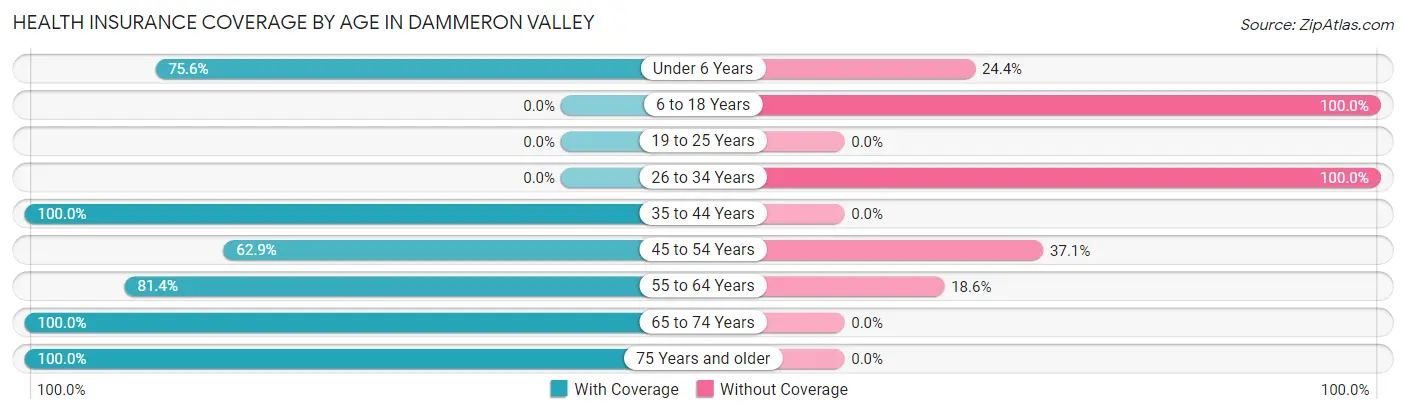
| Age Bracket | With Coverage | Without Coverage |
| Under 6 Years | 59 (75.6%) | 19 (24.4%) |
| 6 to 18 Years | 0 (0.0%) | 23 (100.0%) |
| 19 to 25 Years | 0 (0.0%) | 0 (0.0%) |
| 26 to 34 Years | 0 (0.0%) | 49 (100.0%) |
| 35 to 44 Years | 84 (100.0%) | 0 (0.0%) |
| 45 to 54 Years | 56 (62.9%) | 33 (37.1%) |
| 55 to 64 Years | 144 (81.4%) | 33 (18.6%) |
| 65 to 74 Years | 290 (100.0%) | 0 (0.0%) |
| 75 Years and older | 27 (100.0%) | 0 (0.0%) |
| Total | 660 (80.8%) | 157 (19.2%) |
Health Insurance Coverage by Citizenship Status in Dammeron Valley
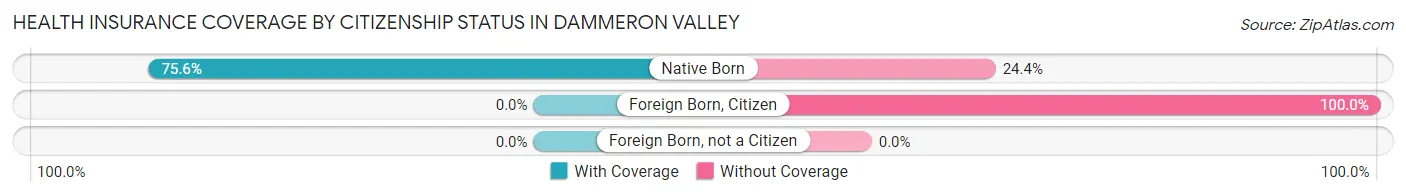
| Citizenship Status | With Coverage | Without Coverage |
| Native Born | 59 (75.6%) | 19 (24.4%) |
| Foreign Born, Citizen | 0 (0.0%) | 23 (100.0%) |
| Foreign Born, not a Citizen | 0 (0.0%) | 0 (0.0%) |
Health Insurance Coverage by Household Income in Dammeron Valley
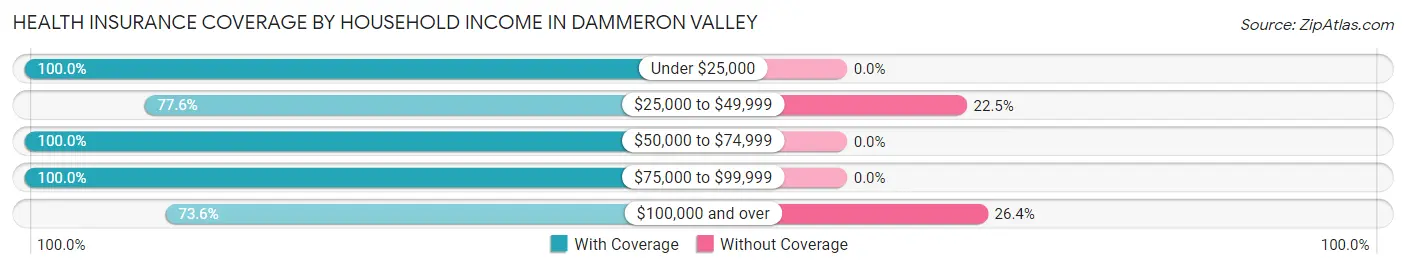
| Household Income | With Coverage | Without Coverage |
| Under $25,000 | 38 (100.0%) | 0 (0.0%) |
| $25,000 to $49,999 | 114 (77.5%) | 33 (22.5%) |
| $50,000 to $74,999 | 152 (100.0%) | 0 (0.0%) |
| $75,000 to $99,999 | 10 (100.0%) | 0 (0.0%) |
| $100,000 and over | 346 (73.6%) | 124 (26.4%) |
Public vs Private Health Insurance Coverage by Age in Dammeron Valley
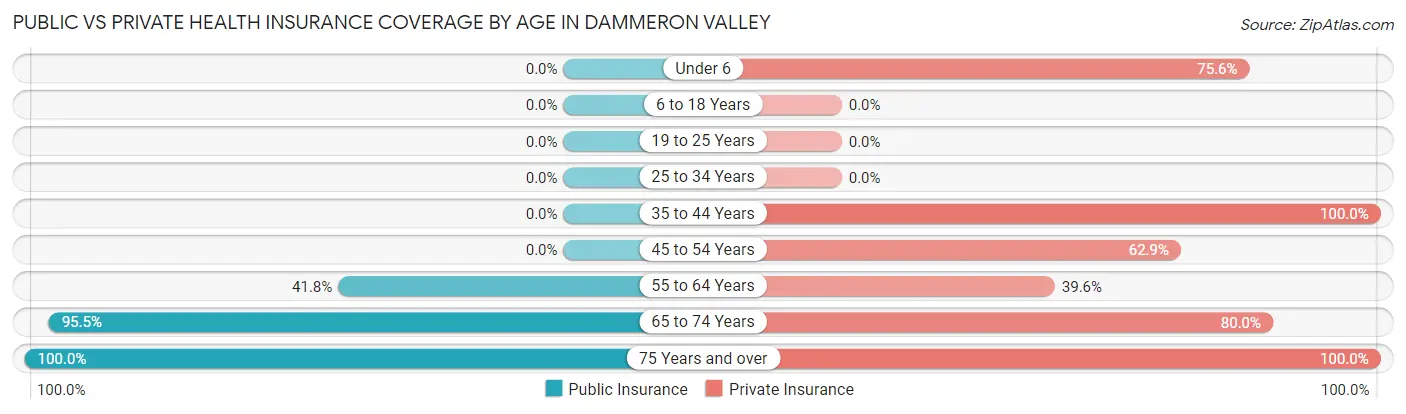
| Age Bracket | Public Insurance | Private Insurance |
| Under 6 | 0 (0.0%) | 59 (75.6%) |
| 6 to 18 Years | 0 (0.0%) | 0 (0.0%) |
| 19 to 25 Years | 0 (0.0%) | 0 (0.0%) |
| 25 to 34 Years | 0 (0.0%) | 0 (0.0%) |
| 35 to 44 Years | 0 (0.0%) | 84 (100.0%) |
| 45 to 54 Years | 0 (0.0%) | 56 (62.9%) |
| 55 to 64 Years | 74 (41.8%) | 70 (39.6%) |
| 65 to 74 Years | 277 (95.5%) | 232 (80.0%) |
| 75 Years and over | 27 (100.0%) | 27 (100.0%) |
| Total | 378 (46.3%) | 528 (64.6%) |
Disability Status by Sex by Age in Dammeron Valley
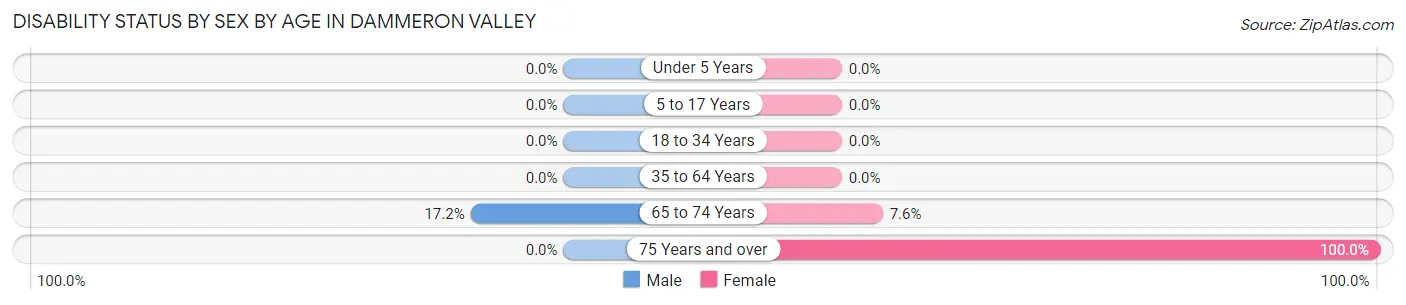
| Age Bracket | Male | Female |
| Under 5 Years | 0 (0.0%) | 0 (0.0%) |
| 5 to 17 Years | 0 (0.0%) | 0 (0.0%) |
| 18 to 34 Years | 0 (0.0%) | 0 (0.0%) |
| 35 to 64 Years | 0 (0.0%) | 0 (0.0%) |
| 65 to 74 Years | 25 (17.2%) | 11 (7.6%) |
| 75 Years and over | 0 (0.0%) | 27 (100.0%) |
Disability Class by Sex by Age in Dammeron Valley
Disability Class: Hearing Difficulty
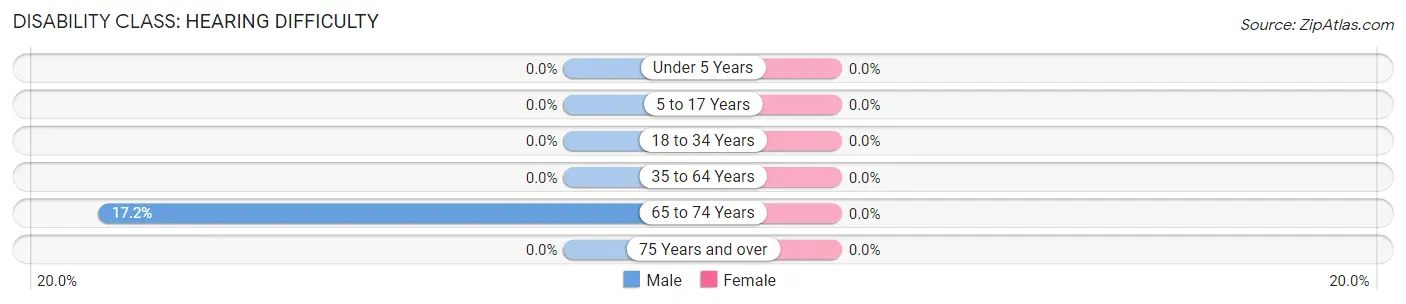
| Age Bracket | Male | Female |
| Under 5 Years | 0 (0.0%) | 0 (0.0%) |
| 5 to 17 Years | 0 (0.0%) | 0 (0.0%) |
| 18 to 34 Years | 0 (0.0%) | 0 (0.0%) |
| 35 to 64 Years | 0 (0.0%) | 0 (0.0%) |
| 65 to 74 Years | 25 (17.2%) | 0 (0.0%) |
| 75 Years and over | 0 (0.0%) | 0 (0.0%) |
Disability Class: Vision Difficulty
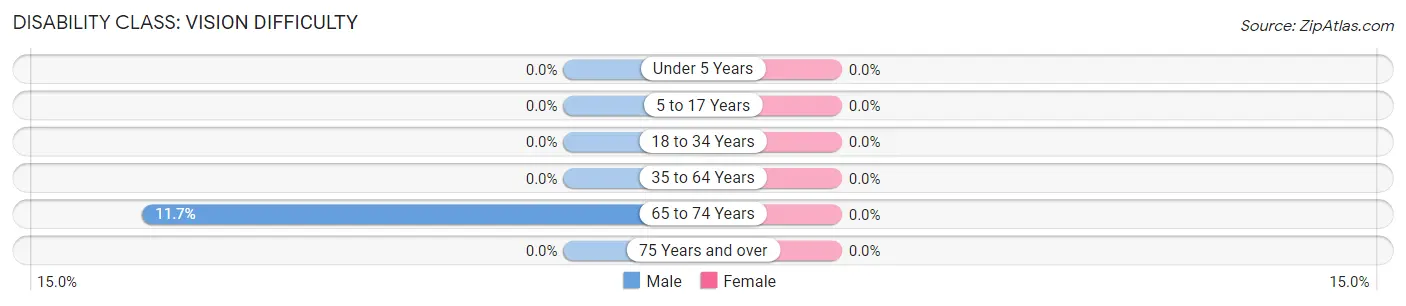
| Age Bracket | Male | Female |
| Under 5 Years | 0 (0.0%) | 0 (0.0%) |
| 5 to 17 Years | 0 (0.0%) | 0 (0.0%) |
| 18 to 34 Years | 0 (0.0%) | 0 (0.0%) |
| 35 to 64 Years | 0 (0.0%) | 0 (0.0%) |
| 65 to 74 Years | 17 (11.7%) | 0 (0.0%) |
| 75 Years and over | 0 (0.0%) | 0 (0.0%) |
Disability Class: Cognitive Difficulty
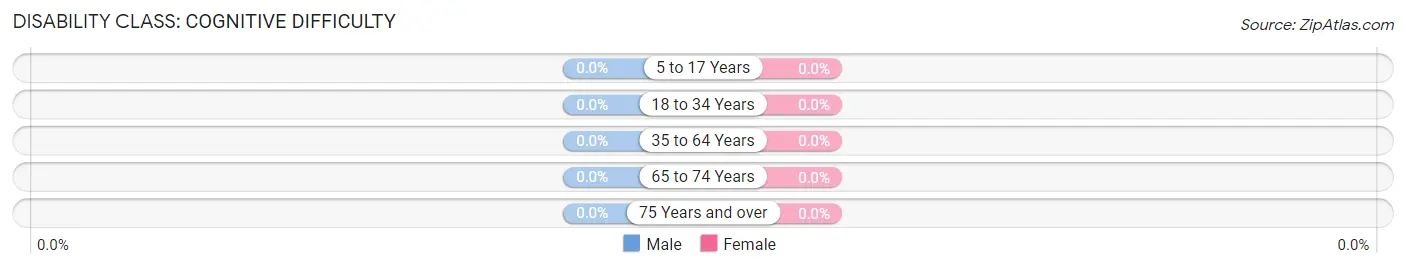
| Age Bracket | Male | Female |
| 5 to 17 Years | 0 (0.0%) | 0 (0.0%) |
| 18 to 34 Years | 0 (0.0%) | 0 (0.0%) |
| 35 to 64 Years | 0 (0.0%) | 0 (0.0%) |
| 65 to 74 Years | 0 (0.0%) | 0 (0.0%) |
| 75 Years and over | 0 (0.0%) | 0 (0.0%) |
Disability Class: Ambulatory Difficulty
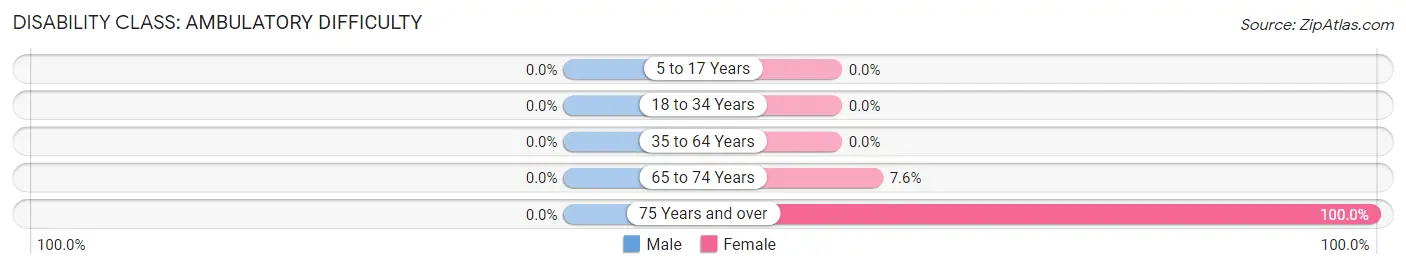
| Age Bracket | Male | Female |
| 5 to 17 Years | 0 (0.0%) | 0 (0.0%) |
| 18 to 34 Years | 0 (0.0%) | 0 (0.0%) |
| 35 to 64 Years | 0 (0.0%) | 0 (0.0%) |
| 65 to 74 Years | 0 (0.0%) | 11 (7.6%) |
| 75 Years and over | 0 (0.0%) | 27 (100.0%) |
Disability Class: Self-Care Difficulty
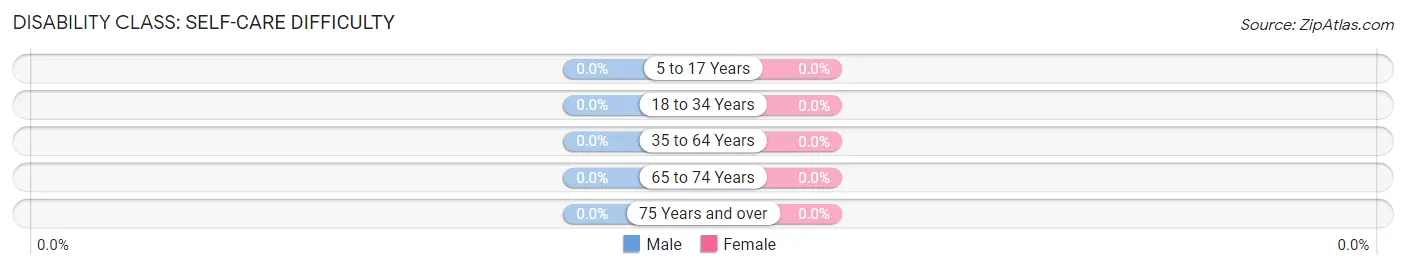
| Age Bracket | Male | Female |
| 5 to 17 Years | 0 (0.0%) | 0 (0.0%) |
| 18 to 34 Years | 0 (0.0%) | 0 (0.0%) |
| 35 to 64 Years | 0 (0.0%) | 0 (0.0%) |
| 65 to 74 Years | 0 (0.0%) | 0 (0.0%) |
| 75 Years and over | 0 (0.0%) | 0 (0.0%) |
Technology Access in Dammeron Valley
Computing Device Access in Dammeron Valley
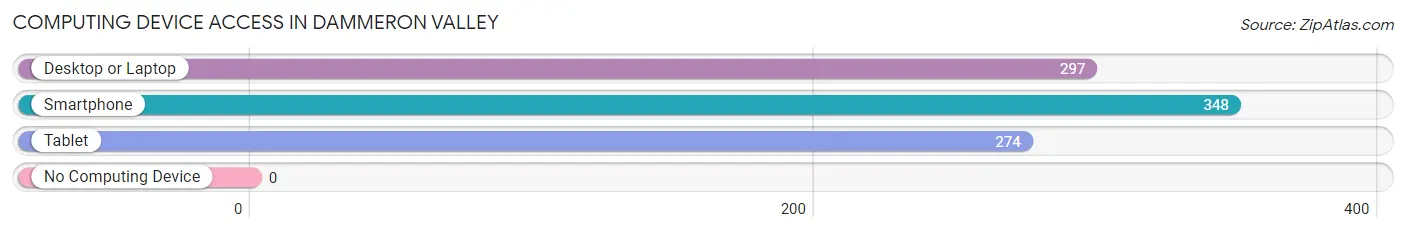
| Device Type | # Households | % Households |
| Desktop or Laptop | 297 | 81.4% |
| Smartphone | 348 | 95.3% |
| Tablet | 274 | 75.1% |
| No Computing Device | 0 | 0.0% |
| Total | 365 | 100.0% |
Internet Access in Dammeron Valley
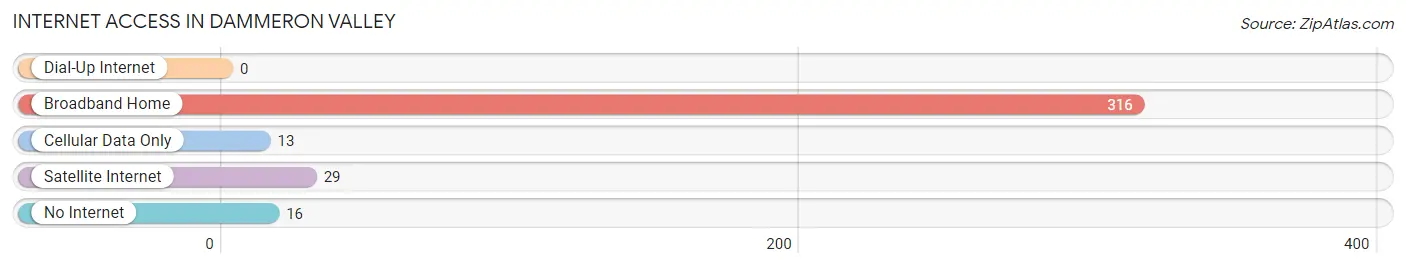
| Internet Type | # Households | % Households |
| Dial-Up Internet | 0 | 0.0% |
| Broadband Home | 316 | 86.6% |
| Cellular Data Only | 13 | 3.6% |
| Satellite Internet | 29 | 8.0% |
| No Internet | 16 | 4.4% |
| Total | 365 | 100.0% |
Dammeron Valley Summary
Dammeron Valley is a small unincorporated community located in Washington County, Utah. It is situated in the southwestern part of the state, approximately 15 miles northeast of St. George. The population of Dammeron Valley was estimated to be 1,845 in 2019.
History
The area that is now Dammeron Valley was first settled in the late 1800s by Mormon pioneers. The first settlers were members of the Church of Jesus Christ of Latter-day Saints, who were sent to the area to establish a settlement. The settlement was named after a local Native American chief, Chief Dammeron. The settlers built a fort and a school, and the area quickly grew into a thriving community.
In the early 1900s, the area was home to a number of small farms and ranches. The area was also known for its fruit orchards, which produced apples, peaches, and other fruits. The area was also home to a number of small businesses, including a general store, a blacksmith shop, and a post office.
Geography
Dammeron Valley is located in the southwestern part of Utah, approximately 15 miles northeast of St. George. The area is situated in the Red Cliffs Desert Reserve, which is a protected area of desert and mountain terrain. The area is characterized by its red sandstone cliffs, which are a popular destination for hikers and rock climbers. The area is also home to a number of small lakes and reservoirs, which provide a variety of recreational activities.
The climate in Dammeron Valley is generally mild, with hot summers and mild winters. The average annual temperature is around 70 degrees Fahrenheit. The area receives an average of 8 inches of precipitation per year, with most of it falling in the winter months.
Economy
The economy of Dammeron Valley is largely based on agriculture and tourism. The area is home to a number of small farms and ranches, which produce a variety of crops, including alfalfa, hay, and wheat. The area is also home to a number of small businesses, including restaurants, stores, and other services.
Tourism is also an important part of the local economy. The area is home to a number of outdoor recreational activities, including hiking, camping, fishing, and rock climbing. The area is also home to a number of historic sites, including the Old Dammeron Valley Church and the Old Dammeron Valley Cemetery.
Demographics
As of 2019, the population of Dammeron Valley was estimated to be 1,845. The population is largely white, with a small percentage of African Americans, Native Americans, and other races. The median household income in the area is around $50,000, and the median home value is around $200,000. The area is served by the Washington County School District.
Common Questions
What is Per Capita Income in Dammeron Valley?
Per Capita income in Dammeron Valley is $50,113.
What is the Median Family Income in Dammeron Valley?
Median Family Income in Dammeron Valley is $105,694.
What is the Median Household income in Dammeron Valley?
Median Household Income in Dammeron Valley is $71,458.
What is Inequality or Gini Index in Dammeron Valley?
Inequality or Gini Index in Dammeron Valley is 0.44.
What is the Total Population of Dammeron Valley?
Total Population of Dammeron Valley is 817.
What is the Total Male Population of Dammeron Valley?
Total Male Population of Dammeron Valley is 439.
What is the Total Female Population of Dammeron Valley?
Total Female Population of Dammeron Valley is 378.
What is the Ratio of Males per 100 Females in Dammeron Valley?
There are 116.14 Males per 100 Females in Dammeron Valley.
What is the Ratio of Females per 100 Males in Dammeron Valley?
There are 86.10 Females per 100 Males in Dammeron Valley.
What is the Median Population Age in Dammeron Valley?
Median Population Age in Dammeron Valley is 61.9 Years.
What is the Average Family Size in Dammeron Valley
Average Family Size in Dammeron Valley is 2.7 People.
What is the Average Household Size in Dammeron Valley
Average Household Size in Dammeron Valley is 2.2 People.
How Large is the Labor Force in Dammeron Valley?
There are 130 People in the Labor Forcein in Dammeron Valley.
What is the Percentage of People in the Labor Force in Dammeron Valley?
18.2% of People are in the Labor Force in Dammeron Valley.