Vernal, UT Map & Demographics
Vernal Map
Vernal Overview
$24,627
PER CAPITA INCOME
$66,615
AVG FAMILY INCOME
$58,869
AVG HOUSEHOLD INCOME
65.3%
WAGE / INCOME GAP [ % ]
34.7¢/ $1
WAGE / INCOME GAP [ $ ]
0.39
INEQUALITY / GINI INDEX
10,141
TOTAL POPULATION
5,312
MALE POPULATION
4,829
FEMALE POPULATION
110.00
MALES / 100 FEMALES
90.91
FEMALES / 100 MALES
30.0
MEDIAN AGE
3.7
AVG FAMILY SIZE
3.0
AVG HOUSEHOLD SIZE
4,816
LABOR FORCE [ PEOPLE ]
66.6%
PERCENT IN LABOR FORCE
8.9%
UNEMPLOYMENT RATE
Vernal Zip Codes
Vernal Area Codes
Income in Vernal
Income Overview in Vernal
Per Capita Income in Vernal is $24,627, while median incomes of families and households are $66,615 and $58,869 respectively.
| Characteristic | Number | Measure |
| Per Capita Income | 10,141 | $24,627 |
| Median Family Income | 2,259 | $66,615 |
| Mean Family Income | 2,259 | $79,281 |
| Median Household Income | 3,327 | $58,869 |
| Mean Household Income | 3,327 | $68,712 |
| Income Deficit | 2,259 | $0 |
| Wage / Income Gap (%) | 10,141 | 65.32% |
| Wage / Income Gap ($) | 10,141 | 34.68¢ per $1 |
| Gini / Inequality Index | 10,141 | 0.39 |
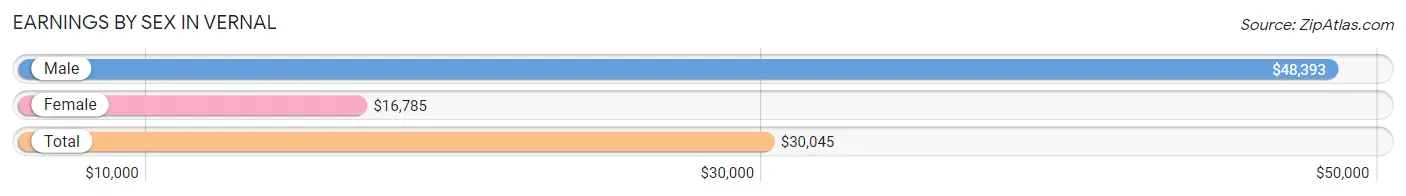
Earnings by Sex in Vernal
Average Earnings in Vernal are $30,045, $48,393 for men and $16,785 for women, a difference of 65.3%.
| Sex | Number | Average Earnings |
| Male | 2,673 (53.5%) | $48,393 |
| Female | 2,319 (46.5%) | $16,785 |
| Total | 4,992 (100.0%) | $30,045 |
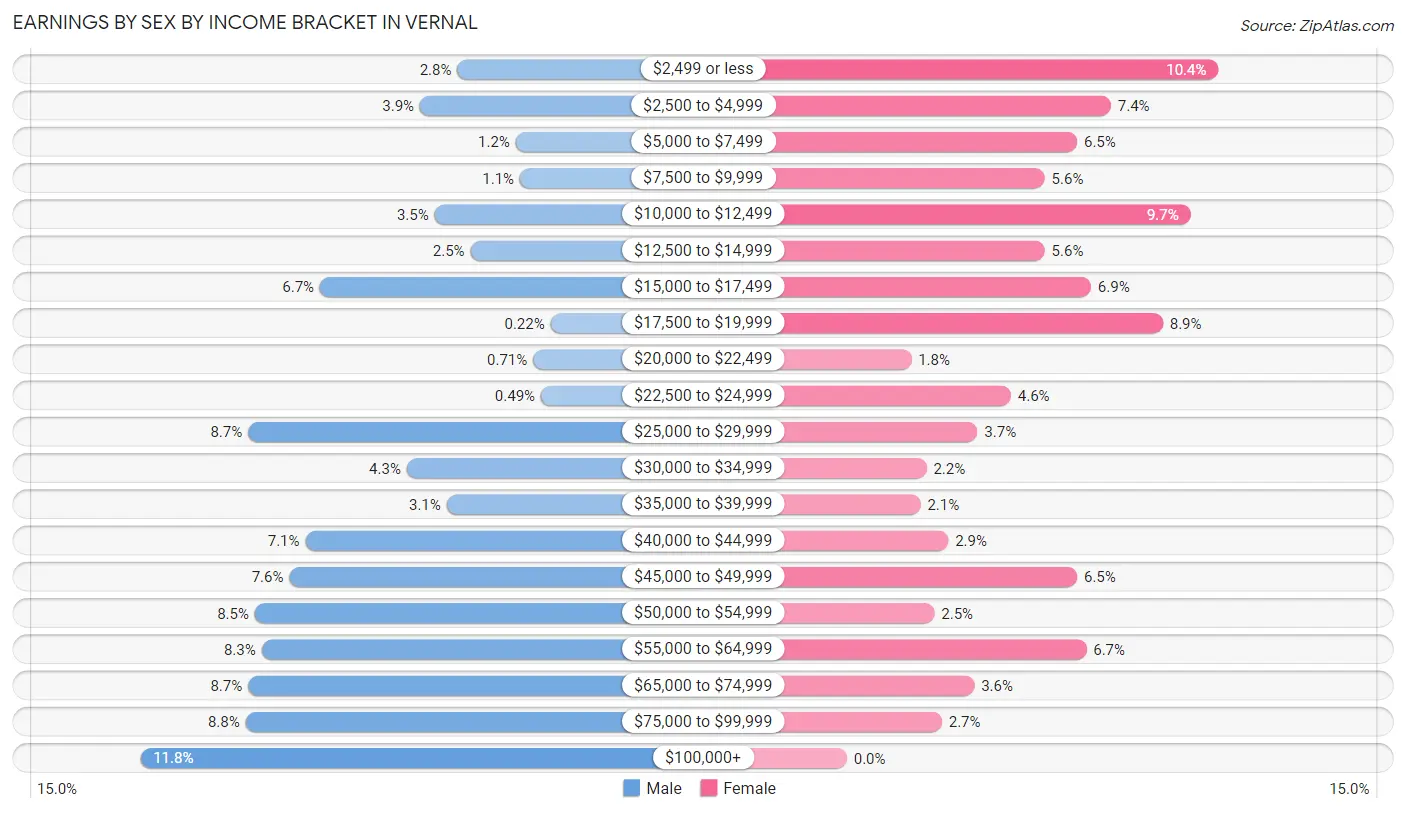
Earnings by Sex by Income Bracket in Vernal
The most common earnings brackets in Vernal are $100,000+ for men (314 | 11.7%) and $2,499 or less for women (242 | 10.4%).
| Income | Male | Female |
| $2,499 or less | 76 (2.8%) | 242 (10.4%) |
| $2,500 to $4,999 | 104 (3.9%) | 172 (7.4%) |
| $5,000 to $7,499 | 32 (1.2%) | 150 (6.5%) |
| $7,500 to $9,999 | 29 (1.1%) | 129 (5.6%) |
| $10,000 to $12,499 | 93 (3.5%) | 224 (9.7%) |
| $12,500 to $14,999 | 66 (2.5%) | 129 (5.6%) |
| $15,000 to $17,499 | 179 (6.7%) | 159 (6.9%) |
| $17,500 to $19,999 | 6 (0.2%) | 206 (8.9%) |
| $20,000 to $22,499 | 19 (0.7%) | 42 (1.8%) |
| $22,500 to $24,999 | 13 (0.5%) | 107 (4.6%) |
| $25,000 to $29,999 | 233 (8.7%) | 85 (3.7%) |
| $30,000 to $34,999 | 114 (4.3%) | 52 (2.2%) |
| $35,000 to $39,999 | 84 (3.1%) | 48 (2.1%) |
| $40,000 to $44,999 | 190 (7.1%) | 66 (2.9%) |
| $45,000 to $49,999 | 202 (7.6%) | 150 (6.5%) |
| $50,000 to $54,999 | 228 (8.5%) | 57 (2.5%) |
| $55,000 to $64,999 | 223 (8.3%) | 156 (6.7%) |
| $65,000 to $74,999 | 233 (8.7%) | 83 (3.6%) |
| $75,000 to $99,999 | 235 (8.8%) | 62 (2.7%) |
| $100,000+ | 314 (11.7%) | 0 (0.0%) |
| Total | 2,673 (100.0%) | 2,319 (100.0%) |
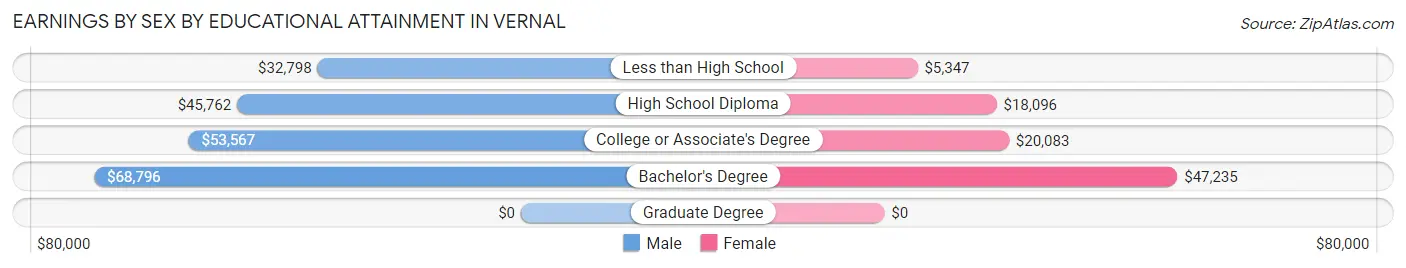
Earnings by Sex by Educational Attainment in Vernal
Average earnings in Vernal are $49,253 for men and $17,856 for women, a difference of 63.7%. Men with an educational attainment of bachelor's degree enjoy the highest average annual earnings of $68,796, while those with less than high school education earn the least with $32,798. Women with an educational attainment of bachelor's degree earn the most with the average annual earnings of $47,235, while those with less than high school education have the smallest earnings of $5,347.
| Educational Attainment | Male Income | Female Income |
| Less than High School | $32,798 | $5,347 |
| High School Diploma | $45,762 | $18,096 |
| College or Associate's Degree | $53,567 | $20,083 |
| Bachelor's Degree | $68,796 | $47,235 |
| Graduate Degree | - | - |
| Total | $49,253 | $17,856 |
Family Income in Vernal
Family Income Brackets in Vernal
According to the Vernal family income data, there are 642 families falling into the $50,000 to $74,999 income range, which is the most common income bracket and makes up 28.4% of all families. Conversely, the $10,000 to $14,999 income bracket is the least frequent group with only 32 families (1.4%) belonging to this category.
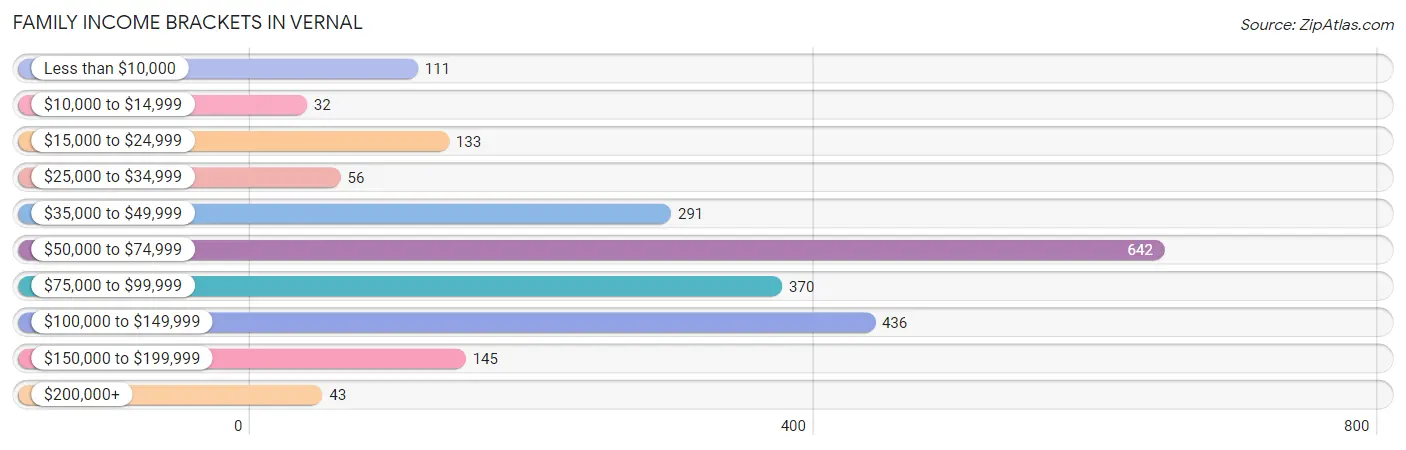
| Income Bracket | # Families | % Families |
| Less than $10,000 | 111 | 4.9% |
| $10,000 to $14,999 | 32 | 1.4% |
| $15,000 to $24,999 | 133 | 5.9% |
| $25,000 to $34,999 | 56 | 2.5% |
| $35,000 to $49,999 | 291 | 12.9% |
| $50,000 to $74,999 | 642 | 28.4% |
| $75,000 to $99,999 | 370 | 16.4% |
| $100,000 to $149,999 | 436 | 19.3% |
| $150,000 to $199,999 | 145 | 6.4% |
| $200,000+ | 43 | 1.9% |
Family Income by Famaliy Size in Vernal
7+ person families (29 | 1.3%) account for the highest median family income in Vernal with $167,868 per family, while 2-person families (771 | 34.1%) have the highest median income of $32,682 per family member.
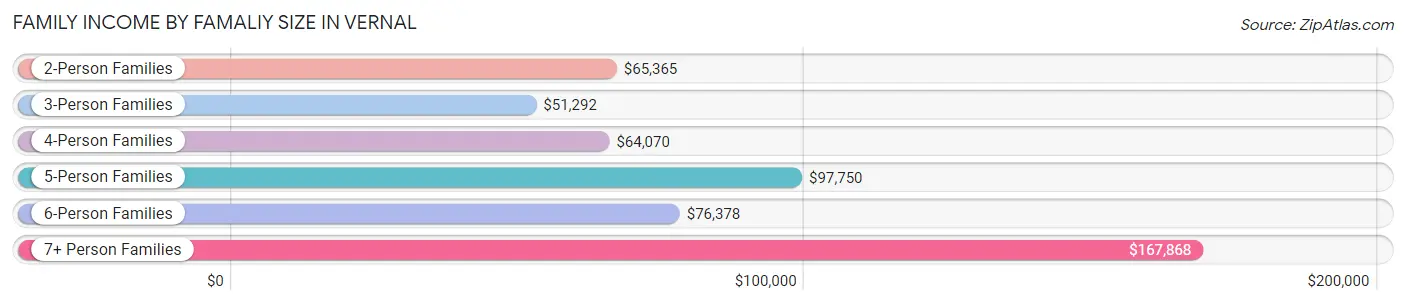
| Income Bracket | # Families | Median Income |
| 2-Person Families | 771 (34.1%) | $65,365 |
| 3-Person Families | 595 (26.3%) | $51,292 |
| 4-Person Families | 458 (20.3%) | $64,070 |
| 5-Person Families | 195 (8.6%) | $97,750 |
| 6-Person Families | 211 (9.3%) | $76,378 |
| 7+ Person Families | 29 (1.3%) | $167,868 |
| Total | 2,259 (100.0%) | $66,615 |
Family Income by Number of Earners in Vernal
The median family income in Vernal is $66,615, with families comprising 3+ earners (290) having the highest median family income of $94,799, while families with no earners (301) have the lowest median family income of $49,185, accounting for 12.8% and 13.3% of families, respectively.
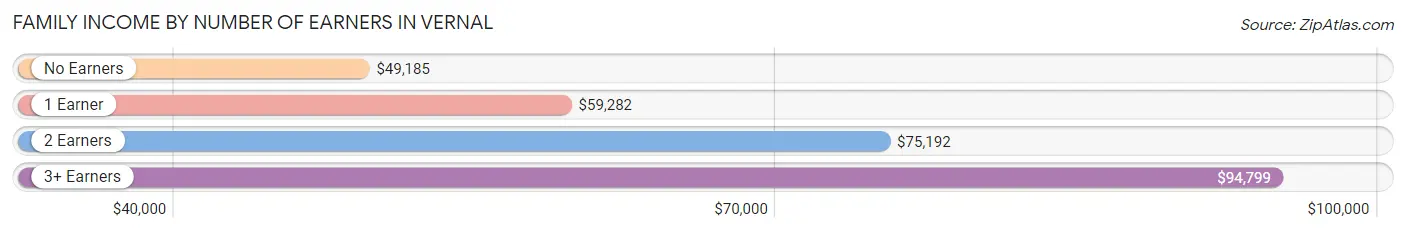
| Number of Earners | # Families | Median Income |
| No Earners | 301 (13.3%) | $49,185 |
| 1 Earner | 890 (39.4%) | $59,282 |
| 2 Earners | 778 (34.4%) | $75,192 |
| 3+ Earners | 290 (12.8%) | $94,799 |
| Total | 2,259 (100.0%) | $66,615 |
Household Income in Vernal
Household Income Brackets in Vernal
With 888 households falling in the category, the $50,000 to $74,999 income range is the most frequent in Vernal, accounting for 26.7% of all households. In contrast, only 57 households (1.7%) fall into the $200,000+ income bracket, making it the least populous group.
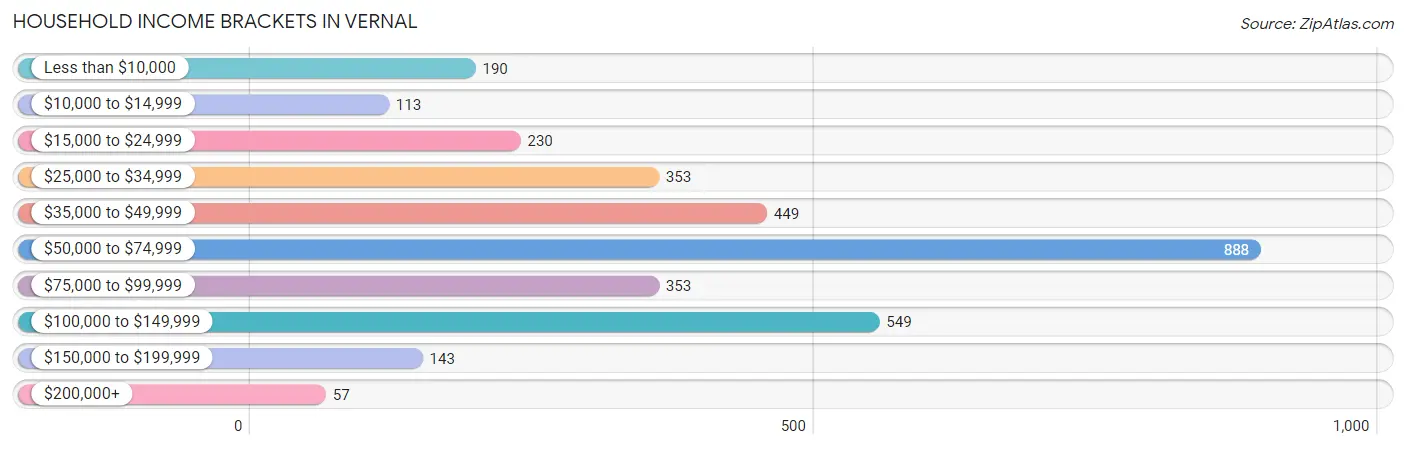
| Income Bracket | # Households | % Households |
| Less than $10,000 | 190 | 5.7% |
| $10,000 to $14,999 | 113 | 3.4% |
| $15,000 to $24,999 | 230 | 6.9% |
| $25,000 to $34,999 | 353 | 10.6% |
| $35,000 to $49,999 | 449 | 13.5% |
| $50,000 to $74,999 | 888 | 26.7% |
| $75,000 to $99,999 | 353 | 10.6% |
| $100,000 to $149,999 | 549 | 16.5% |
| $150,000 to $199,999 | 143 | 4.3% |
| $200,000+ | 57 | 1.7% |
Household Income by Householder Age in Vernal
The median household income in Vernal is $58,869, with the highest median household income of $63,047 found in the 45 to 64 years age bracket for the primary householder. A total of 1,112 households (33.4%) fall into this category. Meanwhile, the 65+ years age bracket for the primary householder has the lowest median household income of $47,583, with 492 households (14.8%) in this group.
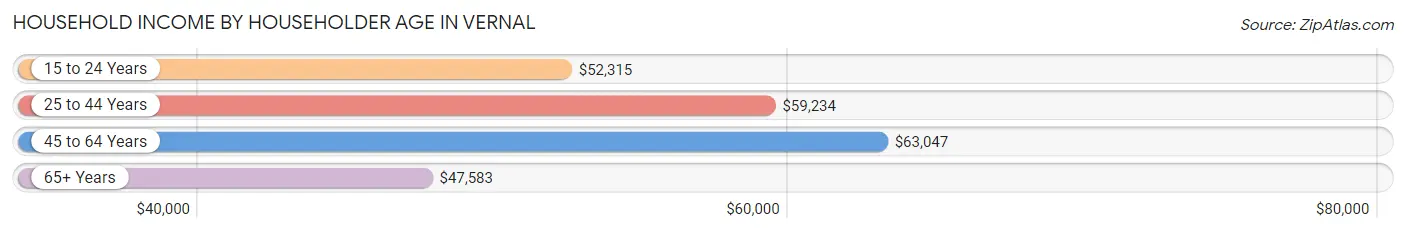
| Income Bracket | # Households | Median Income |
| 15 to 24 Years | 320 (9.6%) | $52,315 |
| 25 to 44 Years | 1,403 (42.2%) | $59,234 |
| 45 to 64 Years | 1,112 (33.4%) | $63,047 |
| 65+ Years | 492 (14.8%) | $47,583 |
| Total | 3,327 (100.0%) | $58,869 |
Poverty in Vernal
Income Below Poverty by Sex and Age in Vernal
With 14.1% poverty level for males and 17.5% for females among the residents of Vernal, 15 year old males and 5 year old females are the most vulnerable to poverty, with 38 males (38.4%) and 59 females (48.8%) in their respective age groups living below the poverty level.
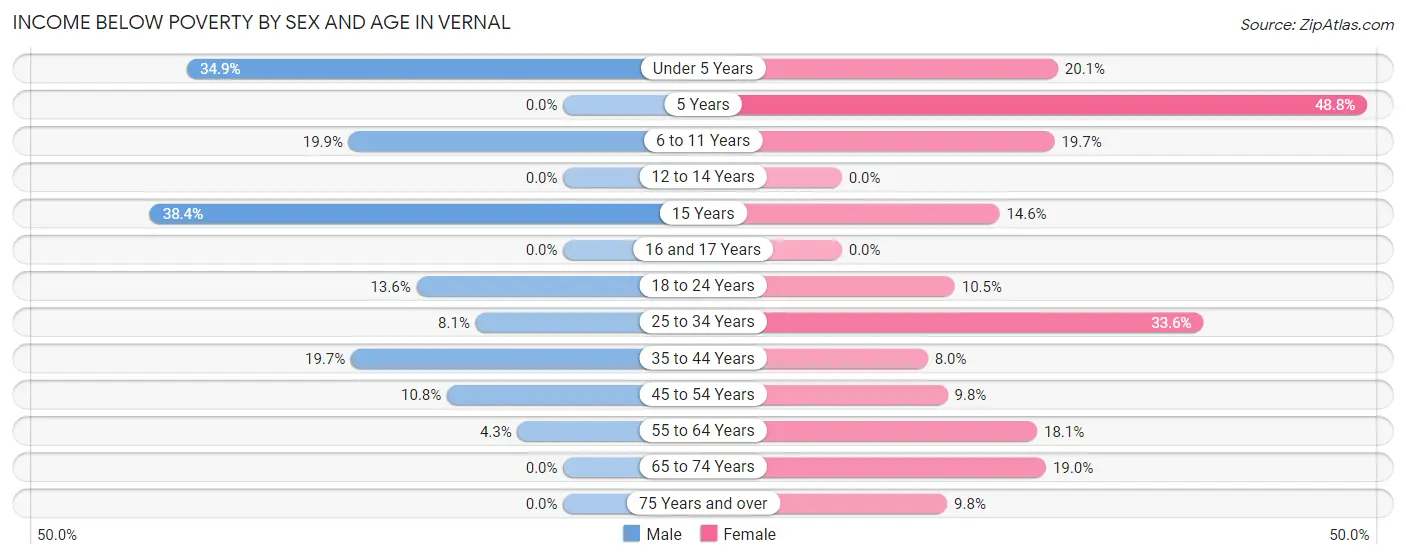
| Age Bracket | Male | Female |
| Under 5 Years | 222 (34.9%) | 85 (20.1%) |
| 5 Years | 0 (0.0%) | 59 (48.8%) |
| 6 to 11 Years | 87 (19.9%) | 90 (19.7%) |
| 12 to 14 Years | 0 (0.0%) | 0 (0.0%) |
| 15 Years | 38 (38.4%) | 12 (14.6%) |
| 16 and 17 Years | 0 (0.0%) | 0 (0.0%) |
| 18 to 24 Years | 74 (13.6%) | 54 (10.5%) |
| 25 to 34 Years | 64 (8.1%) | 292 (33.6%) |
| 35 to 44 Years | 158 (19.7%) | 38 (8.0%) |
| 45 to 54 Years | 56 (10.8%) | 60 (9.8%) |
| 55 to 64 Years | 18 (4.3%) | 75 (18.1%) |
| 65 to 74 Years | 0 (0.0%) | 36 (19.0%) |
| 75 Years and over | 0 (0.0%) | 18 (9.8%) |
| Total | 717 (14.1%) | 819 (17.5%) |
Income Above Poverty by Sex and Age in Vernal
According to the poverty statistics in Vernal, males aged 5 years and females aged 12 to 14 years are the age groups that are most secure financially, with 100.0% of males and 100.0% of females in these age groups living above the poverty line.
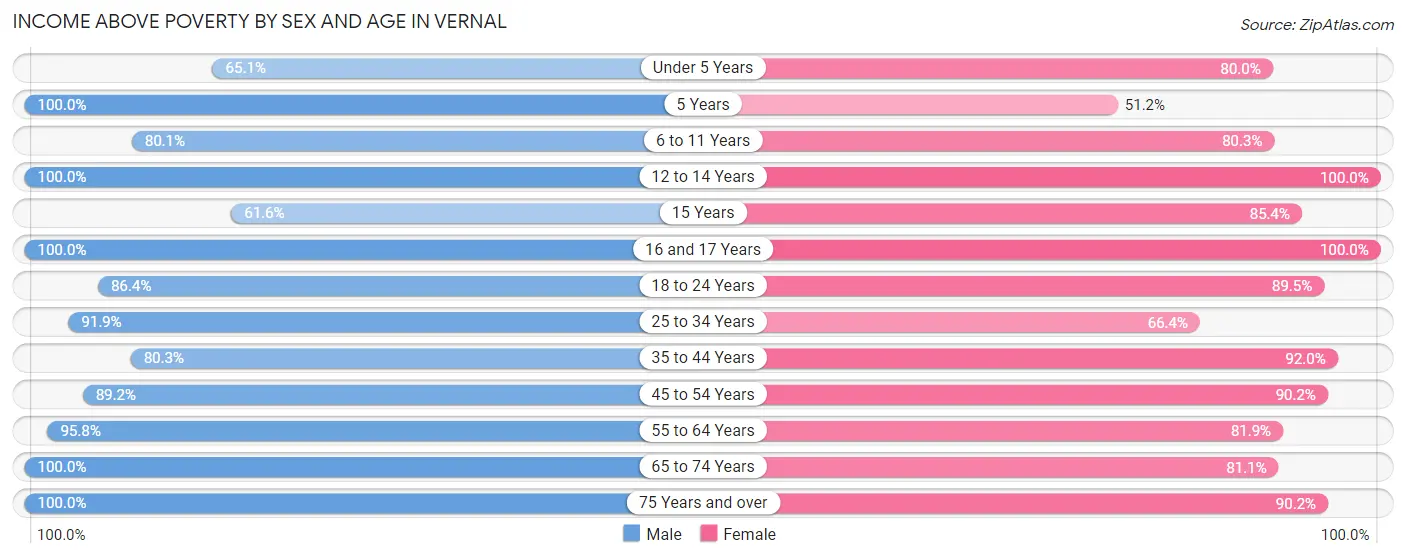
| Age Bracket | Male | Female |
| Under 5 Years | 414 (65.1%) | 339 (79.9%) |
| 5 Years | 71 (100.0%) | 62 (51.2%) |
| 6 to 11 Years | 350 (80.1%) | 366 (80.3%) |
| 12 to 14 Years | 340 (100.0%) | 135 (100.0%) |
| 15 Years | 61 (61.6%) | 70 (85.4%) |
| 16 and 17 Years | 62 (100.0%) | 198 (100.0%) |
| 18 to 24 Years | 469 (86.4%) | 461 (89.5%) |
| 25 to 34 Years | 723 (91.9%) | 578 (66.4%) |
| 35 to 44 Years | 644 (80.3%) | 438 (92.0%) |
| 45 to 54 Years | 463 (89.2%) | 551 (90.2%) |
| 55 to 64 Years | 406 (95.8%) | 339 (81.9%) |
| 65 to 74 Years | 194 (100.0%) | 154 (81.0%) |
| 75 Years and over | 159 (100.0%) | 166 (90.2%) |
| Total | 4,356 (85.9%) | 3,857 (82.5%) |
Income Below Poverty Among Married-Couple Families in Vernal
The poverty statistics for married-couple families in Vernal show that 5.6% or 86 of the total 1,535 families live below the poverty line. Families with 1 or 2 children have the highest poverty rate of 7.6%, comprising of 48 families. On the other hand, families with 5 or more children have the lowest poverty rate of 0.0%, which includes 0 families.
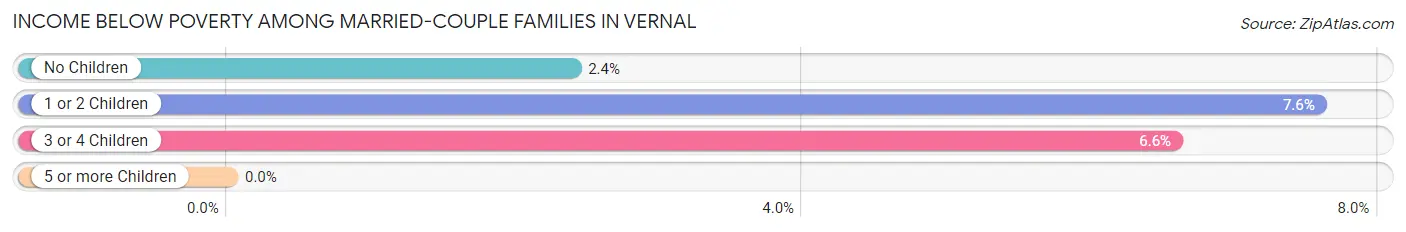
| Children | Above Poverty | Below Poverty |
| No Children | 491 (97.6%) | 12 (2.4%) |
| 1 or 2 Children | 585 (92.4%) | 48 (7.6%) |
| 3 or 4 Children | 369 (93.4%) | 26 (6.6%) |
| 5 or more Children | 4 (100.0%) | 0 (0.0%) |
| Total | 1,449 (94.4%) | 86 (5.6%) |
Income Below Poverty Among Single-Parent Households in Vernal
According to the poverty data in Vernal, 27.0% or 65 single-father households and 30.6% or 148 single-mother households are living below the poverty line. Among single-father households, those with 1 or 2 children have the highest poverty rate, with 65 households (59.1%) experiencing poverty. Likewise, among single-mother households, those with 3 or 4 children have the highest poverty rate, with 72 households (100.0%) falling below the poverty line.
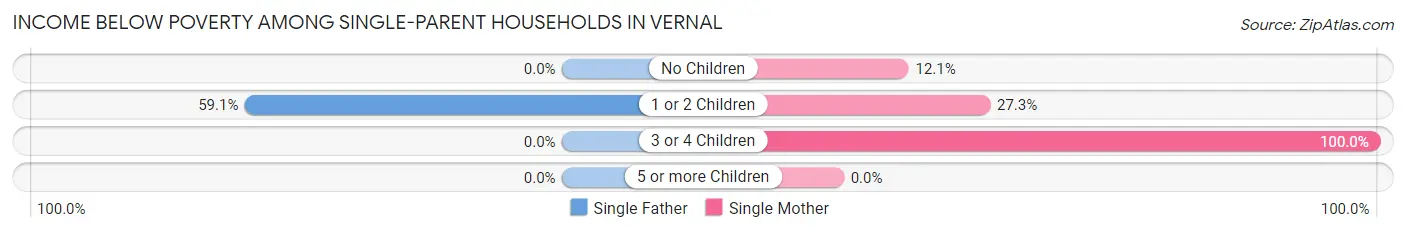
| Children | Single Father | Single Mother |
| No Children | 0 (0.0%) | 25 (12.1%) |
| 1 or 2 Children | 65 (59.1%) | 51 (27.3%) |
| 3 or 4 Children | 0 (0.0%) | 72 (100.0%) |
| 5 or more Children | 0 (0.0%) | 0 (0.0%) |
| Total | 65 (27.0%) | 148 (30.6%) |
Income Below Poverty Among Married-Couple vs Single-Parent Households in Vernal
The poverty data for Vernal shows that 86 of the married-couple family households (5.6%) and 213 of the single-parent households (29.4%) are living below the poverty level. Within the married-couple family households, those with 1 or 2 children have the highest poverty rate, with 48 households (7.6%) falling below the poverty line. Among the single-parent households, those with 3 or 4 children have the highest poverty rate, with 72 household (100.0%) living below poverty.
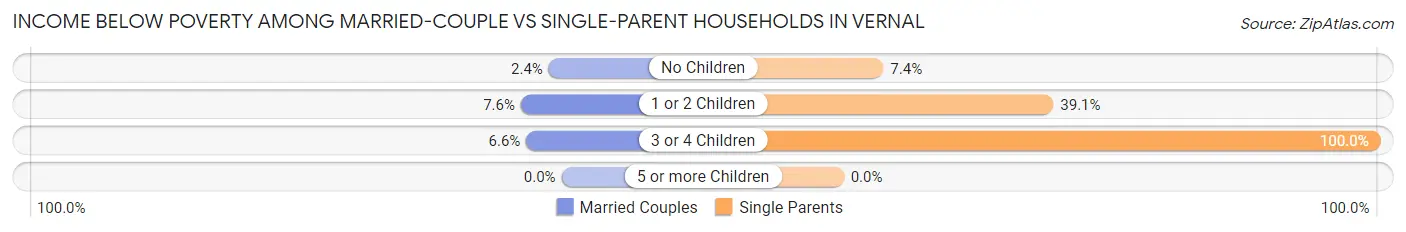
| Children | Married-Couple Families | Single-Parent Households |
| No Children | 12 (2.4%) | 25 (7.4%) |
| 1 or 2 Children | 48 (7.6%) | 116 (39.1%) |
| 3 or 4 Children | 26 (6.6%) | 72 (100.0%) |
| 5 or more Children | 0 (0.0%) | 0 (0.0%) |
| Total | 86 (5.6%) | 213 (29.4%) |
Race in Vernal
The most populous races in Vernal are White / Caucasian (8,712 | 85.9%), Hispanic or Latino (1,067 | 10.5%), and Two or more Races (599 | 5.9%).
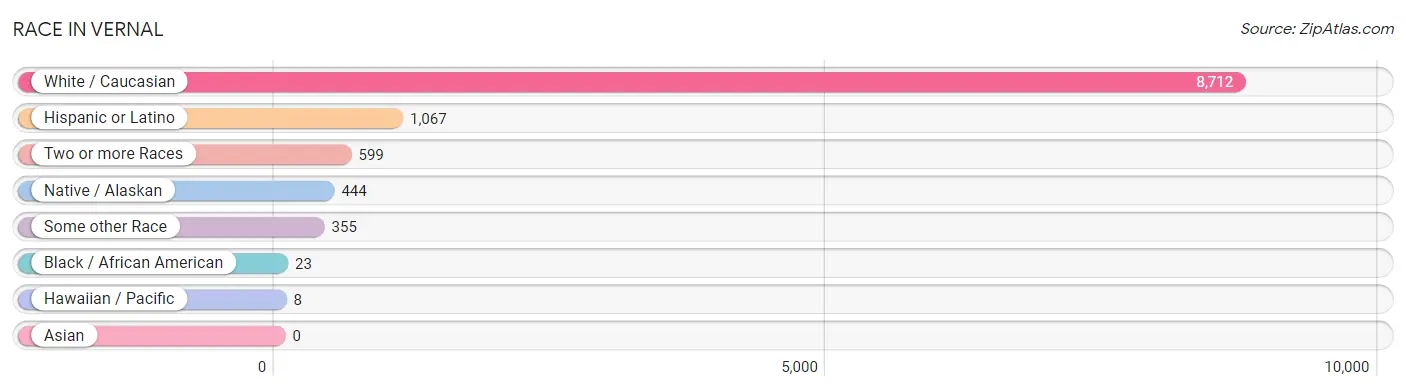
| Race | # Population | % Population |
| Asian | 0 | 0.0% |
| Black / African American | 23 | 0.2% |
| Hawaiian / Pacific | 8 | 0.1% |
| Hispanic or Latino | 1,067 | 10.5% |
| Native / Alaskan | 444 | 4.4% |
| White / Caucasian | 8,712 | 85.9% |
| Two or more Races | 599 | 5.9% |
| Some other Race | 355 | 3.5% |
| Total | 10,141 | 100.0% |
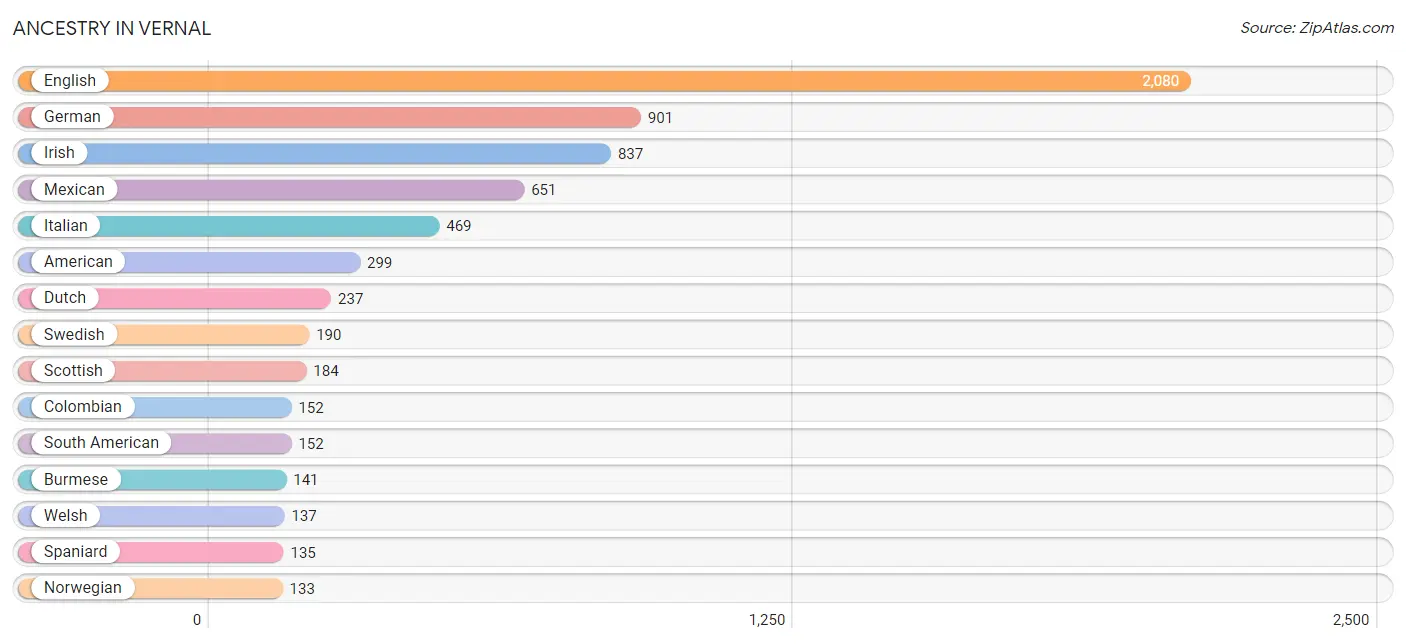
Ancestry in Vernal
The most populous ancestries reported in Vernal are English (2,080 | 20.5%), German (901 | 8.9%), Irish (837 | 8.3%), Mexican (651 | 6.4%), and Italian (469 | 4.6%), together accounting for 48.7% of all Vernal residents.
| Ancestry | # Population | % Population |
| Alaska Native | 42 | 0.4% |
| American | 299 | 2.9% |
| Bhutanese | 39 | 0.4% |
| Blackfeet | 26 | 0.3% |
| British | 61 | 0.6% |
| Burmese | 141 | 1.4% |
| Canadian | 51 | 0.5% |
| Central American | 56 | 0.5% |
| Cherokee | 105 | 1.0% |
| Colombian | 152 | 1.5% |
| Czech | 66 | 0.6% |
| Danish | 33 | 0.3% |
| Dutch | 237 | 2.3% |
| English | 2,080 | 20.5% |
| European | 113 | 1.1% |
| Finnish | 31 | 0.3% |
| French | 102 | 1.0% |
| German | 901 | 8.9% |
| Guamanian / Chamorro | 25 | 0.3% |
| Guatemalan | 25 | 0.3% |
| Irish | 837 | 8.3% |
| Italian | 469 | 4.6% |
| Korean | 4 | 0.0% |
| Mexican | 651 | 6.4% |
| Norwegian | 133 | 1.3% |
| Paiute | 5 | 0.1% |
| Polish | 38 | 0.4% |
| Salvadoran | 31 | 0.3% |
| Samoan | 7 | 0.1% |
| Scandinavian | 42 | 0.4% |
| Scotch-Irish | 57 | 0.6% |
| Scottish | 184 | 1.8% |
| Sioux | 68 | 0.7% |
| South American | 152 | 1.5% |
| Spaniard | 135 | 1.3% |
| Spanish | 20 | 0.2% |
| Swedish | 190 | 1.9% |
| Swiss | 89 | 0.9% |
| Thai | 42 | 0.4% |
| Tongan | 4 | 0.0% |
| Turkish | 125 | 1.2% |
| Ute | 123 | 1.2% |
| Welsh | 137 | 1.3% | View All 43 Rows |
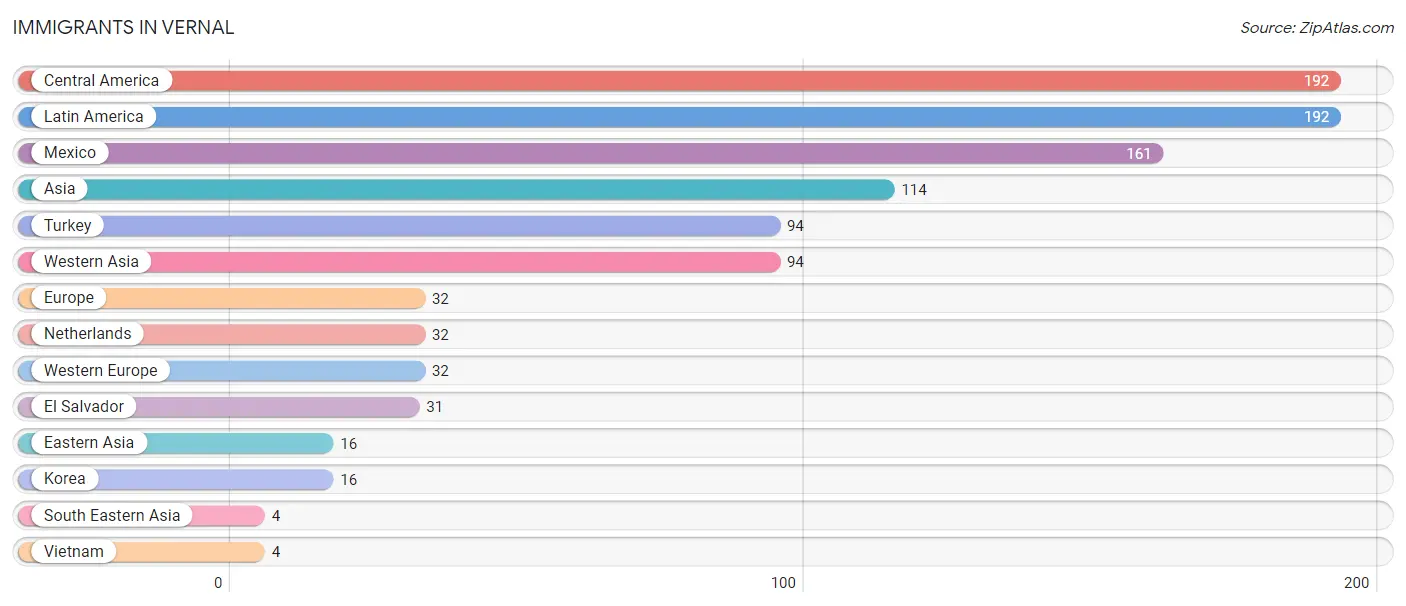
Immigrants in Vernal
The most numerous immigrant groups reported in Vernal came from Central America (192 | 1.9%), Latin America (192 | 1.9%), Mexico (161 | 1.6%), Asia (114 | 1.1%), and Turkey (94 | 0.9%), together accounting for 7.4% of all Vernal residents.
| Immigration Origin | # Population | % Population |
| Asia | 114 | 1.1% |
| Central America | 192 | 1.9% |
| Eastern Asia | 16 | 0.2% |
| El Salvador | 31 | 0.3% |
| Europe | 32 | 0.3% |
| Korea | 16 | 0.2% |
| Latin America | 192 | 1.9% |
| Mexico | 161 | 1.6% |
| Netherlands | 32 | 0.3% |
| South Eastern Asia | 4 | 0.0% |
| Turkey | 94 | 0.9% |
| Vietnam | 4 | 0.0% |
| Western Asia | 94 | 0.9% |
| Western Europe | 32 | 0.3% | View All 14 Rows |
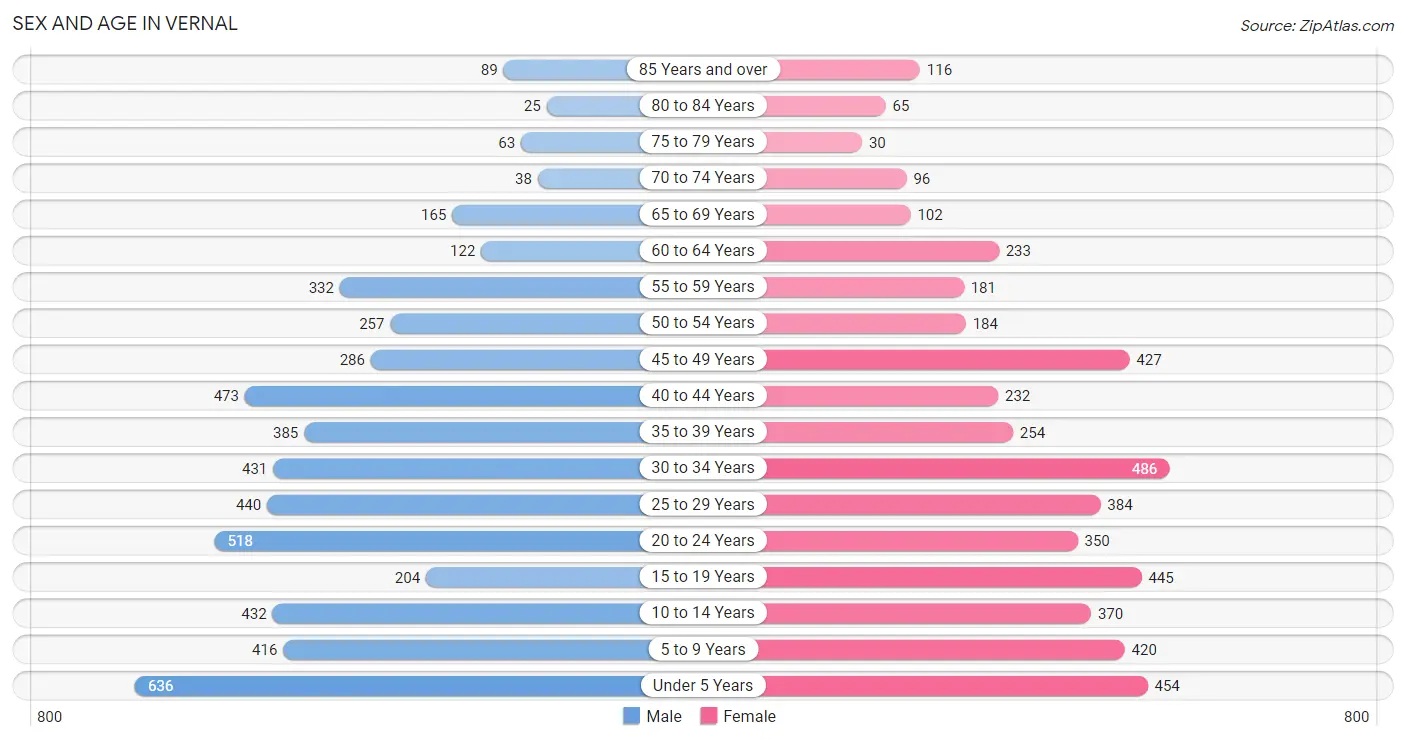
Sex and Age in Vernal
Sex and Age in Vernal
The most populous age groups in Vernal are Under 5 Years (636 | 12.0%) for men and 30 to 34 Years (486 | 10.1%) for women.
| Age Bracket | Male | Female |
| Under 5 Years | 636 (12.0%) | 454 (9.4%) |
| 5 to 9 Years | 416 (7.8%) | 420 (8.7%) |
| 10 to 14 Years | 432 (8.1%) | 370 (7.7%) |
| 15 to 19 Years | 204 (3.8%) | 445 (9.2%) |
| 20 to 24 Years | 518 (9.8%) | 350 (7.2%) |
| 25 to 29 Years | 440 (8.3%) | 384 (8.0%) |
| 30 to 34 Years | 431 (8.1%) | 486 (10.1%) |
| 35 to 39 Years | 385 (7.2%) | 254 (5.3%) |
| 40 to 44 Years | 473 (8.9%) | 232 (4.8%) |
| 45 to 49 Years | 286 (5.4%) | 427 (8.8%) |
| 50 to 54 Years | 257 (4.8%) | 184 (3.8%) |
| 55 to 59 Years | 332 (6.2%) | 181 (3.7%) |
| 60 to 64 Years | 122 (2.3%) | 233 (4.8%) |
| 65 to 69 Years | 165 (3.1%) | 102 (2.1%) |
| 70 to 74 Years | 38 (0.7%) | 96 (2.0%) |
| 75 to 79 Years | 63 (1.2%) | 30 (0.6%) |
| 80 to 84 Years | 25 (0.5%) | 65 (1.3%) |
| 85 Years and over | 89 (1.7%) | 116 (2.4%) |
| Total | 5,312 (100.0%) | 4,829 (100.0%) |
Families and Households in Vernal
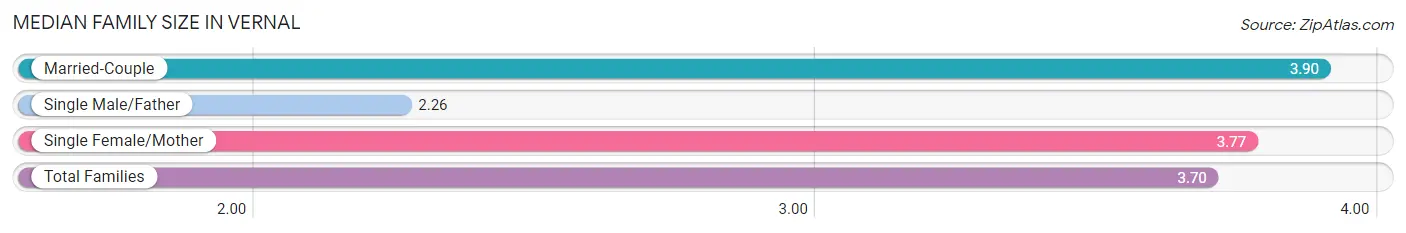
Median Family Size in Vernal
The median family size in Vernal is 3.70 persons per family, with married-couple families (1,535 | 67.9%) accounting for the largest median family size of 3.9 persons per family. On the other hand, single male/father families (241 | 10.7%) represent the smallest median family size with 2.26 persons per family.
| Family Type | # Families | Family Size |
| Married-Couple | 1,535 (67.9%) | 3.90 |
| Single Male/Father | 241 (10.7%) | 2.26 |
| Single Female/Mother | 483 (21.4%) | 3.77 |
| Total Families | 2,259 (100.0%) | 3.70 |
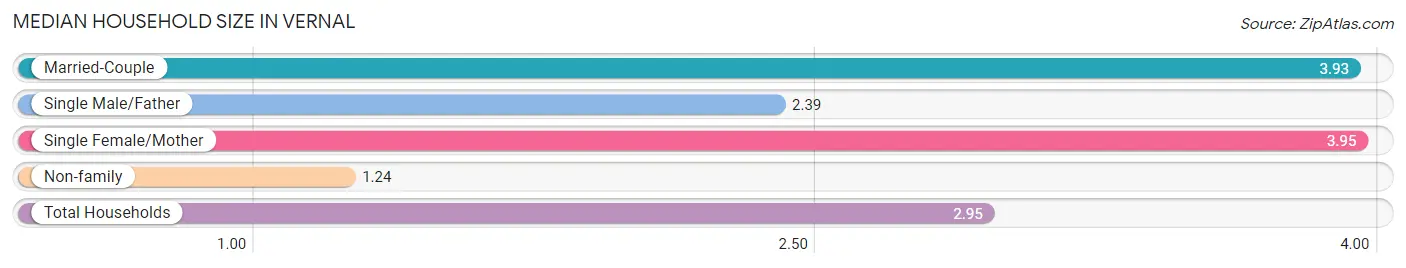
Median Household Size in Vernal
The median household size in Vernal is 2.95 persons per household, with single female/mother households (483 | 14.5%) accounting for the largest median household size of 3.95 persons per household. non-family households (1,068 | 32.1%) represent the smallest median household size with 1.24 persons per household.
| Household Type | # Households | Household Size |
| Married-Couple | 1,535 (46.1%) | 3.93 |
| Single Male/Father | 241 (7.2%) | 2.39 |
| Single Female/Mother | 483 (14.5%) | 3.95 |
| Non-family | 1,068 (32.1%) | 1.24 |
| Total Households | 3,327 (100.0%) | 2.95 |
Household Size by Marriage Status in Vernal
Out of a total of 3,327 households in Vernal, 2,259 (67.9%) are family households, while 1,068 (32.1%) are nonfamily households. The most numerous type of family households are 2-person households, comprising 747, and the most common type of nonfamily households are 1-person households, comprising 887.
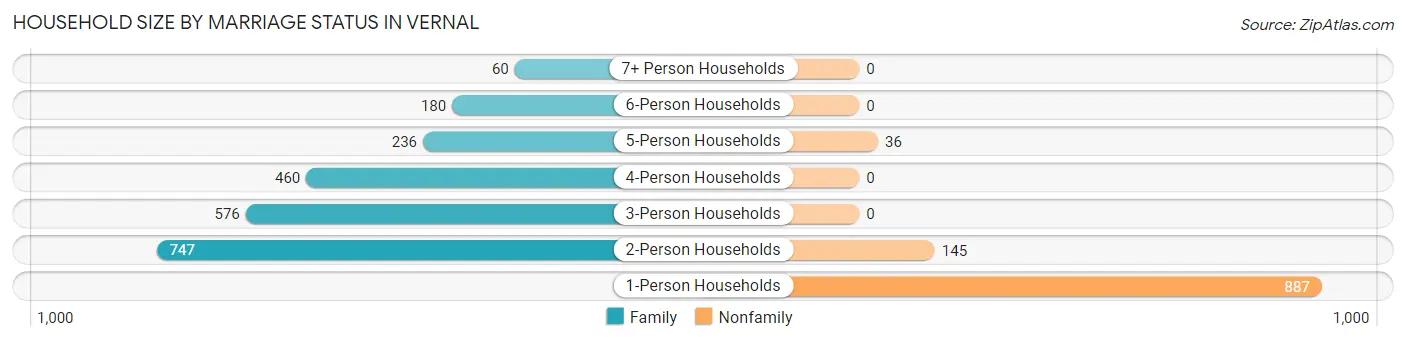
| Household Size | Family Households | Nonfamily Households |
| 1-Person Households | - | 887 (26.7%) |
| 2-Person Households | 747 (22.5%) | 145 (4.4%) |
| 3-Person Households | 576 (17.3%) | 0 (0.0%) |
| 4-Person Households | 460 (13.8%) | 0 (0.0%) |
| 5-Person Households | 236 (7.1%) | 36 (1.1%) |
| 6-Person Households | 180 (5.4%) | 0 (0.0%) |
| 7+ Person Households | 60 (1.8%) | 0 (0.0%) |
| Total | 2,259 (67.9%) | 1,068 (32.1%) |
Female Fertility in Vernal
Fertility by Age in Vernal
Average fertility rate in Vernal is 111.0 births per 1,000 women. Women in the age bracket of 20 to 34 years have the highest fertility rate with 231.0 births per 1,000 women. Women in the age bracket of 20 to 34 years acount for 96.3% of all women with births.
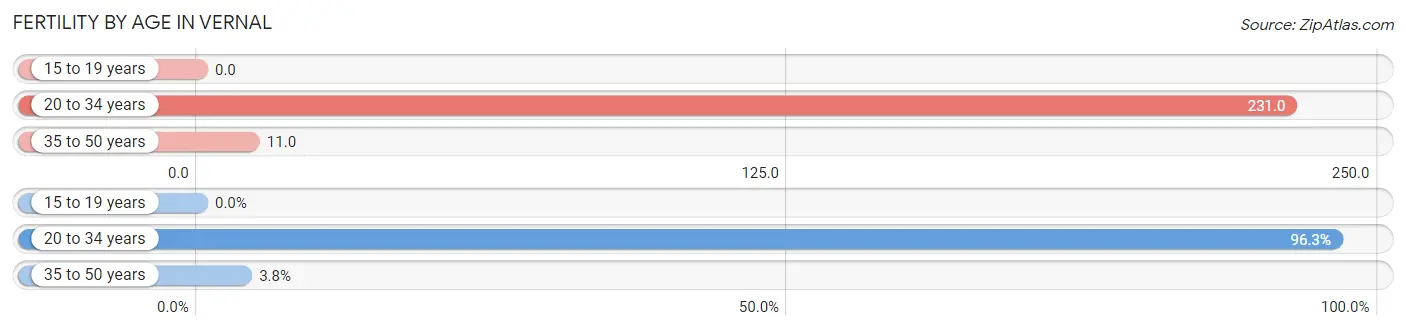
| Age Bracket | Women with Births | Births / 1,000 Women |
| 15 to 19 years | 0 (0.0%) | 0.0 |
| 20 to 34 years | 282 (96.3%) | 231.0 |
| 35 to 50 years | 11 (3.7%) | 11.0 |
| Total | 293 (100.0%) | 111.0 |
Fertility by Age by Marriage Status in Vernal
82.3% of women with births (293) in Vernal are married. The highest percentage of unmarried women with births falls into 35 to 50 years age bracket with 100.0% of them unmarried at the time of birth, while the lowest percentage of unmarried women with births belong to 20 to 34 years age bracket with 14.5% of them unmarried.
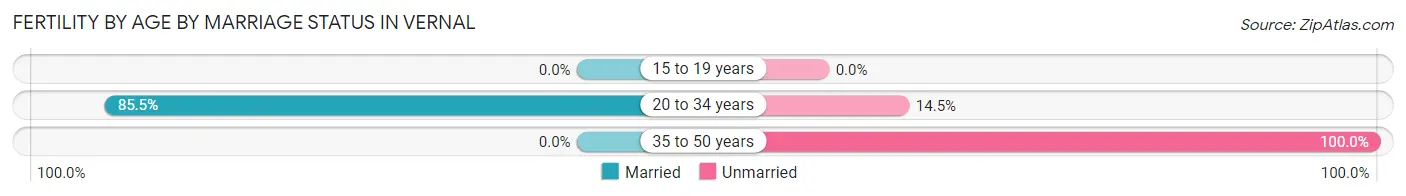
| Age Bracket | Married | Unmarried |
| 15 to 19 years | 0 (0.0%) | 0 (0.0%) |
| 20 to 34 years | 241 (85.5%) | 41 (14.5%) |
| 35 to 50 years | 0 (0.0%) | 11 (100.0%) |
| Total | 241 (82.3%) | 52 (17.7%) |
Fertility by Education in Vernal
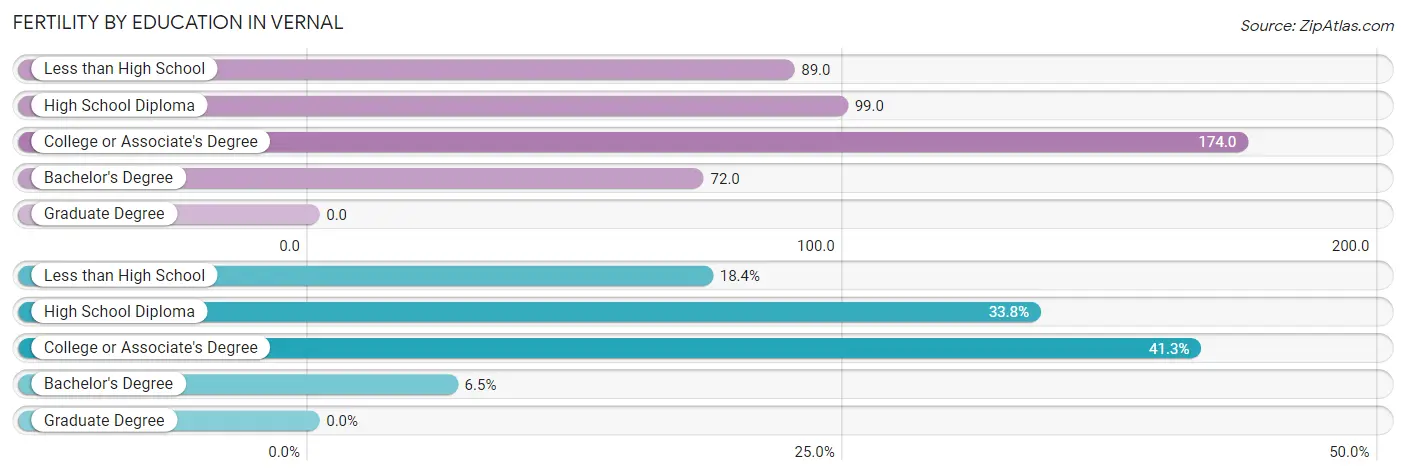
| Educational Attainment | Women with Births | Births / 1,000 Women |
| Less than High School | 54 (18.4%) | 89.0 |
| High School Diploma | 99 (33.8%) | 99.0 |
| College or Associate's Degree | 121 (41.3%) | 174.0 |
| Bachelor's Degree | 19 (6.5%) | 72.0 |
| Graduate Degree | 0 (0.0%) | 0.0 |
| Total | 293 (100.0%) | 111.0 |
Fertility by Education by Marriage Status in Vernal
17.7% of women with births in Vernal are unmarried. Women with the educational attainment of less than high school are most likely to be married with 100.0% of them married at childbirth, while women with the educational attainment of high school diploma are least likely to be married with 41.4% of them unmarried at childbirth.
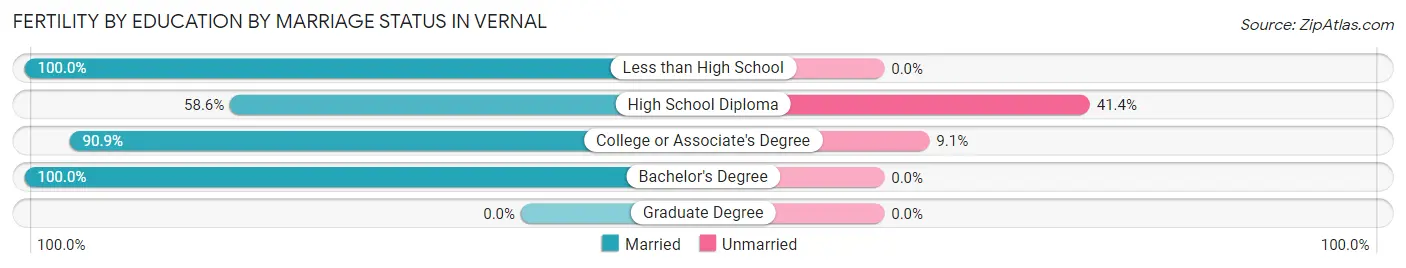
| Educational Attainment | Married | Unmarried |
| Less than High School | 54 (100.0%) | 0 (0.0%) |
| High School Diploma | 58 (58.6%) | 41 (41.4%) |
| College or Associate's Degree | 110 (90.9%) | 11 (9.1%) |
| Bachelor's Degree | 19 (100.0%) | 0 (0.0%) |
| Graduate Degree | 0 (0.0%) | 0 (0.0%) |
| Total | 241 (82.3%) | 52 (17.7%) |
Employment Characteristics in Vernal
Employment by Class of Employer in Vernal
Among the 4,364 employed individuals in Vernal, private company employees (3,202 | 73.4%), local government employees (411 | 9.4%), and federal government employees (214 | 4.9%) make up the most common classes of employment.
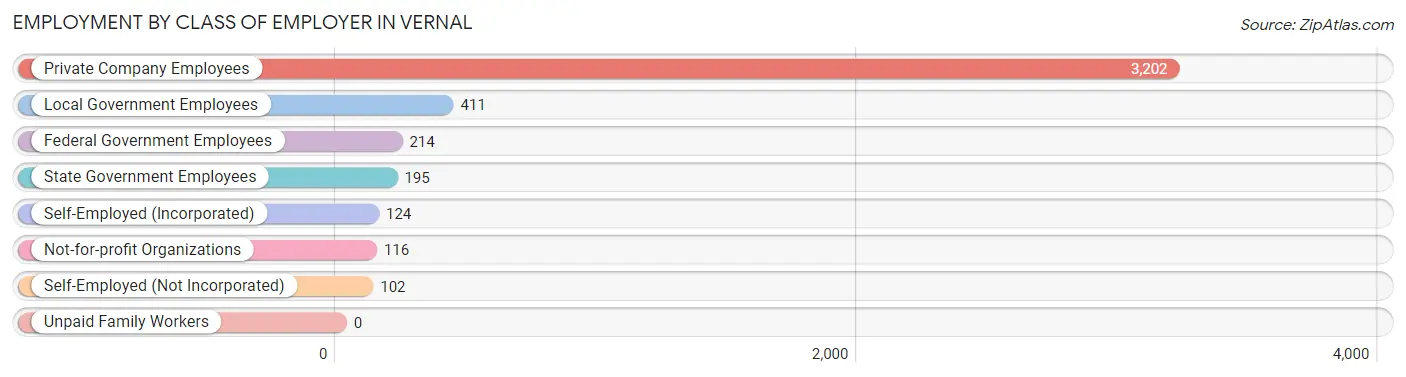
| Employer Class | # Employees | % Employees |
| Private Company Employees | 3,202 | 73.4% |
| Self-Employed (Incorporated) | 124 | 2.8% |
| Self-Employed (Not Incorporated) | 102 | 2.3% |
| Not-for-profit Organizations | 116 | 2.7% |
| Local Government Employees | 411 | 9.4% |
| State Government Employees | 195 | 4.5% |
| Federal Government Employees | 214 | 4.9% |
| Unpaid Family Workers | 0 | 0.0% |
| Total | 4,364 | 100.0% |
Employment Status by Age in Vernal
According to the labor force statistics for Vernal, out of the total population over 16 years of age (7,231), 66.6% or 4,816 individuals are in the labor force, with 8.9% or 429 of them unemployed. The age group with the highest labor force participation rate is 16 to 19 years, with 83.9% or 392 individuals in the labor force. Within the labor force, the 20 to 24 years age range has the highest percentage of unemployed individuals, with 19.1% or 138 of them being unemployed.
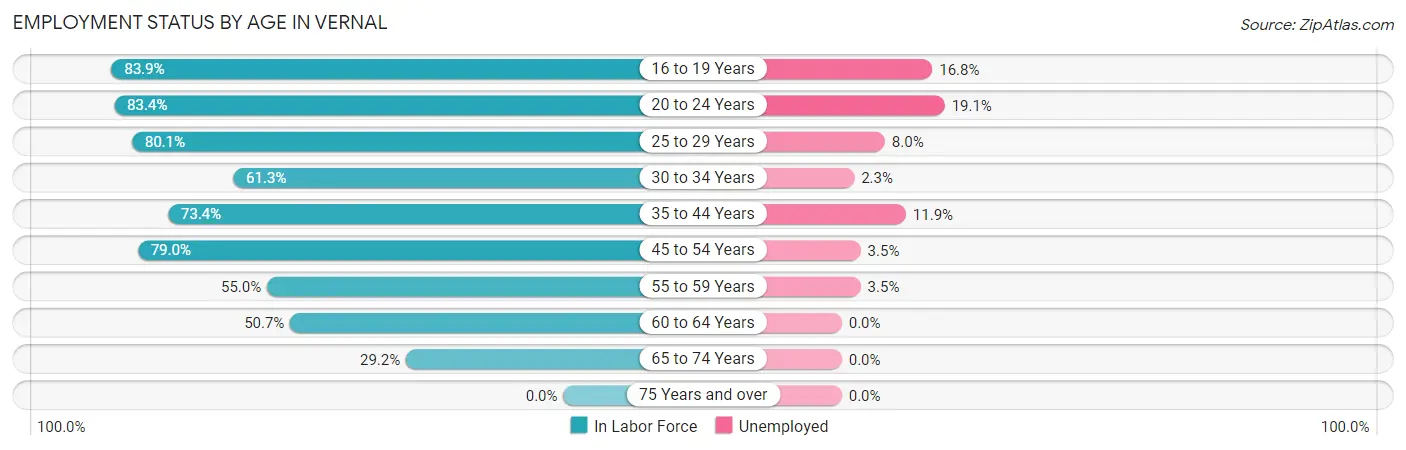
| Age Bracket | In Labor Force | Unemployed |
| 16 to 19 Years | 392 (83.9%) | 66 (16.8%) |
| 20 to 24 Years | 724 (83.4%) | 138 (19.1%) |
| 25 to 29 Years | 660 (80.1%) | 53 (8.0%) |
| 30 to 34 Years | 562 (61.3%) | 13 (2.3%) |
| 35 to 44 Years | 986 (73.4%) | 117 (11.9%) |
| 45 to 54 Years | 912 (79.0%) | 32 (3.5%) |
| 55 to 59 Years | 282 (55.0%) | 10 (3.5%) |
| 60 to 64 Years | 180 (50.7%) | 0 (0.0%) |
| 65 to 74 Years | 117 (29.2%) | 0 (0.0%) |
| 75 Years and over | 0 (0.0%) | 0 (0.0%) |
| Total | 4,816 (66.6%) | 429 (8.9%) |
Employment Status by Educational Attainment in Vernal
According to labor force statistics for Vernal, 70.2% of individuals (3,585) out of the total population between 25 and 64 years of age (5,107) are in the labor force, with 6.3% or 226 of them being unemployed. The group with the highest labor force participation rate are those with the educational attainment of bachelor's degree or higher, with 80.3% or 615 individuals in the labor force. Within the labor force, individuals with less than high school education have the highest percentage of unemployment, with 16.6% or 78 of them being unemployed.
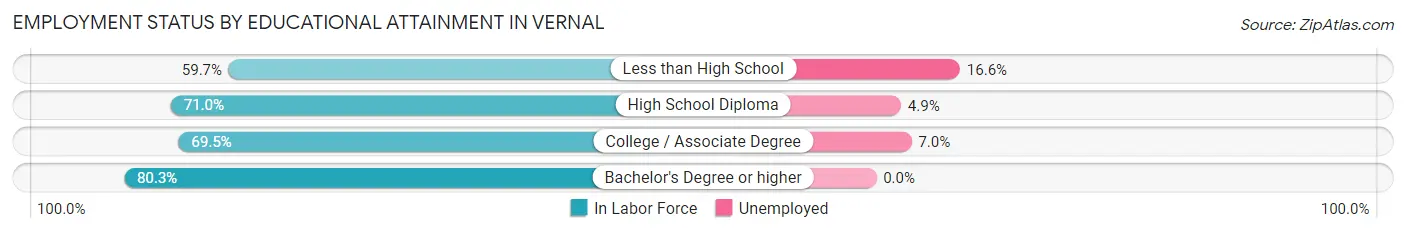
| Educational Attainment | In Labor Force | Unemployed |
| Less than High School | 469 (59.7%) | 130 (16.6%) |
| High School Diploma | 1,330 (71.0%) | 92 (4.9%) |
| College / Associate Degree | 1,170 (69.5%) | 118 (7.0%) |
| Bachelor's Degree or higher | 615 (80.3%) | 0 (0.0%) |
| Total | 3,585 (70.2%) | 322 (6.3%) |
Employment Occupations by Sex in Vernal
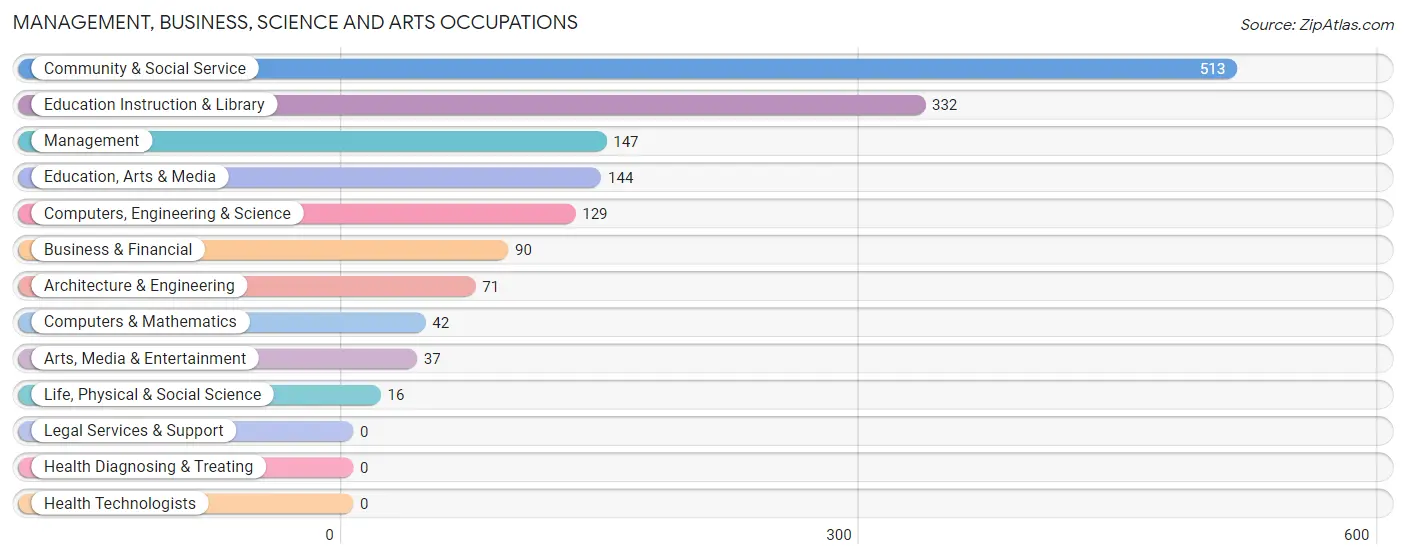
Management, Business, Science and Arts Occupations
The most common Management, Business, Science and Arts occupations in Vernal are Community & Social Service (513 | 11.7%), Education Instruction & Library (332 | 7.6%), Management (147 | 3.4%), Education, Arts & Media (144 | 3.3%), and Computers, Engineering & Science (129 | 2.9%).
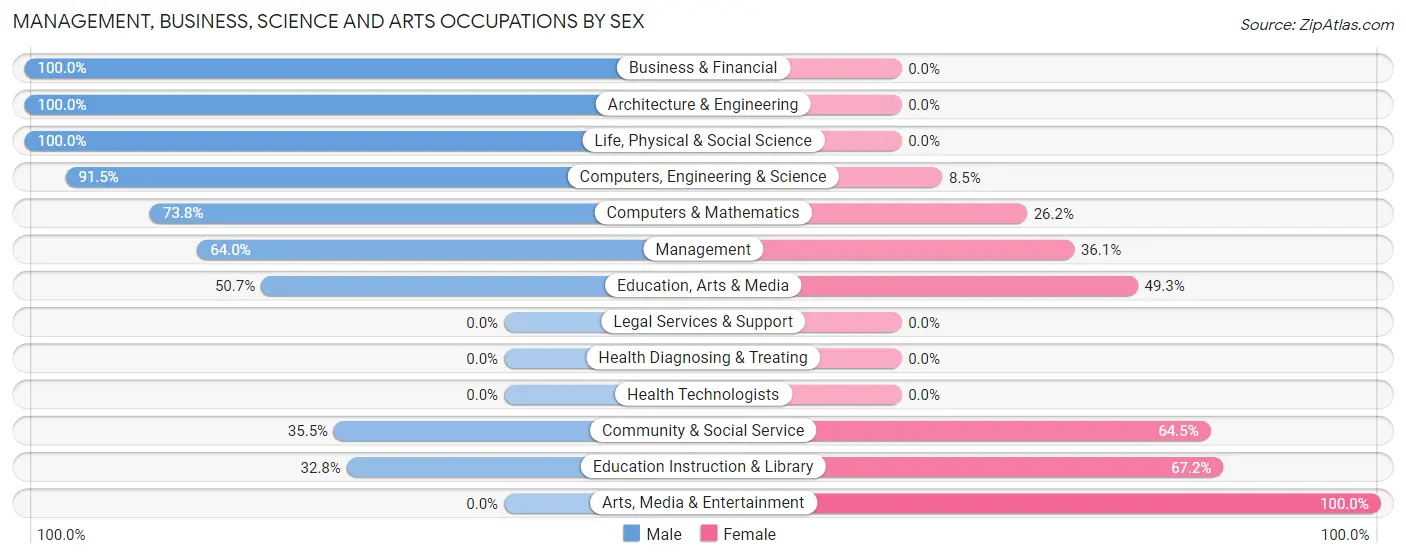
Management, Business, Science and Arts Occupations by Sex
Within the Management, Business, Science and Arts occupations in Vernal, the most male-oriented occupations are Business & Financial (100.0%), Architecture & Engineering (100.0%), and Life, Physical & Social Science (100.0%), while the most female-oriented occupations are Arts, Media & Entertainment (100.0%), Education Instruction & Library (67.2%), and Community & Social Service (64.5%).
| Occupation | Male | Female |
| Management | 94 (63.9%) | 53 (36.0%) |
| Business & Financial | 90 (100.0%) | 0 (0.0%) |
| Computers, Engineering & Science | 118 (91.5%) | 11 (8.5%) |
| Computers & Mathematics | 31 (73.8%) | 11 (26.2%) |
| Architecture & Engineering | 71 (100.0%) | 0 (0.0%) |
| Life, Physical & Social Science | 16 (100.0%) | 0 (0.0%) |
| Community & Social Service | 182 (35.5%) | 331 (64.5%) |
| Education, Arts & Media | 73 (50.7%) | 71 (49.3%) |
| Legal Services & Support | 0 (0.0%) | 0 (0.0%) |
| Education Instruction & Library | 109 (32.8%) | 223 (67.2%) |
| Arts, Media & Entertainment | 0 (0.0%) | 37 (100.0%) |
| Health Diagnosing & Treating | 0 (0.0%) | 0 (0.0%) |
| Health Technologists | 0 (0.0%) | 0 (0.0%) |
| Total (Category) | 484 (55.1%) | 395 (44.9%) |
| Total (Overall) | 2,379 (54.2%) | 2,008 (45.8%) |
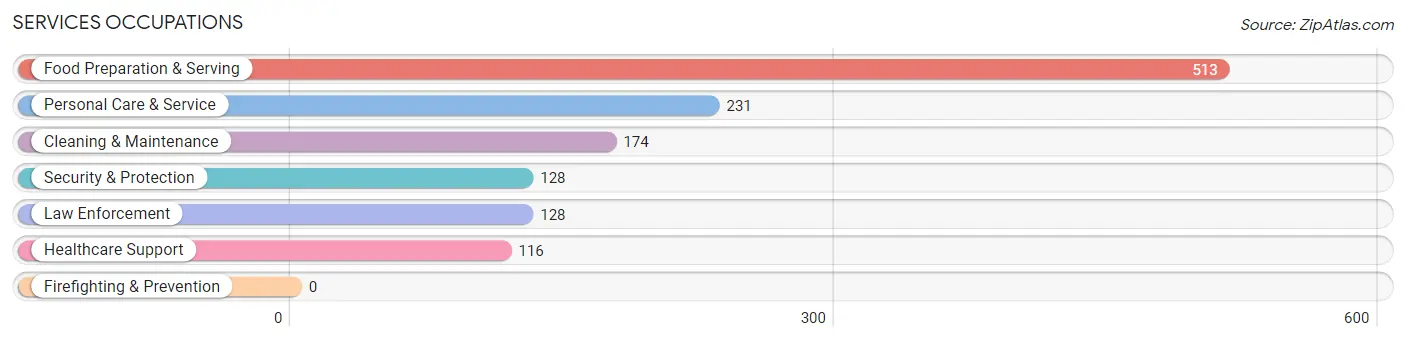
Services Occupations
The most common Services occupations in Vernal are Food Preparation & Serving (513 | 11.7%), Personal Care & Service (231 | 5.3%), Cleaning & Maintenance (174 | 4.0%), Security & Protection (128 | 2.9%), and Law Enforcement (128 | 2.9%).
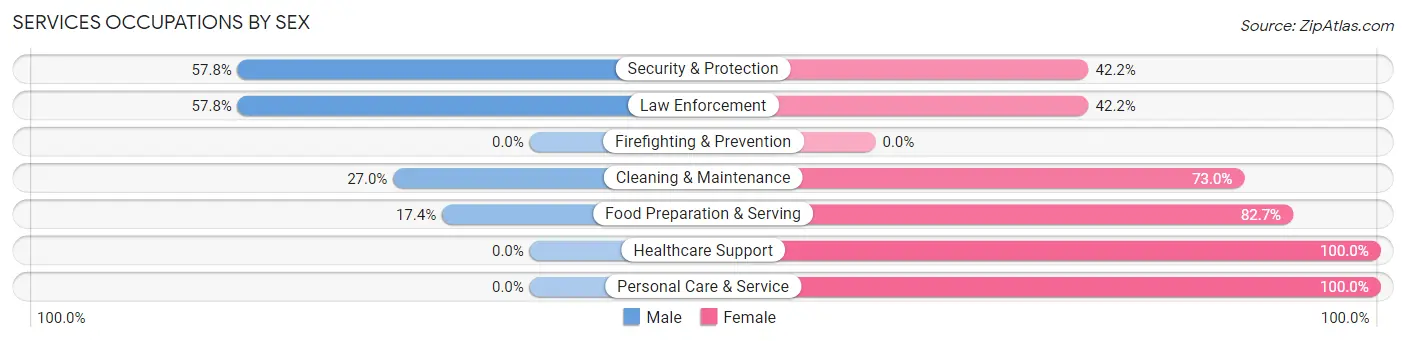
Services Occupations by Sex
Within the Services occupations in Vernal, the most male-oriented occupations are Security & Protection (57.8%), Law Enforcement (57.8%), and Cleaning & Maintenance (27.0%), while the most female-oriented occupations are Healthcare Support (100.0%), Personal Care & Service (100.0%), and Food Preparation & Serving (82.7%).
| Occupation | Male | Female |
| Healthcare Support | 0 (0.0%) | 116 (100.0%) |
| Security & Protection | 74 (57.8%) | 54 (42.2%) |
| Firefighting & Prevention | 0 (0.0%) | 0 (0.0%) |
| Law Enforcement | 74 (57.8%) | 54 (42.2%) |
| Food Preparation & Serving | 89 (17.3%) | 424 (82.7%) |
| Cleaning & Maintenance | 47 (27.0%) | 127 (73.0%) |
| Personal Care & Service | 0 (0.0%) | 231 (100.0%) |
| Total (Category) | 210 (18.1%) | 952 (81.9%) |
| Total (Overall) | 2,379 (54.2%) | 2,008 (45.8%) |
Sales and Office Occupations
The most common Sales and Office occupations in Vernal are Office & Administration (495 | 11.3%), and Sales & Related (423 | 9.6%).
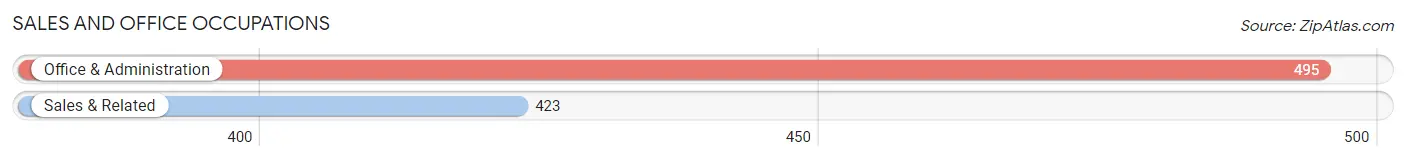
Sales and Office Occupations by Sex
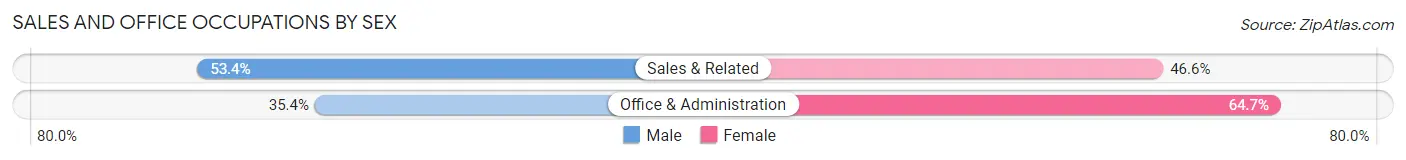
| Occupation | Male | Female |
| Sales & Related | 226 (53.4%) | 197 (46.6%) |
| Office & Administration | 175 (35.3%) | 320 (64.6%) |
| Total (Category) | 401 (43.7%) | 517 (56.3%) |
| Total (Overall) | 2,379 (54.2%) | 2,008 (45.8%) |
Natural Resources, Construction and Maintenance Occupations
The most common Natural Resources, Construction and Maintenance occupations in Vernal are Construction & Extraction (361 | 8.2%), and Installation, Maintenance & Repair (53 | 1.2%).
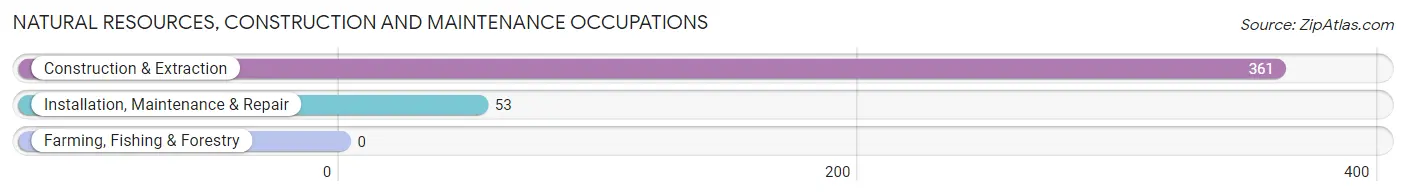
Natural Resources, Construction and Maintenance Occupations by Sex
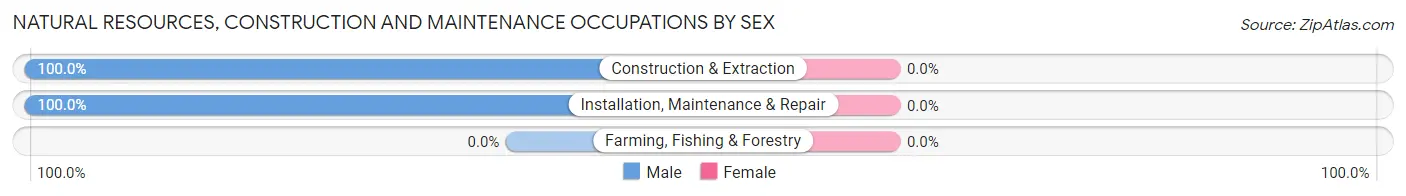
| Occupation | Male | Female |
| Farming, Fishing & Forestry | 0 (0.0%) | 0 (0.0%) |
| Construction & Extraction | 361 (100.0%) | 0 (0.0%) |
| Installation, Maintenance & Repair | 53 (100.0%) | 0 (0.0%) |
| Total (Category) | 414 (100.0%) | 0 (0.0%) |
| Total (Overall) | 2,379 (54.2%) | 2,008 (45.8%) |
Production, Transportation and Moving Occupations
The most common Production, Transportation and Moving occupations in Vernal are Material Moving (383 | 8.7%), Production (341 | 7.8%), and Transportation (290 | 6.6%).
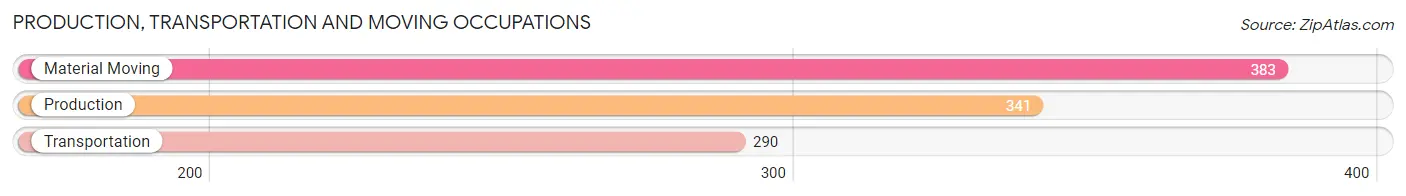
Production, Transportation and Moving Occupations by Sex
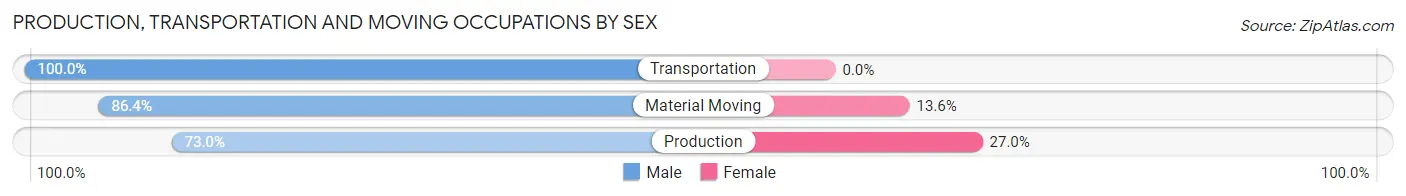
| Occupation | Male | Female |
| Production | 249 (73.0%) | 92 (27.0%) |
| Transportation | 290 (100.0%) | 0 (0.0%) |
| Material Moving | 331 (86.4%) | 52 (13.6%) |
| Total (Category) | 870 (85.8%) | 144 (14.2%) |
| Total (Overall) | 2,379 (54.2%) | 2,008 (45.8%) |
Employment Industries by Sex in Vernal
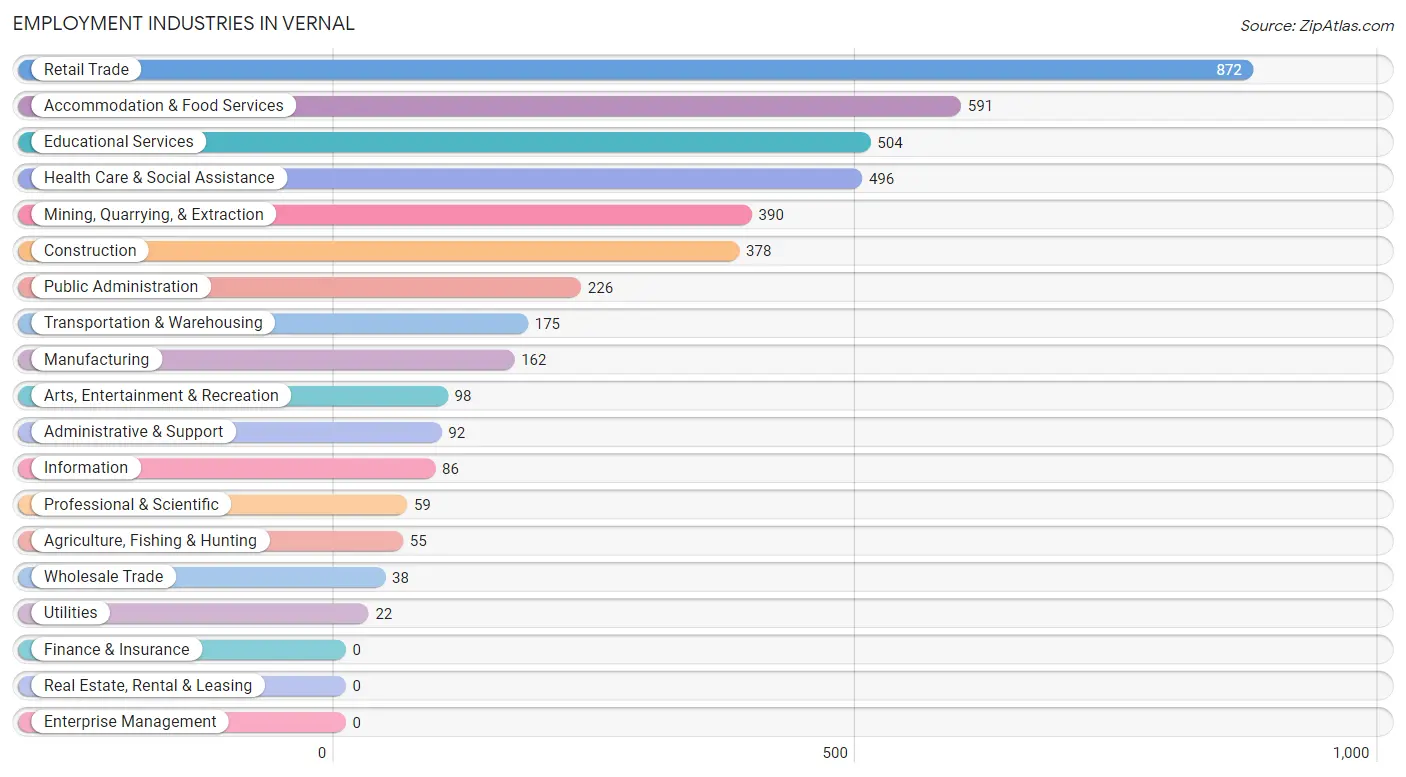
Employment Industries in Vernal
The major employment industries in Vernal include Retail Trade (872 | 19.9%), Accommodation & Food Services (591 | 13.5%), Educational Services (504 | 11.5%), Health Care & Social Assistance (496 | 11.3%), and Mining, Quarrying, & Extraction (390 | 8.9%).
Employment Industries by Sex in Vernal
The Vernal industries that see more men than women are Agriculture, Fishing & Hunting (100.0%), Mining, Quarrying, & Extraction (100.0%), and Transportation & Warehousing (100.0%), whereas the industries that tend to have a higher number of women are Health Care & Social Assistance (87.3%), Accommodation & Food Services (79.9%), and Information (69.8%).
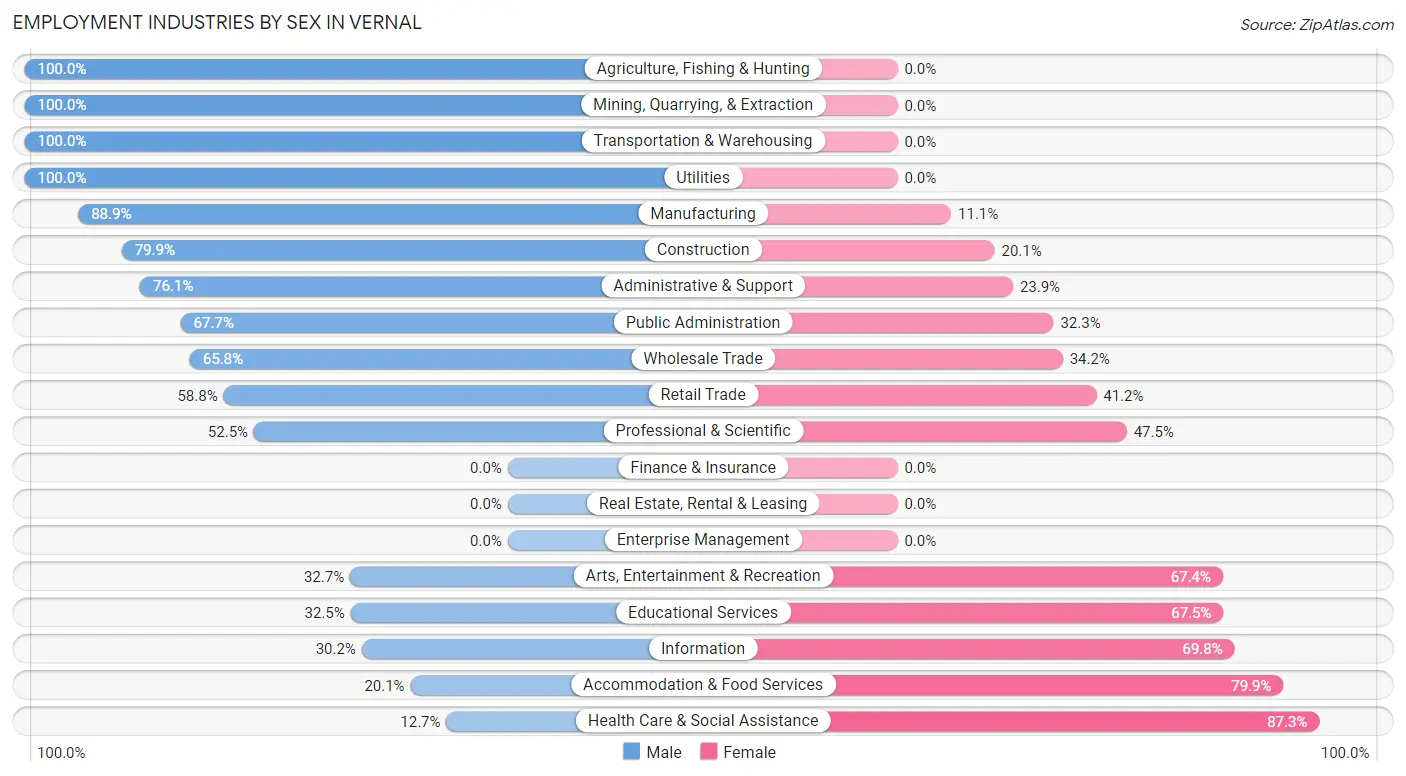
| Industry | Male | Female |
| Agriculture, Fishing & Hunting | 55 (100.0%) | 0 (0.0%) |
| Mining, Quarrying, & Extraction | 390 (100.0%) | 0 (0.0%) |
| Construction | 302 (79.9%) | 76 (20.1%) |
| Manufacturing | 144 (88.9%) | 18 (11.1%) |
| Wholesale Trade | 25 (65.8%) | 13 (34.2%) |
| Retail Trade | 513 (58.8%) | 359 (41.2%) |
| Transportation & Warehousing | 175 (100.0%) | 0 (0.0%) |
| Utilities | 22 (100.0%) | 0 (0.0%) |
| Information | 26 (30.2%) | 60 (69.8%) |
| Finance & Insurance | 0 (0.0%) | 0 (0.0%) |
| Real Estate, Rental & Leasing | 0 (0.0%) | 0 (0.0%) |
| Professional & Scientific | 31 (52.5%) | 28 (47.5%) |
| Enterprise Management | 0 (0.0%) | 0 (0.0%) |
| Administrative & Support | 70 (76.1%) | 22 (23.9%) |
| Educational Services | 164 (32.5%) | 340 (67.5%) |
| Health Care & Social Assistance | 63 (12.7%) | 433 (87.3%) |
| Arts, Entertainment & Recreation | 32 (32.7%) | 66 (67.3%) |
| Accommodation & Food Services | 119 (20.1%) | 472 (79.9%) |
| Public Administration | 153 (67.7%) | 73 (32.3%) |
| Total | 2,379 (54.2%) | 2,008 (45.8%) |
Education in Vernal
School Enrollment in Vernal
The most common levels of schooling among the 2,676 students in Vernal are elementary school (711 | 26.6%), middle school (626 | 23.4%), and high school (554 | 20.7%).
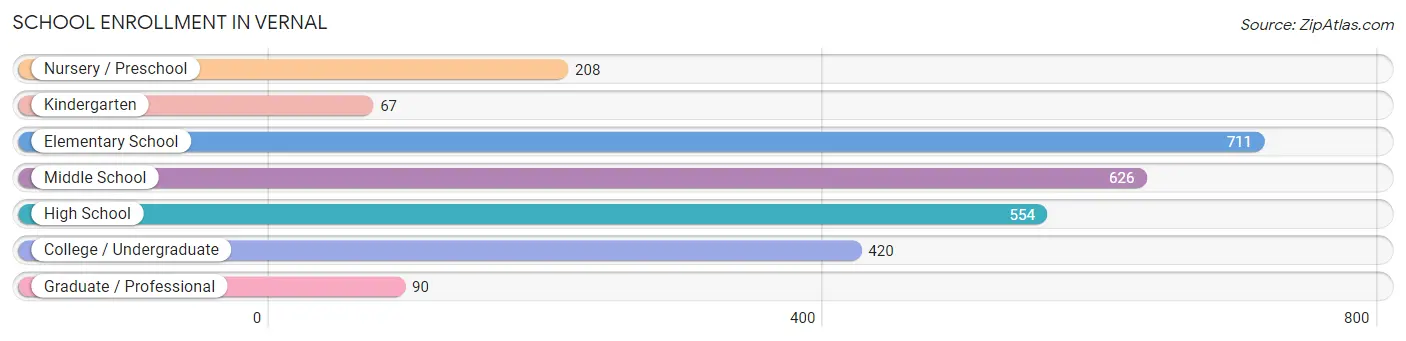
| School Level | # Students | % Students |
| Nursery / Preschool | 208 | 7.8% |
| Kindergarten | 67 | 2.5% |
| Elementary School | 711 | 26.6% |
| Middle School | 626 | 23.4% |
| High School | 554 | 20.7% |
| College / Undergraduate | 420 | 15.7% |
| Graduate / Professional | 90 | 3.4% |
| Total | 2,676 | 100.0% |
School Enrollment by Age by Funding Source in Vernal
Out of a total of 2,676 students who are enrolled in schools in Vernal, 417 (15.6%) attend a private institution, while the remaining 2,259 (84.4%) are enrolled in public schools. The age group of 35 years and over has the highest likelihood of being enrolled in private schools, with 123 (48.4% in the age bracket) enrolled. Conversely, the age group of 18 to 19 year olds has the lowest likelihood of being enrolled in a private school, with 41 (100.0% in the age bracket) attending a public institution.
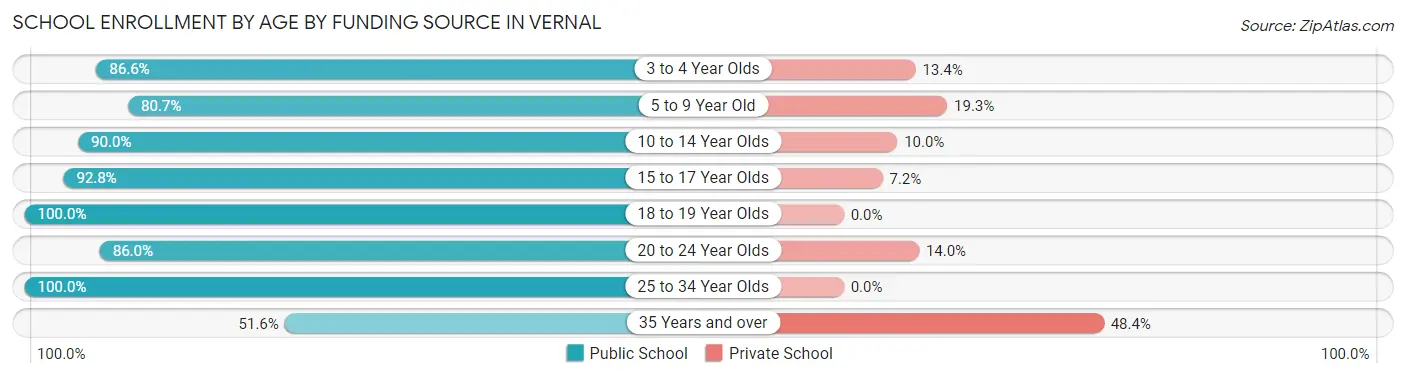
| Age Bracket | Public School | Private School |
| 3 to 4 Year Olds | 123 (86.6%) | 19 (13.4%) |
| 5 to 9 Year Old | 595 (80.7%) | 142 (19.3%) |
| 10 to 14 Year Olds | 713 (90.0%) | 79 (10.0%) |
| 15 to 17 Year Olds | 410 (92.8%) | 32 (7.2%) |
| 18 to 19 Year Olds | 41 (100.0%) | 0 (0.0%) |
| 20 to 24 Year Olds | 141 (86.0%) | 23 (14.0%) |
| 25 to 34 Year Olds | 104 (100.0%) | 0 (0.0%) |
| 35 Years and over | 131 (51.6%) | 123 (48.4%) |
| Total | 2,259 (84.4%) | 417 (15.6%) |
Educational Attainment by Field of Study in Vernal
Education (217 | 23.5%), bio, nature & agricultural (133 | 14.4%), science & technology (118 | 12.8%), computers & mathematics (70 | 7.6%), and communications (68 | 7.4%) are the most common fields of study among 924 individuals in Vernal who have obtained a bachelor's degree or higher.
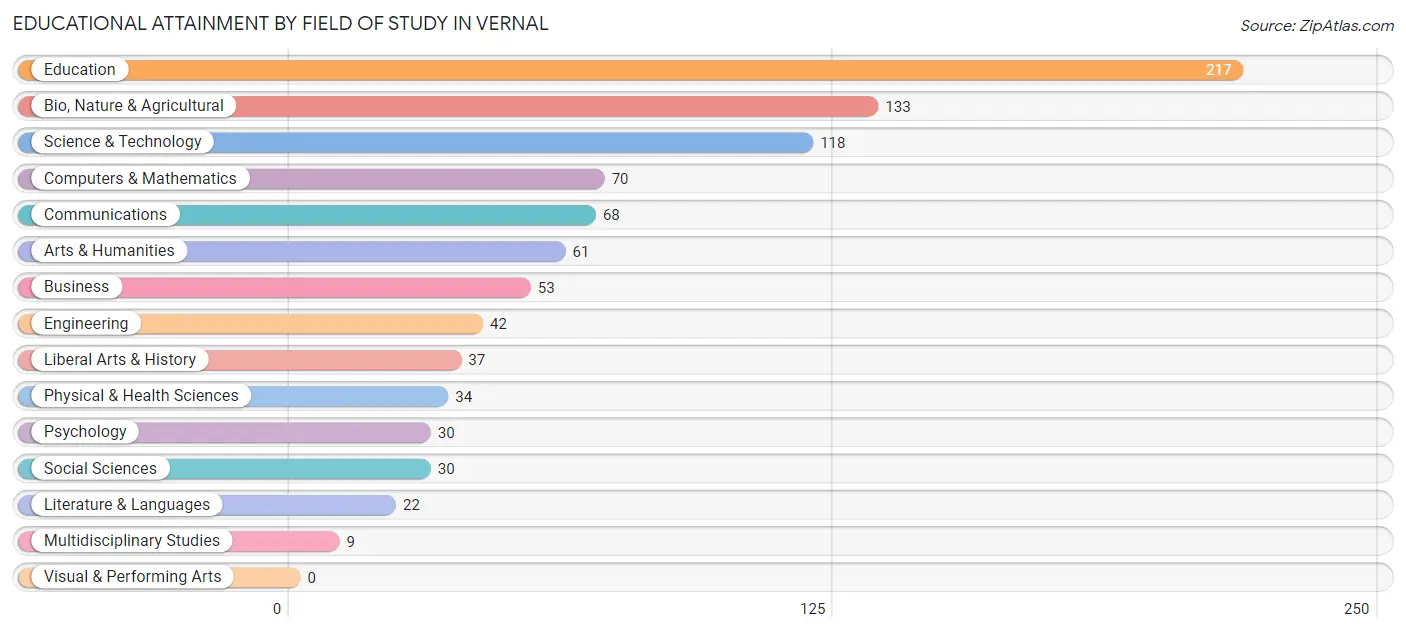
| Field of Study | # Graduates | % Graduates |
| Computers & Mathematics | 70 | 7.6% |
| Bio, Nature & Agricultural | 133 | 14.4% |
| Physical & Health Sciences | 34 | 3.7% |
| Psychology | 30 | 3.3% |
| Social Sciences | 30 | 3.3% |
| Engineering | 42 | 4.5% |
| Multidisciplinary Studies | 9 | 1.0% |
| Science & Technology | 118 | 12.8% |
| Business | 53 | 5.7% |
| Education | 217 | 23.5% |
| Literature & Languages | 22 | 2.4% |
| Liberal Arts & History | 37 | 4.0% |
| Visual & Performing Arts | 0 | 0.0% |
| Communications | 68 | 7.4% |
| Arts & Humanities | 61 | 6.6% |
| Total | 924 | 100.0% |
Transportation & Commute in Vernal
Vehicle Availability by Sex in Vernal
The most prevalent vehicle ownership categories in Vernal are males with 2 vehicles (836, accounting for 35.1%) and females with 2 vehicles (516, making up 42.5%).
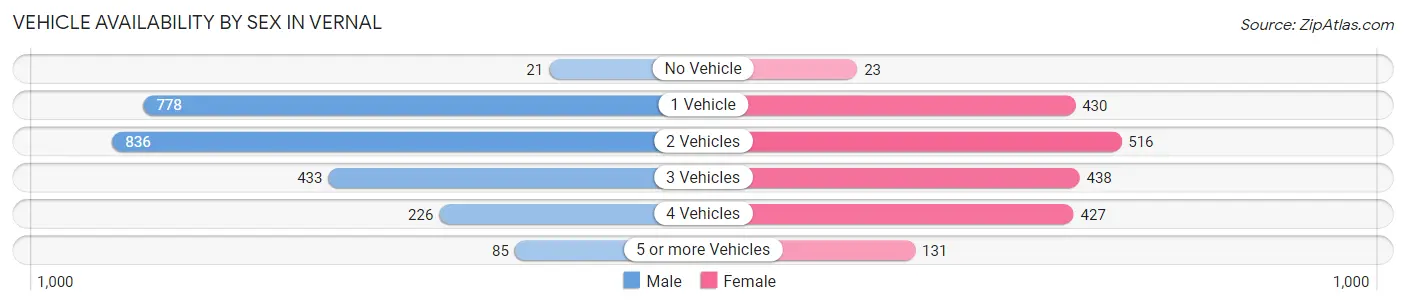
| Vehicles Available | Male | Female |
| No Vehicle | 21 (0.9%) | 23 (1.2%) |
| 1 Vehicle | 778 (32.7%) | 430 (21.9%) |
| 2 Vehicles | 836 (35.1%) | 516 (26.3%) |
| 3 Vehicles | 433 (18.2%) | 438 (22.3%) |
| 4 Vehicles | 226 (9.5%) | 427 (21.7%) |
| 5 or more Vehicles | 85 (3.6%) | 131 (6.7%) |
| Total | 2,379 (100.0%) | 1,965 (100.0%) |
Commute Time in Vernal
The most frequently occuring commute durations in Vernal are 5 to 9 minutes (1,951 commuters, 46.5%), 10 to 14 minutes (753 commuters, 17.9%), and less than 5 minutes (338 commuters, 8.1%).
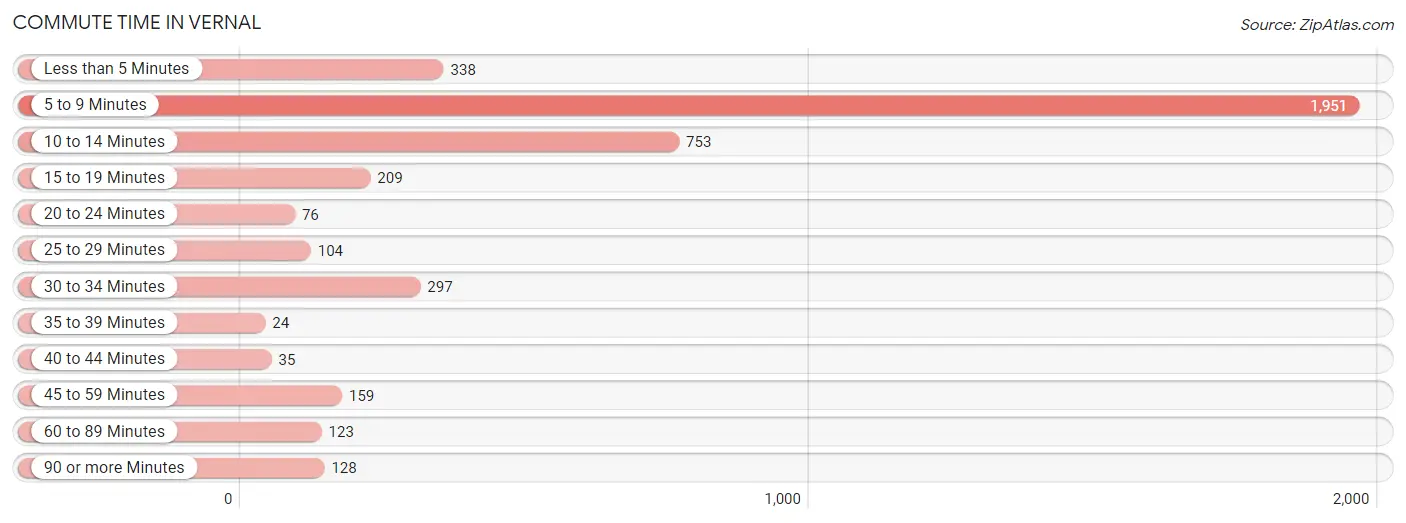
| Commute Time | # Commuters | % Commuters |
| Less than 5 Minutes | 338 | 8.1% |
| 5 to 9 Minutes | 1,951 | 46.5% |
| 10 to 14 Minutes | 753 | 17.9% |
| 15 to 19 Minutes | 209 | 5.0% |
| 20 to 24 Minutes | 76 | 1.8% |
| 25 to 29 Minutes | 104 | 2.5% |
| 30 to 34 Minutes | 297 | 7.1% |
| 35 to 39 Minutes | 24 | 0.6% |
| 40 to 44 Minutes | 35 | 0.8% |
| 45 to 59 Minutes | 159 | 3.8% |
| 60 to 89 Minutes | 123 | 2.9% |
| 90 or more Minutes | 128 | 3.0% |
Commute Time by Sex in Vernal
The most common commute times in Vernal are 5 to 9 minutes (959 commuters, 42.0%) for males and 5 to 9 minutes (992 commuters, 51.9%) for females.
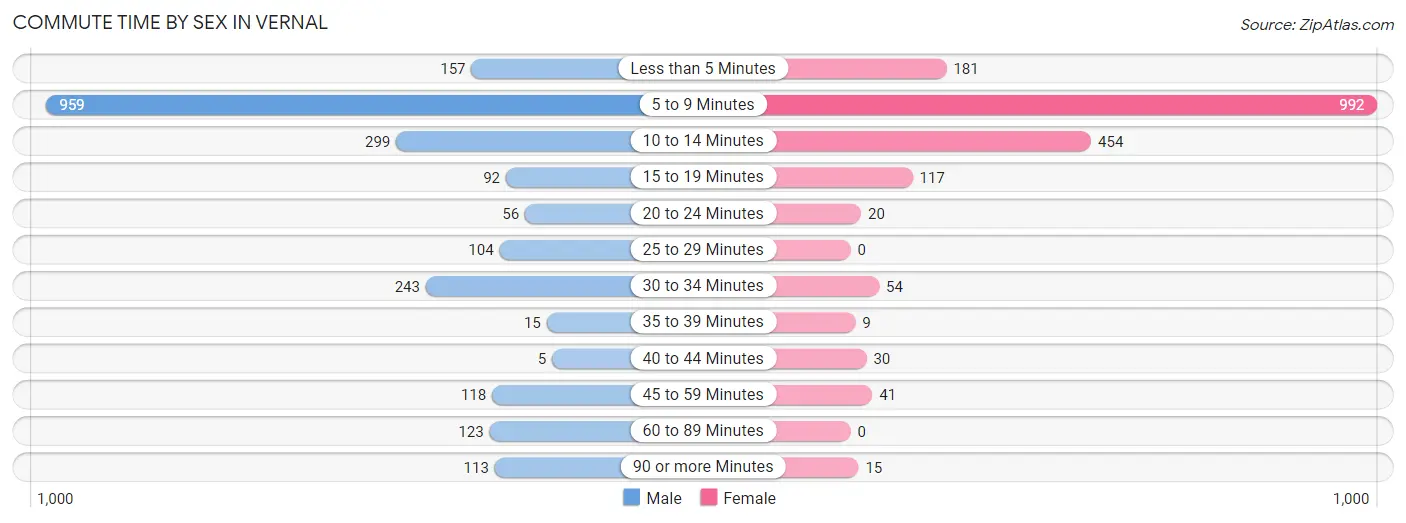
| Commute Time | Male | Female |
| Less than 5 Minutes | 157 (6.9%) | 181 (9.5%) |
| 5 to 9 Minutes | 959 (42.0%) | 992 (51.9%) |
| 10 to 14 Minutes | 299 (13.1%) | 454 (23.7%) |
| 15 to 19 Minutes | 92 (4.0%) | 117 (6.1%) |
| 20 to 24 Minutes | 56 (2.5%) | 20 (1.1%) |
| 25 to 29 Minutes | 104 (4.5%) | 0 (0.0%) |
| 30 to 34 Minutes | 243 (10.6%) | 54 (2.8%) |
| 35 to 39 Minutes | 15 (0.7%) | 9 (0.5%) |
| 40 to 44 Minutes | 5 (0.2%) | 30 (1.6%) |
| 45 to 59 Minutes | 118 (5.2%) | 41 (2.1%) |
| 60 to 89 Minutes | 123 (5.4%) | 0 (0.0%) |
| 90 or more Minutes | 113 (5.0%) | 15 (0.8%) |
Time of Departure to Work by Sex in Vernal
The most frequent times of departure to work in Vernal are 7:30 AM to 7:59 AM (451, 19.8%) for males and 7:00 AM to 7:29 AM (444, 23.2%) for females.
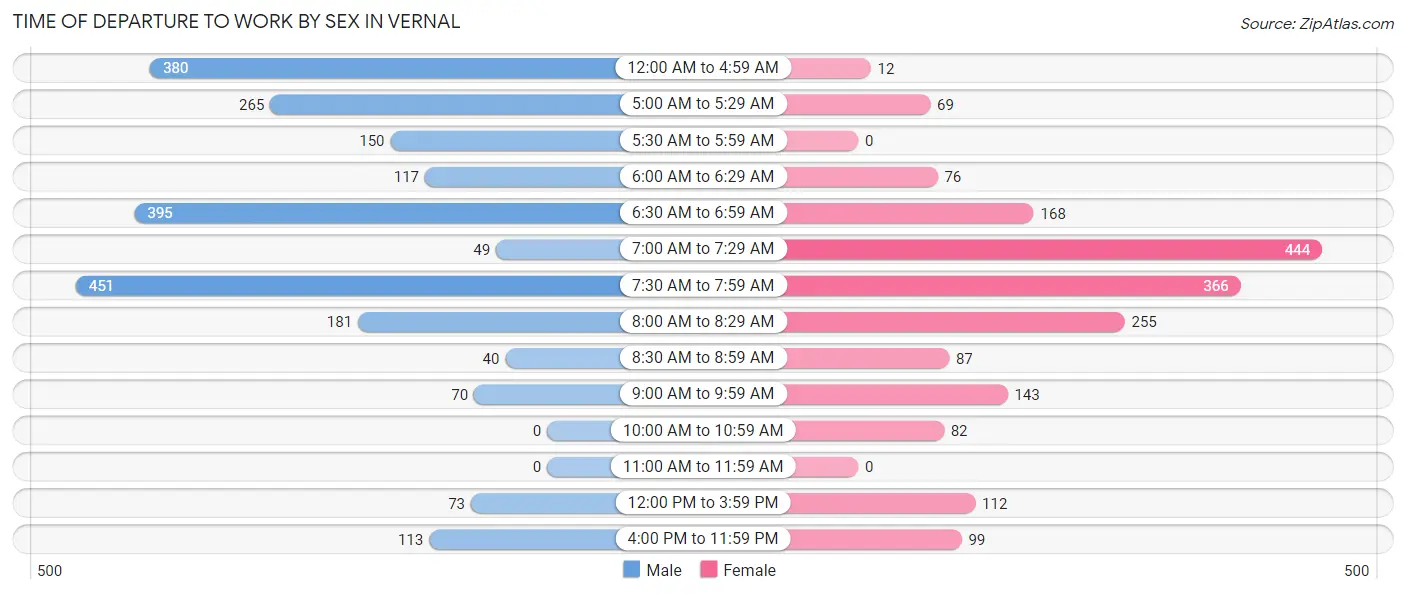
| Time of Departure | Male | Female |
| 12:00 AM to 4:59 AM | 380 (16.6%) | 12 (0.6%) |
| 5:00 AM to 5:29 AM | 265 (11.6%) | 69 (3.6%) |
| 5:30 AM to 5:59 AM | 150 (6.6%) | 0 (0.0%) |
| 6:00 AM to 6:29 AM | 117 (5.1%) | 76 (4.0%) |
| 6:30 AM to 6:59 AM | 395 (17.3%) | 168 (8.8%) |
| 7:00 AM to 7:29 AM | 49 (2.1%) | 444 (23.2%) |
| 7:30 AM to 7:59 AM | 451 (19.8%) | 366 (19.1%) |
| 8:00 AM to 8:29 AM | 181 (7.9%) | 255 (13.3%) |
| 8:30 AM to 8:59 AM | 40 (1.8%) | 87 (4.5%) |
| 9:00 AM to 9:59 AM | 70 (3.1%) | 143 (7.5%) |
| 10:00 AM to 10:59 AM | 0 (0.0%) | 82 (4.3%) |
| 11:00 AM to 11:59 AM | 0 (0.0%) | 0 (0.0%) |
| 12:00 PM to 3:59 PM | 73 (3.2%) | 112 (5.9%) |
| 4:00 PM to 11:59 PM | 113 (5.0%) | 99 (5.2%) |
| Total | 2,284 (100.0%) | 1,913 (100.0%) |
Housing Occupancy in Vernal
Occupancy by Ownership in Vernal
Of the total 3,327 dwellings in Vernal, owner-occupied units account for 1,707 (51.3%), while renter-occupied units make up 1,620 (48.7%).
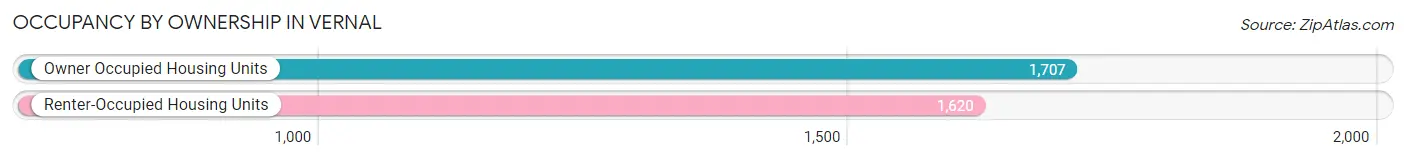
| Occupancy | # Housing Units | % Housing Units |
| Owner Occupied Housing Units | 1,707 | 51.3% |
| Renter-Occupied Housing Units | 1,620 | 48.7% |
| Total Occupied Housing Units | 3,327 | 100.0% |
Occupancy by Household Size in Vernal
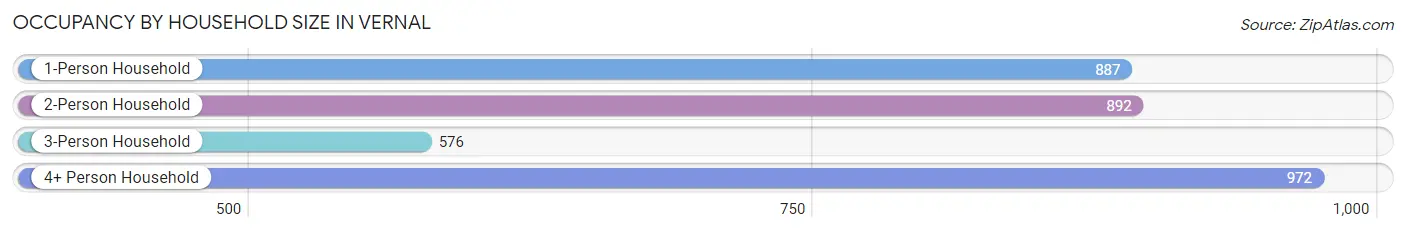
| Household Size | # Housing Units | % Housing Units |
| 1-Person Household | 887 | 26.7% |
| 2-Person Household | 892 | 26.8% |
| 3-Person Household | 576 | 17.3% |
| 4+ Person Household | 972 | 29.2% |
| Total Housing Units | 3,327 | 100.0% |
Occupancy by Ownership by Household Size in Vernal
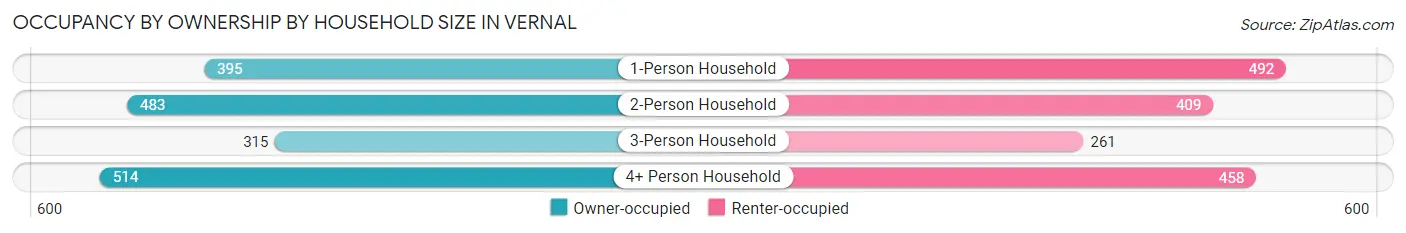
| Household Size | Owner-occupied | Renter-occupied |
| 1-Person Household | 395 (44.5%) | 492 (55.5%) |
| 2-Person Household | 483 (54.1%) | 409 (45.9%) |
| 3-Person Household | 315 (54.7%) | 261 (45.3%) |
| 4+ Person Household | 514 (52.9%) | 458 (47.1%) |
| Total Housing Units | 1,707 (51.3%) | 1,620 (48.7%) |
Occupancy by Educational Attainment in Vernal
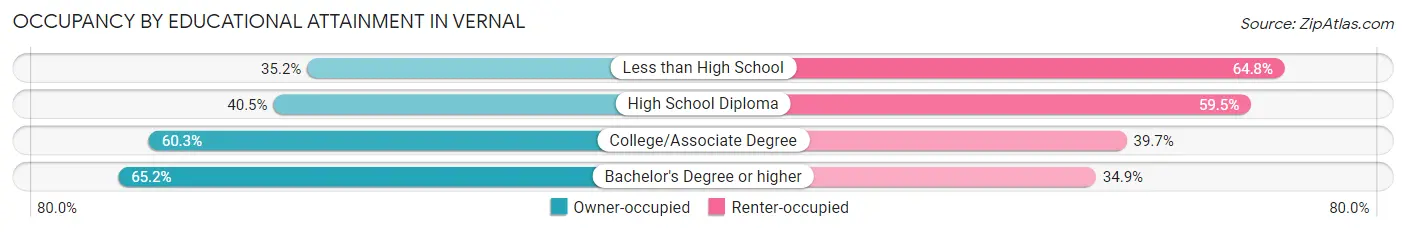
| Household Size | Owner-occupied | Renter-occupied |
| Less than High School | 159 (35.2%) | 293 (64.8%) |
| High School Diploma | 435 (40.5%) | 638 (59.5%) |
| College/Associate Degree | 756 (60.3%) | 498 (39.7%) |
| Bachelor's Degree or higher | 357 (65.1%) | 191 (34.8%) |
Occupancy by Age of Householder in Vernal
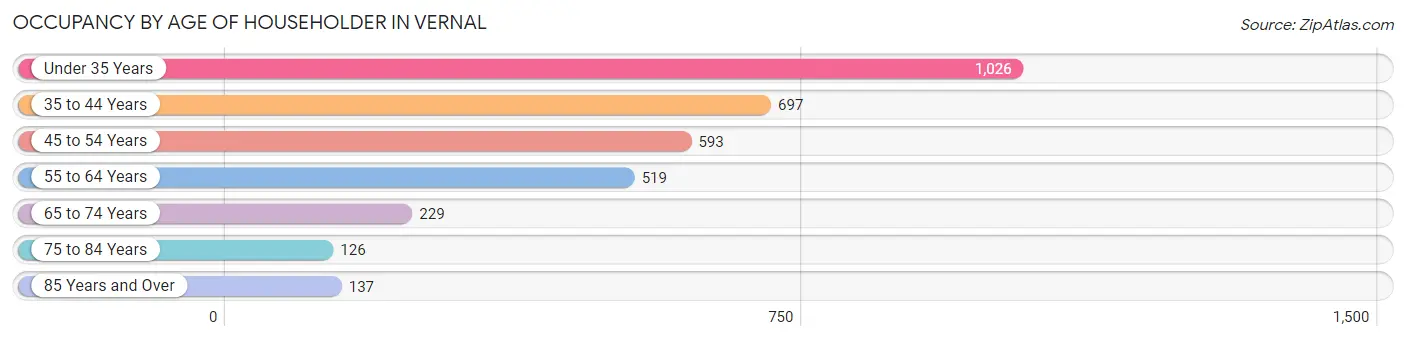
| Age Bracket | # Households | % Households |
| Under 35 Years | 1,026 | 30.8% |
| 35 to 44 Years | 697 | 20.9% |
| 45 to 54 Years | 593 | 17.8% |
| 55 to 64 Years | 519 | 15.6% |
| 65 to 74 Years | 229 | 6.9% |
| 75 to 84 Years | 126 | 3.8% |
| 85 Years and Over | 137 | 4.1% |
| Total | 3,327 | 100.0% |
Housing Finances in Vernal
Median Income by Occupancy in Vernal
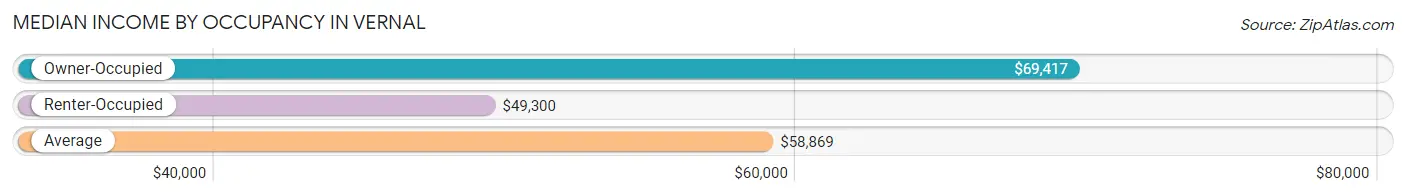
| Occupancy Type | # Households | Median Income |
| Owner-Occupied | 1,707 (51.3%) | $69,417 |
| Renter-Occupied | 1,620 (48.7%) | $49,300 |
| Average | 3,327 (100.0%) | $58,869 |
Occupancy by Householder Income Bracket in Vernal
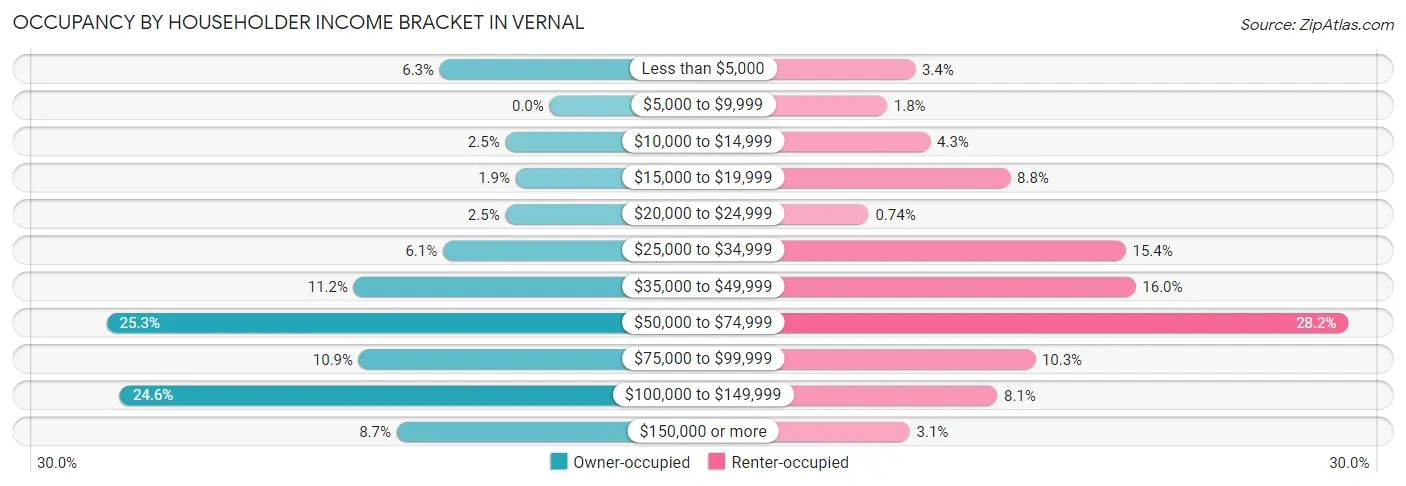
| Income Bracket | Owner-occupied | Renter-occupied |
| Less than $5,000 | 107 (6.3%) | 55 (3.4%) |
| $5,000 to $9,999 | 0 (0.0%) | 29 (1.8%) |
| $10,000 to $14,999 | 43 (2.5%) | 69 (4.3%) |
| $15,000 to $19,999 | 33 (1.9%) | 143 (8.8%) |
| $20,000 to $24,999 | 43 (2.5%) | 12 (0.7%) |
| $25,000 to $34,999 | 104 (6.1%) | 250 (15.4%) |
| $35,000 to $49,999 | 191 (11.2%) | 259 (16.0%) |
| $50,000 to $74,999 | 432 (25.3%) | 456 (28.1%) |
| $75,000 to $99,999 | 186 (10.9%) | 166 (10.2%) |
| $100,000 to $149,999 | 419 (24.5%) | 131 (8.1%) |
| $150,000 or more | 149 (8.7%) | 50 (3.1%) |
| Total | 1,707 (100.0%) | 1,620 (100.0%) |
Monthly Housing Cost Tiers in Vernal
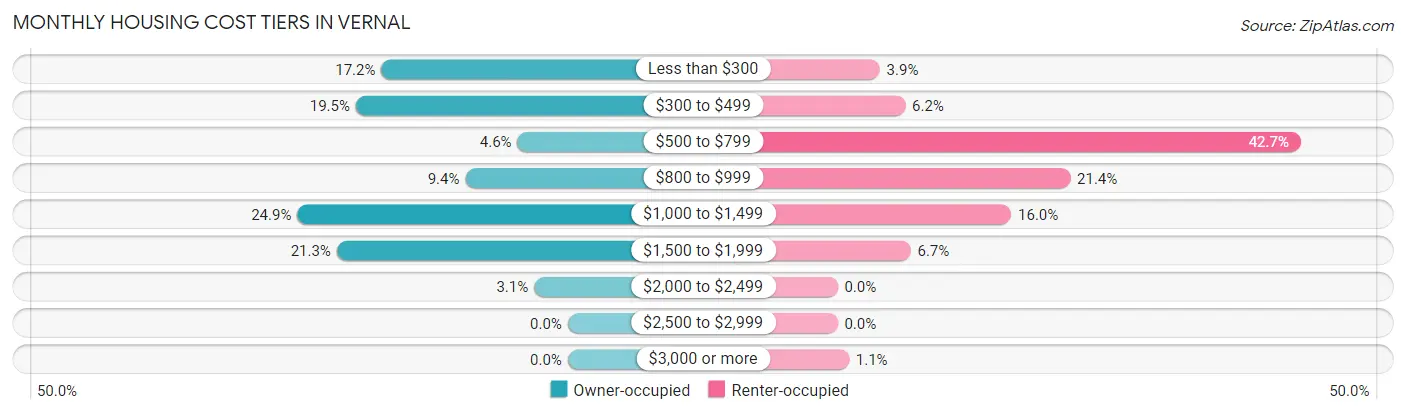
| Monthly Cost | Owner-occupied | Renter-occupied |
| Less than $300 | 293 (17.2%) | 63 (3.9%) |
| $300 to $499 | 333 (19.5%) | 101 (6.2%) |
| $500 to $799 | 79 (4.6%) | 691 (42.6%) |
| $800 to $999 | 161 (9.4%) | 347 (21.4%) |
| $1,000 to $1,499 | 425 (24.9%) | 259 (16.0%) |
| $1,500 to $1,999 | 363 (21.3%) | 109 (6.7%) |
| $2,000 to $2,499 | 53 (3.1%) | 0 (0.0%) |
| $2,500 to $2,999 | 0 (0.0%) | 0 (0.0%) |
| $3,000 or more | 0 (0.0%) | 17 (1.1%) |
| Total | 1,707 (100.0%) | 1,620 (100.0%) |
Physical Housing Characteristics in Vernal
Housing Structures in Vernal
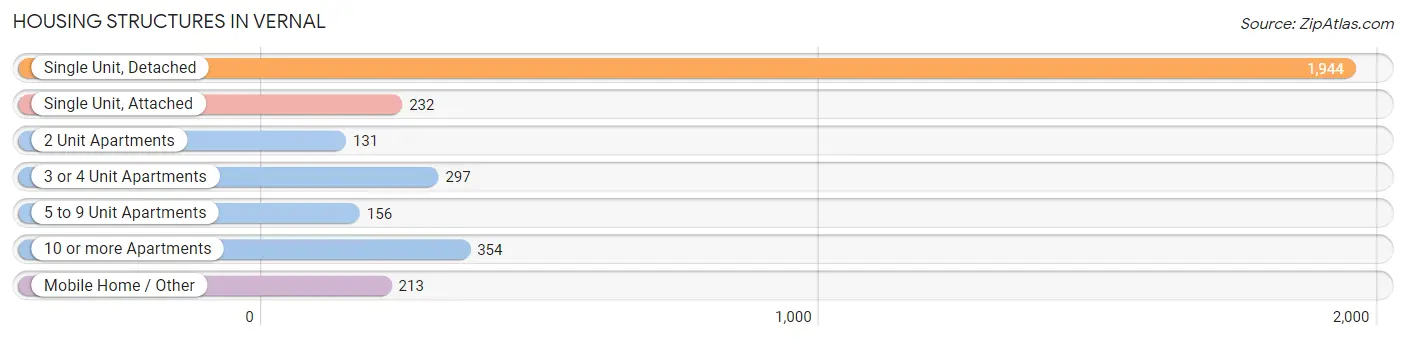
| Structure Type | # Housing Units | % Housing Units |
| Single Unit, Detached | 1,944 | 58.4% |
| Single Unit, Attached | 232 | 7.0% |
| 2 Unit Apartments | 131 | 3.9% |
| 3 or 4 Unit Apartments | 297 | 8.9% |
| 5 to 9 Unit Apartments | 156 | 4.7% |
| 10 or more Apartments | 354 | 10.6% |
| Mobile Home / Other | 213 | 6.4% |
| Total | 3,327 | 100.0% |
Housing Structures by Occupancy in Vernal
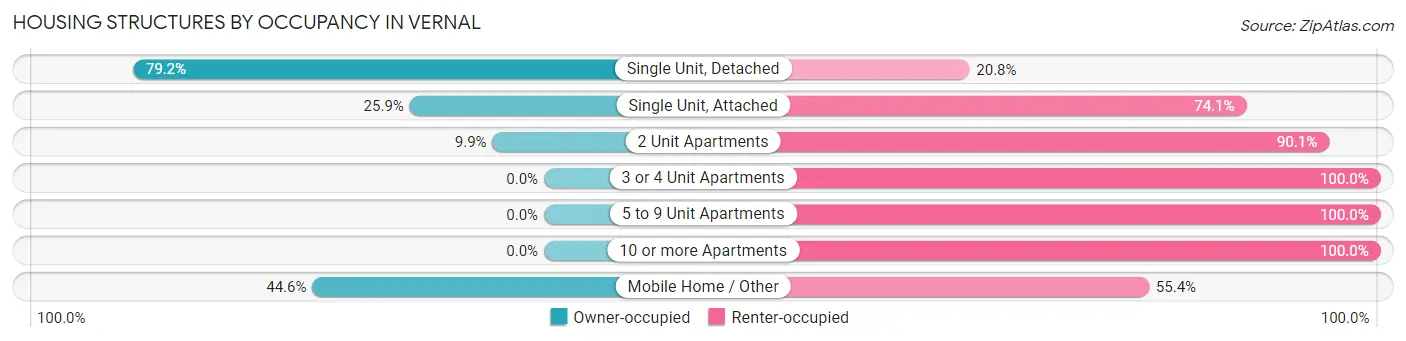
| Structure Type | Owner-occupied | Renter-occupied |
| Single Unit, Detached | 1,539 (79.2%) | 405 (20.8%) |
| Single Unit, Attached | 60 (25.9%) | 172 (74.1%) |
| 2 Unit Apartments | 13 (9.9%) | 118 (90.1%) |
| 3 or 4 Unit Apartments | 0 (0.0%) | 297 (100.0%) |
| 5 to 9 Unit Apartments | 0 (0.0%) | 156 (100.0%) |
| 10 or more Apartments | 0 (0.0%) | 354 (100.0%) |
| Mobile Home / Other | 95 (44.6%) | 118 (55.4%) |
| Total | 1,707 (51.3%) | 1,620 (48.7%) |
Housing Structures by Number of Rooms in Vernal
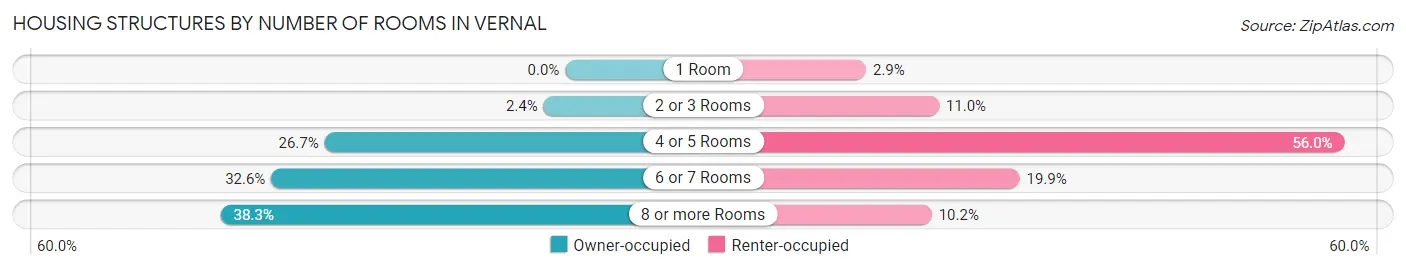
| Number of Rooms | Owner-occupied | Renter-occupied |
| 1 Room | 0 (0.0%) | 47 (2.9%) |
| 2 or 3 Rooms | 41 (2.4%) | 178 (11.0%) |
| 4 or 5 Rooms | 456 (26.7%) | 907 (56.0%) |
| 6 or 7 Rooms | 557 (32.6%) | 323 (19.9%) |
| 8 or more Rooms | 653 (38.3%) | 165 (10.2%) |
| Total | 1,707 (100.0%) | 1,620 (100.0%) |
Housing Structure by Heating Type in Vernal
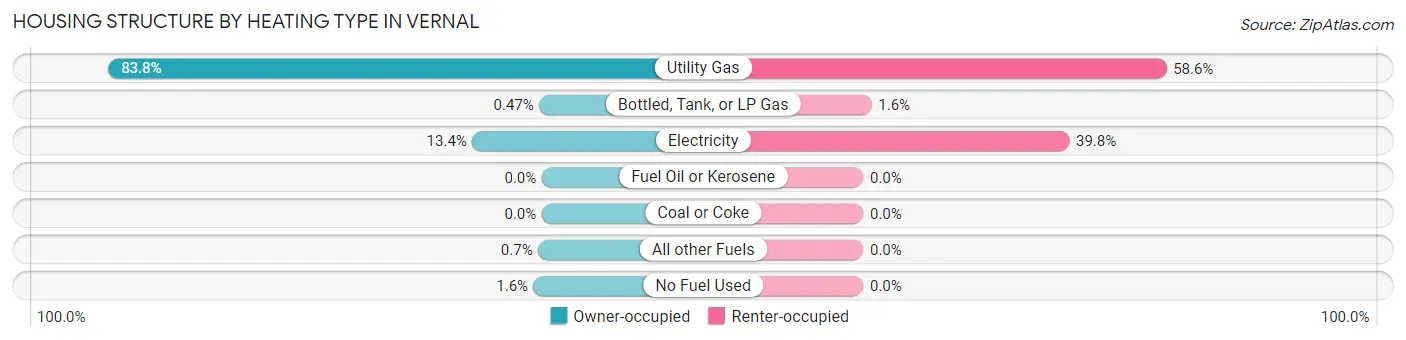
| Heating Type | Owner-occupied | Renter-occupied |
| Utility Gas | 1,431 (83.8%) | 949 (58.6%) |
| Bottled, Tank, or LP Gas | 8 (0.5%) | 26 (1.6%) |
| Electricity | 229 (13.4%) | 645 (39.8%) |
| Fuel Oil or Kerosene | 0 (0.0%) | 0 (0.0%) |
| Coal or Coke | 0 (0.0%) | 0 (0.0%) |
| All other Fuels | 12 (0.7%) | 0 (0.0%) |
| No Fuel Used | 27 (1.6%) | 0 (0.0%) |
| Total | 1,707 (100.0%) | 1,620 (100.0%) |
Household Vehicle Usage in Vernal
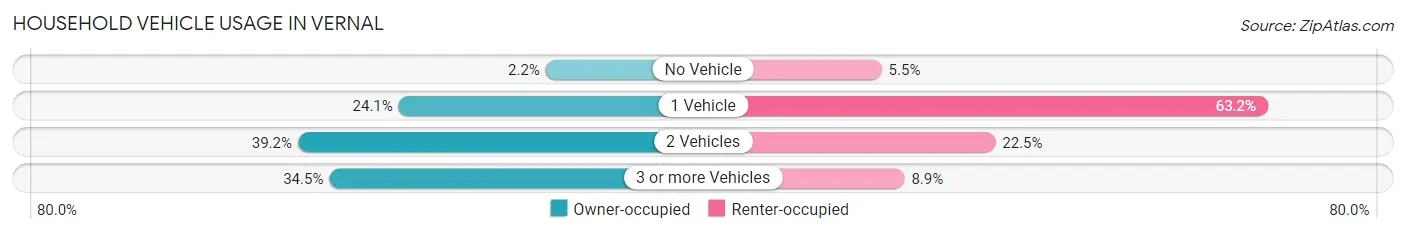
| Vehicles per Household | Owner-occupied | Renter-occupied |
| No Vehicle | 37 (2.2%) | 89 (5.5%) |
| 1 Vehicle | 412 (24.1%) | 1,023 (63.1%) |
| 2 Vehicles | 669 (39.2%) | 364 (22.5%) |
| 3 or more Vehicles | 589 (34.5%) | 144 (8.9%) |
| Total | 1,707 (100.0%) | 1,620 (100.0%) |
Real Estate & Mortgages in Vernal
Real Estate and Mortgage Overview in Vernal
| Characteristic | Without Mortgage | With Mortgage |
| Housing Units | 670 | 1,037 |
| Median Property Value | $234,300 | $208,300 |
| Median Household Income | $58,529 | $113 |
| Monthly Housing Costs | $360 | $0 |
| Real Estate Taxes | $1,284 | $21 |
Property Value by Mortgage Status in Vernal
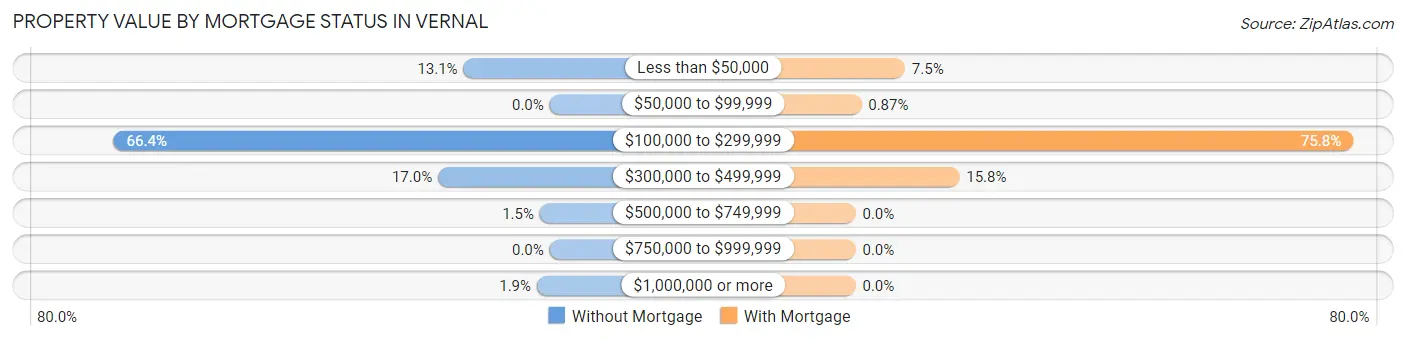
| Property Value | Without Mortgage | With Mortgage |
| Less than $50,000 | 88 (13.1%) | 78 (7.5%) |
| $50,000 to $99,999 | 0 (0.0%) | 9 (0.9%) |
| $100,000 to $299,999 | 445 (66.4%) | 786 (75.8%) |
| $300,000 to $499,999 | 114 (17.0%) | 164 (15.8%) |
| $500,000 to $749,999 | 10 (1.5%) | 0 (0.0%) |
| $750,000 to $999,999 | 0 (0.0%) | 0 (0.0%) |
| $1,000,000 or more | 13 (1.9%) | 0 (0.0%) |
| Total | 670 (100.0%) | 1,037 (100.0%) |
Household Income by Mortgage Status in Vernal
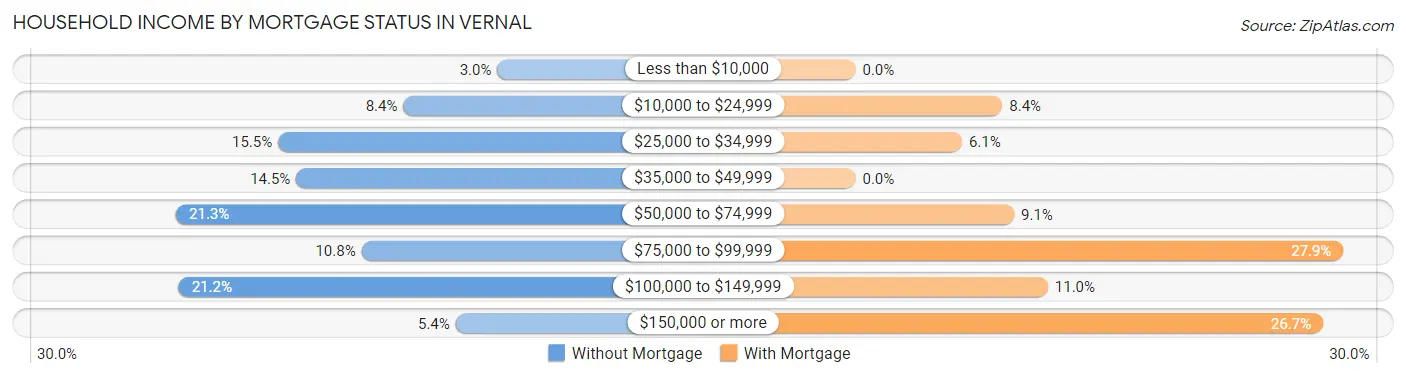
| Household Income | Without Mortgage | With Mortgage |
| Less than $10,000 | 20 (3.0%) | 0 (0.0%) |
| $10,000 to $24,999 | 56 (8.4%) | 87 (8.4%) |
| $25,000 to $34,999 | 104 (15.5%) | 63 (6.1%) |
| $35,000 to $49,999 | 97 (14.5%) | 0 (0.0%) |
| $50,000 to $74,999 | 143 (21.3%) | 94 (9.1%) |
| $75,000 to $99,999 | 72 (10.7%) | 289 (27.9%) |
| $100,000 to $149,999 | 142 (21.2%) | 114 (11.0%) |
| $150,000 or more | 36 (5.4%) | 277 (26.7%) |
| Total | 670 (100.0%) | 1,037 (100.0%) |
Property Value to Household Income Ratio in Vernal
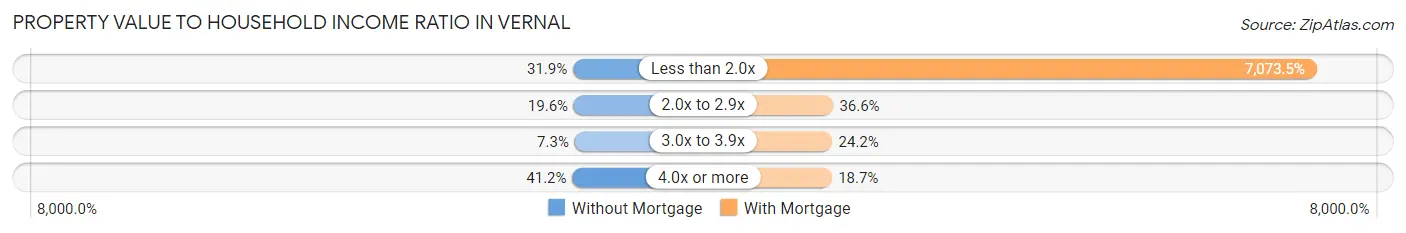
| Value-to-Income Ratio | Without Mortgage | With Mortgage |
| Less than 2.0x | 214 (31.9%) | 73,352 (7,073.5%) |
| 2.0x to 2.9x | 131 (19.6%) | 379 (36.5%) |
| 3.0x to 3.9x | 49 (7.3%) | 251 (24.2%) |
| 4.0x or more | 276 (41.2%) | 194 (18.7%) |
| Total | 670 (100.0%) | 1,037 (100.0%) |
Real Estate Taxes by Mortgage Status in Vernal
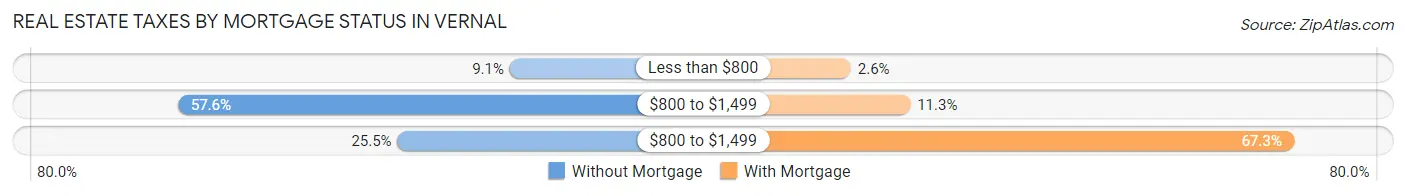
| Property Taxes | Without Mortgage | With Mortgage |
| Less than $800 | 61 (9.1%) | 27 (2.6%) |
| $800 to $1,499 | 386 (57.6%) | 117 (11.3%) |
| $800 to $1,499 | 171 (25.5%) | 698 (67.3%) |
| Total | 670 (100.0%) | 1,037 (100.0%) |
Health & Disability in Vernal
Health Insurance Coverage by Age in Vernal
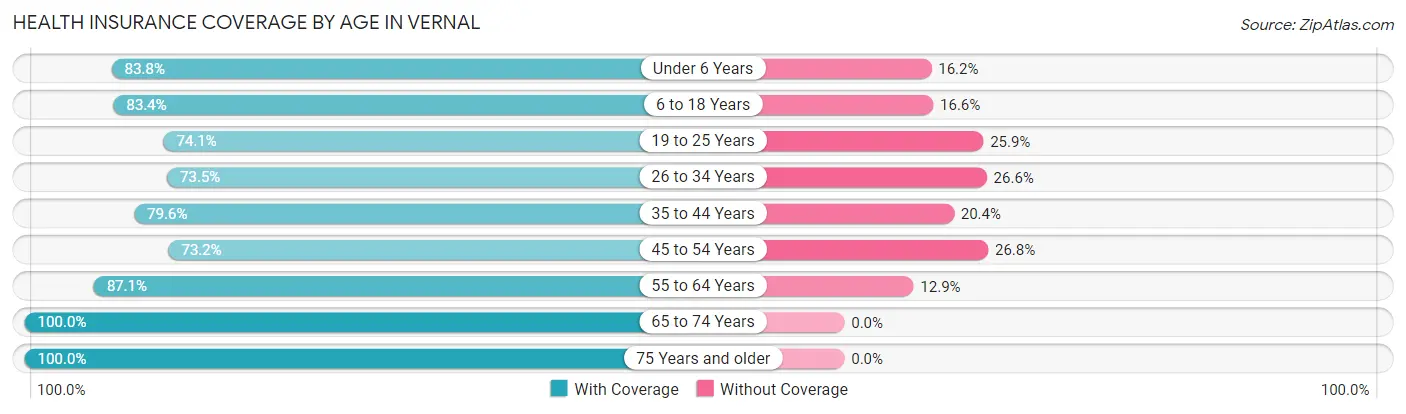
| Age Bracket | With Coverage | Without Coverage |
| Under 6 Years | 1,074 (83.8%) | 208 (16.2%) |
| 6 to 18 Years | 1,744 (83.4%) | 346 (16.6%) |
| 19 to 25 Years | 678 (74.1%) | 237 (25.9%) |
| 26 to 34 Years | 1,173 (73.5%) | 424 (26.6%) |
| 35 to 44 Years | 1,017 (79.6%) | 261 (20.4%) |
| 45 to 54 Years | 827 (73.2%) | 303 (26.8%) |
| 55 to 64 Years | 730 (87.1%) | 108 (12.9%) |
| 65 to 74 Years | 384 (100.0%) | 0 (0.0%) |
| 75 Years and older | 343 (100.0%) | 0 (0.0%) |
| Total | 7,970 (80.9%) | 1,887 (19.1%) |
Health Insurance Coverage by Citizenship Status in Vernal
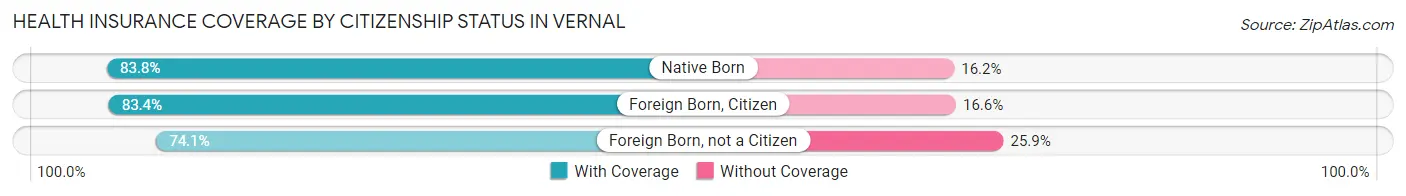
| Citizenship Status | With Coverage | Without Coverage |
| Native Born | 1,074 (83.8%) | 208 (16.2%) |
| Foreign Born, Citizen | 1,744 (83.4%) | 346 (16.6%) |
| Foreign Born, not a Citizen | 678 (74.1%) | 237 (25.9%) |
Health Insurance Coverage by Household Income in Vernal
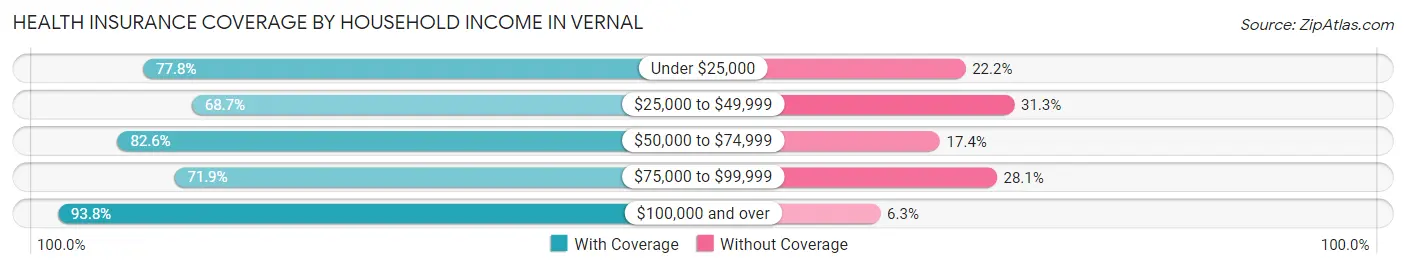
| Household Income | With Coverage | Without Coverage |
| Under $25,000 | 754 (77.8%) | 215 (22.2%) |
| $25,000 to $49,999 | 1,383 (68.7%) | 631 (31.3%) |
| $50,000 to $74,999 | 2,084 (82.6%) | 439 (17.4%) |
| $75,000 to $99,999 | 1,095 (71.9%) | 427 (28.1%) |
| $100,000 and over | 2,627 (93.8%) | 175 (6.2%) |
Public vs Private Health Insurance Coverage by Age in Vernal
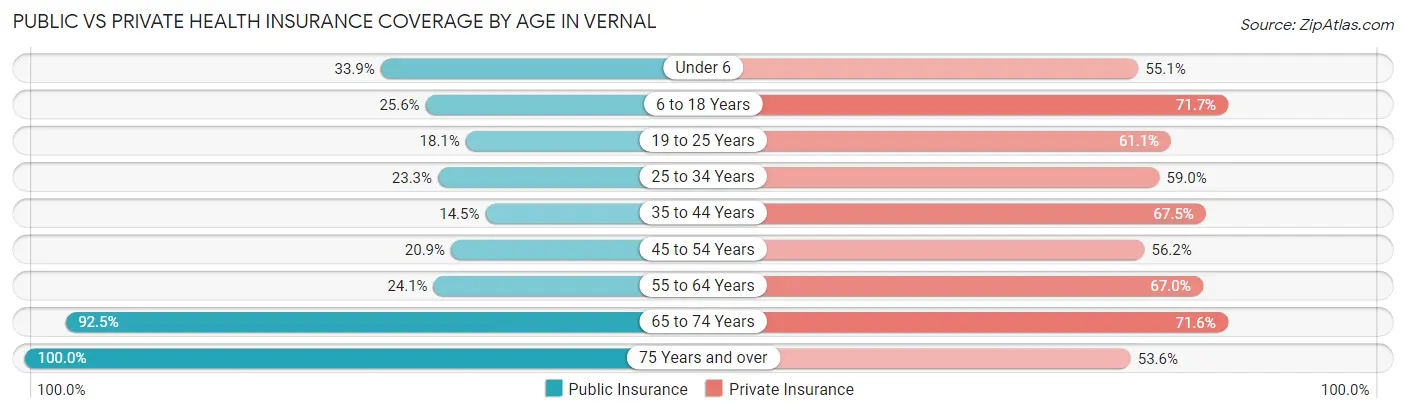
| Age Bracket | Public Insurance | Private Insurance |
| Under 6 | 435 (33.9%) | 706 (55.1%) |
| 6 to 18 Years | 535 (25.6%) | 1,498 (71.7%) |
| 19 to 25 Years | 166 (18.1%) | 559 (61.1%) |
| 25 to 34 Years | 372 (23.3%) | 942 (59.0%) |
| 35 to 44 Years | 185 (14.5%) | 863 (67.5%) |
| 45 to 54 Years | 236 (20.9%) | 635 (56.2%) |
| 55 to 64 Years | 202 (24.1%) | 561 (66.9%) |
| 65 to 74 Years | 355 (92.4%) | 275 (71.6%) |
| 75 Years and over | 343 (100.0%) | 184 (53.6%) |
| Total | 2,829 (28.7%) | 6,223 (63.1%) |
Disability Status by Sex by Age in Vernal
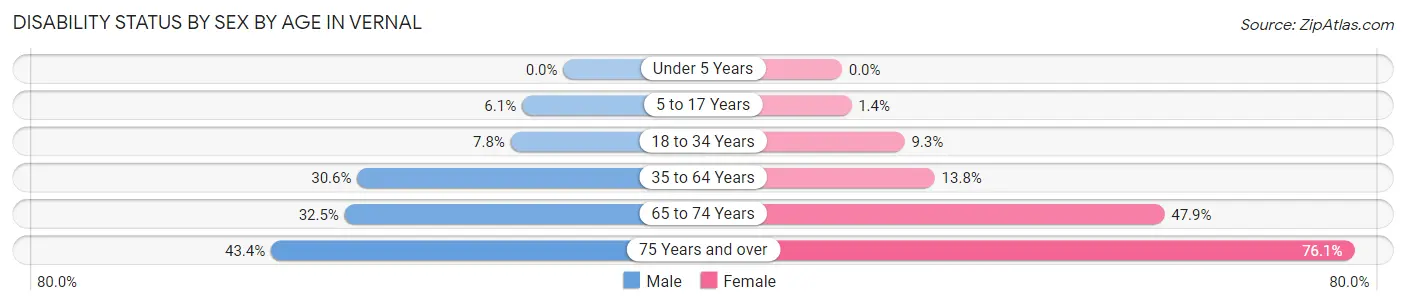
| Age Bracket | Male | Female |
| Under 5 Years | 0 (0.0%) | 0 (0.0%) |
| 5 to 17 Years | 62 (6.1%) | 15 (1.4%) |
| 18 to 34 Years | 104 (7.8%) | 129 (9.3%) |
| 35 to 64 Years | 534 (30.6%) | 207 (13.8%) |
| 65 to 74 Years | 63 (32.5%) | 91 (47.9%) |
| 75 Years and over | 69 (43.4%) | 140 (76.1%) |
Disability Class by Sex by Age in Vernal
Disability Class: Hearing Difficulty
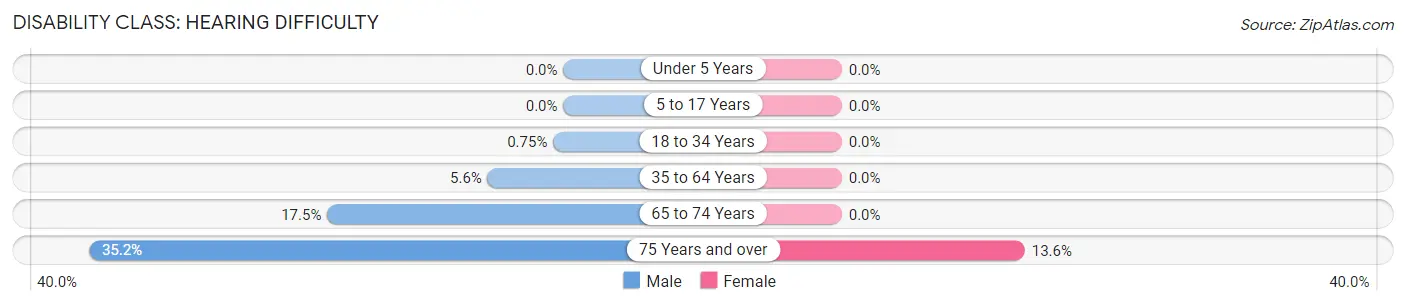
| Age Bracket | Male | Female |
| Under 5 Years | 0 (0.0%) | 0 (0.0%) |
| 5 to 17 Years | 0 (0.0%) | 0 (0.0%) |
| 18 to 34 Years | 10 (0.7%) | 0 (0.0%) |
| 35 to 64 Years | 98 (5.6%) | 0 (0.0%) |
| 65 to 74 Years | 34 (17.5%) | 0 (0.0%) |
| 75 Years and over | 56 (35.2%) | 25 (13.6%) |
Disability Class: Vision Difficulty
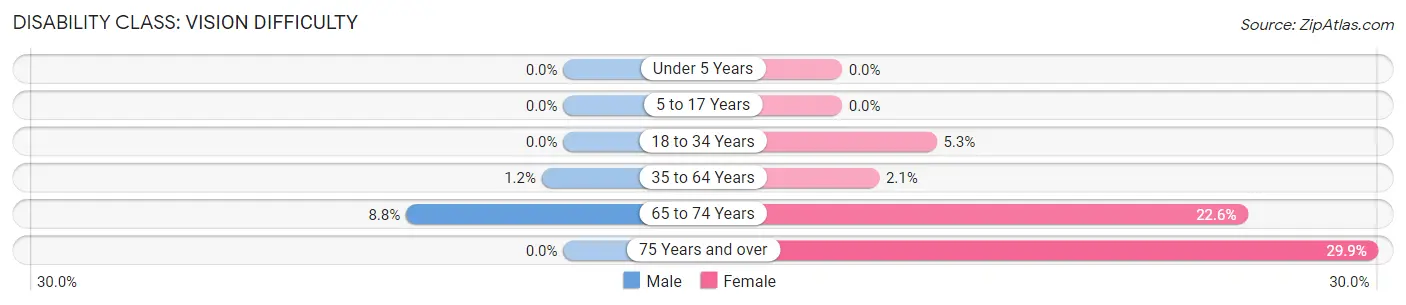
| Age Bracket | Male | Female |
| Under 5 Years | 0 (0.0%) | 0 (0.0%) |
| 5 to 17 Years | 0 (0.0%) | 0 (0.0%) |
| 18 to 34 Years | 0 (0.0%) | 73 (5.3%) |
| 35 to 64 Years | 21 (1.2%) | 31 (2.1%) |
| 65 to 74 Years | 17 (8.8%) | 43 (22.6%) |
| 75 Years and over | 0 (0.0%) | 55 (29.9%) |
Disability Class: Cognitive Difficulty
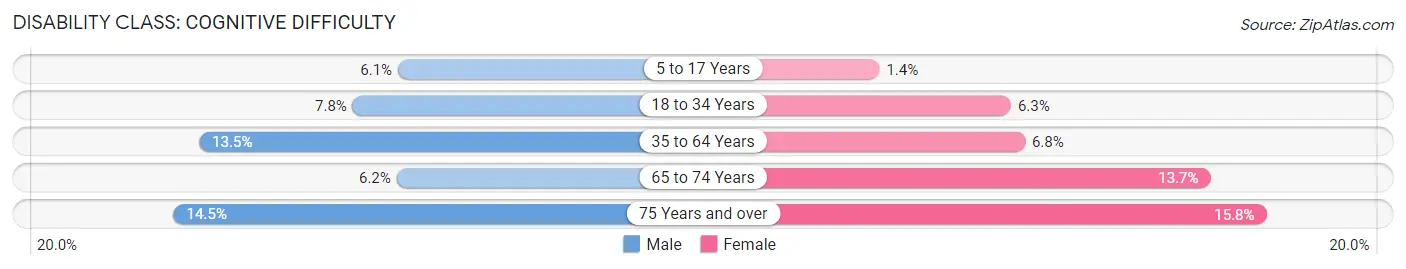
| Age Bracket | Male | Female |
| 5 to 17 Years | 62 (6.1%) | 15 (1.4%) |
| 18 to 34 Years | 104 (7.8%) | 87 (6.3%) |
| 35 to 64 Years | 236 (13.5%) | 102 (6.8%) |
| 65 to 74 Years | 12 (6.2%) | 26 (13.7%) |
| 75 Years and over | 23 (14.5%) | 29 (15.8%) |
Disability Class: Ambulatory Difficulty
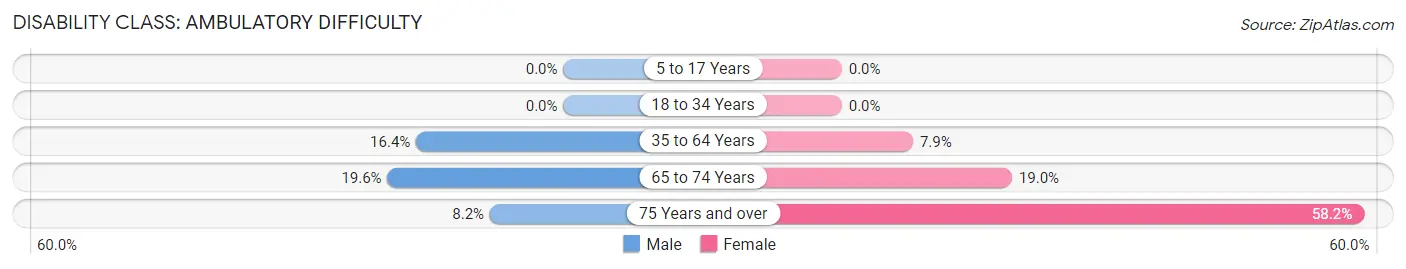
| Age Bracket | Male | Female |
| 5 to 17 Years | 0 (0.0%) | 0 (0.0%) |
| 18 to 34 Years | 0 (0.0%) | 0 (0.0%) |
| 35 to 64 Years | 286 (16.4%) | 119 (7.9%) |
| 65 to 74 Years | 38 (19.6%) | 36 (19.0%) |
| 75 Years and over | 13 (8.2%) | 107 (58.2%) |
Disability Class: Self-Care Difficulty
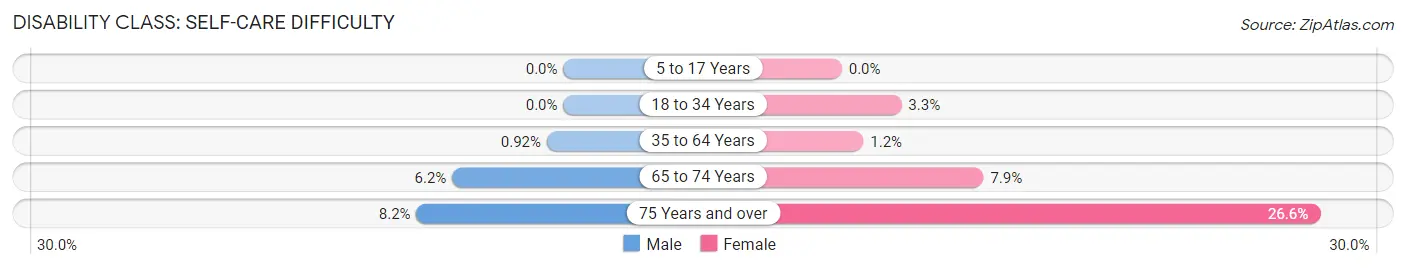
| Age Bracket | Male | Female |
| 5 to 17 Years | 0 (0.0%) | 0 (0.0%) |
| 18 to 34 Years | 0 (0.0%) | 46 (3.3%) |
| 35 to 64 Years | 16 (0.9%) | 18 (1.2%) |
| 65 to 74 Years | 12 (6.2%) | 15 (7.9%) |
| 75 Years and over | 13 (8.2%) | 49 (26.6%) |
Technology Access in Vernal
Computing Device Access in Vernal
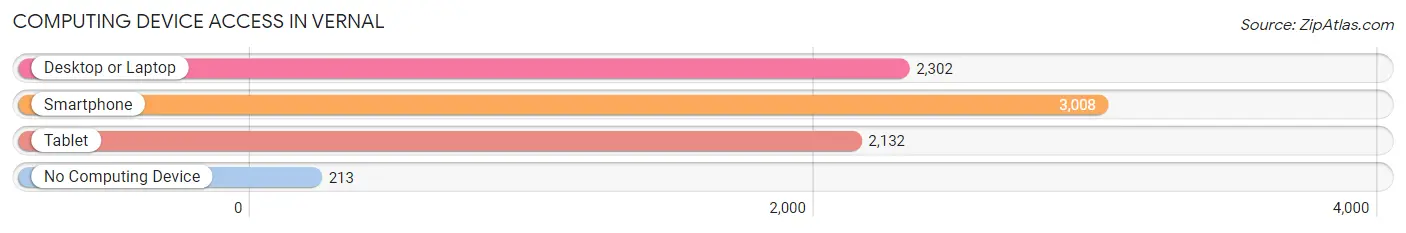
| Device Type | # Households | % Households |
| Desktop or Laptop | 2,302 | 69.2% |
| Smartphone | 3,008 | 90.4% |
| Tablet | 2,132 | 64.1% |
| No Computing Device | 213 | 6.4% |
| Total | 3,327 | 100.0% |
Internet Access in Vernal
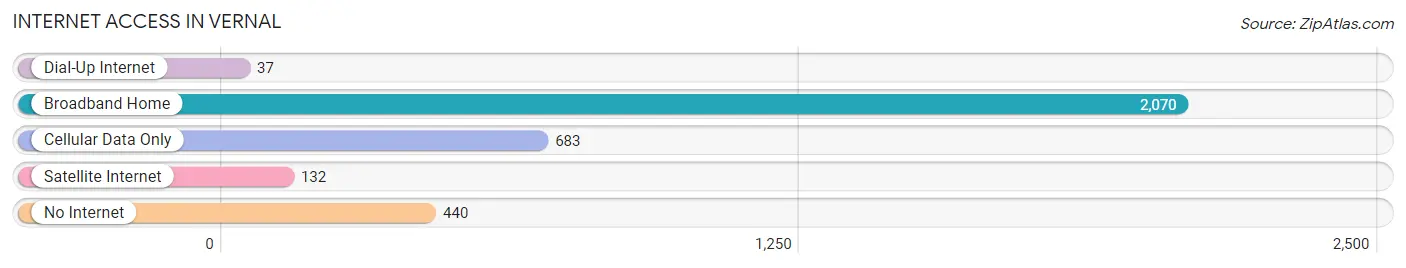
| Internet Type | # Households | % Households |
| Dial-Up Internet | 37 | 1.1% |
| Broadband Home | 2,070 | 62.2% |
| Cellular Data Only | 683 | 20.5% |
| Satellite Internet | 132 | 4.0% |
| No Internet | 440 | 13.2% |
| Total | 3,327 | 100.0% |
Vernal Summary
Vernal, Utah is a small city located in the northeastern corner of the state, in Uintah County. It is situated in the Uinta Basin, a large, flat area of land surrounded by mountains. The city is known for its rich history, diverse geography, and vibrant economy.
History
Vernal was first settled in the late 1800s by Mormon pioneers. The city was named after the nearby Vernal Creek, which was named after the Latin word for “spring” due to the abundance of water in the area. The city was incorporated in 1909 and has since grown to become the largest city in Uintah County.
Vernal has a rich history of oil and gas production. The first oil well was drilled in the area in 1892, and the city quickly became a major center for oil and gas production. The city was also home to the first commercial oil refinery in the state of Utah.
Geography
Vernal is located in the Uinta Basin, a large, flat area of land surrounded by mountains. The city is situated at an elevation of 5,000 feet and is surrounded by the Uinta Mountains to the east and the Book Cliffs to the west. The city is located near the Green River, which is a major tributary of the Colorado River.
The climate in Vernal is semi-arid, with hot summers and cold winters. The average annual temperature is around 50 degrees Fahrenheit, and the average annual precipitation is around 10 inches.
Economy
Vernal’s economy is largely based on oil and gas production, agriculture, and tourism. The city is home to several oil and gas companies, including Chevron, ConocoPhillips, and Anadarko Petroleum. The city is also home to several agricultural businesses, including dairy farms, cattle ranches, and hay farms.
Tourism is also an important part of the local economy. The city is home to several attractions, including Dinosaur National Monument, the Uintah County Museum, and the Utah Field House of Natural History.
Demographics
As of the 2010 census, the population of Vernal was 9,089. The racial makeup of the city was 91.3% White, 0.7% African American, 1.2% Native American, 0.7% Asian, 0.1% Pacific Islander, 4.2% from other races, and 2.0% from two or more races. Hispanic or Latino of any race were 8.3% of the population.
Vernal is a small city with a diverse population. The city is home to a variety of cultures and religions, including Mormons, Catholics, and members of the Church of Jesus Christ of Latter-day Saints. The city is also home to a large Native American population, with the Ute Tribe of the Uintah and Ouray Reservation located nearby.
Common Questions
What is Per Capita Income in Vernal?
Per Capita income in Vernal is $24,627.
What is the Median Family Income in Vernal?
Median Family Income in Vernal is $66,615.
What is the Median Household income in Vernal?
Median Household Income in Vernal is $58,869.
What is Income or Wage Gap in Vernal?
Income or Wage Gap in Vernal is 65.3%.
Women in Vernal earn 34.7 cents for every dollar earned by a man.
What is Inequality or Gini Index in Vernal?
Inequality or Gini Index in Vernal is 0.39.
What is the Total Population of Vernal?
Total Population of Vernal is 10,141.
What is the Total Male Population of Vernal?
Total Male Population of Vernal is 5,312.
What is the Total Female Population of Vernal?
Total Female Population of Vernal is 4,829.
What is the Ratio of Males per 100 Females in Vernal?
There are 110.00 Males per 100 Females in Vernal.
What is the Ratio of Females per 100 Males in Vernal?
There are 90.91 Females per 100 Males in Vernal.
What is the Median Population Age in Vernal?
Median Population Age in Vernal is 30.0 Years.
What is the Average Family Size in Vernal
Average Family Size in Vernal is 3.7 People.
What is the Average Household Size in Vernal
Average Household Size in Vernal is 3.0 People.
How Large is the Labor Force in Vernal?
There are 4,816 People in the Labor Forcein in Vernal.
What is the Percentage of People in the Labor Force in Vernal?
66.6% of People are in the Labor Force in Vernal.
What is the Unemployment Rate in Vernal?
Unemployment Rate in Vernal is 8.9%.