Junction, UT Map & Demographics
Junction Map
Junction Overview
$16,174
PER CAPITA INCOME
$45,625
AVG FAMILY INCOME
72.6%
WAGE / INCOME GAP [ % ]
27.4¢/ $1
WAGE / INCOME GAP [ $ ]
0.49
INEQUALITY / GINI INDEX
288
TOTAL POPULATION
191
MALE POPULATION
97
FEMALE POPULATION
196.91
MALES / 100 FEMALES
50.79
FEMALES / 100 MALES
61.2
MEDIAN AGE
5.5
AVG FAMILY SIZE
2.9
AVG HOUSEHOLD SIZE
68
LABOR FORCE [ PEOPLE ]
26.1%
PERCENT IN LABOR FORCE
20.6%
UNEMPLOYMENT RATE
Junction Zip Codes
Junction Area Codes
Income in Junction
Income Overview in Junction
| Characteristic | Number | Measure |
| Per Capita Income | 288 | $16,174 |
| Median Family Income | 42 | $45,625 |
| Mean Family Income | 42 | $48,024 |
| Median Household Income | 101 | $0 |
| Mean Household Income | 101 | $40,258 |
| Income Deficit | 42 | $0 |
| Wage / Income Gap (%) | 288 | 72.61% |
| Wage / Income Gap ($) | 288 | 27.39¢ per $1 |
| Gini / Inequality Index | 288 | 0.49 |
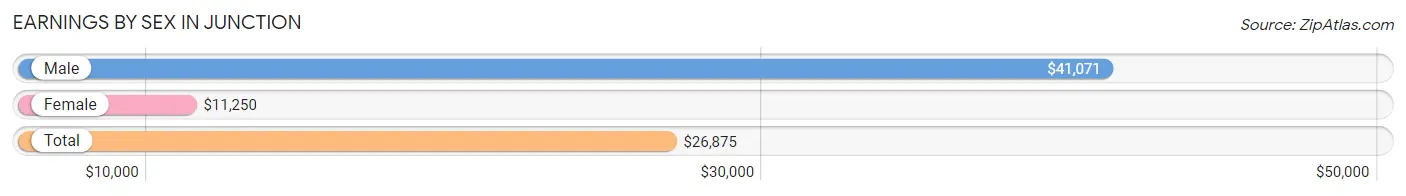
Earnings by Sex in Junction
Average Earnings in Junction are $26,875, $41,071 for men and $11,250 for women, a difference of 72.6%.
| Sex | Number | Average Earnings |
| Male | 48 (73.9%) | $41,071 |
| Female | 17 (26.2%) | $11,250 |
| Total | 65 (100.0%) | $26,875 |
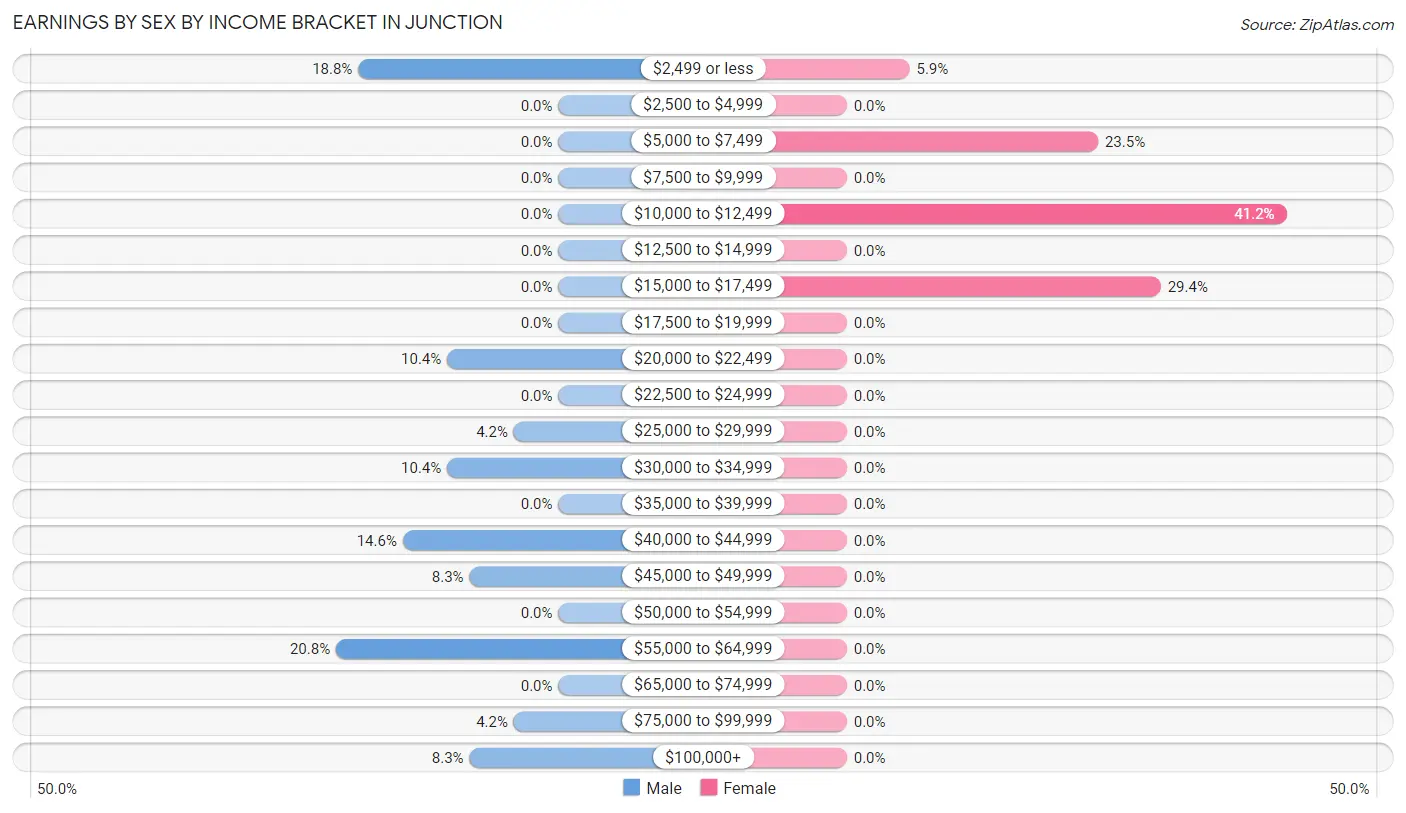
Earnings by Sex by Income Bracket in Junction
The most common earnings brackets in Junction are $55,000 to $64,999 for men (10 | 20.8%) and $10,000 to $12,499 for women (7 | 41.2%).
| Income | Male | Female |
| $2,499 or less | 9 (18.8%) | 1 (5.9%) |
| $2,500 to $4,999 | 0 (0.0%) | 0 (0.0%) |
| $5,000 to $7,499 | 0 (0.0%) | 4 (23.5%) |
| $7,500 to $9,999 | 0 (0.0%) | 0 (0.0%) |
| $10,000 to $12,499 | 0 (0.0%) | 7 (41.2%) |
| $12,500 to $14,999 | 0 (0.0%) | 0 (0.0%) |
| $15,000 to $17,499 | 0 (0.0%) | 5 (29.4%) |
| $17,500 to $19,999 | 0 (0.0%) | 0 (0.0%) |
| $20,000 to $22,499 | 5 (10.4%) | 0 (0.0%) |
| $22,500 to $24,999 | 0 (0.0%) | 0 (0.0%) |
| $25,000 to $29,999 | 2 (4.2%) | 0 (0.0%) |
| $30,000 to $34,999 | 5 (10.4%) | 0 (0.0%) |
| $35,000 to $39,999 | 0 (0.0%) | 0 (0.0%) |
| $40,000 to $44,999 | 7 (14.6%) | 0 (0.0%) |
| $45,000 to $49,999 | 4 (8.3%) | 0 (0.0%) |
| $50,000 to $54,999 | 0 (0.0%) | 0 (0.0%) |
| $55,000 to $64,999 | 10 (20.8%) | 0 (0.0%) |
| $65,000 to $74,999 | 0 (0.0%) | 0 (0.0%) |
| $75,000 to $99,999 | 2 (4.2%) | 0 (0.0%) |
| $100,000+ | 4 (8.3%) | 0 (0.0%) |
| Total | 48 (100.0%) | 17 (100.0%) |
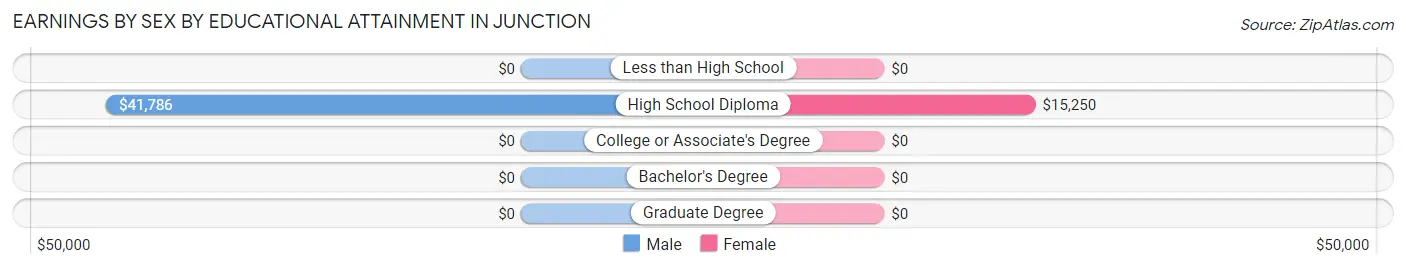
Earnings by Sex by Educational Attainment in Junction
Average earnings in Junction are $46,250 for men and $11,429 for women, a difference of 75.3%. Men with an educational attainment of high school diploma enjoy the highest average annual earnings of $41,786, while those with high school diploma education earn the least with $41,786. Women with an educational attainment of high school diploma earn the most with the average annual earnings of $15,250, while those with high school diploma education have the smallest earnings of $15,250.
| Educational Attainment | Male Income | Female Income |
| Less than High School | - | - |
| High School Diploma | $41,786 | $15,250 |
| College or Associate's Degree | - | - |
| Bachelor's Degree | - | - |
| Graduate Degree | - | - |
| Total | $46,250 | $11,429 |
Family Income in Junction
Family Income Brackets in Junction
According to the Junction family income data, there are 13 families falling into the $10,000 to $14,999 income range, which is the most common income bracket and makes up 30.9% of all families.
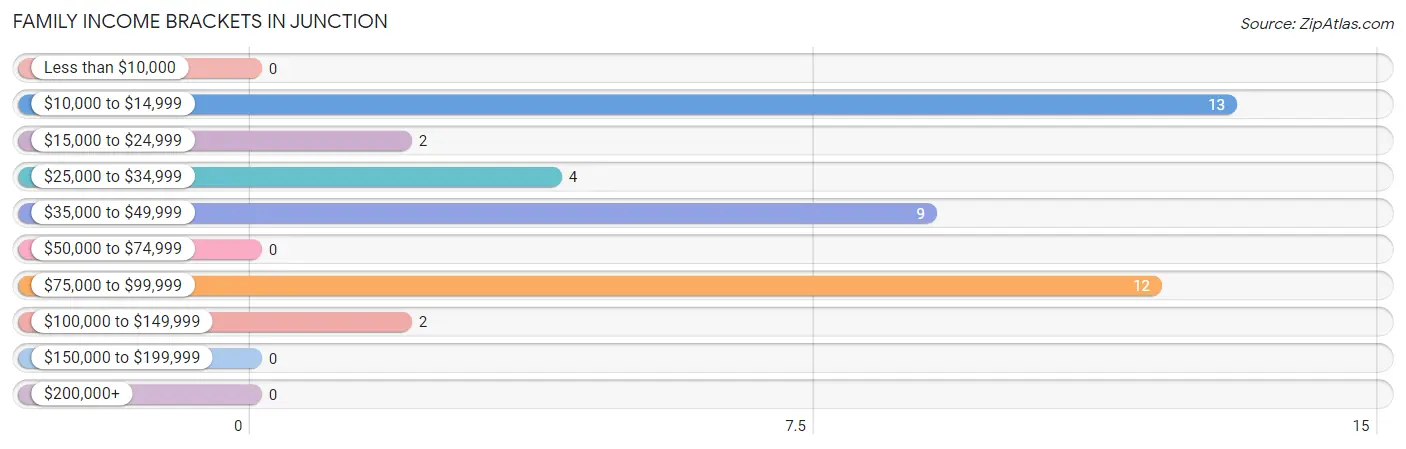
| Income Bracket | # Families | % Families |
| Less than $10,000 | 0 | 0.0% |
| $10,000 to $14,999 | 13 | 31.0% |
| $15,000 to $24,999 | 2 | 4.8% |
| $25,000 to $34,999 | 4 | 9.5% |
| $35,000 to $49,999 | 9 | 21.4% |
| $50,000 to $74,999 | 0 | 0.0% |
| $75,000 to $99,999 | 12 | 28.6% |
| $100,000 to $149,999 | 2 | 4.8% |
| $150,000 to $199,999 | 0 | 0.0% |
| $200,000+ | 0 | 0.0% |
Family Income by Famaliy Size in Junction
2-person families (18 | 42.9%) account for the highest median family income in Junction with $46,786 per family, while 2-person families (18 | 42.9%) have the highest median income of $23,393 per family member.
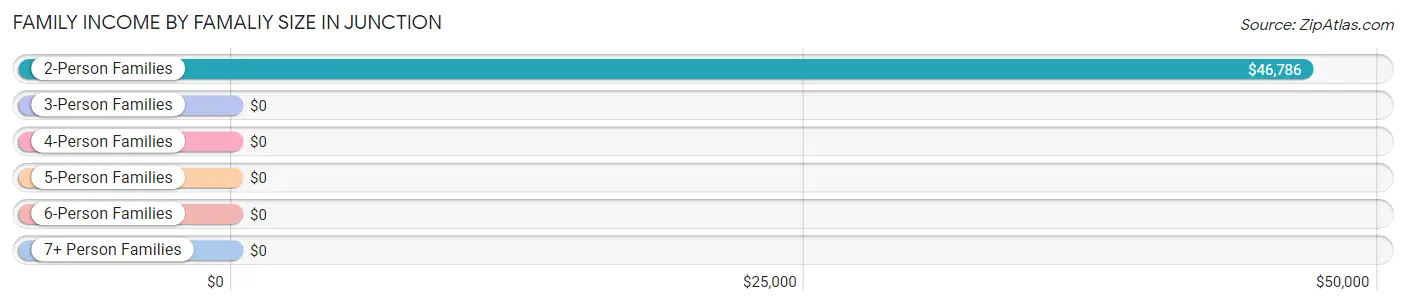
| Income Bracket | # Families | Median Income |
| 2-Person Families | 18 (42.9%) | $46,786 |
| 3-Person Families | 13 (30.9%) | $0 |
| 4-Person Families | 2 (4.8%) | $0 |
| 5-Person Families | 2 (4.8%) | $0 |
| 6-Person Families | 5 (11.9%) | $0 |
| 7+ Person Families | 2 (4.8%) | $0 |
| Total | 42 (100.0%) | $45,625 |
Family Income by Number of Earners in Junction
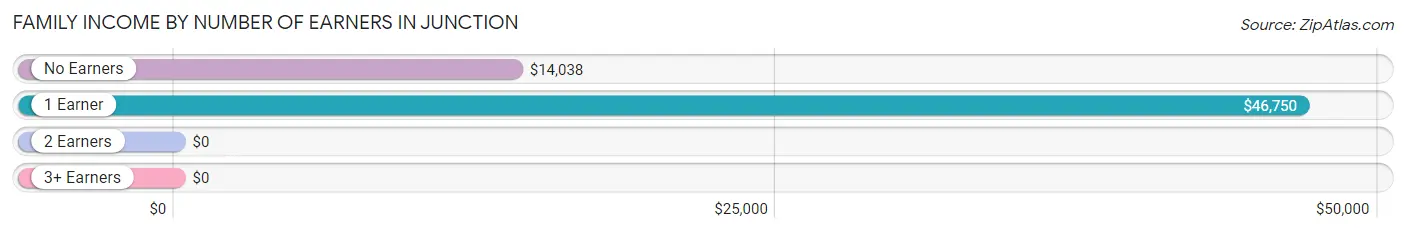
| Number of Earners | # Families | Median Income |
| No Earners | 16 (38.1%) | $14,038 |
| 1 Earner | 19 (45.2%) | $46,750 |
| 2 Earners | 2 (4.8%) | $0 |
| 3+ Earners | 5 (11.9%) | $0 |
| Total | 42 (100.0%) | $45,625 |
Household Income in Junction
Household Income Brackets in Junction
With 54 households falling in the category, the $10,000 to $14,999 income range is the most frequent in Junction, accounting for 53.5% of all households.
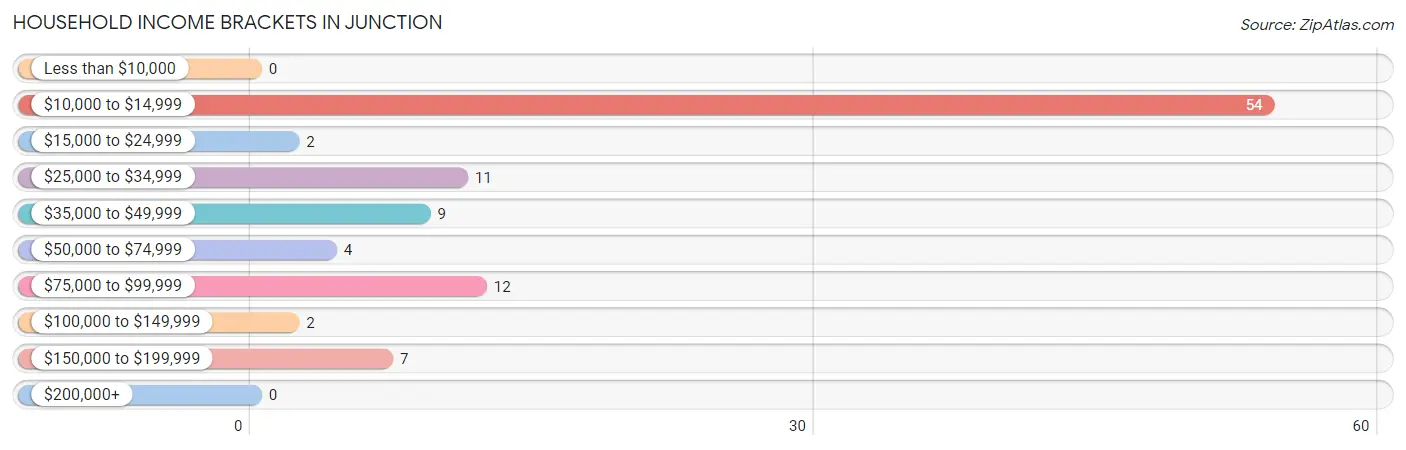
| Income Bracket | # Households | % Households |
| Less than $10,000 | 0 | 0.0% |
| $10,000 to $14,999 | 54 | 53.5% |
| $15,000 to $24,999 | 2 | 2.0% |
| $25,000 to $34,999 | 11 | 10.9% |
| $35,000 to $49,999 | 9 | 8.9% |
| $50,000 to $74,999 | 4 | 4.0% |
| $75,000 to $99,999 | 12 | 11.9% |
| $100,000 to $149,999 | 2 | 2.0% |
| $150,000 to $199,999 | 7 | 6.9% |
| $200,000+ | 0 | 0.0% |
Household Income by Householder Age in Junction
| Income Bracket | # Households | Median Income |
| 15 to 24 Years | 0 (0.0%) | $0 |
| 25 to 44 Years | 7 (6.9%) | $0 |
| 45 to 64 Years | 21 (20.8%) | $0 |
| 65+ Years | 73 (72.3%) | $0 |
| Total | 101 (100.0%) | $0 |
Poverty in Junction
Income Below Poverty by Sex and Age in Junction
With 40.3% poverty level for males and 63.9% for females among the residents of Junction, 55 to 64 year old males and 16 and 17 year old females are the most vulnerable to poverty, with 52 males (86.7%) and 1 females (100.0%) in their respective age groups living below the poverty level.
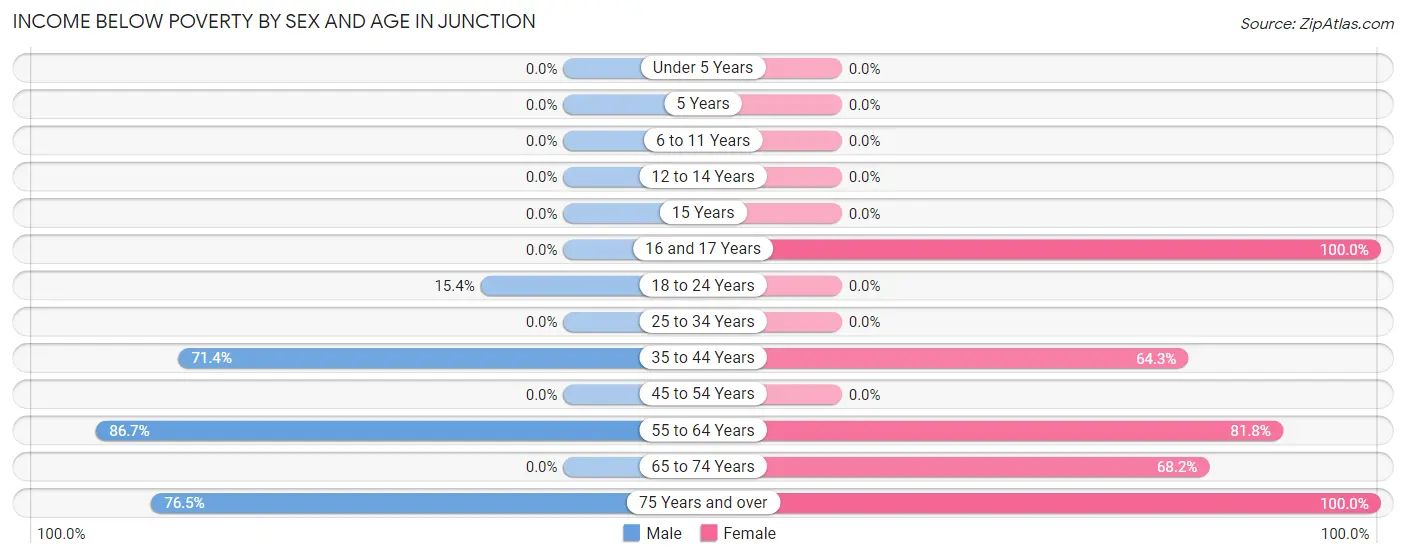
| Age Bracket | Male | Female |
| Under 5 Years | 0 (0.0%) | 0 (0.0%) |
| 5 Years | 0 (0.0%) | 0 (0.0%) |
| 6 to 11 Years | 0 (0.0%) | 0 (0.0%) |
| 12 to 14 Years | 0 (0.0%) | 0 (0.0%) |
| 15 Years | 0 (0.0%) | 0 (0.0%) |
| 16 and 17 Years | 0 (0.0%) | 1 (100.0%) |
| 18 to 24 Years | 2 (15.4%) | 0 (0.0%) |
| 25 to 34 Years | 0 (0.0%) | 0 (0.0%) |
| 35 to 44 Years | 10 (71.4%) | 9 (64.3%) |
| 45 to 54 Years | 0 (0.0%) | 0 (0.0%) |
| 55 to 64 Years | 52 (86.7%) | 9 (81.8%) |
| 65 to 74 Years | 0 (0.0%) | 30 (68.2%) |
| 75 Years and over | 13 (76.5%) | 13 (100.0%) |
| Total | 77 (40.3%) | 62 (63.9%) |
Income Above Poverty by Sex and Age in Junction
According to the poverty statistics in Junction, males aged under 5 years and females aged 6 to 11 years are the age groups that are most secure financially, with 100.0% of males and 100.0% of females in these age groups living above the poverty line.
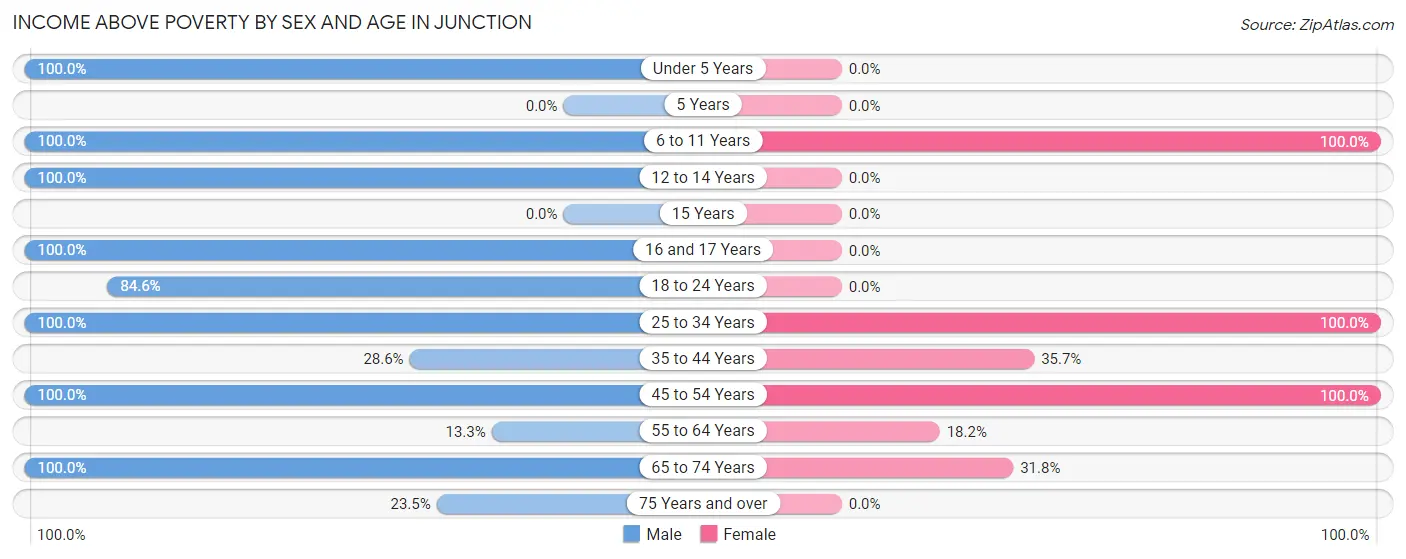
| Age Bracket | Male | Female |
| Under 5 Years | 15 (100.0%) | 0 (0.0%) |
| 5 Years | 0 (0.0%) | 0 (0.0%) |
| 6 to 11 Years | 3 (100.0%) | 3 (100.0%) |
| 12 to 14 Years | 6 (100.0%) | 0 (0.0%) |
| 15 Years | 0 (0.0%) | 0 (0.0%) |
| 16 and 17 Years | 7 (100.0%) | 0 (0.0%) |
| 18 to 24 Years | 11 (84.6%) | 0 (0.0%) |
| 25 to 34 Years | 11 (100.0%) | 2 (100.0%) |
| 35 to 44 Years | 4 (28.6%) | 5 (35.7%) |
| 45 to 54 Years | 21 (100.0%) | 9 (100.0%) |
| 55 to 64 Years | 8 (13.3%) | 2 (18.2%) |
| 65 to 74 Years | 24 (100.0%) | 14 (31.8%) |
| 75 Years and over | 4 (23.5%) | 0 (0.0%) |
| Total | 114 (59.7%) | 35 (36.1%) |
Income Below Poverty Among Married-Couple Families in Junction
The poverty statistics for married-couple families in Junction show that 31.4% or 11 of the total 35 families live below the poverty line. Families with no children have the highest poverty rate of 39.3%, comprising of 11 families. On the other hand, families with 1 or 2 children have the lowest poverty rate of 0.0%, which includes 0 families.
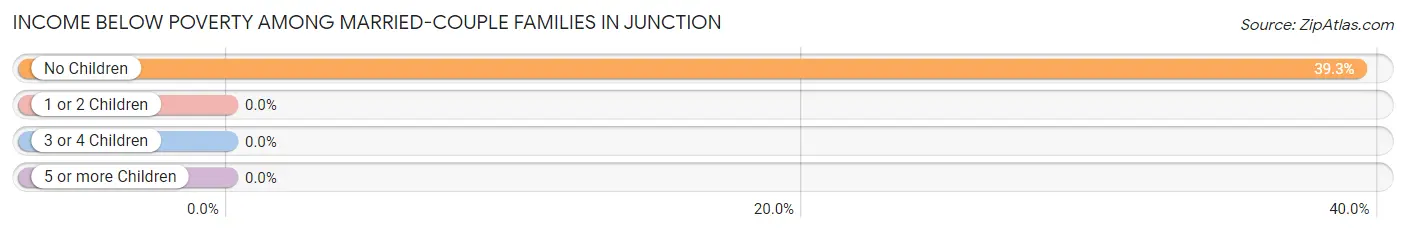
| Children | Above Poverty | Below Poverty |
| No Children | 17 (60.7%) | 11 (39.3%) |
| 1 or 2 Children | 5 (100.0%) | 0 (0.0%) |
| 3 or 4 Children | 0 (0.0%) | 0 (0.0%) |
| 5 or more Children | 2 (100.0%) | 0 (0.0%) |
| Total | 24 (68.6%) | 11 (31.4%) |
Income Below Poverty Among Single-Parent Households in Junction
According to the poverty data in Junction, 50.0% or 2 single-father households and 66.7% or 2 single-mother households are living below the poverty line. Among single-father households, those with no children have the highest poverty rate, with 2 households (50.0%) experiencing poverty. Likewise, among single-mother households, those with 1 or 2 children have the highest poverty rate, with 2 households (100.0%) falling below the poverty line.
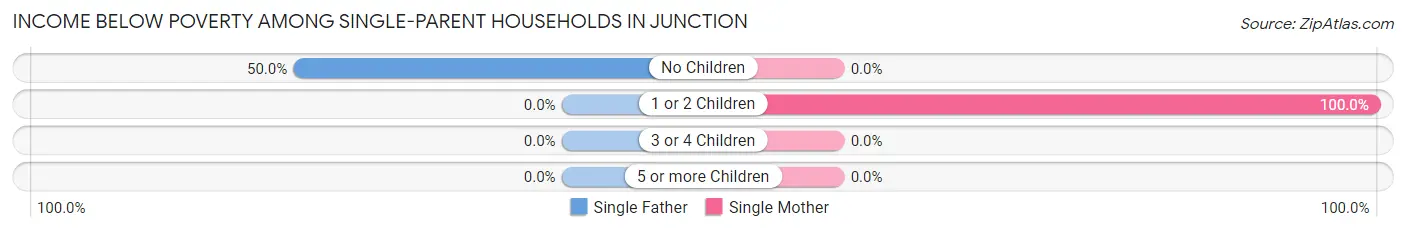
| Children | Single Father | Single Mother |
| No Children | 2 (50.0%) | 0 (0.0%) |
| 1 or 2 Children | 0 (0.0%) | 2 (100.0%) |
| 3 or 4 Children | 0 (0.0%) | 0 (0.0%) |
| 5 or more Children | 0 (0.0%) | 0 (0.0%) |
| Total | 2 (50.0%) | 2 (66.7%) |
Income Below Poverty Among Married-Couple vs Single-Parent Households in Junction
The poverty data for Junction shows that 11 of the married-couple family households (31.4%) and 4 of the single-parent households (57.1%) are living below the poverty level. Within the married-couple family households, those with no children have the highest poverty rate, with 11 households (39.3%) falling below the poverty line. Among the single-parent households, those with 1 or 2 children have the highest poverty rate, with 2 household (100.0%) living below poverty.
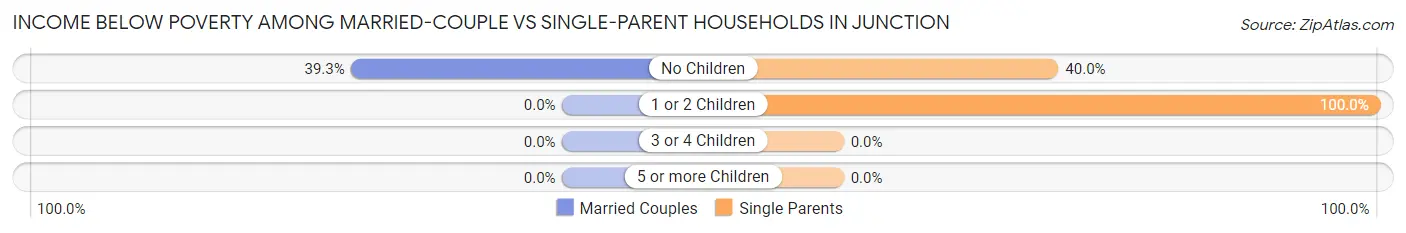
| Children | Married-Couple Families | Single-Parent Households |
| No Children | 11 (39.3%) | 2 (40.0%) |
| 1 or 2 Children | 0 (0.0%) | 2 (100.0%) |
| 3 or 4 Children | 0 (0.0%) | 0 (0.0%) |
| 5 or more Children | 0 (0.0%) | 0 (0.0%) |
| Total | 11 (31.4%) | 4 (57.1%) |
Race in Junction
The most populous races in Junction are , and White / Caucasian (288 | 100.0%).
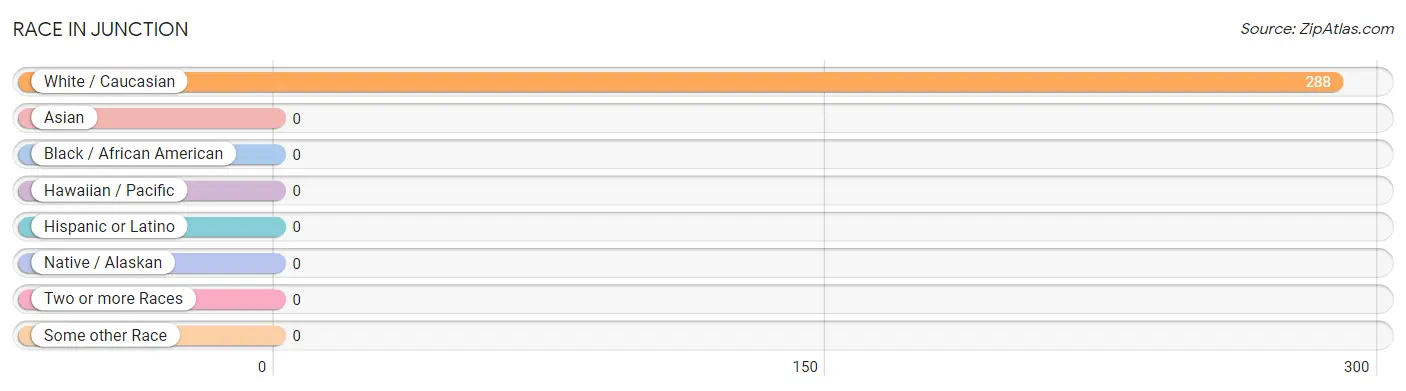
| Race | # Population | % Population |
| Asian | 0 | 0.0% |
| Black / African American | 0 | 0.0% |
| Hawaiian / Pacific | 0 | 0.0% |
| Hispanic or Latino | 0 | 0.0% |
| Native / Alaskan | 0 | 0.0% |
| White / Caucasian | 288 | 100.0% |
| Two or more Races | 0 | 0.0% |
| Some other Race | 0 | 0.0% |
| Total | 288 | 100.0% |
Ancestry in Junction
The most populous ancestries reported in Junction are American (41 | 14.2%), Polish (37 | 12.9%), Irish (25 | 8.7%), English (24 | 8.3%), and German (20 | 6.9%), together accounting for 51.0% of all Junction residents.
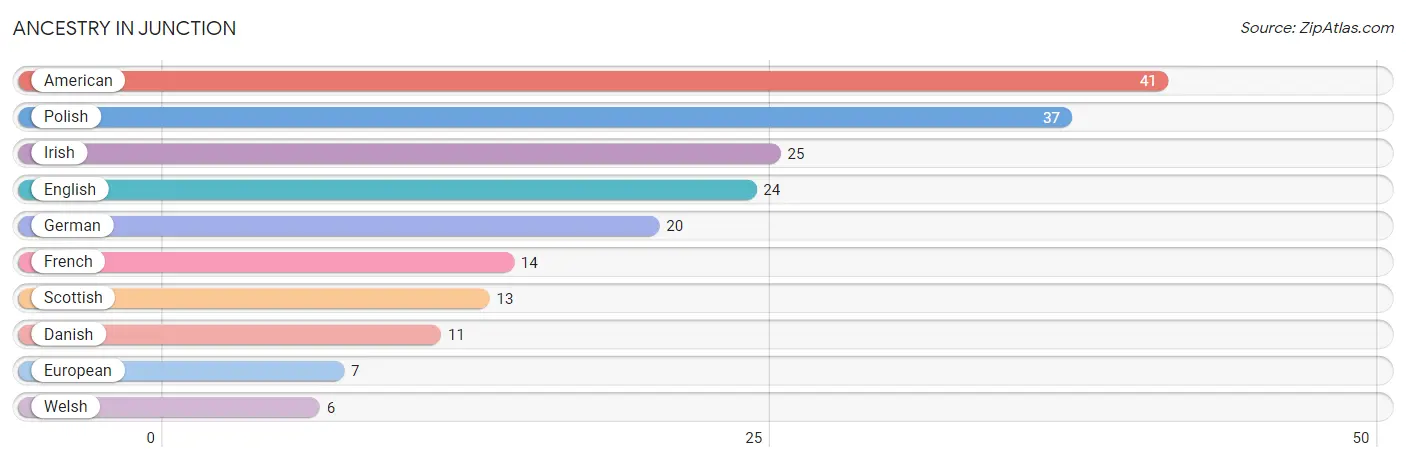
| Ancestry | # Population | % Population |
| American | 41 | 14.2% |
| Danish | 11 | 3.8% |
| English | 24 | 8.3% |
| European | 7 | 2.4% |
| French | 14 | 4.9% |
| German | 20 | 6.9% |
| Irish | 25 | 8.7% |
| Polish | 37 | 12.9% |
| Scottish | 13 | 4.5% |
| Welsh | 6 | 2.1% | View All 10 Rows |
Immigrants in Junction

| Immigration Origin | # Population | % Population | View All 0 Rows |
Sex and Age in Junction
Sex and Age in Junction
The most populous age groups in Junction are 60 to 64 Years (52 | 27.2%) for men and 65 to 69 Years (33 | 34.0%) for women.
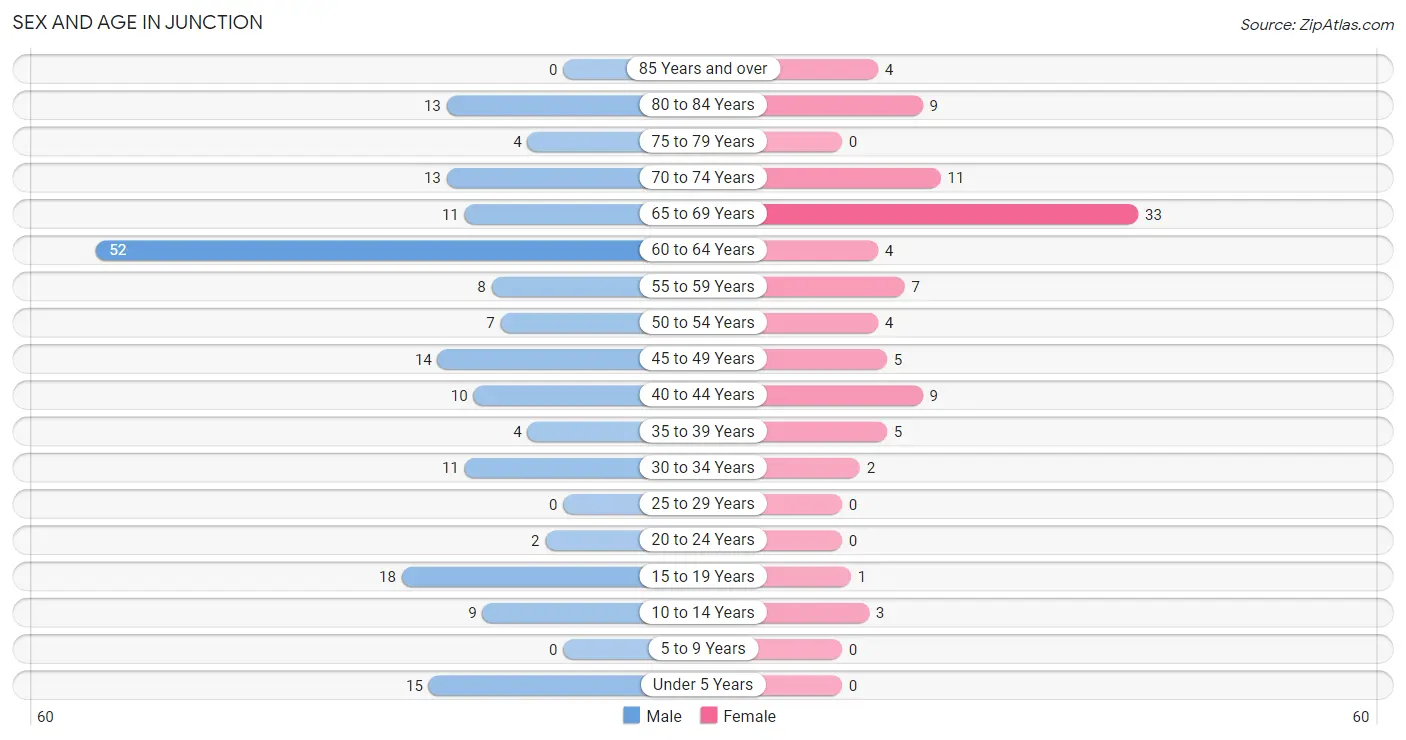
| Age Bracket | Male | Female |
| Under 5 Years | 15 (7.9%) | 0 (0.0%) |
| 5 to 9 Years | 0 (0.0%) | 0 (0.0%) |
| 10 to 14 Years | 9 (4.7%) | 3 (3.1%) |
| 15 to 19 Years | 18 (9.4%) | 1 (1.0%) |
| 20 to 24 Years | 2 (1.1%) | 0 (0.0%) |
| 25 to 29 Years | 0 (0.0%) | 0 (0.0%) |
| 30 to 34 Years | 11 (5.8%) | 2 (2.1%) |
| 35 to 39 Years | 4 (2.1%) | 5 (5.1%) |
| 40 to 44 Years | 10 (5.2%) | 9 (9.3%) |
| 45 to 49 Years | 14 (7.3%) | 5 (5.1%) |
| 50 to 54 Years | 7 (3.7%) | 4 (4.1%) |
| 55 to 59 Years | 8 (4.2%) | 7 (7.2%) |
| 60 to 64 Years | 52 (27.2%) | 4 (4.1%) |
| 65 to 69 Years | 11 (5.8%) | 33 (34.0%) |
| 70 to 74 Years | 13 (6.8%) | 11 (11.3%) |
| 75 to 79 Years | 4 (2.1%) | 0 (0.0%) |
| 80 to 84 Years | 13 (6.8%) | 9 (9.3%) |
| 85 Years and over | 0 (0.0%) | 4 (4.1%) |
| Total | 191 (100.0%) | 97 (100.0%) |
Families and Households in Junction
Median Family Size in Junction
The median family size in Junction is 5.45 persons per family, with single female/mother families (3 | 7.1%) accounting for the largest median family size of 12.33 persons per family. On the other hand, married-couple families (35 | 83.3%) represent the smallest median family size with 4.77 persons per family.
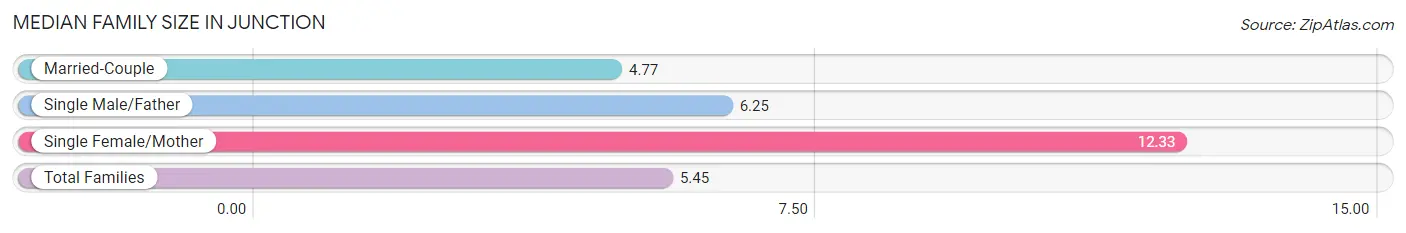
| Family Type | # Families | Family Size |
| Married-Couple | 35 (83.3%) | 4.77 |
| Single Male/Father | 4 (9.5%) | 6.25 |
| Single Female/Mother | 3 (7.1%) | 12.33 |
| Total Families | 42 (100.0%) | 5.45 |
Median Household Size in Junction
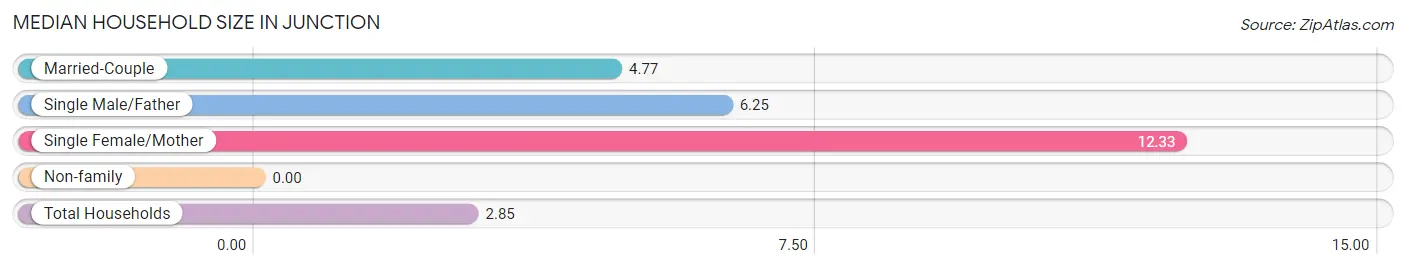
| Household Type | # Households | Household Size |
| Married-Couple | 35 (34.6%) | 4.77 |
| Single Male/Father | 4 (4.0%) | 6.25 |
| Single Female/Mother | 3 (3.0%) | 12.33 |
| Non-family | 59 (58.4%) | - |
| Total Households | 101 (100.0%) | 2.85 |
Household Size by Marriage Status in Junction
Out of a total of 101 households in Junction, 42 (41.6%) are family households, while 59 (58.4%) are nonfamily households. The most numerous type of family households are 2-person households, comprising 18, and the most common type of nonfamily households are 1-person households, comprising 59.
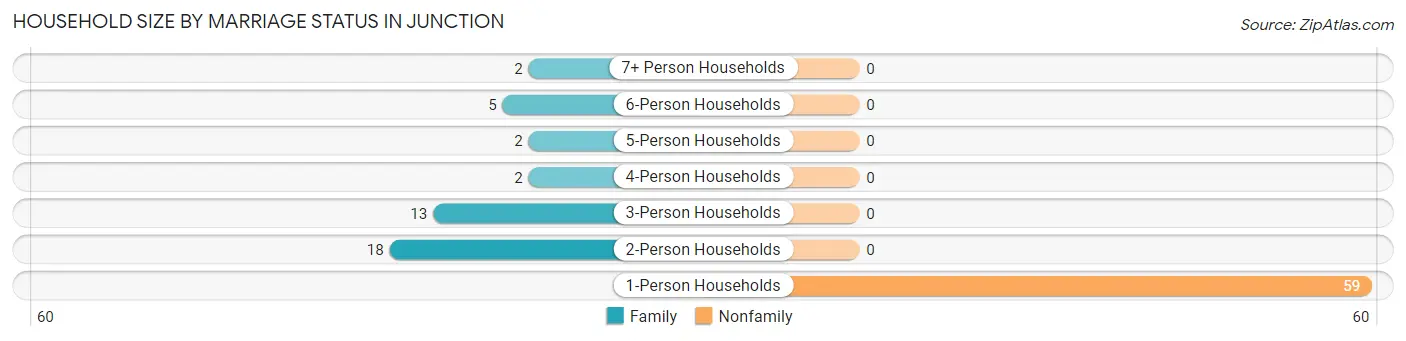
| Household Size | Family Households | Nonfamily Households |
| 1-Person Households | - | 59 (58.4%) |
| 2-Person Households | 18 (17.8%) | 0 (0.0%) |
| 3-Person Households | 13 (12.9%) | 0 (0.0%) |
| 4-Person Households | 2 (2.0%) | 0 (0.0%) |
| 5-Person Households | 2 (2.0%) | 0 (0.0%) |
| 6-Person Households | 5 (5.0%) | 0 (0.0%) |
| 7+ Person Households | 2 (2.0%) | 0 (0.0%) |
| Total | 42 (41.6%) | 59 (58.4%) |
Female Fertility in Junction
Fertility by Age in Junction
| Age Bracket | Women with Births | Births / 1,000 Women |
| 15 to 19 years | 0 (0.0%) | 0.0 |
| 20 to 34 years | 0 (0.0%) | 0.0 |
| 35 to 50 years | 0 (0.0%) | 0.0 |
| Total | 0 (0.0%) | 0.0 |
Fertility by Age by Marriage Status in Junction
| Age Bracket | Married | Unmarried |
| 15 to 19 years | 0 (0.0%) | 0 (0.0%) |
| 20 to 34 years | 0 (0.0%) | 0 (0.0%) |
| 35 to 50 years | 0 (0.0%) | 0 (0.0%) |
| Total | 0 (0.0%) | 0 (0.0%) |
Fertility by Education in Junction
| Educational Attainment | Women with Births | Births / 1,000 Women |
| Less than High School | 0 (0.0%) | 0.0 |
| High School Diploma | 0 (0.0%) | 0.0 |
| College or Associate's Degree | 0 (0.0%) | 0.0 |
| Bachelor's Degree | 0 (0.0%) | 0.0 |
| Graduate Degree | 0 (0.0%) | 0.0 |
| Total | 0 (0.0%) | 0.0 |
Fertility by Education by Marriage Status in Junction
| Educational Attainment | Married | Unmarried |
| Less than High School | 0 (0.0%) | 0 (0.0%) |
| High School Diploma | 0 (0.0%) | 0 (0.0%) |
| College or Associate's Degree | 0 (0.0%) | 0 (0.0%) |
| Bachelor's Degree | 0 (0.0%) | 0 (0.0%) |
| Graduate Degree | 0 (0.0%) | 0 (0.0%) |
| Total | 0 (0.0%) | 0 (0.0%) |
Employment Characteristics in Junction
Employment by Class of Employer in Junction
Among the 54 employed individuals in Junction, private company employees (35 | 64.8%), local government employees (9 | 16.7%), and self-employed (incorporated) (4 | 7.4%) make up the most common classes of employment.
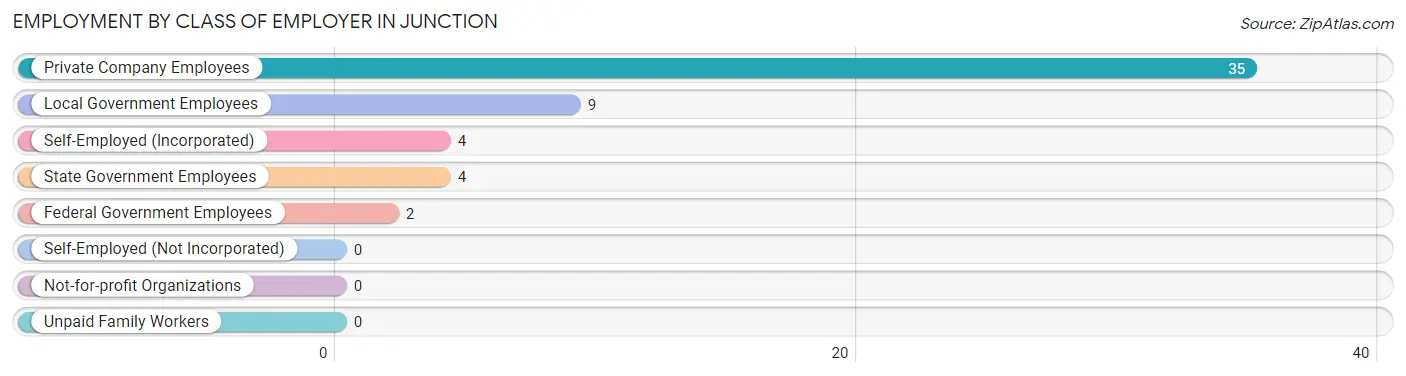
| Employer Class | # Employees | % Employees |
| Private Company Employees | 35 | 64.8% |
| Self-Employed (Incorporated) | 4 | 7.4% |
| Self-Employed (Not Incorporated) | 0 | 0.0% |
| Not-for-profit Organizations | 0 | 0.0% |
| Local Government Employees | 9 | 16.7% |
| State Government Employees | 4 | 7.4% |
| Federal Government Employees | 2 | 3.7% |
| Unpaid Family Workers | 0 | 0.0% |
| Total | 54 | 100.0% |
Employment Status by Age in Junction
According to the labor force statistics for Junction, out of the total population over 16 years of age (261), 26.1% or 68 individuals are in the labor force, with 20.6% or 14 of them unemployed. The age group with the highest labor force participation rate is 55 to 59 years, with 100.0% or 15 individuals in the labor force. Within the labor force, the 35 to 44 years age range has the highest percentage of unemployed individuals, with 52.6% or 10 of them being unemployed.
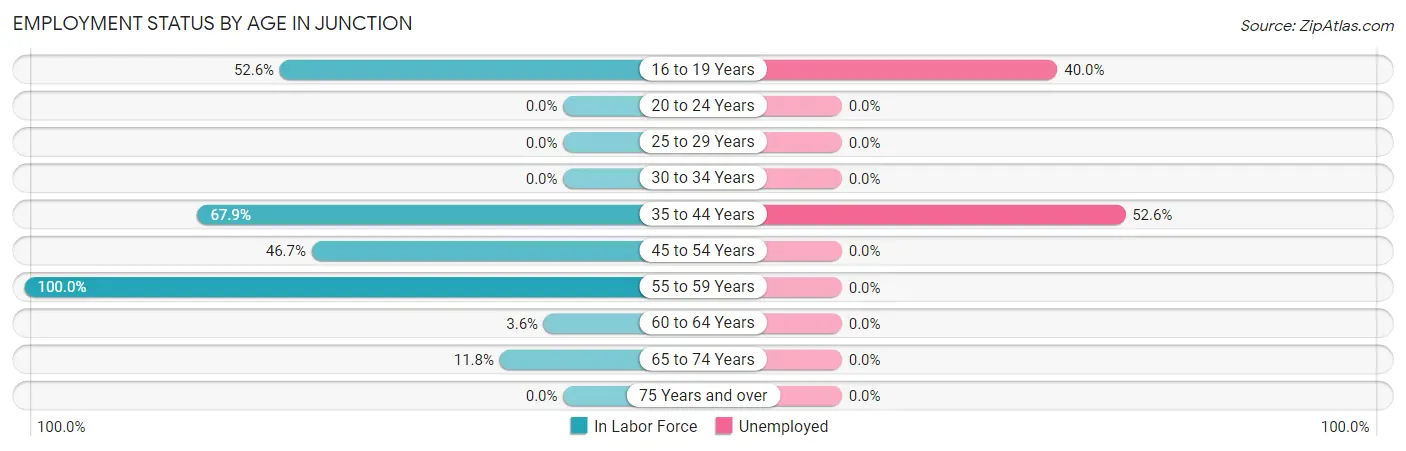
| Age Bracket | In Labor Force | Unemployed |
| 16 to 19 Years | 10 (52.6%) | 4 (40.0%) |
| 20 to 24 Years | 0 (0.0%) | 0 (0.0%) |
| 25 to 29 Years | 0 (0.0%) | 0 (0.0%) |
| 30 to 34 Years | 0 (0.0%) | 0 (0.0%) |
| 35 to 44 Years | 19 (67.9%) | 10 (52.6%) |
| 45 to 54 Years | 14 (46.7%) | 0 (0.0%) |
| 55 to 59 Years | 15 (100.0%) | 0 (0.0%) |
| 60 to 64 Years | 2 (3.6%) | 0 (0.0%) |
| 65 to 74 Years | 8 (11.8%) | 0 (0.0%) |
| 75 Years and over | 0 (0.0%) | 0 (0.0%) |
| Total | 68 (26.1%) | 14 (20.6%) |
Employment Status by Educational Attainment in Junction
According to labor force statistics for Junction, 35.2% of individuals (50) out of the total population between 25 and 64 years of age (142) are in the labor force, with 20.0% or 10 of them being unemployed. The group with the highest labor force participation rate are those with the educational attainment of bachelor's degree or higher, with 100.0% or 4 individuals in the labor force. Within the labor force, individuals with high school diploma education have the highest percentage of unemployment, with 27.0% or 10 of them being unemployed.
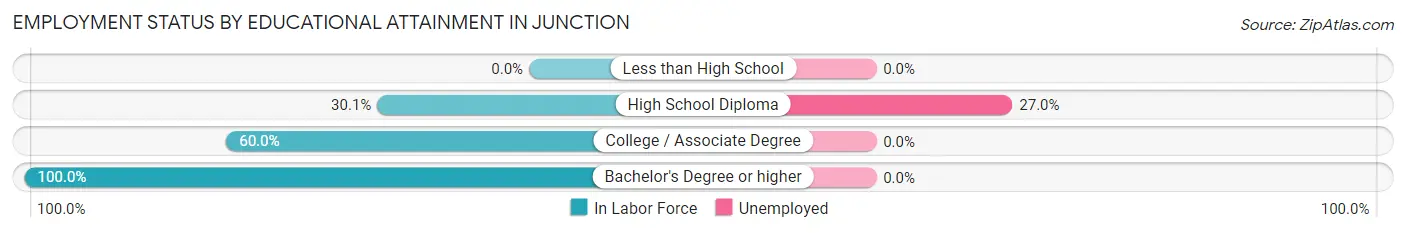
| Educational Attainment | In Labor Force | Unemployed |
| Less than High School | 0 (0.0%) | 0 (0.0%) |
| High School Diploma | 37 (30.1%) | 33 (27.0%) |
| College / Associate Degree | 9 (60.0%) | 0 (0.0%) |
| Bachelor's Degree or higher | 4 (100.0%) | 0 (0.0%) |
| Total | 50 (35.2%) | 28 (20.0%) |
Employment Occupations by Sex in Junction
Management, Business, Science and Arts Occupations
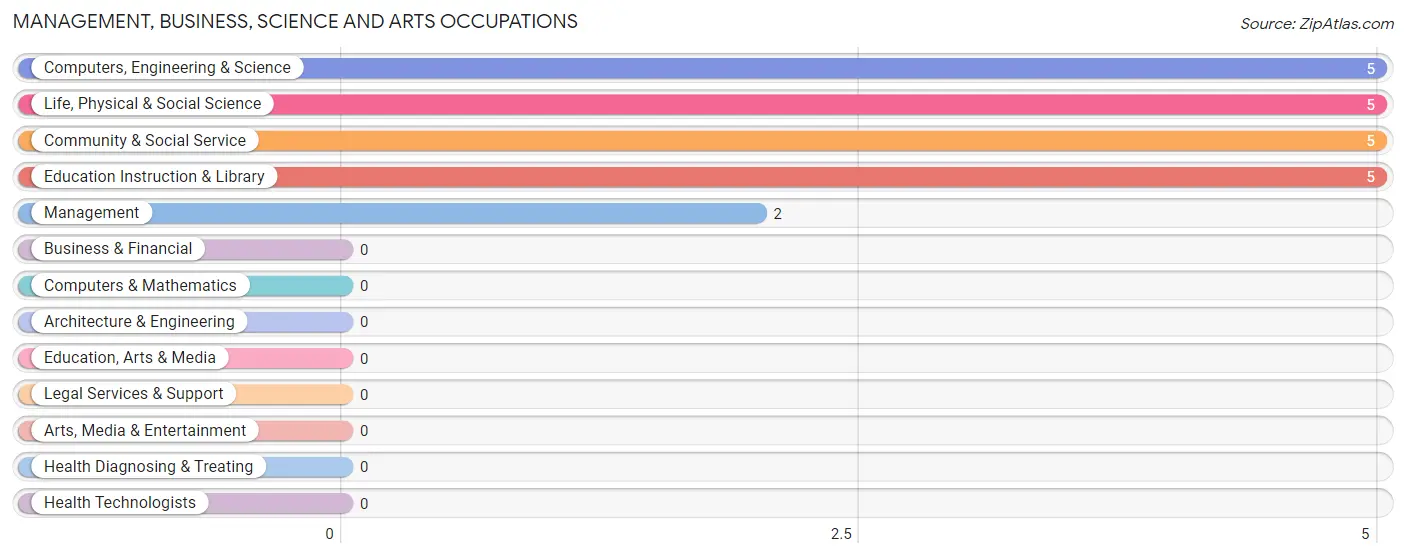
The most common Management, Business, Science and Arts occupations in Junction are Computers, Engineering & Science (5 | 9.3%), Life, Physical & Social Science (5 | 9.3%), Community & Social Service (5 | 9.3%), Education Instruction & Library (5 | 9.3%), and Management (2 | 3.7%).
Management, Business, Science and Arts Occupations by Sex
Within the Management, Business, Science and Arts occupations in Junction, the most male-oriented occupations are Management (100.0%), Computers, Engineering & Science (100.0%), and Life, Physical & Social Science (100.0%), while the most female-oriented occupations are Community & Social Service (100.0%), and Education Instruction & Library (100.0%).
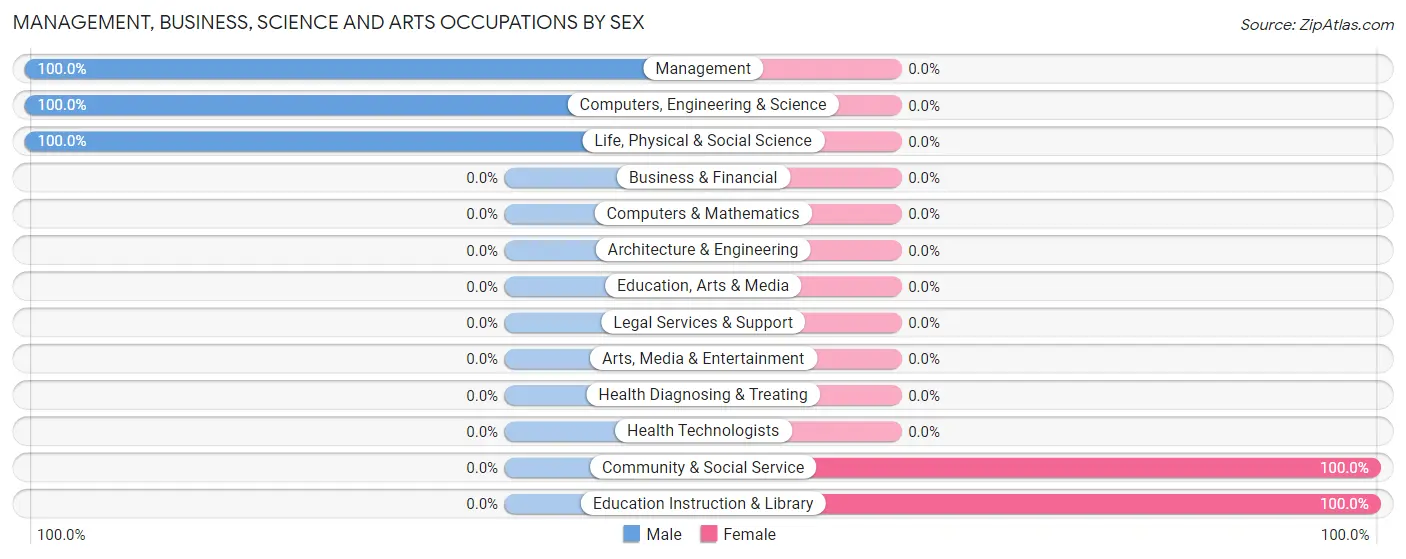
| Occupation | Male | Female |
| Management | 2 (100.0%) | 0 (0.0%) |
| Business & Financial | 0 (0.0%) | 0 (0.0%) |
| Computers, Engineering & Science | 5 (100.0%) | 0 (0.0%) |
| Computers & Mathematics | 0 (0.0%) | 0 (0.0%) |
| Architecture & Engineering | 0 (0.0%) | 0 (0.0%) |
| Life, Physical & Social Science | 5 (100.0%) | 0 (0.0%) |
| Community & Social Service | 0 (0.0%) | 5 (100.0%) |
| Education, Arts & Media | 0 (0.0%) | 0 (0.0%) |
| Legal Services & Support | 0 (0.0%) | 0 (0.0%) |
| Education Instruction & Library | 0 (0.0%) | 5 (100.0%) |
| Arts, Media & Entertainment | 0 (0.0%) | 0 (0.0%) |
| Health Diagnosing & Treating | 0 (0.0%) | 0 (0.0%) |
| Health Technologists | 0 (0.0%) | 0 (0.0%) |
| Total (Category) | 7 (58.3%) | 5 (41.7%) |
| Total (Overall) | 37 (68.5%) | 17 (31.5%) |
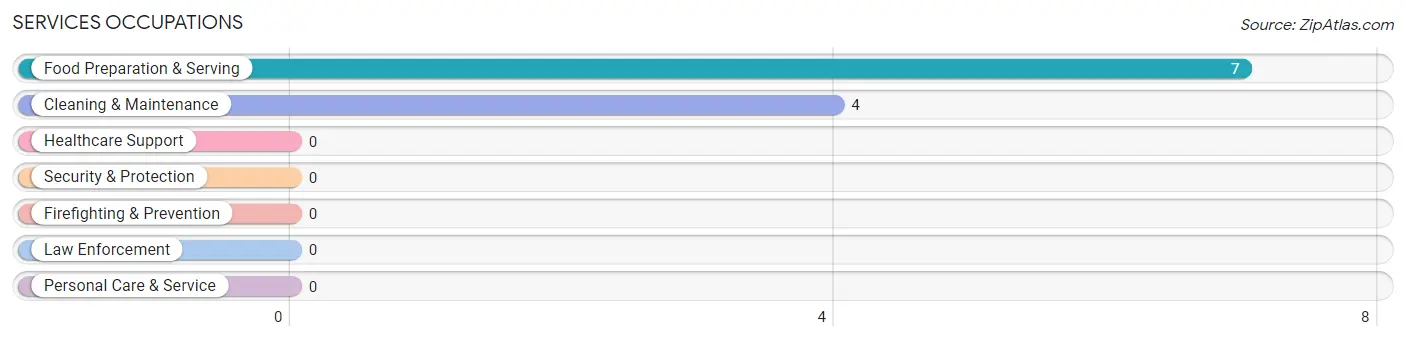
Services Occupations
The most common Services occupations in Junction are Food Preparation & Serving (7 | 13.0%), and Cleaning & Maintenance (4 | 7.4%).
Services Occupations by Sex
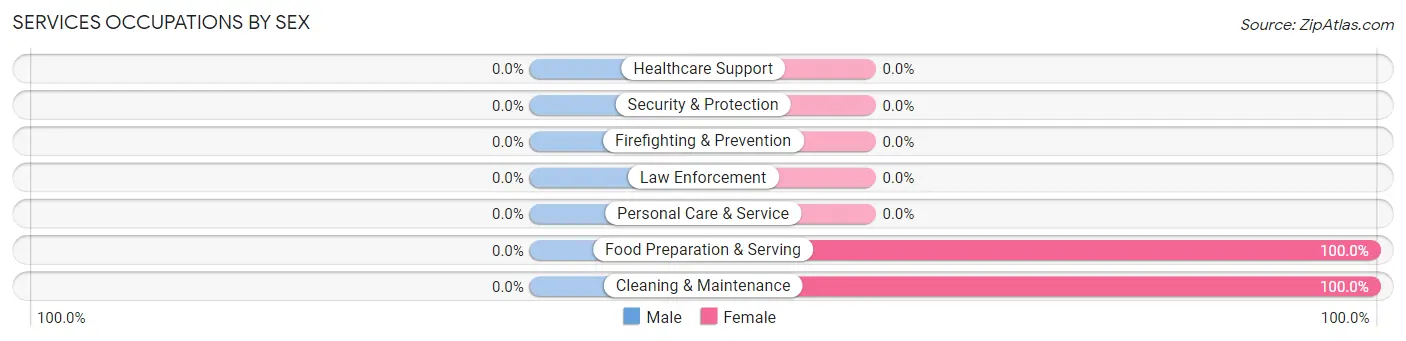
| Occupation | Male | Female |
| Healthcare Support | 0 (0.0%) | 0 (0.0%) |
| Security & Protection | 0 (0.0%) | 0 (0.0%) |
| Firefighting & Prevention | 0 (0.0%) | 0 (0.0%) |
| Law Enforcement | 0 (0.0%) | 0 (0.0%) |
| Food Preparation & Serving | 0 (0.0%) | 7 (100.0%) |
| Cleaning & Maintenance | 0 (0.0%) | 4 (100.0%) |
| Personal Care & Service | 0 (0.0%) | 0 (0.0%) |
| Total (Category) | 0 (0.0%) | 11 (100.0%) |
| Total (Overall) | 37 (68.5%) | 17 (31.5%) |
Sales and Office Occupations
The most common Sales and Office occupations in Junction are , and Sales & Related (1 | 1.8%).
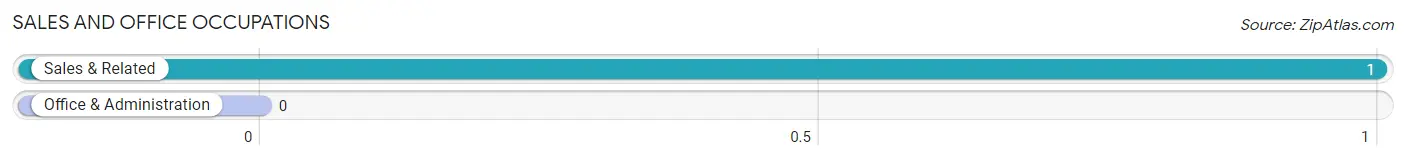
Sales and Office Occupations by Sex

| Occupation | Male | Female |
| Sales & Related | 0 (0.0%) | 1 (100.0%) |
| Office & Administration | 0 (0.0%) | 0 (0.0%) |
| Total (Category) | 0 (0.0%) | 1 (100.0%) |
| Total (Overall) | 37 (68.5%) | 17 (31.5%) |
Natural Resources, Construction and Maintenance Occupations
The most common Natural Resources, Construction and Maintenance occupations in Junction are Farming, Fishing & Forestry (5 | 9.3%), and Construction & Extraction (4 | 7.4%).
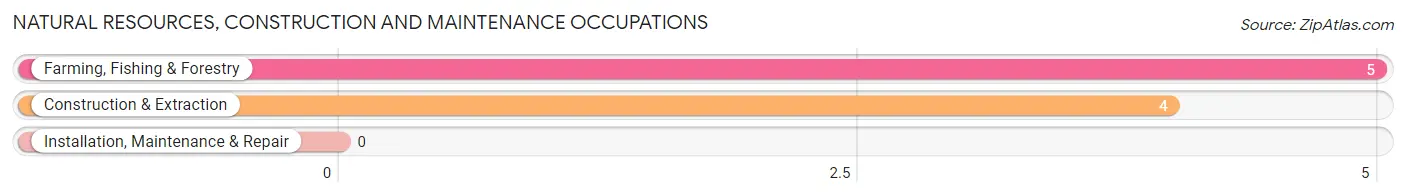
Natural Resources, Construction and Maintenance Occupations by Sex
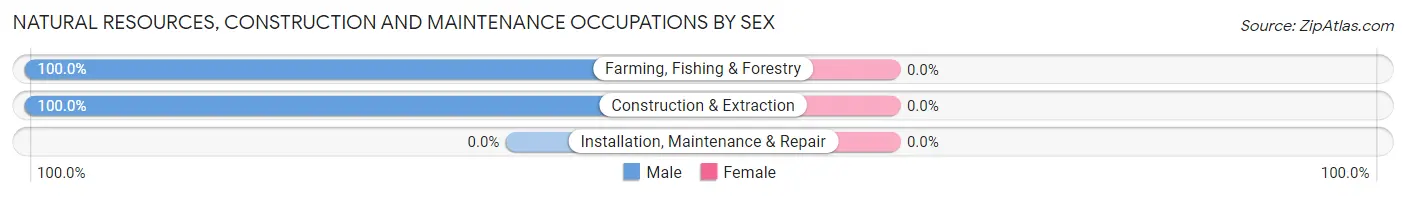
| Occupation | Male | Female |
| Farming, Fishing & Forestry | 5 (100.0%) | 0 (0.0%) |
| Construction & Extraction | 4 (100.0%) | 0 (0.0%) |
| Installation, Maintenance & Repair | 0 (0.0%) | 0 (0.0%) |
| Total (Category) | 9 (100.0%) | 0 (0.0%) |
| Total (Overall) | 37 (68.5%) | 17 (31.5%) |
Production, Transportation and Moving Occupations
The most common Production, Transportation and Moving occupations in Junction are Transportation (17 | 31.5%), and Material Moving (4 | 7.4%).
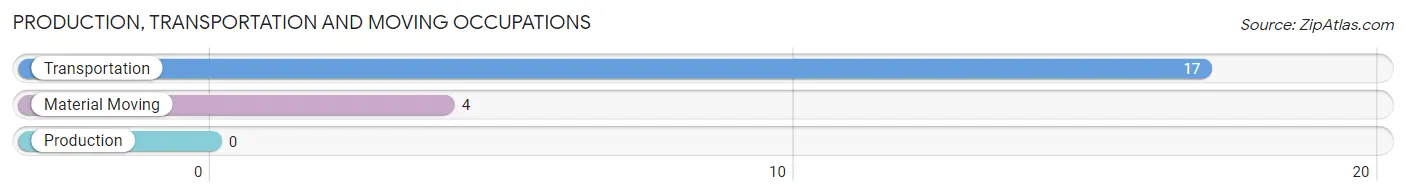
Production, Transportation and Moving Occupations by Sex
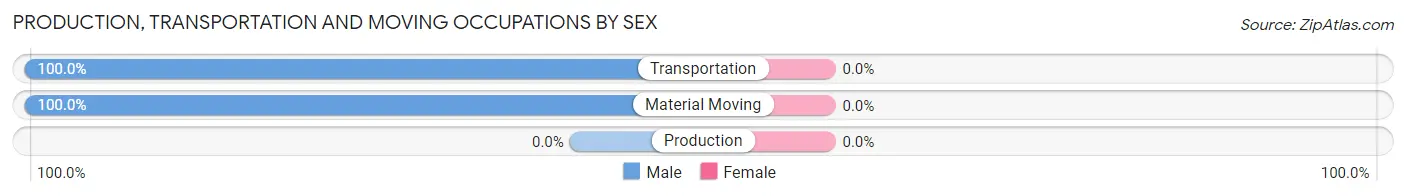
| Occupation | Male | Female |
| Production | 0 (0.0%) | 0 (0.0%) |
| Transportation | 17 (100.0%) | 0 (0.0%) |
| Material Moving | 4 (100.0%) | 0 (0.0%) |
| Total (Category) | 21 (100.0%) | 0 (0.0%) |
| Total (Overall) | 37 (68.5%) | 17 (31.5%) |
Employment Industries by Sex in Junction
Employment Industries in Junction
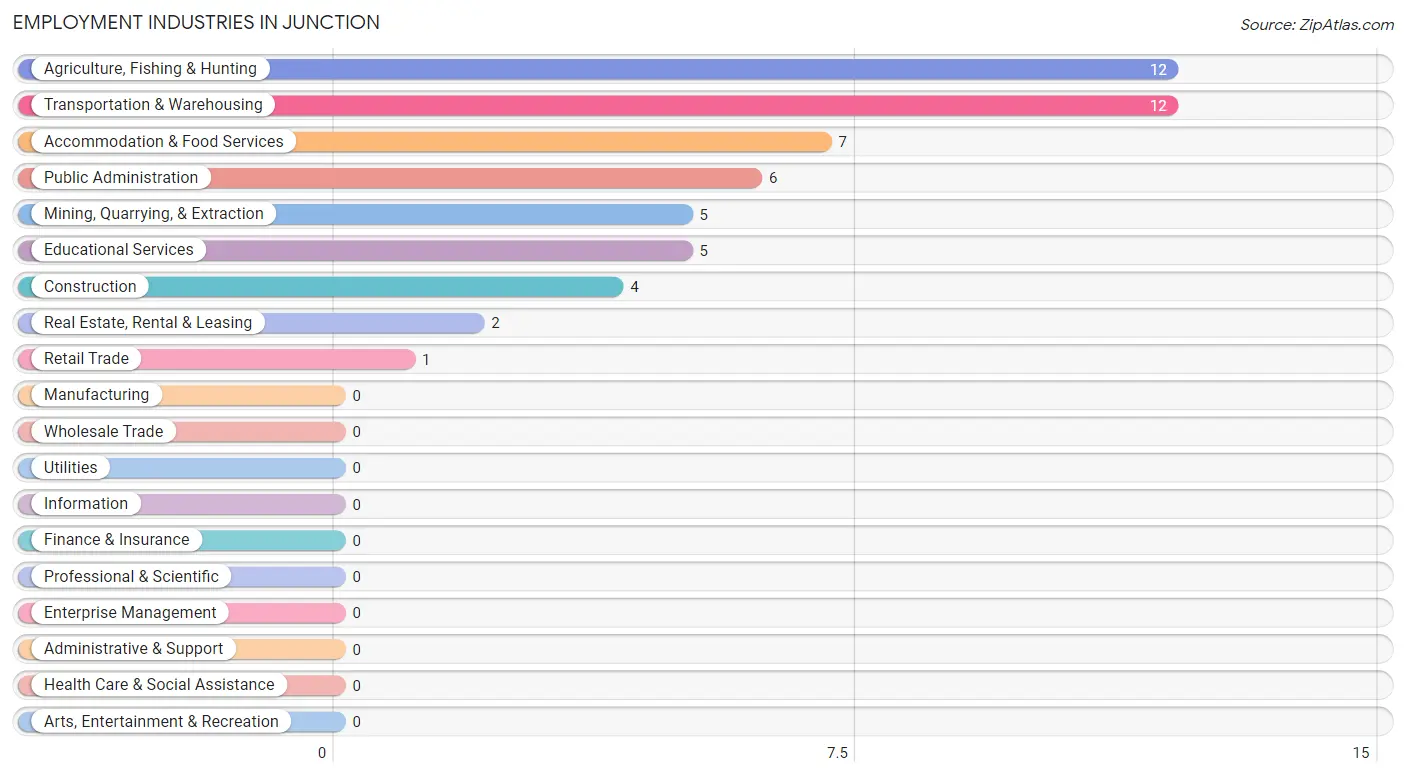
The major employment industries in Junction include Agriculture, Fishing & Hunting (12 | 22.2%), Transportation & Warehousing (12 | 22.2%), Accommodation & Food Services (7 | 13.0%), Public Administration (6 | 11.1%), and Mining, Quarrying, & Extraction (5 | 9.3%).
Employment Industries by Sex in Junction
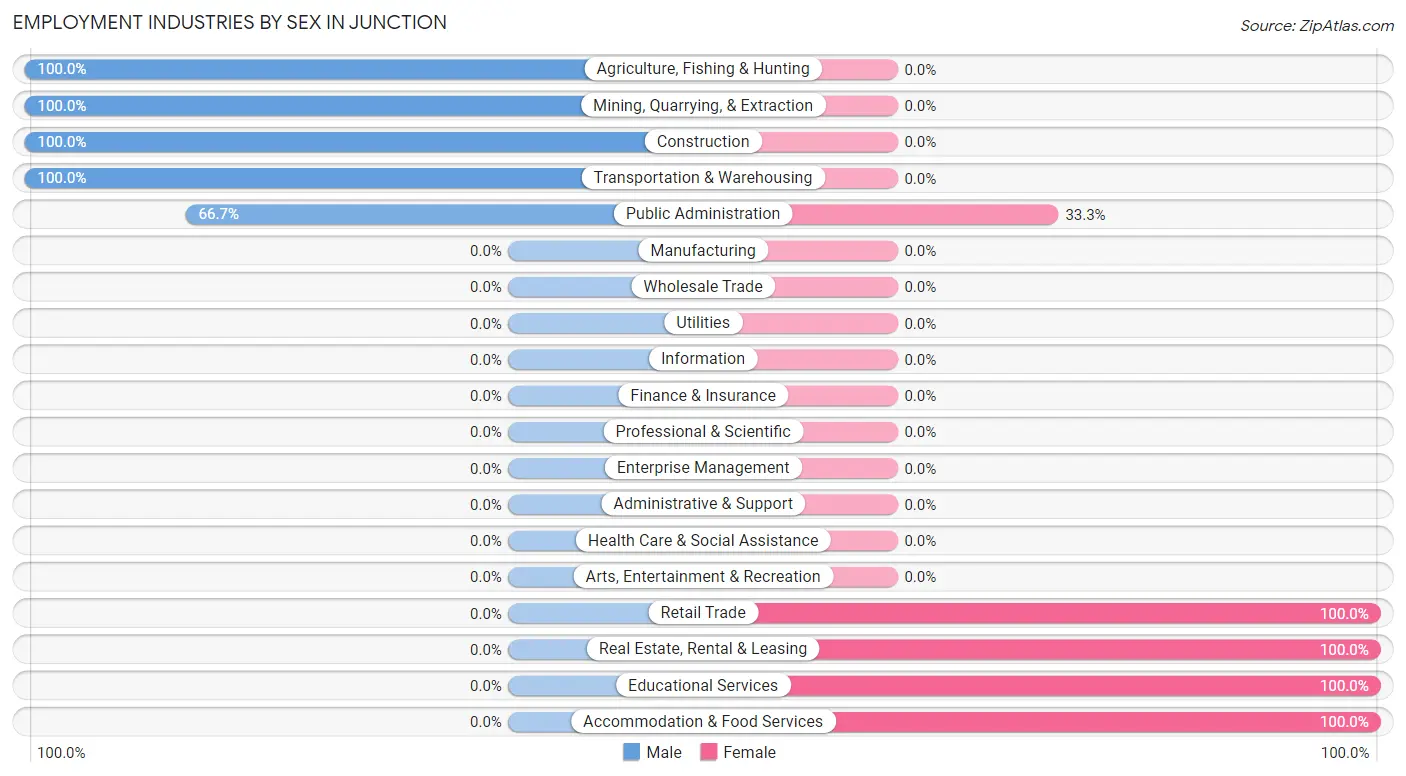
The Junction industries that see more men than women are Agriculture, Fishing & Hunting (100.0%), Mining, Quarrying, & Extraction (100.0%), and Construction (100.0%), whereas the industries that tend to have a higher number of women are Retail Trade (100.0%), Real Estate, Rental & Leasing (100.0%), and Educational Services (100.0%).
| Industry | Male | Female |
| Agriculture, Fishing & Hunting | 12 (100.0%) | 0 (0.0%) |
| Mining, Quarrying, & Extraction | 5 (100.0%) | 0 (0.0%) |
| Construction | 4 (100.0%) | 0 (0.0%) |
| Manufacturing | 0 (0.0%) | 0 (0.0%) |
| Wholesale Trade | 0 (0.0%) | 0 (0.0%) |
| Retail Trade | 0 (0.0%) | 1 (100.0%) |
| Transportation & Warehousing | 12 (100.0%) | 0 (0.0%) |
| Utilities | 0 (0.0%) | 0 (0.0%) |
| Information | 0 (0.0%) | 0 (0.0%) |
| Finance & Insurance | 0 (0.0%) | 0 (0.0%) |
| Real Estate, Rental & Leasing | 0 (0.0%) | 2 (100.0%) |
| Professional & Scientific | 0 (0.0%) | 0 (0.0%) |
| Enterprise Management | 0 (0.0%) | 0 (0.0%) |
| Administrative & Support | 0 (0.0%) | 0 (0.0%) |
| Educational Services | 0 (0.0%) | 5 (100.0%) |
| Health Care & Social Assistance | 0 (0.0%) | 0 (0.0%) |
| Arts, Entertainment & Recreation | 0 (0.0%) | 0 (0.0%) |
| Accommodation & Food Services | 0 (0.0%) | 7 (100.0%) |
| Public Administration | 4 (66.7%) | 2 (33.3%) |
| Total | 37 (68.5%) | 17 (31.5%) |
Education in Junction
School Enrollment in Junction
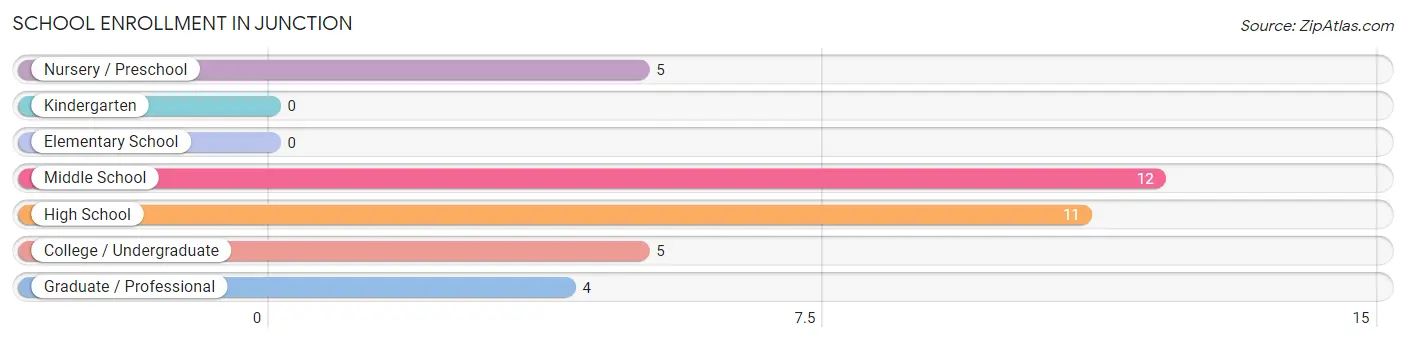
The most common levels of schooling among the 37 students in Junction are middle school (12 | 32.4%), high school (11 | 29.7%), and nursery / preschool (5 | 13.5%).
| School Level | # Students | % Students |
| Nursery / Preschool | 5 | 13.5% |
| Kindergarten | 0 | 0.0% |
| Elementary School | 0 | 0.0% |
| Middle School | 12 | 32.4% |
| High School | 11 | 29.7% |
| College / Undergraduate | 5 | 13.5% |
| Graduate / Professional | 4 | 10.8% |
| Total | 37 | 100.0% |
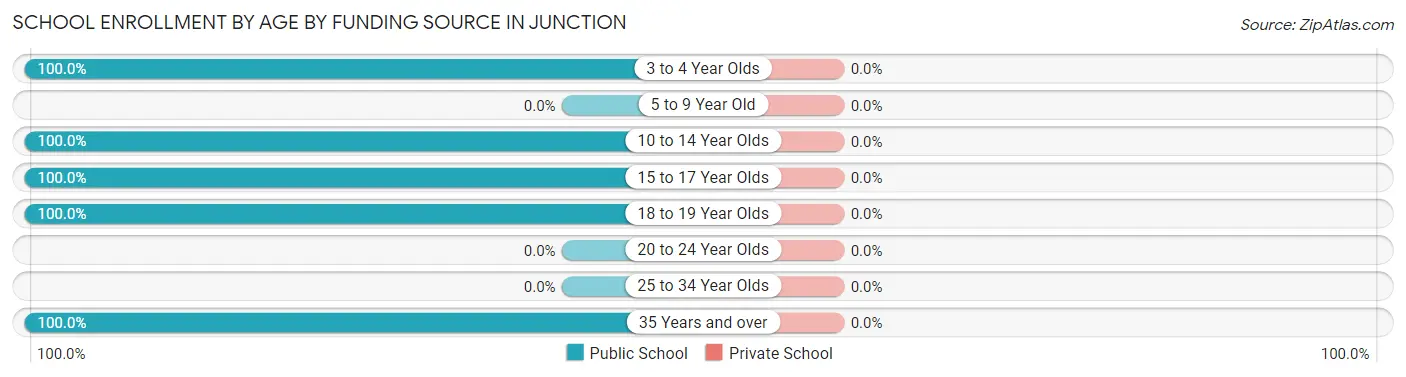
School Enrollment by Age by Funding Source in Junction
| Age Bracket | Public School | Private School |
| 3 to 4 Year Olds | 5 (100.0%) | 0 (0.0%) |
| 5 to 9 Year Old | 0 (0.0%) | 0 (0.0%) |
| 10 to 14 Year Olds | 12 (100.0%) | 0 (0.0%) |
| 15 to 17 Year Olds | 7 (100.0%) | 0 (0.0%) |
| 18 to 19 Year Olds | 9 (100.0%) | 0 (0.0%) |
| 20 to 24 Year Olds | 0 (0.0%) | 0 (0.0%) |
| 25 to 34 Year Olds | 0 (0.0%) | 0 (0.0%) |
| 35 Years and over | 4 (100.0%) | 0 (0.0%) |
| Total | 37 (100.0%) | 0 (0.0%) |
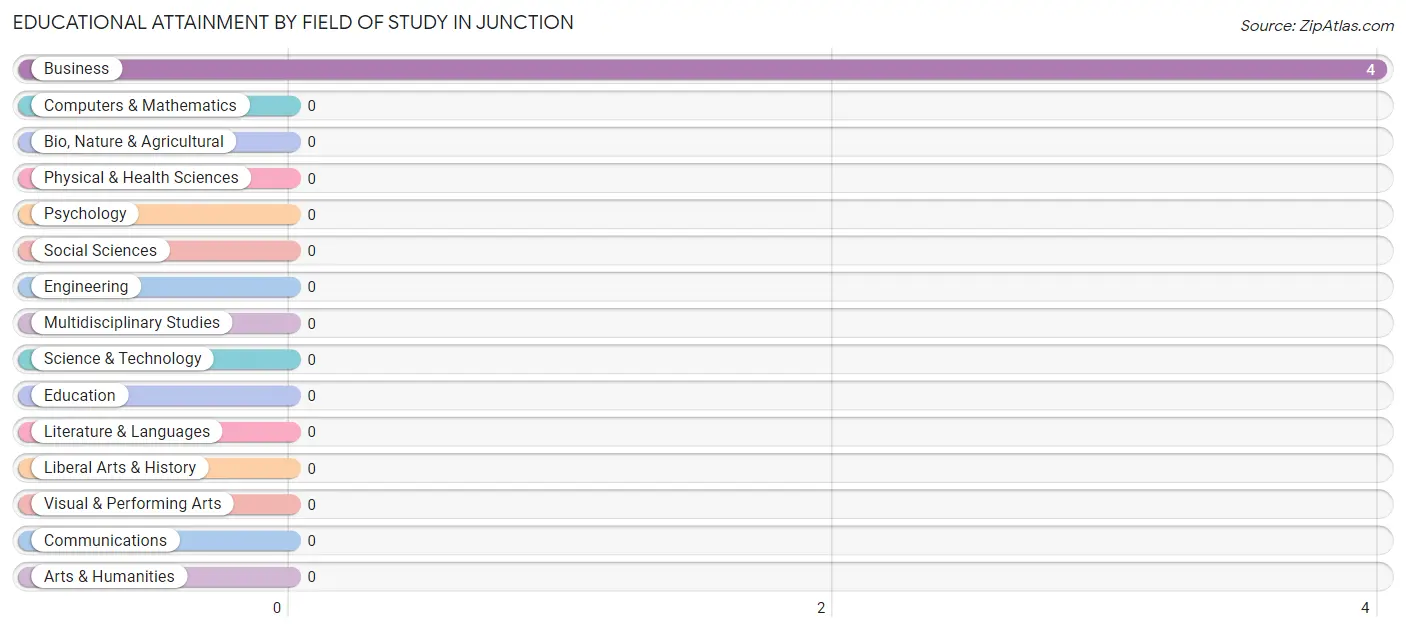
Educational Attainment by Field of Study in Junction
, and business (4 | 100.0%) are the most common fields of study among 4 individuals in Junction who have obtained a bachelor's degree or higher.
| Field of Study | # Graduates | % Graduates |
| Computers & Mathematics | 0 | 0.0% |
| Bio, Nature & Agricultural | 0 | 0.0% |
| Physical & Health Sciences | 0 | 0.0% |
| Psychology | 0 | 0.0% |
| Social Sciences | 0 | 0.0% |
| Engineering | 0 | 0.0% |
| Multidisciplinary Studies | 0 | 0.0% |
| Science & Technology | 0 | 0.0% |
| Business | 4 | 100.0% |
| Education | 0 | 0.0% |
| Literature & Languages | 0 | 0.0% |
| Liberal Arts & History | 0 | 0.0% |
| Visual & Performing Arts | 0 | 0.0% |
| Communications | 0 | 0.0% |
| Arts & Humanities | 0 | 0.0% |
| Total | 4 | 100.0% |
Transportation & Commute in Junction
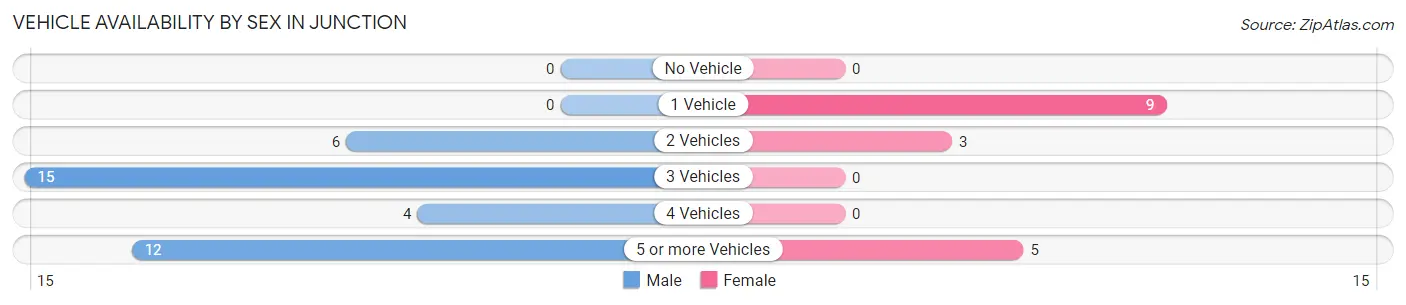
Vehicle Availability by Sex in Junction
The most prevalent vehicle ownership categories in Junction are males with 3 vehicles (15, accounting for 40.5%) and females with 3 vehicles (0, making up 88.2%).
| Vehicles Available | Male | Female |
| No Vehicle | 0 (0.0%) | 0 (0.0%) |
| 1 Vehicle | 0 (0.0%) | 9 (52.9%) |
| 2 Vehicles | 6 (16.2%) | 3 (17.6%) |
| 3 Vehicles | 15 (40.5%) | 0 (0.0%) |
| 4 Vehicles | 4 (10.8%) | 0 (0.0%) |
| 5 or more Vehicles | 12 (32.4%) | 5 (29.4%) |
| Total | 37 (100.0%) | 17 (100.0%) |
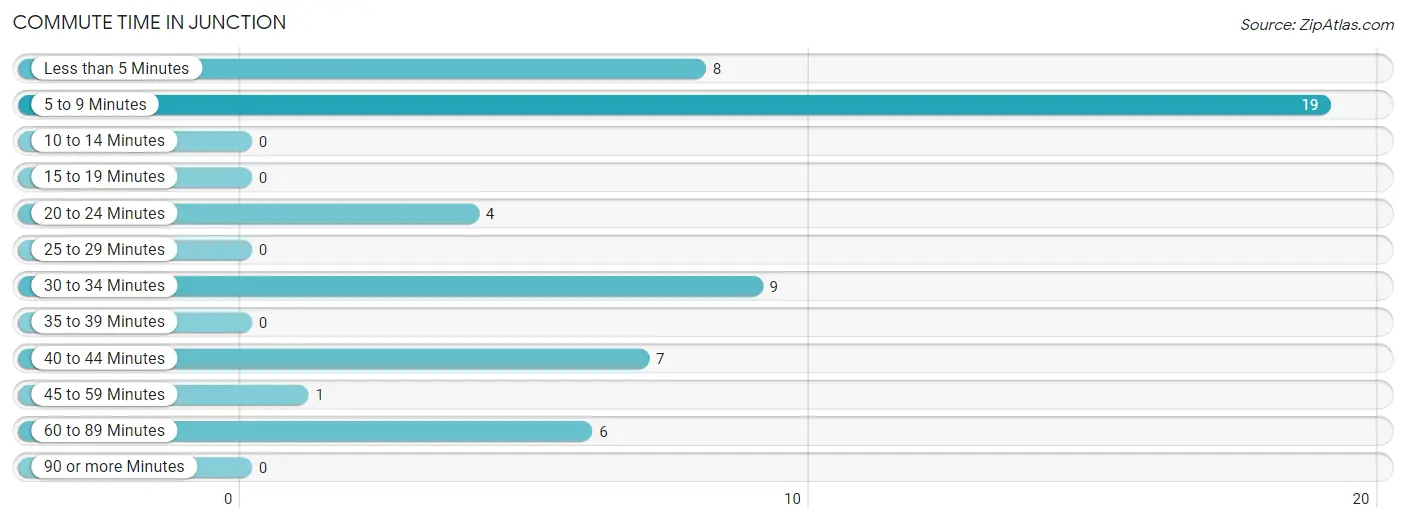
Commute Time in Junction
The most frequently occuring commute durations in Junction are 5 to 9 minutes (19 commuters, 35.2%), 30 to 34 minutes (9 commuters, 16.7%), and less than 5 minutes (8 commuters, 14.8%).
| Commute Time | # Commuters | % Commuters |
| Less than 5 Minutes | 8 | 14.8% |
| 5 to 9 Minutes | 19 | 35.2% |
| 10 to 14 Minutes | 0 | 0.0% |
| 15 to 19 Minutes | 0 | 0.0% |
| 20 to 24 Minutes | 4 | 7.4% |
| 25 to 29 Minutes | 0 | 0.0% |
| 30 to 34 Minutes | 9 | 16.7% |
| 35 to 39 Minutes | 0 | 0.0% |
| 40 to 44 Minutes | 7 | 13.0% |
| 45 to 59 Minutes | 1 | 1.8% |
| 60 to 89 Minutes | 6 | 11.1% |
| 90 or more Minutes | 0 | 0.0% |
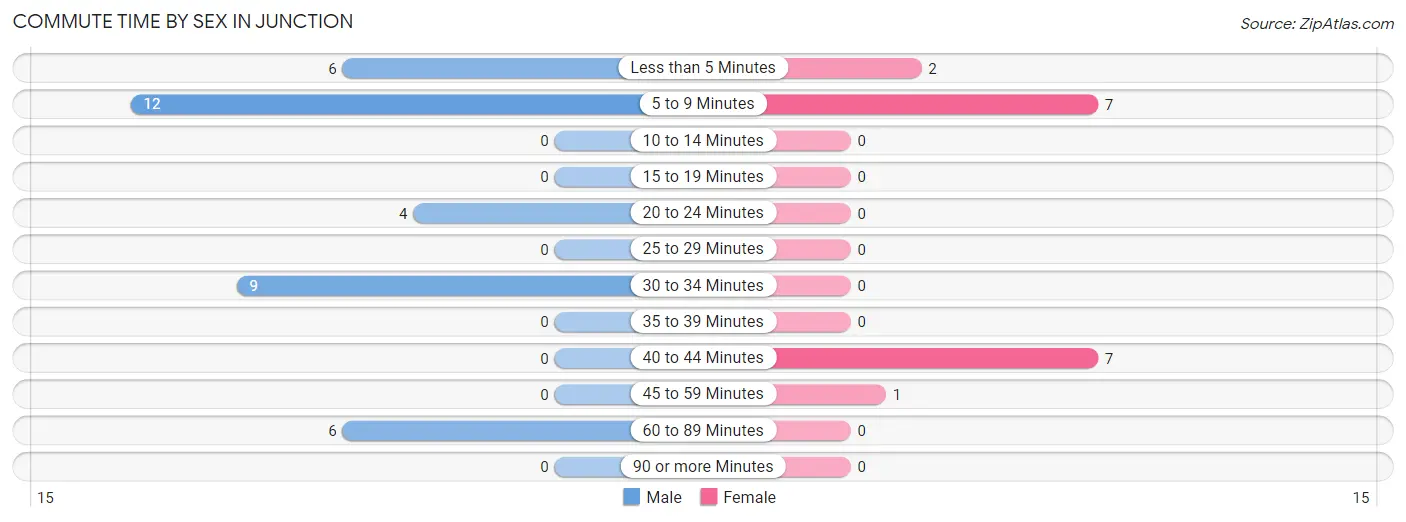
Commute Time by Sex in Junction
The most common commute times in Junction are 5 to 9 minutes (12 commuters, 32.4%) for males and 5 to 9 minutes (7 commuters, 41.2%) for females.
| Commute Time | Male | Female |
| Less than 5 Minutes | 6 (16.2%) | 2 (11.8%) |
| 5 to 9 Minutes | 12 (32.4%) | 7 (41.2%) |
| 10 to 14 Minutes | 0 (0.0%) | 0 (0.0%) |
| 15 to 19 Minutes | 0 (0.0%) | 0 (0.0%) |
| 20 to 24 Minutes | 4 (10.8%) | 0 (0.0%) |
| 25 to 29 Minutes | 0 (0.0%) | 0 (0.0%) |
| 30 to 34 Minutes | 9 (24.3%) | 0 (0.0%) |
| 35 to 39 Minutes | 0 (0.0%) | 0 (0.0%) |
| 40 to 44 Minutes | 0 (0.0%) | 7 (41.2%) |
| 45 to 59 Minutes | 0 (0.0%) | 1 (5.9%) |
| 60 to 89 Minutes | 6 (16.2%) | 0 (0.0%) |
| 90 or more Minutes | 0 (0.0%) | 0 (0.0%) |
Time of Departure to Work by Sex in Junction
The most frequent times of departure to work in Junction are 12:00 PM to 3:59 PM (8, 21.6%) for males and 10:00 AM to 10:59 AM (7, 41.2%) for females.
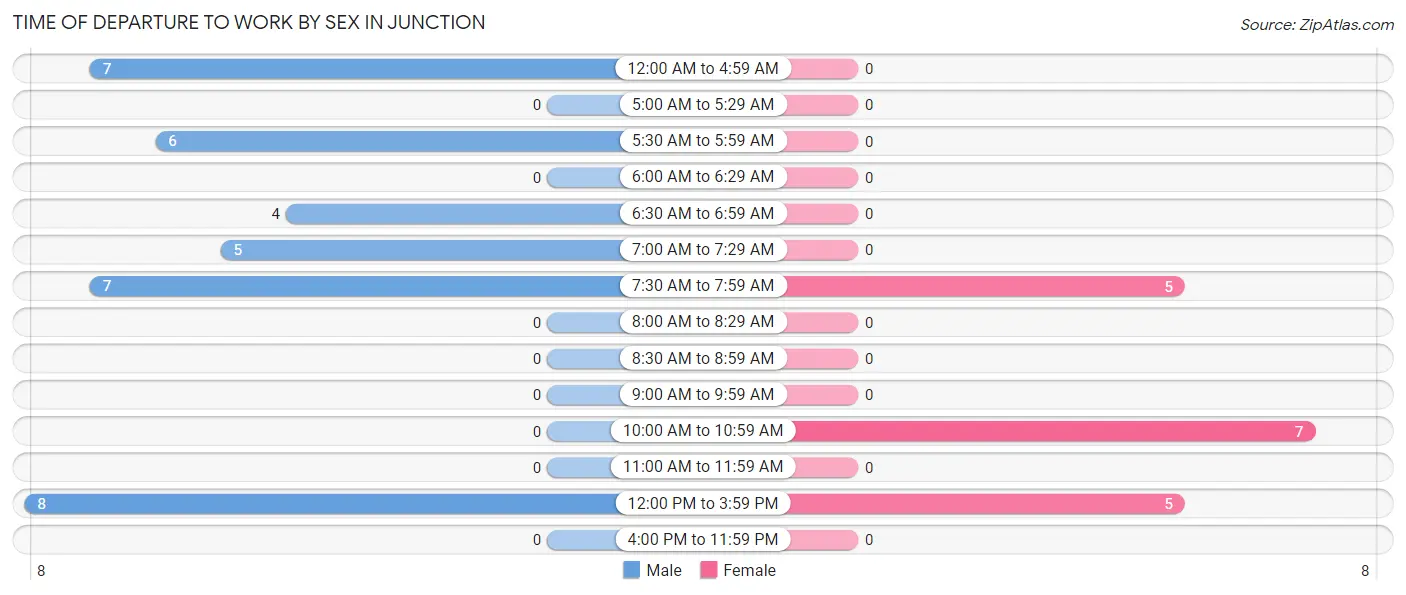
| Time of Departure | Male | Female |
| 12:00 AM to 4:59 AM | 7 (18.9%) | 0 (0.0%) |
| 5:00 AM to 5:29 AM | 0 (0.0%) | 0 (0.0%) |
| 5:30 AM to 5:59 AM | 6 (16.2%) | 0 (0.0%) |
| 6:00 AM to 6:29 AM | 0 (0.0%) | 0 (0.0%) |
| 6:30 AM to 6:59 AM | 4 (10.8%) | 0 (0.0%) |
| 7:00 AM to 7:29 AM | 5 (13.5%) | 0 (0.0%) |
| 7:30 AM to 7:59 AM | 7 (18.9%) | 5 (29.4%) |
| 8:00 AM to 8:29 AM | 0 (0.0%) | 0 (0.0%) |
| 8:30 AM to 8:59 AM | 0 (0.0%) | 0 (0.0%) |
| 9:00 AM to 9:59 AM | 0 (0.0%) | 0 (0.0%) |
| 10:00 AM to 10:59 AM | 0 (0.0%) | 7 (41.2%) |
| 11:00 AM to 11:59 AM | 0 (0.0%) | 0 (0.0%) |
| 12:00 PM to 3:59 PM | 8 (21.6%) | 5 (29.4%) |
| 4:00 PM to 11:59 PM | 0 (0.0%) | 0 (0.0%) |
| Total | 37 (100.0%) | 17 (100.0%) |
Housing Occupancy in Junction
Occupancy by Ownership in Junction
Of the total 101 dwellings in Junction, owner-occupied units account for 96 (95.1%), while renter-occupied units make up 5 (5.0%).
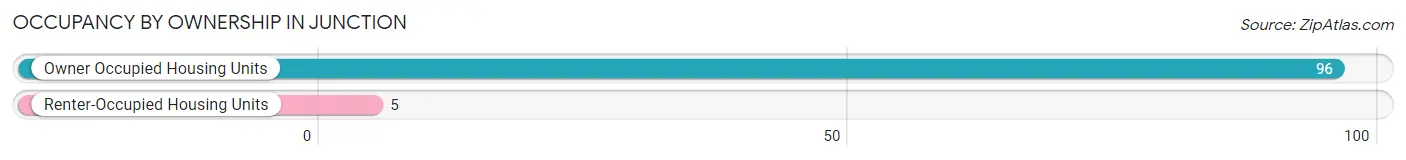
| Occupancy | # Housing Units | % Housing Units |
| Owner Occupied Housing Units | 96 | 95.1% |
| Renter-Occupied Housing Units | 5 | 5.0% |
| Total Occupied Housing Units | 101 | 100.0% |
Occupancy by Household Size in Junction
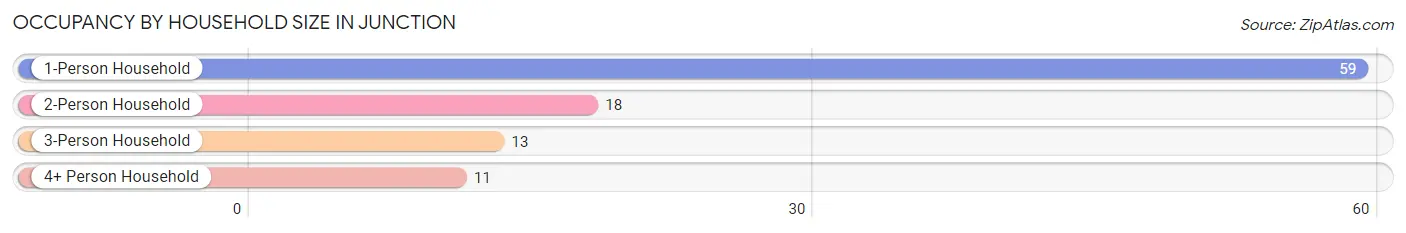
| Household Size | # Housing Units | % Housing Units |
| 1-Person Household | 59 | 58.4% |
| 2-Person Household | 18 | 17.8% |
| 3-Person Household | 13 | 12.9% |
| 4+ Person Household | 11 | 10.9% |
| Total Housing Units | 101 | 100.0% |
Occupancy by Ownership by Household Size in Junction
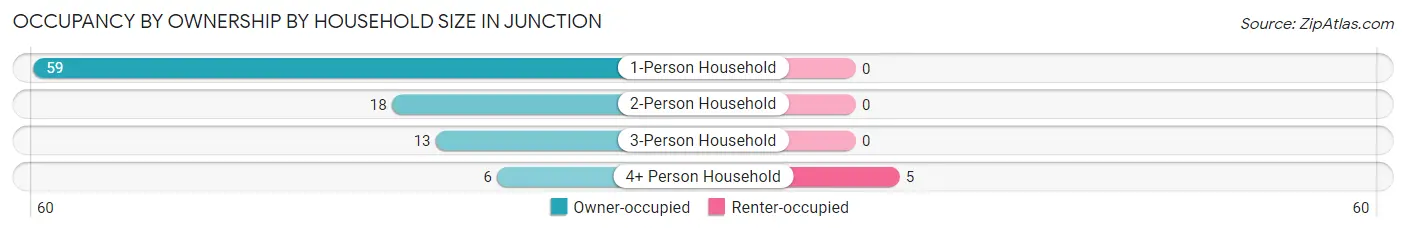
| Household Size | Owner-occupied | Renter-occupied |
| 1-Person Household | 59 (100.0%) | 0 (0.0%) |
| 2-Person Household | 18 (100.0%) | 0 (0.0%) |
| 3-Person Household | 13 (100.0%) | 0 (0.0%) |
| 4+ Person Household | 6 (54.5%) | 5 (45.5%) |
| Total Housing Units | 96 (95.1%) | 5 (5.0%) |
Occupancy by Educational Attainment in Junction
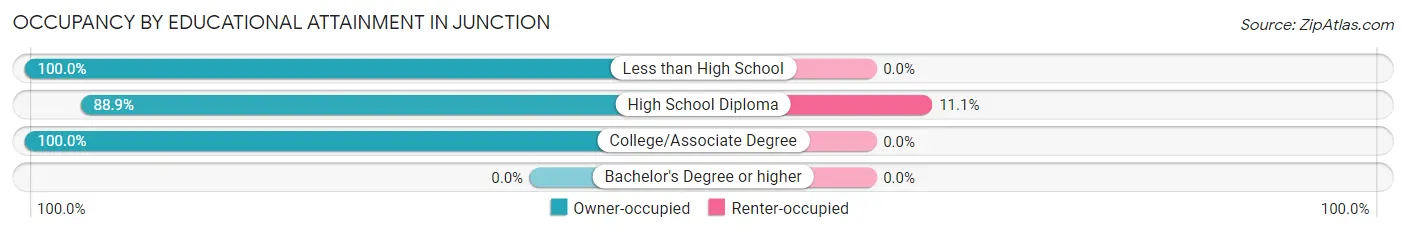
| Household Size | Owner-occupied | Renter-occupied |
| Less than High School | 4 (100.0%) | 0 (0.0%) |
| High School Diploma | 40 (88.9%) | 5 (11.1%) |
| College/Associate Degree | 52 (100.0%) | 0 (0.0%) |
| Bachelor's Degree or higher | 0 (0.0%) | 0 (0.0%) |
Occupancy by Age of Householder in Junction
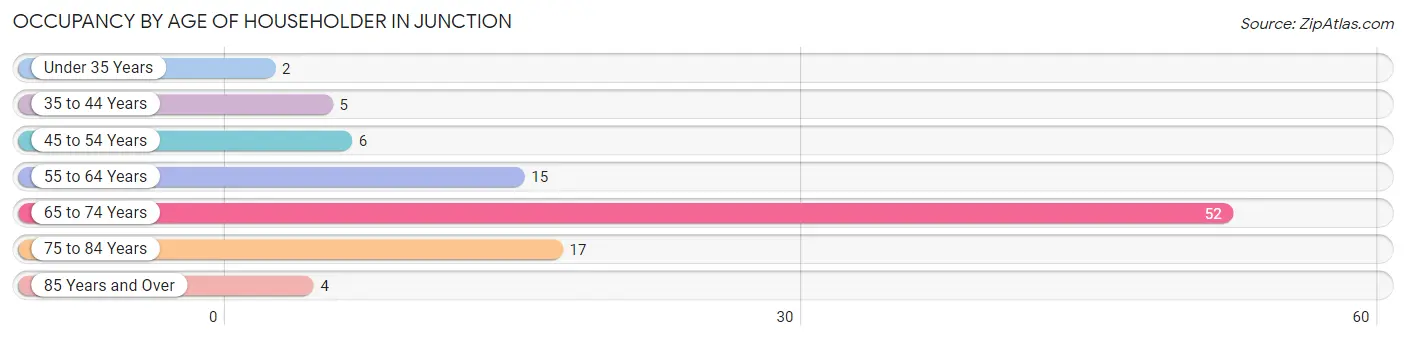
| Age Bracket | # Households | % Households |
| Under 35 Years | 2 | 2.0% |
| 35 to 44 Years | 5 | 5.0% |
| 45 to 54 Years | 6 | 5.9% |
| 55 to 64 Years | 15 | 14.8% |
| 65 to 74 Years | 52 | 51.5% |
| 75 to 84 Years | 17 | 16.8% |
| 85 Years and Over | 4 | 4.0% |
| Total | 101 | 100.0% |
Housing Finances in Junction
Median Income by Occupancy in Junction
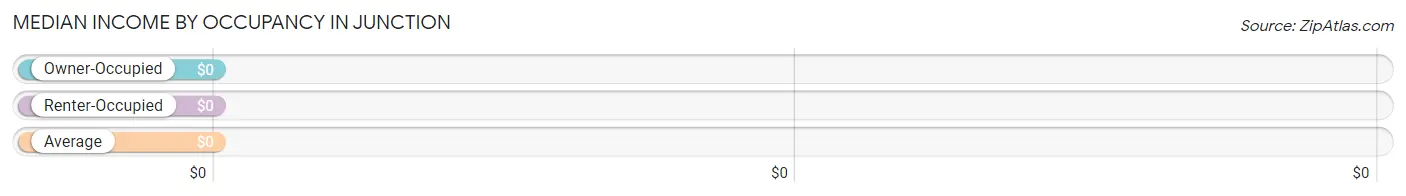
| Occupancy Type | # Households | Median Income |
| Owner-Occupied | 96 (95.1%) | $0 |
| Renter-Occupied | 5 (5.0%) | $0 |
| Average | 101 (100.0%) | $0 |
Occupancy by Householder Income Bracket in Junction
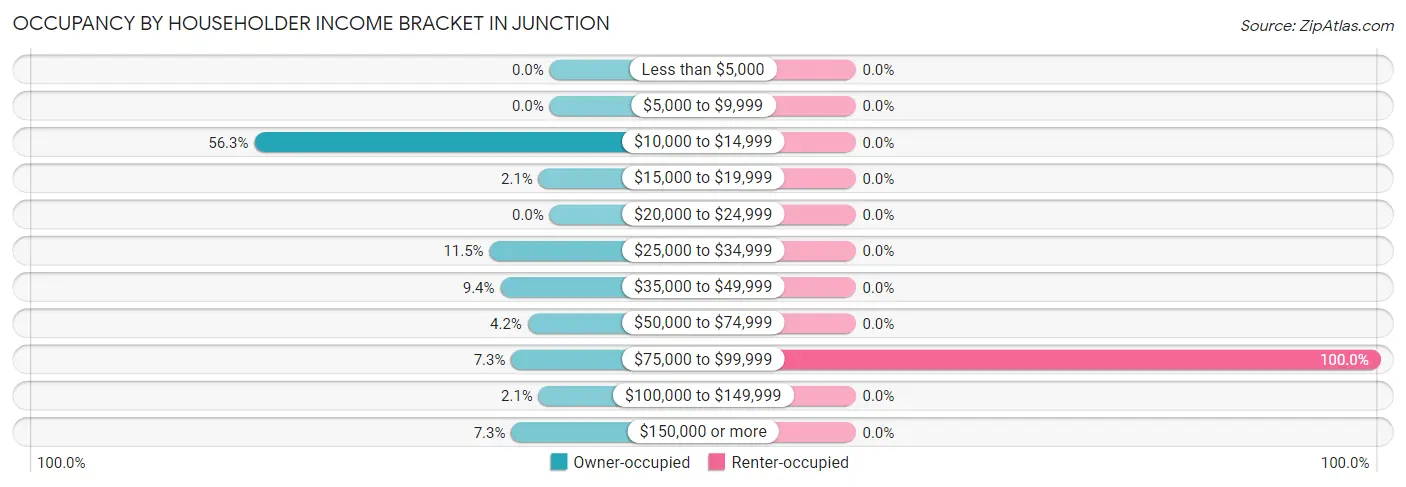
| Income Bracket | Owner-occupied | Renter-occupied |
| Less than $5,000 | 0 (0.0%) | 0 (0.0%) |
| $5,000 to $9,999 | 0 (0.0%) | 0 (0.0%) |
| $10,000 to $14,999 | 54 (56.2%) | 0 (0.0%) |
| $15,000 to $19,999 | 2 (2.1%) | 0 (0.0%) |
| $20,000 to $24,999 | 0 (0.0%) | 0 (0.0%) |
| $25,000 to $34,999 | 11 (11.5%) | 0 (0.0%) |
| $35,000 to $49,999 | 9 (9.4%) | 0 (0.0%) |
| $50,000 to $74,999 | 4 (4.2%) | 0 (0.0%) |
| $75,000 to $99,999 | 7 (7.3%) | 5 (100.0%) |
| $100,000 to $149,999 | 2 (2.1%) | 0 (0.0%) |
| $150,000 or more | 7 (7.3%) | 0 (0.0%) |
| Total | 96 (100.0%) | 5 (100.0%) |
Monthly Housing Cost Tiers in Junction

| Monthly Cost | Owner-occupied | Renter-occupied |
| Less than $300 | 60 (62.5%) | 0 (0.0%) |
| $300 to $499 | 6 (6.2%) | 0 (0.0%) |
| $500 to $799 | 15 (15.6%) | 0 (0.0%) |
| $800 to $999 | 6 (6.2%) | 5 (100.0%) |
| $1,000 to $1,499 | 9 (9.4%) | 0 (0.0%) |
| $1,500 to $1,999 | 0 (0.0%) | 0 (0.0%) |
| $2,000 to $2,499 | 0 (0.0%) | 0 (0.0%) |
| $2,500 to $2,999 | 0 (0.0%) | 0 (0.0%) |
| $3,000 or more | 0 (0.0%) | 0 (0.0%) |
| Total | 96 (100.0%) | 5 (100.0%) |
Physical Housing Characteristics in Junction
Housing Structures in Junction
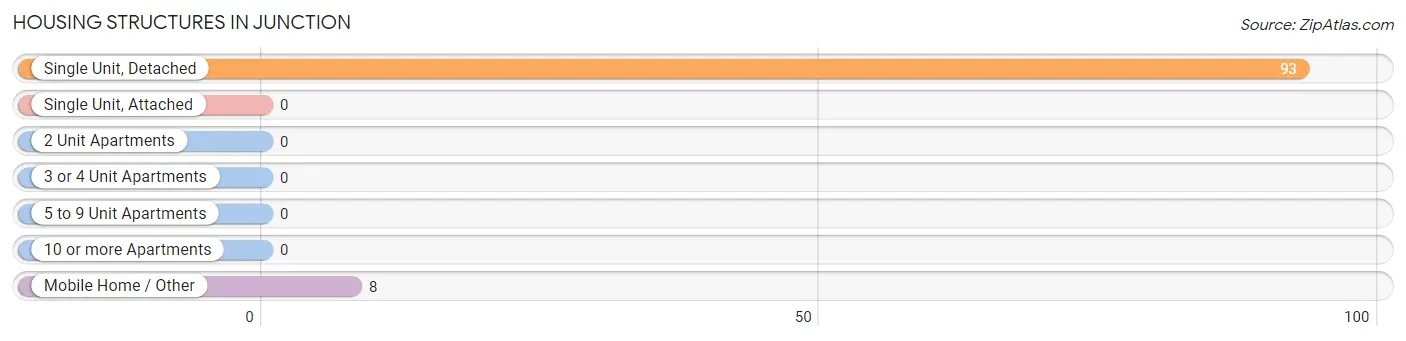
| Structure Type | # Housing Units | % Housing Units |
| Single Unit, Detached | 93 | 92.1% |
| Single Unit, Attached | 0 | 0.0% |
| 2 Unit Apartments | 0 | 0.0% |
| 3 or 4 Unit Apartments | 0 | 0.0% |
| 5 to 9 Unit Apartments | 0 | 0.0% |
| 10 or more Apartments | 0 | 0.0% |
| Mobile Home / Other | 8 | 7.9% |
| Total | 101 | 100.0% |
Housing Structures by Occupancy in Junction
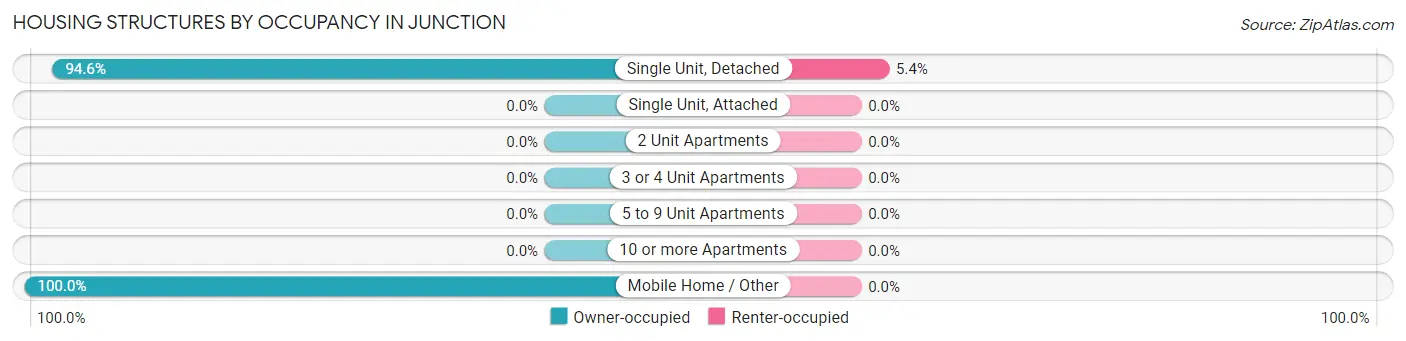
| Structure Type | Owner-occupied | Renter-occupied |
| Single Unit, Detached | 88 (94.6%) | 5 (5.4%) |
| Single Unit, Attached | 0 (0.0%) | 0 (0.0%) |
| 2 Unit Apartments | 0 (0.0%) | 0 (0.0%) |
| 3 or 4 Unit Apartments | 0 (0.0%) | 0 (0.0%) |
| 5 to 9 Unit Apartments | 0 (0.0%) | 0 (0.0%) |
| 10 or more Apartments | 0 (0.0%) | 0 (0.0%) |
| Mobile Home / Other | 8 (100.0%) | 0 (0.0%) |
| Total | 96 (95.1%) | 5 (5.0%) |
Housing Structures by Number of Rooms in Junction
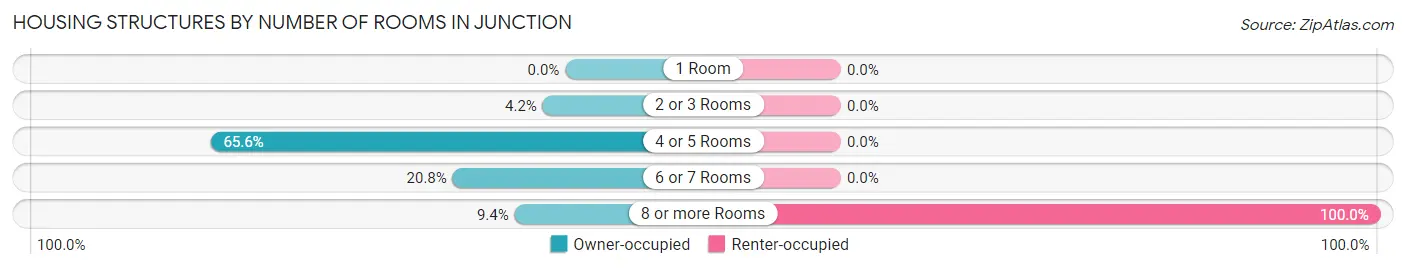
| Number of Rooms | Owner-occupied | Renter-occupied |
| 1 Room | 0 (0.0%) | 0 (0.0%) |
| 2 or 3 Rooms | 4 (4.2%) | 0 (0.0%) |
| 4 or 5 Rooms | 63 (65.6%) | 0 (0.0%) |
| 6 or 7 Rooms | 20 (20.8%) | 0 (0.0%) |
| 8 or more Rooms | 9 (9.4%) | 5 (100.0%) |
| Total | 96 (100.0%) | 5 (100.0%) |
Housing Structure by Heating Type in Junction
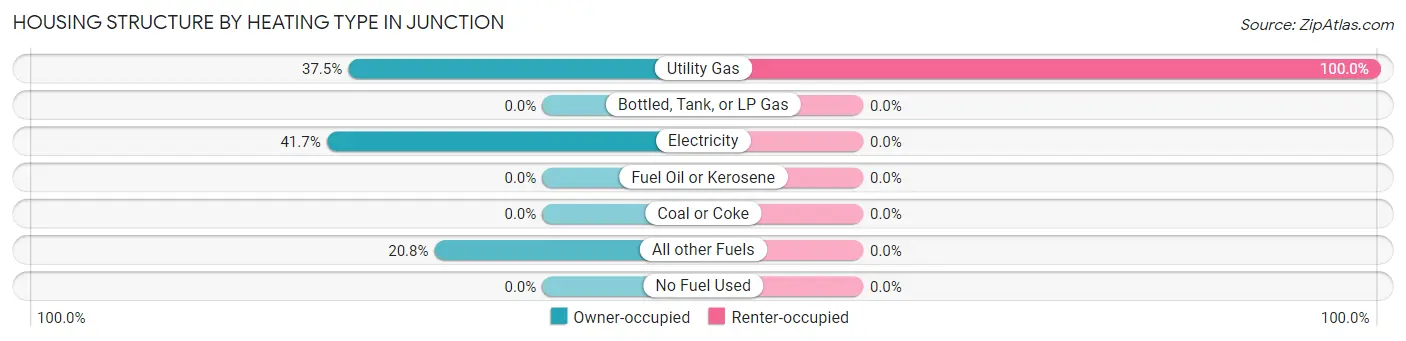
| Heating Type | Owner-occupied | Renter-occupied |
| Utility Gas | 36 (37.5%) | 5 (100.0%) |
| Bottled, Tank, or LP Gas | 0 (0.0%) | 0 (0.0%) |
| Electricity | 40 (41.7%) | 0 (0.0%) |
| Fuel Oil or Kerosene | 0 (0.0%) | 0 (0.0%) |
| Coal or Coke | 0 (0.0%) | 0 (0.0%) |
| All other Fuels | 20 (20.8%) | 0 (0.0%) |
| No Fuel Used | 0 (0.0%) | 0 (0.0%) |
| Total | 96 (100.0%) | 5 (100.0%) |
Household Vehicle Usage in Junction
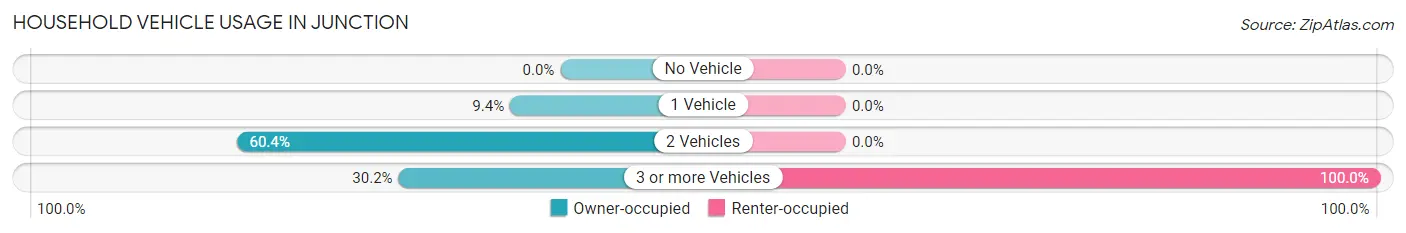
| Vehicles per Household | Owner-occupied | Renter-occupied |
| No Vehicle | 0 (0.0%) | 0 (0.0%) |
| 1 Vehicle | 9 (9.4%) | 0 (0.0%) |
| 2 Vehicles | 58 (60.4%) | 0 (0.0%) |
| 3 or more Vehicles | 29 (30.2%) | 5 (100.0%) |
| Total | 96 (100.0%) | 5 (100.0%) |
Real Estate & Mortgages in Junction
Real Estate and Mortgage Overview in Junction
| Characteristic | Without Mortgage | With Mortgage |
| Housing Units | 73 | 23 |
| Median Property Value | $159,400 | $0 |
| Median Household Income | - | - |
| Monthly Housing Costs | $239 | $0 |
| Real Estate Taxes | $833 | $0 |
Property Value by Mortgage Status in Junction
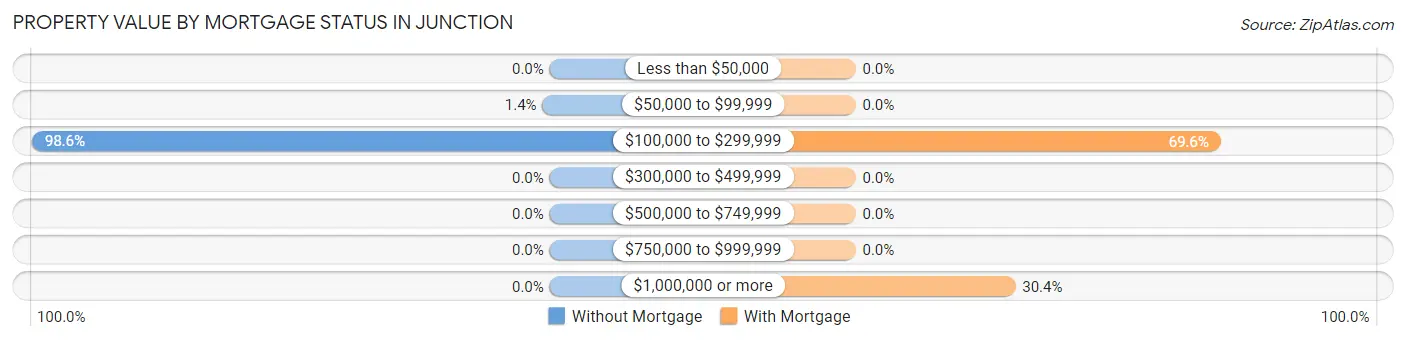
| Property Value | Without Mortgage | With Mortgage |
| Less than $50,000 | 0 (0.0%) | 0 (0.0%) |
| $50,000 to $99,999 | 1 (1.4%) | 0 (0.0%) |
| $100,000 to $299,999 | 72 (98.6%) | 16 (69.6%) |
| $300,000 to $499,999 | 0 (0.0%) | 0 (0.0%) |
| $500,000 to $749,999 | 0 (0.0%) | 0 (0.0%) |
| $750,000 to $999,999 | 0 (0.0%) | 0 (0.0%) |
| $1,000,000 or more | 0 (0.0%) | 7 (30.4%) |
| Total | 73 (100.0%) | 23 (100.0%) |
Household Income by Mortgage Status in Junction
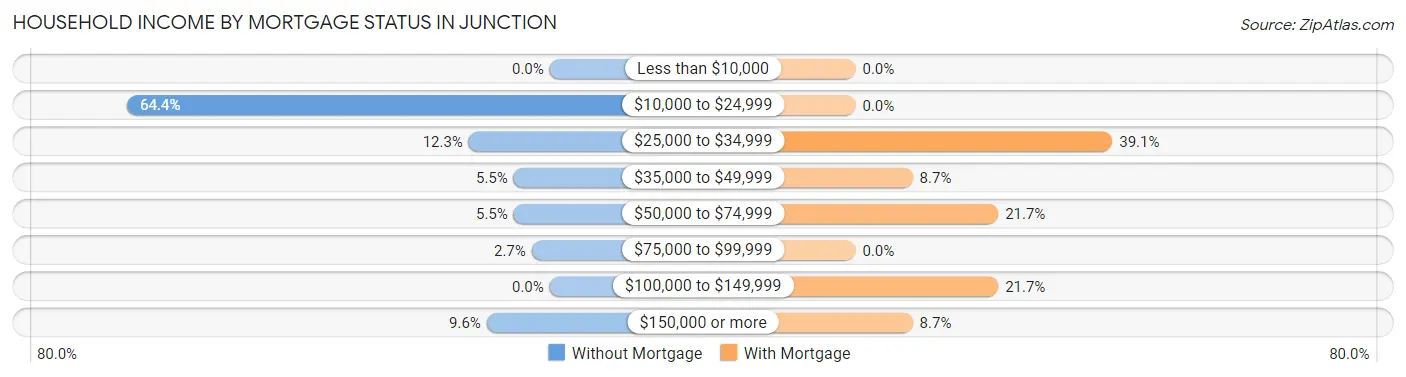
| Household Income | Without Mortgage | With Mortgage |
| Less than $10,000 | 0 (0.0%) | 0 (0.0%) |
| $10,000 to $24,999 | 47 (64.4%) | 0 (0.0%) |
| $25,000 to $34,999 | 9 (12.3%) | 9 (39.1%) |
| $35,000 to $49,999 | 4 (5.5%) | 2 (8.7%) |
| $50,000 to $74,999 | 4 (5.5%) | 5 (21.7%) |
| $75,000 to $99,999 | 2 (2.7%) | 0 (0.0%) |
| $100,000 to $149,999 | 0 (0.0%) | 5 (21.7%) |
| $150,000 or more | 7 (9.6%) | 2 (8.7%) |
| Total | 73 (100.0%) | 23 (100.0%) |
Property Value to Household Income Ratio in Junction
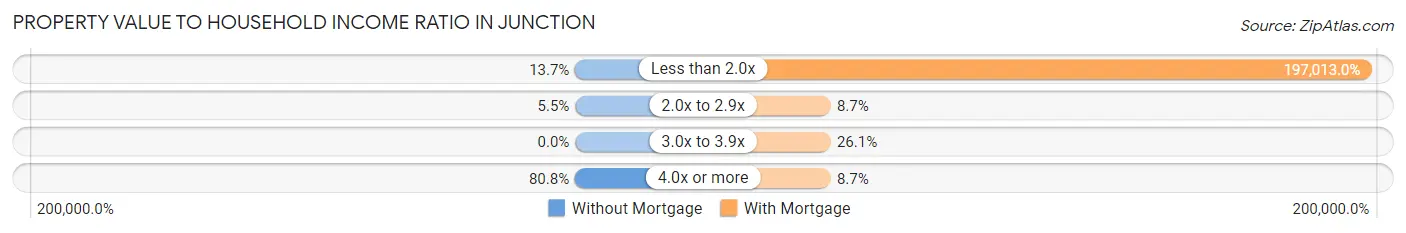
| Value-to-Income Ratio | Without Mortgage | With Mortgage |
| Less than 2.0x | 10 (13.7%) | 45,313 (197,013.0%) |
| 2.0x to 2.9x | 4 (5.5%) | 2 (8.7%) |
| 3.0x to 3.9x | 0 (0.0%) | 6 (26.1%) |
| 4.0x or more | 59 (80.8%) | 2 (8.7%) |
| Total | 73 (100.0%) | 23 (100.0%) |
Real Estate Taxes by Mortgage Status in Junction
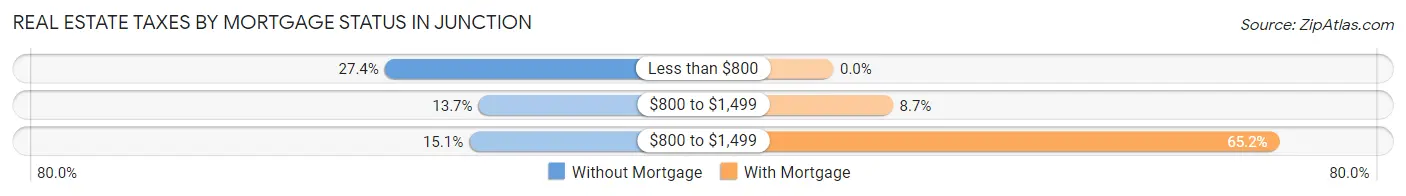
| Property Taxes | Without Mortgage | With Mortgage |
| Less than $800 | 20 (27.4%) | 0 (0.0%) |
| $800 to $1,499 | 10 (13.7%) | 2 (8.7%) |
| $800 to $1,499 | 11 (15.1%) | 15 (65.2%) |
| Total | 73 (100.0%) | 23 (100.0%) |
Health & Disability in Junction
Health Insurance Coverage by Age in Junction
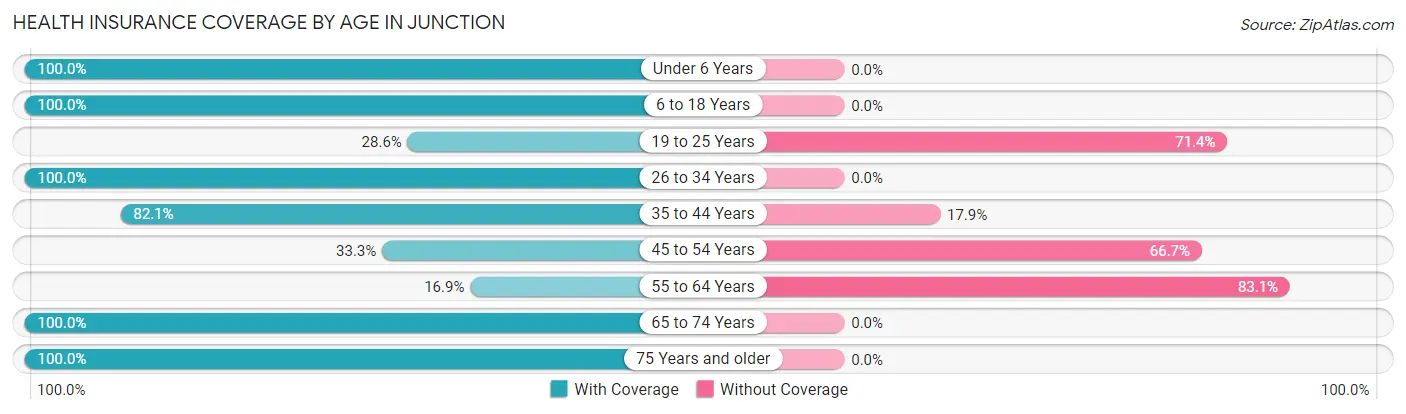
| Age Bracket | With Coverage | Without Coverage |
| Under 6 Years | 15 (100.0%) | 0 (0.0%) |
| 6 to 18 Years | 26 (100.0%) | 0 (0.0%) |
| 19 to 25 Years | 2 (28.6%) | 5 (71.4%) |
| 26 to 34 Years | 13 (100.0%) | 0 (0.0%) |
| 35 to 44 Years | 23 (82.1%) | 5 (17.9%) |
| 45 to 54 Years | 10 (33.3%) | 20 (66.7%) |
| 55 to 64 Years | 12 (16.9%) | 59 (83.1%) |
| 65 to 74 Years | 68 (100.0%) | 0 (0.0%) |
| 75 Years and older | 30 (100.0%) | 0 (0.0%) |
| Total | 199 (69.1%) | 89 (30.9%) |
Health Insurance Coverage by Citizenship Status in Junction
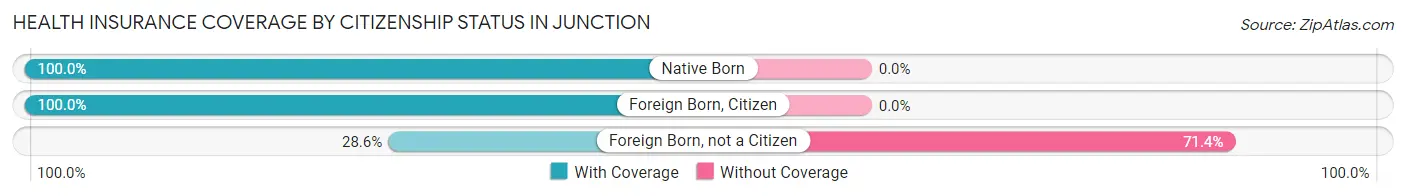
| Citizenship Status | With Coverage | Without Coverage |
| Native Born | 15 (100.0%) | 0 (0.0%) |
| Foreign Born, Citizen | 26 (100.0%) | 0 (0.0%) |
| Foreign Born, not a Citizen | 2 (28.6%) | 5 (71.4%) |
Health Insurance Coverage by Household Income in Junction
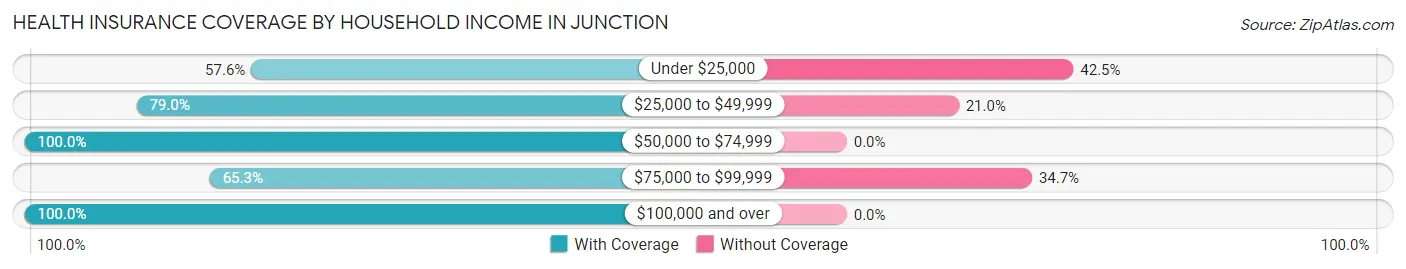
| Household Income | With Coverage | Without Coverage |
| Under $25,000 | 80 (57.6%) | 59 (42.4%) |
| $25,000 to $49,999 | 49 (79.0%) | 13 (21.0%) |
| $50,000 to $74,999 | 4 (100.0%) | 0 (0.0%) |
| $75,000 to $99,999 | 32 (65.3%) | 17 (34.7%) |
| $100,000 and over | 34 (100.0%) | 0 (0.0%) |
Public vs Private Health Insurance Coverage by Age in Junction
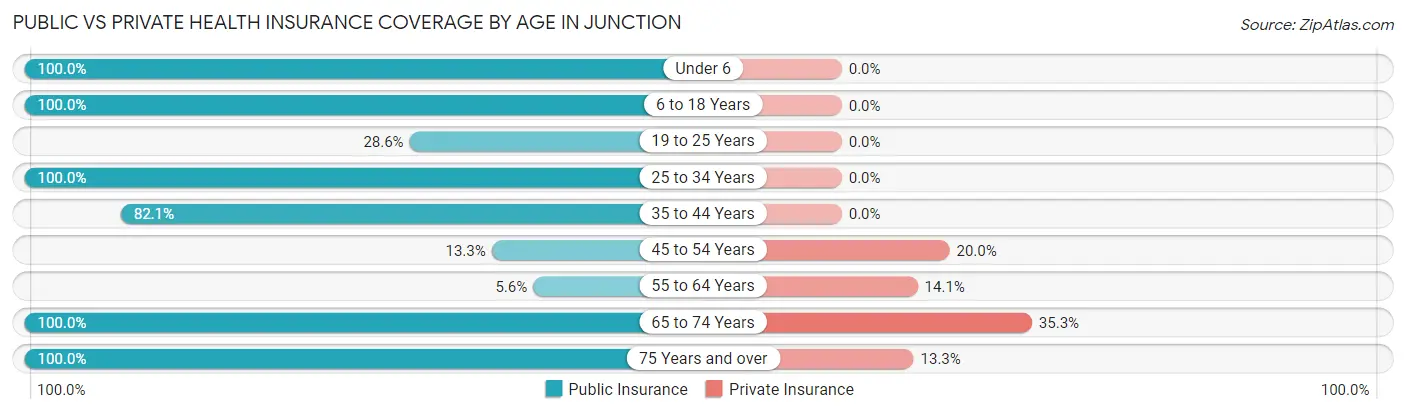
| Age Bracket | Public Insurance | Private Insurance |
| Under 6 | 15 (100.0%) | 0 (0.0%) |
| 6 to 18 Years | 26 (100.0%) | 0 (0.0%) |
| 19 to 25 Years | 2 (28.6%) | 0 (0.0%) |
| 25 to 34 Years | 13 (100.0%) | 0 (0.0%) |
| 35 to 44 Years | 23 (82.1%) | 0 (0.0%) |
| 45 to 54 Years | 4 (13.3%) | 6 (20.0%) |
| 55 to 64 Years | 4 (5.6%) | 10 (14.1%) |
| 65 to 74 Years | 68 (100.0%) | 24 (35.3%) |
| 75 Years and over | 30 (100.0%) | 4 (13.3%) |
| Total | 185 (64.2%) | 44 (15.3%) |
Disability Status by Sex by Age in Junction
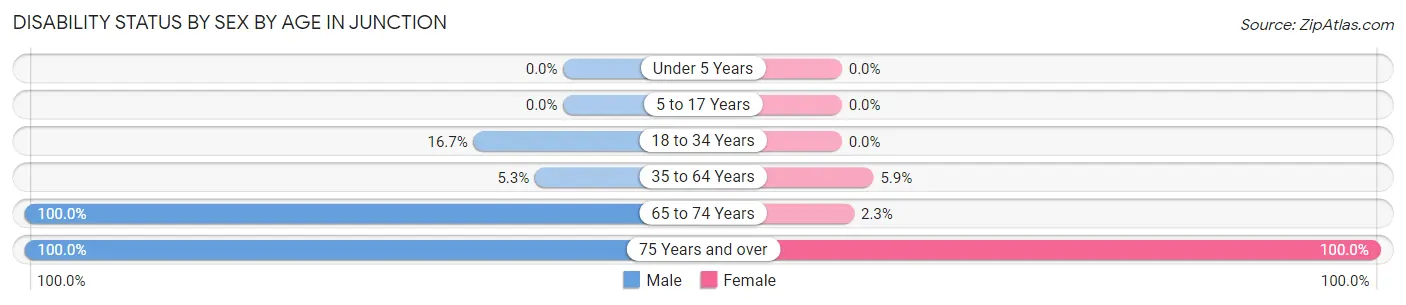
| Age Bracket | Male | Female |
| Under 5 Years | 0 (0.0%) | 0 (0.0%) |
| 5 to 17 Years | 0 (0.0%) | 0 (0.0%) |
| 18 to 34 Years | 4 (16.7%) | 0 (0.0%) |
| 35 to 64 Years | 5 (5.3%) | 2 (5.9%) |
| 65 to 74 Years | 24 (100.0%) | 1 (2.3%) |
| 75 Years and over | 17 (100.0%) | 13 (100.0%) |
Disability Class by Sex by Age in Junction
Disability Class: Hearing Difficulty
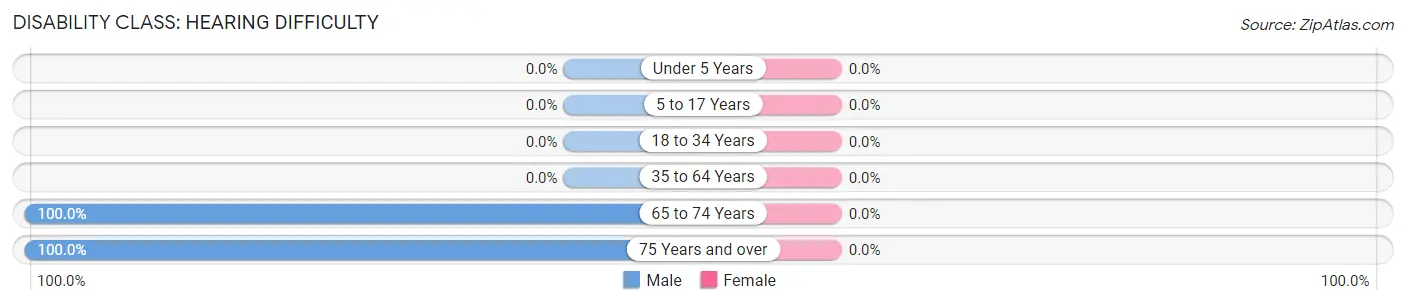
| Age Bracket | Male | Female |
| Under 5 Years | 0 (0.0%) | 0 (0.0%) |
| 5 to 17 Years | 0 (0.0%) | 0 (0.0%) |
| 18 to 34 Years | 0 (0.0%) | 0 (0.0%) |
| 35 to 64 Years | 0 (0.0%) | 0 (0.0%) |
| 65 to 74 Years | 24 (100.0%) | 0 (0.0%) |
| 75 Years and over | 17 (100.0%) | 0 (0.0%) |
Disability Class: Vision Difficulty
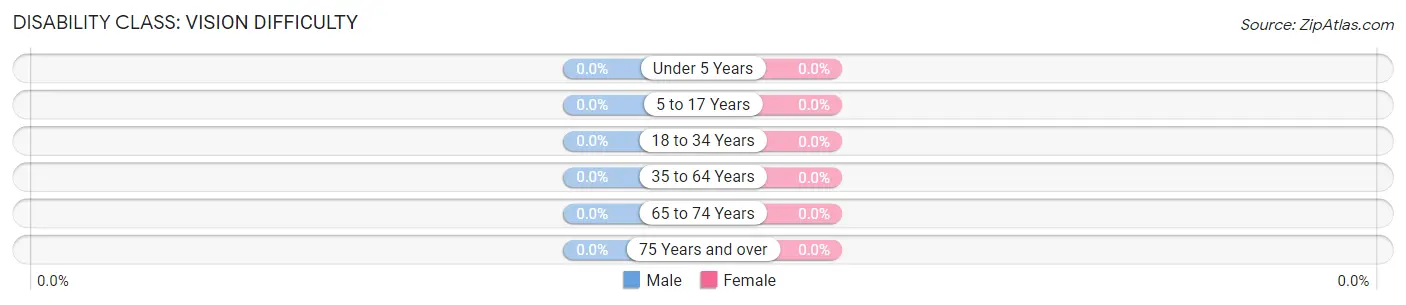
| Age Bracket | Male | Female |
| Under 5 Years | 0 (0.0%) | 0 (0.0%) |
| 5 to 17 Years | 0 (0.0%) | 0 (0.0%) |
| 18 to 34 Years | 0 (0.0%) | 0 (0.0%) |
| 35 to 64 Years | 0 (0.0%) | 0 (0.0%) |
| 65 to 74 Years | 0 (0.0%) | 0 (0.0%) |
| 75 Years and over | 0 (0.0%) | 0 (0.0%) |
Disability Class: Cognitive Difficulty
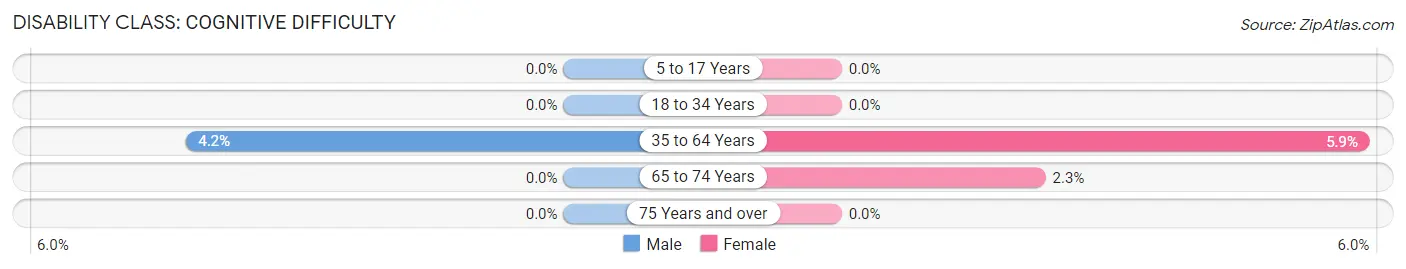
| Age Bracket | Male | Female |
| 5 to 17 Years | 0 (0.0%) | 0 (0.0%) |
| 18 to 34 Years | 0 (0.0%) | 0 (0.0%) |
| 35 to 64 Years | 4 (4.2%) | 2 (5.9%) |
| 65 to 74 Years | 0 (0.0%) | 1 (2.3%) |
| 75 Years and over | 0 (0.0%) | 0 (0.0%) |
Disability Class: Ambulatory Difficulty
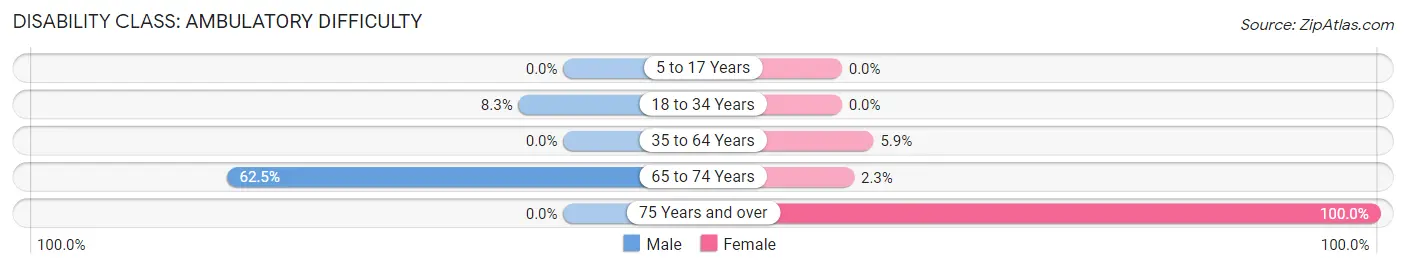
| Age Bracket | Male | Female |
| 5 to 17 Years | 0 (0.0%) | 0 (0.0%) |
| 18 to 34 Years | 2 (8.3%) | 0 (0.0%) |
| 35 to 64 Years | 0 (0.0%) | 2 (5.9%) |
| 65 to 74 Years | 15 (62.5%) | 1 (2.3%) |
| 75 Years and over | 0 (0.0%) | 13 (100.0%) |
Disability Class: Self-Care Difficulty
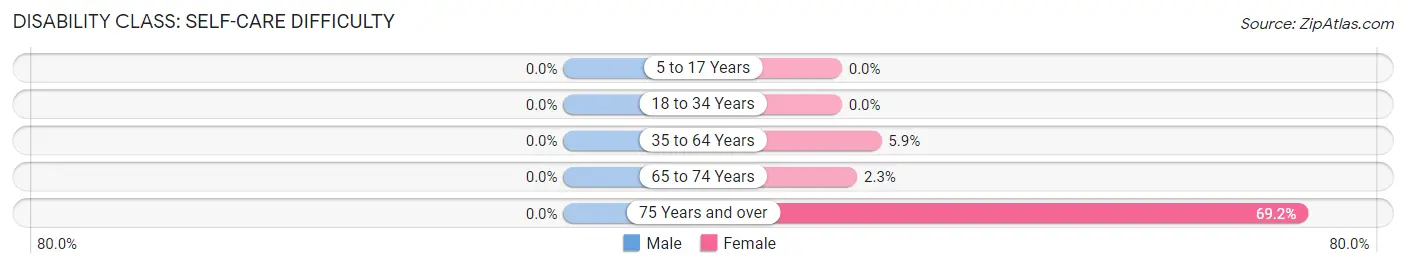
| Age Bracket | Male | Female |
| 5 to 17 Years | 0 (0.0%) | 0 (0.0%) |
| 18 to 34 Years | 0 (0.0%) | 0 (0.0%) |
| 35 to 64 Years | 0 (0.0%) | 2 (5.9%) |
| 65 to 74 Years | 0 (0.0%) | 1 (2.3%) |
| 75 Years and over | 0 (0.0%) | 9 (69.2%) |
Technology Access in Junction
Computing Device Access in Junction
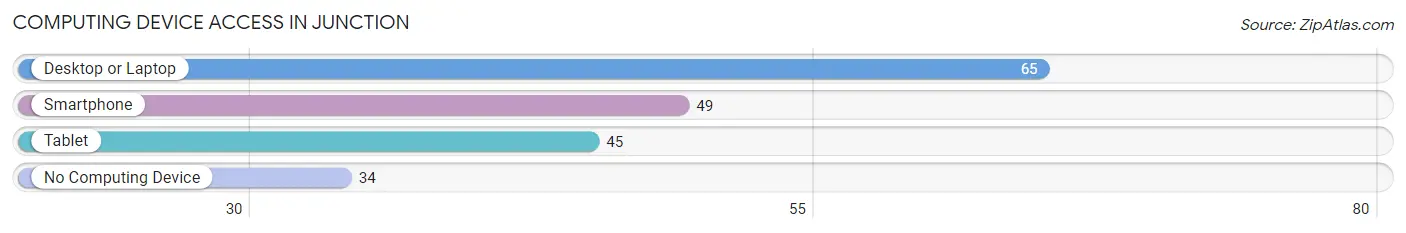
| Device Type | # Households | % Households |
| Desktop or Laptop | 65 | 64.4% |
| Smartphone | 49 | 48.5% |
| Tablet | 45 | 44.6% |
| No Computing Device | 34 | 33.7% |
| Total | 101 | 100.0% |
Internet Access in Junction
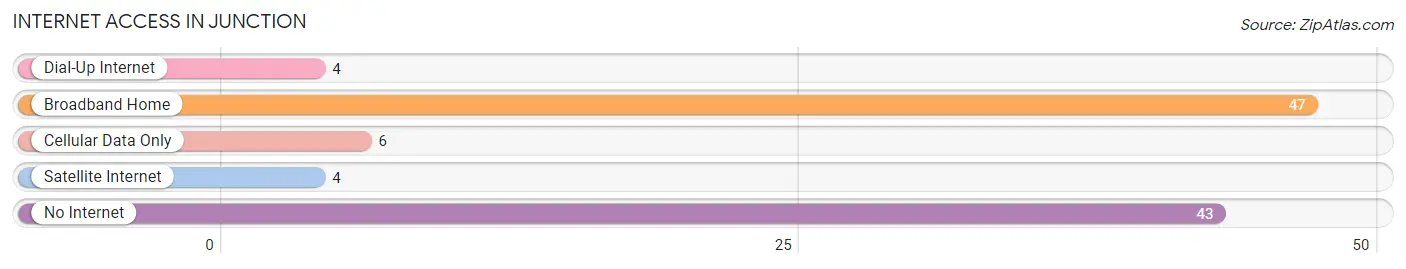
| Internet Type | # Households | % Households |
| Dial-Up Internet | 4 | 4.0% |
| Broadband Home | 47 | 46.5% |
| Cellular Data Only | 6 | 5.9% |
| Satellite Internet | 4 | 4.0% |
| No Internet | 43 | 42.6% |
| Total | 101 | 100.0% |
Junction Summary
Junction, Utah is a small town located in the southeastern corner of the state, near the border of Colorado. It is situated in the heart of the San Rafael Swell, a large area of rugged terrain and canyons. The town is home to just over 500 people and is the county seat of Emery County.
History
Junction was first settled in 1883 by a group of Mormon pioneers led by John W. Van Cott. The town was originally named “Goblin Valley” after the nearby Goblin Valley State Park. In 1891, the name was changed to Junction, as it was the junction of two railroads. The town was incorporated in 1895.
In the early 1900s, Junction was a bustling town with a population of over 1,000. It was a major stop on the Denver and Rio Grande Western Railroad, and the town was home to several businesses, including a hotel, a bank, a general store, and a post office.
In the 1950s, the railroad stopped running through Junction, and the population began to decline. The town was nearly abandoned by the 1970s, but in the 1980s, the population began to grow again as people moved to the area for its rural lifestyle and scenic beauty.
Geography
Junction is located in the southeastern corner of Utah, near the border of Colorado. It is situated in the heart of the San Rafael Swell, a large area of rugged terrain and canyons. The town is surrounded by the Manti-La Sal National Forest and the San Rafael Swell Wilderness Area.
The climate in Junction is semi-arid, with hot summers and cold winters. The average annual temperature is around 50°F (10°C). The area receives an average of 8 inches (20 cm) of precipitation per year.
Economy
The economy of Junction is largely based on tourism and agriculture. The town is home to several tourist attractions, including Goblin Valley State Park, the San Rafael Swell, and the San Rafael River.
Agriculture is also an important part of the local economy. The area is home to several farms and ranches, which produce hay, alfalfa, and other crops.
Demographics
As of the 2010 census, Junction had a population of 517 people. The racial makeup of the town was 97.3% White, 0.4% Native American, 0.2% Asian, 0.2% from other races, and 1.9% from two or more races.
The median household income in Junction was $37,500, and the median family income was $41,250. The per capita income was $17,845. About 11.2% of families and 14.2% of the population were below the poverty line.
Common Questions
What is Per Capita Income in Junction?
Per Capita income in Junction is $16,174.
What is the Median Family Income in Junction?
Median Family Income in Junction is $45,625.
What is Income or Wage Gap in Junction?
Income or Wage Gap in Junction is 72.6%.
Women in Junction earn 27.4 cents for every dollar earned by a man.
What is Inequality or Gini Index in Junction?
Inequality or Gini Index in Junction is 0.49.
What is the Total Population of Junction?
Total Population of Junction is 288.
What is the Total Male Population of Junction?
Total Male Population of Junction is 191.
What is the Total Female Population of Junction?
Total Female Population of Junction is 97.
What is the Ratio of Males per 100 Females in Junction?
There are 196.91 Males per 100 Females in Junction.
What is the Ratio of Females per 100 Males in Junction?
There are 50.79 Females per 100 Males in Junction.
What is the Median Population Age in Junction?
Median Population Age in Junction is 61.2 Years.
What is the Average Family Size in Junction
Average Family Size in Junction is 5.5 People.
What is the Average Household Size in Junction
Average Household Size in Junction is 2.9 People.
How Large is the Labor Force in Junction?
There are 68 People in the Labor Forcein in Junction.
What is the Percentage of People in the Labor Force in Junction?
26.1% of People are in the Labor Force in Junction.
What is the Unemployment Rate in Junction?
Unemployment Rate in Junction is 20.6%.