Wanship, UT Map & Demographics
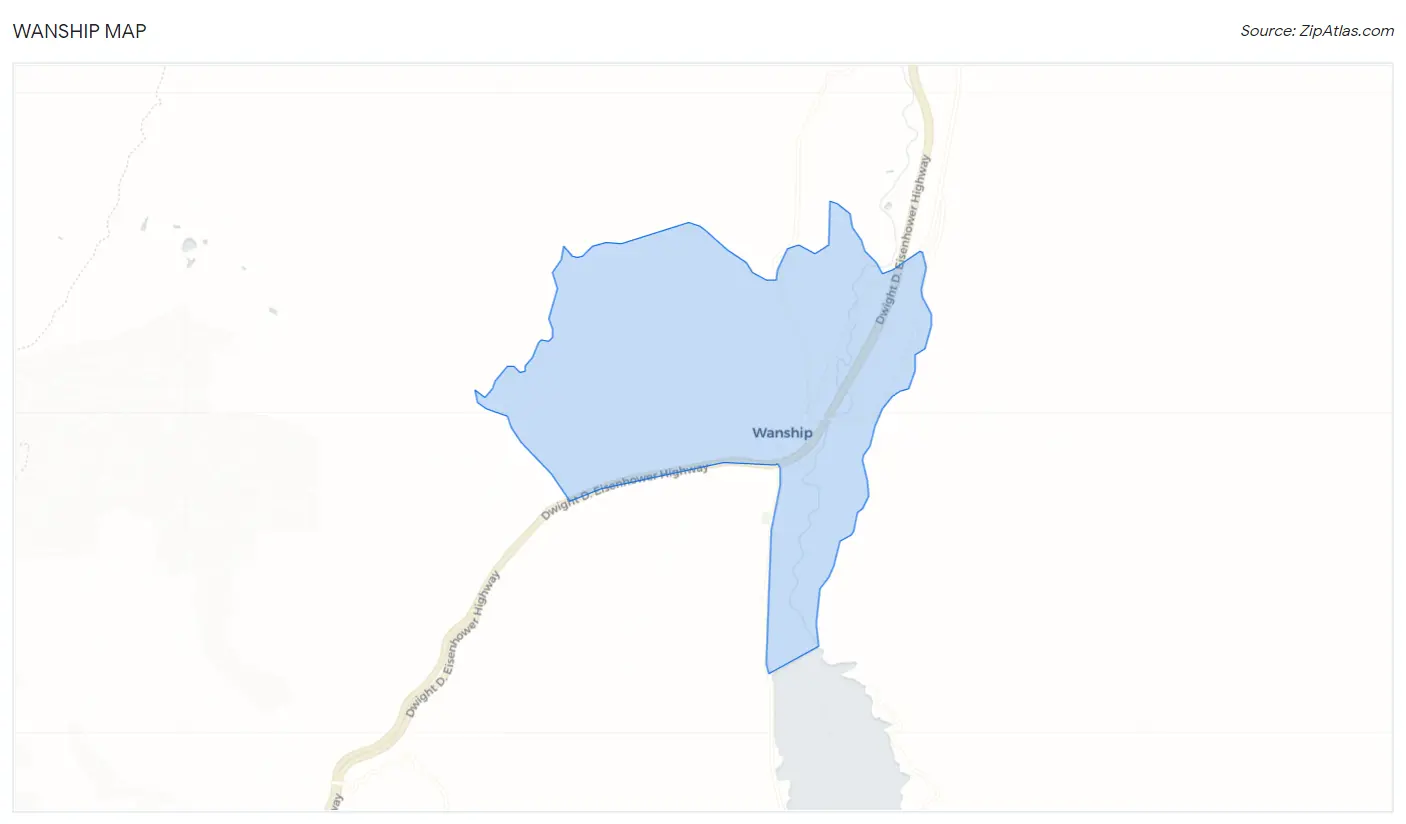
Wanship Map
Wanship Overview
$23,871
PER CAPITA INCOME
$88,839
AVG FAMILY INCOME
$82,500
AVG HOUSEHOLD INCOME
33.4%
WAGE / INCOME GAP [ % ]
66.6¢/ $1
WAGE / INCOME GAP [ $ ]
0.30
INEQUALITY / GINI INDEX
320
TOTAL POPULATION
169
MALE POPULATION
151
FEMALE POPULATION
111.92
MALES / 100 FEMALES
89.35
FEMALES / 100 MALES
27.7
MEDIAN AGE
4.2
AVG FAMILY SIZE
3.6
AVG HOUSEHOLD SIZE
192
LABOR FORCE [ PEOPLE ]
77.1%
PERCENT IN LABOR FORCE
Wanship Area Codes
Income in Wanship
Income Overview in Wanship
Per Capita Income in Wanship is $23,871, while median incomes of families and households are $88,839 and $82,500 respectively.
| Characteristic | Number | Measure |
| Per Capita Income | 320 | $23,871 |
| Median Family Income | 73 | $88,839 |
| Mean Family Income | 73 | $88,459 |
| Median Household Income | 88 | $82,500 |
| Mean Household Income | 88 | $80,359 |
| Income Deficit | 73 | $0 |
| Wage / Income Gap (%) | 320 | 33.44% |
| Wage / Income Gap ($) | 320 | 66.56¢ per $1 |
| Gini / Inequality Index | 320 | 0.30 |
Earnings by Sex in Wanship
Average Earnings in Wanship are $16,121, $15,600 for men and $23,438 for women, a difference of 33.4%.
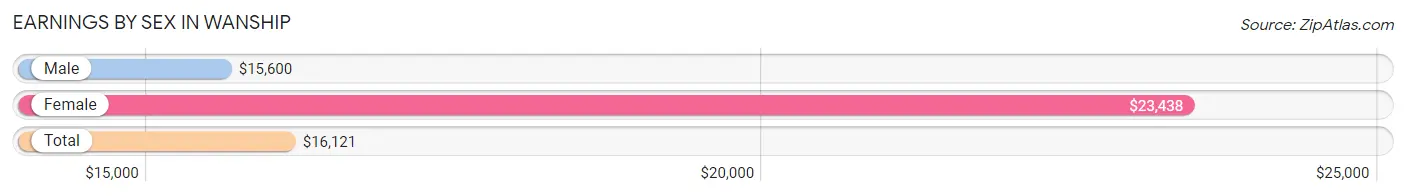
| Sex | Number | Average Earnings |
| Male | 138 (71.9%) | $15,600 |
| Female | 54 (28.1%) | $23,438 |
| Total | 192 (100.0%) | $16,121 |
Earnings by Sex by Income Bracket in Wanship
The most common earnings brackets in Wanship are $10,000 to $12,499 for men (44 | 31.9%) and $5,000 to $7,499 for women (10 | 18.5%).
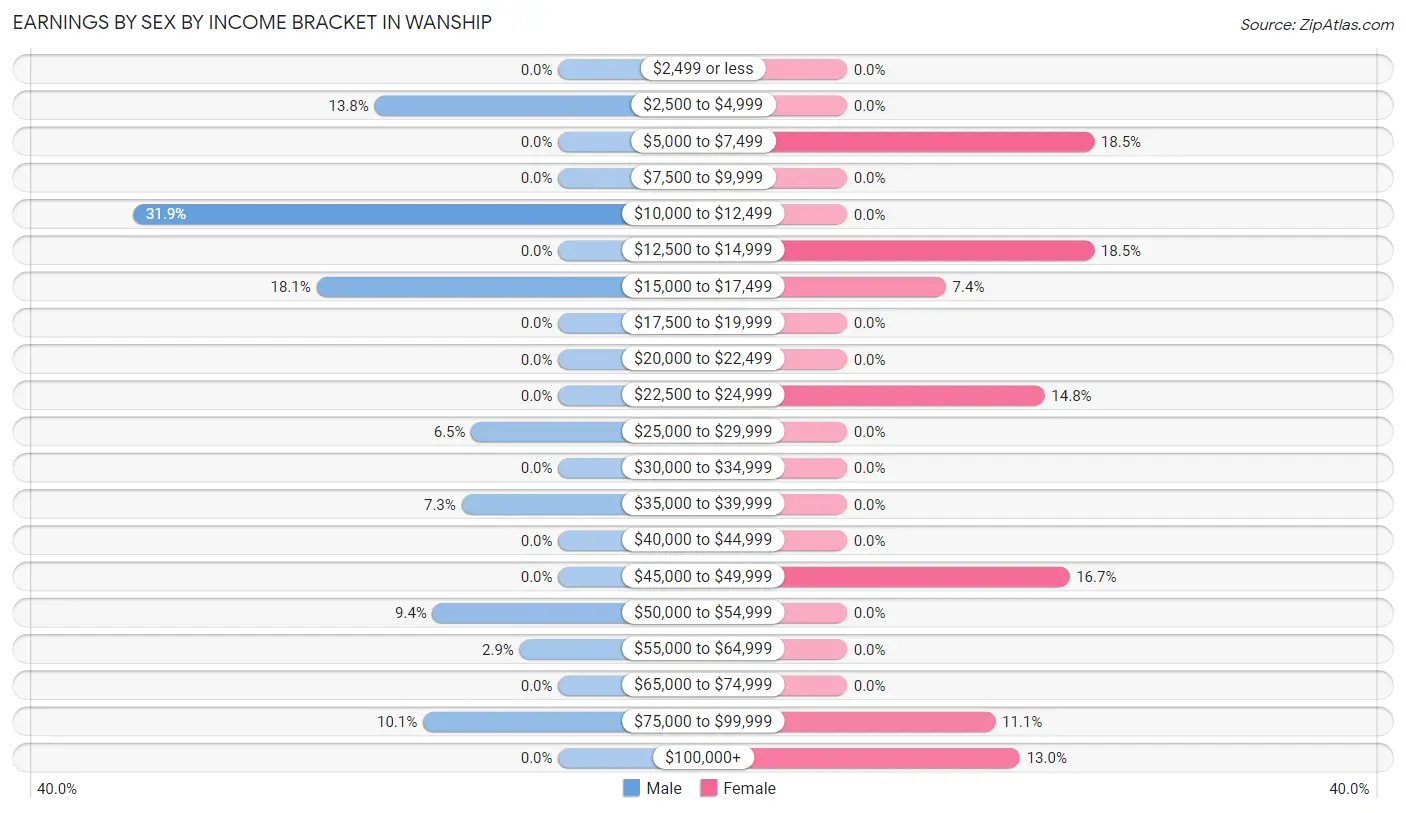
| Income | Male | Female |
| $2,499 or less | 0 (0.0%) | 0 (0.0%) |
| $2,500 to $4,999 | 19 (13.8%) | 0 (0.0%) |
| $5,000 to $7,499 | 0 (0.0%) | 10 (18.5%) |
| $7,500 to $9,999 | 0 (0.0%) | 0 (0.0%) |
| $10,000 to $12,499 | 44 (31.9%) | 0 (0.0%) |
| $12,500 to $14,999 | 0 (0.0%) | 10 (18.5%) |
| $15,000 to $17,499 | 25 (18.1%) | 4 (7.4%) |
| $17,500 to $19,999 | 0 (0.0%) | 0 (0.0%) |
| $20,000 to $22,499 | 0 (0.0%) | 0 (0.0%) |
| $22,500 to $24,999 | 0 (0.0%) | 8 (14.8%) |
| $25,000 to $29,999 | 9 (6.5%) | 0 (0.0%) |
| $30,000 to $34,999 | 0 (0.0%) | 0 (0.0%) |
| $35,000 to $39,999 | 10 (7.2%) | 0 (0.0%) |
| $40,000 to $44,999 | 0 (0.0%) | 0 (0.0%) |
| $45,000 to $49,999 | 0 (0.0%) | 9 (16.7%) |
| $50,000 to $54,999 | 13 (9.4%) | 0 (0.0%) |
| $55,000 to $64,999 | 4 (2.9%) | 0 (0.0%) |
| $65,000 to $74,999 | 0 (0.0%) | 0 (0.0%) |
| $75,000 to $99,999 | 14 (10.1%) | 6 (11.1%) |
| $100,000+ | 0 (0.0%) | 7 (13.0%) |
| Total | 138 (100.0%) | 54 (100.0%) |
Earnings by Sex by Educational Attainment in Wanship
| Educational Attainment | Male Income | Female Income |
| Less than High School | - | - |
| High School Diploma | - | - |
| College or Associate's Degree | - | - |
| Bachelor's Degree | - | - |
| Graduate Degree | - | - |
| Total | - | - |
Family Income in Wanship
Family Income Brackets in Wanship
According to the Wanship family income data, there are 24 families falling into the $75,000 to $99,999 income range, which is the most common income bracket and makes up 32.9% of all families.
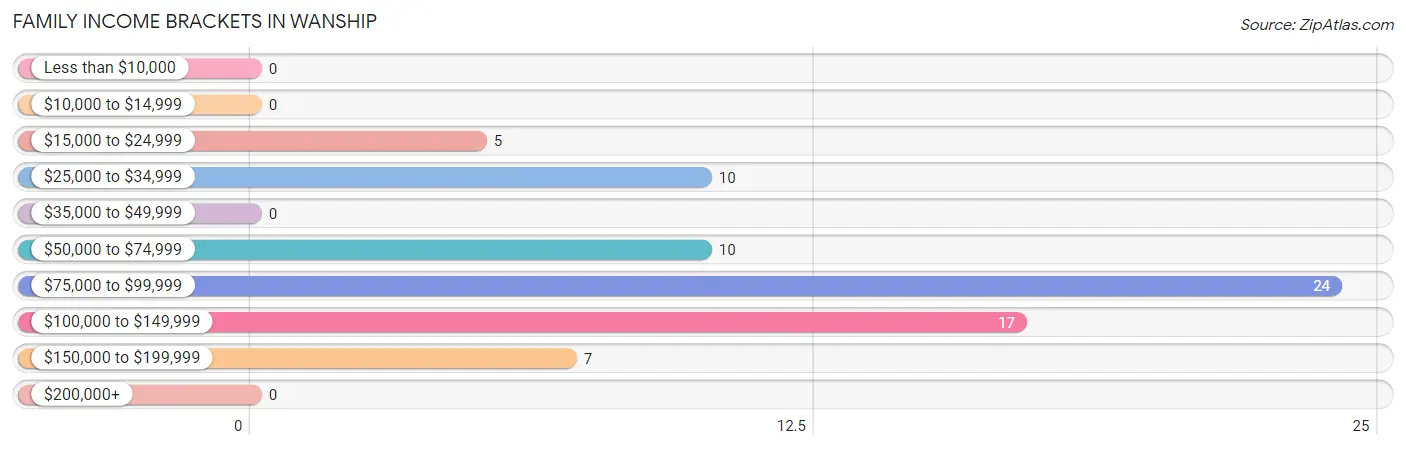
| Income Bracket | # Families | % Families |
| Less than $10,000 | 0 | 0.0% |
| $10,000 to $14,999 | 0 | 0.0% |
| $15,000 to $24,999 | 5 | 6.8% |
| $25,000 to $34,999 | 10 | 13.7% |
| $35,000 to $49,999 | 0 | 0.0% |
| $50,000 to $74,999 | 10 | 13.7% |
| $75,000 to $99,999 | 24 | 32.9% |
| $100,000 to $149,999 | 17 | 23.3% |
| $150,000 to $199,999 | 7 | 9.6% |
| $200,000+ | 0 | 0.0% |
Family Income by Famaliy Size in Wanship
3-person families (19 | 26.0%) account for the highest median family income in Wanship with $97,292 per family, while 3-person families (19 | 26.0%) have the highest median income of $32,431 per family member.
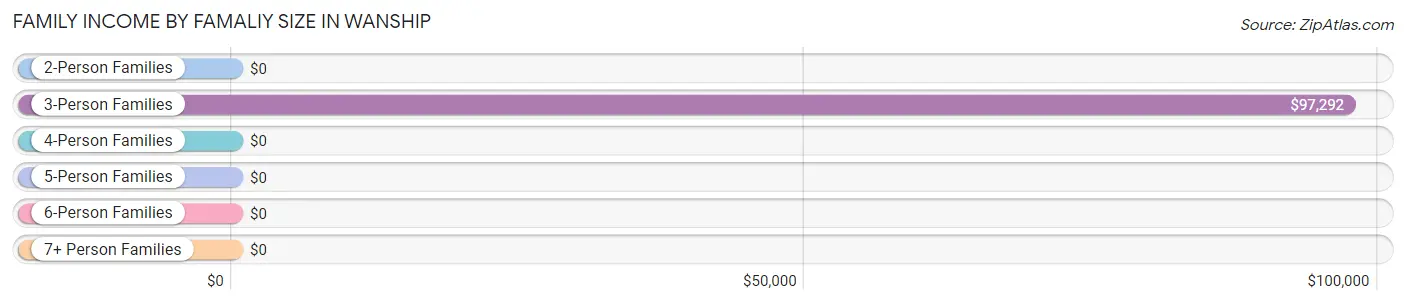
| Income Bracket | # Families | Median Income |
| 2-Person Families | 25 (34.3%) | $0 |
| 3-Person Families | 19 (26.0%) | $97,292 |
| 4-Person Families | 15 (20.5%) | $0 |
| 5-Person Families | 14 (19.2%) | $0 |
| 6-Person Families | 0 (0.0%) | $0 |
| 7+ Person Families | 0 (0.0%) | $0 |
| Total | 73 (100.0%) | $88,839 |
Family Income by Number of Earners in Wanship
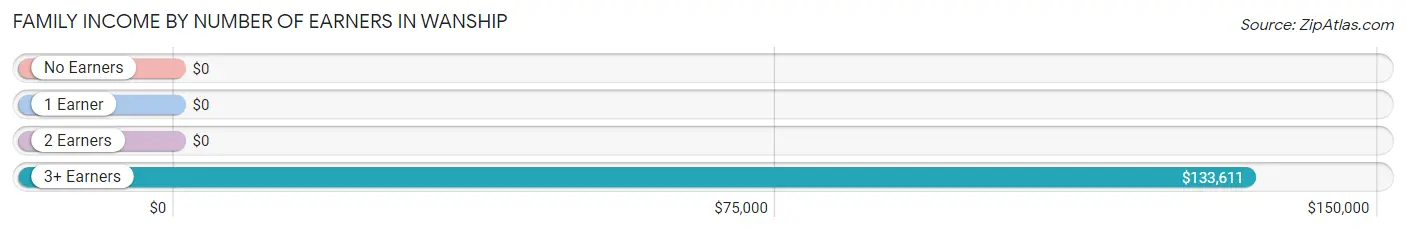
| Number of Earners | # Families | Median Income |
| No Earners | 15 (20.5%) | $0 |
| 1 Earner | 24 (32.9%) | $0 |
| 2 Earners | 10 (13.7%) | $0 |
| 3+ Earners | 24 (32.9%) | $133,611 |
| Total | 73 (100.0%) | $88,839 |
Household Income in Wanship
Household Income Brackets in Wanship
With 24 households falling in the category, the $75,000 to $99,999 income range is the most frequent in Wanship, accounting for 27.3% of all households.
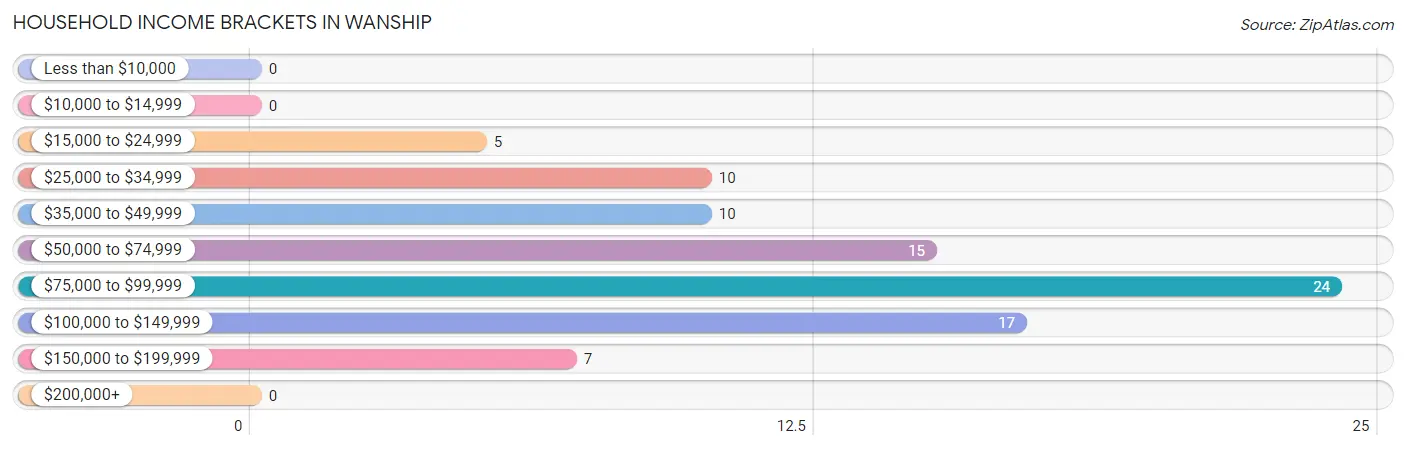
| Income Bracket | # Households | % Households |
| Less than $10,000 | 0 | 0.0% |
| $10,000 to $14,999 | 0 | 0.0% |
| $15,000 to $24,999 | 5 | 5.7% |
| $25,000 to $34,999 | 10 | 11.4% |
| $35,000 to $49,999 | 10 | 11.4% |
| $50,000 to $74,999 | 15 | 17.0% |
| $75,000 to $99,999 | 24 | 27.3% |
| $100,000 to $149,999 | 17 | 19.3% |
| $150,000 to $199,999 | 7 | 8.0% |
| $200,000+ | 0 | 0.0% |
Household Income by Householder Age in Wanship
The median household income in Wanship is $82,500, with the highest median household income of $88,393 found in the 25 to 44 years age bracket for the primary householder. A total of 30 households (34.1%) fall into this category. Meanwhile, the 15 to 24 years age bracket for the primary householder has the lowest median household income of $0, with 4 households (4.5%) in this group.
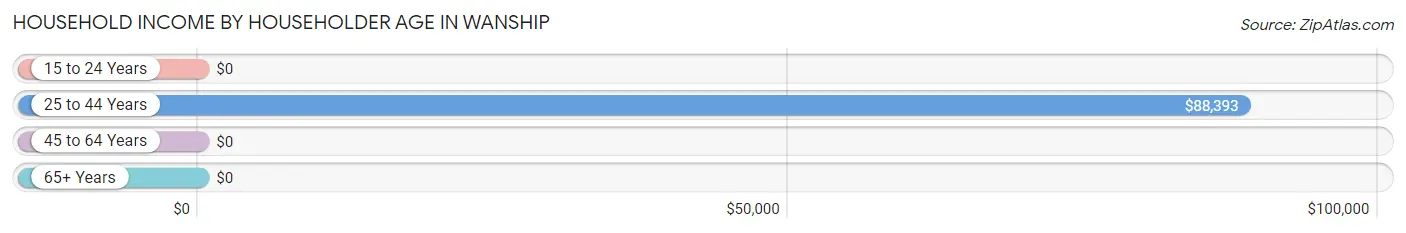
| Income Bracket | # Households | Median Income |
| 15 to 24 Years | 4 (4.5%) | $0 |
| 25 to 44 Years | 30 (34.1%) | $88,393 |
| 45 to 64 Years | 30 (34.1%) | $0 |
| 65+ Years | 24 (27.3%) | $0 |
| Total | 88 (100.0%) | $82,500 |
Poverty in Wanship
Income Below Poverty by Sex and Age in Wanship
| Age Bracket | Male | Female |
| Under 5 Years | 0 (0.0%) | 0 (0.0%) |
| 5 Years | 0 (0.0%) | 0 (0.0%) |
| 6 to 11 Years | 0 (0.0%) | 0 (0.0%) |
| 12 to 14 Years | 0 (0.0%) | 0 (0.0%) |
| 15 Years | 0 (0.0%) | 0 (0.0%) |
| 16 and 17 Years | 0 (0.0%) | 0 (0.0%) |
| 18 to 24 Years | 0 (0.0%) | 0 (0.0%) |
| 25 to 34 Years | 0 (0.0%) | 0 (0.0%) |
| 35 to 44 Years | 0 (0.0%) | 0 (0.0%) |
| 45 to 54 Years | 0 (0.0%) | 0 (0.0%) |
| 55 to 64 Years | 0 (0.0%) | 0 (0.0%) |
| 65 to 74 Years | 0 (0.0%) | 0 (0.0%) |
| 75 Years and over | 0 (0.0%) | 0 (0.0%) |
| Total | 0 (0.0%) | 0 (0.0%) |
Income Above Poverty by Sex and Age in Wanship
According to the poverty statistics in Wanship, males aged under 5 years and females aged under 5 years are the age groups that are most secure financially, with 100.0% of males and 100.0% of females in these age groups living above the poverty line.
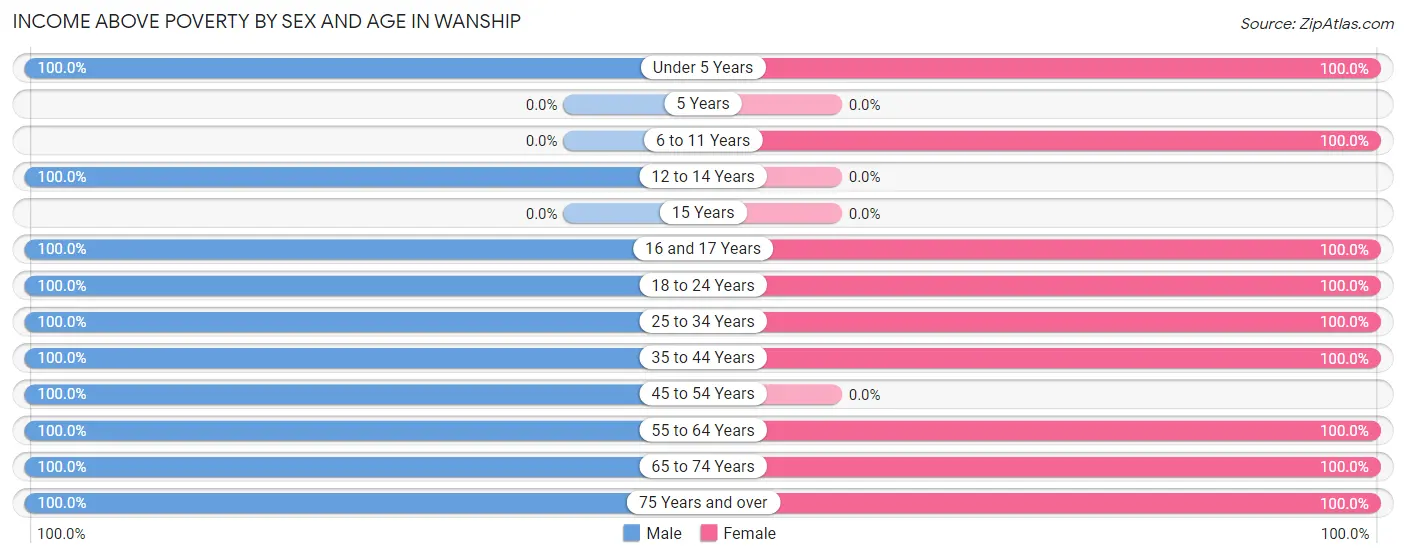
| Age Bracket | Male | Female |
| Under 5 Years | 6 (100.0%) | 20 (100.0%) |
| 5 Years | 0 (0.0%) | 0 (0.0%) |
| 6 to 11 Years | 0 (0.0%) | 35 (100.0%) |
| 12 to 14 Years | 10 (100.0%) | 0 (0.0%) |
| 15 Years | 0 (0.0%) | 0 (0.0%) |
| 16 and 17 Years | 9 (100.0%) | 10 (100.0%) |
| 18 to 24 Years | 18 (100.0%) | 14 (100.0%) |
| 25 to 34 Years | 62 (100.0%) | 17 (100.0%) |
| 35 to 44 Years | 10 (100.0%) | 6 (100.0%) |
| 45 to 54 Years | 5 (100.0%) | 0 (0.0%) |
| 55 to 64 Years | 17 (100.0%) | 25 (100.0%) |
| 65 to 74 Years | 17 (100.0%) | 9 (100.0%) |
| 75 Years and over | 15 (100.0%) | 15 (100.0%) |
| Total | 169 (100.0%) | 151 (100.0%) |
Income Below Poverty Among Married-Couple Families in Wanship
| Children | Above Poverty | Below Poverty |
| No Children | 42 (100.0%) | 0 (0.0%) |
| 1 or 2 Children | 11 (100.0%) | 0 (0.0%) |
| 3 or 4 Children | 14 (100.0%) | 0 (0.0%) |
| 5 or more Children | 0 (0.0%) | 0 (0.0%) |
| Total | 67 (100.0%) | 0 (0.0%) |
Income Below Poverty Among Single-Parent Households in Wanship
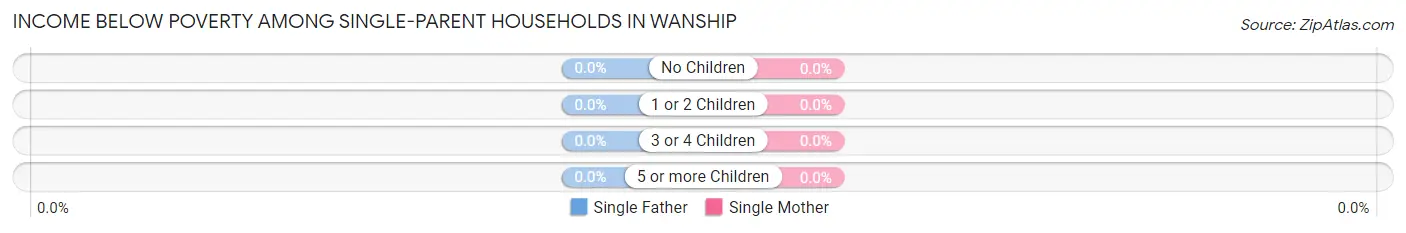
| Children | Single Father | Single Mother |
| No Children | 0 (0.0%) | 0 (0.0%) |
| 1 or 2 Children | 0 (0.0%) | 0 (0.0%) |
| 3 or 4 Children | 0 (0.0%) | 0 (0.0%) |
| 5 or more Children | 0 (0.0%) | 0 (0.0%) |
| Total | 0 (0.0%) | 0 (0.0%) |
Income Below Poverty Among Married-Couple vs Single-Parent Households in Wanship
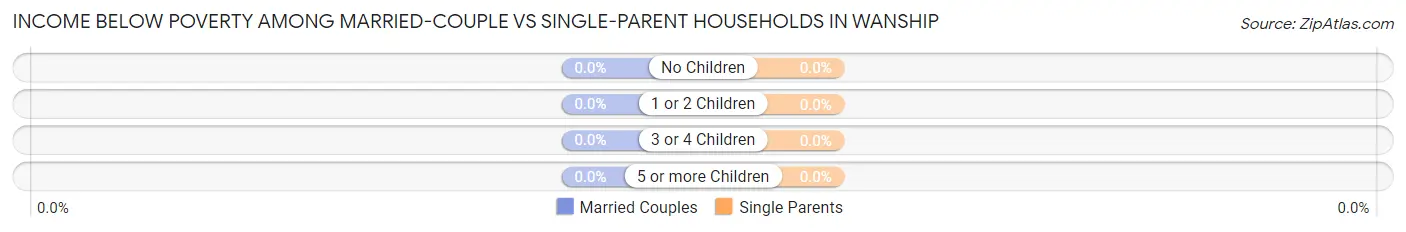
| Children | Married-Couple Families | Single-Parent Households |
| No Children | 0 (0.0%) | 0 (0.0%) |
| 1 or 2 Children | 0 (0.0%) | 0 (0.0%) |
| 3 or 4 Children | 0 (0.0%) | 0 (0.0%) |
| 5 or more Children | 0 (0.0%) | 0 (0.0%) |
| Total | 0 (0.0%) | 0 (0.0%) |
Race in Wanship
The most populous races in Wanship are White / Caucasian (320 | 100.0%), and Hispanic or Latino (26 | 8.1%).
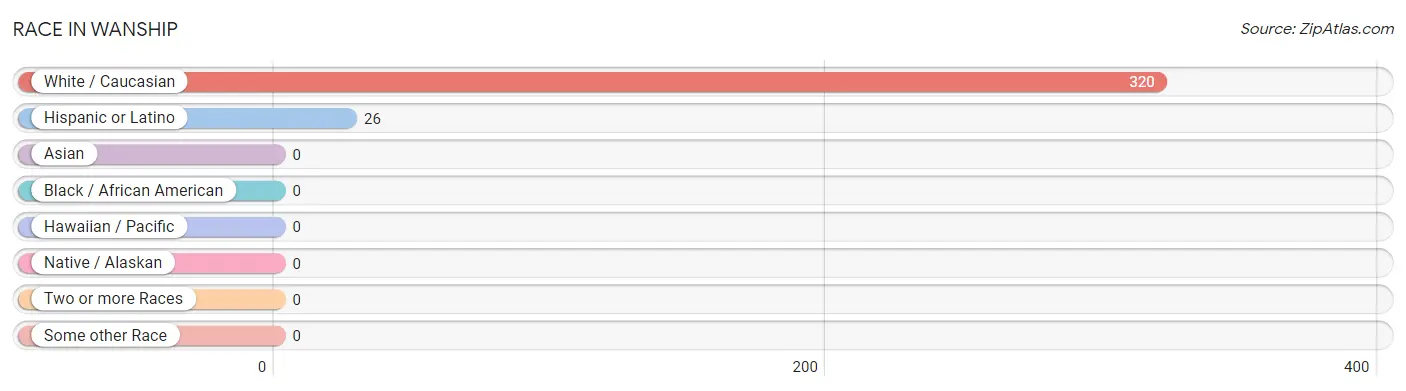
| Race | # Population | % Population |
| Asian | 0 | 0.0% |
| Black / African American | 0 | 0.0% |
| Hawaiian / Pacific | 0 | 0.0% |
| Hispanic or Latino | 26 | 8.1% |
| Native / Alaskan | 0 | 0.0% |
| White / Caucasian | 320 | 100.0% |
| Two or more Races | 0 | 0.0% |
| Some other Race | 0 | 0.0% |
| Total | 320 | 100.0% |
Ancestry in Wanship
The most populous ancestries reported in Wanship are English (132 | 41.2%), Dutch (82 | 25.6%), Swiss (80 | 25.0%), French (26 | 8.1%), and Mexican (26 | 8.1%), together accounting for 108.1% of all Wanship residents.
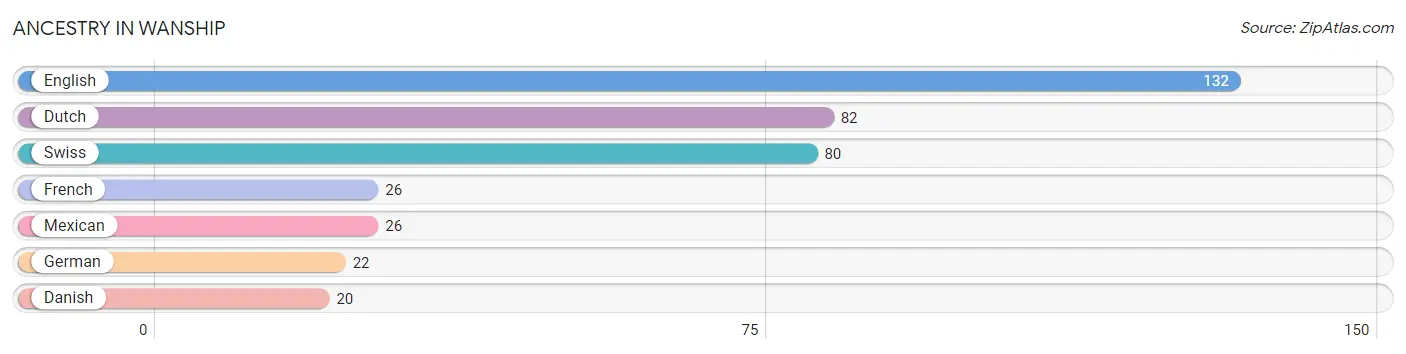
| Ancestry | # Population | % Population |
| Danish | 20 | 6.2% |
| Dutch | 82 | 25.6% |
| English | 132 | 41.2% |
| French | 26 | 8.1% |
| German | 22 | 6.9% |
| Mexican | 26 | 8.1% |
| Swiss | 80 | 25.0% | View All 7 Rows |
Immigrants in Wanship

| Immigration Origin | # Population | % Population | View All 0 Rows |
Sex and Age in Wanship
Sex and Age in Wanship
The most populous age groups in Wanship are 25 to 29 Years (44 | 26.0%) for men and 5 to 9 Years (35 | 23.2%) for women.
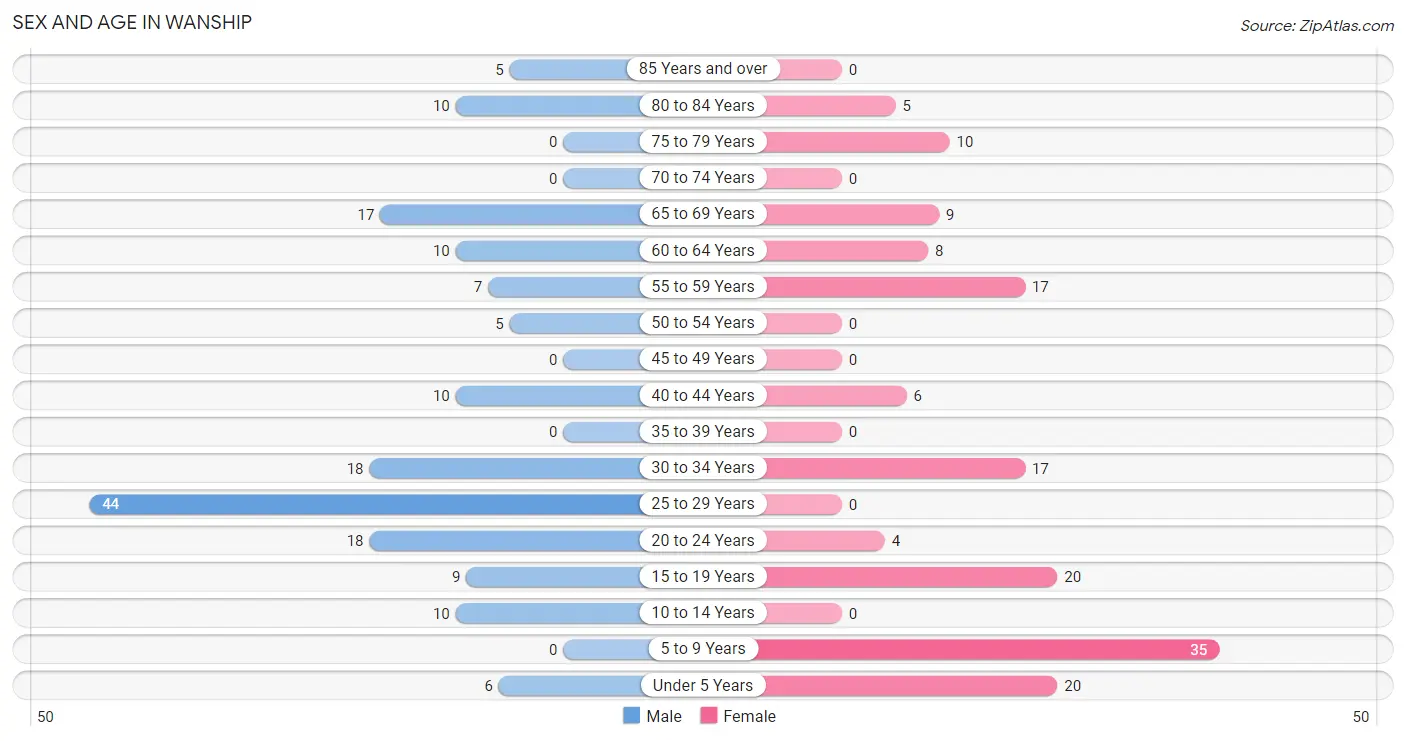
| Age Bracket | Male | Female |
| Under 5 Years | 6 (3.5%) | 20 (13.3%) |
| 5 to 9 Years | 0 (0.0%) | 35 (23.2%) |
| 10 to 14 Years | 10 (5.9%) | 0 (0.0%) |
| 15 to 19 Years | 9 (5.3%) | 20 (13.3%) |
| 20 to 24 Years | 18 (10.6%) | 4 (2.6%) |
| 25 to 29 Years | 44 (26.0%) | 0 (0.0%) |
| 30 to 34 Years | 18 (10.6%) | 17 (11.3%) |
| 35 to 39 Years | 0 (0.0%) | 0 (0.0%) |
| 40 to 44 Years | 10 (5.9%) | 6 (4.0%) |
| 45 to 49 Years | 0 (0.0%) | 0 (0.0%) |
| 50 to 54 Years | 5 (3.0%) | 0 (0.0%) |
| 55 to 59 Years | 7 (4.1%) | 17 (11.3%) |
| 60 to 64 Years | 10 (5.9%) | 8 (5.3%) |
| 65 to 69 Years | 17 (10.1%) | 9 (6.0%) |
| 70 to 74 Years | 0 (0.0%) | 0 (0.0%) |
| 75 to 79 Years | 0 (0.0%) | 10 (6.6%) |
| 80 to 84 Years | 10 (5.9%) | 5 (3.3%) |
| 85 Years and over | 5 (3.0%) | 0 (0.0%) |
| Total | 169 (100.0%) | 151 (100.0%) |
Families and Households in Wanship
Median Family Size in Wanship
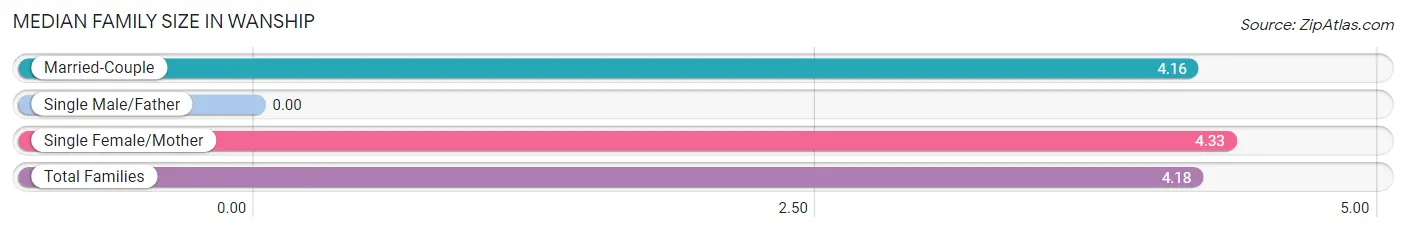
| Family Type | # Families | Family Size |
| Married-Couple | 67 (91.8%) | 4.16 |
| Single Male/Father | 0 (0.0%) | - |
| Single Female/Mother | 6 (8.2%) | 4.33 |
| Total Families | 73 (100.0%) | 4.18 |
Median Household Size in Wanship
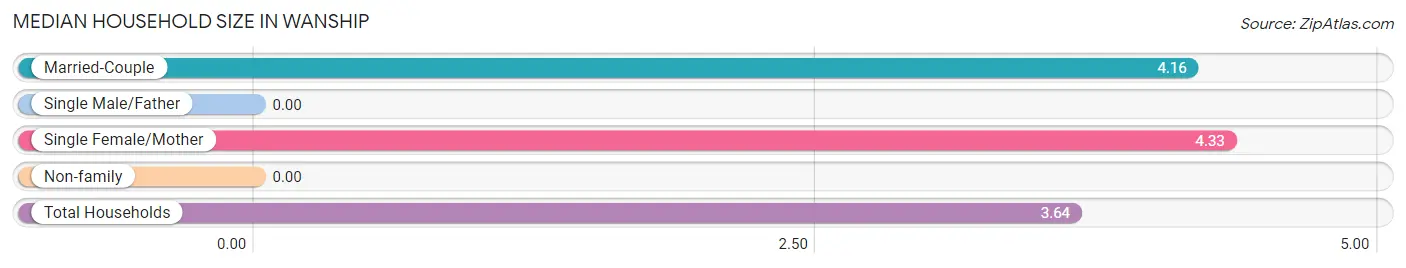
| Household Type | # Households | Household Size |
| Married-Couple | 67 (76.1%) | 4.16 |
| Single Male/Father | 0 (0.0%) | - |
| Single Female/Mother | 6 (6.8%) | 4.33 |
| Non-family | 15 (17.1%) | - |
| Total Households | 88 (100.0%) | 3.64 |
Household Size by Marriage Status in Wanship
Out of a total of 88 households in Wanship, 73 (83.0%) are family households, while 15 (17.1%) are nonfamily households. The most numerous type of family households are 2-person households, comprising 25, and the most common type of nonfamily households are 1-person households, comprising 15.
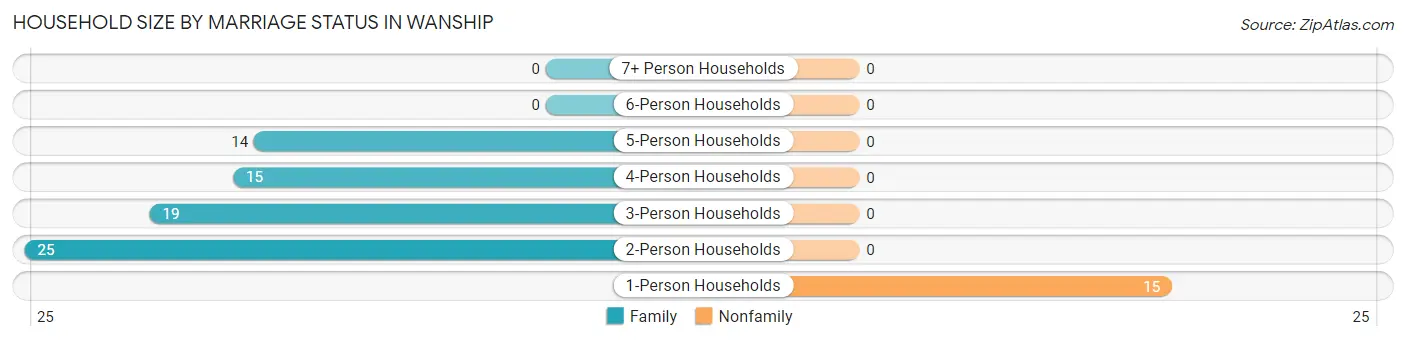
| Household Size | Family Households | Nonfamily Households |
| 1-Person Households | - | 15 (17.1%) |
| 2-Person Households | 25 (28.4%) | 0 (0.0%) |
| 3-Person Households | 19 (21.6%) | 0 (0.0%) |
| 4-Person Households | 15 (17.1%) | 0 (0.0%) |
| 5-Person Households | 14 (15.9%) | 0 (0.0%) |
| 6-Person Households | 0 (0.0%) | 0 (0.0%) |
| 7+ Person Households | 0 (0.0%) | 0 (0.0%) |
| Total | 73 (83.0%) | 15 (17.1%) |
Female Fertility in Wanship
Fertility by Age in Wanship
Average fertility rate in Wanship is 362.0 births per 1,000 women. Women in the age bracket of 20 to 34 years have the highest fertility rate with 810.0 births per 1,000 women. Women in the age bracket of 20 to 34 years acount for 100.0% of all women with births.
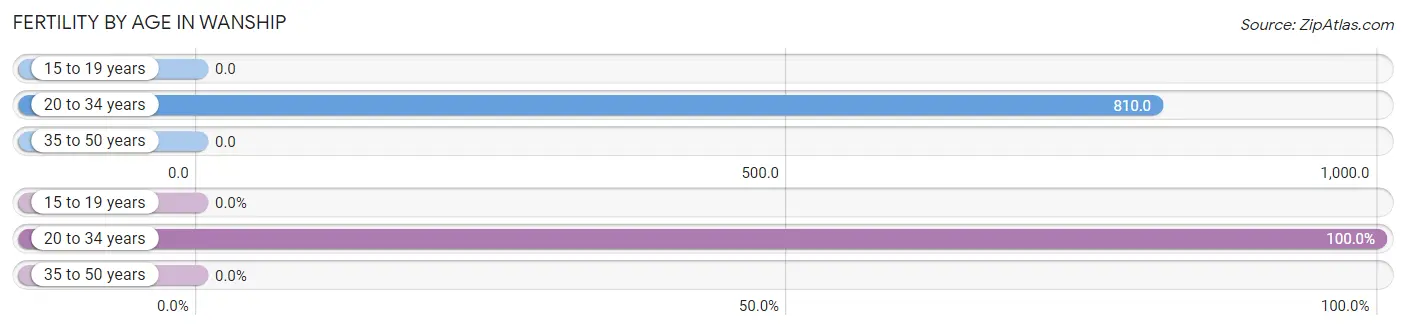
| Age Bracket | Women with Births | Births / 1,000 Women |
| 15 to 19 years | 0 (0.0%) | 0.0 |
| 20 to 34 years | 17 (100.0%) | 810.0 |
| 35 to 50 years | 0 (0.0%) | 0.0 |
| Total | 17 (100.0%) | 362.0 |
Fertility by Age by Marriage Status in Wanship
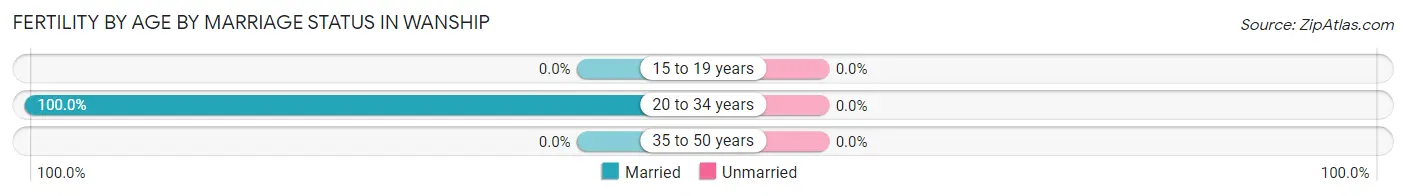
| Age Bracket | Married | Unmarried |
| 15 to 19 years | 0 (0.0%) | 0 (0.0%) |
| 20 to 34 years | 17 (100.0%) | 0 (0.0%) |
| 35 to 50 years | 0 (0.0%) | 0 (0.0%) |
| Total | 17 (100.0%) | 0 (0.0%) |
Fertility by Education in Wanship
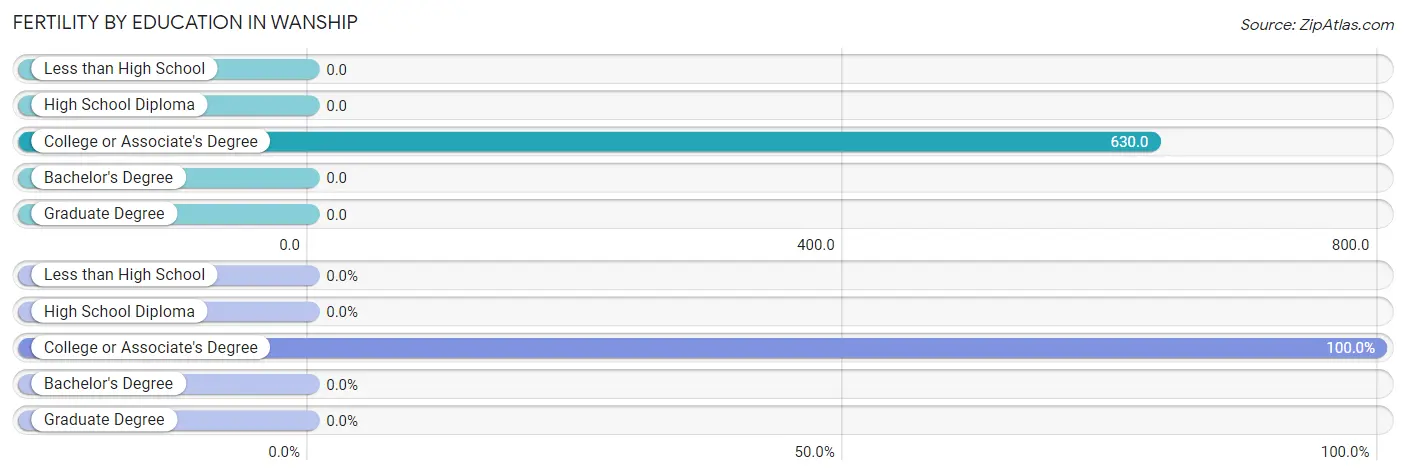
| Educational Attainment | Women with Births | Births / 1,000 Women |
| Less than High School | 0 (0.0%) | 0.0 |
| High School Diploma | 0 (0.0%) | 0.0 |
| College or Associate's Degree | 17 (100.0%) | 630.0 |
| Bachelor's Degree | 0 (0.0%) | 0.0 |
| Graduate Degree | 0 (0.0%) | 0.0 |
| Total | 17 (100.0%) | 362.0 |
Fertility by Education by Marriage Status in Wanship
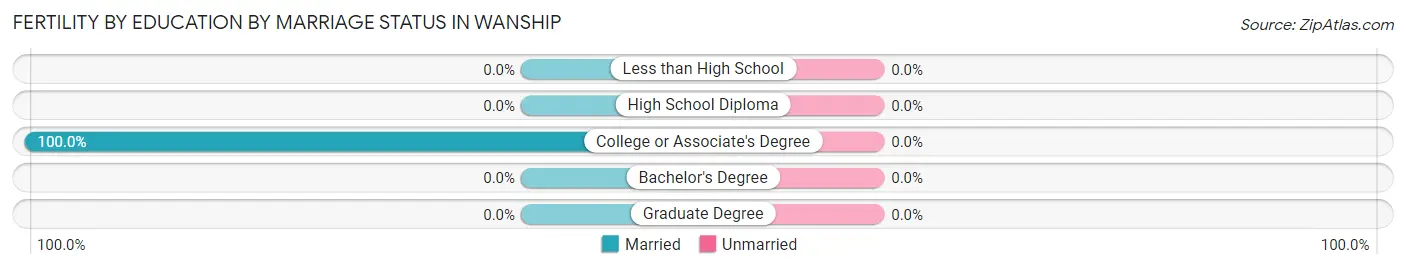
| Educational Attainment | Married | Unmarried |
| Less than High School | 0 (0.0%) | 0 (0.0%) |
| High School Diploma | 0 (0.0%) | 0 (0.0%) |
| College or Associate's Degree | 17 (100.0%) | 0 (0.0%) |
| Bachelor's Degree | 0 (0.0%) | 0 (0.0%) |
| Graduate Degree | 0 (0.0%) | 0 (0.0%) |
| Total | 17 (100.0%) | 0 (0.0%) |
Employment Characteristics in Wanship
Employment by Class of Employer in Wanship
Among the 192 employed individuals in Wanship, private company employees (142 | 74.0%), not-for-profit organizations (22 | 11.5%), and state government employees (11 | 5.7%) make up the most common classes of employment.
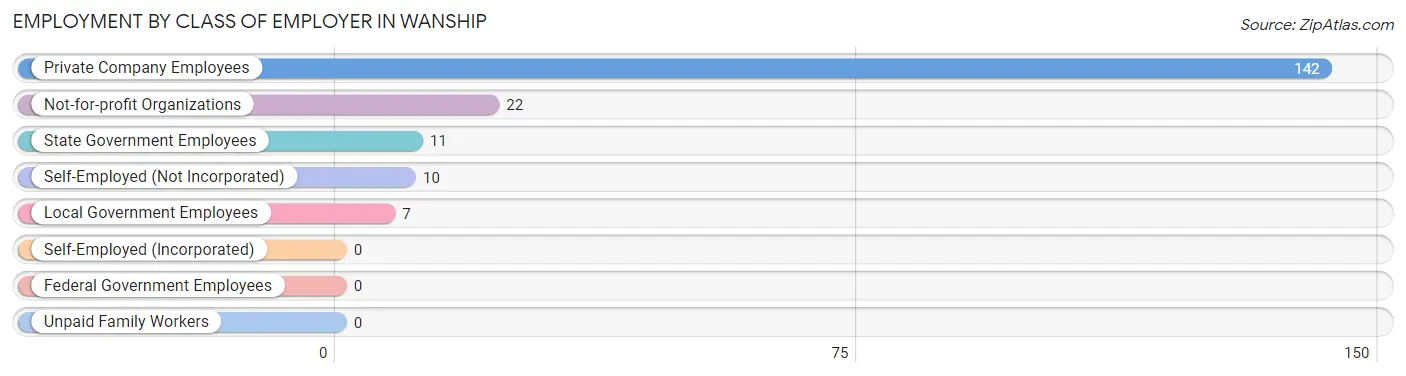
| Employer Class | # Employees | % Employees |
| Private Company Employees | 142 | 74.0% |
| Self-Employed (Incorporated) | 0 | 0.0% |
| Self-Employed (Not Incorporated) | 10 | 5.2% |
| Not-for-profit Organizations | 22 | 11.5% |
| Local Government Employees | 7 | 3.6% |
| State Government Employees | 11 | 5.7% |
| Federal Government Employees | 0 | 0.0% |
| Unpaid Family Workers | 0 | 0.0% |
| Total | 192 | 100.0% |
Employment Status by Age in Wanship
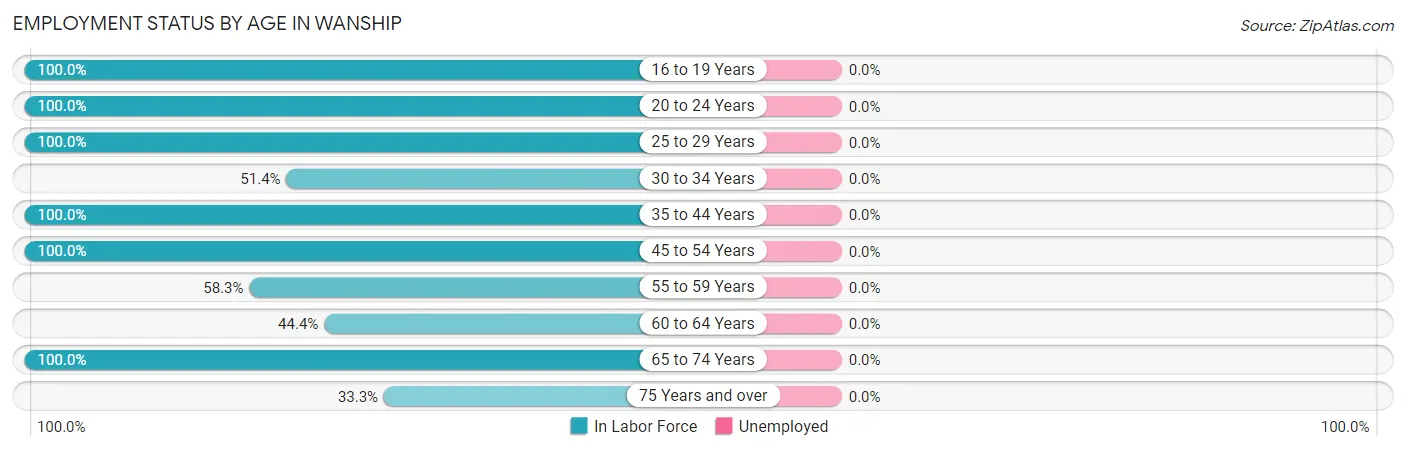
| Age Bracket | In Labor Force | Unemployed |
| 16 to 19 Years | 29 (100.0%) | 0 (0.0%) |
| 20 to 24 Years | 22 (100.0%) | 0 (0.0%) |
| 25 to 29 Years | 44 (100.0%) | 0 (0.0%) |
| 30 to 34 Years | 18 (51.4%) | 0 (0.0%) |
| 35 to 44 Years | 16 (100.0%) | 0 (0.0%) |
| 45 to 54 Years | 5 (100.0%) | 0 (0.0%) |
| 55 to 59 Years | 14 (58.3%) | 0 (0.0%) |
| 60 to 64 Years | 8 (44.4%) | 0 (0.0%) |
| 65 to 74 Years | 26 (100.0%) | 0 (0.0%) |
| 75 Years and over | 10 (33.3%) | 0 (0.0%) |
| Total | 192 (77.1%) | 0 (0.0%) |
Employment Status by Educational Attainment in Wanship
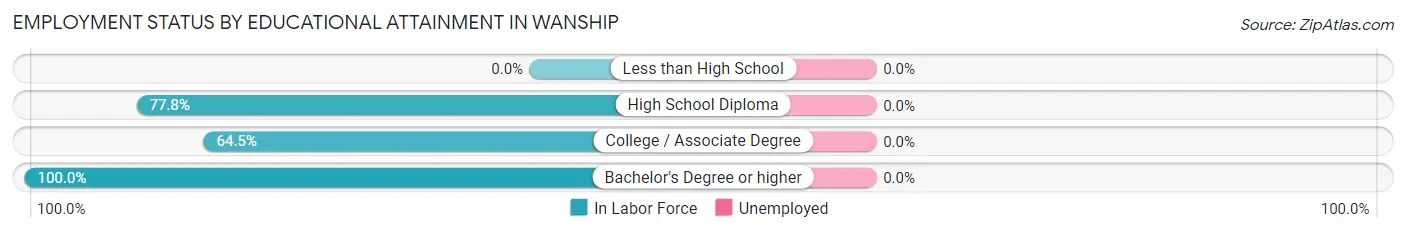
| Educational Attainment | In Labor Force | Unemployed |
| Less than High School | 0 (0.0%) | 0 (0.0%) |
| High School Diploma | 35 (77.8%) | 0 (0.0%) |
| College / Associate Degree | 49 (64.5%) | 0 (0.0%) |
| Bachelor's Degree or higher | 21 (100.0%) | 0 (0.0%) |
| Total | 105 (73.9%) | 0 (0.0%) |
Employment Occupations by Sex in Wanship
Management, Business, Science and Arts Occupations
The most common Management, Business, Science and Arts occupations in Wanship are Management (30 | 15.6%), Health Diagnosing & Treating (11 | 5.7%), Business & Financial (6 | 3.1%), and Health Technologists (4 | 2.1%).
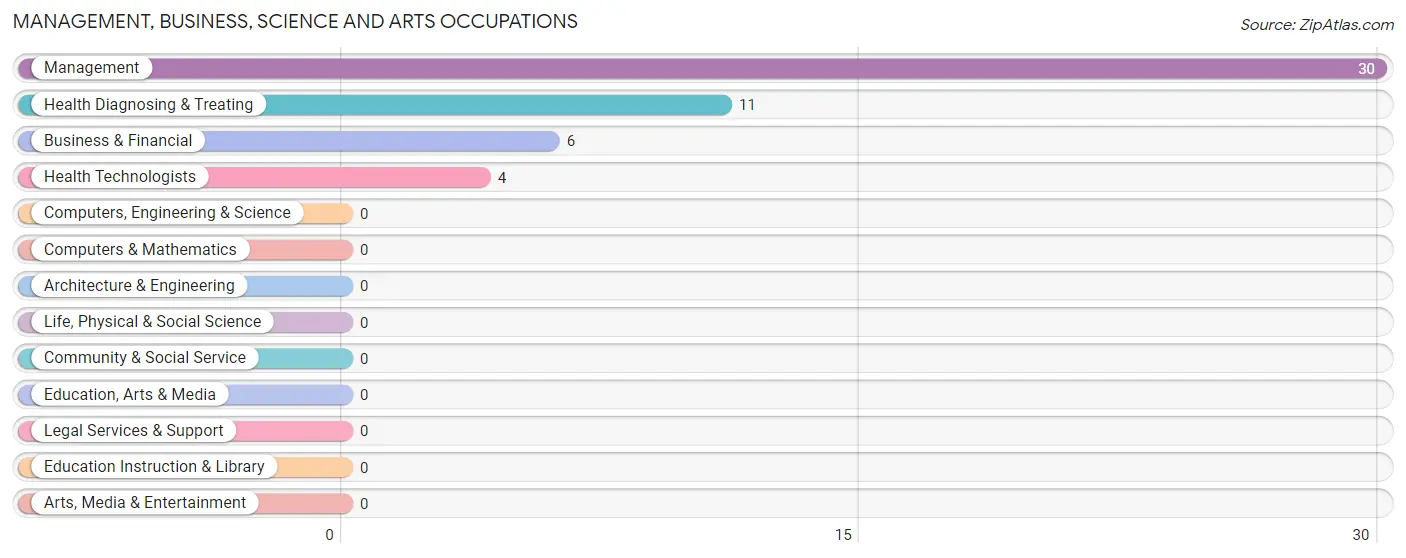
Management, Business, Science and Arts Occupations by Sex
Within the Management, Business, Science and Arts occupations in Wanship, the most male-oriented occupations are Health Diagnosing & Treating (63.6%), and Management (46.7%), while the most female-oriented occupations are Business & Financial (100.0%), Health Technologists (100.0%), and Management (53.3%).
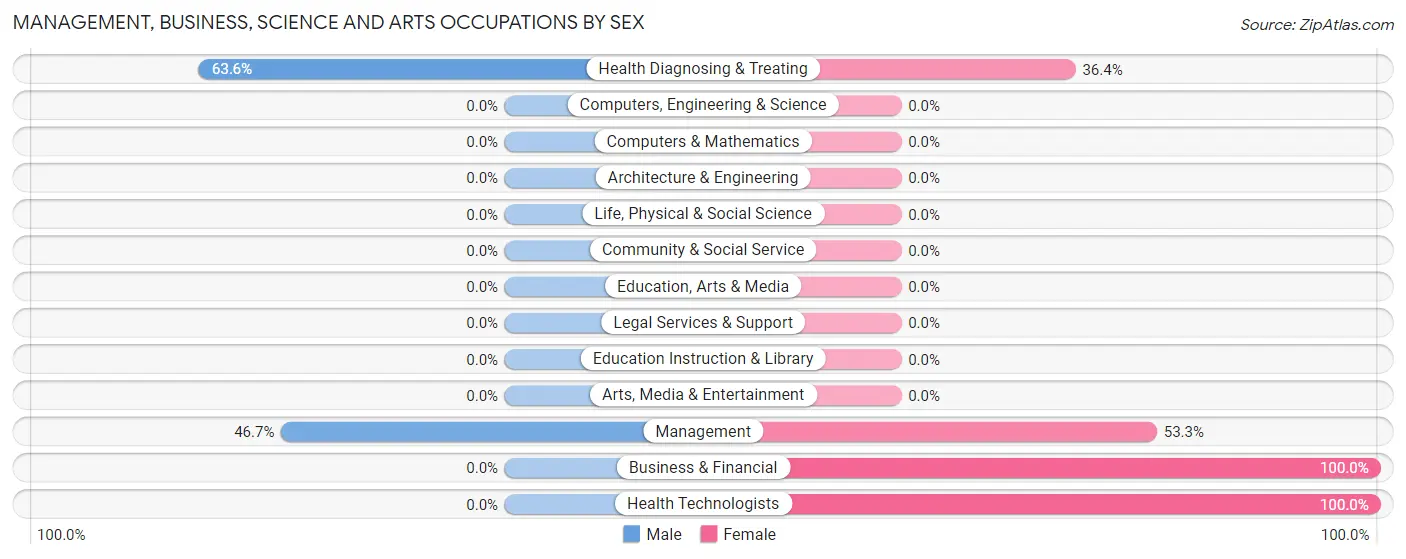
| Occupation | Male | Female |
| Management | 14 (46.7%) | 16 (53.3%) |
| Business & Financial | 0 (0.0%) | 6 (100.0%) |
| Computers, Engineering & Science | 0 (0.0%) | 0 (0.0%) |
| Computers & Mathematics | 0 (0.0%) | 0 (0.0%) |
| Architecture & Engineering | 0 (0.0%) | 0 (0.0%) |
| Life, Physical & Social Science | 0 (0.0%) | 0 (0.0%) |
| Community & Social Service | 0 (0.0%) | 0 (0.0%) |
| Education, Arts & Media | 0 (0.0%) | 0 (0.0%) |
| Legal Services & Support | 0 (0.0%) | 0 (0.0%) |
| Education Instruction & Library | 0 (0.0%) | 0 (0.0%) |
| Arts, Media & Entertainment | 0 (0.0%) | 0 (0.0%) |
| Health Diagnosing & Treating | 7 (63.6%) | 4 (36.4%) |
| Health Technologists | 0 (0.0%) | 4 (100.0%) |
| Total (Category) | 21 (44.7%) | 26 (55.3%) |
| Total (Overall) | 138 (71.9%) | 54 (28.1%) |
Services Occupations
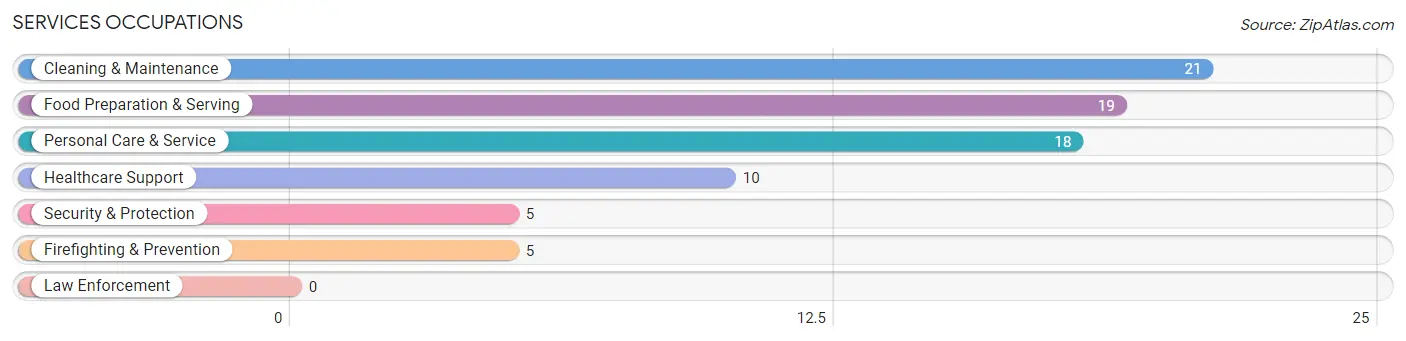
The most common Services occupations in Wanship are Cleaning & Maintenance (21 | 10.9%), Food Preparation & Serving (19 | 9.9%), Personal Care & Service (18 | 9.4%), Healthcare Support (10 | 5.2%), and Security & Protection (5 | 2.6%).
Services Occupations by Sex
Within the Services occupations in Wanship, the most male-oriented occupations are Security & Protection (100.0%), Firefighting & Prevention (100.0%), and Cleaning & Maintenance (100.0%), while the most female-oriented occupations are Healthcare Support (100.0%), and Food Preparation & Serving (52.6%).
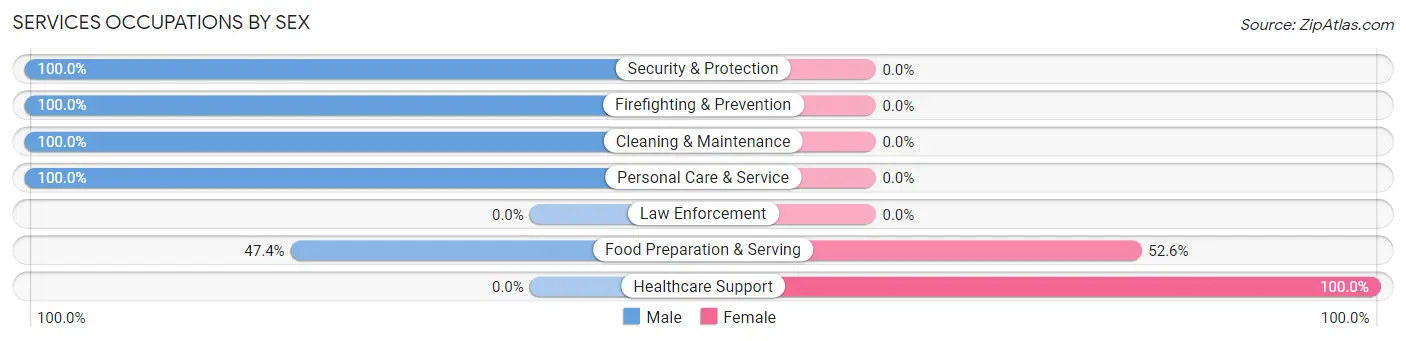
| Occupation | Male | Female |
| Healthcare Support | 0 (0.0%) | 10 (100.0%) |
| Security & Protection | 5 (100.0%) | 0 (0.0%) |
| Firefighting & Prevention | 5 (100.0%) | 0 (0.0%) |
| Law Enforcement | 0 (0.0%) | 0 (0.0%) |
| Food Preparation & Serving | 9 (47.4%) | 10 (52.6%) |
| Cleaning & Maintenance | 21 (100.0%) | 0 (0.0%) |
| Personal Care & Service | 18 (100.0%) | 0 (0.0%) |
| Total (Category) | 53 (72.6%) | 20 (27.4%) |
| Total (Overall) | 138 (71.9%) | 54 (28.1%) |
Sales and Office Occupations
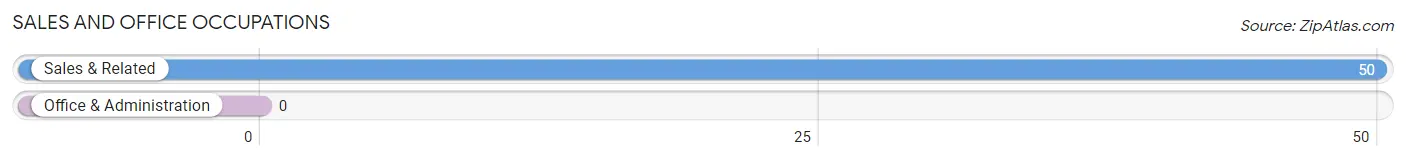
The most common Sales and Office occupations in Wanship are , and Sales & Related (50 | 26.0%).
Sales and Office Occupations by Sex
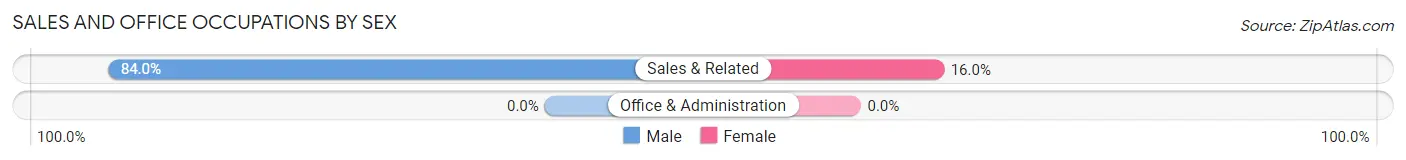
| Occupation | Male | Female |
| Sales & Related | 42 (84.0%) | 8 (16.0%) |
| Office & Administration | 0 (0.0%) | 0 (0.0%) |
| Total (Category) | 42 (84.0%) | 8 (16.0%) |
| Total (Overall) | 138 (71.9%) | 54 (28.1%) |
Natural Resources, Construction and Maintenance Occupations
The most common Natural Resources, Construction and Maintenance occupations in Wanship are , and Construction & Extraction (4 | 2.1%).
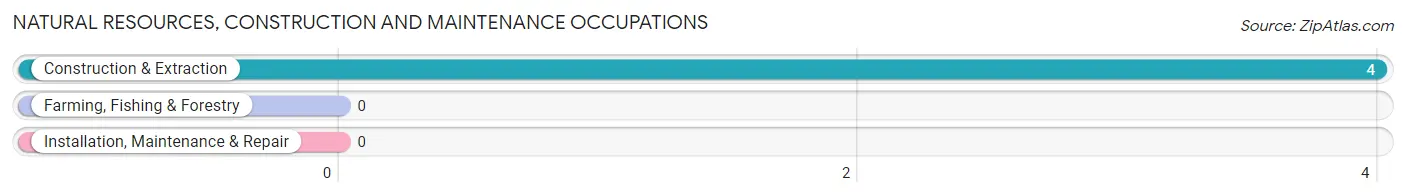
Natural Resources, Construction and Maintenance Occupations by Sex
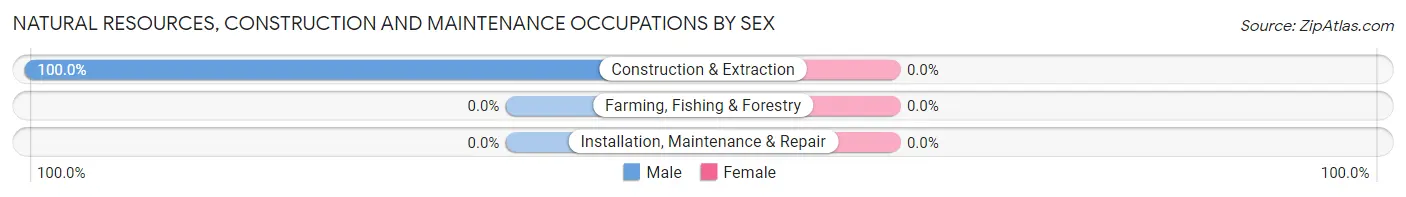
| Occupation | Male | Female |
| Farming, Fishing & Forestry | 0 (0.0%) | 0 (0.0%) |
| Construction & Extraction | 4 (100.0%) | 0 (0.0%) |
| Installation, Maintenance & Repair | 0 (0.0%) | 0 (0.0%) |
| Total (Category) | 4 (100.0%) | 0 (0.0%) |
| Total (Overall) | 138 (71.9%) | 54 (28.1%) |
Production, Transportation and Moving Occupations
The most common Production, Transportation and Moving occupations in Wanship are , and Transportation (18 | 9.4%).
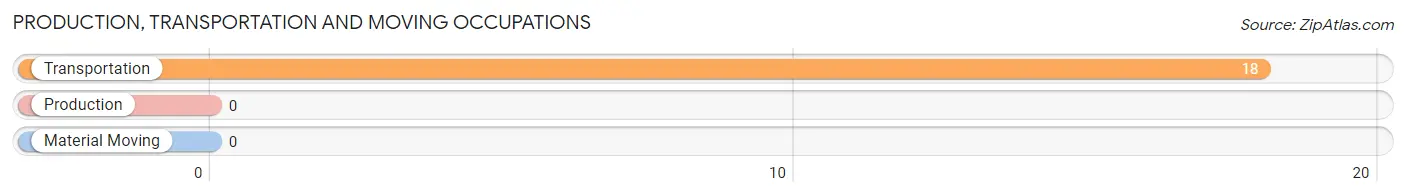
Production, Transportation and Moving Occupations by Sex
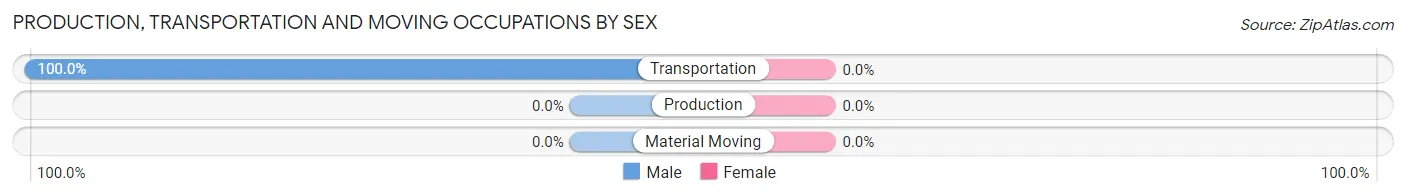
| Occupation | Male | Female |
| Production | 0 (0.0%) | 0 (0.0%) |
| Transportation | 18 (100.0%) | 0 (0.0%) |
| Material Moving | 0 (0.0%) | 0 (0.0%) |
| Total (Category) | 18 (100.0%) | 0 (0.0%) |
| Total (Overall) | 138 (71.9%) | 54 (28.1%) |
Employment Industries by Sex in Wanship
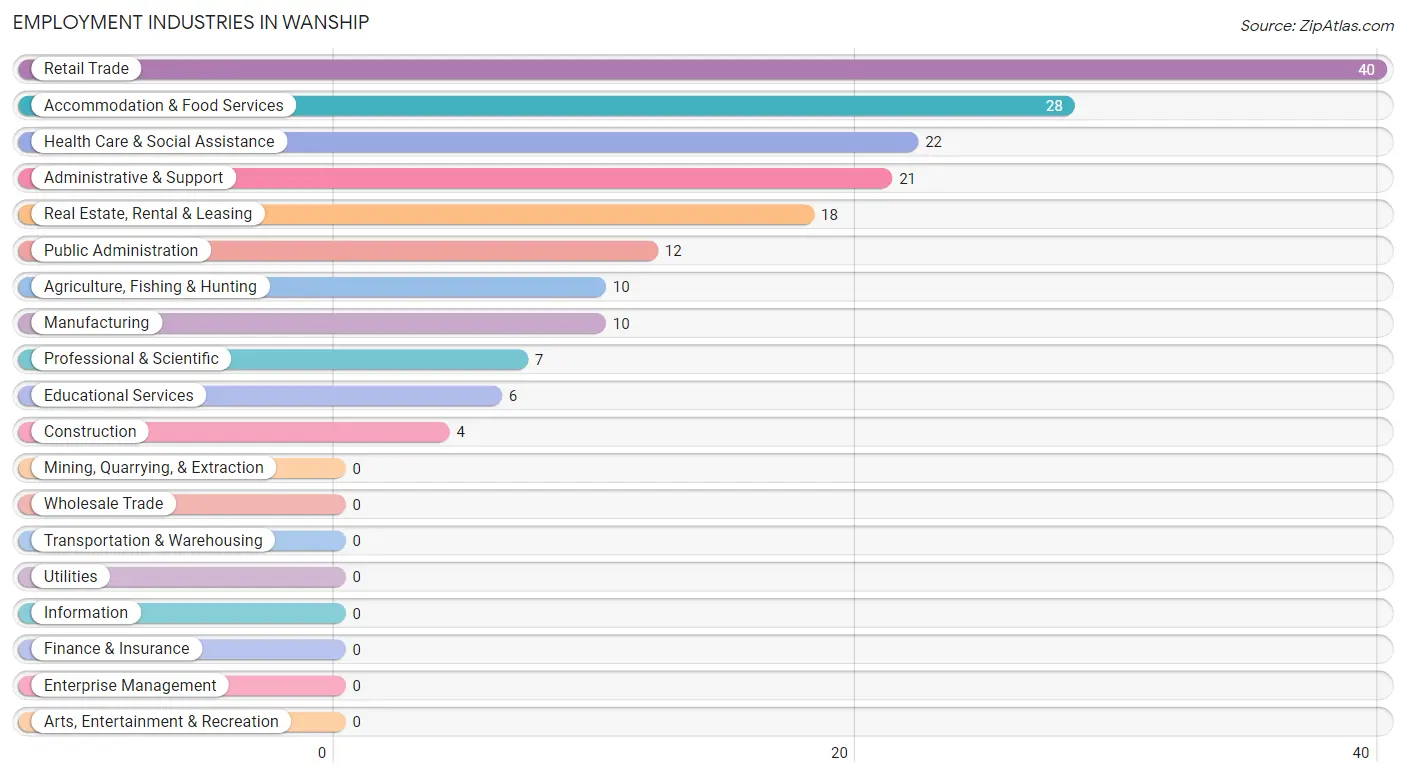
Employment Industries in Wanship
The major employment industries in Wanship include Retail Trade (40 | 20.8%), Accommodation & Food Services (28 | 14.6%), Health Care & Social Assistance (22 | 11.5%), Administrative & Support (21 | 10.9%), and Real Estate, Rental & Leasing (18 | 9.4%).
Employment Industries by Sex in Wanship
The Wanship industries that see more men than women are Agriculture, Fishing & Hunting (100.0%), Construction (100.0%), and Manufacturing (100.0%), whereas the industries that tend to have a higher number of women are Professional & Scientific (100.0%), Educational Services (100.0%), and Health Care & Social Assistance (100.0%).
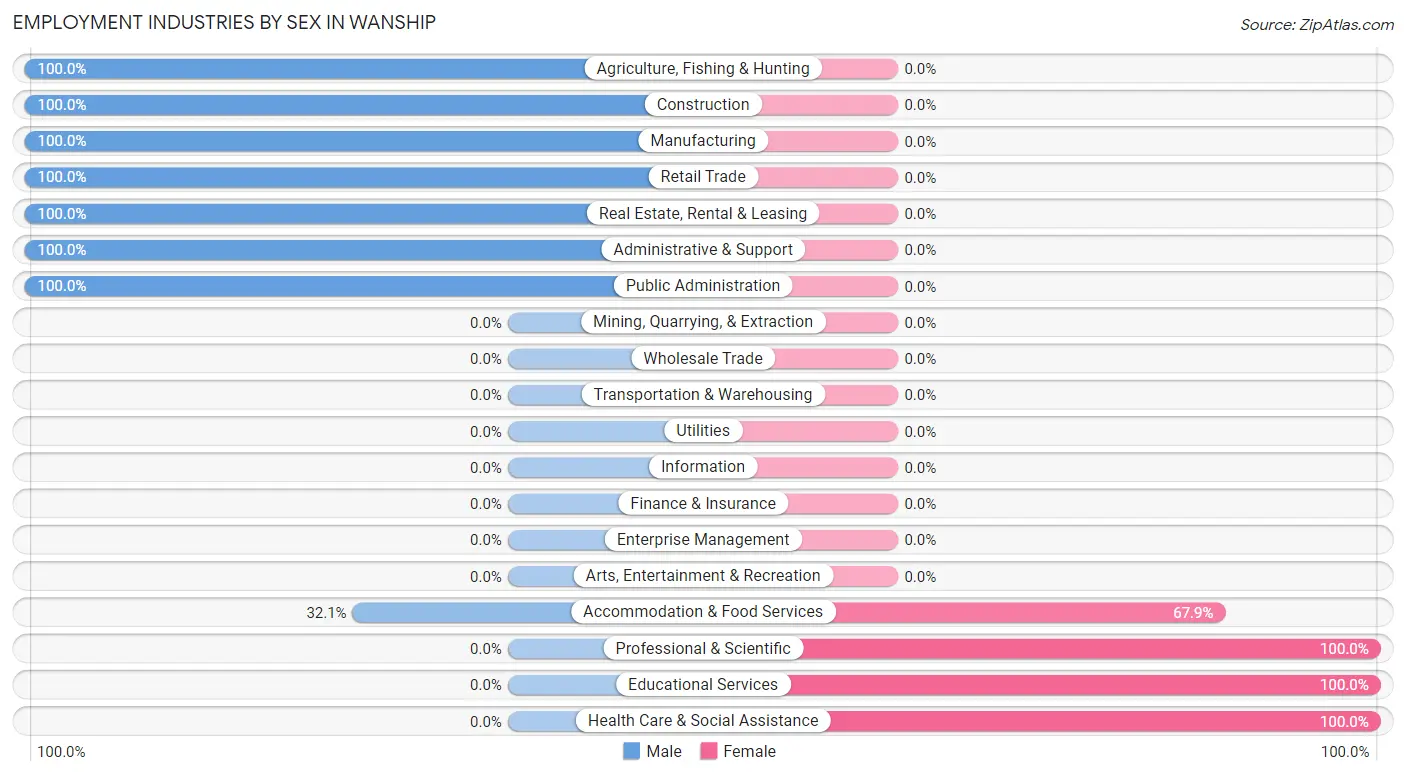
| Industry | Male | Female |
| Agriculture, Fishing & Hunting | 10 (100.0%) | 0 (0.0%) |
| Mining, Quarrying, & Extraction | 0 (0.0%) | 0 (0.0%) |
| Construction | 4 (100.0%) | 0 (0.0%) |
| Manufacturing | 10 (100.0%) | 0 (0.0%) |
| Wholesale Trade | 0 (0.0%) | 0 (0.0%) |
| Retail Trade | 40 (100.0%) | 0 (0.0%) |
| Transportation & Warehousing | 0 (0.0%) | 0 (0.0%) |
| Utilities | 0 (0.0%) | 0 (0.0%) |
| Information | 0 (0.0%) | 0 (0.0%) |
| Finance & Insurance | 0 (0.0%) | 0 (0.0%) |
| Real Estate, Rental & Leasing | 18 (100.0%) | 0 (0.0%) |
| Professional & Scientific | 0 (0.0%) | 7 (100.0%) |
| Enterprise Management | 0 (0.0%) | 0 (0.0%) |
| Administrative & Support | 21 (100.0%) | 0 (0.0%) |
| Educational Services | 0 (0.0%) | 6 (100.0%) |
| Health Care & Social Assistance | 0 (0.0%) | 22 (100.0%) |
| Arts, Entertainment & Recreation | 0 (0.0%) | 0 (0.0%) |
| Accommodation & Food Services | 9 (32.1%) | 19 (67.9%) |
| Public Administration | 12 (100.0%) | 0 (0.0%) |
| Total | 138 (71.9%) | 54 (28.1%) |
Education in Wanship
School Enrollment in Wanship
The most common levels of schooling among the 84 students in Wanship are elementary school (35 | 41.7%), college / undergraduate (20 | 23.8%), and high school (19 | 22.6%).
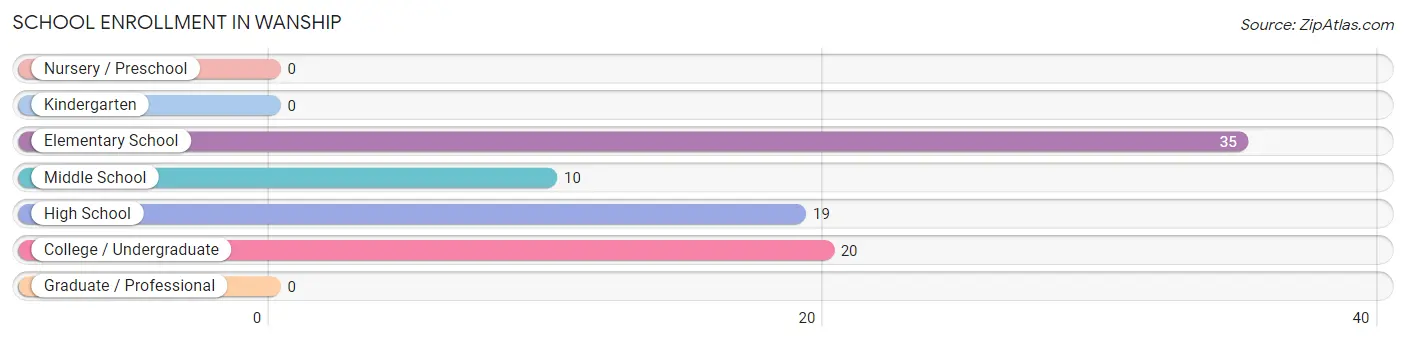
| School Level | # Students | % Students |
| Nursery / Preschool | 0 | 0.0% |
| Kindergarten | 0 | 0.0% |
| Elementary School | 35 | 41.7% |
| Middle School | 10 | 11.9% |
| High School | 19 | 22.6% |
| College / Undergraduate | 20 | 23.8% |
| Graduate / Professional | 0 | 0.0% |
| Total | 84 | 100.0% |
School Enrollment by Age by Funding Source in Wanship
Out of a total of 84 students who are enrolled in schools in Wanship, 20 (23.8%) attend a private institution, while the remaining 64 (76.2%) are enrolled in public schools. The age group of 18 to 19 year olds has the highest likelihood of being enrolled in private schools, with 10 (100.0% in the age bracket) enrolled. Conversely, the age group of 5 to 9 year old has the lowest likelihood of being enrolled in a private school, with 35 (100.0% in the age bracket) attending a public institution.
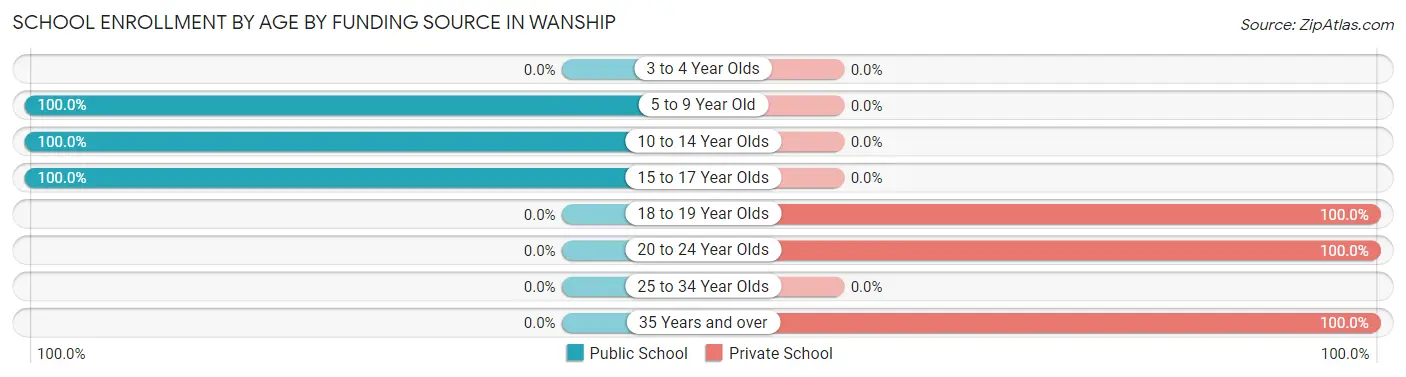
| Age Bracket | Public School | Private School |
| 3 to 4 Year Olds | 0 (0.0%) | 0 (0.0%) |
| 5 to 9 Year Old | 35 (100.0%) | 0 (0.0%) |
| 10 to 14 Year Olds | 10 (100.0%) | 0 (0.0%) |
| 15 to 17 Year Olds | 19 (100.0%) | 0 (0.0%) |
| 18 to 19 Year Olds | 0 (0.0%) | 10 (100.0%) |
| 20 to 24 Year Olds | 0 (0.0%) | 4 (100.0%) |
| 25 to 34 Year Olds | 0 (0.0%) | 0 (0.0%) |
| 35 Years and over | 0 (0.0%) | 6 (100.0%) |
| Total | 64 (76.2%) | 20 (23.8%) |
Educational Attainment by Field of Study in Wanship
Social sciences (14 | 34.2%), literature & languages (10 | 24.4%), arts & humanities (10 | 24.4%), and communications (7 | 17.1%) are the most common fields of study among 41 individuals in Wanship who have obtained a bachelor's degree or higher.
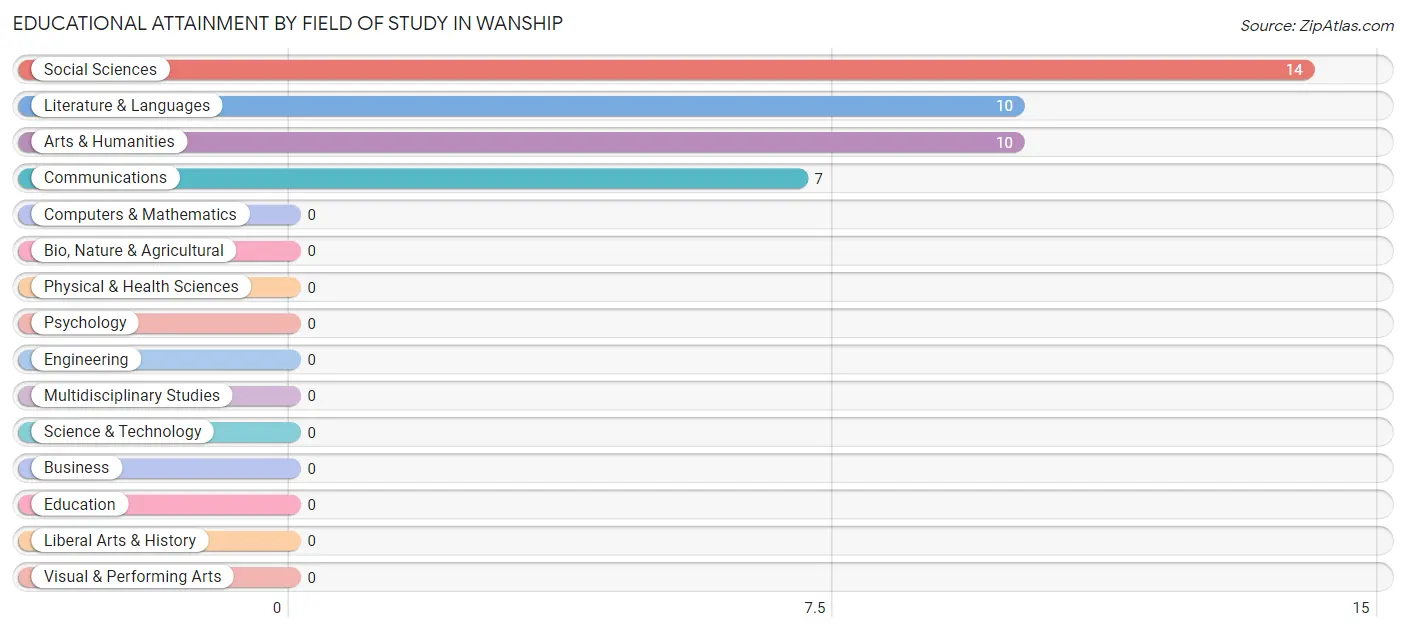
| Field of Study | # Graduates | % Graduates |
| Computers & Mathematics | 0 | 0.0% |
| Bio, Nature & Agricultural | 0 | 0.0% |
| Physical & Health Sciences | 0 | 0.0% |
| Psychology | 0 | 0.0% |
| Social Sciences | 14 | 34.2% |
| Engineering | 0 | 0.0% |
| Multidisciplinary Studies | 0 | 0.0% |
| Science & Technology | 0 | 0.0% |
| Business | 0 | 0.0% |
| Education | 0 | 0.0% |
| Literature & Languages | 10 | 24.4% |
| Liberal Arts & History | 0 | 0.0% |
| Visual & Performing Arts | 0 | 0.0% |
| Communications | 7 | 17.1% |
| Arts & Humanities | 10 | 24.4% |
| Total | 41 | 100.0% |
Transportation & Commute in Wanship
Vehicle Availability by Sex in Wanship
The most prevalent vehicle ownership categories in Wanship are males with 5 or more vehicles (89, accounting for 64.5%) and females with 5 or more vehicles (17, making up 164.8%).
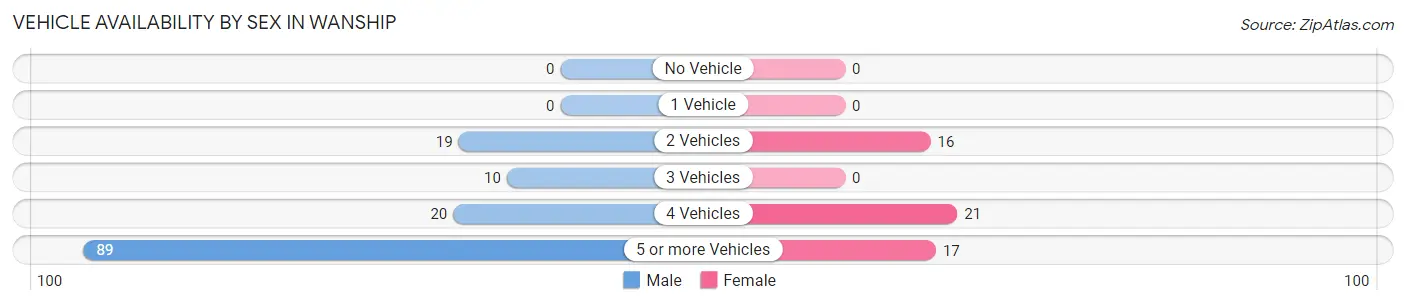
| Vehicles Available | Male | Female |
| No Vehicle | 0 (0.0%) | 0 (0.0%) |
| 1 Vehicle | 0 (0.0%) | 0 (0.0%) |
| 2 Vehicles | 19 (13.8%) | 16 (29.6%) |
| 3 Vehicles | 10 (7.2%) | 0 (0.0%) |
| 4 Vehicles | 20 (14.5%) | 21 (38.9%) |
| 5 or more Vehicles | 89 (64.5%) | 17 (31.5%) |
| Total | 138 (100.0%) | 54 (100.0%) |
Commute Time in Wanship
The most frequently occuring commute durations in Wanship are 30 to 34 minutes (44 commuters, 25.1%), 15 to 19 minutes (37 commuters, 21.1%), and 20 to 24 minutes (27 commuters, 15.4%).
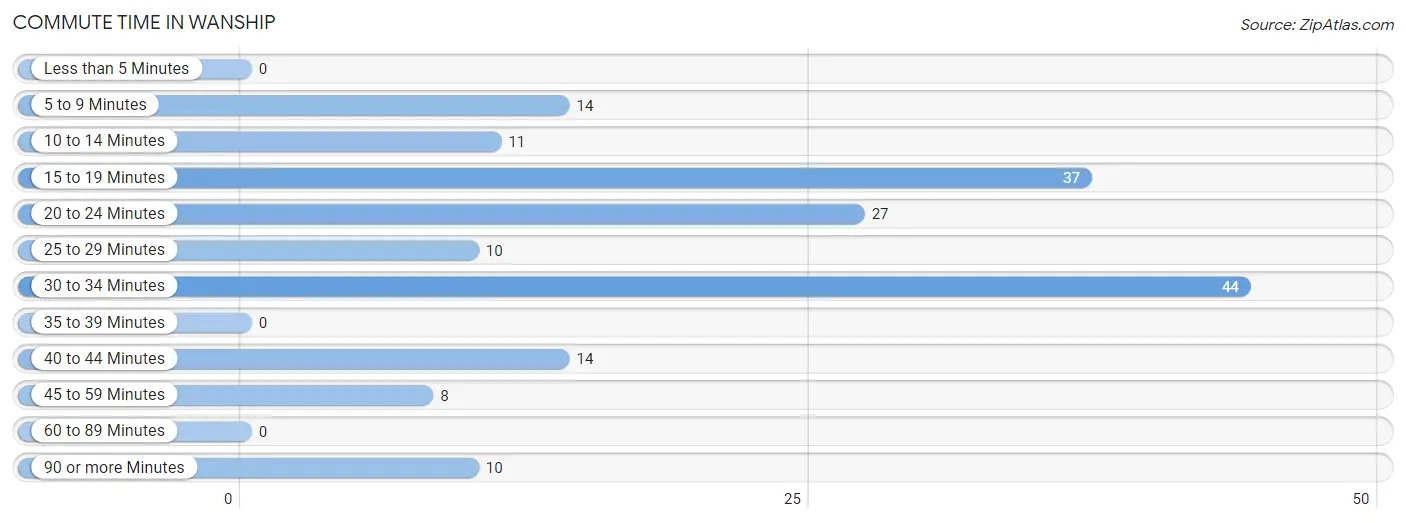
| Commute Time | # Commuters | % Commuters |
| Less than 5 Minutes | 0 | 0.0% |
| 5 to 9 Minutes | 14 | 8.0% |
| 10 to 14 Minutes | 11 | 6.3% |
| 15 to 19 Minutes | 37 | 21.1% |
| 20 to 24 Minutes | 27 | 15.4% |
| 25 to 29 Minutes | 10 | 5.7% |
| 30 to 34 Minutes | 44 | 25.1% |
| 35 to 39 Minutes | 0 | 0.0% |
| 40 to 44 Minutes | 14 | 8.0% |
| 45 to 59 Minutes | 8 | 4.6% |
| 60 to 89 Minutes | 0 | 0.0% |
| 90 or more Minutes | 10 | 5.7% |
Commute Time by Sex in Wanship
The most common commute times in Wanship are 30 to 34 minutes (44 commuters, 34.4%) for males and 15 to 19 minutes (10 commuters, 21.3%) for females.
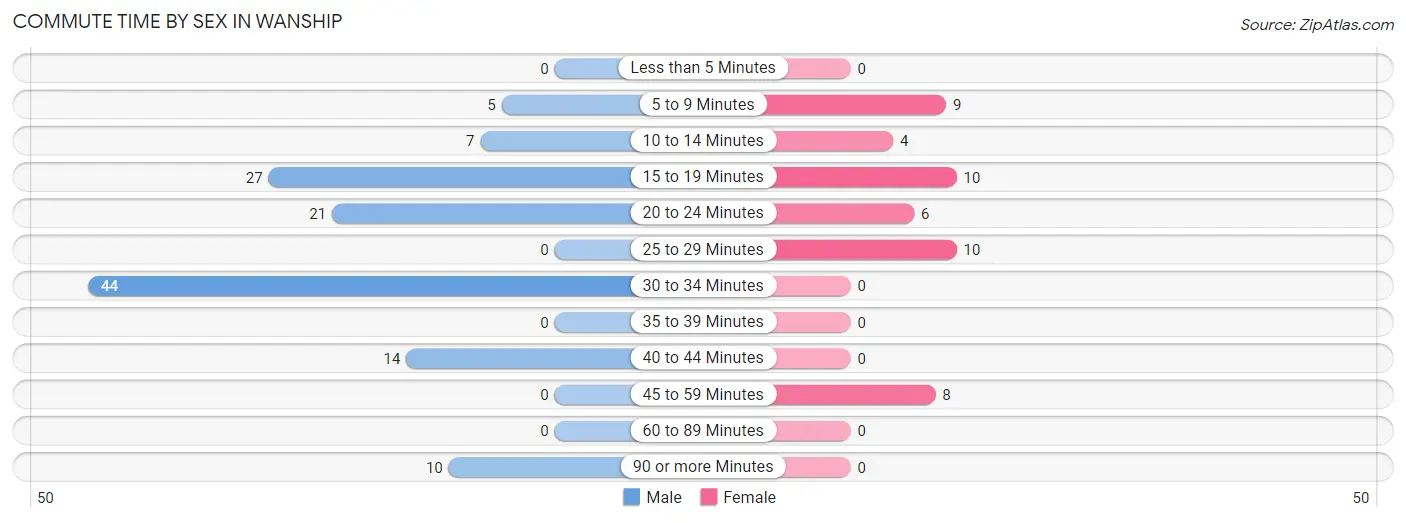
| Commute Time | Male | Female |
| Less than 5 Minutes | 0 (0.0%) | 0 (0.0%) |
| 5 to 9 Minutes | 5 (3.9%) | 9 (19.2%) |
| 10 to 14 Minutes | 7 (5.5%) | 4 (8.5%) |
| 15 to 19 Minutes | 27 (21.1%) | 10 (21.3%) |
| 20 to 24 Minutes | 21 (16.4%) | 6 (12.8%) |
| 25 to 29 Minutes | 0 (0.0%) | 10 (21.3%) |
| 30 to 34 Minutes | 44 (34.4%) | 0 (0.0%) |
| 35 to 39 Minutes | 0 (0.0%) | 0 (0.0%) |
| 40 to 44 Minutes | 14 (10.9%) | 0 (0.0%) |
| 45 to 59 Minutes | 0 (0.0%) | 8 (17.0%) |
| 60 to 89 Minutes | 0 (0.0%) | 0 (0.0%) |
| 90 or more Minutes | 10 (7.8%) | 0 (0.0%) |
Time of Departure to Work by Sex in Wanship
The most frequent times of departure to work in Wanship are 6:00 AM to 6:29 AM (28, 21.9%) for males and 4:00 PM to 11:59 PM (19, 40.4%) for females.
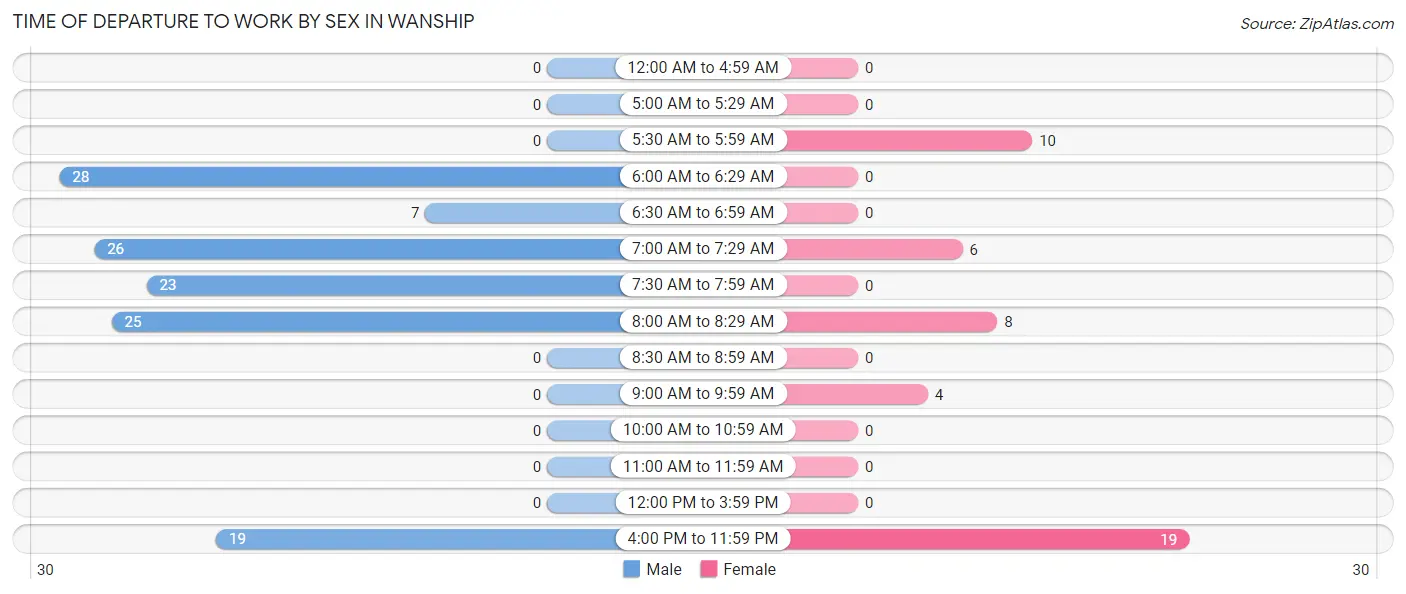
| Time of Departure | Male | Female |
| 12:00 AM to 4:59 AM | 0 (0.0%) | 0 (0.0%) |
| 5:00 AM to 5:29 AM | 0 (0.0%) | 0 (0.0%) |
| 5:30 AM to 5:59 AM | 0 (0.0%) | 10 (21.3%) |
| 6:00 AM to 6:29 AM | 28 (21.9%) | 0 (0.0%) |
| 6:30 AM to 6:59 AM | 7 (5.5%) | 0 (0.0%) |
| 7:00 AM to 7:29 AM | 26 (20.3%) | 6 (12.8%) |
| 7:30 AM to 7:59 AM | 23 (18.0%) | 0 (0.0%) |
| 8:00 AM to 8:29 AM | 25 (19.5%) | 8 (17.0%) |
| 8:30 AM to 8:59 AM | 0 (0.0%) | 0 (0.0%) |
| 9:00 AM to 9:59 AM | 0 (0.0%) | 4 (8.5%) |
| 10:00 AM to 10:59 AM | 0 (0.0%) | 0 (0.0%) |
| 11:00 AM to 11:59 AM | 0 (0.0%) | 0 (0.0%) |
| 12:00 PM to 3:59 PM | 0 (0.0%) | 0 (0.0%) |
| 4:00 PM to 11:59 PM | 19 (14.8%) | 19 (40.4%) |
| Total | 128 (100.0%) | 47 (100.0%) |
Housing Occupancy in Wanship
Occupancy by Ownership in Wanship
Of the total 88 dwellings in Wanship, owner-occupied units account for 88 (100.0%), while renter-occupied units make up 0 (0.0%).
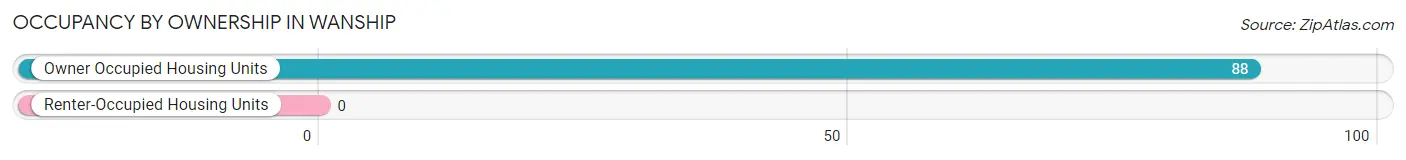
| Occupancy | # Housing Units | % Housing Units |
| Owner Occupied Housing Units | 88 | 100.0% |
| Renter-Occupied Housing Units | 0 | 0.0% |
| Total Occupied Housing Units | 88 | 100.0% |
Occupancy by Household Size in Wanship
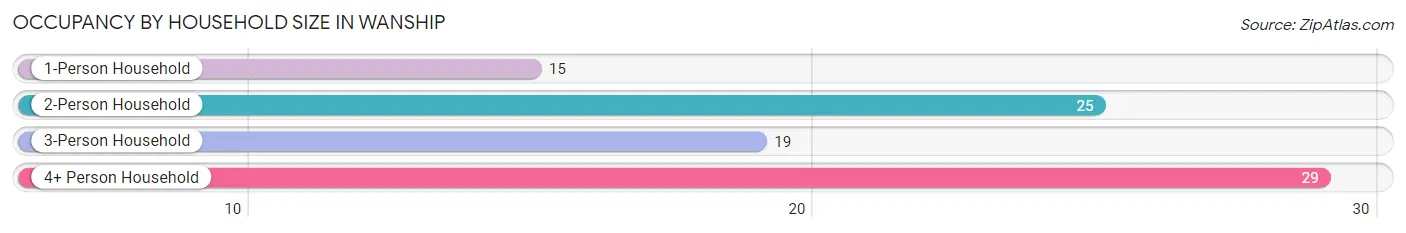
| Household Size | # Housing Units | % Housing Units |
| 1-Person Household | 15 | 17.1% |
| 2-Person Household | 25 | 28.4% |
| 3-Person Household | 19 | 21.6% |
| 4+ Person Household | 29 | 33.0% |
| Total Housing Units | 88 | 100.0% |
Occupancy by Ownership by Household Size in Wanship
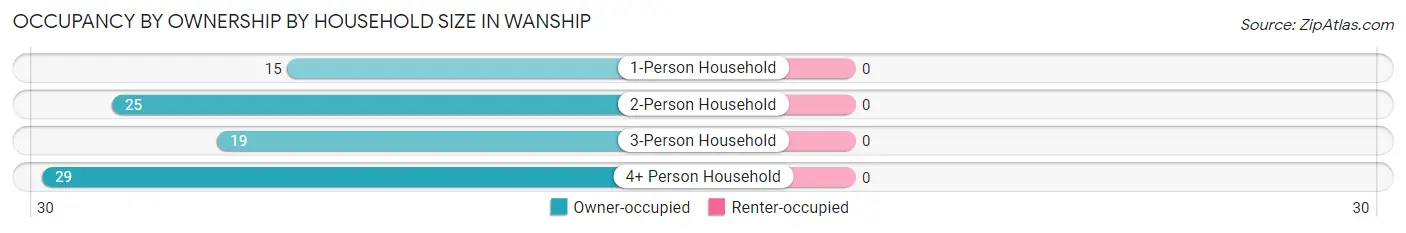
| Household Size | Owner-occupied | Renter-occupied |
| 1-Person Household | 15 (100.0%) | 0 (0.0%) |
| 2-Person Household | 25 (100.0%) | 0 (0.0%) |
| 3-Person Household | 19 (100.0%) | 0 (0.0%) |
| 4+ Person Household | 29 (100.0%) | 0 (0.0%) |
| Total Housing Units | 88 (100.0%) | 0 (0.0%) |
Occupancy by Educational Attainment in Wanship
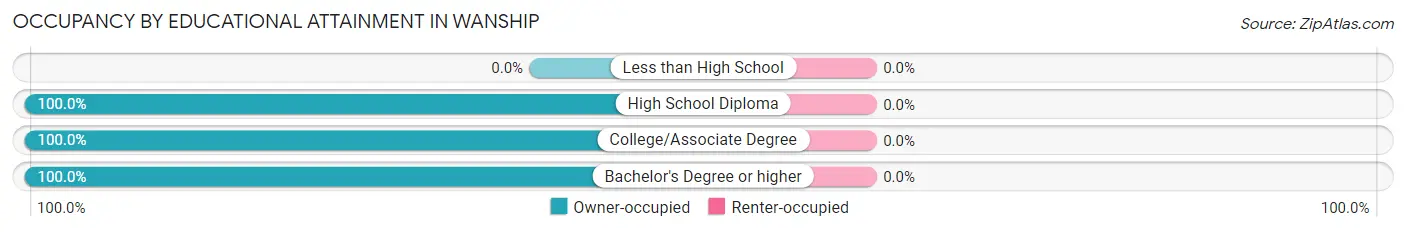
| Household Size | Owner-occupied | Renter-occupied |
| Less than High School | 0 (0.0%) | 0 (0.0%) |
| High School Diploma | 15 (100.0%) | 0 (0.0%) |
| College/Associate Degree | 49 (100.0%) | 0 (0.0%) |
| Bachelor's Degree or higher | 24 (100.0%) | 0 (0.0%) |
Occupancy by Age of Householder in Wanship
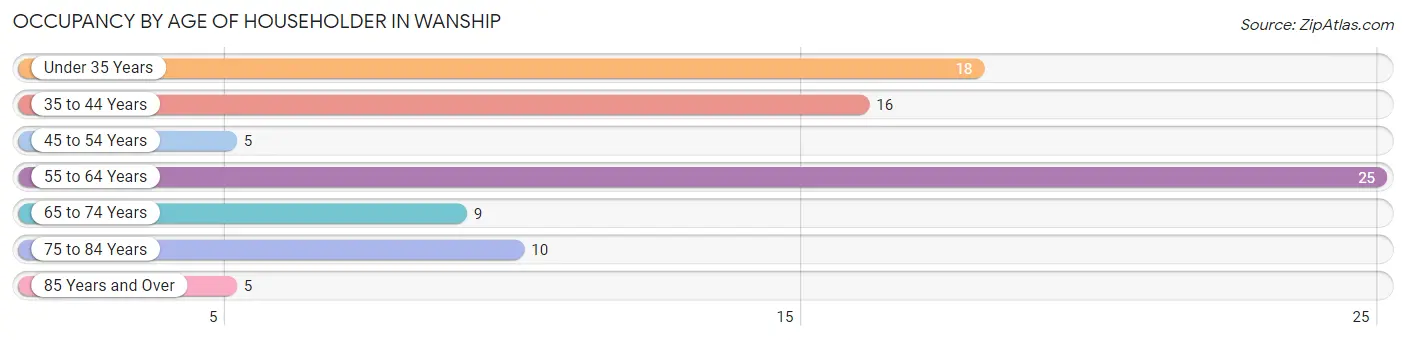
| Age Bracket | # Households | % Households |
| Under 35 Years | 18 | 20.4% |
| 35 to 44 Years | 16 | 18.2% |
| 45 to 54 Years | 5 | 5.7% |
| 55 to 64 Years | 25 | 28.4% |
| 65 to 74 Years | 9 | 10.2% |
| 75 to 84 Years | 10 | 11.4% |
| 85 Years and Over | 5 | 5.7% |
| Total | 88 | 100.0% |
Housing Finances in Wanship
Median Income by Occupancy in Wanship
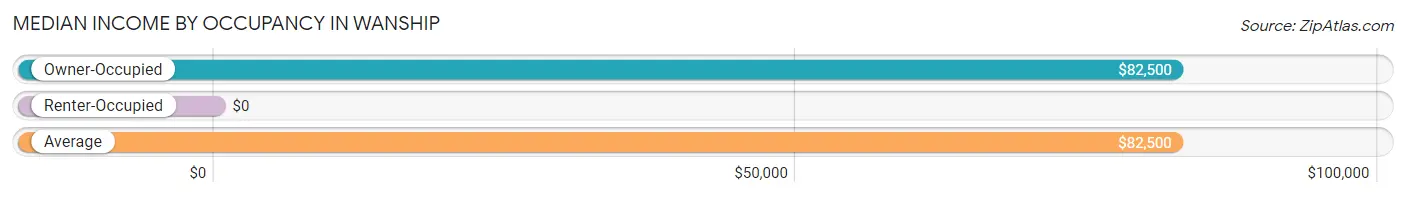
| Occupancy Type | # Households | Median Income |
| Owner-Occupied | 88 (100.0%) | $82,500 |
| Renter-Occupied | 0 (0.0%) | $0 |
| Average | 88 (100.0%) | $82,500 |
Occupancy by Householder Income Bracket in Wanship
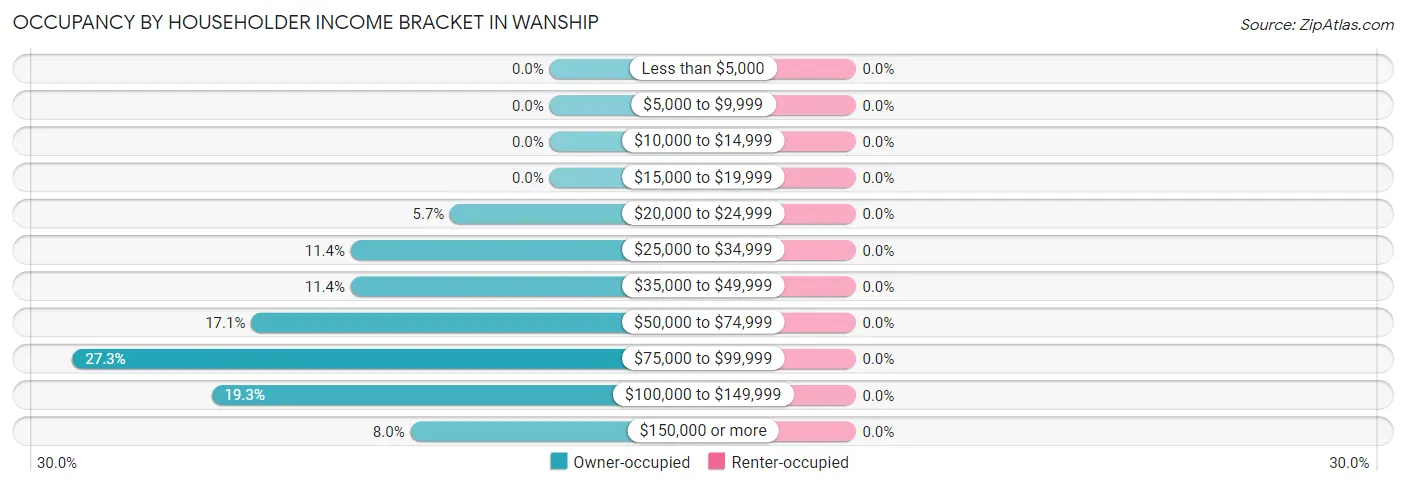
| Income Bracket | Owner-occupied | Renter-occupied |
| Less than $5,000 | 0 (0.0%) | 0 (0.0%) |
| $5,000 to $9,999 | 0 (0.0%) | 0 (0.0%) |
| $10,000 to $14,999 | 0 (0.0%) | 0 (0.0%) |
| $15,000 to $19,999 | 0 (0.0%) | 0 (0.0%) |
| $20,000 to $24,999 | 5 (5.7%) | 0 (0.0%) |
| $25,000 to $34,999 | 10 (11.4%) | 0 (0.0%) |
| $35,000 to $49,999 | 10 (11.4%) | 0 (0.0%) |
| $50,000 to $74,999 | 15 (17.1%) | 0 (0.0%) |
| $75,000 to $99,999 | 24 (27.3%) | 0 (0.0%) |
| $100,000 to $149,999 | 17 (19.3%) | 0 (0.0%) |
| $150,000 or more | 7 (8.0%) | 0 (0.0%) |
| Total | 88 (100.0%) | 0 (0.0%) |
Monthly Housing Cost Tiers in Wanship
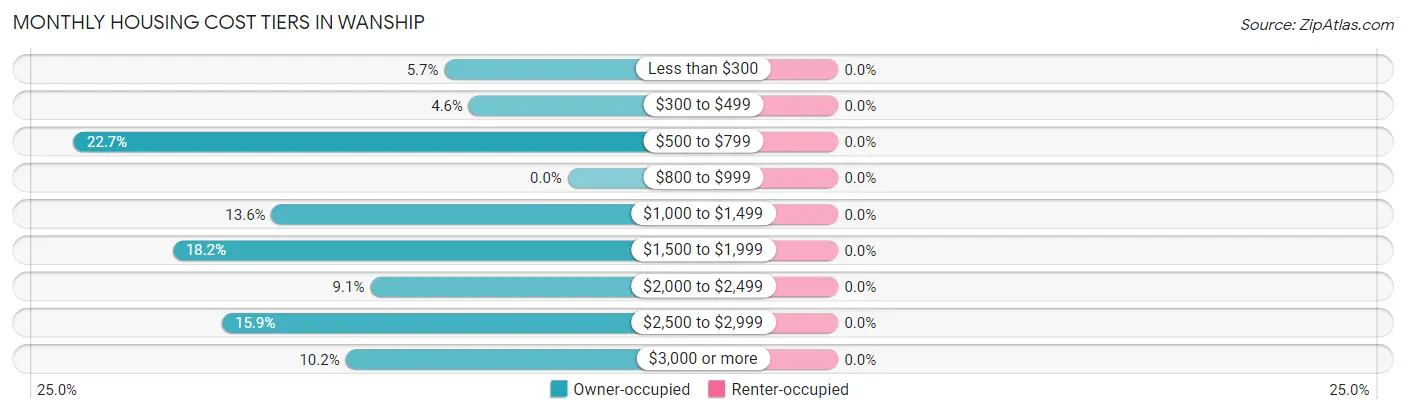
| Monthly Cost | Owner-occupied | Renter-occupied |
| Less than $300 | 5 (5.7%) | 0 (0.0%) |
| $300 to $499 | 4 (4.5%) | 0 (0.0%) |
| $500 to $799 | 20 (22.7%) | 0 (0.0%) |
| $800 to $999 | 0 (0.0%) | 0 (0.0%) |
| $1,000 to $1,499 | 12 (13.6%) | 0 (0.0%) |
| $1,500 to $1,999 | 16 (18.2%) | 0 (0.0%) |
| $2,000 to $2,499 | 8 (9.1%) | 0 (0.0%) |
| $2,500 to $2,999 | 14 (15.9%) | 0 (0.0%) |
| $3,000 or more | 9 (10.2%) | 0 (0.0%) |
| Total | 88 (100.0%) | 0 (0.0%) |
Physical Housing Characteristics in Wanship
Housing Structures in Wanship
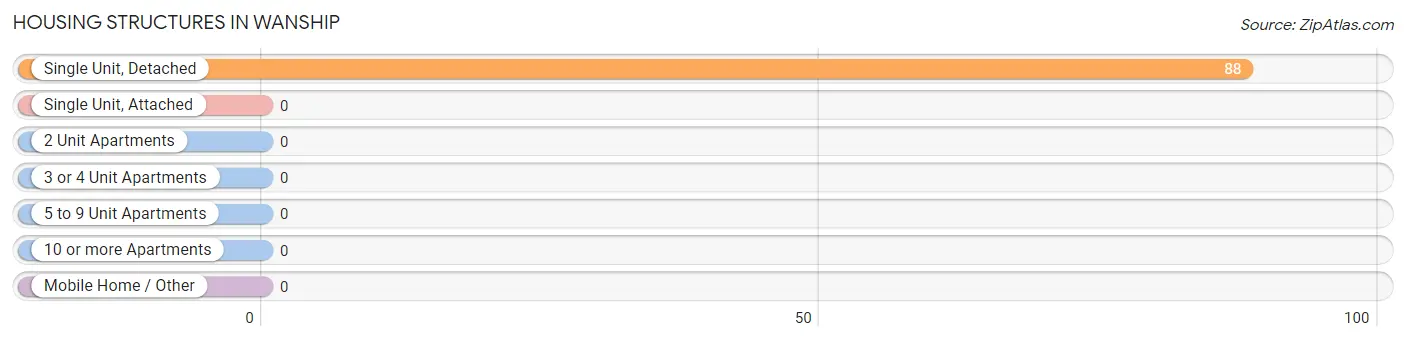
| Structure Type | # Housing Units | % Housing Units |
| Single Unit, Detached | 88 | 100.0% |
| Single Unit, Attached | 0 | 0.0% |
| 2 Unit Apartments | 0 | 0.0% |
| 3 or 4 Unit Apartments | 0 | 0.0% |
| 5 to 9 Unit Apartments | 0 | 0.0% |
| 10 or more Apartments | 0 | 0.0% |
| Mobile Home / Other | 0 | 0.0% |
| Total | 88 | 100.0% |
Housing Structures by Occupancy in Wanship
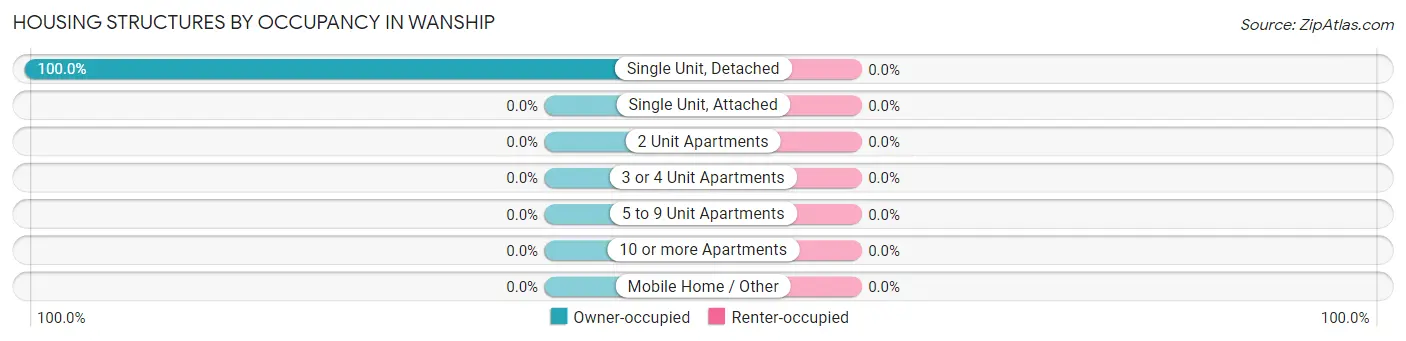
| Structure Type | Owner-occupied | Renter-occupied |
| Single Unit, Detached | 88 (100.0%) | 0 (0.0%) |
| Single Unit, Attached | 0 (0.0%) | 0 (0.0%) |
| 2 Unit Apartments | 0 (0.0%) | 0 (0.0%) |
| 3 or 4 Unit Apartments | 0 (0.0%) | 0 (0.0%) |
| 5 to 9 Unit Apartments | 0 (0.0%) | 0 (0.0%) |
| 10 or more Apartments | 0 (0.0%) | 0 (0.0%) |
| Mobile Home / Other | 0 (0.0%) | 0 (0.0%) |
| Total | 88 (100.0%) | 0 (0.0%) |
Housing Structures by Number of Rooms in Wanship
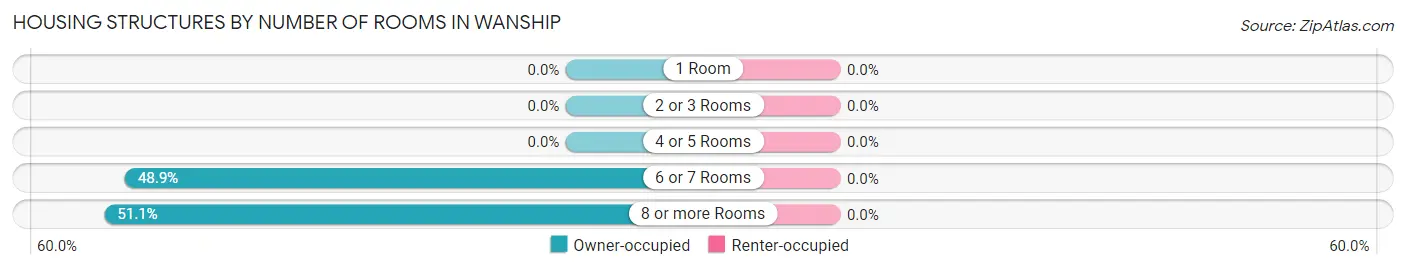
| Number of Rooms | Owner-occupied | Renter-occupied |
| 1 Room | 0 (0.0%) | 0 (0.0%) |
| 2 or 3 Rooms | 0 (0.0%) | 0 (0.0%) |
| 4 or 5 Rooms | 0 (0.0%) | 0 (0.0%) |
| 6 or 7 Rooms | 43 (48.9%) | 0 (0.0%) |
| 8 or more Rooms | 45 (51.1%) | 0 (0.0%) |
| Total | 88 (100.0%) | 0 (0.0%) |
Housing Structure by Heating Type in Wanship
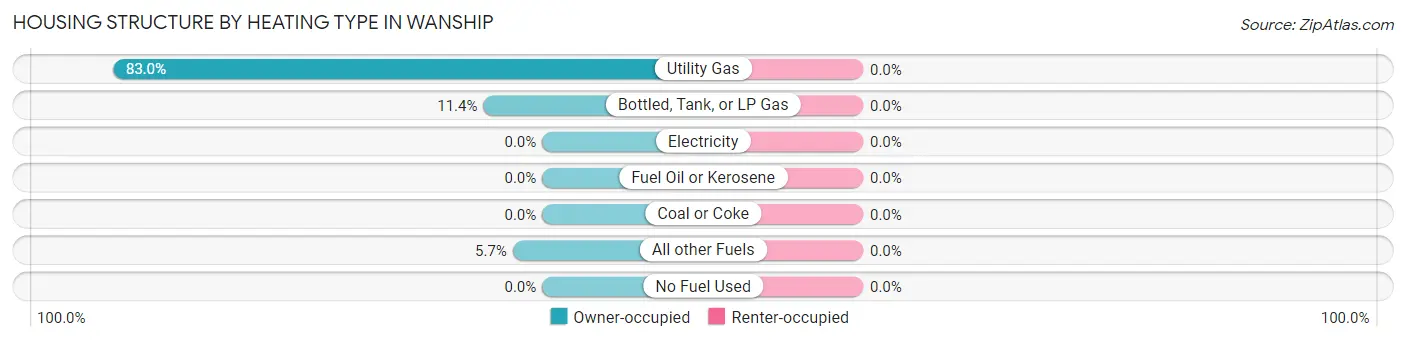
| Heating Type | Owner-occupied | Renter-occupied |
| Utility Gas | 73 (83.0%) | 0 (0.0%) |
| Bottled, Tank, or LP Gas | 10 (11.4%) | 0 (0.0%) |
| Electricity | 0 (0.0%) | 0 (0.0%) |
| Fuel Oil or Kerosene | 0 (0.0%) | 0 (0.0%) |
| Coal or Coke | 0 (0.0%) | 0 (0.0%) |
| All other Fuels | 5 (5.7%) | 0 (0.0%) |
| No Fuel Used | 0 (0.0%) | 0 (0.0%) |
| Total | 88 (100.0%) | 0 (0.0%) |
Household Vehicle Usage in Wanship
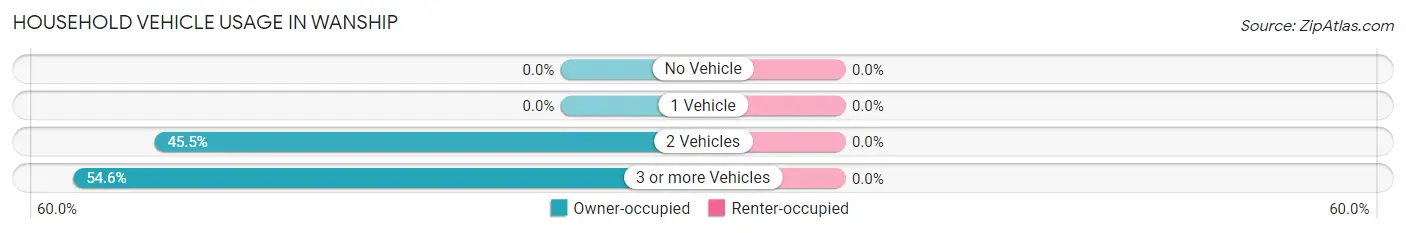
| Vehicles per Household | Owner-occupied | Renter-occupied |
| No Vehicle | 0 (0.0%) | 0 (0.0%) |
| 1 Vehicle | 0 (0.0%) | 0 (0.0%) |
| 2 Vehicles | 40 (45.5%) | 0 (0.0%) |
| 3 or more Vehicles | 48 (54.5%) | 0 (0.0%) |
| Total | 88 (100.0%) | 0 (0.0%) |
Real Estate & Mortgages in Wanship
Real Estate and Mortgage Overview in Wanship
| Characteristic | Without Mortgage | With Mortgage |
| Housing Units | 29 | 59 |
| Median Property Value | $568,800 | $461,800 |
| Median Household Income | $27,375 | $7 |
| Monthly Housing Costs | $555 | $9 |
| Real Estate Taxes | - | - |
Property Value by Mortgage Status in Wanship
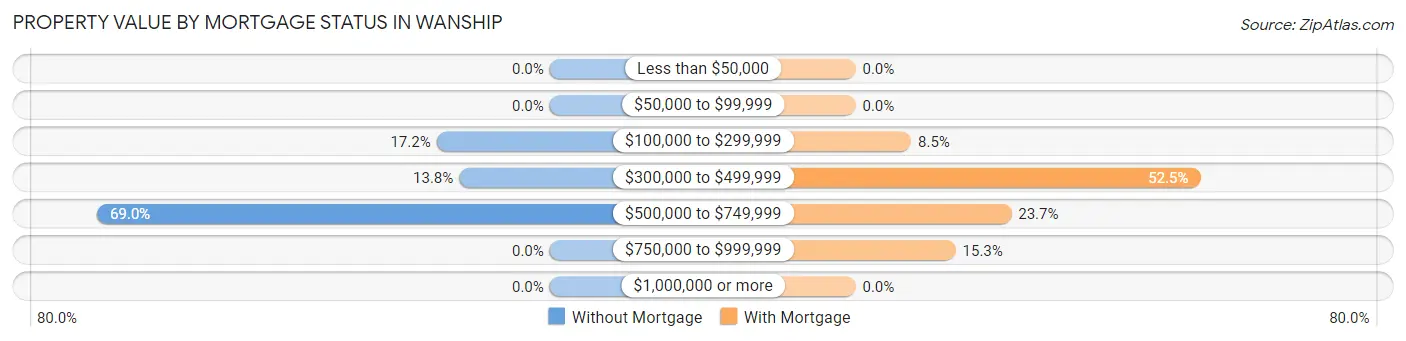
| Property Value | Without Mortgage | With Mortgage |
| Less than $50,000 | 0 (0.0%) | 0 (0.0%) |
| $50,000 to $99,999 | 0 (0.0%) | 0 (0.0%) |
| $100,000 to $299,999 | 5 (17.2%) | 5 (8.5%) |
| $300,000 to $499,999 | 4 (13.8%) | 31 (52.5%) |
| $500,000 to $749,999 | 20 (69.0%) | 14 (23.7%) |
| $750,000 to $999,999 | 0 (0.0%) | 9 (15.2%) |
| $1,000,000 or more | 0 (0.0%) | 0 (0.0%) |
| Total | 29 (100.0%) | 59 (100.0%) |
Household Income by Mortgage Status in Wanship
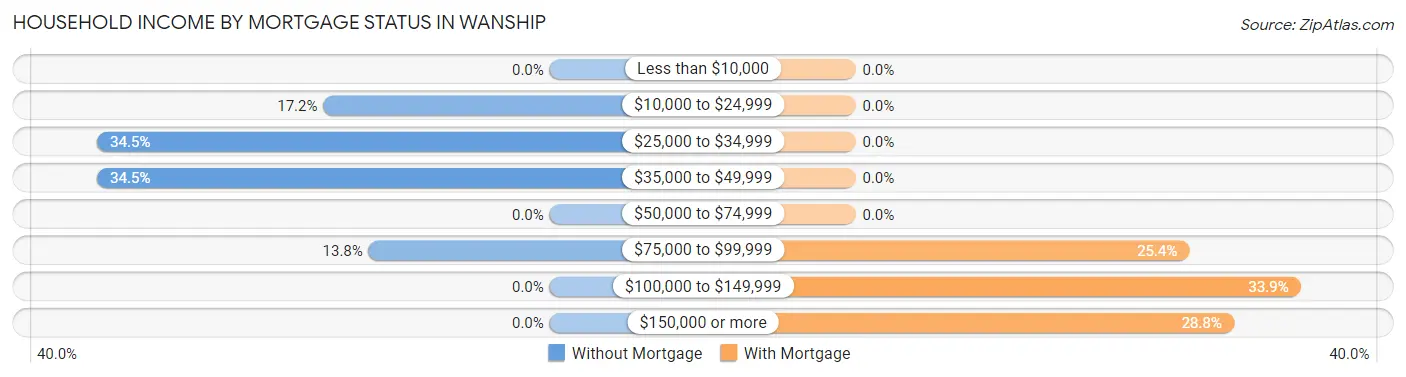
| Household Income | Without Mortgage | With Mortgage |
| Less than $10,000 | 0 (0.0%) | 0 (0.0%) |
| $10,000 to $24,999 | 5 (17.2%) | 0 (0.0%) |
| $25,000 to $34,999 | 10 (34.5%) | 0 (0.0%) |
| $35,000 to $49,999 | 10 (34.5%) | 0 (0.0%) |
| $50,000 to $74,999 | 0 (0.0%) | 0 (0.0%) |
| $75,000 to $99,999 | 4 (13.8%) | 15 (25.4%) |
| $100,000 to $149,999 | 0 (0.0%) | 20 (33.9%) |
| $150,000 or more | 0 (0.0%) | 17 (28.8%) |
| Total | 29 (100.0%) | 59 (100.0%) |
Property Value to Household Income Ratio in Wanship
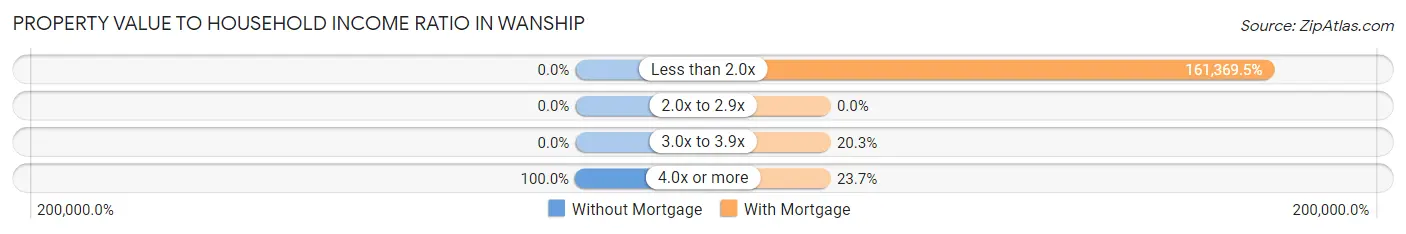
| Value-to-Income Ratio | Without Mortgage | With Mortgage |
| Less than 2.0x | 0 (0.0%) | 95,208 (161,369.5%) |
| 2.0x to 2.9x | 0 (0.0%) | 0 (0.0%) |
| 3.0x to 3.9x | 0 (0.0%) | 12 (20.3%) |
| 4.0x or more | 29 (100.0%) | 14 (23.7%) |
| Total | 29 (100.0%) | 59 (100.0%) |
Real Estate Taxes by Mortgage Status in Wanship
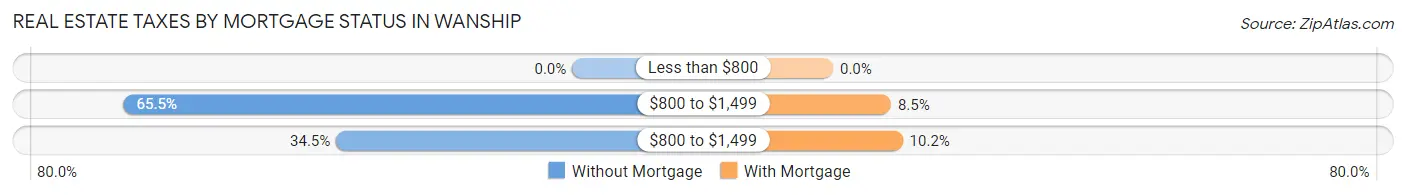
| Property Taxes | Without Mortgage | With Mortgage |
| Less than $800 | 0 (0.0%) | 0 (0.0%) |
| $800 to $1,499 | 19 (65.5%) | 5 (8.5%) |
| $800 to $1,499 | 10 (34.5%) | 6 (10.2%) |
| Total | 29 (100.0%) | 59 (100.0%) |
Health & Disability in Wanship
Health Insurance Coverage by Age in Wanship
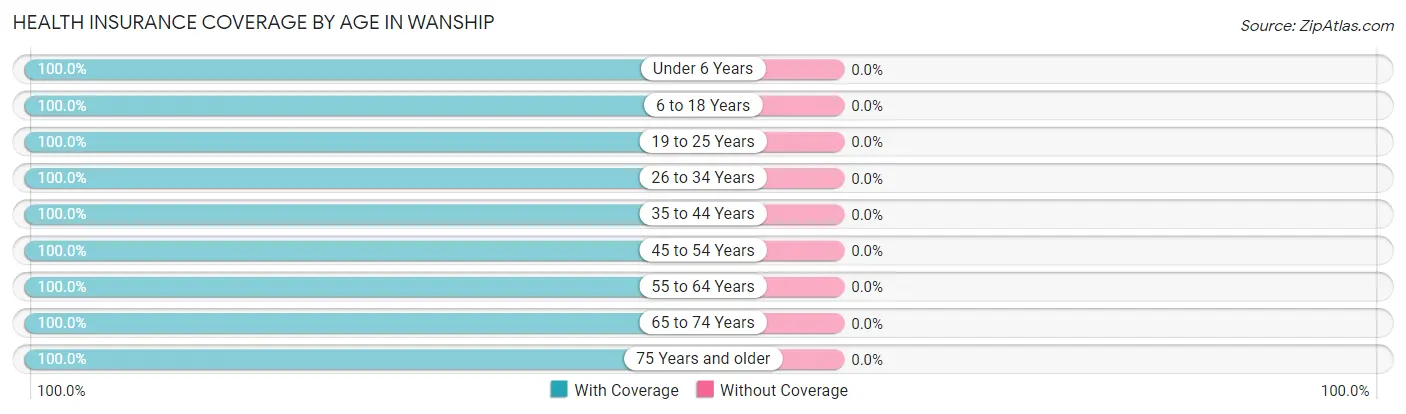
| Age Bracket | With Coverage | Without Coverage |
| Under 6 Years | 26 (100.0%) | 0 (0.0%) |
| 6 to 18 Years | 74 (100.0%) | 0 (0.0%) |
| 19 to 25 Years | 43 (100.0%) | 0 (0.0%) |
| 26 to 34 Years | 58 (100.0%) | 0 (0.0%) |
| 35 to 44 Years | 16 (100.0%) | 0 (0.0%) |
| 45 to 54 Years | 5 (100.0%) | 0 (0.0%) |
| 55 to 64 Years | 42 (100.0%) | 0 (0.0%) |
| 65 to 74 Years | 26 (100.0%) | 0 (0.0%) |
| 75 Years and older | 30 (100.0%) | 0 (0.0%) |
| Total | 320 (100.0%) | 0 (0.0%) |
Health Insurance Coverage by Citizenship Status in Wanship
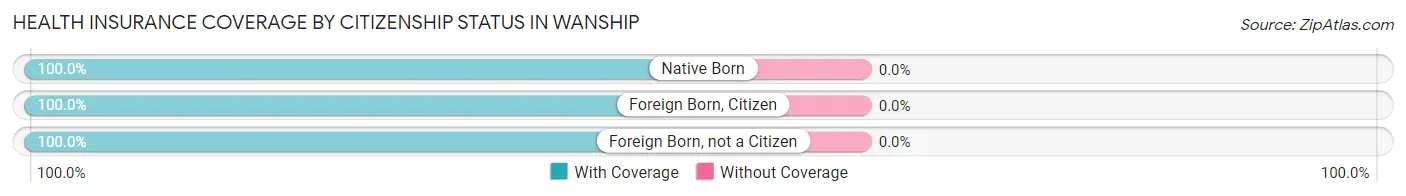
| Citizenship Status | With Coverage | Without Coverage |
| Native Born | 26 (100.0%) | 0 (0.0%) |
| Foreign Born, Citizen | 74 (100.0%) | 0 (0.0%) |
| Foreign Born, not a Citizen | 43 (100.0%) | 0 (0.0%) |
Health Insurance Coverage by Household Income in Wanship
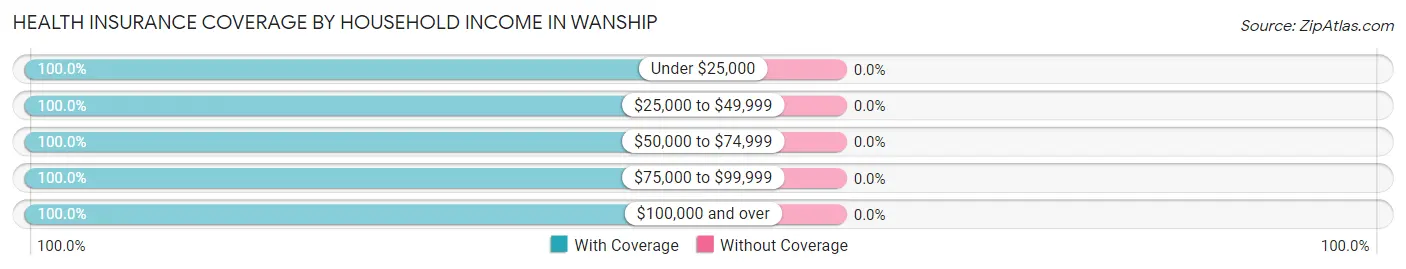
| Household Income | With Coverage | Without Coverage |
| Under $25,000 | 10 (100.0%) | 0 (0.0%) |
| $25,000 to $49,999 | 30 (100.0%) | 0 (0.0%) |
| $50,000 to $74,999 | 25 (100.0%) | 0 (0.0%) |
| $75,000 to $99,999 | 126 (100.0%) | 0 (0.0%) |
| $100,000 and over | 129 (100.0%) | 0 (0.0%) |
Public vs Private Health Insurance Coverage by Age in Wanship
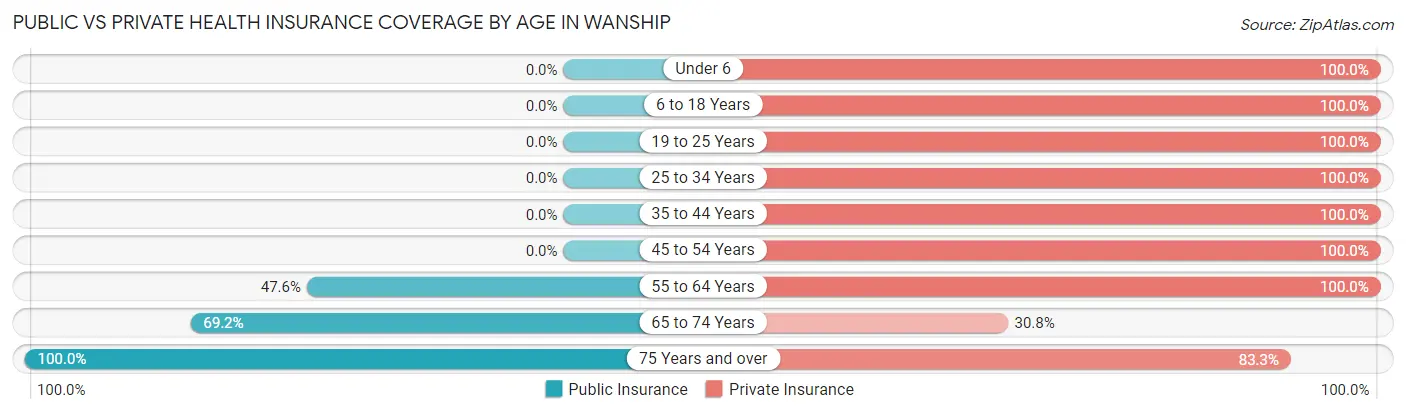
| Age Bracket | Public Insurance | Private Insurance |
| Under 6 | 0 (0.0%) | 26 (100.0%) |
| 6 to 18 Years | 0 (0.0%) | 74 (100.0%) |
| 19 to 25 Years | 0 (0.0%) | 43 (100.0%) |
| 25 to 34 Years | 0 (0.0%) | 58 (100.0%) |
| 35 to 44 Years | 0 (0.0%) | 16 (100.0%) |
| 45 to 54 Years | 0 (0.0%) | 5 (100.0%) |
| 55 to 64 Years | 20 (47.6%) | 42 (100.0%) |
| 65 to 74 Years | 18 (69.2%) | 8 (30.8%) |
| 75 Years and over | 30 (100.0%) | 25 (83.3%) |
| Total | 68 (21.2%) | 297 (92.8%) |
Disability Status by Sex by Age in Wanship
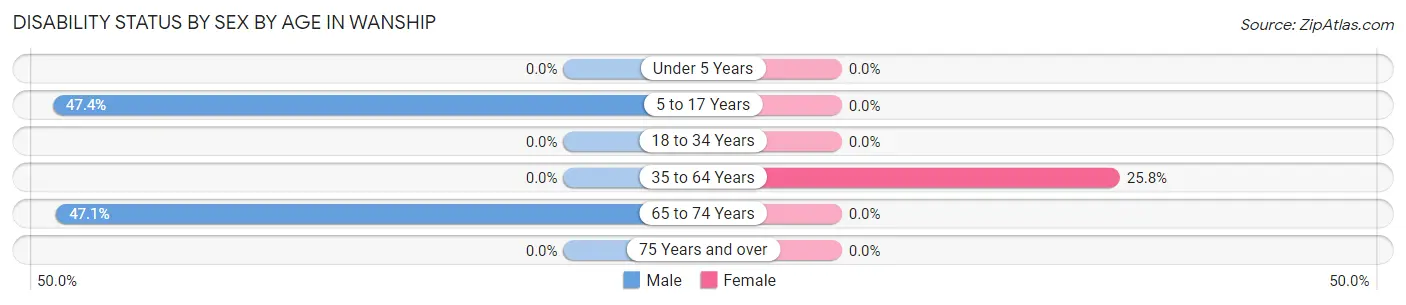
| Age Bracket | Male | Female |
| Under 5 Years | 0 (0.0%) | 0 (0.0%) |
| 5 to 17 Years | 9 (47.4%) | 0 (0.0%) |
| 18 to 34 Years | 0 (0.0%) | 0 (0.0%) |
| 35 to 64 Years | 0 (0.0%) | 8 (25.8%) |
| 65 to 74 Years | 8 (47.1%) | 0 (0.0%) |
| 75 Years and over | 0 (0.0%) | 0 (0.0%) |
Disability Class by Sex by Age in Wanship
Disability Class: Hearing Difficulty
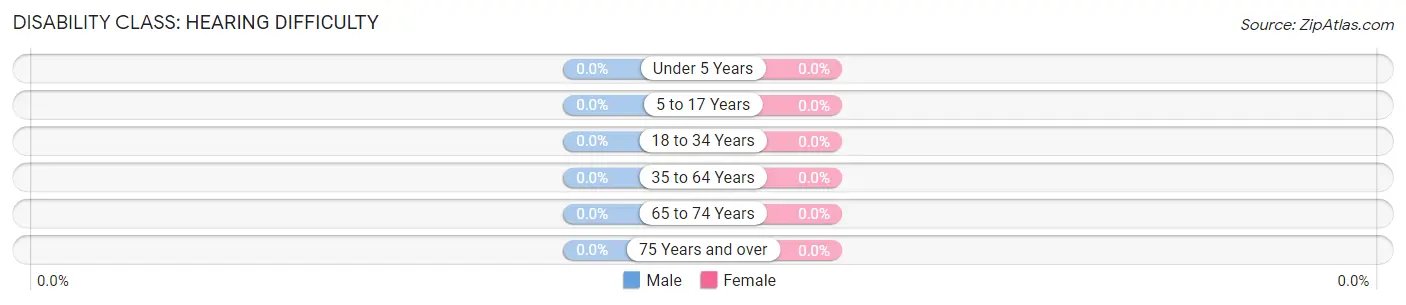
| Age Bracket | Male | Female |
| Under 5 Years | 0 (0.0%) | 0 (0.0%) |
| 5 to 17 Years | 0 (0.0%) | 0 (0.0%) |
| 18 to 34 Years | 0 (0.0%) | 0 (0.0%) |
| 35 to 64 Years | 0 (0.0%) | 0 (0.0%) |
| 65 to 74 Years | 0 (0.0%) | 0 (0.0%) |
| 75 Years and over | 0 (0.0%) | 0 (0.0%) |
Disability Class: Vision Difficulty
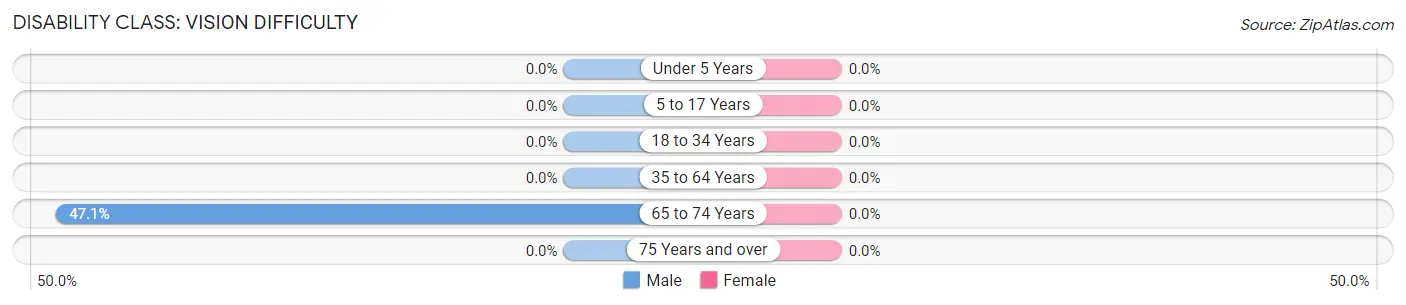
| Age Bracket | Male | Female |
| Under 5 Years | 0 (0.0%) | 0 (0.0%) |
| 5 to 17 Years | 0 (0.0%) | 0 (0.0%) |
| 18 to 34 Years | 0 (0.0%) | 0 (0.0%) |
| 35 to 64 Years | 0 (0.0%) | 0 (0.0%) |
| 65 to 74 Years | 8 (47.1%) | 0 (0.0%) |
| 75 Years and over | 0 (0.0%) | 0 (0.0%) |
Disability Class: Cognitive Difficulty
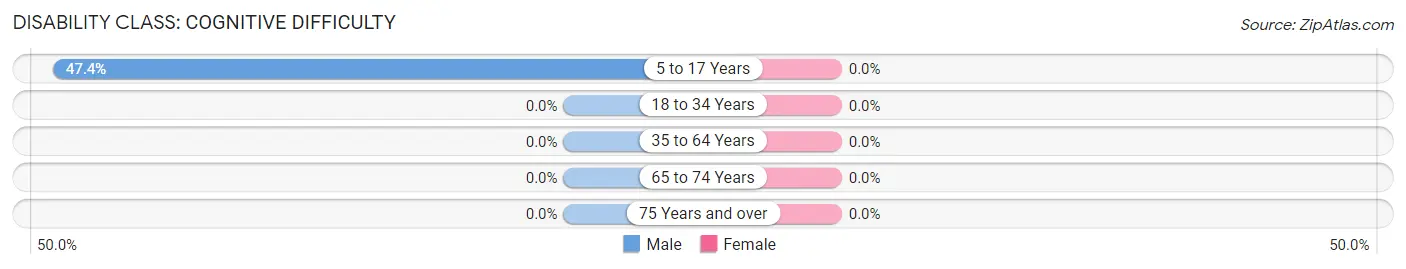
| Age Bracket | Male | Female |
| 5 to 17 Years | 9 (47.4%) | 0 (0.0%) |
| 18 to 34 Years | 0 (0.0%) | 0 (0.0%) |
| 35 to 64 Years | 0 (0.0%) | 0 (0.0%) |
| 65 to 74 Years | 0 (0.0%) | 0 (0.0%) |
| 75 Years and over | 0 (0.0%) | 0 (0.0%) |
Disability Class: Ambulatory Difficulty
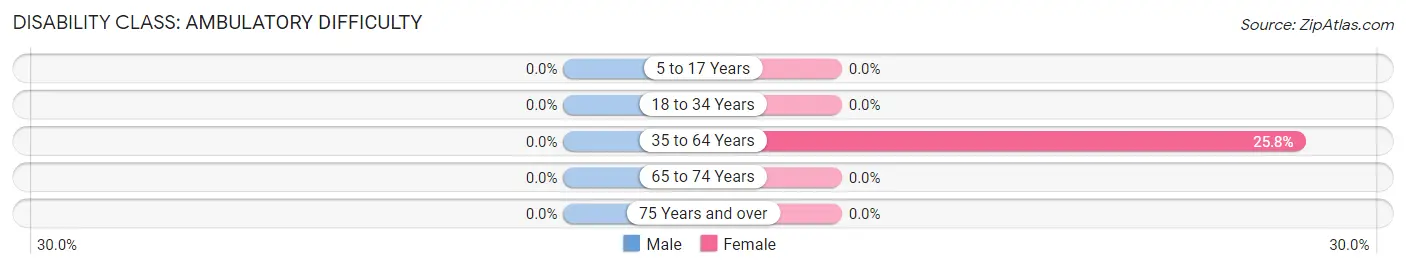
| Age Bracket | Male | Female |
| 5 to 17 Years | 0 (0.0%) | 0 (0.0%) |
| 18 to 34 Years | 0 (0.0%) | 0 (0.0%) |
| 35 to 64 Years | 0 (0.0%) | 8 (25.8%) |
| 65 to 74 Years | 0 (0.0%) | 0 (0.0%) |
| 75 Years and over | 0 (0.0%) | 0 (0.0%) |
Disability Class: Self-Care Difficulty
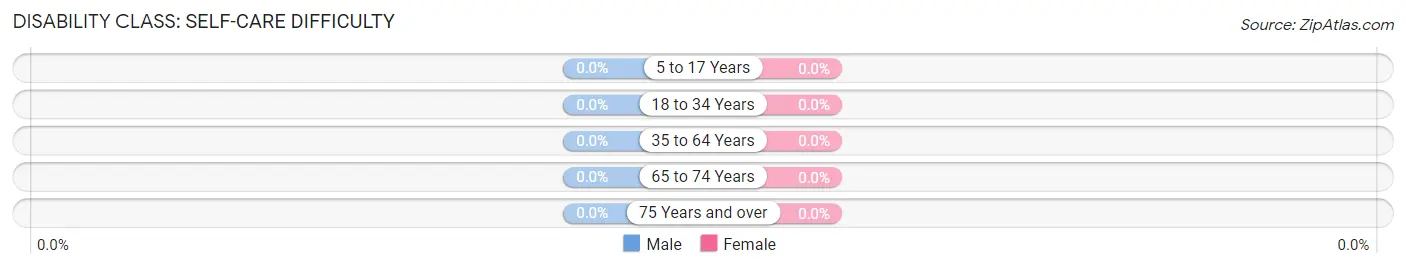
| Age Bracket | Male | Female |
| 5 to 17 Years | 0 (0.0%) | 0 (0.0%) |
| 18 to 34 Years | 0 (0.0%) | 0 (0.0%) |
| 35 to 64 Years | 0 (0.0%) | 0 (0.0%) |
| 65 to 74 Years | 0 (0.0%) | 0 (0.0%) |
| 75 Years and over | 0 (0.0%) | 0 (0.0%) |
Technology Access in Wanship
Computing Device Access in Wanship
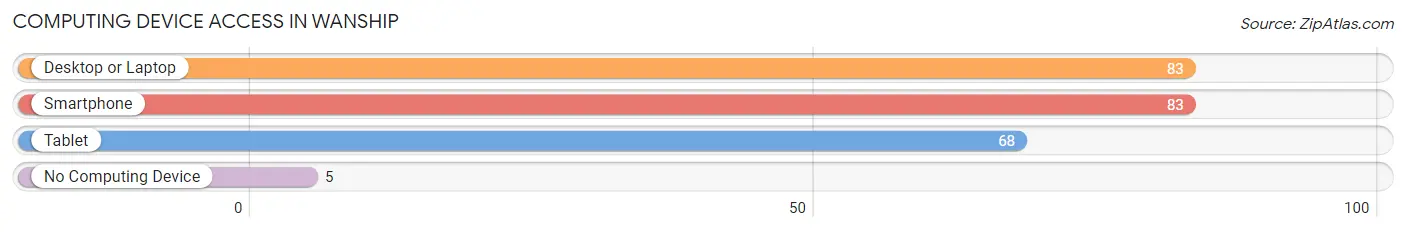
| Device Type | # Households | % Households |
| Desktop or Laptop | 83 | 94.3% |
| Smartphone | 83 | 94.3% |
| Tablet | 68 | 77.3% |
| No Computing Device | 5 | 5.7% |
| Total | 88 | 100.0% |
Internet Access in Wanship
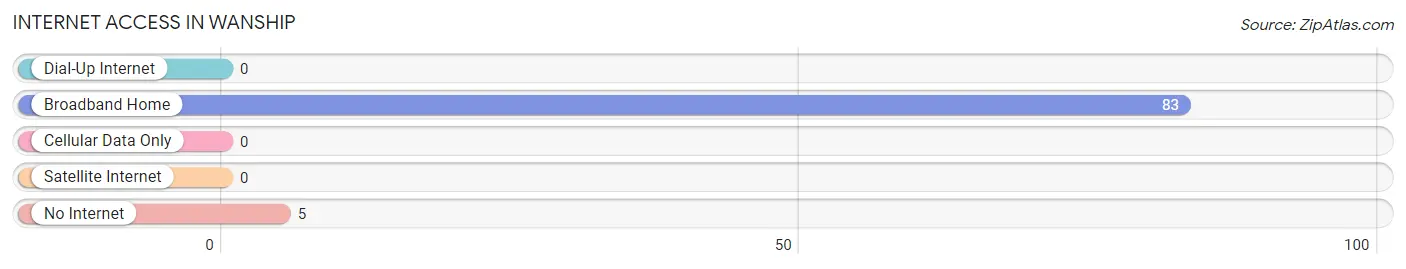
| Internet Type | # Households | % Households |
| Dial-Up Internet | 0 | 0.0% |
| Broadband Home | 83 | 94.3% |
| Cellular Data Only | 0 | 0.0% |
| Satellite Internet | 0 | 0.0% |
| No Internet | 5 | 5.7% |
| Total | 88 | 100.0% |
Wanship Summary
Wanship is a small unincorporated community located in Summit County, Utah, United States. It is situated in the Wasatch Mountains, approximately 25 miles east of Salt Lake City. The population of Wanship was estimated to be 1,072 in 2019.
History
The area that is now Wanship was first settled in the late 1800s by Mormon pioneers. The town was originally known as “Wanshipville” and was named after the Wanship family, who were among the first settlers. The town was officially incorporated in 1909.
In the early 1900s, Wanship was a thriving agricultural community. The town was home to several farms, a sawmill, and a general store. The town also had a post office, a school, and a church.
In the 1950s, Wanship began to experience a decline in population as many of its residents moved away in search of better economic opportunities. The town’s population dropped from a peak of around 500 in the 1940s to just over 200 in the 1970s.
Geography
Wanship is located in the Wasatch Mountains, approximately 25 miles east of Salt Lake City. The town is situated at an elevation of 6,000 feet and is surrounded by mountains and forests. The area is known for its scenic beauty and is popular with hikers, campers, and other outdoor enthusiasts.
The climate in Wanship is semi-arid, with hot summers and cold winters. The average annual temperature is around 45 degrees Fahrenheit. The average annual precipitation is around 15 inches.
Economy
The economy of Wanship is largely based on tourism and recreation. The town is home to several ski resorts, including Park City Mountain Resort and Deer Valley Resort. The area is also popular with hikers, campers, and other outdoor enthusiasts.
In addition to tourism and recreation, Wanship is home to several small businesses, including restaurants, retail stores, and service providers. The town is also home to several small manufacturing companies.
Demographics
As of 2019, the population of Wanship was estimated to be 1,072. The racial makeup of the town was 94.3% White, 0.9% Black or African American, 0.7% Native American, 0.7% Asian, 0.2% Pacific Islander, and 2.2% from other races. The median household income was $50,000. The median age was 37.5 years.
Conclusion
Wanship is a small unincorporated community located in Summit County, Utah. The town was originally settled by Mormon pioneers in the late 1800s and was officially incorporated in 1909. The economy of Wanship is largely based on tourism and recreation, and the town is home to several ski resorts and other outdoor attractions. The population of Wanship was estimated to be 1,072 in 2019.
Common Questions
What is Per Capita Income in Wanship?
Per Capita income in Wanship is $23,871.
What is the Median Family Income in Wanship?
Median Family Income in Wanship is $88,839.
What is the Median Household income in Wanship?
Median Household Income in Wanship is $82,500.
What is Income or Wage Gap in Wanship?
Income or Wage Gap in Wanship is 33.4%.
Women in Wanship earn 66.6 cents for every dollar earned by a man.
What is Inequality or Gini Index in Wanship?
Inequality or Gini Index in Wanship is 0.30.
What is the Total Population of Wanship?
Total Population of Wanship is 320.
What is the Total Male Population of Wanship?
Total Male Population of Wanship is 169.
What is the Total Female Population of Wanship?
Total Female Population of Wanship is 151.
What is the Ratio of Males per 100 Females in Wanship?
There are 111.92 Males per 100 Females in Wanship.
What is the Ratio of Females per 100 Males in Wanship?
There are 89.35 Females per 100 Males in Wanship.
What is the Median Population Age in Wanship?
Median Population Age in Wanship is 27.7 Years.
What is the Average Family Size in Wanship
Average Family Size in Wanship is 4.2 People.
What is the Average Household Size in Wanship
Average Household Size in Wanship is 3.6 People.
How Large is the Labor Force in Wanship?
There are 192 People in the Labor Forcein in Wanship.
What is the Percentage of People in the Labor Force in Wanship?
77.1% of People are in the Labor Force in Wanship.