Cities with the Highest Percentage of Population Employed in Mining, Quarrying, & Extraction in Utah
RELATED REPORTS & OPTIONS
Mining, Quarrying, & Extraction
Utah
Compare Cities
Map of Cities with the Highest Percentage of Population Employed in Mining, Quarrying, & Extraction in Utah
0.0%
25.0%
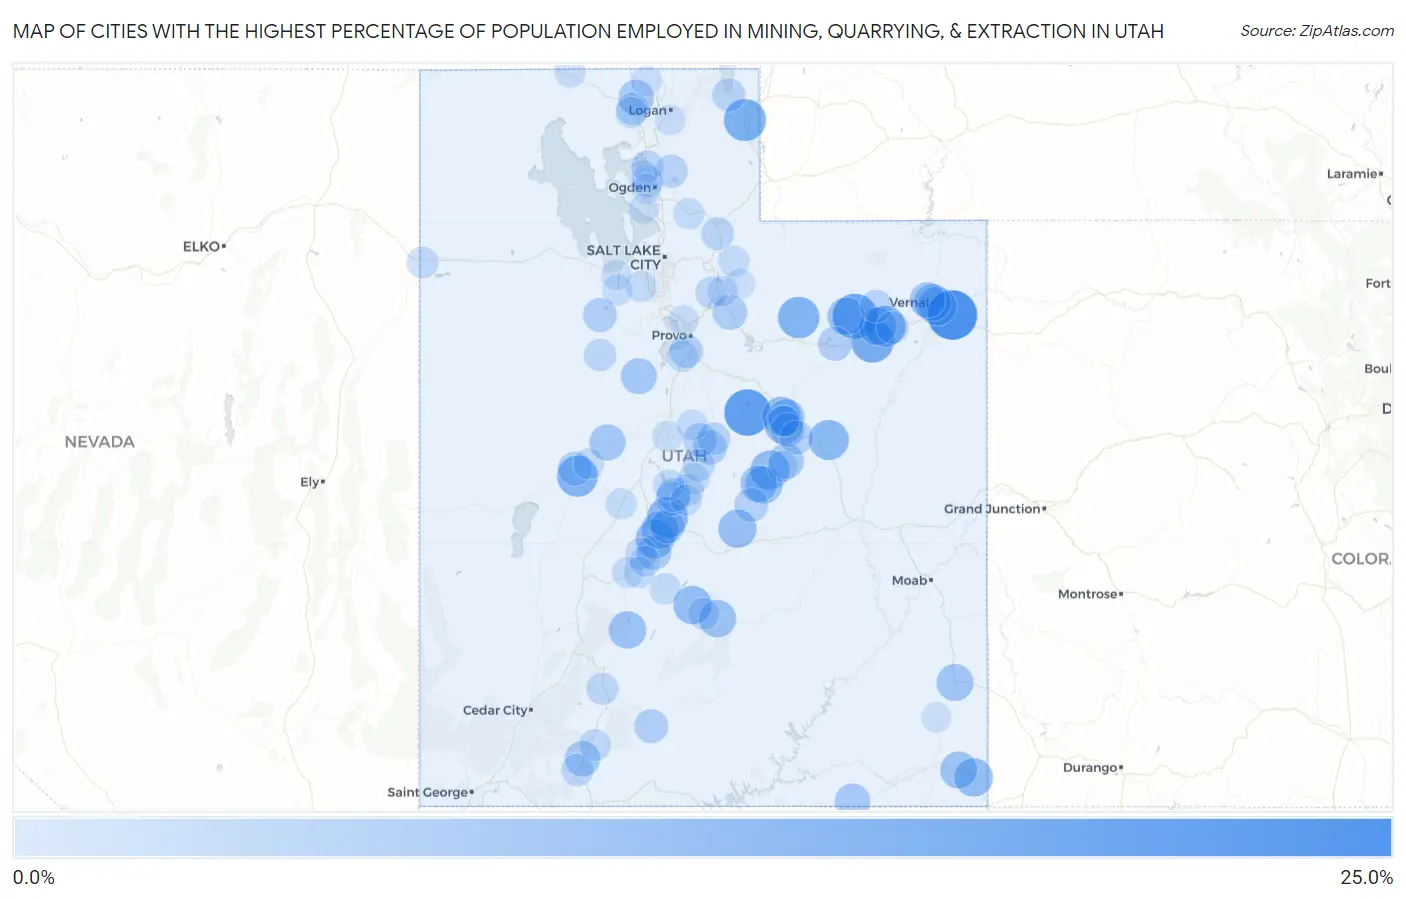
Cities with the Highest Percentage of Population Employed in Mining, Quarrying, & Extraction in Utah
| City | % Employed | vs State | vs National | |
| 1. | Jensen | 23.8% | 0.71% (+23.1)#1 | 0.44% (+23.4)#178 |
| 2. | Scofield | 20.0% | 0.71% (+19.3)#2 | 0.44% (+19.6)#245 |
| 3. | Bluebell | 18.2% | 0.71% (+17.5)#3 | 0.44% (+17.7)#295 |
| 4. | Myton | 15.7% | 0.71% (+15.0)#4 | 0.44% (+15.3)#381 |
| 5. | Randolph | 14.9% | 0.71% (+14.2)#5 | 0.44% (+14.5)#413 |
| 6. | Tabiona | 14.1% | 0.71% (+13.4)#6 | 0.44% (+13.6)#464 |
| 7. | Ballard | 13.8% | 0.71% (+13.1)#7 | 0.44% (+13.3)#476 |
| 8. | Redmond | 13.5% | 0.71% (+12.8)#8 | 0.44% (+13.1)#487 |
| 9. | Deseret | 13.4% | 0.71% (+12.7)#9 | 0.44% (+13.0)#500 |
| 10. | East Carbon | 12.4% | 0.71% (+11.7)#10 | 0.44% (+12.0)#569 |
| 11. | Huntington | 11.4% | 0.71% (+10.7)#11 | 0.44% (+11.0)#640 |
| 12. | Sigurd | 11.0% | 0.71% (+10.3)#12 | 0.44% (+10.5)#686 |
| 13. | Helper | 10.9% | 0.71% (+10.2)#13 | 0.44% (+10.5)#692 |
| 14. | Aneth | 10.6% | 0.71% (+9.88)#14 | 0.44% (+10.1)#707 |
| 15. | Loa | 10.6% | 0.71% (+9.87)#15 | 0.44% (+10.1)#709 |
| 16. | Carbonville | 10.6% | 0.71% (+9.85)#16 | 0.44% (+10.1)#712 |
| 17. | Naples | 10.4% | 0.71% (+9.70)#17 | 0.44% (+9.97)#724 |
| 18. | Emery | 10.3% | 0.71% (+9.58)#18 | 0.44% (+9.85)#732 |
| 19. | Roosevelt | 9.8% | 0.71% (+9.06)#19 | 0.44% (+9.32)#781 |
| 20. | Aurora | 9.7% | 0.71% (+8.96)#20 | 0.44% (+9.23)#787 |
| 21. | Altamont | 9.6% | 0.71% (+8.85)#21 | 0.44% (+9.11)#795 |
| 22. | Castle Dale | 9.3% | 0.71% (+8.62)#22 | 0.44% (+8.89)#821 |
| 23. | Torrey | 9.3% | 0.71% (+8.60)#23 | 0.44% (+8.86)#823 |
| 24. | Junction | 9.3% | 0.71% (+8.55)#24 | 0.44% (+8.82)#827 |
| 25. | Montezuma Creek | 9.0% | 0.71% (+8.25)#25 | 0.44% (+8.51)#869 |
| 26. | Vernal | 8.9% | 0.71% (+8.18)#26 | 0.44% (+8.45)#877 |
| 27. | Monticello | 8.8% | 0.71% (+8.07)#27 | 0.44% (+8.34)#889 |
| 28. | Kenilworth | 8.7% | 0.71% (+7.99)#28 | 0.44% (+8.26)#906 |
| 29. | Orangeville | 8.6% | 0.71% (+7.94)#29 | 0.44% (+8.21)#917 |
| 30. | Lynndyl | 8.0% | 0.71% (+7.29)#30 | 0.44% (+7.56)#1,000 |
| 31. | Eureka | 7.7% | 0.71% (+7.04)#31 | 0.44% (+7.30)#1,040 |
| 32. | Maeser | 7.5% | 0.71% (+6.77)#32 | 0.44% (+7.04)#1,081 |
| 33. | Glendale | 7.2% | 0.71% (+6.53)#33 | 0.44% (+6.80)#1,107 |
| 34. | Riverside | 7.2% | 0.71% (+6.50)#34 | 0.44% (+6.77)#1,111 |
| 35. | Elmo | 7.2% | 0.71% (+6.49)#35 | 0.44% (+6.75)#1,116 |
| 36. | Oljato Monument Valley | 7.1% | 0.71% (+6.38)#36 | 0.44% (+6.65)#1,139 |
| 37. | Glenwood | 6.5% | 0.71% (+5.81)#37 | 0.44% (+6.07)#1,246 |
| 38. | Independence | 6.2% | 0.71% (+5.54)#38 | 0.44% (+5.81)#1,296 |
| 39. | Salina | 6.0% | 0.71% (+5.31)#39 | 0.44% (+5.58)#1,354 |
| 40. | Spring City | 5.8% | 0.71% (+5.13)#40 | 0.44% (+5.40)#1,384 |
| 41. | Hinckley | 5.7% | 0.71% (+4.95)#41 | 0.44% (+5.22)#1,428 |
| 42. | Duchesne | 5.6% | 0.71% (+4.86)#42 | 0.44% (+5.13)#1,448 |
| 43. | Henrieville | 5.5% | 0.71% (+4.81)#43 | 0.44% (+5.08)#1,465 |
| 44. | Centerfield | 5.5% | 0.71% (+4.79)#44 | 0.44% (+5.06)#1,475 |
| 45. | Rush Valley | 5.5% | 0.71% (+4.79)#45 | 0.44% (+5.05)#1,476 |
| 46. | Price | 5.4% | 0.71% (+4.65)#46 | 0.44% (+4.92)#1,511 |
| 47. | Gunnison | 5.3% | 0.71% (+4.57)#47 | 0.44% (+4.84)#1,525 |
| 48. | Ferron | 5.2% | 0.71% (+4.46)#48 | 0.44% (+4.72)#1,562 |
| 49. | Wellington | 5.2% | 0.71% (+4.44)#49 | 0.44% (+4.71)#1,566 |
| 50. | Moroni | 5.1% | 0.71% (+4.41)#50 | 0.44% (+4.67)#1,576 |
| 51. | Palmyra | 4.7% | 0.71% (+4.01)#51 | 0.44% (+4.28)#1,691 |
| 52. | Wolf Creek | 4.5% | 0.71% (+3.83)#52 | 0.44% (+4.09)#1,756 |
| 53. | Laketown | 4.5% | 0.71% (+3.78)#53 | 0.44% (+4.05)#1,766 |
| 54. | Mount Pleasant | 4.3% | 0.71% (+3.58)#54 | 0.44% (+3.85)#1,829 |
| 55. | Coalville | 4.2% | 0.71% (+3.45)#55 | 0.44% (+3.71)#1,885 |
| 56. | Neola | 4.0% | 0.71% (+3.32)#56 | 0.44% (+3.58)#1,931 |
| 57. | Orderville | 3.8% | 0.71% (+3.08)#57 | 0.44% (+3.35)#2,041 |
| 58. | Fort Duchesne | 3.7% | 0.71% (+3.00)#58 | 0.44% (+3.26)#2,075 |
| 59. | Vernon | 3.6% | 0.71% (+2.91)#59 | 0.44% (+3.17)#2,111 |
| 60. | Garland | 3.6% | 0.71% (+2.86)#60 | 0.44% (+3.12)#2,147 |
| 61. | Midway | 3.4% | 0.71% (+2.67)#61 | 0.44% (+2.93)#2,263 |
| 62. | Panguitch | 3.3% | 0.71% (+2.62)#62 | 0.44% (+2.89)#2,290 |
| 63. | Ephraim | 3.3% | 0.71% (+2.55)#63 | 0.44% (+2.82)#2,336 |
| 64. | Marriott Slaterville | 3.2% | 0.71% (+2.53)#64 | 0.44% (+2.79)#2,346 |
| 65. | South Willard | 3.2% | 0.71% (+2.48)#65 | 0.44% (+2.75)#2,375 |
| 66. | Sterling | 3.2% | 0.71% (+2.47)#66 | 0.44% (+2.73)#2,382 |
| 67. | Richfield | 3.0% | 0.71% (+2.32)#67 | 0.44% (+2.59)#2,470 |
| 68. | Wendover | 3.0% | 0.71% (+2.28)#68 | 0.44% (+2.55)#2,496 |
| 69. | Bicknell | 2.9% | 0.71% (+2.22)#69 | 0.44% (+2.49)#2,527 |
| 70. | Alton | 2.8% | 0.71% (+2.11)#70 | 0.44% (+2.38)#2,600 |
| 71. | Benjamin | 2.8% | 0.71% (+2.08)#71 | 0.44% (+2.35)#2,620 |
| 72. | Manti | 2.7% | 0.71% (+2.02)#72 | 0.44% (+2.29)#2,667 |
| 73. | Tremonton | 2.7% | 0.71% (+2.01)#73 | 0.44% (+2.28)#2,677 |
| 74. | Koosharem | 2.7% | 0.71% (+2.00)#74 | 0.44% (+2.26)#2,688 |
| 75. | Fayette | 2.5% | 0.71% (+1.79)#75 | 0.44% (+2.06)#2,859 |
| 76. | Oakley | 2.4% | 0.71% (+1.71)#76 | 0.44% (+1.98)#2,913 |
| 77. | Morgan | 2.4% | 0.71% (+1.71)#77 | 0.44% (+1.98)#2,916 |
| 78. | Holden | 2.4% | 0.71% (+1.67)#78 | 0.44% (+1.94)#2,949 |
| 79. | Fountain Green | 2.4% | 0.71% (+1.65)#79 | 0.44% (+1.92)#2,970 |
| 80. | Mayfield | 2.3% | 0.71% (+1.58)#80 | 0.44% (+1.85)#3,025 |
| 81. | Cleveland | 2.3% | 0.71% (+1.58)#81 | 0.44% (+1.84)#3,027 |
| 82. | Joseph | 2.2% | 0.71% (+1.54)#82 | 0.44% (+1.81)#3,049 |
| 83. | Spring Glen | 2.2% | 0.71% (+1.52)#83 | 0.44% (+1.79)#3,062 |
| 84. | Monroe | 2.2% | 0.71% (+1.47)#84 | 0.44% (+1.74)#3,101 |
| 85. | Annabella | 2.2% | 0.71% (+1.45)#85 | 0.44% (+1.71)#3,124 |
| 86. | Copperton | 2.1% | 0.71% (+1.43)#86 | 0.44% (+1.70)#3,137 |
| 87. | Delta | 2.1% | 0.71% (+1.41)#87 | 0.44% (+1.68)#3,161 |
| 88. | Tooele | 2.0% | 0.71% (+1.29)#88 | 0.44% (+1.55)#3,272 |
| 89. | Levan | 1.9% | 0.71% (+1.23)#89 | 0.44% (+1.50)#3,320 |
| 90. | Heber | 1.9% | 0.71% (+1.17)#90 | 0.44% (+1.44)#3,386 |
| 91. | Snowville | 1.7% | 0.71% (+0.989)#91 | 0.44% (+1.25)#3,564 |
| 92. | Clarkston | 1.6% | 0.71% (+0.891)#92 | 0.44% (+1.16)#3,703 |
| 93. | Woodland | 1.6% | 0.71% (+0.881)#93 | 0.44% (+1.15)#3,708 |
| 94. | Stansbury Park | 1.5% | 0.71% (+0.837)#94 | 0.44% (+1.10)#3,772 |
| 95. | Plain City | 1.4% | 0.71% (+0.690)#95 | 0.44% (+0.956)#3,952 |
| 96. | Lindon | 1.4% | 0.71% (+0.677)#96 | 0.44% (+0.943)#3,970 |
| 97. | Nibley | 1.3% | 0.71% (+0.605)#97 | 0.44% (+0.871)#4,069 |
| 98. | West Haven | 1.3% | 0.71% (+0.598)#98 | 0.44% (+0.864)#4,082 |
| 99. | Blanding | 1.2% | 0.71% (+0.527)#99 | 0.44% (+0.793)#4,182 |
| 100. | Syracuse | 1.1% | 0.71% (+0.389)#100 | 0.44% (+0.655)#4,414 |
Common Questions
What are the Top 10 Cities with the Highest Percentage of Population Employed in Mining, Quarrying, & Extraction in Utah?
Top 10 Cities with the Highest Percentage of Population Employed in Mining, Quarrying, & Extraction in Utah are:
What city has the Highest Percentage of Population Employed in Mining, Quarrying, & Extraction in Utah?
Jensen has the Highest Percentage of Population Employed in Mining, Quarrying, & Extraction in Utah with 23.8%.
What is the Percentage of Population Employed in Mining, Quarrying, & Extraction in the State of Utah?
Percentage of Population Employed in Mining, Quarrying, & Extraction in Utah is 0.71%.
What is the Percentage of Population Employed in Mining, Quarrying, & Extraction in the United States?
Percentage of Population Employed in Mining, Quarrying, & Extraction in the United States is 0.44%.