Panguitch, UT Map & Demographics
Panguitch Map
Panguitch Overview
$22,881
PER CAPITA INCOME
$74,095
AVG FAMILY INCOME
$64,886
AVG HOUSEHOLD INCOME
52.3%
WAGE / INCOME GAP [ % ]
47.7¢/ $1
WAGE / INCOME GAP [ $ ]
0.39
INEQUALITY / GINI INDEX
1,702
TOTAL POPULATION
830
MALE POPULATION
872
FEMALE POPULATION
95.18
MALES / 100 FEMALES
105.06
FEMALES / 100 MALES
33.2
MEDIAN AGE
3.1
AVG FAMILY SIZE
2.8
AVG HOUSEHOLD SIZE
704
LABOR FORCE [ PEOPLE ]
56.4%
PERCENT IN LABOR FORCE
6.1%
UNEMPLOYMENT RATE
Panguitch Zip Codes
Panguitch Area Codes
Income in Panguitch
Income Overview in Panguitch
Per Capita Income in Panguitch is $22,881, while median incomes of families and households are $74,095 and $64,886 respectively.
| Characteristic | Number | Measure |
| Per Capita Income | 1,702 | $22,881 |
| Median Family Income | 457 | $74,095 |
| Mean Family Income | 457 | $82,942 |
| Median Household Income | 559 | $64,886 |
| Mean Household Income | 559 | $72,929 |
| Income Deficit | 457 | $0 |
| Wage / Income Gap (%) | 1,702 | 52.34% |
| Wage / Income Gap ($) | 1,702 | 47.66¢ per $1 |
| Gini / Inequality Index | 1,702 | 0.39 |
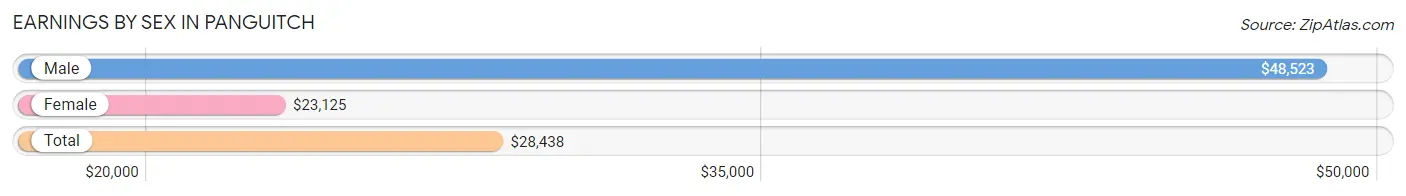
Earnings by Sex in Panguitch
Average Earnings in Panguitch are $28,438, $48,523 for men and $23,125 for women, a difference of 52.3%.
| Sex | Number | Average Earnings |
| Male | 331 (43.7%) | $48,523 |
| Female | 427 (56.3%) | $23,125 |
| Total | 758 (100.0%) | $28,438 |
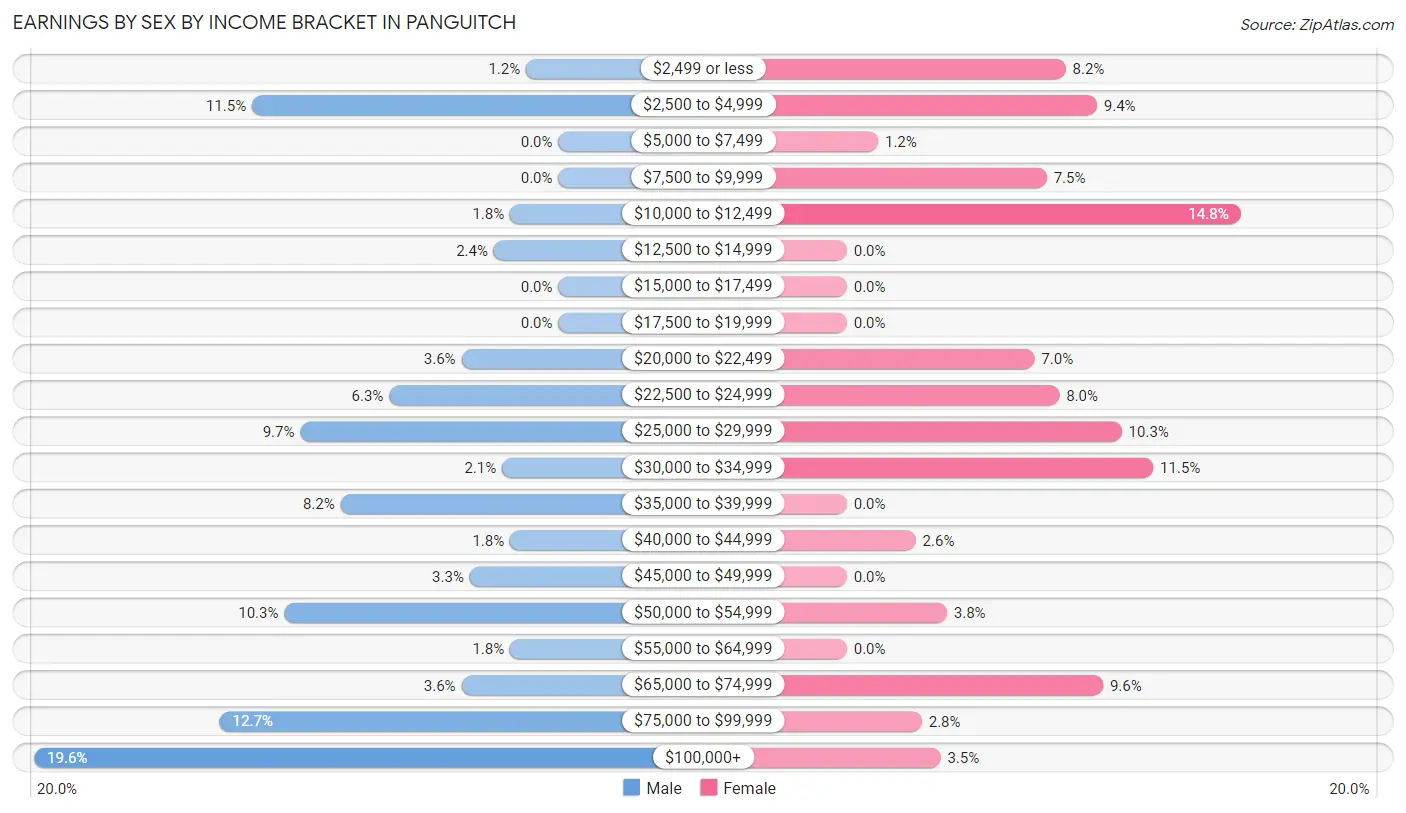
Earnings by Sex by Income Bracket in Panguitch
The most common earnings brackets in Panguitch are $100,000+ for men (65 | 19.6%) and $10,000 to $12,499 for women (63 | 14.7%).
| Income | Male | Female |
| $2,499 or less | 4 (1.2%) | 35 (8.2%) |
| $2,500 to $4,999 | 38 (11.5%) | 40 (9.4%) |
| $5,000 to $7,499 | 0 (0.0%) | 5 (1.2%) |
| $7,500 to $9,999 | 0 (0.0%) | 32 (7.5%) |
| $10,000 to $12,499 | 6 (1.8%) | 63 (14.7%) |
| $12,500 to $14,999 | 8 (2.4%) | 0 (0.0%) |
| $15,000 to $17,499 | 0 (0.0%) | 0 (0.0%) |
| $17,500 to $19,999 | 0 (0.0%) | 0 (0.0%) |
| $20,000 to $22,499 | 12 (3.6%) | 30 (7.0%) |
| $22,500 to $24,999 | 21 (6.3%) | 34 (8.0%) |
| $25,000 to $29,999 | 32 (9.7%) | 44 (10.3%) |
| $30,000 to $34,999 | 7 (2.1%) | 49 (11.5%) |
| $35,000 to $39,999 | 27 (8.2%) | 0 (0.0%) |
| $40,000 to $44,999 | 6 (1.8%) | 11 (2.6%) |
| $45,000 to $49,999 | 11 (3.3%) | 0 (0.0%) |
| $50,000 to $54,999 | 34 (10.3%) | 16 (3.7%) |
| $55,000 to $64,999 | 6 (1.8%) | 0 (0.0%) |
| $65,000 to $74,999 | 12 (3.6%) | 41 (9.6%) |
| $75,000 to $99,999 | 42 (12.7%) | 12 (2.8%) |
| $100,000+ | 65 (19.6%) | 15 (3.5%) |
| Total | 331 (100.0%) | 427 (100.0%) |
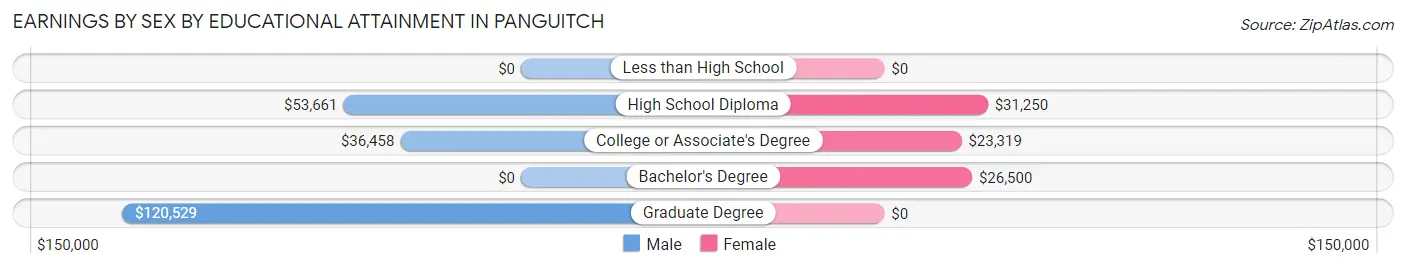
Earnings by Sex by Educational Attainment in Panguitch
Average earnings in Panguitch are $55,313 for men and $25,667 for women, a difference of 53.6%. Men with an educational attainment of graduate degree enjoy the highest average annual earnings of $120,529, while those with college or associate's degree education earn the least with $36,458. Women with an educational attainment of high school diploma earn the most with the average annual earnings of $31,250, while those with college or associate's degree education have the smallest earnings of $23,319.
| Educational Attainment | Male Income | Female Income |
| Less than High School | - | - |
| High School Diploma | $53,661 | $31,250 |
| College or Associate's Degree | $36,458 | $23,319 |
| Bachelor's Degree | - | - |
| Graduate Degree | $120,529 | $0 |
| Total | $55,313 | $25,667 |
Family Income in Panguitch
Family Income Brackets in Panguitch
According to the Panguitch family income data, there are 112 families falling into the $50,000 to $74,999 income range, which is the most common income bracket and makes up 24.5% of all families.
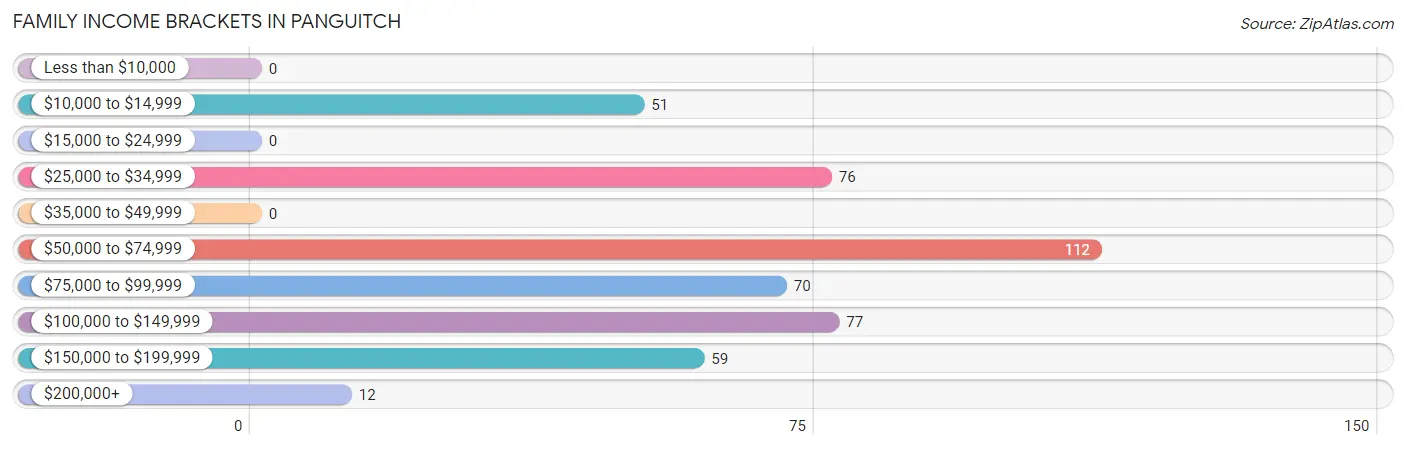
| Income Bracket | # Families | % Families |
| Less than $10,000 | 0 | 0.0% |
| $10,000 to $14,999 | 51 | 11.2% |
| $15,000 to $24,999 | 0 | 0.0% |
| $25,000 to $34,999 | 76 | 16.6% |
| $35,000 to $49,999 | 0 | 0.0% |
| $50,000 to $74,999 | 112 | 24.5% |
| $75,000 to $99,999 | 70 | 15.3% |
| $100,000 to $149,999 | 77 | 16.8% |
| $150,000 to $199,999 | 59 | 12.9% |
| $200,000+ | 12 | 2.6% |
Family Income by Famaliy Size in Panguitch
4-person families (76 | 16.6%) account for the highest median family income in Panguitch with $103,250 per family, while 2-person families (225 | 49.2%) have the highest median income of $31,344 per family member.
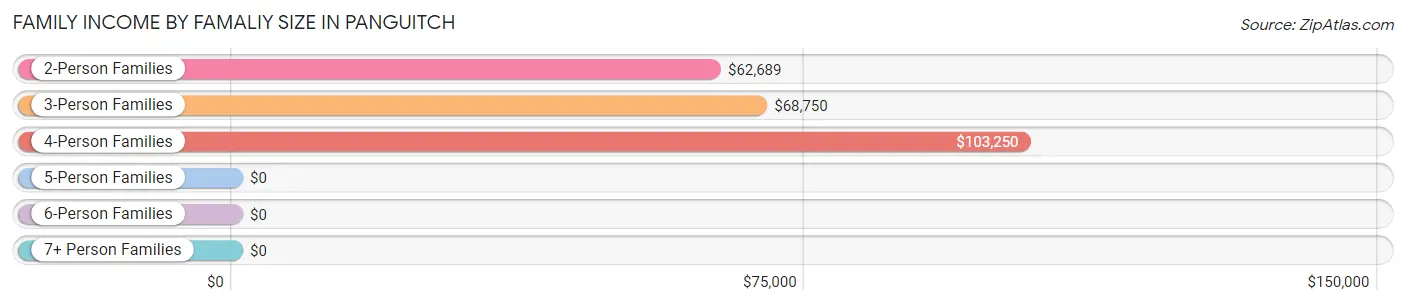
| Income Bracket | # Families | Median Income |
| 2-Person Families | 225 (49.2%) | $62,689 |
| 3-Person Families | 51 (11.2%) | $68,750 |
| 4-Person Families | 76 (16.6%) | $103,250 |
| 5-Person Families | 66 (14.4%) | $0 |
| 6-Person Families | 34 (7.4%) | $0 |
| 7+ Person Families | 5 (1.1%) | $0 |
| Total | 457 (100.0%) | $74,095 |
Family Income by Number of Earners in Panguitch
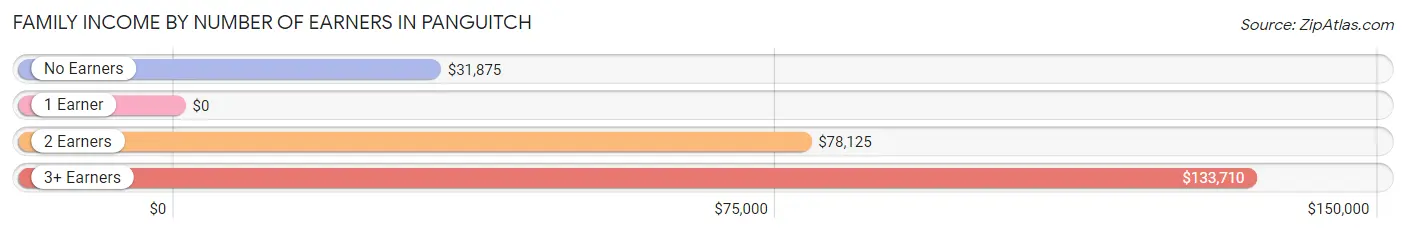
| Number of Earners | # Families | Median Income |
| No Earners | 103 (22.5%) | $31,875 |
| 1 Earner | 57 (12.5%) | $0 |
| 2 Earners | 217 (47.5%) | $78,125 |
| 3+ Earners | 80 (17.5%) | $133,710 |
| Total | 457 (100.0%) | $74,095 |
Household Income in Panguitch
Household Income Brackets in Panguitch
With 131 households falling in the category, the $50,000 to $74,999 income range is the most frequent in Panguitch, accounting for 23.4% of all households. In contrast, only 6 households (1.1%) fall into the less than $10,000 income bracket, making it the least populous group.
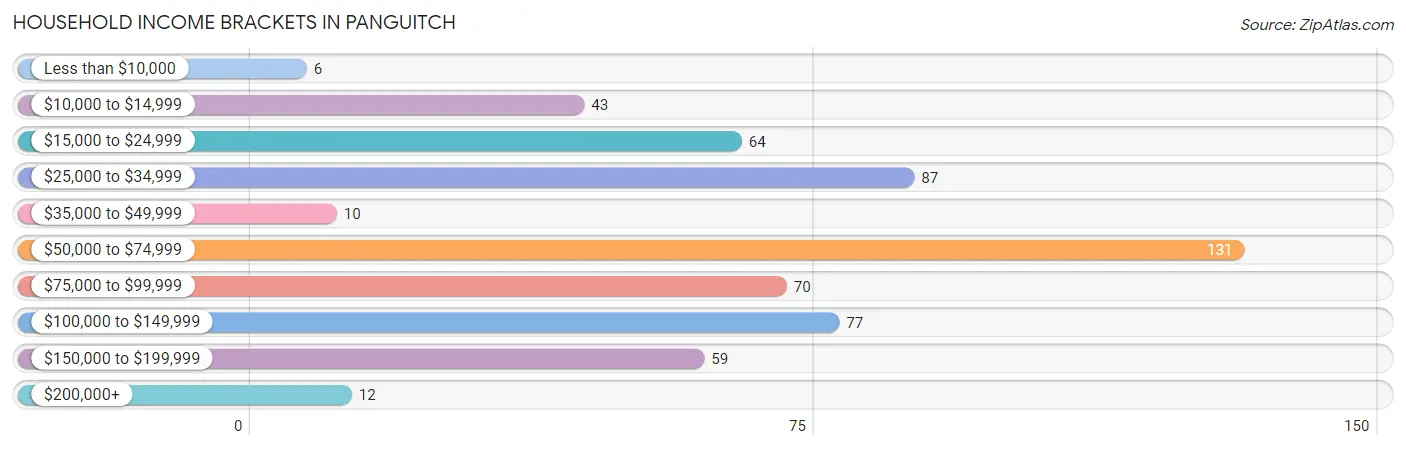
| Income Bracket | # Households | % Households |
| Less than $10,000 | 6 | 1.1% |
| $10,000 to $14,999 | 43 | 7.7% |
| $15,000 to $24,999 | 64 | 11.4% |
| $25,000 to $34,999 | 87 | 15.6% |
| $35,000 to $49,999 | 10 | 1.8% |
| $50,000 to $74,999 | 131 | 23.4% |
| $75,000 to $99,999 | 70 | 12.5% |
| $100,000 to $149,999 | 77 | 13.8% |
| $150,000 to $199,999 | 59 | 10.6% |
| $200,000+ | 12 | 2.1% |
Household Income by Householder Age in Panguitch
The median household income in Panguitch is $64,886, with the highest median household income of $133,266 found in the 45 to 64 years age bracket for the primary householder. A total of 131 households (23.4%) fall into this category.
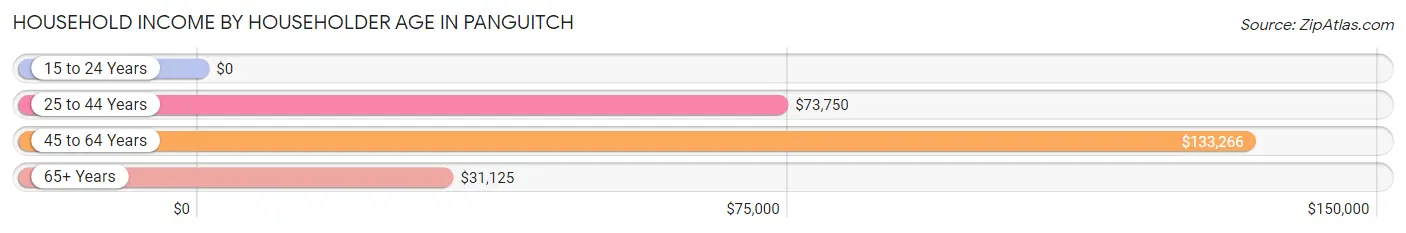
| Income Bracket | # Households | Median Income |
| 15 to 24 Years | 0 (0.0%) | $0 |
| 25 to 44 Years | 199 (35.6%) | $73,750 |
| 45 to 64 Years | 131 (23.4%) | $133,266 |
| 65+ Years | 229 (41.0%) | $31,125 |
| Total | 559 (100.0%) | $64,886 |
Poverty in Panguitch
Income Below Poverty by Sex and Age in Panguitch
With 15.3% poverty level for males and 17.0% for females among the residents of Panguitch, 5 year old males and under 5 year old females are the most vulnerable to poverty, with 12 males (100.0%) and 46 females (78.0%) in their respective age groups living below the poverty level.
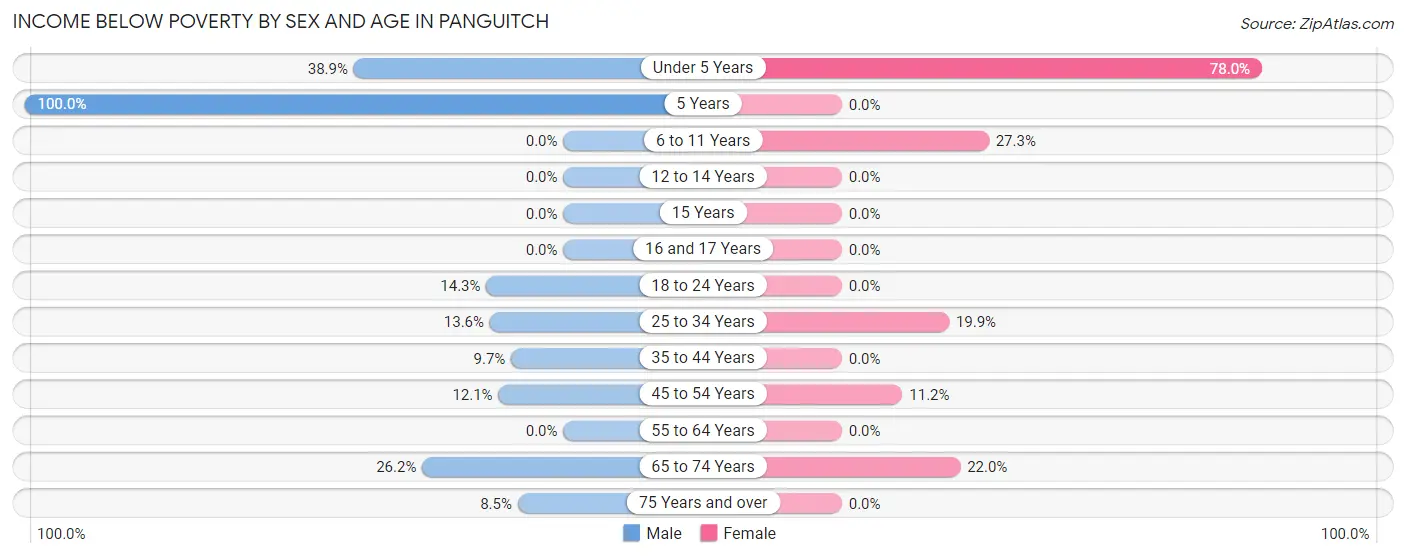
| Age Bracket | Male | Female |
| Under 5 Years | 28 (38.9%) | 46 (78.0%) |
| 5 Years | 12 (100.0%) | 0 (0.0%) |
| 6 to 11 Years | 0 (0.0%) | 33 (27.3%) |
| 12 to 14 Years | 0 (0.0%) | 0 (0.0%) |
| 15 Years | 0 (0.0%) | 0 (0.0%) |
| 16 and 17 Years | 0 (0.0%) | 0 (0.0%) |
| 18 to 24 Years | 4 (14.3%) | 0 (0.0%) |
| 25 to 34 Years | 9 (13.6%) | 36 (19.9%) |
| 35 to 44 Years | 6 (9.7%) | 0 (0.0%) |
| 45 to 54 Years | 10 (12.0%) | 10 (11.2%) |
| 55 to 64 Years | 0 (0.0%) | 0 (0.0%) |
| 65 to 74 Years | 33 (26.2%) | 20 (22.0%) |
| 75 Years and over | 6 (8.5%) | 0 (0.0%) |
| Total | 108 (15.3%) | 145 (17.0%) |
Income Above Poverty by Sex and Age in Panguitch
According to the poverty statistics in Panguitch, males aged 6 to 11 years and females aged 12 to 14 years are the age groups that are most secure financially, with 100.0% of males and 100.0% of females in these age groups living above the poverty line.
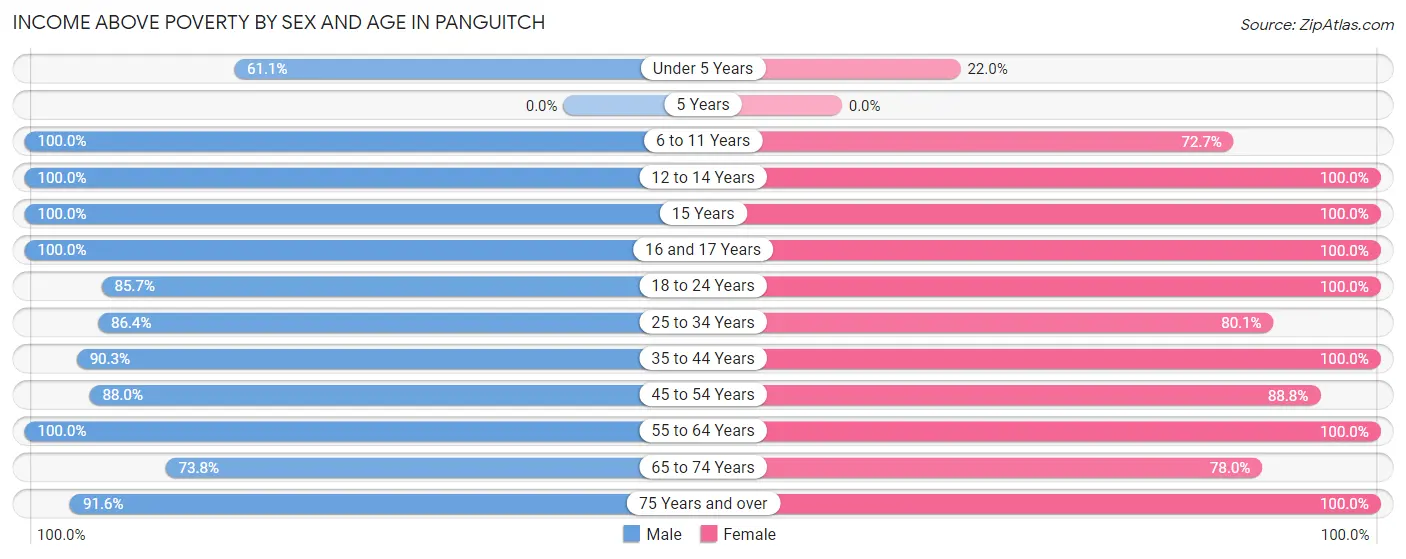
| Age Bracket | Male | Female |
| Under 5 Years | 44 (61.1%) | 13 (22.0%) |
| 5 Years | 0 (0.0%) | 0 (0.0%) |
| 6 to 11 Years | 15 (100.0%) | 88 (72.7%) |
| 12 to 14 Years | 75 (100.0%) | 39 (100.0%) |
| 15 Years | 23 (100.0%) | 38 (100.0%) |
| 16 and 17 Years | 38 (100.0%) | 20 (100.0%) |
| 18 to 24 Years | 24 (85.7%) | 77 (100.0%) |
| 25 to 34 Years | 57 (86.4%) | 145 (80.1%) |
| 35 to 44 Years | 56 (90.3%) | 46 (100.0%) |
| 45 to 54 Years | 73 (87.9%) | 79 (88.8%) |
| 55 to 64 Years | 34 (100.0%) | 62 (100.0%) |
| 65 to 74 Years | 93 (73.8%) | 71 (78.0%) |
| 75 Years and over | 65 (91.5%) | 29 (100.0%) |
| Total | 597 (84.7%) | 707 (83.0%) |
Income Below Poverty Among Married-Couple Families in Panguitch
The poverty statistics for married-couple families in Panguitch show that 12.4% or 46 of the total 372 families live below the poverty line. Families with 3 or 4 children have the highest poverty rate of 30.6%, comprising of 26 families. On the other hand, families with 1 or 2 children have the lowest poverty rate of 0.0%, which includes 0 families.
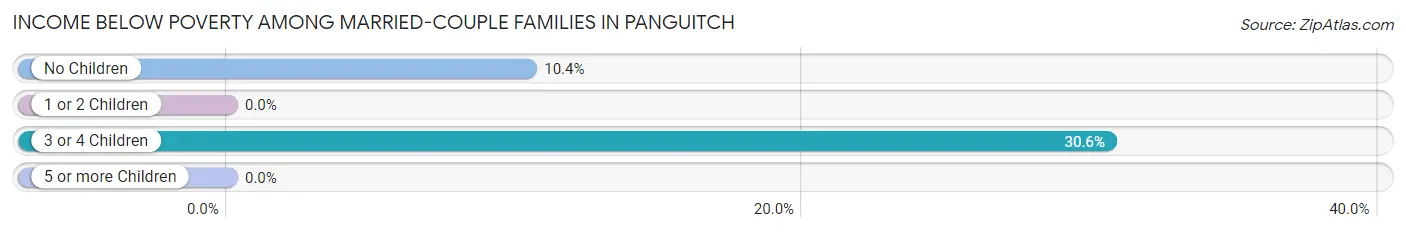
| Children | Above Poverty | Below Poverty |
| No Children | 172 (89.6%) | 20 (10.4%) |
| 1 or 2 Children | 95 (100.0%) | 0 (0.0%) |
| 3 or 4 Children | 59 (69.4%) | 26 (30.6%) |
| 5 or more Children | 0 (0.0%) | 0 (0.0%) |
| Total | 326 (87.6%) | 46 (12.4%) |
Income Below Poverty Among Single-Parent Households in Panguitch
According to the poverty data in Panguitch, 25.0% or 10 single-father households and 22.2% or 10 single-mother households are living below the poverty line. Among single-father households, those with no children have the highest poverty rate, with 10 households (100.0%) experiencing poverty. Likewise, among single-mother households, those with 1 or 2 children have the highest poverty rate, with 10 households (45.5%) falling below the poverty line.
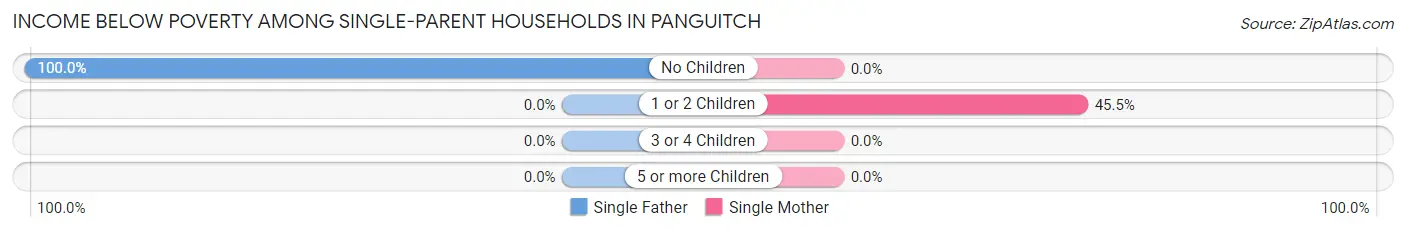
| Children | Single Father | Single Mother |
| No Children | 10 (100.0%) | 0 (0.0%) |
| 1 or 2 Children | 0 (0.0%) | 10 (45.5%) |
| 3 or 4 Children | 0 (0.0%) | 0 (0.0%) |
| 5 or more Children | 0 (0.0%) | 0 (0.0%) |
| Total | 10 (25.0%) | 10 (22.2%) |
Income Below Poverty Among Married-Couple vs Single-Parent Households in Panguitch
The poverty data for Panguitch shows that 46 of the married-couple family households (12.4%) and 20 of the single-parent households (23.5%) are living below the poverty level. Within the married-couple family households, those with 3 or 4 children have the highest poverty rate, with 26 households (30.6%) falling below the poverty line. Among the single-parent households, those with no children have the highest poverty rate, with 10 household (30.3%) living below poverty.
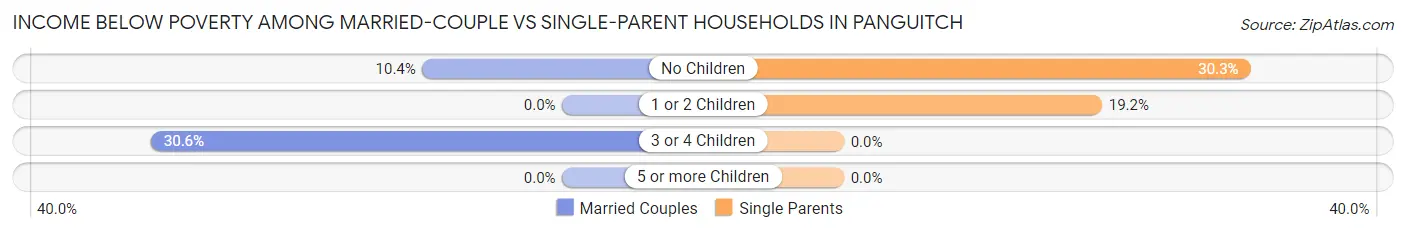
| Children | Married-Couple Families | Single-Parent Households |
| No Children | 20 (10.4%) | 10 (30.3%) |
| 1 or 2 Children | 0 (0.0%) | 10 (19.2%) |
| 3 or 4 Children | 26 (30.6%) | 0 (0.0%) |
| 5 or more Children | 0 (0.0%) | 0 (0.0%) |
| Total | 46 (12.4%) | 20 (23.5%) |
Race in Panguitch
The most populous races in Panguitch are White / Caucasian (1,606 | 94.4%), Hispanic or Latino (73 | 4.3%), and Native / Alaskan (39 | 2.3%).
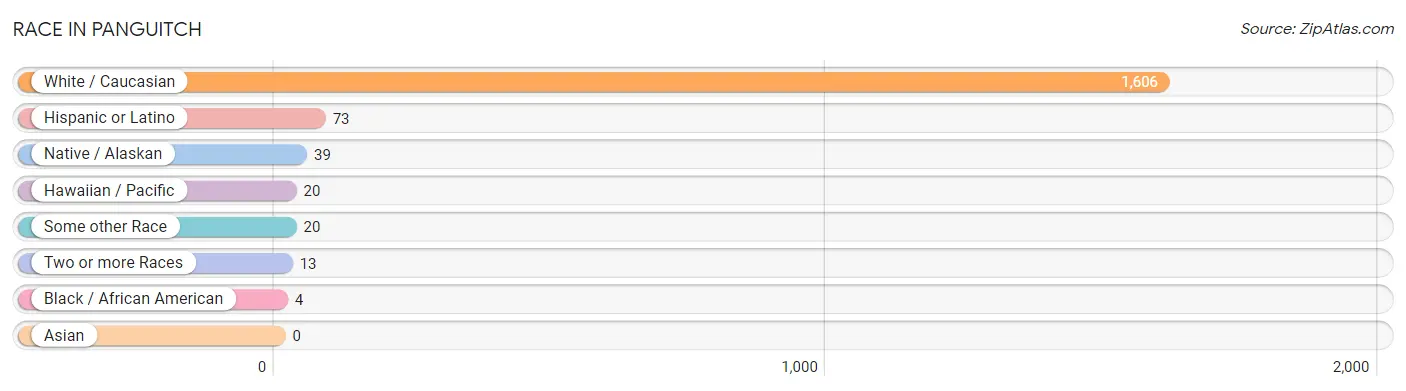
| Race | # Population | % Population |
| Asian | 0 | 0.0% |
| Black / African American | 4 | 0.2% |
| Hawaiian / Pacific | 20 | 1.2% |
| Hispanic or Latino | 73 | 4.3% |
| Native / Alaskan | 39 | 2.3% |
| White / Caucasian | 1,606 | 94.4% |
| Two or more Races | 13 | 0.8% |
| Some other Race | 20 | 1.2% |
| Total | 1,702 | 100.0% |
Ancestry in Panguitch
The most populous ancestries reported in Panguitch are English (557 | 32.7%), European (136 | 8.0%), German (128 | 7.5%), Irish (101 | 5.9%), and Scottish (100 | 5.9%), together accounting for 60.0% of all Panguitch residents.
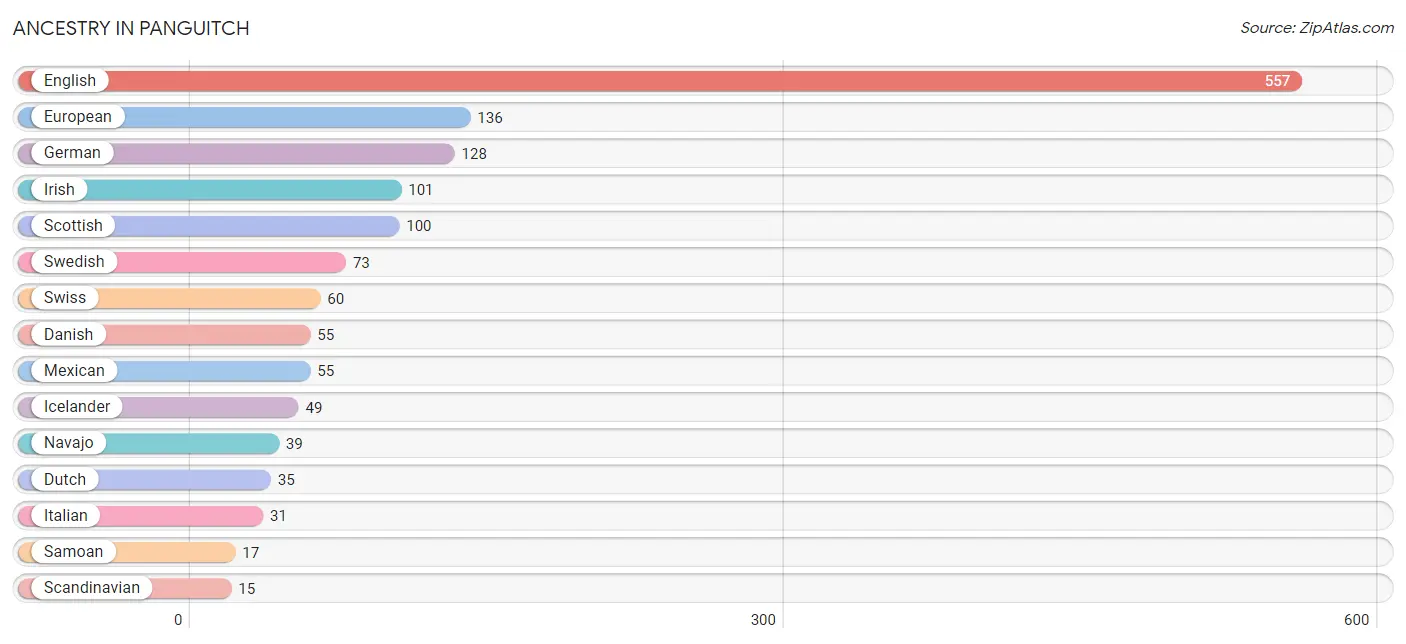
| Ancestry | # Population | % Population |
| American | 14 | 0.8% |
| British | 2 | 0.1% |
| Cajun | 7 | 0.4% |
| Central American | 4 | 0.2% |
| Danish | 55 | 3.2% |
| Dutch | 35 | 2.1% |
| English | 557 | 32.7% |
| European | 136 | 8.0% |
| French | 4 | 0.2% |
| German | 128 | 7.5% |
| Guatemalan | 4 | 0.2% |
| Icelander | 49 | 2.9% |
| Irish | 101 | 5.9% |
| Italian | 31 | 1.8% |
| Mexican | 55 | 3.2% |
| Navajo | 39 | 2.3% |
| Northern European | 14 | 0.8% |
| Norwegian | 9 | 0.5% |
| Samoan | 17 | 1.0% |
| Scandinavian | 15 | 0.9% |
| Scotch-Irish | 8 | 0.5% |
| Scottish | 100 | 5.9% |
| Spaniard | 8 | 0.5% |
| Swedish | 73 | 4.3% |
| Swiss | 60 | 3.5% |
| Tongan | 8 | 0.5% | View All 26 Rows |
Immigrants in Panguitch
The most numerous immigrant groups reported in Panguitch came from Oceania (12 | 0.7%), Central America (4 | 0.2%), Latin America (4 | 0.2%), and Mexico (4 | 0.2%), together accounting for 1.4% of all Panguitch residents.
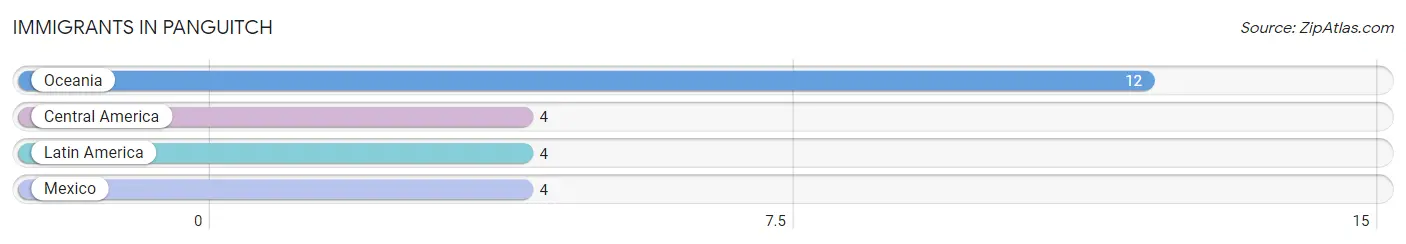
| Immigration Origin | # Population | % Population |
| Central America | 4 | 0.2% |
| Latin America | 4 | 0.2% |
| Mexico | 4 | 0.2% |
| Oceania | 12 | 0.7% | View All 4 Rows |
Sex and Age in Panguitch
Sex and Age in Panguitch
The most populous age groups in Panguitch are 30 to 34 Years (99 | 11.9%) for men and 15 to 19 Years (114 | 13.1%) for women.
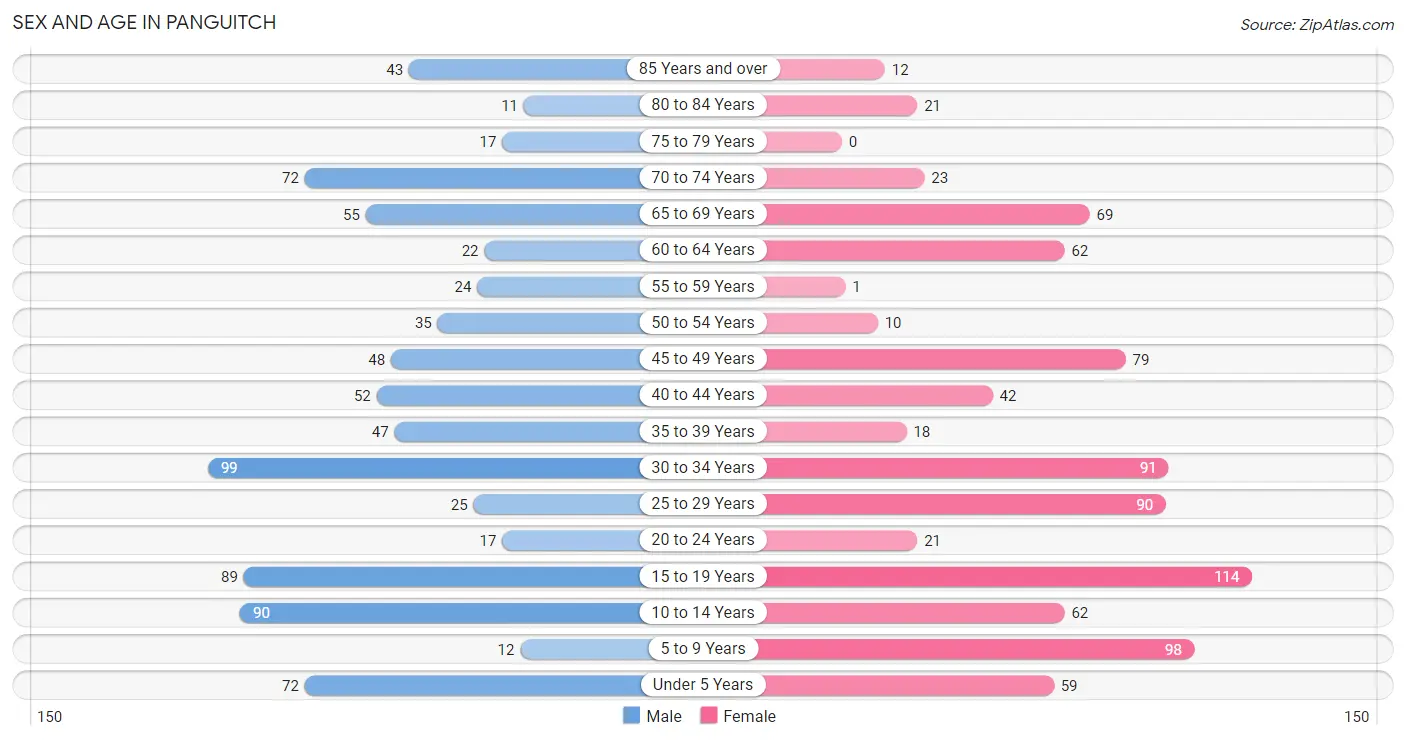
| Age Bracket | Male | Female |
| Under 5 Years | 72 (8.7%) | 59 (6.8%) |
| 5 to 9 Years | 12 (1.5%) | 98 (11.2%) |
| 10 to 14 Years | 90 (10.8%) | 62 (7.1%) |
| 15 to 19 Years | 89 (10.7%) | 114 (13.1%) |
| 20 to 24 Years | 17 (2.1%) | 21 (2.4%) |
| 25 to 29 Years | 25 (3.0%) | 90 (10.3%) |
| 30 to 34 Years | 99 (11.9%) | 91 (10.4%) |
| 35 to 39 Years | 47 (5.7%) | 18 (2.1%) |
| 40 to 44 Years | 52 (6.3%) | 42 (4.8%) |
| 45 to 49 Years | 48 (5.8%) | 79 (9.1%) |
| 50 to 54 Years | 35 (4.2%) | 10 (1.1%) |
| 55 to 59 Years | 24 (2.9%) | 1 (0.1%) |
| 60 to 64 Years | 22 (2.6%) | 62 (7.1%) |
| 65 to 69 Years | 55 (6.6%) | 69 (7.9%) |
| 70 to 74 Years | 72 (8.7%) | 23 (2.6%) |
| 75 to 79 Years | 17 (2.1%) | 0 (0.0%) |
| 80 to 84 Years | 11 (1.3%) | 21 (2.4%) |
| 85 Years and over | 43 (5.2%) | 12 (1.4%) |
| Total | 830 (100.0%) | 872 (100.0%) |
Families and Households in Panguitch
Median Family Size in Panguitch
The median family size in Panguitch is 3.15 persons per family, with single female/mother families (45 | 9.9%) accounting for the largest median family size of 3.78 persons per family. On the other hand, married-couple families (372 | 81.4%) represent the smallest median family size with 3.06 persons per family.
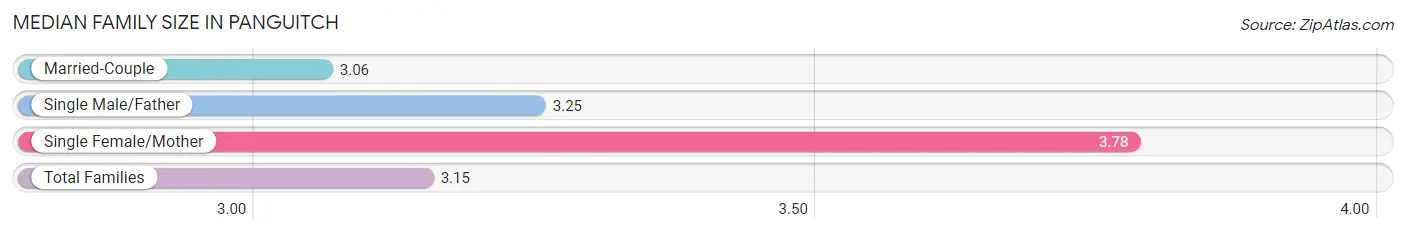
| Family Type | # Families | Family Size |
| Married-Couple | 372 (81.4%) | 3.06 |
| Single Male/Father | 40 (8.7%) | 3.25 |
| Single Female/Mother | 45 (9.9%) | 3.78 |
| Total Families | 457 (100.0%) | 3.15 |
Median Household Size in Panguitch
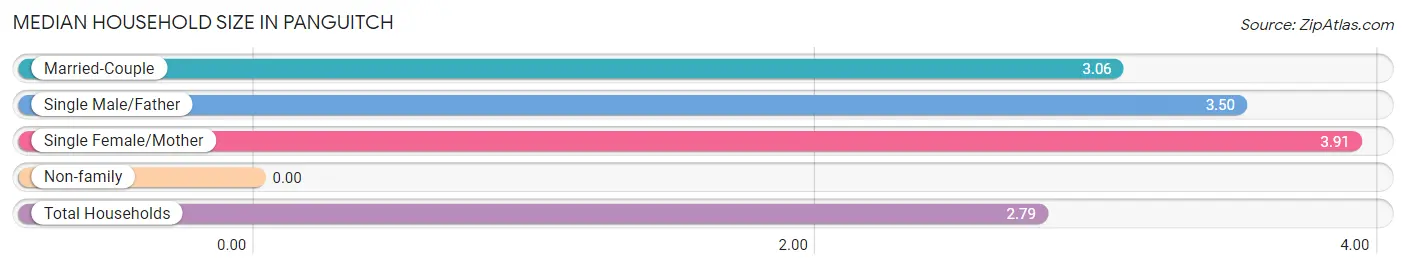
| Household Type | # Households | Household Size |
| Married-Couple | 372 (66.5%) | 3.06 |
| Single Male/Father | 40 (7.2%) | 3.50 |
| Single Female/Mother | 45 (8.1%) | 3.91 |
| Non-family | 102 (18.2%) | - |
| Total Households | 559 (100.0%) | 2.79 |
Household Size by Marriage Status in Panguitch
Out of a total of 559 households in Panguitch, 457 (81.8%) are family households, while 102 (18.2%) are nonfamily households. The most numerous type of family households are 2-person households, comprising 215, and the most common type of nonfamily households are 1-person households, comprising 102.
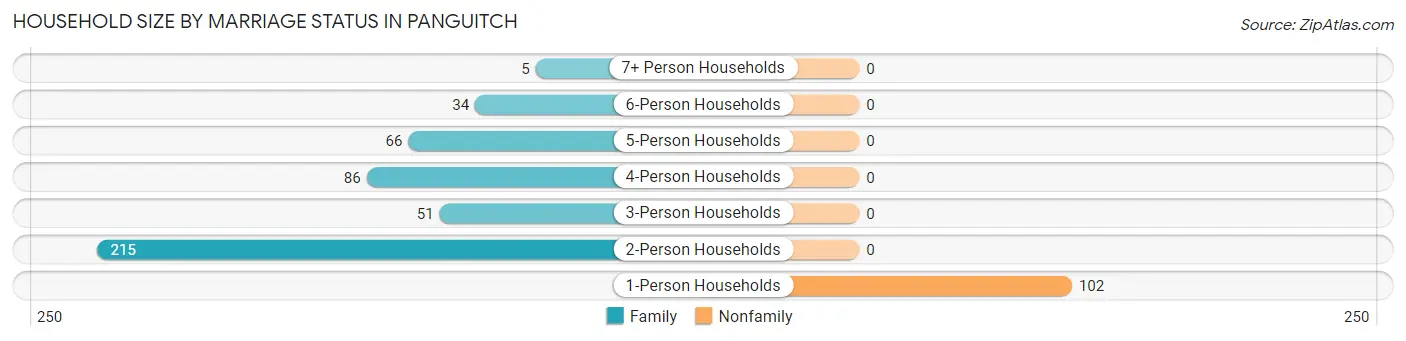
| Household Size | Family Households | Nonfamily Households |
| 1-Person Households | - | 102 (18.2%) |
| 2-Person Households | 215 (38.5%) | 0 (0.0%) |
| 3-Person Households | 51 (9.1%) | 0 (0.0%) |
| 4-Person Households | 86 (15.4%) | 0 (0.0%) |
| 5-Person Households | 66 (11.8%) | 0 (0.0%) |
| 6-Person Households | 34 (6.1%) | 0 (0.0%) |
| 7+ Person Households | 5 (0.9%) | 0 (0.0%) |
| Total | 457 (81.8%) | 102 (18.2%) |
Female Fertility in Panguitch
Fertility by Age in Panguitch
Average fertility rate in Panguitch is 7.0 births per 1,000 women. Women in the age bracket of 20 to 34 years have the highest fertility rate with 15.0 births per 1,000 women. Women in the age bracket of 20 to 34 years acount for 100.0% of all women with births.
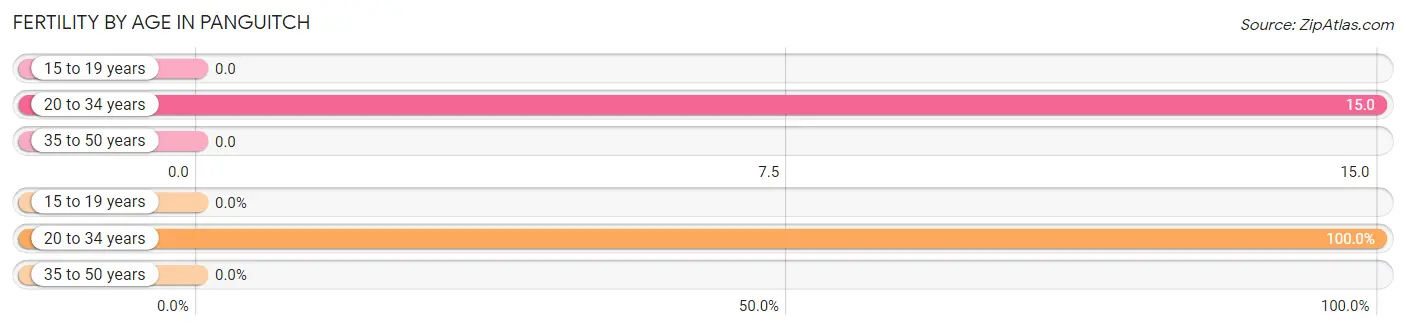
| Age Bracket | Women with Births | Births / 1,000 Women |
| 15 to 19 years | 0 (0.0%) | 0.0 |
| 20 to 34 years | 3 (100.0%) | 15.0 |
| 35 to 50 years | 0 (0.0%) | 0.0 |
| Total | 3 (100.0%) | 7.0 |
Fertility by Age by Marriage Status in Panguitch
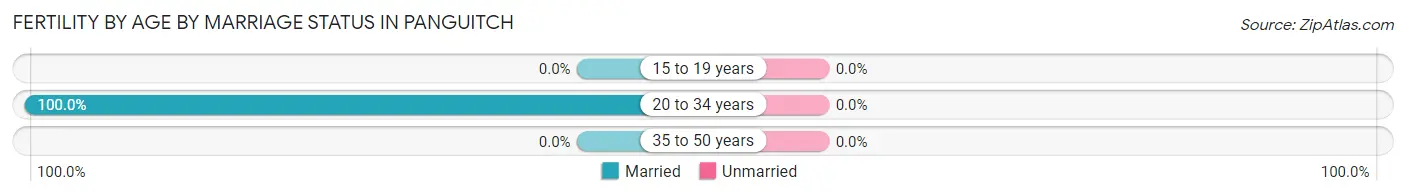
| Age Bracket | Married | Unmarried |
| 15 to 19 years | 0 (0.0%) | 0 (0.0%) |
| 20 to 34 years | 3 (100.0%) | 0 (0.0%) |
| 35 to 50 years | 0 (0.0%) | 0 (0.0%) |
| Total | 3 (100.0%) | 0 (0.0%) |
Fertility by Education in Panguitch
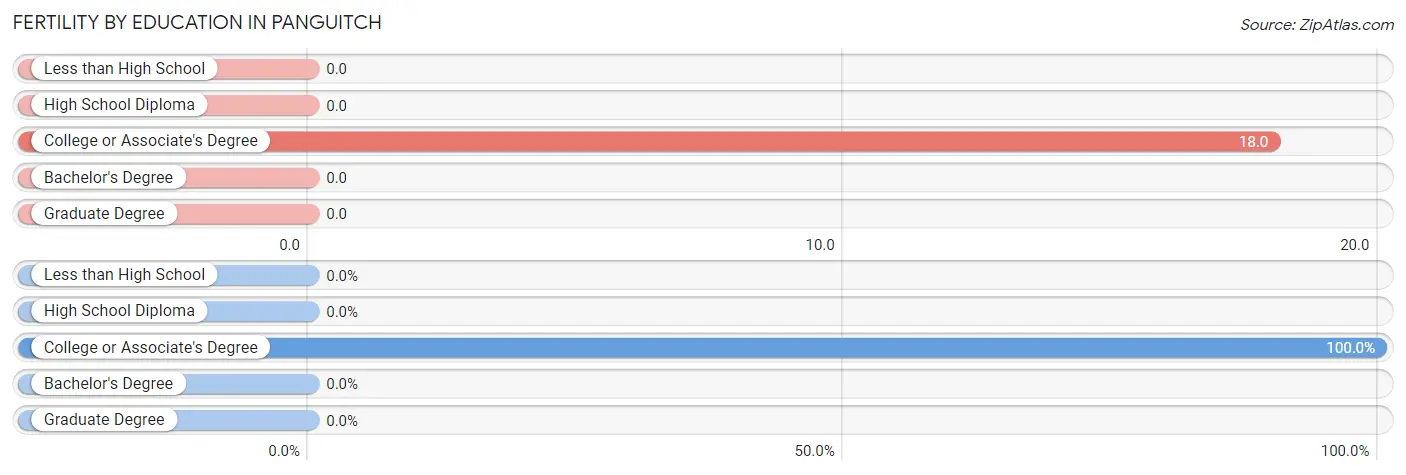
| Educational Attainment | Women with Births | Births / 1,000 Women |
| Less than High School | 0 (0.0%) | 0.0 |
| High School Diploma | 0 (0.0%) | 0.0 |
| College or Associate's Degree | 3 (100.0%) | 18.0 |
| Bachelor's Degree | 0 (0.0%) | 0.0 |
| Graduate Degree | 0 (0.0%) | 0.0 |
| Total | 3 (100.0%) | 7.0 |
Fertility by Education by Marriage Status in Panguitch
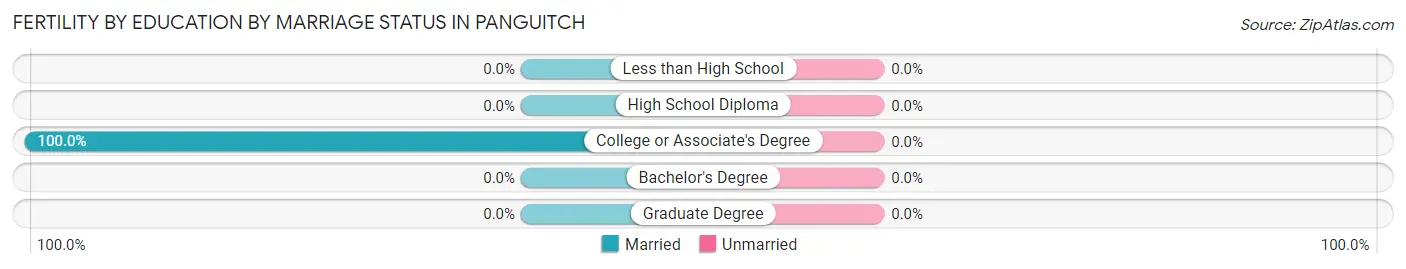
| Educational Attainment | Married | Unmarried |
| Less than High School | 0 (0.0%) | 0 (0.0%) |
| High School Diploma | 0 (0.0%) | 0 (0.0%) |
| College or Associate's Degree | 3 (100.0%) | 0 (0.0%) |
| Bachelor's Degree | 0 (0.0%) | 0 (0.0%) |
| Graduate Degree | 0 (0.0%) | 0 (0.0%) |
| Total | 3 (100.0%) | 0 (0.0%) |
Employment Characteristics in Panguitch
Employment by Class of Employer in Panguitch
Among the 647 employed individuals in Panguitch, private company employees (426 | 65.8%), local government employees (54 | 8.4%), and not-for-profit organizations (51 | 7.9%) make up the most common classes of employment.
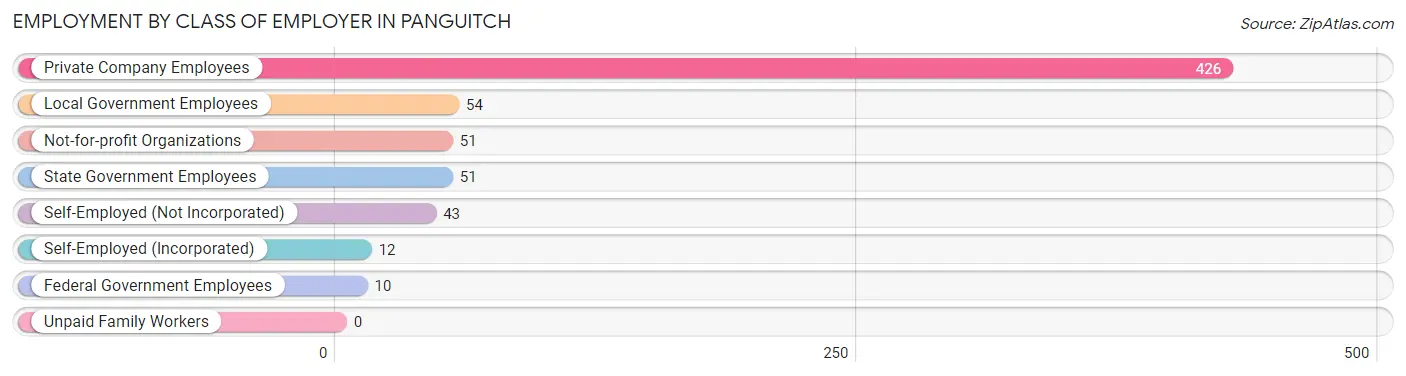
| Employer Class | # Employees | % Employees |
| Private Company Employees | 426 | 65.8% |
| Self-Employed (Incorporated) | 12 | 1.8% |
| Self-Employed (Not Incorporated) | 43 | 6.7% |
| Not-for-profit Organizations | 51 | 7.9% |
| Local Government Employees | 54 | 8.4% |
| State Government Employees | 51 | 7.9% |
| Federal Government Employees | 10 | 1.5% |
| Unpaid Family Workers | 0 | 0.0% |
| Total | 647 | 100.0% |
Employment Status by Age in Panguitch
According to the labor force statistics for Panguitch, out of the total population over 16 years of age (1,248), 56.4% or 704 individuals are in the labor force, with 6.1% or 43 of them unemployed. The age group with the highest labor force participation rate is 16 to 19 years, with 100.0% or 142 individuals in the labor force. Within the labor force, the 25 to 29 years age range has the highest percentage of unemployed individuals, with 34.4% or 31 of them being unemployed.
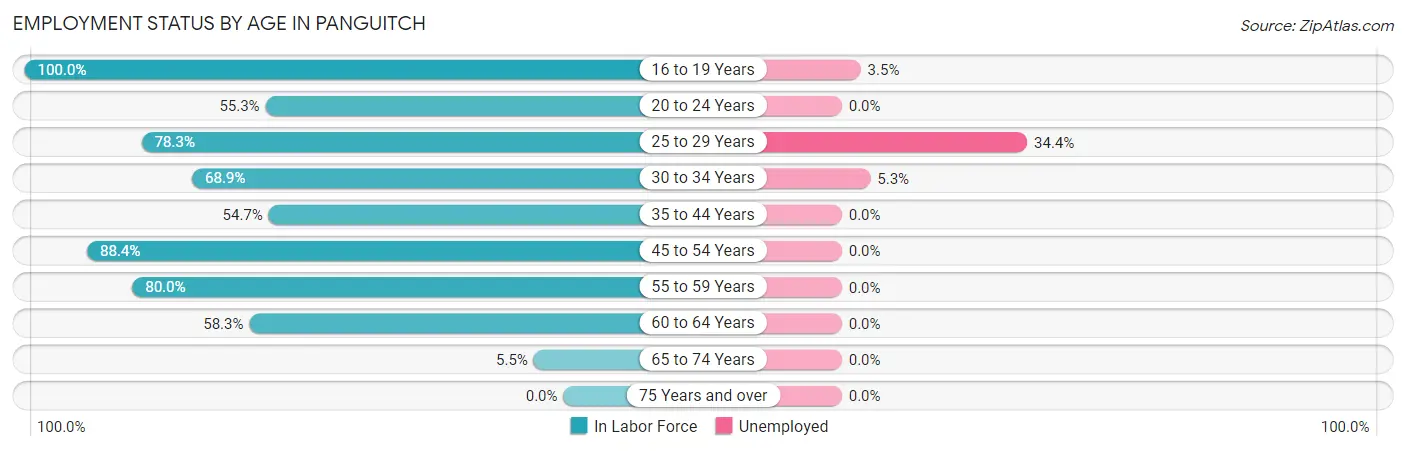
| Age Bracket | In Labor Force | Unemployed |
| 16 to 19 Years | 142 (100.0%) | 5 (3.5%) |
| 20 to 24 Years | 21 (55.3%) | 0 (0.0%) |
| 25 to 29 Years | 90 (78.3%) | 31 (34.4%) |
| 30 to 34 Years | 131 (68.9%) | 7 (5.3%) |
| 35 to 44 Years | 87 (54.7%) | 0 (0.0%) |
| 45 to 54 Years | 152 (88.4%) | 0 (0.0%) |
| 55 to 59 Years | 20 (80.0%) | 0 (0.0%) |
| 60 to 64 Years | 49 (58.3%) | 0 (0.0%) |
| 65 to 74 Years | 12 (5.5%) | 0 (0.0%) |
| 75 Years and over | 0 (0.0%) | 0 (0.0%) |
| Total | 704 (56.4%) | 43 (6.1%) |
Employment Status by Educational Attainment in Panguitch
According to labor force statistics for Panguitch, 71.0% of individuals (529) out of the total population between 25 and 64 years of age (745) are in the labor force, with 7.2% or 38 of them being unemployed. The group with the highest labor force participation rate are those with the educational attainment of bachelor's degree or higher, with 83.8% or 140 individuals in the labor force. Within the labor force, individuals with high school diploma education have the highest percentage of unemployment, with 18.2% or 31 of them being unemployed.
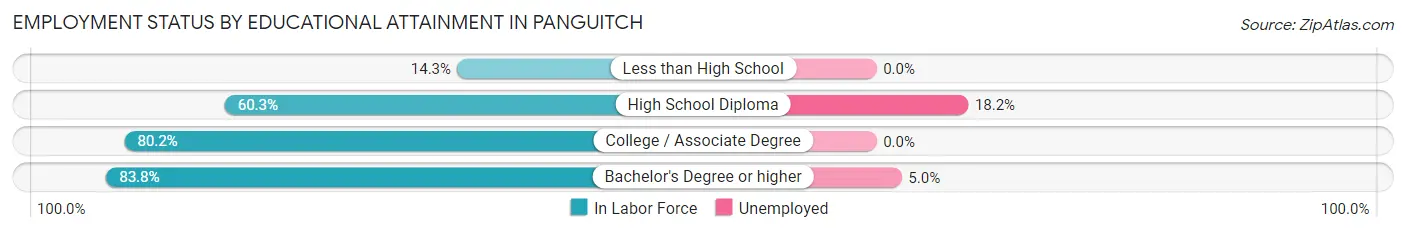
| Educational Attainment | In Labor Force | Unemployed |
| Less than High School | 4 (14.3%) | 0 (0.0%) |
| High School Diploma | 170 (60.3%) | 51 (18.2%) |
| College / Associate Degree | 215 (80.2%) | 0 (0.0%) |
| Bachelor's Degree or higher | 140 (83.8%) | 8 (5.0%) |
| Total | 529 (71.0%) | 54 (7.2%) |
Employment Occupations by Sex in Panguitch
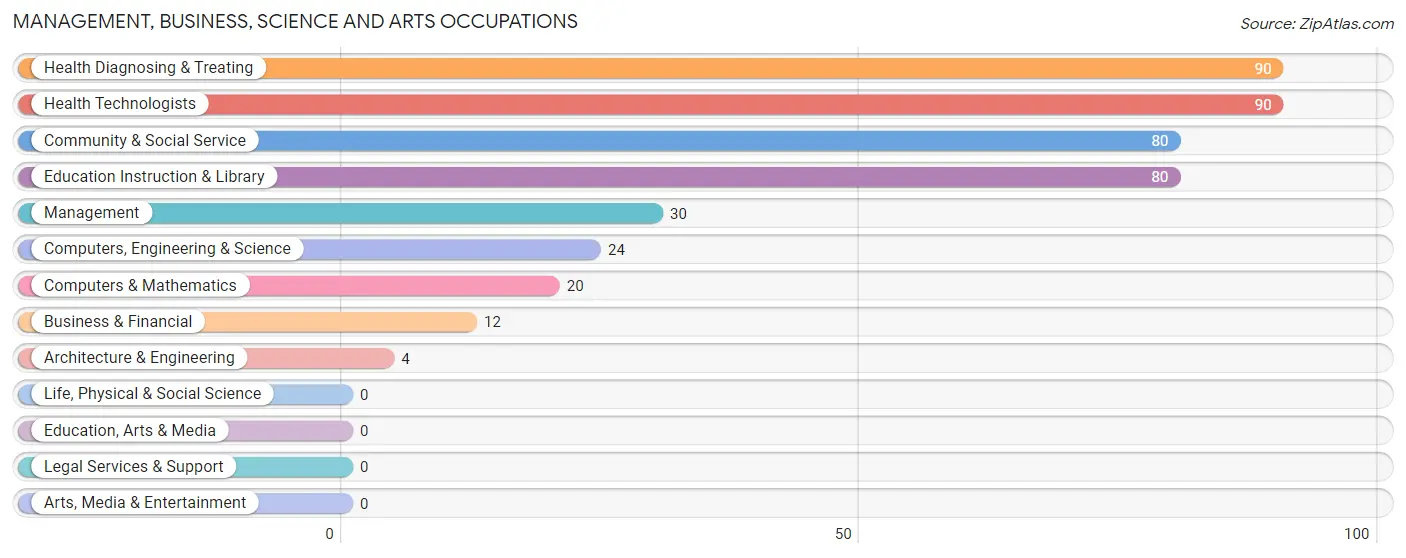
Management, Business, Science and Arts Occupations
The most common Management, Business, Science and Arts occupations in Panguitch are Health Diagnosing & Treating (90 | 13.6%), Health Technologists (90 | 13.6%), Community & Social Service (80 | 12.1%), Education Instruction & Library (80 | 12.1%), and Management (30 | 4.5%).
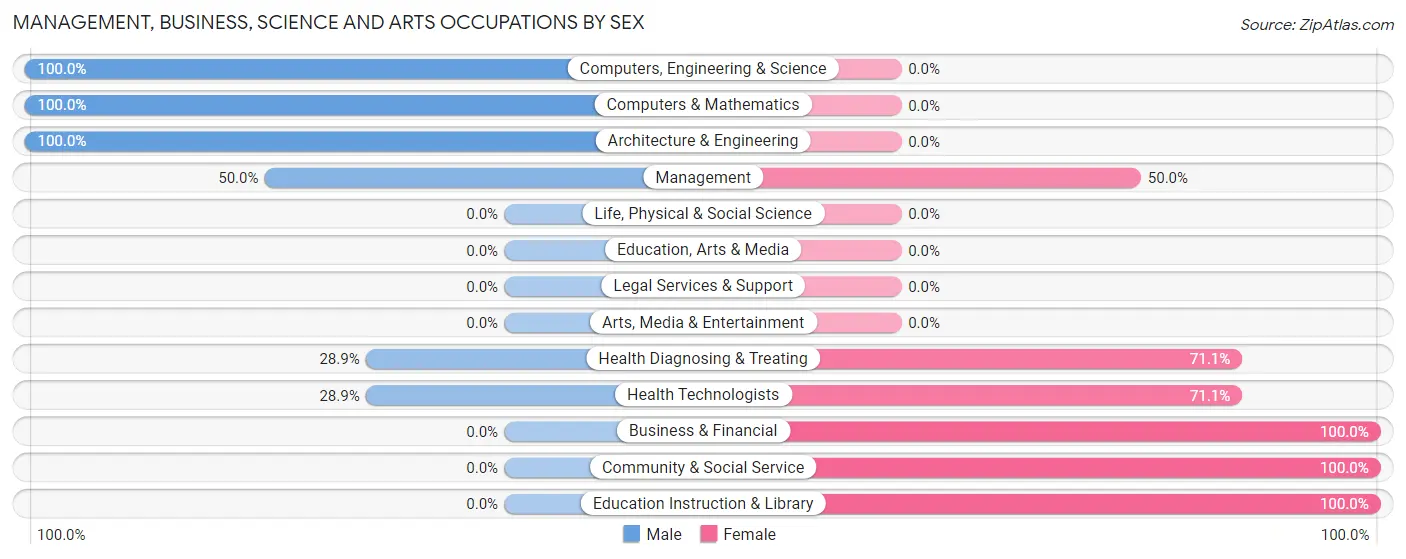
Management, Business, Science and Arts Occupations by Sex
Within the Management, Business, Science and Arts occupations in Panguitch, the most male-oriented occupations are Computers, Engineering & Science (100.0%), Computers & Mathematics (100.0%), and Architecture & Engineering (100.0%), while the most female-oriented occupations are Business & Financial (100.0%), Community & Social Service (100.0%), and Education Instruction & Library (100.0%).
| Occupation | Male | Female |
| Management | 15 (50.0%) | 15 (50.0%) |
| Business & Financial | 0 (0.0%) | 12 (100.0%) |
| Computers, Engineering & Science | 24 (100.0%) | 0 (0.0%) |
| Computers & Mathematics | 20 (100.0%) | 0 (0.0%) |
| Architecture & Engineering | 4 (100.0%) | 0 (0.0%) |
| Life, Physical & Social Science | 0 (0.0%) | 0 (0.0%) |
| Community & Social Service | 0 (0.0%) | 80 (100.0%) |
| Education, Arts & Media | 0 (0.0%) | 0 (0.0%) |
| Legal Services & Support | 0 (0.0%) | 0 (0.0%) |
| Education Instruction & Library | 0 (0.0%) | 80 (100.0%) |
| Arts, Media & Entertainment | 0 (0.0%) | 0 (0.0%) |
| Health Diagnosing & Treating | 26 (28.9%) | 64 (71.1%) |
| Health Technologists | 26 (28.9%) | 64 (71.1%) |
| Total (Category) | 65 (27.5%) | 171 (72.5%) |
| Total (Overall) | 298 (45.1%) | 363 (54.9%) |
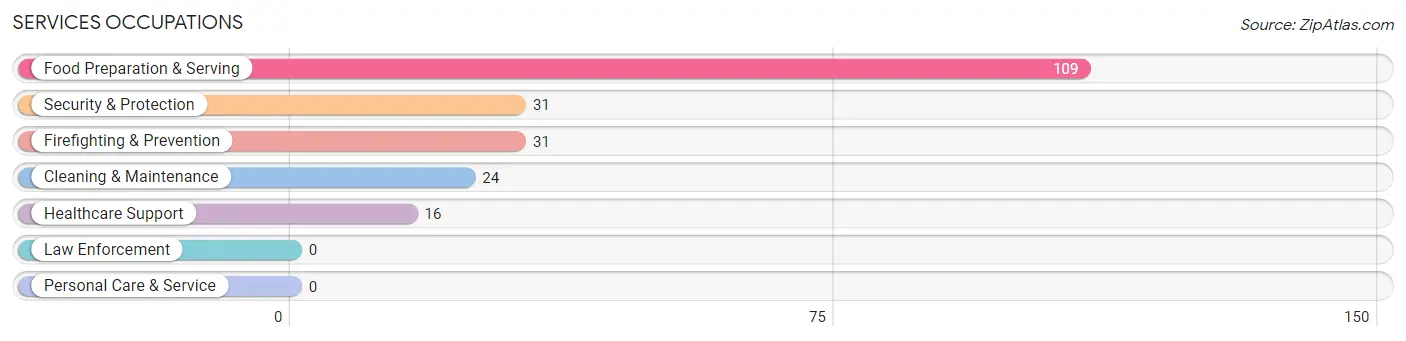
Services Occupations
The most common Services occupations in Panguitch are Food Preparation & Serving (109 | 16.5%), Security & Protection (31 | 4.7%), Firefighting & Prevention (31 | 4.7%), Cleaning & Maintenance (24 | 3.6%), and Healthcare Support (16 | 2.4%).
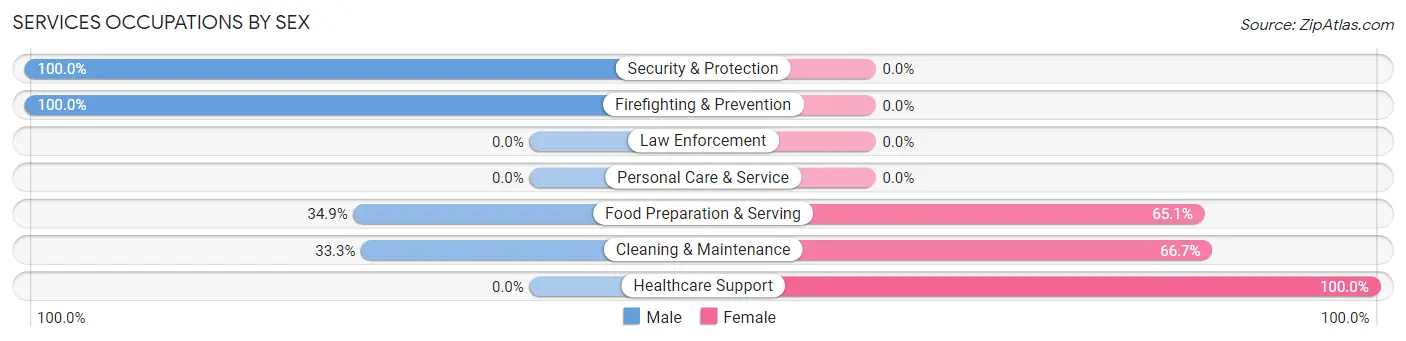
Services Occupations by Sex
Within the Services occupations in Panguitch, the most male-oriented occupations are Security & Protection (100.0%), Firefighting & Prevention (100.0%), and Food Preparation & Serving (34.9%), while the most female-oriented occupations are Healthcare Support (100.0%), Cleaning & Maintenance (66.7%), and Food Preparation & Serving (65.1%).
| Occupation | Male | Female |
| Healthcare Support | 0 (0.0%) | 16 (100.0%) |
| Security & Protection | 31 (100.0%) | 0 (0.0%) |
| Firefighting & Prevention | 31 (100.0%) | 0 (0.0%) |
| Law Enforcement | 0 (0.0%) | 0 (0.0%) |
| Food Preparation & Serving | 38 (34.9%) | 71 (65.1%) |
| Cleaning & Maintenance | 8 (33.3%) | 16 (66.7%) |
| Personal Care & Service | 0 (0.0%) | 0 (0.0%) |
| Total (Category) | 77 (42.8%) | 103 (57.2%) |
| Total (Overall) | 298 (45.1%) | 363 (54.9%) |
Sales and Office Occupations
The most common Sales and Office occupations in Panguitch are Office & Administration (61 | 9.2%), and Sales & Related (50 | 7.6%).
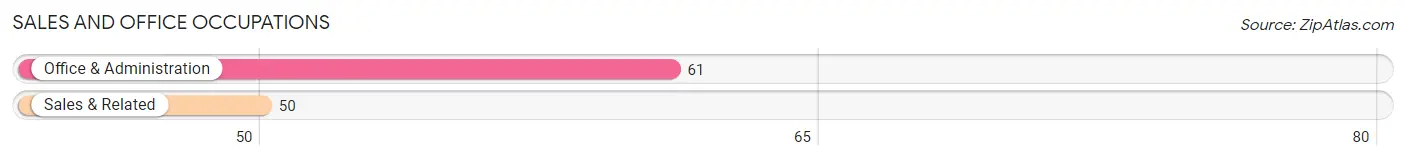
Sales and Office Occupations by Sex
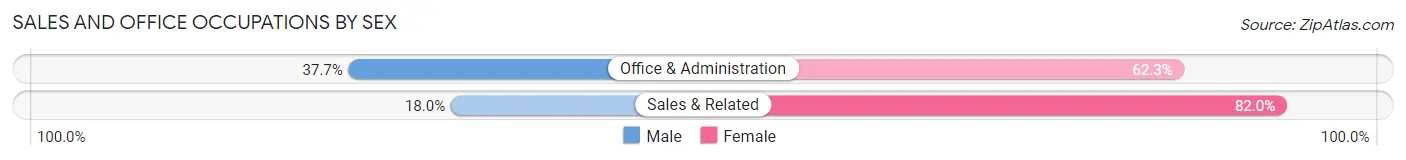
| Occupation | Male | Female |
| Sales & Related | 9 (18.0%) | 41 (82.0%) |
| Office & Administration | 23 (37.7%) | 38 (62.3%) |
| Total (Category) | 32 (28.8%) | 79 (71.2%) |
| Total (Overall) | 298 (45.1%) | 363 (54.9%) |
Natural Resources, Construction and Maintenance Occupations
The most common Natural Resources, Construction and Maintenance occupations in Panguitch are Construction & Extraction (56 | 8.5%), and Installation, Maintenance & Repair (16 | 2.4%).
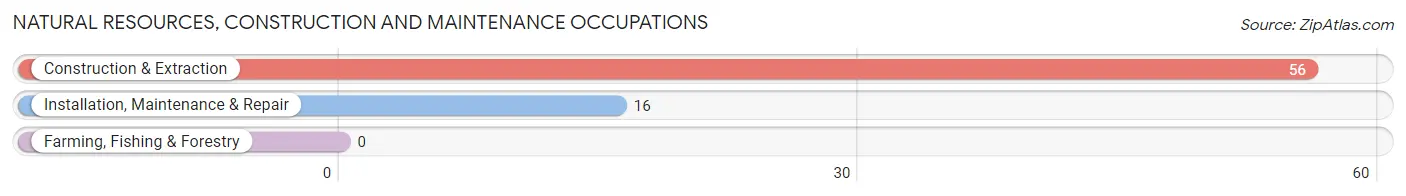
Natural Resources, Construction and Maintenance Occupations by Sex
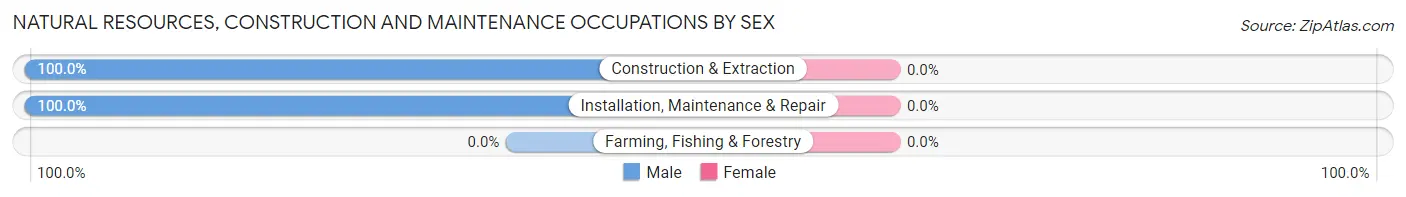
| Occupation | Male | Female |
| Farming, Fishing & Forestry | 0 (0.0%) | 0 (0.0%) |
| Construction & Extraction | 56 (100.0%) | 0 (0.0%) |
| Installation, Maintenance & Repair | 16 (100.0%) | 0 (0.0%) |
| Total (Category) | 72 (100.0%) | 0 (0.0%) |
| Total (Overall) | 298 (45.1%) | 363 (54.9%) |
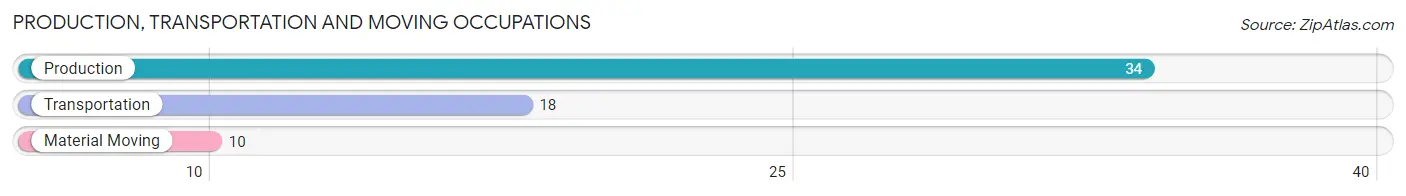
Production, Transportation and Moving Occupations
The most common Production, Transportation and Moving occupations in Panguitch are Production (34 | 5.1%), Transportation (18 | 2.7%), and Material Moving (10 | 1.5%).
Production, Transportation and Moving Occupations by Sex
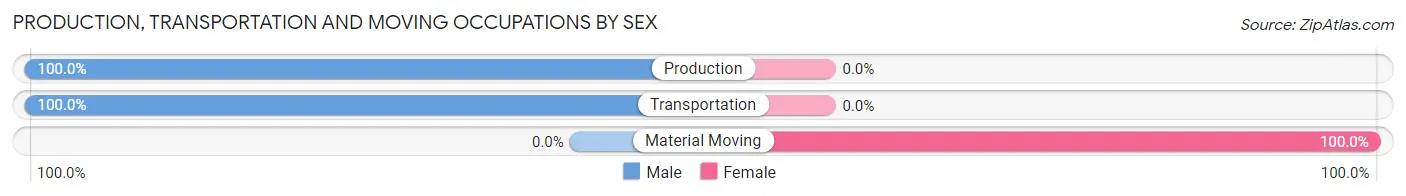
| Occupation | Male | Female |
| Production | 34 (100.0%) | 0 (0.0%) |
| Transportation | 18 (100.0%) | 0 (0.0%) |
| Material Moving | 0 (0.0%) | 10 (100.0%) |
| Total (Category) | 52 (83.9%) | 10 (16.1%) |
| Total (Overall) | 298 (45.1%) | 363 (54.9%) |
Employment Industries by Sex in Panguitch
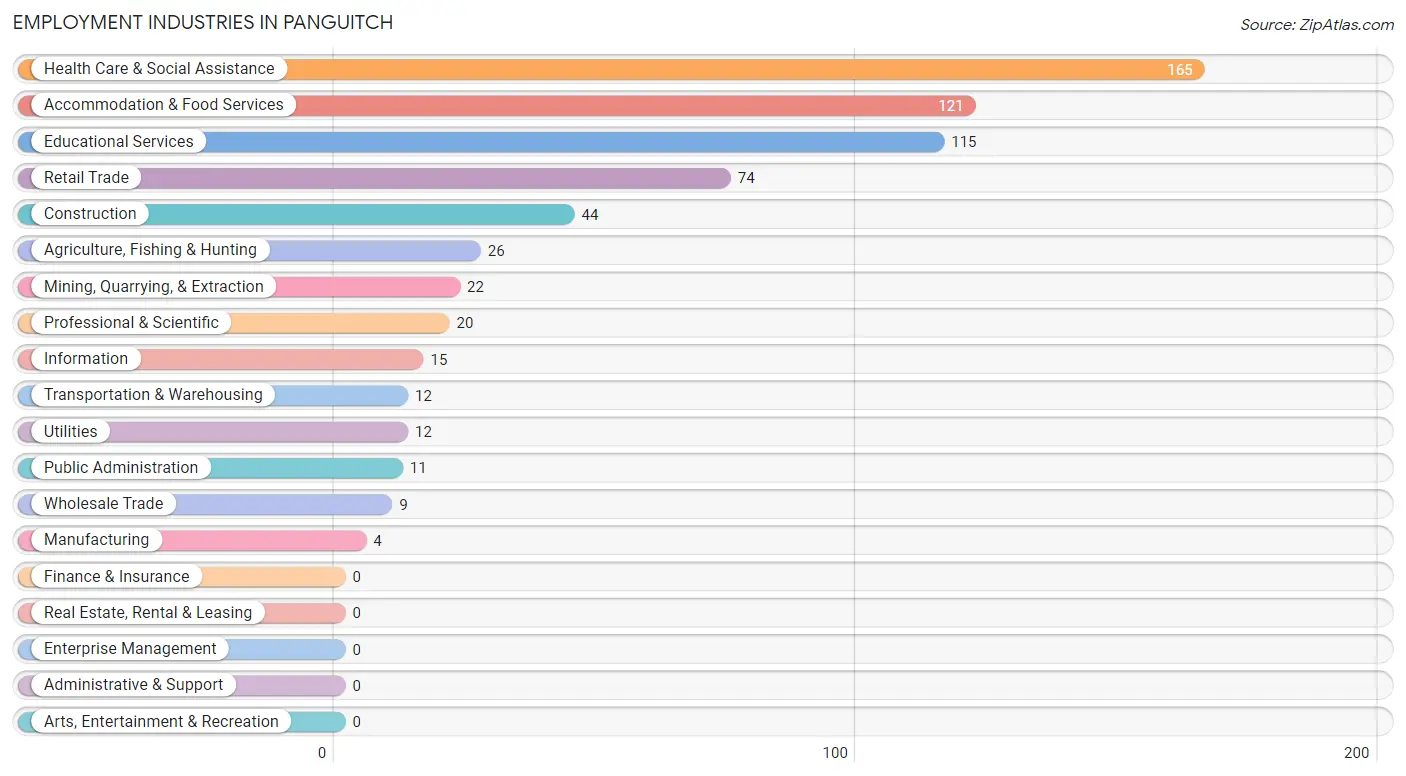
Employment Industries in Panguitch
The major employment industries in Panguitch include Health Care & Social Assistance (165 | 25.0%), Accommodation & Food Services (121 | 18.3%), Educational Services (115 | 17.4%), Retail Trade (74 | 11.2%), and Construction (44 | 6.7%).
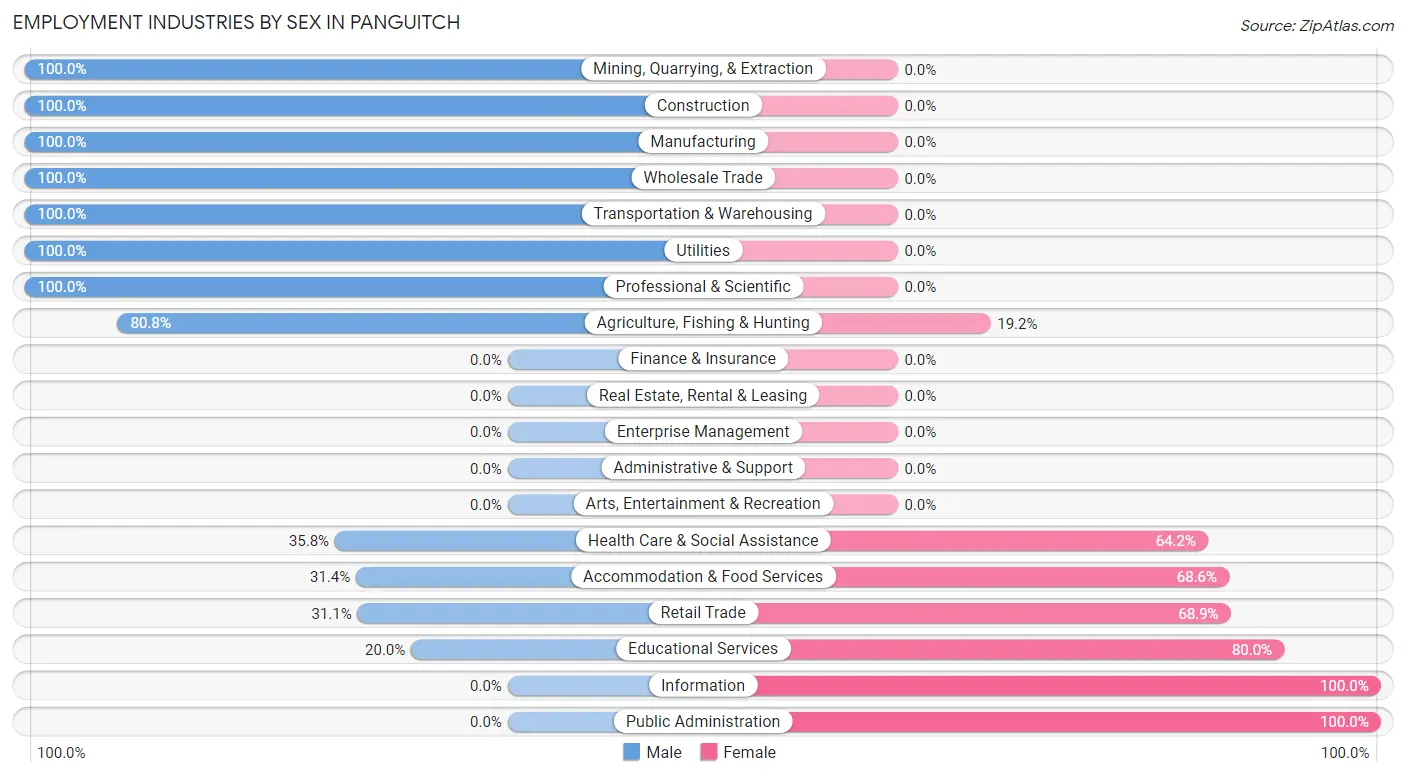
Employment Industries by Sex in Panguitch
The Panguitch industries that see more men than women are Mining, Quarrying, & Extraction (100.0%), Construction (100.0%), and Manufacturing (100.0%), whereas the industries that tend to have a higher number of women are Information (100.0%), Public Administration (100.0%), and Educational Services (80.0%).
| Industry | Male | Female |
| Agriculture, Fishing & Hunting | 21 (80.8%) | 5 (19.2%) |
| Mining, Quarrying, & Extraction | 22 (100.0%) | 0 (0.0%) |
| Construction | 44 (100.0%) | 0 (0.0%) |
| Manufacturing | 4 (100.0%) | 0 (0.0%) |
| Wholesale Trade | 9 (100.0%) | 0 (0.0%) |
| Retail Trade | 23 (31.1%) | 51 (68.9%) |
| Transportation & Warehousing | 12 (100.0%) | 0 (0.0%) |
| Utilities | 12 (100.0%) | 0 (0.0%) |
| Information | 0 (0.0%) | 15 (100.0%) |
| Finance & Insurance | 0 (0.0%) | 0 (0.0%) |
| Real Estate, Rental & Leasing | 0 (0.0%) | 0 (0.0%) |
| Professional & Scientific | 20 (100.0%) | 0 (0.0%) |
| Enterprise Management | 0 (0.0%) | 0 (0.0%) |
| Administrative & Support | 0 (0.0%) | 0 (0.0%) |
| Educational Services | 23 (20.0%) | 92 (80.0%) |
| Health Care & Social Assistance | 59 (35.8%) | 106 (64.2%) |
| Arts, Entertainment & Recreation | 0 (0.0%) | 0 (0.0%) |
| Accommodation & Food Services | 38 (31.4%) | 83 (68.6%) |
| Public Administration | 0 (0.0%) | 11 (100.0%) |
| Total | 298 (45.1%) | 363 (54.9%) |
Education in Panguitch
School Enrollment in Panguitch
The most common levels of schooling among the 585 students in Panguitch are high school (226 | 38.6%), middle school (131 | 22.4%), and elementary school (105 | 17.9%).
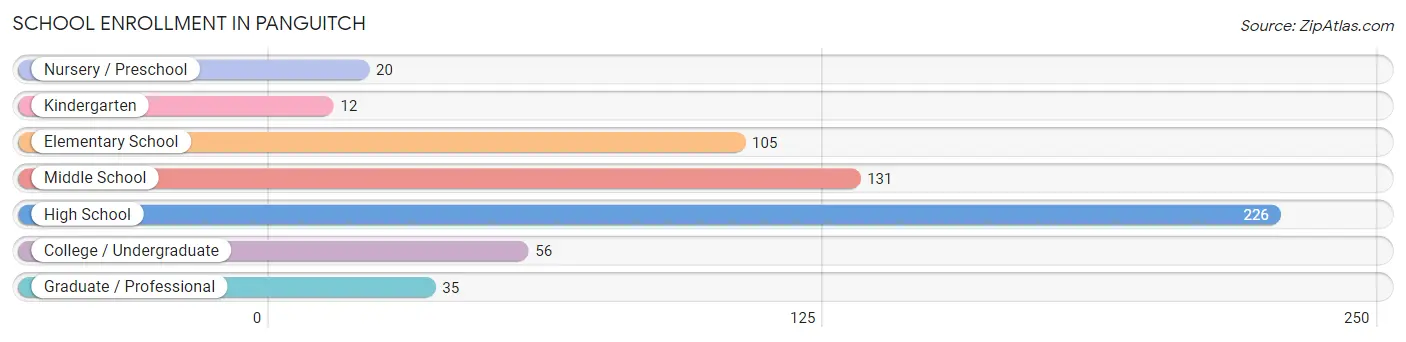
| School Level | # Students | % Students |
| Nursery / Preschool | 20 | 3.4% |
| Kindergarten | 12 | 2.1% |
| Elementary School | 105 | 17.9% |
| Middle School | 131 | 22.4% |
| High School | 226 | 38.6% |
| College / Undergraduate | 56 | 9.6% |
| Graduate / Professional | 35 | 6.0% |
| Total | 585 | 100.0% |
School Enrollment by Age by Funding Source in Panguitch
Out of a total of 585 students who are enrolled in schools in Panguitch, 31 (5.3%) attend a private institution, while the remaining 554 (94.7%) are enrolled in public schools. The age group of 35 years and over has the highest likelihood of being enrolled in private schools, with 31 (77.5% in the age bracket) enrolled. Conversely, the age group of 3 to 4 year olds has the lowest likelihood of being enrolled in a private school, with 20 (100.0% in the age bracket) attending a public institution.
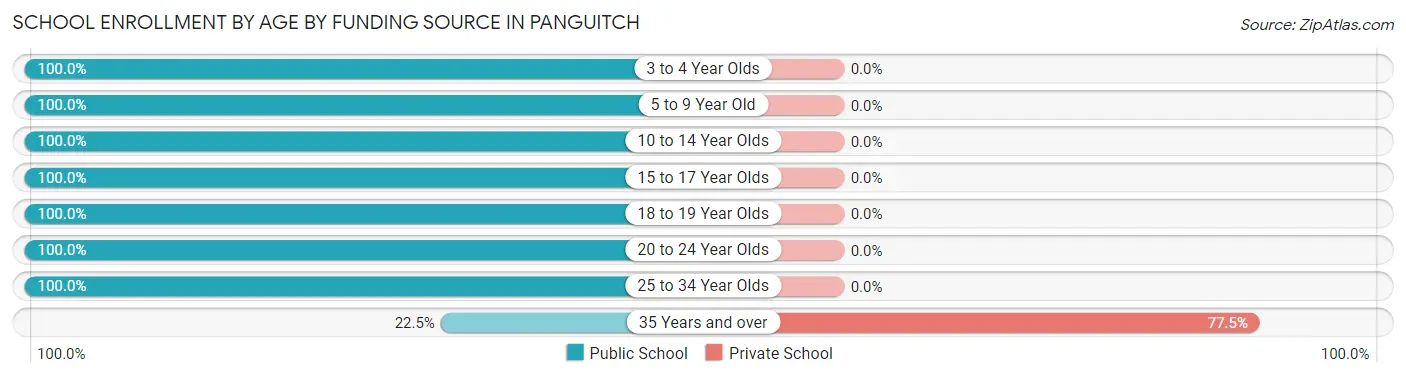
| Age Bracket | Public School | Private School |
| 3 to 4 Year Olds | 20 (100.0%) | 0 (0.0%) |
| 5 to 9 Year Old | 110 (100.0%) | 0 (0.0%) |
| 10 to 14 Year Olds | 152 (100.0%) | 0 (0.0%) |
| 15 to 17 Year Olds | 119 (100.0%) | 0 (0.0%) |
| 18 to 19 Year Olds | 79 (100.0%) | 0 (0.0%) |
| 20 to 24 Year Olds | 27 (100.0%) | 0 (0.0%) |
| 25 to 34 Year Olds | 38 (100.0%) | 0 (0.0%) |
| 35 Years and over | 9 (22.5%) | 31 (77.5%) |
| Total | 554 (94.7%) | 31 (5.3%) |
Educational Attainment by Field of Study in Panguitch
Education (72 | 30.5%), psychology (39 | 16.5%), arts & humanities (23 | 9.8%), bio, nature & agricultural (21 | 8.9%), and engineering (20 | 8.5%) are the most common fields of study among 236 individuals in Panguitch who have obtained a bachelor's degree or higher.
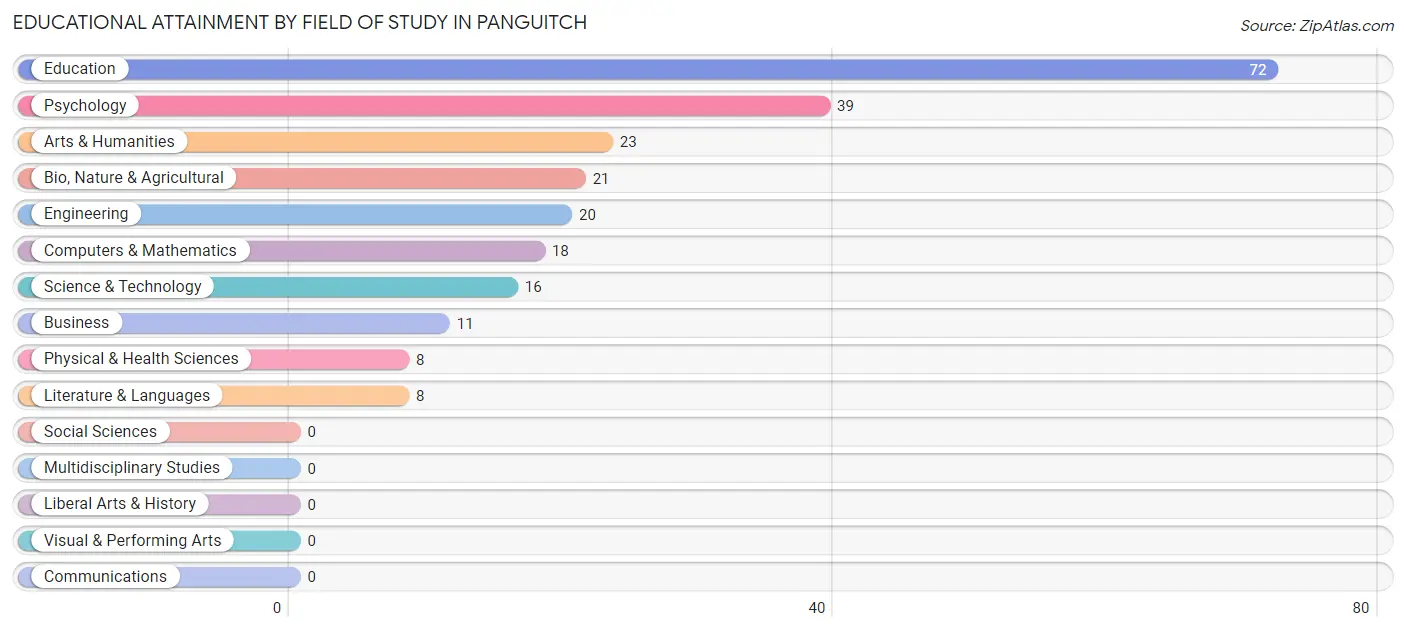
| Field of Study | # Graduates | % Graduates |
| Computers & Mathematics | 18 | 7.6% |
| Bio, Nature & Agricultural | 21 | 8.9% |
| Physical & Health Sciences | 8 | 3.4% |
| Psychology | 39 | 16.5% |
| Social Sciences | 0 | 0.0% |
| Engineering | 20 | 8.5% |
| Multidisciplinary Studies | 0 | 0.0% |
| Science & Technology | 16 | 6.8% |
| Business | 11 | 4.7% |
| Education | 72 | 30.5% |
| Literature & Languages | 8 | 3.4% |
| Liberal Arts & History | 0 | 0.0% |
| Visual & Performing Arts | 0 | 0.0% |
| Communications | 0 | 0.0% |
| Arts & Humanities | 23 | 9.8% |
| Total | 236 | 100.0% |
Transportation & Commute in Panguitch
Vehicle Availability by Sex in Panguitch
The most prevalent vehicle ownership categories in Panguitch are males with 2 vehicles (124, accounting for 43.7%) and females with 2 vehicles (126, making up 34.2%).
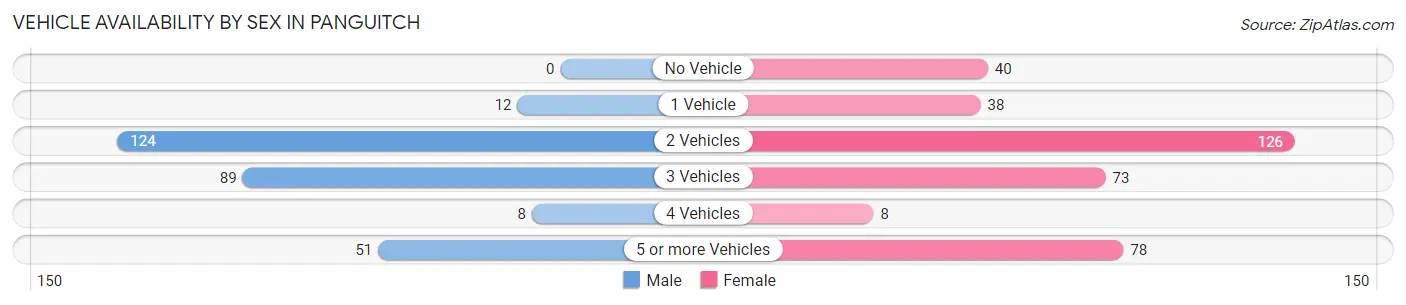
| Vehicles Available | Male | Female |
| No Vehicle | 0 (0.0%) | 40 (11.0%) |
| 1 Vehicle | 12 (4.2%) | 38 (10.5%) |
| 2 Vehicles | 124 (43.7%) | 126 (34.7%) |
| 3 Vehicles | 89 (31.3%) | 73 (20.1%) |
| 4 Vehicles | 8 (2.8%) | 8 (2.2%) |
| 5 or more Vehicles | 51 (18.0%) | 78 (21.5%) |
| Total | 284 (100.0%) | 363 (100.0%) |
Commute Time in Panguitch
The most frequently occuring commute durations in Panguitch are less than 5 minutes (284 commuters, 46.2%), 5 to 9 minutes (228 commuters, 37.1%), and 45 to 59 minutes (35 commuters, 5.7%).
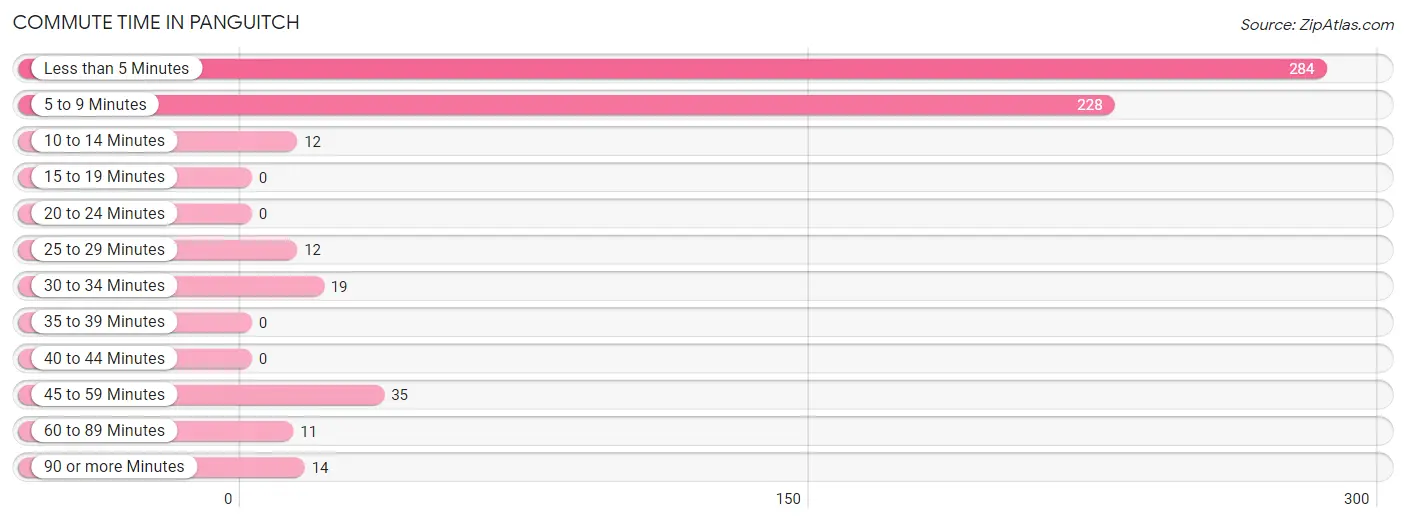
| Commute Time | # Commuters | % Commuters |
| Less than 5 Minutes | 284 | 46.2% |
| 5 to 9 Minutes | 228 | 37.1% |
| 10 to 14 Minutes | 12 | 1.9% |
| 15 to 19 Minutes | 0 | 0.0% |
| 20 to 24 Minutes | 0 | 0.0% |
| 25 to 29 Minutes | 12 | 1.9% |
| 30 to 34 Minutes | 19 | 3.1% |
| 35 to 39 Minutes | 0 | 0.0% |
| 40 to 44 Minutes | 0 | 0.0% |
| 45 to 59 Minutes | 35 | 5.7% |
| 60 to 89 Minutes | 11 | 1.8% |
| 90 or more Minutes | 14 | 2.3% |
Commute Time by Sex in Panguitch
The most common commute times in Panguitch are less than 5 minutes (124 commuters, 47.0%) for males and less than 5 minutes (160 commuters, 45.6%) for females.
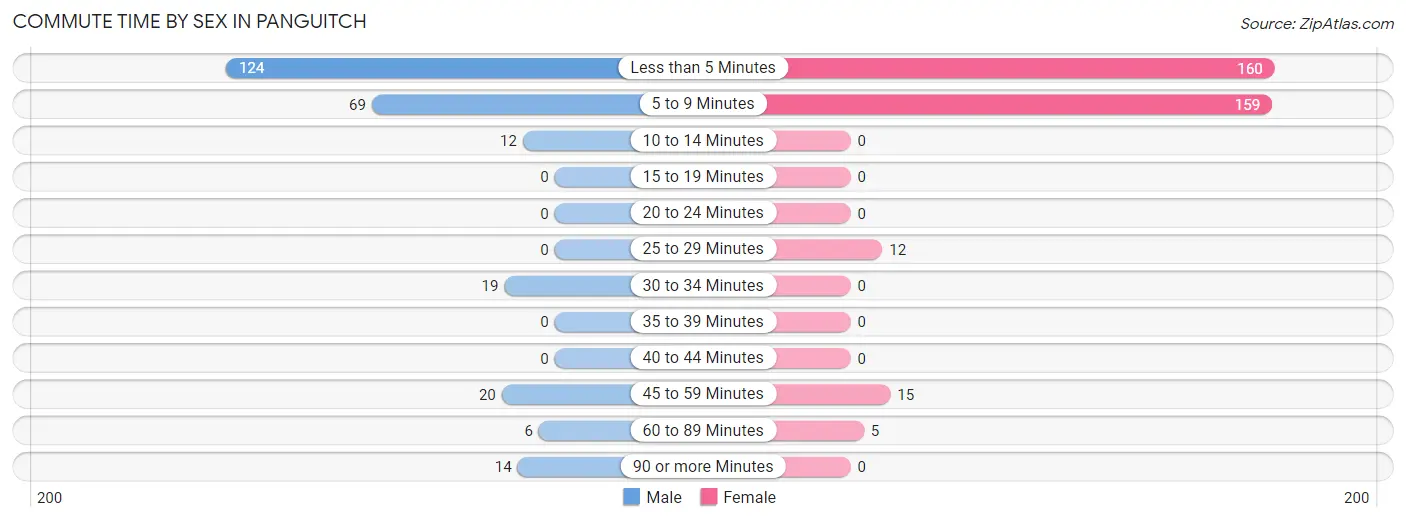
| Commute Time | Male | Female |
| Less than 5 Minutes | 124 (47.0%) | 160 (45.6%) |
| 5 to 9 Minutes | 69 (26.1%) | 159 (45.3%) |
| 10 to 14 Minutes | 12 (4.5%) | 0 (0.0%) |
| 15 to 19 Minutes | 0 (0.0%) | 0 (0.0%) |
| 20 to 24 Minutes | 0 (0.0%) | 0 (0.0%) |
| 25 to 29 Minutes | 0 (0.0%) | 12 (3.4%) |
| 30 to 34 Minutes | 19 (7.2%) | 0 (0.0%) |
| 35 to 39 Minutes | 0 (0.0%) | 0 (0.0%) |
| 40 to 44 Minutes | 0 (0.0%) | 0 (0.0%) |
| 45 to 59 Minutes | 20 (7.6%) | 15 (4.3%) |
| 60 to 89 Minutes | 6 (2.3%) | 5 (1.4%) |
| 90 or more Minutes | 14 (5.3%) | 0 (0.0%) |
Time of Departure to Work by Sex in Panguitch
The most frequent times of departure to work in Panguitch are 7:00 AM to 7:29 AM (65, 24.6%) for males and 8:00 AM to 8:29 AM (62, 17.7%) for females.
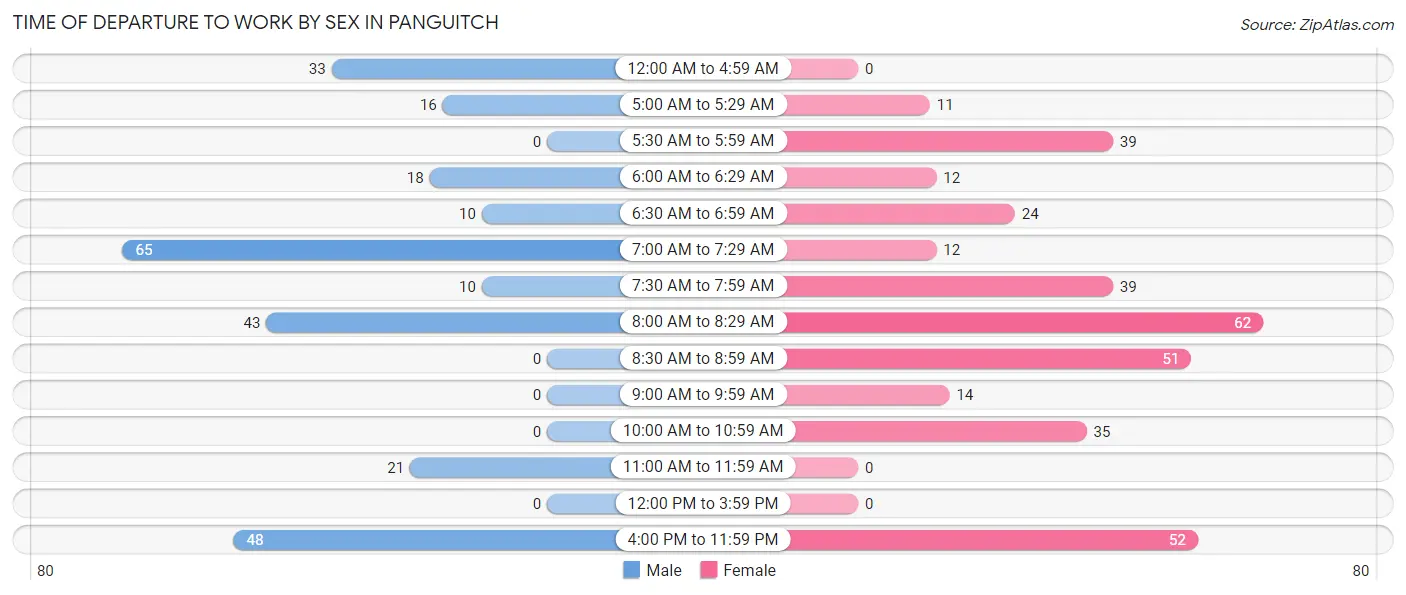
| Time of Departure | Male | Female |
| 12:00 AM to 4:59 AM | 33 (12.5%) | 0 (0.0%) |
| 5:00 AM to 5:29 AM | 16 (6.1%) | 11 (3.1%) |
| 5:30 AM to 5:59 AM | 0 (0.0%) | 39 (11.1%) |
| 6:00 AM to 6:29 AM | 18 (6.8%) | 12 (3.4%) |
| 6:30 AM to 6:59 AM | 10 (3.8%) | 24 (6.8%) |
| 7:00 AM to 7:29 AM | 65 (24.6%) | 12 (3.4%) |
| 7:30 AM to 7:59 AM | 10 (3.8%) | 39 (11.1%) |
| 8:00 AM to 8:29 AM | 43 (16.3%) | 62 (17.7%) |
| 8:30 AM to 8:59 AM | 0 (0.0%) | 51 (14.5%) |
| 9:00 AM to 9:59 AM | 0 (0.0%) | 14 (4.0%) |
| 10:00 AM to 10:59 AM | 0 (0.0%) | 35 (10.0%) |
| 11:00 AM to 11:59 AM | 21 (8.0%) | 0 (0.0%) |
| 12:00 PM to 3:59 PM | 0 (0.0%) | 0 (0.0%) |
| 4:00 PM to 11:59 PM | 48 (18.2%) | 52 (14.8%) |
| Total | 264 (100.0%) | 351 (100.0%) |
Housing Occupancy in Panguitch
Occupancy by Ownership in Panguitch
Of the total 559 dwellings in Panguitch, owner-occupied units account for 447 (80.0%), while renter-occupied units make up 112 (20.0%).
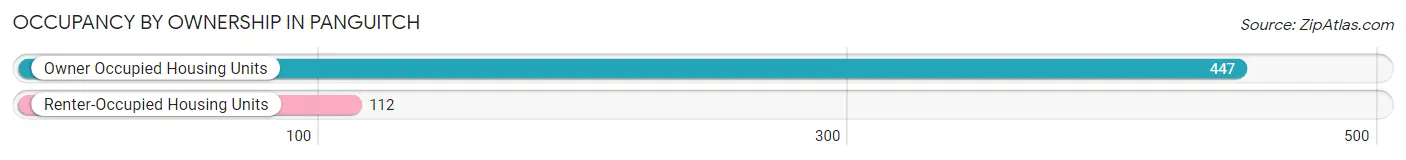
| Occupancy | # Housing Units | % Housing Units |
| Owner Occupied Housing Units | 447 | 80.0% |
| Renter-Occupied Housing Units | 112 | 20.0% |
| Total Occupied Housing Units | 559 | 100.0% |
Occupancy by Household Size in Panguitch
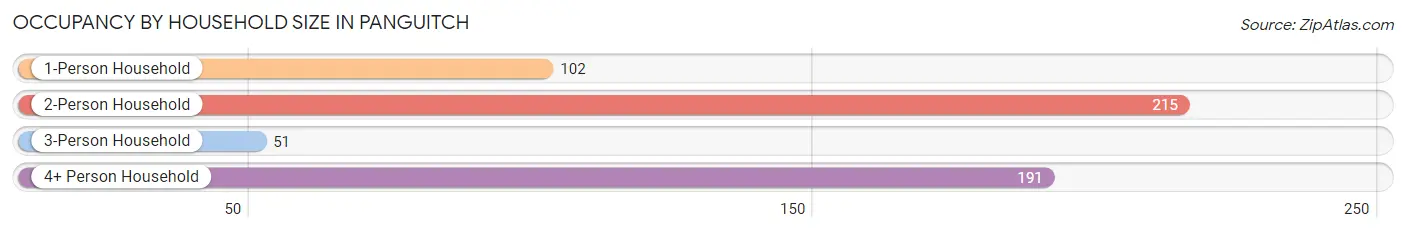
| Household Size | # Housing Units | % Housing Units |
| 1-Person Household | 102 | 18.2% |
| 2-Person Household | 215 | 38.5% |
| 3-Person Household | 51 | 9.1% |
| 4+ Person Household | 191 | 34.2% |
| Total Housing Units | 559 | 100.0% |
Occupancy by Ownership by Household Size in Panguitch
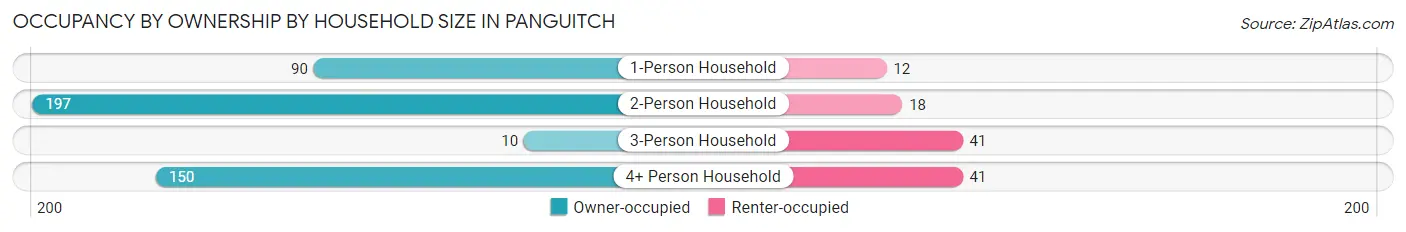
| Household Size | Owner-occupied | Renter-occupied |
| 1-Person Household | 90 (88.2%) | 12 (11.8%) |
| 2-Person Household | 197 (91.6%) | 18 (8.4%) |
| 3-Person Household | 10 (19.6%) | 41 (80.4%) |
| 4+ Person Household | 150 (78.5%) | 41 (21.5%) |
| Total Housing Units | 447 (80.0%) | 112 (20.0%) |
Occupancy by Educational Attainment in Panguitch
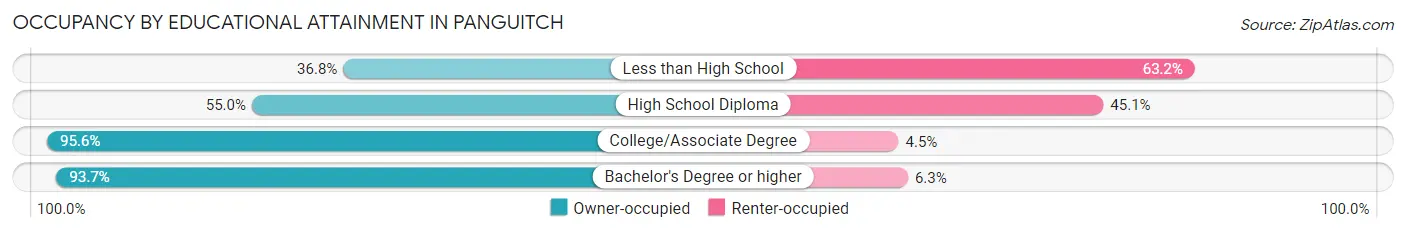
| Household Size | Owner-occupied | Renter-occupied |
| Less than High School | 7 (36.8%) | 12 (63.2%) |
| High School Diploma | 100 (54.9%) | 82 (45.1%) |
| College/Associate Degree | 236 (95.6%) | 11 (4.4%) |
| Bachelor's Degree or higher | 104 (93.7%) | 7 (6.3%) |
Occupancy by Age of Householder in Panguitch
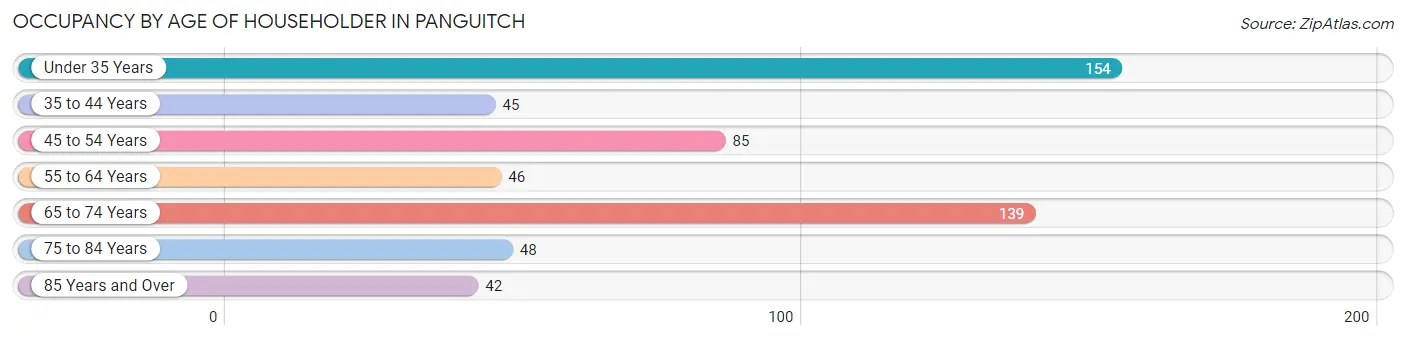
| Age Bracket | # Households | % Households |
| Under 35 Years | 154 | 27.6% |
| 35 to 44 Years | 45 | 8.1% |
| 45 to 54 Years | 85 | 15.2% |
| 55 to 64 Years | 46 | 8.2% |
| 65 to 74 Years | 139 | 24.9% |
| 75 to 84 Years | 48 | 8.6% |
| 85 Years and Over | 42 | 7.5% |
| Total | 559 | 100.0% |
Housing Finances in Panguitch
Median Income by Occupancy in Panguitch
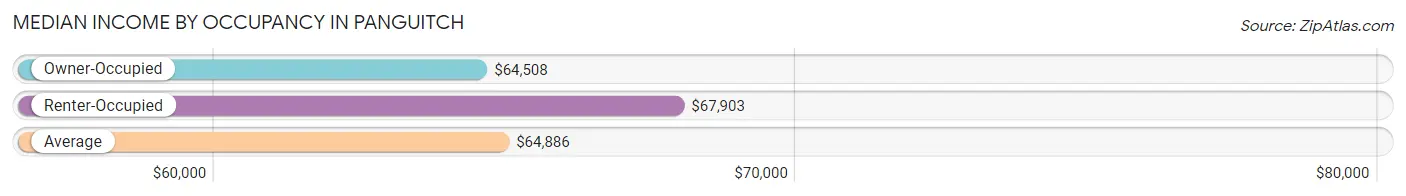
| Occupancy Type | # Households | Median Income |
| Owner-Occupied | 447 (80.0%) | $64,508 |
| Renter-Occupied | 112 (20.0%) | $67,903 |
| Average | 559 (100.0%) | $64,886 |
Occupancy by Householder Income Bracket in Panguitch
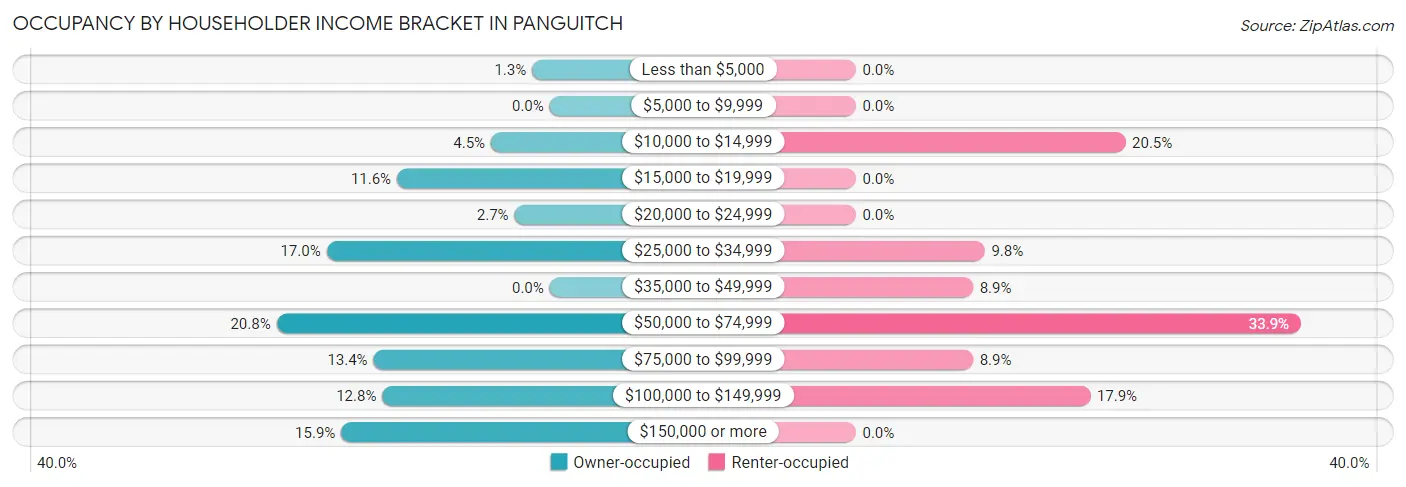
| Income Bracket | Owner-occupied | Renter-occupied |
| Less than $5,000 | 6 (1.3%) | 0 (0.0%) |
| $5,000 to $9,999 | 0 (0.0%) | 0 (0.0%) |
| $10,000 to $14,999 | 20 (4.5%) | 23 (20.5%) |
| $15,000 to $19,999 | 52 (11.6%) | 0 (0.0%) |
| $20,000 to $24,999 | 12 (2.7%) | 0 (0.0%) |
| $25,000 to $34,999 | 76 (17.0%) | 11 (9.8%) |
| $35,000 to $49,999 | 0 (0.0%) | 10 (8.9%) |
| $50,000 to $74,999 | 93 (20.8%) | 38 (33.9%) |
| $75,000 to $99,999 | 60 (13.4%) | 10 (8.9%) |
| $100,000 to $149,999 | 57 (12.8%) | 20 (17.9%) |
| $150,000 or more | 71 (15.9%) | 0 (0.0%) |
| Total | 447 (100.0%) | 112 (100.0%) |
Monthly Housing Cost Tiers in Panguitch
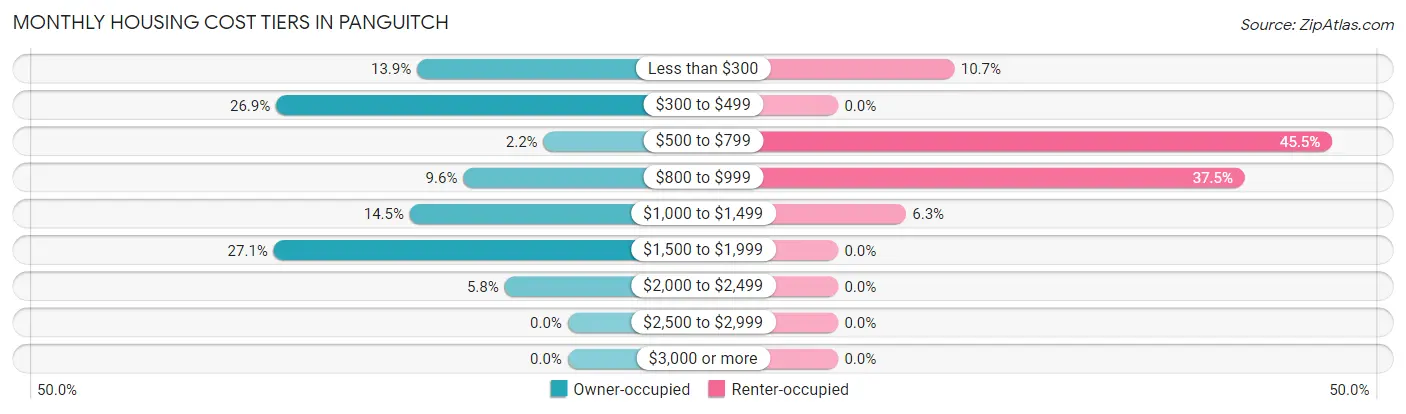
| Monthly Cost | Owner-occupied | Renter-occupied |
| Less than $300 | 62 (13.9%) | 12 (10.7%) |
| $300 to $499 | 120 (26.9%) | 0 (0.0%) |
| $500 to $799 | 10 (2.2%) | 51 (45.5%) |
| $800 to $999 | 43 (9.6%) | 42 (37.5%) |
| $1,000 to $1,499 | 65 (14.5%) | 7 (6.2%) |
| $1,500 to $1,999 | 121 (27.1%) | 0 (0.0%) |
| $2,000 to $2,499 | 26 (5.8%) | 0 (0.0%) |
| $2,500 to $2,999 | 0 (0.0%) | 0 (0.0%) |
| $3,000 or more | 0 (0.0%) | 0 (0.0%) |
| Total | 447 (100.0%) | 112 (100.0%) |
Physical Housing Characteristics in Panguitch
Housing Structures in Panguitch
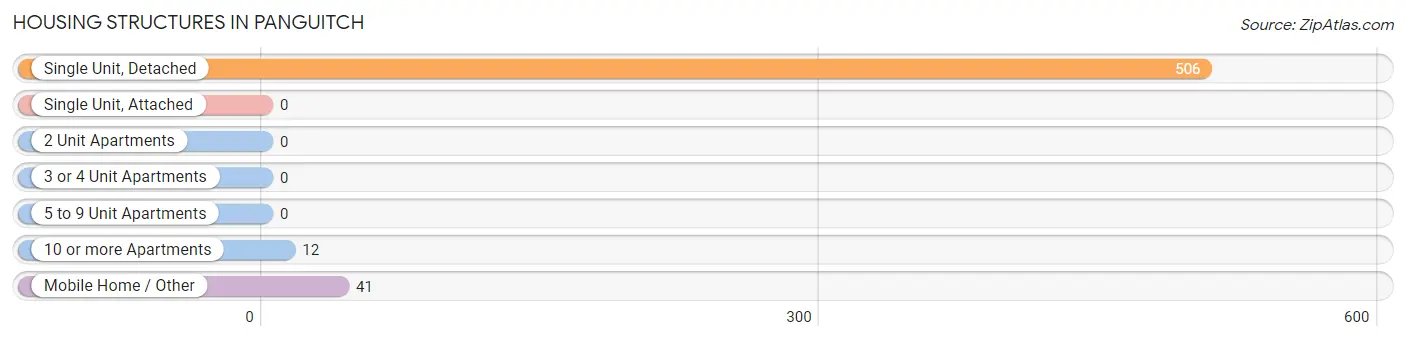
| Structure Type | # Housing Units | % Housing Units |
| Single Unit, Detached | 506 | 90.5% |
| Single Unit, Attached | 0 | 0.0% |
| 2 Unit Apartments | 0 | 0.0% |
| 3 or 4 Unit Apartments | 0 | 0.0% |
| 5 to 9 Unit Apartments | 0 | 0.0% |
| 10 or more Apartments | 12 | 2.1% |
| Mobile Home / Other | 41 | 7.3% |
| Total | 559 | 100.0% |
Housing Structures by Occupancy in Panguitch
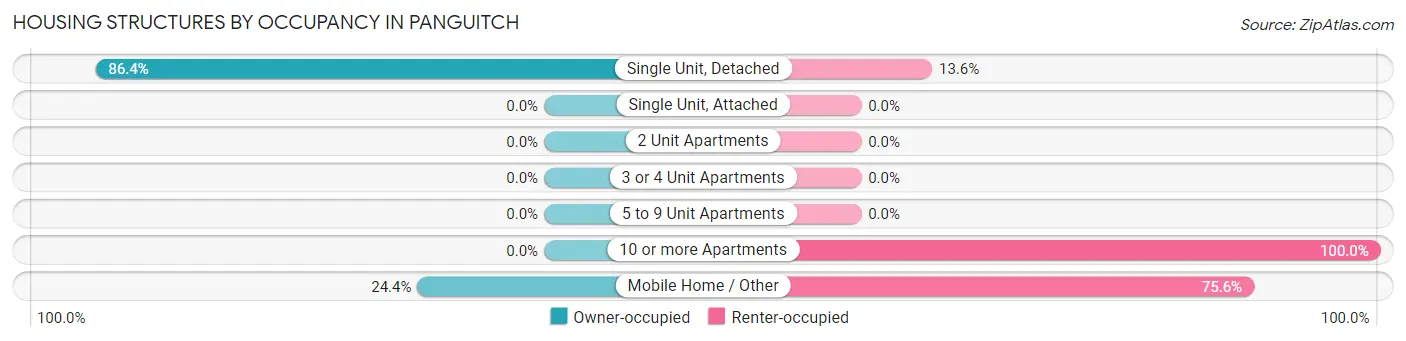
| Structure Type | Owner-occupied | Renter-occupied |
| Single Unit, Detached | 437 (86.4%) | 69 (13.6%) |
| Single Unit, Attached | 0 (0.0%) | 0 (0.0%) |
| 2 Unit Apartments | 0 (0.0%) | 0 (0.0%) |
| 3 or 4 Unit Apartments | 0 (0.0%) | 0 (0.0%) |
| 5 to 9 Unit Apartments | 0 (0.0%) | 0 (0.0%) |
| 10 or more Apartments | 0 (0.0%) | 12 (100.0%) |
| Mobile Home / Other | 10 (24.4%) | 31 (75.6%) |
| Total | 447 (80.0%) | 112 (20.0%) |
Housing Structures by Number of Rooms in Panguitch
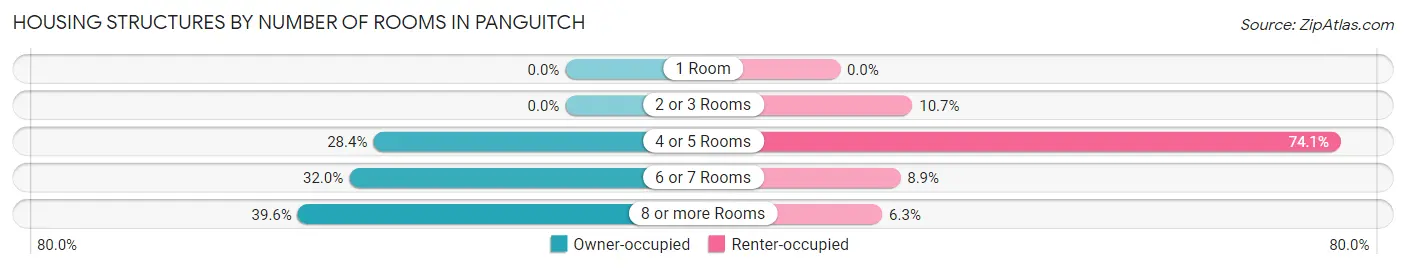
| Number of Rooms | Owner-occupied | Renter-occupied |
| 1 Room | 0 (0.0%) | 0 (0.0%) |
| 2 or 3 Rooms | 0 (0.0%) | 12 (10.7%) |
| 4 or 5 Rooms | 127 (28.4%) | 83 (74.1%) |
| 6 or 7 Rooms | 143 (32.0%) | 10 (8.9%) |
| 8 or more Rooms | 177 (39.6%) | 7 (6.2%) |
| Total | 447 (100.0%) | 112 (100.0%) |
Housing Structure by Heating Type in Panguitch
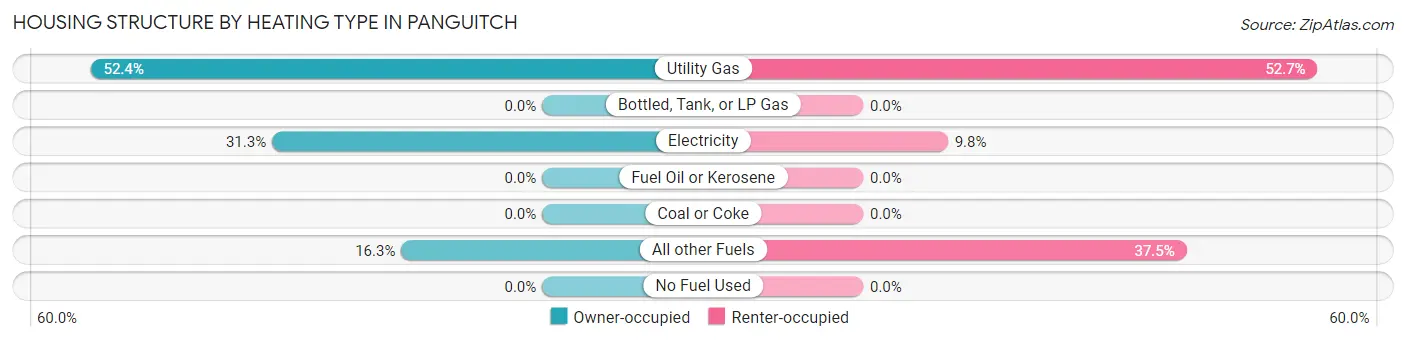
| Heating Type | Owner-occupied | Renter-occupied |
| Utility Gas | 234 (52.3%) | 59 (52.7%) |
| Bottled, Tank, or LP Gas | 0 (0.0%) | 0 (0.0%) |
| Electricity | 140 (31.3%) | 11 (9.8%) |
| Fuel Oil or Kerosene | 0 (0.0%) | 0 (0.0%) |
| Coal or Coke | 0 (0.0%) | 0 (0.0%) |
| All other Fuels | 73 (16.3%) | 42 (37.5%) |
| No Fuel Used | 0 (0.0%) | 0 (0.0%) |
| Total | 447 (100.0%) | 112 (100.0%) |
Household Vehicle Usage in Panguitch
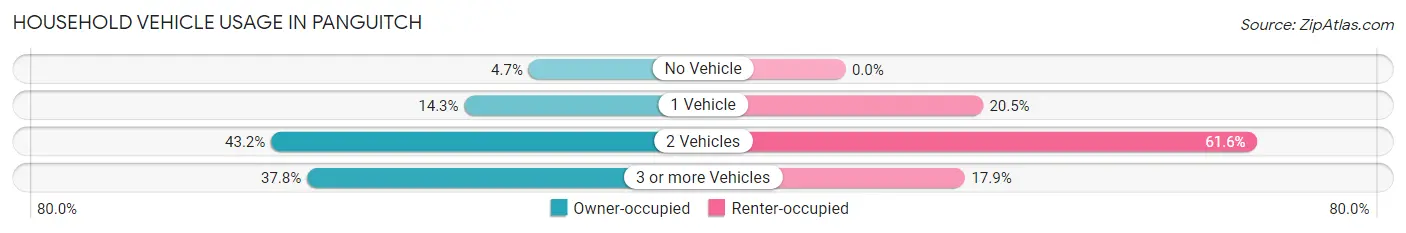
| Vehicles per Household | Owner-occupied | Renter-occupied |
| No Vehicle | 21 (4.7%) | 0 (0.0%) |
| 1 Vehicle | 64 (14.3%) | 23 (20.5%) |
| 2 Vehicles | 193 (43.2%) | 69 (61.6%) |
| 3 or more Vehicles | 169 (37.8%) | 20 (17.9%) |
| Total | 447 (100.0%) | 112 (100.0%) |
Real Estate & Mortgages in Panguitch
Real Estate and Mortgage Overview in Panguitch
| Characteristic | Without Mortgage | With Mortgage |
| Housing Units | 182 | 265 |
| Median Property Value | $129,500 | $287,900 |
| Median Household Income | $33,409 | $39 |
| Monthly Housing Costs | $335 | $0 |
| Real Estate Taxes | $903 | $0 |
Property Value by Mortgage Status in Panguitch
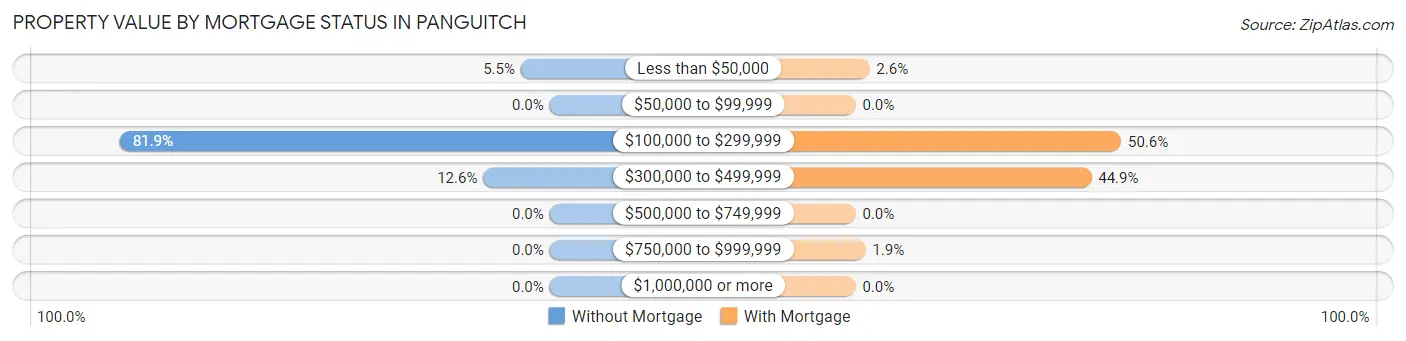
| Property Value | Without Mortgage | With Mortgage |
| Less than $50,000 | 10 (5.5%) | 7 (2.6%) |
| $50,000 to $99,999 | 0 (0.0%) | 0 (0.0%) |
| $100,000 to $299,999 | 149 (81.9%) | 134 (50.6%) |
| $300,000 to $499,999 | 23 (12.6%) | 119 (44.9%) |
| $500,000 to $749,999 | 0 (0.0%) | 0 (0.0%) |
| $750,000 to $999,999 | 0 (0.0%) | 5 (1.9%) |
| $1,000,000 or more | 0 (0.0%) | 0 (0.0%) |
| Total | 182 (100.0%) | 265 (100.0%) |
Household Income by Mortgage Status in Panguitch
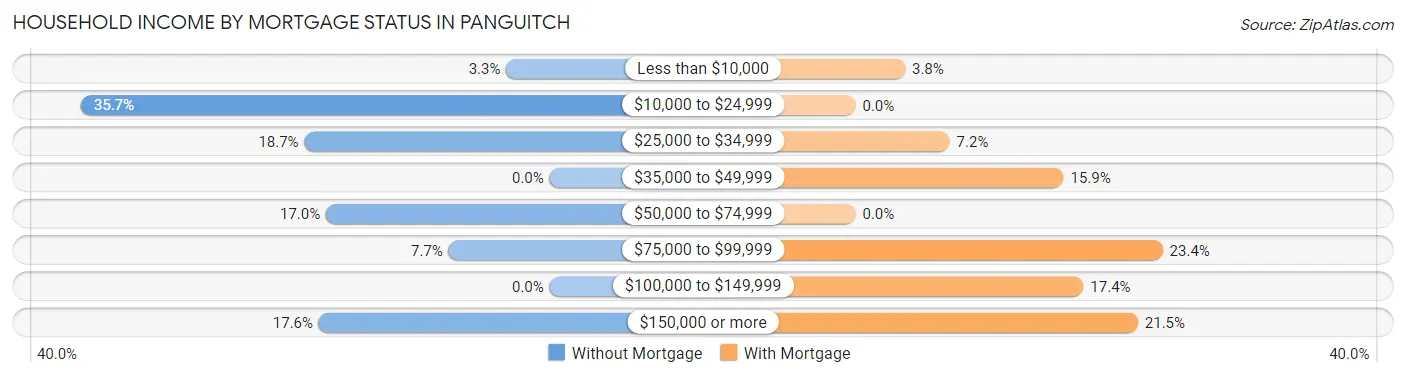
| Household Income | Without Mortgage | With Mortgage |
| Less than $10,000 | 6 (3.3%) | 10 (3.8%) |
| $10,000 to $24,999 | 65 (35.7%) | 0 (0.0%) |
| $25,000 to $34,999 | 34 (18.7%) | 19 (7.2%) |
| $35,000 to $49,999 | 0 (0.0%) | 42 (15.9%) |
| $50,000 to $74,999 | 31 (17.0%) | 0 (0.0%) |
| $75,000 to $99,999 | 14 (7.7%) | 62 (23.4%) |
| $100,000 to $149,999 | 0 (0.0%) | 46 (17.4%) |
| $150,000 or more | 32 (17.6%) | 57 (21.5%) |
| Total | 182 (100.0%) | 265 (100.0%) |
Property Value to Household Income Ratio in Panguitch
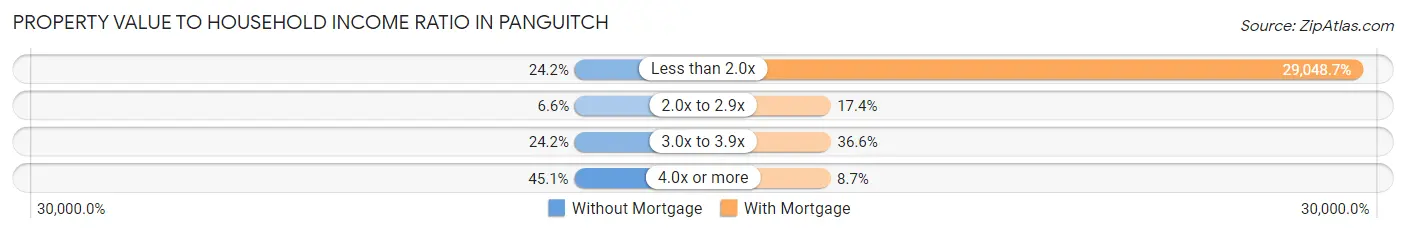
| Value-to-Income Ratio | Without Mortgage | With Mortgage |
| Less than 2.0x | 44 (24.2%) | 76,979 (29,048.7%) |
| 2.0x to 2.9x | 12 (6.6%) | 46 (17.4%) |
| 3.0x to 3.9x | 44 (24.2%) | 97 (36.6%) |
| 4.0x or more | 82 (45.1%) | 23 (8.7%) |
| Total | 182 (100.0%) | 265 (100.0%) |
Real Estate Taxes by Mortgage Status in Panguitch
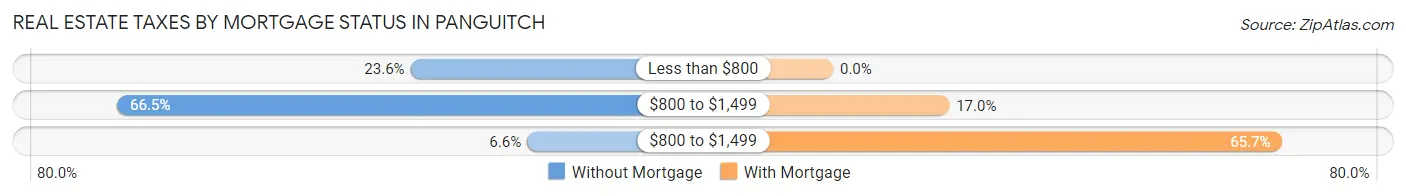
| Property Taxes | Without Mortgage | With Mortgage |
| Less than $800 | 43 (23.6%) | 0 (0.0%) |
| $800 to $1,499 | 121 (66.5%) | 45 (17.0%) |
| $800 to $1,499 | 12 (6.6%) | 174 (65.7%) |
| Total | 182 (100.0%) | 265 (100.0%) |
Health & Disability in Panguitch
Health Insurance Coverage by Age in Panguitch
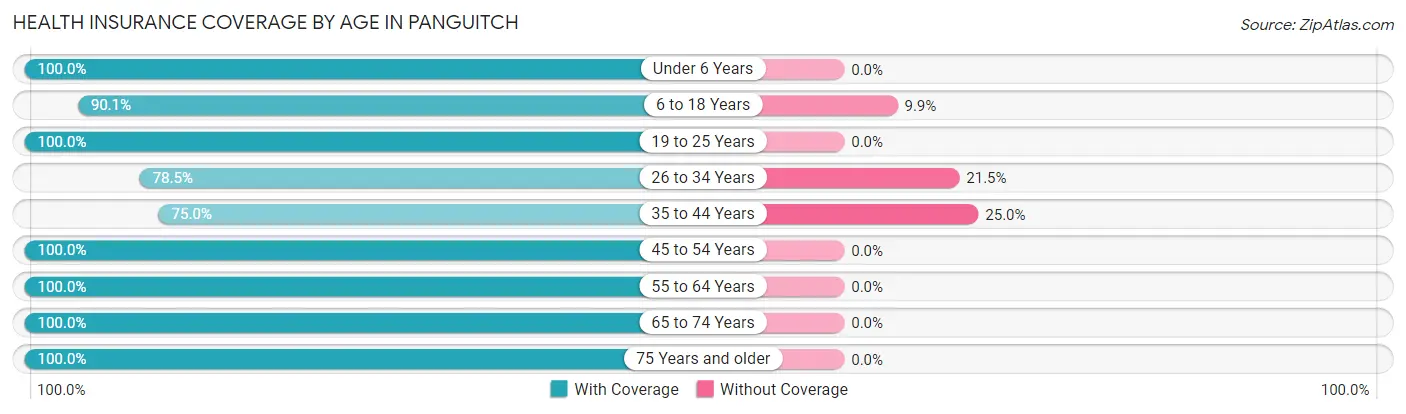
| Age Bracket | With Coverage | Without Coverage |
| Under 6 Years | 143 (100.0%) | 0 (0.0%) |
| 6 to 18 Years | 408 (90.1%) | 45 (9.9%) |
| 19 to 25 Years | 21 (100.0%) | 0 (0.0%) |
| 26 to 34 Years | 194 (78.5%) | 53 (21.5%) |
| 35 to 44 Years | 81 (75.0%) | 27 (25.0%) |
| 45 to 54 Years | 172 (100.0%) | 0 (0.0%) |
| 55 to 64 Years | 96 (100.0%) | 0 (0.0%) |
| 65 to 74 Years | 217 (100.0%) | 0 (0.0%) |
| 75 Years and older | 100 (100.0%) | 0 (0.0%) |
| Total | 1,432 (92.0%) | 125 (8.0%) |
Health Insurance Coverage by Citizenship Status in Panguitch
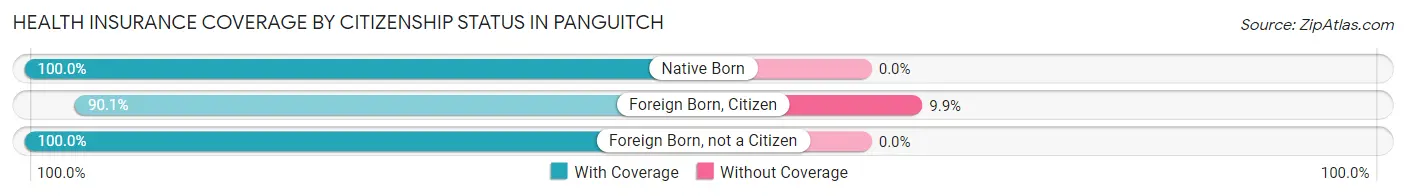
| Citizenship Status | With Coverage | Without Coverage |
| Native Born | 143 (100.0%) | 0 (0.0%) |
| Foreign Born, Citizen | 408 (90.1%) | 45 (9.9%) |
| Foreign Born, not a Citizen | 21 (100.0%) | 0 (0.0%) |
Health Insurance Coverage by Household Income in Panguitch
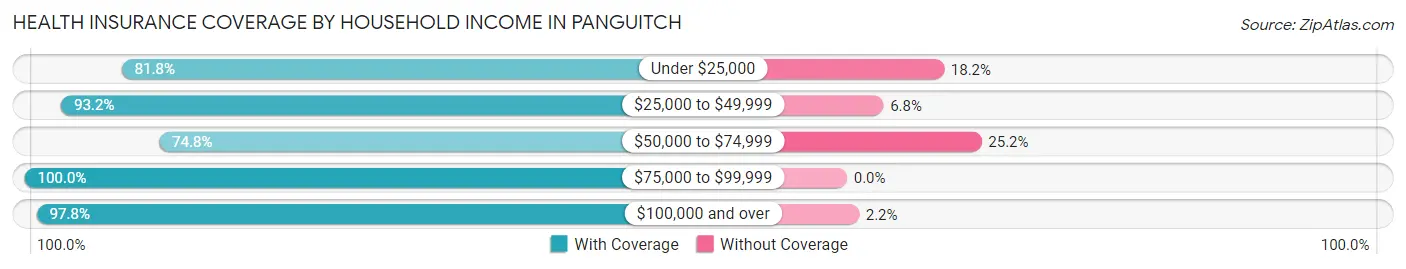
| Household Income | With Coverage | Without Coverage |
| Under $25,000 | 162 (81.8%) | 36 (18.2%) |
| $25,000 to $49,999 | 232 (93.2%) | 17 (6.8%) |
| $50,000 to $74,999 | 181 (74.8%) | 61 (25.2%) |
| $75,000 to $99,999 | 378 (100.0%) | 0 (0.0%) |
| $100,000 and over | 479 (97.8%) | 11 (2.2%) |
Public vs Private Health Insurance Coverage by Age in Panguitch
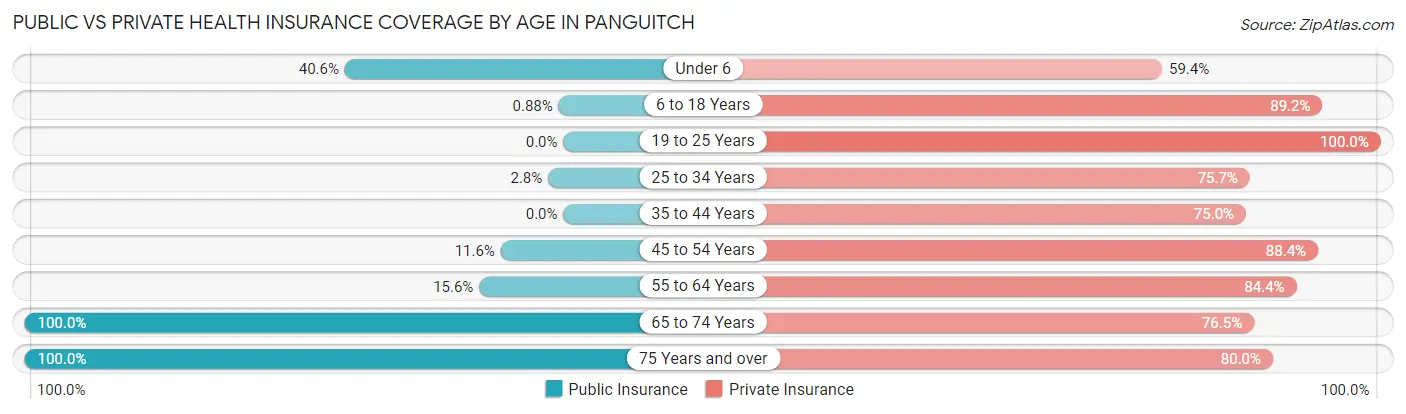
| Age Bracket | Public Insurance | Private Insurance |
| Under 6 | 58 (40.6%) | 85 (59.4%) |
| 6 to 18 Years | 4 (0.9%) | 404 (89.2%) |
| 19 to 25 Years | 0 (0.0%) | 21 (100.0%) |
| 25 to 34 Years | 7 (2.8%) | 187 (75.7%) |
| 35 to 44 Years | 0 (0.0%) | 81 (75.0%) |
| 45 to 54 Years | 20 (11.6%) | 152 (88.4%) |
| 55 to 64 Years | 15 (15.6%) | 81 (84.4%) |
| 65 to 74 Years | 217 (100.0%) | 166 (76.5%) |
| 75 Years and over | 100 (100.0%) | 80 (80.0%) |
| Total | 421 (27.0%) | 1,257 (80.7%) |
Disability Status by Sex by Age in Panguitch
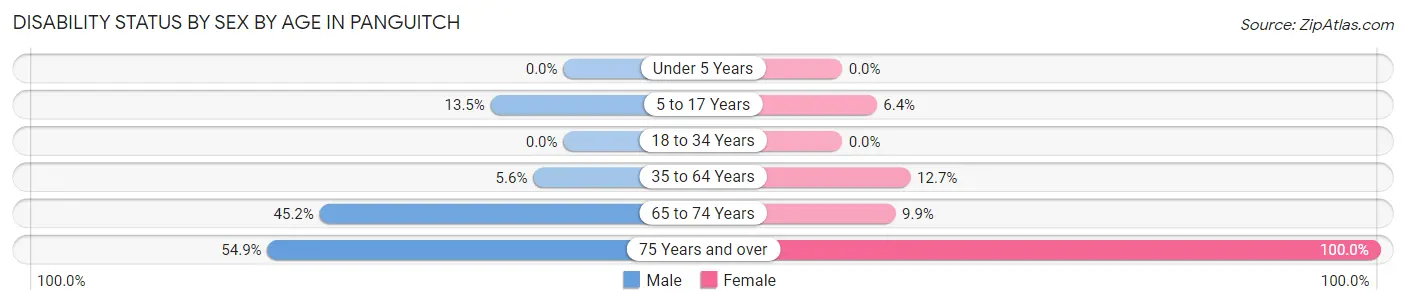
| Age Bracket | Male | Female |
| Under 5 Years | 0 (0.0%) | 0 (0.0%) |
| 5 to 17 Years | 22 (13.5%) | 14 (6.4%) |
| 18 to 34 Years | 0 (0.0%) | 0 (0.0%) |
| 35 to 64 Years | 10 (5.6%) | 25 (12.7%) |
| 65 to 74 Years | 57 (45.2%) | 9 (9.9%) |
| 75 Years and over | 39 (54.9%) | 29 (100.0%) |
Disability Class by Sex by Age in Panguitch
Disability Class: Hearing Difficulty
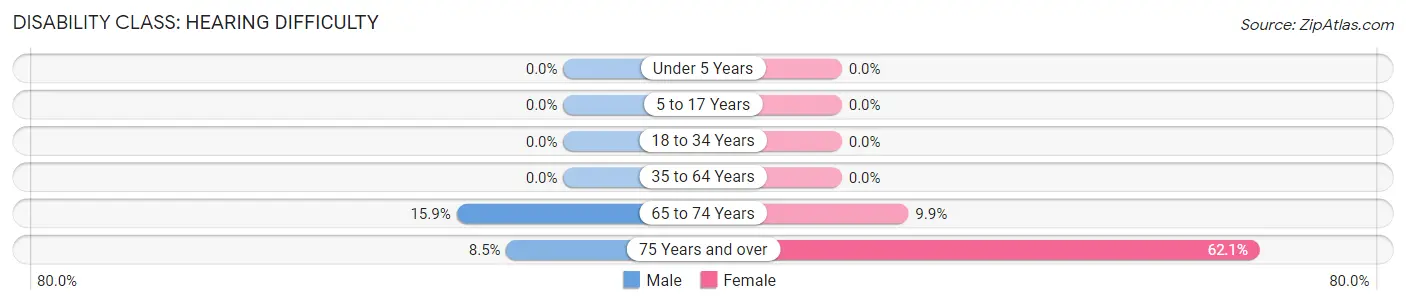
| Age Bracket | Male | Female |
| Under 5 Years | 0 (0.0%) | 0 (0.0%) |
| 5 to 17 Years | 0 (0.0%) | 0 (0.0%) |
| 18 to 34 Years | 0 (0.0%) | 0 (0.0%) |
| 35 to 64 Years | 0 (0.0%) | 0 (0.0%) |
| 65 to 74 Years | 20 (15.9%) | 9 (9.9%) |
| 75 Years and over | 6 (8.5%) | 18 (62.1%) |
Disability Class: Vision Difficulty
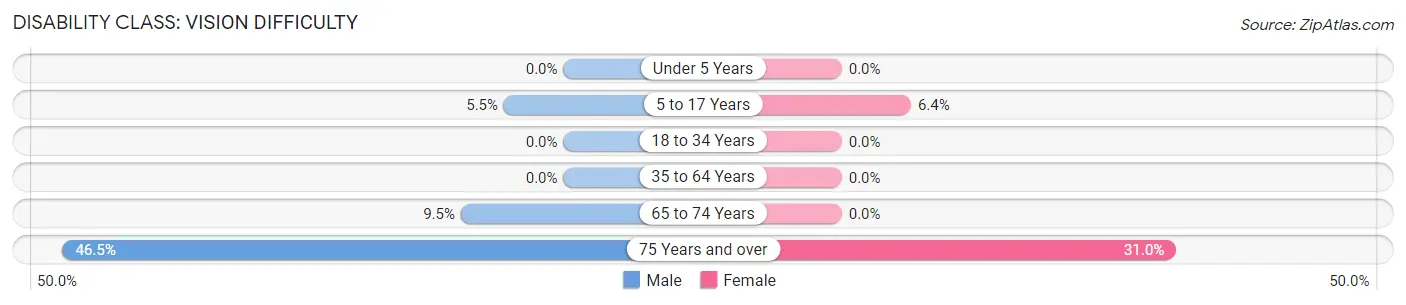
| Age Bracket | Male | Female |
| Under 5 Years | 0 (0.0%) | 0 (0.0%) |
| 5 to 17 Years | 9 (5.5%) | 14 (6.4%) |
| 18 to 34 Years | 0 (0.0%) | 0 (0.0%) |
| 35 to 64 Years | 0 (0.0%) | 0 (0.0%) |
| 65 to 74 Years | 12 (9.5%) | 0 (0.0%) |
| 75 Years and over | 33 (46.5%) | 9 (31.0%) |
Disability Class: Cognitive Difficulty
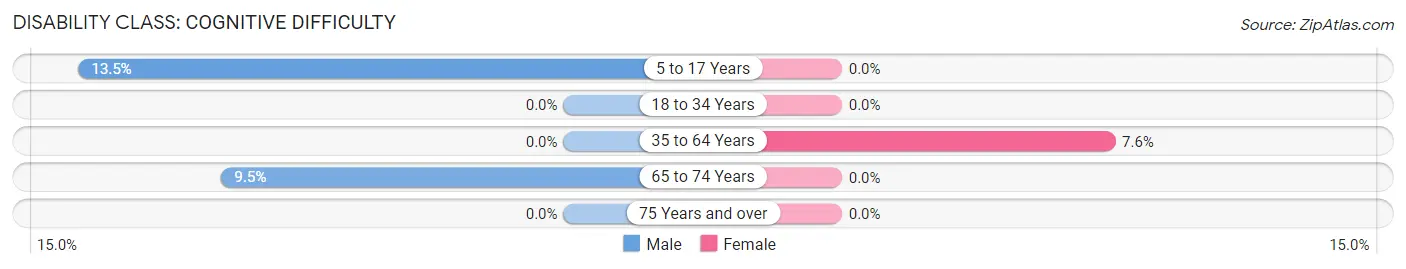
| Age Bracket | Male | Female |
| 5 to 17 Years | 22 (13.5%) | 0 (0.0%) |
| 18 to 34 Years | 0 (0.0%) | 0 (0.0%) |
| 35 to 64 Years | 0 (0.0%) | 15 (7.6%) |
| 65 to 74 Years | 12 (9.5%) | 0 (0.0%) |
| 75 Years and over | 0 (0.0%) | 0 (0.0%) |
Disability Class: Ambulatory Difficulty
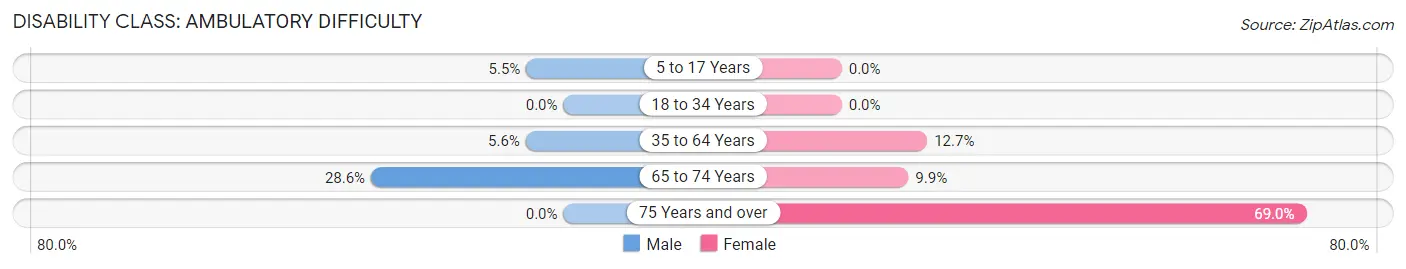
| Age Bracket | Male | Female |
| 5 to 17 Years | 9 (5.5%) | 0 (0.0%) |
| 18 to 34 Years | 0 (0.0%) | 0 (0.0%) |
| 35 to 64 Years | 10 (5.6%) | 25 (12.7%) |
| 65 to 74 Years | 36 (28.6%) | 9 (9.9%) |
| 75 Years and over | 0 (0.0%) | 20 (69.0%) |
Disability Class: Self-Care Difficulty
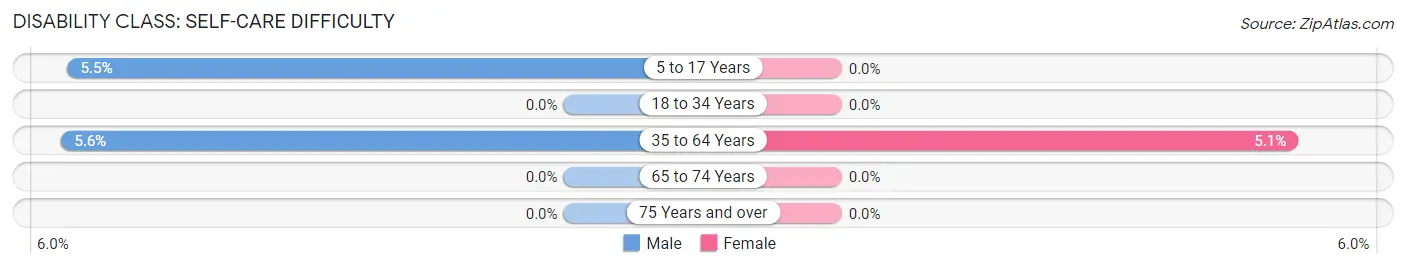
| Age Bracket | Male | Female |
| 5 to 17 Years | 9 (5.5%) | 0 (0.0%) |
| 18 to 34 Years | 0 (0.0%) | 0 (0.0%) |
| 35 to 64 Years | 10 (5.6%) | 10 (5.1%) |
| 65 to 74 Years | 0 (0.0%) | 0 (0.0%) |
| 75 Years and over | 0 (0.0%) | 0 (0.0%) |
Technology Access in Panguitch
Computing Device Access in Panguitch
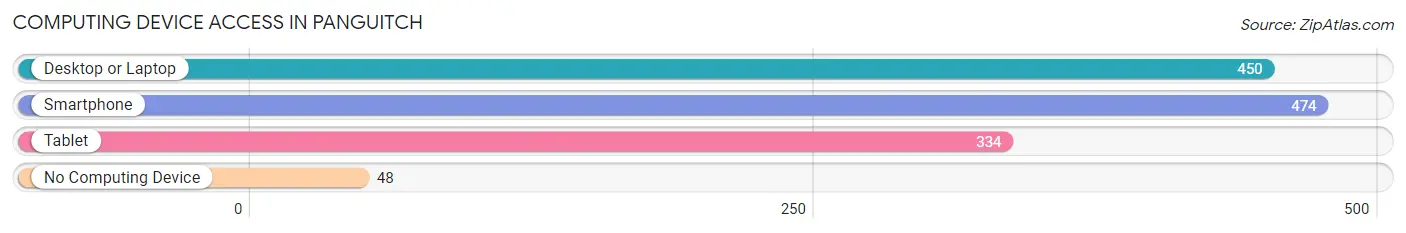
| Device Type | # Households | % Households |
| Desktop or Laptop | 450 | 80.5% |
| Smartphone | 474 | 84.8% |
| Tablet | 334 | 59.8% |
| No Computing Device | 48 | 8.6% |
| Total | 559 | 100.0% |
Internet Access in Panguitch
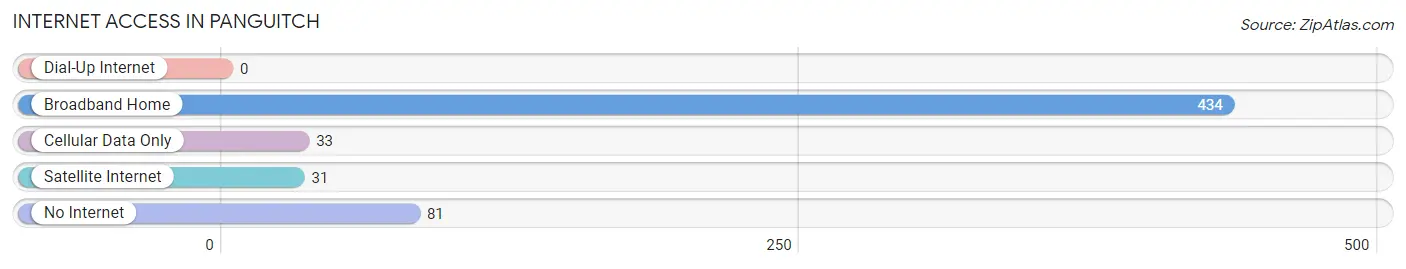
| Internet Type | # Households | % Households |
| Dial-Up Internet | 0 | 0.0% |
| Broadband Home | 434 | 77.6% |
| Cellular Data Only | 33 | 5.9% |
| Satellite Internet | 31 | 5.6% |
| No Internet | 81 | 14.5% |
| Total | 559 | 100.0% |
Panguitch Summary
Panguitch is a small town located in Garfield County, Utah, United States. It is situated in the southwestern part of the state, approximately 160 miles south of Salt Lake City. The town was founded in 1864 by Mormon pioneers and is the county seat of Garfield County. As of the 2010 census, the population of Panguitch was 1,520.
Geography
Panguitch is located at 37°48'N, 112°30'W (37.8, -112.5). It is situated in the Paunsaugunt Plateau region of southwestern Utah, at an elevation of 6,400 feet. The town is surrounded by the Dixie National Forest and is located near Bryce Canyon National Park.
Climate
Panguitch has a semi-arid climate, with hot summers and cold winters. The average high temperature in July is 88°F, and the average low temperature in January is 17°F. The average annual precipitation is 11.5 inches.
History
Panguitch was founded in 1864 by Mormon pioneers. The town was named after the Paiute word for "big fish," which was used to describe the abundance of trout in the nearby streams. The town was an important stop on the Old Spanish Trail, and it served as a supply center for the surrounding area.
In 1866, the town was incorporated and a courthouse was built. The courthouse was destroyed by fire in 1871, but it was rebuilt the following year.
In the late 19th century, Panguitch became an important center for the cattle industry. The town was also a major stop on the Denver and Rio Grande Western Railroad.
In the early 20th century, Panguitch experienced a period of economic decline. The railroad was abandoned in the 1920s, and the cattle industry declined due to overgrazing.
In the late 20th century, Panguitch experienced a resurgence in economic activity. The town became a popular tourist destination due to its proximity to Bryce Canyon National Park. The town also became a center for outdoor recreation, with numerous hiking and camping opportunities in the surrounding area.
Economy
The economy of Panguitch is largely based on tourism and outdoor recreation. The town is a popular destination for visitors to Bryce Canyon National Park, and it is also a popular destination for hikers and campers.
The town is also home to several small businesses, including restaurants, hotels, and retail stores. The town is also home to a number of manufacturing companies, including a furniture factory and a woodworking shop.
Demographics
As of the 2010 census, the population of Panguitch was 1,520. The racial makeup of the town was 94.2% White, 0.3% African American, 0.7% Native American, 0.3% Asian, 0.1% Pacific Islander, 2.3% from other races, and 2.3% from two or more races. Hispanic or Latino of any race were 5.2% of the population.
The median income for a household in Panguitch was $35,938, and the median income for a family was $41,250. The per capita income for the town was $17,845. About 11.2% of families and 14.2% of the population were below the poverty line, including 18.2% of those under age 18 and 8.3% of those age 65 or over.
Common Questions
What is Per Capita Income in Panguitch?
Per Capita income in Panguitch is $22,881.
What is the Median Family Income in Panguitch?
Median Family Income in Panguitch is $74,095.
What is the Median Household income in Panguitch?
Median Household Income in Panguitch is $64,886.
What is Income or Wage Gap in Panguitch?
Income or Wage Gap in Panguitch is 52.3%.
Women in Panguitch earn 47.7 cents for every dollar earned by a man.
What is Inequality or Gini Index in Panguitch?
Inequality or Gini Index in Panguitch is 0.39.
What is the Total Population of Panguitch?
Total Population of Panguitch is 1,702.
What is the Total Male Population of Panguitch?
Total Male Population of Panguitch is 830.
What is the Total Female Population of Panguitch?
Total Female Population of Panguitch is 872.
What is the Ratio of Males per 100 Females in Panguitch?
There are 95.18 Males per 100 Females in Panguitch.
What is the Ratio of Females per 100 Males in Panguitch?
There are 105.06 Females per 100 Males in Panguitch.
What is the Median Population Age in Panguitch?
Median Population Age in Panguitch is 33.2 Years.
What is the Average Family Size in Panguitch
Average Family Size in Panguitch is 3.1 People.
What is the Average Household Size in Panguitch
Average Household Size in Panguitch is 2.8 People.
How Large is the Labor Force in Panguitch?
There are 704 People in the Labor Forcein in Panguitch.
What is the Percentage of People in the Labor Force in Panguitch?
56.4% of People are in the Labor Force in Panguitch.
What is the Unemployment Rate in Panguitch?
Unemployment Rate in Panguitch is 6.1%.