Sigurd, UT Map & Demographics
Sigurd Map
Sigurd Overview
$25,630
PER CAPITA INCOME
$79,500
AVG FAMILY INCOME
$75,694
AVG HOUSEHOLD INCOME
55.6%
WAGE / INCOME GAP [ % ]
44.4¢/ $1
WAGE / INCOME GAP [ $ ]
0.35
INEQUALITY / GINI INDEX
498
TOTAL POPULATION
277
MALE POPULATION
221
FEMALE POPULATION
125.34
MALES / 100 FEMALES
79.78
FEMALES / 100 MALES
33.2
MEDIAN AGE
3.8
AVG FAMILY SIZE
3.4
AVG HOUSEHOLD SIZE
246
LABOR FORCE [ PEOPLE ]
70.3%
PERCENT IN LABOR FORCE
5.4%
UNEMPLOYMENT RATE
Sigurd Zip Codes
Sigurd Area Codes
Income in Sigurd
Income Overview in Sigurd
Per Capita Income in Sigurd is $25,630, while median incomes of families and households are $79,500 and $75,694 respectively.
| Characteristic | Number | Measure |
| Per Capita Income | 498 | $25,630 |
| Median Family Income | 122 | $79,500 |
| Mean Family Income | 122 | $85,053 |
| Median Household Income | 147 | $75,694 |
| Mean Household Income | 147 | $78,056 |
| Income Deficit | 122 | $0 |
| Wage / Income Gap (%) | 498 | 55.61% |
| Wage / Income Gap ($) | 498 | 44.39¢ per $1 |
| Gini / Inequality Index | 498 | 0.35 |
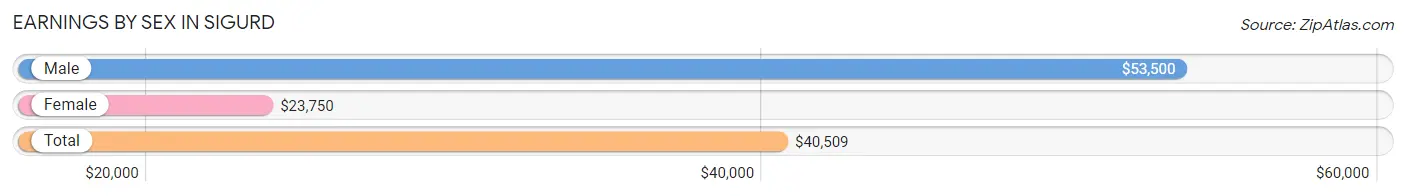
Earnings by Sex in Sigurd
Average Earnings in Sigurd are $40,509, $53,500 for men and $23,750 for women, a difference of 55.6%.
| Sex | Number | Average Earnings |
| Male | 144 (54.7%) | $53,500 |
| Female | 119 (45.3%) | $23,750 |
| Total | 263 (100.0%) | $40,509 |
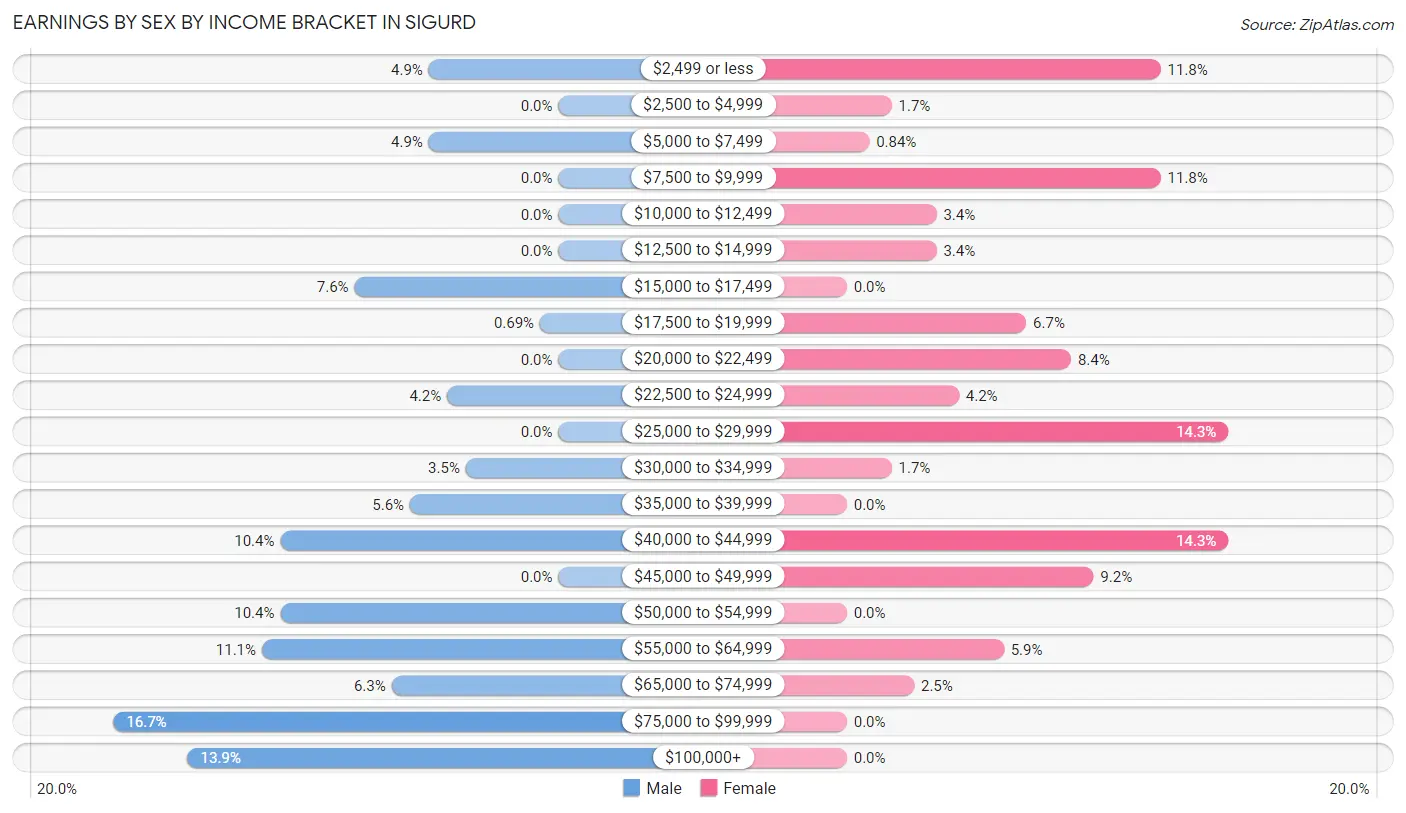
Earnings by Sex by Income Bracket in Sigurd
The most common earnings brackets in Sigurd are $75,000 to $99,999 for men (24 | 16.7%) and $25,000 to $29,999 for women (17 | 14.3%).
| Income | Male | Female |
| $2,499 or less | 7 (4.9%) | 14 (11.8%) |
| $2,500 to $4,999 | 0 (0.0%) | 2 (1.7%) |
| $5,000 to $7,499 | 7 (4.9%) | 1 (0.8%) |
| $7,500 to $9,999 | 0 (0.0%) | 14 (11.8%) |
| $10,000 to $12,499 | 0 (0.0%) | 4 (3.4%) |
| $12,500 to $14,999 | 0 (0.0%) | 4 (3.4%) |
| $15,000 to $17,499 | 11 (7.6%) | 0 (0.0%) |
| $17,500 to $19,999 | 1 (0.7%) | 8 (6.7%) |
| $20,000 to $22,499 | 0 (0.0%) | 10 (8.4%) |
| $22,500 to $24,999 | 6 (4.2%) | 5 (4.2%) |
| $25,000 to $29,999 | 0 (0.0%) | 17 (14.3%) |
| $30,000 to $34,999 | 5 (3.5%) | 2 (1.7%) |
| $35,000 to $39,999 | 8 (5.6%) | 0 (0.0%) |
| $40,000 to $44,999 | 15 (10.4%) | 17 (14.3%) |
| $45,000 to $49,999 | 0 (0.0%) | 11 (9.2%) |
| $50,000 to $54,999 | 15 (10.4%) | 0 (0.0%) |
| $55,000 to $64,999 | 16 (11.1%) | 7 (5.9%) |
| $65,000 to $74,999 | 9 (6.2%) | 3 (2.5%) |
| $75,000 to $99,999 | 24 (16.7%) | 0 (0.0%) |
| $100,000+ | 20 (13.9%) | 0 (0.0%) |
| Total | 144 (100.0%) | 119 (100.0%) |
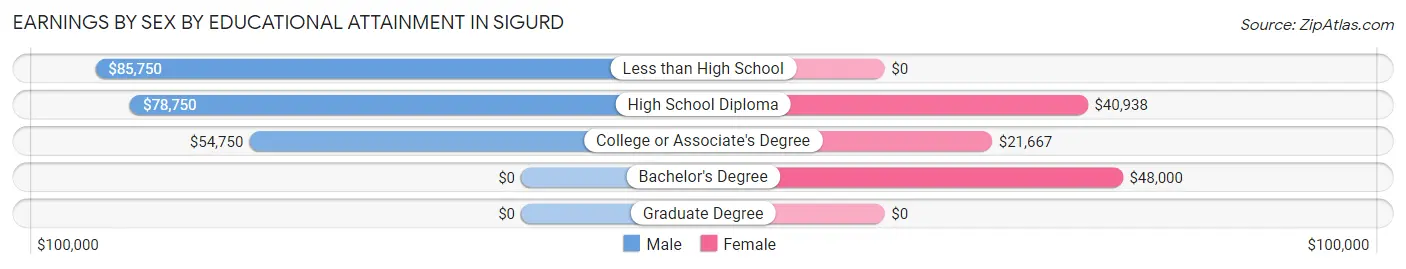
Earnings by Sex by Educational Attainment in Sigurd
Average earnings in Sigurd are $67,750 for men and $26,719 for women, a difference of 60.6%. Men with an educational attainment of less than high school enjoy the highest average annual earnings of $85,750, while those with college or associate's degree education earn the least with $54,750. Women with an educational attainment of bachelor's degree earn the most with the average annual earnings of $48,000, while those with college or associate's degree education have the smallest earnings of $21,667.
| Educational Attainment | Male Income | Female Income |
| Less than High School | $85,750 | $0 |
| High School Diploma | $78,750 | $40,938 |
| College or Associate's Degree | $54,750 | $21,667 |
| Bachelor's Degree | - | - |
| Graduate Degree | - | - |
| Total | $67,750 | $26,719 |
Family Income in Sigurd
Family Income Brackets in Sigurd
According to the Sigurd family income data, there are 34 families falling into the $100,000 to $149,999 income range, which is the most common income bracket and makes up 27.9% of all families.
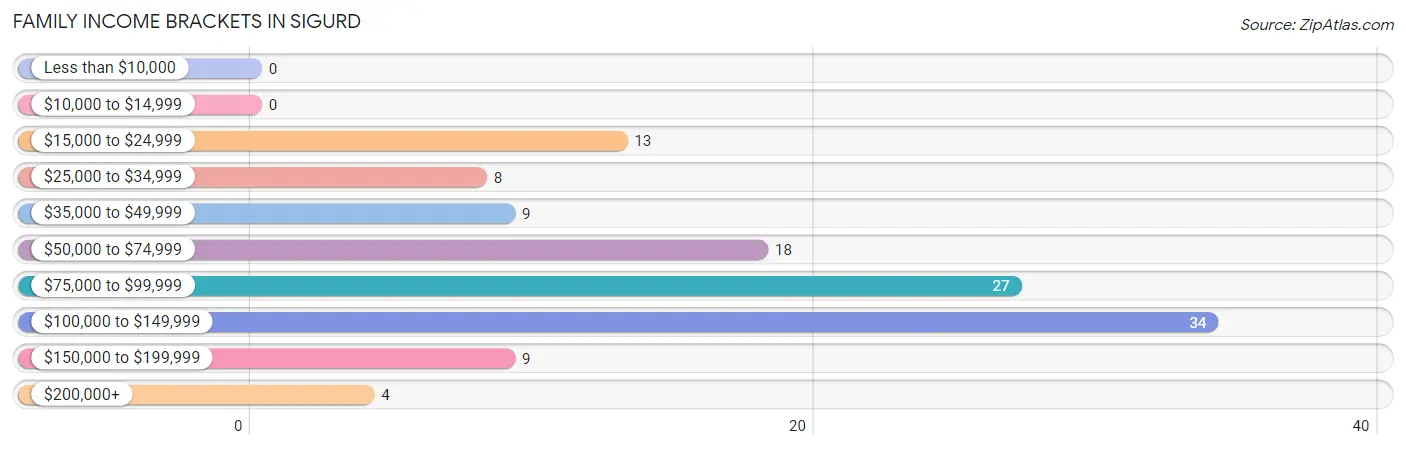
| Income Bracket | # Families | % Families |
| Less than $10,000 | 0 | 0.0% |
| $10,000 to $14,999 | 0 | 0.0% |
| $15,000 to $24,999 | 13 | 10.7% |
| $25,000 to $34,999 | 8 | 6.6% |
| $35,000 to $49,999 | 9 | 7.4% |
| $50,000 to $74,999 | 18 | 14.8% |
| $75,000 to $99,999 | 27 | 22.1% |
| $100,000 to $149,999 | 34 | 27.9% |
| $150,000 to $199,999 | 9 | 7.4% |
| $200,000+ | 4 | 3.3% |
Family Income by Famaliy Size in Sigurd
5-person families (20 | 16.4%) account for the highest median family income in Sigurd with $105,000 per family, while 3-person families (20 | 16.4%) have the highest median income of $29,375 per family member.
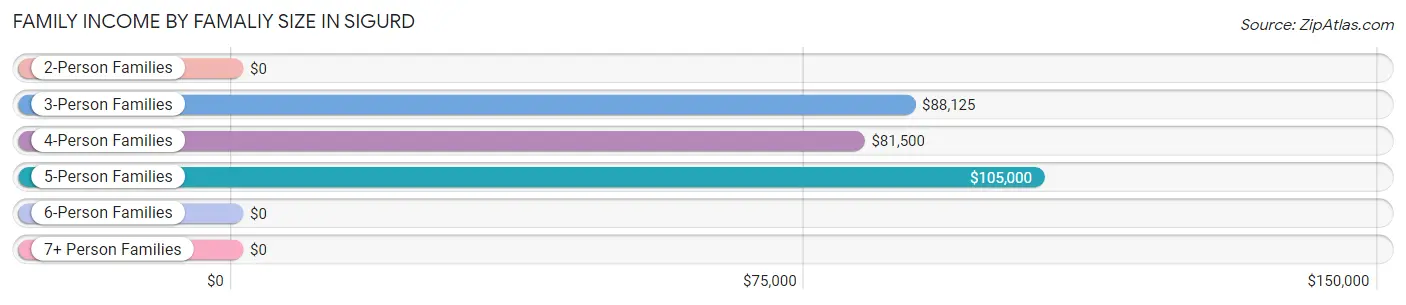
| Income Bracket | # Families | Median Income |
| 2-Person Families | 30 (24.6%) | $0 |
| 3-Person Families | 20 (16.4%) | $88,125 |
| 4-Person Families | 34 (27.9%) | $81,500 |
| 5-Person Families | 20 (16.4%) | $105,000 |
| 6-Person Families | 4 (3.3%) | $0 |
| 7+ Person Families | 14 (11.5%) | $0 |
| Total | 122 (100.0%) | $79,500 |
Family Income by Number of Earners in Sigurd
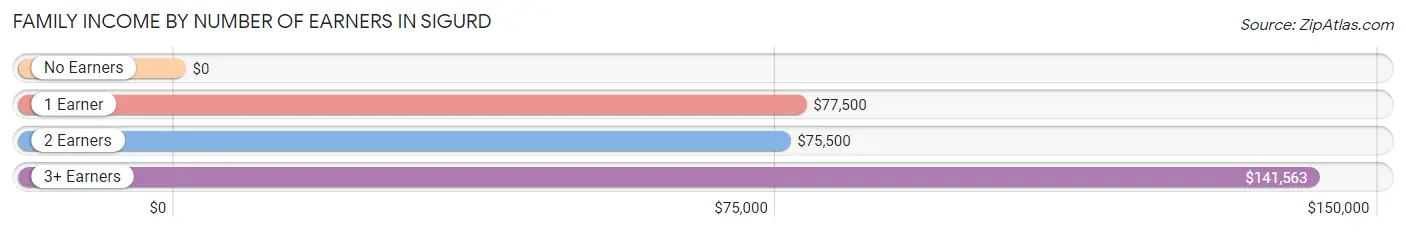
| Number of Earners | # Families | Median Income |
| No Earners | 5 (4.1%) | $0 |
| 1 Earner | 38 (31.1%) | $77,500 |
| 2 Earners | 58 (47.5%) | $75,500 |
| 3+ Earners | 21 (17.2%) | $141,563 |
| Total | 122 (100.0%) | $79,500 |
Household Income in Sigurd
Household Income Brackets in Sigurd
With 36 households falling in the category, the $100,000 to $149,999 income range is the most frequent in Sigurd, accounting for 24.5% of all households.
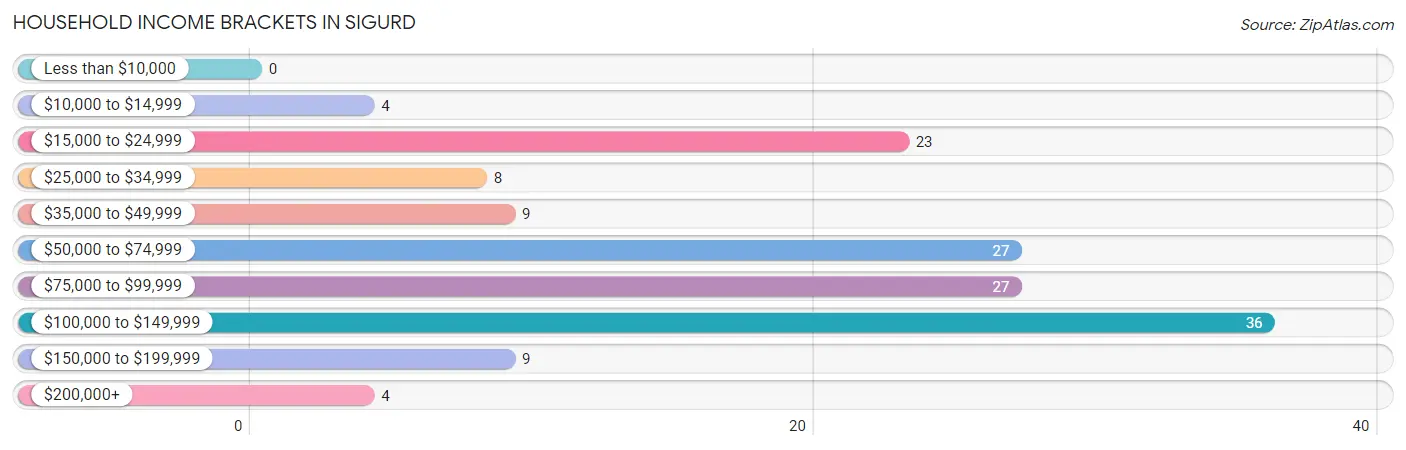
| Income Bracket | # Households | % Households |
| Less than $10,000 | 0 | 0.0% |
| $10,000 to $14,999 | 4 | 2.7% |
| $15,000 to $24,999 | 23 | 15.6% |
| $25,000 to $34,999 | 8 | 5.4% |
| $35,000 to $49,999 | 9 | 6.1% |
| $50,000 to $74,999 | 27 | 18.4% |
| $75,000 to $99,999 | 27 | 18.4% |
| $100,000 to $149,999 | 36 | 24.5% |
| $150,000 to $199,999 | 9 | 6.1% |
| $200,000+ | 4 | 2.7% |
Household Income by Householder Age in Sigurd
The median household income in Sigurd is $75,694, with the highest median household income of $79,500 found in the 25 to 44 years age bracket for the primary householder. A total of 60 households (40.8%) fall into this category. Meanwhile, the 15 to 24 years age bracket for the primary householder has the lowest median household income of $0, with 8 households (5.4%) in this group.
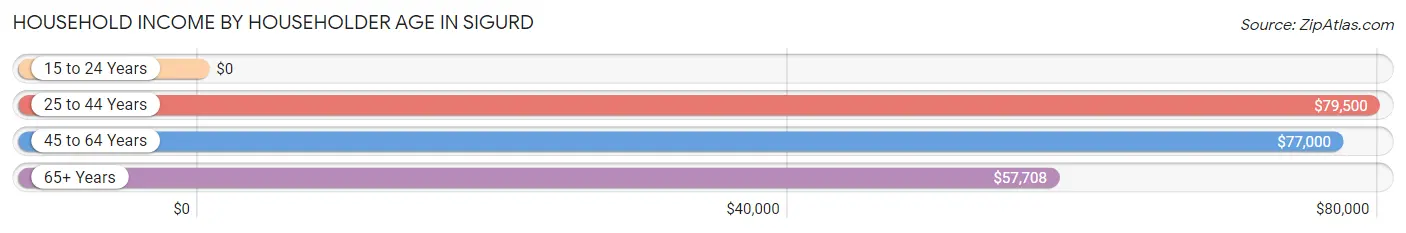
| Income Bracket | # Households | Median Income |
| 15 to 24 Years | 8 (5.4%) | $0 |
| 25 to 44 Years | 60 (40.8%) | $79,500 |
| 45 to 64 Years | 58 (39.5%) | $77,000 |
| 65+ Years | 21 (14.3%) | $57,708 |
| Total | 147 (100.0%) | $75,694 |
Poverty in Sigurd
Income Below Poverty by Sex and Age in Sigurd
With 22.7% poverty level for males and 22.2% for females among the residents of Sigurd, 6 to 11 year old males and under 5 year old females are the most vulnerable to poverty, with 18 males (54.5%) and 14 females (51.8%) in their respective age groups living below the poverty level.
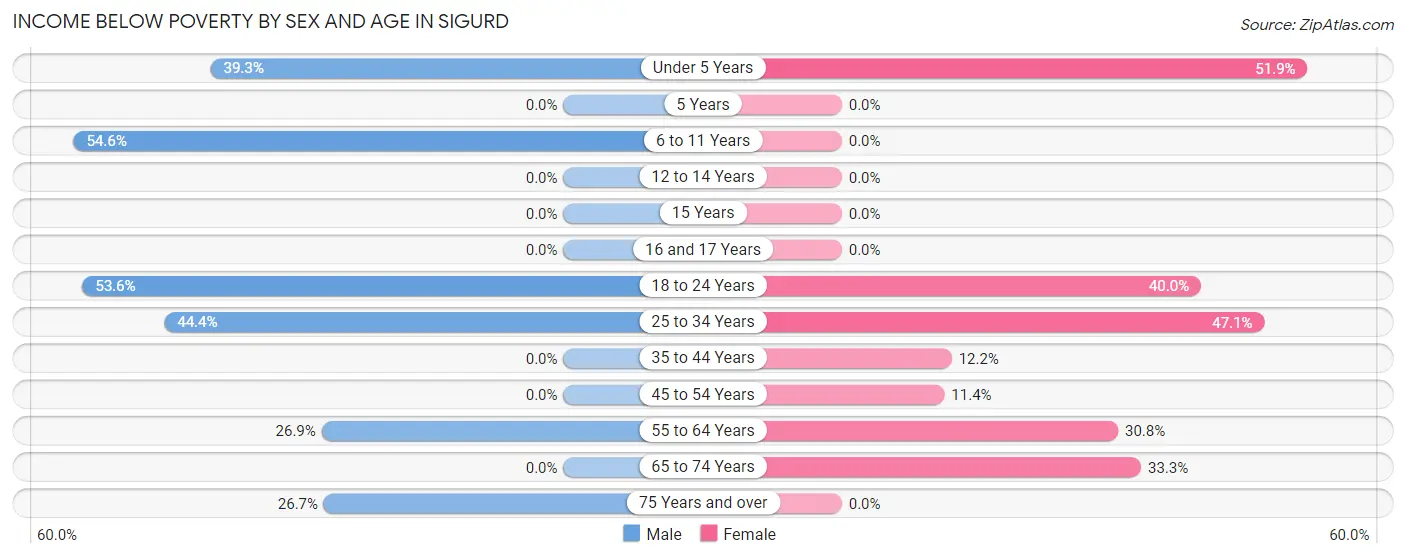
| Age Bracket | Male | Female |
| Under 5 Years | 11 (39.3%) | 14 (51.8%) |
| 5 Years | 0 (0.0%) | 0 (0.0%) |
| 6 to 11 Years | 18 (54.5%) | 0 (0.0%) |
| 12 to 14 Years | 0 (0.0%) | 0 (0.0%) |
| 15 Years | 0 (0.0%) | 0 (0.0%) |
| 16 and 17 Years | 0 (0.0%) | 0 (0.0%) |
| 18 to 24 Years | 15 (53.6%) | 8 (40.0%) |
| 25 to 34 Years | 8 (44.4%) | 8 (47.1%) |
| 35 to 44 Years | 0 (0.0%) | 6 (12.2%) |
| 45 to 54 Years | 0 (0.0%) | 4 (11.4%) |
| 55 to 64 Years | 7 (26.9%) | 4 (30.8%) |
| 65 to 74 Years | 0 (0.0%) | 5 (33.3%) |
| 75 Years and over | 4 (26.7%) | 0 (0.0%) |
| Total | 63 (22.7%) | 49 (22.2%) |
Income Above Poverty by Sex and Age in Sigurd
According to the poverty statistics in Sigurd, males aged 5 years and females aged 5 years are the age groups that are most secure financially, with 100.0% of males and 100.0% of females in these age groups living above the poverty line.
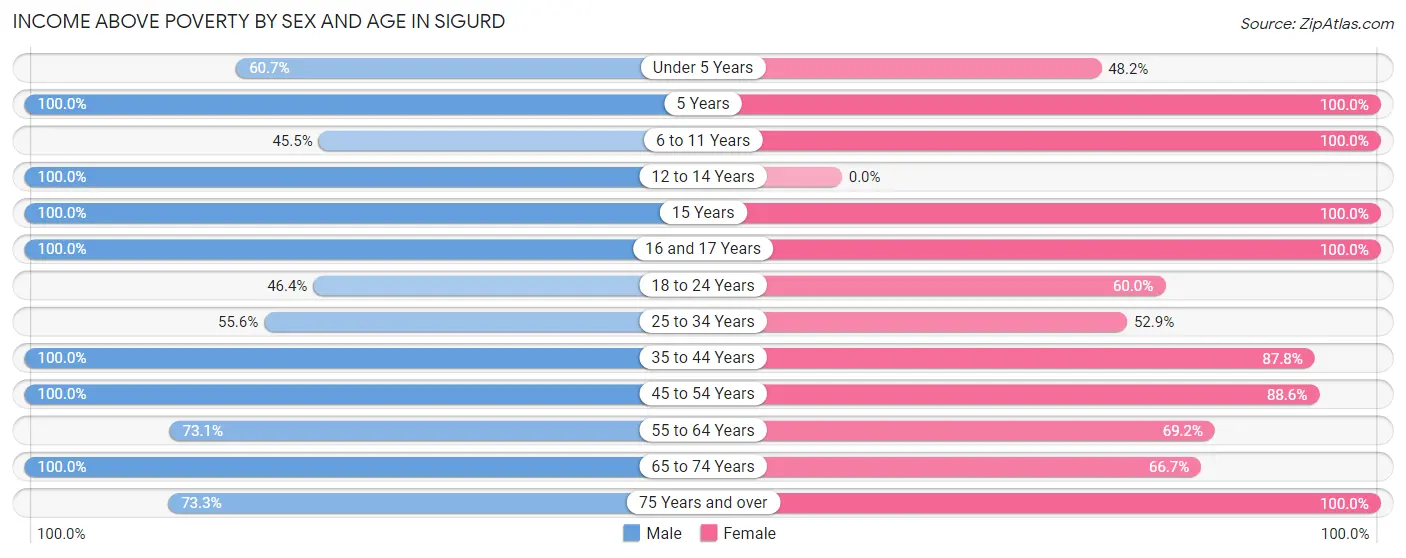
| Age Bracket | Male | Female |
| Under 5 Years | 17 (60.7%) | 13 (48.1%) |
| 5 Years | 4 (100.0%) | 8 (100.0%) |
| 6 to 11 Years | 15 (45.5%) | 12 (100.0%) |
| 12 to 14 Years | 23 (100.0%) | 0 (0.0%) |
| 15 Years | 6 (100.0%) | 7 (100.0%) |
| 16 and 17 Years | 24 (100.0%) | 11 (100.0%) |
| 18 to 24 Years | 13 (46.4%) | 12 (60.0%) |
| 25 to 34 Years | 10 (55.6%) | 9 (52.9%) |
| 35 to 44 Years | 34 (100.0%) | 43 (87.8%) |
| 45 to 54 Years | 37 (100.0%) | 31 (88.6%) |
| 55 to 64 Years | 19 (73.1%) | 9 (69.2%) |
| 65 to 74 Years | 1 (100.0%) | 10 (66.7%) |
| 75 Years and over | 11 (73.3%) | 7 (100.0%) |
| Total | 214 (77.3%) | 172 (77.8%) |
Income Below Poverty Among Married-Couple Families in Sigurd
The poverty statistics for married-couple families in Sigurd show that 21.7% or 25 of the total 115 families live below the poverty line. Families with 5 or more children have the highest poverty rate of 57.1%, comprising of 8 families. On the other hand, families with 3 or 4 children have the lowest poverty rate of 0.0%, which includes 0 families.
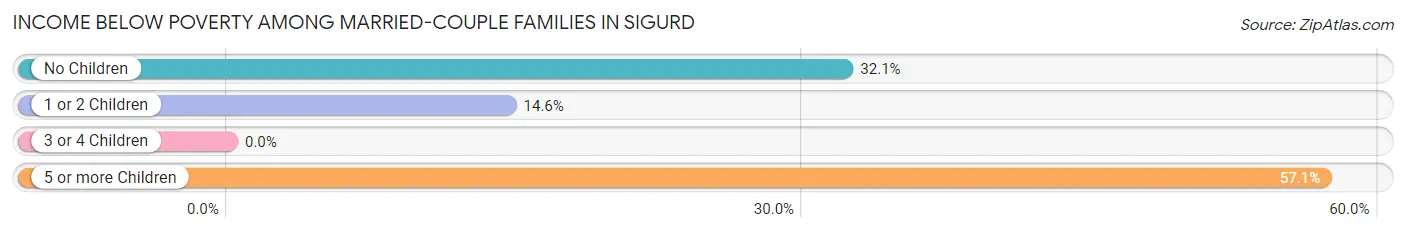
| Children | Above Poverty | Below Poverty |
| No Children | 19 (67.9%) | 9 (32.1%) |
| 1 or 2 Children | 47 (85.5%) | 8 (14.5%) |
| 3 or 4 Children | 18 (100.0%) | 0 (0.0%) |
| 5 or more Children | 6 (42.9%) | 8 (57.1%) |
| Total | 90 (78.3%) | 25 (21.7%) |
Income Below Poverty Among Single-Parent Households in Sigurd
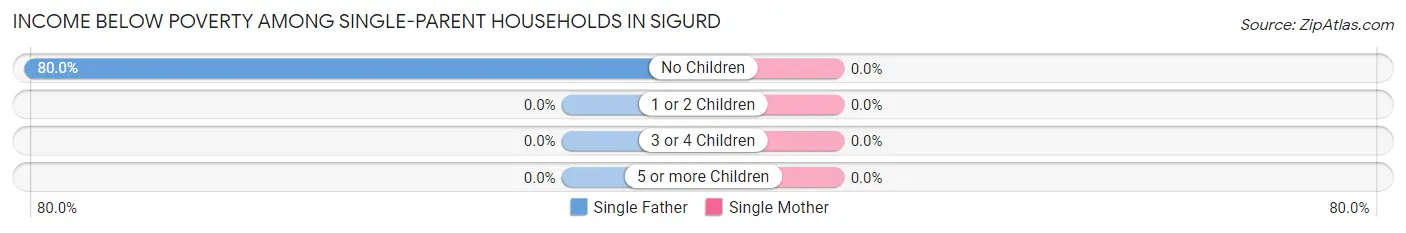
| Children | Single Father | Single Mother |
| No Children | 4 (80.0%) | 0 (0.0%) |
| 1 or 2 Children | 0 (0.0%) | 0 (0.0%) |
| 3 or 4 Children | 0 (0.0%) | 0 (0.0%) |
| 5 or more Children | 0 (0.0%) | 0 (0.0%) |
| Total | 4 (80.0%) | 0 (0.0%) |
Income Below Poverty Among Married-Couple vs Single-Parent Households in Sigurd
The poverty data for Sigurd shows that 25 of the married-couple family households (21.7%) and 4 of the single-parent households (57.1%) are living below the poverty level. Within the married-couple family households, those with 5 or more children have the highest poverty rate, with 8 households (57.1%) falling below the poverty line. Among the single-parent households, those with no children have the highest poverty rate, with 4 household (57.1%) living below poverty.
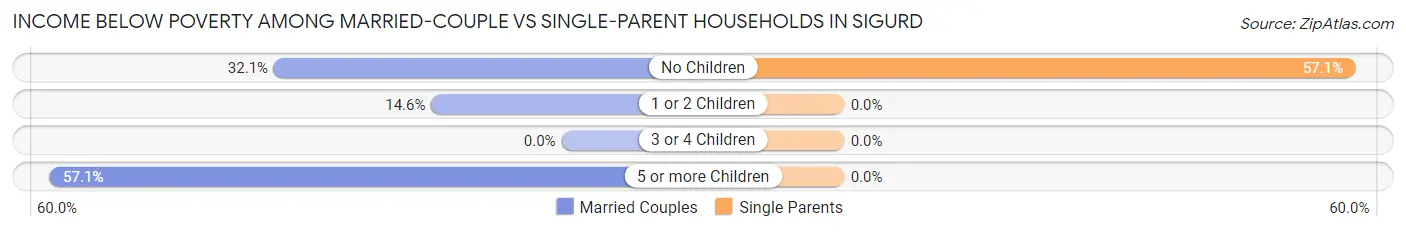
| Children | Married-Couple Families | Single-Parent Households |
| No Children | 9 (32.1%) | 4 (57.1%) |
| 1 or 2 Children | 8 (14.5%) | 0 (0.0%) |
| 3 or 4 Children | 0 (0.0%) | 0 (0.0%) |
| 5 or more Children | 8 (57.1%) | 0 (0.0%) |
| Total | 25 (21.7%) | 4 (57.1%) |
Race in Sigurd
The most populous races in Sigurd are White / Caucasian (473 | 95.0%), Hispanic or Latino (40 | 8.0%), and Two or more Races (16 | 3.2%).
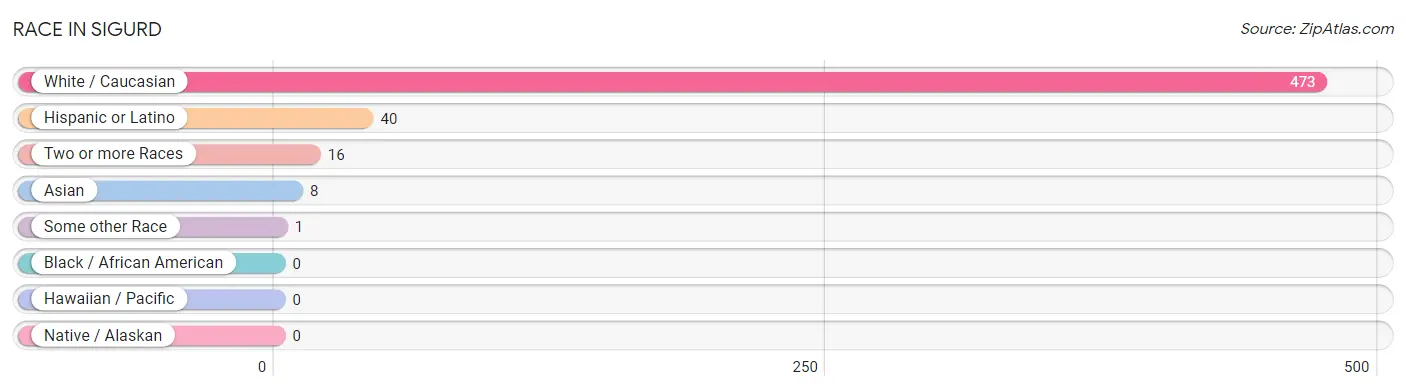
| Race | # Population | % Population |
| Asian | 8 | 1.6% |
| Black / African American | 0 | 0.0% |
| Hawaiian / Pacific | 0 | 0.0% |
| Hispanic or Latino | 40 | 8.0% |
| Native / Alaskan | 0 | 0.0% |
| White / Caucasian | 473 | 95.0% |
| Two or more Races | 16 | 3.2% |
| Some other Race | 1 | 0.2% |
| Total | 498 | 100.0% |
Ancestry in Sigurd
The most populous ancestries reported in Sigurd are English (153 | 30.7%), Danish (79 | 15.9%), German (44 | 8.8%), Scandinavian (22 | 4.4%), and European (21 | 4.2%), together accounting for 64.1% of all Sigurd residents.
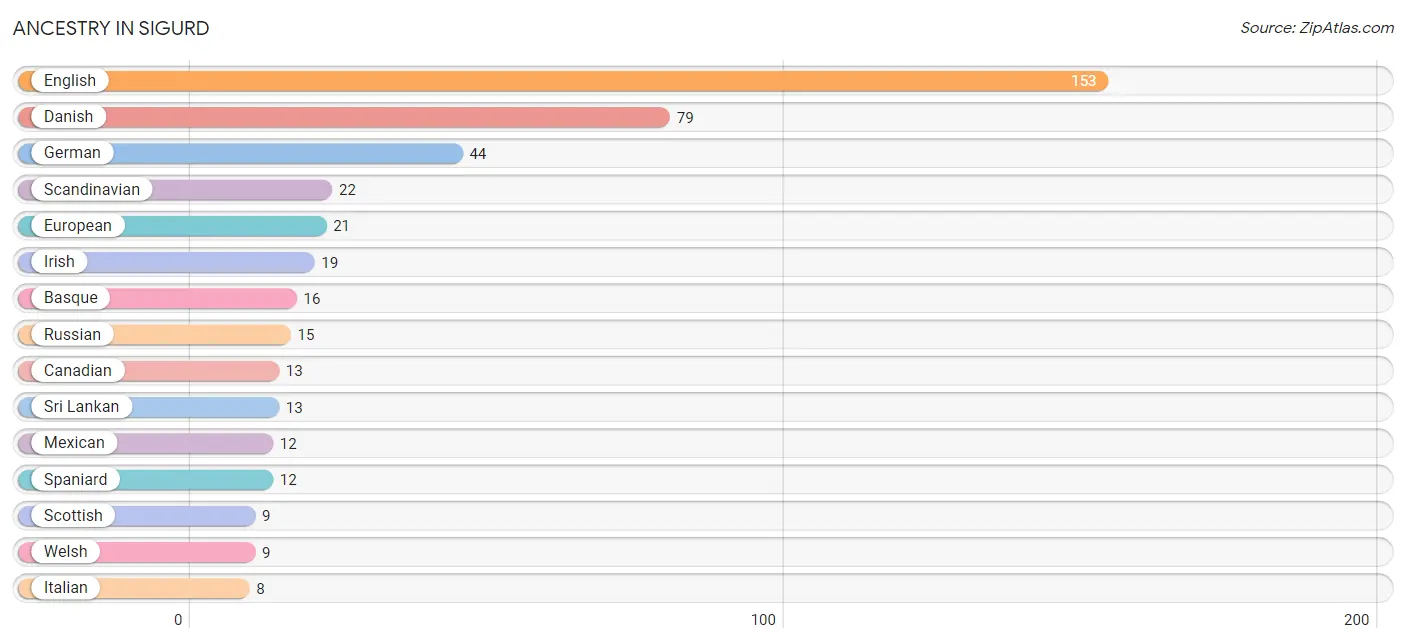
| Ancestry | # Population | % Population |
| Basque | 16 | 3.2% |
| Canadian | 13 | 2.6% |
| Czechoslovakian | 4 | 0.8% |
| Danish | 79 | 15.9% |
| Dutch | 6 | 1.2% |
| English | 153 | 30.7% |
| European | 21 | 4.2% |
| German | 44 | 8.8% |
| Irish | 19 | 3.8% |
| Italian | 8 | 1.6% |
| Mexican | 12 | 2.4% |
| Polish | 1 | 0.2% |
| Romanian | 5 | 1.0% |
| Russian | 15 | 3.0% |
| Scandinavian | 22 | 4.4% |
| Scottish | 9 | 1.8% |
| Spaniard | 12 | 2.4% |
| Sri Lankan | 13 | 2.6% |
| Swedish | 7 | 1.4% |
| Swiss | 5 | 1.0% |
| Welsh | 9 | 1.8% | View All 21 Rows |
Immigrants in Sigurd

| Immigration Origin | # Population | % Population | View All 0 Rows |
Sex and Age in Sigurd
Sex and Age in Sigurd
The most populous age groups in Sigurd are 10 to 14 Years (35 | 12.6%) for men and 40 to 44 Years (32 | 14.5%) for women.
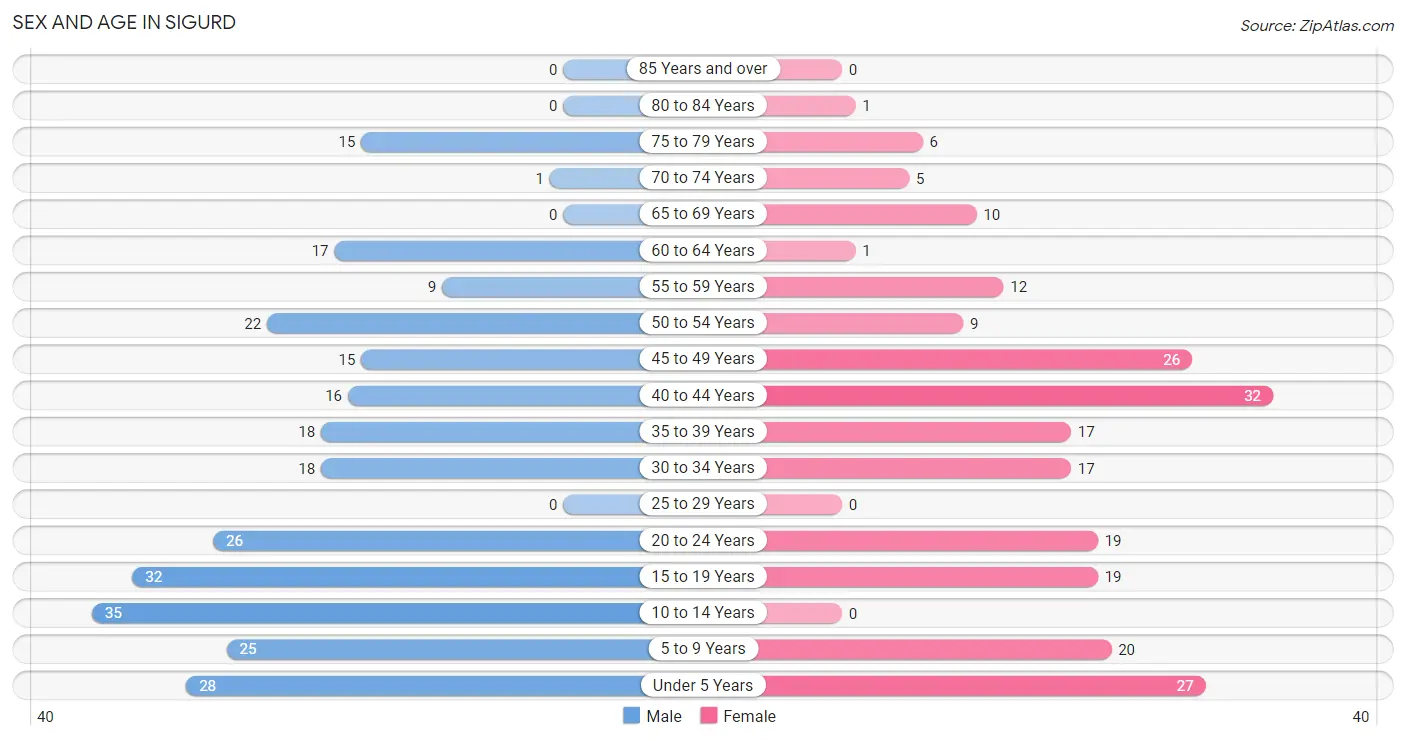
| Age Bracket | Male | Female |
| Under 5 Years | 28 (10.1%) | 27 (12.2%) |
| 5 to 9 Years | 25 (9.0%) | 20 (9.0%) |
| 10 to 14 Years | 35 (12.6%) | 0 (0.0%) |
| 15 to 19 Years | 32 (11.6%) | 19 (8.6%) |
| 20 to 24 Years | 26 (9.4%) | 19 (8.6%) |
| 25 to 29 Years | 0 (0.0%) | 0 (0.0%) |
| 30 to 34 Years | 18 (6.5%) | 17 (7.7%) |
| 35 to 39 Years | 18 (6.5%) | 17 (7.7%) |
| 40 to 44 Years | 16 (5.8%) | 32 (14.5%) |
| 45 to 49 Years | 15 (5.4%) | 26 (11.8%) |
| 50 to 54 Years | 22 (7.9%) | 9 (4.1%) |
| 55 to 59 Years | 9 (3.3%) | 12 (5.4%) |
| 60 to 64 Years | 17 (6.1%) | 1 (0.4%) |
| 65 to 69 Years | 0 (0.0%) | 10 (4.5%) |
| 70 to 74 Years | 1 (0.4%) | 5 (2.3%) |
| 75 to 79 Years | 15 (5.4%) | 6 (2.7%) |
| 80 to 84 Years | 0 (0.0%) | 1 (0.4%) |
| 85 Years and over | 0 (0.0%) | 0 (0.0%) |
| Total | 277 (100.0%) | 221 (100.0%) |
Families and Households in Sigurd
Median Family Size in Sigurd
The median family size in Sigurd is 3.81 persons per family, with married-couple families (115 | 94.3%) accounting for the largest median family size of 3.88 persons per family. On the other hand, single female/mother families (2 | 1.6%) represent the smallest median family size with 2.00 persons per family.
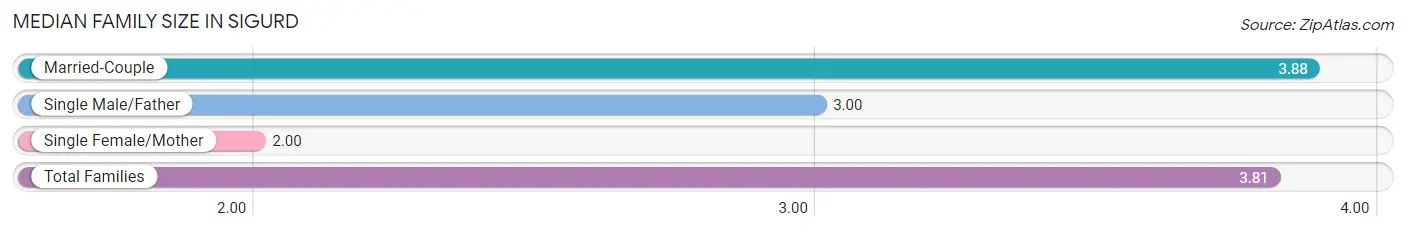
| Family Type | # Families | Family Size |
| Married-Couple | 115 (94.3%) | 3.88 |
| Single Male/Father | 5 (4.1%) | 3.00 |
| Single Female/Mother | 2 (1.6%) | 2.00 |
| Total Families | 122 (100.0%) | 3.81 |
Median Household Size in Sigurd
The median household size in Sigurd is 3.39 persons per household, with married-couple households (115 | 78.2%) accounting for the largest median household size of 3.88 persons per household. non-family households (25 | 17.0%) represent the smallest median household size with 1.24 persons per household.
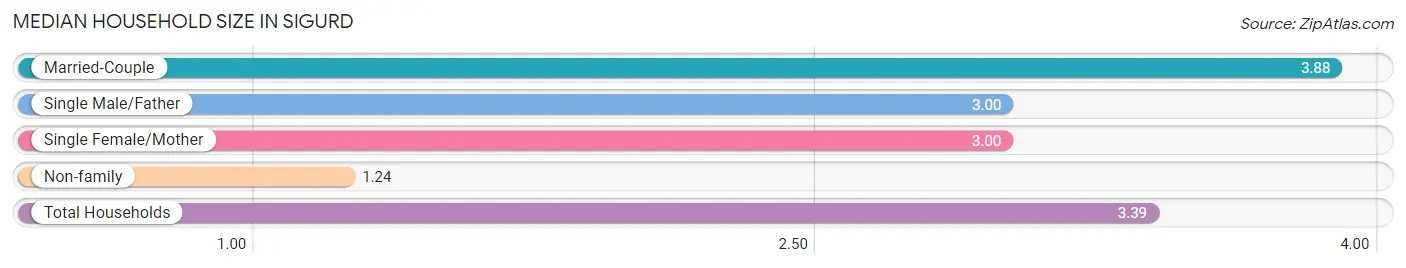
| Household Type | # Households | Household Size |
| Married-Couple | 115 (78.2%) | 3.88 |
| Single Male/Father | 5 (3.4%) | 3.00 |
| Single Female/Mother | 2 (1.4%) | 3.00 |
| Non-family | 25 (17.0%) | 1.24 |
| Total Households | 147 (100.0%) | 3.39 |
Household Size by Marriage Status in Sigurd
Out of a total of 147 households in Sigurd, 122 (83.0%) are family households, while 25 (17.0%) are nonfamily households. The most numerous type of family households are 4-person households, comprising 34, and the most common type of nonfamily households are 1-person households, comprising 20.
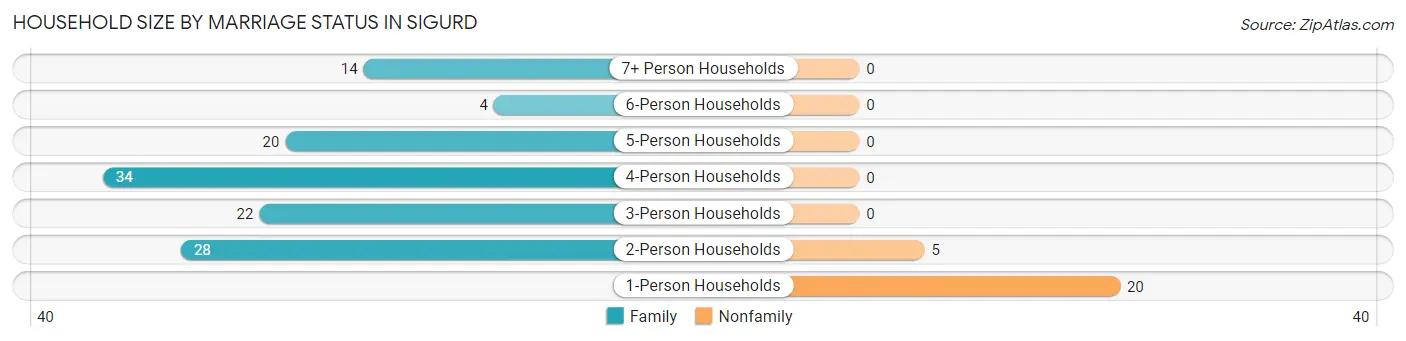
| Household Size | Family Households | Nonfamily Households |
| 1-Person Households | - | 20 (13.6%) |
| 2-Person Households | 28 (19.1%) | 5 (3.4%) |
| 3-Person Households | 22 (15.0%) | 0 (0.0%) |
| 4-Person Households | 34 (23.1%) | 0 (0.0%) |
| 5-Person Households | 20 (13.6%) | 0 (0.0%) |
| 6-Person Households | 4 (2.7%) | 0 (0.0%) |
| 7+ Person Households | 14 (9.5%) | 0 (0.0%) |
| Total | 122 (83.0%) | 25 (17.0%) |
Female Fertility in Sigurd
Fertility by Age in Sigurd
Average fertility rate in Sigurd is 38.0 births per 1,000 women. Women in the age bracket of 20 to 34 years have the highest fertility rate with 139.0 births per 1,000 women. Women in the age bracket of 20 to 34 years acount for 100.0% of all women with births.
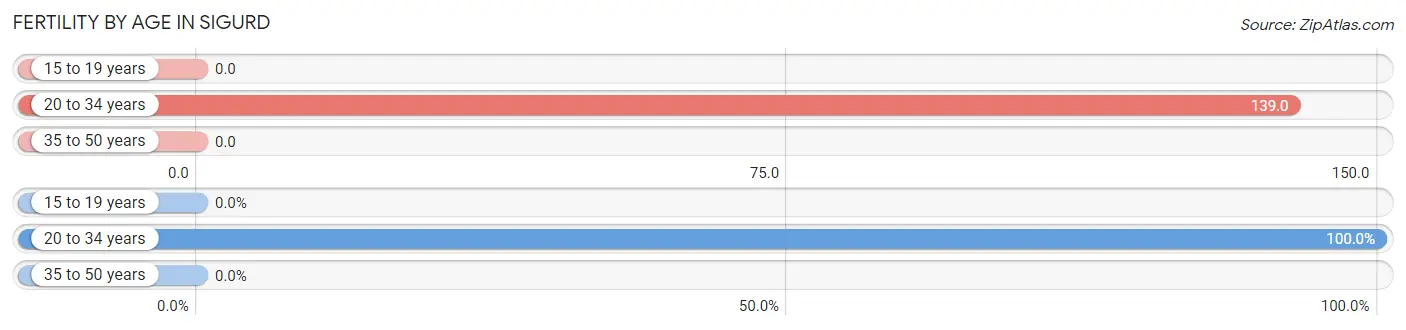
| Age Bracket | Women with Births | Births / 1,000 Women |
| 15 to 19 years | 0 (0.0%) | 0.0 |
| 20 to 34 years | 5 (100.0%) | 139.0 |
| 35 to 50 years | 0 (0.0%) | 0.0 |
| Total | 5 (100.0%) | 38.0 |
Fertility by Age by Marriage Status in Sigurd
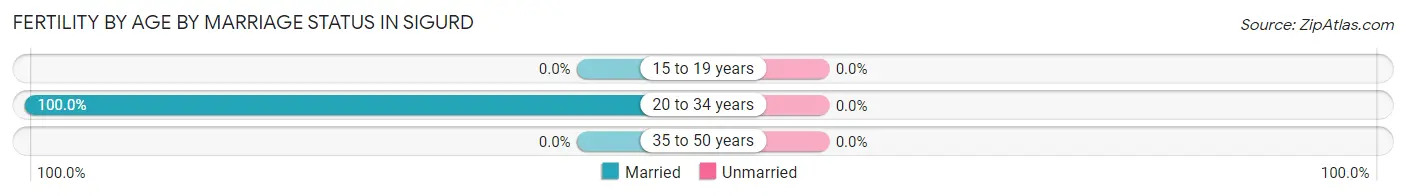
| Age Bracket | Married | Unmarried |
| 15 to 19 years | 0 (0.0%) | 0 (0.0%) |
| 20 to 34 years | 5 (100.0%) | 0 (0.0%) |
| 35 to 50 years | 0 (0.0%) | 0 (0.0%) |
| Total | 5 (100.0%) | 0 (0.0%) |
Fertility by Education in Sigurd
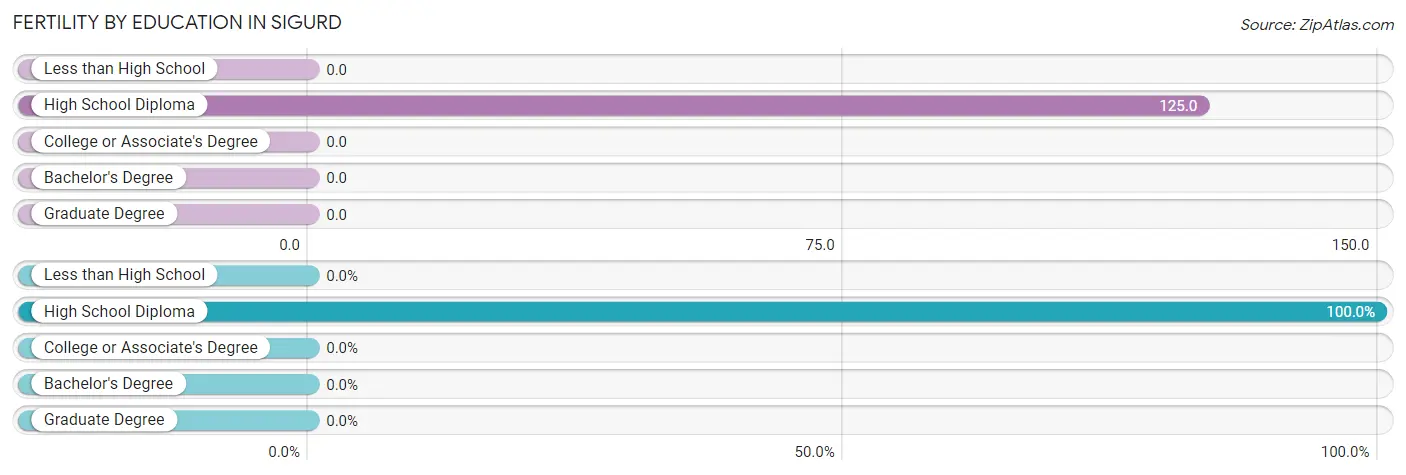
| Educational Attainment | Women with Births | Births / 1,000 Women |
| Less than High School | 0 (0.0%) | 0.0 |
| High School Diploma | 5 (100.0%) | 125.0 |
| College or Associate's Degree | 0 (0.0%) | 0.0 |
| Bachelor's Degree | 0 (0.0%) | 0.0 |
| Graduate Degree | 0 (0.0%) | 0.0 |
| Total | 5 (100.0%) | 38.0 |
Fertility by Education by Marriage Status in Sigurd
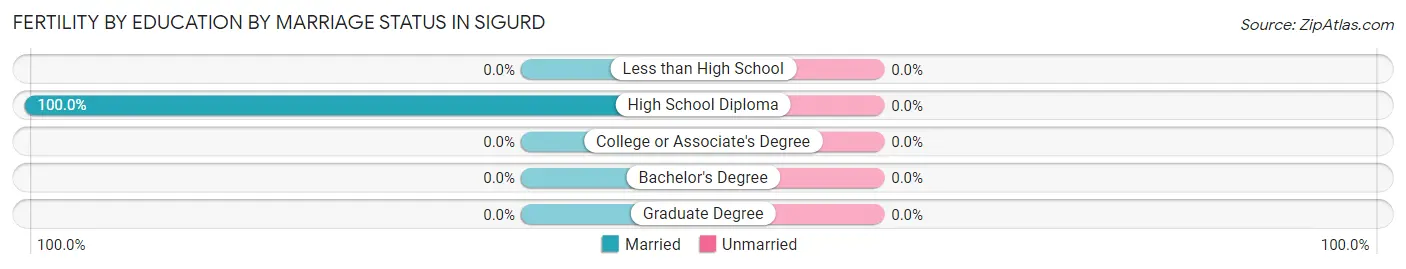
| Educational Attainment | Married | Unmarried |
| Less than High School | 0 (0.0%) | 0 (0.0%) |
| High School Diploma | 5 (100.0%) | 0 (0.0%) |
| College or Associate's Degree | 0 (0.0%) | 0 (0.0%) |
| Bachelor's Degree | 0 (0.0%) | 0 (0.0%) |
| Graduate Degree | 0 (0.0%) | 0 (0.0%) |
| Total | 5 (100.0%) | 0 (0.0%) |
Employment Characteristics in Sigurd
Employment by Class of Employer in Sigurd
Among the 221 employed individuals in Sigurd, private company employees (156 | 70.6%), self-employed (incorporated) (15 | 6.8%), and state government employees (14 | 6.3%) make up the most common classes of employment.
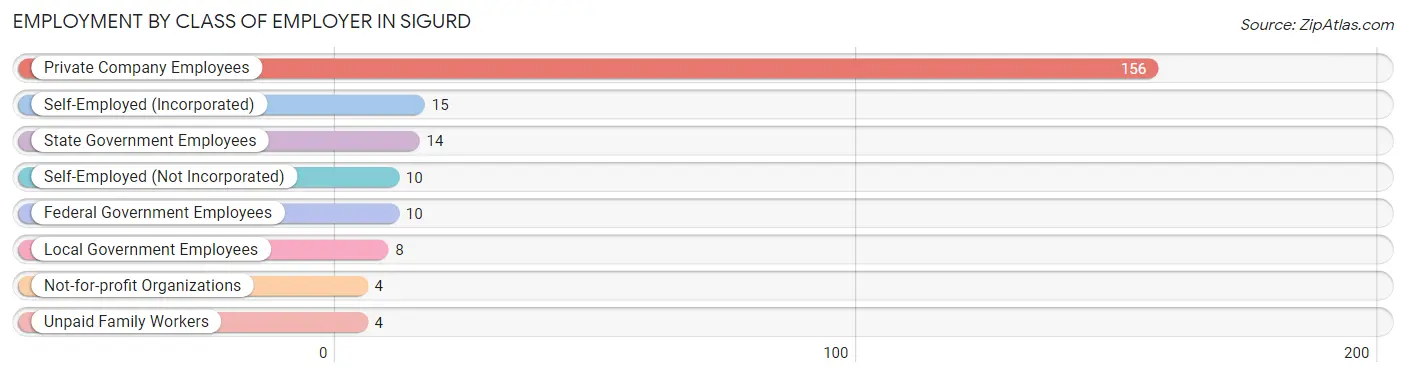
| Employer Class | # Employees | % Employees |
| Private Company Employees | 156 | 70.6% |
| Self-Employed (Incorporated) | 15 | 6.8% |
| Self-Employed (Not Incorporated) | 10 | 4.5% |
| Not-for-profit Organizations | 4 | 1.8% |
| Local Government Employees | 8 | 3.6% |
| State Government Employees | 14 | 6.3% |
| Federal Government Employees | 10 | 4.5% |
| Unpaid Family Workers | 4 | 1.8% |
| Total | 221 | 100.0% |
Employment Status by Age in Sigurd
According to the labor force statistics for Sigurd, out of the total population over 16 years of age (350), 70.3% or 246 individuals are in the labor force, with 5.4% or 13 of them unemployed. The age group with the highest labor force participation rate is 45 to 54 years, with 100.0% or 72 individuals in the labor force. Within the labor force, the 65 to 74 years age range has the highest percentage of unemployed individuals, with 40.0% or 4 of them being unemployed.
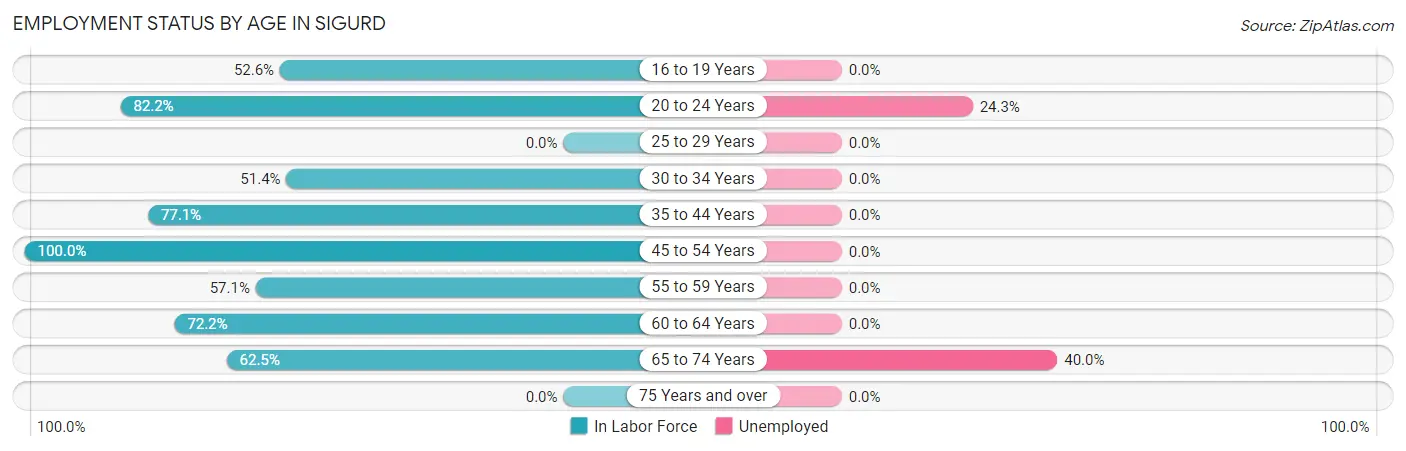
| Age Bracket | In Labor Force | Unemployed |
| 16 to 19 Years | 20 (52.6%) | 0 (0.0%) |
| 20 to 24 Years | 37 (82.2%) | 9 (24.3%) |
| 25 to 29 Years | 0 (0.0%) | 0 (0.0%) |
| 30 to 34 Years | 18 (51.4%) | 0 (0.0%) |
| 35 to 44 Years | 64 (77.1%) | 0 (0.0%) |
| 45 to 54 Years | 72 (100.0%) | 0 (0.0%) |
| 55 to 59 Years | 12 (57.1%) | 0 (0.0%) |
| 60 to 64 Years | 13 (72.2%) | 0 (0.0%) |
| 65 to 74 Years | 10 (62.5%) | 4 (40.0%) |
| 75 Years and over | 0 (0.0%) | 0 (0.0%) |
| Total | 246 (70.3%) | 13 (5.4%) |
Employment Status by Educational Attainment in Sigurd
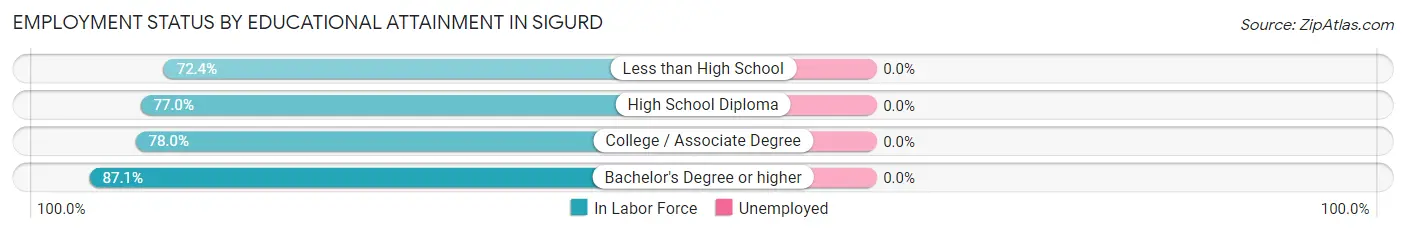
| Educational Attainment | In Labor Force | Unemployed |
| Less than High School | 21 (72.4%) | 0 (0.0%) |
| High School Diploma | 67 (77.0%) | 0 (0.0%) |
| College / Associate Degree | 64 (78.0%) | 0 (0.0%) |
| Bachelor's Degree or higher | 27 (87.1%) | 0 (0.0%) |
| Total | 179 (78.2%) | 0 (0.0%) |
Employment Occupations by Sex in Sigurd
Management, Business, Science and Arts Occupations
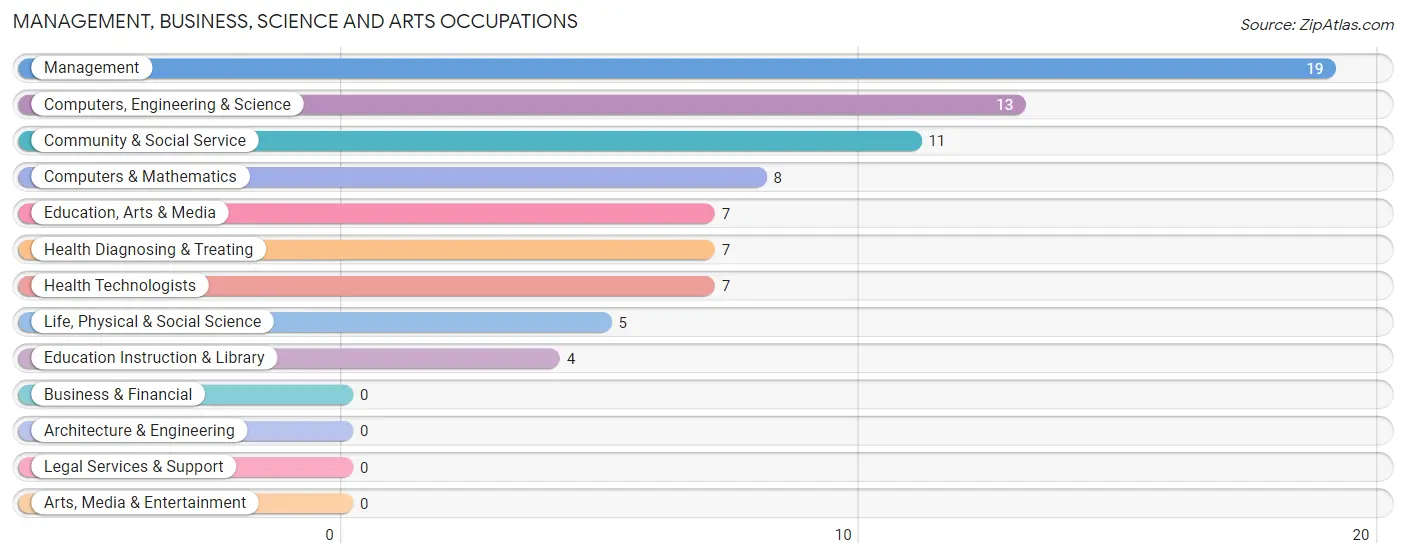
The most common Management, Business, Science and Arts occupations in Sigurd are Management (19 | 8.3%), Computers, Engineering & Science (13 | 5.7%), Community & Social Service (11 | 4.8%), Computers & Mathematics (8 | 3.5%), and Education, Arts & Media (7 | 3.1%).
Management, Business, Science and Arts Occupations by Sex
Within the Management, Business, Science and Arts occupations in Sigurd, the most male-oriented occupations are Computers, Engineering & Science (100.0%), Computers & Mathematics (100.0%), and Life, Physical & Social Science (100.0%), while the most female-oriented occupations are Community & Social Service (100.0%), Education, Arts & Media (100.0%), and Education Instruction & Library (100.0%).
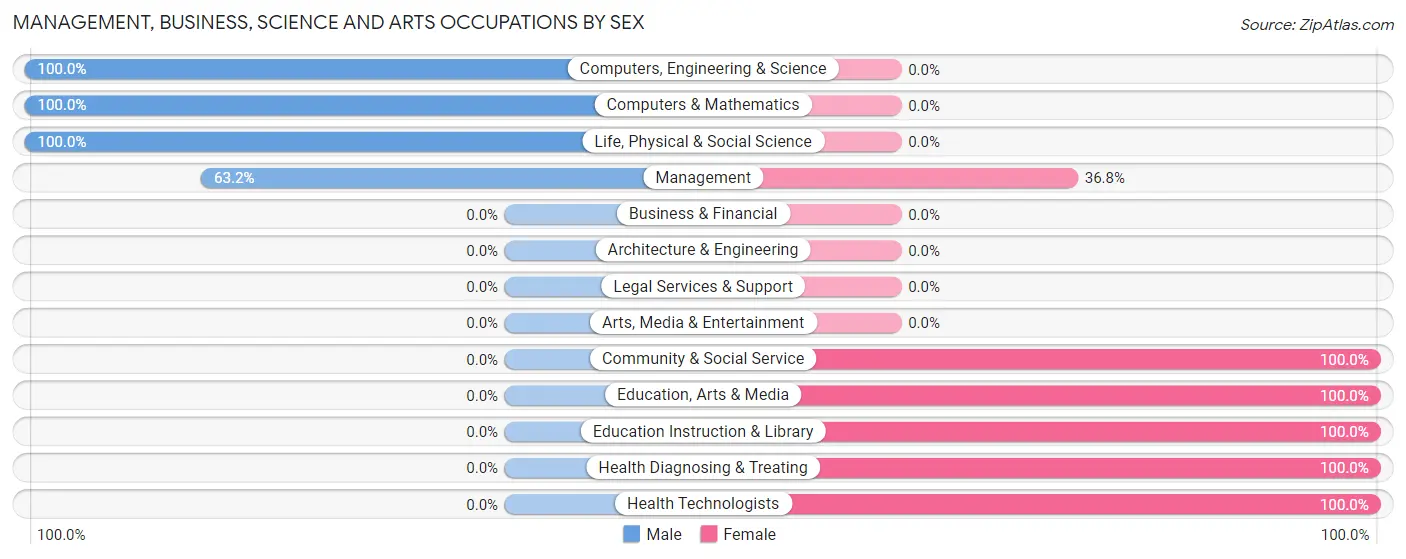
| Occupation | Male | Female |
| Management | 12 (63.2%) | 7 (36.8%) |
| Business & Financial | 0 (0.0%) | 0 (0.0%) |
| Computers, Engineering & Science | 13 (100.0%) | 0 (0.0%) |
| Computers & Mathematics | 8 (100.0%) | 0 (0.0%) |
| Architecture & Engineering | 0 (0.0%) | 0 (0.0%) |
| Life, Physical & Social Science | 5 (100.0%) | 0 (0.0%) |
| Community & Social Service | 0 (0.0%) | 11 (100.0%) |
| Education, Arts & Media | 0 (0.0%) | 7 (100.0%) |
| Legal Services & Support | 0 (0.0%) | 0 (0.0%) |
| Education Instruction & Library | 0 (0.0%) | 4 (100.0%) |
| Arts, Media & Entertainment | 0 (0.0%) | 0 (0.0%) |
| Health Diagnosing & Treating | 0 (0.0%) | 7 (100.0%) |
| Health Technologists | 0 (0.0%) | 7 (100.0%) |
| Total (Category) | 25 (50.0%) | 25 (50.0%) |
| Total (Overall) | 130 (57.0%) | 98 (43.0%) |
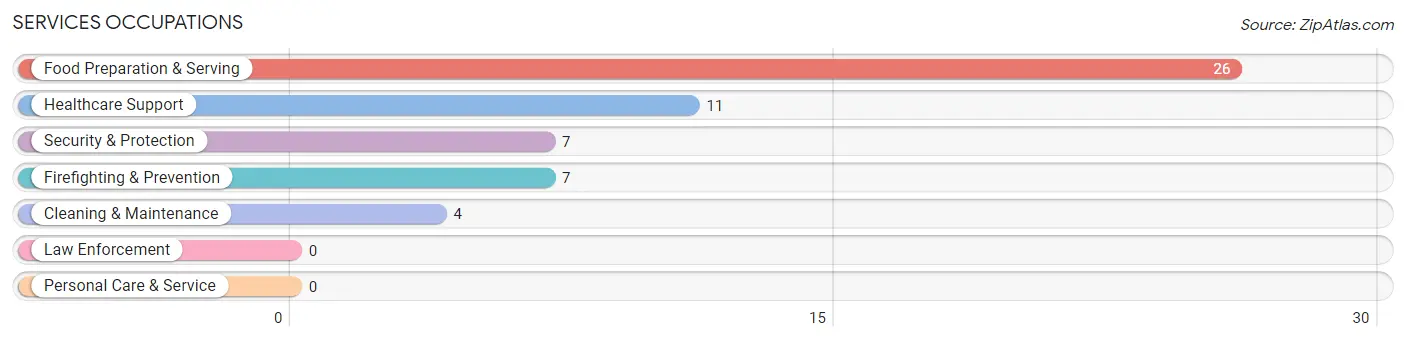
Services Occupations
The most common Services occupations in Sigurd are Food Preparation & Serving (26 | 11.4%), Healthcare Support (11 | 4.8%), Security & Protection (7 | 3.1%), Firefighting & Prevention (7 | 3.1%), and Cleaning & Maintenance (4 | 1.8%).
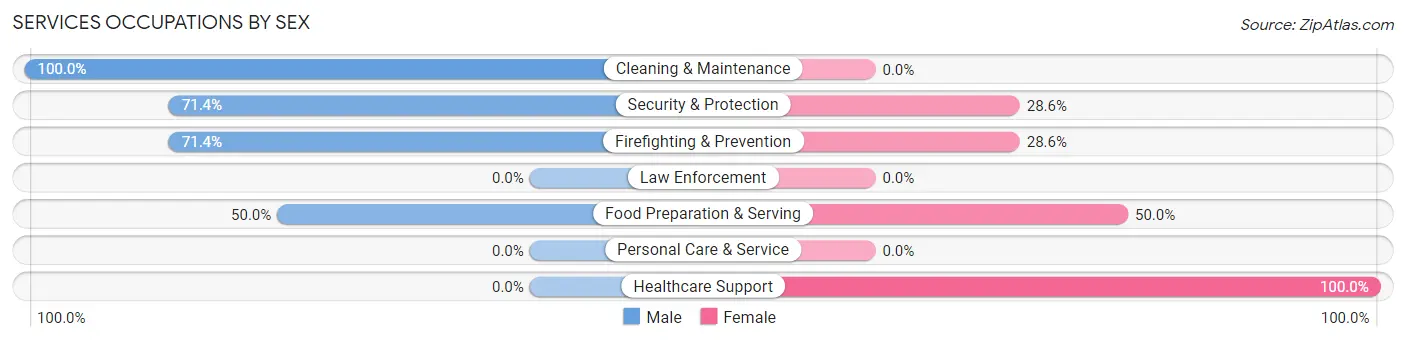
Services Occupations by Sex
Within the Services occupations in Sigurd, the most male-oriented occupations are Cleaning & Maintenance (100.0%), Security & Protection (71.4%), and Firefighting & Prevention (71.4%), while the most female-oriented occupations are Healthcare Support (100.0%), Food Preparation & Serving (50.0%), and Security & Protection (28.6%).
| Occupation | Male | Female |
| Healthcare Support | 0 (0.0%) | 11 (100.0%) |
| Security & Protection | 5 (71.4%) | 2 (28.6%) |
| Firefighting & Prevention | 5 (71.4%) | 2 (28.6%) |
| Law Enforcement | 0 (0.0%) | 0 (0.0%) |
| Food Preparation & Serving | 13 (50.0%) | 13 (50.0%) |
| Cleaning & Maintenance | 4 (100.0%) | 0 (0.0%) |
| Personal Care & Service | 0 (0.0%) | 0 (0.0%) |
| Total (Category) | 22 (45.8%) | 26 (54.2%) |
| Total (Overall) | 130 (57.0%) | 98 (43.0%) |
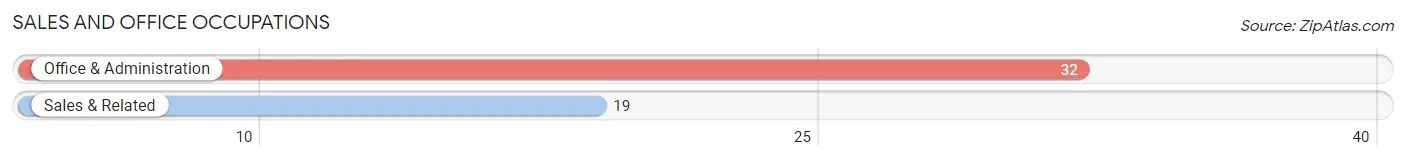
Sales and Office Occupations
The most common Sales and Office occupations in Sigurd are Office & Administration (32 | 14.0%), and Sales & Related (19 | 8.3%).
Sales and Office Occupations by Sex
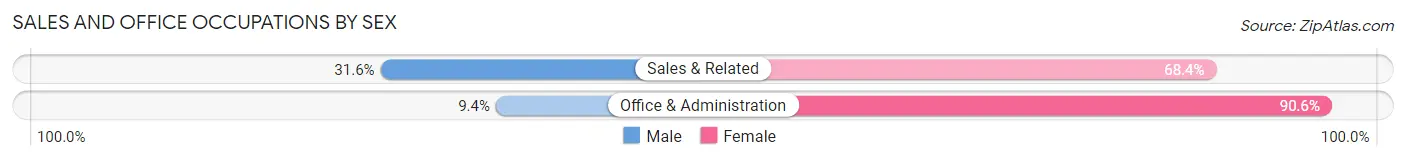
| Occupation | Male | Female |
| Sales & Related | 6 (31.6%) | 13 (68.4%) |
| Office & Administration | 3 (9.4%) | 29 (90.6%) |
| Total (Category) | 9 (17.6%) | 42 (82.4%) |
| Total (Overall) | 130 (57.0%) | 98 (43.0%) |
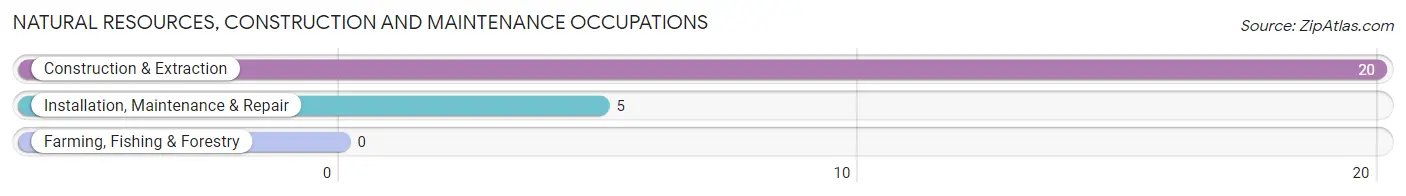
Natural Resources, Construction and Maintenance Occupations
The most common Natural Resources, Construction and Maintenance occupations in Sigurd are Construction & Extraction (20 | 8.8%), and Installation, Maintenance & Repair (5 | 2.2%).
Natural Resources, Construction and Maintenance Occupations by Sex
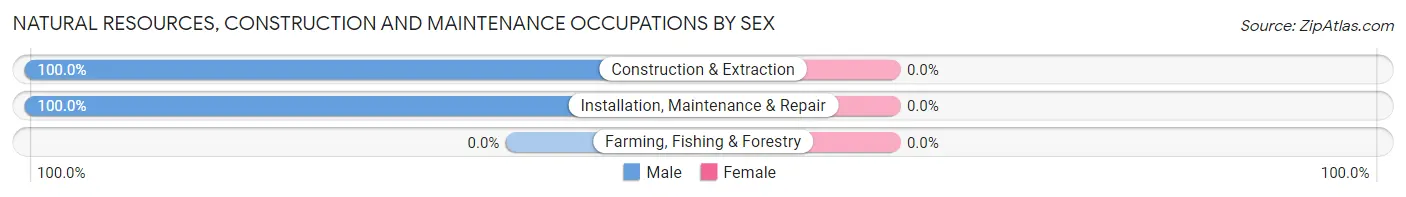
| Occupation | Male | Female |
| Farming, Fishing & Forestry | 0 (0.0%) | 0 (0.0%) |
| Construction & Extraction | 20 (100.0%) | 0 (0.0%) |
| Installation, Maintenance & Repair | 5 (100.0%) | 0 (0.0%) |
| Total (Category) | 25 (100.0%) | 0 (0.0%) |
| Total (Overall) | 130 (57.0%) | 98 (43.0%) |
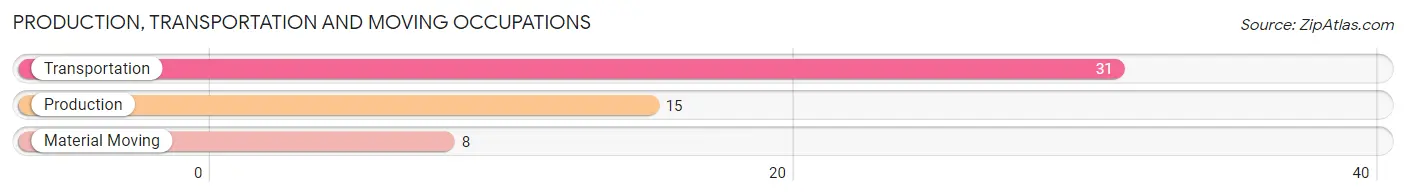
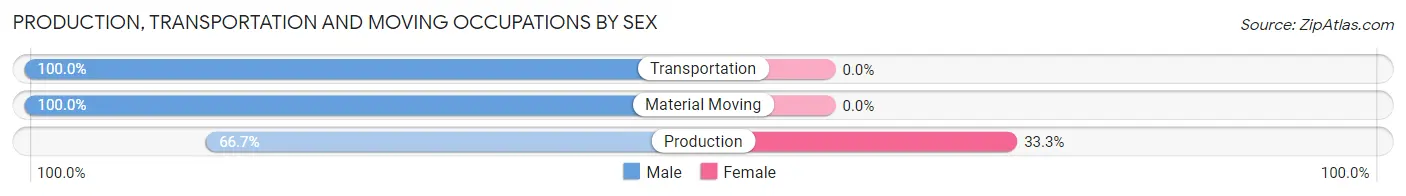
Production, Transportation and Moving Occupations
The most common Production, Transportation and Moving occupations in Sigurd are Transportation (31 | 13.6%), Production (15 | 6.6%), and Material Moving (8 | 3.5%).
Production, Transportation and Moving Occupations by Sex
| Occupation | Male | Female |
| Production | 10 (66.7%) | 5 (33.3%) |
| Transportation | 31 (100.0%) | 0 (0.0%) |
| Material Moving | 8 (100.0%) | 0 (0.0%) |
| Total (Category) | 49 (90.7%) | 5 (9.3%) |
| Total (Overall) | 130 (57.0%) | 98 (43.0%) |
Employment Industries by Sex in Sigurd
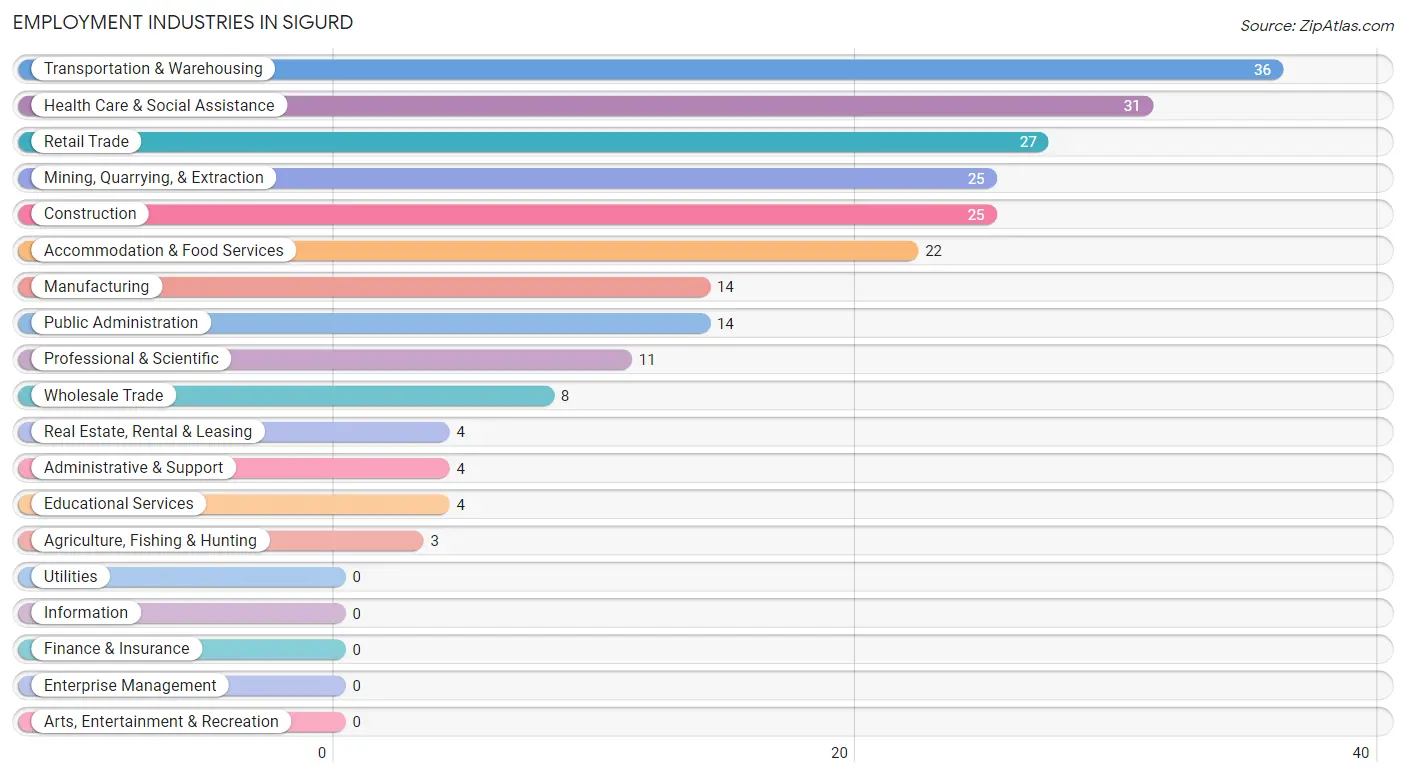
Employment Industries in Sigurd
The major employment industries in Sigurd include Transportation & Warehousing (36 | 15.8%), Health Care & Social Assistance (31 | 13.6%), Retail Trade (27 | 11.8%), Mining, Quarrying, & Extraction (25 | 11.0%), and Construction (25 | 11.0%).
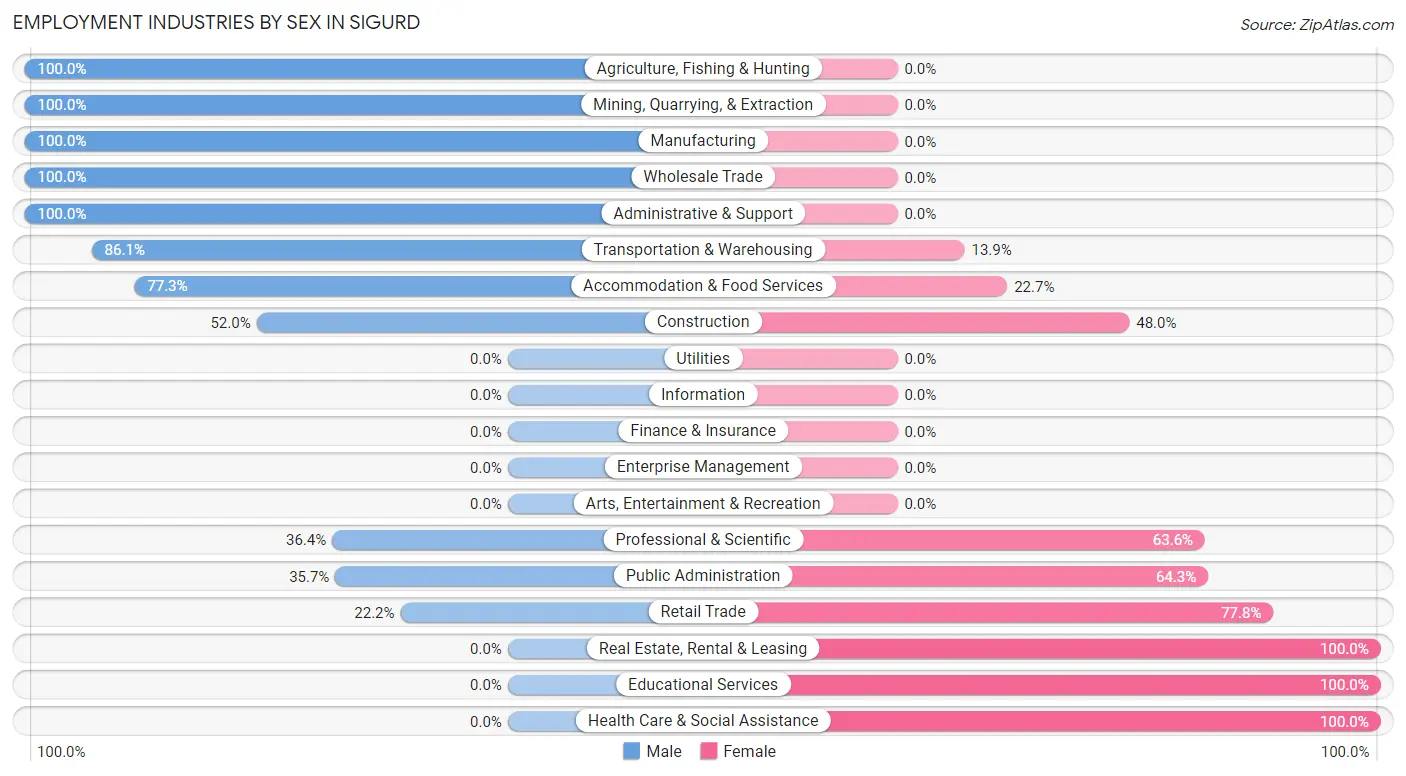
Employment Industries by Sex in Sigurd
The Sigurd industries that see more men than women are Agriculture, Fishing & Hunting (100.0%), Mining, Quarrying, & Extraction (100.0%), and Manufacturing (100.0%), whereas the industries that tend to have a higher number of women are Real Estate, Rental & Leasing (100.0%), Educational Services (100.0%), and Health Care & Social Assistance (100.0%).
| Industry | Male | Female |
| Agriculture, Fishing & Hunting | 3 (100.0%) | 0 (0.0%) |
| Mining, Quarrying, & Extraction | 25 (100.0%) | 0 (0.0%) |
| Construction | 13 (52.0%) | 12 (48.0%) |
| Manufacturing | 14 (100.0%) | 0 (0.0%) |
| Wholesale Trade | 8 (100.0%) | 0 (0.0%) |
| Retail Trade | 6 (22.2%) | 21 (77.8%) |
| Transportation & Warehousing | 31 (86.1%) | 5 (13.9%) |
| Utilities | 0 (0.0%) | 0 (0.0%) |
| Information | 0 (0.0%) | 0 (0.0%) |
| Finance & Insurance | 0 (0.0%) | 0 (0.0%) |
| Real Estate, Rental & Leasing | 0 (0.0%) | 4 (100.0%) |
| Professional & Scientific | 4 (36.4%) | 7 (63.6%) |
| Enterprise Management | 0 (0.0%) | 0 (0.0%) |
| Administrative & Support | 4 (100.0%) | 0 (0.0%) |
| Educational Services | 0 (0.0%) | 4 (100.0%) |
| Health Care & Social Assistance | 0 (0.0%) | 31 (100.0%) |
| Arts, Entertainment & Recreation | 0 (0.0%) | 0 (0.0%) |
| Accommodation & Food Services | 17 (77.3%) | 5 (22.7%) |
| Public Administration | 5 (35.7%) | 9 (64.3%) |
| Total | 130 (57.0%) | 98 (43.0%) |
Education in Sigurd
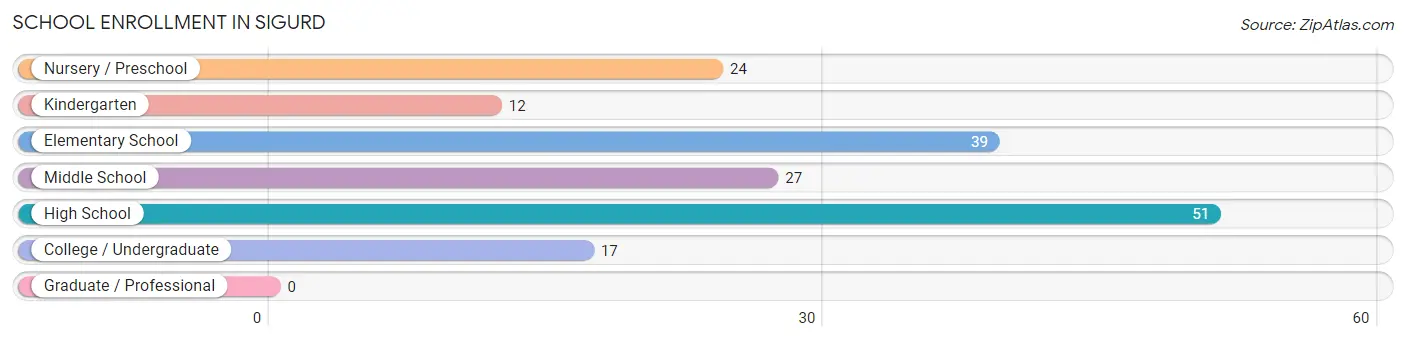
School Enrollment in Sigurd
The most common levels of schooling among the 170 students in Sigurd are high school (51 | 30.0%), elementary school (39 | 22.9%), and middle school (27 | 15.9%).
| School Level | # Students | % Students |
| Nursery / Preschool | 24 | 14.1% |
| Kindergarten | 12 | 7.1% |
| Elementary School | 39 | 22.9% |
| Middle School | 27 | 15.9% |
| High School | 51 | 30.0% |
| College / Undergraduate | 17 | 10.0% |
| Graduate / Professional | 0 | 0.0% |
| Total | 170 | 100.0% |
School Enrollment by Age by Funding Source in Sigurd
Out of a total of 170 students who are enrolled in schools in Sigurd, 14 (8.2%) attend a private institution, while the remaining 156 (91.8%) are enrolled in public schools. The age group of 25 to 34 year olds has the highest likelihood of being enrolled in private schools, with 5 (100.0% in the age bracket) enrolled. Conversely, the age group of 5 to 9 year old has the lowest likelihood of being enrolled in a private school, with 45 (100.0% in the age bracket) attending a public institution.
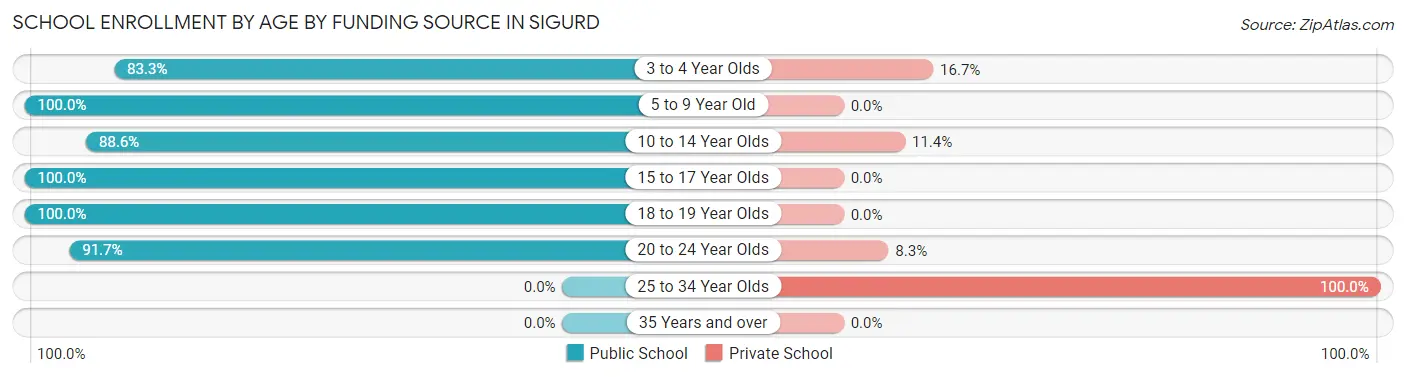
| Age Bracket | Public School | Private School |
| 3 to 4 Year Olds | 20 (83.3%) | 4 (16.7%) |
| 5 to 9 Year Old | 45 (100.0%) | 0 (0.0%) |
| 10 to 14 Year Olds | 31 (88.6%) | 4 (11.4%) |
| 15 to 17 Year Olds | 48 (100.0%) | 0 (0.0%) |
| 18 to 19 Year Olds | 1 (100.0%) | 0 (0.0%) |
| 20 to 24 Year Olds | 11 (91.7%) | 1 (8.3%) |
| 25 to 34 Year Olds | 0 (0.0%) | 5 (100.0%) |
| 35 Years and over | 0 (0.0%) | 0 (0.0%) |
| Total | 156 (91.8%) | 14 (8.2%) |
Educational Attainment by Field of Study in Sigurd
Science & technology (11 | 31.4%), computers & mathematics (8 | 22.9%), multidisciplinary studies (6 | 17.1%), bio, nature & agricultural (5 | 14.3%), and psychology (5 | 14.3%) are the most common fields of study among 35 individuals in Sigurd who have obtained a bachelor's degree or higher.
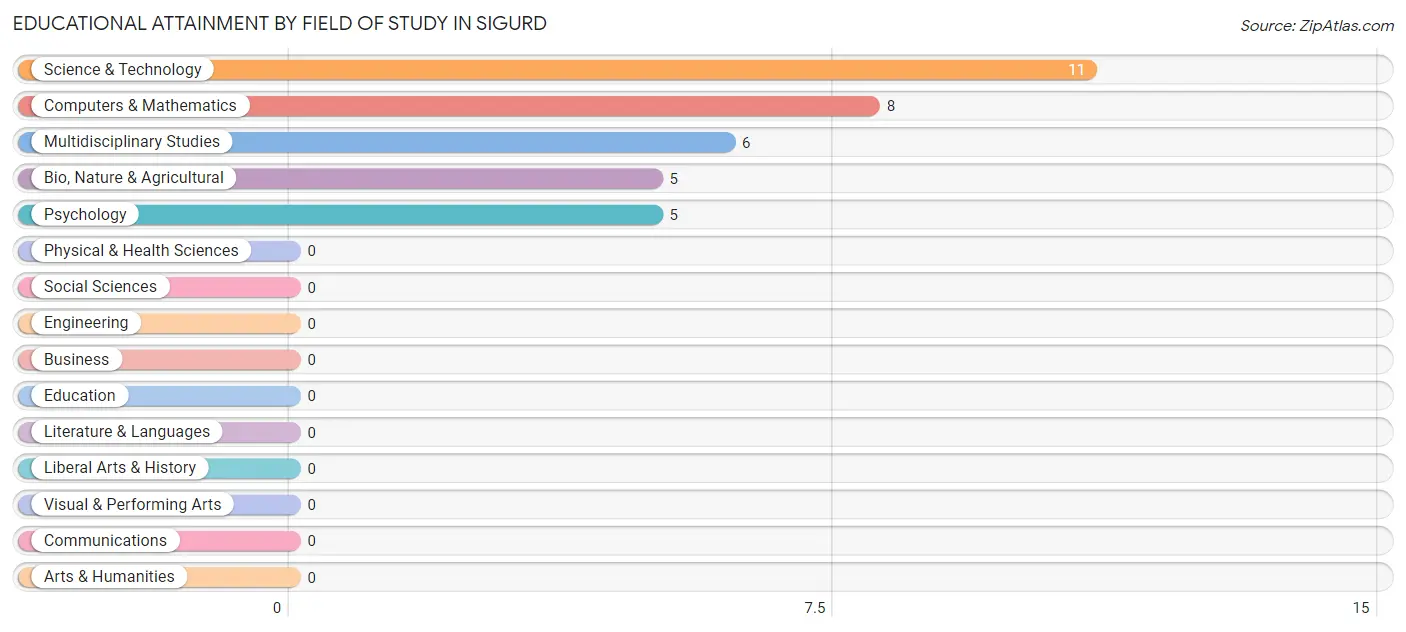
| Field of Study | # Graduates | % Graduates |
| Computers & Mathematics | 8 | 22.9% |
| Bio, Nature & Agricultural | 5 | 14.3% |
| Physical & Health Sciences | 0 | 0.0% |
| Psychology | 5 | 14.3% |
| Social Sciences | 0 | 0.0% |
| Engineering | 0 | 0.0% |
| Multidisciplinary Studies | 6 | 17.1% |
| Science & Technology | 11 | 31.4% |
| Business | 0 | 0.0% |
| Education | 0 | 0.0% |
| Literature & Languages | 0 | 0.0% |
| Liberal Arts & History | 0 | 0.0% |
| Visual & Performing Arts | 0 | 0.0% |
| Communications | 0 | 0.0% |
| Arts & Humanities | 0 | 0.0% |
| Total | 35 | 100.0% |
Transportation & Commute in Sigurd
Vehicle Availability by Sex in Sigurd
The most prevalent vehicle ownership categories in Sigurd are males with 2 vehicles (44, accounting for 35.8%) and females with 2 vehicles (28, making up 44.9%).
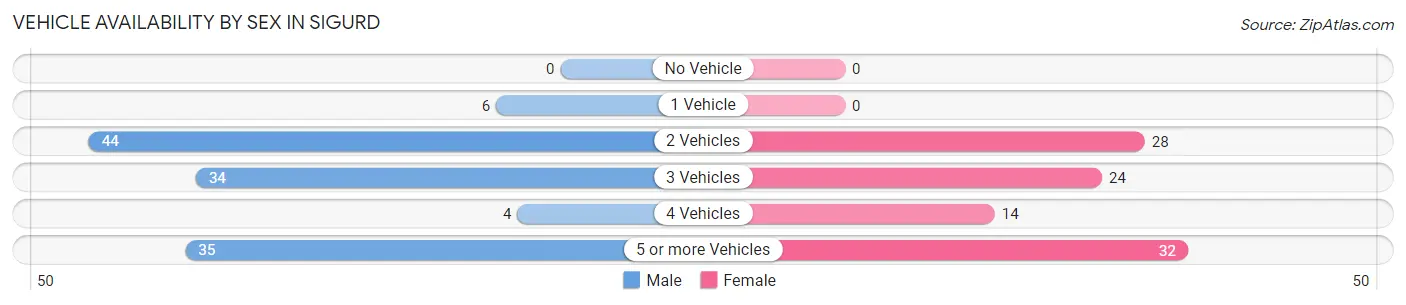
| Vehicles Available | Male | Female |
| No Vehicle | 0 (0.0%) | 0 (0.0%) |
| 1 Vehicle | 6 (4.9%) | 0 (0.0%) |
| 2 Vehicles | 44 (35.8%) | 28 (28.6%) |
| 3 Vehicles | 34 (27.6%) | 24 (24.5%) |
| 4 Vehicles | 4 (3.3%) | 14 (14.3%) |
| 5 or more Vehicles | 35 (28.5%) | 32 (32.7%) |
| Total | 123 (100.0%) | 98 (100.0%) |
Commute Time in Sigurd
The most frequently occuring commute durations in Sigurd are 10 to 14 minutes (106 commuters, 52.2%), 15 to 19 minutes (38 commuters, 18.7%), and 5 to 9 minutes (19 commuters, 9.4%).
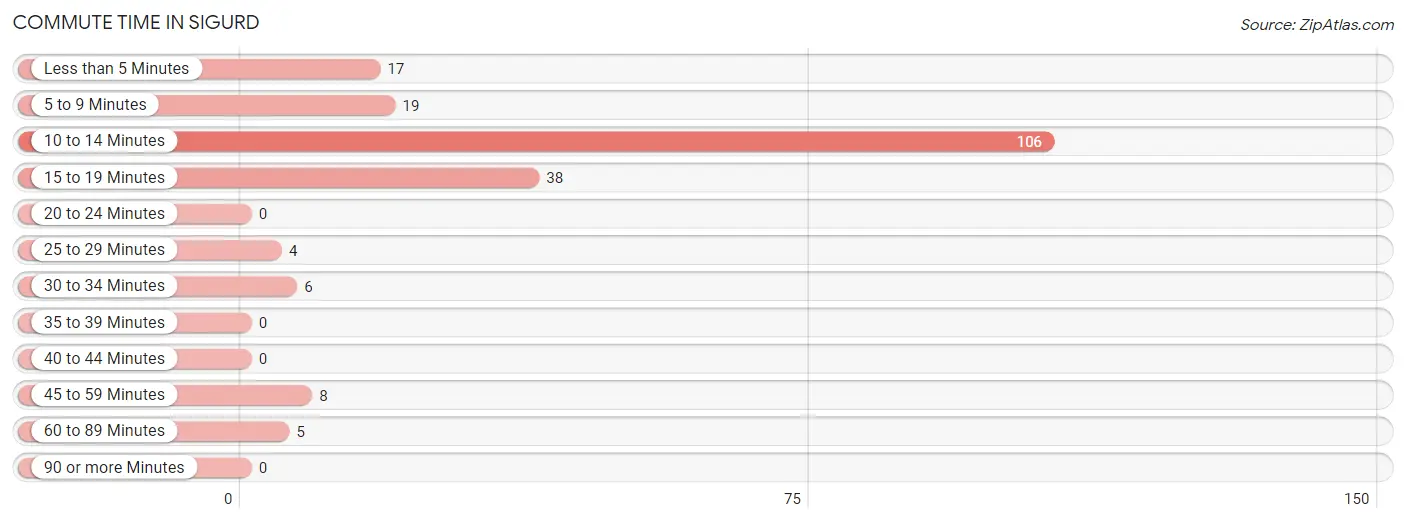
| Commute Time | # Commuters | % Commuters |
| Less than 5 Minutes | 17 | 8.4% |
| 5 to 9 Minutes | 19 | 9.4% |
| 10 to 14 Minutes | 106 | 52.2% |
| 15 to 19 Minutes | 38 | 18.7% |
| 20 to 24 Minutes | 0 | 0.0% |
| 25 to 29 Minutes | 4 | 2.0% |
| 30 to 34 Minutes | 6 | 3.0% |
| 35 to 39 Minutes | 0 | 0.0% |
| 40 to 44 Minutes | 0 | 0.0% |
| 45 to 59 Minutes | 8 | 3.9% |
| 60 to 89 Minutes | 5 | 2.5% |
| 90 or more Minutes | 0 | 0.0% |
Commute Time by Sex in Sigurd
The most common commute times in Sigurd are 10 to 14 minutes (48 commuters, 44.0%) for males and 10 to 14 minutes (58 commuters, 61.7%) for females.
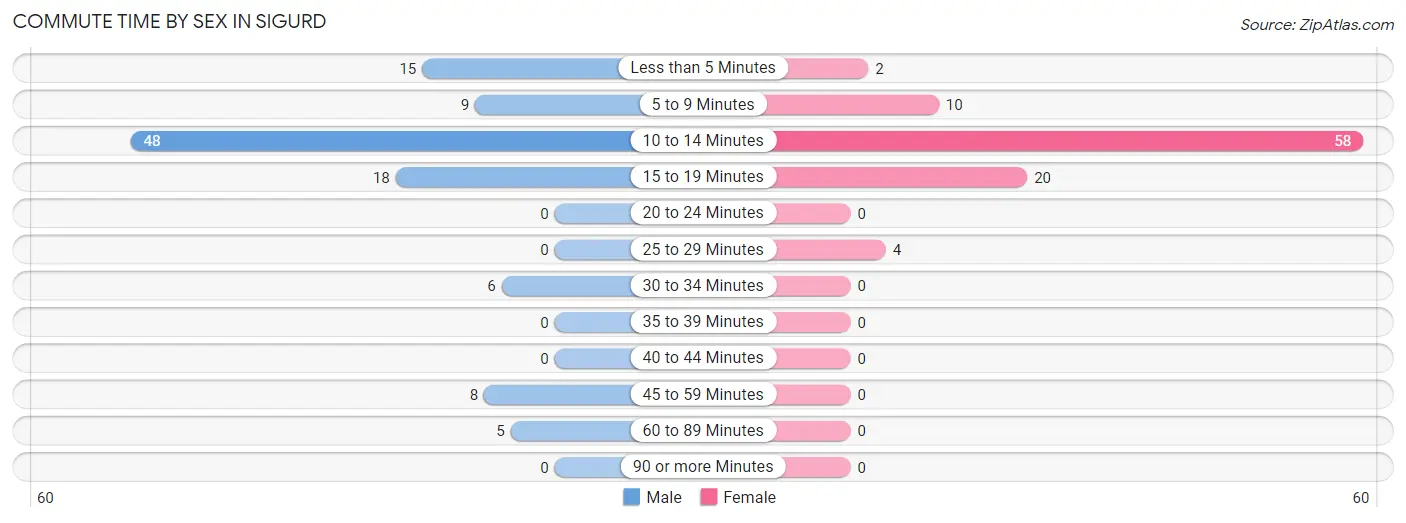
| Commute Time | Male | Female |
| Less than 5 Minutes | 15 (13.8%) | 2 (2.1%) |
| 5 to 9 Minutes | 9 (8.3%) | 10 (10.6%) |
| 10 to 14 Minutes | 48 (44.0%) | 58 (61.7%) |
| 15 to 19 Minutes | 18 (16.5%) | 20 (21.3%) |
| 20 to 24 Minutes | 0 (0.0%) | 0 (0.0%) |
| 25 to 29 Minutes | 0 (0.0%) | 4 (4.3%) |
| 30 to 34 Minutes | 6 (5.5%) | 0 (0.0%) |
| 35 to 39 Minutes | 0 (0.0%) | 0 (0.0%) |
| 40 to 44 Minutes | 0 (0.0%) | 0 (0.0%) |
| 45 to 59 Minutes | 8 (7.3%) | 0 (0.0%) |
| 60 to 89 Minutes | 5 (4.6%) | 0 (0.0%) |
| 90 or more Minutes | 0 (0.0%) | 0 (0.0%) |
Time of Departure to Work by Sex in Sigurd
The most frequent times of departure to work in Sigurd are 12:00 PM to 3:59 PM (18, 16.5%) for males and 8:00 AM to 8:29 AM (25, 26.6%) for females.
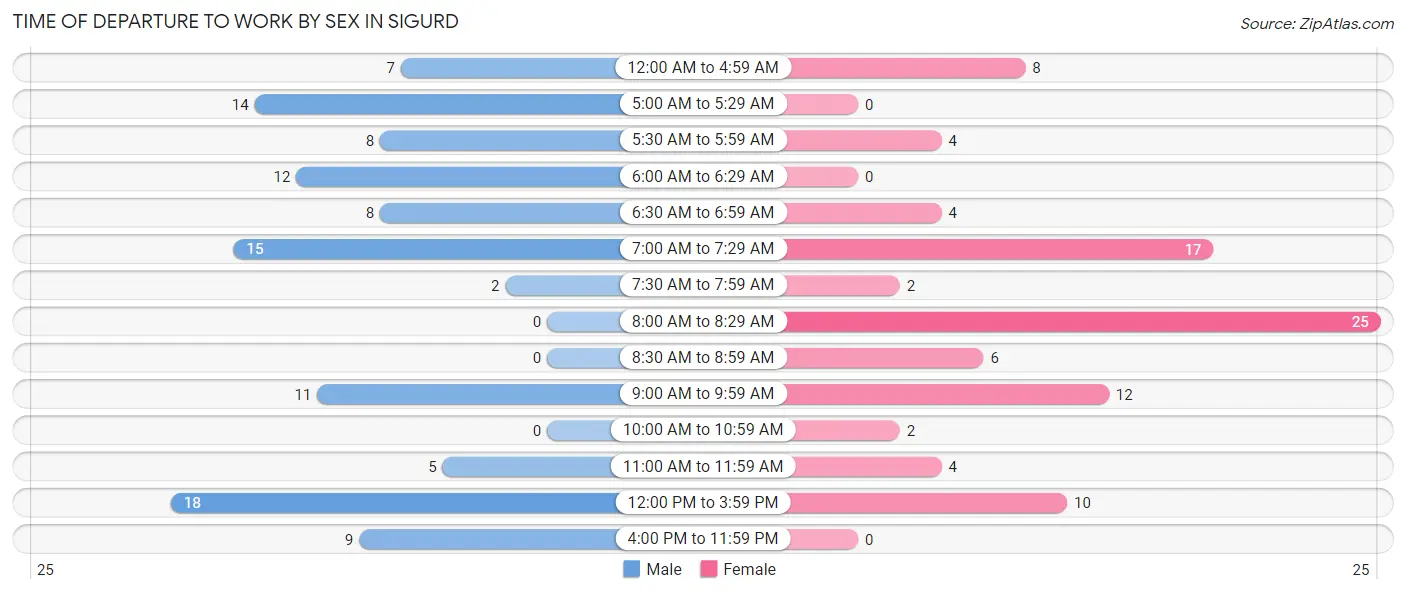
| Time of Departure | Male | Female |
| 12:00 AM to 4:59 AM | 7 (6.4%) | 8 (8.5%) |
| 5:00 AM to 5:29 AM | 14 (12.8%) | 0 (0.0%) |
| 5:30 AM to 5:59 AM | 8 (7.3%) | 4 (4.3%) |
| 6:00 AM to 6:29 AM | 12 (11.0%) | 0 (0.0%) |
| 6:30 AM to 6:59 AM | 8 (7.3%) | 4 (4.3%) |
| 7:00 AM to 7:29 AM | 15 (13.8%) | 17 (18.1%) |
| 7:30 AM to 7:59 AM | 2 (1.8%) | 2 (2.1%) |
| 8:00 AM to 8:29 AM | 0 (0.0%) | 25 (26.6%) |
| 8:30 AM to 8:59 AM | 0 (0.0%) | 6 (6.4%) |
| 9:00 AM to 9:59 AM | 11 (10.1%) | 12 (12.8%) |
| 10:00 AM to 10:59 AM | 0 (0.0%) | 2 (2.1%) |
| 11:00 AM to 11:59 AM | 5 (4.6%) | 4 (4.3%) |
| 12:00 PM to 3:59 PM | 18 (16.5%) | 10 (10.6%) |
| 4:00 PM to 11:59 PM | 9 (8.3%) | 0 (0.0%) |
| Total | 109 (100.0%) | 94 (100.0%) |
Housing Occupancy in Sigurd
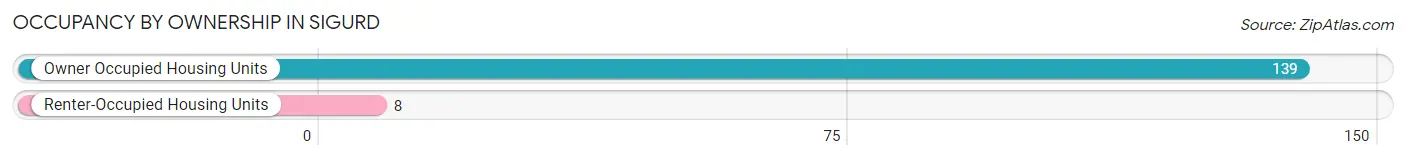
Occupancy by Ownership in Sigurd
Of the total 147 dwellings in Sigurd, owner-occupied units account for 139 (94.6%), while renter-occupied units make up 8 (5.4%).
| Occupancy | # Housing Units | % Housing Units |
| Owner Occupied Housing Units | 139 | 94.6% |
| Renter-Occupied Housing Units | 8 | 5.4% |
| Total Occupied Housing Units | 147 | 100.0% |
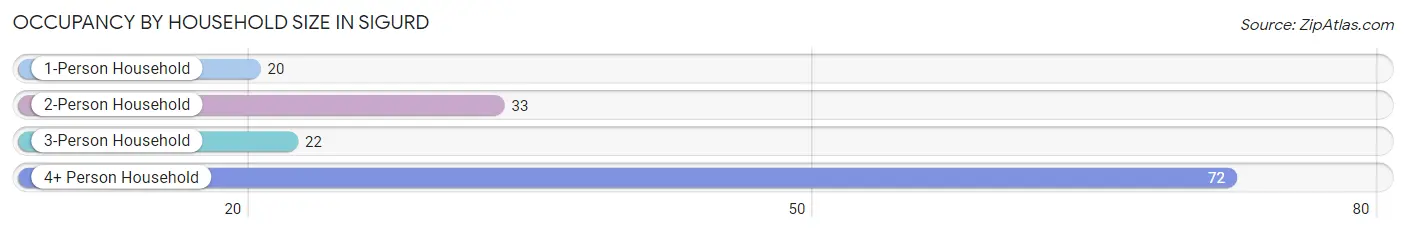
Occupancy by Household Size in Sigurd
| Household Size | # Housing Units | % Housing Units |
| 1-Person Household | 20 | 13.6% |
| 2-Person Household | 33 | 22.5% |
| 3-Person Household | 22 | 15.0% |
| 4+ Person Household | 72 | 49.0% |
| Total Housing Units | 147 | 100.0% |
Occupancy by Ownership by Household Size in Sigurd
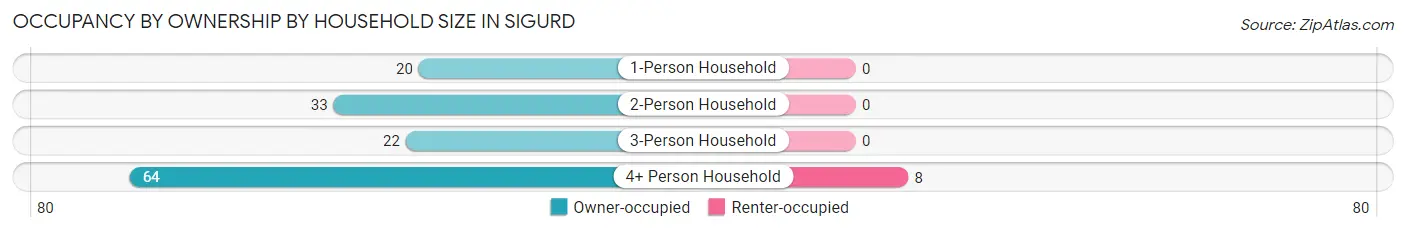
| Household Size | Owner-occupied | Renter-occupied |
| 1-Person Household | 20 (100.0%) | 0 (0.0%) |
| 2-Person Household | 33 (100.0%) | 0 (0.0%) |
| 3-Person Household | 22 (100.0%) | 0 (0.0%) |
| 4+ Person Household | 64 (88.9%) | 8 (11.1%) |
| Total Housing Units | 139 (94.6%) | 8 (5.4%) |
Occupancy by Educational Attainment in Sigurd
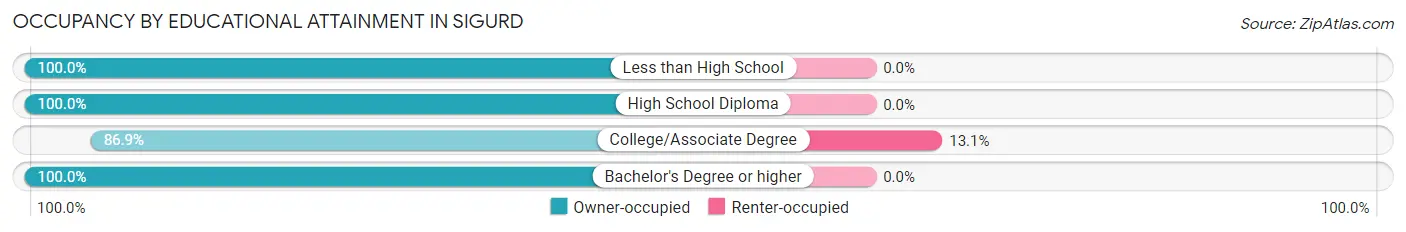
| Household Size | Owner-occupied | Renter-occupied |
| Less than High School | 19 (100.0%) | 0 (0.0%) |
| High School Diploma | 54 (100.0%) | 0 (0.0%) |
| College/Associate Degree | 53 (86.9%) | 8 (13.1%) |
| Bachelor's Degree or higher | 13 (100.0%) | 0 (0.0%) |
Occupancy by Age of Householder in Sigurd
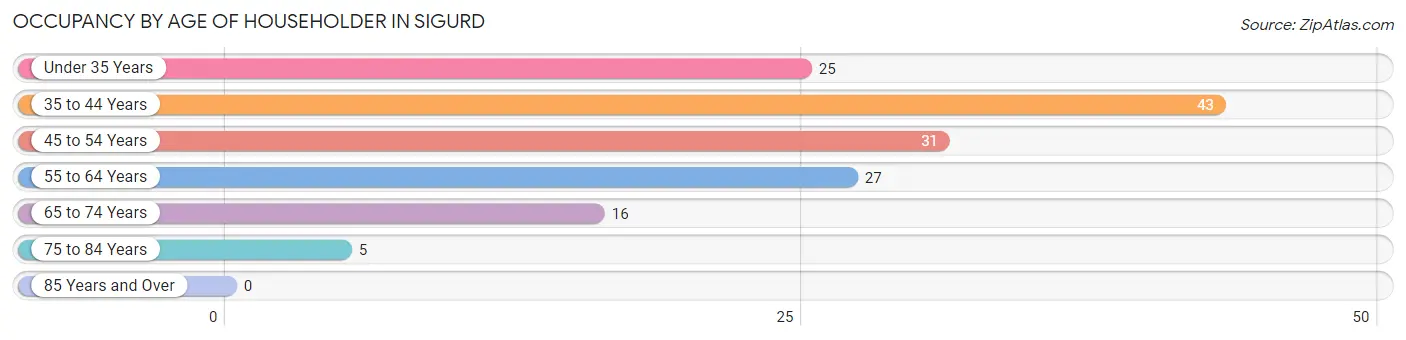
| Age Bracket | # Households | % Households |
| Under 35 Years | 25 | 17.0% |
| 35 to 44 Years | 43 | 29.2% |
| 45 to 54 Years | 31 | 21.1% |
| 55 to 64 Years | 27 | 18.4% |
| 65 to 74 Years | 16 | 10.9% |
| 75 to 84 Years | 5 | 3.4% |
| 85 Years and Over | 0 | 0.0% |
| Total | 147 | 100.0% |
Housing Finances in Sigurd
Median Income by Occupancy in Sigurd
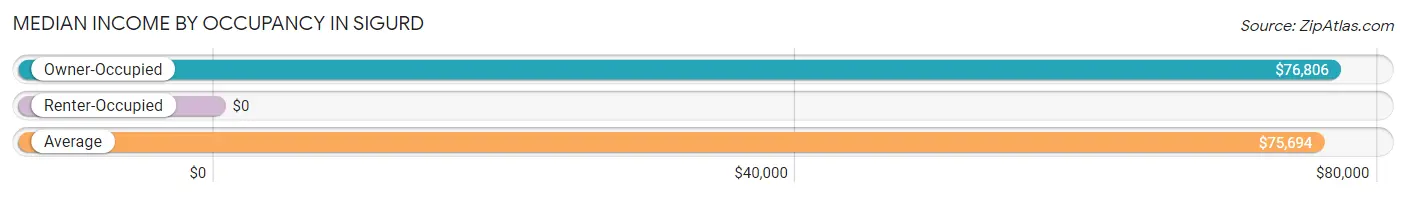
| Occupancy Type | # Households | Median Income |
| Owner-Occupied | 139 (94.6%) | $76,806 |
| Renter-Occupied | 8 (5.4%) | $0 |
| Average | 147 (100.0%) | $75,694 |
Occupancy by Householder Income Bracket in Sigurd
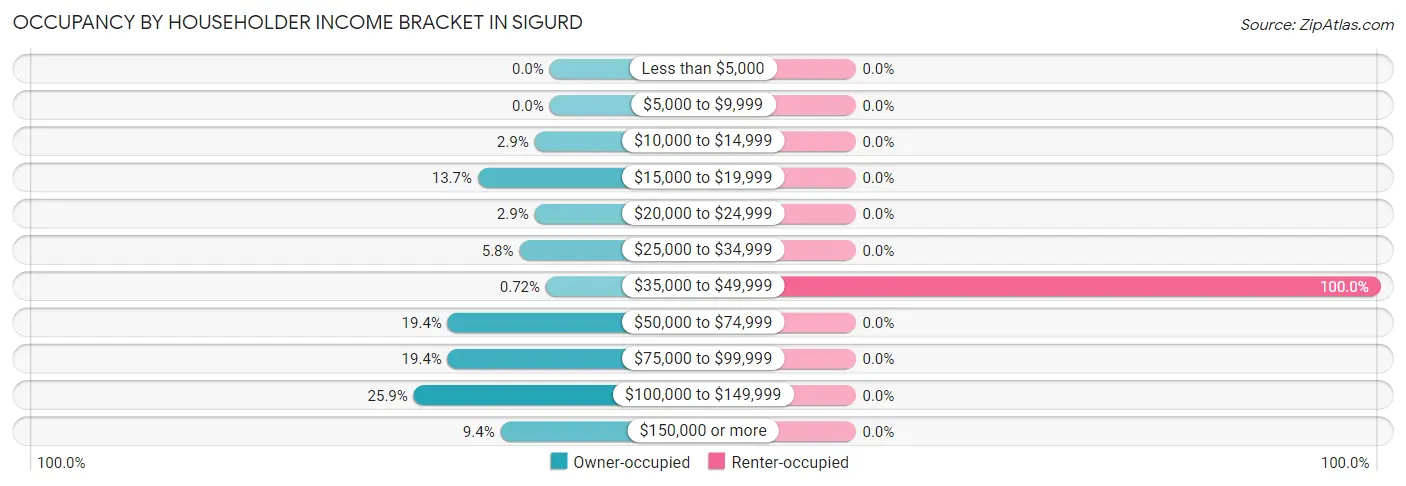
| Income Bracket | Owner-occupied | Renter-occupied |
| Less than $5,000 | 0 (0.0%) | 0 (0.0%) |
| $5,000 to $9,999 | 0 (0.0%) | 0 (0.0%) |
| $10,000 to $14,999 | 4 (2.9%) | 0 (0.0%) |
| $15,000 to $19,999 | 19 (13.7%) | 0 (0.0%) |
| $20,000 to $24,999 | 4 (2.9%) | 0 (0.0%) |
| $25,000 to $34,999 | 8 (5.8%) | 0 (0.0%) |
| $35,000 to $49,999 | 1 (0.7%) | 8 (100.0%) |
| $50,000 to $74,999 | 27 (19.4%) | 0 (0.0%) |
| $75,000 to $99,999 | 27 (19.4%) | 0 (0.0%) |
| $100,000 to $149,999 | 36 (25.9%) | 0 (0.0%) |
| $150,000 or more | 13 (9.3%) | 0 (0.0%) |
| Total | 139 (100.0%) | 8 (100.0%) |
Monthly Housing Cost Tiers in Sigurd
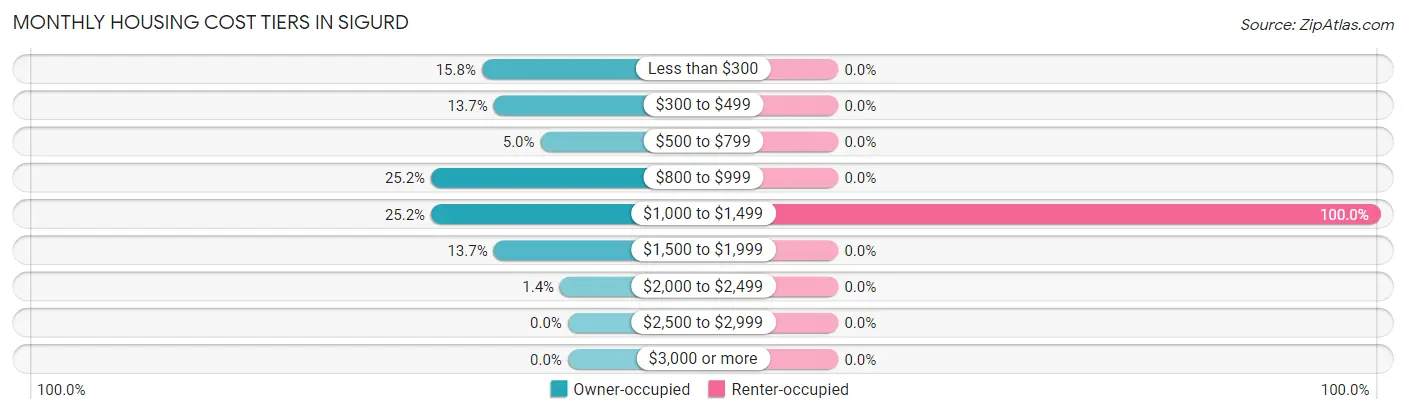
| Monthly Cost | Owner-occupied | Renter-occupied |
| Less than $300 | 22 (15.8%) | 0 (0.0%) |
| $300 to $499 | 19 (13.7%) | 0 (0.0%) |
| $500 to $799 | 7 (5.0%) | 0 (0.0%) |
| $800 to $999 | 35 (25.2%) | 0 (0.0%) |
| $1,000 to $1,499 | 35 (25.2%) | 8 (100.0%) |
| $1,500 to $1,999 | 19 (13.7%) | 0 (0.0%) |
| $2,000 to $2,499 | 2 (1.4%) | 0 (0.0%) |
| $2,500 to $2,999 | 0 (0.0%) | 0 (0.0%) |
| $3,000 or more | 0 (0.0%) | 0 (0.0%) |
| Total | 139 (100.0%) | 8 (100.0%) |
Physical Housing Characteristics in Sigurd
Housing Structures in Sigurd
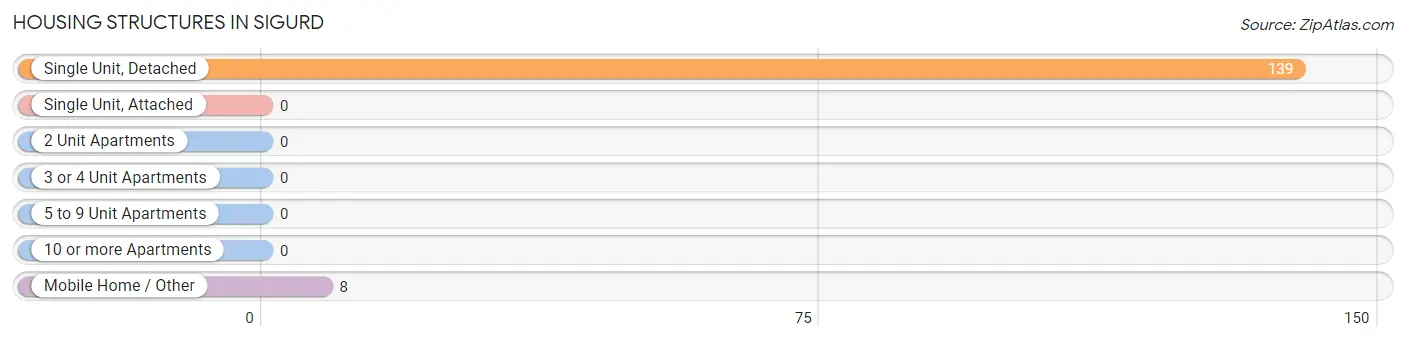
| Structure Type | # Housing Units | % Housing Units |
| Single Unit, Detached | 139 | 94.6% |
| Single Unit, Attached | 0 | 0.0% |
| 2 Unit Apartments | 0 | 0.0% |
| 3 or 4 Unit Apartments | 0 | 0.0% |
| 5 to 9 Unit Apartments | 0 | 0.0% |
| 10 or more Apartments | 0 | 0.0% |
| Mobile Home / Other | 8 | 5.4% |
| Total | 147 | 100.0% |
Housing Structures by Occupancy in Sigurd
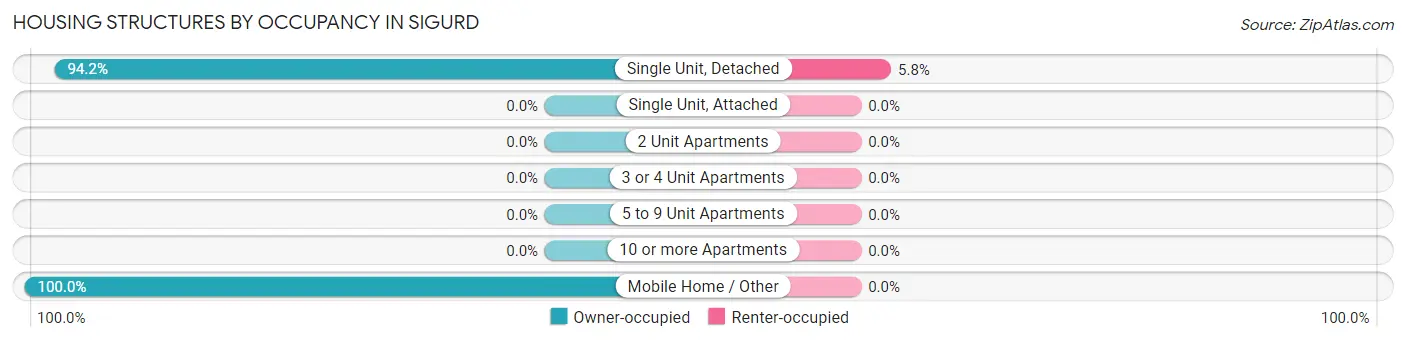
| Structure Type | Owner-occupied | Renter-occupied |
| Single Unit, Detached | 131 (94.2%) | 8 (5.8%) |
| Single Unit, Attached | 0 (0.0%) | 0 (0.0%) |
| 2 Unit Apartments | 0 (0.0%) | 0 (0.0%) |
| 3 or 4 Unit Apartments | 0 (0.0%) | 0 (0.0%) |
| 5 to 9 Unit Apartments | 0 (0.0%) | 0 (0.0%) |
| 10 or more Apartments | 0 (0.0%) | 0 (0.0%) |
| Mobile Home / Other | 8 (100.0%) | 0 (0.0%) |
| Total | 139 (94.6%) | 8 (5.4%) |
Housing Structures by Number of Rooms in Sigurd
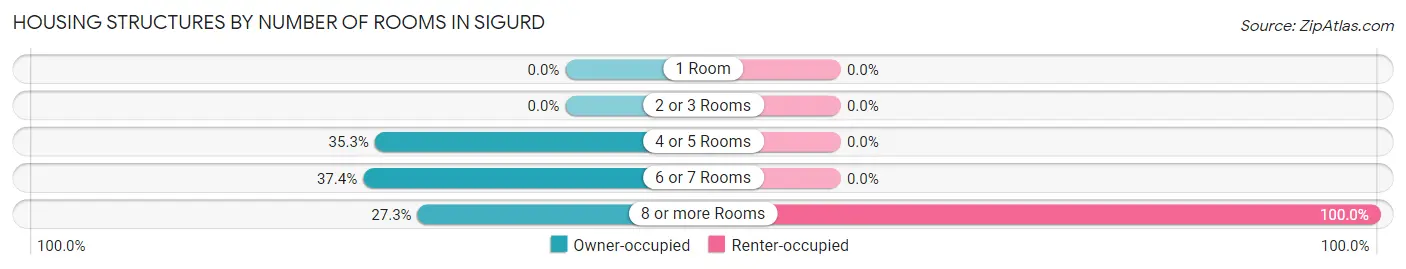
| Number of Rooms | Owner-occupied | Renter-occupied |
| 1 Room | 0 (0.0%) | 0 (0.0%) |
| 2 or 3 Rooms | 0 (0.0%) | 0 (0.0%) |
| 4 or 5 Rooms | 49 (35.2%) | 0 (0.0%) |
| 6 or 7 Rooms | 52 (37.4%) | 0 (0.0%) |
| 8 or more Rooms | 38 (27.3%) | 8 (100.0%) |
| Total | 139 (100.0%) | 8 (100.0%) |
Housing Structure by Heating Type in Sigurd
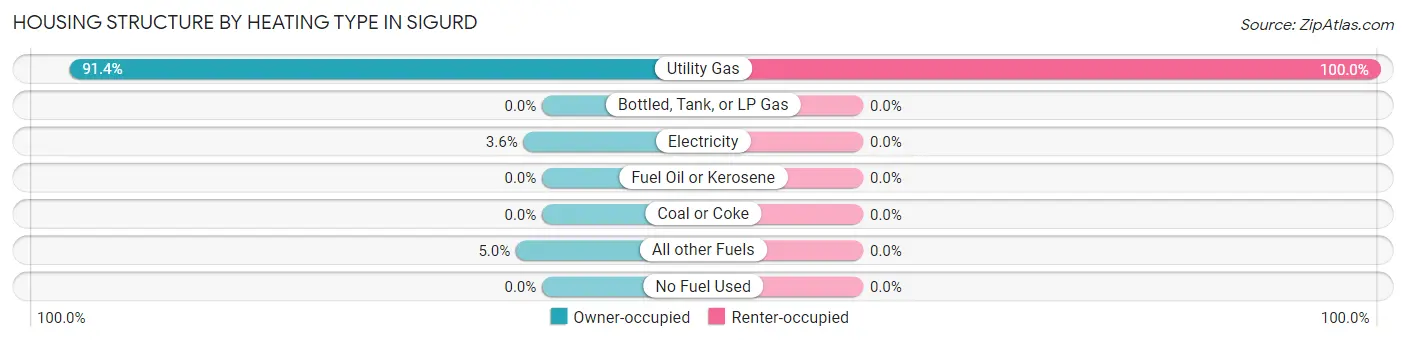
| Heating Type | Owner-occupied | Renter-occupied |
| Utility Gas | 127 (91.4%) | 8 (100.0%) |
| Bottled, Tank, or LP Gas | 0 (0.0%) | 0 (0.0%) |
| Electricity | 5 (3.6%) | 0 (0.0%) |
| Fuel Oil or Kerosene | 0 (0.0%) | 0 (0.0%) |
| Coal or Coke | 0 (0.0%) | 0 (0.0%) |
| All other Fuels | 7 (5.0%) | 0 (0.0%) |
| No Fuel Used | 0 (0.0%) | 0 (0.0%) |
| Total | 139 (100.0%) | 8 (100.0%) |
Household Vehicle Usage in Sigurd
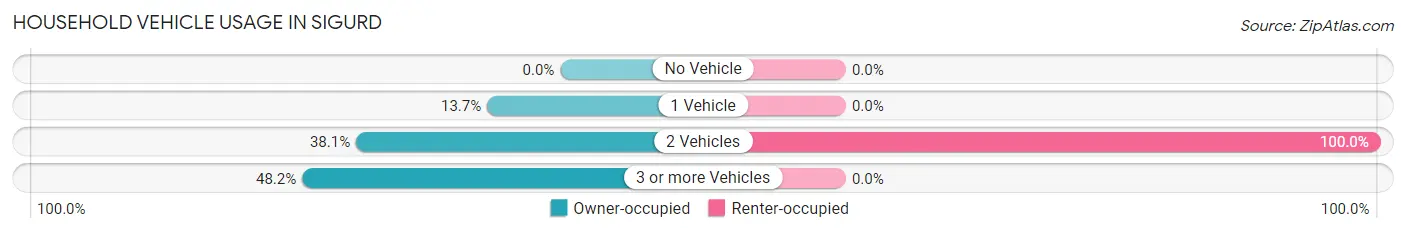
| Vehicles per Household | Owner-occupied | Renter-occupied |
| No Vehicle | 0 (0.0%) | 0 (0.0%) |
| 1 Vehicle | 19 (13.7%) | 0 (0.0%) |
| 2 Vehicles | 53 (38.1%) | 8 (100.0%) |
| 3 or more Vehicles | 67 (48.2%) | 0 (0.0%) |
| Total | 139 (100.0%) | 8 (100.0%) |
Real Estate & Mortgages in Sigurd
Real Estate and Mortgage Overview in Sigurd
| Characteristic | Without Mortgage | With Mortgage |
| Housing Units | 45 | 94 |
| Median Property Value | $202,300 | $235,700 |
| Median Household Income | - | - |
| Monthly Housing Costs | $303 | $0 |
| Real Estate Taxes | $922 | $0 |
Property Value by Mortgage Status in Sigurd
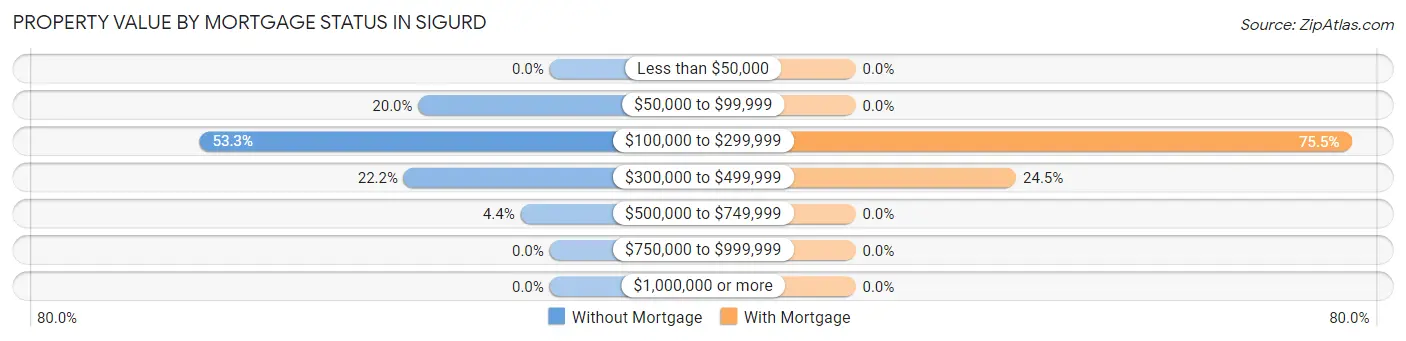
| Property Value | Without Mortgage | With Mortgage |
| Less than $50,000 | 0 (0.0%) | 0 (0.0%) |
| $50,000 to $99,999 | 9 (20.0%) | 0 (0.0%) |
| $100,000 to $299,999 | 24 (53.3%) | 71 (75.5%) |
| $300,000 to $499,999 | 10 (22.2%) | 23 (24.5%) |
| $500,000 to $749,999 | 2 (4.4%) | 0 (0.0%) |
| $750,000 to $999,999 | 0 (0.0%) | 0 (0.0%) |
| $1,000,000 or more | 0 (0.0%) | 0 (0.0%) |
| Total | 45 (100.0%) | 94 (100.0%) |
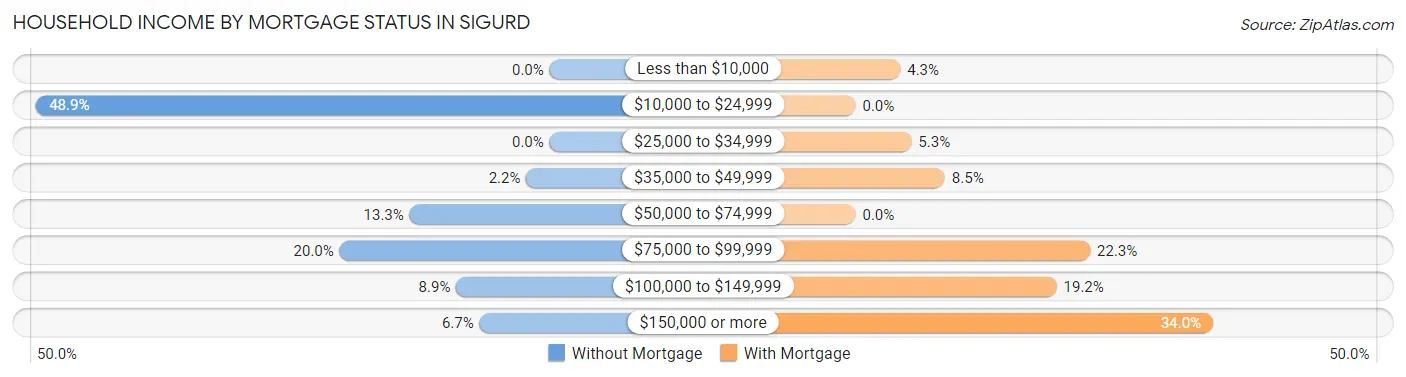
Household Income by Mortgage Status in Sigurd
| Household Income | Without Mortgage | With Mortgage |
| Less than $10,000 | 0 (0.0%) | 4 (4.3%) |
| $10,000 to $24,999 | 22 (48.9%) | 0 (0.0%) |
| $25,000 to $34,999 | 0 (0.0%) | 5 (5.3%) |
| $35,000 to $49,999 | 1 (2.2%) | 8 (8.5%) |
| $50,000 to $74,999 | 6 (13.3%) | 0 (0.0%) |
| $75,000 to $99,999 | 9 (20.0%) | 21 (22.3%) |
| $100,000 to $149,999 | 4 (8.9%) | 18 (19.2%) |
| $150,000 or more | 3 (6.7%) | 32 (34.0%) |
| Total | 45 (100.0%) | 94 (100.0%) |
Property Value to Household Income Ratio in Sigurd
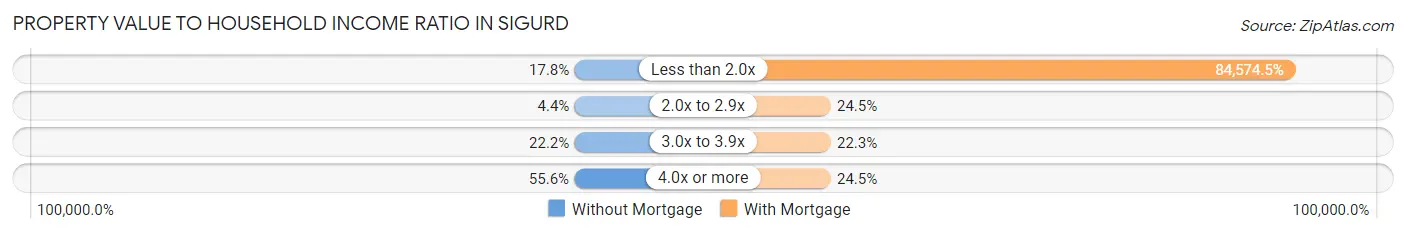
| Value-to-Income Ratio | Without Mortgage | With Mortgage |
| Less than 2.0x | 8 (17.8%) | 79,500 (84,574.5%) |
| 2.0x to 2.9x | 2 (4.4%) | 23 (24.5%) |
| 3.0x to 3.9x | 10 (22.2%) | 21 (22.3%) |
| 4.0x or more | 25 (55.6%) | 23 (24.5%) |
| Total | 45 (100.0%) | 94 (100.0%) |
Real Estate Taxes by Mortgage Status in Sigurd
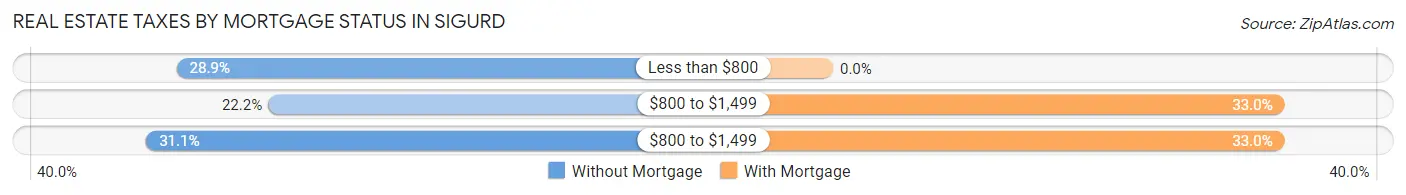
| Property Taxes | Without Mortgage | With Mortgage |
| Less than $800 | 13 (28.9%) | 0 (0.0%) |
| $800 to $1,499 | 10 (22.2%) | 31 (33.0%) |
| $800 to $1,499 | 14 (31.1%) | 31 (33.0%) |
| Total | 45 (100.0%) | 94 (100.0%) |
Health & Disability in Sigurd
Health Insurance Coverage by Age in Sigurd
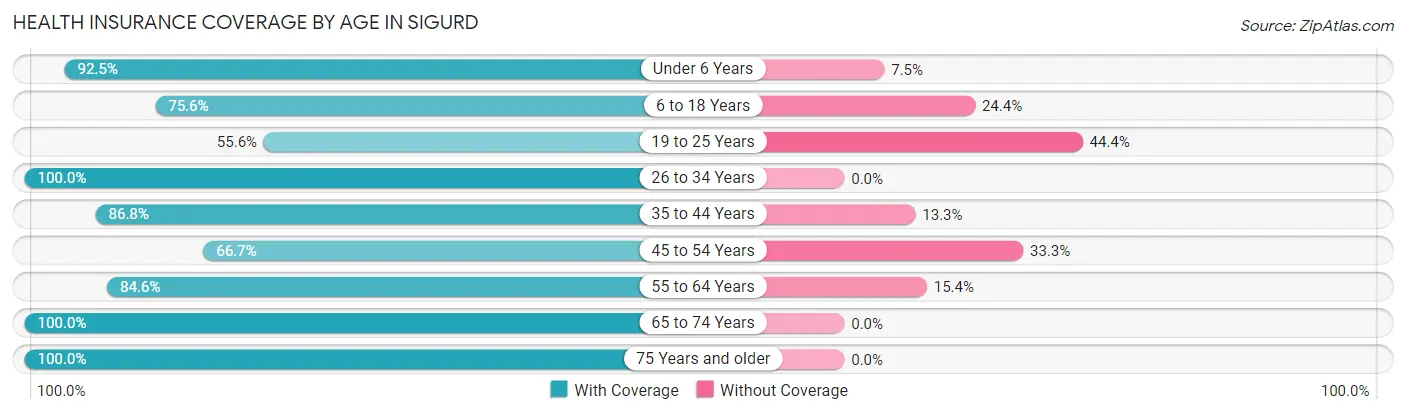
| Age Bracket | With Coverage | Without Coverage |
| Under 6 Years | 62 (92.5%) | 5 (7.5%) |
| 6 to 18 Years | 90 (75.6%) | 29 (24.4%) |
| 19 to 25 Years | 25 (55.6%) | 20 (44.4%) |
| 26 to 34 Years | 30 (100.0%) | 0 (0.0%) |
| 35 to 44 Years | 72 (86.8%) | 11 (13.3%) |
| 45 to 54 Years | 48 (66.7%) | 24 (33.3%) |
| 55 to 64 Years | 33 (84.6%) | 6 (15.4%) |
| 65 to 74 Years | 16 (100.0%) | 0 (0.0%) |
| 75 Years and older | 22 (100.0%) | 0 (0.0%) |
| Total | 398 (80.7%) | 95 (19.3%) |
Health Insurance Coverage by Citizenship Status in Sigurd
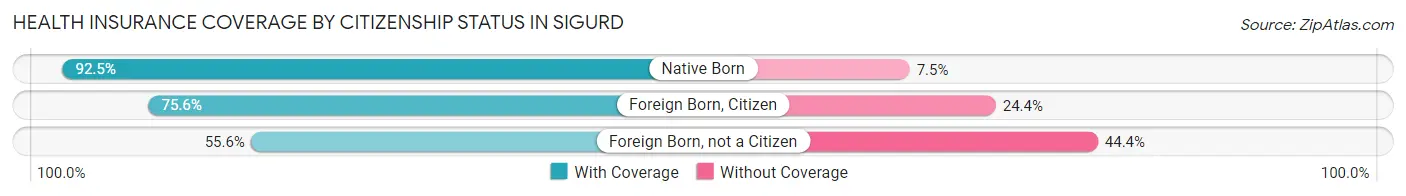
| Citizenship Status | With Coverage | Without Coverage |
| Native Born | 62 (92.5%) | 5 (7.5%) |
| Foreign Born, Citizen | 90 (75.6%) | 29 (24.4%) |
| Foreign Born, not a Citizen | 25 (55.6%) | 20 (44.4%) |
Health Insurance Coverage by Household Income in Sigurd
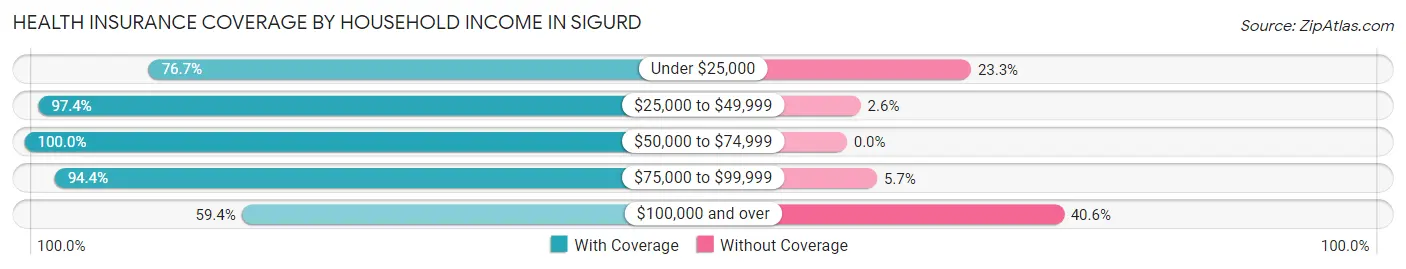
| Household Income | With Coverage | Without Coverage |
| Under $25,000 | 33 (76.7%) | 10 (23.3%) |
| $25,000 to $49,999 | 75 (97.4%) | 2 (2.6%) |
| $50,000 to $74,999 | 62 (100.0%) | 0 (0.0%) |
| $75,000 to $99,999 | 117 (94.4%) | 7 (5.7%) |
| $100,000 and over | 111 (59.4%) | 76 (40.6%) |
Public vs Private Health Insurance Coverage by Age in Sigurd
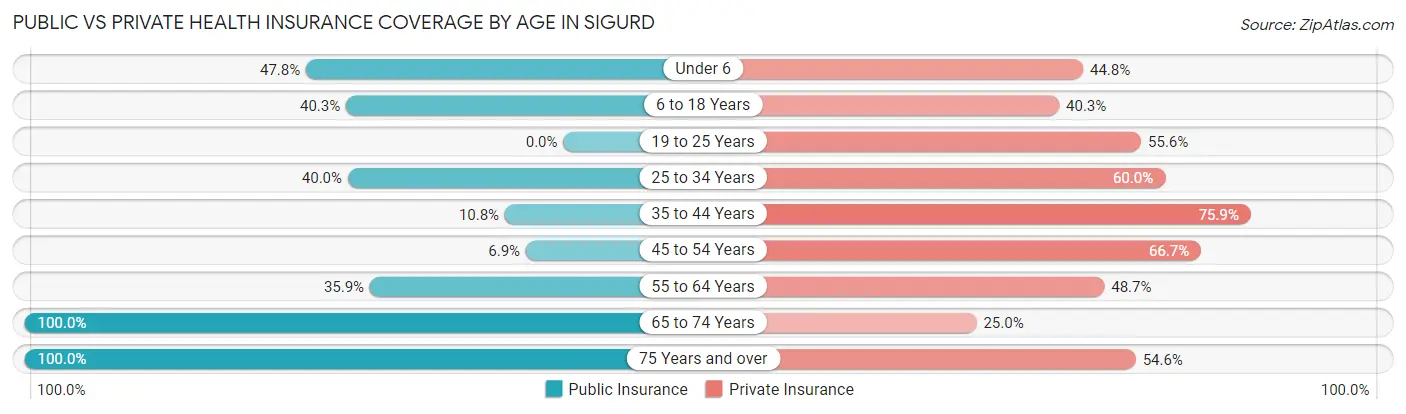
| Age Bracket | Public Insurance | Private Insurance |
| Under 6 | 32 (47.8%) | 30 (44.8%) |
| 6 to 18 Years | 48 (40.3%) | 48 (40.3%) |
| 19 to 25 Years | 0 (0.0%) | 25 (55.6%) |
| 25 to 34 Years | 12 (40.0%) | 18 (60.0%) |
| 35 to 44 Years | 9 (10.8%) | 63 (75.9%) |
| 45 to 54 Years | 5 (6.9%) | 48 (66.7%) |
| 55 to 64 Years | 14 (35.9%) | 19 (48.7%) |
| 65 to 74 Years | 16 (100.0%) | 4 (25.0%) |
| 75 Years and over | 22 (100.0%) | 12 (54.5%) |
| Total | 158 (32.1%) | 267 (54.2%) |
Disability Status by Sex by Age in Sigurd
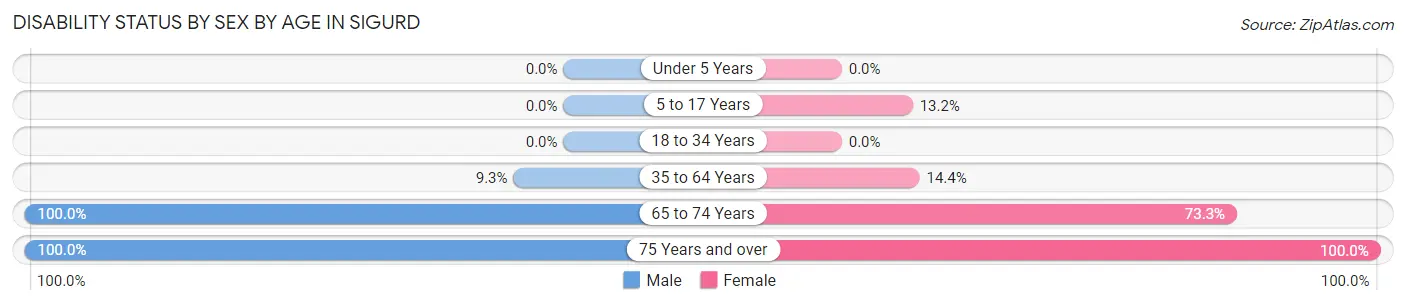
| Age Bracket | Male | Female |
| Under 5 Years | 0 (0.0%) | 0 (0.0%) |
| 5 to 17 Years | 0 (0.0%) | 5 (13.2%) |
| 18 to 34 Years | 0 (0.0%) | 0 (0.0%) |
| 35 to 64 Years | 9 (9.3%) | 14 (14.4%) |
| 65 to 74 Years | 1 (100.0%) | 11 (73.3%) |
| 75 Years and over | 15 (100.0%) | 7 (100.0%) |
Disability Class by Sex by Age in Sigurd
Disability Class: Hearing Difficulty
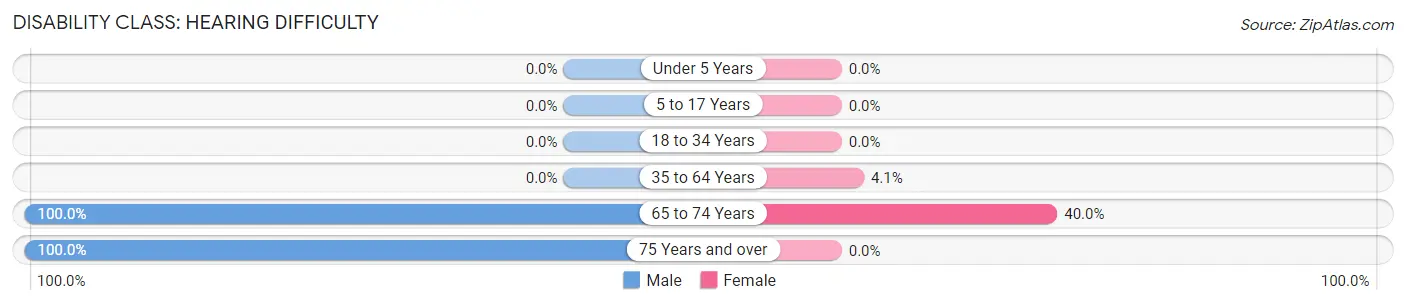
| Age Bracket | Male | Female |
| Under 5 Years | 0 (0.0%) | 0 (0.0%) |
| 5 to 17 Years | 0 (0.0%) | 0 (0.0%) |
| 18 to 34 Years | 0 (0.0%) | 0 (0.0%) |
| 35 to 64 Years | 0 (0.0%) | 4 (4.1%) |
| 65 to 74 Years | 1 (100.0%) | 6 (40.0%) |
| 75 Years and over | 15 (100.0%) | 0 (0.0%) |
Disability Class: Vision Difficulty
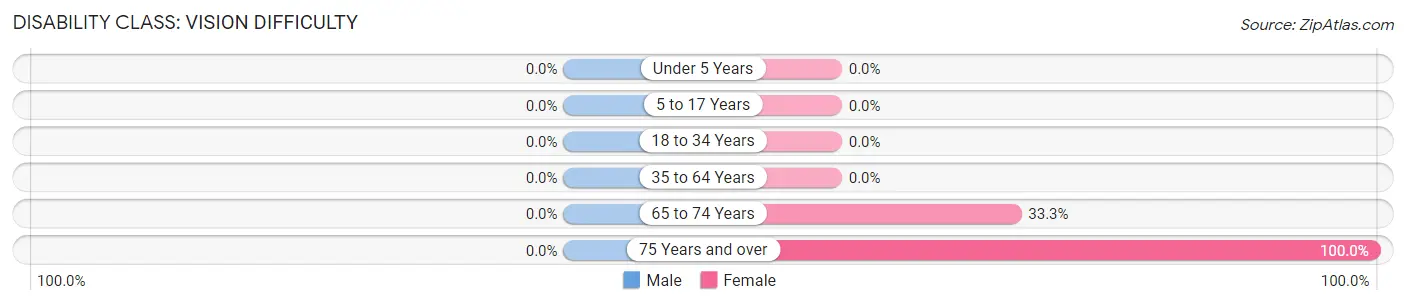
| Age Bracket | Male | Female |
| Under 5 Years | 0 (0.0%) | 0 (0.0%) |
| 5 to 17 Years | 0 (0.0%) | 0 (0.0%) |
| 18 to 34 Years | 0 (0.0%) | 0 (0.0%) |
| 35 to 64 Years | 0 (0.0%) | 0 (0.0%) |
| 65 to 74 Years | 0 (0.0%) | 5 (33.3%) |
| 75 Years and over | 0 (0.0%) | 7 (100.0%) |
Disability Class: Cognitive Difficulty
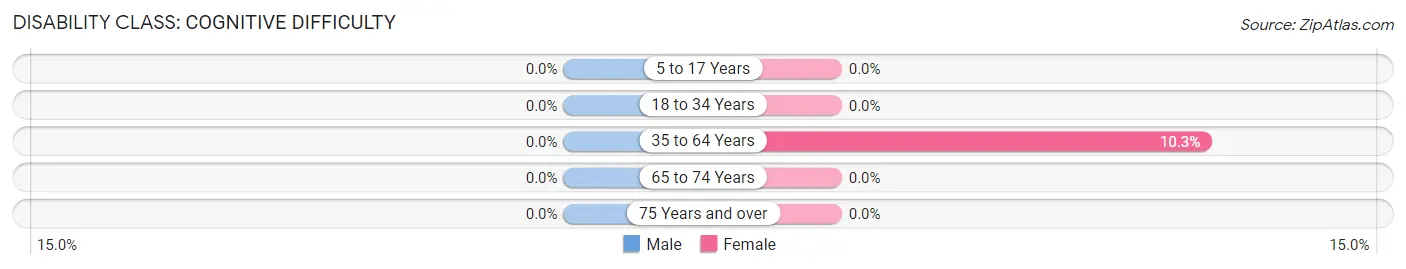
| Age Bracket | Male | Female |
| 5 to 17 Years | 0 (0.0%) | 0 (0.0%) |
| 18 to 34 Years | 0 (0.0%) | 0 (0.0%) |
| 35 to 64 Years | 0 (0.0%) | 10 (10.3%) |
| 65 to 74 Years | 0 (0.0%) | 0 (0.0%) |
| 75 Years and over | 0 (0.0%) | 0 (0.0%) |
Disability Class: Ambulatory Difficulty
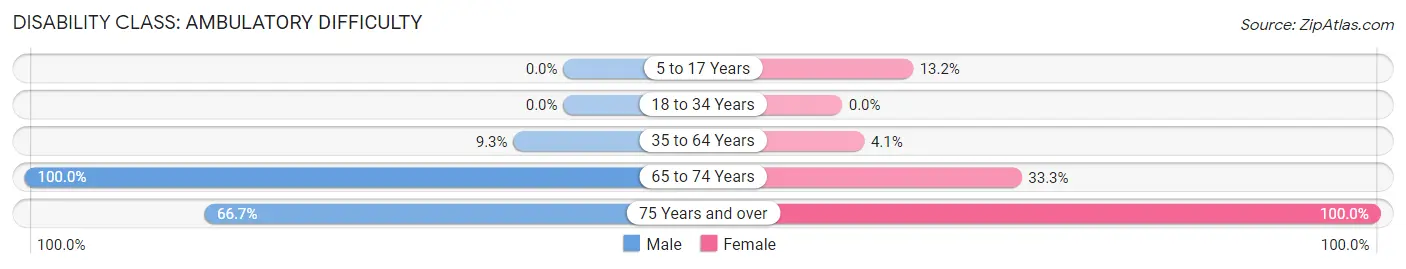
| Age Bracket | Male | Female |
| 5 to 17 Years | 0 (0.0%) | 5 (13.2%) |
| 18 to 34 Years | 0 (0.0%) | 0 (0.0%) |
| 35 to 64 Years | 9 (9.3%) | 4 (4.1%) |
| 65 to 74 Years | 1 (100.0%) | 5 (33.3%) |
| 75 Years and over | 10 (66.7%) | 7 (100.0%) |
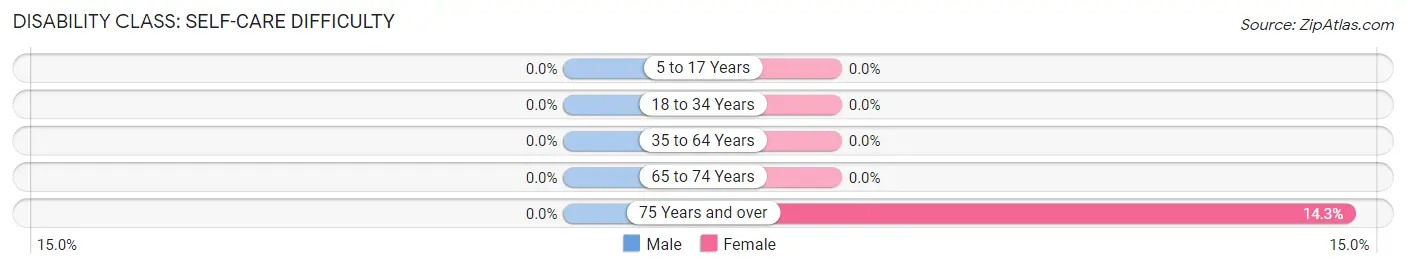
Disability Class: Self-Care Difficulty
| Age Bracket | Male | Female |
| 5 to 17 Years | 0 (0.0%) | 0 (0.0%) |
| 18 to 34 Years | 0 (0.0%) | 0 (0.0%) |
| 35 to 64 Years | 0 (0.0%) | 0 (0.0%) |
| 65 to 74 Years | 0 (0.0%) | 0 (0.0%) |
| 75 Years and over | 0 (0.0%) | 1 (14.3%) |
Technology Access in Sigurd
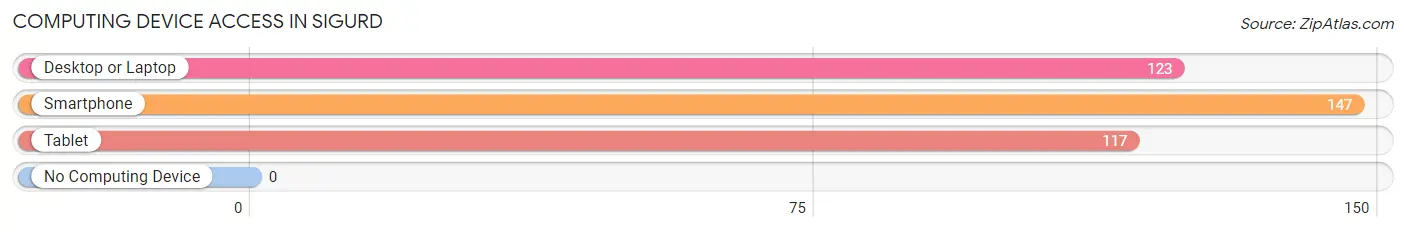
Computing Device Access in Sigurd
| Device Type | # Households | % Households |
| Desktop or Laptop | 123 | 83.7% |
| Smartphone | 147 | 100.0% |
| Tablet | 117 | 79.6% |
| No Computing Device | 0 | 0.0% |
| Total | 147 | 100.0% |
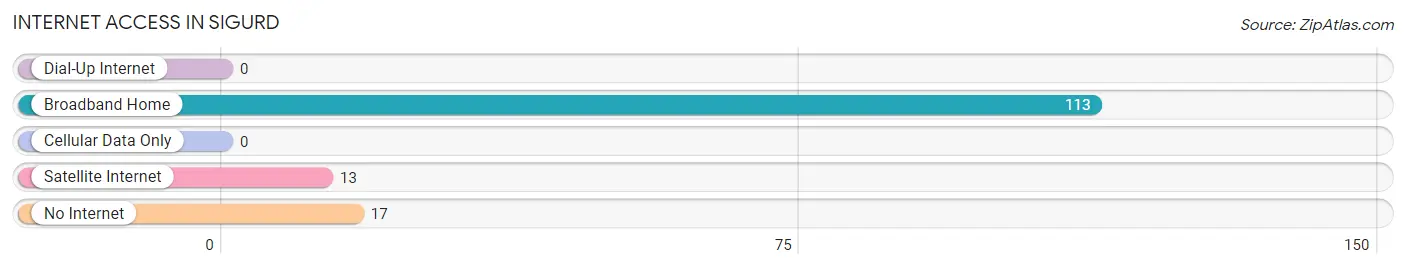
Internet Access in Sigurd
| Internet Type | # Households | % Households |
| Dial-Up Internet | 0 | 0.0% |
| Broadband Home | 113 | 76.9% |
| Cellular Data Only | 0 | 0.0% |
| Satellite Internet | 13 | 8.8% |
| No Internet | 17 | 11.6% |
| Total | 147 | 100.0% |
Sigurd Summary
Sigurd is a small city located in the state of Utah in the United States. It is located in Sevier County, about 30 miles south of the city of Richfield. The population of Sigurd was estimated to be 545 in 2019.
History
Sigurd was founded in 1891 by a group of Scandinavian immigrants. The city was named after Sigurd, a legendary hero from Norse mythology. The settlers were attracted to the area due to its fertile soil and abundant water supply. The first settlers built a small log cabin and began farming the land.
In the early 1900s, the city began to grow and develop. The first school was built in 1902 and the first church was built in 1904. The city was incorporated in 1909 and the first mayor was elected in 1910.
Geography
Sigurd is located in the Sevier Valley, which is part of the Great Basin region of the United States. The city is situated at an elevation of 5,400 feet and is surrounded by mountains. The nearest mountain range is the Wasatch Range, which is located to the east of the city.
The climate in Sigurd is semi-arid, with hot summers and cold winters. The average annual temperature is around 50 degrees Fahrenheit. The average annual precipitation is around 10 inches.
Economy
The economy of Sigurd is largely based on agriculture. The city is home to several farms and ranches, which produce a variety of crops and livestock. The city also has a small manufacturing sector, which produces a variety of products such as furniture and clothing.
The city also has a small tourism industry, which is centered around the nearby Fish Lake National Wildlife Refuge. The refuge is home to a variety of wildlife, including bald eagles, ospreys, and trumpeter swans.
Demographics
As of 2019, the population of Sigurd was estimated to be 545. The racial makeup of the city was 97.3% White, 0.7% Native American, 0.2% Asian, 0.2% from other races, and 1.6% from two or more races. The median household income was $41,250 and the median home value was $127,500.
Conclusion
Sigurd is a small city located in the state of Utah. It was founded in 1891 by a group of Scandinavian immigrants and has since grown into a small agricultural and manufacturing center. The city has a semi-arid climate and is home to a variety of wildlife. The population of Sigurd was estimated to be 545 in 2019.
Common Questions
What is Per Capita Income in Sigurd?
Per Capita income in Sigurd is $25,630.
What is the Median Family Income in Sigurd?
Median Family Income in Sigurd is $79,500.
What is the Median Household income in Sigurd?
Median Household Income in Sigurd is $75,694.
What is Income or Wage Gap in Sigurd?
Income or Wage Gap in Sigurd is 55.6%.
Women in Sigurd earn 44.4 cents for every dollar earned by a man.
What is Inequality or Gini Index in Sigurd?
Inequality or Gini Index in Sigurd is 0.35.
What is the Total Population of Sigurd?
Total Population of Sigurd is 498.
What is the Total Male Population of Sigurd?
Total Male Population of Sigurd is 277.
What is the Total Female Population of Sigurd?
Total Female Population of Sigurd is 221.
What is the Ratio of Males per 100 Females in Sigurd?
There are 125.34 Males per 100 Females in Sigurd.
What is the Ratio of Females per 100 Males in Sigurd?
There are 79.78 Females per 100 Males in Sigurd.
What is the Median Population Age in Sigurd?
Median Population Age in Sigurd is 33.2 Years.
What is the Average Family Size in Sigurd
Average Family Size in Sigurd is 3.8 People.
What is the Average Household Size in Sigurd
Average Household Size in Sigurd is 3.4 People.
How Large is the Labor Force in Sigurd?
There are 246 People in the Labor Forcein in Sigurd.
What is the Percentage of People in the Labor Force in Sigurd?
70.3% of People are in the Labor Force in Sigurd.
What is the Unemployment Rate in Sigurd?
Unemployment Rate in Sigurd is 5.4%.