Interlaken, UT Map & Demographics
Interlaken Map
Interlaken Overview
$95,805
PER CAPITA INCOME
$161,250
AVG FAMILY INCOME
$131,250
AVG HOUSEHOLD INCOME
0.45
INEQUALITY / GINI INDEX
84
TOTAL POPULATION
46
MALE POPULATION
38
FEMALE POPULATION
121.05
MALES / 100 FEMALES
82.61
FEMALES / 100 MALES
62.0
MEDIAN AGE
1.9
AVG FAMILY SIZE
1.6
AVG HOUSEHOLD SIZE
55
LABOR FORCE [ PEOPLE ]
65.5%
PERCENT IN LABOR FORCE
Income in Interlaken
Income Overview in Interlaken
Per Capita Income in Interlaken is $95,805, while median incomes of families and households are $161,250 and $131,250 respectively.
| Characteristic | Number | Measure |
| Per Capita Income | 84 | $95,805 |
| Median Family Income | 34 | $161,250 |
| Mean Family Income | 34 | $215,591 |
| Median Household Income | 52 | $131,250 |
| Mean Household Income | 52 | $156,865 |
| Income Deficit | 34 | $0 |
| Wage / Income Gap (%) | 84 | 0.00% |
| Wage / Income Gap ($) | 84 | 100.00¢ per $1 |
| Gini / Inequality Index | 84 | 0.45 |
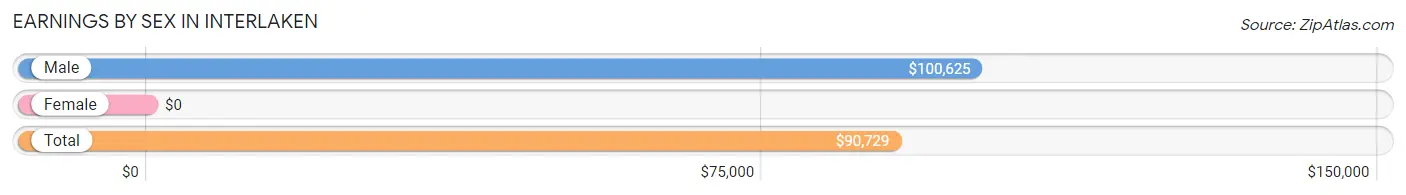
Earnings by Sex in Interlaken
| Sex | Number | Average Earnings |
| Male | 26 (47.3%) | $100,625 |
| Female | 29 (52.7%) | $0 |
| Total | 55 (100.0%) | $90,729 |
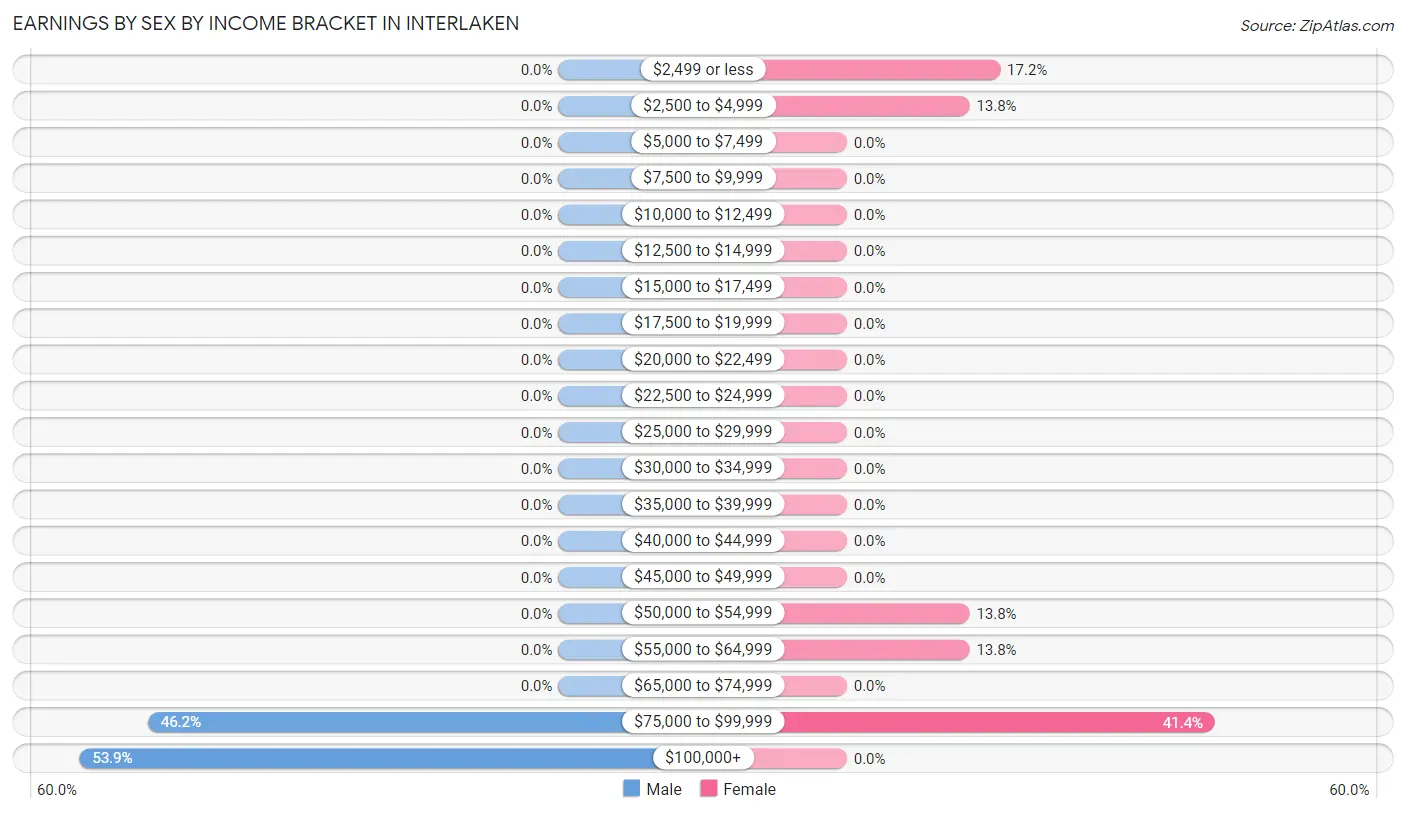
Earnings by Sex by Income Bracket in Interlaken
The most common earnings brackets in Interlaken are $100,000+ for men (14 | 53.8%) and $75,000 to $99,999 for women (12 | 41.4%).
| Income | Male | Female |
| $2,499 or less | 0 (0.0%) | 5 (17.2%) |
| $2,500 to $4,999 | 0 (0.0%) | 4 (13.8%) |
| $5,000 to $7,499 | 0 (0.0%) | 0 (0.0%) |
| $7,500 to $9,999 | 0 (0.0%) | 0 (0.0%) |
| $10,000 to $12,499 | 0 (0.0%) | 0 (0.0%) |
| $12,500 to $14,999 | 0 (0.0%) | 0 (0.0%) |
| $15,000 to $17,499 | 0 (0.0%) | 0 (0.0%) |
| $17,500 to $19,999 | 0 (0.0%) | 0 (0.0%) |
| $20,000 to $22,499 | 0 (0.0%) | 0 (0.0%) |
| $22,500 to $24,999 | 0 (0.0%) | 0 (0.0%) |
| $25,000 to $29,999 | 0 (0.0%) | 0 (0.0%) |
| $30,000 to $34,999 | 0 (0.0%) | 0 (0.0%) |
| $35,000 to $39,999 | 0 (0.0%) | 0 (0.0%) |
| $40,000 to $44,999 | 0 (0.0%) | 0 (0.0%) |
| $45,000 to $49,999 | 0 (0.0%) | 0 (0.0%) |
| $50,000 to $54,999 | 0 (0.0%) | 4 (13.8%) |
| $55,000 to $64,999 | 0 (0.0%) | 4 (13.8%) |
| $65,000 to $74,999 | 0 (0.0%) | 0 (0.0%) |
| $75,000 to $99,999 | 12 (46.2%) | 12 (41.4%) |
| $100,000+ | 14 (53.8%) | 0 (0.0%) |
| Total | 26 (100.0%) | 29 (100.0%) |
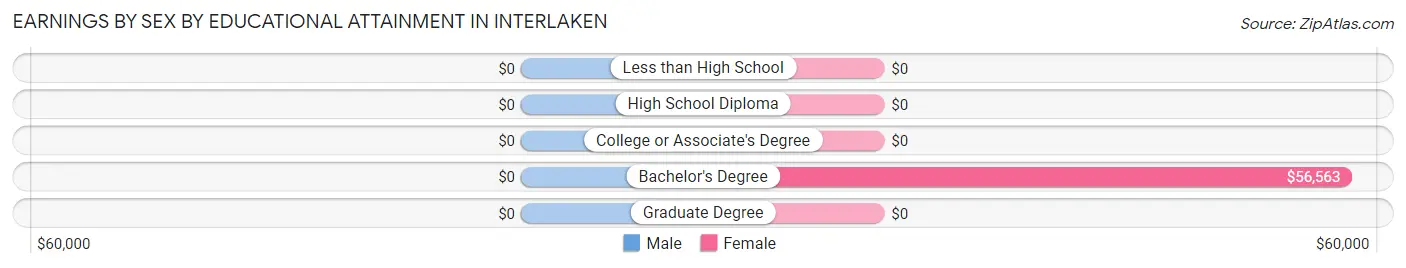
Earnings by Sex by Educational Attainment in Interlaken
| Educational Attainment | Male Income | Female Income |
| Less than High School | - | - |
| High School Diploma | - | - |
| College or Associate's Degree | - | - |
| Bachelor's Degree | - | - |
| Graduate Degree | - | - |
| Total | $100,625 | $0 |
Family Income in Interlaken
Family Income Brackets in Interlaken
According to the Interlaken family income data, there are 11 families falling into the $100,000 to $149,999 income range, which is the most common income bracket and makes up 32.4% of all families.
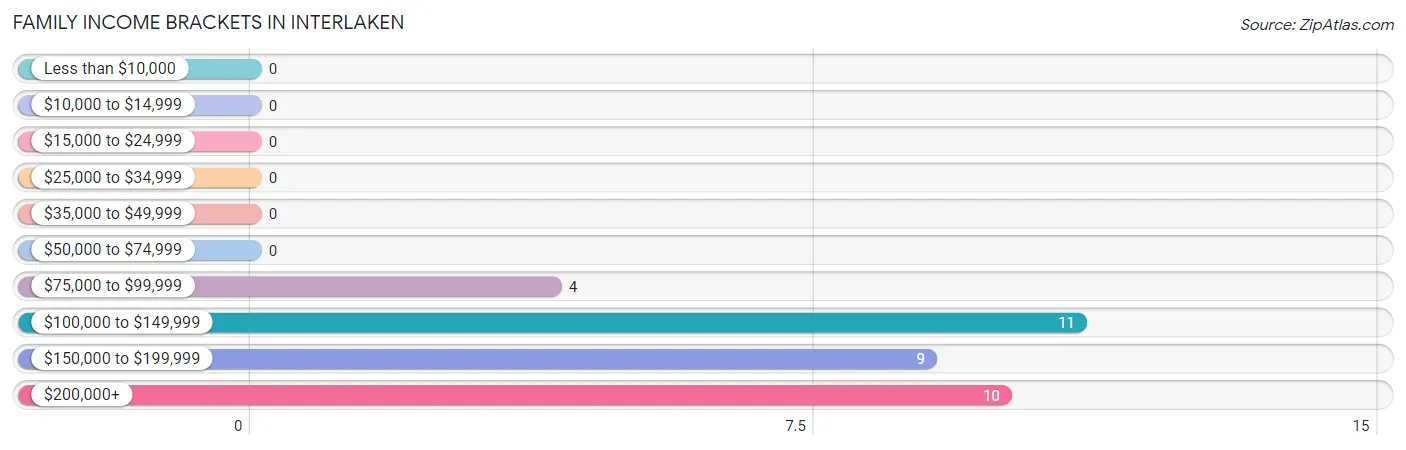
| Income Bracket | # Families | % Families |
| Less than $10,000 | 0 | 0.0% |
| $10,000 to $14,999 | 0 | 0.0% |
| $15,000 to $24,999 | 0 | 0.0% |
| $25,000 to $34,999 | 0 | 0.0% |
| $35,000 to $49,999 | 0 | 0.0% |
| $50,000 to $74,999 | 0 | 0.0% |
| $75,000 to $99,999 | 4 | 11.8% |
| $100,000 to $149,999 | 11 | 32.4% |
| $150,000 to $199,999 | 9 | 26.5% |
| $200,000+ | 10 | 29.4% |
Family Income by Famaliy Size in Interlaken
2-person families (34 | 100.0%) account for the highest median family income in Interlaken with $161,250 per family, while 2-person families (34 | 100.0%) have the highest median income of $80,625 per family member.
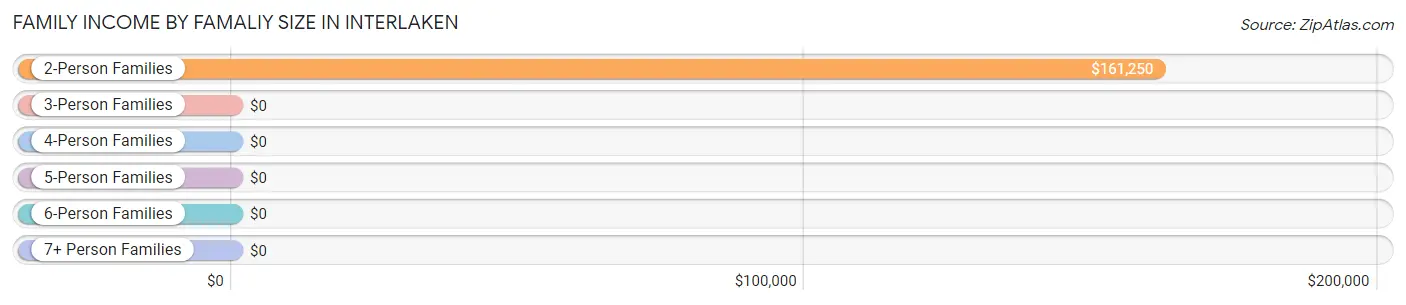
| Income Bracket | # Families | Median Income |
| 2-Person Families | 34 (100.0%) | $161,250 |
| 3-Person Families | 0 (0.0%) | $0 |
| 4-Person Families | 0 (0.0%) | $0 |
| 5-Person Families | 0 (0.0%) | $0 |
| 6-Person Families | 0 (0.0%) | $0 |
| 7+ Person Families | 0 (0.0%) | $0 |
| Total | 34 (100.0%) | $161,250 |
Family Income by Number of Earners in Interlaken
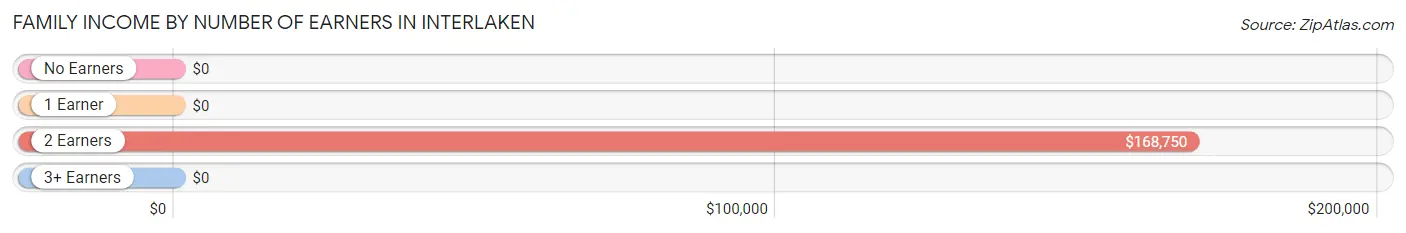
| Number of Earners | # Families | Median Income |
| No Earners | 4 (11.8%) | $0 |
| 1 Earner | 8 (23.5%) | $0 |
| 2 Earners | 22 (64.7%) | $168,750 |
| 3+ Earners | 0 (0.0%) | $0 |
| Total | 34 (100.0%) | $161,250 |
Household Income in Interlaken
Household Income Brackets in Interlaken
With 15 households falling in the category, the $100,000 to $149,999 income range is the most frequent in Interlaken, accounting for 28.8% of all households.
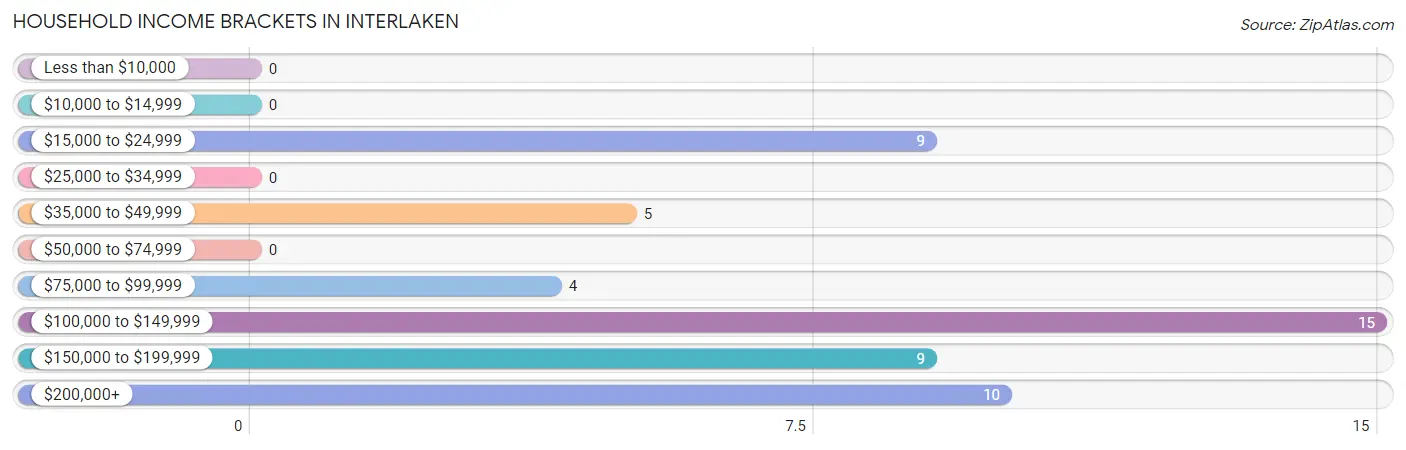
| Income Bracket | # Households | % Households |
| Less than $10,000 | 0 | 0.0% |
| $10,000 to $14,999 | 0 | 0.0% |
| $15,000 to $24,999 | 9 | 17.3% |
| $25,000 to $34,999 | 0 | 0.0% |
| $35,000 to $49,999 | 5 | 9.6% |
| $50,000 to $74,999 | 0 | 0.0% |
| $75,000 to $99,999 | 4 | 7.7% |
| $100,000 to $149,999 | 15 | 28.8% |
| $150,000 to $199,999 | 9 | 17.3% |
| $200,000+ | 10 | 19.2% |
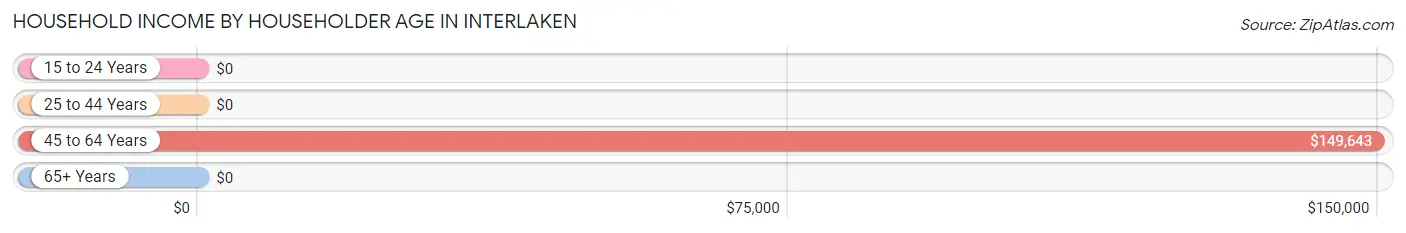
Household Income by Householder Age in Interlaken
The median household income in Interlaken is $131,250, with the highest median household income of $149,643 found in the 45 to 64 years age bracket for the primary householder. A total of 20 households (38.5%) fall into this category.
| Income Bracket | # Households | Median Income |
| 15 to 24 Years | 0 (0.0%) | $0 |
| 25 to 44 Years | 6 (11.5%) | $0 |
| 45 to 64 Years | 20 (38.5%) | $149,643 |
| 65+ Years | 26 (50.0%) | $0 |
| Total | 52 (100.0%) | $131,250 |
Poverty in Interlaken
Income Below Poverty by Sex and Age in Interlaken
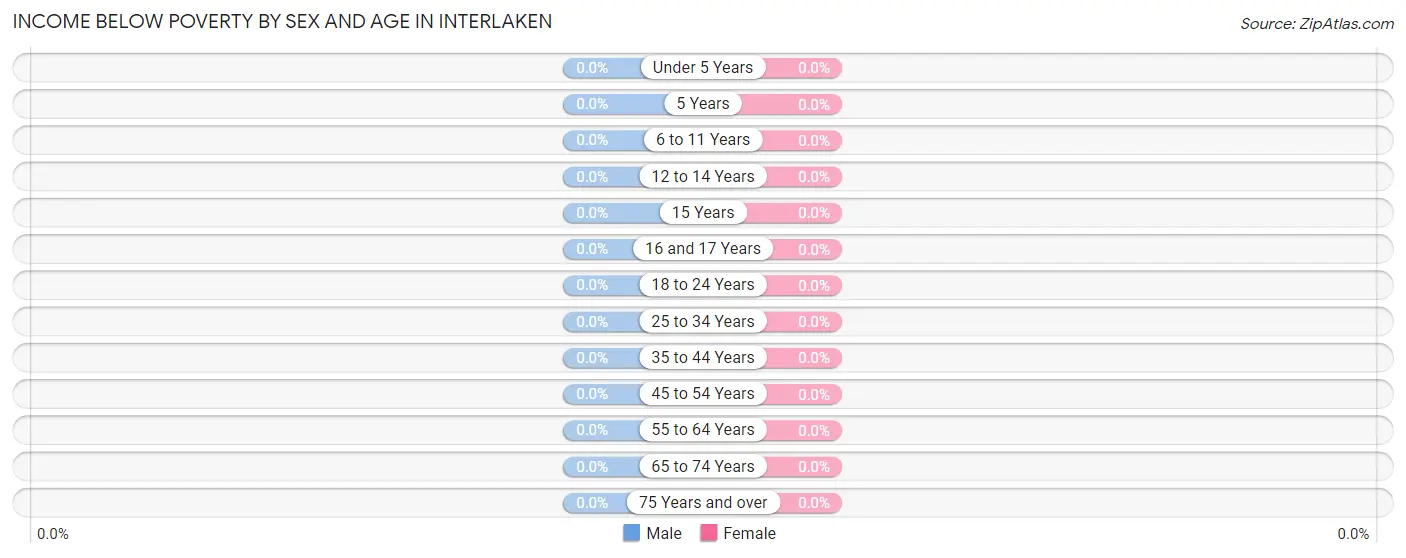
| Age Bracket | Male | Female |
| Under 5 Years | 0 (0.0%) | 0 (0.0%) |
| 5 Years | 0 (0.0%) | 0 (0.0%) |
| 6 to 11 Years | 0 (0.0%) | 0 (0.0%) |
| 12 to 14 Years | 0 (0.0%) | 0 (0.0%) |
| 15 Years | 0 (0.0%) | 0 (0.0%) |
| 16 and 17 Years | 0 (0.0%) | 0 (0.0%) |
| 18 to 24 Years | 0 (0.0%) | 0 (0.0%) |
| 25 to 34 Years | 0 (0.0%) | 0 (0.0%) |
| 35 to 44 Years | 0 (0.0%) | 0 (0.0%) |
| 45 to 54 Years | 0 (0.0%) | 0 (0.0%) |
| 55 to 64 Years | 0 (0.0%) | 0 (0.0%) |
| 65 to 74 Years | 0 (0.0%) | 0 (0.0%) |
| 75 Years and over | 0 (0.0%) | 0 (0.0%) |
| Total | 0 (0.0%) | 0 (0.0%) |
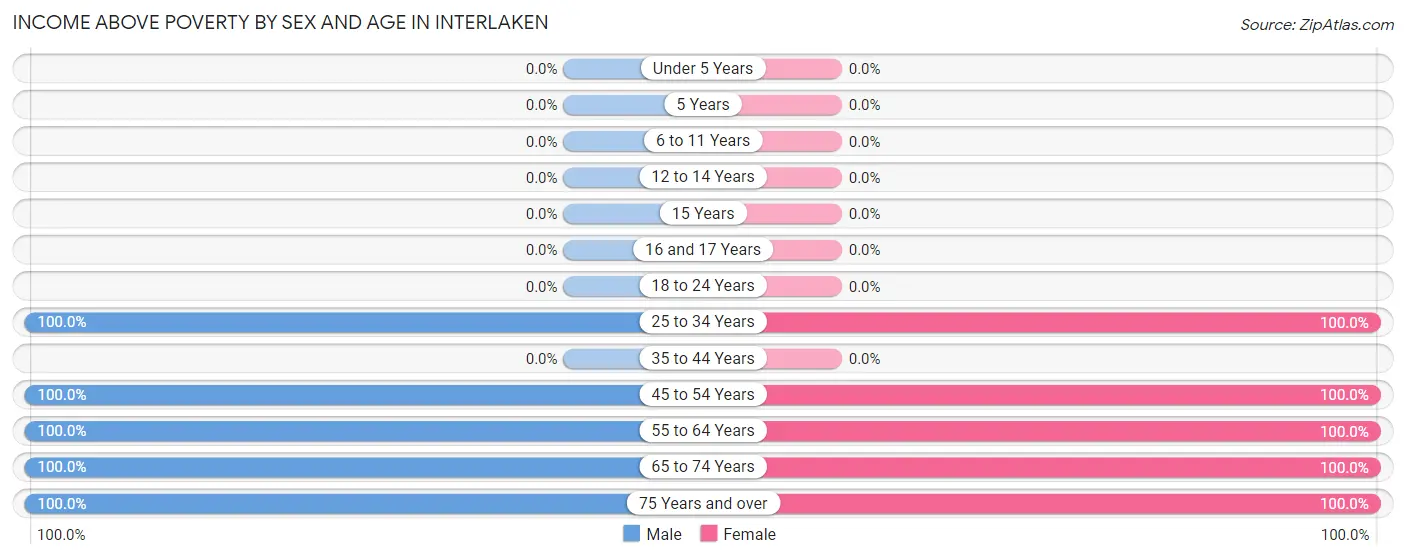
Income Above Poverty by Sex and Age in Interlaken
According to the poverty statistics in Interlaken, males aged 25 to 34 years and females aged 25 to 34 years are the age groups that are most secure financially, with 100.0% of males and 100.0% of females in these age groups living above the poverty line.
| Age Bracket | Male | Female |
| Under 5 Years | 0 (0.0%) | 0 (0.0%) |
| 5 Years | 0 (0.0%) | 0 (0.0%) |
| 6 to 11 Years | 0 (0.0%) | 0 (0.0%) |
| 12 to 14 Years | 0 (0.0%) | 0 (0.0%) |
| 15 Years | 0 (0.0%) | 0 (0.0%) |
| 16 and 17 Years | 0 (0.0%) | 0 (0.0%) |
| 18 to 24 Years | 0 (0.0%) | 0 (0.0%) |
| 25 to 34 Years | 6 (100.0%) | 5 (100.0%) |
| 35 to 44 Years | 0 (0.0%) | 0 (0.0%) |
| 45 to 54 Years | 9 (100.0%) | 7 (100.0%) |
| 55 to 64 Years | 11 (100.0%) | 8 (100.0%) |
| 65 to 74 Years | 9 (100.0%) | 14 (100.0%) |
| 75 Years and over | 11 (100.0%) | 4 (100.0%) |
| Total | 46 (100.0%) | 38 (100.0%) |
Income Below Poverty Among Married-Couple Families in Interlaken
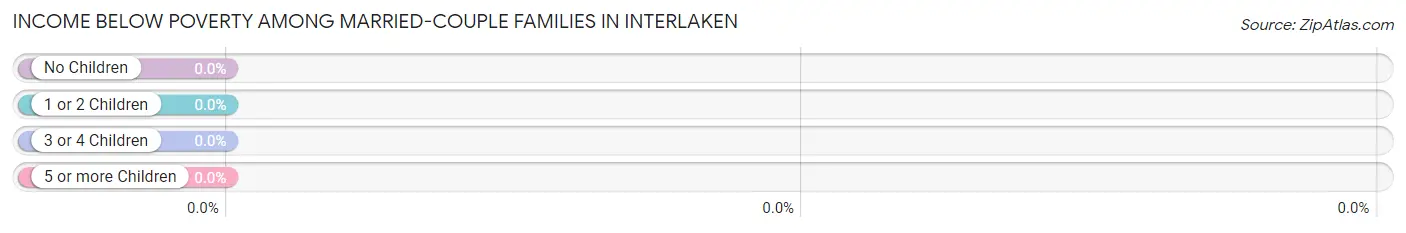
| Children | Above Poverty | Below Poverty |
| No Children | 34 (100.0%) | 0 (0.0%) |
| 1 or 2 Children | 0 (0.0%) | 0 (0.0%) |
| 3 or 4 Children | 0 (0.0%) | 0 (0.0%) |
| 5 or more Children | 0 (0.0%) | 0 (0.0%) |
| Total | 34 (100.0%) | 0 (0.0%) |
Income Below Poverty Among Single-Parent Households in Interlaken
| Children | Single Father | Single Mother |
| No Children | 0 (0.0%) | 0 (0.0%) |
| 1 or 2 Children | 0 (0.0%) | 0 (0.0%) |
| 3 or 4 Children | 0 (0.0%) | 0 (0.0%) |
| 5 or more Children | 0 (0.0%) | 0 (0.0%) |
| Total | 0 (0.0%) | 0 (0.0%) |
Income Below Poverty Among Married-Couple vs Single-Parent Households in Interlaken
| Children | Married-Couple Families | Single-Parent Households |
| No Children | 0 (0.0%) | 0 (0.0%) |
| 1 or 2 Children | 0 (0.0%) | 0 (0.0%) |
| 3 or 4 Children | 0 (0.0%) | 0 (0.0%) |
| 5 or more Children | 0 (0.0%) | 0 (0.0%) |
| Total | 0 (0.0%) | 0 (0.0%) |
Race in Interlaken
The most populous races in Interlaken are White / Caucasian (77 | 91.7%), and Asian (7 | 8.3%).
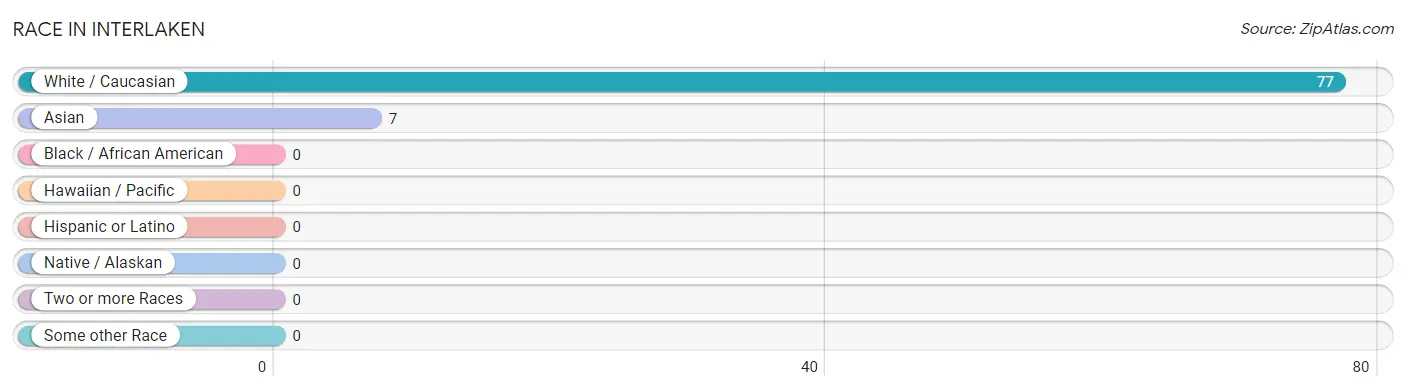
| Race | # Population | % Population |
| Asian | 7 | 8.3% |
| Black / African American | 0 | 0.0% |
| Hawaiian / Pacific | 0 | 0.0% |
| Hispanic or Latino | 0 | 0.0% |
| Native / Alaskan | 0 | 0.0% |
| White / Caucasian | 77 | 91.7% |
| Two or more Races | 0 | 0.0% |
| Some other Race | 0 | 0.0% |
| Total | 84 | 100.0% |
Ancestry in Interlaken
The most populous ancestries reported in Interlaken are English (31 | 36.9%), German (30 | 35.7%), Irish (19 | 22.6%), Belgian (7 | 8.3%), and Laotian (7 | 8.3%), together accounting for 111.9% of all Interlaken residents.
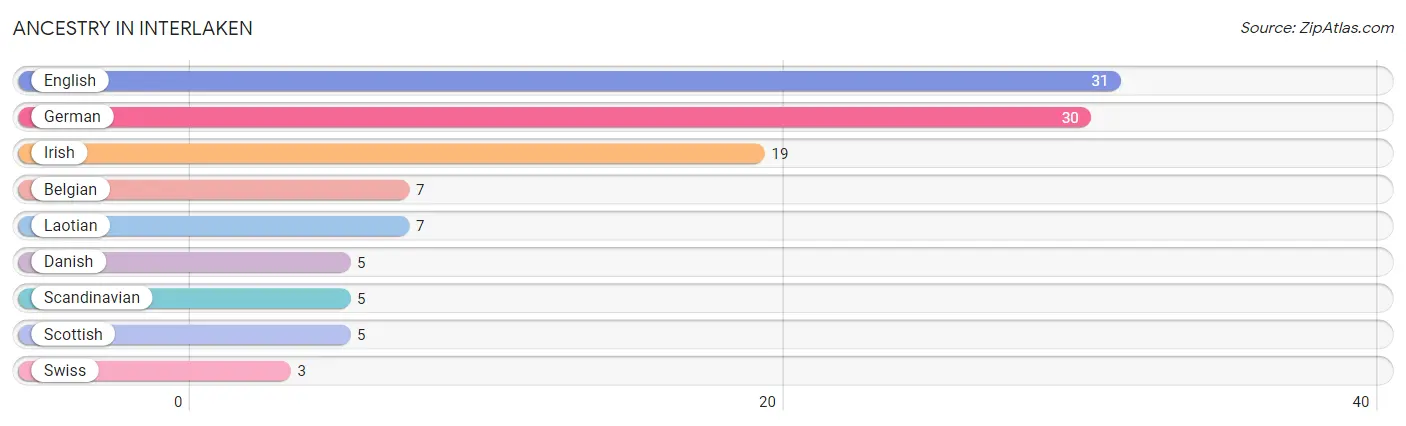
| Ancestry | # Population | % Population |
| Belgian | 7 | 8.3% |
| Danish | 5 | 5.9% |
| English | 31 | 36.9% |
| German | 30 | 35.7% |
| Irish | 19 | 22.6% |
| Laotian | 7 | 8.3% |
| Scandinavian | 5 | 5.9% |
| Scottish | 5 | 5.9% |
| Swiss | 3 | 3.6% | View All 9 Rows |
Immigrants in Interlaken

| Immigration Origin | # Population | % Population | View All 0 Rows |
Sex and Age in Interlaken
Sex and Age in Interlaken
The most populous age groups in Interlaken are 75 to 79 Years (8 | 17.4%) for men and 65 to 69 Years (9 | 23.7%) for women.
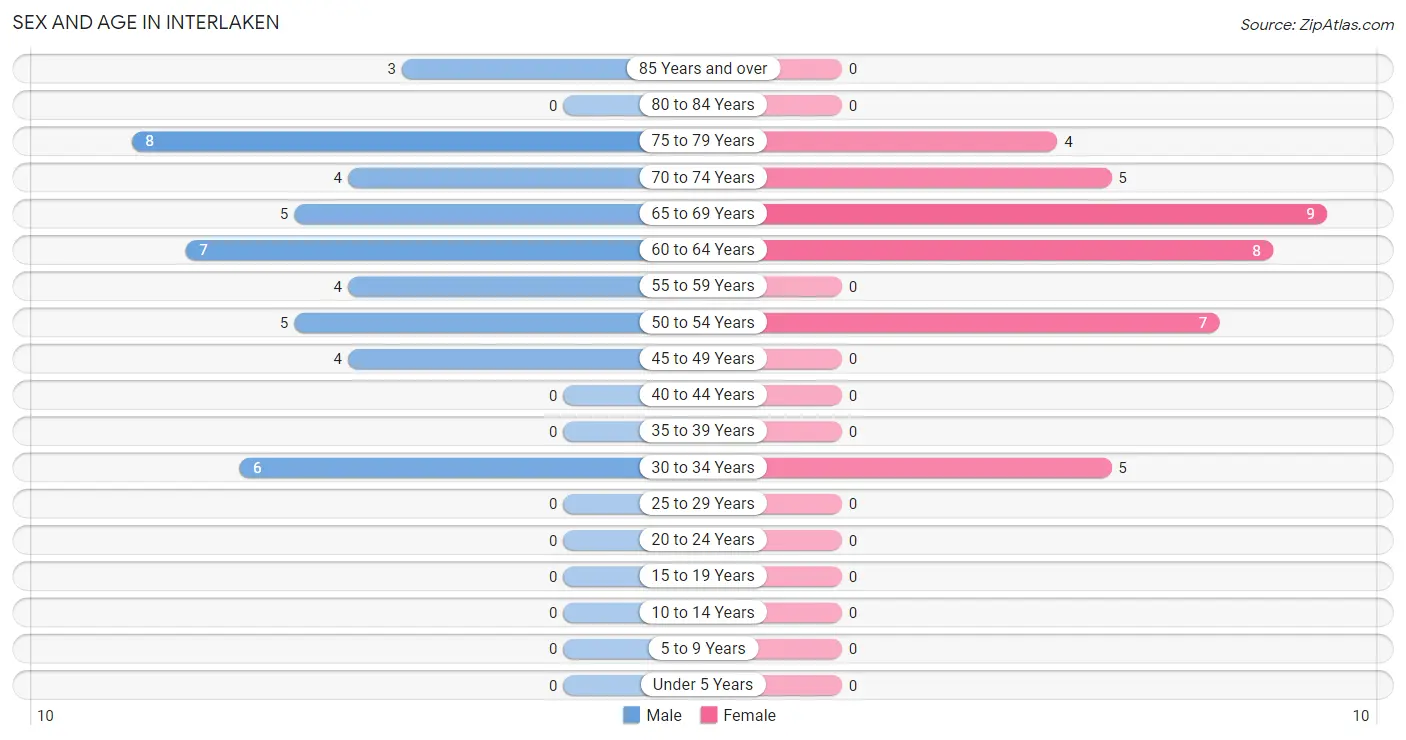
| Age Bracket | Male | Female |
| Under 5 Years | 0 (0.0%) | 0 (0.0%) |
| 5 to 9 Years | 0 (0.0%) | 0 (0.0%) |
| 10 to 14 Years | 0 (0.0%) | 0 (0.0%) |
| 15 to 19 Years | 0 (0.0%) | 0 (0.0%) |
| 20 to 24 Years | 0 (0.0%) | 0 (0.0%) |
| 25 to 29 Years | 0 (0.0%) | 0 (0.0%) |
| 30 to 34 Years | 6 (13.0%) | 5 (13.2%) |
| 35 to 39 Years | 0 (0.0%) | 0 (0.0%) |
| 40 to 44 Years | 0 (0.0%) | 0 (0.0%) |
| 45 to 49 Years | 4 (8.7%) | 0 (0.0%) |
| 50 to 54 Years | 5 (10.9%) | 7 (18.4%) |
| 55 to 59 Years | 4 (8.7%) | 0 (0.0%) |
| 60 to 64 Years | 7 (15.2%) | 8 (21.0%) |
| 65 to 69 Years | 5 (10.9%) | 9 (23.7%) |
| 70 to 74 Years | 4 (8.7%) | 5 (13.2%) |
| 75 to 79 Years | 8 (17.4%) | 4 (10.5%) |
| 80 to 84 Years | 0 (0.0%) | 0 (0.0%) |
| 85 Years and over | 3 (6.5%) | 0 (0.0%) |
| Total | 46 (100.0%) | 38 (100.0%) |
Families and Households in Interlaken
Median Family Size in Interlaken
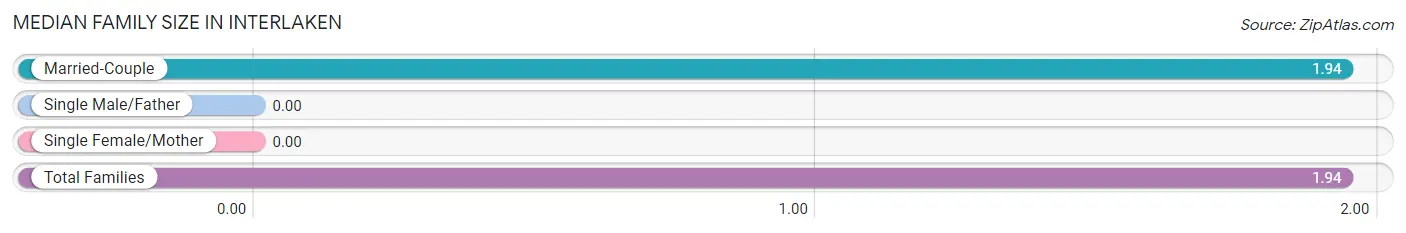
| Family Type | # Families | Family Size |
| Married-Couple | 34 (100.0%) | 1.94 |
| Single Male/Father | 0 (0.0%) | - |
| Single Female/Mother | 0 (0.0%) | - |
| Total Families | 34 (100.0%) | 1.94 |
Median Household Size in Interlaken
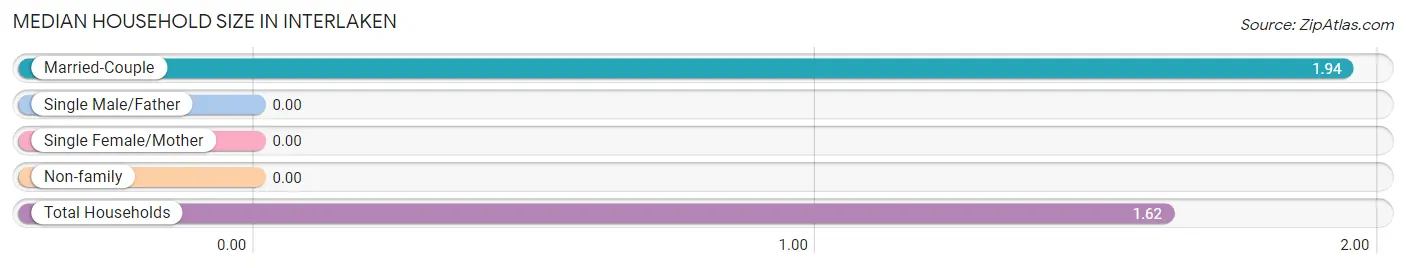
| Household Type | # Households | Household Size |
| Married-Couple | 34 (65.4%) | 1.94 |
| Single Male/Father | 0 (0.0%) | - |
| Single Female/Mother | 0 (0.0%) | - |
| Non-family | 18 (34.6%) | - |
| Total Households | 52 (100.0%) | 1.62 |
Household Size by Marriage Status in Interlaken
Out of a total of 52 households in Interlaken, 34 (65.4%) are family households, while 18 (34.6%) are nonfamily households. The most numerous type of family households are 2-person households, comprising 34, and the most common type of nonfamily households are 1-person households, comprising 18.
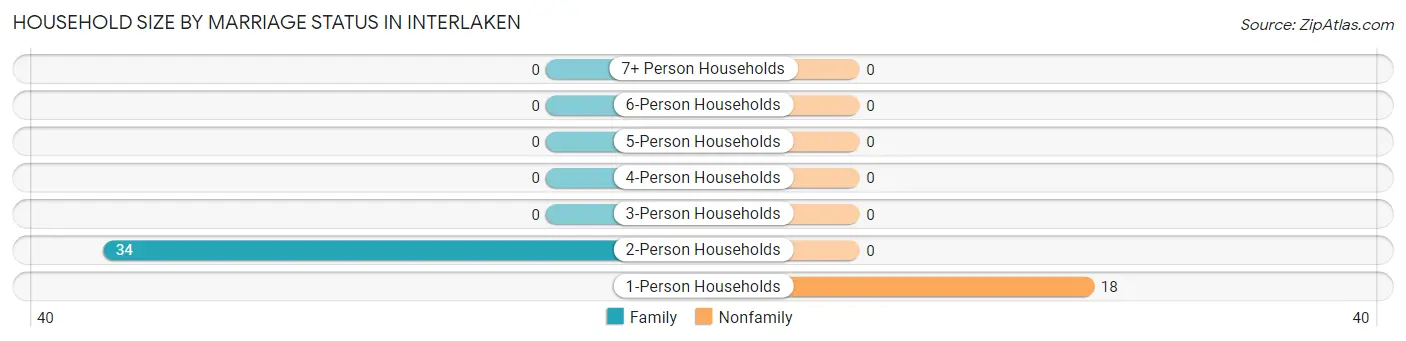
| Household Size | Family Households | Nonfamily Households |
| 1-Person Households | - | 18 (34.6%) |
| 2-Person Households | 34 (65.4%) | 0 (0.0%) |
| 3-Person Households | 0 (0.0%) | 0 (0.0%) |
| 4-Person Households | 0 (0.0%) | 0 (0.0%) |
| 5-Person Households | 0 (0.0%) | 0 (0.0%) |
| 6-Person Households | 0 (0.0%) | 0 (0.0%) |
| 7+ Person Households | 0 (0.0%) | 0 (0.0%) |
| Total | 34 (65.4%) | 18 (34.6%) |
Female Fertility in Interlaken
Fertility by Age in Interlaken
| Age Bracket | Women with Births | Births / 1,000 Women |
| 15 to 19 years | 0 (0.0%) | 0.0 |
| 20 to 34 years | 0 (0.0%) | 0.0 |
| 35 to 50 years | 0 (0.0%) | 0.0 |
| Total | 0 (0.0%) | 0.0 |
Fertility by Age by Marriage Status in Interlaken
| Age Bracket | Married | Unmarried |
| 15 to 19 years | 0 (0.0%) | 0 (0.0%) |
| 20 to 34 years | 0 (0.0%) | 0 (0.0%) |
| 35 to 50 years | 0 (0.0%) | 0 (0.0%) |
| Total | 0 (0.0%) | 0 (0.0%) |
Fertility by Education in Interlaken
| Educational Attainment | Women with Births | Births / 1,000 Women |
| Less than High School | 0 (0.0%) | 0.0 |
| High School Diploma | 0 (0.0%) | 0.0 |
| College or Associate's Degree | 0 (0.0%) | 0.0 |
| Bachelor's Degree | 0 (0.0%) | 0.0 |
| Graduate Degree | 0 (0.0%) | 0.0 |
| Total | 0 (0.0%) | 0.0 |
Fertility by Education by Marriage Status in Interlaken
| Educational Attainment | Married | Unmarried |
| Less than High School | 0 (0.0%) | 0 (0.0%) |
| High School Diploma | 0 (0.0%) | 0 (0.0%) |
| College or Associate's Degree | 0 (0.0%) | 0 (0.0%) |
| Bachelor's Degree | 0 (0.0%) | 0 (0.0%) |
| Graduate Degree | 0 (0.0%) | 0 (0.0%) |
| Total | 0 (0.0%) | 0 (0.0%) |
Employment Characteristics in Interlaken
Employment by Class of Employer in Interlaken
Among the 55 employed individuals in Interlaken, private company employees (36 | 65.4%), local government employees (8 | 14.5%), and not-for-profit organizations (7 | 12.7%) make up the most common classes of employment.
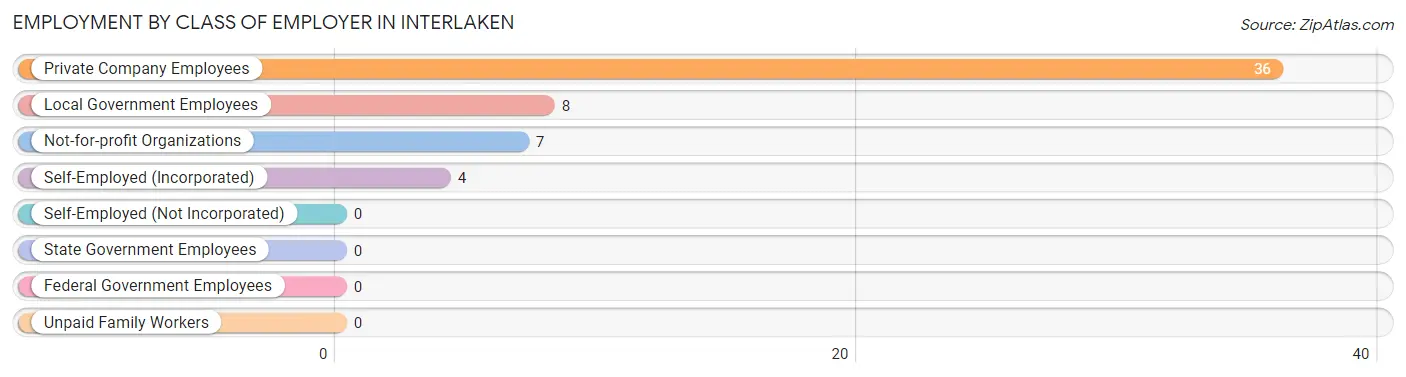
| Employer Class | # Employees | % Employees |
| Private Company Employees | 36 | 65.4% |
| Self-Employed (Incorporated) | 4 | 7.3% |
| Self-Employed (Not Incorporated) | 0 | 0.0% |
| Not-for-profit Organizations | 7 | 12.7% |
| Local Government Employees | 8 | 14.5% |
| State Government Employees | 0 | 0.0% |
| Federal Government Employees | 0 | 0.0% |
| Unpaid Family Workers | 0 | 0.0% |
| Total | 55 | 100.0% |
Employment Status by Age in Interlaken
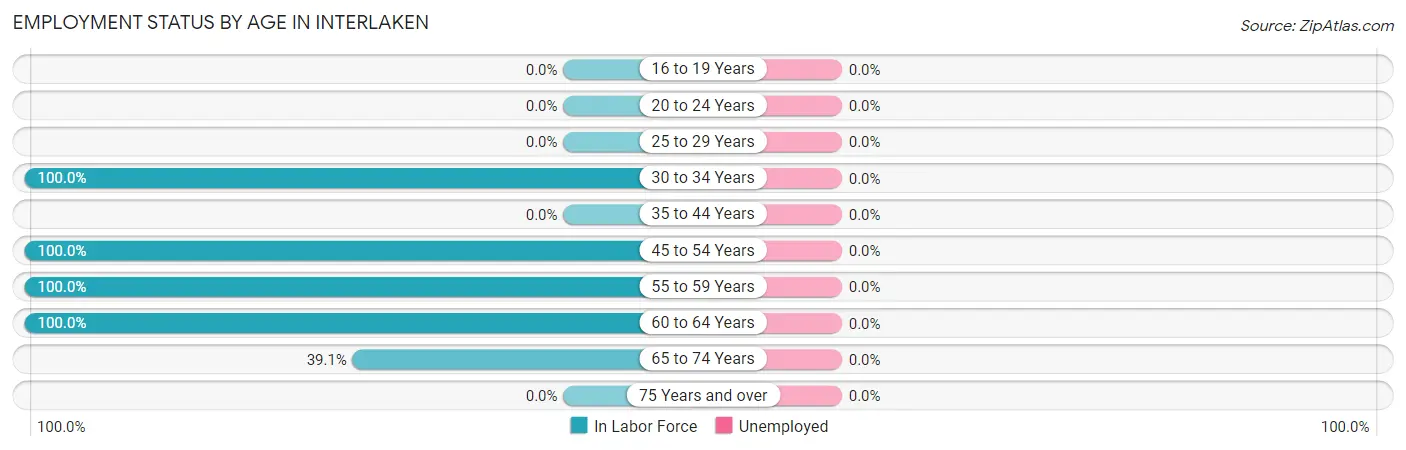
| Age Bracket | In Labor Force | Unemployed |
| 16 to 19 Years | 0 (0.0%) | 0 (0.0%) |
| 20 to 24 Years | 0 (0.0%) | 0 (0.0%) |
| 25 to 29 Years | 0 (0.0%) | 0 (0.0%) |
| 30 to 34 Years | 11 (100.0%) | 0 (0.0%) |
| 35 to 44 Years | 0 (0.0%) | 0 (0.0%) |
| 45 to 54 Years | 16 (100.0%) | 0 (0.0%) |
| 55 to 59 Years | 4 (100.0%) | 0 (0.0%) |
| 60 to 64 Years | 15 (100.0%) | 0 (0.0%) |
| 65 to 74 Years | 9 (39.1%) | 0 (0.0%) |
| 75 Years and over | 0 (0.0%) | 0 (0.0%) |
| Total | 55 (65.5%) | 0 (0.0%) |
Employment Status by Educational Attainment in Interlaken
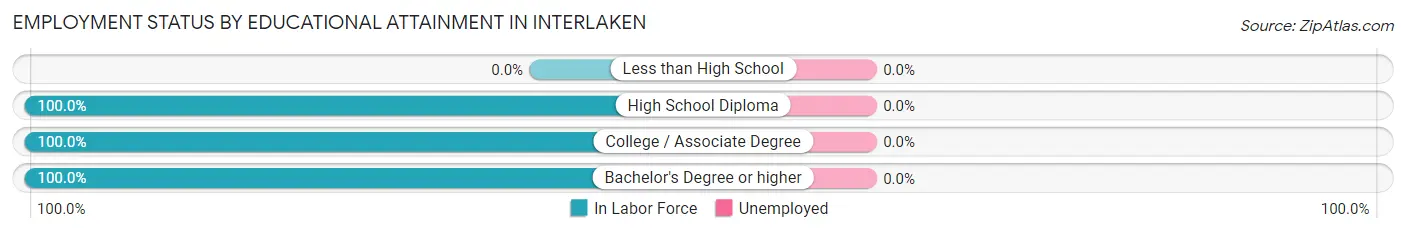
| Educational Attainment | In Labor Force | Unemployed |
| Less than High School | 0 (0.0%) | 0 (0.0%) |
| High School Diploma | 4 (100.0%) | 0 (0.0%) |
| College / Associate Degree | 19 (100.0%) | 0 (0.0%) |
| Bachelor's Degree or higher | 23 (100.0%) | 0 (0.0%) |
| Total | 46 (100.0%) | 0 (0.0%) |
Employment Occupations by Sex in Interlaken
Management, Business, Science and Arts Occupations
The most common Management, Business, Science and Arts occupations in Interlaken are Management (11 | 20.0%), Community & Social Service (9 | 16.4%), Computers, Engineering & Science (6 | 10.9%), Computers & Mathematics (6 | 10.9%), and Education Instruction & Library (5 | 9.1%).
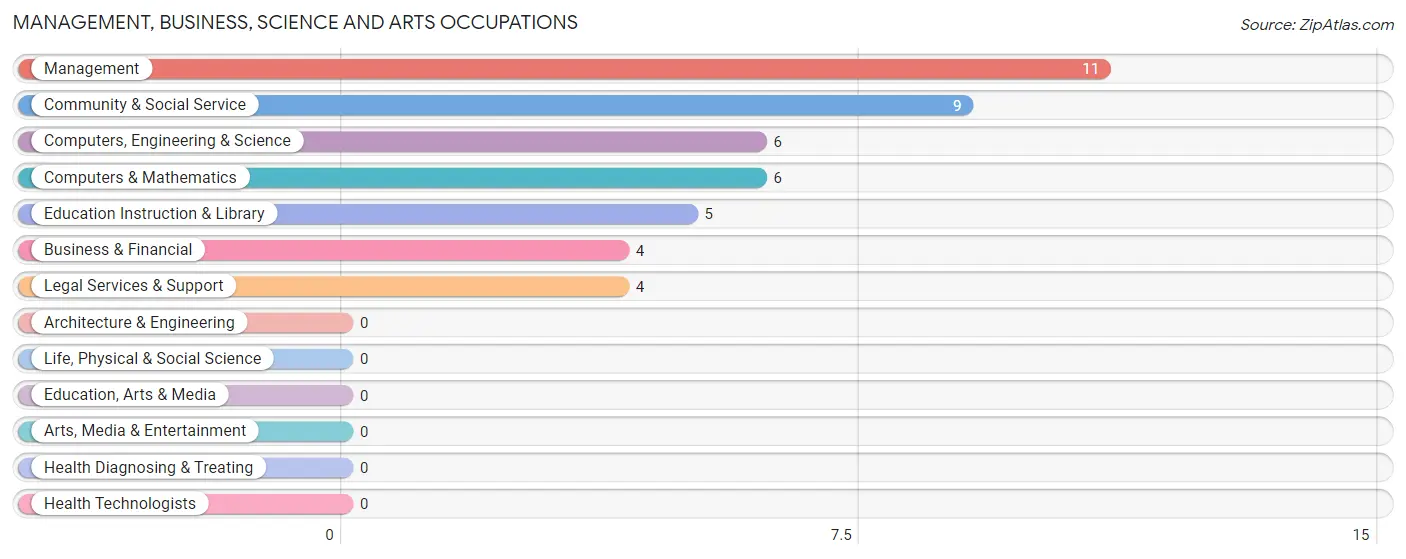
Management, Business, Science and Arts Occupations by Sex
Within the Management, Business, Science and Arts occupations in Interlaken, the most male-oriented occupations are Computers, Engineering & Science (100.0%), Computers & Mathematics (100.0%), and Legal Services & Support (100.0%), while the most female-oriented occupations are Business & Financial (100.0%), Education Instruction & Library (100.0%), and Management (63.6%).
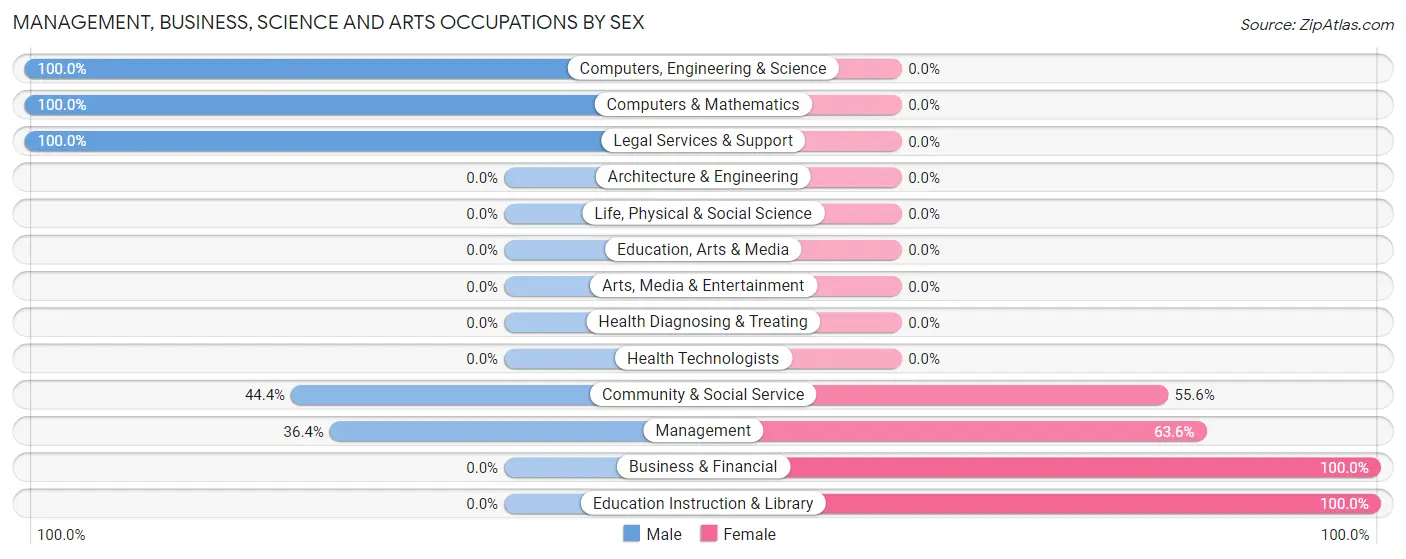
| Occupation | Male | Female |
| Management | 4 (36.4%) | 7 (63.6%) |
| Business & Financial | 0 (0.0%) | 4 (100.0%) |
| Computers, Engineering & Science | 6 (100.0%) | 0 (0.0%) |
| Computers & Mathematics | 6 (100.0%) | 0 (0.0%) |
| Architecture & Engineering | 0 (0.0%) | 0 (0.0%) |
| Life, Physical & Social Science | 0 (0.0%) | 0 (0.0%) |
| Community & Social Service | 4 (44.4%) | 5 (55.6%) |
| Education, Arts & Media | 0 (0.0%) | 0 (0.0%) |
| Legal Services & Support | 4 (100.0%) | 0 (0.0%) |
| Education Instruction & Library | 0 (0.0%) | 5 (100.0%) |
| Arts, Media & Entertainment | 0 (0.0%) | 0 (0.0%) |
| Health Diagnosing & Treating | 0 (0.0%) | 0 (0.0%) |
| Health Technologists | 0 (0.0%) | 0 (0.0%) |
| Total (Category) | 14 (46.7%) | 16 (53.3%) |
| Total (Overall) | 26 (47.3%) | 29 (52.7%) |
Services Occupations
The most common Services occupations in Interlaken are , and Food Preparation & Serving (5 | 9.1%).
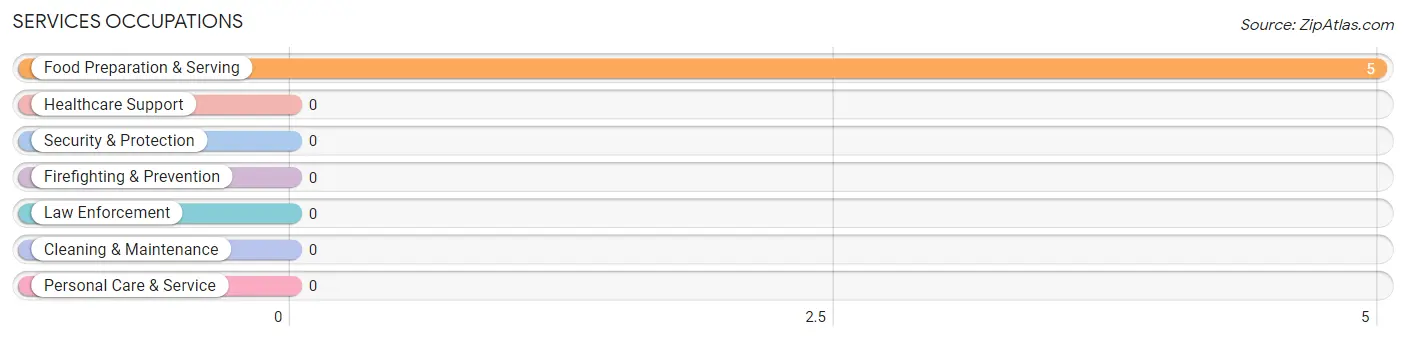
Services Occupations by Sex
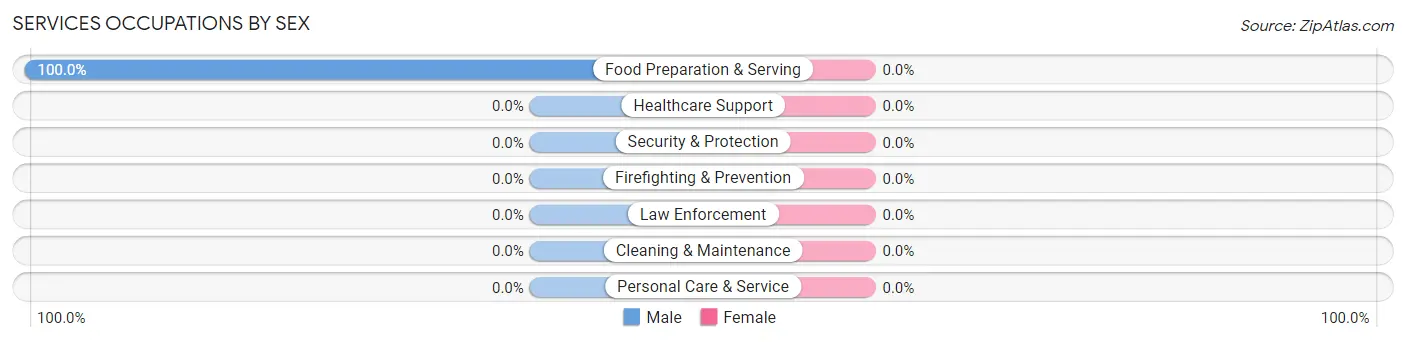
| Occupation | Male | Female |
| Healthcare Support | 0 (0.0%) | 0 (0.0%) |
| Security & Protection | 0 (0.0%) | 0 (0.0%) |
| Firefighting & Prevention | 0 (0.0%) | 0 (0.0%) |
| Law Enforcement | 0 (0.0%) | 0 (0.0%) |
| Food Preparation & Serving | 5 (100.0%) | 0 (0.0%) |
| Cleaning & Maintenance | 0 (0.0%) | 0 (0.0%) |
| Personal Care & Service | 0 (0.0%) | 0 (0.0%) |
| Total (Category) | 5 (100.0%) | 0 (0.0%) |
| Total (Overall) | 26 (47.3%) | 29 (52.7%) |
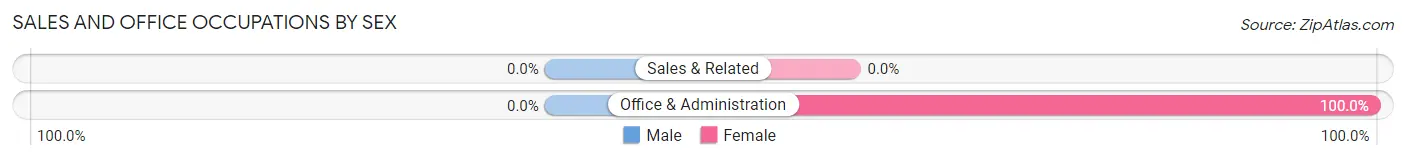
Sales and Office Occupations
The most common Sales and Office occupations in Interlaken are , and Office & Administration (13 | 23.6%).
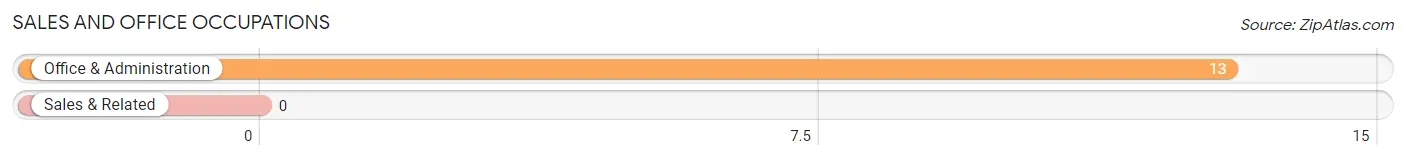
Sales and Office Occupations by Sex
| Occupation | Male | Female |
| Sales & Related | 0 (0.0%) | 0 (0.0%) |
| Office & Administration | 0 (0.0%) | 13 (100.0%) |
| Total (Category) | 0 (0.0%) | 13 (100.0%) |
| Total (Overall) | 26 (47.3%) | 29 (52.7%) |
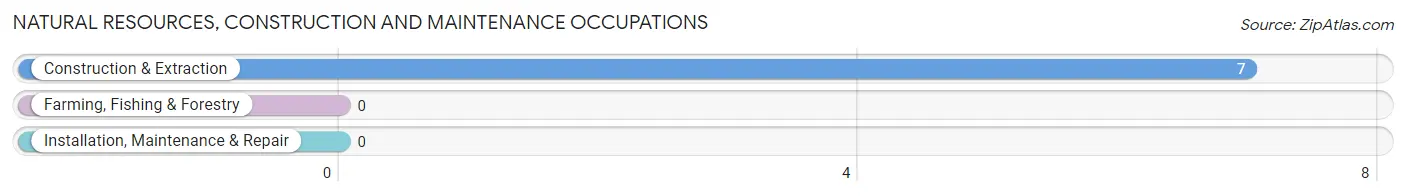
Natural Resources, Construction and Maintenance Occupations
The most common Natural Resources, Construction and Maintenance occupations in Interlaken are , and Construction & Extraction (7 | 12.7%).
Natural Resources, Construction and Maintenance Occupations by Sex
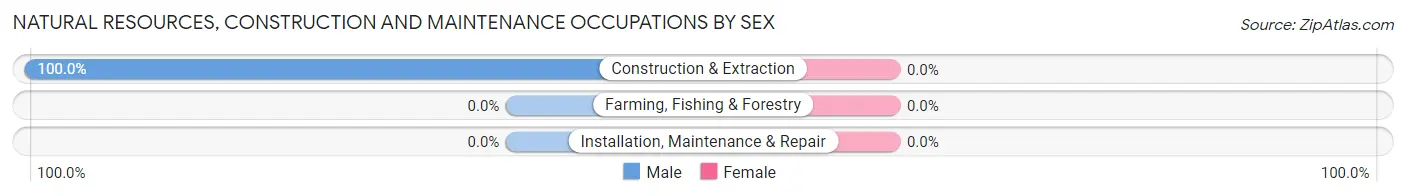
| Occupation | Male | Female |
| Farming, Fishing & Forestry | 0 (0.0%) | 0 (0.0%) |
| Construction & Extraction | 7 (100.0%) | 0 (0.0%) |
| Installation, Maintenance & Repair | 0 (0.0%) | 0 (0.0%) |
| Total (Category) | 7 (100.0%) | 0 (0.0%) |
| Total (Overall) | 26 (47.3%) | 29 (52.7%) |
Production, Transportation and Moving Occupations
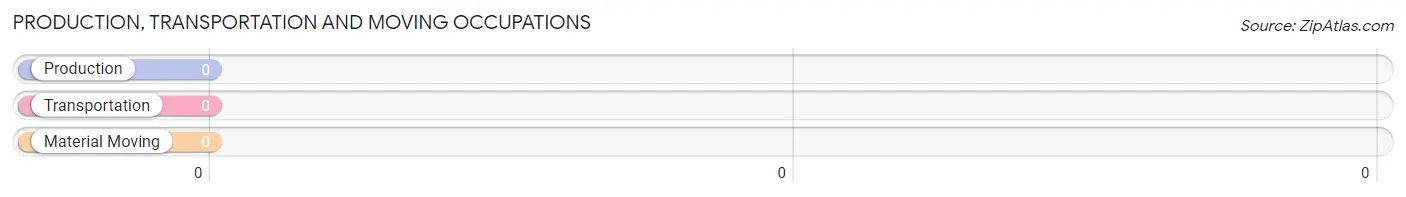
Production, Transportation and Moving Occupations by Sex
| Occupation | Male | Female |
| Production | 0 (0.0%) | 0 (0.0%) |
| Transportation | 0 (0.0%) | 0 (0.0%) |
| Material Moving | 0 (0.0%) | 0 (0.0%) |
| Total (Category) | 0 (0.0%) | 0 (0.0%) |
| Total (Overall) | 26 (47.3%) | 29 (52.7%) |
Employment Industries by Sex in Interlaken
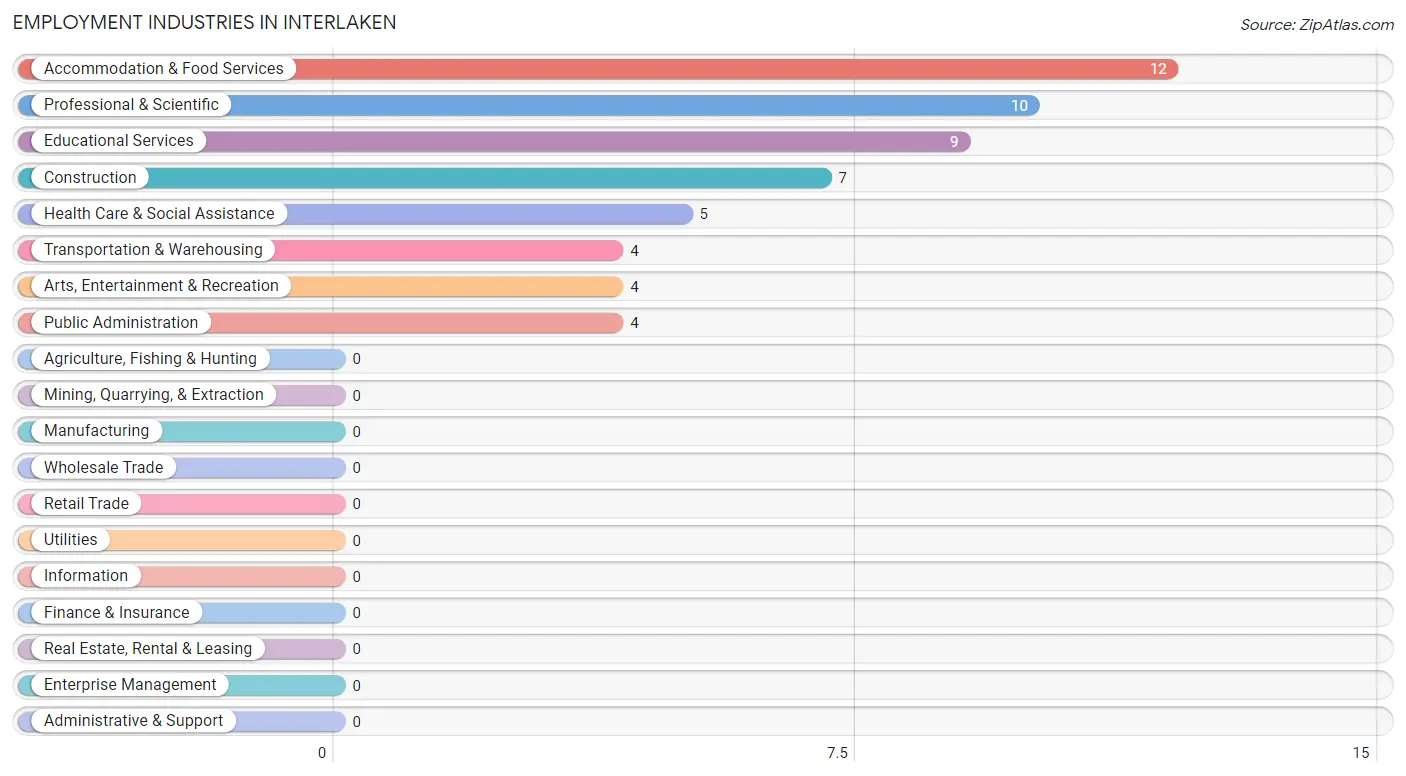
Employment Industries in Interlaken
The major employment industries in Interlaken include Accommodation & Food Services (12 | 21.8%), Professional & Scientific (10 | 18.2%), Educational Services (9 | 16.4%), Construction (7 | 12.7%), and Health Care & Social Assistance (5 | 9.1%).
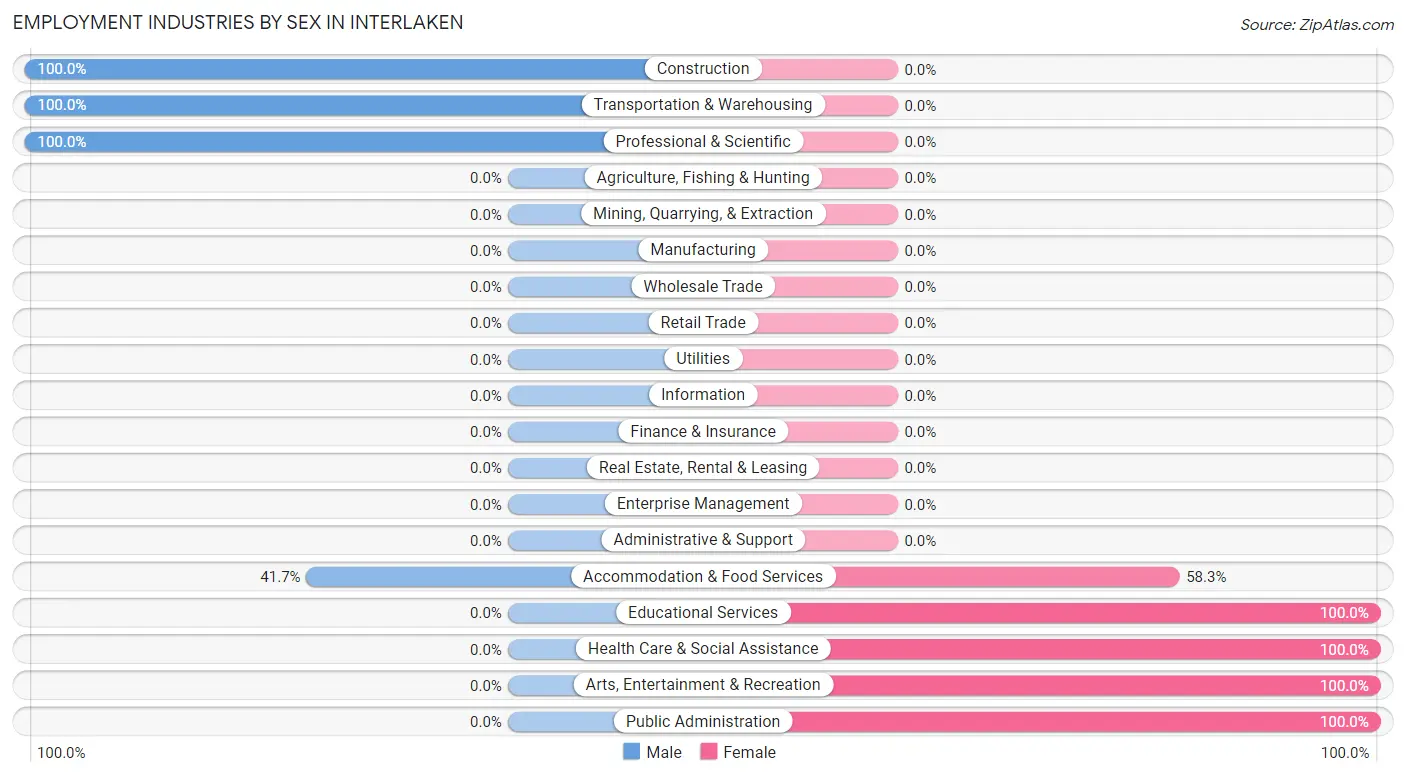
Employment Industries by Sex in Interlaken
The Interlaken industries that see more men than women are Construction (100.0%), Transportation & Warehousing (100.0%), and Professional & Scientific (100.0%), whereas the industries that tend to have a higher number of women are Educational Services (100.0%), Health Care & Social Assistance (100.0%), and Arts, Entertainment & Recreation (100.0%).
| Industry | Male | Female |
| Agriculture, Fishing & Hunting | 0 (0.0%) | 0 (0.0%) |
| Mining, Quarrying, & Extraction | 0 (0.0%) | 0 (0.0%) |
| Construction | 7 (100.0%) | 0 (0.0%) |
| Manufacturing | 0 (0.0%) | 0 (0.0%) |
| Wholesale Trade | 0 (0.0%) | 0 (0.0%) |
| Retail Trade | 0 (0.0%) | 0 (0.0%) |
| Transportation & Warehousing | 4 (100.0%) | 0 (0.0%) |
| Utilities | 0 (0.0%) | 0 (0.0%) |
| Information | 0 (0.0%) | 0 (0.0%) |
| Finance & Insurance | 0 (0.0%) | 0 (0.0%) |
| Real Estate, Rental & Leasing | 0 (0.0%) | 0 (0.0%) |
| Professional & Scientific | 10 (100.0%) | 0 (0.0%) |
| Enterprise Management | 0 (0.0%) | 0 (0.0%) |
| Administrative & Support | 0 (0.0%) | 0 (0.0%) |
| Educational Services | 0 (0.0%) | 9 (100.0%) |
| Health Care & Social Assistance | 0 (0.0%) | 5 (100.0%) |
| Arts, Entertainment & Recreation | 0 (0.0%) | 4 (100.0%) |
| Accommodation & Food Services | 5 (41.7%) | 7 (58.3%) |
| Public Administration | 0 (0.0%) | 4 (100.0%) |
| Total | 26 (47.3%) | 29 (52.7%) |
Education in Interlaken
School Enrollment in Interlaken
| School Level | # Students | % Students |
| Nursery / Preschool | 0 | 0.0% |
| Kindergarten | 0 | 0.0% |
| Elementary School | 0 | 0.0% |
| Middle School | 0 | 0.0% |
| High School | 0 | 0.0% |
| College / Undergraduate | 0 | 0.0% |
| Graduate / Professional | 0 | 0.0% |
| Total | 0 | 0.0% |
School Enrollment by Age by Funding Source in Interlaken
| Age Bracket | Public School | Private School |
| 3 to 4 Year Olds | 0 (0.0%) | 0 (0.0%) |
| 5 to 9 Year Old | 0 (0.0%) | 0 (0.0%) |
| 10 to 14 Year Olds | 0 (0.0%) | 0 (0.0%) |
| 15 to 17 Year Olds | 0 (0.0%) | 0 (0.0%) |
| 18 to 19 Year Olds | 0 (0.0%) | 0 (0.0%) |
| 20 to 24 Year Olds | 0 (0.0%) | 0 (0.0%) |
| 25 to 34 Year Olds | 0 (0.0%) | 0 (0.0%) |
| 35 Years and over | 0 (0.0%) | 0 (0.0%) |
| Total | 0 (0.0%) | 0 (0.0%) |
Educational Attainment by Field of Study in Interlaken
Visual & performing arts (10 | 20.4%), social sciences (9 | 18.4%), business (8 | 16.3%), computers & mathematics (6 | 12.2%), and psychology (4 | 8.2%) are the most common fields of study among 49 individuals in Interlaken who have obtained a bachelor's degree or higher.
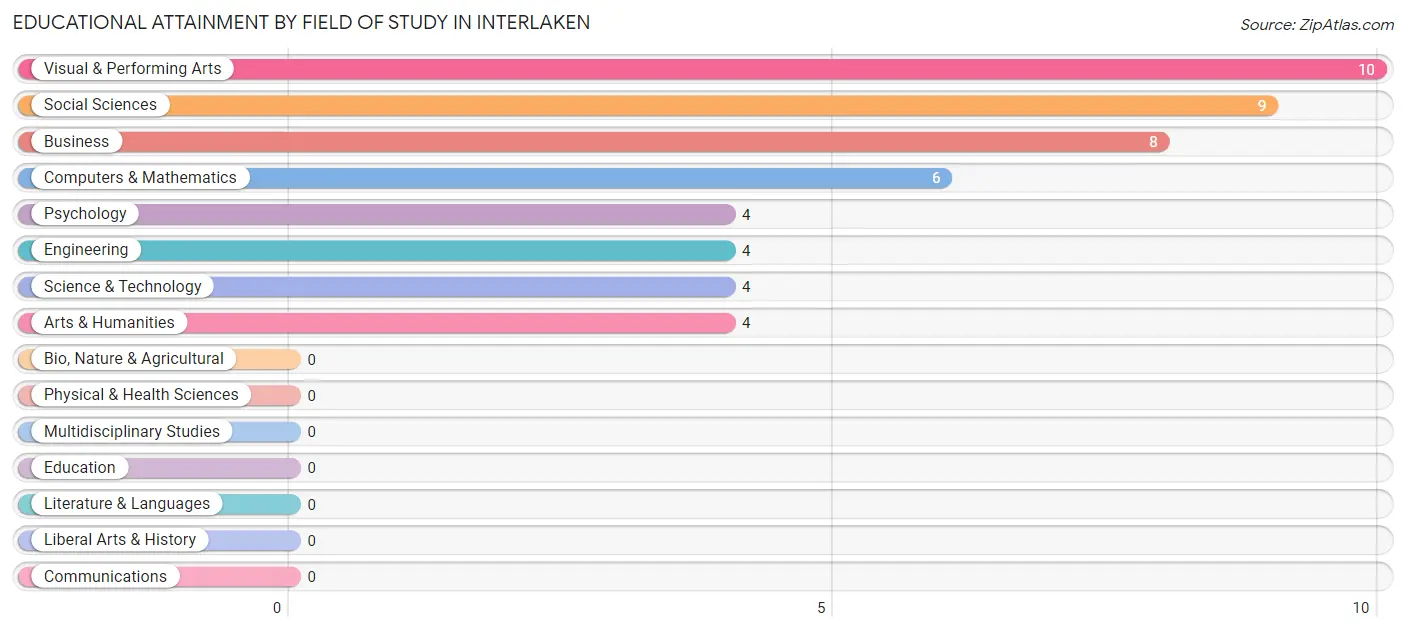
| Field of Study | # Graduates | % Graduates |
| Computers & Mathematics | 6 | 12.2% |
| Bio, Nature & Agricultural | 0 | 0.0% |
| Physical & Health Sciences | 0 | 0.0% |
| Psychology | 4 | 8.2% |
| Social Sciences | 9 | 18.4% |
| Engineering | 4 | 8.2% |
| Multidisciplinary Studies | 0 | 0.0% |
| Science & Technology | 4 | 8.2% |
| Business | 8 | 16.3% |
| Education | 0 | 0.0% |
| Literature & Languages | 0 | 0.0% |
| Liberal Arts & History | 0 | 0.0% |
| Visual & Performing Arts | 10 | 20.4% |
| Communications | 0 | 0.0% |
| Arts & Humanities | 4 | 8.2% |
| Total | 49 | 100.0% |
Transportation & Commute in Interlaken
Vehicle Availability by Sex in Interlaken
The most prevalent vehicle ownership categories in Interlaken are males with 4 vehicles (10, accounting for 38.5%) and females with 4 vehicles (9, making up 34.5%).
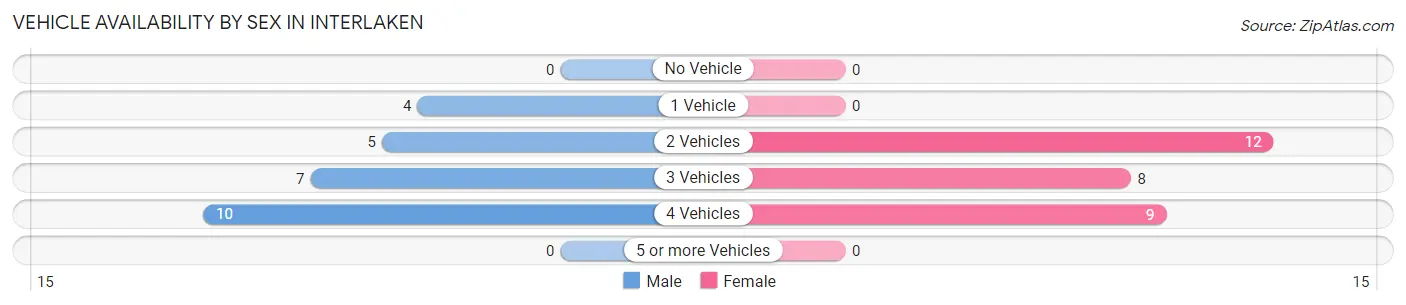
| Vehicles Available | Male | Female |
| No Vehicle | 0 (0.0%) | 0 (0.0%) |
| 1 Vehicle | 4 (15.4%) | 0 (0.0%) |
| 2 Vehicles | 5 (19.2%) | 12 (41.4%) |
| 3 Vehicles | 7 (26.9%) | 8 (27.6%) |
| 4 Vehicles | 10 (38.5%) | 9 (31.0%) |
| 5 or more Vehicles | 0 (0.0%) | 0 (0.0%) |
| Total | 26 (100.0%) | 29 (100.0%) |
Commute Time in Interlaken
The most frequently occuring commute durations in Interlaken are 30 to 34 minutes (15 commuters, 31.9%), 5 to 9 minutes (11 commuters, 23.4%), and 45 to 59 minutes (6 commuters, 12.8%).
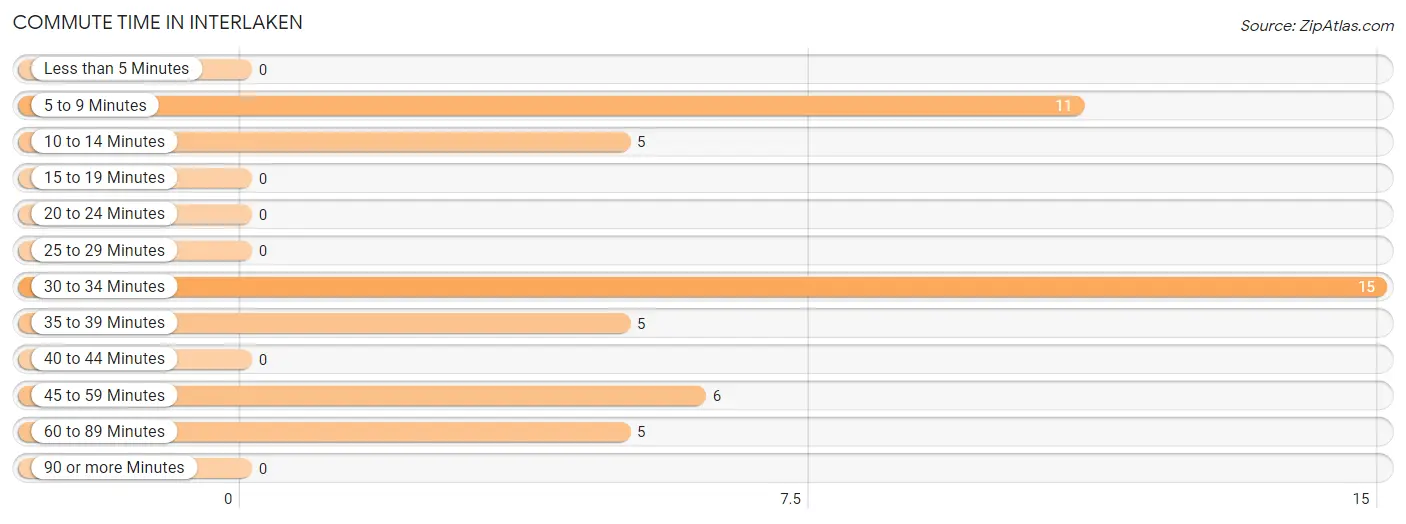
| Commute Time | # Commuters | % Commuters |
| Less than 5 Minutes | 0 | 0.0% |
| 5 to 9 Minutes | 11 | 23.4% |
| 10 to 14 Minutes | 5 | 10.6% |
| 15 to 19 Minutes | 0 | 0.0% |
| 20 to 24 Minutes | 0 | 0.0% |
| 25 to 29 Minutes | 0 | 0.0% |
| 30 to 34 Minutes | 15 | 31.9% |
| 35 to 39 Minutes | 5 | 10.6% |
| 40 to 44 Minutes | 0 | 0.0% |
| 45 to 59 Minutes | 6 | 12.8% |
| 60 to 89 Minutes | 5 | 10.6% |
| 90 or more Minutes | 0 | 0.0% |
Commute Time by Sex in Interlaken
The most common commute times in Interlaken are 30 to 34 minutes (7 commuters, 38.9%) for males and 5 to 9 minutes (11 commuters, 37.9%) for females.
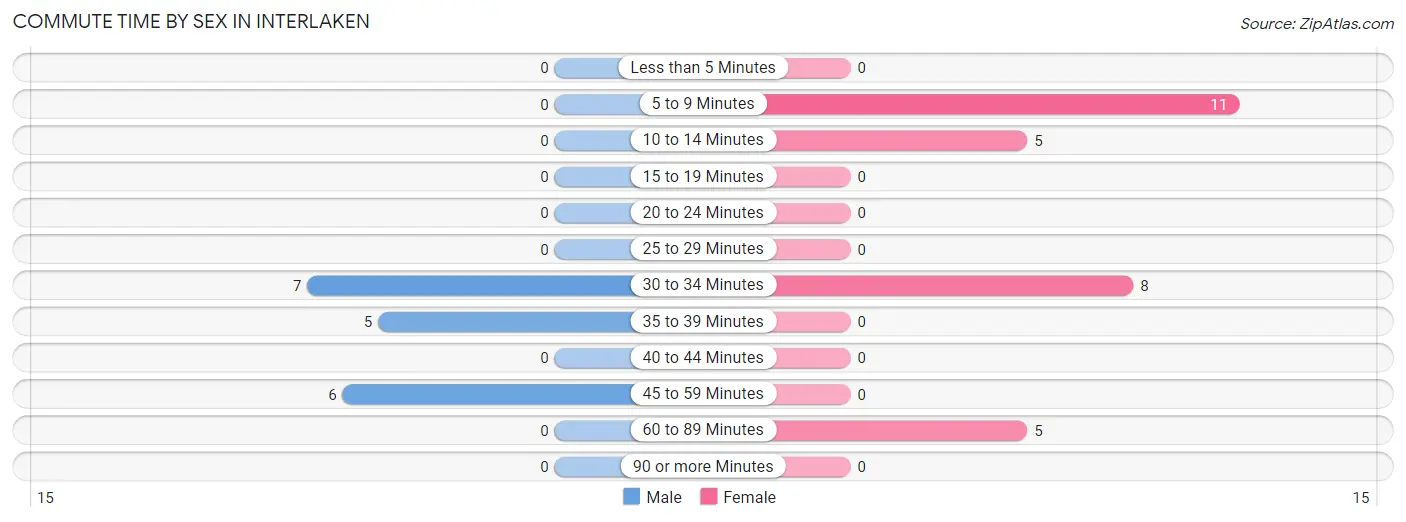
| Commute Time | Male | Female |
| Less than 5 Minutes | 0 (0.0%) | 0 (0.0%) |
| 5 to 9 Minutes | 0 (0.0%) | 11 (37.9%) |
| 10 to 14 Minutes | 0 (0.0%) | 5 (17.2%) |
| 15 to 19 Minutes | 0 (0.0%) | 0 (0.0%) |
| 20 to 24 Minutes | 0 (0.0%) | 0 (0.0%) |
| 25 to 29 Minutes | 0 (0.0%) | 0 (0.0%) |
| 30 to 34 Minutes | 7 (38.9%) | 8 (27.6%) |
| 35 to 39 Minutes | 5 (27.8%) | 0 (0.0%) |
| 40 to 44 Minutes | 0 (0.0%) | 0 (0.0%) |
| 45 to 59 Minutes | 6 (33.3%) | 0 (0.0%) |
| 60 to 89 Minutes | 0 (0.0%) | 5 (17.2%) |
| 90 or more Minutes | 0 (0.0%) | 0 (0.0%) |
Time of Departure to Work by Sex in Interlaken
The most frequent times of departure to work in Interlaken are 6:00 AM to 6:29 AM (7, 38.9%) for males and 12:00 PM to 3:59 PM (10, 34.5%) for females.
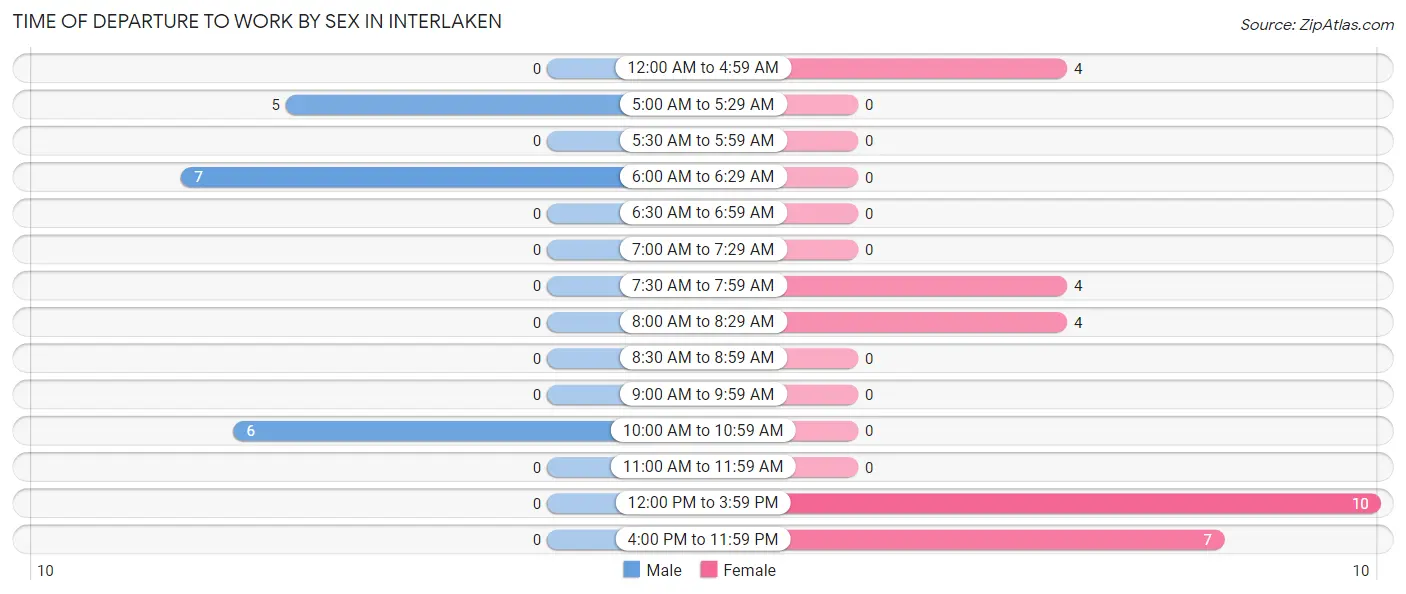
| Time of Departure | Male | Female |
| 12:00 AM to 4:59 AM | 0 (0.0%) | 4 (13.8%) |
| 5:00 AM to 5:29 AM | 5 (27.8%) | 0 (0.0%) |
| 5:30 AM to 5:59 AM | 0 (0.0%) | 0 (0.0%) |
| 6:00 AM to 6:29 AM | 7 (38.9%) | 0 (0.0%) |
| 6:30 AM to 6:59 AM | 0 (0.0%) | 0 (0.0%) |
| 7:00 AM to 7:29 AM | 0 (0.0%) | 0 (0.0%) |
| 7:30 AM to 7:59 AM | 0 (0.0%) | 4 (13.8%) |
| 8:00 AM to 8:29 AM | 0 (0.0%) | 4 (13.8%) |
| 8:30 AM to 8:59 AM | 0 (0.0%) | 0 (0.0%) |
| 9:00 AM to 9:59 AM | 0 (0.0%) | 0 (0.0%) |
| 10:00 AM to 10:59 AM | 6 (33.3%) | 0 (0.0%) |
| 11:00 AM to 11:59 AM | 0 (0.0%) | 0 (0.0%) |
| 12:00 PM to 3:59 PM | 0 (0.0%) | 10 (34.5%) |
| 4:00 PM to 11:59 PM | 0 (0.0%) | 7 (24.1%) |
| Total | 18 (100.0%) | 29 (100.0%) |
Housing Occupancy in Interlaken
Occupancy by Ownership in Interlaken
Of the total 52 dwellings in Interlaken, owner-occupied units account for 48 (92.3%), while renter-occupied units make up 4 (7.7%).
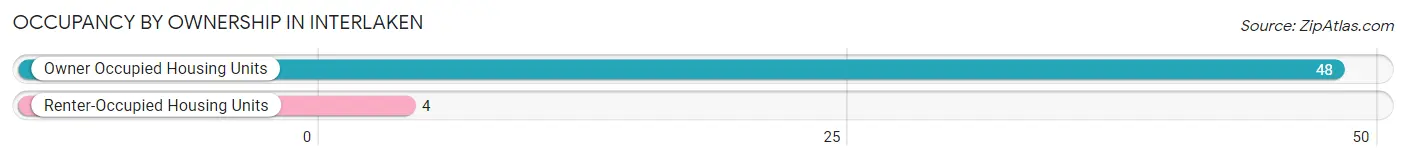
| Occupancy | # Housing Units | % Housing Units |
| Owner Occupied Housing Units | 48 | 92.3% |
| Renter-Occupied Housing Units | 4 | 7.7% |
| Total Occupied Housing Units | 52 | 100.0% |
Occupancy by Household Size in Interlaken
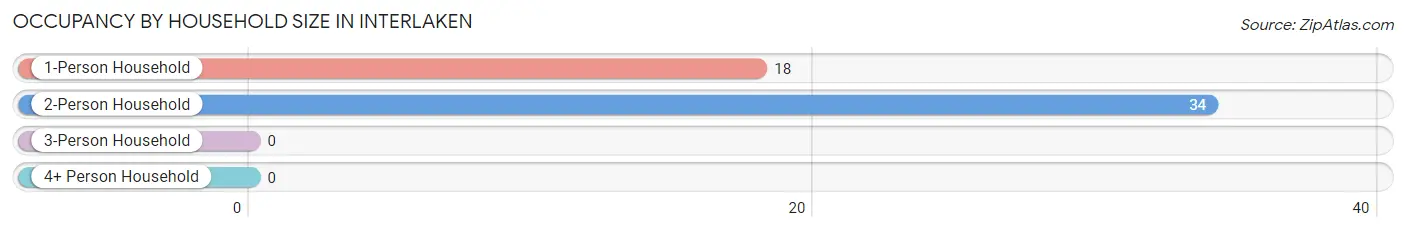
| Household Size | # Housing Units | % Housing Units |
| 1-Person Household | 18 | 34.6% |
| 2-Person Household | 34 | 65.4% |
| 3-Person Household | 0 | 0.0% |
| 4+ Person Household | 0 | 0.0% |
| Total Housing Units | 52 | 100.0% |
Occupancy by Ownership by Household Size in Interlaken
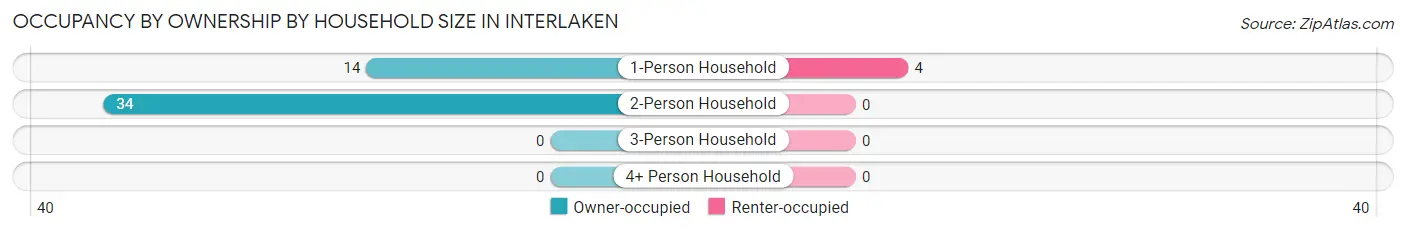
| Household Size | Owner-occupied | Renter-occupied |
| 1-Person Household | 14 (77.8%) | 4 (22.2%) |
| 2-Person Household | 34 (100.0%) | 0 (0.0%) |
| 3-Person Household | 0 (0.0%) | 0 (0.0%) |
| 4+ Person Household | 0 (0.0%) | 0 (0.0%) |
| Total Housing Units | 48 (92.3%) | 4 (7.7%) |
Occupancy by Educational Attainment in Interlaken
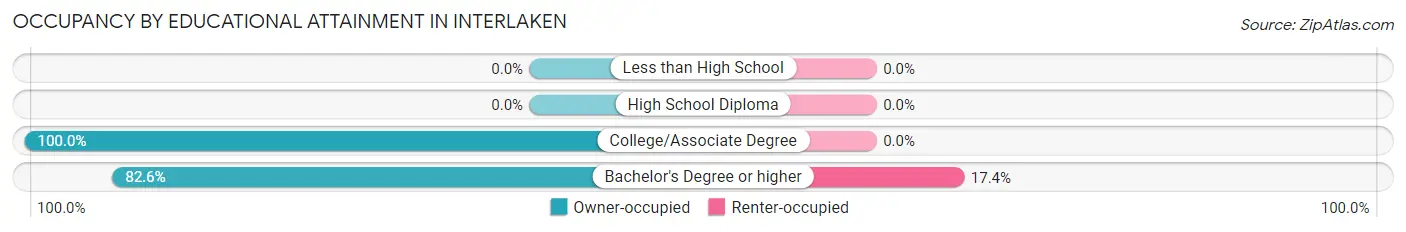
| Household Size | Owner-occupied | Renter-occupied |
| Less than High School | 0 (0.0%) | 0 (0.0%) |
| High School Diploma | 0 (0.0%) | 0 (0.0%) |
| College/Associate Degree | 29 (100.0%) | 0 (0.0%) |
| Bachelor's Degree or higher | 19 (82.6%) | 4 (17.4%) |
Occupancy by Age of Householder in Interlaken
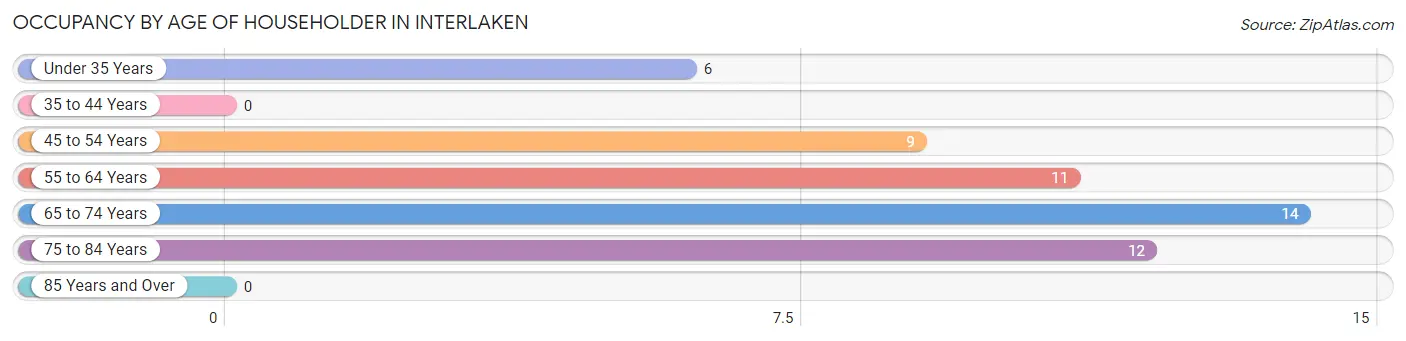
| Age Bracket | # Households | % Households |
| Under 35 Years | 6 | 11.5% |
| 35 to 44 Years | 0 | 0.0% |
| 45 to 54 Years | 9 | 17.3% |
| 55 to 64 Years | 11 | 21.1% |
| 65 to 74 Years | 14 | 26.9% |
| 75 to 84 Years | 12 | 23.1% |
| 85 Years and Over | 0 | 0.0% |
| Total | 52 | 100.0% |
Housing Finances in Interlaken
Median Income by Occupancy in Interlaken
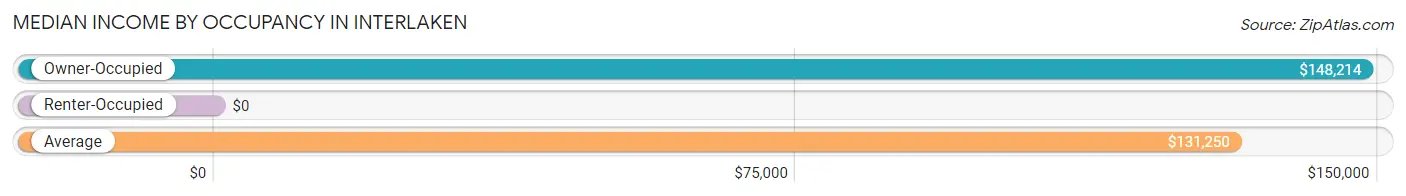
| Occupancy Type | # Households | Median Income |
| Owner-Occupied | 48 (92.3%) | $148,214 |
| Renter-Occupied | 4 (7.7%) | $0 |
| Average | 52 (100.0%) | $131,250 |
Occupancy by Householder Income Bracket in Interlaken
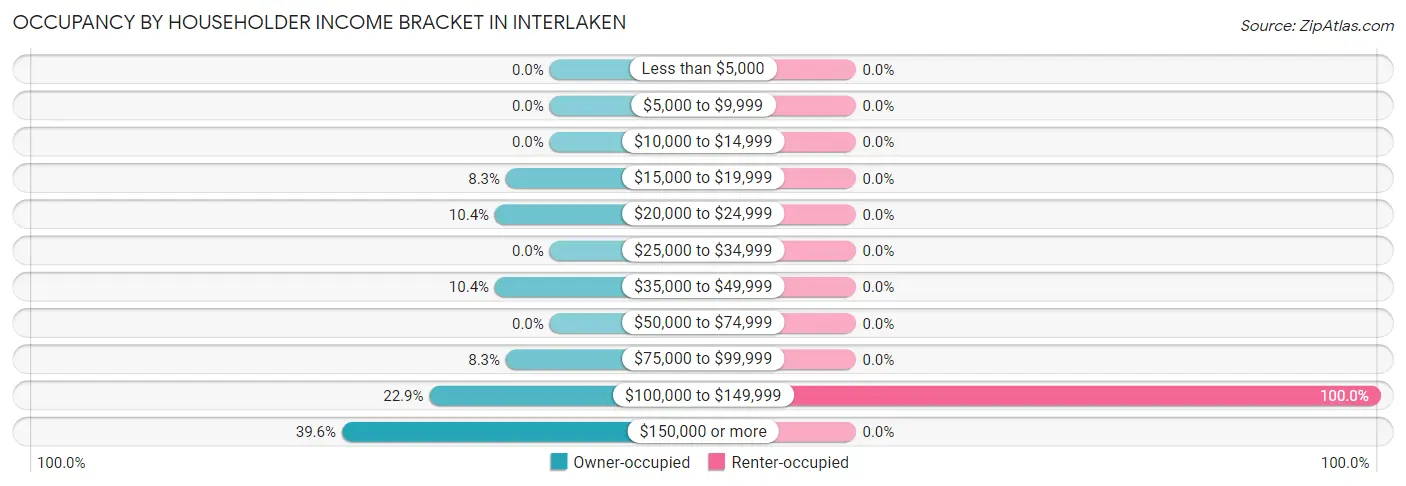
| Income Bracket | Owner-occupied | Renter-occupied |
| Less than $5,000 | 0 (0.0%) | 0 (0.0%) |
| $5,000 to $9,999 | 0 (0.0%) | 0 (0.0%) |
| $10,000 to $14,999 | 0 (0.0%) | 0 (0.0%) |
| $15,000 to $19,999 | 4 (8.3%) | 0 (0.0%) |
| $20,000 to $24,999 | 5 (10.4%) | 0 (0.0%) |
| $25,000 to $34,999 | 0 (0.0%) | 0 (0.0%) |
| $35,000 to $49,999 | 5 (10.4%) | 0 (0.0%) |
| $50,000 to $74,999 | 0 (0.0%) | 0 (0.0%) |
| $75,000 to $99,999 | 4 (8.3%) | 0 (0.0%) |
| $100,000 to $149,999 | 11 (22.9%) | 4 (100.0%) |
| $150,000 or more | 19 (39.6%) | 0 (0.0%) |
| Total | 48 (100.0%) | 4 (100.0%) |
Monthly Housing Cost Tiers in Interlaken
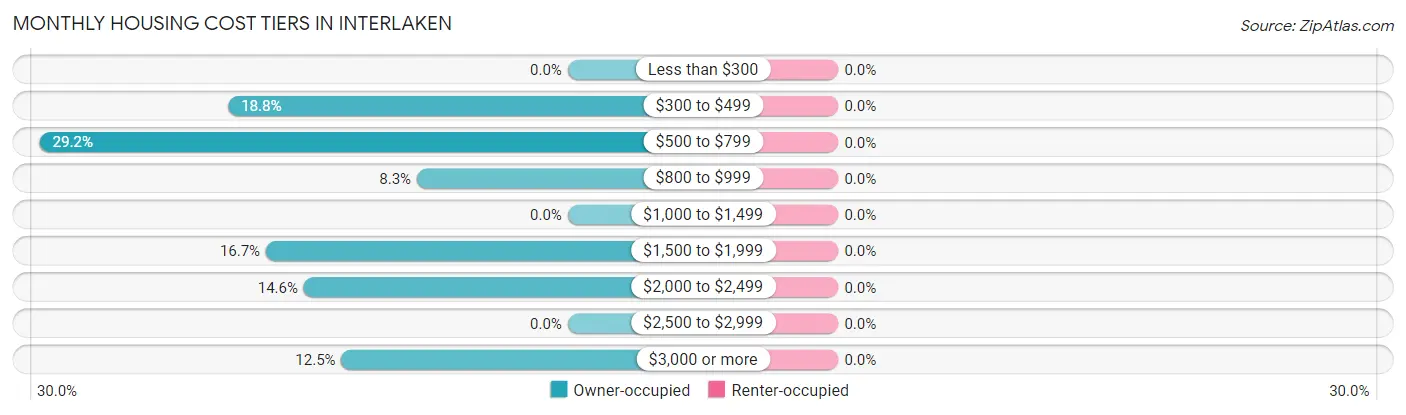
| Monthly Cost | Owner-occupied | Renter-occupied |
| Less than $300 | 0 (0.0%) | 0 (0.0%) |
| $300 to $499 | 9 (18.8%) | 0 (0.0%) |
| $500 to $799 | 14 (29.2%) | 0 (0.0%) |
| $800 to $999 | 4 (8.3%) | 0 (0.0%) |
| $1,000 to $1,499 | 0 (0.0%) | 0 (0.0%) |
| $1,500 to $1,999 | 8 (16.7%) | 0 (0.0%) |
| $2,000 to $2,499 | 7 (14.6%) | 0 (0.0%) |
| $2,500 to $2,999 | 0 (0.0%) | 0 (0.0%) |
| $3,000 or more | 6 (12.5%) | 0 (0.0%) |
| Total | 48 (100.0%) | 4 (100.0%) |
Physical Housing Characteristics in Interlaken
Housing Structures in Interlaken
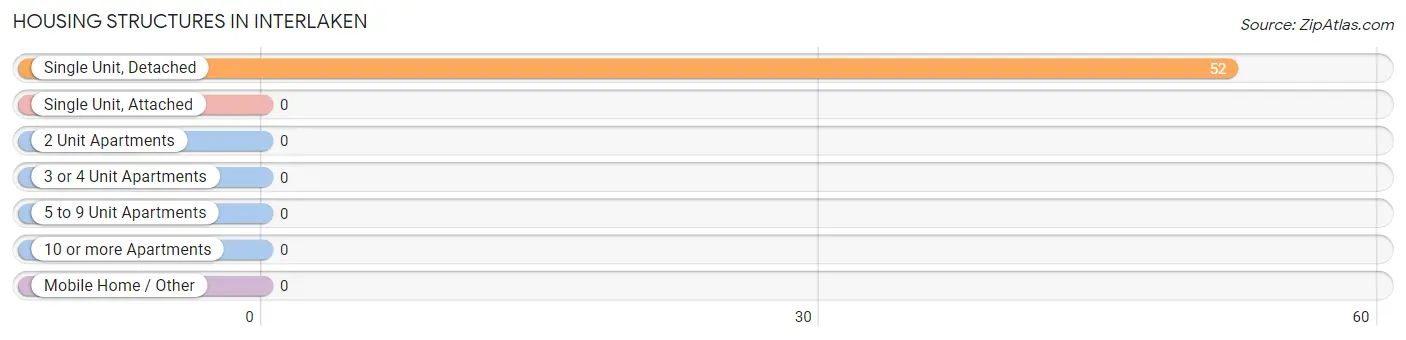
| Structure Type | # Housing Units | % Housing Units |
| Single Unit, Detached | 52 | 100.0% |
| Single Unit, Attached | 0 | 0.0% |
| 2 Unit Apartments | 0 | 0.0% |
| 3 or 4 Unit Apartments | 0 | 0.0% |
| 5 to 9 Unit Apartments | 0 | 0.0% |
| 10 or more Apartments | 0 | 0.0% |
| Mobile Home / Other | 0 | 0.0% |
| Total | 52 | 100.0% |
Housing Structures by Occupancy in Interlaken
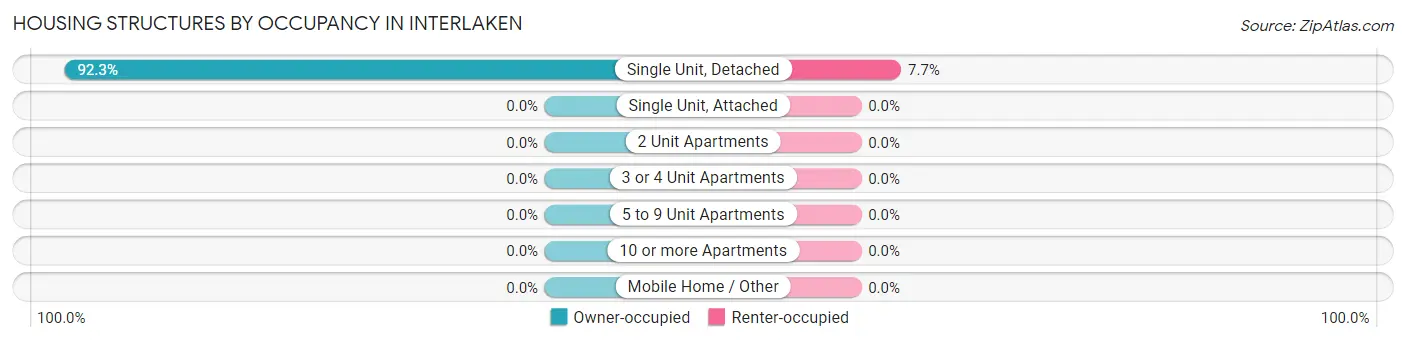
| Structure Type | Owner-occupied | Renter-occupied |
| Single Unit, Detached | 48 (92.3%) | 4 (7.7%) |
| Single Unit, Attached | 0 (0.0%) | 0 (0.0%) |
| 2 Unit Apartments | 0 (0.0%) | 0 (0.0%) |
| 3 or 4 Unit Apartments | 0 (0.0%) | 0 (0.0%) |
| 5 to 9 Unit Apartments | 0 (0.0%) | 0 (0.0%) |
| 10 or more Apartments | 0 (0.0%) | 0 (0.0%) |
| Mobile Home / Other | 0 (0.0%) | 0 (0.0%) |
| Total | 48 (92.3%) | 4 (7.7%) |
Housing Structures by Number of Rooms in Interlaken
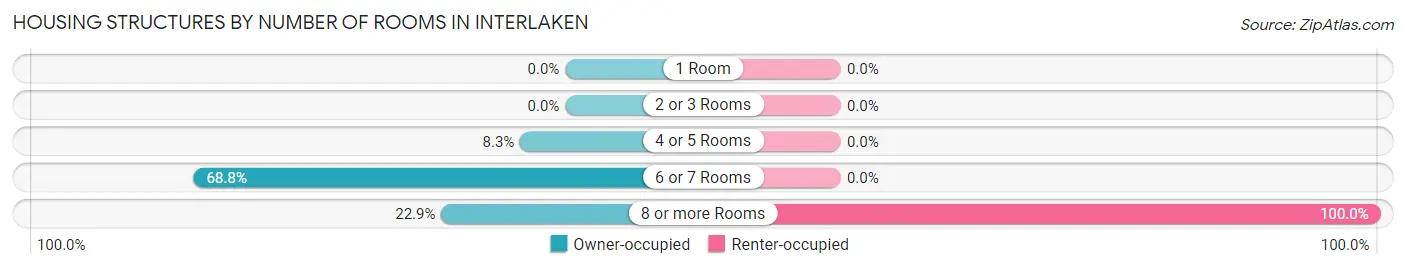
| Number of Rooms | Owner-occupied | Renter-occupied |
| 1 Room | 0 (0.0%) | 0 (0.0%) |
| 2 or 3 Rooms | 0 (0.0%) | 0 (0.0%) |
| 4 or 5 Rooms | 4 (8.3%) | 0 (0.0%) |
| 6 or 7 Rooms | 33 (68.8%) | 0 (0.0%) |
| 8 or more Rooms | 11 (22.9%) | 4 (100.0%) |
| Total | 48 (100.0%) | 4 (100.0%) |
Housing Structure by Heating Type in Interlaken
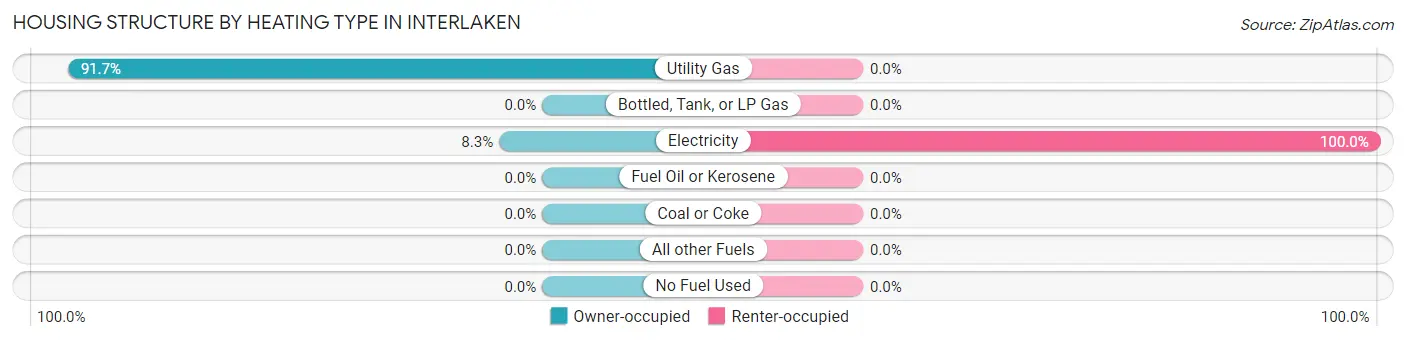
| Heating Type | Owner-occupied | Renter-occupied |
| Utility Gas | 44 (91.7%) | 0 (0.0%) |
| Bottled, Tank, or LP Gas | 0 (0.0%) | 0 (0.0%) |
| Electricity | 4 (8.3%) | 4 (100.0%) |
| Fuel Oil or Kerosene | 0 (0.0%) | 0 (0.0%) |
| Coal or Coke | 0 (0.0%) | 0 (0.0%) |
| All other Fuels | 0 (0.0%) | 0 (0.0%) |
| No Fuel Used | 0 (0.0%) | 0 (0.0%) |
| Total | 48 (100.0%) | 4 (100.0%) |
Household Vehicle Usage in Interlaken
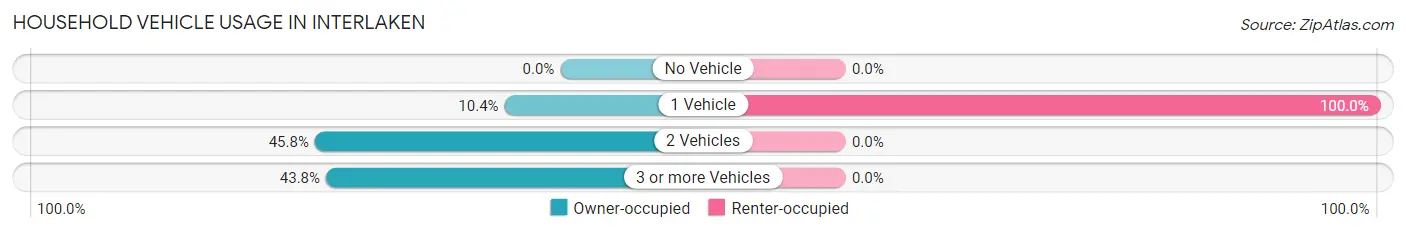
| Vehicles per Household | Owner-occupied | Renter-occupied |
| No Vehicle | 0 (0.0%) | 0 (0.0%) |
| 1 Vehicle | 5 (10.4%) | 4 (100.0%) |
| 2 Vehicles | 22 (45.8%) | 0 (0.0%) |
| 3 or more Vehicles | 21 (43.8%) | 0 (0.0%) |
| Total | 48 (100.0%) | 4 (100.0%) |
Real Estate & Mortgages in Interlaken
Real Estate and Mortgage Overview in Interlaken
| Characteristic | Without Mortgage | With Mortgage |
| Housing Units | 27 | 21 |
| Median Property Value | $625,000 | $647,700 |
| Median Household Income | - | - |
| Monthly Housing Costs | $590 | $6 |
| Real Estate Taxes | $2,607 | $0 |
Property Value by Mortgage Status in Interlaken
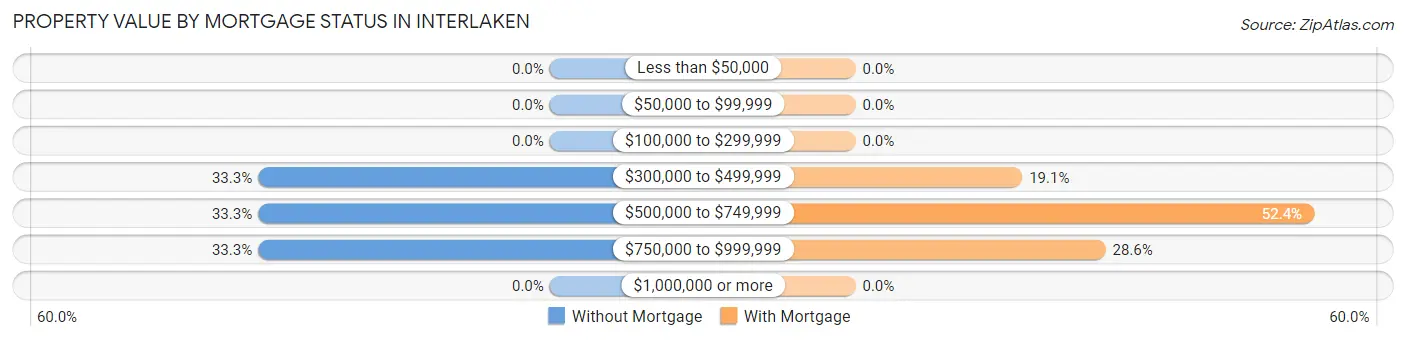
| Property Value | Without Mortgage | With Mortgage |
| Less than $50,000 | 0 (0.0%) | 0 (0.0%) |
| $50,000 to $99,999 | 0 (0.0%) | 0 (0.0%) |
| $100,000 to $299,999 | 0 (0.0%) | 0 (0.0%) |
| $300,000 to $499,999 | 9 (33.3%) | 4 (19.1%) |
| $500,000 to $749,999 | 9 (33.3%) | 11 (52.4%) |
| $750,000 to $999,999 | 9 (33.3%) | 6 (28.6%) |
| $1,000,000 or more | 0 (0.0%) | 0 (0.0%) |
| Total | 27 (100.0%) | 21 (100.0%) |
Household Income by Mortgage Status in Interlaken
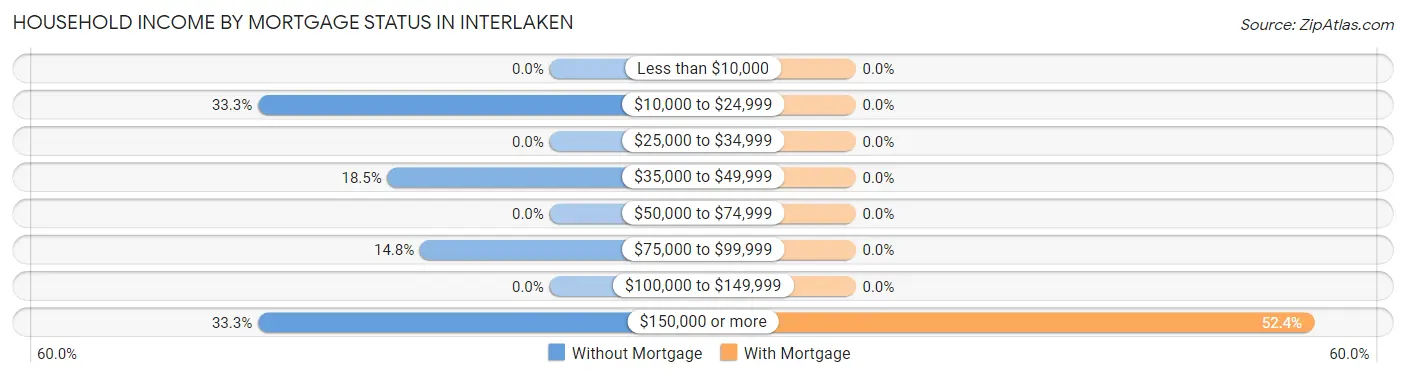
| Household Income | Without Mortgage | With Mortgage |
| Less than $10,000 | 0 (0.0%) | 0 (0.0%) |
| $10,000 to $24,999 | 9 (33.3%) | 0 (0.0%) |
| $25,000 to $34,999 | 0 (0.0%) | 0 (0.0%) |
| $35,000 to $49,999 | 5 (18.5%) | 0 (0.0%) |
| $50,000 to $74,999 | 0 (0.0%) | 0 (0.0%) |
| $75,000 to $99,999 | 4 (14.8%) | 0 (0.0%) |
| $100,000 to $149,999 | 0 (0.0%) | 0 (0.0%) |
| $150,000 or more | 9 (33.3%) | 11 (52.4%) |
| Total | 27 (100.0%) | 21 (100.0%) |
Property Value to Household Income Ratio in Interlaken
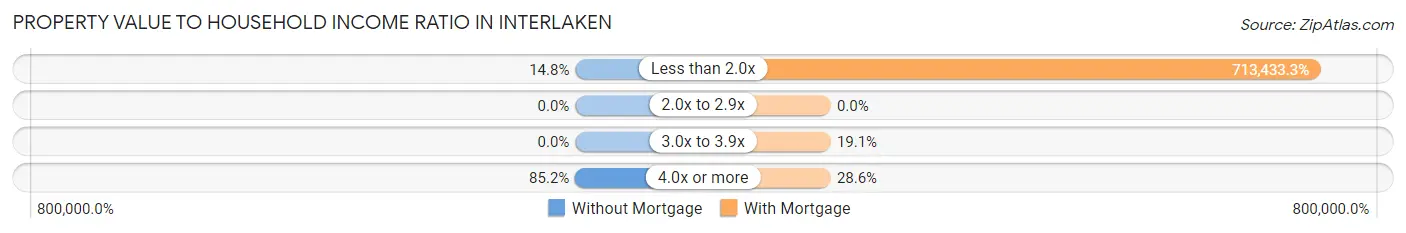
| Value-to-Income Ratio | Without Mortgage | With Mortgage |
| Less than 2.0x | 4 (14.8%) | 149,821 (713,433.3%) |
| 2.0x to 2.9x | 0 (0.0%) | 0 (0.0%) |
| 3.0x to 3.9x | 0 (0.0%) | 4 (19.1%) |
| 4.0x or more | 23 (85.2%) | 6 (28.6%) |
| Total | 27 (100.0%) | 21 (100.0%) |
Real Estate Taxes by Mortgage Status in Interlaken
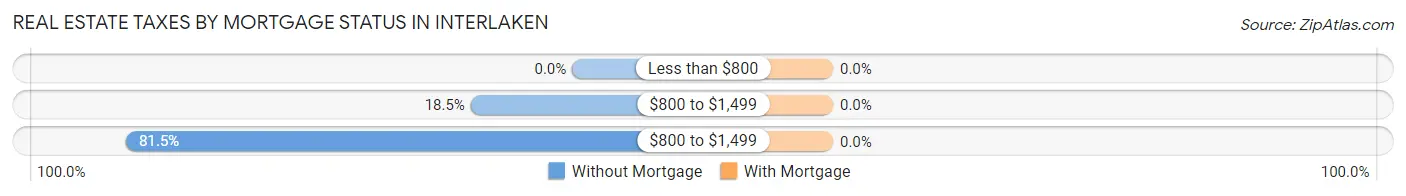
| Property Taxes | Without Mortgage | With Mortgage |
| Less than $800 | 0 (0.0%) | 0 (0.0%) |
| $800 to $1,499 | 5 (18.5%) | 0 (0.0%) |
| $800 to $1,499 | 22 (81.5%) | 0 (0.0%) |
| Total | 27 (100.0%) | 21 (100.0%) |
Health & Disability in Interlaken
Health Insurance Coverage by Age in Interlaken
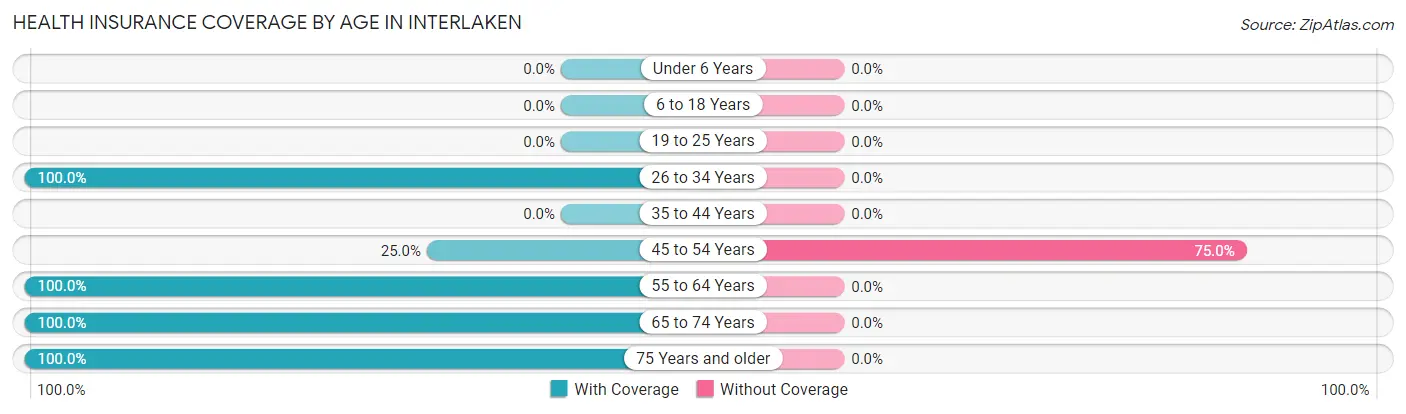
| Age Bracket | With Coverage | Without Coverage |
| Under 6 Years | 0 (0.0%) | 0 (0.0%) |
| 6 to 18 Years | 0 (0.0%) | 0 (0.0%) |
| 19 to 25 Years | 0 (0.0%) | 0 (0.0%) |
| 26 to 34 Years | 11 (100.0%) | 0 (0.0%) |
| 35 to 44 Years | 0 (0.0%) | 0 (0.0%) |
| 45 to 54 Years | 4 (25.0%) | 12 (75.0%) |
| 55 to 64 Years | 19 (100.0%) | 0 (0.0%) |
| 65 to 74 Years | 23 (100.0%) | 0 (0.0%) |
| 75 Years and older | 15 (100.0%) | 0 (0.0%) |
| Total | 72 (85.7%) | 12 (14.3%) |
Health Insurance Coverage by Citizenship Status in Interlaken
| Citizenship Status | With Coverage | Without Coverage |
| Native Born | 0 (0.0%) | 0 (0.0%) |
| Foreign Born, Citizen | 0 (0.0%) | 0 (0.0%) |
| Foreign Born, not a Citizen | 0 (0.0%) | 0 (0.0%) |
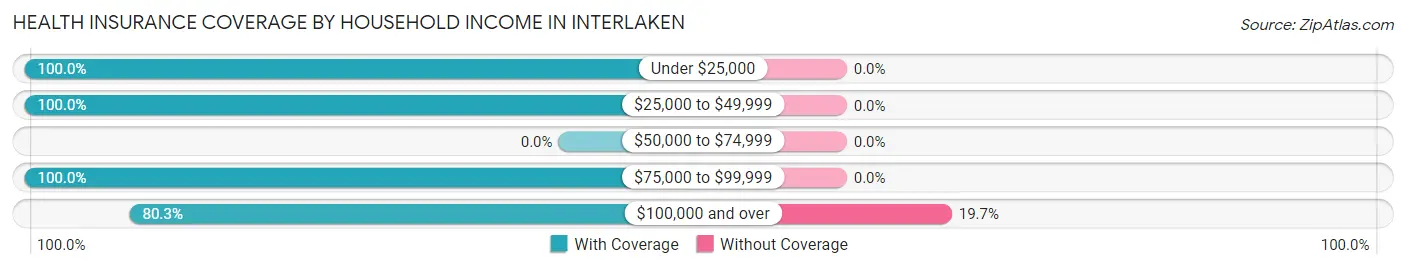
Health Insurance Coverage by Household Income in Interlaken
| Household Income | With Coverage | Without Coverage |
| Under $25,000 | 9 (100.0%) | 0 (0.0%) |
| $25,000 to $49,999 | 5 (100.0%) | 0 (0.0%) |
| $50,000 to $74,999 | 0 (0.0%) | 0 (0.0%) |
| $75,000 to $99,999 | 9 (100.0%) | 0 (0.0%) |
| $100,000 and over | 49 (80.3%) | 12 (19.7%) |
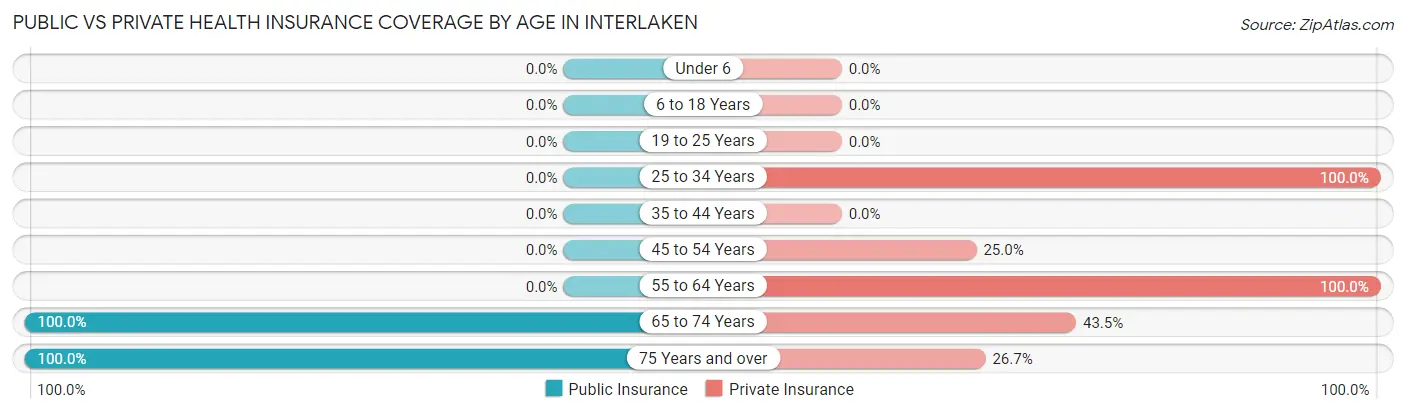
Public vs Private Health Insurance Coverage by Age in Interlaken
| Age Bracket | Public Insurance | Private Insurance |
| Under 6 | 0 (0.0%) | 0 (0.0%) |
| 6 to 18 Years | 0 (0.0%) | 0 (0.0%) |
| 19 to 25 Years | 0 (0.0%) | 0 (0.0%) |
| 25 to 34 Years | 0 (0.0%) | 11 (100.0%) |
| 35 to 44 Years | 0 (0.0%) | 0 (0.0%) |
| 45 to 54 Years | 0 (0.0%) | 4 (25.0%) |
| 55 to 64 Years | 0 (0.0%) | 19 (100.0%) |
| 65 to 74 Years | 23 (100.0%) | 10 (43.5%) |
| 75 Years and over | 15 (100.0%) | 4 (26.7%) |
| Total | 38 (45.2%) | 48 (57.1%) |
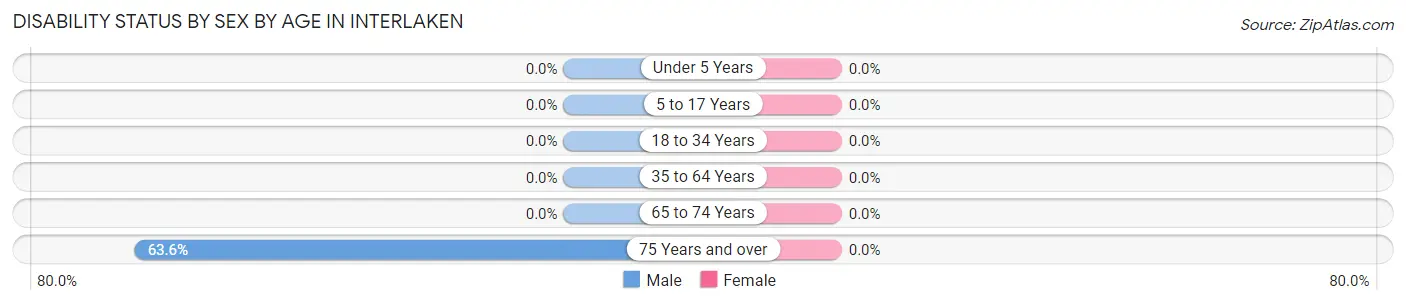
Disability Status by Sex by Age in Interlaken
| Age Bracket | Male | Female |
| Under 5 Years | 0 (0.0%) | 0 (0.0%) |
| 5 to 17 Years | 0 (0.0%) | 0 (0.0%) |
| 18 to 34 Years | 0 (0.0%) | 0 (0.0%) |
| 35 to 64 Years | 0 (0.0%) | 0 (0.0%) |
| 65 to 74 Years | 0 (0.0%) | 0 (0.0%) |
| 75 Years and over | 7 (63.6%) | 0 (0.0%) |
Disability Class by Sex by Age in Interlaken
Disability Class: Hearing Difficulty
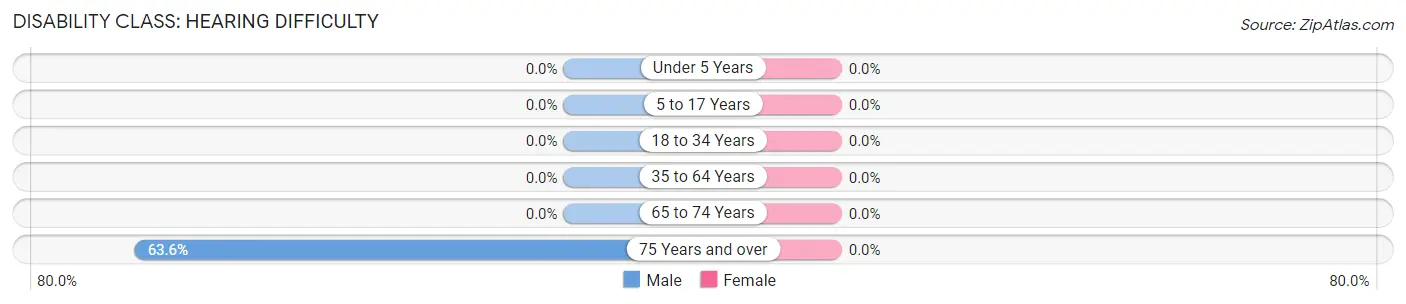
| Age Bracket | Male | Female |
| Under 5 Years | 0 (0.0%) | 0 (0.0%) |
| 5 to 17 Years | 0 (0.0%) | 0 (0.0%) |
| 18 to 34 Years | 0 (0.0%) | 0 (0.0%) |
| 35 to 64 Years | 0 (0.0%) | 0 (0.0%) |
| 65 to 74 Years | 0 (0.0%) | 0 (0.0%) |
| 75 Years and over | 7 (63.6%) | 0 (0.0%) |
Disability Class: Vision Difficulty
| Age Bracket | Male | Female |
| Under 5 Years | 0 (0.0%) | 0 (0.0%) |
| 5 to 17 Years | 0 (0.0%) | 0 (0.0%) |
| 18 to 34 Years | 0 (0.0%) | 0 (0.0%) |
| 35 to 64 Years | 0 (0.0%) | 0 (0.0%) |
| 65 to 74 Years | 0 (0.0%) | 0 (0.0%) |
| 75 Years and over | 0 (0.0%) | 0 (0.0%) |
Disability Class: Cognitive Difficulty
| Age Bracket | Male | Female |
| 5 to 17 Years | 0 (0.0%) | 0 (0.0%) |
| 18 to 34 Years | 0 (0.0%) | 0 (0.0%) |
| 35 to 64 Years | 0 (0.0%) | 0 (0.0%) |
| 65 to 74 Years | 0 (0.0%) | 0 (0.0%) |
| 75 Years and over | 0 (0.0%) | 0 (0.0%) |
Disability Class: Ambulatory Difficulty
| Age Bracket | Male | Female |
| 5 to 17 Years | 0 (0.0%) | 0 (0.0%) |
| 18 to 34 Years | 0 (0.0%) | 0 (0.0%) |
| 35 to 64 Years | 0 (0.0%) | 0 (0.0%) |
| 65 to 74 Years | 0 (0.0%) | 0 (0.0%) |
| 75 Years and over | 0 (0.0%) | 0 (0.0%) |
Disability Class: Self-Care Difficulty
| Age Bracket | Male | Female |
| 5 to 17 Years | 0 (0.0%) | 0 (0.0%) |
| 18 to 34 Years | 0 (0.0%) | 0 (0.0%) |
| 35 to 64 Years | 0 (0.0%) | 0 (0.0%) |
| 65 to 74 Years | 0 (0.0%) | 0 (0.0%) |
| 75 Years and over | 0 (0.0%) | 0 (0.0%) |
Technology Access in Interlaken
Computing Device Access in Interlaken
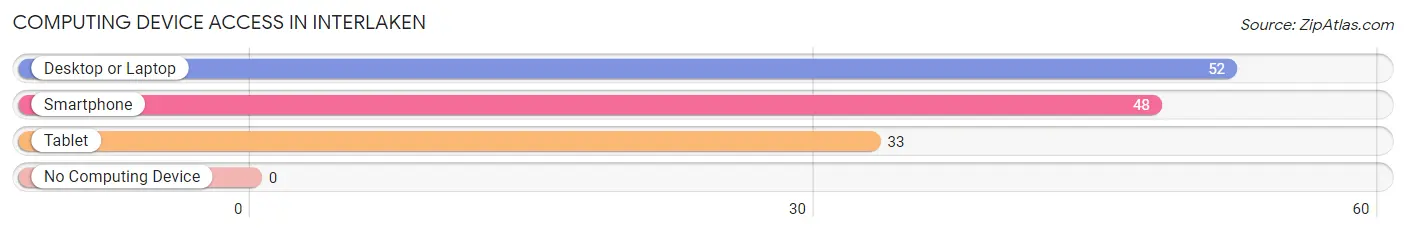
| Device Type | # Households | % Households |
| Desktop or Laptop | 52 | 100.0% |
| Smartphone | 48 | 92.3% |
| Tablet | 33 | 63.5% |
| No Computing Device | 0 | 0.0% |
| Total | 52 | 100.0% |
Internet Access in Interlaken
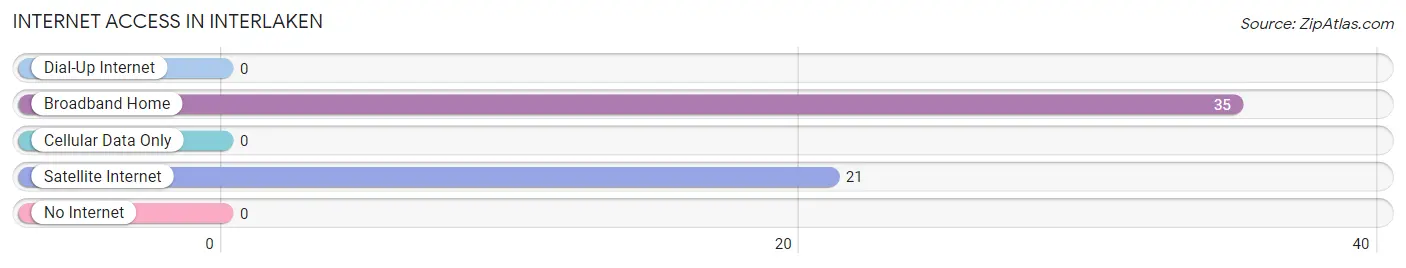
| Internet Type | # Households | % Households |
| Dial-Up Internet | 0 | 0.0% |
| Broadband Home | 35 | 67.3% |
| Cellular Data Only | 0 | 0.0% |
| Satellite Internet | 21 | 40.4% |
| No Internet | 0 | 0.0% |
| Total | 52 | 100.0% |
Interlaken Summary
Interlaken is a small town located in the Wasatch Mountains of Utah. It is situated in the Wasatch-Cache National Forest, and is surrounded by the Uinta National Forest. The town is located in Summit County, and is approximately 30 miles east of Park City. The town was founded in 1883, and is named after the nearby Interlaken Lake.
History
Interlaken was founded in 1883 by a group of Swiss immigrants who were looking for a place to settle and start a new life. The town was named after the nearby Interlaken Lake, which was named after the Swiss city of Interlaken. The town was originally a farming community, and the settlers grew potatoes, hay, and other crops. The town also had a sawmill, which provided lumber for the local area.
In the early 1900s, Interlaken began to grow and develop. The town was connected to the railroad in 1906, and the first post office was established in 1907. The town also had a school, a church, and a general store.
In the 1920s, Interlaken began to attract tourists. The town was a popular destination for hikers, campers, and fishermen. The town also had a ski resort, which opened in the 1930s.
Geography
Interlaken is located in the Wasatch Mountains of Utah. The town is situated in the Wasatch-Cache National Forest, and is surrounded by the Uinta National Forest. The town is located in Summit County, and is approximately 30 miles east of Park City.
The town is situated at an elevation of 6,400 feet, and is surrounded by mountains and forests. The nearby Interlaken Lake is a popular destination for fishing and camping. The town is also close to several ski resorts, including Park City Mountain Resort and Deer Valley Resort.
Economy
Interlaken’s economy is largely based on tourism. The town is a popular destination for hikers, campers, and fishermen. The nearby ski resorts also attract visitors from all over the world.
The town also has several businesses, including restaurants, hotels, and shops. The town also has a post office, a bank, and a library.
Demographics
As of the 2010 census, Interlaken had a population of 545. The town has a median age of 44.7 years, and a median household income of $50,000. The town is predominantly white, with 95.2% of the population identifying as white. The town also has a small Hispanic population, with 4.8% of the population identifying as Hispanic or Latino.
Interlaken is a small town with a rich history and a vibrant economy. The town is a popular destination for tourists, and is surrounded by beautiful mountains and forests. The town is also home to a diverse population, and is a great place to live and work.
Common Questions
What is Per Capita Income in Interlaken?
Per Capita income in Interlaken is $95,805.
What is the Median Family Income in Interlaken?
Median Family Income in Interlaken is $161,250.
What is the Median Household income in Interlaken?
Median Household Income in Interlaken is $131,250.
What is Inequality or Gini Index in Interlaken?
Inequality or Gini Index in Interlaken is 0.45.
What is the Total Population of Interlaken?
Total Population of Interlaken is 84.
What is the Total Male Population of Interlaken?
Total Male Population of Interlaken is 46.
What is the Total Female Population of Interlaken?
Total Female Population of Interlaken is 38.
What is the Ratio of Males per 100 Females in Interlaken?
There are 121.05 Males per 100 Females in Interlaken.
What is the Ratio of Females per 100 Males in Interlaken?
There are 82.61 Females per 100 Males in Interlaken.
What is the Median Population Age in Interlaken?
Median Population Age in Interlaken is 62.0 Years.
What is the Average Family Size in Interlaken
Average Family Size in Interlaken is 1.9 People.
What is the Average Household Size in Interlaken
Average Household Size in Interlaken is 1.6 People.
How Large is the Labor Force in Interlaken?
There are 55 People in the Labor Forcein in Interlaken.
What is the Percentage of People in the Labor Force in Interlaken?
65.5% of People are in the Labor Force in Interlaken.