Cedar City, UT Map & Demographics
Cedar City Map
Cedar City Overview
$25,540
PER CAPITA INCOME
$75,014
AVG FAMILY INCOME
$60,778
AVG HOUSEHOLD INCOME
55.7%
WAGE / INCOME GAP [ % ]
44.3¢/ $1
WAGE / INCOME GAP [ $ ]
$8,923
FAMILY INCOME DEFICIT
0.43
INEQUALITY / GINI INDEX
35,812
TOTAL POPULATION
18,011
MALE POPULATION
17,801
FEMALE POPULATION
101.18
MALES / 100 FEMALES
98.83
FEMALES / 100 MALES
26.0
MEDIAN AGE
3.6
AVG FAMILY SIZE
3.1
AVG HOUSEHOLD SIZE
18,009
LABOR FORCE [ PEOPLE ]
66.4%
PERCENT IN LABOR FORCE
3.1%
UNEMPLOYMENT RATE
Cedar City Area Codes
Income in Cedar City
Income Overview in Cedar City
Per Capita Income in Cedar City is $25,540, while median incomes of families and households are $75,014 and $60,778 respectively.
| Characteristic | Number | Measure |
| Per Capita Income | 35,812 | $25,540 |
| Median Family Income | 7,631 | $75,014 |
| Mean Family Income | 7,631 | $91,418 |
| Median Household Income | 11,377 | $60,778 |
| Mean Household Income | 11,377 | $77,763 |
| Income Deficit | 7,631 | $8,923 |
| Wage / Income Gap (%) | 35,812 | 55.68% |
| Wage / Income Gap ($) | 35,812 | 44.32¢ per $1 |
| Gini / Inequality Index | 35,812 | 0.43 |
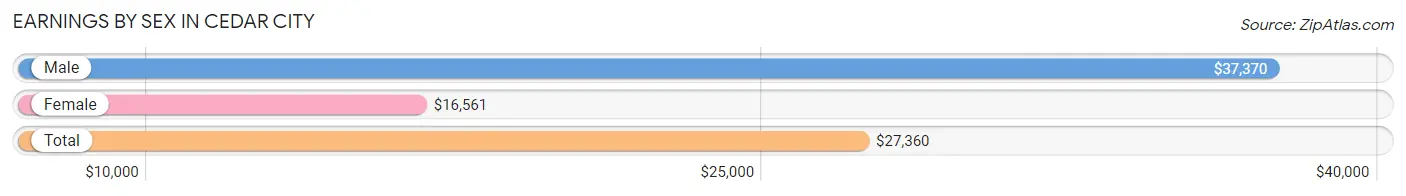
Earnings by Sex in Cedar City
Average Earnings in Cedar City are $27,360, $37,370 for men and $16,561 for women, a difference of 55.7%.
| Sex | Number | Average Earnings |
| Male | 10,266 (52.9%) | $37,370 |
| Female | 9,135 (47.1%) | $16,561 |
| Total | 19,401 (100.0%) | $27,360 |
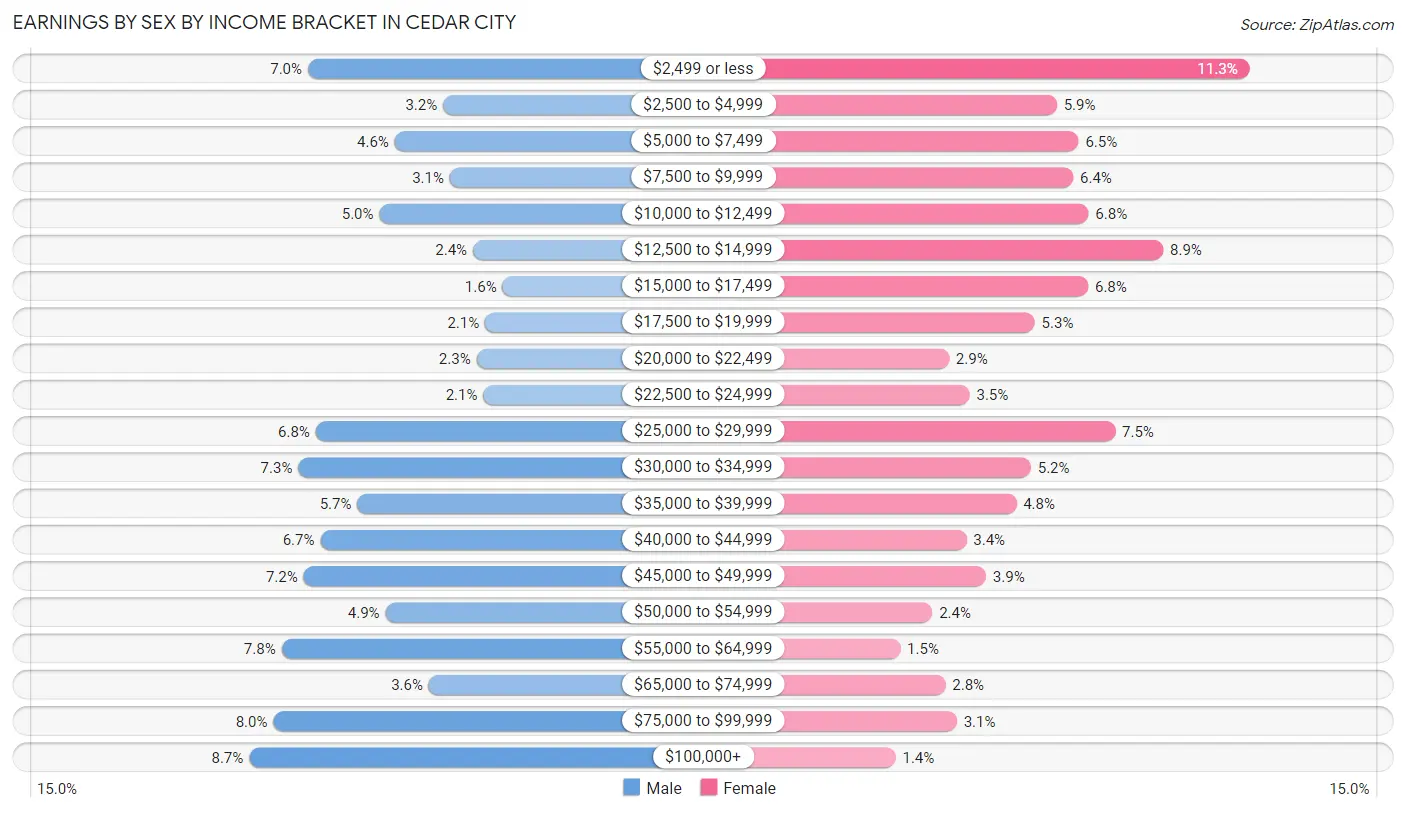
Earnings by Sex by Income Bracket in Cedar City
The most common earnings brackets in Cedar City are $100,000+ for men (892 | 8.7%) and $2,499 or less for women (1,034 | 11.3%).
| Income | Male | Female |
| $2,499 or less | 723 (7.0%) | 1,034 (11.3%) |
| $2,500 to $4,999 | 333 (3.2%) | 539 (5.9%) |
| $5,000 to $7,499 | 472 (4.6%) | 595 (6.5%) |
| $7,500 to $9,999 | 313 (3.0%) | 581 (6.4%) |
| $10,000 to $12,499 | 516 (5.0%) | 620 (6.8%) |
| $12,500 to $14,999 | 246 (2.4%) | 812 (8.9%) |
| $15,000 to $17,499 | 161 (1.6%) | 619 (6.8%) |
| $17,500 to $19,999 | 211 (2.1%) | 482 (5.3%) |
| $20,000 to $22,499 | 236 (2.3%) | 262 (2.9%) |
| $22,500 to $24,999 | 217 (2.1%) | 315 (3.5%) |
| $25,000 to $29,999 | 700 (6.8%) | 689 (7.5%) |
| $30,000 to $34,999 | 750 (7.3%) | 472 (5.2%) |
| $35,000 to $39,999 | 580 (5.7%) | 435 (4.8%) |
| $40,000 to $44,999 | 687 (6.7%) | 307 (3.4%) |
| $45,000 to $49,999 | 735 (7.2%) | 357 (3.9%) |
| $50,000 to $54,999 | 499 (4.9%) | 219 (2.4%) |
| $55,000 to $64,999 | 799 (7.8%) | 137 (1.5%) |
| $65,000 to $74,999 | 374 (3.6%) | 253 (2.8%) |
| $75,000 to $99,999 | 822 (8.0%) | 282 (3.1%) |
| $100,000+ | 892 (8.7%) | 125 (1.4%) |
| Total | 10,266 (100.0%) | 9,135 (100.0%) |
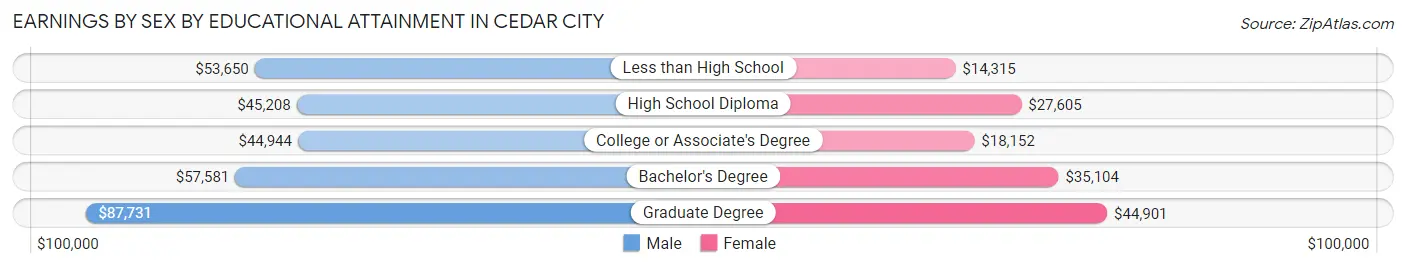
Earnings by Sex by Educational Attainment in Cedar City
Average earnings in Cedar City are $47,148 for men and $22,975 for women, a difference of 51.3%. Men with an educational attainment of graduate degree enjoy the highest average annual earnings of $87,731, while those with college or associate's degree education earn the least with $44,944. Women with an educational attainment of graduate degree earn the most with the average annual earnings of $44,901, while those with less than high school education have the smallest earnings of $14,315.
| Educational Attainment | Male Income | Female Income |
| Less than High School | $53,650 | $14,315 |
| High School Diploma | $45,208 | $27,605 |
| College or Associate's Degree | $44,944 | $18,152 |
| Bachelor's Degree | $57,581 | $35,104 |
| Graduate Degree | $87,731 | $44,901 |
| Total | $47,148 | $22,975 |
Family Income in Cedar City
Family Income Brackets in Cedar City
According to the Cedar City family income data, there are 1,686 families falling into the $50,000 to $74,999 income range, which is the most common income bracket and makes up 22.1% of all families. Conversely, the $10,000 to $14,999 income bracket is the least frequent group with only 137 families (1.8%) belonging to this category.
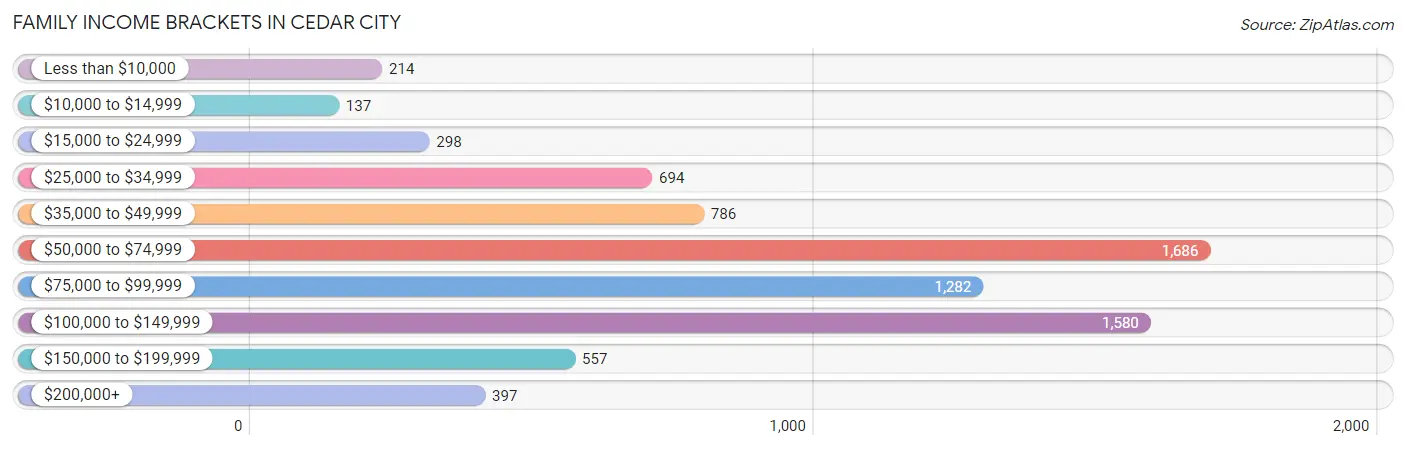
| Income Bracket | # Families | % Families |
| Less than $10,000 | 214 | 2.8% |
| $10,000 to $14,999 | 137 | 1.8% |
| $15,000 to $24,999 | 298 | 3.9% |
| $25,000 to $34,999 | 694 | 9.1% |
| $35,000 to $49,999 | 786 | 10.3% |
| $50,000 to $74,999 | 1,686 | 22.1% |
| $75,000 to $99,999 | 1,282 | 16.8% |
| $100,000 to $149,999 | 1,580 | 20.7% |
| $150,000 to $199,999 | 557 | 7.3% |
| $200,000+ | 397 | 5.2% |
Family Income by Famaliy Size in Cedar City
7+ person families (311 | 4.1%) account for the highest median family income in Cedar City with $197,617 per family, while 2-person families (2,785 | 36.5%) have the highest median income of $37,104 per family member.
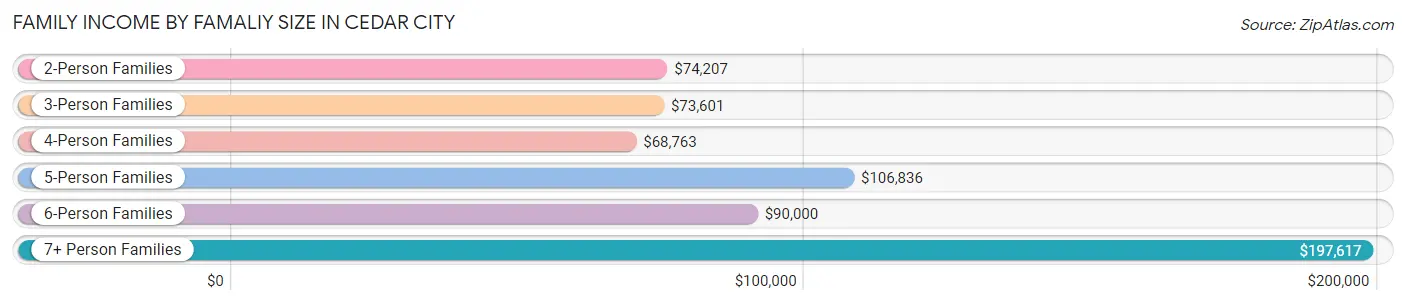
| Income Bracket | # Families | Median Income |
| 2-Person Families | 2,785 (36.5%) | $74,207 |
| 3-Person Families | 1,277 (16.7%) | $73,601 |
| 4-Person Families | 2,096 (27.5%) | $68,763 |
| 5-Person Families | 768 (10.1%) | $106,836 |
| 6-Person Families | 394 (5.2%) | $90,000 |
| 7+ Person Families | 311 (4.1%) | $197,617 |
| Total | 7,631 (100.0%) | $75,014 |
Family Income by Number of Earners in Cedar City
The median family income in Cedar City is $75,014, with families comprising 3+ earners (1,313) having the highest median family income of $120,292, while families with 1 earner (2,222) have the lowest median family income of $50,561, accounting for 17.2% and 29.1% of families, respectively.
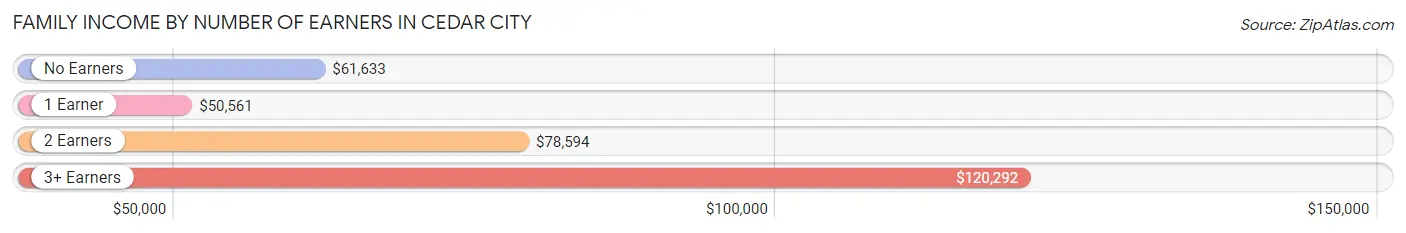
| Number of Earners | # Families | Median Income |
| No Earners | 876 (11.5%) | $61,633 |
| 1 Earner | 2,222 (29.1%) | $50,561 |
| 2 Earners | 3,220 (42.2%) | $78,594 |
| 3+ Earners | 1,313 (17.2%) | $120,292 |
| Total | 7,631 (100.0%) | $75,014 |
Household Income in Cedar City
Household Income Brackets in Cedar City
With 2,241 households falling in the category, the $50,000 to $74,999 income range is the most frequent in Cedar City, accounting for 19.7% of all households. In contrast, only 478 households (4.2%) fall into the $200,000+ income bracket, making it the least populous group.
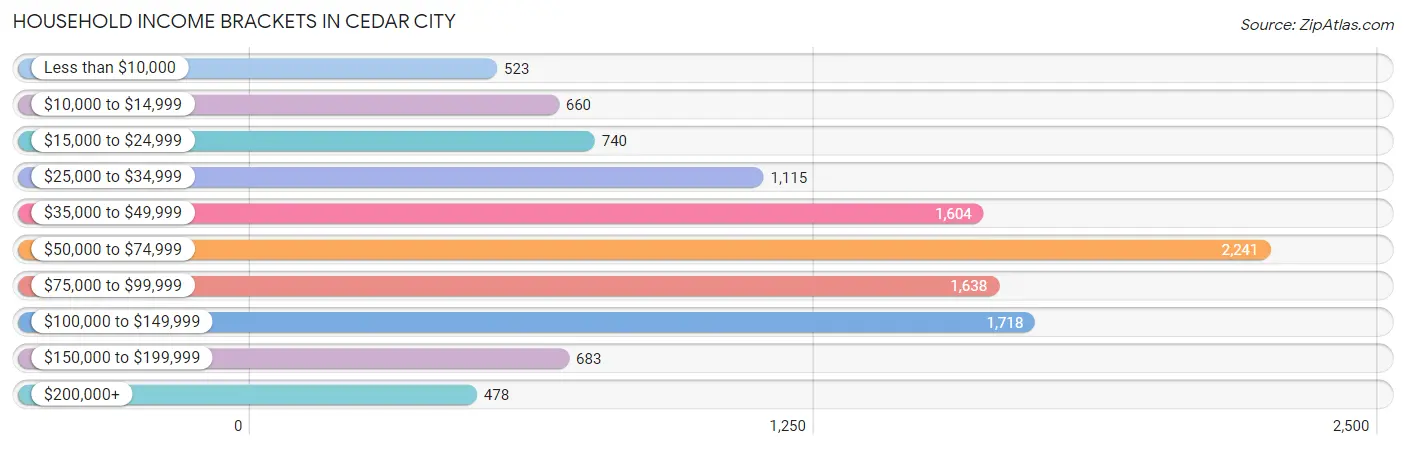
| Income Bracket | # Households | % Households |
| Less than $10,000 | 523 | 4.6% |
| $10,000 to $14,999 | 660 | 5.8% |
| $15,000 to $24,999 | 740 | 6.5% |
| $25,000 to $34,999 | 1,115 | 9.8% |
| $35,000 to $49,999 | 1,604 | 14.1% |
| $50,000 to $74,999 | 2,241 | 19.7% |
| $75,000 to $99,999 | 1,638 | 14.4% |
| $100,000 to $149,999 | 1,718 | 15.1% |
| $150,000 to $199,999 | 683 | 6.0% |
| $200,000+ | 478 | 4.2% |
Household Income by Householder Age in Cedar City
The median household income in Cedar City is $60,778, with the highest median household income of $78,022 found in the 45 to 64 years age bracket for the primary householder. A total of 3,207 households (28.2%) fall into this category. Meanwhile, the 15 to 24 years age bracket for the primary householder has the lowest median household income of $29,728, with 1,920 households (16.9%) in this group.
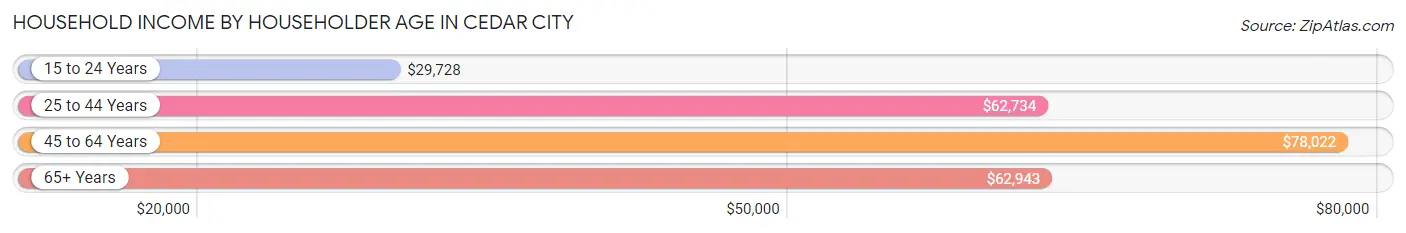
| Income Bracket | # Households | Median Income |
| 15 to 24 Years | 1,920 (16.9%) | $29,728 |
| 25 to 44 Years | 3,944 (34.7%) | $62,734 |
| 45 to 64 Years | 3,207 (28.2%) | $78,022 |
| 65+ Years | 2,306 (20.3%) | $62,943 |
| Total | 11,377 (100.0%) | $60,778 |
Poverty in Cedar City
Income Below Poverty by Sex and Age in Cedar City
With 15.3% poverty level for males and 20.1% for females among the residents of Cedar City, 18 to 24 year old males and 18 to 24 year old females are the most vulnerable to poverty, with 1,082 males (32.8%) and 1,970 females (50.6%) in their respective age groups living below the poverty level.
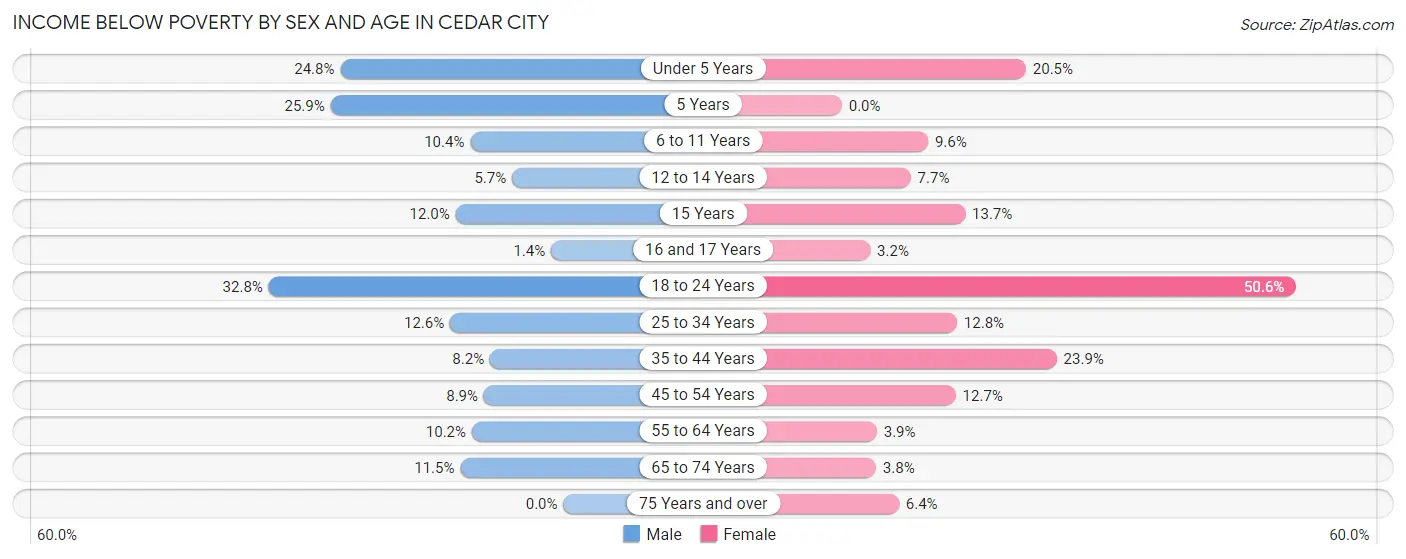
| Age Bracket | Male | Female |
| Under 5 Years | 359 (24.8%) | 253 (20.5%) |
| 5 Years | 70 (25.9%) | 0 (0.0%) |
| 6 to 11 Years | 210 (10.4%) | 148 (9.6%) |
| 12 to 14 Years | 39 (5.7%) | 55 (7.7%) |
| 15 Years | 30 (12.0%) | 28 (13.7%) |
| 16 and 17 Years | 7 (1.4%) | 15 (3.2%) |
| 18 to 24 Years | 1,082 (32.8%) | 1,970 (50.6%) |
| 25 to 34 Years | 362 (12.6%) | 347 (12.8%) |
| 35 to 44 Years | 152 (8.2%) | 374 (23.9%) |
| 45 to 54 Years | 119 (8.8%) | 193 (12.7%) |
| 55 to 64 Years | 137 (10.2%) | 52 (3.9%) |
| 65 to 74 Years | 128 (11.5%) | 48 (3.8%) |
| 75 Years and over | 0 (0.0%) | 52 (6.4%) |
| Total | 2,695 (15.3%) | 3,535 (20.1%) |
Income Above Poverty by Sex and Age in Cedar City
According to the poverty statistics in Cedar City, males aged 75 years and over and females aged 5 years are the age groups that are most secure financially, with 100.0% of males and 100.0% of females in these age groups living above the poverty line.
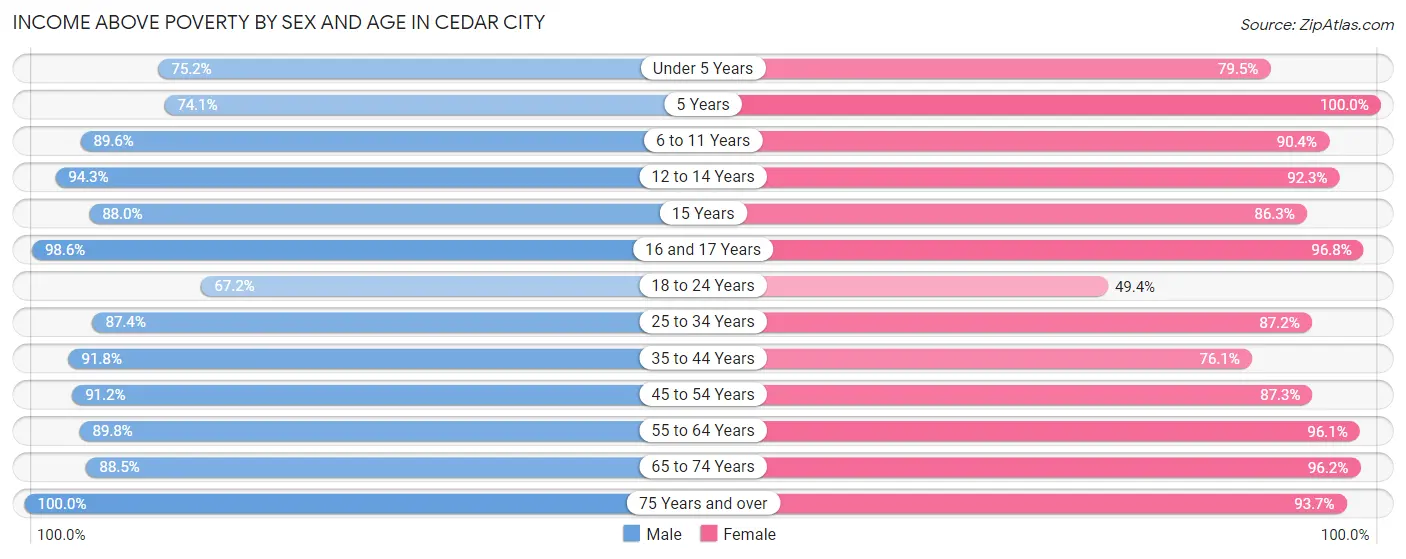
| Age Bracket | Male | Female |
| Under 5 Years | 1,086 (75.2%) | 981 (79.5%) |
| 5 Years | 200 (74.1%) | 295 (100.0%) |
| 6 to 11 Years | 1,815 (89.6%) | 1,393 (90.4%) |
| 12 to 14 Years | 644 (94.3%) | 662 (92.3%) |
| 15 Years | 220 (88.0%) | 176 (86.3%) |
| 16 and 17 Years | 503 (98.6%) | 460 (96.8%) |
| 18 to 24 Years | 2,215 (67.2%) | 1,923 (49.4%) |
| 25 to 34 Years | 2,506 (87.4%) | 2,359 (87.2%) |
| 35 to 44 Years | 1,708 (91.8%) | 1,189 (76.1%) |
| 45 to 54 Years | 1,226 (91.1%) | 1,329 (87.3%) |
| 55 to 64 Years | 1,208 (89.8%) | 1,281 (96.1%) |
| 65 to 74 Years | 987 (88.5%) | 1,215 (96.2%) |
| 75 Years and over | 651 (100.0%) | 767 (93.6%) |
| Total | 14,969 (84.7%) | 14,030 (79.9%) |
Income Below Poverty Among Married-Couple Families in Cedar City
The poverty statistics for married-couple families in Cedar City show that 5.9% or 363 of the total 6,127 families live below the poverty line. Families with 5 or more children have the highest poverty rate of 17.5%, comprising of 43 families. On the other hand, families with no children have the lowest poverty rate of 3.2%, which includes 96 families.
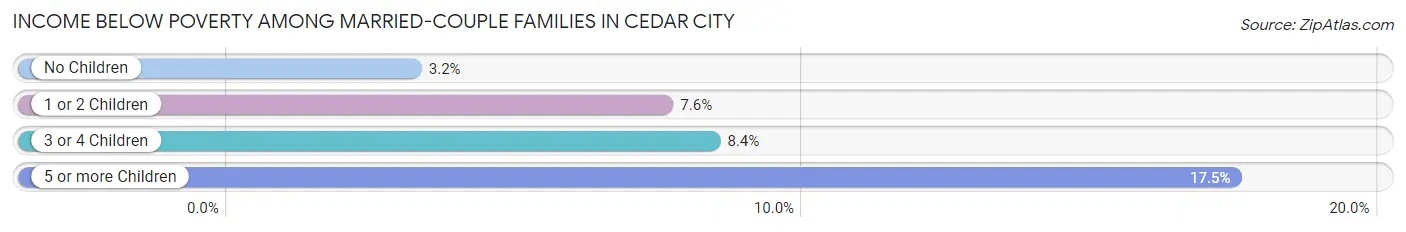
| Children | Above Poverty | Below Poverty |
| No Children | 2,907 (96.8%) | 96 (3.2%) |
| 1 or 2 Children | 2,011 (92.4%) | 165 (7.6%) |
| 3 or 4 Children | 643 (91.6%) | 59 (8.4%) |
| 5 or more Children | 203 (82.5%) | 43 (17.5%) |
| Total | 5,764 (94.1%) | 363 (5.9%) |
Income Below Poverty Among Single-Parent Households in Cedar City
According to the poverty data in Cedar City, 13.8% or 79 single-father households and 27.7% or 258 single-mother households are living below the poverty line. Among single-father households, those with no children have the highest poverty rate, with 34 households (17.3%) experiencing poverty. Likewise, among single-mother households, those with 1 or 2 children have the highest poverty rate, with 157 households (43.0%) falling below the poverty line.
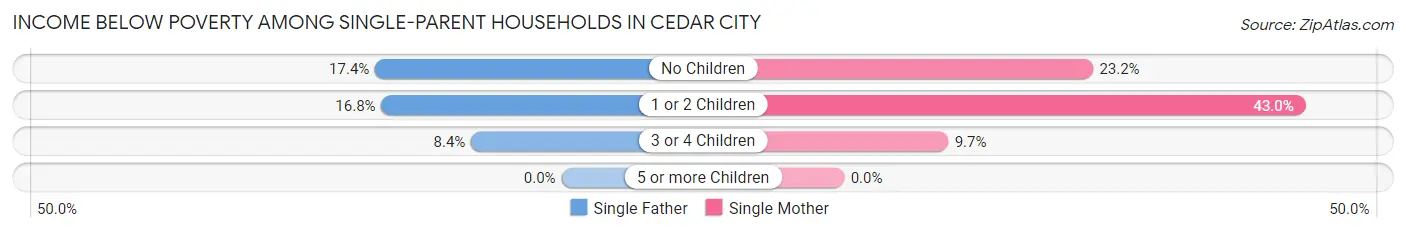
| Children | Single Father | Single Mother |
| No Children | 34 (17.3%) | 79 (23.2%) |
| 1 or 2 Children | 27 (16.8%) | 157 (43.0%) |
| 3 or 4 Children | 18 (8.4%) | 22 (9.7%) |
| 5 or more Children | 0 (0.0%) | 0 (0.0%) |
| Total | 79 (13.8%) | 258 (27.7%) |
Income Below Poverty Among Married-Couple vs Single-Parent Households in Cedar City
The poverty data for Cedar City shows that 363 of the married-couple family households (5.9%) and 337 of the single-parent households (22.4%) are living below the poverty level. Within the married-couple family households, those with 5 or more children have the highest poverty rate, with 43 households (17.5%) falling below the poverty line. Among the single-parent households, those with 1 or 2 children have the highest poverty rate, with 184 household (35.0%) living below poverty.
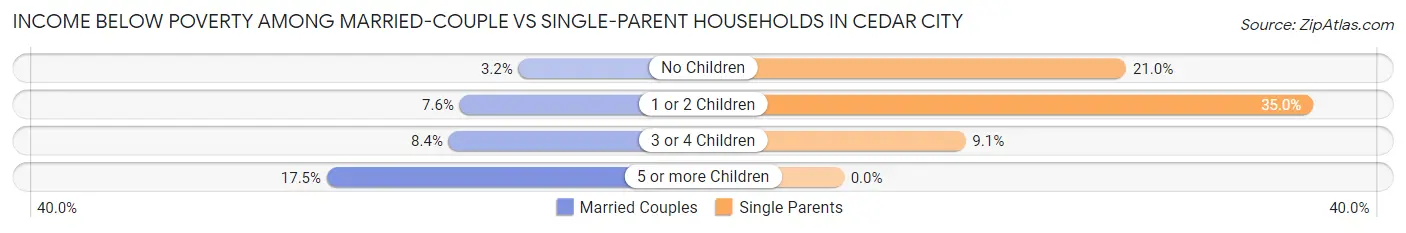
| Children | Married-Couple Families | Single-Parent Households |
| No Children | 96 (3.2%) | 113 (21.0%) |
| 1 or 2 Children | 165 (7.6%) | 184 (35.0%) |
| 3 or 4 Children | 59 (8.4%) | 40 (9.1%) |
| 5 or more Children | 43 (17.5%) | 0 (0.0%) |
| Total | 363 (5.9%) | 337 (22.4%) |
Race in Cedar City
The most populous races in Cedar City are White / Caucasian (30,321 | 84.7%), Hispanic or Latino (4,863 | 13.6%), and Two or more Races (2,551 | 7.1%).
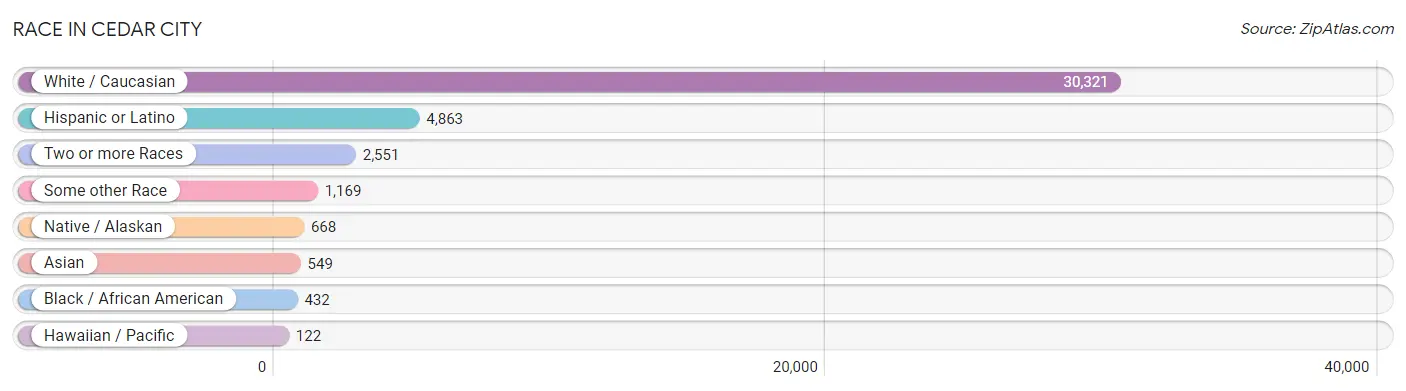
| Race | # Population | % Population |
| Asian | 549 | 1.5% |
| Black / African American | 432 | 1.2% |
| Hawaiian / Pacific | 122 | 0.3% |
| Hispanic or Latino | 4,863 | 13.6% |
| Native / Alaskan | 668 | 1.9% |
| White / Caucasian | 30,321 | 84.7% |
| Two or more Races | 2,551 | 7.1% |
| Some other Race | 1,169 | 3.3% |
| Total | 35,812 | 100.0% |
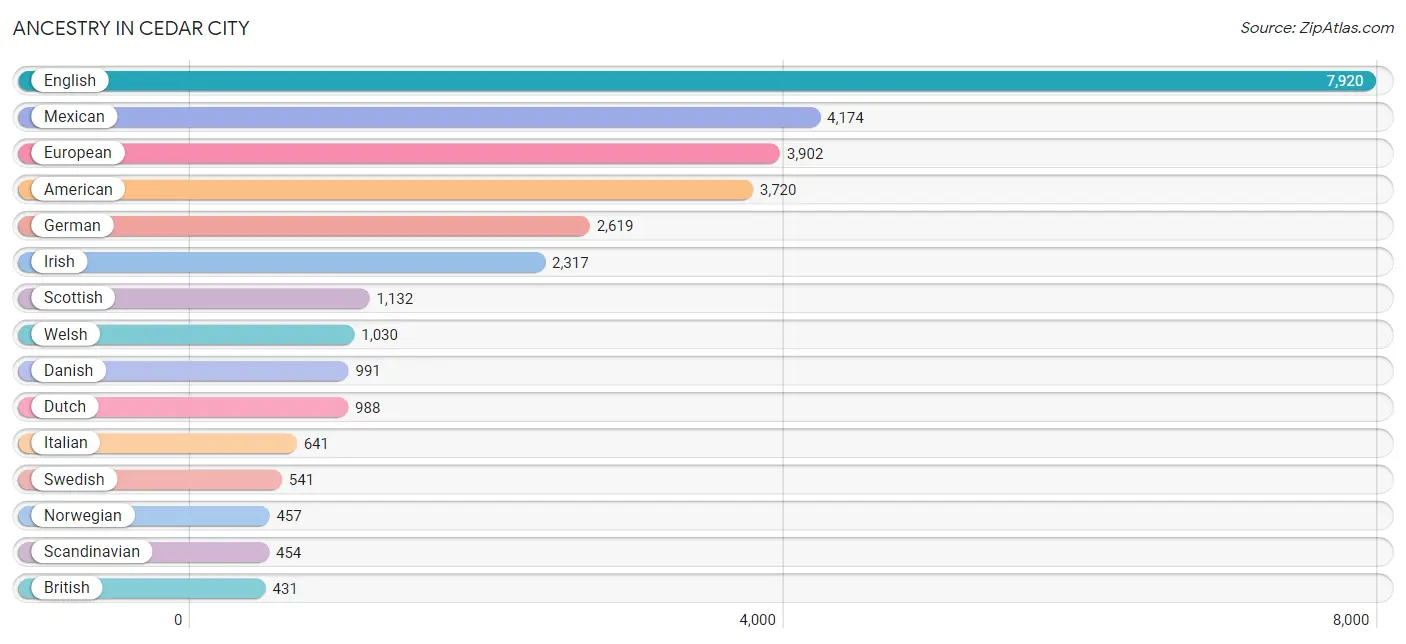
Ancestry in Cedar City
The most populous ancestries reported in Cedar City are English (7,920 | 22.1%), Mexican (4,174 | 11.7%), European (3,902 | 10.9%), American (3,720 | 10.4%), and German (2,619 | 7.3%), together accounting for 62.4% of all Cedar City residents.
| Ancestry | # Population | % Population |
| African | 53 | 0.2% |
| Alaska Native | 43 | 0.1% |
| American | 3,720 | 10.4% |
| Arab | 95 | 0.3% |
| Argentinean | 68 | 0.2% |
| Armenian | 7 | 0.0% |
| Barbadian | 17 | 0.1% |
| Belgian | 4 | 0.0% |
| Bhutanese | 88 | 0.3% |
| Blackfeet | 33 | 0.1% |
| Brazilian | 33 | 0.1% |
| British | 431 | 1.2% |
| Burmese | 74 | 0.2% |
| Cambodian | 2 | 0.0% |
| Canadian | 29 | 0.1% |
| Central American | 161 | 0.4% |
| Central American Indian | 43 | 0.1% |
| Cherokee | 305 | 0.9% |
| Chilean | 18 | 0.1% |
| Colombian | 125 | 0.4% |
| Costa Rican | 45 | 0.1% |
| Croatian | 23 | 0.1% |
| Cuban | 45 | 0.1% |
| Czechoslovakian | 31 | 0.1% |
| Danish | 991 | 2.8% |
| Dutch | 988 | 2.8% |
| English | 7,920 | 22.1% |
| European | 3,902 | 10.9% |
| Filipino | 12 | 0.0% |
| French | 427 | 1.2% |
| French Canadian | 94 | 0.3% |
| German | 2,619 | 7.3% |
| Ghanaian | 19 | 0.1% |
| Greek | 104 | 0.3% |
| Guatemalan | 17 | 0.1% |
| Hopi | 13 | 0.0% |
| Hungarian | 155 | 0.4% |
| Icelander | 24 | 0.1% |
| Indian (Asian) | 282 | 0.8% |
| Iranian | 28 | 0.1% |
| Irish | 2,317 | 6.5% |
| Iroquois | 28 | 0.1% |
| Italian | 641 | 1.8% |
| Korean | 81 | 0.2% |
| Lebanese | 62 | 0.2% |
| Lithuanian | 16 | 0.0% |
| Mexican | 4,174 | 11.7% |
| Mexican American Indian | 34 | 0.1% |
| Native Hawaiian | 133 | 0.4% |
| Navajo | 388 | 1.1% |
| Nicaraguan | 8 | 0.0% |
| Northern European | 53 | 0.2% |
| Norwegian | 457 | 1.3% |
| Paiute | 162 | 0.4% |
| Pakistani | 14 | 0.0% |
| Peruvian | 10 | 0.0% |
| Polish | 371 | 1.0% |
| Portuguese | 161 | 0.4% |
| Puerto Rican | 23 | 0.1% |
| Romanian | 17 | 0.1% |
| Russian | 67 | 0.2% |
| Salvadoran | 91 | 0.3% |
| Samoan | 157 | 0.4% |
| Scandinavian | 454 | 1.3% |
| Scotch-Irish | 205 | 0.6% |
| Scottish | 1,132 | 3.2% |
| Shoshone | 25 | 0.1% |
| Slovak | 36 | 0.1% |
| South American | 221 | 0.6% |
| Spaniard | 50 | 0.1% |
| Spanish | 70 | 0.2% |
| Sri Lankan | 31 | 0.1% |
| Subsaharan African | 72 | 0.2% |
| Swedish | 541 | 1.5% |
| Swiss | 372 | 1.0% |
| Thai | 274 | 0.8% |
| Tongan | 109 | 0.3% |
| Ute | 1 | 0.0% |
| Welsh | 1,030 | 2.9% |
| Yuman | 8 | 0.0% | View All 80 Rows |
Immigrants in Cedar City
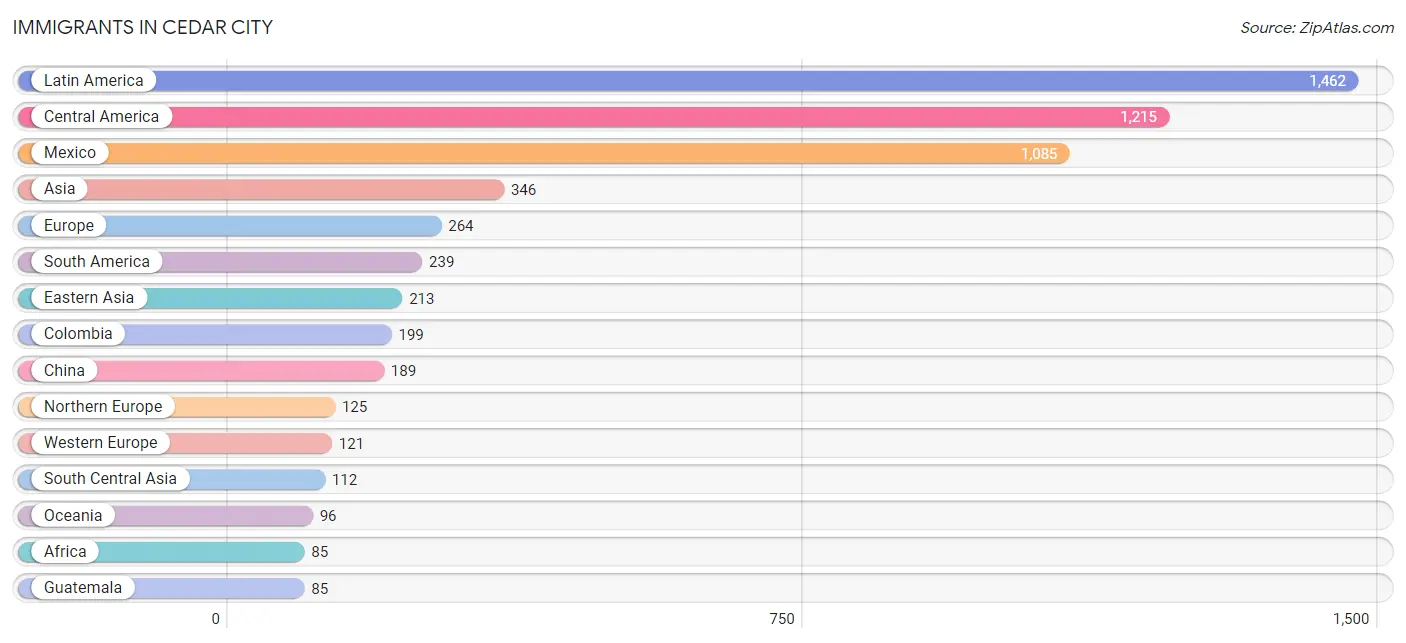
The most numerous immigrant groups reported in Cedar City came from Latin America (1,462 | 4.1%), Central America (1,215 | 3.4%), Mexico (1,085 | 3.0%), Asia (346 | 1.0%), and Europe (264 | 0.7%), together accounting for 12.2% of all Cedar City residents.
| Immigration Origin | # Population | % Population |
| Africa | 85 | 0.2% |
| Asia | 346 | 1.0% |
| Australia | 67 | 0.2% |
| Brazil | 22 | 0.1% |
| Canada | 75 | 0.2% |
| Caribbean | 8 | 0.0% |
| Central America | 1,215 | 3.4% |
| Chile | 18 | 0.1% |
| China | 189 | 0.5% |
| Colombia | 199 | 0.6% |
| Congo | 28 | 0.1% |
| Costa Rica | 45 | 0.1% |
| Denmark | 27 | 0.1% |
| Eastern Africa | 11 | 0.0% |
| Eastern Asia | 213 | 0.6% |
| Eastern Europe | 10 | 0.0% |
| England | 72 | 0.2% |
| Europe | 264 | 0.7% |
| France | 11 | 0.0% |
| Germany | 69 | 0.2% |
| Ghana | 19 | 0.1% |
| Guatemala | 85 | 0.2% |
| Hong Kong | 52 | 0.2% |
| India | 52 | 0.2% |
| Iran | 28 | 0.1% |
| Italy | 8 | 0.0% |
| Japan | 20 | 0.1% |
| Kenya | 9 | 0.0% |
| Latin America | 1,462 | 4.1% |
| Mexico | 1,085 | 3.0% |
| Middle Africa | 28 | 0.1% |
| Morocco | 27 | 0.1% |
| Nepal | 19 | 0.1% |
| Netherlands | 9 | 0.0% |
| Northern Africa | 27 | 0.1% |
| Northern Europe | 125 | 0.4% |
| Oceania | 96 | 0.3% |
| Philippines | 14 | 0.0% |
| Romania | 10 | 0.0% |
| South America | 239 | 0.7% |
| South Central Asia | 112 | 0.3% |
| South Eastern Asia | 21 | 0.1% |
| Southern Europe | 8 | 0.0% |
| Switzerland | 32 | 0.1% |
| Taiwan | 12 | 0.0% |
| Thailand | 7 | 0.0% |
| Trinidad and Tobago | 8 | 0.0% |
| Western Africa | 19 | 0.1% |
| Western Europe | 121 | 0.3% | View All 49 Rows |
Sex and Age in Cedar City
Sex and Age in Cedar City
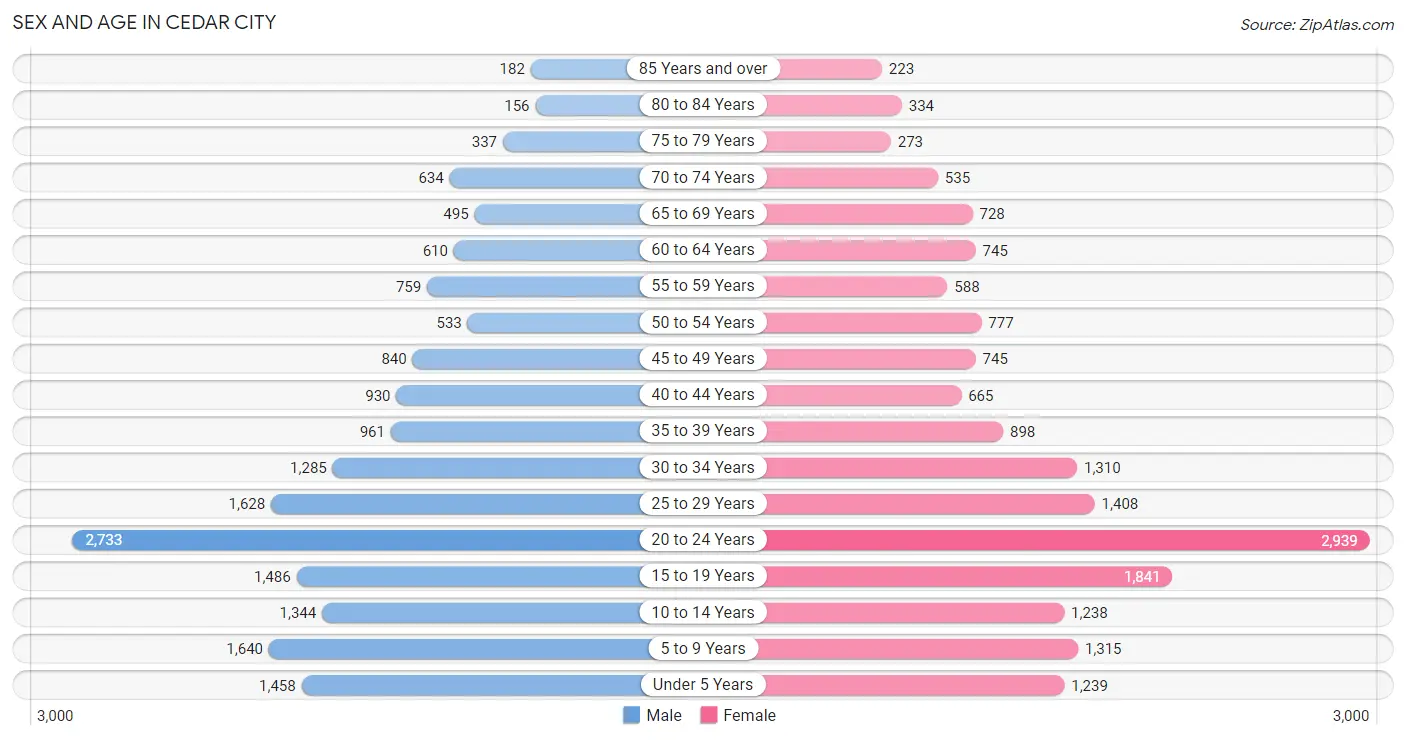
The most populous age groups in Cedar City are 20 to 24 Years (2,733 | 15.2%) for men and 20 to 24 Years (2,939 | 16.5%) for women.
| Age Bracket | Male | Female |
| Under 5 Years | 1,458 (8.1%) | 1,239 (7.0%) |
| 5 to 9 Years | 1,640 (9.1%) | 1,315 (7.4%) |
| 10 to 14 Years | 1,344 (7.5%) | 1,238 (7.0%) |
| 15 to 19 Years | 1,486 (8.3%) | 1,841 (10.3%) |
| 20 to 24 Years | 2,733 (15.2%) | 2,939 (16.5%) |
| 25 to 29 Years | 1,628 (9.0%) | 1,408 (7.9%) |
| 30 to 34 Years | 1,285 (7.1%) | 1,310 (7.4%) |
| 35 to 39 Years | 961 (5.3%) | 898 (5.0%) |
| 40 to 44 Years | 930 (5.2%) | 665 (3.7%) |
| 45 to 49 Years | 840 (4.7%) | 745 (4.2%) |
| 50 to 54 Years | 533 (3.0%) | 777 (4.4%) |
| 55 to 59 Years | 759 (4.2%) | 588 (3.3%) |
| 60 to 64 Years | 610 (3.4%) | 745 (4.2%) |
| 65 to 69 Years | 495 (2.8%) | 728 (4.1%) |
| 70 to 74 Years | 634 (3.5%) | 535 (3.0%) |
| 75 to 79 Years | 337 (1.9%) | 273 (1.5%) |
| 80 to 84 Years | 156 (0.9%) | 334 (1.9%) |
| 85 Years and over | 182 (1.0%) | 223 (1.3%) |
| Total | 18,011 (100.0%) | 17,801 (100.0%) |
Families and Households in Cedar City
Median Family Size in Cedar City
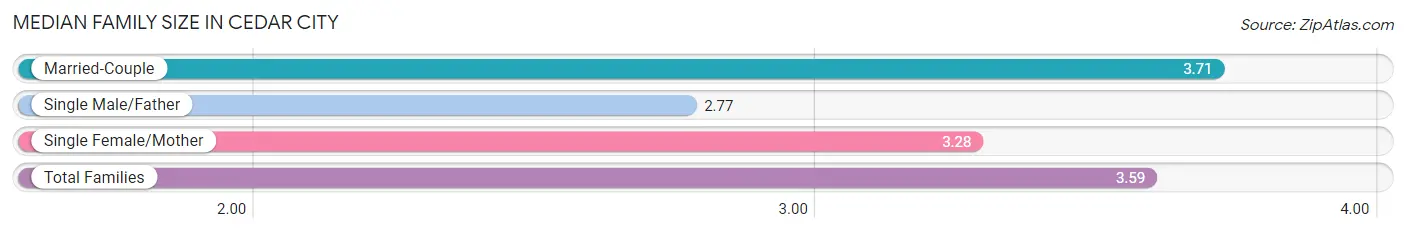
The median family size in Cedar City is 3.59 persons per family, with married-couple families (6,127 | 80.3%) accounting for the largest median family size of 3.71 persons per family. On the other hand, single male/father families (571 | 7.5%) represent the smallest median family size with 2.77 persons per family.
| Family Type | # Families | Family Size |
| Married-Couple | 6,127 (80.3%) | 3.71 |
| Single Male/Father | 571 (7.5%) | 2.77 |
| Single Female/Mother | 933 (12.2%) | 3.28 |
| Total Families | 7,631 (100.0%) | 3.59 |
Median Household Size in Cedar City
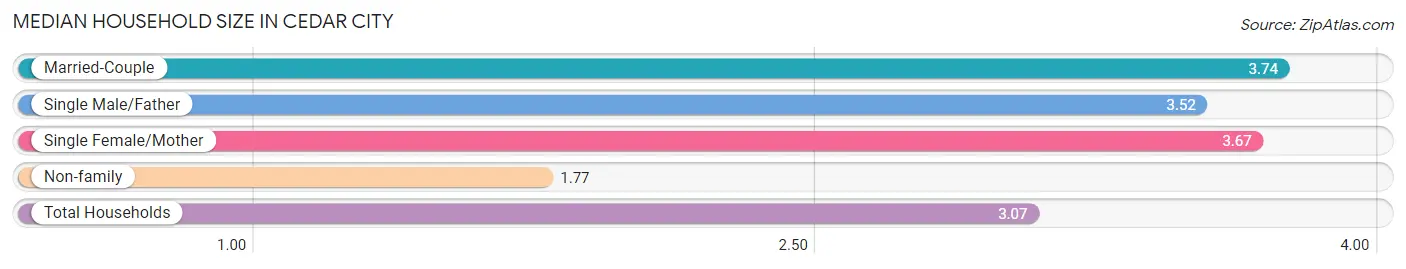
The median household size in Cedar City is 3.07 persons per household, with married-couple households (6,127 | 53.8%) accounting for the largest median household size of 3.74 persons per household. non-family households (3,746 | 32.9%) represent the smallest median household size with 1.77 persons per household.
| Household Type | # Households | Household Size |
| Married-Couple | 6,127 (53.8%) | 3.74 |
| Single Male/Father | 571 (5.0%) | 3.52 |
| Single Female/Mother | 933 (8.2%) | 3.67 |
| Non-family | 3,746 (32.9%) | 1.77 |
| Total Households | 11,377 (100.0%) | 3.07 |
Household Size by Marriage Status in Cedar City
Out of a total of 11,377 households in Cedar City, 7,631 (67.1%) are family households, while 3,746 (32.9%) are nonfamily households. The most numerous type of family households are 2-person households, comprising 2,536, and the most common type of nonfamily households are 1-person households, comprising 2,445.
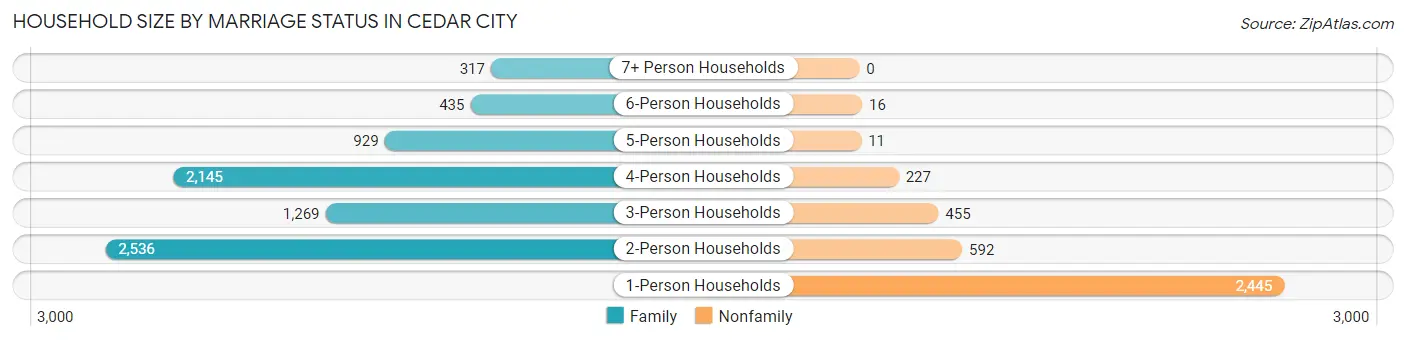
| Household Size | Family Households | Nonfamily Households |
| 1-Person Households | - | 2,445 (21.5%) |
| 2-Person Households | 2,536 (22.3%) | 592 (5.2%) |
| 3-Person Households | 1,269 (11.2%) | 455 (4.0%) |
| 4-Person Households | 2,145 (18.9%) | 227 (2.0%) |
| 5-Person Households | 929 (8.2%) | 11 (0.1%) |
| 6-Person Households | 435 (3.8%) | 16 (0.1%) |
| 7+ Person Households | 317 (2.8%) | 0 (0.0%) |
| Total | 7,631 (67.1%) | 3,746 (32.9%) |
Female Fertility in Cedar City
Fertility by Age in Cedar City
Average fertility rate in Cedar City is 50.0 births per 1,000 women. Women in the age bracket of 20 to 34 years have the highest fertility rate with 83.0 births per 1,000 women. Women in the age bracket of 20 to 34 years acount for 93.0% of all women with births.
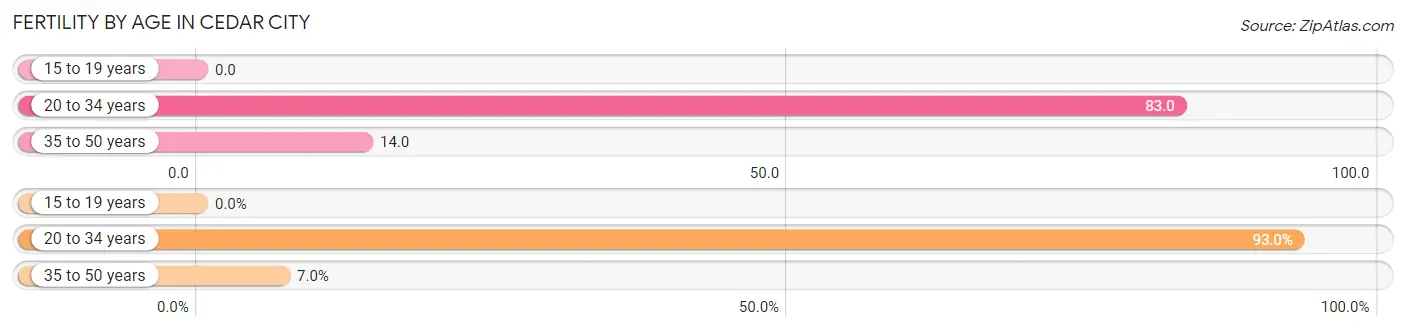
| Age Bracket | Women with Births | Births / 1,000 Women |
| 15 to 19 years | 0 (0.0%) | 0.0 |
| 20 to 34 years | 468 (93.0%) | 83.0 |
| 35 to 50 years | 35 (7.0%) | 14.0 |
| Total | 503 (100.0%) | 50.0 |
Fertility by Age by Marriage Status in Cedar City
92.2% of women with births (503) in Cedar City are married. The highest percentage of unmarried women with births falls into 20 to 34 years age bracket with 8.3% of them unmarried at the time of birth, while the lowest percentage of unmarried women with births belong to 35 to 50 years age bracket with 0.0% of them unmarried.
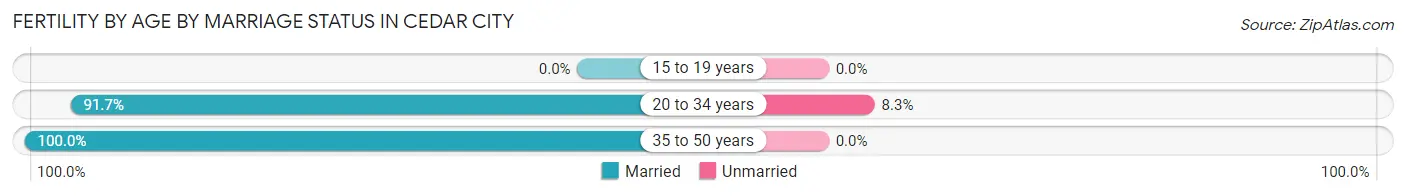
| Age Bracket | Married | Unmarried |
| 15 to 19 years | 0 (0.0%) | 0 (0.0%) |
| 20 to 34 years | 429 (91.7%) | 39 (8.3%) |
| 35 to 50 years | 35 (100.0%) | 0 (0.0%) |
| Total | 464 (92.2%) | 39 (7.7%) |
Fertility by Education in Cedar City
Average fertility rate in Cedar City is 50.0 births per 1,000 women. Women with the education attainment of bachelor's degree have the highest fertility rate of 98.0 births per 1,000 women, while women with the education attainment of less than high school have the lowest fertility at 13.0 births per 1,000 women. Women with the education attainment of college or associate's degree represent 38.4% of all women with births.
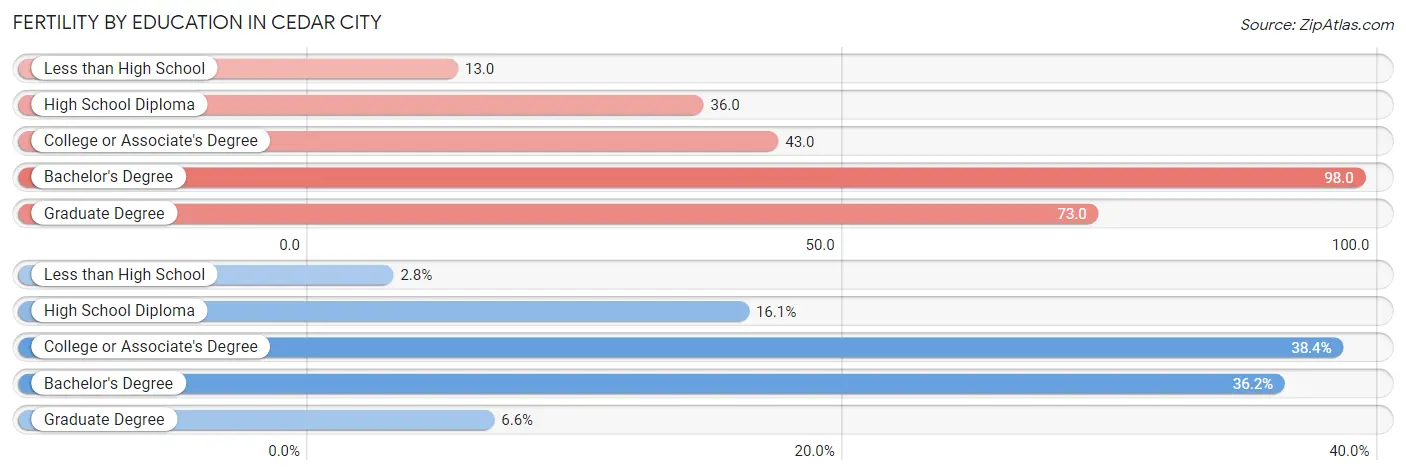
| Educational Attainment | Women with Births | Births / 1,000 Women |
| Less than High School | 14 (2.8%) | 13.0 |
| High School Diploma | 81 (16.1%) | 36.0 |
| College or Associate's Degree | 193 (38.4%) | 43.0 |
| Bachelor's Degree | 182 (36.2%) | 98.0 |
| Graduate Degree | 33 (6.6%) | 73.0 |
| Total | 503 (100.0%) | 50.0 |
Fertility by Education by Marriage Status in Cedar City
7.7% of women with births in Cedar City are unmarried. Women with the educational attainment of bachelor's degree are most likely to be married with 100.0% of them married at childbirth, while women with the educational attainment of high school diploma are least likely to be married with 21.0% of them unmarried at childbirth.
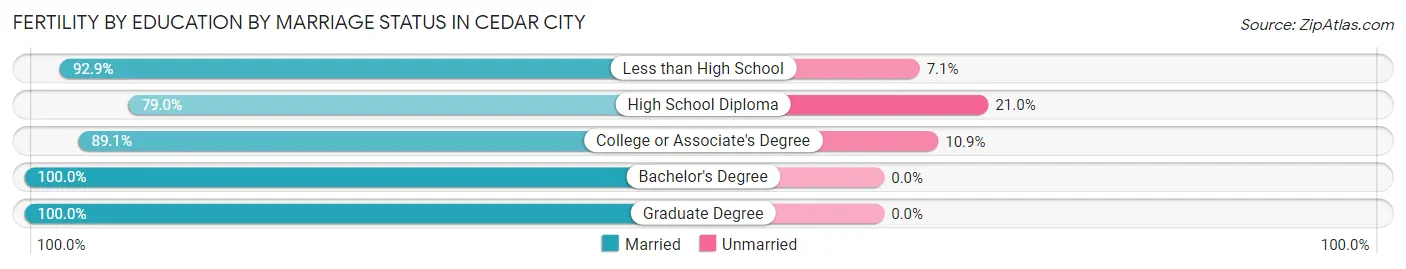
| Educational Attainment | Married | Unmarried |
| Less than High School | 13 (92.9%) | 1 (7.1%) |
| High School Diploma | 64 (79.0%) | 17 (21.0%) |
| College or Associate's Degree | 172 (89.1%) | 21 (10.9%) |
| Bachelor's Degree | 182 (100.0%) | 0 (0.0%) |
| Graduate Degree | 33 (100.0%) | 0 (0.0%) |
| Total | 464 (92.2%) | 39 (7.7%) |
Employment Characteristics in Cedar City
Employment by Class of Employer in Cedar City
Among the 17,201 employed individuals in Cedar City, private company employees (11,223 | 65.2%), not-for-profit organizations (1,364 | 7.9%), and state government employees (1,342 | 7.8%) make up the most common classes of employment.
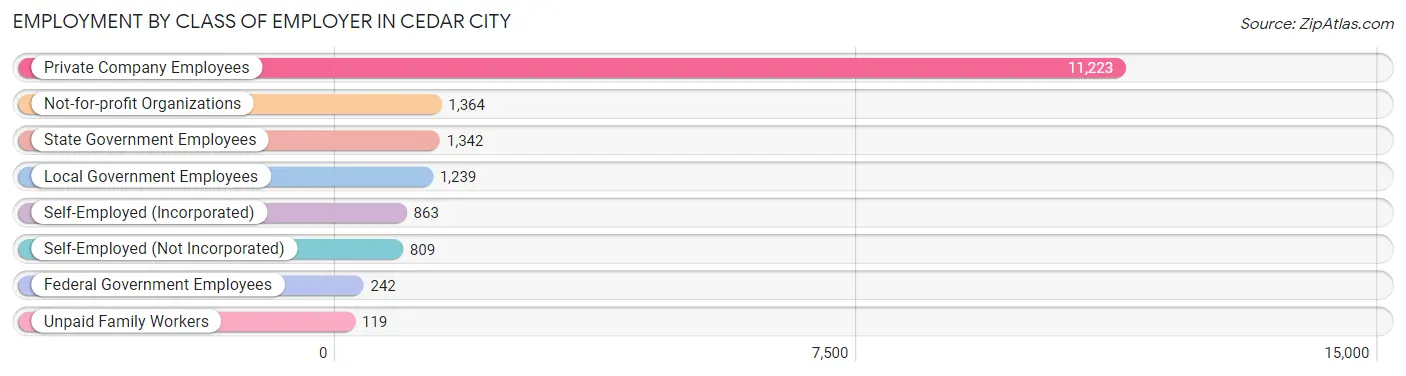
| Employer Class | # Employees | % Employees |
| Private Company Employees | 11,223 | 65.2% |
| Self-Employed (Incorporated) | 863 | 5.0% |
| Self-Employed (Not Incorporated) | 809 | 4.7% |
| Not-for-profit Organizations | 1,364 | 7.9% |
| Local Government Employees | 1,239 | 7.2% |
| State Government Employees | 1,342 | 7.8% |
| Federal Government Employees | 242 | 1.4% |
| Unpaid Family Workers | 119 | 0.7% |
| Total | 17,201 | 100.0% |
Employment Status by Age in Cedar City
According to the labor force statistics for Cedar City, out of the total population over 16 years of age (27,122), 66.4% or 18,009 individuals are in the labor force, with 3.1% or 558 of them unemployed. The age group with the highest labor force participation rate is 45 to 54 years, with 86.6% or 2,507 individuals in the labor force. Within the labor force, the 16 to 19 years age range has the highest percentage of unemployed individuals, with 7.4% or 110 of them being unemployed.
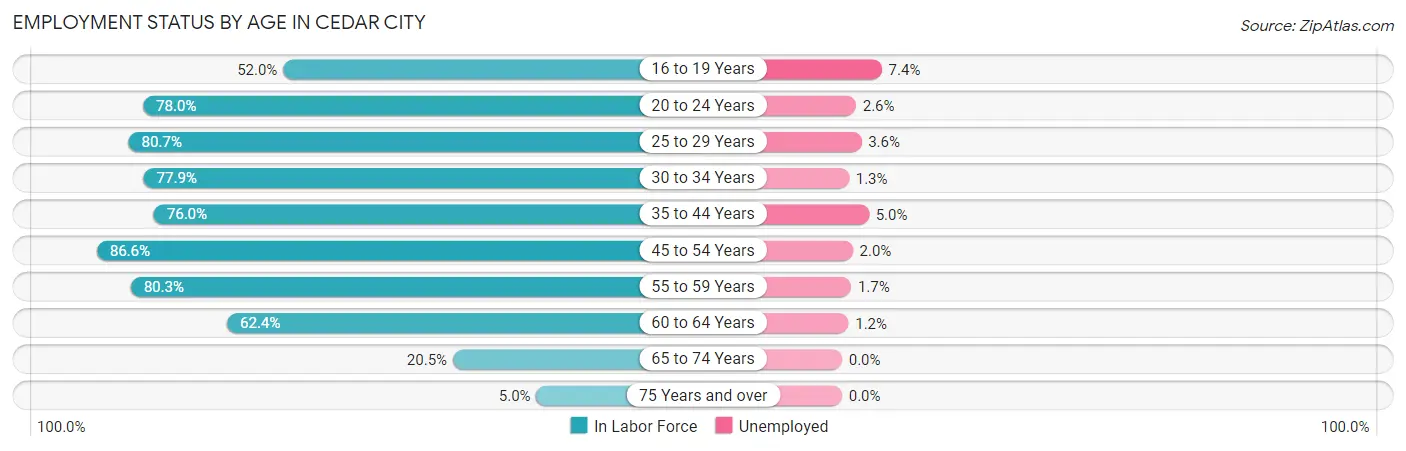
| Age Bracket | In Labor Force | Unemployed |
| 16 to 19 Years | 1,493 (52.0%) | 110 (7.4%) |
| 20 to 24 Years | 4,424 (78.0%) | 115 (2.6%) |
| 25 to 29 Years | 2,450 (80.7%) | 88 (3.6%) |
| 30 to 34 Years | 2,022 (77.9%) | 26 (1.3%) |
| 35 to 44 Years | 2,625 (76.0%) | 131 (5.0%) |
| 45 to 54 Years | 2,507 (86.6%) | 50 (2.0%) |
| 55 to 59 Years | 1,082 (80.3%) | 18 (1.7%) |
| 60 to 64 Years | 846 (62.4%) | 10 (1.2%) |
| 65 to 74 Years | 490 (20.5%) | 0 (0.0%) |
| 75 Years and over | 75 (5.0%) | 0 (0.0%) |
| Total | 18,009 (66.4%) | 558 (3.1%) |
Employment Status by Educational Attainment in Cedar City
According to labor force statistics for Cedar City, 78.5% of individuals (11,525) out of the total population between 25 and 64 years of age (14,682) are in the labor force, with 2.8% or 323 of them being unemployed. The group with the highest labor force participation rate are those with the educational attainment of bachelor's degree or higher, with 83.6% or 3,940 individuals in the labor force. Within the labor force, individuals with less than high school education have the highest percentage of unemployment, with 9.7% or 62 of them being unemployed.
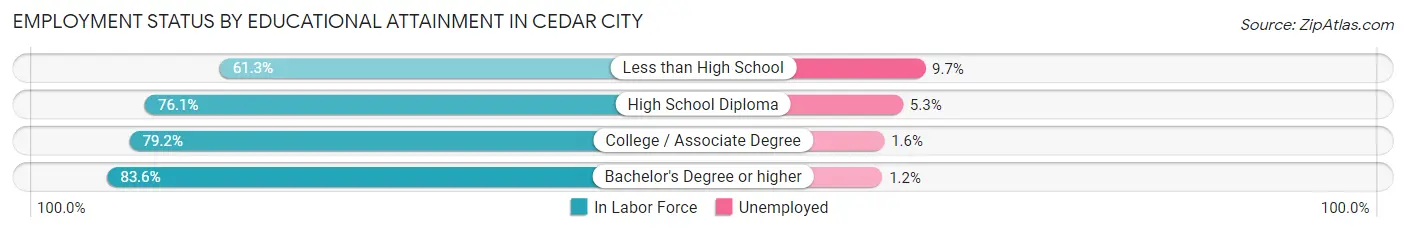
| Educational Attainment | In Labor Force | Unemployed |
| Less than High School | 639 (61.3%) | 101 (9.7%) |
| High School Diploma | 2,776 (76.1%) | 193 (5.3%) |
| College / Associate Degree | 4,180 (79.2%) | 84 (1.6%) |
| Bachelor's Degree or higher | 3,940 (83.6%) | 57 (1.2%) |
| Total | 11,525 (78.5%) | 411 (2.8%) |
Employment Occupations by Sex in Cedar City
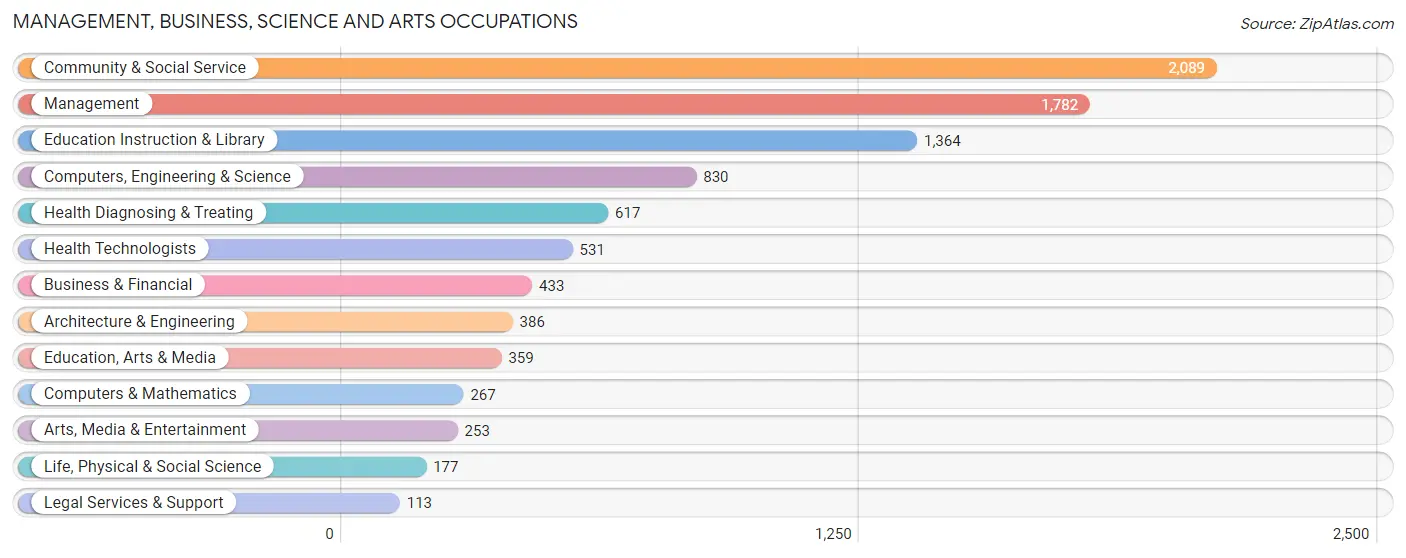
Management, Business, Science and Arts Occupations
The most common Management, Business, Science and Arts occupations in Cedar City are Community & Social Service (2,089 | 12.0%), Management (1,782 | 10.2%), Education Instruction & Library (1,364 | 7.8%), Computers, Engineering & Science (830 | 4.8%), and Health Diagnosing & Treating (617 | 3.5%).
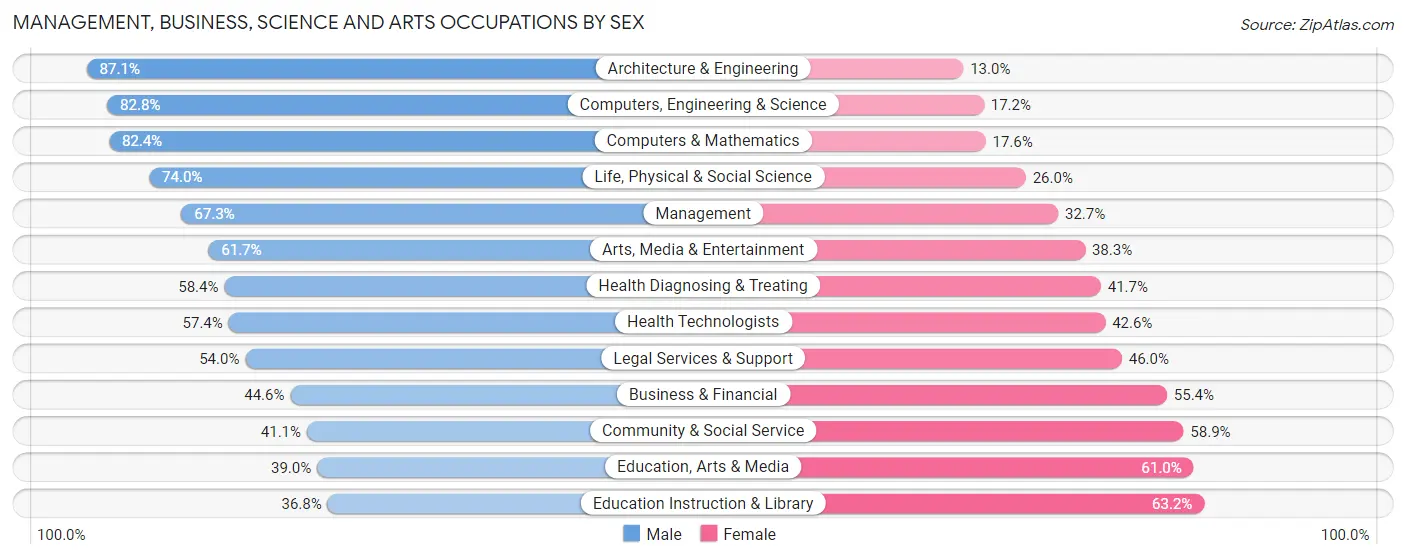
Management, Business, Science and Arts Occupations by Sex
Within the Management, Business, Science and Arts occupations in Cedar City, the most male-oriented occupations are Architecture & Engineering (87.1%), Computers, Engineering & Science (82.8%), and Computers & Mathematics (82.4%), while the most female-oriented occupations are Education Instruction & Library (63.2%), Education, Arts & Media (61.0%), and Community & Social Service (58.9%).
| Occupation | Male | Female |
| Management | 1,199 (67.3%) | 583 (32.7%) |
| Business & Financial | 193 (44.6%) | 240 (55.4%) |
| Computers, Engineering & Science | 687 (82.8%) | 143 (17.2%) |
| Computers & Mathematics | 220 (82.4%) | 47 (17.6%) |
| Architecture & Engineering | 336 (87.1%) | 50 (13.0%) |
| Life, Physical & Social Science | 131 (74.0%) | 46 (26.0%) |
| Community & Social Service | 859 (41.1%) | 1,230 (58.9%) |
| Education, Arts & Media | 140 (39.0%) | 219 (61.0%) |
| Legal Services & Support | 61 (54.0%) | 52 (46.0%) |
| Education Instruction & Library | 502 (36.8%) | 862 (63.2%) |
| Arts, Media & Entertainment | 156 (61.7%) | 97 (38.3%) |
| Health Diagnosing & Treating | 360 (58.4%) | 257 (41.6%) |
| Health Technologists | 305 (57.4%) | 226 (42.6%) |
| Total (Category) | 3,298 (57.4%) | 2,453 (42.6%) |
| Total (Overall) | 9,308 (53.3%) | 8,157 (46.7%) |
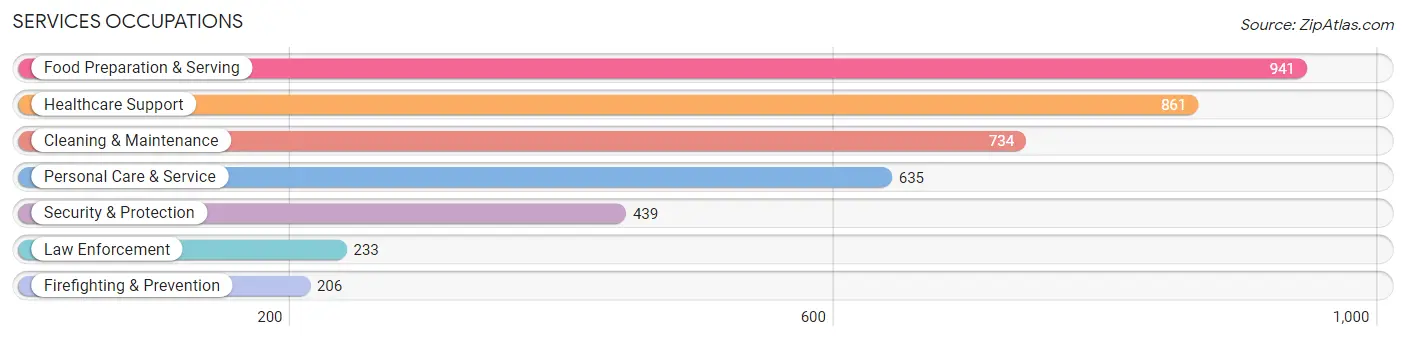
Services Occupations
The most common Services occupations in Cedar City are Food Preparation & Serving (941 | 5.4%), Healthcare Support (861 | 4.9%), Cleaning & Maintenance (734 | 4.2%), Personal Care & Service (635 | 3.6%), and Security & Protection (439 | 2.5%).
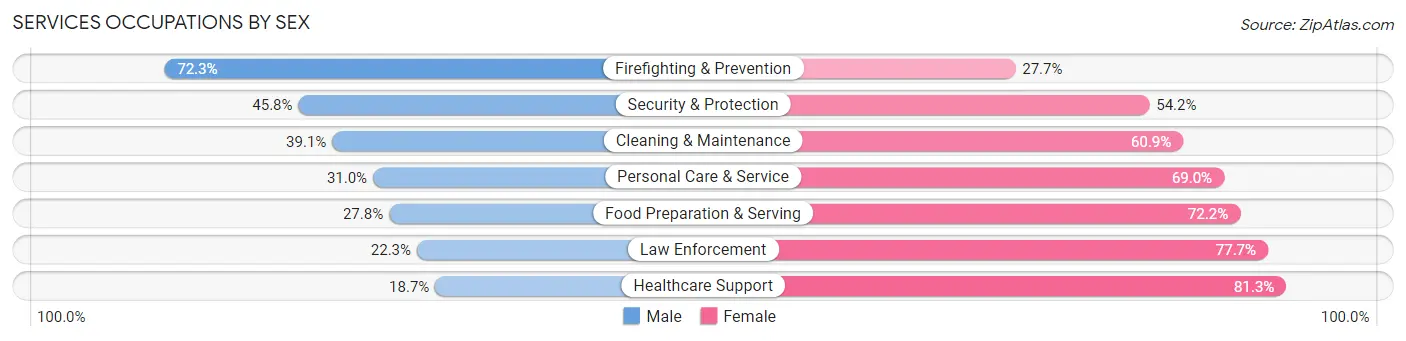
Services Occupations by Sex
Within the Services occupations in Cedar City, the most male-oriented occupations are Firefighting & Prevention (72.3%), Security & Protection (45.8%), and Cleaning & Maintenance (39.1%), while the most female-oriented occupations are Healthcare Support (81.3%), Law Enforcement (77.7%), and Food Preparation & Serving (72.2%).
| Occupation | Male | Female |
| Healthcare Support | 161 (18.7%) | 700 (81.3%) |
| Security & Protection | 201 (45.8%) | 238 (54.2%) |
| Firefighting & Prevention | 149 (72.3%) | 57 (27.7%) |
| Law Enforcement | 52 (22.3%) | 181 (77.7%) |
| Food Preparation & Serving | 262 (27.8%) | 679 (72.2%) |
| Cleaning & Maintenance | 287 (39.1%) | 447 (60.9%) |
| Personal Care & Service | 197 (31.0%) | 438 (69.0%) |
| Total (Category) | 1,108 (30.7%) | 2,502 (69.3%) |
| Total (Overall) | 9,308 (53.3%) | 8,157 (46.7%) |
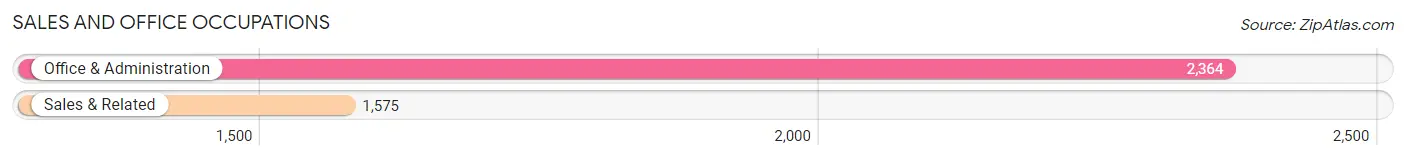
Sales and Office Occupations
The most common Sales and Office occupations in Cedar City are Office & Administration (2,364 | 13.5%), and Sales & Related (1,575 | 9.0%).
Sales and Office Occupations by Sex
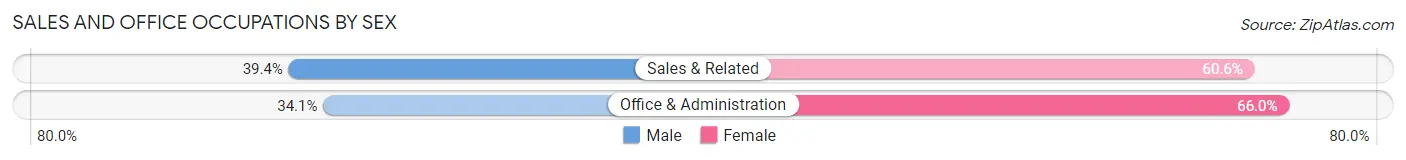
| Occupation | Male | Female |
| Sales & Related | 620 (39.4%) | 955 (60.6%) |
| Office & Administration | 805 (34.1%) | 1,559 (65.9%) |
| Total (Category) | 1,425 (36.2%) | 2,514 (63.8%) |
| Total (Overall) | 9,308 (53.3%) | 8,157 (46.7%) |
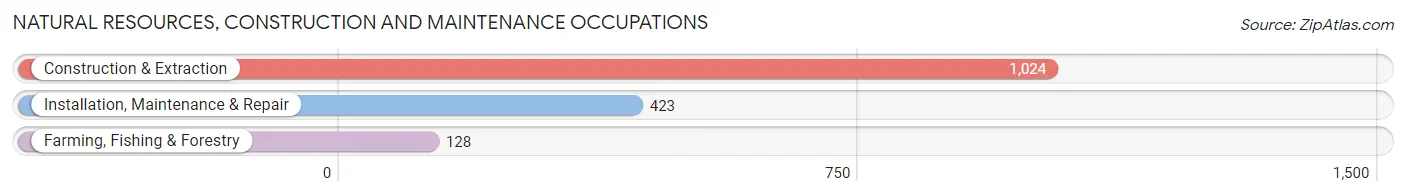
Natural Resources, Construction and Maintenance Occupations
The most common Natural Resources, Construction and Maintenance occupations in Cedar City are Construction & Extraction (1,024 | 5.9%), Installation, Maintenance & Repair (423 | 2.4%), and Farming, Fishing & Forestry (128 | 0.7%).
Natural Resources, Construction and Maintenance Occupations by Sex
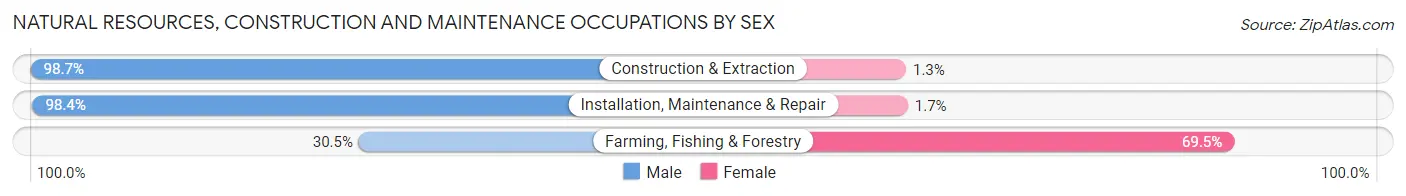
| Occupation | Male | Female |
| Farming, Fishing & Forestry | 39 (30.5%) | 89 (69.5%) |
| Construction & Extraction | 1,011 (98.7%) | 13 (1.3%) |
| Installation, Maintenance & Repair | 416 (98.4%) | 7 (1.7%) |
| Total (Category) | 1,466 (93.1%) | 109 (6.9%) |
| Total (Overall) | 9,308 (53.3%) | 8,157 (46.7%) |
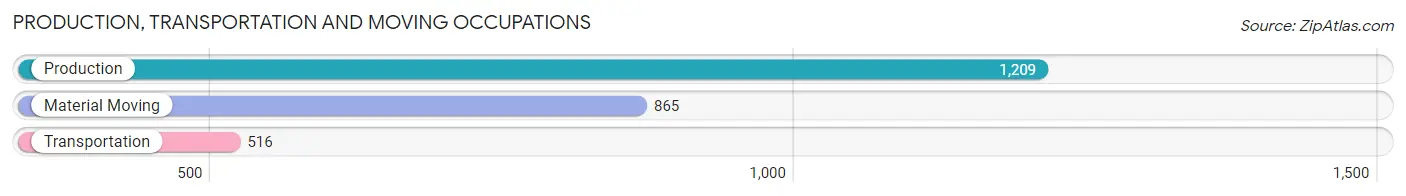
Production, Transportation and Moving Occupations
The most common Production, Transportation and Moving occupations in Cedar City are Production (1,209 | 6.9%), Material Moving (865 | 5.0%), and Transportation (516 | 2.9%).
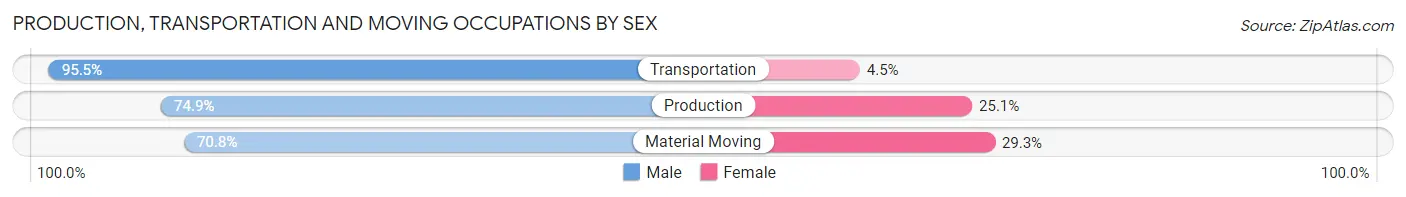
Production, Transportation and Moving Occupations by Sex
| Occupation | Male | Female |
| Production | 906 (74.9%) | 303 (25.1%) |
| Transportation | 493 (95.5%) | 23 (4.5%) |
| Material Moving | 612 (70.8%) | 253 (29.2%) |
| Total (Category) | 2,011 (77.6%) | 579 (22.4%) |
| Total (Overall) | 9,308 (53.3%) | 8,157 (46.7%) |
Employment Industries by Sex in Cedar City
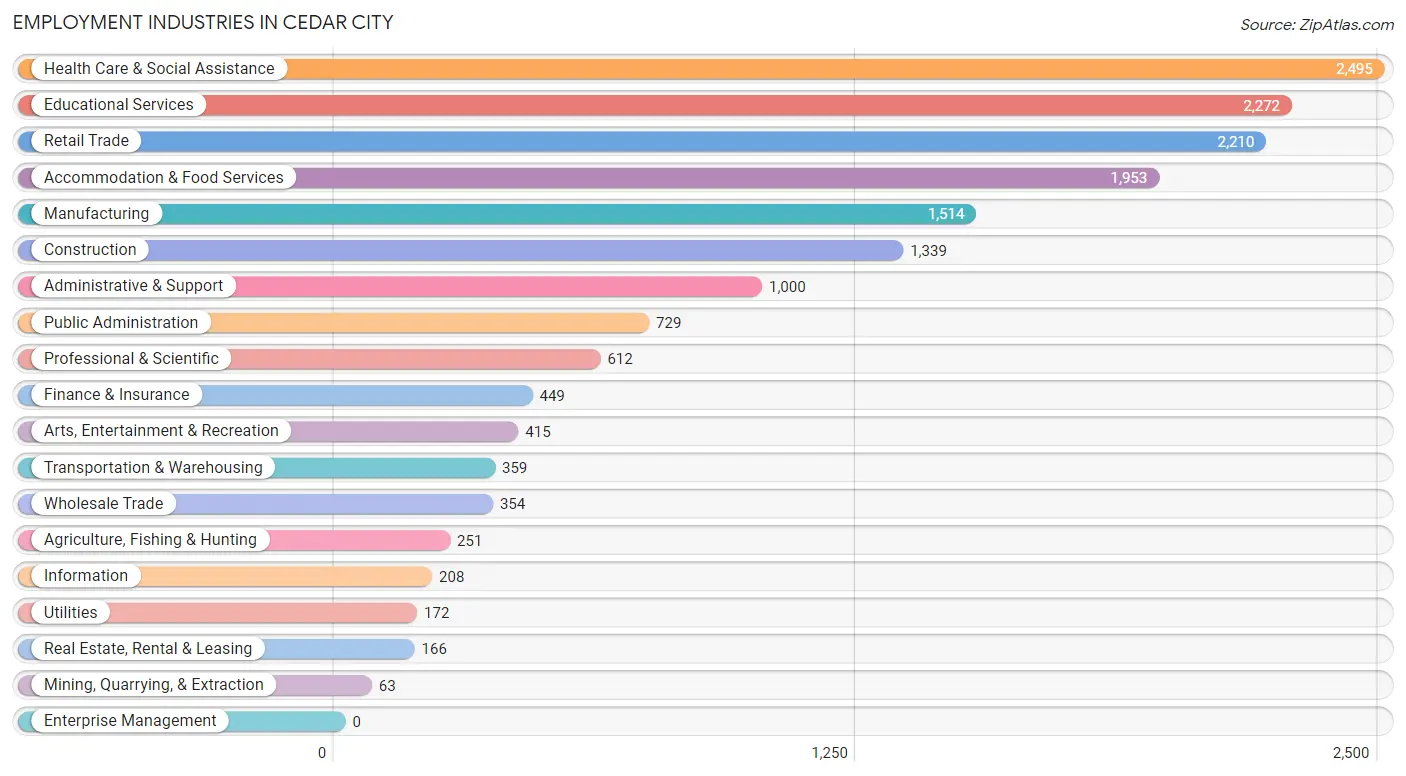
Employment Industries in Cedar City
The major employment industries in Cedar City include Health Care & Social Assistance (2,495 | 14.3%), Educational Services (2,272 | 13.0%), Retail Trade (2,210 | 12.7%), Accommodation & Food Services (1,953 | 11.2%), and Manufacturing (1,514 | 8.7%).
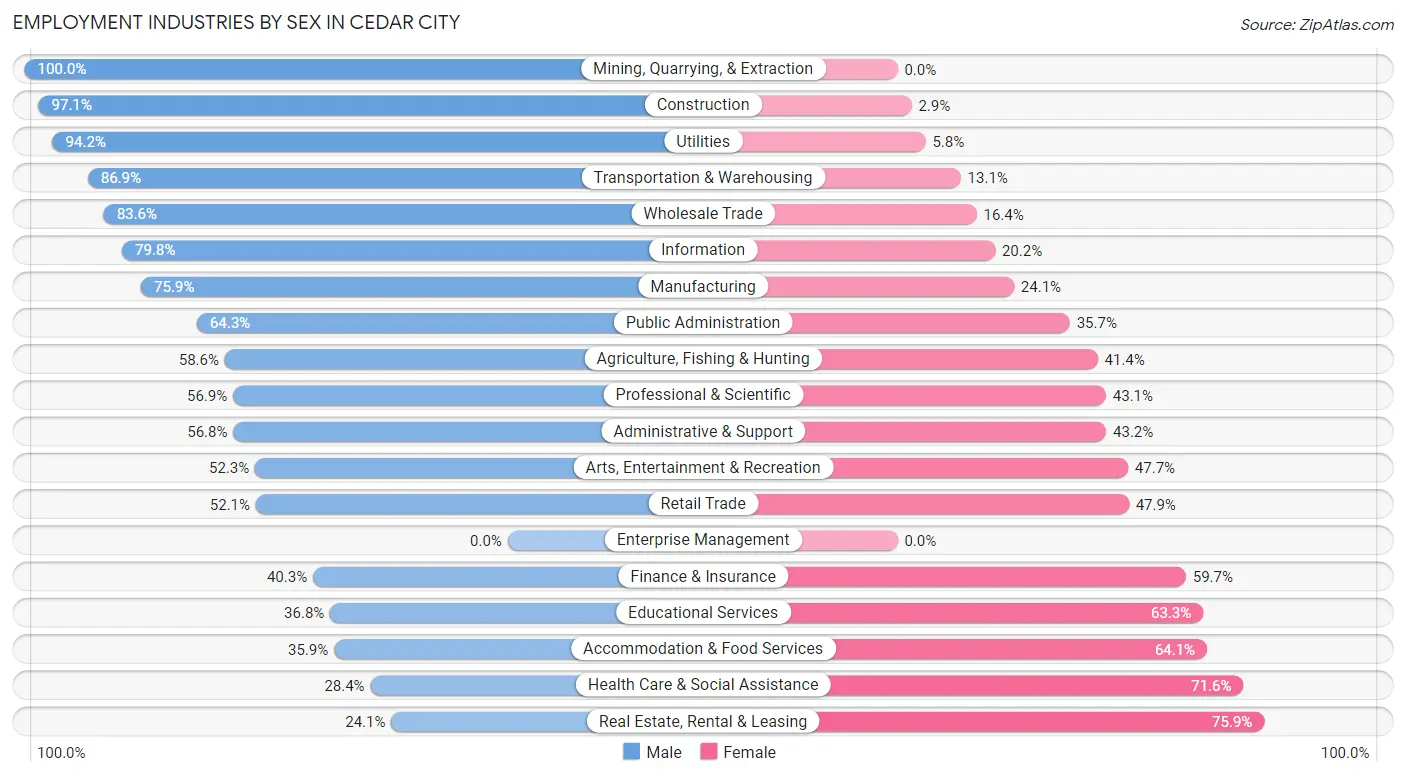
Employment Industries by Sex in Cedar City
The Cedar City industries that see more men than women are Mining, Quarrying, & Extraction (100.0%), Construction (97.1%), and Utilities (94.2%), whereas the industries that tend to have a higher number of women are Real Estate, Rental & Leasing (75.9%), Health Care & Social Assistance (71.6%), and Accommodation & Food Services (64.1%).
| Industry | Male | Female |
| Agriculture, Fishing & Hunting | 147 (58.6%) | 104 (41.4%) |
| Mining, Quarrying, & Extraction | 63 (100.0%) | 0 (0.0%) |
| Construction | 1,300 (97.1%) | 39 (2.9%) |
| Manufacturing | 1,149 (75.9%) | 365 (24.1%) |
| Wholesale Trade | 296 (83.6%) | 58 (16.4%) |
| Retail Trade | 1,152 (52.1%) | 1,058 (47.9%) |
| Transportation & Warehousing | 312 (86.9%) | 47 (13.1%) |
| Utilities | 162 (94.2%) | 10 (5.8%) |
| Information | 166 (79.8%) | 42 (20.2%) |
| Finance & Insurance | 181 (40.3%) | 268 (59.7%) |
| Real Estate, Rental & Leasing | 40 (24.1%) | 126 (75.9%) |
| Professional & Scientific | 348 (56.9%) | 264 (43.1%) |
| Enterprise Management | 0 (0.0%) | 0 (0.0%) |
| Administrative & Support | 568 (56.8%) | 432 (43.2%) |
| Educational Services | 835 (36.7%) | 1,437 (63.2%) |
| Health Care & Social Assistance | 709 (28.4%) | 1,786 (71.6%) |
| Arts, Entertainment & Recreation | 217 (52.3%) | 198 (47.7%) |
| Accommodation & Food Services | 702 (35.9%) | 1,251 (64.1%) |
| Public Administration | 469 (64.3%) | 260 (35.7%) |
| Total | 9,308 (53.3%) | 8,157 (46.7%) |
Education in Cedar City
School Enrollment in Cedar City
The most common levels of schooling among the 13,360 students in Cedar City are college / undergraduate (5,281 | 39.5%), elementary school (2,203 | 16.5%), and middle school (2,123 | 15.9%).
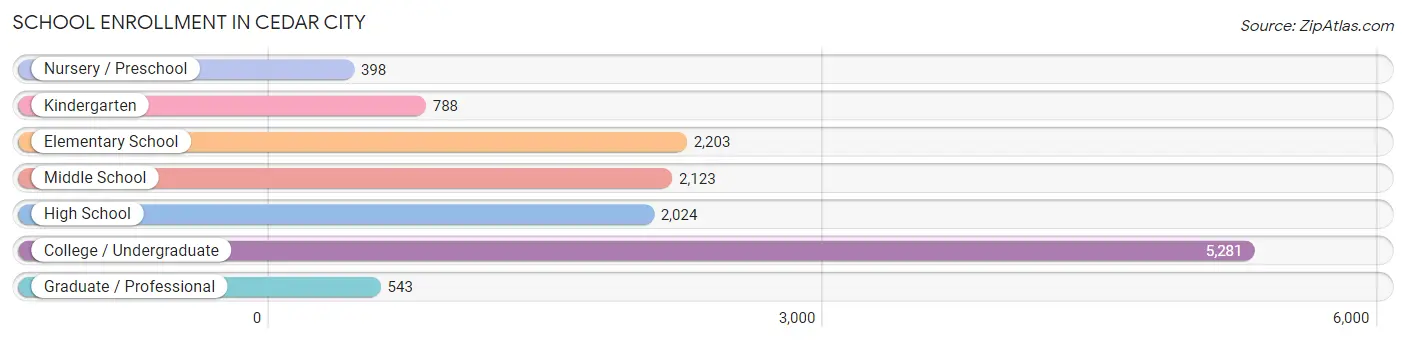
| School Level | # Students | % Students |
| Nursery / Preschool | 398 | 3.0% |
| Kindergarten | 788 | 5.9% |
| Elementary School | 2,203 | 16.5% |
| Middle School | 2,123 | 15.9% |
| High School | 2,024 | 15.1% |
| College / Undergraduate | 5,281 | 39.5% |
| Graduate / Professional | 543 | 4.1% |
| Total | 13,360 | 100.0% |
School Enrollment by Age by Funding Source in Cedar City
Out of a total of 13,360 students who are enrolled in schools in Cedar City, 962 (7.2%) attend a private institution, while the remaining 12,398 (92.8%) are enrolled in public schools. The age group of 3 to 4 year olds has the highest likelihood of being enrolled in private schools, with 252 (49.8% in the age bracket) enrolled. Conversely, the age group of 18 to 19 year olds has the lowest likelihood of being enrolled in a private school, with 1,183 (99.4% in the age bracket) attending a public institution.
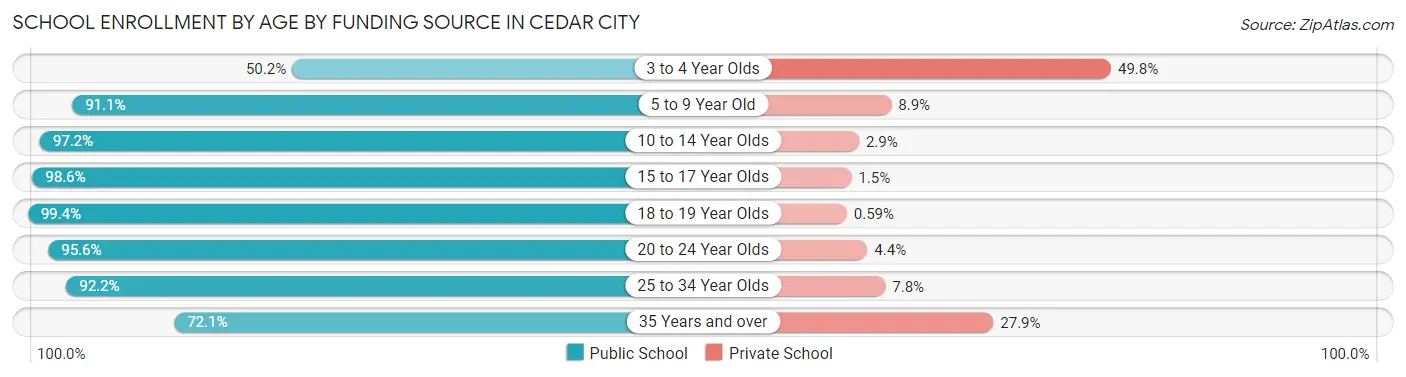
| Age Bracket | Public School | Private School |
| 3 to 4 Year Olds | 254 (50.2%) | 252 (49.8%) |
| 5 to 9 Year Old | 2,554 (91.1%) | 249 (8.9%) |
| 10 to 14 Year Olds | 2,490 (97.2%) | 73 (2.9%) |
| 15 to 17 Year Olds | 1,363 (98.6%) | 20 (1.5%) |
| 18 to 19 Year Olds | 1,183 (99.4%) | 7 (0.6%) |
| 20 to 24 Year Olds | 3,396 (95.6%) | 157 (4.4%) |
| 25 to 34 Year Olds | 783 (92.2%) | 66 (7.8%) |
| 35 Years and over | 370 (72.1%) | 143 (27.9%) |
| Total | 12,398 (92.8%) | 962 (7.2%) |
Educational Attainment by Field of Study in Cedar City
Education (1,208 | 17.5%), business (1,189 | 17.2%), science & technology (747 | 10.8%), bio, nature & agricultural (488 | 7.1%), and liberal arts & history (483 | 7.0%) are the most common fields of study among 6,912 individuals in Cedar City who have obtained a bachelor's degree or higher.
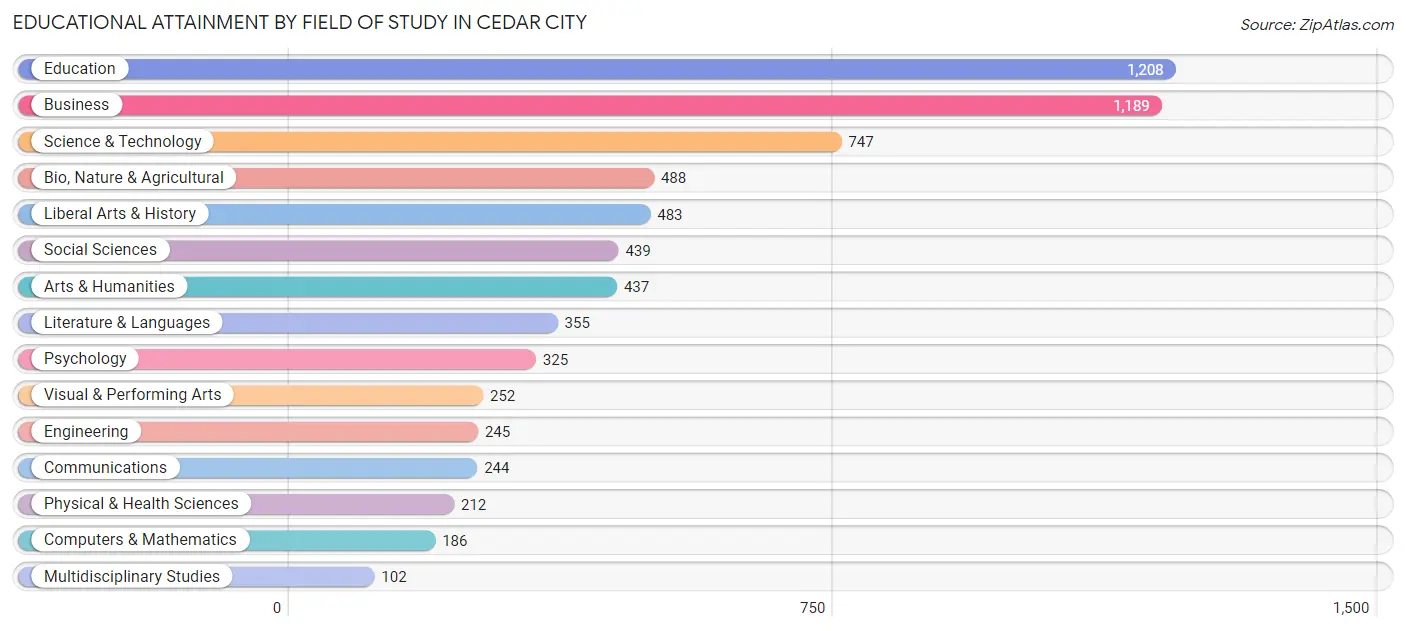
| Field of Study | # Graduates | % Graduates |
| Computers & Mathematics | 186 | 2.7% |
| Bio, Nature & Agricultural | 488 | 7.1% |
| Physical & Health Sciences | 212 | 3.1% |
| Psychology | 325 | 4.7% |
| Social Sciences | 439 | 6.4% |
| Engineering | 245 | 3.5% |
| Multidisciplinary Studies | 102 | 1.5% |
| Science & Technology | 747 | 10.8% |
| Business | 1,189 | 17.2% |
| Education | 1,208 | 17.5% |
| Literature & Languages | 355 | 5.1% |
| Liberal Arts & History | 483 | 7.0% |
| Visual & Performing Arts | 252 | 3.6% |
| Communications | 244 | 3.5% |
| Arts & Humanities | 437 | 6.3% |
| Total | 6,912 | 100.0% |
Transportation & Commute in Cedar City
Vehicle Availability by Sex in Cedar City
The most prevalent vehicle ownership categories in Cedar City are males with 2 vehicles (3,549, accounting for 39.1%) and females with 2 vehicles (3,042, making up 45.3%).
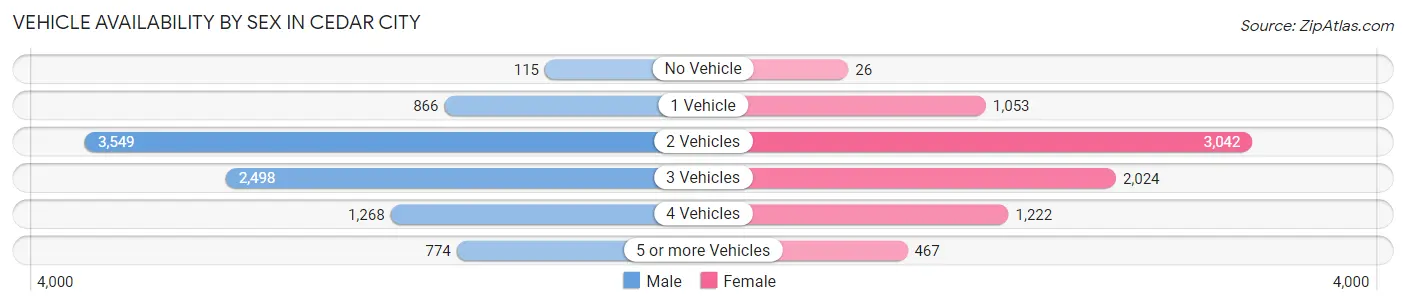
| Vehicles Available | Male | Female |
| No Vehicle | 115 (1.3%) | 26 (0.3%) |
| 1 Vehicle | 866 (9.6%) | 1,053 (13.4%) |
| 2 Vehicles | 3,549 (39.1%) | 3,042 (38.8%) |
| 3 Vehicles | 2,498 (27.5%) | 2,024 (25.8%) |
| 4 Vehicles | 1,268 (14.0%) | 1,222 (15.6%) |
| 5 or more Vehicles | 774 (8.5%) | 467 (6.0%) |
| Total | 9,070 (100.0%) | 7,834 (100.0%) |
Commute Time in Cedar City
The most frequently occuring commute durations in Cedar City are 10 to 14 minutes (5,243 commuters, 32.8%), 5 to 9 minutes (5,079 commuters, 31.8%), and 15 to 19 minutes (2,303 commuters, 14.4%).
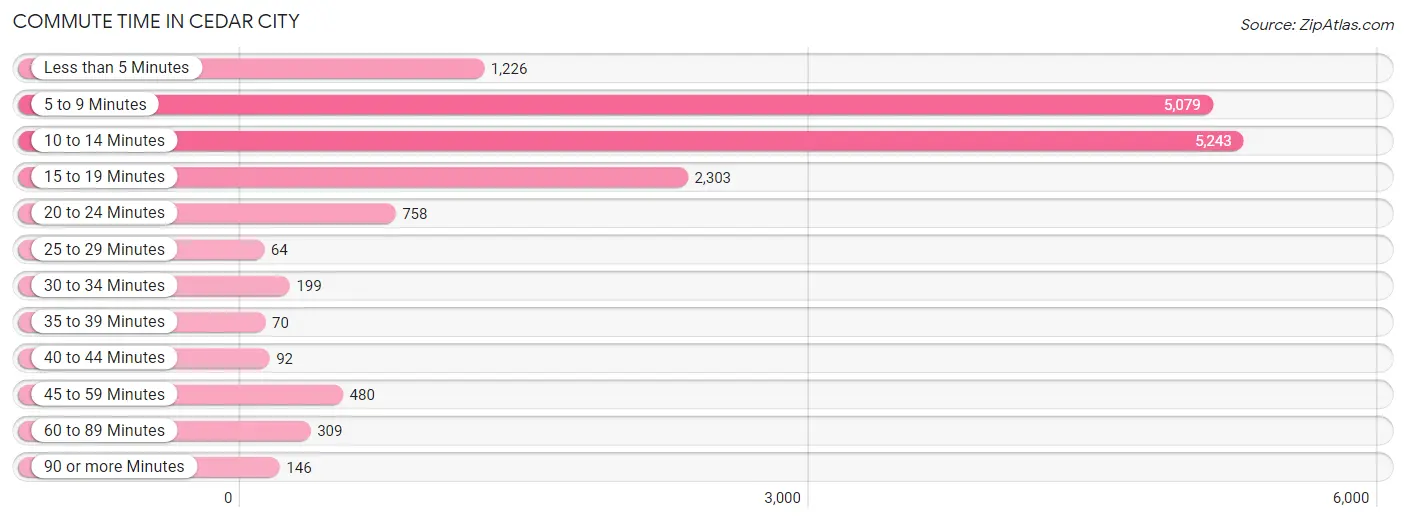
| Commute Time | # Commuters | % Commuters |
| Less than 5 Minutes | 1,226 | 7.7% |
| 5 to 9 Minutes | 5,079 | 31.8% |
| 10 to 14 Minutes | 5,243 | 32.8% |
| 15 to 19 Minutes | 2,303 | 14.4% |
| 20 to 24 Minutes | 758 | 4.8% |
| 25 to 29 Minutes | 64 | 0.4% |
| 30 to 34 Minutes | 199 | 1.3% |
| 35 to 39 Minutes | 70 | 0.4% |
| 40 to 44 Minutes | 92 | 0.6% |
| 45 to 59 Minutes | 480 | 3.0% |
| 60 to 89 Minutes | 309 | 1.9% |
| 90 or more Minutes | 146 | 0.9% |
Commute Time by Sex in Cedar City
The most common commute times in Cedar City are 10 to 14 minutes (2,959 commuters, 34.5%) for males and 5 to 9 minutes (2,575 commuters, 34.9%) for females.
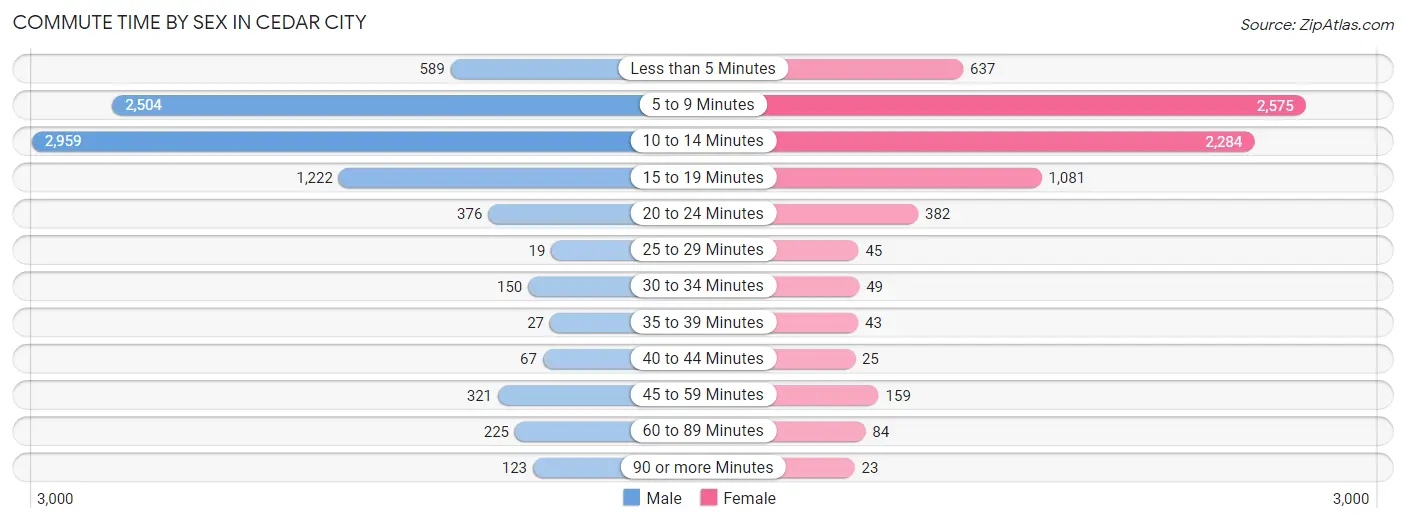
| Commute Time | Male | Female |
| Less than 5 Minutes | 589 (6.9%) | 637 (8.6%) |
| 5 to 9 Minutes | 2,504 (29.2%) | 2,575 (34.9%) |
| 10 to 14 Minutes | 2,959 (34.5%) | 2,284 (30.9%) |
| 15 to 19 Minutes | 1,222 (14.2%) | 1,081 (14.6%) |
| 20 to 24 Minutes | 376 (4.4%) | 382 (5.2%) |
| 25 to 29 Minutes | 19 (0.2%) | 45 (0.6%) |
| 30 to 34 Minutes | 150 (1.8%) | 49 (0.7%) |
| 35 to 39 Minutes | 27 (0.3%) | 43 (0.6%) |
| 40 to 44 Minutes | 67 (0.8%) | 25 (0.3%) |
| 45 to 59 Minutes | 321 (3.7%) | 159 (2.1%) |
| 60 to 89 Minutes | 225 (2.6%) | 84 (1.1%) |
| 90 or more Minutes | 123 (1.4%) | 23 (0.3%) |
Time of Departure to Work by Sex in Cedar City
The most frequent times of departure to work in Cedar City are 7:30 AM to 7:59 AM (1,160, 13.5%) for males and 12:00 PM to 3:59 PM (1,118, 15.1%) for females.
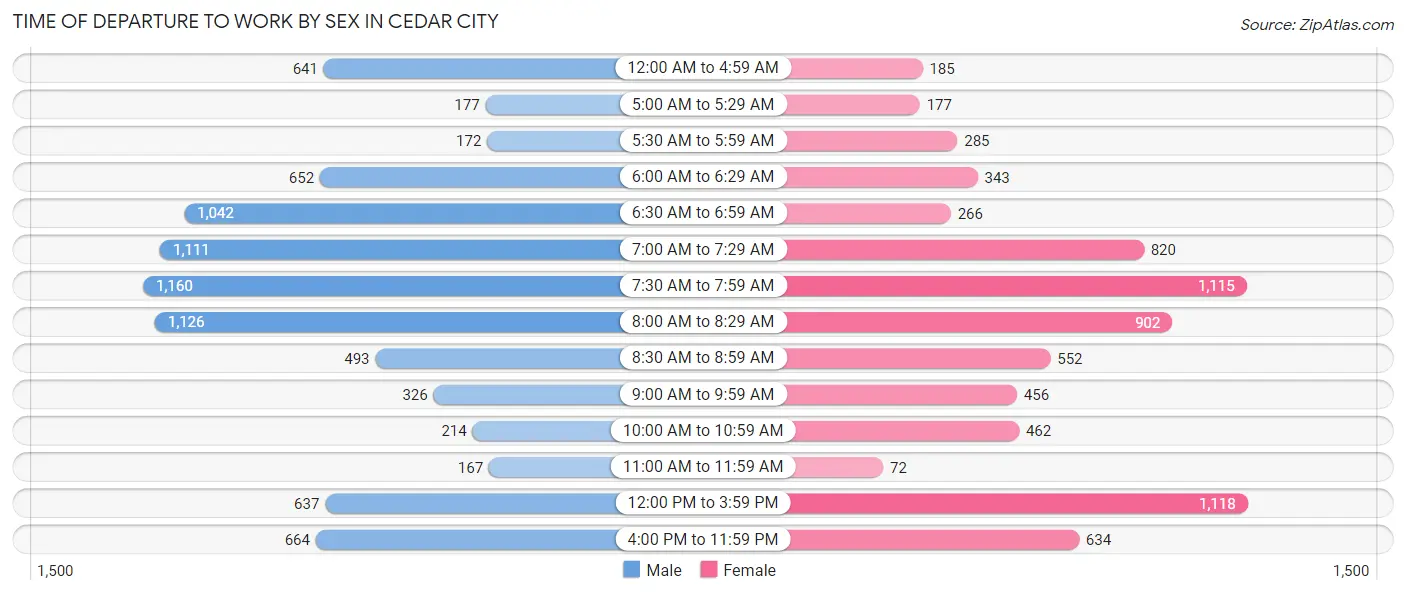
| Time of Departure | Male | Female |
| 12:00 AM to 4:59 AM | 641 (7.5%) | 185 (2.5%) |
| 5:00 AM to 5:29 AM | 177 (2.1%) | 177 (2.4%) |
| 5:30 AM to 5:59 AM | 172 (2.0%) | 285 (3.9%) |
| 6:00 AM to 6:29 AM | 652 (7.6%) | 343 (4.6%) |
| 6:30 AM to 6:59 AM | 1,042 (12.1%) | 266 (3.6%) |
| 7:00 AM to 7:29 AM | 1,111 (13.0%) | 820 (11.1%) |
| 7:30 AM to 7:59 AM | 1,160 (13.5%) | 1,115 (15.1%) |
| 8:00 AM to 8:29 AM | 1,126 (13.1%) | 902 (12.2%) |
| 8:30 AM to 8:59 AM | 493 (5.7%) | 552 (7.5%) |
| 9:00 AM to 9:59 AM | 326 (3.8%) | 456 (6.2%) |
| 10:00 AM to 10:59 AM | 214 (2.5%) | 462 (6.2%) |
| 11:00 AM to 11:59 AM | 167 (1.9%) | 72 (1.0%) |
| 12:00 PM to 3:59 PM | 637 (7.4%) | 1,118 (15.1%) |
| 4:00 PM to 11:59 PM | 664 (7.7%) | 634 (8.6%) |
| Total | 8,582 (100.0%) | 7,387 (100.0%) |
Housing Occupancy in Cedar City
Occupancy by Ownership in Cedar City
Of the total 11,377 dwellings in Cedar City, owner-occupied units account for 6,466 (56.8%), while renter-occupied units make up 4,911 (43.2%).
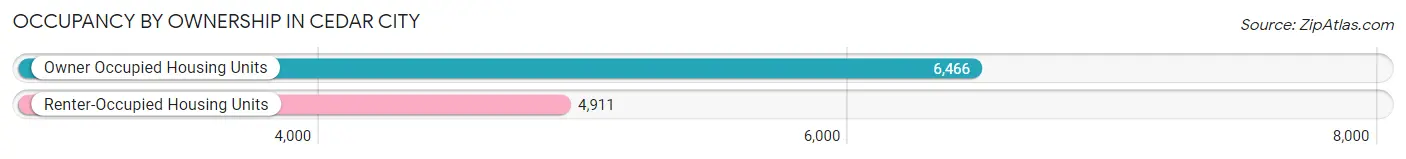
| Occupancy | # Housing Units | % Housing Units |
| Owner Occupied Housing Units | 6,466 | 56.8% |
| Renter-Occupied Housing Units | 4,911 | 43.2% |
| Total Occupied Housing Units | 11,377 | 100.0% |
Occupancy by Household Size in Cedar City
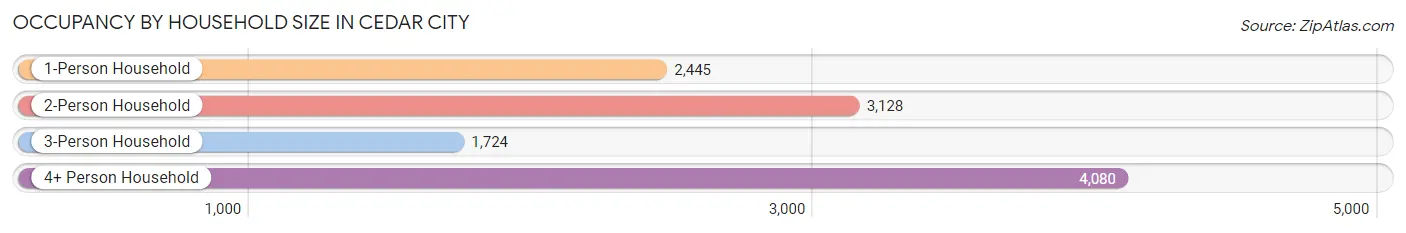
| Household Size | # Housing Units | % Housing Units |
| 1-Person Household | 2,445 | 21.5% |
| 2-Person Household | 3,128 | 27.5% |
| 3-Person Household | 1,724 | 15.1% |
| 4+ Person Household | 4,080 | 35.9% |
| Total Housing Units | 11,377 | 100.0% |
Occupancy by Ownership by Household Size in Cedar City
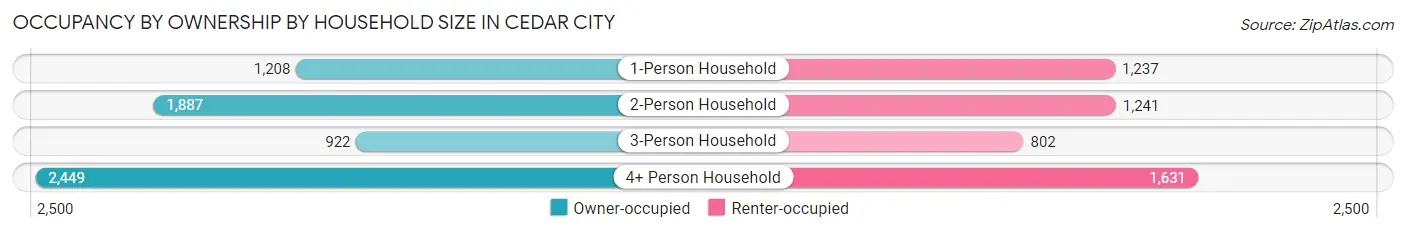
| Household Size | Owner-occupied | Renter-occupied |
| 1-Person Household | 1,208 (49.4%) | 1,237 (50.6%) |
| 2-Person Household | 1,887 (60.3%) | 1,241 (39.7%) |
| 3-Person Household | 922 (53.5%) | 802 (46.5%) |
| 4+ Person Household | 2,449 (60.0%) | 1,631 (40.0%) |
| Total Housing Units | 6,466 (56.8%) | 4,911 (43.2%) |
Occupancy by Educational Attainment in Cedar City
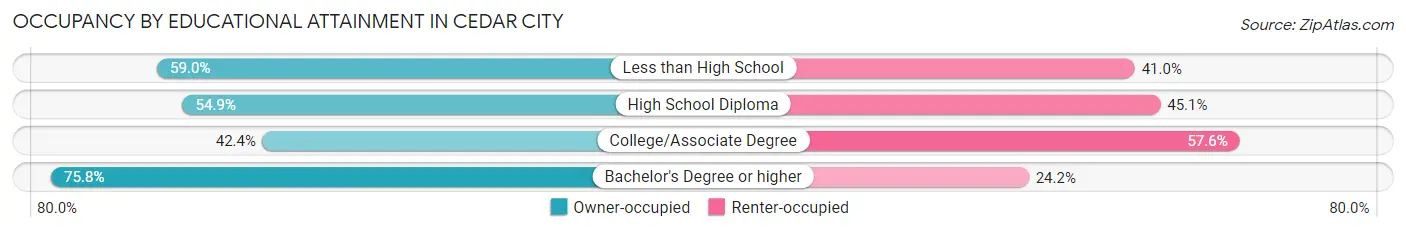
| Household Size | Owner-occupied | Renter-occupied |
| Less than High School | 384 (59.0%) | 267 (41.0%) |
| High School Diploma | 1,162 (54.9%) | 953 (45.1%) |
| College/Associate Degree | 2,038 (42.4%) | 2,771 (57.6%) |
| Bachelor's Degree or higher | 2,882 (75.8%) | 920 (24.2%) |
Occupancy by Age of Householder in Cedar City
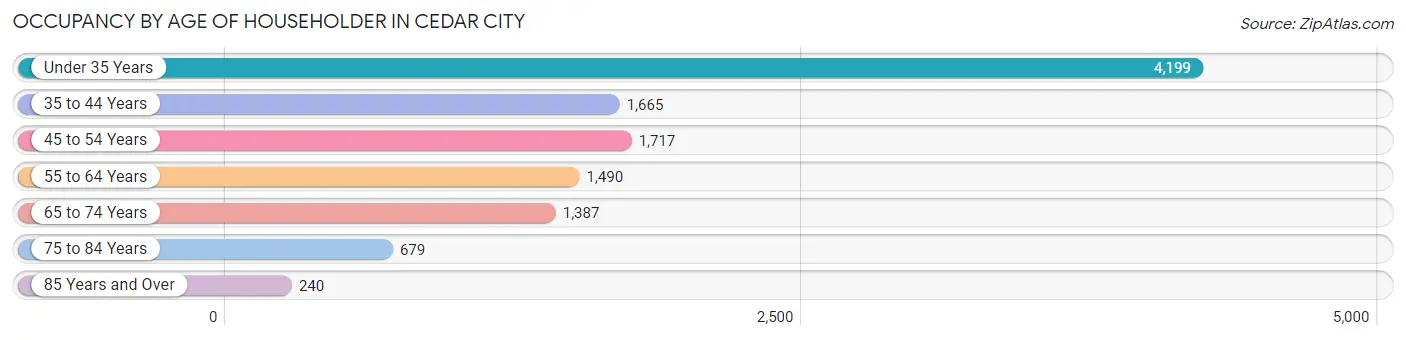
| Age Bracket | # Households | % Households |
| Under 35 Years | 4,199 | 36.9% |
| 35 to 44 Years | 1,665 | 14.6% |
| 45 to 54 Years | 1,717 | 15.1% |
| 55 to 64 Years | 1,490 | 13.1% |
| 65 to 74 Years | 1,387 | 12.2% |
| 75 to 84 Years | 679 | 6.0% |
| 85 Years and Over | 240 | 2.1% |
| Total | 11,377 | 100.0% |
Housing Finances in Cedar City
Median Income by Occupancy in Cedar City
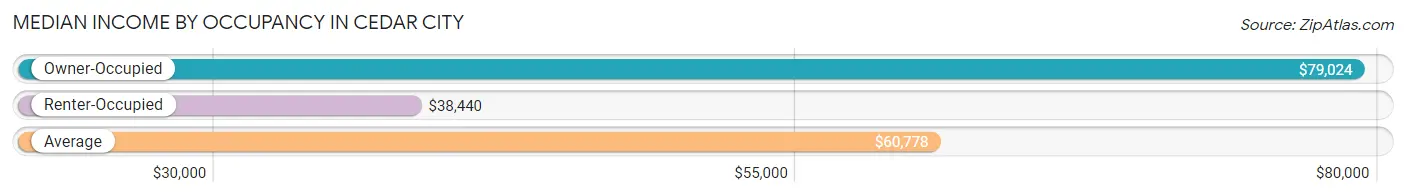
| Occupancy Type | # Households | Median Income |
| Owner-Occupied | 6,466 (56.8%) | $79,024 |
| Renter-Occupied | 4,911 (43.2%) | $38,440 |
| Average | 11,377 (100.0%) | $60,778 |
Occupancy by Householder Income Bracket in Cedar City
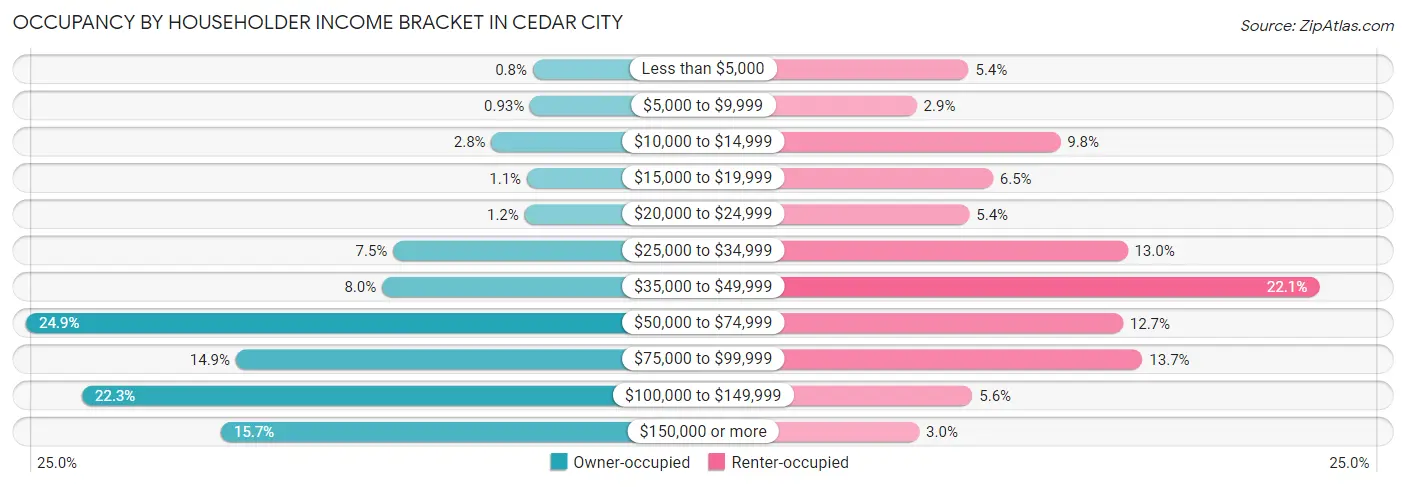
| Income Bracket | Owner-occupied | Renter-occupied |
| Less than $5,000 | 52 (0.8%) | 264 (5.4%) |
| $5,000 to $9,999 | 60 (0.9%) | 143 (2.9%) |
| $10,000 to $14,999 | 179 (2.8%) | 479 (9.8%) |
| $15,000 to $19,999 | 70 (1.1%) | 321 (6.5%) |
| $20,000 to $24,999 | 77 (1.2%) | 266 (5.4%) |
| $25,000 to $34,999 | 482 (7.4%) | 636 (13.0%) |
| $35,000 to $49,999 | 516 (8.0%) | 1,084 (22.1%) |
| $50,000 to $74,999 | 1,612 (24.9%) | 625 (12.7%) |
| $75,000 to $99,999 | 966 (14.9%) | 671 (13.7%) |
| $100,000 to $149,999 | 1,440 (22.3%) | 273 (5.6%) |
| $150,000 or more | 1,012 (15.7%) | 149 (3.0%) |
| Total | 6,466 (100.0%) | 4,911 (100.0%) |
Monthly Housing Cost Tiers in Cedar City
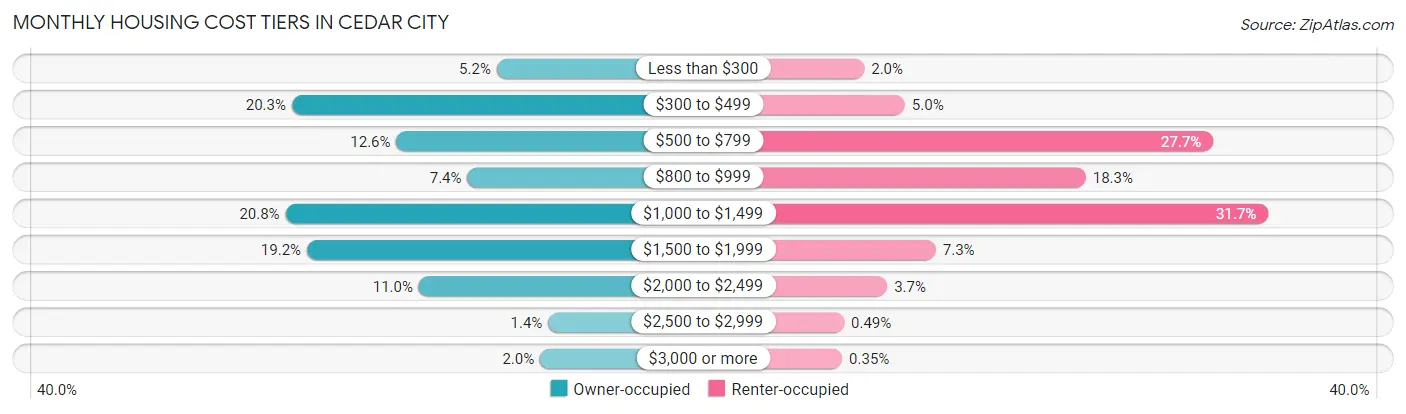
| Monthly Cost | Owner-occupied | Renter-occupied |
| Less than $300 | 338 (5.2%) | 97 (2.0%) |
| $300 to $499 | 1,314 (20.3%) | 244 (5.0%) |
| $500 to $799 | 816 (12.6%) | 1,359 (27.7%) |
| $800 to $999 | 478 (7.4%) | 898 (18.3%) |
| $1,000 to $1,499 | 1,344 (20.8%) | 1,558 (31.7%) |
| $1,500 to $1,999 | 1,242 (19.2%) | 356 (7.2%) |
| $2,000 to $2,499 | 709 (11.0%) | 180 (3.7%) |
| $2,500 to $2,999 | 93 (1.4%) | 24 (0.5%) |
| $3,000 or more | 132 (2.0%) | 17 (0.4%) |
| Total | 6,466 (100.0%) | 4,911 (100.0%) |
Physical Housing Characteristics in Cedar City
Housing Structures in Cedar City
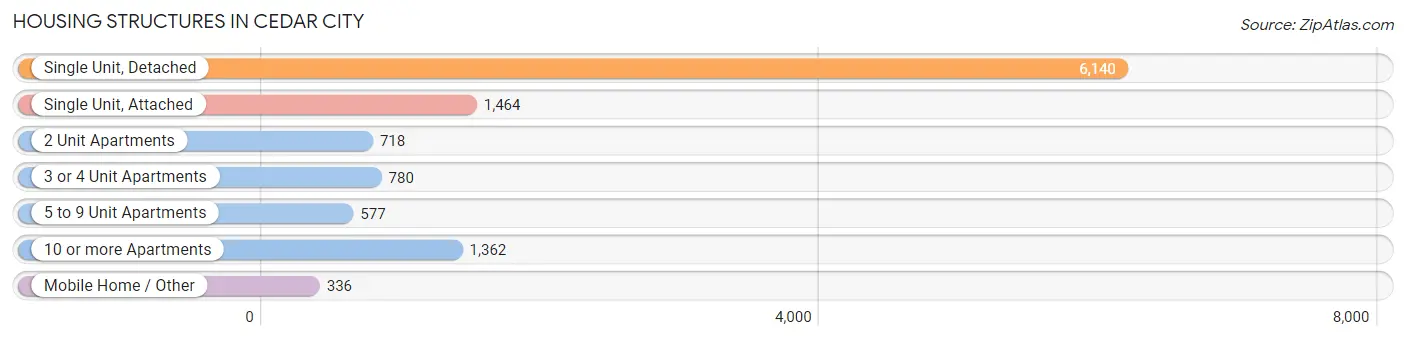
| Structure Type | # Housing Units | % Housing Units |
| Single Unit, Detached | 6,140 | 54.0% |
| Single Unit, Attached | 1,464 | 12.9% |
| 2 Unit Apartments | 718 | 6.3% |
| 3 or 4 Unit Apartments | 780 | 6.9% |
| 5 to 9 Unit Apartments | 577 | 5.1% |
| 10 or more Apartments | 1,362 | 12.0% |
| Mobile Home / Other | 336 | 2.9% |
| Total | 11,377 | 100.0% |
Housing Structures by Occupancy in Cedar City
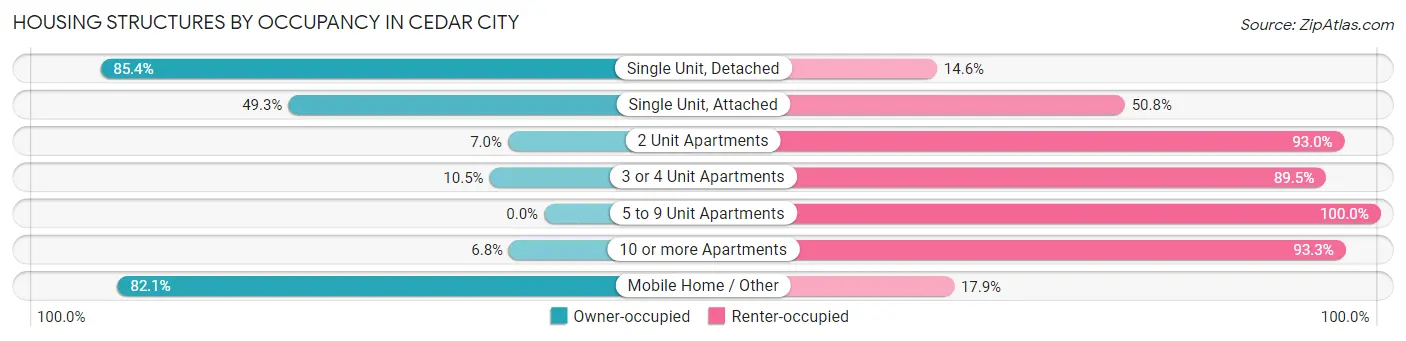
| Structure Type | Owner-occupied | Renter-occupied |
| Single Unit, Detached | 5,245 (85.4%) | 895 (14.6%) |
| Single Unit, Attached | 721 (49.2%) | 743 (50.7%) |
| 2 Unit Apartments | 50 (7.0%) | 668 (93.0%) |
| 3 or 4 Unit Apartments | 82 (10.5%) | 698 (89.5%) |
| 5 to 9 Unit Apartments | 0 (0.0%) | 577 (100.0%) |
| 10 or more Apartments | 92 (6.8%) | 1,270 (93.2%) |
| Mobile Home / Other | 276 (82.1%) | 60 (17.9%) |
| Total | 6,466 (56.8%) | 4,911 (43.2%) |
Housing Structures by Number of Rooms in Cedar City
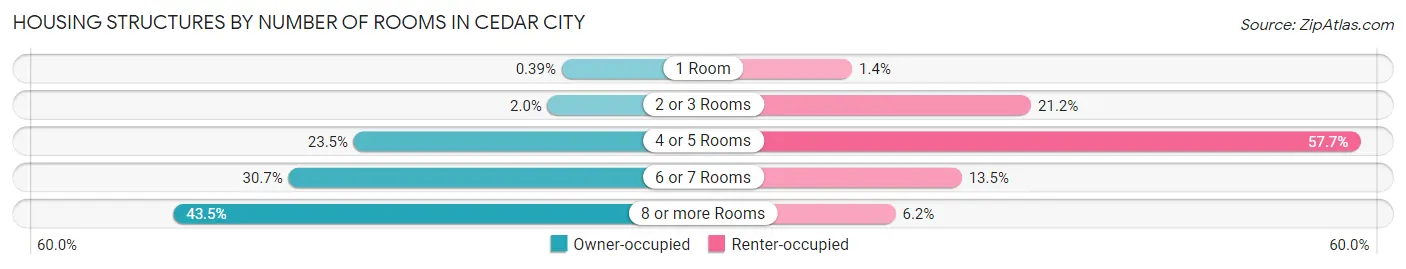
| Number of Rooms | Owner-occupied | Renter-occupied |
| 1 Room | 25 (0.4%) | 67 (1.4%) |
| 2 or 3 Rooms | 126 (1.9%) | 1,042 (21.2%) |
| 4 or 5 Rooms | 1,517 (23.5%) | 2,835 (57.7%) |
| 6 or 7 Rooms | 1,986 (30.7%) | 664 (13.5%) |
| 8 or more Rooms | 2,812 (43.5%) | 303 (6.2%) |
| Total | 6,466 (100.0%) | 4,911 (100.0%) |
Housing Structure by Heating Type in Cedar City
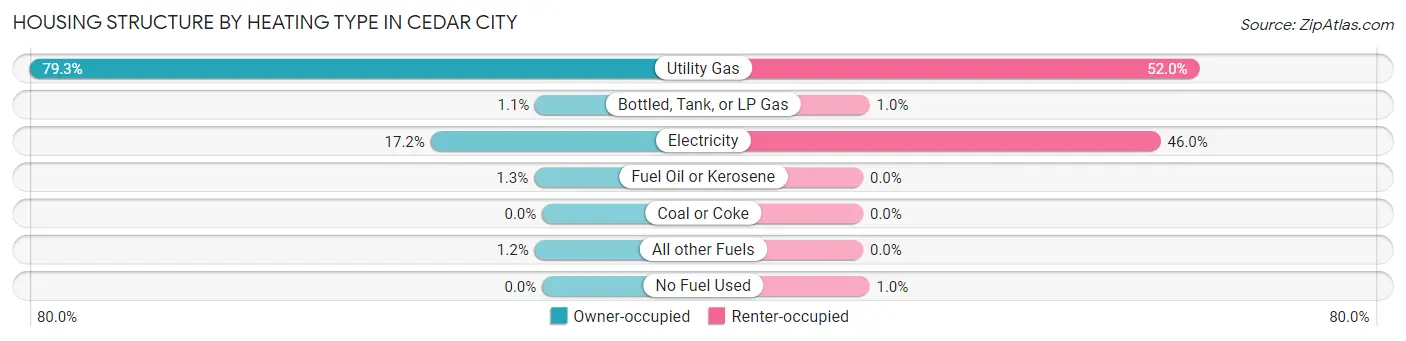
| Heating Type | Owner-occupied | Renter-occupied |
| Utility Gas | 5,125 (79.3%) | 2,553 (52.0%) |
| Bottled, Tank, or LP Gas | 69 (1.1%) | 50 (1.0%) |
| Electricity | 1,115 (17.2%) | 2,259 (46.0%) |
| Fuel Oil or Kerosene | 81 (1.3%) | 0 (0.0%) |
| Coal or Coke | 0 (0.0%) | 0 (0.0%) |
| All other Fuels | 76 (1.2%) | 0 (0.0%) |
| No Fuel Used | 0 (0.0%) | 49 (1.0%) |
| Total | 6,466 (100.0%) | 4,911 (100.0%) |
Household Vehicle Usage in Cedar City
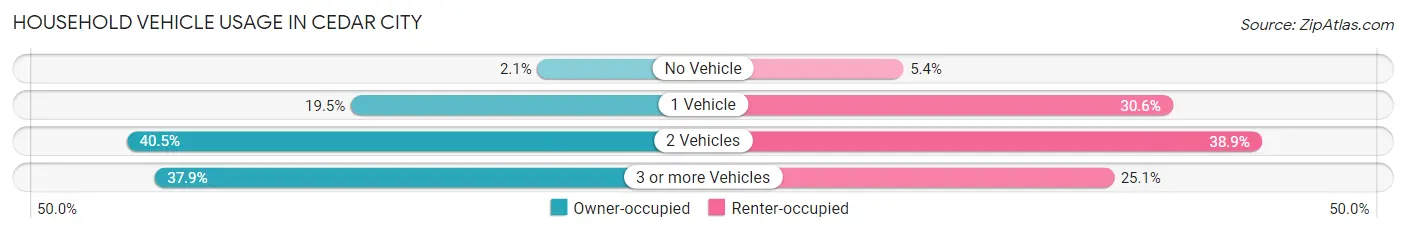
| Vehicles per Household | Owner-occupied | Renter-occupied |
| No Vehicle | 137 (2.1%) | 267 (5.4%) |
| 1 Vehicle | 1,262 (19.5%) | 1,502 (30.6%) |
| 2 Vehicles | 2,617 (40.5%) | 1,910 (38.9%) |
| 3 or more Vehicles | 2,450 (37.9%) | 1,232 (25.1%) |
| Total | 6,466 (100.0%) | 4,911 (100.0%) |
Real Estate & Mortgages in Cedar City
Real Estate and Mortgage Overview in Cedar City
| Characteristic | Without Mortgage | With Mortgage |
| Housing Units | 2,200 | 4,266 |
| Median Property Value | $292,500 | $315,800 |
| Median Household Income | $73,019 | $749 |
| Monthly Housing Costs | $416 | $132 |
| Real Estate Taxes | $1,452 | $140 |
Property Value by Mortgage Status in Cedar City
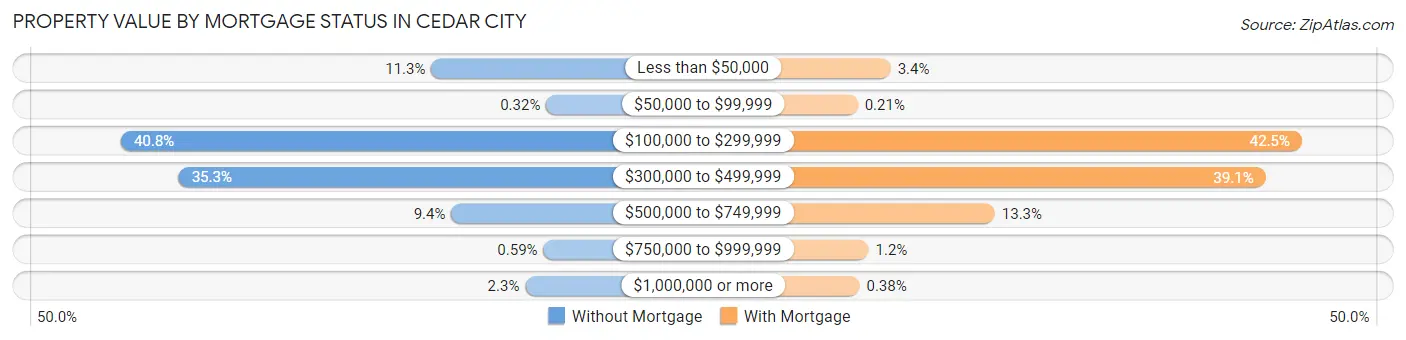
| Property Value | Without Mortgage | With Mortgage |
| Less than $50,000 | 248 (11.3%) | 143 (3.4%) |
| $50,000 to $99,999 | 7 (0.3%) | 9 (0.2%) |
| $100,000 to $299,999 | 898 (40.8%) | 1,813 (42.5%) |
| $300,000 to $499,999 | 777 (35.3%) | 1,666 (39.1%) |
| $500,000 to $749,999 | 206 (9.4%) | 566 (13.3%) |
| $750,000 to $999,999 | 13 (0.6%) | 53 (1.2%) |
| $1,000,000 or more | 51 (2.3%) | 16 (0.4%) |
| Total | 2,200 (100.0%) | 4,266 (100.0%) |
Household Income by Mortgage Status in Cedar City
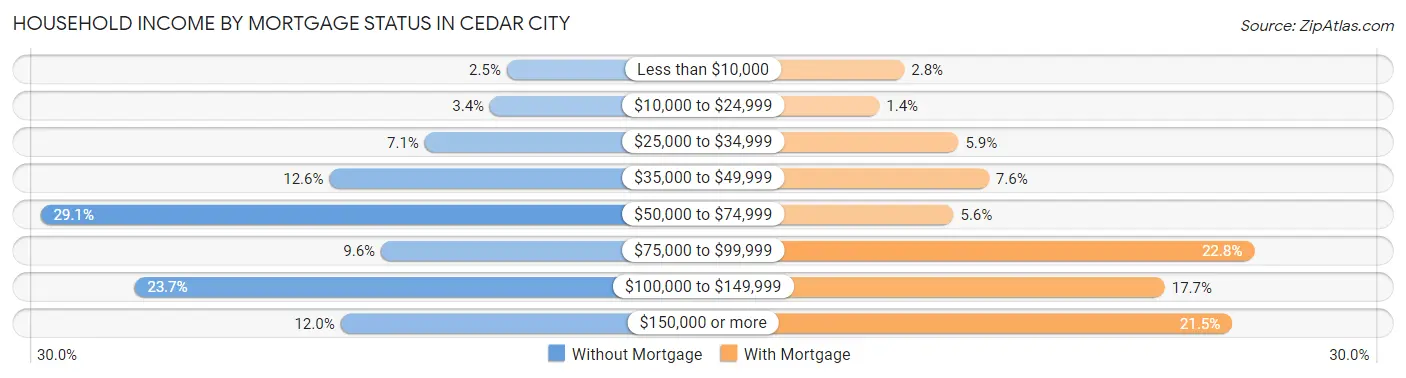
| Household Income | Without Mortgage | With Mortgage |
| Less than $10,000 | 54 (2.5%) | 119 (2.8%) |
| $10,000 to $24,999 | 75 (3.4%) | 58 (1.4%) |
| $25,000 to $34,999 | 157 (7.1%) | 251 (5.9%) |
| $35,000 to $49,999 | 277 (12.6%) | 325 (7.6%) |
| $50,000 to $74,999 | 640 (29.1%) | 239 (5.6%) |
| $75,000 to $99,999 | 212 (9.6%) | 972 (22.8%) |
| $100,000 to $149,999 | 522 (23.7%) | 754 (17.7%) |
| $150,000 or more | 263 (11.9%) | 918 (21.5%) |
| Total | 2,200 (100.0%) | 4,266 (100.0%) |
Property Value to Household Income Ratio in Cedar City
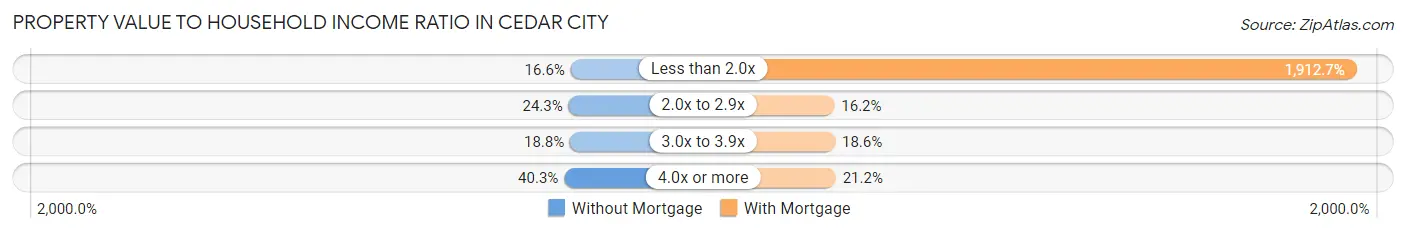
| Value-to-Income Ratio | Without Mortgage | With Mortgage |
| Less than 2.0x | 366 (16.6%) | 81,595 (1,912.7%) |
| 2.0x to 2.9x | 534 (24.3%) | 690 (16.2%) |
| 3.0x to 3.9x | 414 (18.8%) | 794 (18.6%) |
| 4.0x or more | 886 (40.3%) | 903 (21.2%) |
| Total | 2,200 (100.0%) | 4,266 (100.0%) |
Real Estate Taxes by Mortgage Status in Cedar City
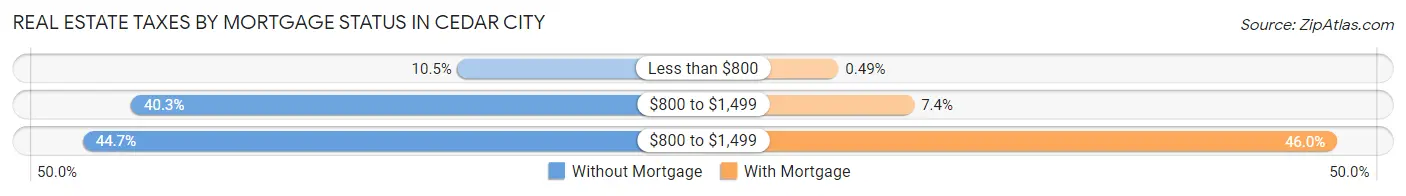
| Property Taxes | Without Mortgage | With Mortgage |
| Less than $800 | 230 (10.4%) | 21 (0.5%) |
| $800 to $1,499 | 886 (40.3%) | 316 (7.4%) |
| $800 to $1,499 | 983 (44.7%) | 1,964 (46.0%) |
| Total | 2,200 (100.0%) | 4,266 (100.0%) |
Health & Disability in Cedar City
Health Insurance Coverage by Age in Cedar City
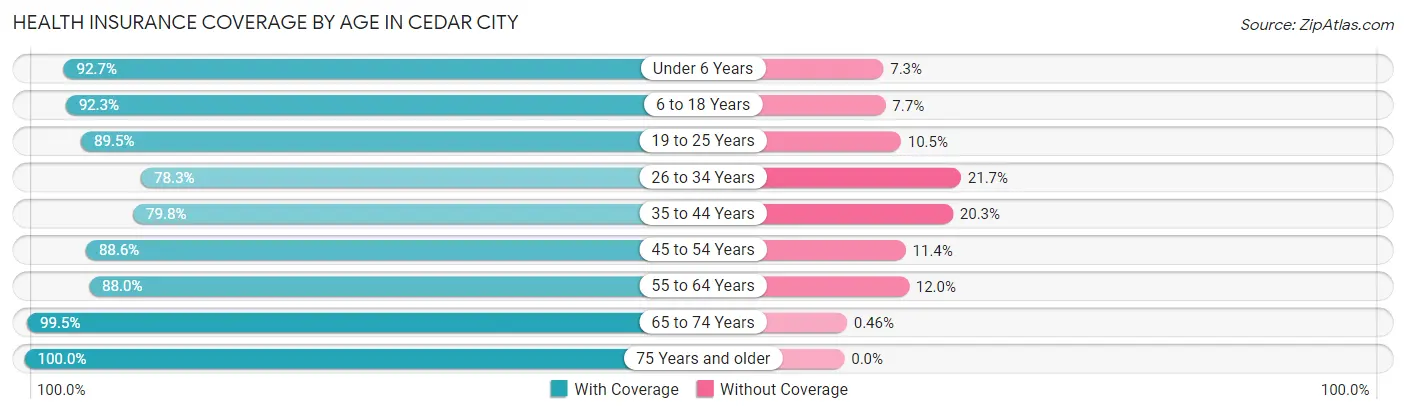
| Age Bracket | With Coverage | Without Coverage |
| Under 6 Years | 3,025 (92.7%) | 237 (7.3%) |
| 6 to 18 Years | 6,806 (92.3%) | 565 (7.7%) |
| 19 to 25 Years | 6,418 (89.5%) | 756 (10.5%) |
| 26 to 34 Years | 3,876 (78.3%) | 1,077 (21.7%) |
| 35 to 44 Years | 2,730 (79.7%) | 693 (20.3%) |
| 45 to 54 Years | 2,539 (88.6%) | 328 (11.4%) |
| 55 to 64 Years | 2,356 (88.0%) | 322 (12.0%) |
| 65 to 74 Years | 2,367 (99.5%) | 11 (0.5%) |
| 75 Years and older | 1,470 (100.0%) | 0 (0.0%) |
| Total | 31,587 (88.8%) | 3,989 (11.2%) |
Health Insurance Coverage by Citizenship Status in Cedar City
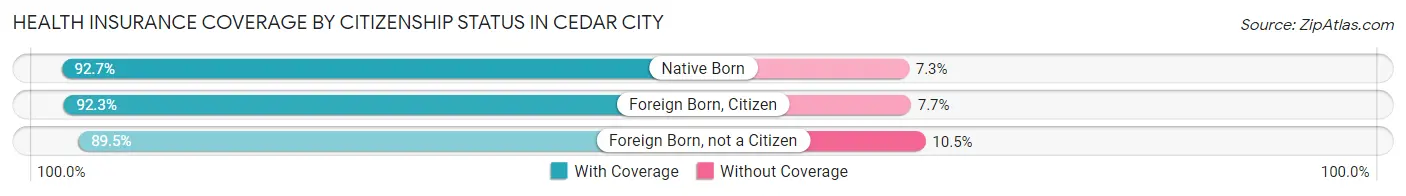
| Citizenship Status | With Coverage | Without Coverage |
| Native Born | 3,025 (92.7%) | 237 (7.3%) |
| Foreign Born, Citizen | 6,806 (92.3%) | 565 (7.7%) |
| Foreign Born, not a Citizen | 6,418 (89.5%) | 756 (10.5%) |
Health Insurance Coverage by Household Income in Cedar City
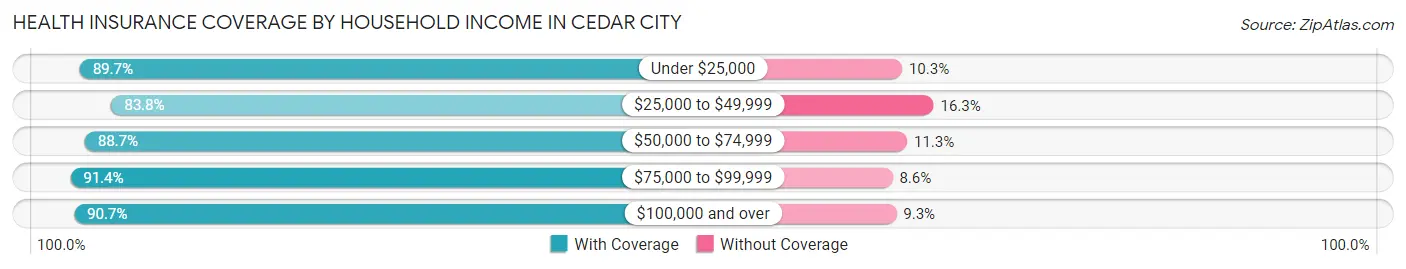
| Household Income | With Coverage | Without Coverage |
| Under $25,000 | 3,372 (89.7%) | 389 (10.3%) |
| $25,000 to $49,999 | 6,306 (83.8%) | 1,224 (16.3%) |
| $50,000 to $74,999 | 6,263 (88.7%) | 797 (11.3%) |
| $75,000 to $99,999 | 5,278 (91.4%) | 494 (8.6%) |
| $100,000 and over | 9,848 (90.7%) | 1,007 (9.3%) |
Public vs Private Health Insurance Coverage by Age in Cedar City
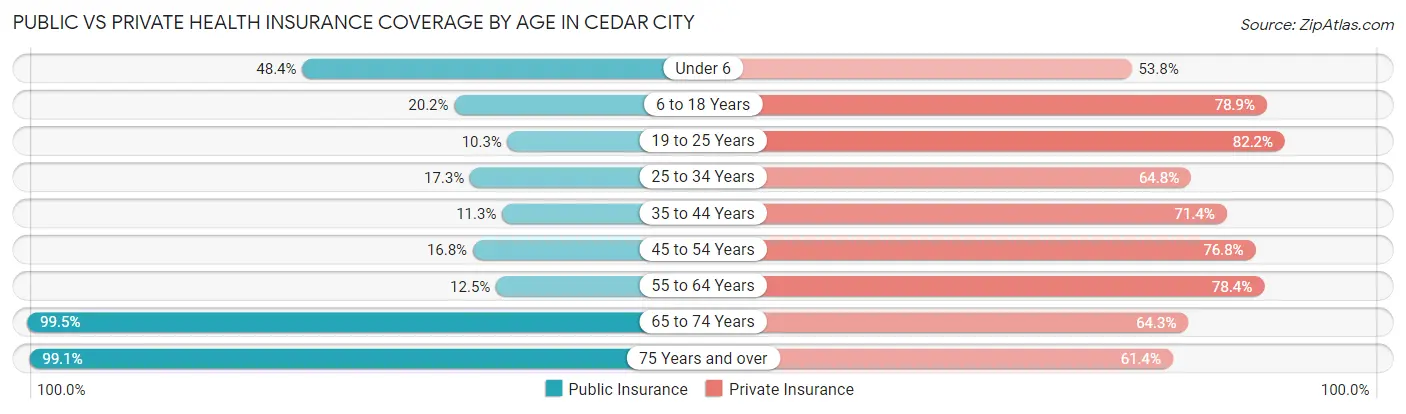
| Age Bracket | Public Insurance | Private Insurance |
| Under 6 | 1,580 (48.4%) | 1,754 (53.8%) |
| 6 to 18 Years | 1,491 (20.2%) | 5,814 (78.9%) |
| 19 to 25 Years | 741 (10.3%) | 5,899 (82.2%) |
| 25 to 34 Years | 858 (17.3%) | 3,210 (64.8%) |
| 35 to 44 Years | 388 (11.3%) | 2,445 (71.4%) |
| 45 to 54 Years | 481 (16.8%) | 2,201 (76.8%) |
| 55 to 64 Years | 334 (12.5%) | 2,099 (78.4%) |
| 65 to 74 Years | 2,367 (99.5%) | 1,529 (64.3%) |
| 75 Years and over | 1,457 (99.1%) | 903 (61.4%) |
| Total | 9,697 (27.3%) | 25,854 (72.7%) |
Disability Status by Sex by Age in Cedar City
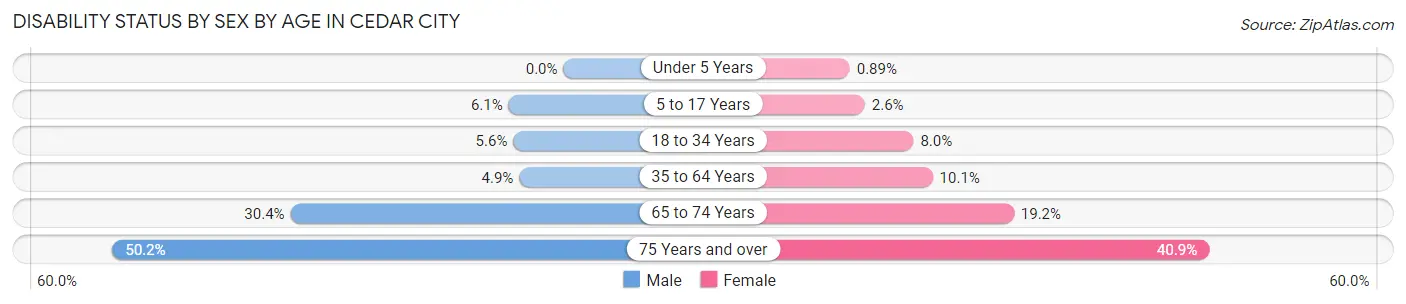
| Age Bracket | Male | Female |
| Under 5 Years | 0 (0.0%) | 11 (0.9%) |
| 5 to 17 Years | 228 (6.1%) | 83 (2.6%) |
| 18 to 34 Years | 351 (5.6%) | 543 (8.0%) |
| 35 to 64 Years | 224 (4.9%) | 447 (10.1%) |
| 65 to 74 Years | 339 (30.4%) | 242 (19.2%) |
| 75 Years and over | 327 (50.2%) | 335 (40.9%) |
Disability Class by Sex by Age in Cedar City
Disability Class: Hearing Difficulty
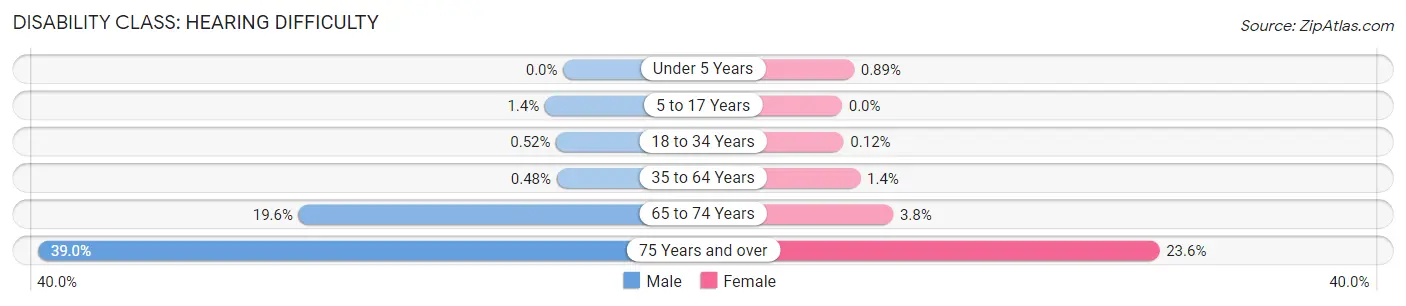
| Age Bracket | Male | Female |
| Under 5 Years | 0 (0.0%) | 11 (0.9%) |
| 5 to 17 Years | 51 (1.4%) | 0 (0.0%) |
| 18 to 34 Years | 33 (0.5%) | 8 (0.1%) |
| 35 to 64 Years | 22 (0.5%) | 60 (1.4%) |
| 65 to 74 Years | 219 (19.6%) | 48 (3.8%) |
| 75 Years and over | 254 (39.0%) | 193 (23.6%) |
Disability Class: Vision Difficulty
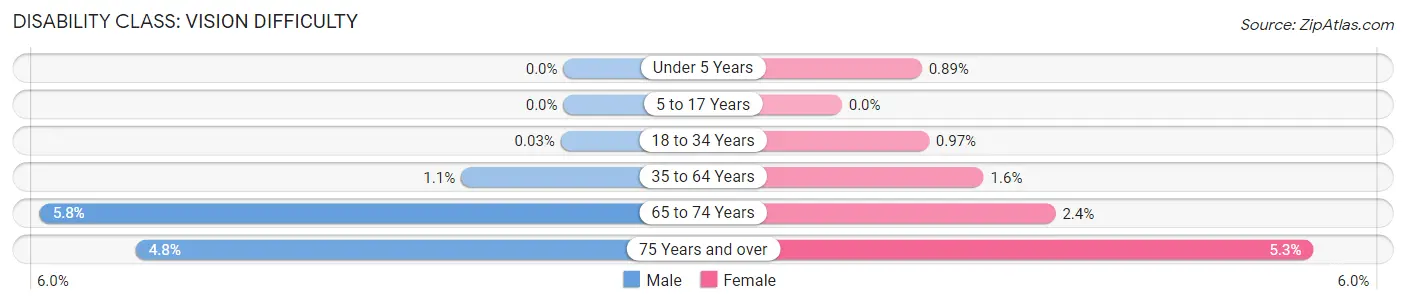
| Age Bracket | Male | Female |
| Under 5 Years | 0 (0.0%) | 11 (0.9%) |
| 5 to 17 Years | 0 (0.0%) | 0 (0.0%) |
| 18 to 34 Years | 2 (0.0%) | 66 (1.0%) |
| 35 to 64 Years | 52 (1.1%) | 70 (1.6%) |
| 65 to 74 Years | 65 (5.8%) | 30 (2.4%) |
| 75 Years and over | 31 (4.8%) | 43 (5.2%) |
Disability Class: Cognitive Difficulty
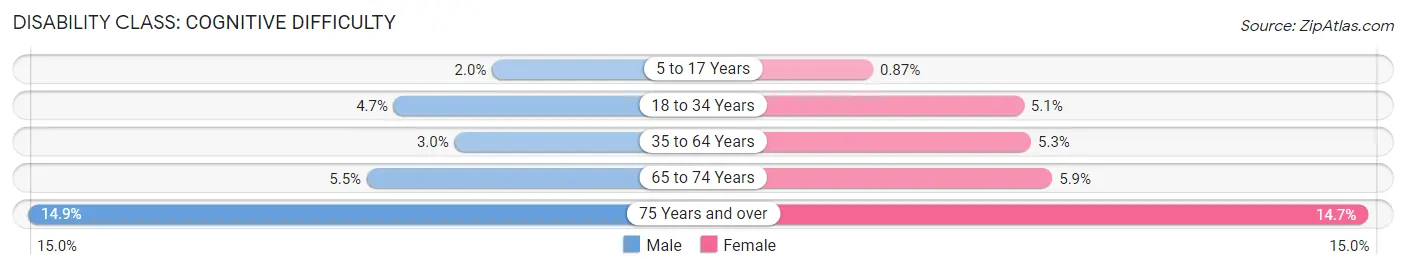
| Age Bracket | Male | Female |
| 5 to 17 Years | 74 (2.0%) | 28 (0.9%) |
| 18 to 34 Years | 297 (4.7%) | 345 (5.1%) |
| 35 to 64 Years | 138 (3.0%) | 233 (5.3%) |
| 65 to 74 Years | 61 (5.5%) | 74 (5.9%) |
| 75 Years and over | 97 (14.9%) | 120 (14.6%) |
Disability Class: Ambulatory Difficulty
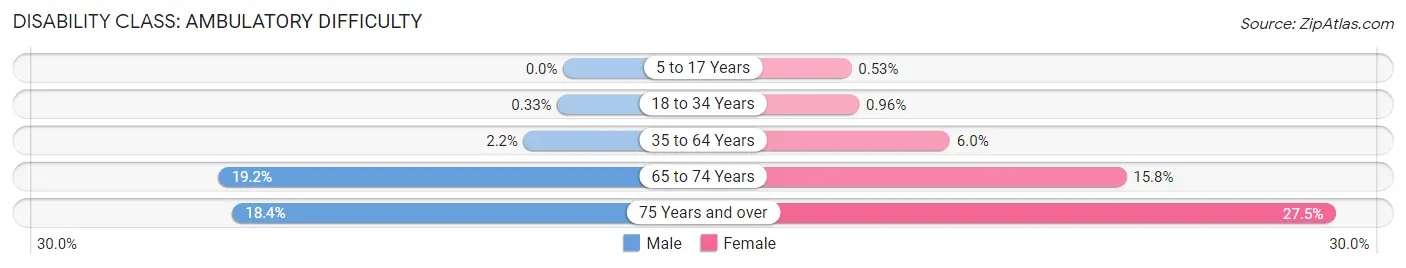
| Age Bracket | Male | Female |
| 5 to 17 Years | 0 (0.0%) | 17 (0.5%) |
| 18 to 34 Years | 21 (0.3%) | 65 (1.0%) |
| 35 to 64 Years | 100 (2.2%) | 266 (6.0%) |
| 65 to 74 Years | 214 (19.2%) | 200 (15.8%) |
| 75 Years and over | 120 (18.4%) | 225 (27.5%) |
Disability Class: Self-Care Difficulty
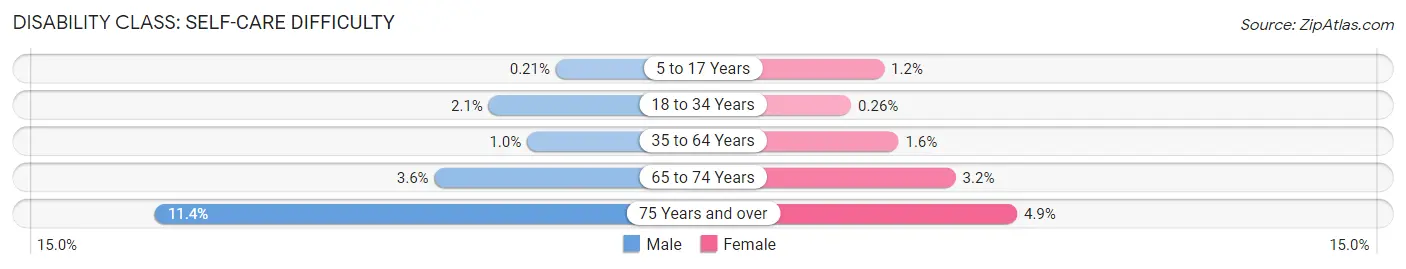
| Age Bracket | Male | Female |
| 5 to 17 Years | 8 (0.2%) | 38 (1.2%) |
| 18 to 34 Years | 131 (2.1%) | 18 (0.3%) |
| 35 to 64 Years | 46 (1.0%) | 70 (1.6%) |
| 65 to 74 Years | 40 (3.6%) | 40 (3.2%) |
| 75 Years and over | 74 (11.4%) | 40 (4.9%) |
Technology Access in Cedar City
Computing Device Access in Cedar City
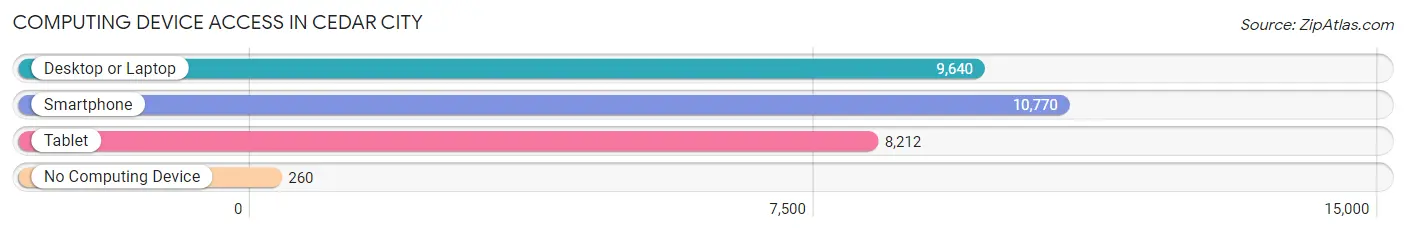
| Device Type | # Households | % Households |
| Desktop or Laptop | 9,640 | 84.7% |
| Smartphone | 10,770 | 94.7% |
| Tablet | 8,212 | 72.2% |
| No Computing Device | 260 | 2.3% |
| Total | 11,377 | 100.0% |
Internet Access in Cedar City
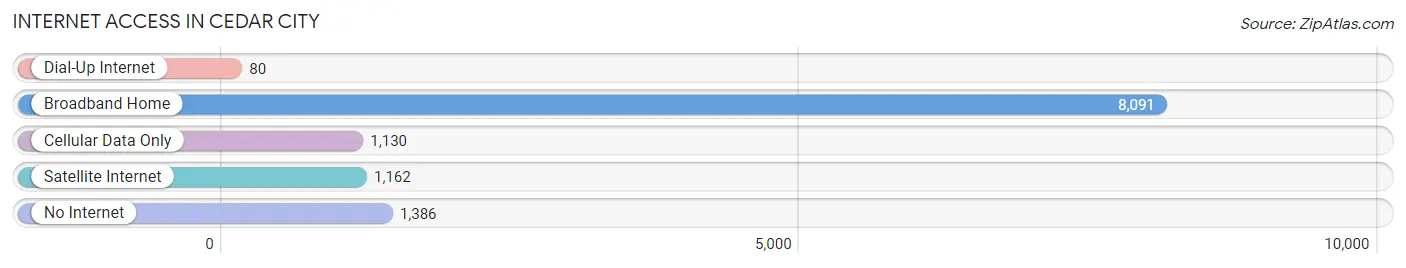
| Internet Type | # Households | % Households |
| Dial-Up Internet | 80 | 0.7% |
| Broadband Home | 8,091 | 71.1% |
| Cellular Data Only | 1,130 | 9.9% |
| Satellite Internet | 1,162 | 10.2% |
| No Internet | 1,386 | 12.2% |
| Total | 11,377 | 100.0% |
Cedar City Summary
Cedar City is a city located in southwestern Utah, United States, near the Arizona border. It is the county seat of Iron County and is the largest city in the county. The city is located in the heart of the Cedar Valley, a region of the Great Basin Desert. The city is known for its rich history, diverse geography, and vibrant economy.
History
Cedar City was founded in 1851 by a group of Mormon pioneers led by Isaac C. Haight. The pioneers named the city after the nearby Cedar Mountains, which were named for the abundance of cedar trees in the area. The city was originally a farming community, but soon developed into a trading center for the surrounding area. In 1868, the Utah and Nevada Railroad was built through the city, connecting it to the rest of the country. This allowed the city to become a major hub for the mining and lumber industries.
In the early 20th century, Cedar City experienced a period of growth and prosperity. The city was home to several large businesses, including the Iron County Bank, the Cedar City Lumber Company, and the Cedar City Woolen Mills. The city also became a popular tourist destination, with many visitors coming to enjoy the nearby national parks and monuments.
Geography
Cedar City is located in southwestern Utah, near the Arizona border. It is situated in the heart of the Cedar Valley, a region of the Great Basin Desert. The city is surrounded by mountains, including the Cedar Mountains to the north and the Markagunt Plateau to the south. The city is located at an elevation of 5,858 feet (1,786 m).
The climate in Cedar City is semi-arid, with hot summers and cold winters. The average annual temperature is 54°F (12°C). The average annual precipitation is 11.5 inches (292 mm).
Economy
Cedar City’s economy is largely based on tourism, education, and manufacturing. The city is home to Southern Utah University, which is a major employer in the area. The city is also home to several manufacturing companies, including the Cedar City Lumber Company and the Cedar City Woolen Mills.
The city is also a popular tourist destination, with many visitors coming to enjoy the nearby national parks and monuments. The city is home to several popular attractions, including the Cedar Breaks National Monument, the Cedar City Aquatic Center, and the Cedar City Arts Center.
Demographics
As of the 2010 census, Cedar City had a population of 28,857. The racial makeup of the city was 90.2% White, 0.7% African American, 1.2% Native American, 0.7% Asian, 0.1% Pacific Islander, 4.3% from other races, and 2.9% from two or more races. Hispanic or Latino of any race were 11.3% of the population.
The median income for a household in the city was $41,919, and the median income for a family was $50,919. The per capita income for the city was $20,919. About 11.3% of families and 15.2% of the population were below the poverty line, including 20.2% of those under age 18 and 8.2% of those age 65 or over.
Common Questions
What is Per Capita Income in Cedar City?
Per Capita income in Cedar City is $25,540.
What is the Median Family Income in Cedar City?
Median Family Income in Cedar City is $75,014.
What is the Median Household income in Cedar City?
Median Household Income in Cedar City is $60,778.
What is Income or Wage Gap in Cedar City?
Income or Wage Gap in Cedar City is 55.7%.
Women in Cedar City earn 44.3 cents for every dollar earned by a man.
What is Family Income Deficit in Cedar City?
Family Income Deficit in Cedar City is $8,923.
Families that are below poverty line in Cedar City earn $8,923 less on average than the poverty threshold level.
What is Inequality or Gini Index in Cedar City?
Inequality or Gini Index in Cedar City is 0.43.
What is the Total Population of Cedar City?
Total Population of Cedar City is 35,812.
What is the Total Male Population of Cedar City?
Total Male Population of Cedar City is 18,011.
What is the Total Female Population of Cedar City?
Total Female Population of Cedar City is 17,801.
What is the Ratio of Males per 100 Females in Cedar City?
There are 101.18 Males per 100 Females in Cedar City.
What is the Ratio of Females per 100 Males in Cedar City?
There are 98.83 Females per 100 Males in Cedar City.
What is the Median Population Age in Cedar City?
Median Population Age in Cedar City is 26.0 Years.
What is the Average Family Size in Cedar City
Average Family Size in Cedar City is 3.6 People.
What is the Average Household Size in Cedar City
Average Household Size in Cedar City is 3.1 People.
How Large is the Labor Force in Cedar City?
There are 18,009 People in the Labor Forcein in Cedar City.
What is the Percentage of People in the Labor Force in Cedar City?
66.4% of People are in the Labor Force in Cedar City.
What is the Unemployment Rate in Cedar City?
Unemployment Rate in Cedar City is 3.1%.