Flaming Gorge, UT Map & Demographics
Flaming Gorge Map
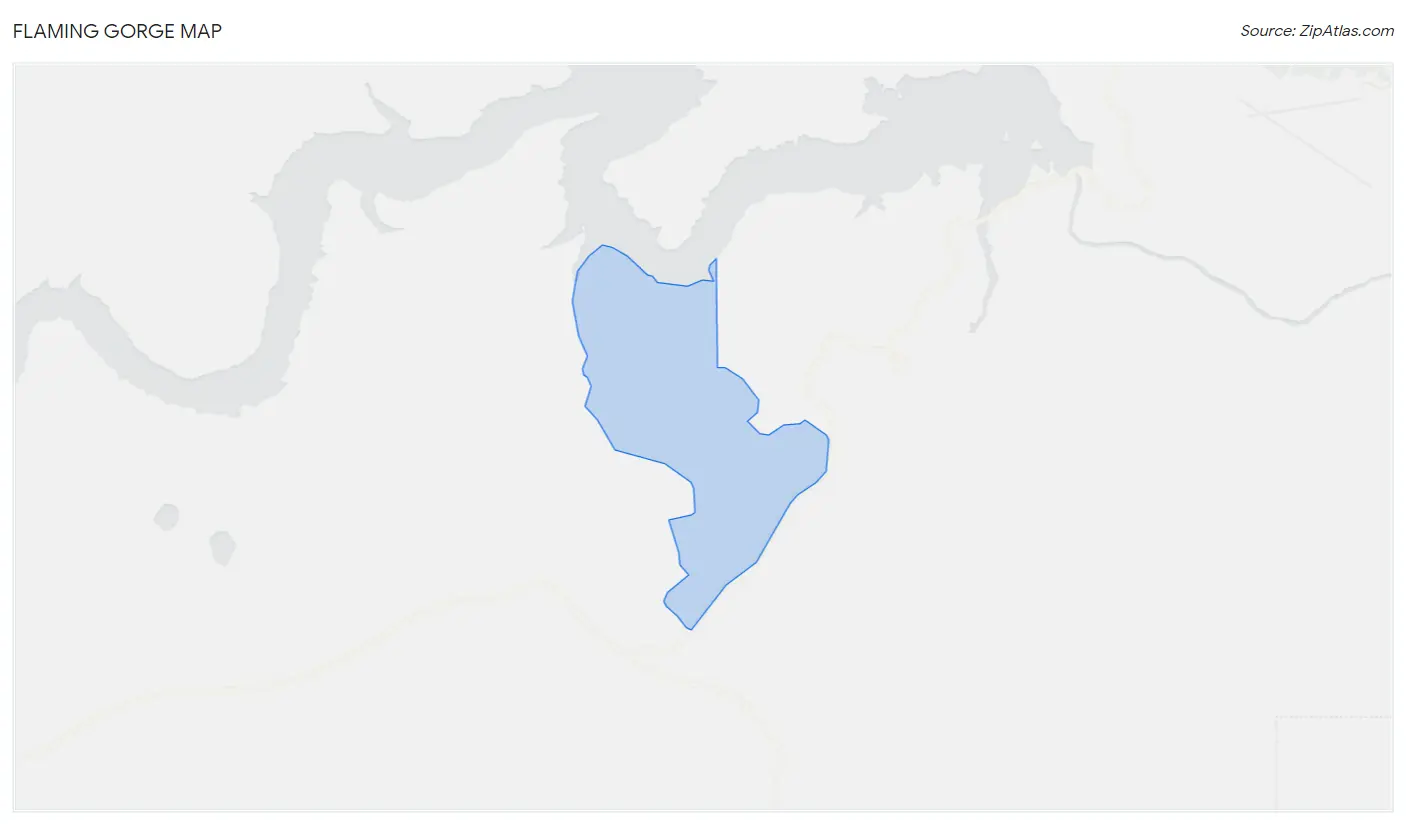
Flaming Gorge Overview
$26,367
PER CAPITA INCOME
$105,000
AVG FAMILY INCOME
$35,833
AVG HOUSEHOLD INCOME
0.46
INEQUALITY / GINI INDEX
69
TOTAL POPULATION
31
MALE POPULATION
38
FEMALE POPULATION
81.58
MALES / 100 FEMALES
122.58
FEMALES / 100 MALES
45.3
MEDIAN AGE
3.6
AVG FAMILY SIZE
2.5
AVG HOUSEHOLD SIZE
33
LABOR FORCE [ PEOPLE ]
70.2%
PERCENT IN LABOR FORCE
Income in Flaming Gorge
Income Overview in Flaming Gorge
Per Capita Income in Flaming Gorge is $26,367, while median incomes of families and households are $105,000 and $35,833 respectively.
| Characteristic | Number | Measure |
| Per Capita Income | 69 | $26,367 |
| Median Family Income | 16 | $105,000 |
| Mean Family Income | 16 | $94,100 |
| Median Household Income | 28 | $35,833 |
| Mean Household Income | 28 | $61,914 |
| Income Deficit | 16 | $0 |
| Wage / Income Gap (%) | 69 | 0.00% |
| Wage / Income Gap ($) | 69 | 100.00¢ per $1 |
| Gini / Inequality Index | 69 | 0.46 |
Earnings by Sex in Flaming Gorge
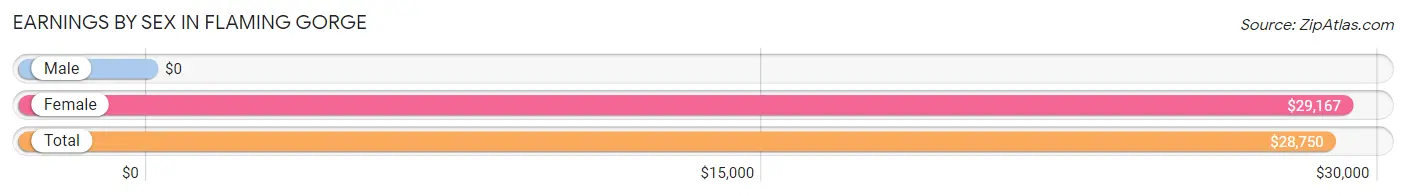
| Sex | Number | Average Earnings |
| Male | 11 (33.3%) | $0 |
| Female | 22 (66.7%) | $29,167 |
| Total | 33 (100.0%) | $28,750 |
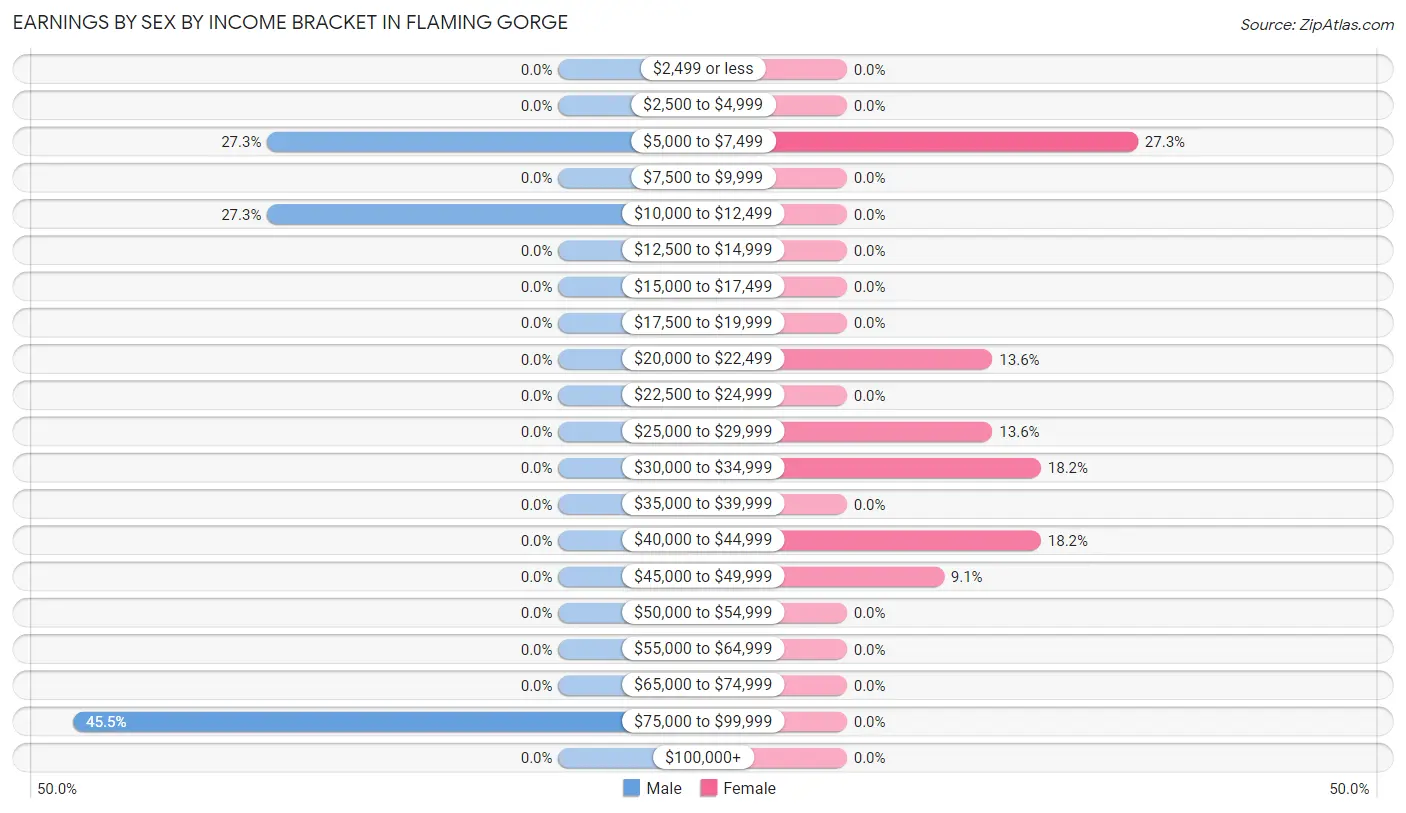
Earnings by Sex by Income Bracket in Flaming Gorge
The most common earnings brackets in Flaming Gorge are $75,000 to $99,999 for men (5 | 45.5%) and $5,000 to $7,499 for women (6 | 27.3%).
| Income | Male | Female |
| $2,499 or less | 0 (0.0%) | 0 (0.0%) |
| $2,500 to $4,999 | 0 (0.0%) | 0 (0.0%) |
| $5,000 to $7,499 | 3 (27.3%) | 6 (27.3%) |
| $7,500 to $9,999 | 0 (0.0%) | 0 (0.0%) |
| $10,000 to $12,499 | 3 (27.3%) | 0 (0.0%) |
| $12,500 to $14,999 | 0 (0.0%) | 0 (0.0%) |
| $15,000 to $17,499 | 0 (0.0%) | 0 (0.0%) |
| $17,500 to $19,999 | 0 (0.0%) | 0 (0.0%) |
| $20,000 to $22,499 | 0 (0.0%) | 3 (13.6%) |
| $22,500 to $24,999 | 0 (0.0%) | 0 (0.0%) |
| $25,000 to $29,999 | 0 (0.0%) | 3 (13.6%) |
| $30,000 to $34,999 | 0 (0.0%) | 4 (18.2%) |
| $35,000 to $39,999 | 0 (0.0%) | 0 (0.0%) |
| $40,000 to $44,999 | 0 (0.0%) | 4 (18.2%) |
| $45,000 to $49,999 | 0 (0.0%) | 2 (9.1%) |
| $50,000 to $54,999 | 0 (0.0%) | 0 (0.0%) |
| $55,000 to $64,999 | 0 (0.0%) | 0 (0.0%) |
| $65,000 to $74,999 | 0 (0.0%) | 0 (0.0%) |
| $75,000 to $99,999 | 5 (45.5%) | 0 (0.0%) |
| $100,000+ | 0 (0.0%) | 0 (0.0%) |
| Total | 11 (100.0%) | 22 (100.0%) |
Earnings by Sex by Educational Attainment in Flaming Gorge
| Educational Attainment | Male Income | Female Income |
| Less than High School | - | - |
| High School Diploma | - | - |
| College or Associate's Degree | - | - |
| Bachelor's Degree | - | - |
| Graduate Degree | - | - |
| Total | - | - |
Family Income in Flaming Gorge
Family Income Brackets in Flaming Gorge
According to the Flaming Gorge family income data, there are 5 families falling into the $100,000 to $149,999 income range, which is the most common income bracket and makes up 31.2% of all families.
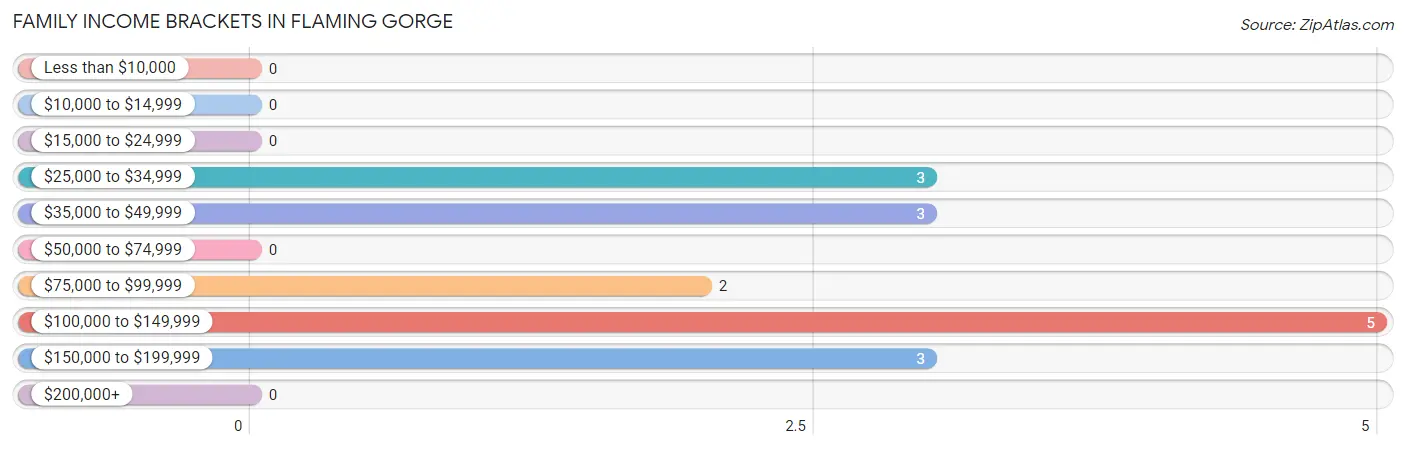
| Income Bracket | # Families | % Families |
| Less than $10,000 | 0 | 0.0% |
| $10,000 to $14,999 | 0 | 0.0% |
| $15,000 to $24,999 | 0 | 0.0% |
| $25,000 to $34,999 | 3 | 18.8% |
| $35,000 to $49,999 | 3 | 18.8% |
| $50,000 to $74,999 | 0 | 0.0% |
| $75,000 to $99,999 | 2 | 12.5% |
| $100,000 to $149,999 | 5 | 31.3% |
| $150,000 to $199,999 | 3 | 18.8% |
| $200,000+ | 0 | 0.0% |
Family Income by Famaliy Size in Flaming Gorge
2-person families (11 | 68.8%) account for the highest median family income in Flaming Gorge with $122,917 per family, while 2-person families (11 | 68.8%) have the highest median income of $61,458 per family member.
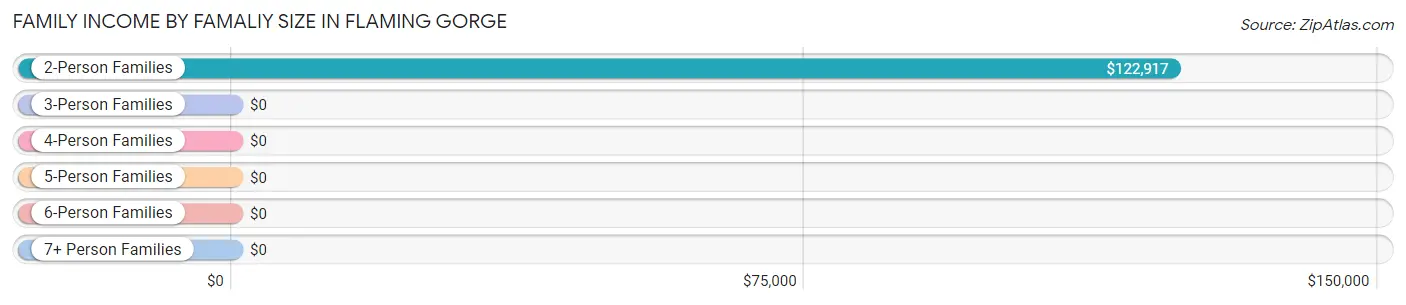
| Income Bracket | # Families | Median Income |
| 2-Person Families | 11 (68.8%) | $122,917 |
| 3-Person Families | 0 (0.0%) | $0 |
| 4-Person Families | 3 (18.8%) | $0 |
| 5-Person Families | 0 (0.0%) | $0 |
| 6-Person Families | 0 (0.0%) | $0 |
| 7+ Person Families | 2 (12.5%) | $0 |
| Total | 16 (100.0%) | $105,000 |
Family Income by Number of Earners in Flaming Gorge
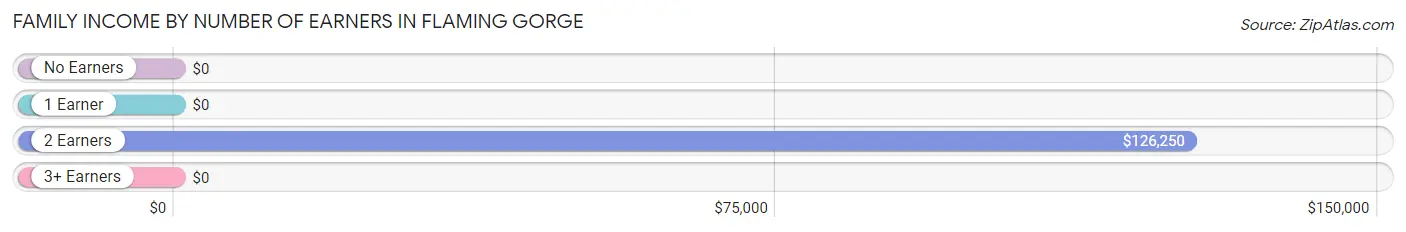
| Number of Earners | # Families | Median Income |
| No Earners | 5 (31.2%) | $0 |
| 1 Earner | 3 (18.8%) | $0 |
| 2 Earners | 8 (50.0%) | $126,250 |
| 3+ Earners | 0 (0.0%) | $0 |
| Total | 16 (100.0%) | $105,000 |
Household Income in Flaming Gorge
Household Income Brackets in Flaming Gorge
With 6 households falling in the category, the less than $10,000 income range is the most frequent in Flaming Gorge, accounting for 21.4% of all households.
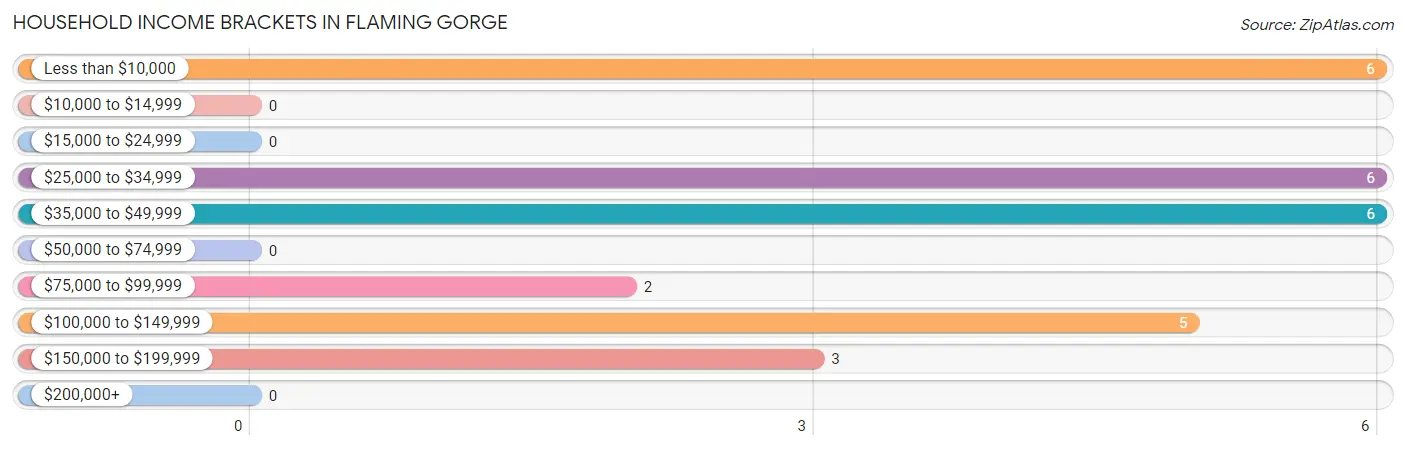
| Income Bracket | # Households | % Households |
| Less than $10,000 | 6 | 21.4% |
| $10,000 to $14,999 | 0 | 0.0% |
| $15,000 to $24,999 | 0 | 0.0% |
| $25,000 to $34,999 | 6 | 21.4% |
| $35,000 to $49,999 | 6 | 21.4% |
| $50,000 to $74,999 | 0 | 0.0% |
| $75,000 to $99,999 | 2 | 7.1% |
| $100,000 to $149,999 | 5 | 17.9% |
| $150,000 to $199,999 | 3 | 10.7% |
| $200,000+ | 0 | 0.0% |
Household Income by Householder Age in Flaming Gorge
The median household income in Flaming Gorge is $35,833, with the highest median household income of $123,750 found in the 65+ years age bracket for the primary householder. A total of 9 households (32.1%) fall into this category.
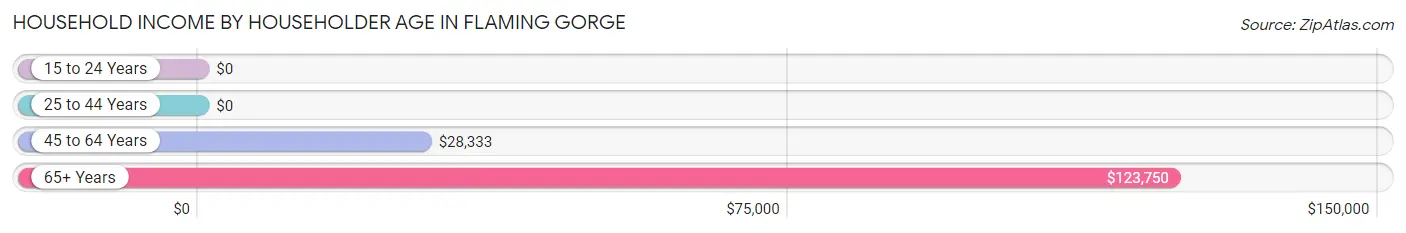
| Income Bracket | # Households | Median Income |
| 15 to 24 Years | 0 (0.0%) | $0 |
| 25 to 44 Years | 5 (17.9%) | $0 |
| 45 to 64 Years | 14 (50.0%) | $28,333 |
| 65+ Years | 9 (32.1%) | $123,750 |
| Total | 28 (100.0%) | $35,833 |
Poverty in Flaming Gorge
Income Below Poverty by Sex and Age in Flaming Gorge
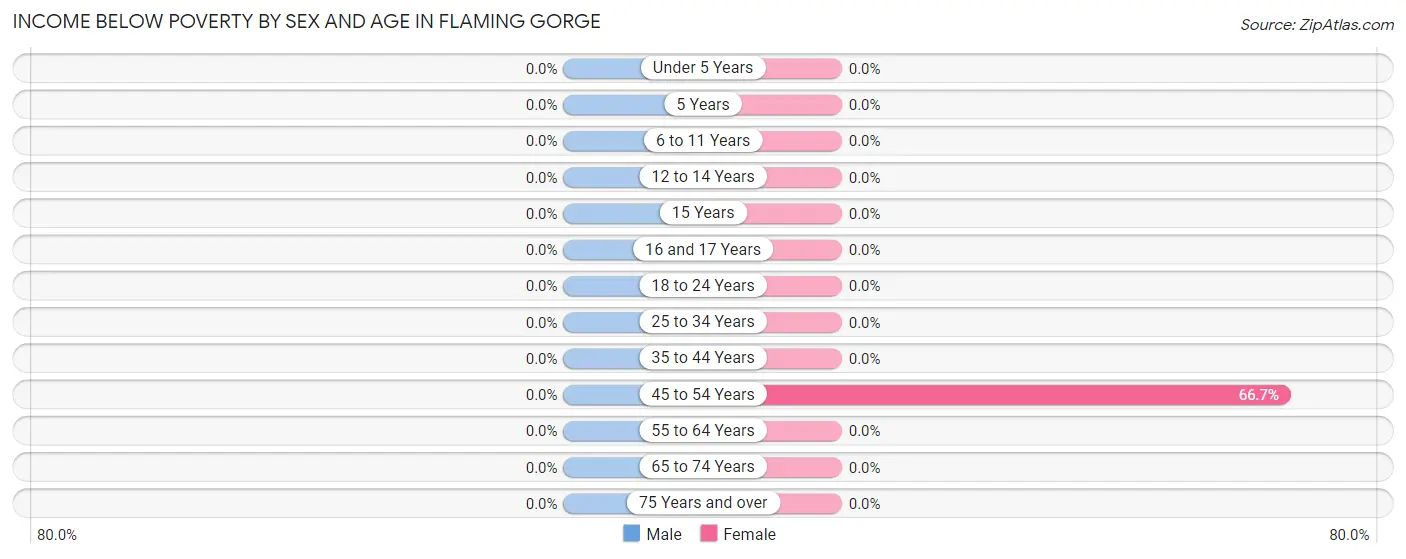
| Age Bracket | Male | Female |
| Under 5 Years | 0 (0.0%) | 0 (0.0%) |
| 5 Years | 0 (0.0%) | 0 (0.0%) |
| 6 to 11 Years | 0 (0.0%) | 0 (0.0%) |
| 12 to 14 Years | 0 (0.0%) | 0 (0.0%) |
| 15 Years | 0 (0.0%) | 0 (0.0%) |
| 16 and 17 Years | 0 (0.0%) | 0 (0.0%) |
| 18 to 24 Years | 0 (0.0%) | 0 (0.0%) |
| 25 to 34 Years | 0 (0.0%) | 0 (0.0%) |
| 35 to 44 Years | 0 (0.0%) | 0 (0.0%) |
| 45 to 54 Years | 0 (0.0%) | 6 (66.7%) |
| 55 to 64 Years | 0 (0.0%) | 0 (0.0%) |
| 65 to 74 Years | 0 (0.0%) | 0 (0.0%) |
| 75 Years and over | 0 (0.0%) | 0 (0.0%) |
| Total | 0 (0.0%) | 6 (15.8%) |
Income Above Poverty by Sex and Age in Flaming Gorge
According to the poverty statistics in Flaming Gorge, males aged 6 to 11 years and females aged 5 years are the age groups that are most secure financially, with 100.0% of males and 100.0% of females in these age groups living above the poverty line.
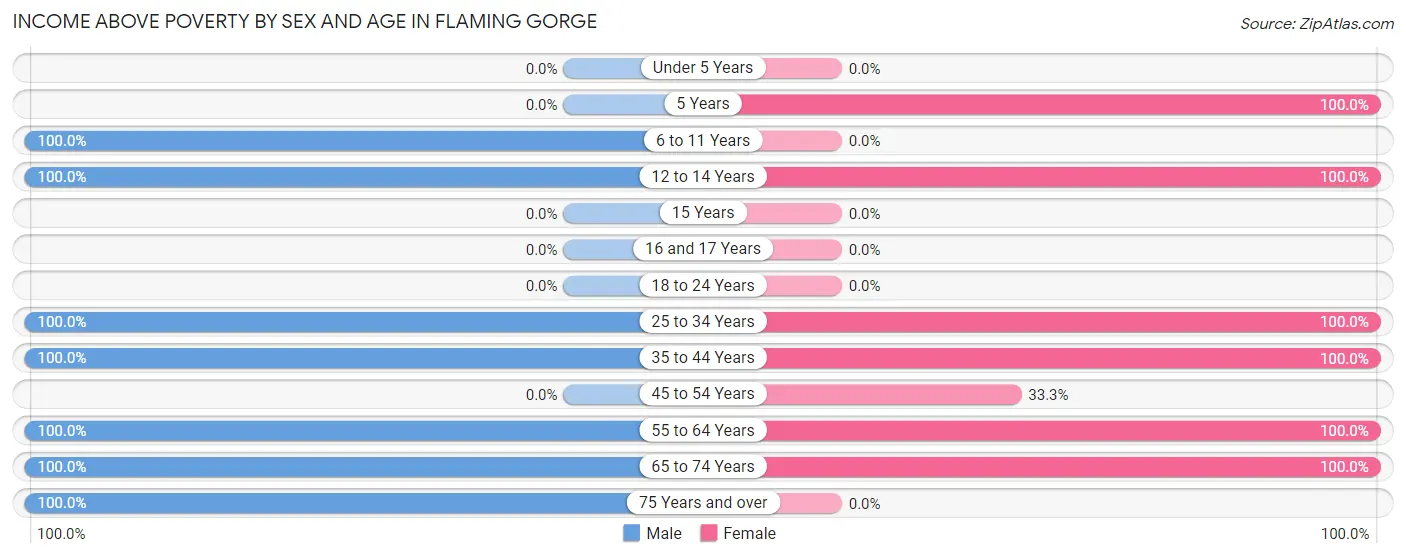
| Age Bracket | Male | Female |
| Under 5 Years | 0 (0.0%) | 0 (0.0%) |
| 5 Years | 0 (0.0%) | 2 (100.0%) |
| 6 to 11 Years | 4 (100.0%) | 0 (0.0%) |
| 12 to 14 Years | 8 (100.0%) | 8 (100.0%) |
| 15 Years | 0 (0.0%) | 0 (0.0%) |
| 16 and 17 Years | 0 (0.0%) | 0 (0.0%) |
| 18 to 24 Years | 0 (0.0%) | 0 (0.0%) |
| 25 to 34 Years | 3 (100.0%) | 4 (100.0%) |
| 35 to 44 Years | 2 (100.0%) | 2 (100.0%) |
| 45 to 54 Years | 0 (0.0%) | 3 (33.3%) |
| 55 to 64 Years | 2 (100.0%) | 7 (100.0%) |
| 65 to 74 Years | 9 (100.0%) | 6 (100.0%) |
| 75 Years and over | 3 (100.0%) | 0 (0.0%) |
| Total | 31 (100.0%) | 32 (84.2%) |
Income Below Poverty Among Married-Couple Families in Flaming Gorge
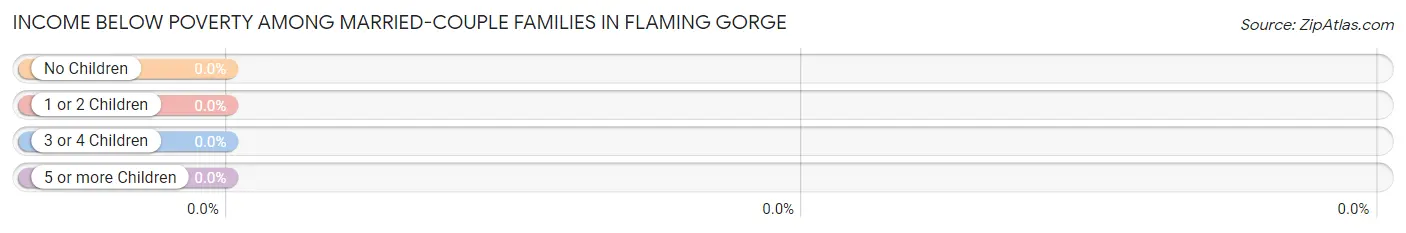
| Children | Above Poverty | Below Poverty |
| No Children | 11 (100.0%) | 0 (0.0%) |
| 1 or 2 Children | 3 (100.0%) | 0 (0.0%) |
| 3 or 4 Children | 0 (0.0%) | 0 (0.0%) |
| 5 or more Children | 2 (100.0%) | 0 (0.0%) |
| Total | 16 (100.0%) | 0 (0.0%) |
Income Below Poverty Among Single-Parent Households in Flaming Gorge
| Children | Single Father | Single Mother |
| No Children | 0 (0.0%) | 0 (0.0%) |
| 1 or 2 Children | 0 (0.0%) | 0 (0.0%) |
| 3 or 4 Children | 0 (0.0%) | 0 (0.0%) |
| 5 or more Children | 0 (0.0%) | 0 (0.0%) |
| Total | 0 (0.0%) | 0 (0.0%) |
Income Below Poverty Among Married-Couple vs Single-Parent Households in Flaming Gorge
| Children | Married-Couple Families | Single-Parent Households |
| No Children | 0 (0.0%) | 0 (0.0%) |
| 1 or 2 Children | 0 (0.0%) | 0 (0.0%) |
| 3 or 4 Children | 0 (0.0%) | 0 (0.0%) |
| 5 or more Children | 0 (0.0%) | 0 (0.0%) |
| Total | 0 (0.0%) | 0 (0.0%) |
Race in Flaming Gorge
The most populous races in Flaming Gorge are , and White / Caucasian (69 | 100.0%).
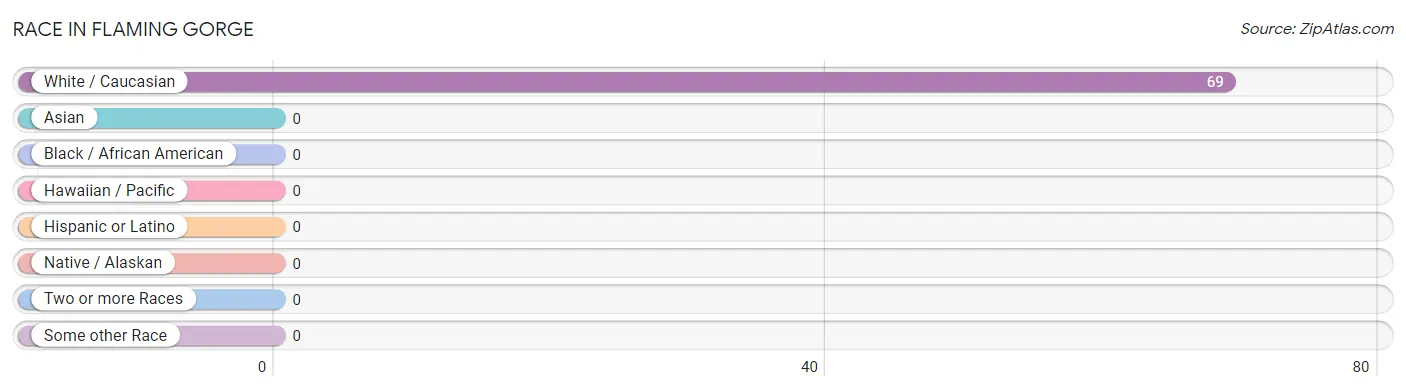
| Race | # Population | % Population |
| Asian | 0 | 0.0% |
| Black / African American | 0 | 0.0% |
| Hawaiian / Pacific | 0 | 0.0% |
| Hispanic or Latino | 0 | 0.0% |
| Native / Alaskan | 0 | 0.0% |
| White / Caucasian | 69 | 100.0% |
| Two or more Races | 0 | 0.0% |
| Some other Race | 0 | 0.0% |
| Total | 69 | 100.0% |
Ancestry in Flaming Gorge
The most populous ancestries reported in Flaming Gorge are American (6 | 8.7%), English (6 | 8.7%), Norwegian (4 | 5.8%), French (3 | 4.3%), and Italian (3 | 4.3%), together accounting for 31.9% of all Flaming Gorge residents.
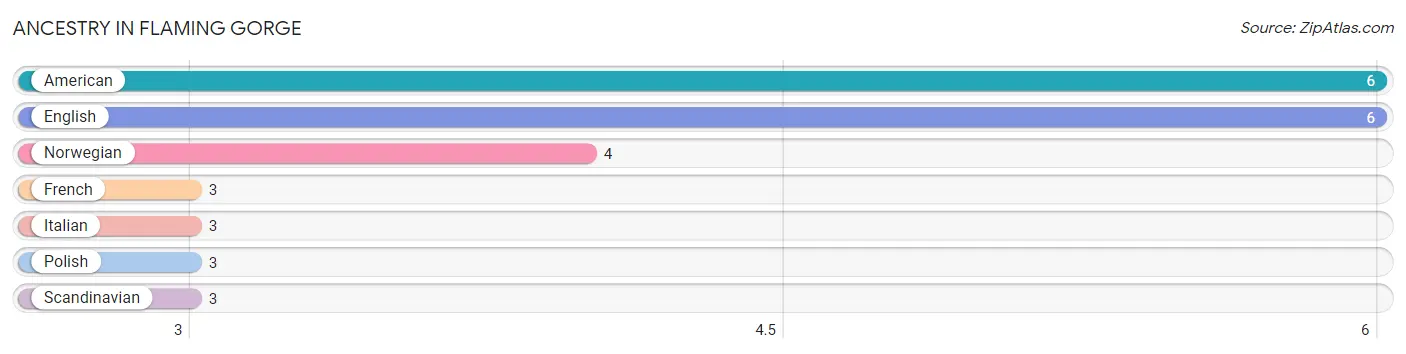
| Ancestry | # Population | % Population |
| American | 6 | 8.7% |
| English | 6 | 8.7% |
| French | 3 | 4.3% |
| Italian | 3 | 4.3% |
| Norwegian | 4 | 5.8% |
| Polish | 3 | 4.3% |
| Scandinavian | 3 | 4.3% | View All 7 Rows |
Immigrants in Flaming Gorge

| Immigration Origin | # Population | % Population | View All 0 Rows |
Sex and Age in Flaming Gorge
Sex and Age in Flaming Gorge
The most populous age groups in Flaming Gorge are 10 to 14 Years (8 | 25.8%) for men and 10 to 14 Years (8 | 21.0%) for women.
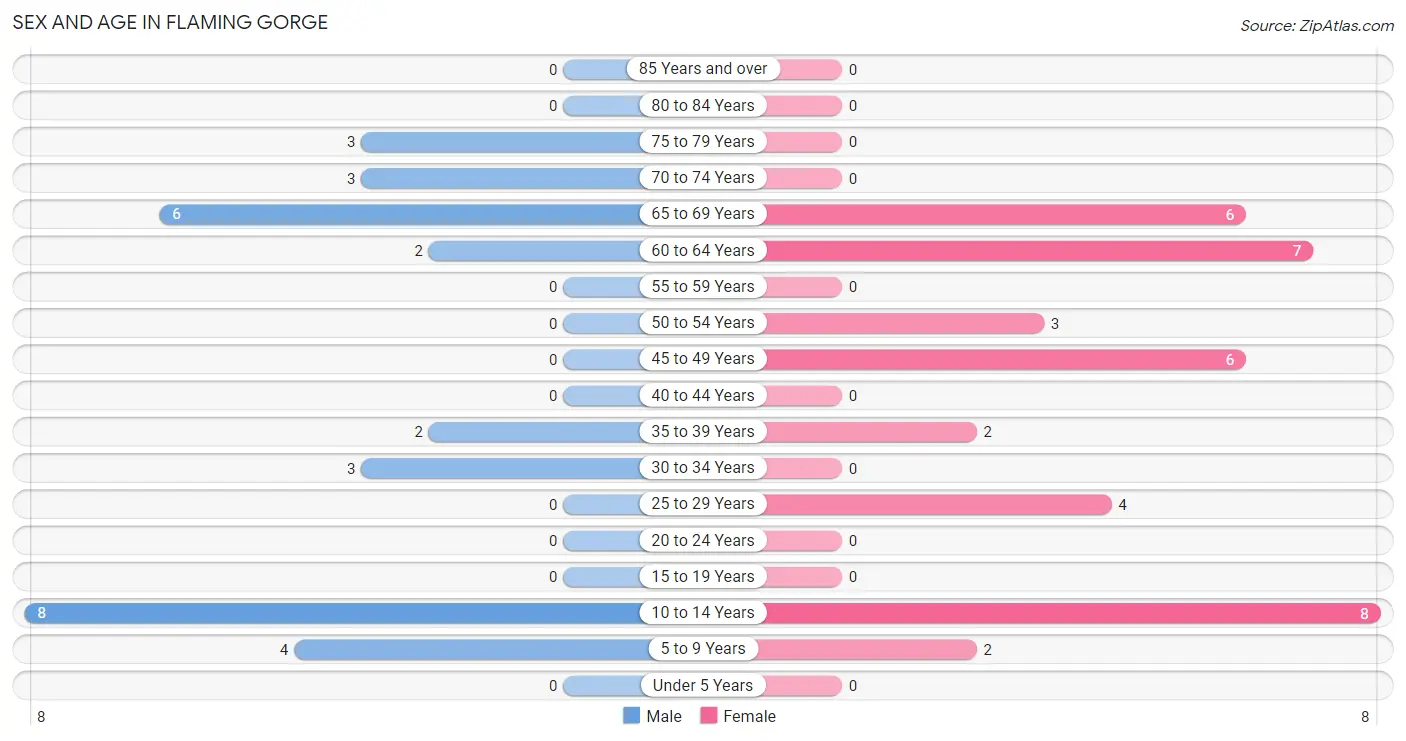
| Age Bracket | Male | Female |
| Under 5 Years | 0 (0.0%) | 0 (0.0%) |
| 5 to 9 Years | 4 (12.9%) | 2 (5.3%) |
| 10 to 14 Years | 8 (25.8%) | 8 (21.0%) |
| 15 to 19 Years | 0 (0.0%) | 0 (0.0%) |
| 20 to 24 Years | 0 (0.0%) | 0 (0.0%) |
| 25 to 29 Years | 0 (0.0%) | 4 (10.5%) |
| 30 to 34 Years | 3 (9.7%) | 0 (0.0%) |
| 35 to 39 Years | 2 (6.5%) | 2 (5.3%) |
| 40 to 44 Years | 0 (0.0%) | 0 (0.0%) |
| 45 to 49 Years | 0 (0.0%) | 6 (15.8%) |
| 50 to 54 Years | 0 (0.0%) | 3 (7.9%) |
| 55 to 59 Years | 0 (0.0%) | 0 (0.0%) |
| 60 to 64 Years | 2 (6.5%) | 7 (18.4%) |
| 65 to 69 Years | 6 (19.4%) | 6 (15.8%) |
| 70 to 74 Years | 3 (9.7%) | 0 (0.0%) |
| 75 to 79 Years | 3 (9.7%) | 0 (0.0%) |
| 80 to 84 Years | 0 (0.0%) | 0 (0.0%) |
| 85 Years and over | 0 (0.0%) | 0 (0.0%) |
| Total | 31 (100.0%) | 38 (100.0%) |
Families and Households in Flaming Gorge
Median Family Size in Flaming Gorge
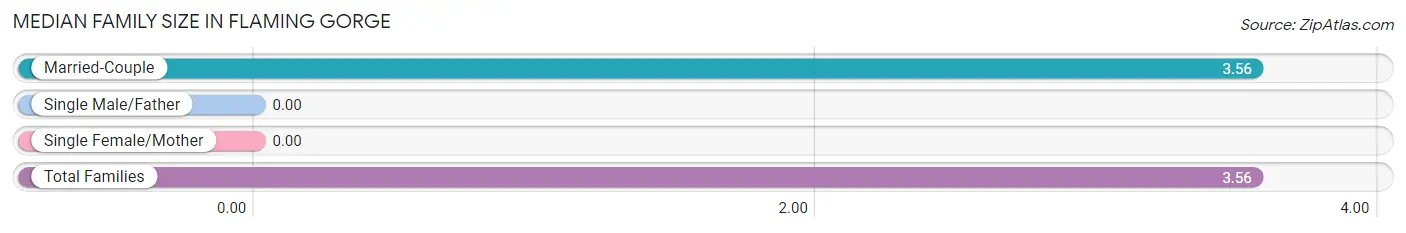
| Family Type | # Families | Family Size |
| Married-Couple | 16 (100.0%) | 3.56 |
| Single Male/Father | 0 (0.0%) | - |
| Single Female/Mother | 0 (0.0%) | - |
| Total Families | 16 (100.0%) | 3.56 |
Median Household Size in Flaming Gorge
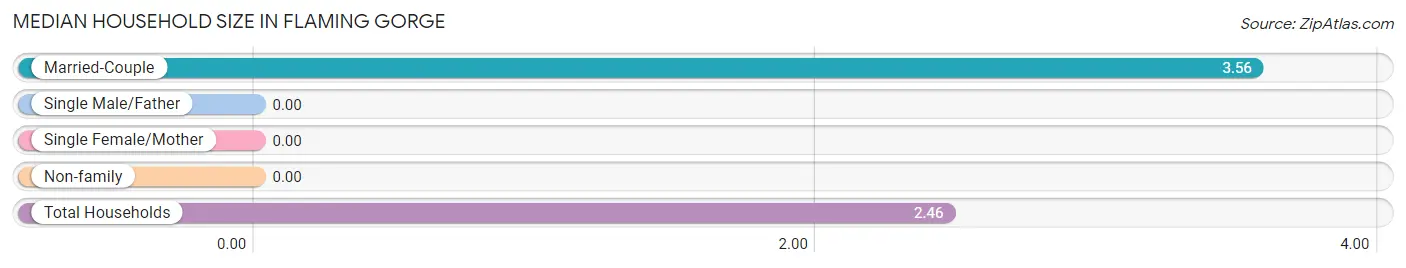
| Household Type | # Households | Household Size |
| Married-Couple | 16 (57.1%) | 3.56 |
| Single Male/Father | 0 (0.0%) | - |
| Single Female/Mother | 0 (0.0%) | - |
| Non-family | 12 (42.9%) | - |
| Total Households | 28 (100.0%) | 2.46 |
Household Size by Marriage Status in Flaming Gorge
Out of a total of 28 households in Flaming Gorge, 16 (57.1%) are family households, while 12 (42.9%) are nonfamily households. The most numerous type of family households are 2-person households, comprising 11, and the most common type of nonfamily households are 1-person households, comprising 12.
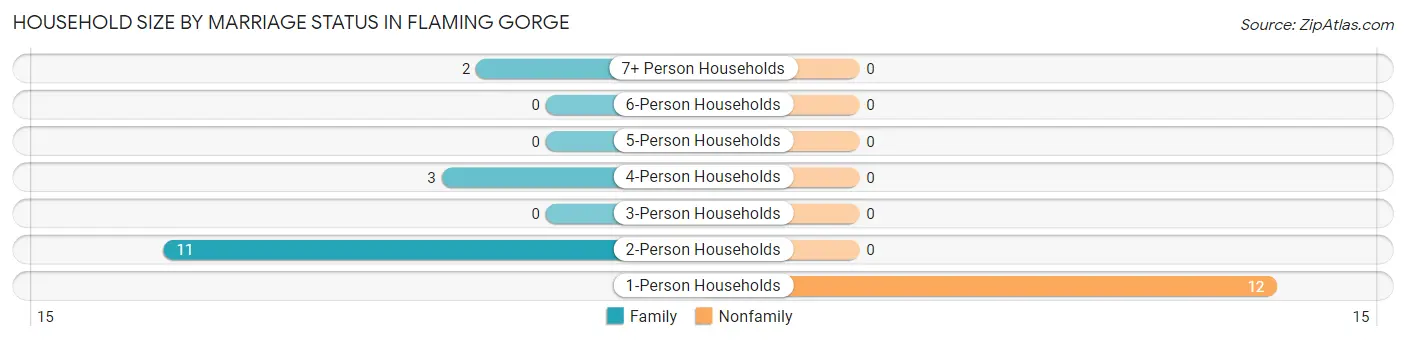
| Household Size | Family Households | Nonfamily Households |
| 1-Person Households | - | 12 (42.9%) |
| 2-Person Households | 11 (39.3%) | 0 (0.0%) |
| 3-Person Households | 0 (0.0%) | 0 (0.0%) |
| 4-Person Households | 3 (10.7%) | 0 (0.0%) |
| 5-Person Households | 0 (0.0%) | 0 (0.0%) |
| 6-Person Households | 0 (0.0%) | 0 (0.0%) |
| 7+ Person Households | 2 (7.1%) | 0 (0.0%) |
| Total | 16 (57.1%) | 12 (42.9%) |
Female Fertility in Flaming Gorge
Fertility by Age in Flaming Gorge
| Age Bracket | Women with Births | Births / 1,000 Women |
| 15 to 19 years | 0 (0.0%) | 0.0 |
| 20 to 34 years | 0 (0.0%) | 0.0 |
| 35 to 50 years | 0 (0.0%) | 0.0 |
| Total | 0 (0.0%) | 0.0 |
Fertility by Age by Marriage Status in Flaming Gorge
| Age Bracket | Married | Unmarried |
| 15 to 19 years | 0 (0.0%) | 0 (0.0%) |
| 20 to 34 years | 0 (0.0%) | 0 (0.0%) |
| 35 to 50 years | 0 (0.0%) | 0 (0.0%) |
| Total | 0 (0.0%) | 0 (0.0%) |
Fertility by Education in Flaming Gorge
| Educational Attainment | Women with Births | Births / 1,000 Women |
| Less than High School | 0 (0.0%) | 0.0 |
| High School Diploma | 0 (0.0%) | 0.0 |
| College or Associate's Degree | 0 (0.0%) | 0.0 |
| Bachelor's Degree | 0 (0.0%) | 0.0 |
| Graduate Degree | 0 (0.0%) | 0.0 |
| Total | 0 (0.0%) | 0.0 |
Fertility by Education by Marriage Status in Flaming Gorge
| Educational Attainment | Married | Unmarried |
| Less than High School | 0 (0.0%) | 0 (0.0%) |
| High School Diploma | 0 (0.0%) | 0 (0.0%) |
| College or Associate's Degree | 0 (0.0%) | 0 (0.0%) |
| Bachelor's Degree | 0 (0.0%) | 0 (0.0%) |
| Graduate Degree | 0 (0.0%) | 0 (0.0%) |
| Total | 0 (0.0%) | 0 (0.0%) |
Employment Characteristics in Flaming Gorge
Employment by Class of Employer in Flaming Gorge
Among the 33 employed individuals in Flaming Gorge, private company employees (26 | 78.8%), self-employed (incorporated) (4 | 12.1%), and not-for-profit organizations (3 | 9.1%) make up the most common classes of employment.
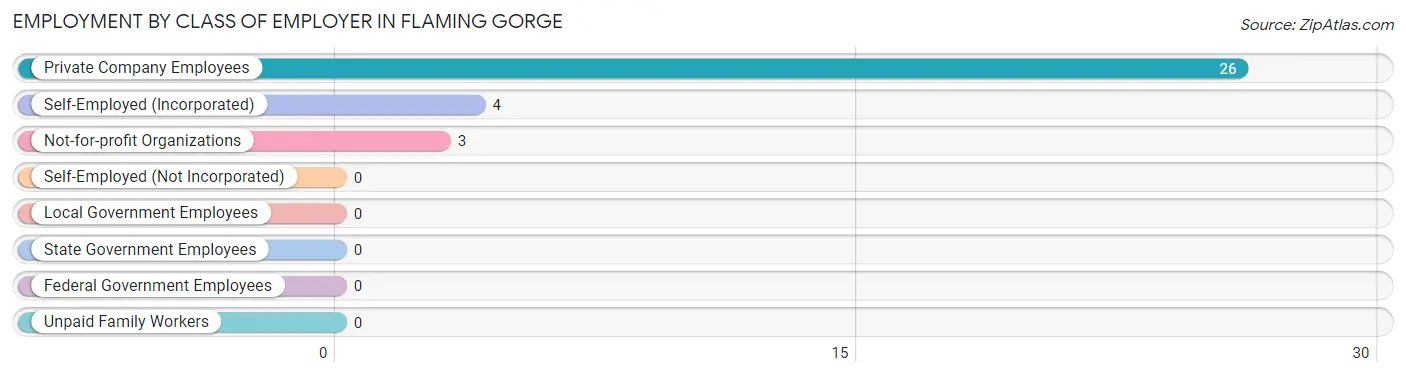
| Employer Class | # Employees | % Employees |
| Private Company Employees | 26 | 78.8% |
| Self-Employed (Incorporated) | 4 | 12.1% |
| Self-Employed (Not Incorporated) | 0 | 0.0% |
| Not-for-profit Organizations | 3 | 9.1% |
| Local Government Employees | 0 | 0.0% |
| State Government Employees | 0 | 0.0% |
| Federal Government Employees | 0 | 0.0% |
| Unpaid Family Workers | 0 | 0.0% |
| Total | 33 | 100.0% |
Employment Status by Age in Flaming Gorge
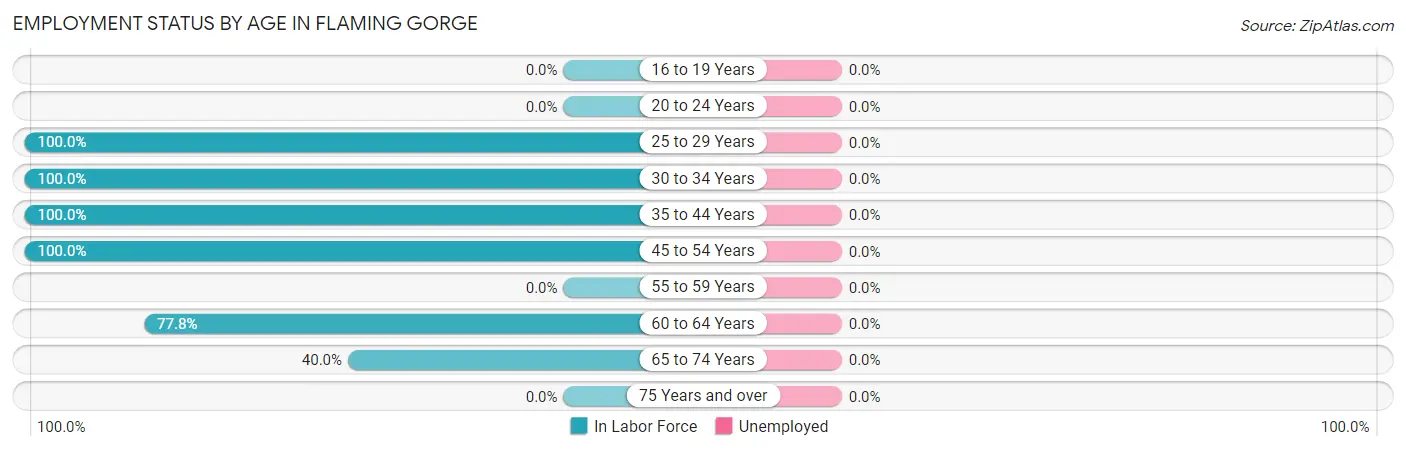
| Age Bracket | In Labor Force | Unemployed |
| 16 to 19 Years | 0 (0.0%) | 0 (0.0%) |
| 20 to 24 Years | 0 (0.0%) | 0 (0.0%) |
| 25 to 29 Years | 4 (100.0%) | 0 (0.0%) |
| 30 to 34 Years | 3 (100.0%) | 0 (0.0%) |
| 35 to 44 Years | 4 (100.0%) | 0 (0.0%) |
| 45 to 54 Years | 9 (100.0%) | 0 (0.0%) |
| 55 to 59 Years | 0 (0.0%) | 0 (0.0%) |
| 60 to 64 Years | 7 (77.8%) | 0 (0.0%) |
| 65 to 74 Years | 6 (40.0%) | 0 (0.0%) |
| 75 Years and over | 0 (0.0%) | 0 (0.0%) |
| Total | 33 (70.2%) | 0 (0.0%) |
Employment Status by Educational Attainment in Flaming Gorge
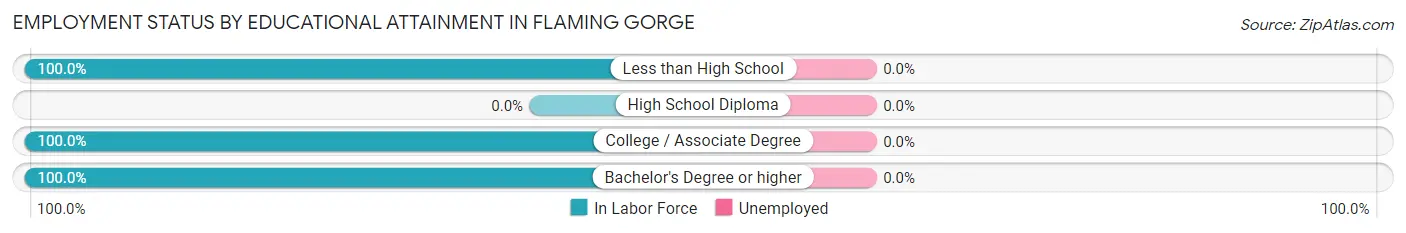
| Educational Attainment | In Labor Force | Unemployed |
| Less than High School | 3 (100.0%) | 0 (0.0%) |
| High School Diploma | 0 (0.0%) | 0 (0.0%) |
| College / Associate Degree | 18 (100.0%) | 0 (0.0%) |
| Bachelor's Degree or higher | 6 (100.0%) | 0 (0.0%) |
| Total | 27 (93.1%) | 0 (0.0%) |
Employment Occupations by Sex in Flaming Gorge
Management, Business, Science and Arts Occupations
The most common Management, Business, Science and Arts occupations in Flaming Gorge are , and Management (10 | 30.3%).
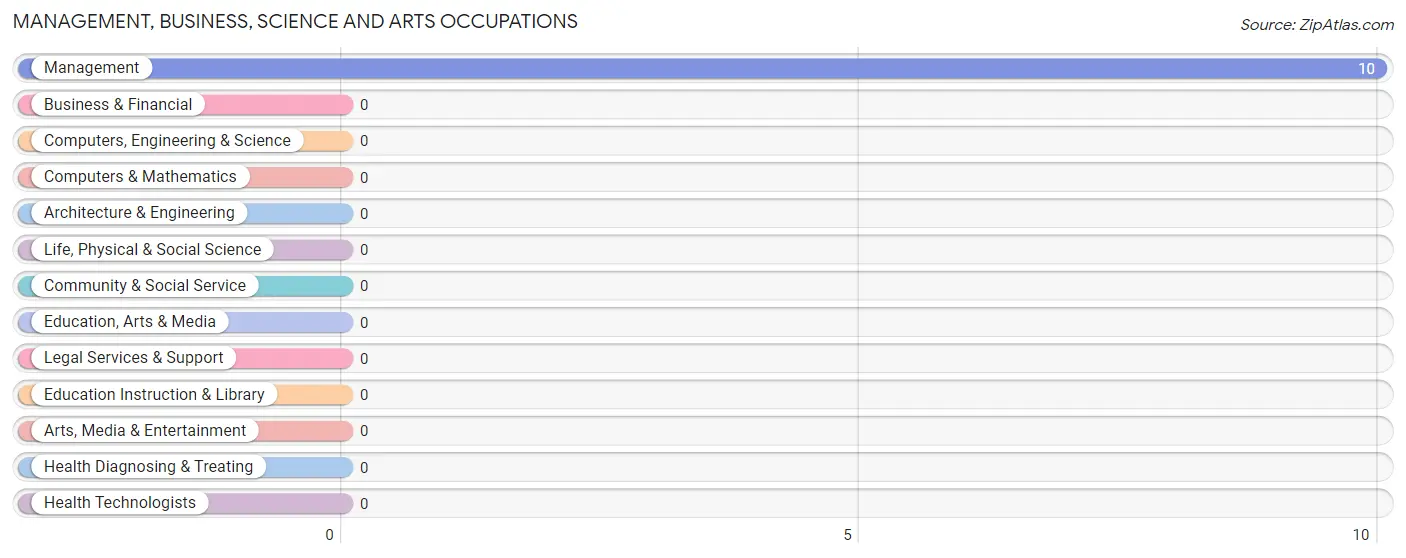
Management, Business, Science and Arts Occupations by Sex
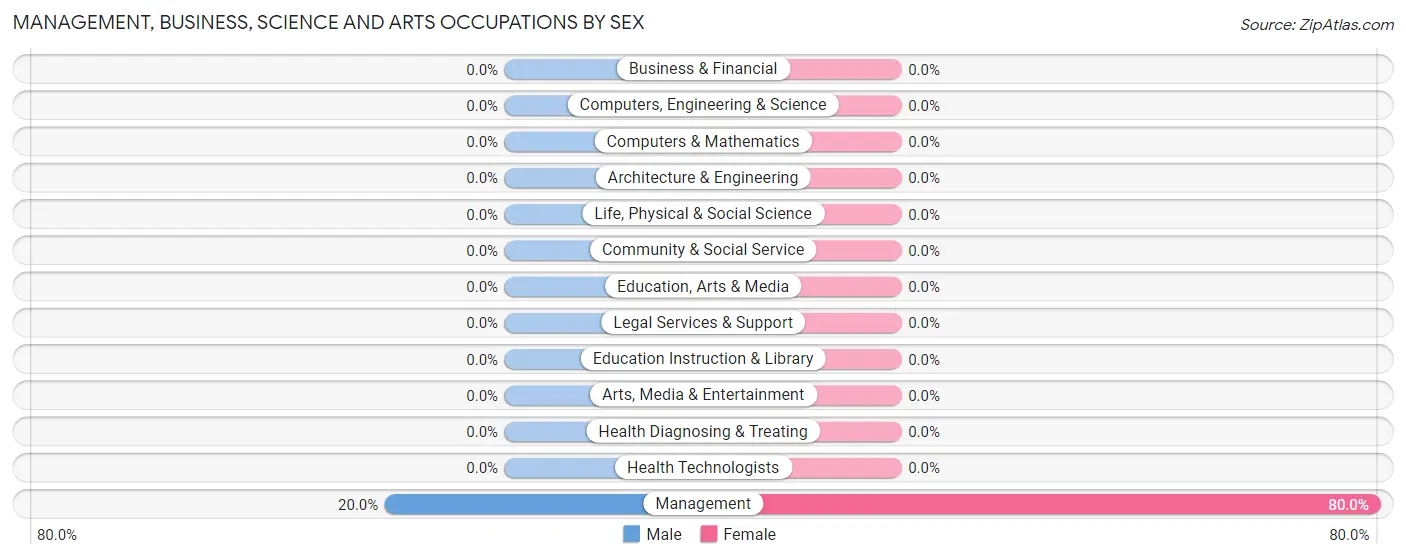
| Occupation | Male | Female |
| Management | 2 (20.0%) | 8 (80.0%) |
| Business & Financial | 0 (0.0%) | 0 (0.0%) |
| Computers, Engineering & Science | 0 (0.0%) | 0 (0.0%) |
| Computers & Mathematics | 0 (0.0%) | 0 (0.0%) |
| Architecture & Engineering | 0 (0.0%) | 0 (0.0%) |
| Life, Physical & Social Science | 0 (0.0%) | 0 (0.0%) |
| Community & Social Service | 0 (0.0%) | 0 (0.0%) |
| Education, Arts & Media | 0 (0.0%) | 0 (0.0%) |
| Legal Services & Support | 0 (0.0%) | 0 (0.0%) |
| Education Instruction & Library | 0 (0.0%) | 0 (0.0%) |
| Arts, Media & Entertainment | 0 (0.0%) | 0 (0.0%) |
| Health Diagnosing & Treating | 0 (0.0%) | 0 (0.0%) |
| Health Technologists | 0 (0.0%) | 0 (0.0%) |
| Total (Category) | 2 (20.0%) | 8 (80.0%) |
| Total (Overall) | 11 (33.3%) | 22 (66.7%) |
Services Occupations
The most common Services occupations in Flaming Gorge are Food Preparation & Serving (3 | 9.1%), and Cleaning & Maintenance (3 | 9.1%).
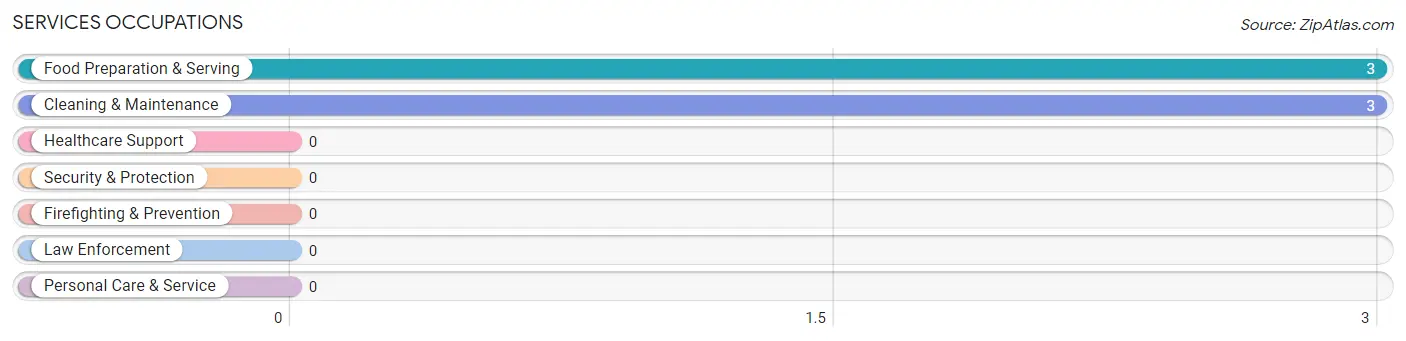
Services Occupations by Sex
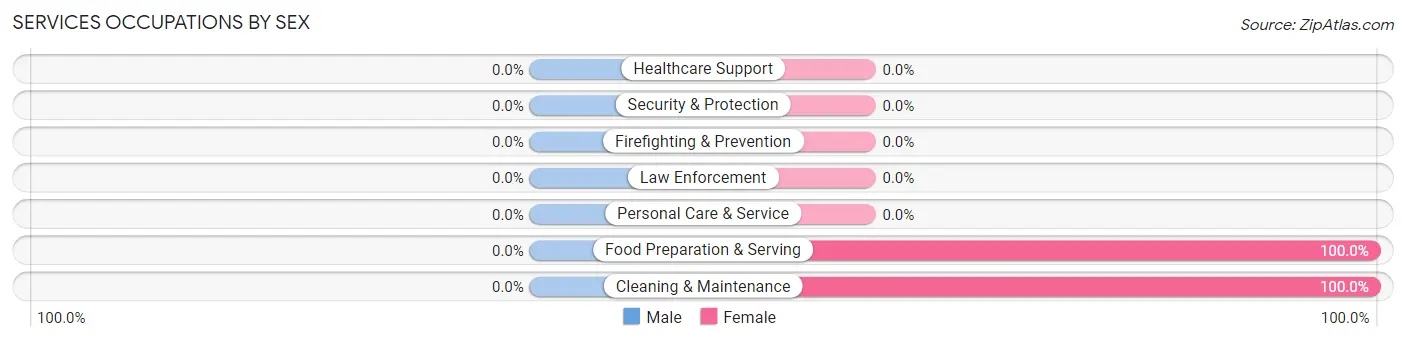
| Occupation | Male | Female |
| Healthcare Support | 0 (0.0%) | 0 (0.0%) |
| Security & Protection | 0 (0.0%) | 0 (0.0%) |
| Firefighting & Prevention | 0 (0.0%) | 0 (0.0%) |
| Law Enforcement | 0 (0.0%) | 0 (0.0%) |
| Food Preparation & Serving | 0 (0.0%) | 3 (100.0%) |
| Cleaning & Maintenance | 0 (0.0%) | 3 (100.0%) |
| Personal Care & Service | 0 (0.0%) | 0 (0.0%) |
| Total (Category) | 0 (0.0%) | 6 (100.0%) |
| Total (Overall) | 11 (33.3%) | 22 (66.7%) |
Sales and Office Occupations
The most common Sales and Office occupations in Flaming Gorge are , and Office & Administration (8 | 24.2%).
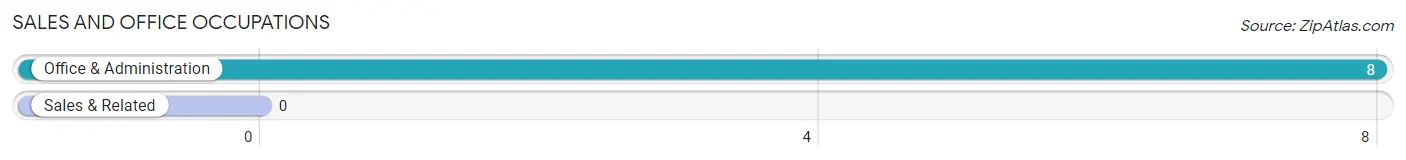
Sales and Office Occupations by Sex
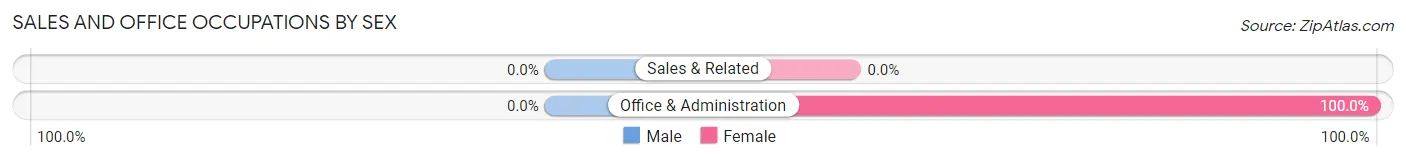
| Occupation | Male | Female |
| Sales & Related | 0 (0.0%) | 0 (0.0%) |
| Office & Administration | 0 (0.0%) | 8 (100.0%) |
| Total (Category) | 0 (0.0%) | 8 (100.0%) |
| Total (Overall) | 11 (33.3%) | 22 (66.7%) |
Natural Resources, Construction and Maintenance Occupations
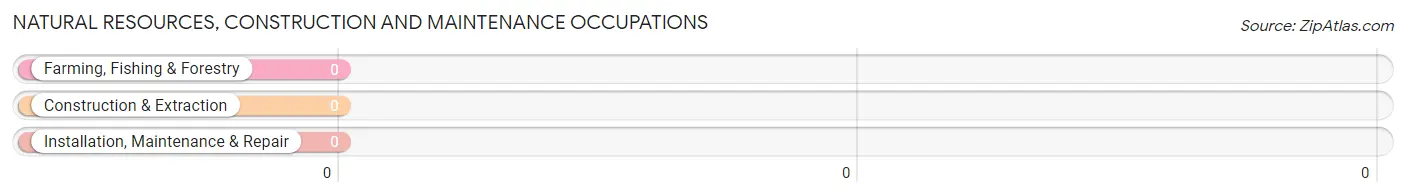
Natural Resources, Construction and Maintenance Occupations by Sex
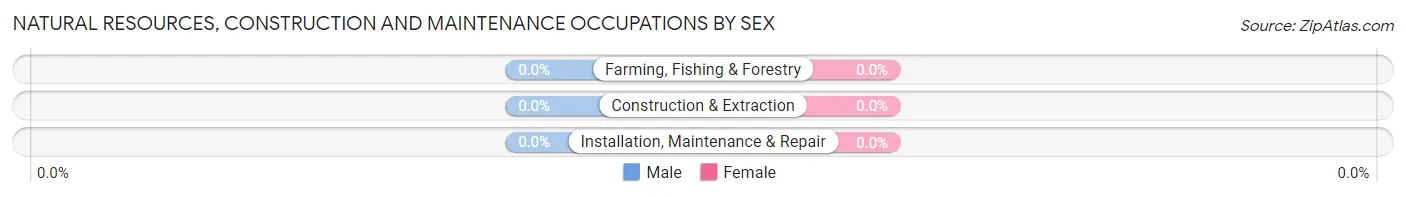
| Occupation | Male | Female |
| Farming, Fishing & Forestry | 0 (0.0%) | 0 (0.0%) |
| Construction & Extraction | 0 (0.0%) | 0 (0.0%) |
| Installation, Maintenance & Repair | 0 (0.0%) | 0 (0.0%) |
| Total (Category) | 0 (0.0%) | 0 (0.0%) |
| Total (Overall) | 11 (33.3%) | 22 (66.7%) |
Production, Transportation and Moving Occupations
The most common Production, Transportation and Moving occupations in Flaming Gorge are Transportation (6 | 18.2%), and Production (3 | 9.1%).
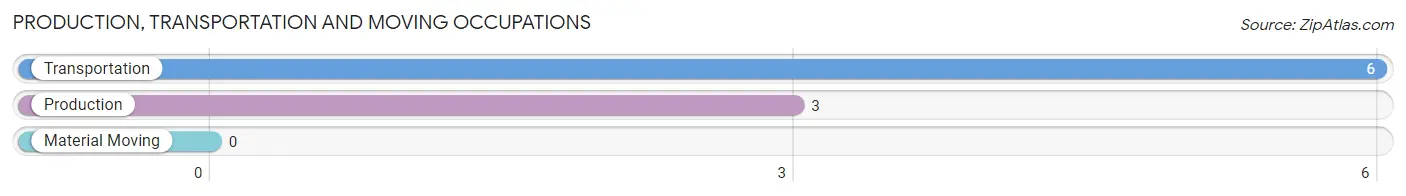
Production, Transportation and Moving Occupations by Sex
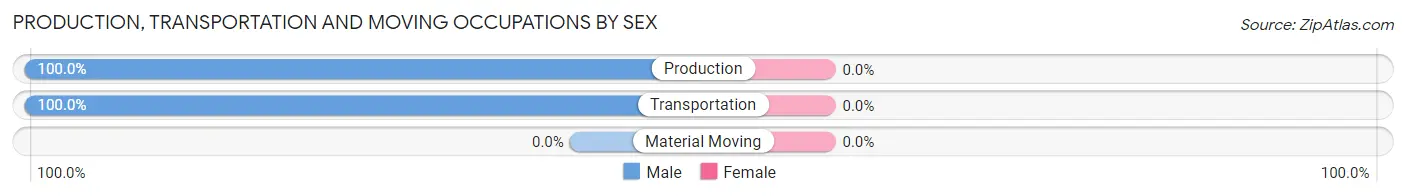
| Occupation | Male | Female |
| Production | 3 (100.0%) | 0 (0.0%) |
| Transportation | 6 (100.0%) | 0 (0.0%) |
| Material Moving | 0 (0.0%) | 0 (0.0%) |
| Total (Category) | 9 (100.0%) | 0 (0.0%) |
| Total (Overall) | 11 (33.3%) | 22 (66.7%) |
Employment Industries by Sex in Flaming Gorge
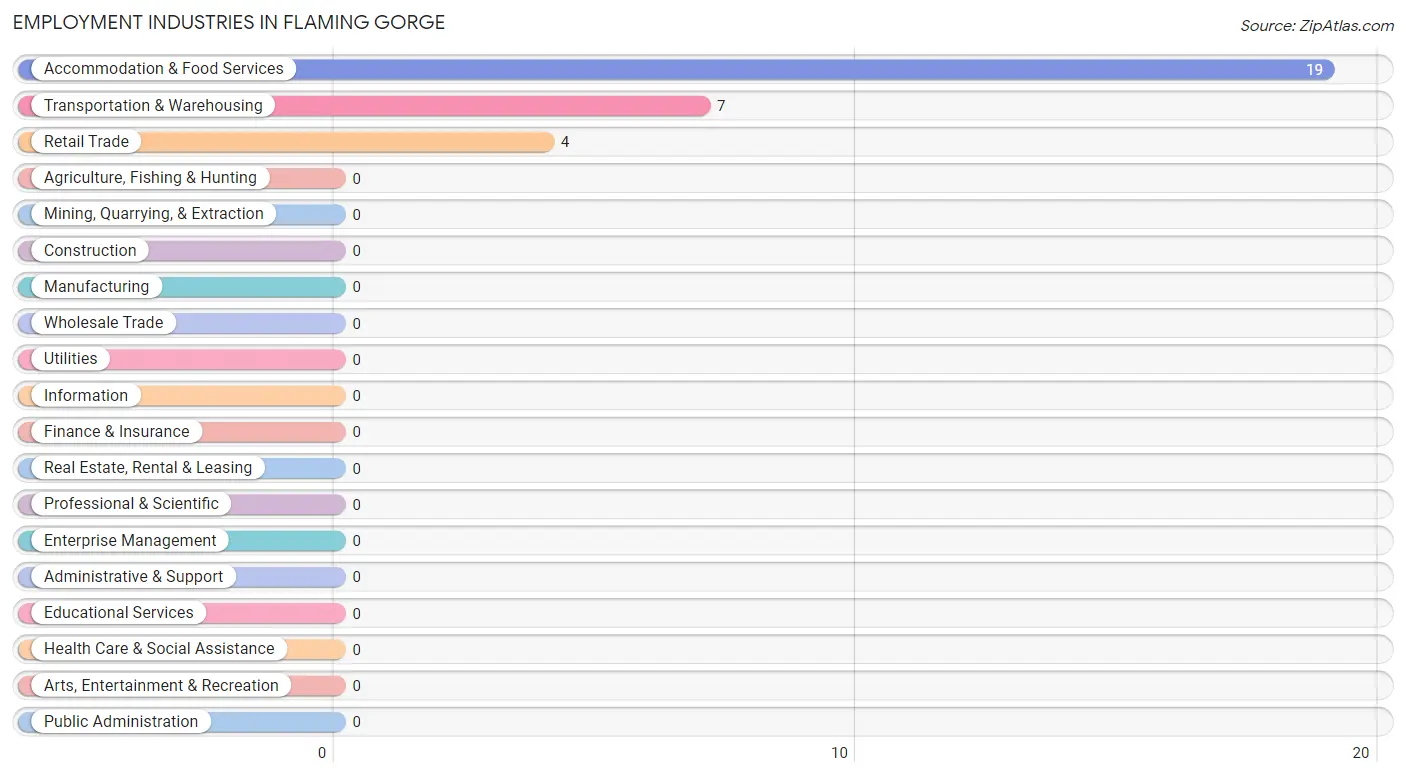
Employment Industries in Flaming Gorge
The major employment industries in Flaming Gorge include Accommodation & Food Services (19 | 57.6%), Transportation & Warehousing (7 | 21.2%), and Retail Trade (4 | 12.1%).
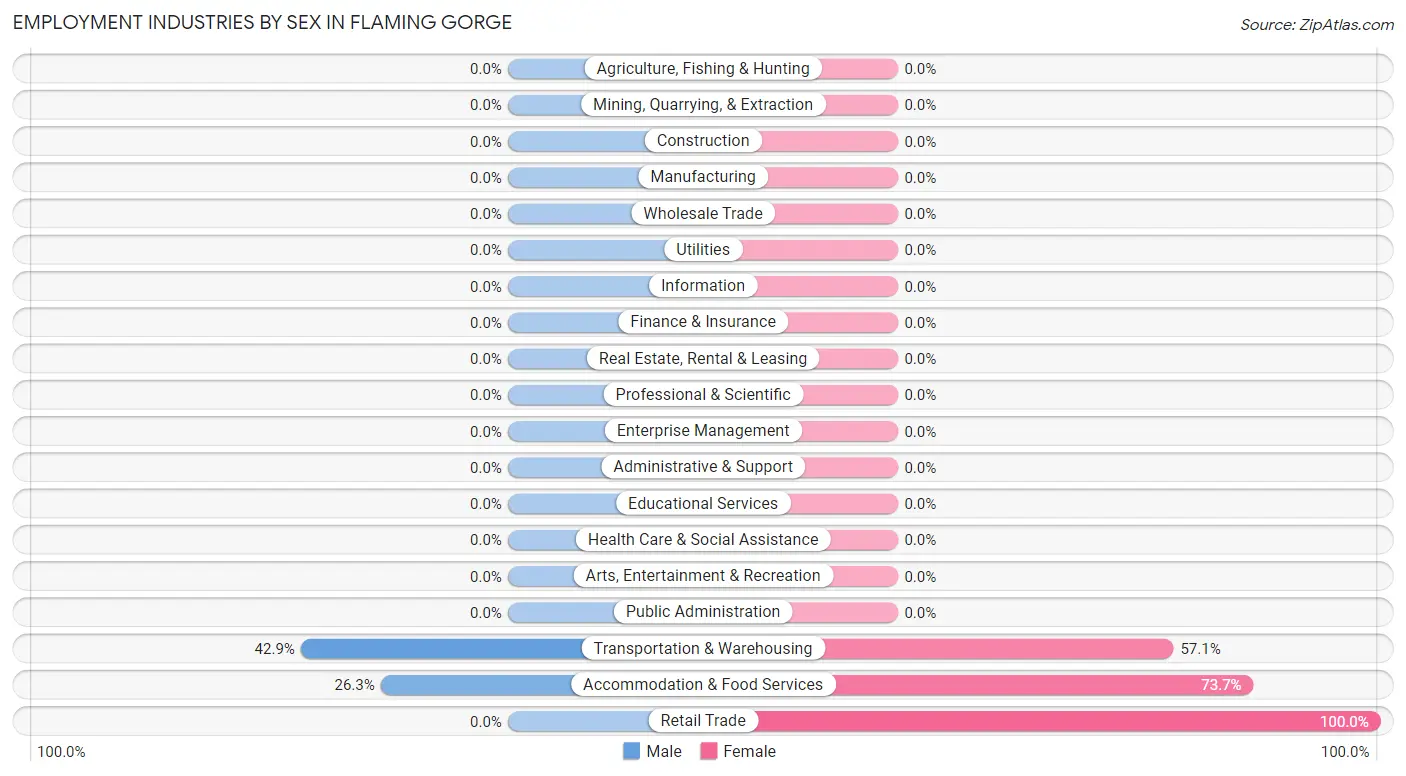
Employment Industries by Sex in Flaming Gorge
The Flaming Gorge industries that see more men than women are Transportation & Warehousing (42.9%), and Accommodation & Food Services (26.3%), whereas the industries that tend to have a higher number of women are Retail Trade (100.0%), Accommodation & Food Services (73.7%), and Transportation & Warehousing (57.1%).
| Industry | Male | Female |
| Agriculture, Fishing & Hunting | 0 (0.0%) | 0 (0.0%) |
| Mining, Quarrying, & Extraction | 0 (0.0%) | 0 (0.0%) |
| Construction | 0 (0.0%) | 0 (0.0%) |
| Manufacturing | 0 (0.0%) | 0 (0.0%) |
| Wholesale Trade | 0 (0.0%) | 0 (0.0%) |
| Retail Trade | 0 (0.0%) | 4 (100.0%) |
| Transportation & Warehousing | 3 (42.9%) | 4 (57.1%) |
| Utilities | 0 (0.0%) | 0 (0.0%) |
| Information | 0 (0.0%) | 0 (0.0%) |
| Finance & Insurance | 0 (0.0%) | 0 (0.0%) |
| Real Estate, Rental & Leasing | 0 (0.0%) | 0 (0.0%) |
| Professional & Scientific | 0 (0.0%) | 0 (0.0%) |
| Enterprise Management | 0 (0.0%) | 0 (0.0%) |
| Administrative & Support | 0 (0.0%) | 0 (0.0%) |
| Educational Services | 0 (0.0%) | 0 (0.0%) |
| Health Care & Social Assistance | 0 (0.0%) | 0 (0.0%) |
| Arts, Entertainment & Recreation | 0 (0.0%) | 0 (0.0%) |
| Accommodation & Food Services | 5 (26.3%) | 14 (73.7%) |
| Public Administration | 0 (0.0%) | 0 (0.0%) |
| Total | 11 (33.3%) | 22 (66.7%) |
Education in Flaming Gorge
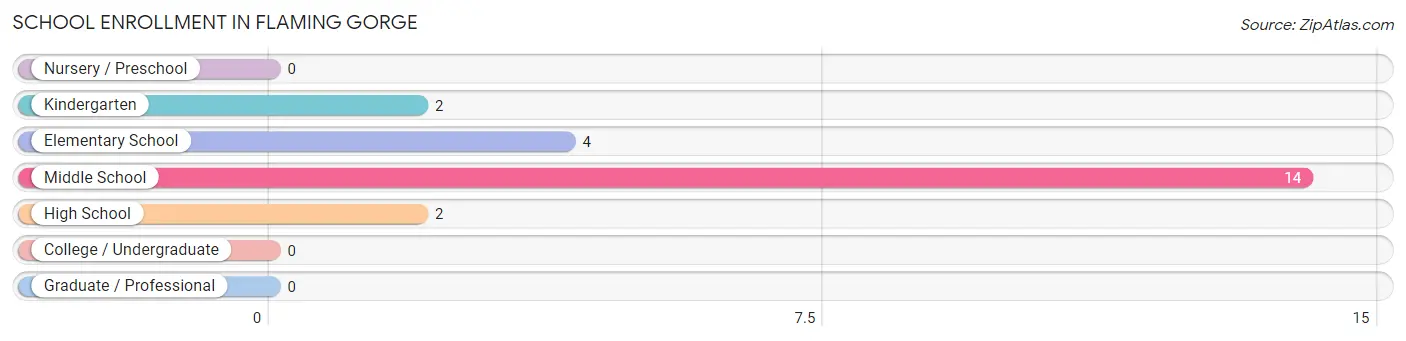
School Enrollment in Flaming Gorge
The most common levels of schooling among the 22 students in Flaming Gorge are middle school (14 | 63.6%), elementary school (4 | 18.2%), and kindergarten (2 | 9.1%).
| School Level | # Students | % Students |
| Nursery / Preschool | 0 | 0.0% |
| Kindergarten | 2 | 9.1% |
| Elementary School | 4 | 18.2% |
| Middle School | 14 | 63.6% |
| High School | 2 | 9.1% |
| College / Undergraduate | 0 | 0.0% |
| Graduate / Professional | 0 | 0.0% |
| Total | 22 | 100.0% |
School Enrollment by Age by Funding Source in Flaming Gorge
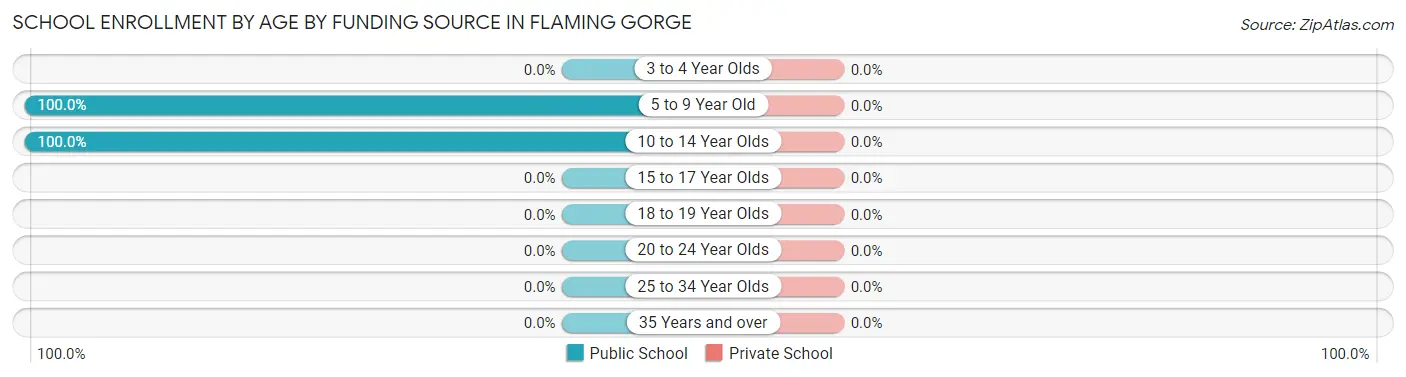
| Age Bracket | Public School | Private School |
| 3 to 4 Year Olds | 0 (0.0%) | 0 (0.0%) |
| 5 to 9 Year Old | 6 (100.0%) | 0 (0.0%) |
| 10 to 14 Year Olds | 16 (100.0%) | 0 (0.0%) |
| 15 to 17 Year Olds | 0 (0.0%) | 0 (0.0%) |
| 18 to 19 Year Olds | 0 (0.0%) | 0 (0.0%) |
| 20 to 24 Year Olds | 0 (0.0%) | 0 (0.0%) |
| 25 to 34 Year Olds | 0 (0.0%) | 0 (0.0%) |
| 35 Years and over | 0 (0.0%) | 0 (0.0%) |
| Total | 22 (100.0%) | 0 (0.0%) |
Educational Attainment by Field of Study in Flaming Gorge
Education (8 | 47.1%), communications (4 | 23.5%), science & technology (3 | 17.6%), and business (2 | 11.8%) are the most common fields of study among 17 individuals in Flaming Gorge who have obtained a bachelor's degree or higher.
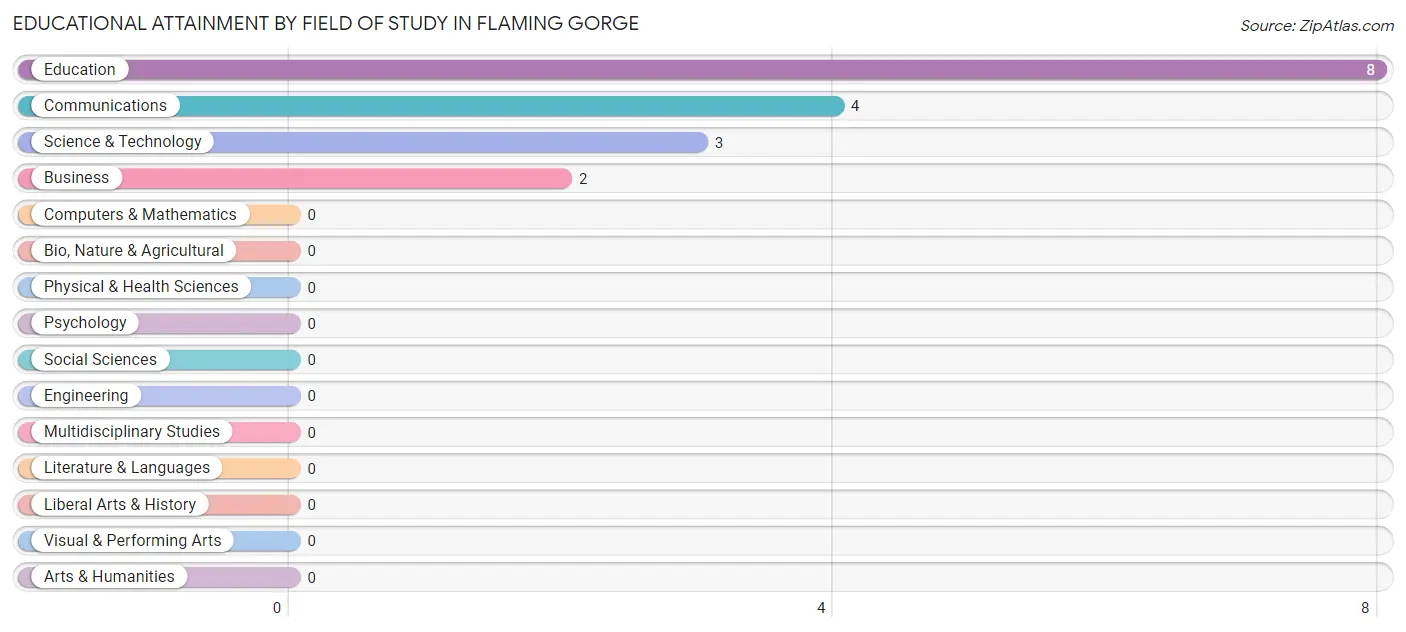
| Field of Study | # Graduates | % Graduates |
| Computers & Mathematics | 0 | 0.0% |
| Bio, Nature & Agricultural | 0 | 0.0% |
| Physical & Health Sciences | 0 | 0.0% |
| Psychology | 0 | 0.0% |
| Social Sciences | 0 | 0.0% |
| Engineering | 0 | 0.0% |
| Multidisciplinary Studies | 0 | 0.0% |
| Science & Technology | 3 | 17.6% |
| Business | 2 | 11.8% |
| Education | 8 | 47.1% |
| Literature & Languages | 0 | 0.0% |
| Liberal Arts & History | 0 | 0.0% |
| Visual & Performing Arts | 0 | 0.0% |
| Communications | 4 | 23.5% |
| Arts & Humanities | 0 | 0.0% |
| Total | 17 | 100.0% |
Transportation & Commute in Flaming Gorge
Vehicle Availability by Sex in Flaming Gorge
The most prevalent vehicle ownership categories in Flaming Gorge are males with no vehicle (3, accounting for 27.3%) and females with no vehicle (4, making up 13.6%).
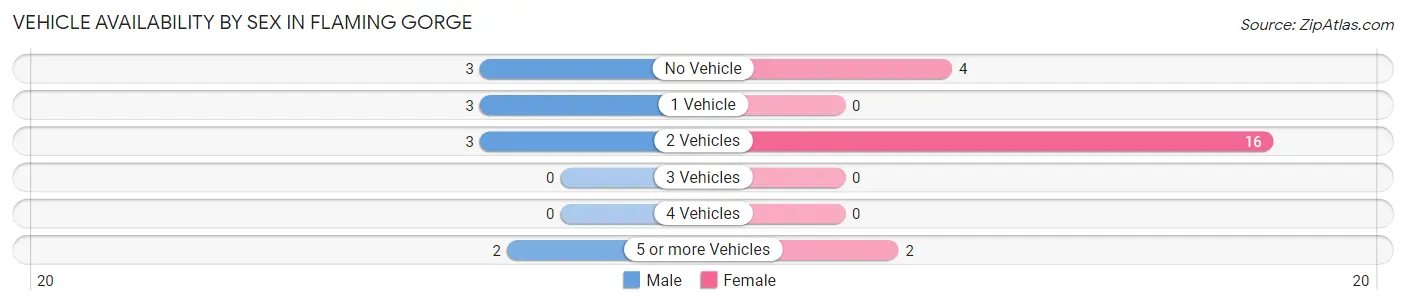
| Vehicles Available | Male | Female |
| No Vehicle | 3 (27.3%) | 4 (18.2%) |
| 1 Vehicle | 3 (27.3%) | 0 (0.0%) |
| 2 Vehicles | 3 (27.3%) | 16 (72.7%) |
| 3 Vehicles | 0 (0.0%) | 0 (0.0%) |
| 4 Vehicles | 0 (0.0%) | 0 (0.0%) |
| 5 or more Vehicles | 2 (18.2%) | 2 (9.1%) |
| Total | 11 (100.0%) | 22 (100.0%) |
Commute Time in Flaming Gorge
The most frequently occuring commute durations in Flaming Gorge are less than 5 minutes (20 commuters, 60.6%), 15 to 19 minutes (7 commuters, 21.2%), and 5 to 9 minutes (3 commuters, 9.1%).
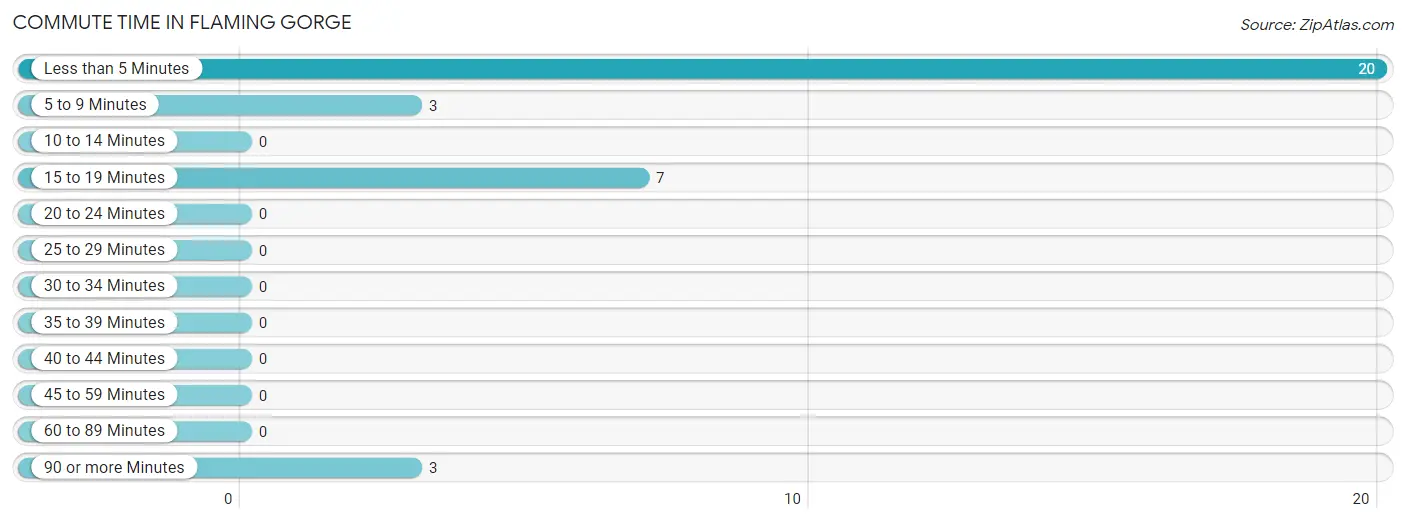
| Commute Time | # Commuters | % Commuters |
| Less than 5 Minutes | 20 | 60.6% |
| 5 to 9 Minutes | 3 | 9.1% |
| 10 to 14 Minutes | 0 | 0.0% |
| 15 to 19 Minutes | 7 | 21.2% |
| 20 to 24 Minutes | 0 | 0.0% |
| 25 to 29 Minutes | 0 | 0.0% |
| 30 to 34 Minutes | 0 | 0.0% |
| 35 to 39 Minutes | 0 | 0.0% |
| 40 to 44 Minutes | 0 | 0.0% |
| 45 to 59 Minutes | 0 | 0.0% |
| 60 to 89 Minutes | 0 | 0.0% |
| 90 or more Minutes | 3 | 9.1% |
Commute Time by Sex in Flaming Gorge
The most common commute times in Flaming Gorge are 5 to 9 minutes (3 commuters, 27.3%) for males and less than 5 minutes (18 commuters, 81.8%) for females.
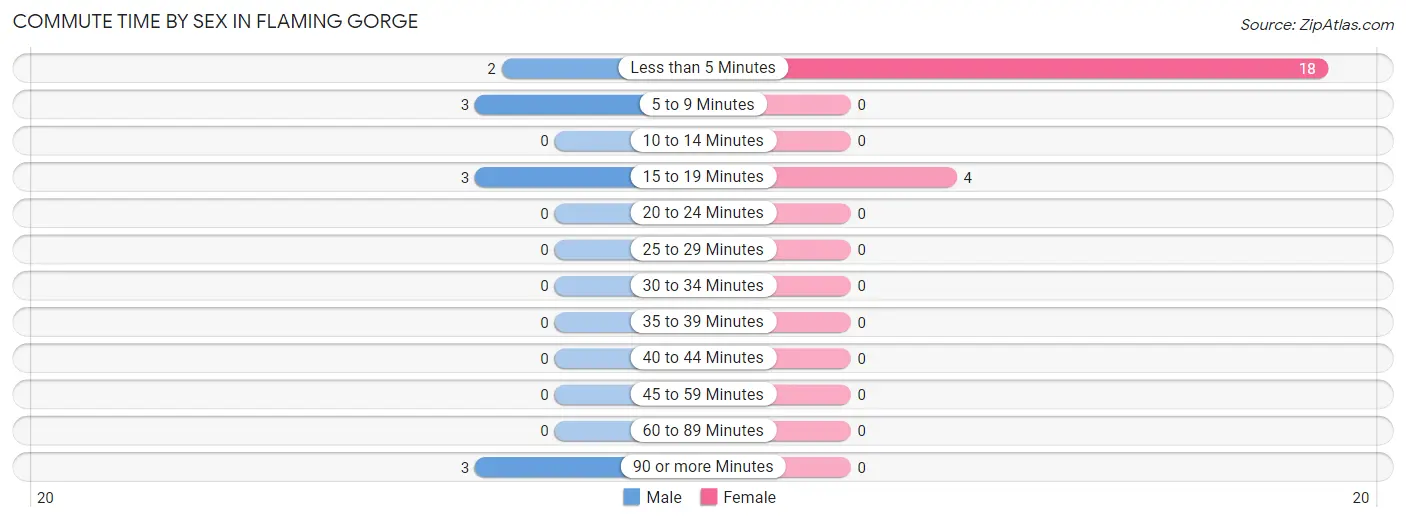
| Commute Time | Male | Female |
| Less than 5 Minutes | 2 (18.2%) | 18 (81.8%) |
| 5 to 9 Minutes | 3 (27.3%) | 0 (0.0%) |
| 10 to 14 Minutes | 0 (0.0%) | 0 (0.0%) |
| 15 to 19 Minutes | 3 (27.3%) | 4 (18.2%) |
| 20 to 24 Minutes | 0 (0.0%) | 0 (0.0%) |
| 25 to 29 Minutes | 0 (0.0%) | 0 (0.0%) |
| 30 to 34 Minutes | 0 (0.0%) | 0 (0.0%) |
| 35 to 39 Minutes | 0 (0.0%) | 0 (0.0%) |
| 40 to 44 Minutes | 0 (0.0%) | 0 (0.0%) |
| 45 to 59 Minutes | 0 (0.0%) | 0 (0.0%) |
| 60 to 89 Minutes | 0 (0.0%) | 0 (0.0%) |
| 90 or more Minutes | 3 (27.3%) | 0 (0.0%) |
Time of Departure to Work by Sex in Flaming Gorge
The most frequent times of departure to work in Flaming Gorge are 5:00 AM to 5:29 AM (6, 54.5%) for males and 7:00 AM to 7:29 AM (11, 50.0%) for females.
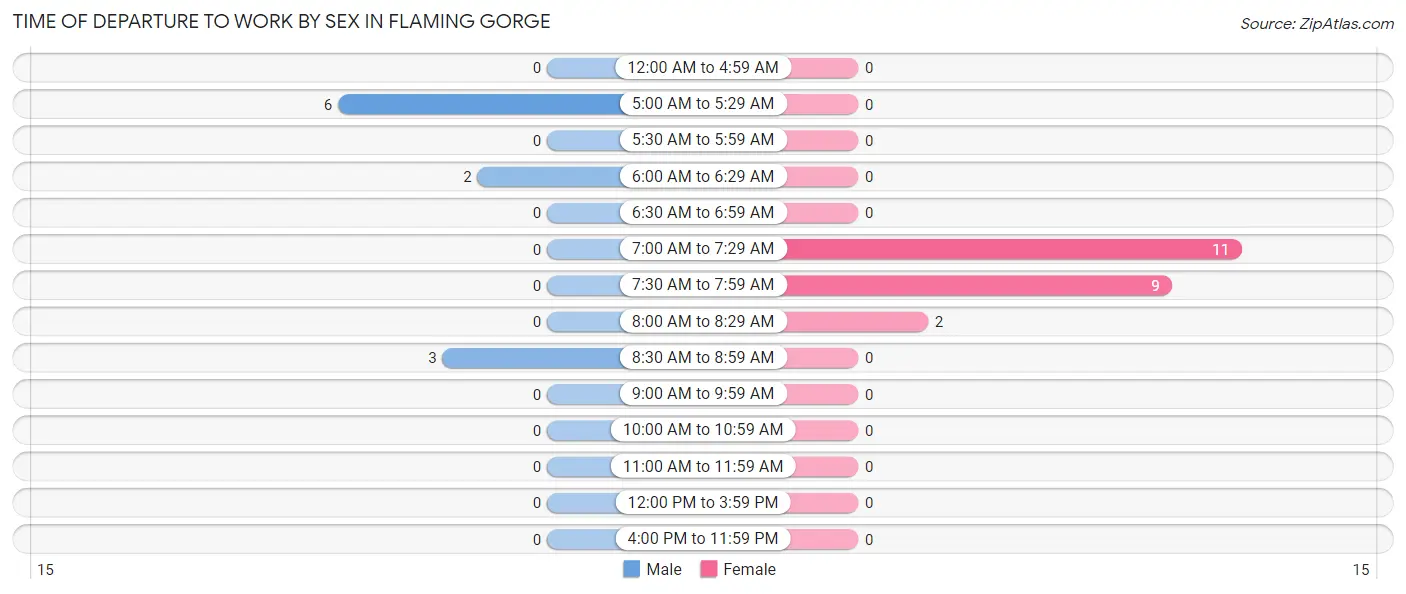
| Time of Departure | Male | Female |
| 12:00 AM to 4:59 AM | 0 (0.0%) | 0 (0.0%) |
| 5:00 AM to 5:29 AM | 6 (54.5%) | 0 (0.0%) |
| 5:30 AM to 5:59 AM | 0 (0.0%) | 0 (0.0%) |
| 6:00 AM to 6:29 AM | 2 (18.2%) | 0 (0.0%) |
| 6:30 AM to 6:59 AM | 0 (0.0%) | 0 (0.0%) |
| 7:00 AM to 7:29 AM | 0 (0.0%) | 11 (50.0%) |
| 7:30 AM to 7:59 AM | 0 (0.0%) | 9 (40.9%) |
| 8:00 AM to 8:29 AM | 0 (0.0%) | 2 (9.1%) |
| 8:30 AM to 8:59 AM | 3 (27.3%) | 0 (0.0%) |
| 9:00 AM to 9:59 AM | 0 (0.0%) | 0 (0.0%) |
| 10:00 AM to 10:59 AM | 0 (0.0%) | 0 (0.0%) |
| 11:00 AM to 11:59 AM | 0 (0.0%) | 0 (0.0%) |
| 12:00 PM to 3:59 PM | 0 (0.0%) | 0 (0.0%) |
| 4:00 PM to 11:59 PM | 0 (0.0%) | 0 (0.0%) |
| Total | 11 (100.0%) | 22 (100.0%) |
Housing Occupancy in Flaming Gorge
Occupancy by Ownership in Flaming Gorge
Of the total 28 dwellings in Flaming Gorge, owner-occupied units account for 20 (71.4%), while renter-occupied units make up 8 (28.6%).
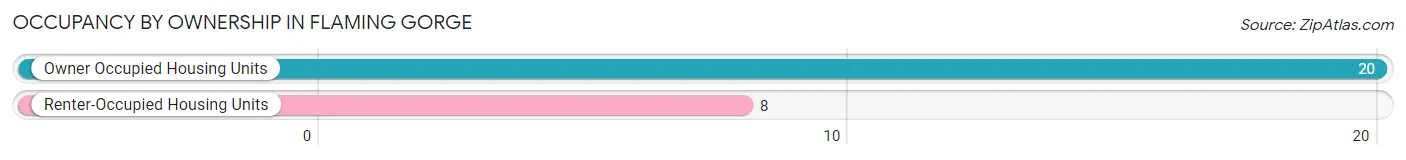
| Occupancy | # Housing Units | % Housing Units |
| Owner Occupied Housing Units | 20 | 71.4% |
| Renter-Occupied Housing Units | 8 | 28.6% |
| Total Occupied Housing Units | 28 | 100.0% |
Occupancy by Household Size in Flaming Gorge
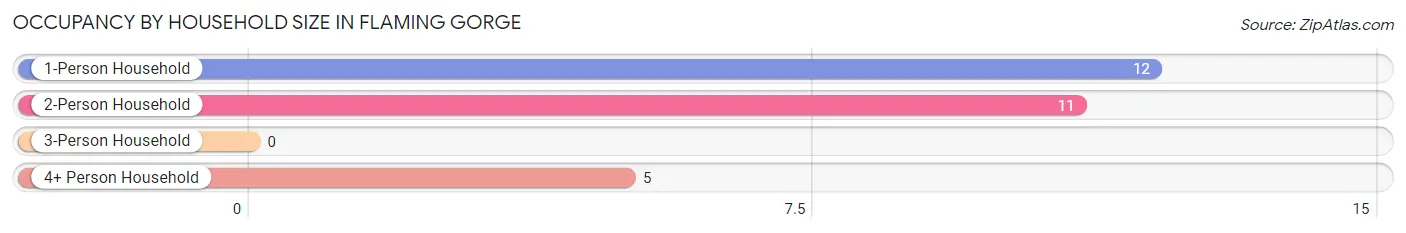
| Household Size | # Housing Units | % Housing Units |
| 1-Person Household | 12 | 42.9% |
| 2-Person Household | 11 | 39.3% |
| 3-Person Household | 0 | 0.0% |
| 4+ Person Household | 5 | 17.9% |
| Total Housing Units | 28 | 100.0% |
Occupancy by Ownership by Household Size in Flaming Gorge
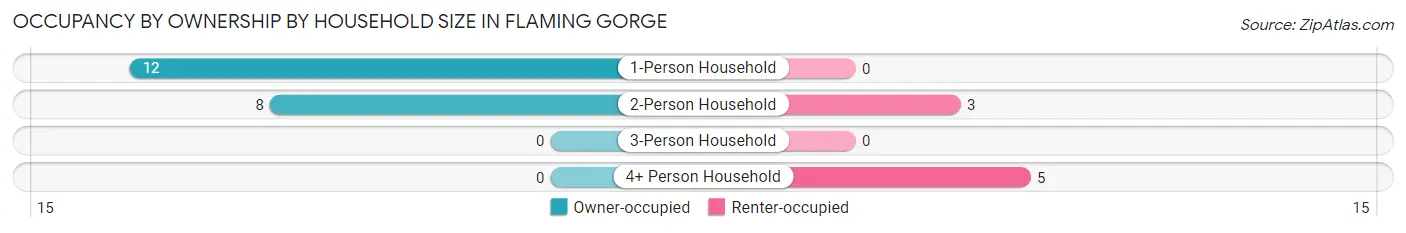
| Household Size | Owner-occupied | Renter-occupied |
| 1-Person Household | 12 (100.0%) | 0 (0.0%) |
| 2-Person Household | 8 (72.7%) | 3 (27.3%) |
| 3-Person Household | 0 (0.0%) | 0 (0.0%) |
| 4+ Person Household | 0 (0.0%) | 5 (100.0%) |
| Total Housing Units | 20 (71.4%) | 8 (28.6%) |
Occupancy by Educational Attainment in Flaming Gorge
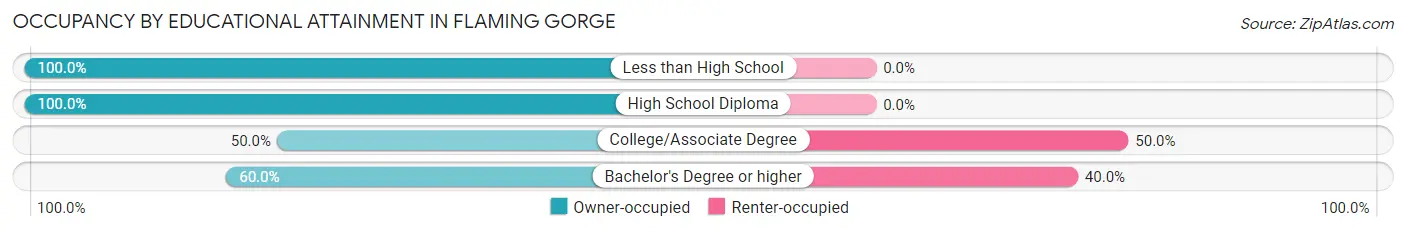
| Household Size | Owner-occupied | Renter-occupied |
| Less than High School | 3 (100.0%) | 0 (0.0%) |
| High School Diploma | 8 (100.0%) | 0 (0.0%) |
| College/Associate Degree | 6 (50.0%) | 6 (50.0%) |
| Bachelor's Degree or higher | 3 (60.0%) | 2 (40.0%) |
Occupancy by Age of Householder in Flaming Gorge
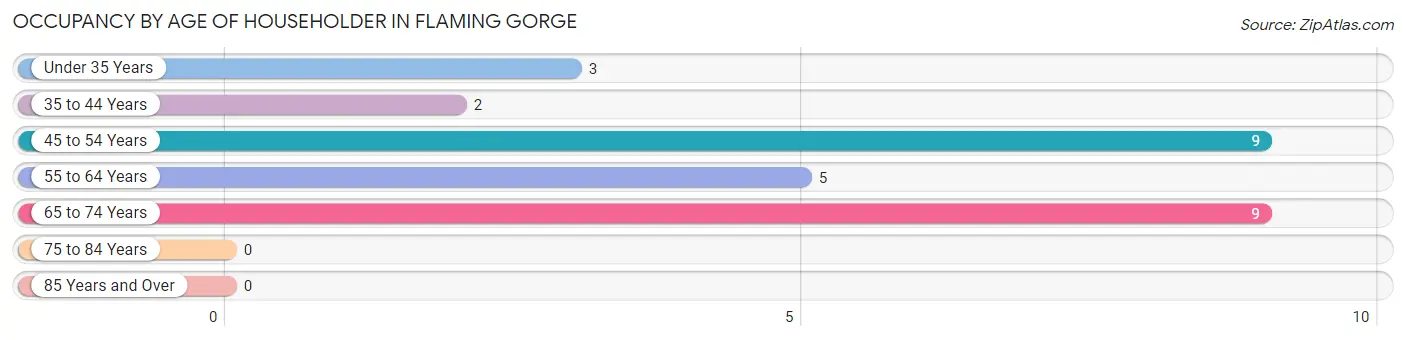
| Age Bracket | # Households | % Households |
| Under 35 Years | 3 | 10.7% |
| 35 to 44 Years | 2 | 7.1% |
| 45 to 54 Years | 9 | 32.1% |
| 55 to 64 Years | 5 | 17.9% |
| 65 to 74 Years | 9 | 32.1% |
| 75 to 84 Years | 0 | 0.0% |
| 85 Years and Over | 0 | 0.0% |
| Total | 28 | 100.0% |
Housing Finances in Flaming Gorge
Median Income by Occupancy in Flaming Gorge
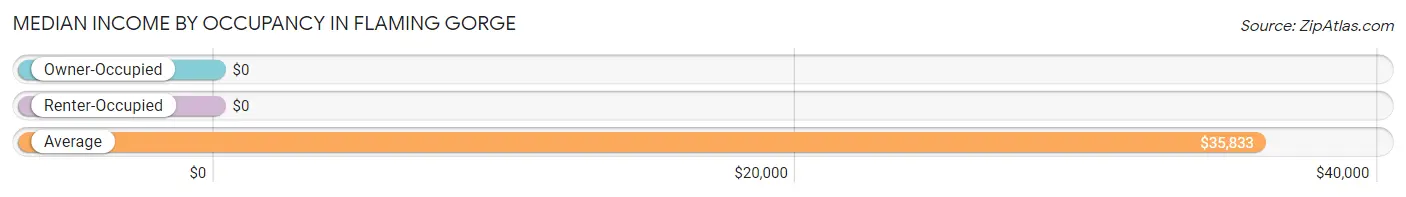
| Occupancy Type | # Households | Median Income |
| Owner-Occupied | 20 (71.4%) | $0 |
| Renter-Occupied | 8 (28.6%) | $0 |
| Average | 28 (100.0%) | $35,833 |
Occupancy by Householder Income Bracket in Flaming Gorge
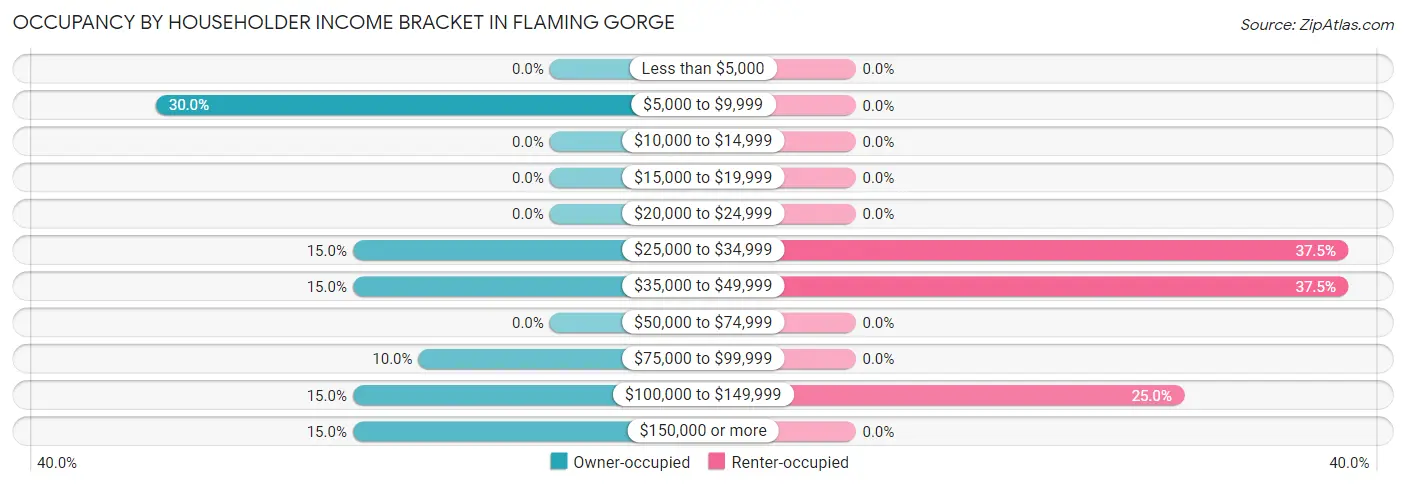
| Income Bracket | Owner-occupied | Renter-occupied |
| Less than $5,000 | 0 (0.0%) | 0 (0.0%) |
| $5,000 to $9,999 | 6 (30.0%) | 0 (0.0%) |
| $10,000 to $14,999 | 0 (0.0%) | 0 (0.0%) |
| $15,000 to $19,999 | 0 (0.0%) | 0 (0.0%) |
| $20,000 to $24,999 | 0 (0.0%) | 0 (0.0%) |
| $25,000 to $34,999 | 3 (15.0%) | 3 (37.5%) |
| $35,000 to $49,999 | 3 (15.0%) | 3 (37.5%) |
| $50,000 to $74,999 | 0 (0.0%) | 0 (0.0%) |
| $75,000 to $99,999 | 2 (10.0%) | 0 (0.0%) |
| $100,000 to $149,999 | 3 (15.0%) | 2 (25.0%) |
| $150,000 or more | 3 (15.0%) | 0 (0.0%) |
| Total | 20 (100.0%) | 8 (100.0%) |
Monthly Housing Cost Tiers in Flaming Gorge
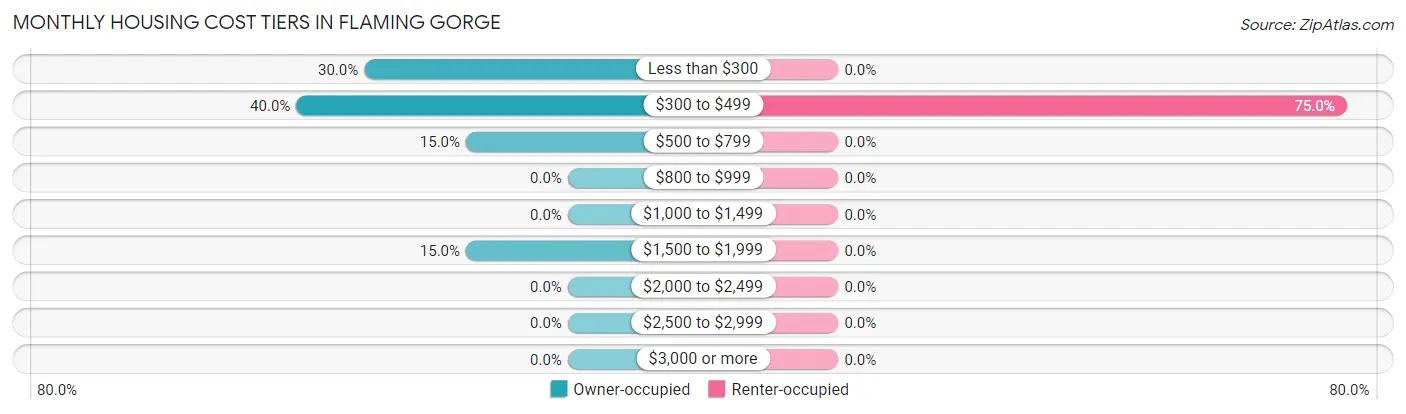
| Monthly Cost | Owner-occupied | Renter-occupied |
| Less than $300 | 6 (30.0%) | 0 (0.0%) |
| $300 to $499 | 8 (40.0%) | 6 (75.0%) |
| $500 to $799 | 3 (15.0%) | 0 (0.0%) |
| $800 to $999 | 0 (0.0%) | 0 (0.0%) |
| $1,000 to $1,499 | 0 (0.0%) | 0 (0.0%) |
| $1,500 to $1,999 | 3 (15.0%) | 0 (0.0%) |
| $2,000 to $2,499 | 0 (0.0%) | 0 (0.0%) |
| $2,500 to $2,999 | 0 (0.0%) | 0 (0.0%) |
| $3,000 or more | 0 (0.0%) | 0 (0.0%) |
| Total | 20 (100.0%) | 8 (100.0%) |
Physical Housing Characteristics in Flaming Gorge
Housing Structures in Flaming Gorge
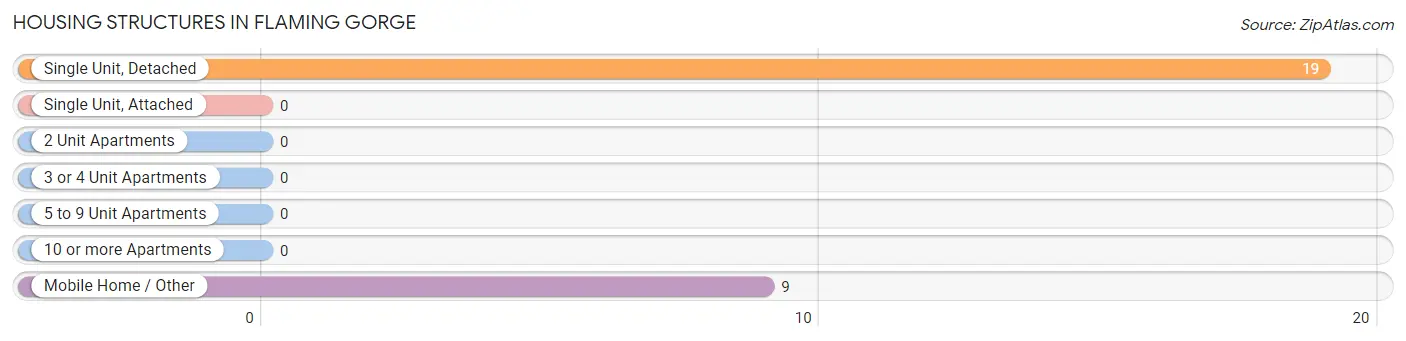
| Structure Type | # Housing Units | % Housing Units |
| Single Unit, Detached | 19 | 67.9% |
| Single Unit, Attached | 0 | 0.0% |
| 2 Unit Apartments | 0 | 0.0% |
| 3 or 4 Unit Apartments | 0 | 0.0% |
| 5 to 9 Unit Apartments | 0 | 0.0% |
| 10 or more Apartments | 0 | 0.0% |
| Mobile Home / Other | 9 | 32.1% |
| Total | 28 | 100.0% |
Housing Structures by Occupancy in Flaming Gorge
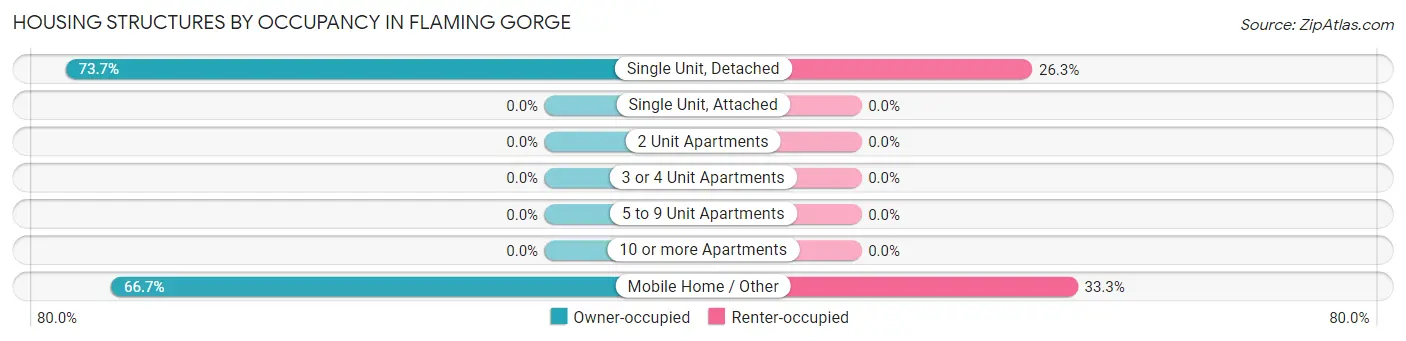
| Structure Type | Owner-occupied | Renter-occupied |
| Single Unit, Detached | 14 (73.7%) | 5 (26.3%) |
| Single Unit, Attached | 0 (0.0%) | 0 (0.0%) |
| 2 Unit Apartments | 0 (0.0%) | 0 (0.0%) |
| 3 or 4 Unit Apartments | 0 (0.0%) | 0 (0.0%) |
| 5 to 9 Unit Apartments | 0 (0.0%) | 0 (0.0%) |
| 10 or more Apartments | 0 (0.0%) | 0 (0.0%) |
| Mobile Home / Other | 6 (66.7%) | 3 (33.3%) |
| Total | 20 (71.4%) | 8 (28.6%) |
Housing Structures by Number of Rooms in Flaming Gorge
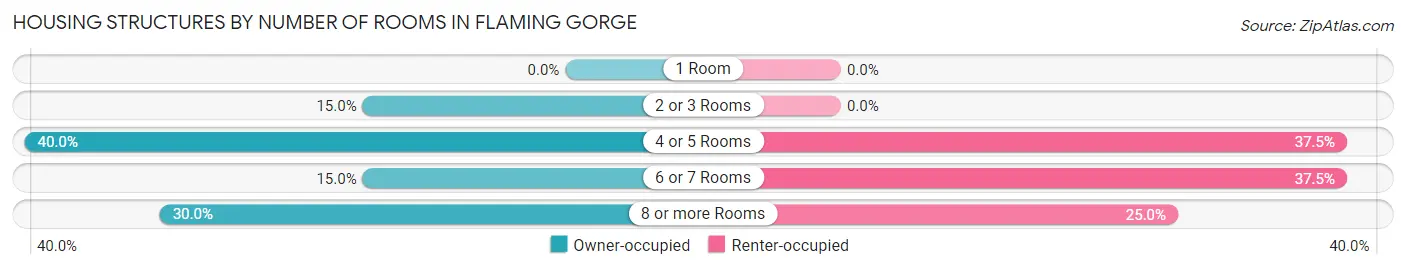
| Number of Rooms | Owner-occupied | Renter-occupied |
| 1 Room | 0 (0.0%) | 0 (0.0%) |
| 2 or 3 Rooms | 3 (15.0%) | 0 (0.0%) |
| 4 or 5 Rooms | 8 (40.0%) | 3 (37.5%) |
| 6 or 7 Rooms | 3 (15.0%) | 3 (37.5%) |
| 8 or more Rooms | 6 (30.0%) | 2 (25.0%) |
| Total | 20 (100.0%) | 8 (100.0%) |
Housing Structure by Heating Type in Flaming Gorge
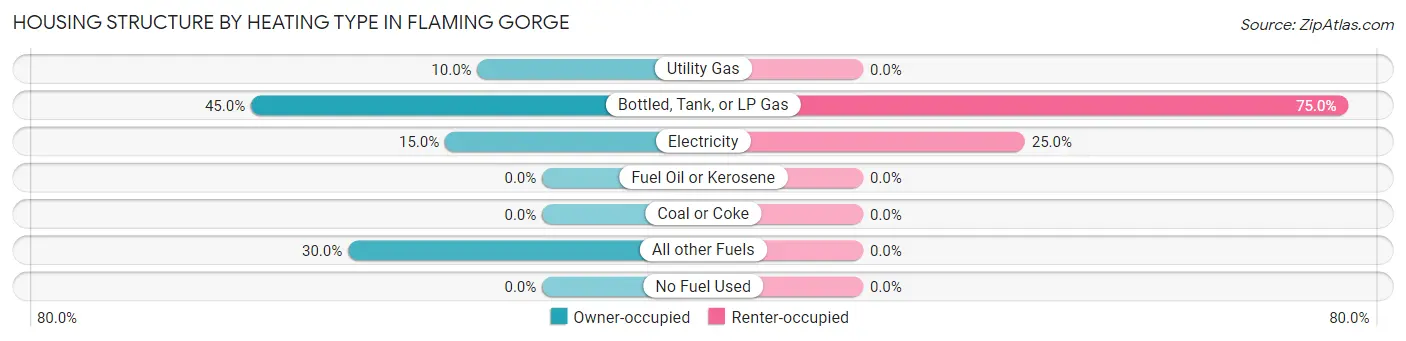
| Heating Type | Owner-occupied | Renter-occupied |
| Utility Gas | 2 (10.0%) | 0 (0.0%) |
| Bottled, Tank, or LP Gas | 9 (45.0%) | 6 (75.0%) |
| Electricity | 3 (15.0%) | 2 (25.0%) |
| Fuel Oil or Kerosene | 0 (0.0%) | 0 (0.0%) |
| Coal or Coke | 0 (0.0%) | 0 (0.0%) |
| All other Fuels | 6 (30.0%) | 0 (0.0%) |
| No Fuel Used | 0 (0.0%) | 0 (0.0%) |
| Total | 20 (100.0%) | 8 (100.0%) |
Household Vehicle Usage in Flaming Gorge
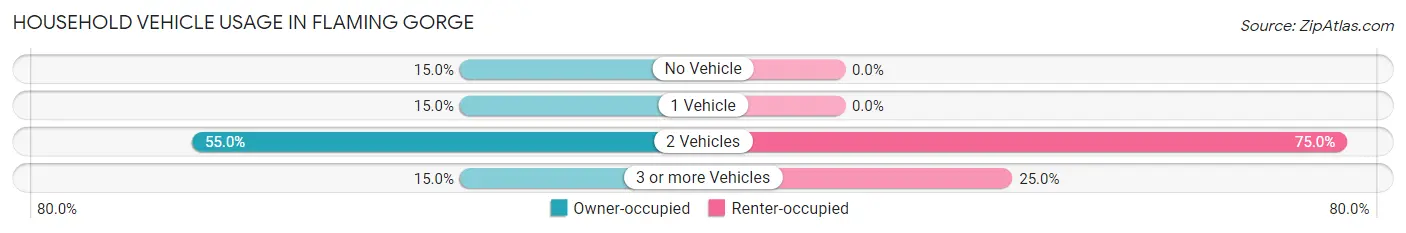
| Vehicles per Household | Owner-occupied | Renter-occupied |
| No Vehicle | 3 (15.0%) | 0 (0.0%) |
| 1 Vehicle | 3 (15.0%) | 0 (0.0%) |
| 2 Vehicles | 11 (55.0%) | 6 (75.0%) |
| 3 or more Vehicles | 3 (15.0%) | 2 (25.0%) |
| Total | 20 (100.0%) | 8 (100.0%) |
Real Estate & Mortgages in Flaming Gorge
Real Estate and Mortgage Overview in Flaming Gorge
| Characteristic | Without Mortgage | With Mortgage |
| Housing Units | 17 | 3 |
| Median Property Value | - | - |
| Median Household Income | - | - |
| Monthly Housing Costs | $354 | $0 |
| Real Estate Taxes | $1,156 | $0 |
Property Value by Mortgage Status in Flaming Gorge
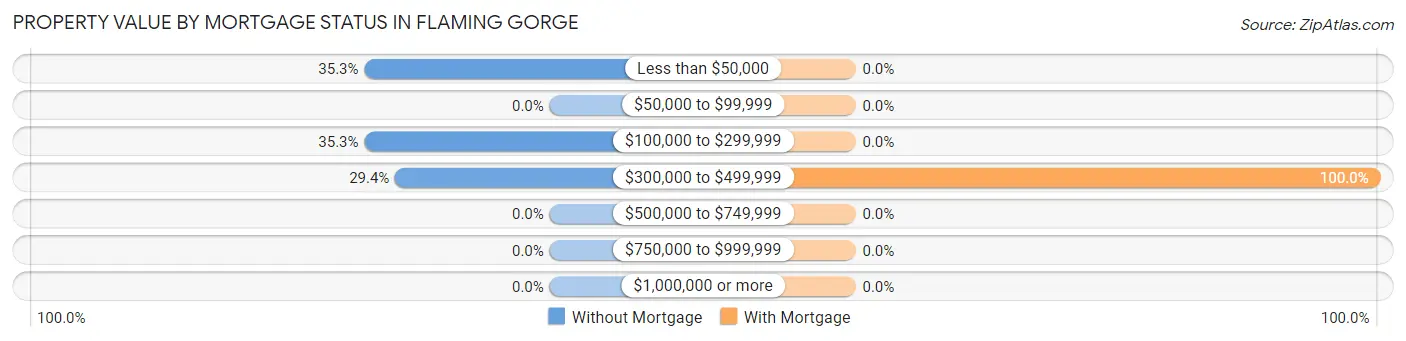
| Property Value | Without Mortgage | With Mortgage |
| Less than $50,000 | 6 (35.3%) | 0 (0.0%) |
| $50,000 to $99,999 | 0 (0.0%) | 0 (0.0%) |
| $100,000 to $299,999 | 6 (35.3%) | 0 (0.0%) |
| $300,000 to $499,999 | 5 (29.4%) | 3 (100.0%) |
| $500,000 to $749,999 | 0 (0.0%) | 0 (0.0%) |
| $750,000 to $999,999 | 0 (0.0%) | 0 (0.0%) |
| $1,000,000 or more | 0 (0.0%) | 0 (0.0%) |
| Total | 17 (100.0%) | 3 (100.0%) |
Household Income by Mortgage Status in Flaming Gorge
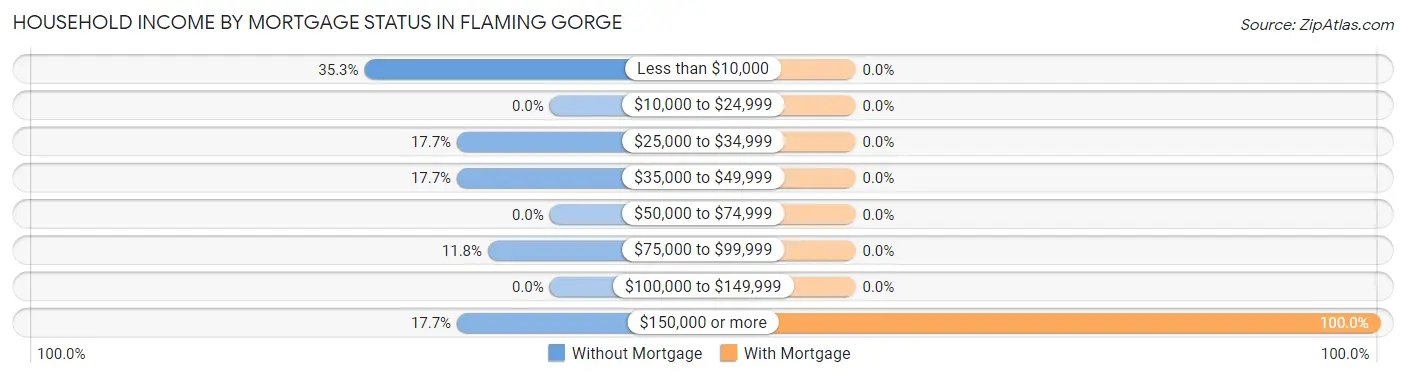
| Household Income | Without Mortgage | With Mortgage |
| Less than $10,000 | 6 (35.3%) | 0 (0.0%) |
| $10,000 to $24,999 | 0 (0.0%) | 0 (0.0%) |
| $25,000 to $34,999 | 3 (17.6%) | 0 (0.0%) |
| $35,000 to $49,999 | 3 (17.6%) | 0 (0.0%) |
| $50,000 to $74,999 | 0 (0.0%) | 0 (0.0%) |
| $75,000 to $99,999 | 2 (11.8%) | 0 (0.0%) |
| $100,000 to $149,999 | 0 (0.0%) | 0 (0.0%) |
| $150,000 or more | 3 (17.6%) | 3 (100.0%) |
| Total | 17 (100.0%) | 3 (100.0%) |
Property Value to Household Income Ratio in Flaming Gorge
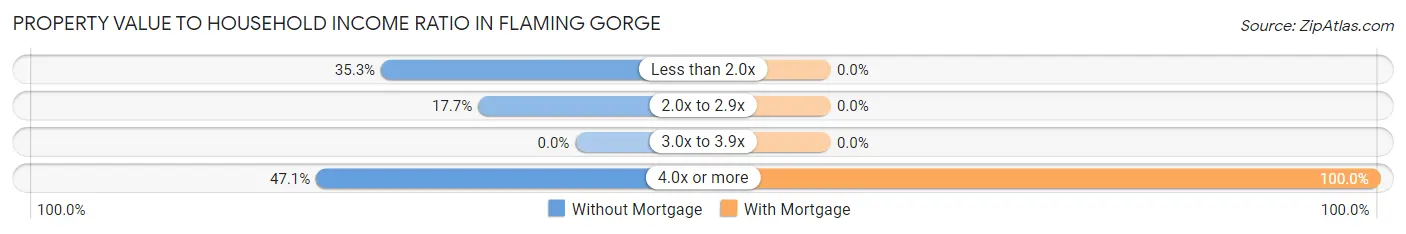
| Value-to-Income Ratio | Without Mortgage | With Mortgage |
| Less than 2.0x | 6 (35.3%) | 0 (0.0%) |
| 2.0x to 2.9x | 3 (17.6%) | 0 (0.0%) |
| 3.0x to 3.9x | 0 (0.0%) | 0 (0.0%) |
| 4.0x or more | 8 (47.1%) | 3 (100.0%) |
| Total | 17 (100.0%) | 3 (100.0%) |
Real Estate Taxes by Mortgage Status in Flaming Gorge
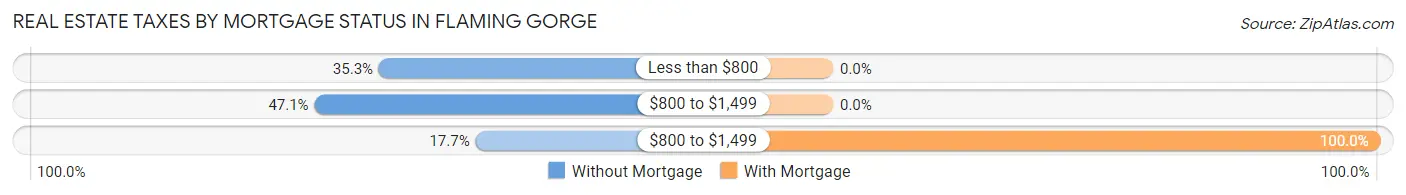
| Property Taxes | Without Mortgage | With Mortgage |
| Less than $800 | 6 (35.3%) | 0 (0.0%) |
| $800 to $1,499 | 8 (47.1%) | 0 (0.0%) |
| $800 to $1,499 | 3 (17.6%) | 3 (100.0%) |
| Total | 17 (100.0%) | 3 (100.0%) |
Health & Disability in Flaming Gorge
Health Insurance Coverage by Age in Flaming Gorge
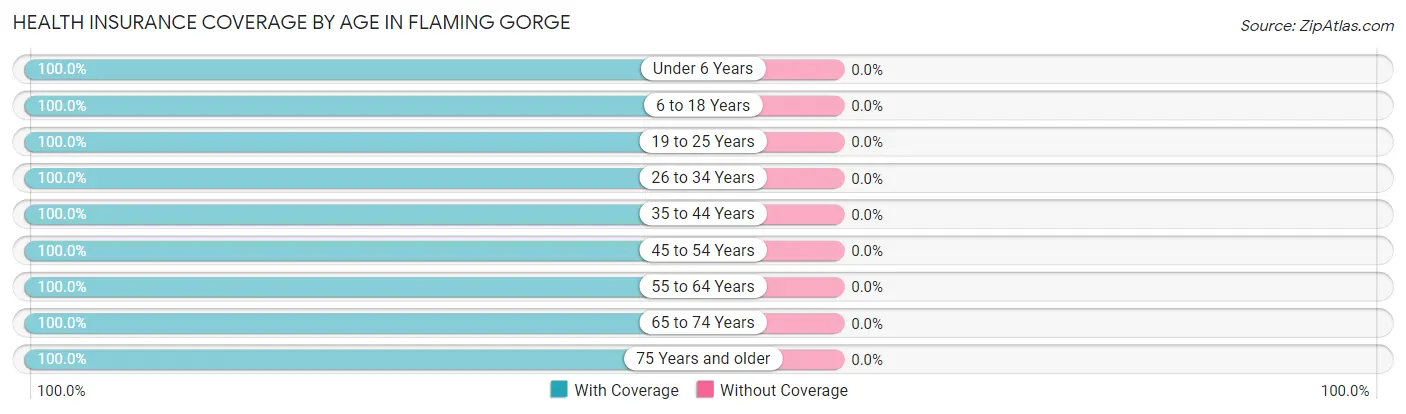
| Age Bracket | With Coverage | Without Coverage |
| Under 6 Years | 2 (100.0%) | 0 (0.0%) |
| 6 to 18 Years | 20 (100.0%) | 0 (0.0%) |
| 19 to 25 Years | 4 (100.0%) | 0 (0.0%) |
| 26 to 34 Years | 3 (100.0%) | 0 (0.0%) |
| 35 to 44 Years | 4 (100.0%) | 0 (0.0%) |
| 45 to 54 Years | 9 (100.0%) | 0 (0.0%) |
| 55 to 64 Years | 9 (100.0%) | 0 (0.0%) |
| 65 to 74 Years | 15 (100.0%) | 0 (0.0%) |
| 75 Years and older | 3 (100.0%) | 0 (0.0%) |
| Total | 69 (100.0%) | 0 (0.0%) |
Health Insurance Coverage by Citizenship Status in Flaming Gorge
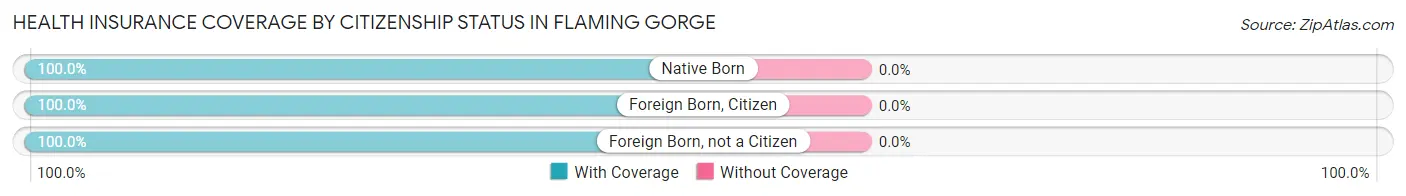
| Citizenship Status | With Coverage | Without Coverage |
| Native Born | 2 (100.0%) | 0 (0.0%) |
| Foreign Born, Citizen | 20 (100.0%) | 0 (0.0%) |
| Foreign Born, not a Citizen | 4 (100.0%) | 0 (0.0%) |
Health Insurance Coverage by Household Income in Flaming Gorge
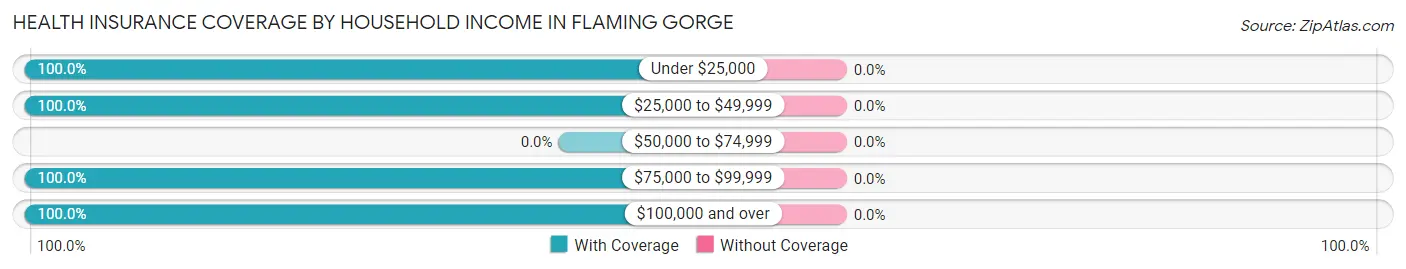
| Household Income | With Coverage | Without Coverage |
| Under $25,000 | 6 (100.0%) | 0 (0.0%) |
| $25,000 to $49,999 | 31 (100.0%) | 0 (0.0%) |
| $50,000 to $74,999 | 0 (0.0%) | 0 (0.0%) |
| $75,000 to $99,999 | 5 (100.0%) | 0 (0.0%) |
| $100,000 and over | 27 (100.0%) | 0 (0.0%) |
Public vs Private Health Insurance Coverage by Age in Flaming Gorge
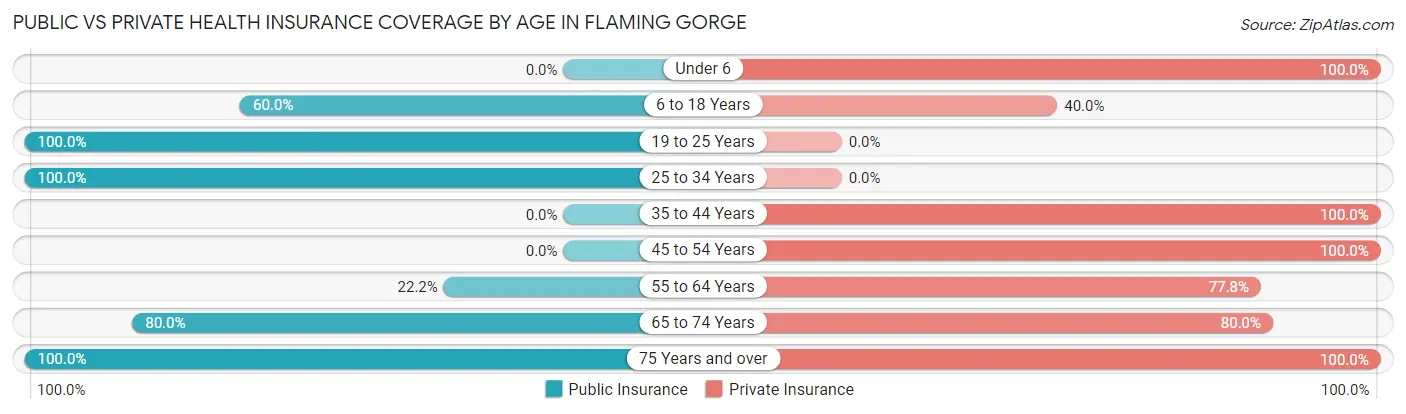
| Age Bracket | Public Insurance | Private Insurance |
| Under 6 | 0 (0.0%) | 2 (100.0%) |
| 6 to 18 Years | 12 (60.0%) | 8 (40.0%) |
| 19 to 25 Years | 4 (100.0%) | 0 (0.0%) |
| 25 to 34 Years | 3 (100.0%) | 0 (0.0%) |
| 35 to 44 Years | 0 (0.0%) | 4 (100.0%) |
| 45 to 54 Years | 0 (0.0%) | 9 (100.0%) |
| 55 to 64 Years | 2 (22.2%) | 7 (77.8%) |
| 65 to 74 Years | 12 (80.0%) | 12 (80.0%) |
| 75 Years and over | 3 (100.0%) | 3 (100.0%) |
| Total | 36 (52.2%) | 45 (65.2%) |
Disability Status by Sex by Age in Flaming Gorge
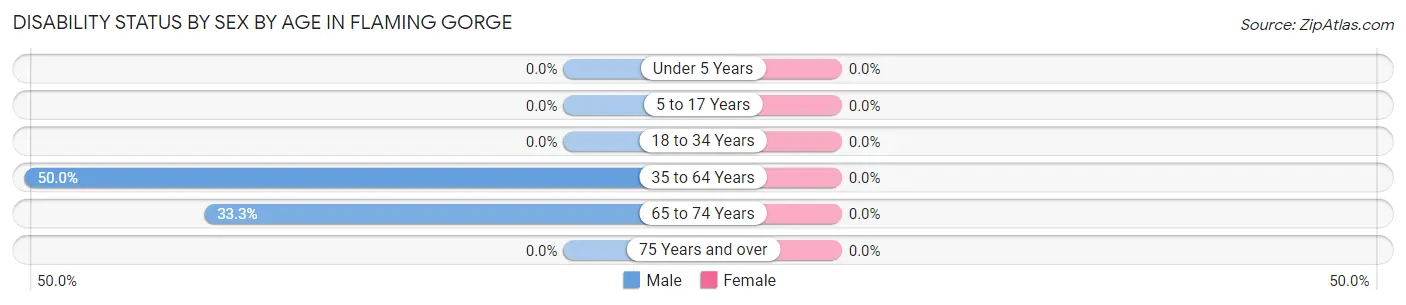
| Age Bracket | Male | Female |
| Under 5 Years | 0 (0.0%) | 0 (0.0%) |
| 5 to 17 Years | 0 (0.0%) | 0 (0.0%) |
| 18 to 34 Years | 0 (0.0%) | 0 (0.0%) |
| 35 to 64 Years | 2 (50.0%) | 0 (0.0%) |
| 65 to 74 Years | 3 (33.3%) | 0 (0.0%) |
| 75 Years and over | 0 (0.0%) | 0 (0.0%) |
Disability Class by Sex by Age in Flaming Gorge
Disability Class: Hearing Difficulty
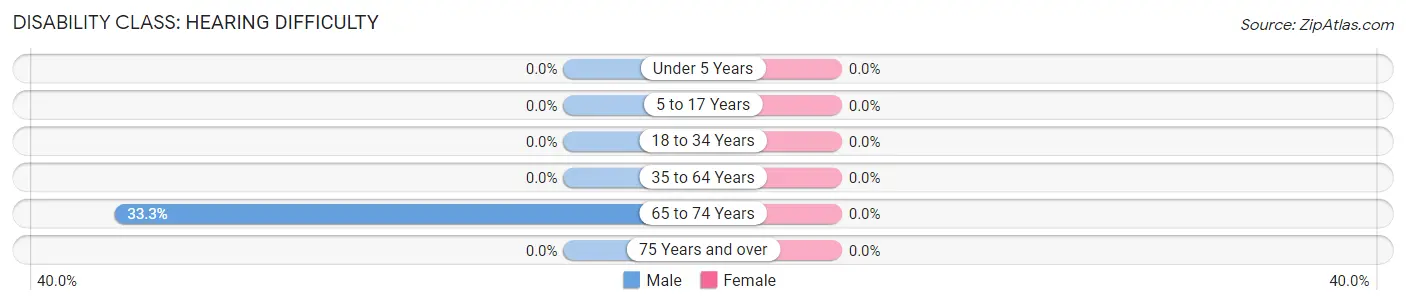
| Age Bracket | Male | Female |
| Under 5 Years | 0 (0.0%) | 0 (0.0%) |
| 5 to 17 Years | 0 (0.0%) | 0 (0.0%) |
| 18 to 34 Years | 0 (0.0%) | 0 (0.0%) |
| 35 to 64 Years | 0 (0.0%) | 0 (0.0%) |
| 65 to 74 Years | 3 (33.3%) | 0 (0.0%) |
| 75 Years and over | 0 (0.0%) | 0 (0.0%) |
Disability Class: Vision Difficulty
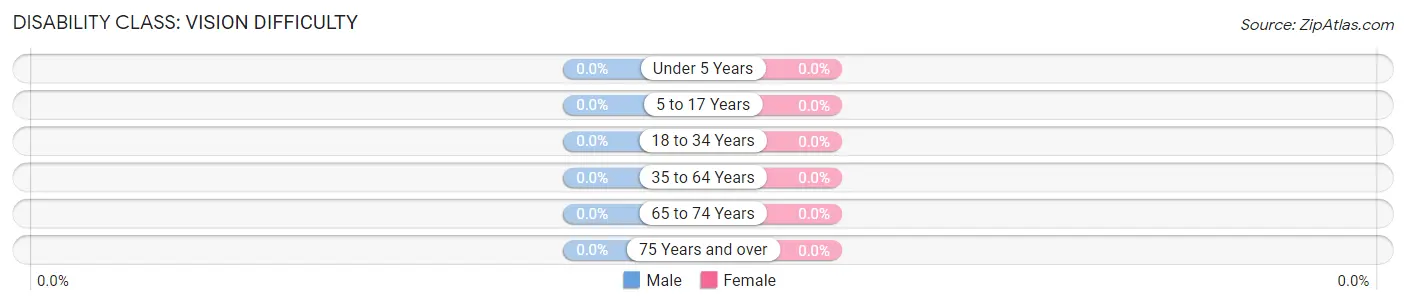
| Age Bracket | Male | Female |
| Under 5 Years | 0 (0.0%) | 0 (0.0%) |
| 5 to 17 Years | 0 (0.0%) | 0 (0.0%) |
| 18 to 34 Years | 0 (0.0%) | 0 (0.0%) |
| 35 to 64 Years | 0 (0.0%) | 0 (0.0%) |
| 65 to 74 Years | 0 (0.0%) | 0 (0.0%) |
| 75 Years and over | 0 (0.0%) | 0 (0.0%) |
Disability Class: Cognitive Difficulty
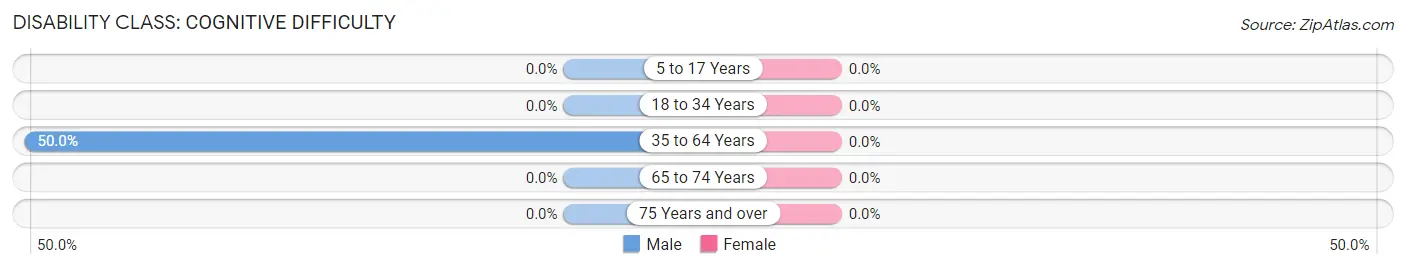
| Age Bracket | Male | Female |
| 5 to 17 Years | 0 (0.0%) | 0 (0.0%) |
| 18 to 34 Years | 0 (0.0%) | 0 (0.0%) |
| 35 to 64 Years | 2 (50.0%) | 0 (0.0%) |
| 65 to 74 Years | 0 (0.0%) | 0 (0.0%) |
| 75 Years and over | 0 (0.0%) | 0 (0.0%) |
Disability Class: Ambulatory Difficulty
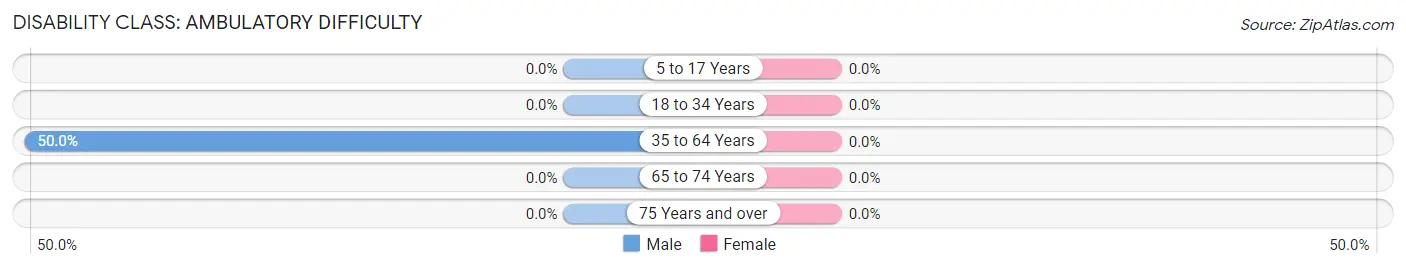
| Age Bracket | Male | Female |
| 5 to 17 Years | 0 (0.0%) | 0 (0.0%) |
| 18 to 34 Years | 0 (0.0%) | 0 (0.0%) |
| 35 to 64 Years | 2 (50.0%) | 0 (0.0%) |
| 65 to 74 Years | 0 (0.0%) | 0 (0.0%) |
| 75 Years and over | 0 (0.0%) | 0 (0.0%) |
Disability Class: Self-Care Difficulty
| Age Bracket | Male | Female |
| 5 to 17 Years | 0 (0.0%) | 0 (0.0%) |
| 18 to 34 Years | 0 (0.0%) | 0 (0.0%) |
| 35 to 64 Years | 0 (0.0%) | 0 (0.0%) |
| 65 to 74 Years | 0 (0.0%) | 0 (0.0%) |
| 75 Years and over | 0 (0.0%) | 0 (0.0%) |
Technology Access in Flaming Gorge
Computing Device Access in Flaming Gorge
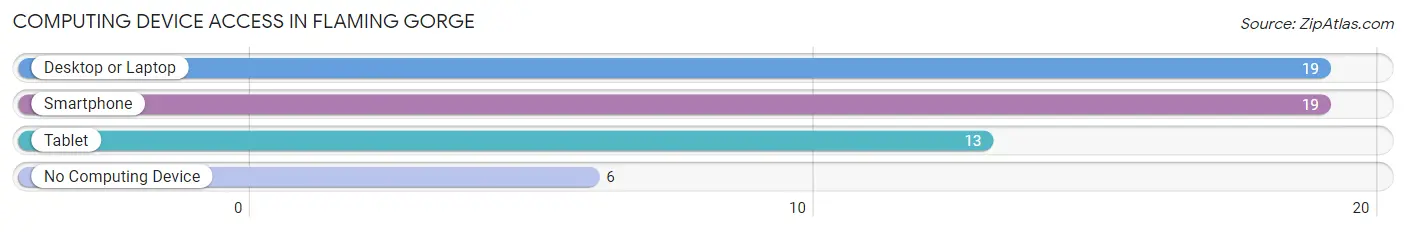
| Device Type | # Households | % Households |
| Desktop or Laptop | 19 | 67.9% |
| Smartphone | 19 | 67.9% |
| Tablet | 13 | 46.4% |
| No Computing Device | 6 | 21.4% |
| Total | 28 | 100.0% |
Internet Access in Flaming Gorge
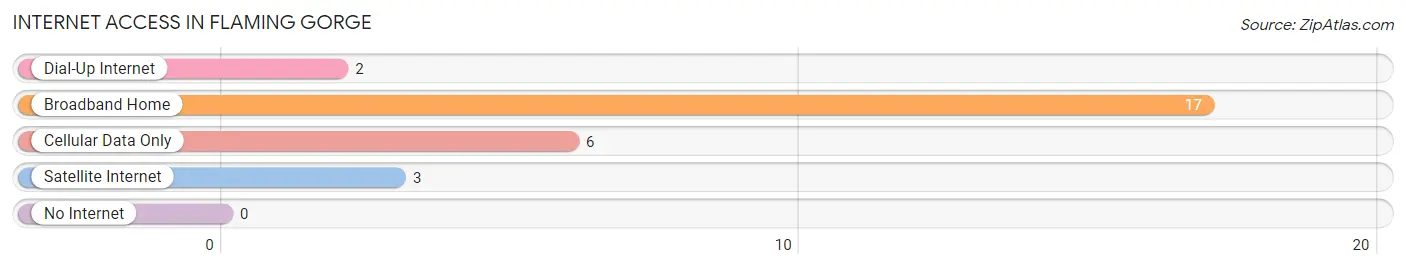
| Internet Type | # Households | % Households |
| Dial-Up Internet | 2 | 7.1% |
| Broadband Home | 17 | 60.7% |
| Cellular Data Only | 6 | 21.4% |
| Satellite Internet | 3 | 10.7% |
| No Internet | 0 | 0.0% |
| Total | 28 | 100.0% |
Flaming Gorge Summary
Flaming Gorge is a reservoir located in the northeastern corner of Utah and the southwestern corner of Wyoming. It is part of the Green River system and is a popular destination for fishing, boating, and other recreational activities. The reservoir was created in 1964 when the Flaming Gorge Dam was built on the Green River. The dam was built to provide hydroelectric power and irrigation water to the region.
Geography
Flaming Gorge is located in the Uinta Mountains of northeastern Utah and southwestern Wyoming. The reservoir is 91 miles long and has a surface area of 42,000 acres. The reservoir is fed by the Green River, which originates in the Wind River Range of Wyoming and flows south into Utah. The reservoir is surrounded by steep canyon walls and is home to a variety of wildlife, including bald eagles, ospreys, and mule deer.
History
The area now known as Flaming Gorge was first explored by John Wesley Powell in 1869. Powell named the area for its red sandstone cliffs, which he described as “flaming” in color. The area was largely uninhabited until the 1950s, when the Bureau of Reclamation began construction on the Flaming Gorge Dam. The dam was completed in 1964 and the reservoir was filled with water from the Green River.
Economy
Flaming Gorge is a popular destination for fishing, boating, and other recreational activities. The reservoir is home to a variety of fish species, including brown trout, rainbow trout, and kokanee salmon. The area is also popular for camping, hiking, and other outdoor activities. The reservoir is also a major source of hydroelectric power for the region.
Demographics
The population of Flaming Gorge is relatively small, with only a few hundred people living in the area. The majority of the population is made up of Native Americans, primarily members of the Ute Tribe. The area is also home to a small number of ranchers and farmers.
Conclusion
Flaming Gorge is a popular destination for fishing, boating, and other recreational activities. The reservoir was created in 1964 when the Flaming Gorge Dam was built on the Green River. The area is home to a variety of wildlife, including bald eagles, ospreys, and mule deer. The area is also a major source of hydroelectric power for the region. The population of Flaming Gorge is relatively small, with only a few hundred people living in the area. The majority of the population is made up of Native Americans, primarily members of the Ute Tribe.
Common Questions
What is Per Capita Income in Flaming Gorge?
Per Capita income in Flaming Gorge is $26,367.
What is the Median Family Income in Flaming Gorge?
Median Family Income in Flaming Gorge is $105,000.
What is the Median Household income in Flaming Gorge?
Median Household Income in Flaming Gorge is $35,833.
What is Inequality or Gini Index in Flaming Gorge?
Inequality or Gini Index in Flaming Gorge is 0.46.
What is the Total Population of Flaming Gorge?
Total Population of Flaming Gorge is 69.
What is the Total Male Population of Flaming Gorge?
Total Male Population of Flaming Gorge is 31.
What is the Total Female Population of Flaming Gorge?
Total Female Population of Flaming Gorge is 38.
What is the Ratio of Males per 100 Females in Flaming Gorge?
There are 81.58 Males per 100 Females in Flaming Gorge.
What is the Ratio of Females per 100 Males in Flaming Gorge?
There are 122.58 Females per 100 Males in Flaming Gorge.
What is the Median Population Age in Flaming Gorge?
Median Population Age in Flaming Gorge is 45.3 Years.
What is the Average Family Size in Flaming Gorge
Average Family Size in Flaming Gorge is 3.6 People.
What is the Average Household Size in Flaming Gorge
Average Household Size in Flaming Gorge is 2.5 People.
How Large is the Labor Force in Flaming Gorge?
There are 33 People in the Labor Forcein in Flaming Gorge.
What is the Percentage of People in the Labor Force in Flaming Gorge?
70.2% of People are in the Labor Force in Flaming Gorge.