Francis, UT Map & Demographics
Francis Map
Francis Overview
$43,909
PER CAPITA INCOME
$121,250
AVG FAMILY INCOME
$104,013
AVG HOUSEHOLD INCOME
36.4%
WAGE / INCOME GAP [ % ]
63.6¢/ $1
WAGE / INCOME GAP [ $ ]
0.39
INEQUALITY / GINI INDEX
1,573
TOTAL POPULATION
865
MALE POPULATION
708
FEMALE POPULATION
122.18
MALES / 100 FEMALES
81.85
FEMALES / 100 MALES
39.0
MEDIAN AGE
4.1
AVG FAMILY SIZE
3.4
AVG HOUSEHOLD SIZE
870
LABOR FORCE [ PEOPLE ]
69.9%
PERCENT IN LABOR FORCE
Francis Area Codes
Income in Francis
Income Overview in Francis
Per Capita Income in Francis is $43,909, while median incomes of families and households are $121,250 and $104,013 respectively.
| Characteristic | Number | Measure |
| Per Capita Income | 1,573 | $43,909 |
| Median Family Income | 350 | $121,250 |
| Mean Family Income | 350 | $145,657 |
| Median Household Income | 459 | $104,013 |
| Mean Household Income | 459 | $129,416 |
| Income Deficit | 350 | $0 |
| Wage / Income Gap (%) | 1,573 | 36.44% |
| Wage / Income Gap ($) | 1,573 | 63.56¢ per $1 |
| Gini / Inequality Index | 1,573 | 0.39 |
Earnings by Sex in Francis
Average Earnings in Francis are $40,815, $51,131 for men and $32,500 for women, a difference of 36.4%.
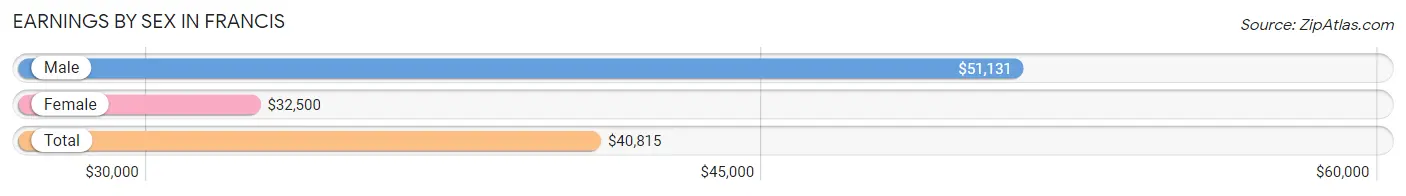
| Sex | Number | Average Earnings |
| Male | 551 (59.1%) | $51,131 |
| Female | 382 (40.9%) | $32,500 |
| Total | 933 (100.0%) | $40,815 |
Earnings by Sex by Income Bracket in Francis
The most common earnings brackets in Francis are $100,000+ for men (122 | 22.1%) and $30,000 to $34,999 for women (56 | 14.7%).
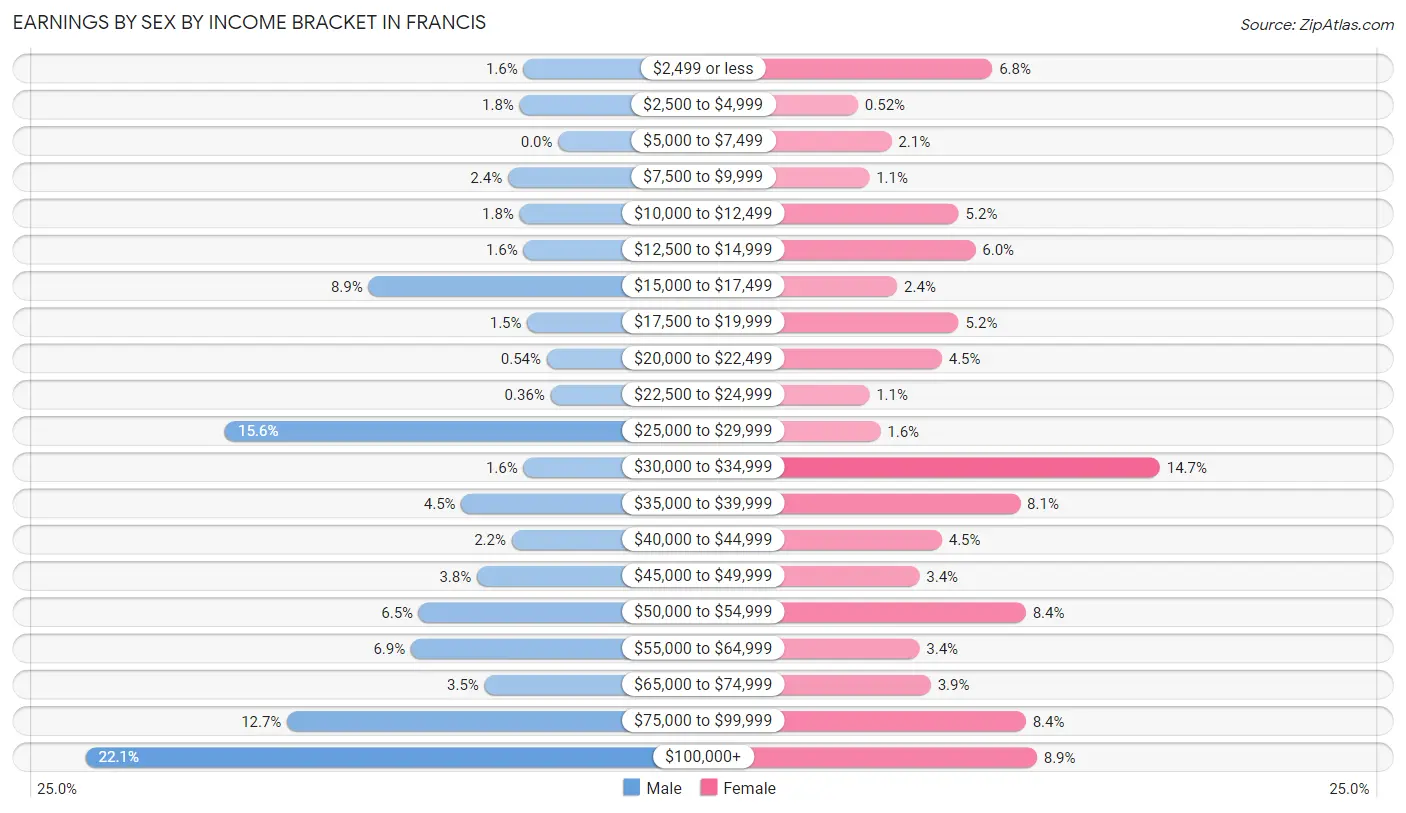
| Income | Male | Female |
| $2,499 or less | 9 (1.6%) | 26 (6.8%) |
| $2,500 to $4,999 | 10 (1.8%) | 2 (0.5%) |
| $5,000 to $7,499 | 0 (0.0%) | 8 (2.1%) |
| $7,500 to $9,999 | 13 (2.4%) | 4 (1.1%) |
| $10,000 to $12,499 | 10 (1.8%) | 20 (5.2%) |
| $12,500 to $14,999 | 9 (1.6%) | 23 (6.0%) |
| $15,000 to $17,499 | 49 (8.9%) | 9 (2.4%) |
| $17,500 to $19,999 | 8 (1.5%) | 20 (5.2%) |
| $20,000 to $22,499 | 3 (0.5%) | 17 (4.4%) |
| $22,500 to $24,999 | 2 (0.4%) | 4 (1.1%) |
| $25,000 to $29,999 | 86 (15.6%) | 6 (1.6%) |
| $30,000 to $34,999 | 9 (1.6%) | 56 (14.7%) |
| $35,000 to $39,999 | 25 (4.5%) | 31 (8.1%) |
| $40,000 to $44,999 | 12 (2.2%) | 17 (4.4%) |
| $45,000 to $49,999 | 21 (3.8%) | 13 (3.4%) |
| $50,000 to $54,999 | 36 (6.5%) | 32 (8.4%) |
| $55,000 to $64,999 | 38 (6.9%) | 13 (3.4%) |
| $65,000 to $74,999 | 19 (3.5%) | 15 (3.9%) |
| $75,000 to $99,999 | 70 (12.7%) | 32 (8.4%) |
| $100,000+ | 122 (22.1%) | 34 (8.9%) |
| Total | 551 (100.0%) | 382 (100.0%) |
Earnings by Sex by Educational Attainment in Francis
Average earnings in Francis are $55,438 for men and $39,141 for women, a difference of 29.4%. Men with an educational attainment of graduate degree enjoy the highest average annual earnings of $138,125, while those with less than high school education earn the least with $42,500. Women with an educational attainment of graduate degree earn the most with the average annual earnings of $50,089, while those with high school diploma education have the smallest earnings of $23,438.
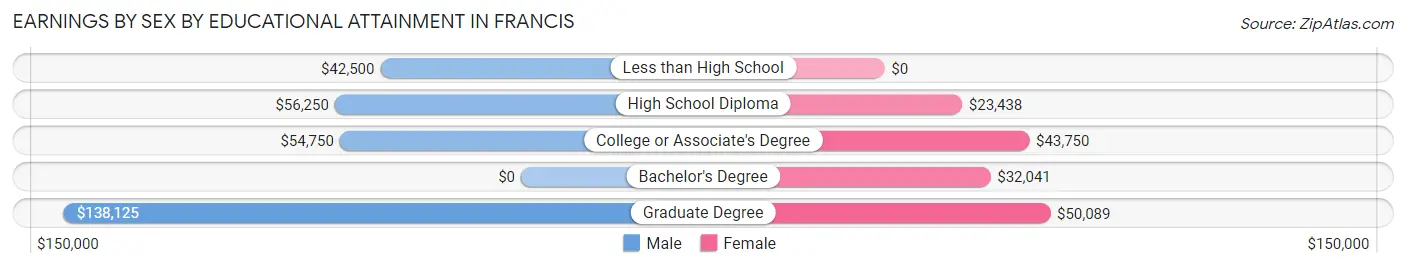
| Educational Attainment | Male Income | Female Income |
| Less than High School | $42,500 | $0 |
| High School Diploma | $56,250 | $23,438 |
| College or Associate's Degree | $54,750 | $43,750 |
| Bachelor's Degree | - | - |
| Graduate Degree | $138,125 | $50,089 |
| Total | $55,438 | $39,141 |
Family Income in Francis
Family Income Brackets in Francis
According to the Francis family income data, there are 106 families falling into the $100,000 to $149,999 income range, which is the most common income bracket and makes up 30.3% of all families.
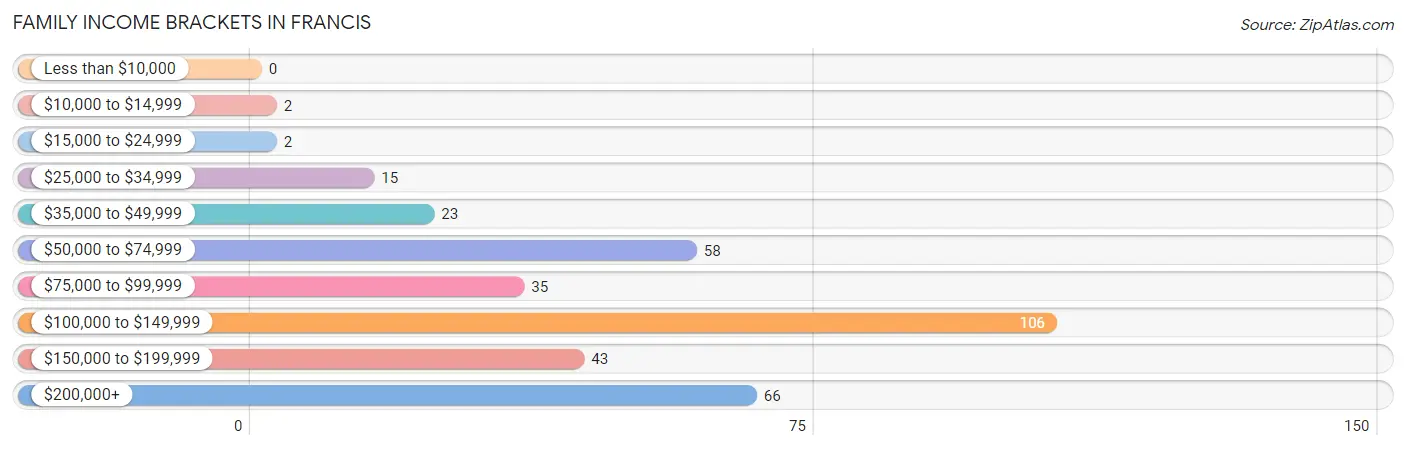
| Income Bracket | # Families | % Families |
| Less than $10,000 | 0 | 0.0% |
| $10,000 to $14,999 | 2 | 0.6% |
| $15,000 to $24,999 | 2 | 0.6% |
| $25,000 to $34,999 | 15 | 4.3% |
| $35,000 to $49,999 | 23 | 6.6% |
| $50,000 to $74,999 | 58 | 16.6% |
| $75,000 to $99,999 | 35 | 10.0% |
| $100,000 to $149,999 | 106 | 30.3% |
| $150,000 to $199,999 | 43 | 12.3% |
| $200,000+ | 66 | 18.9% |
Family Income by Famaliy Size in Francis
6-person families (14 | 4.0%) account for the highest median family income in Francis with $165,000 per family, while 3-person families (90 | 25.7%) have the highest median income of $43,519 per family member.
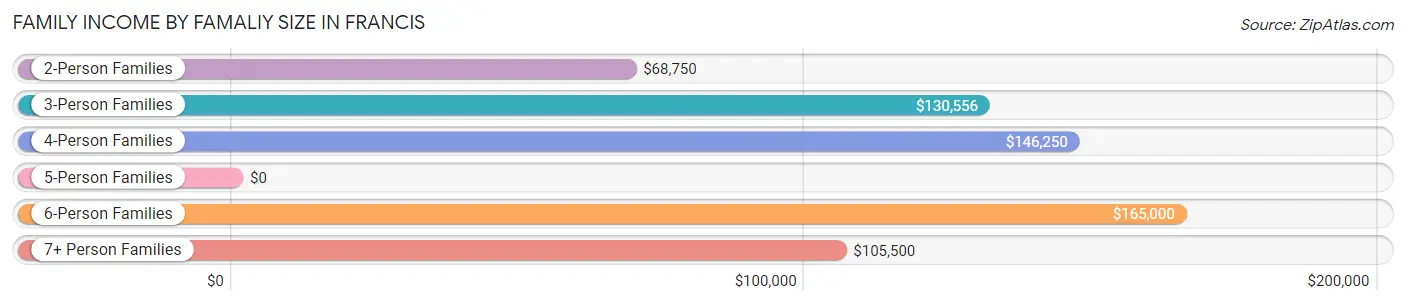
| Income Bracket | # Families | Median Income |
| 2-Person Families | 132 (37.7%) | $68,750 |
| 3-Person Families | 90 (25.7%) | $130,556 |
| 4-Person Families | 84 (24.0%) | $146,250 |
| 5-Person Families | 20 (5.7%) | $0 |
| 6-Person Families | 14 (4.0%) | $165,000 |
| 7+ Person Families | 10 (2.9%) | $105,500 |
| Total | 350 (100.0%) | $121,250 |
Family Income by Number of Earners in Francis
The median family income in Francis is $121,250, with families comprising 3+ earners (80) having the highest median family income of $184,167, while families with no earners (38) have the lowest median family income of $53,750, accounting for 22.9% and 10.9% of families, respectively.
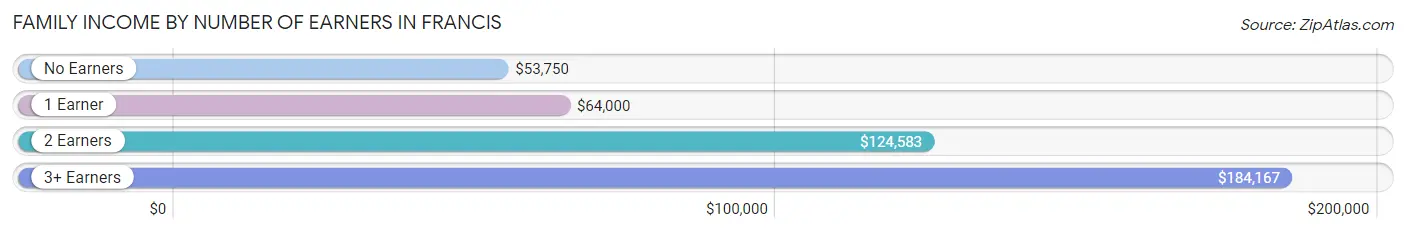
| Number of Earners | # Families | Median Income |
| No Earners | 38 (10.9%) | $53,750 |
| 1 Earner | 84 (24.0%) | $64,000 |
| 2 Earners | 148 (42.3%) | $124,583 |
| 3+ Earners | 80 (22.9%) | $184,167 |
| Total | 350 (100.0%) | $121,250 |
Household Income in Francis
Household Income Brackets in Francis
With 128 households falling in the category, the $100,000 to $149,999 income range is the most frequent in Francis, accounting for 27.9% of all households.
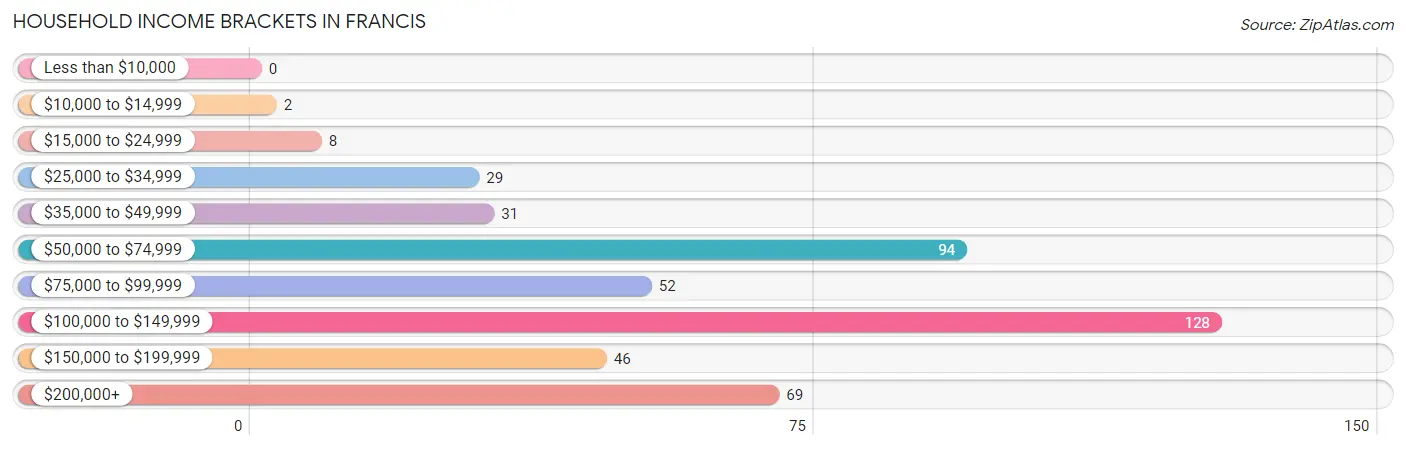
| Income Bracket | # Households | % Households |
| Less than $10,000 | 0 | 0.0% |
| $10,000 to $14,999 | 2 | 0.4% |
| $15,000 to $24,999 | 8 | 1.7% |
| $25,000 to $34,999 | 29 | 6.3% |
| $35,000 to $49,999 | 31 | 6.8% |
| $50,000 to $74,999 | 94 | 20.5% |
| $75,000 to $99,999 | 52 | 11.3% |
| $100,000 to $149,999 | 128 | 27.9% |
| $150,000 to $199,999 | 46 | 10.0% |
| $200,000+ | 69 | 15.0% |
Household Income by Householder Age in Francis
The median household income in Francis is $104,013, with the highest median household income of $136,607 found in the 45 to 64 years age bracket for the primary householder. A total of 219 households (47.7%) fall into this category. Meanwhile, the 15 to 24 years age bracket for the primary householder has the lowest median household income of $0, with 6 households (1.3%) in this group.
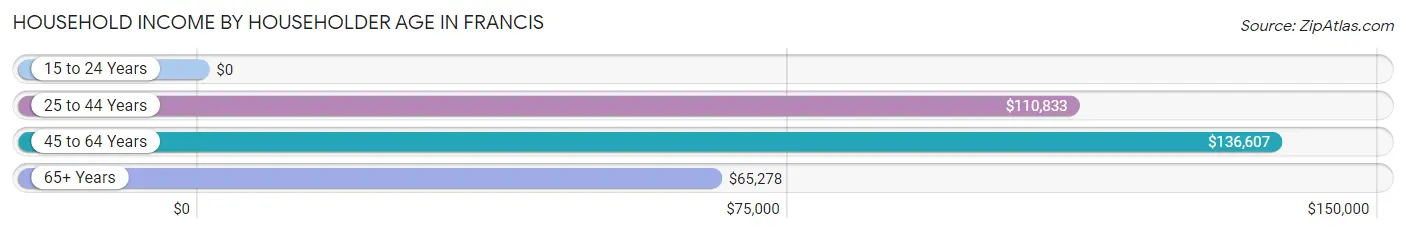
| Income Bracket | # Households | Median Income |
| 15 to 24 Years | 6 (1.3%) | $0 |
| 25 to 44 Years | 130 (28.3%) | $110,833 |
| 45 to 64 Years | 219 (47.7%) | $136,607 |
| 65+ Years | 104 (22.7%) | $65,278 |
| Total | 459 (100.0%) | $104,013 |
Poverty in Francis
Income Below Poverty by Sex and Age in Francis
With 1.7% poverty level for males and 3.3% for females among the residents of Francis, under 5 year old males and 25 to 34 year old females are the most vulnerable to poverty, with 4 males (9.8%) and 9 females (11.8%) in their respective age groups living below the poverty level.
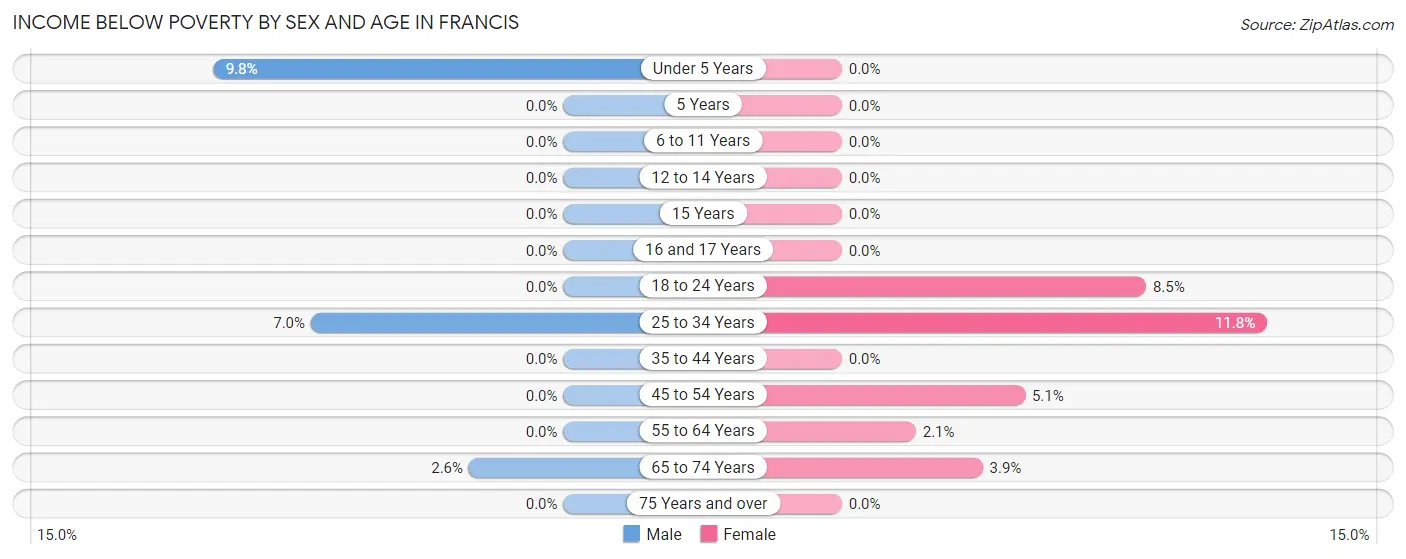
| Age Bracket | Male | Female |
| Under 5 Years | 4 (9.8%) | 0 (0.0%) |
| 5 Years | 0 (0.0%) | 0 (0.0%) |
| 6 to 11 Years | 0 (0.0%) | 0 (0.0%) |
| 12 to 14 Years | 0 (0.0%) | 0 (0.0%) |
| 15 Years | 0 (0.0%) | 0 (0.0%) |
| 16 and 17 Years | 0 (0.0%) | 0 (0.0%) |
| 18 to 24 Years | 0 (0.0%) | 5 (8.5%) |
| 25 to 34 Years | 9 (7.0%) | 9 (11.8%) |
| 35 to 44 Years | 0 (0.0%) | 0 (0.0%) |
| 45 to 54 Years | 0 (0.0%) | 5 (5.1%) |
| 55 to 64 Years | 0 (0.0%) | 2 (2.1%) |
| 65 to 74 Years | 2 (2.6%) | 2 (3.9%) |
| 75 Years and over | 0 (0.0%) | 0 (0.0%) |
| Total | 15 (1.7%) | 23 (3.3%) |
Income Above Poverty by Sex and Age in Francis
According to the poverty statistics in Francis, males aged 5 years and females aged under 5 years are the age groups that are most secure financially, with 100.0% of males and 100.0% of females in these age groups living above the poverty line.
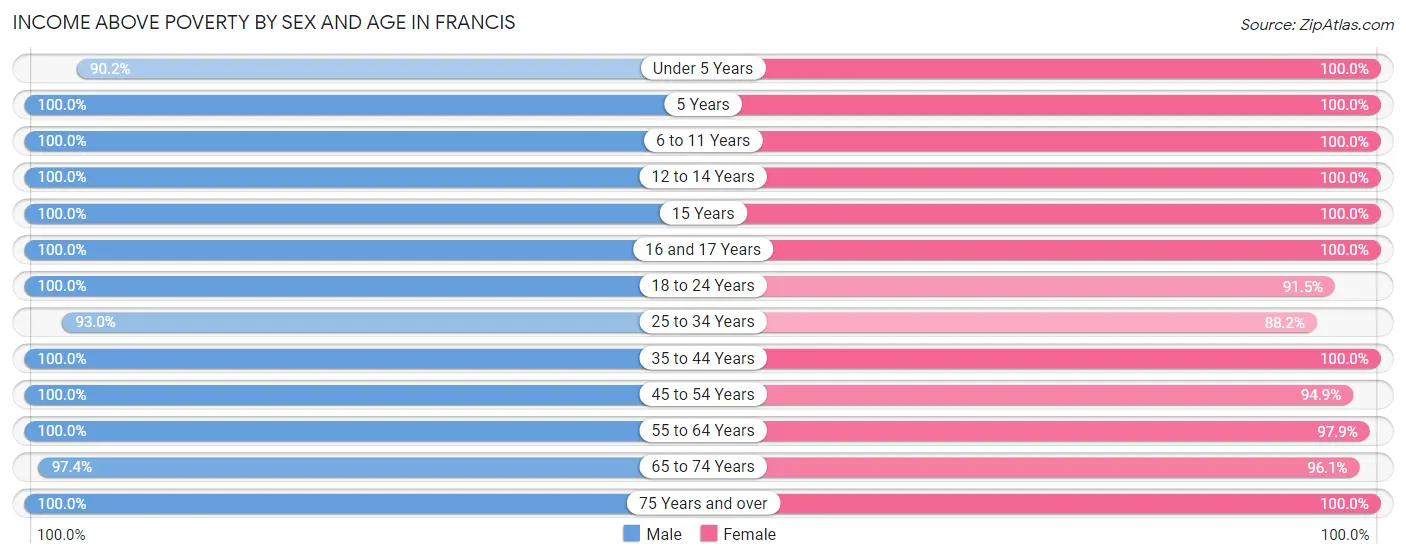
| Age Bracket | Male | Female |
| Under 5 Years | 37 (90.2%) | 24 (100.0%) |
| 5 Years | 2 (100.0%) | 16 (100.0%) |
| 6 to 11 Years | 79 (100.0%) | 83 (100.0%) |
| 12 to 14 Years | 34 (100.0%) | 18 (100.0%) |
| 15 Years | 17 (100.0%) | 15 (100.0%) |
| 16 and 17 Years | 50 (100.0%) | 23 (100.0%) |
| 18 to 24 Years | 58 (100.0%) | 54 (91.5%) |
| 25 to 34 Years | 119 (93.0%) | 67 (88.2%) |
| 35 to 44 Years | 143 (100.0%) | 93 (100.0%) |
| 45 to 54 Years | 96 (100.0%) | 93 (94.9%) |
| 55 to 64 Years | 120 (100.0%) | 95 (97.9%) |
| 65 to 74 Years | 74 (97.4%) | 49 (96.1%) |
| 75 Years and over | 21 (100.0%) | 55 (100.0%) |
| Total | 850 (98.3%) | 685 (96.8%) |
Income Below Poverty Among Married-Couple Families in Francis
The poverty statistics for married-couple families in Francis show that 0.6% or 2 of the total 311 families live below the poverty line. Families with no children have the highest poverty rate of 1.1%, comprising of 2 families. On the other hand, families with 1 or 2 children have the lowest poverty rate of 0.0%, which includes 0 families.
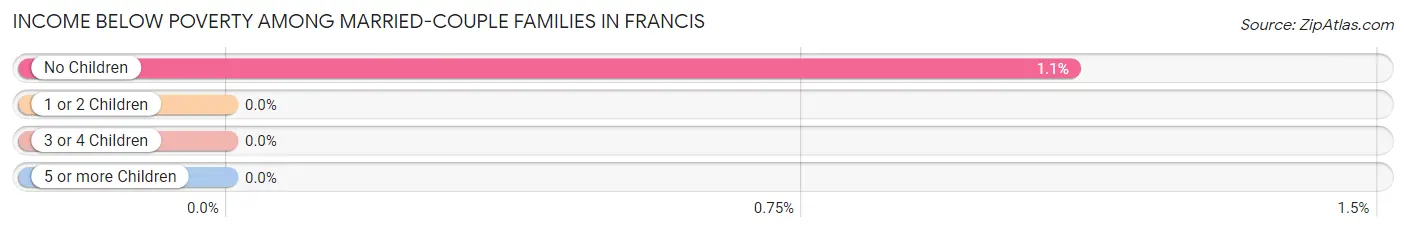
| Children | Above Poverty | Below Poverty |
| No Children | 179 (98.9%) | 2 (1.1%) |
| 1 or 2 Children | 94 (100.0%) | 0 (0.0%) |
| 3 or 4 Children | 29 (100.0%) | 0 (0.0%) |
| 5 or more Children | 7 (100.0%) | 0 (0.0%) |
| Total | 309 (99.4%) | 2 (0.6%) |
Income Below Poverty Among Single-Parent Households in Francis
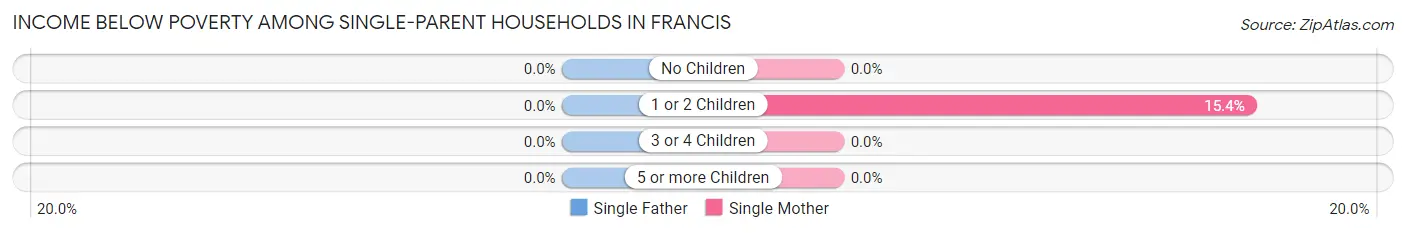
| Children | Single Father | Single Mother |
| No Children | 0 (0.0%) | 0 (0.0%) |
| 1 or 2 Children | 0 (0.0%) | 4 (15.4%) |
| 3 or 4 Children | 0 (0.0%) | 0 (0.0%) |
| 5 or more Children | 0 (0.0%) | 0 (0.0%) |
| Total | 0 (0.0%) | 4 (14.3%) |
Income Below Poverty Among Married-Couple vs Single-Parent Households in Francis
The poverty data for Francis shows that 2 of the married-couple family households (0.6%) and 4 of the single-parent households (10.3%) are living below the poverty level. Within the married-couple family households, those with no children have the highest poverty rate, with 2 households (1.1%) falling below the poverty line. Among the single-parent households, those with 1 or 2 children have the highest poverty rate, with 4 household (14.3%) living below poverty.
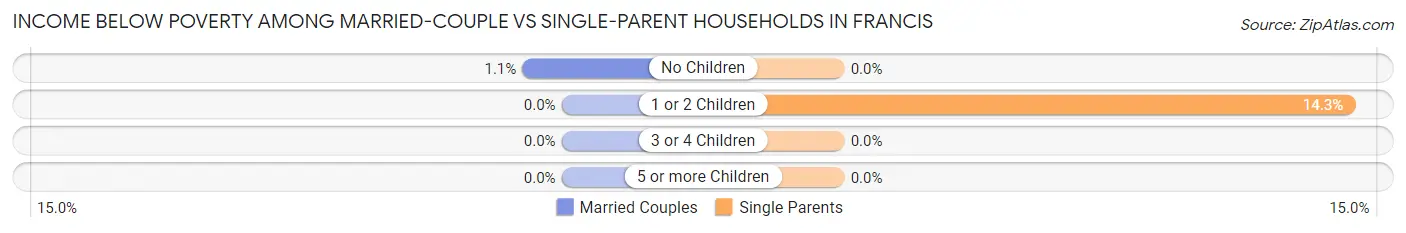
| Children | Married-Couple Families | Single-Parent Households |
| No Children | 2 (1.1%) | 0 (0.0%) |
| 1 or 2 Children | 0 (0.0%) | 4 (14.3%) |
| 3 or 4 Children | 0 (0.0%) | 0 (0.0%) |
| 5 or more Children | 0 (0.0%) | 0 (0.0%) |
| Total | 2 (0.6%) | 4 (10.3%) |
Race in Francis
The most populous races in Francis are White / Caucasian (1,468 | 93.3%), Hispanic or Latino (100 | 6.4%), and Two or more Races (49 | 3.1%).
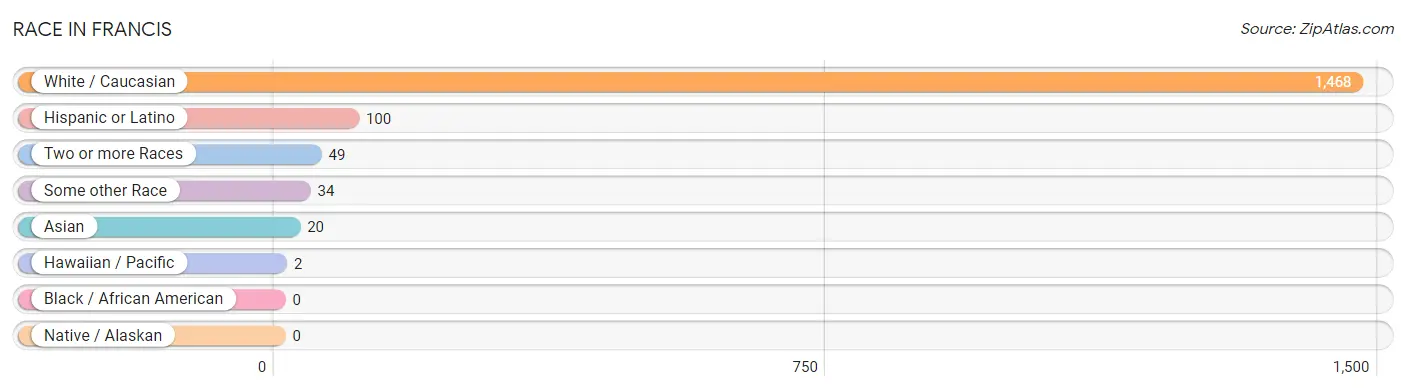
| Race | # Population | % Population |
| Asian | 20 | 1.3% |
| Black / African American | 0 | 0.0% |
| Hawaiian / Pacific | 2 | 0.1% |
| Hispanic or Latino | 100 | 6.4% |
| Native / Alaskan | 0 | 0.0% |
| White / Caucasian | 1,468 | 93.3% |
| Two or more Races | 49 | 3.1% |
| Some other Race | 34 | 2.2% |
| Total | 1,573 | 100.0% |
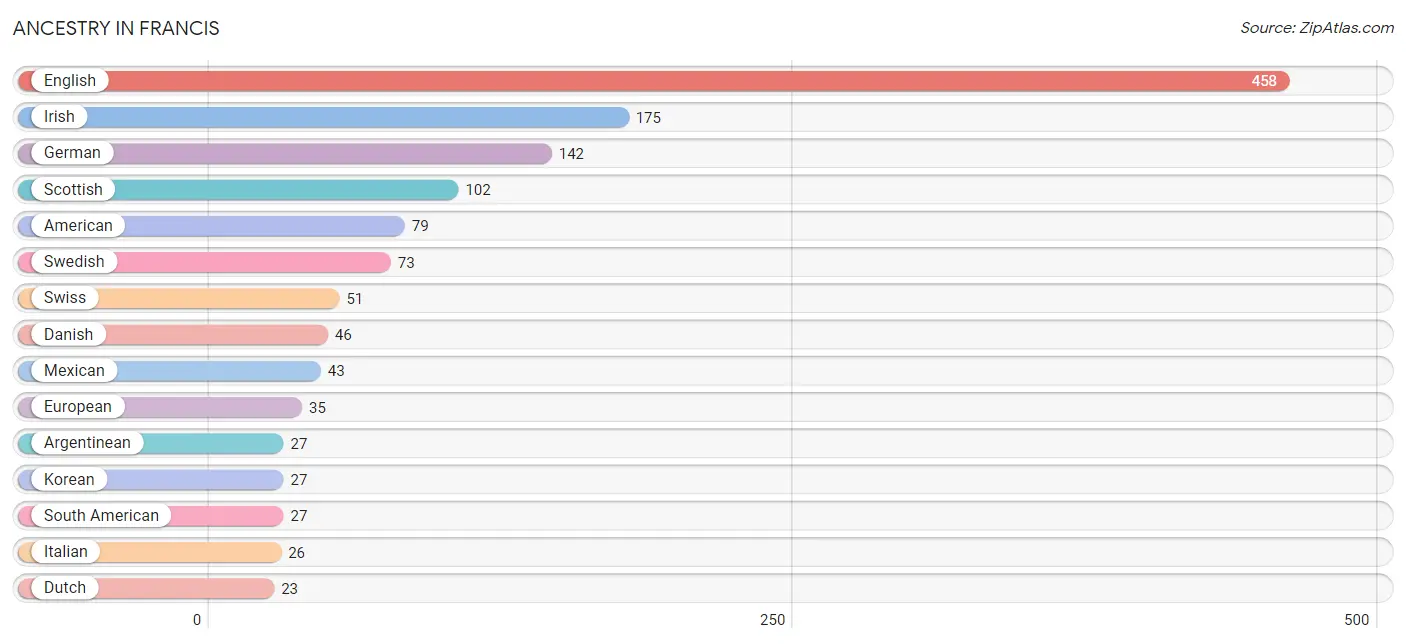
Ancestry in Francis
The most populous ancestries reported in Francis are English (458 | 29.1%), Irish (175 | 11.1%), German (142 | 9.0%), Scottish (102 | 6.5%), and American (79 | 5.0%), together accounting for 60.8% of all Francis residents.
| Ancestry | # Population | % Population |
| American | 79 | 5.0% |
| Arab | 7 | 0.4% |
| Argentinean | 27 | 1.7% |
| Austrian | 2 | 0.1% |
| Bhutanese | 5 | 0.3% |
| British | 2 | 0.1% |
| Central American | 4 | 0.3% |
| Czechoslovakian | 3 | 0.2% |
| Danish | 46 | 2.9% |
| Dutch | 23 | 1.5% |
| Eastern European | 2 | 0.1% |
| English | 458 | 29.1% |
| European | 35 | 2.2% |
| French | 22 | 1.4% |
| French Canadian | 2 | 0.1% |
| German | 142 | 9.0% |
| Greek | 2 | 0.1% |
| Guatemalan | 4 | 0.3% |
| Inupiat | 3 | 0.2% |
| Iranian | 3 | 0.2% |
| Irish | 175 | 11.1% |
| Iroquois | 3 | 0.2% |
| Italian | 26 | 1.7% |
| Korean | 27 | 1.7% |
| Lebanese | 5 | 0.3% |
| Mexican | 43 | 2.7% |
| Moroccan | 2 | 0.1% |
| Norwegian | 20 | 1.3% |
| Polish | 4 | 0.3% |
| Puerto Rican | 17 | 1.1% |
| Samoan | 2 | 0.1% |
| Scandinavian | 9 | 0.6% |
| Scotch-Irish | 13 | 0.8% |
| Scottish | 102 | 6.5% |
| Serbian | 1 | 0.1% |
| Slavic | 8 | 0.5% |
| Slovene | 8 | 0.5% |
| South American | 27 | 1.7% |
| Spaniard | 2 | 0.1% |
| Spanish | 4 | 0.3% |
| Spanish American | 3 | 0.2% |
| Sri Lankan | 2 | 0.1% |
| Swedish | 73 | 4.6% |
| Swiss | 51 | 3.2% |
| Tongan | 2 | 0.1% |
| Welsh | 5 | 0.3% | View All 46 Rows |
Immigrants in Francis
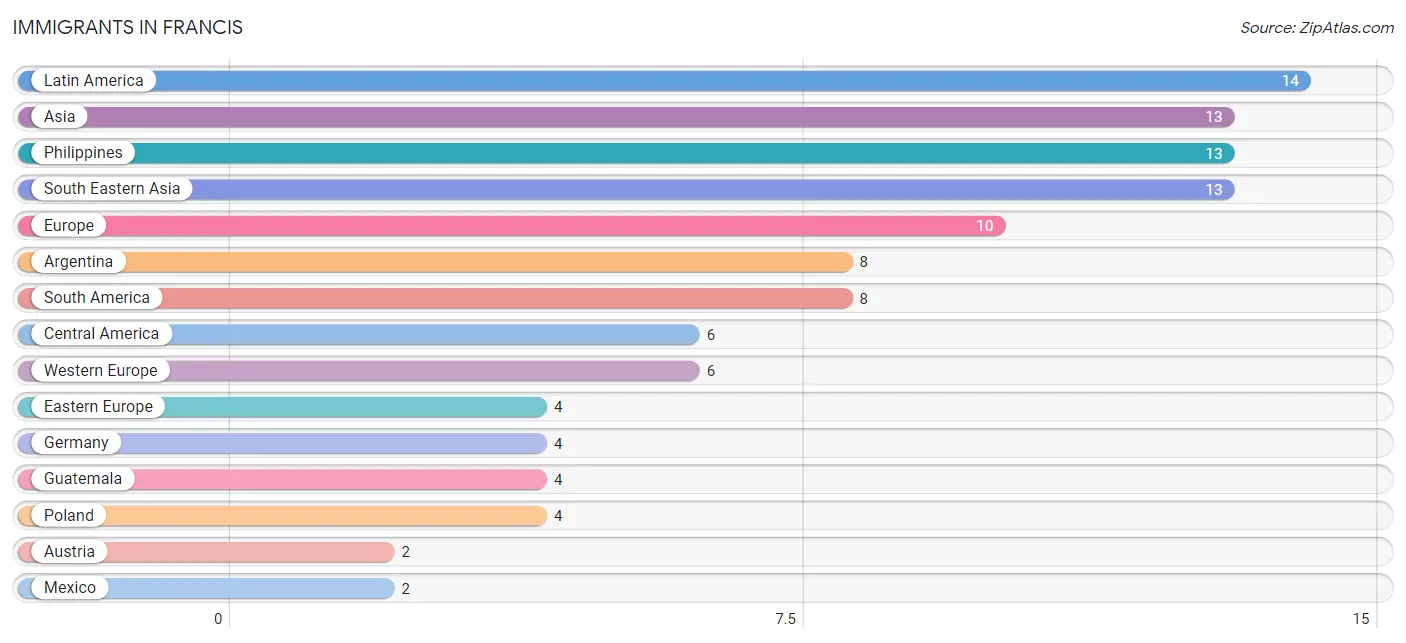
The most numerous immigrant groups reported in Francis came from Latin America (14 | 0.9%), Asia (13 | 0.8%), Philippines (13 | 0.8%), South Eastern Asia (13 | 0.8%), and Europe (10 | 0.6%), together accounting for 4.0% of all Francis residents.
| Immigration Origin | # Population | % Population |
| Argentina | 8 | 0.5% |
| Asia | 13 | 0.8% |
| Austria | 2 | 0.1% |
| Central America | 6 | 0.4% |
| Eastern Europe | 4 | 0.3% |
| Europe | 10 | 0.6% |
| Germany | 4 | 0.3% |
| Guatemala | 4 | 0.3% |
| Latin America | 14 | 0.9% |
| Mexico | 2 | 0.1% |
| Oceania | 2 | 0.1% |
| Philippines | 13 | 0.8% |
| Poland | 4 | 0.3% |
| South America | 8 | 0.5% |
| South Eastern Asia | 13 | 0.8% |
| Western Europe | 6 | 0.4% | View All 16 Rows |
Sex and Age in Francis
Sex and Age in Francis
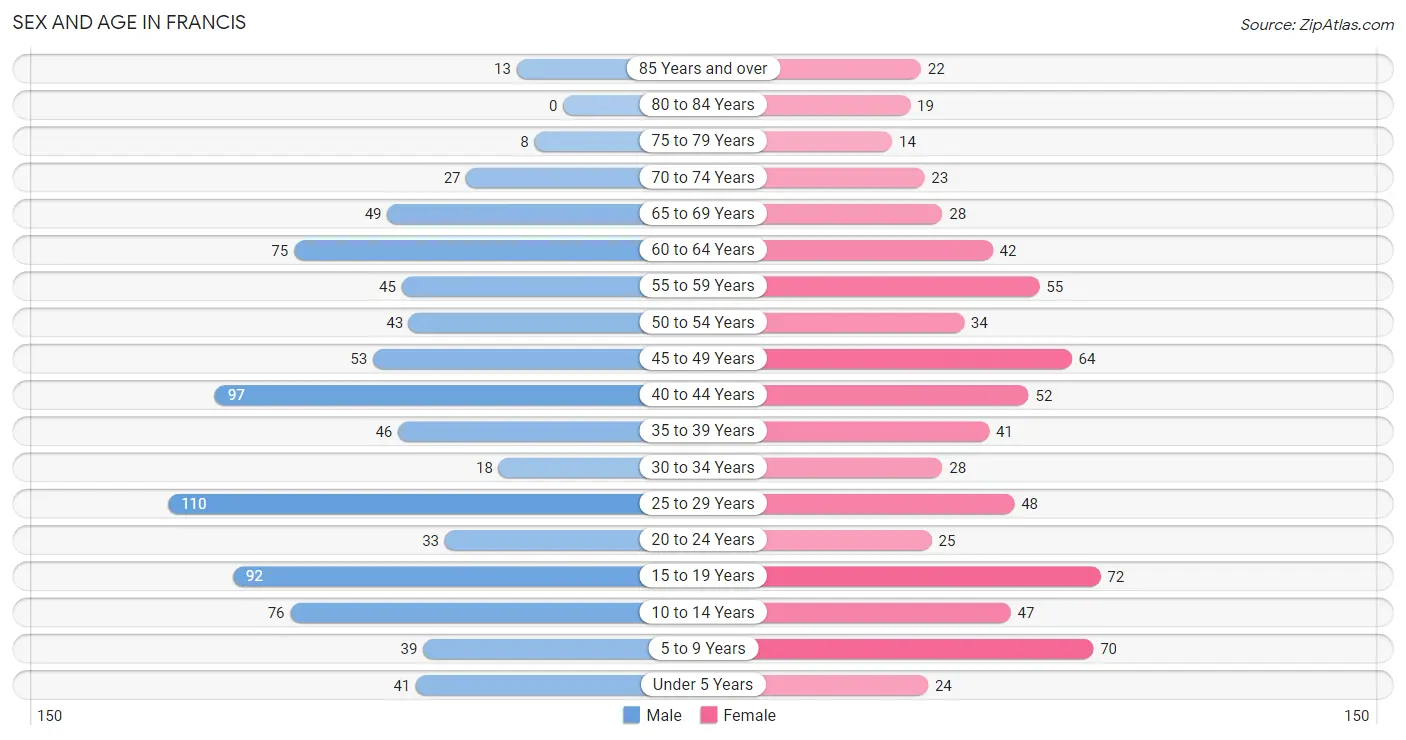
The most populous age groups in Francis are 25 to 29 Years (110 | 12.7%) for men and 15 to 19 Years (72 | 10.2%) for women.
| Age Bracket | Male | Female |
| Under 5 Years | 41 (4.7%) | 24 (3.4%) |
| 5 to 9 Years | 39 (4.5%) | 70 (9.9%) |
| 10 to 14 Years | 76 (8.8%) | 47 (6.6%) |
| 15 to 19 Years | 92 (10.6%) | 72 (10.2%) |
| 20 to 24 Years | 33 (3.8%) | 25 (3.5%) |
| 25 to 29 Years | 110 (12.7%) | 48 (6.8%) |
| 30 to 34 Years | 18 (2.1%) | 28 (4.0%) |
| 35 to 39 Years | 46 (5.3%) | 41 (5.8%) |
| 40 to 44 Years | 97 (11.2%) | 52 (7.3%) |
| 45 to 49 Years | 53 (6.1%) | 64 (9.0%) |
| 50 to 54 Years | 43 (5.0%) | 34 (4.8%) |
| 55 to 59 Years | 45 (5.2%) | 55 (7.8%) |
| 60 to 64 Years | 75 (8.7%) | 42 (5.9%) |
| 65 to 69 Years | 49 (5.7%) | 28 (4.0%) |
| 70 to 74 Years | 27 (3.1%) | 23 (3.3%) |
| 75 to 79 Years | 8 (0.9%) | 14 (2.0%) |
| 80 to 84 Years | 0 (0.0%) | 19 (2.7%) |
| 85 Years and over | 13 (1.5%) | 22 (3.1%) |
| Total | 865 (100.0%) | 708 (100.0%) |
Families and Households in Francis
Median Family Size in Francis
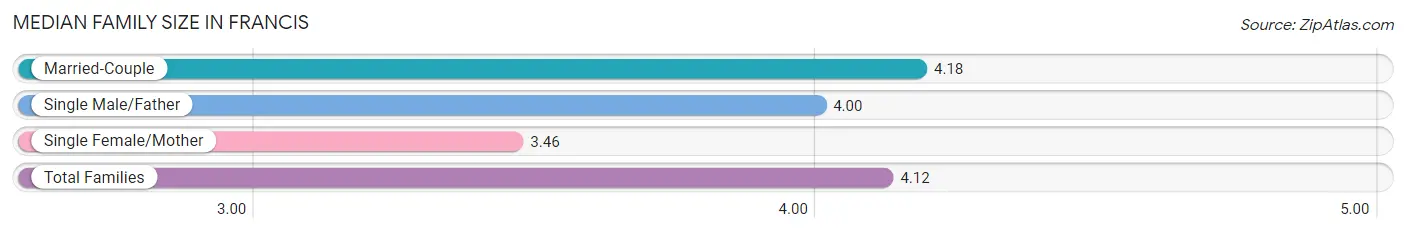
The median family size in Francis is 4.12 persons per family, with married-couple families (311 | 88.9%) accounting for the largest median family size of 4.18 persons per family. On the other hand, single female/mother families (28 | 8.0%) represent the smallest median family size with 3.46 persons per family.
| Family Type | # Families | Family Size |
| Married-Couple | 311 (88.9%) | 4.18 |
| Single Male/Father | 11 (3.1%) | 4.00 |
| Single Female/Mother | 28 (8.0%) | 3.46 |
| Total Families | 350 (100.0%) | 4.12 |
Median Household Size in Francis
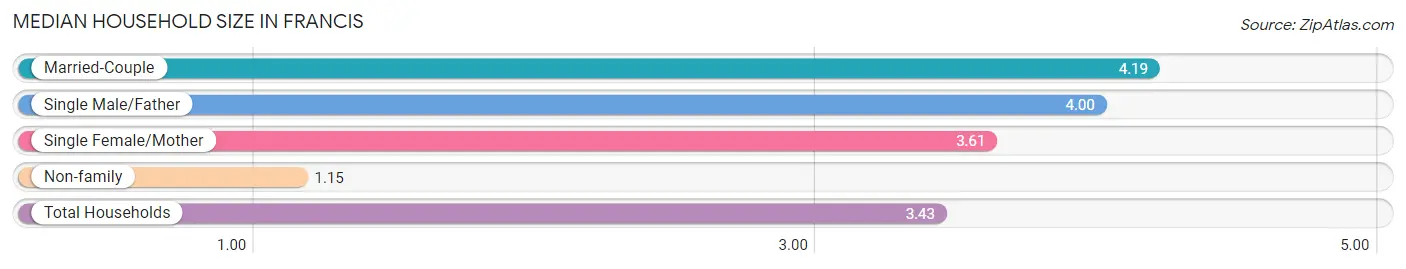
The median household size in Francis is 3.43 persons per household, with married-couple households (311 | 67.8%) accounting for the largest median household size of 4.19 persons per household. non-family households (109 | 23.7%) represent the smallest median household size with 1.15 persons per household.
| Household Type | # Households | Household Size |
| Married-Couple | 311 (67.8%) | 4.19 |
| Single Male/Father | 11 (2.4%) | 4.00 |
| Single Female/Mother | 28 (6.1%) | 3.61 |
| Non-family | 109 (23.7%) | 1.15 |
| Total Households | 459 (100.0%) | 3.43 |
Household Size by Marriage Status in Francis
Out of a total of 459 households in Francis, 350 (76.2%) are family households, while 109 (23.7%) are nonfamily households. The most numerous type of family households are 2-person households, comprising 127, and the most common type of nonfamily households are 1-person households, comprising 98.
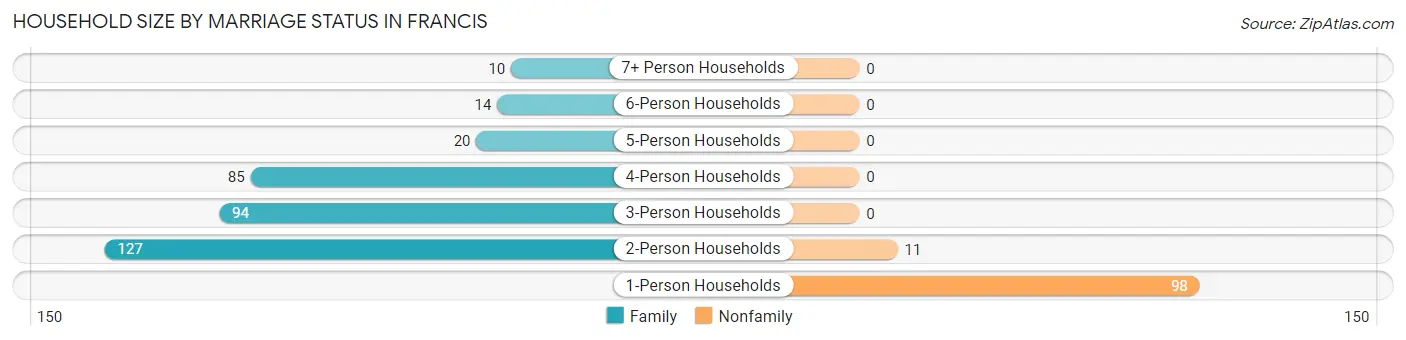
| Household Size | Family Households | Nonfamily Households |
| 1-Person Households | - | 98 (21.3%) |
| 2-Person Households | 127 (27.7%) | 11 (2.4%) |
| 3-Person Households | 94 (20.5%) | 0 (0.0%) |
| 4-Person Households | 85 (18.5%) | 0 (0.0%) |
| 5-Person Households | 20 (4.4%) | 0 (0.0%) |
| 6-Person Households | 14 (3.0%) | 0 (0.0%) |
| 7+ Person Households | 10 (2.2%) | 0 (0.0%) |
| Total | 350 (76.2%) | 109 (23.7%) |
Female Fertility in Francis
Fertility by Age in Francis
Average fertility rate in Francis is 20.0 births per 1,000 women. Women in the age bracket of 35 to 50 years have the highest fertility rate with 34.0 births per 1,000 women. Women in the age bracket of 35 to 50 years acount for 85.7% of all women with births.
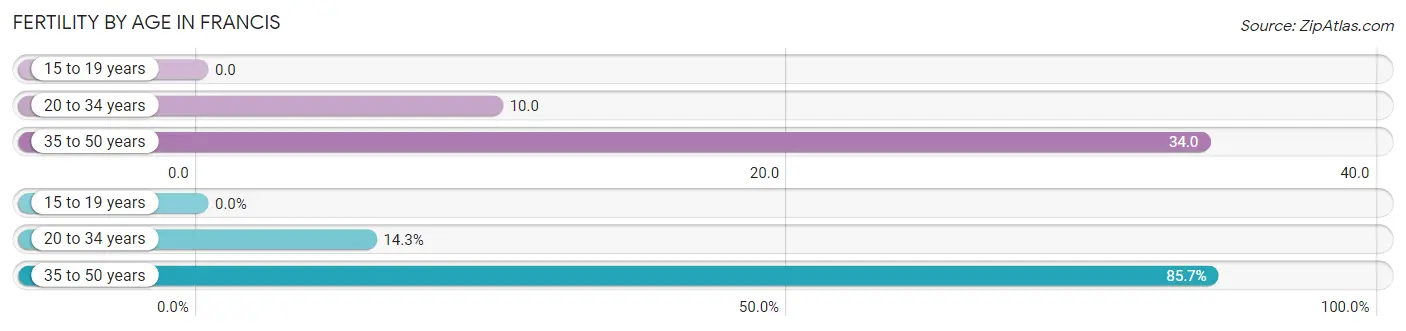
| Age Bracket | Women with Births | Births / 1,000 Women |
| 15 to 19 years | 0 (0.0%) | 0.0 |
| 20 to 34 years | 1 (14.3%) | 10.0 |
| 35 to 50 years | 6 (85.7%) | 34.0 |
| Total | 7 (100.0%) | 20.0 |
Fertility by Age by Marriage Status in Francis
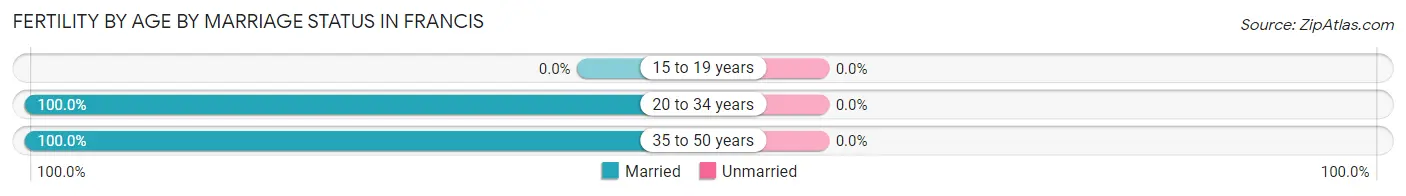
| Age Bracket | Married | Unmarried |
| 15 to 19 years | 0 (0.0%) | 0 (0.0%) |
| 20 to 34 years | 1 (100.0%) | 0 (0.0%) |
| 35 to 50 years | 6 (100.0%) | 0 (0.0%) |
| Total | 7 (100.0%) | 0 (0.0%) |
Fertility by Education in Francis
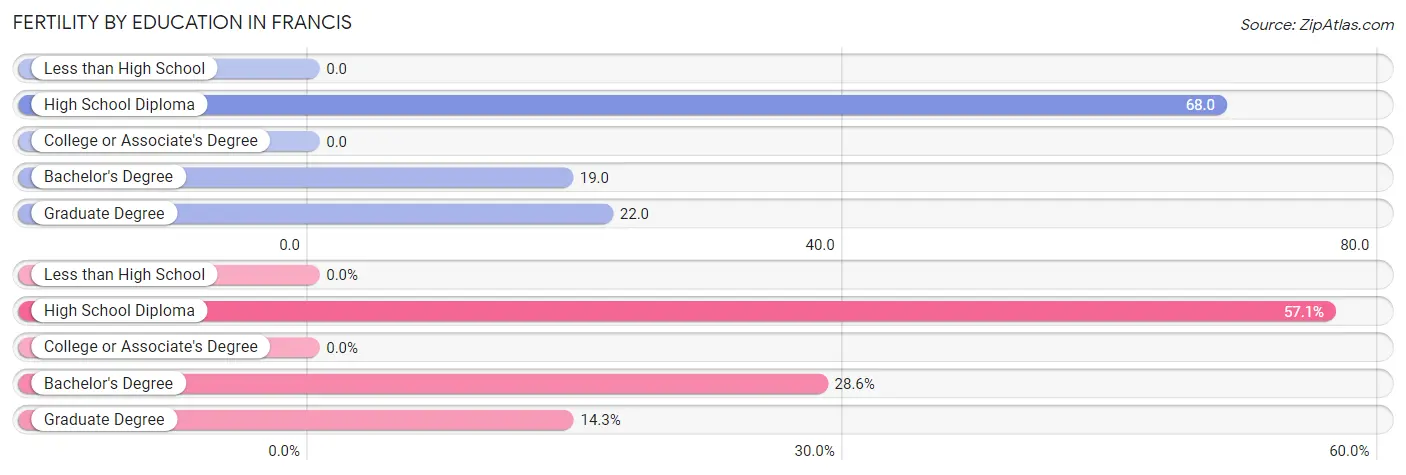
| Educational Attainment | Women with Births | Births / 1,000 Women |
| Less than High School | 0 (0.0%) | 0.0 |
| High School Diploma | 4 (57.1%) | 68.0 |
| College or Associate's Degree | 0 (0.0%) | 0.0 |
| Bachelor's Degree | 2 (28.6%) | 19.0 |
| Graduate Degree | 1 (14.3%) | 22.0 |
| Total | 7 (100.0%) | 20.0 |
Fertility by Education by Marriage Status in Francis
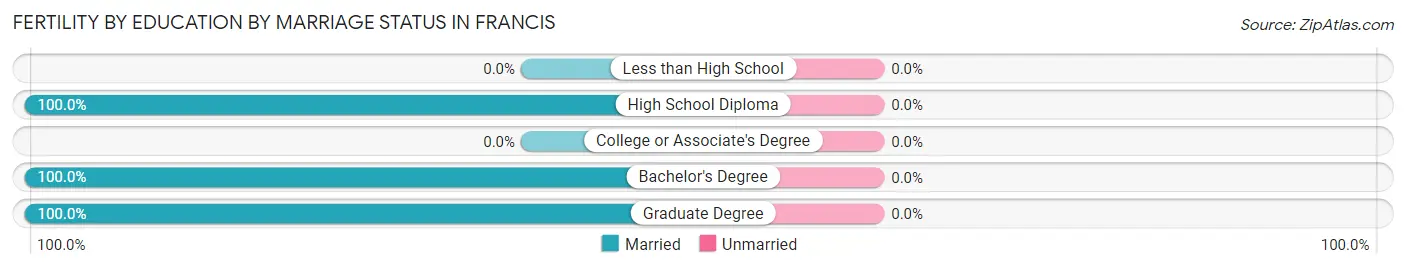
| Educational Attainment | Married | Unmarried |
| Less than High School | 0 (0.0%) | 0 (0.0%) |
| High School Diploma | 4 (100.0%) | 0 (0.0%) |
| College or Associate's Degree | 0 (0.0%) | 0 (0.0%) |
| Bachelor's Degree | 2 (100.0%) | 0 (0.0%) |
| Graduate Degree | 1 (100.0%) | 0 (0.0%) |
| Total | 7 (100.0%) | 0 (0.0%) |
Employment Characteristics in Francis
Employment by Class of Employer in Francis
Among the 858 employed individuals in Francis, private company employees (609 | 71.0%), self-employed (incorporated) (71 | 8.3%), and local government employees (59 | 6.9%) make up the most common classes of employment.
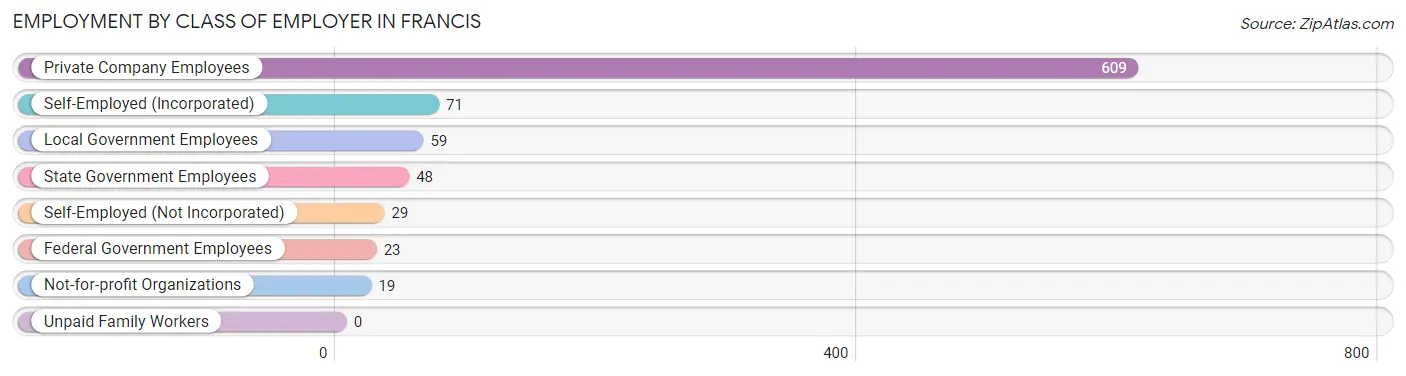
| Employer Class | # Employees | % Employees |
| Private Company Employees | 609 | 71.0% |
| Self-Employed (Incorporated) | 71 | 8.3% |
| Self-Employed (Not Incorporated) | 29 | 3.4% |
| Not-for-profit Organizations | 19 | 2.2% |
| Local Government Employees | 59 | 6.9% |
| State Government Employees | 48 | 5.6% |
| Federal Government Employees | 23 | 2.7% |
| Unpaid Family Workers | 0 | 0.0% |
| Total | 858 | 100.0% |
Employment Status by Age in Francis
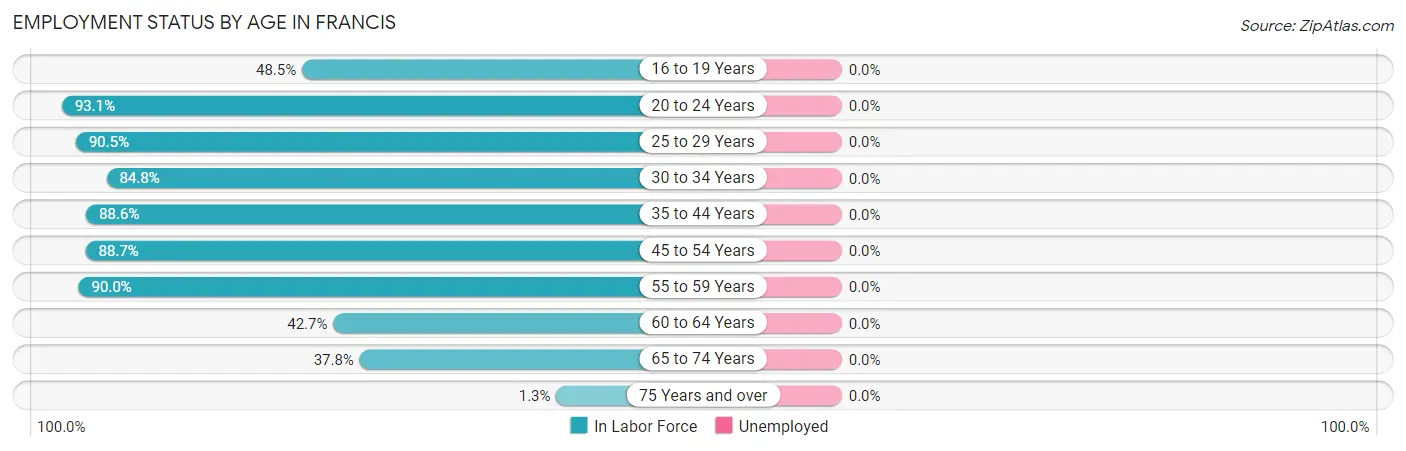
| Age Bracket | In Labor Force | Unemployed |
| 16 to 19 Years | 64 (48.5%) | 0 (0.0%) |
| 20 to 24 Years | 54 (93.1%) | 0 (0.0%) |
| 25 to 29 Years | 143 (90.5%) | 0 (0.0%) |
| 30 to 34 Years | 39 (84.8%) | 0 (0.0%) |
| 35 to 44 Years | 209 (88.6%) | 0 (0.0%) |
| 45 to 54 Years | 172 (88.7%) | 0 (0.0%) |
| 55 to 59 Years | 90 (90.0%) | 0 (0.0%) |
| 60 to 64 Years | 50 (42.7%) | 0 (0.0%) |
| 65 to 74 Years | 48 (37.8%) | 0 (0.0%) |
| 75 Years and over | 1 (1.3%) | 0 (0.0%) |
| Total | 870 (69.9%) | 0 (0.0%) |
Employment Status by Educational Attainment in Francis
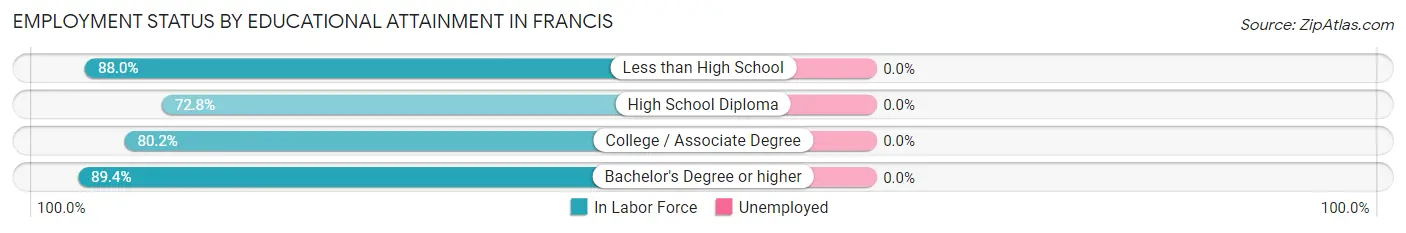
| Educational Attainment | In Labor Force | Unemployed |
| Less than High School | 22 (88.0%) | 0 (0.0%) |
| High School Diploma | 150 (72.8%) | 0 (0.0%) |
| College / Associate Degree | 202 (80.2%) | 0 (0.0%) |
| Bachelor's Degree or higher | 329 (89.4%) | 0 (0.0%) |
| Total | 703 (82.6%) | 0 (0.0%) |
Employment Occupations by Sex in Francis
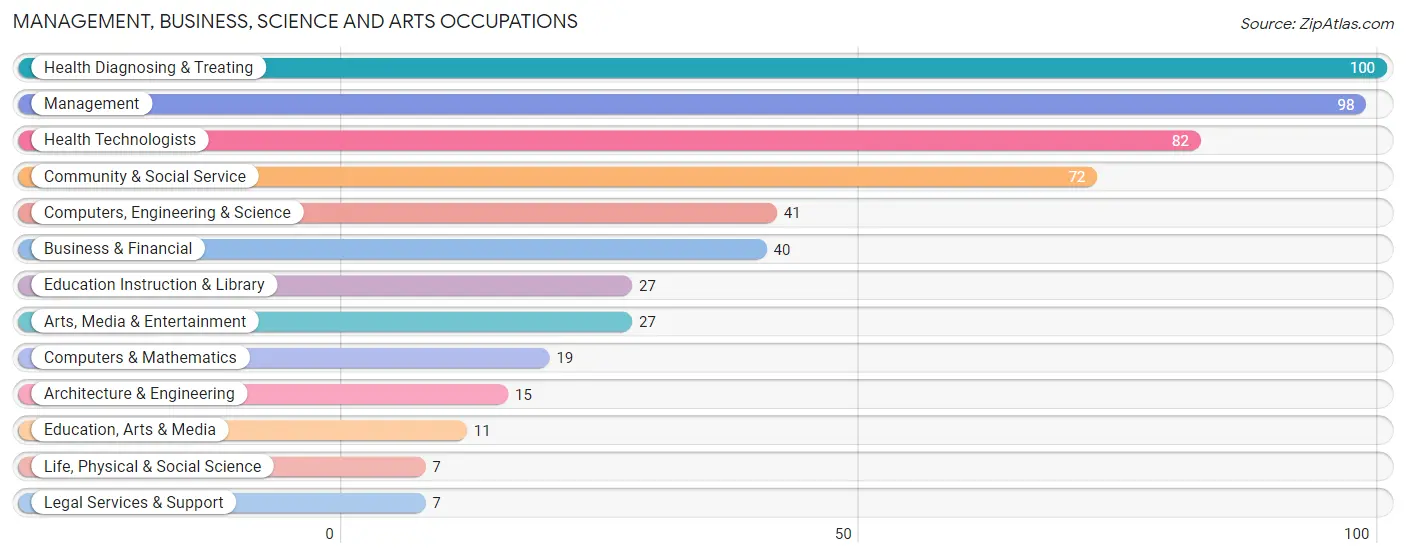
Management, Business, Science and Arts Occupations
The most common Management, Business, Science and Arts occupations in Francis are Health Diagnosing & Treating (100 | 11.5%), Management (98 | 11.3%), Health Technologists (82 | 9.4%), Community & Social Service (72 | 8.3%), and Computers, Engineering & Science (41 | 4.7%).
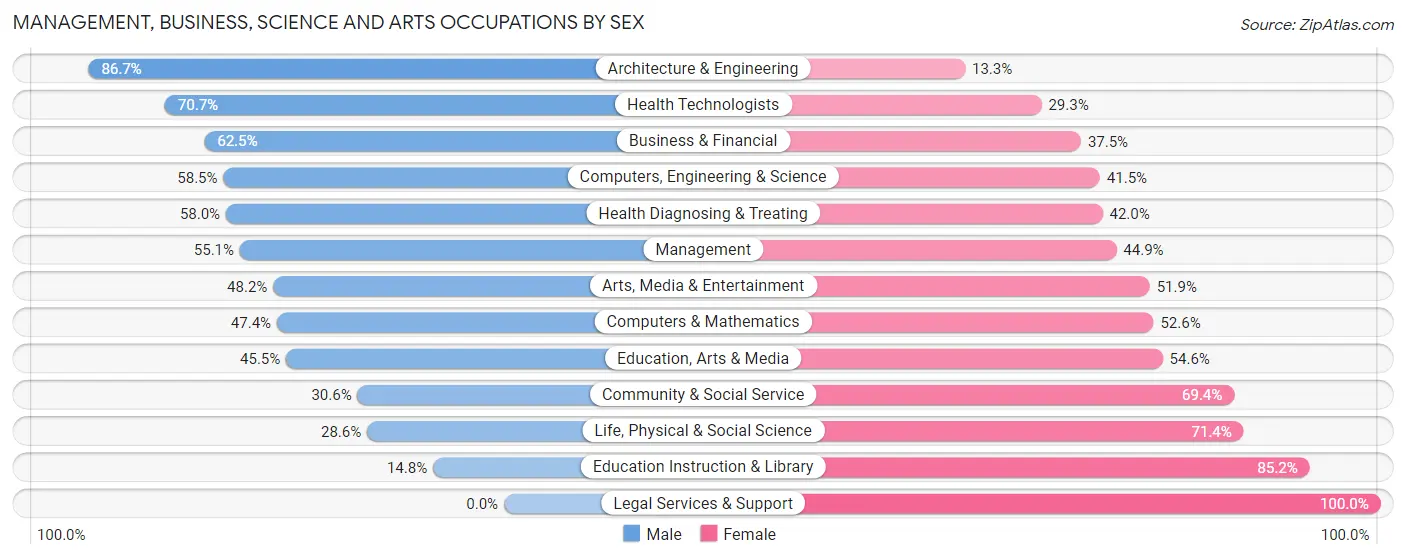
Management, Business, Science and Arts Occupations by Sex
Within the Management, Business, Science and Arts occupations in Francis, the most male-oriented occupations are Architecture & Engineering (86.7%), Health Technologists (70.7%), and Business & Financial (62.5%), while the most female-oriented occupations are Legal Services & Support (100.0%), Education Instruction & Library (85.2%), and Life, Physical & Social Science (71.4%).
| Occupation | Male | Female |
| Management | 54 (55.1%) | 44 (44.9%) |
| Business & Financial | 25 (62.5%) | 15 (37.5%) |
| Computers, Engineering & Science | 24 (58.5%) | 17 (41.5%) |
| Computers & Mathematics | 9 (47.4%) | 10 (52.6%) |
| Architecture & Engineering | 13 (86.7%) | 2 (13.3%) |
| Life, Physical & Social Science | 2 (28.6%) | 5 (71.4%) |
| Community & Social Service | 22 (30.6%) | 50 (69.4%) |
| Education, Arts & Media | 5 (45.5%) | 6 (54.5%) |
| Legal Services & Support | 0 (0.0%) | 7 (100.0%) |
| Education Instruction & Library | 4 (14.8%) | 23 (85.2%) |
| Arts, Media & Entertainment | 13 (48.1%) | 14 (51.8%) |
| Health Diagnosing & Treating | 58 (58.0%) | 42 (42.0%) |
| Health Technologists | 58 (70.7%) | 24 (29.3%) |
| Total (Category) | 183 (52.1%) | 168 (47.9%) |
| Total (Overall) | 522 (60.0%) | 348 (40.0%) |
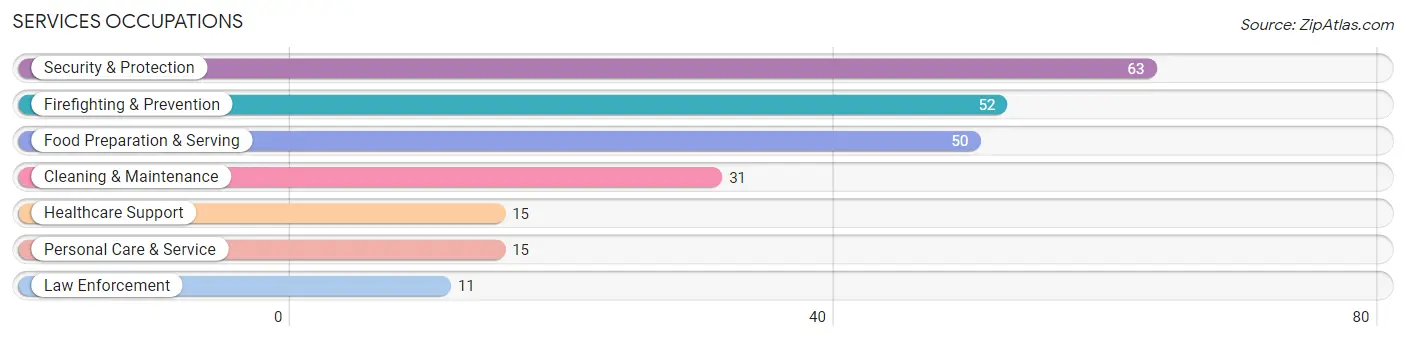
Services Occupations
The most common Services occupations in Francis are Security & Protection (63 | 7.2%), Firefighting & Prevention (52 | 6.0%), Food Preparation & Serving (50 | 5.8%), Cleaning & Maintenance (31 | 3.6%), and Healthcare Support (15 | 1.7%).
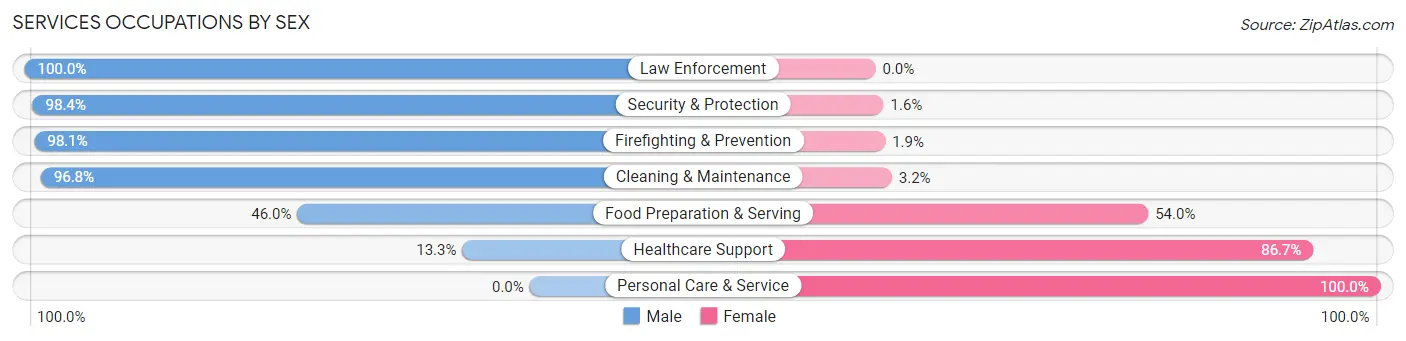
Services Occupations by Sex
Within the Services occupations in Francis, the most male-oriented occupations are Law Enforcement (100.0%), Security & Protection (98.4%), and Firefighting & Prevention (98.1%), while the most female-oriented occupations are Personal Care & Service (100.0%), Healthcare Support (86.7%), and Food Preparation & Serving (54.0%).
| Occupation | Male | Female |
| Healthcare Support | 2 (13.3%) | 13 (86.7%) |
| Security & Protection | 62 (98.4%) | 1 (1.6%) |
| Firefighting & Prevention | 51 (98.1%) | 1 (1.9%) |
| Law Enforcement | 11 (100.0%) | 0 (0.0%) |
| Food Preparation & Serving | 23 (46.0%) | 27 (54.0%) |
| Cleaning & Maintenance | 30 (96.8%) | 1 (3.2%) |
| Personal Care & Service | 0 (0.0%) | 15 (100.0%) |
| Total (Category) | 117 (67.2%) | 57 (32.8%) |
| Total (Overall) | 522 (60.0%) | 348 (40.0%) |
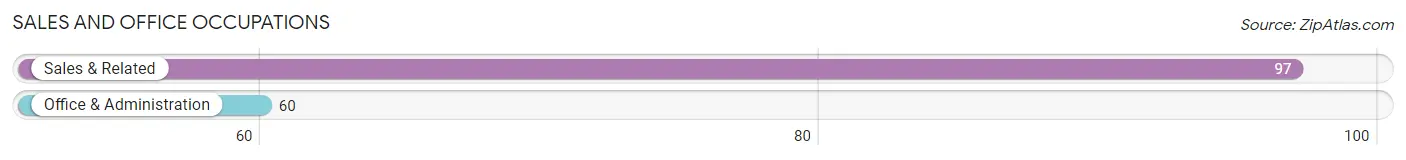
Sales and Office Occupations
The most common Sales and Office occupations in Francis are Sales & Related (97 | 11.2%), and Office & Administration (60 | 6.9%).
Sales and Office Occupations by Sex
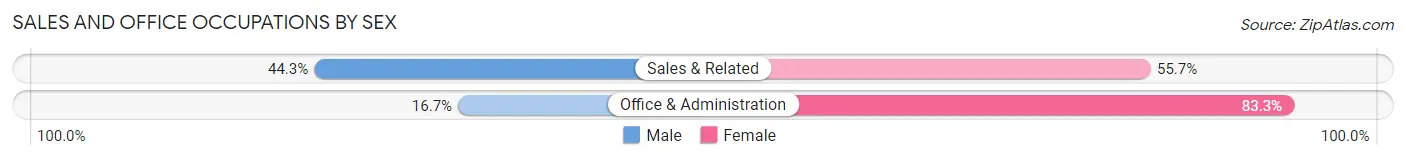
| Occupation | Male | Female |
| Sales & Related | 43 (44.3%) | 54 (55.7%) |
| Office & Administration | 10 (16.7%) | 50 (83.3%) |
| Total (Category) | 53 (33.8%) | 104 (66.2%) |
| Total (Overall) | 522 (60.0%) | 348 (40.0%) |
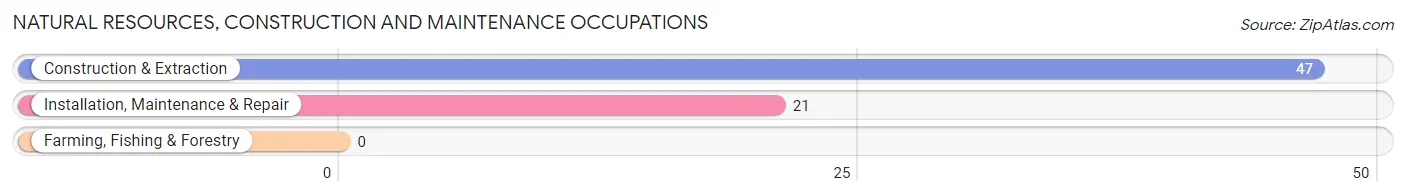
Natural Resources, Construction and Maintenance Occupations
The most common Natural Resources, Construction and Maintenance occupations in Francis are Construction & Extraction (47 | 5.4%), and Installation, Maintenance & Repair (21 | 2.4%).
Natural Resources, Construction and Maintenance Occupations by Sex
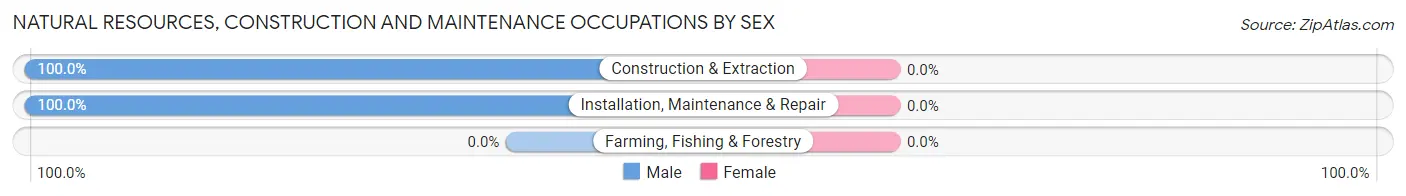
| Occupation | Male | Female |
| Farming, Fishing & Forestry | 0 (0.0%) | 0 (0.0%) |
| Construction & Extraction | 47 (100.0%) | 0 (0.0%) |
| Installation, Maintenance & Repair | 21 (100.0%) | 0 (0.0%) |
| Total (Category) | 68 (100.0%) | 0 (0.0%) |
| Total (Overall) | 522 (60.0%) | 348 (40.0%) |
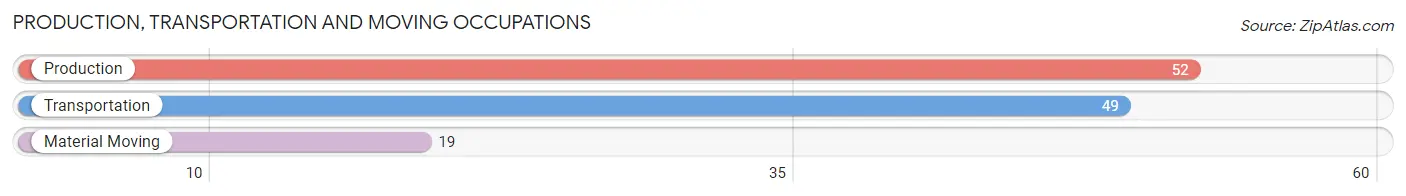
Production, Transportation and Moving Occupations
The most common Production, Transportation and Moving occupations in Francis are Production (52 | 6.0%), Transportation (49 | 5.6%), and Material Moving (19 | 2.2%).
Production, Transportation and Moving Occupations by Sex
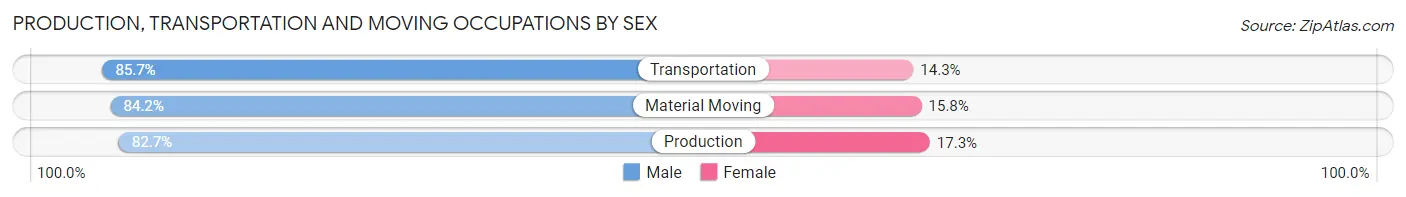
| Occupation | Male | Female |
| Production | 43 (82.7%) | 9 (17.3%) |
| Transportation | 42 (85.7%) | 7 (14.3%) |
| Material Moving | 16 (84.2%) | 3 (15.8%) |
| Total (Category) | 101 (84.2%) | 19 (15.8%) |
| Total (Overall) | 522 (60.0%) | 348 (40.0%) |
Employment Industries by Sex in Francis
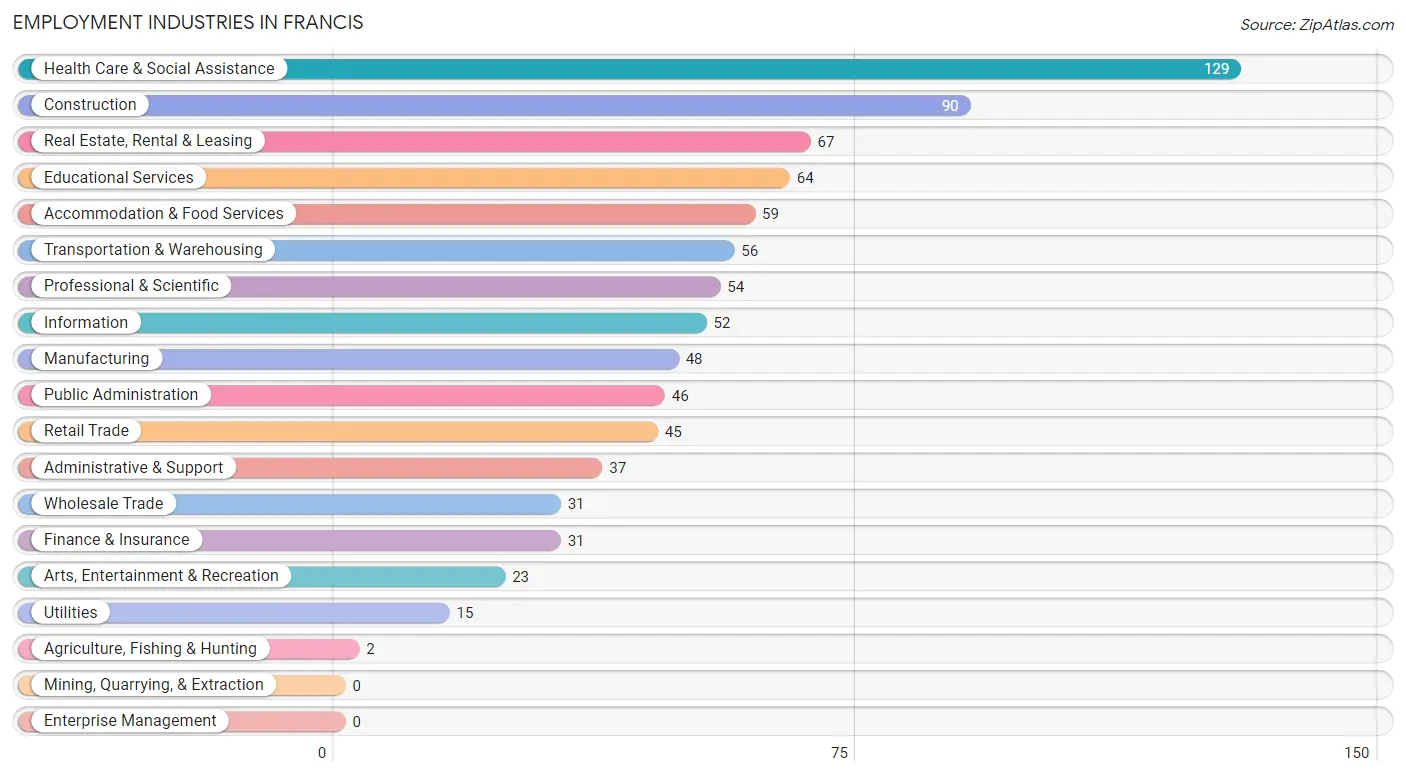
Employment Industries in Francis
The major employment industries in Francis include Health Care & Social Assistance (129 | 14.8%), Construction (90 | 10.3%), Real Estate, Rental & Leasing (67 | 7.7%), Educational Services (64 | 7.4%), and Accommodation & Food Services (59 | 6.8%).
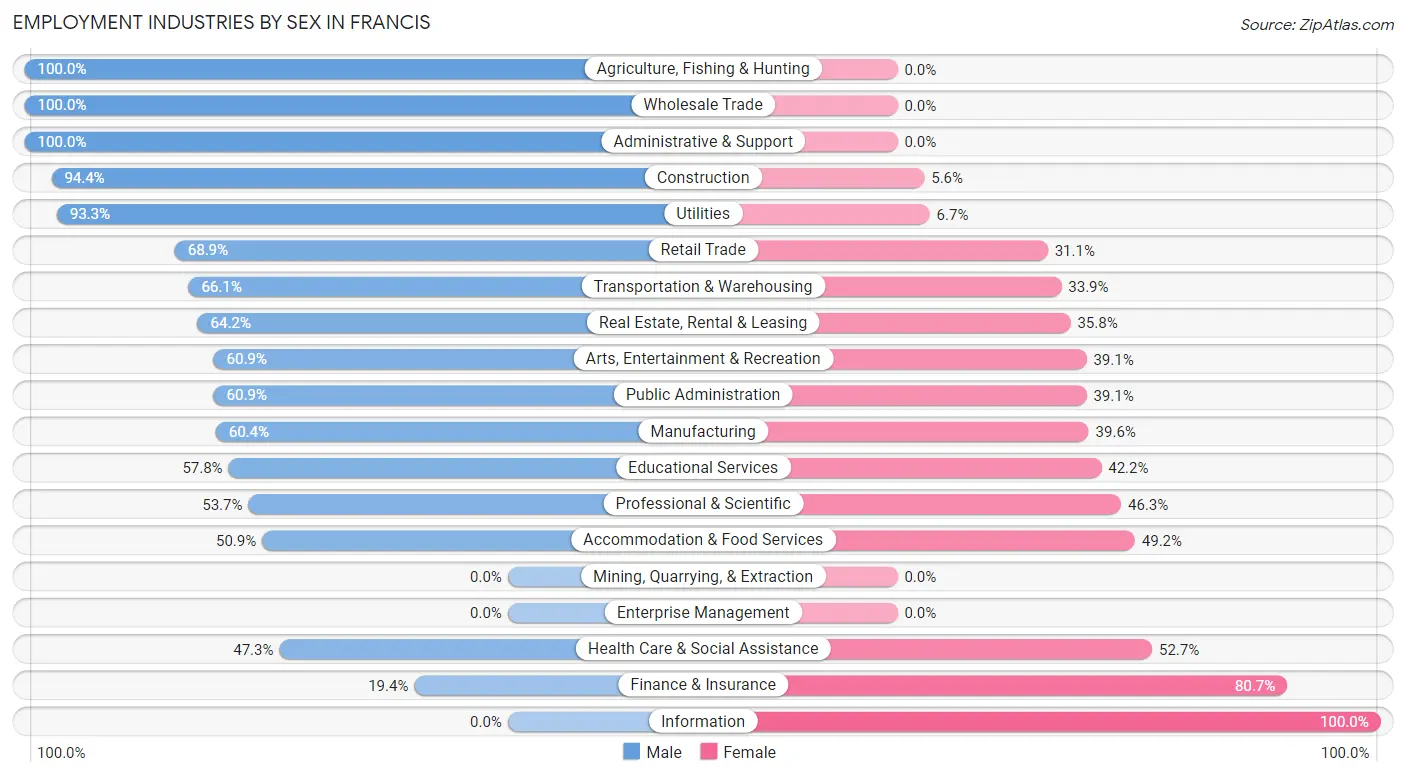
Employment Industries by Sex in Francis
The Francis industries that see more men than women are Agriculture, Fishing & Hunting (100.0%), Wholesale Trade (100.0%), and Administrative & Support (100.0%), whereas the industries that tend to have a higher number of women are Information (100.0%), Finance & Insurance (80.6%), and Health Care & Social Assistance (52.7%).
| Industry | Male | Female |
| Agriculture, Fishing & Hunting | 2 (100.0%) | 0 (0.0%) |
| Mining, Quarrying, & Extraction | 0 (0.0%) | 0 (0.0%) |
| Construction | 85 (94.4%) | 5 (5.6%) |
| Manufacturing | 29 (60.4%) | 19 (39.6%) |
| Wholesale Trade | 31 (100.0%) | 0 (0.0%) |
| Retail Trade | 31 (68.9%) | 14 (31.1%) |
| Transportation & Warehousing | 37 (66.1%) | 19 (33.9%) |
| Utilities | 14 (93.3%) | 1 (6.7%) |
| Information | 0 (0.0%) | 52 (100.0%) |
| Finance & Insurance | 6 (19.4%) | 25 (80.6%) |
| Real Estate, Rental & Leasing | 43 (64.2%) | 24 (35.8%) |
| Professional & Scientific | 29 (53.7%) | 25 (46.3%) |
| Enterprise Management | 0 (0.0%) | 0 (0.0%) |
| Administrative & Support | 37 (100.0%) | 0 (0.0%) |
| Educational Services | 37 (57.8%) | 27 (42.2%) |
| Health Care & Social Assistance | 61 (47.3%) | 68 (52.7%) |
| Arts, Entertainment & Recreation | 14 (60.9%) | 9 (39.1%) |
| Accommodation & Food Services | 30 (50.8%) | 29 (49.1%) |
| Public Administration | 28 (60.9%) | 18 (39.1%) |
| Total | 522 (60.0%) | 348 (40.0%) |
Education in Francis
School Enrollment in Francis
The most common levels of schooling among the 530 students in Francis are college / undergraduate (150 | 28.3%), high school (126 | 23.8%), and elementary school (125 | 23.6%).
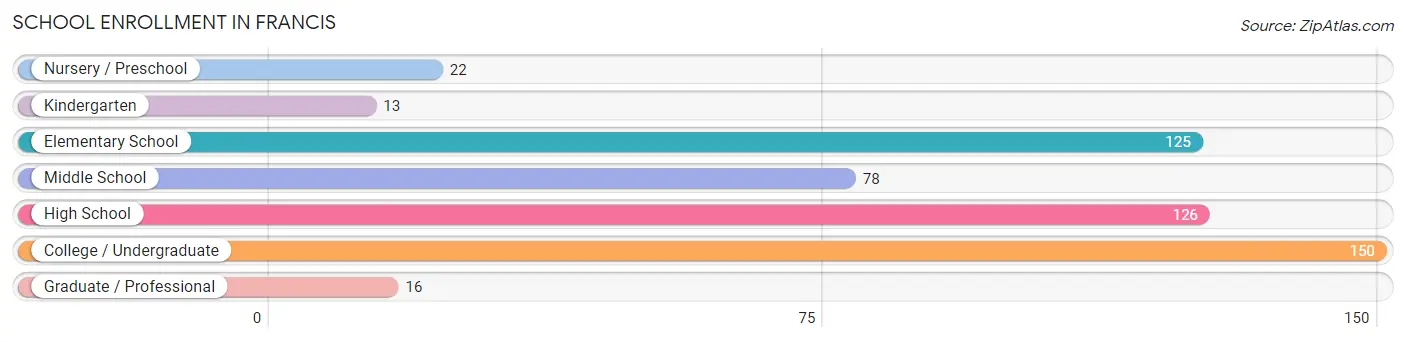
| School Level | # Students | % Students |
| Nursery / Preschool | 22 | 4.2% |
| Kindergarten | 13 | 2.5% |
| Elementary School | 125 | 23.6% |
| Middle School | 78 | 14.7% |
| High School | 126 | 23.8% |
| College / Undergraduate | 150 | 28.3% |
| Graduate / Professional | 16 | 3.0% |
| Total | 530 | 100.0% |
School Enrollment by Age by Funding Source in Francis
Out of a total of 530 students who are enrolled in schools in Francis, 70 (13.2%) attend a private institution, while the remaining 460 (86.8%) are enrolled in public schools. The age group of 20 to 24 year olds has the highest likelihood of being enrolled in private schools, with 24 (75.0% in the age bracket) enrolled. Conversely, the age group of 10 to 14 year olds has the lowest likelihood of being enrolled in a private school, with 118 (95.9% in the age bracket) attending a public institution.
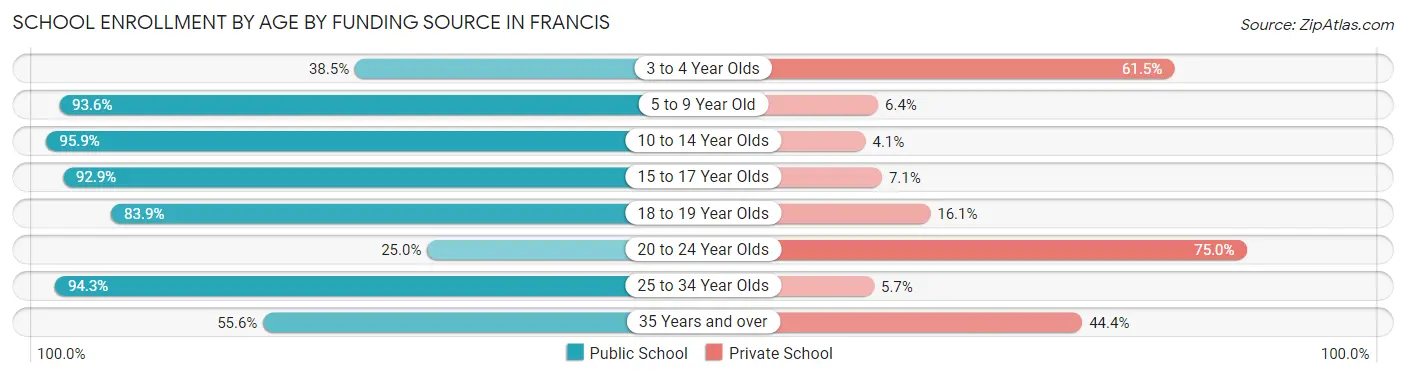
| Age Bracket | Public School | Private School |
| 3 to 4 Year Olds | 5 (38.5%) | 8 (61.5%) |
| 5 to 9 Year Old | 102 (93.6%) | 7 (6.4%) |
| 10 to 14 Year Olds | 118 (95.9%) | 5 (4.1%) |
| 15 to 17 Year Olds | 91 (92.9%) | 7 (7.1%) |
| 18 to 19 Year Olds | 26 (83.9%) | 5 (16.1%) |
| 20 to 24 Year Olds | 8 (25.0%) | 24 (75.0%) |
| 25 to 34 Year Olds | 100 (94.3%) | 6 (5.7%) |
| 35 Years and over | 10 (55.6%) | 8 (44.4%) |
| Total | 460 (86.8%) | 70 (13.2%) |
Educational Attainment by Field of Study in Francis
Bio, nature & agricultural (87 | 19.1%), liberal arts & history (70 | 15.3%), literature & languages (50 | 11.0%), science & technology (35 | 7.7%), and arts & humanities (34 | 7.5%) are the most common fields of study among 456 individuals in Francis who have obtained a bachelor's degree or higher.
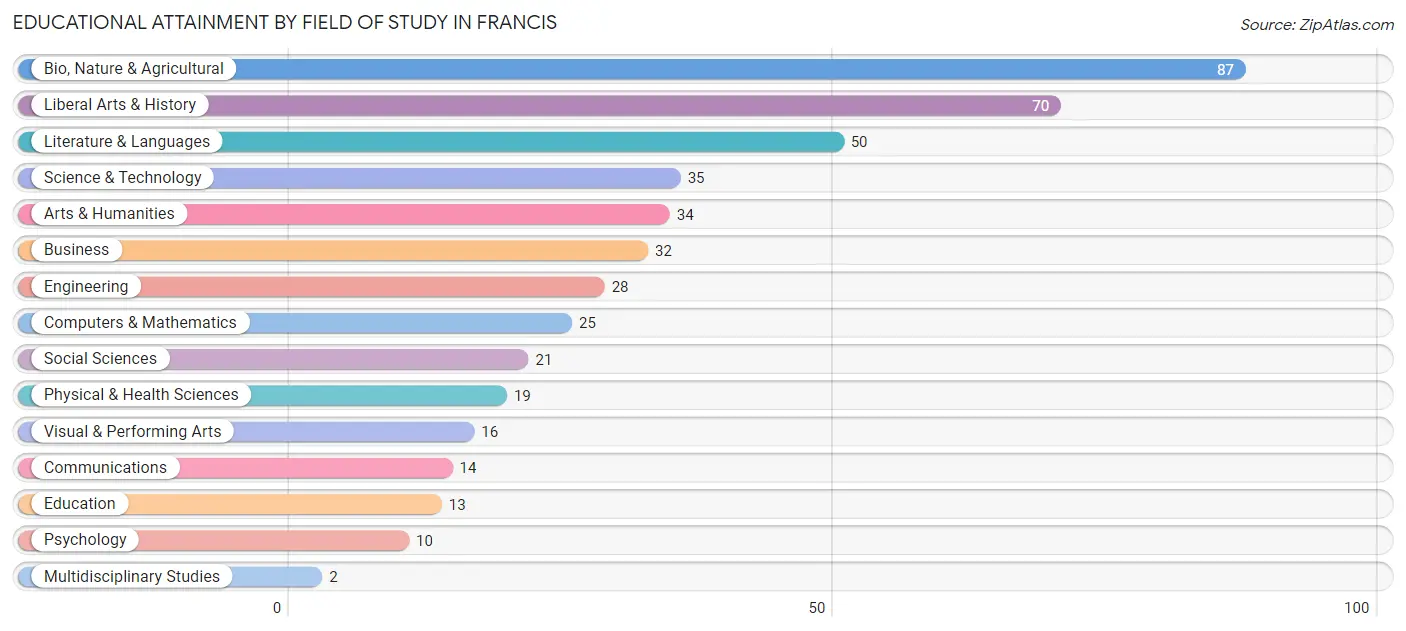
| Field of Study | # Graduates | % Graduates |
| Computers & Mathematics | 25 | 5.5% |
| Bio, Nature & Agricultural | 87 | 19.1% |
| Physical & Health Sciences | 19 | 4.2% |
| Psychology | 10 | 2.2% |
| Social Sciences | 21 | 4.6% |
| Engineering | 28 | 6.1% |
| Multidisciplinary Studies | 2 | 0.4% |
| Science & Technology | 35 | 7.7% |
| Business | 32 | 7.0% |
| Education | 13 | 2.9% |
| Literature & Languages | 50 | 11.0% |
| Liberal Arts & History | 70 | 15.3% |
| Visual & Performing Arts | 16 | 3.5% |
| Communications | 14 | 3.1% |
| Arts & Humanities | 34 | 7.5% |
| Total | 456 | 100.0% |
Transportation & Commute in Francis
Vehicle Availability by Sex in Francis
The most prevalent vehicle ownership categories in Francis are males with 2 vehicles (177, accounting for 34.0%) and females with 2 vehicles (116, making up 52.4%).
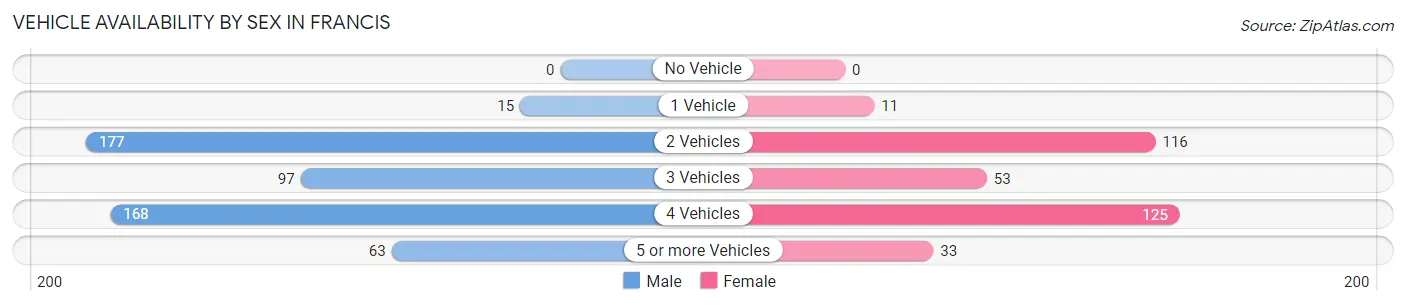
| Vehicles Available | Male | Female |
| No Vehicle | 0 (0.0%) | 0 (0.0%) |
| 1 Vehicle | 15 (2.9%) | 11 (3.3%) |
| 2 Vehicles | 177 (34.0%) | 116 (34.3%) |
| 3 Vehicles | 97 (18.6%) | 53 (15.7%) |
| 4 Vehicles | 168 (32.3%) | 125 (37.0%) |
| 5 or more Vehicles | 63 (12.1%) | 33 (9.8%) |
| Total | 520 (100.0%) | 338 (100.0%) |
Commute Time in Francis
The most frequently occuring commute durations in Francis are 45 to 59 minutes (131 commuters, 19.0%), 5 to 9 minutes (126 commuters, 18.3%), and 30 to 34 minutes (125 commuters, 18.2%).
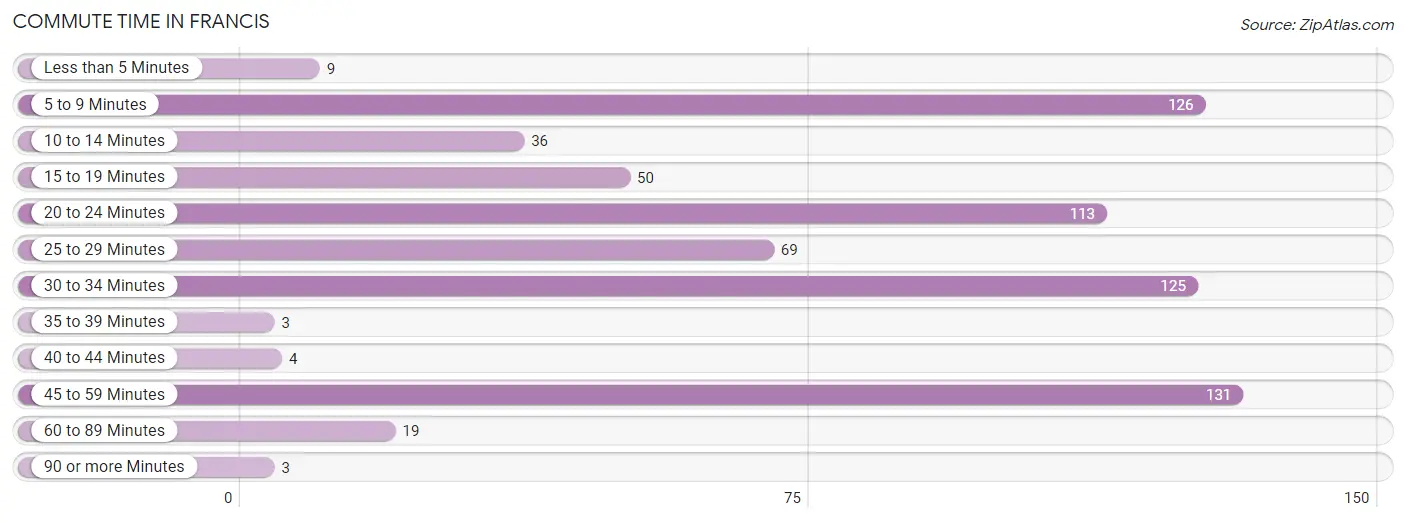
| Commute Time | # Commuters | % Commuters |
| Less than 5 Minutes | 9 | 1.3% |
| 5 to 9 Minutes | 126 | 18.3% |
| 10 to 14 Minutes | 36 | 5.2% |
| 15 to 19 Minutes | 50 | 7.3% |
| 20 to 24 Minutes | 113 | 16.4% |
| 25 to 29 Minutes | 69 | 10.0% |
| 30 to 34 Minutes | 125 | 18.2% |
| 35 to 39 Minutes | 3 | 0.4% |
| 40 to 44 Minutes | 4 | 0.6% |
| 45 to 59 Minutes | 131 | 19.0% |
| 60 to 89 Minutes | 19 | 2.8% |
| 90 or more Minutes | 3 | 0.4% |
Commute Time by Sex in Francis
The most common commute times in Francis are 45 to 59 minutes (108 commuters, 24.8%) for males and 5 to 9 minutes (55 commuters, 21.7%) for females.
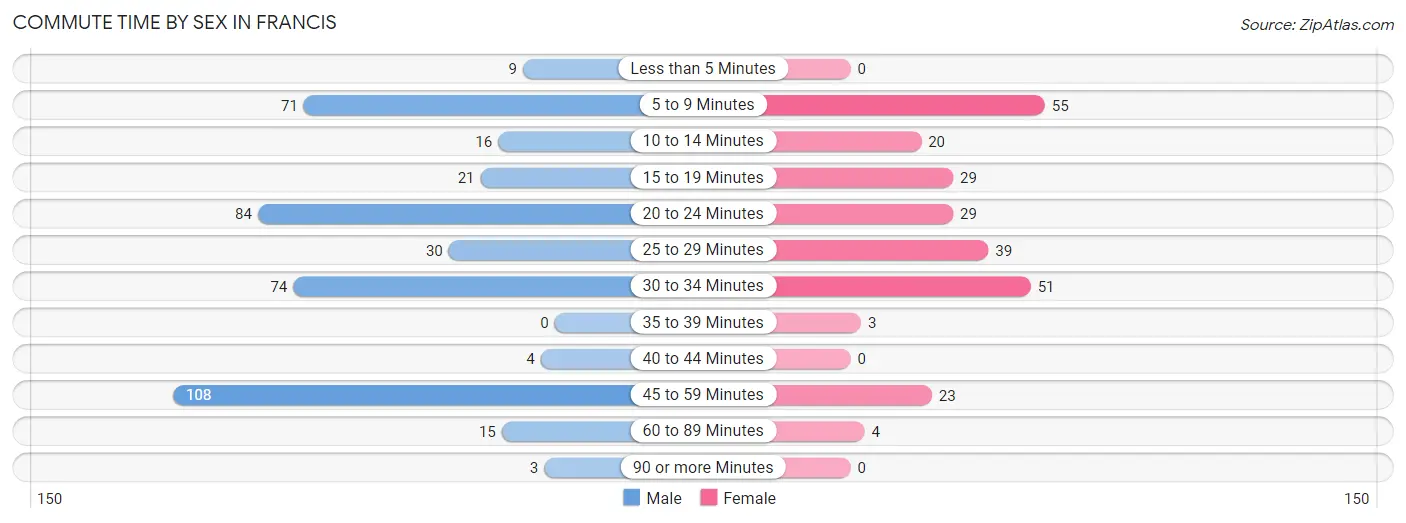
| Commute Time | Male | Female |
| Less than 5 Minutes | 9 (2.1%) | 0 (0.0%) |
| 5 to 9 Minutes | 71 (16.3%) | 55 (21.7%) |
| 10 to 14 Minutes | 16 (3.7%) | 20 (7.9%) |
| 15 to 19 Minutes | 21 (4.8%) | 29 (11.5%) |
| 20 to 24 Minutes | 84 (19.3%) | 29 (11.5%) |
| 25 to 29 Minutes | 30 (6.9%) | 39 (15.4%) |
| 30 to 34 Minutes | 74 (17.0%) | 51 (20.2%) |
| 35 to 39 Minutes | 0 (0.0%) | 3 (1.2%) |
| 40 to 44 Minutes | 4 (0.9%) | 0 (0.0%) |
| 45 to 59 Minutes | 108 (24.8%) | 23 (9.1%) |
| 60 to 89 Minutes | 15 (3.5%) | 4 (1.6%) |
| 90 or more Minutes | 3 (0.7%) | 0 (0.0%) |
Time of Departure to Work by Sex in Francis
The most frequent times of departure to work in Francis are 7:00 AM to 7:29 AM (150, 34.5%) for males and 7:00 AM to 7:29 AM (44, 17.4%) for females.
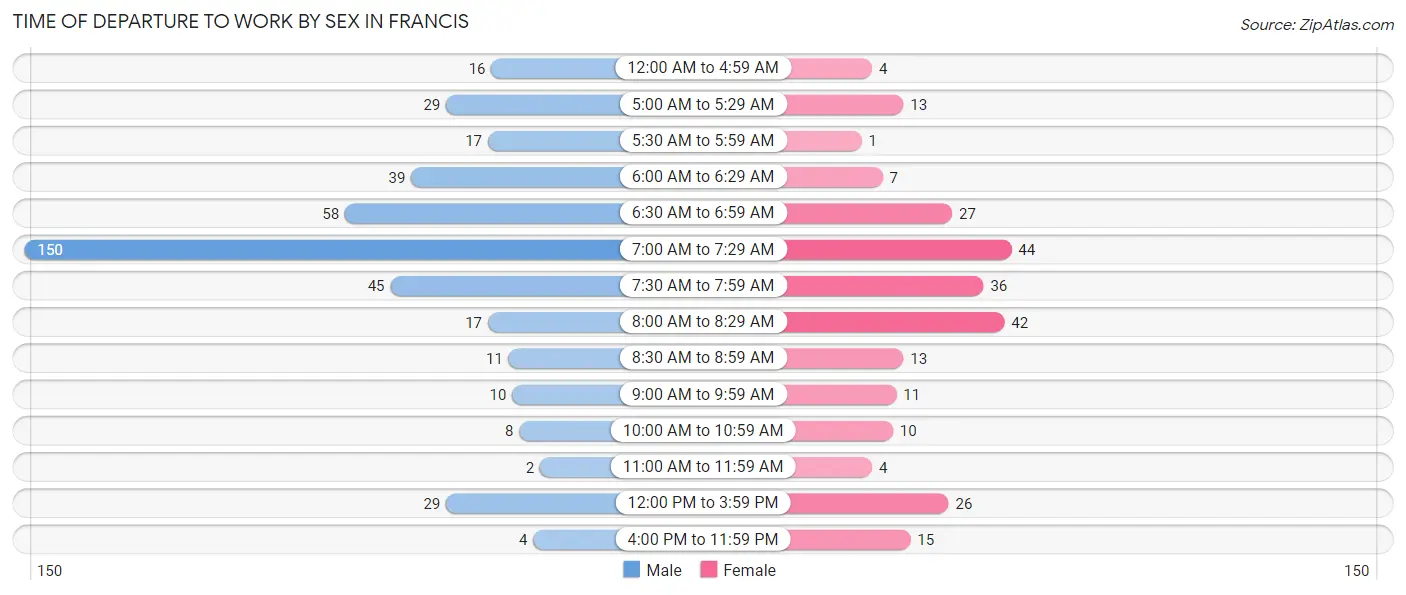
| Time of Departure | Male | Female |
| 12:00 AM to 4:59 AM | 16 (3.7%) | 4 (1.6%) |
| 5:00 AM to 5:29 AM | 29 (6.7%) | 13 (5.1%) |
| 5:30 AM to 5:59 AM | 17 (3.9%) | 1 (0.4%) |
| 6:00 AM to 6:29 AM | 39 (9.0%) | 7 (2.8%) |
| 6:30 AM to 6:59 AM | 58 (13.3%) | 27 (10.7%) |
| 7:00 AM to 7:29 AM | 150 (34.5%) | 44 (17.4%) |
| 7:30 AM to 7:59 AM | 45 (10.3%) | 36 (14.2%) |
| 8:00 AM to 8:29 AM | 17 (3.9%) | 42 (16.6%) |
| 8:30 AM to 8:59 AM | 11 (2.5%) | 13 (5.1%) |
| 9:00 AM to 9:59 AM | 10 (2.3%) | 11 (4.3%) |
| 10:00 AM to 10:59 AM | 8 (1.8%) | 10 (4.0%) |
| 11:00 AM to 11:59 AM | 2 (0.5%) | 4 (1.6%) |
| 12:00 PM to 3:59 PM | 29 (6.7%) | 26 (10.3%) |
| 4:00 PM to 11:59 PM | 4 (0.9%) | 15 (5.9%) |
| Total | 435 (100.0%) | 253 (100.0%) |
Housing Occupancy in Francis
Occupancy by Ownership in Francis
Of the total 459 dwellings in Francis, owner-occupied units account for 397 (86.5%), while renter-occupied units make up 62 (13.5%).
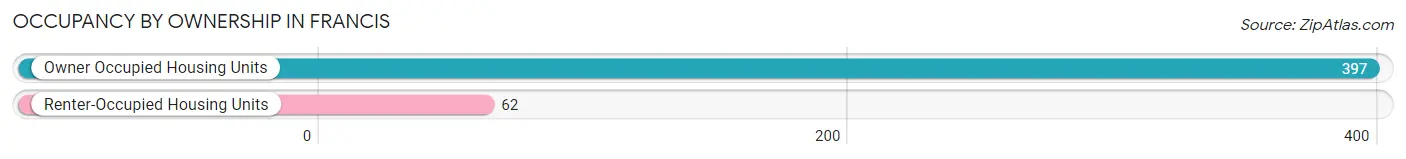
| Occupancy | # Housing Units | % Housing Units |
| Owner Occupied Housing Units | 397 | 86.5% |
| Renter-Occupied Housing Units | 62 | 13.5% |
| Total Occupied Housing Units | 459 | 100.0% |
Occupancy by Household Size in Francis
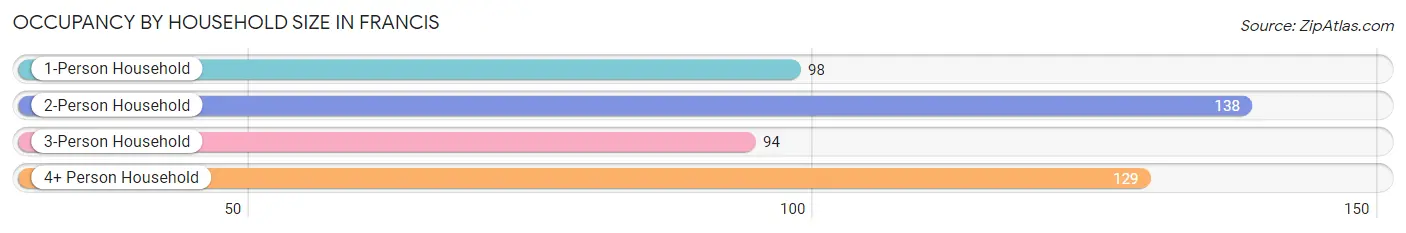
| Household Size | # Housing Units | % Housing Units |
| 1-Person Household | 98 | 21.3% |
| 2-Person Household | 138 | 30.1% |
| 3-Person Household | 94 | 20.5% |
| 4+ Person Household | 129 | 28.1% |
| Total Housing Units | 459 | 100.0% |
Occupancy by Ownership by Household Size in Francis
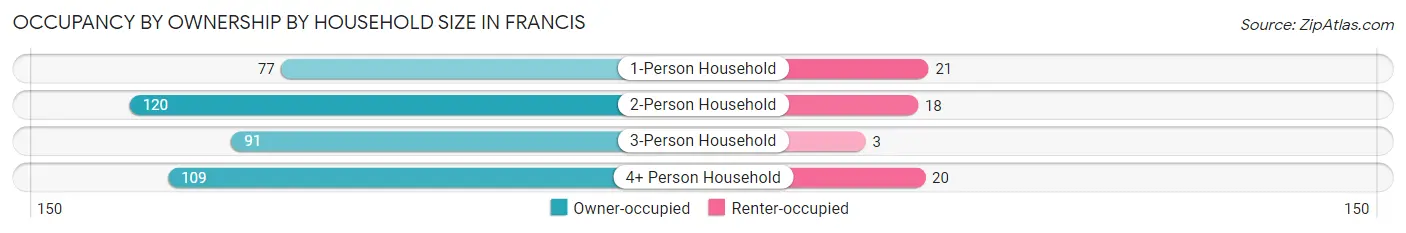
| Household Size | Owner-occupied | Renter-occupied |
| 1-Person Household | 77 (78.6%) | 21 (21.4%) |
| 2-Person Household | 120 (87.0%) | 18 (13.0%) |
| 3-Person Household | 91 (96.8%) | 3 (3.2%) |
| 4+ Person Household | 109 (84.5%) | 20 (15.5%) |
| Total Housing Units | 397 (86.5%) | 62 (13.5%) |
Occupancy by Educational Attainment in Francis
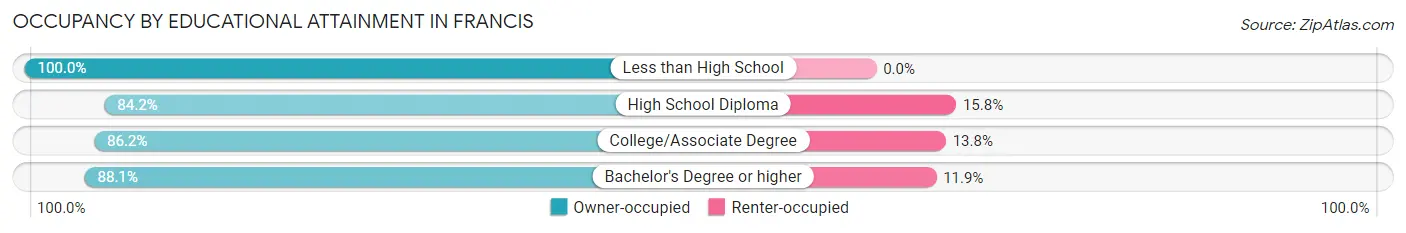
| Household Size | Owner-occupied | Renter-occupied |
| Less than High School | 7 (100.0%) | 0 (0.0%) |
| High School Diploma | 117 (84.2%) | 22 (15.8%) |
| College/Associate Degree | 125 (86.2%) | 20 (13.8%) |
| Bachelor's Degree or higher | 148 (88.1%) | 20 (11.9%) |
Occupancy by Age of Householder in Francis
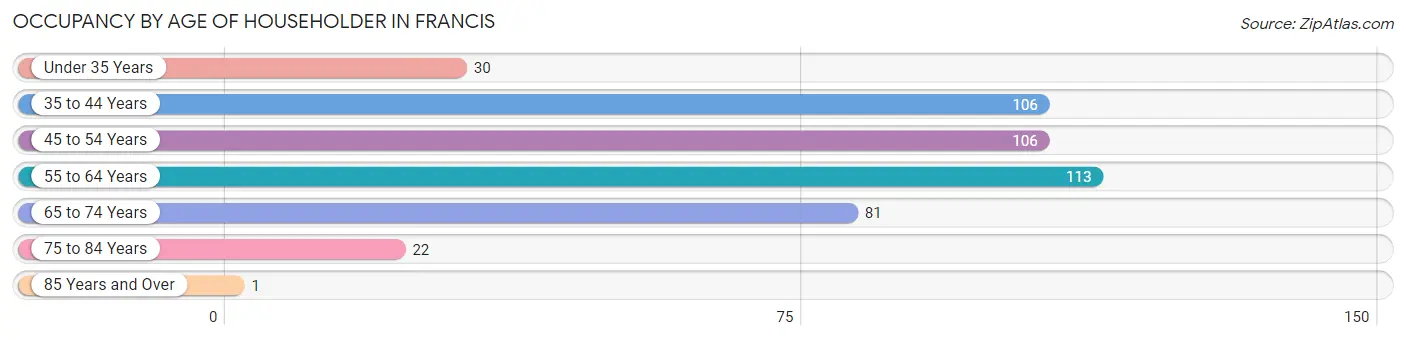
| Age Bracket | # Households | % Households |
| Under 35 Years | 30 | 6.5% |
| 35 to 44 Years | 106 | 23.1% |
| 45 to 54 Years | 106 | 23.1% |
| 55 to 64 Years | 113 | 24.6% |
| 65 to 74 Years | 81 | 17.6% |
| 75 to 84 Years | 22 | 4.8% |
| 85 Years and Over | 1 | 0.2% |
| Total | 459 | 100.0% |
Housing Finances in Francis
Median Income by Occupancy in Francis
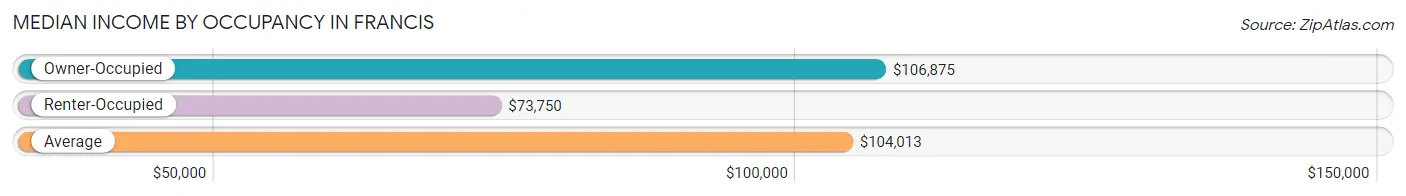
| Occupancy Type | # Households | Median Income |
| Owner-Occupied | 397 (86.5%) | $106,875 |
| Renter-Occupied | 62 (13.5%) | $73,750 |
| Average | 459 (100.0%) | $104,013 |
Occupancy by Householder Income Bracket in Francis
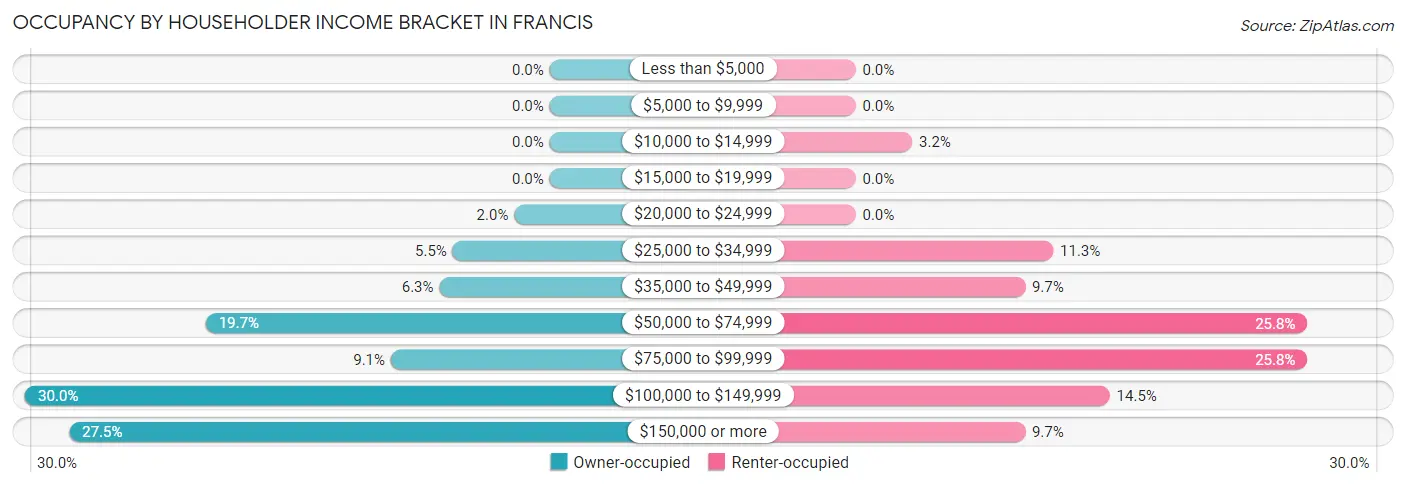
| Income Bracket | Owner-occupied | Renter-occupied |
| Less than $5,000 | 0 (0.0%) | 0 (0.0%) |
| $5,000 to $9,999 | 0 (0.0%) | 0 (0.0%) |
| $10,000 to $14,999 | 0 (0.0%) | 2 (3.2%) |
| $15,000 to $19,999 | 0 (0.0%) | 0 (0.0%) |
| $20,000 to $24,999 | 8 (2.0%) | 0 (0.0%) |
| $25,000 to $34,999 | 22 (5.5%) | 7 (11.3%) |
| $35,000 to $49,999 | 25 (6.3%) | 6 (9.7%) |
| $50,000 to $74,999 | 78 (19.7%) | 16 (25.8%) |
| $75,000 to $99,999 | 36 (9.1%) | 16 (25.8%) |
| $100,000 to $149,999 | 119 (30.0%) | 9 (14.5%) |
| $150,000 or more | 109 (27.5%) | 6 (9.7%) |
| Total | 397 (100.0%) | 62 (100.0%) |
Monthly Housing Cost Tiers in Francis
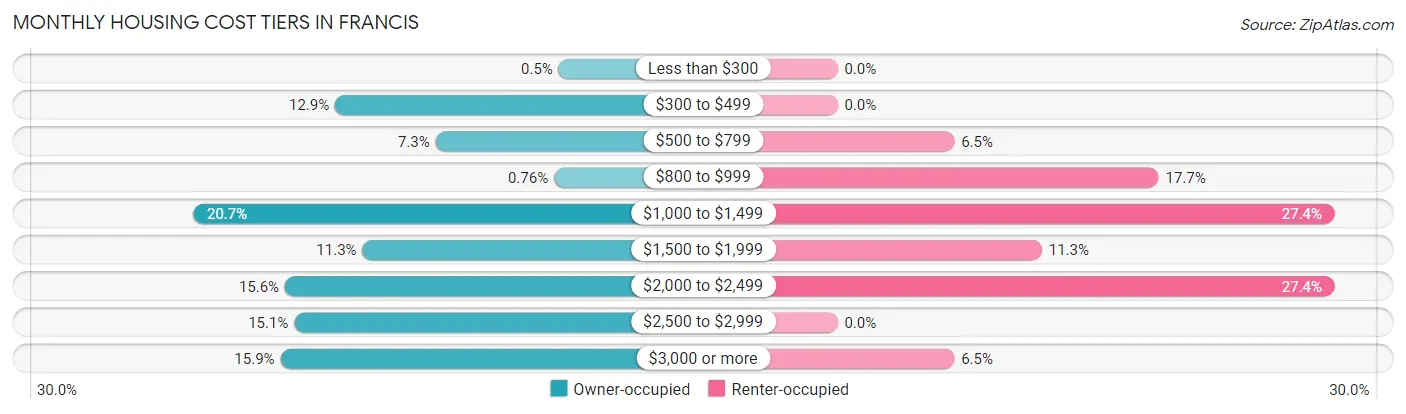
| Monthly Cost | Owner-occupied | Renter-occupied |
| Less than $300 | 2 (0.5%) | 0 (0.0%) |
| $300 to $499 | 51 (12.9%) | 0 (0.0%) |
| $500 to $799 | 29 (7.3%) | 4 (6.5%) |
| $800 to $999 | 3 (0.8%) | 11 (17.7%) |
| $1,000 to $1,499 | 82 (20.6%) | 17 (27.4%) |
| $1,500 to $1,999 | 45 (11.3%) | 7 (11.3%) |
| $2,000 to $2,499 | 62 (15.6%) | 17 (27.4%) |
| $2,500 to $2,999 | 60 (15.1%) | 0 (0.0%) |
| $3,000 or more | 63 (15.9%) | 4 (6.5%) |
| Total | 397 (100.0%) | 62 (100.0%) |
Physical Housing Characteristics in Francis
Housing Structures in Francis
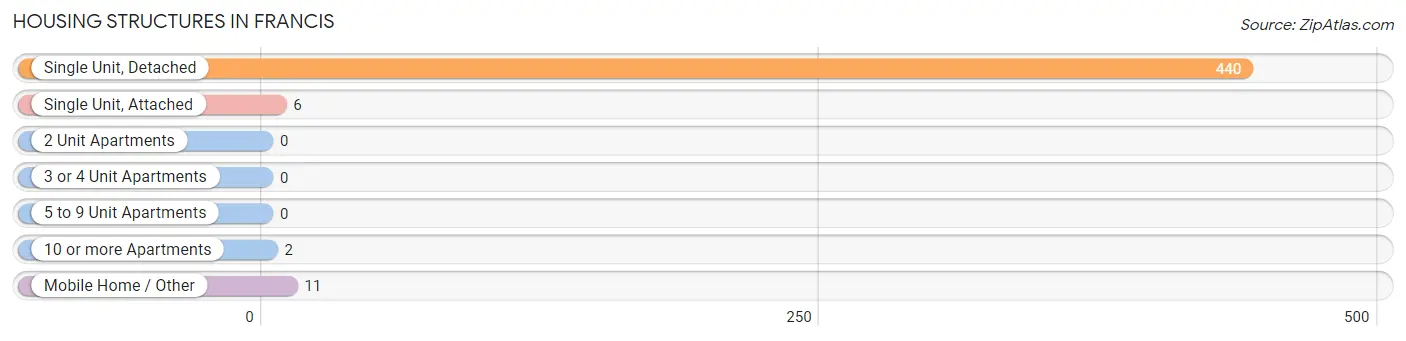
| Structure Type | # Housing Units | % Housing Units |
| Single Unit, Detached | 440 | 95.9% |
| Single Unit, Attached | 6 | 1.3% |
| 2 Unit Apartments | 0 | 0.0% |
| 3 or 4 Unit Apartments | 0 | 0.0% |
| 5 to 9 Unit Apartments | 0 | 0.0% |
| 10 or more Apartments | 2 | 0.4% |
| Mobile Home / Other | 11 | 2.4% |
| Total | 459 | 100.0% |
Housing Structures by Occupancy in Francis
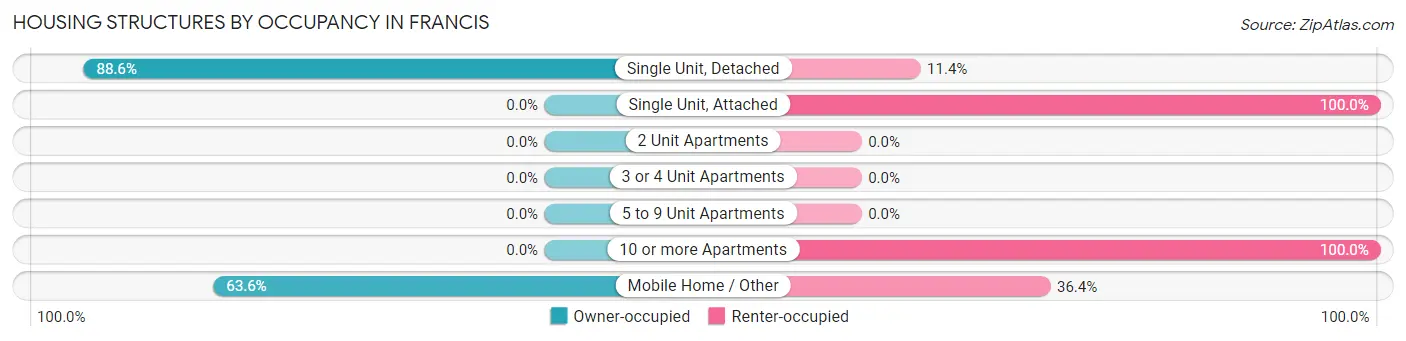
| Structure Type | Owner-occupied | Renter-occupied |
| Single Unit, Detached | 390 (88.6%) | 50 (11.4%) |
| Single Unit, Attached | 0 (0.0%) | 6 (100.0%) |
| 2 Unit Apartments | 0 (0.0%) | 0 (0.0%) |
| 3 or 4 Unit Apartments | 0 (0.0%) | 0 (0.0%) |
| 5 to 9 Unit Apartments | 0 (0.0%) | 0 (0.0%) |
| 10 or more Apartments | 0 (0.0%) | 2 (100.0%) |
| Mobile Home / Other | 7 (63.6%) | 4 (36.4%) |
| Total | 397 (86.5%) | 62 (13.5%) |
Housing Structures by Number of Rooms in Francis
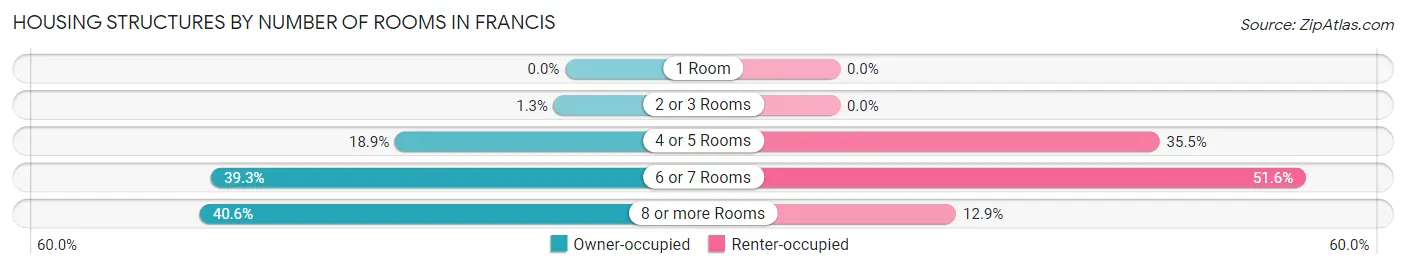
| Number of Rooms | Owner-occupied | Renter-occupied |
| 1 Room | 0 (0.0%) | 0 (0.0%) |
| 2 or 3 Rooms | 5 (1.3%) | 0 (0.0%) |
| 4 or 5 Rooms | 75 (18.9%) | 22 (35.5%) |
| 6 or 7 Rooms | 156 (39.3%) | 32 (51.6%) |
| 8 or more Rooms | 161 (40.6%) | 8 (12.9%) |
| Total | 397 (100.0%) | 62 (100.0%) |
Housing Structure by Heating Type in Francis
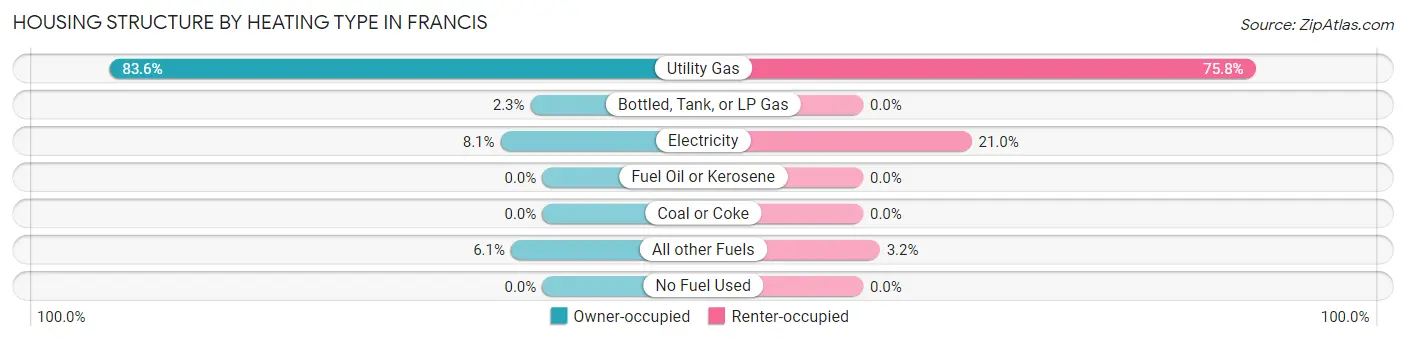
| Heating Type | Owner-occupied | Renter-occupied |
| Utility Gas | 332 (83.6%) | 47 (75.8%) |
| Bottled, Tank, or LP Gas | 9 (2.3%) | 0 (0.0%) |
| Electricity | 32 (8.1%) | 13 (21.0%) |
| Fuel Oil or Kerosene | 0 (0.0%) | 0 (0.0%) |
| Coal or Coke | 0 (0.0%) | 0 (0.0%) |
| All other Fuels | 24 (6.0%) | 2 (3.2%) |
| No Fuel Used | 0 (0.0%) | 0 (0.0%) |
| Total | 397 (100.0%) | 62 (100.0%) |
Household Vehicle Usage in Francis
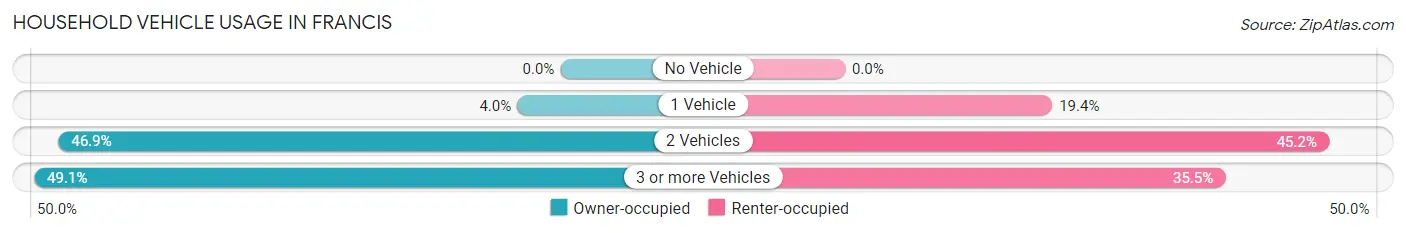
| Vehicles per Household | Owner-occupied | Renter-occupied |
| No Vehicle | 0 (0.0%) | 0 (0.0%) |
| 1 Vehicle | 16 (4.0%) | 12 (19.4%) |
| 2 Vehicles | 186 (46.9%) | 28 (45.2%) |
| 3 or more Vehicles | 195 (49.1%) | 22 (35.5%) |
| Total | 397 (100.0%) | 62 (100.0%) |
Real Estate & Mortgages in Francis
Real Estate and Mortgage Overview in Francis
| Characteristic | Without Mortgage | With Mortgage |
| Housing Units | 82 | 315 |
| Median Property Value | $507,600 | $660,900 |
| Median Household Income | $75,000 | $95 |
| Monthly Housing Costs | $443 | $63 |
| Real Estate Taxes | $1,845 | $1 |
Property Value by Mortgage Status in Francis
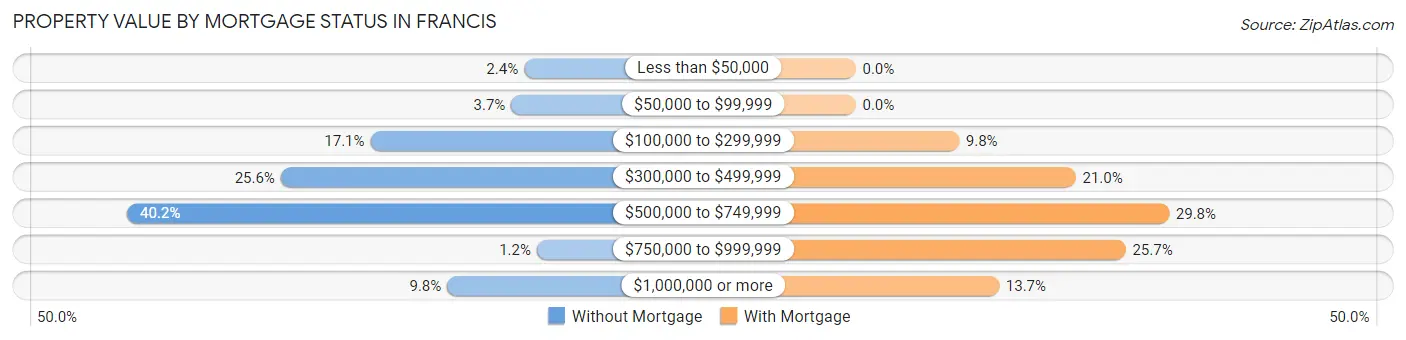
| Property Value | Without Mortgage | With Mortgage |
| Less than $50,000 | 2 (2.4%) | 0 (0.0%) |
| $50,000 to $99,999 | 3 (3.7%) | 0 (0.0%) |
| $100,000 to $299,999 | 14 (17.1%) | 31 (9.8%) |
| $300,000 to $499,999 | 21 (25.6%) | 66 (20.9%) |
| $500,000 to $749,999 | 33 (40.2%) | 94 (29.8%) |
| $750,000 to $999,999 | 1 (1.2%) | 81 (25.7%) |
| $1,000,000 or more | 8 (9.8%) | 43 (13.7%) |
| Total | 82 (100.0%) | 315 (100.0%) |
Household Income by Mortgage Status in Francis
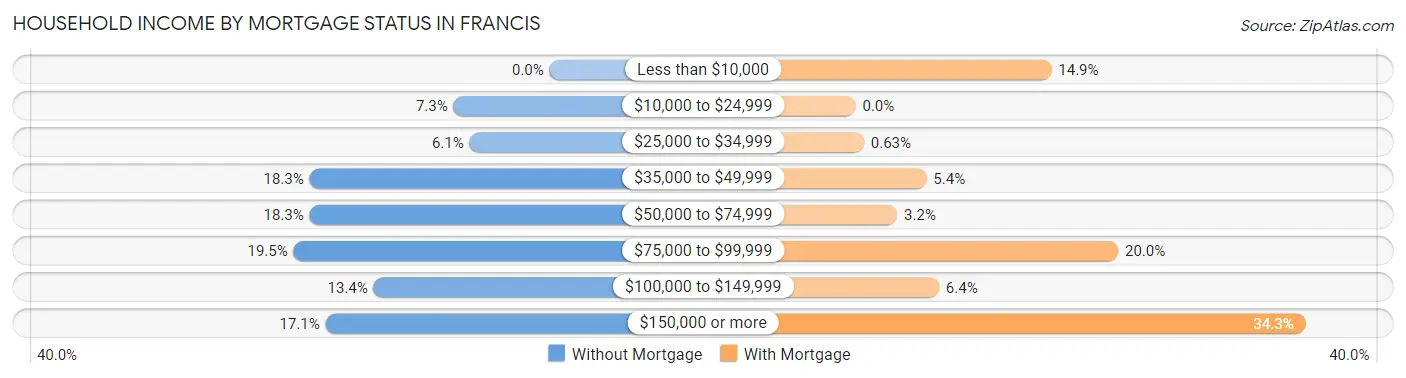
| Household Income | Without Mortgage | With Mortgage |
| Less than $10,000 | 0 (0.0%) | 47 (14.9%) |
| $10,000 to $24,999 | 6 (7.3%) | 0 (0.0%) |
| $25,000 to $34,999 | 5 (6.1%) | 2 (0.6%) |
| $35,000 to $49,999 | 15 (18.3%) | 17 (5.4%) |
| $50,000 to $74,999 | 15 (18.3%) | 10 (3.2%) |
| $75,000 to $99,999 | 16 (19.5%) | 63 (20.0%) |
| $100,000 to $149,999 | 11 (13.4%) | 20 (6.4%) |
| $150,000 or more | 14 (17.1%) | 108 (34.3%) |
| Total | 82 (100.0%) | 315 (100.0%) |
Property Value to Household Income Ratio in Francis
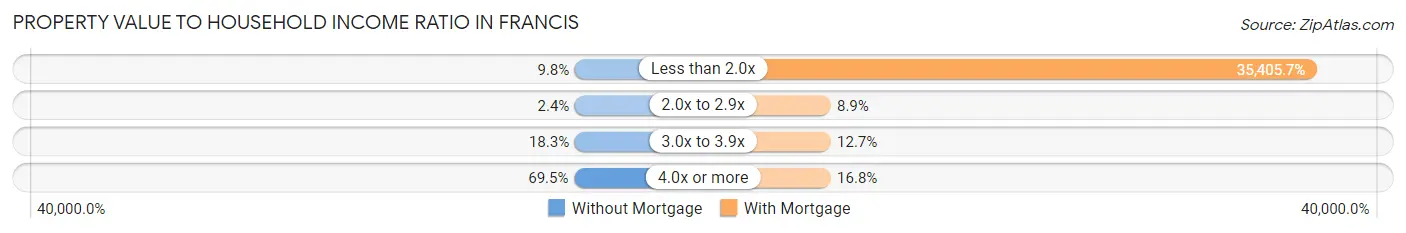
| Value-to-Income Ratio | Without Mortgage | With Mortgage |
| Less than 2.0x | 8 (9.8%) | 111,528 (35,405.7%) |
| 2.0x to 2.9x | 2 (2.4%) | 28 (8.9%) |
| 3.0x to 3.9x | 15 (18.3%) | 40 (12.7%) |
| 4.0x or more | 57 (69.5%) | 53 (16.8%) |
| Total | 82 (100.0%) | 315 (100.0%) |
Real Estate Taxes by Mortgage Status in Francis
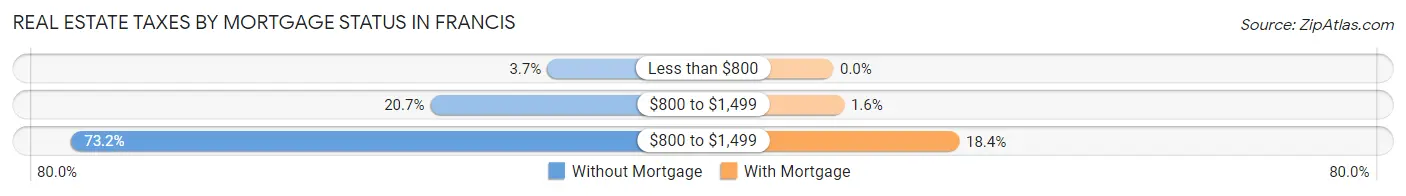
| Property Taxes | Without Mortgage | With Mortgage |
| Less than $800 | 3 (3.7%) | 0 (0.0%) |
| $800 to $1,499 | 17 (20.7%) | 5 (1.6%) |
| $800 to $1,499 | 60 (73.2%) | 58 (18.4%) |
| Total | 82 (100.0%) | 315 (100.0%) |
Health & Disability in Francis
Health Insurance Coverage by Age in Francis
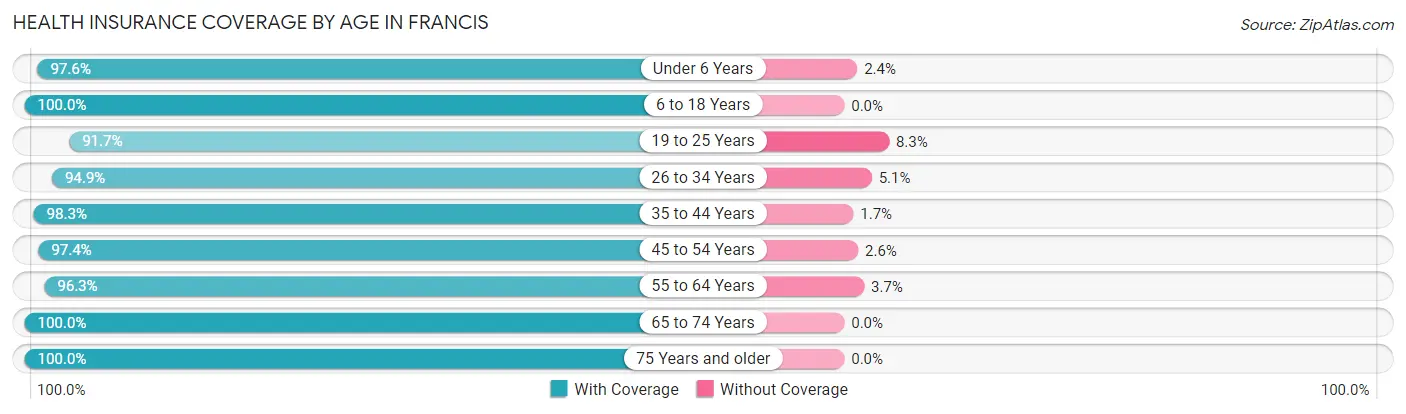
| Age Bracket | With Coverage | Without Coverage |
| Under 6 Years | 81 (97.6%) | 2 (2.4%) |
| 6 to 18 Years | 356 (100.0%) | 0 (0.0%) |
| 19 to 25 Years | 99 (91.7%) | 9 (8.3%) |
| 26 to 34 Years | 167 (94.9%) | 9 (5.1%) |
| 35 to 44 Years | 232 (98.3%) | 4 (1.7%) |
| 45 to 54 Years | 189 (97.4%) | 5 (2.6%) |
| 55 to 64 Years | 209 (96.3%) | 8 (3.7%) |
| 65 to 74 Years | 127 (100.0%) | 0 (0.0%) |
| 75 Years and older | 76 (100.0%) | 0 (0.0%) |
| Total | 1,536 (97.7%) | 37 (2.4%) |
Health Insurance Coverage by Citizenship Status in Francis
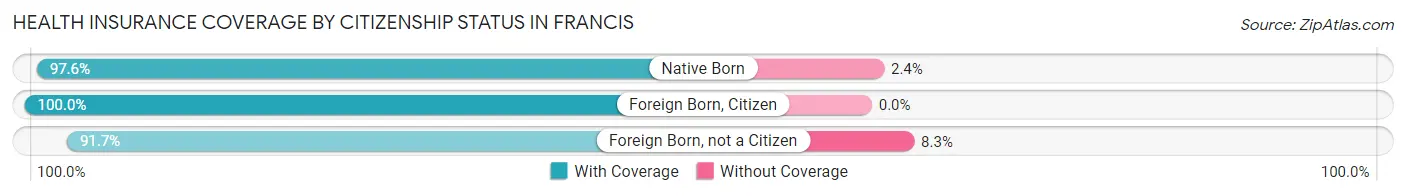
| Citizenship Status | With Coverage | Without Coverage |
| Native Born | 81 (97.6%) | 2 (2.4%) |
| Foreign Born, Citizen | 356 (100.0%) | 0 (0.0%) |
| Foreign Born, not a Citizen | 99 (91.7%) | 9 (8.3%) |
Health Insurance Coverage by Household Income in Francis
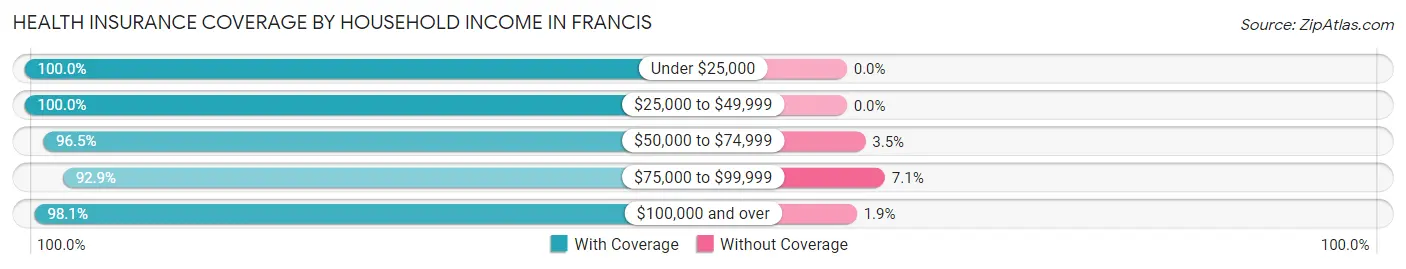
| Household Income | With Coverage | Without Coverage |
| Under $25,000 | 16 (100.0%) | 0 (0.0%) |
| $25,000 to $49,999 | 143 (100.0%) | 0 (0.0%) |
| $50,000 to $74,999 | 194 (96.5%) | 7 (3.5%) |
| $75,000 to $99,999 | 130 (92.9%) | 10 (7.1%) |
| $100,000 and over | 1,053 (98.1%) | 20 (1.9%) |
Public vs Private Health Insurance Coverage by Age in Francis
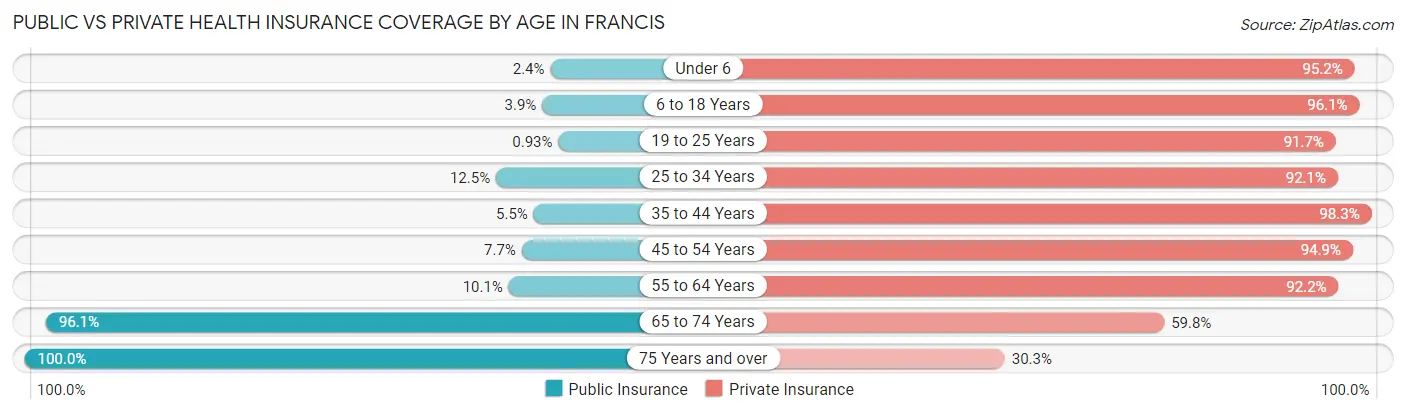
| Age Bracket | Public Insurance | Private Insurance |
| Under 6 | 2 (2.4%) | 79 (95.2%) |
| 6 to 18 Years | 14 (3.9%) | 342 (96.1%) |
| 19 to 25 Years | 1 (0.9%) | 99 (91.7%) |
| 25 to 34 Years | 22 (12.5%) | 162 (92.0%) |
| 35 to 44 Years | 13 (5.5%) | 232 (98.3%) |
| 45 to 54 Years | 15 (7.7%) | 184 (94.9%) |
| 55 to 64 Years | 22 (10.1%) | 200 (92.2%) |
| 65 to 74 Years | 122 (96.1%) | 76 (59.8%) |
| 75 Years and over | 76 (100.0%) | 23 (30.3%) |
| Total | 287 (18.2%) | 1,397 (88.8%) |
Disability Status by Sex by Age in Francis
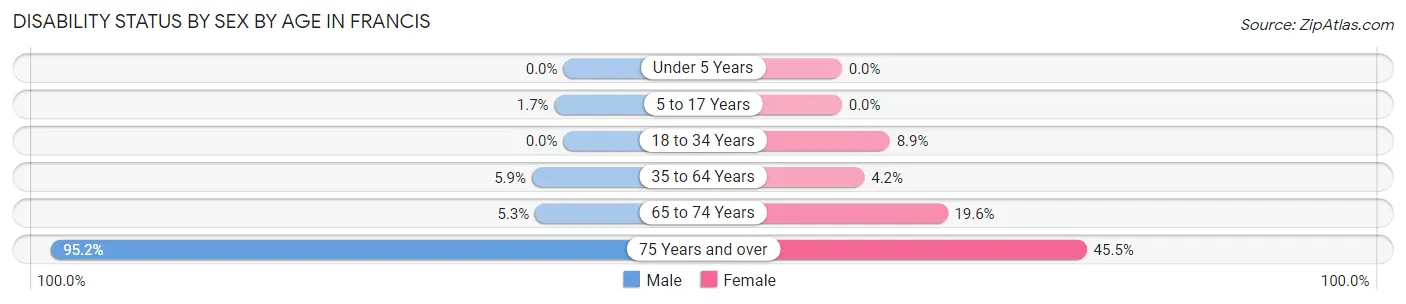
| Age Bracket | Male | Female |
| Under 5 Years | 0 (0.0%) | 0 (0.0%) |
| 5 to 17 Years | 3 (1.7%) | 0 (0.0%) |
| 18 to 34 Years | 0 (0.0%) | 12 (8.9%) |
| 35 to 64 Years | 21 (5.9%) | 12 (4.2%) |
| 65 to 74 Years | 4 (5.3%) | 10 (19.6%) |
| 75 Years and over | 20 (95.2%) | 25 (45.5%) |
Disability Class by Sex by Age in Francis
Disability Class: Hearing Difficulty
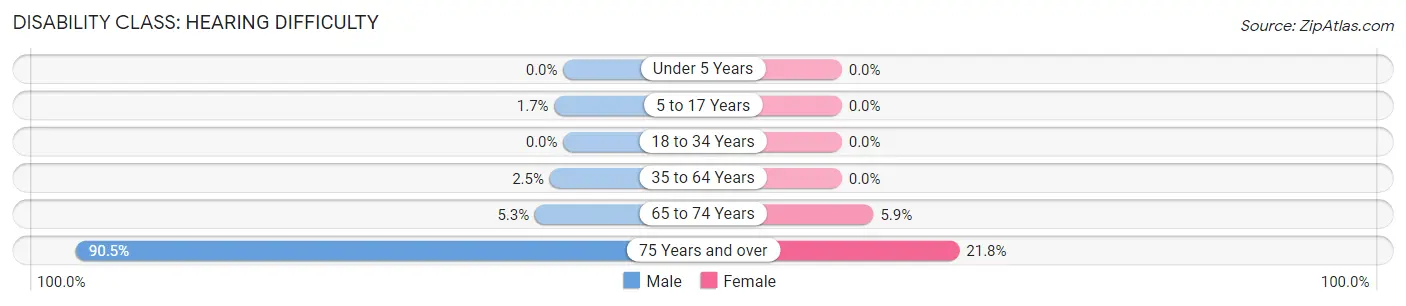
| Age Bracket | Male | Female |
| Under 5 Years | 0 (0.0%) | 0 (0.0%) |
| 5 to 17 Years | 3 (1.7%) | 0 (0.0%) |
| 18 to 34 Years | 0 (0.0%) | 0 (0.0%) |
| 35 to 64 Years | 9 (2.5%) | 0 (0.0%) |
| 65 to 74 Years | 4 (5.3%) | 3 (5.9%) |
| 75 Years and over | 19 (90.5%) | 12 (21.8%) |
Disability Class: Vision Difficulty
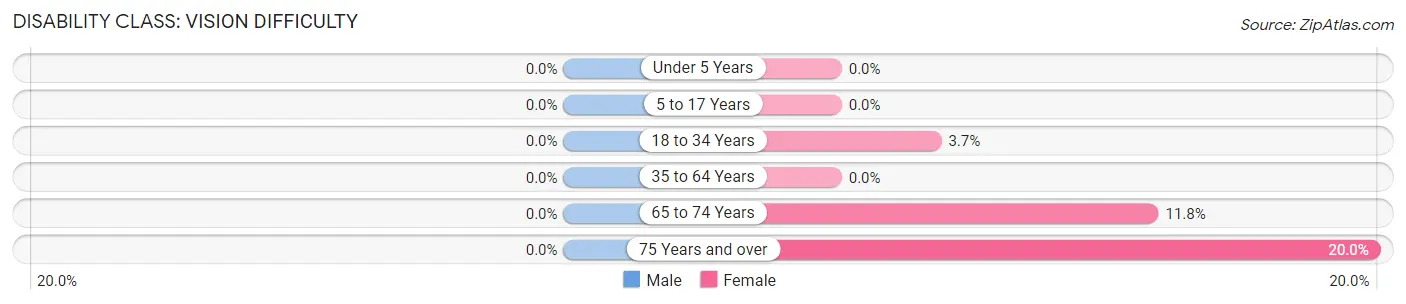
| Age Bracket | Male | Female |
| Under 5 Years | 0 (0.0%) | 0 (0.0%) |
| 5 to 17 Years | 0 (0.0%) | 0 (0.0%) |
| 18 to 34 Years | 0 (0.0%) | 5 (3.7%) |
| 35 to 64 Years | 0 (0.0%) | 0 (0.0%) |
| 65 to 74 Years | 0 (0.0%) | 6 (11.8%) |
| 75 Years and over | 0 (0.0%) | 11 (20.0%) |
Disability Class: Cognitive Difficulty
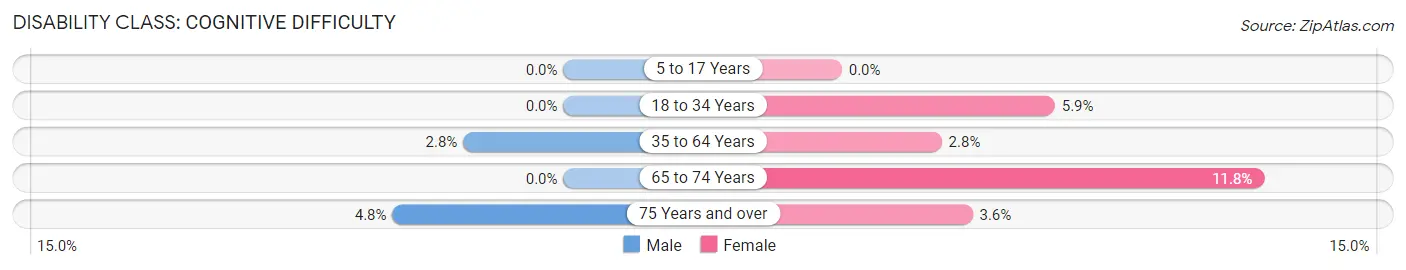
| Age Bracket | Male | Female |
| 5 to 17 Years | 0 (0.0%) | 0 (0.0%) |
| 18 to 34 Years | 0 (0.0%) | 8 (5.9%) |
| 35 to 64 Years | 10 (2.8%) | 8 (2.8%) |
| 65 to 74 Years | 0 (0.0%) | 6 (11.8%) |
| 75 Years and over | 1 (4.8%) | 2 (3.6%) |
Disability Class: Ambulatory Difficulty
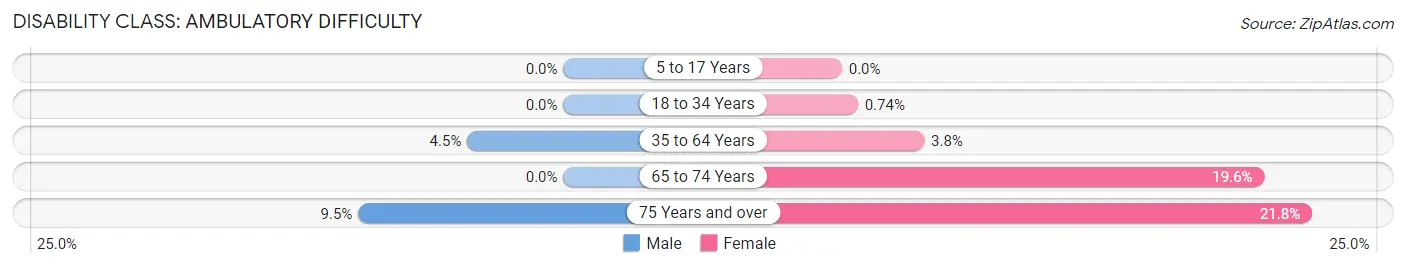
| Age Bracket | Male | Female |
| 5 to 17 Years | 0 (0.0%) | 0 (0.0%) |
| 18 to 34 Years | 0 (0.0%) | 1 (0.7%) |
| 35 to 64 Years | 16 (4.5%) | 11 (3.8%) |
| 65 to 74 Years | 0 (0.0%) | 10 (19.6%) |
| 75 Years and over | 2 (9.5%) | 12 (21.8%) |
Disability Class: Self-Care Difficulty
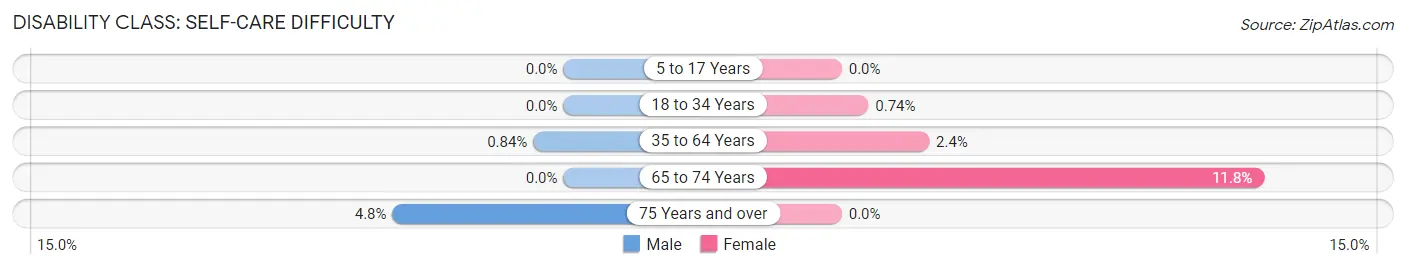
| Age Bracket | Male | Female |
| 5 to 17 Years | 0 (0.0%) | 0 (0.0%) |
| 18 to 34 Years | 0 (0.0%) | 1 (0.7%) |
| 35 to 64 Years | 3 (0.8%) | 7 (2.4%) |
| 65 to 74 Years | 0 (0.0%) | 6 (11.8%) |
| 75 Years and over | 1 (4.8%) | 0 (0.0%) |
Technology Access in Francis
Computing Device Access in Francis
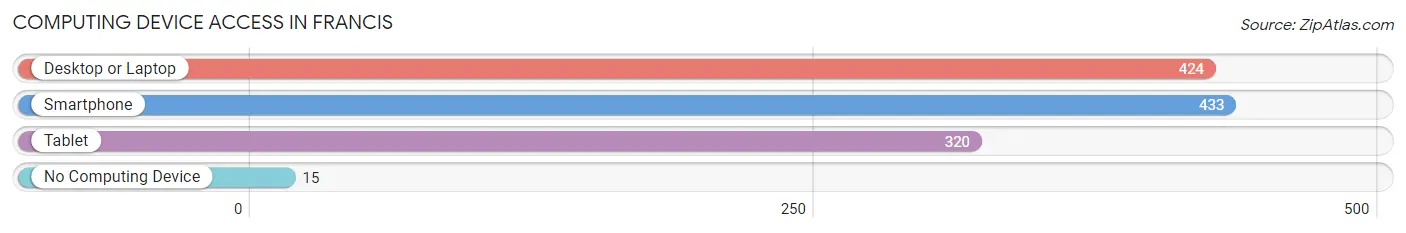
| Device Type | # Households | % Households |
| Desktop or Laptop | 424 | 92.4% |
| Smartphone | 433 | 94.3% |
| Tablet | 320 | 69.7% |
| No Computing Device | 15 | 3.3% |
| Total | 459 | 100.0% |
Internet Access in Francis
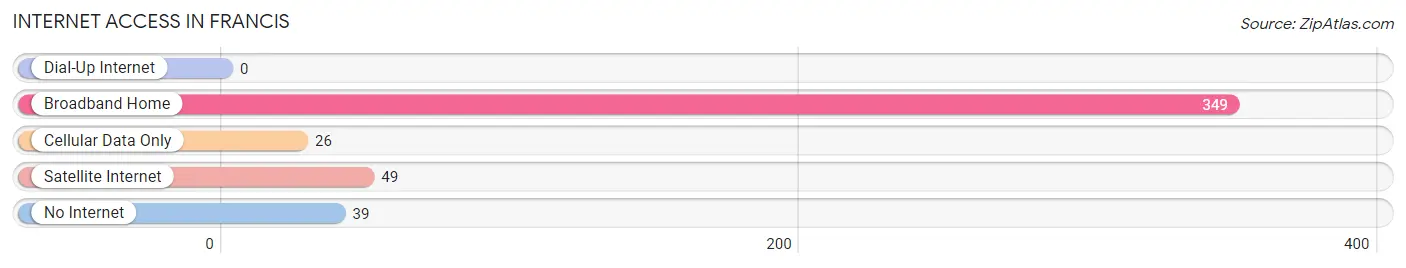
| Internet Type | # Households | % Households |
| Dial-Up Internet | 0 | 0.0% |
| Broadband Home | 349 | 76.0% |
| Cellular Data Only | 26 | 5.7% |
| Satellite Internet | 49 | 10.7% |
| No Internet | 39 | 8.5% |
| Total | 459 | 100.0% |
Francis Summary
The state of Utah is located in the western United States and is bordered by Idaho, Wyoming, Colorado, Arizona, and Nevada. It is the 13th largest state in the United States and the 11th most populous. Utah is known for its diverse geography, ranging from the Great Salt Lake in the north to the red rock canyons of the south. It is also home to five national parks, including Zion National Park and Bryce Canyon National Park.
History
The area that is now Utah was first inhabited by Native American tribes, including the Ute, Paiute, and Shoshone. The first Europeans to explore the area were Spanish explorers in the late 1700s. In 1847, the first permanent settlement was established by Mormon pioneers led by Brigham Young. The settlers established the State of Deseret, which was later renamed Utah after the Ute tribe.
In 1848, the Treaty of Guadalupe Hidalgo was signed, which ended the Mexican-American War and ceded the area to the United States. In 1850, the Utah Territory was established and in 1896, Utah became the 45th state in the Union.
Geography
Utah is located in the western United States and is bordered by Idaho, Wyoming, Colorado, Arizona, and Nevada. It is the 13th largest state in the United States and the 11th most populous. Utah is known for its diverse geography, ranging from the Great Salt Lake in the north to the red rock canyons of the south. It is also home to five national parks, including Zion National Park and Bryce Canyon National Park.
The state is divided into three distinct geographic regions: the Great Basin, the Colorado Plateau, and the Rocky Mountains. The Great Basin is a large desert area in the western part of the state, while the Colorado Plateau is a high-altitude plateau in the south. The Rocky Mountains are located in the northern part of the state and are home to several ski resorts.
Economy
Utah has a diverse economy that is largely driven by the service industry. The state is home to several major companies, including the Church of Jesus Christ of Latter-day Saints, Intermountain Healthcare, and the University of Utah.
The state is also home to several major industries, including mining, tourism, and manufacturing. Mining is a major industry in the state, with the extraction of coal, copper, gold, and other minerals. Tourism is also a major industry, with visitors coming to the state to visit its national parks and ski resorts. Manufacturing is also a major industry, with the production of electronics, chemicals, and food products.
Demographics
As of 2020, the population of Utah was estimated to be 3.2 million. The state is predominantly white, with 78.3% of the population identifying as white. The next largest racial group is Hispanic or Latino, which makes up 13.7% of the population. Other racial groups include African American (2.2%), Asian (2.1%), and Native American (1.2%).
The median household income in Utah is $68,358, which is slightly higher than the national median of $63,179. The poverty rate in the state is 8.7%, which is slightly lower than the national rate of 10.5%.
The largest cities in Utah are Salt Lake City, West Valley City, Provo, West Jordan, and Orem. Salt Lake City is the state capital and the largest city in the state, with a population of 200,567.
Common Questions
What is Per Capita Income in Francis?
Per Capita income in Francis is $43,909.
What is the Median Family Income in Francis?
Median Family Income in Francis is $121,250.
What is the Median Household income in Francis?
Median Household Income in Francis is $104,013.
What is Income or Wage Gap in Francis?
Income or Wage Gap in Francis is 36.4%.
Women in Francis earn 63.6 cents for every dollar earned by a man.
What is Inequality or Gini Index in Francis?
Inequality or Gini Index in Francis is 0.39.
What is the Total Population of Francis?
Total Population of Francis is 1,573.
What is the Total Male Population of Francis?
Total Male Population of Francis is 865.
What is the Total Female Population of Francis?
Total Female Population of Francis is 708.
What is the Ratio of Males per 100 Females in Francis?
There are 122.18 Males per 100 Females in Francis.
What is the Ratio of Females per 100 Males in Francis?
There are 81.85 Females per 100 Males in Francis.
What is the Median Population Age in Francis?
Median Population Age in Francis is 39.0 Years.
What is the Average Family Size in Francis
Average Family Size in Francis is 4.1 People.
What is the Average Household Size in Francis
Average Household Size in Francis is 3.4 People.
How Large is the Labor Force in Francis?
There are 870 People in the Labor Forcein in Francis.
What is the Percentage of People in the Labor Force in Francis?
69.9% of People are in the Labor Force in Francis.