Zip Codes with the Highest Percentage of Population Employed in Food Preparation & Serving in Provo, UT
RELATED REPORTS & OPTIONS
Food Preparation & Serving
Provo
Compare Zip Codes
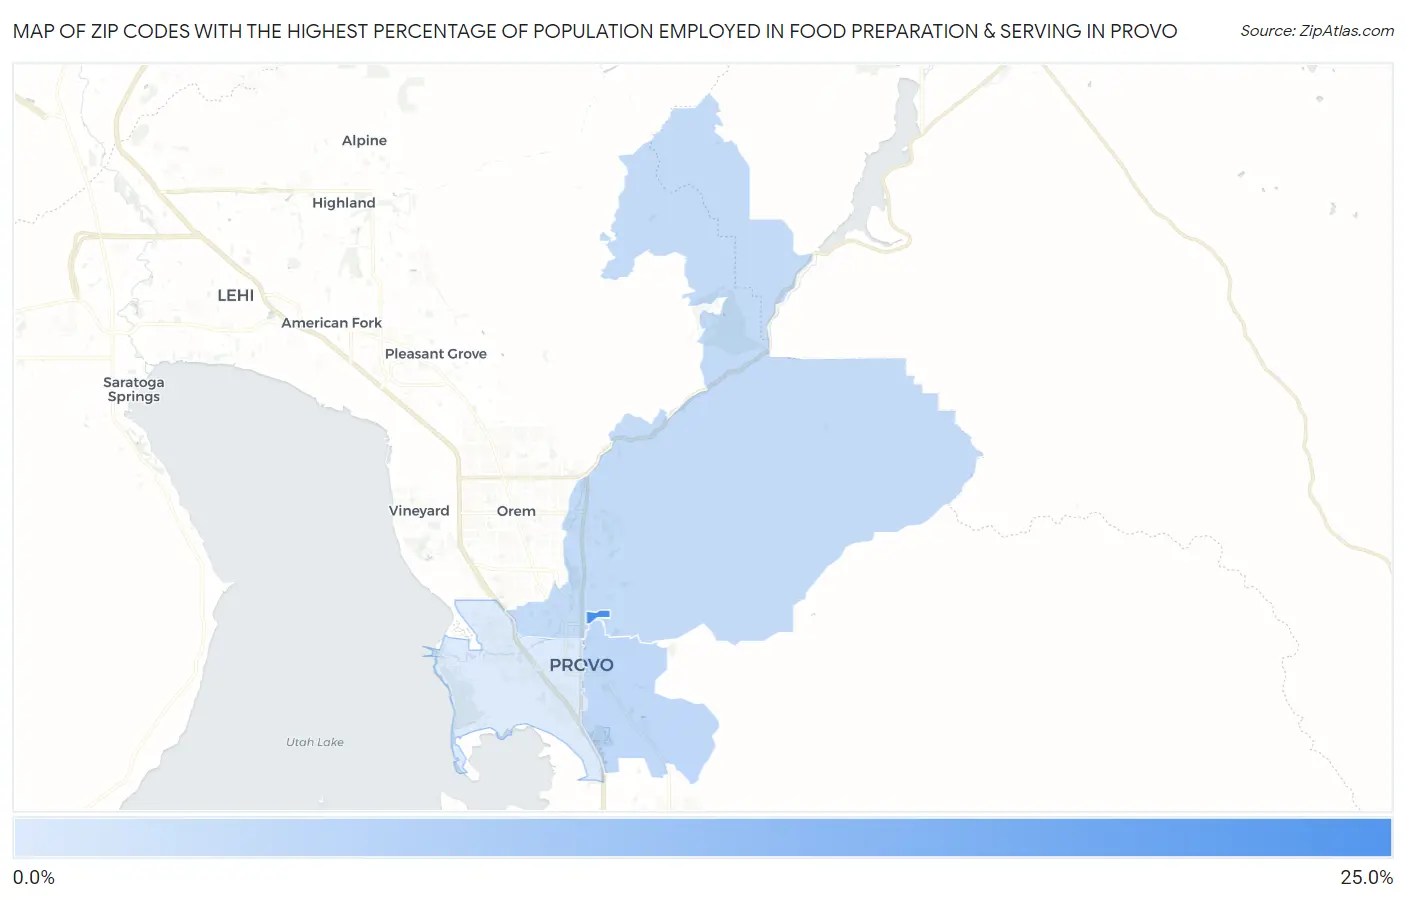
Map of Zip Codes with the Highest Percentage of Population Employed in Food Preparation & Serving in Provo
4.8%
20.7%
Zip Codes with the Highest Percentage of Population Employed in Food Preparation & Serving in Provo, UT
| Zip Code | % Employed | vs State | vs National | |
| 1. | 84602 | 20.7% | 4.5%(+16.2)#4 | 5.3%(+15.5)#465 |
| 2. | 84606 | 7.8% | 4.5%(+3.22)#33 | 5.3%(+2.47)#5,127 |
| 3. | 84604 | 7.3% | 4.5%(+2.77)#37 | 5.3%(+2.02)#5,913 |
| 4. | 84601 | 4.8% | 4.5%(+0.236)#98 | 5.3%(-0.513)#13,853 |
1
Common Questions
What are the Top 3 Zip Codes with the Highest Percentage of Population Employed in Food Preparation & Serving in Provo, UT?
Top 3 Zip Codes with the Highest Percentage of Population Employed in Food Preparation & Serving in Provo, UT are:
What zip code has the Highest Percentage of Population Employed in Food Preparation & Serving in Provo, UT?
84602 has the Highest Percentage of Population Employed in Food Preparation & Serving in Provo, UT with 20.7%.
What is the Percentage of Population Employed in Food Preparation & Serving in Provo, UT?
Percentage of Population Employed in Food Preparation & Serving in Provo is 7.0%.
What is the Percentage of Population Employed in Food Preparation & Serving in Utah?
Percentage of Population Employed in Food Preparation & Serving in Utah is 4.5%.
What is the Percentage of Population Employed in Food Preparation & Serving in the United States?
Percentage of Population Employed in Food Preparation & Serving in the United States is 5.3%.