Logan, UT Map & Demographics
Logan Map
Logan Overview
$23,391
PER CAPITA INCOME
$60,717
AVG FAMILY INCOME
$52,473
AVG HOUSEHOLD INCOME
43.0%
WAGE / INCOME GAP [ % ]
57.0¢/ $1
WAGE / INCOME GAP [ $ ]
$9,927
FAMILY INCOME DEFICIT
0.42
INEQUALITY / GINI INDEX
53,246
TOTAL POPULATION
26,646
MALE POPULATION
26,600
FEMALE POPULATION
100.17
MALES / 100 FEMALES
99.83
FEMALES / 100 MALES
23.7
MEDIAN AGE
3.1
AVG FAMILY SIZE
2.8
AVG HOUSEHOLD SIZE
31,100
LABOR FORCE [ PEOPLE ]
73.5%
PERCENT IN LABOR FORCE
2.5%
UNEMPLOYMENT RATE
Logan Area Codes
Income in Logan
Income Overview in Logan
Per Capita Income in Logan is $23,391, while median incomes of families and households are $60,717 and $52,473 respectively.
| Characteristic | Number | Measure |
| Per Capita Income | 53,246 | $23,391 |
| Median Family Income | 11,629 | $60,717 |
| Mean Family Income | 11,629 | $74,433 |
| Median Household Income | 17,637 | $52,473 |
| Mean Household Income | 17,637 | $67,543 |
| Income Deficit | 11,629 | $9,927 |
| Wage / Income Gap (%) | 53,246 | 42.97% |
| Wage / Income Gap ($) | 53,246 | 57.03¢ per $1 |
| Gini / Inequality Index | 53,246 | 0.42 |
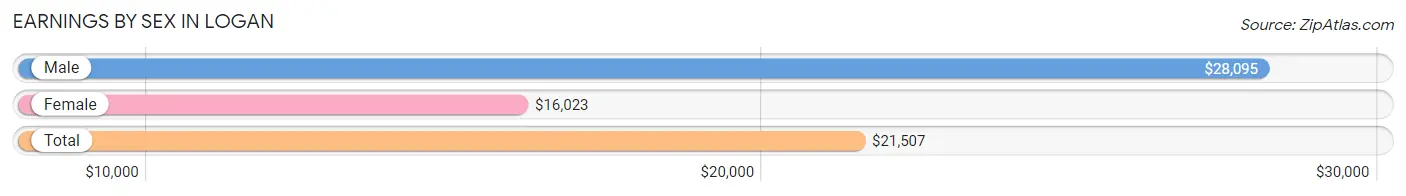
Earnings by Sex in Logan
Average Earnings in Logan are $21,507, $28,095 for men and $16,023 for women, a difference of 43.0%.
| Sex | Number | Average Earnings |
| Male | 17,980 (53.3%) | $28,095 |
| Female | 15,737 (46.7%) | $16,023 |
| Total | 33,717 (100.0%) | $21,507 |
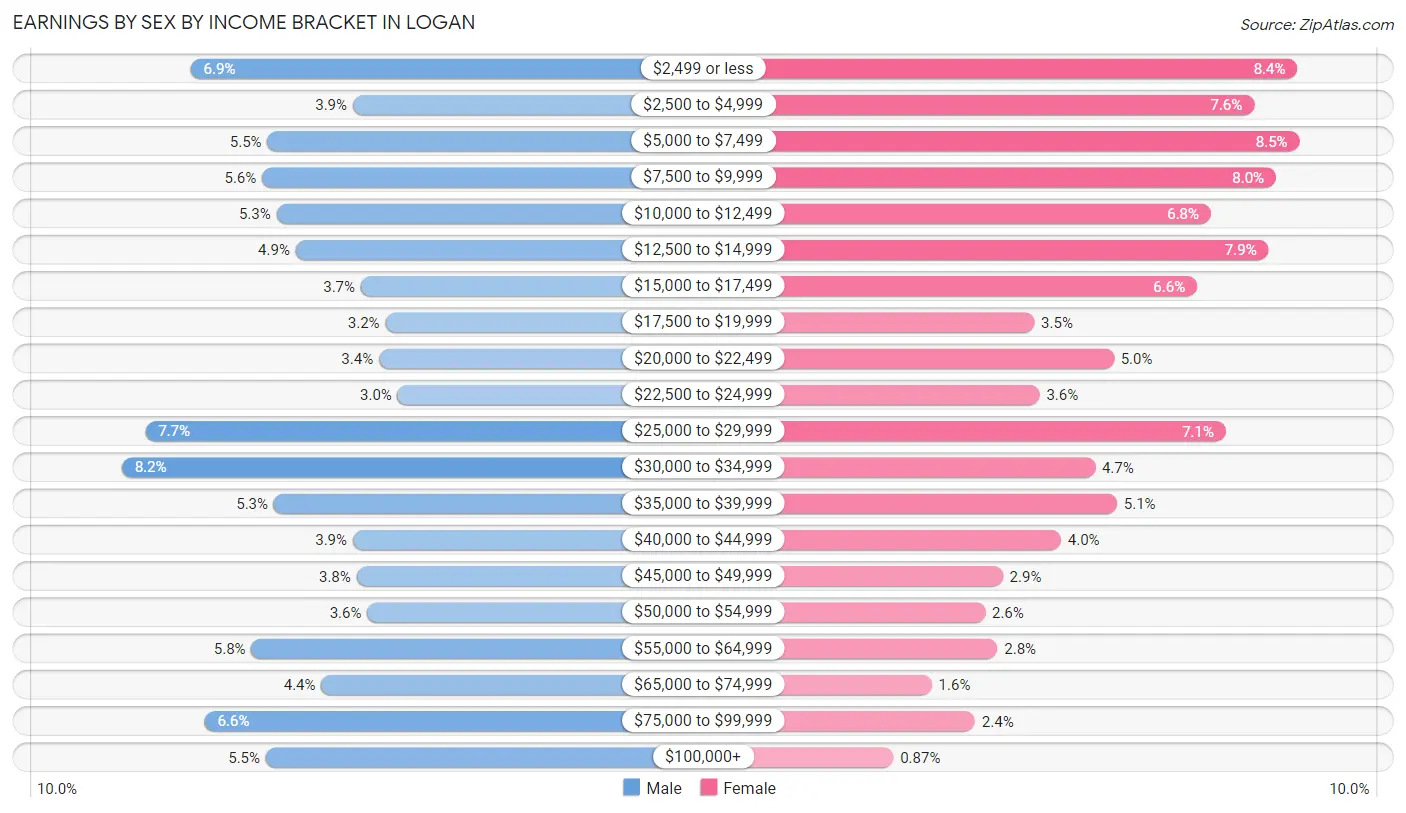
Earnings by Sex by Income Bracket in Logan
The most common earnings brackets in Logan are $30,000 to $34,999 for men (1,470 | 8.2%) and $5,000 to $7,499 for women (1,335 | 8.5%).
| Income | Male | Female |
| $2,499 or less | 1,238 (6.9%) | 1,328 (8.4%) |
| $2,500 to $4,999 | 692 (3.8%) | 1,201 (7.6%) |
| $5,000 to $7,499 | 980 (5.4%) | 1,335 (8.5%) |
| $7,500 to $9,999 | 997 (5.6%) | 1,266 (8.0%) |
| $10,000 to $12,499 | 950 (5.3%) | 1,073 (6.8%) |
| $12,500 to $14,999 | 885 (4.9%) | 1,243 (7.9%) |
| $15,000 to $17,499 | 666 (3.7%) | 1,032 (6.6%) |
| $17,500 to $19,999 | 582 (3.2%) | 552 (3.5%) |
| $20,000 to $22,499 | 604 (3.4%) | 787 (5.0%) |
| $22,500 to $24,999 | 542 (3.0%) | 568 (3.6%) |
| $25,000 to $29,999 | 1,392 (7.7%) | 1,118 (7.1%) |
| $30,000 to $34,999 | 1,470 (8.2%) | 731 (4.6%) |
| $35,000 to $39,999 | 958 (5.3%) | 796 (5.1%) |
| $40,000 to $44,999 | 693 (3.8%) | 631 (4.0%) |
| $45,000 to $49,999 | 679 (3.8%) | 460 (2.9%) |
| $50,000 to $54,999 | 643 (3.6%) | 408 (2.6%) |
| $55,000 to $64,999 | 1,033 (5.8%) | 443 (2.8%) |
| $65,000 to $74,999 | 798 (4.4%) | 251 (1.6%) |
| $75,000 to $99,999 | 1,192 (6.6%) | 377 (2.4%) |
| $100,000+ | 986 (5.5%) | 137 (0.9%) |
| Total | 17,980 (100.0%) | 15,737 (100.0%) |
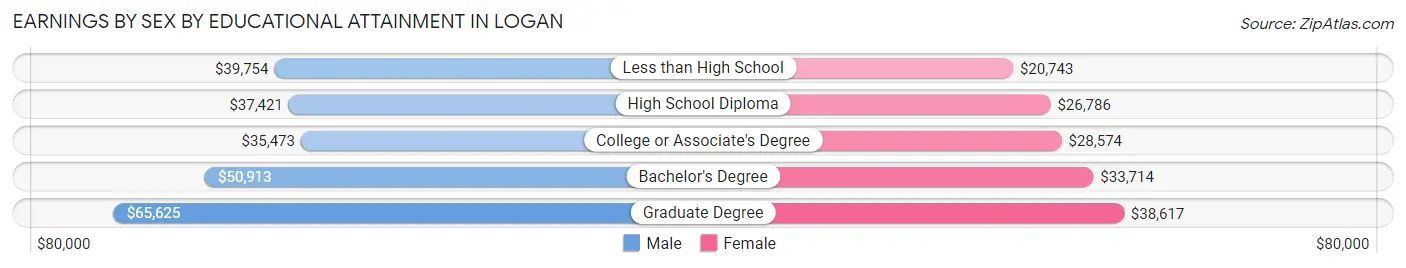
Earnings by Sex by Educational Attainment in Logan
Average earnings in Logan are $41,493 for men and $29,411 for women, a difference of 29.1%. Men with an educational attainment of graduate degree enjoy the highest average annual earnings of $65,625, while those with college or associate's degree education earn the least with $35,473. Women with an educational attainment of graduate degree earn the most with the average annual earnings of $38,617, while those with less than high school education have the smallest earnings of $20,743.
| Educational Attainment | Male Income | Female Income |
| Less than High School | $39,754 | $20,743 |
| High School Diploma | $37,421 | $26,786 |
| College or Associate's Degree | $35,473 | $28,574 |
| Bachelor's Degree | $50,913 | $33,714 |
| Graduate Degree | $65,625 | $38,617 |
| Total | $41,493 | $29,411 |
Family Income in Logan
Family Income Brackets in Logan
According to the Logan family income data, there are 2,175 families falling into the $50,000 to $74,999 income range, which is the most common income bracket and makes up 18.7% of all families. Conversely, the $200,000+ income bracket is the least frequent group with only 395 families (3.4%) belonging to this category.
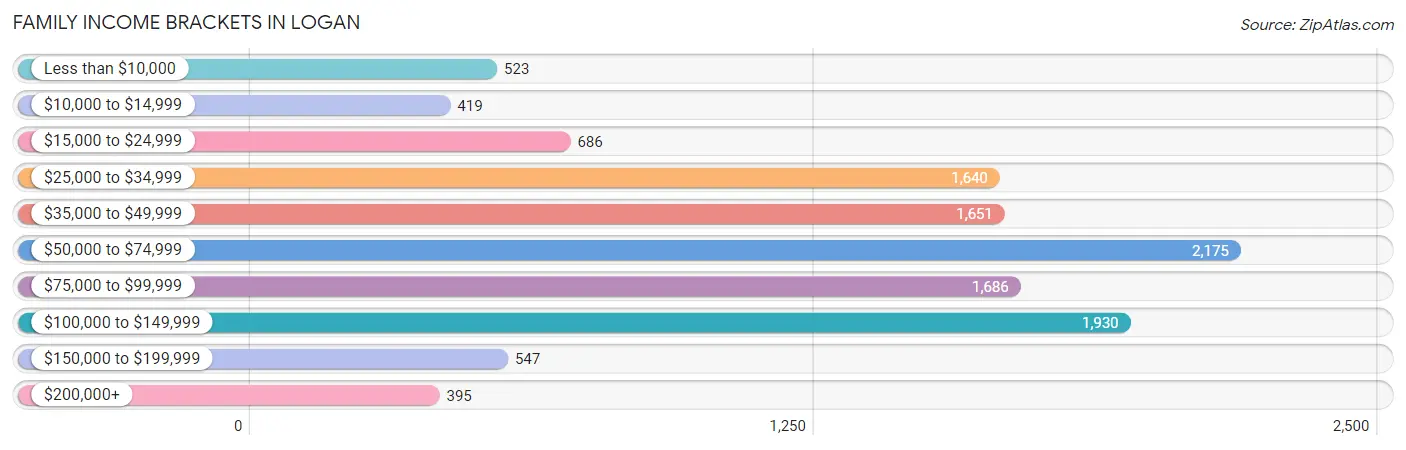
| Income Bracket | # Families | % Families |
| Less than $10,000 | 523 | 4.5% |
| $10,000 to $14,999 | 419 | 3.6% |
| $15,000 to $24,999 | 686 | 5.9% |
| $25,000 to $34,999 | 1,640 | 14.1% |
| $35,000 to $49,999 | 1,651 | 14.2% |
| $50,000 to $74,999 | 2,175 | 18.7% |
| $75,000 to $99,999 | 1,686 | 14.5% |
| $100,000 to $149,999 | 1,930 | 16.6% |
| $150,000 to $199,999 | 547 | 4.7% |
| $200,000+ | 395 | 3.4% |
Family Income by Famaliy Size in Logan
5-person families (991 | 8.5%) account for the highest median family income in Logan with $92,740 per family, while 2-person families (5,866 | 50.4%) have the highest median income of $25,872 per family member.
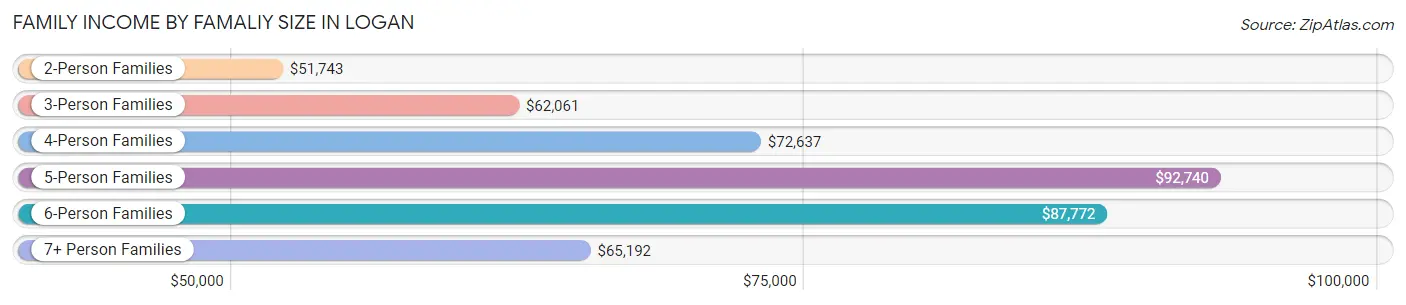
| Income Bracket | # Families | Median Income |
| 2-Person Families | 5,866 (50.4%) | $51,743 |
| 3-Person Families | 2,095 (18.0%) | $62,061 |
| 4-Person Families | 1,760 (15.1%) | $72,637 |
| 5-Person Families | 991 (8.5%) | $92,740 |
| 6-Person Families | 613 (5.3%) | $87,772 |
| 7+ Person Families | 304 (2.6%) | $65,192 |
| Total | 11,629 (100.0%) | $60,717 |
Family Income by Number of Earners in Logan
The median family income in Logan is $60,717, with families comprising 3+ earners (1,020) having the highest median family income of $98,750, while families with no earners (770) have the lowest median family income of $36,371, accounting for 8.8% and 6.6% of families, respectively.
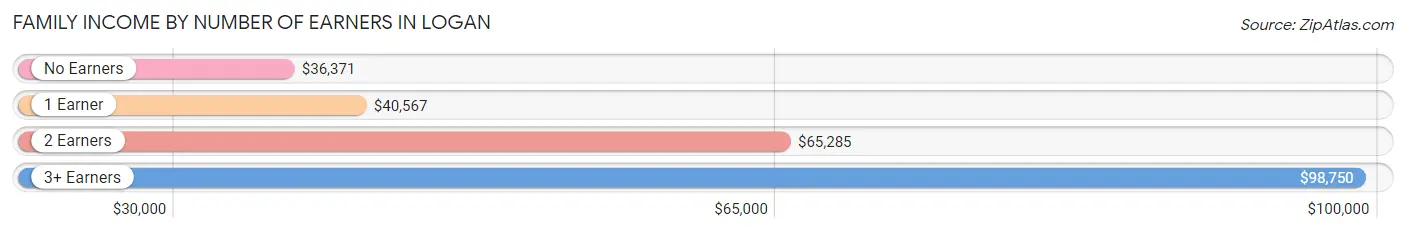
| Number of Earners | # Families | Median Income |
| No Earners | 770 (6.6%) | $36,371 |
| 1 Earner | 3,572 (30.7%) | $40,567 |
| 2 Earners | 6,267 (53.9%) | $65,285 |
| 3+ Earners | 1,020 (8.8%) | $98,750 |
| Total | 11,629 (100.0%) | $60,717 |
Household Income in Logan
Household Income Brackets in Logan
With 3,298 households falling in the category, the $50,000 to $74,999 income range is the most frequent in Logan, accounting for 18.7% of all households. In contrast, only 476 households (2.7%) fall into the $200,000+ income bracket, making it the least populous group.
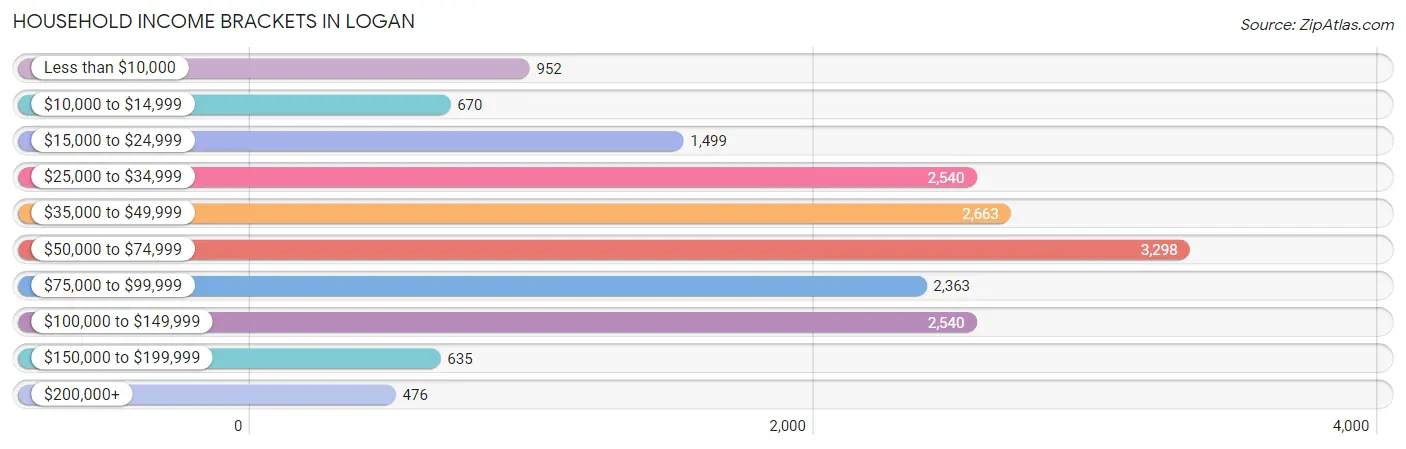
| Income Bracket | # Households | % Households |
| Less than $10,000 | 952 | 5.4% |
| $10,000 to $14,999 | 670 | 3.8% |
| $15,000 to $24,999 | 1,499 | 8.5% |
| $25,000 to $34,999 | 2,540 | 14.4% |
| $35,000 to $49,999 | 2,663 | 15.1% |
| $50,000 to $74,999 | 3,298 | 18.7% |
| $75,000 to $99,999 | 2,363 | 13.4% |
| $100,000 to $149,999 | 2,540 | 14.4% |
| $150,000 to $199,999 | 635 | 3.6% |
| $200,000+ | 476 | 2.7% |
Household Income by Householder Age in Logan
The median household income in Logan is $52,473, with the highest median household income of $67,828 found in the 45 to 64 years age bracket for the primary householder. A total of 3,440 households (19.5%) fall into this category. Meanwhile, the 15 to 24 years age bracket for the primary householder has the lowest median household income of $33,513, with 4,686 households (26.6%) in this group.
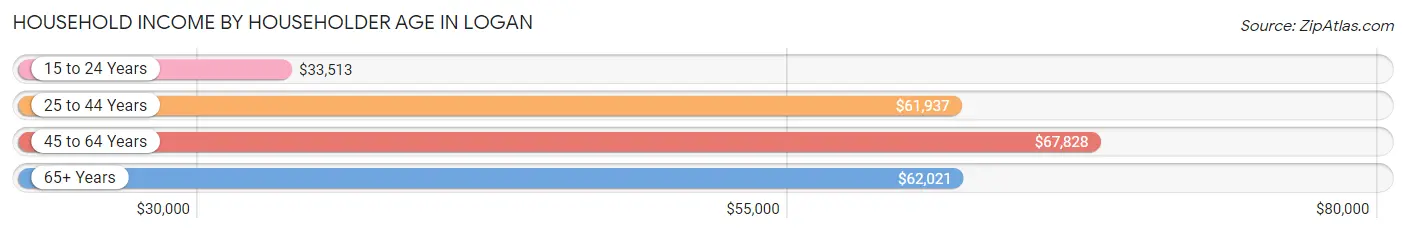
| Income Bracket | # Households | Median Income |
| 15 to 24 Years | 4,686 (26.6%) | $33,513 |
| 25 to 44 Years | 7,334 (41.6%) | $61,937 |
| 45 to 64 Years | 3,440 (19.5%) | $67,828 |
| 65+ Years | 2,177 (12.3%) | $62,021 |
| Total | 17,637 (100.0%) | $52,473 |
Poverty in Logan
Income Below Poverty by Sex and Age in Logan
With 22.7% poverty level for males and 25.5% for females among the residents of Logan, 15 year old males and 18 to 24 year old females are the most vulnerable to poverty, with 258 males (55.2%) and 3,367 females (42.4%) in their respective age groups living below the poverty level.
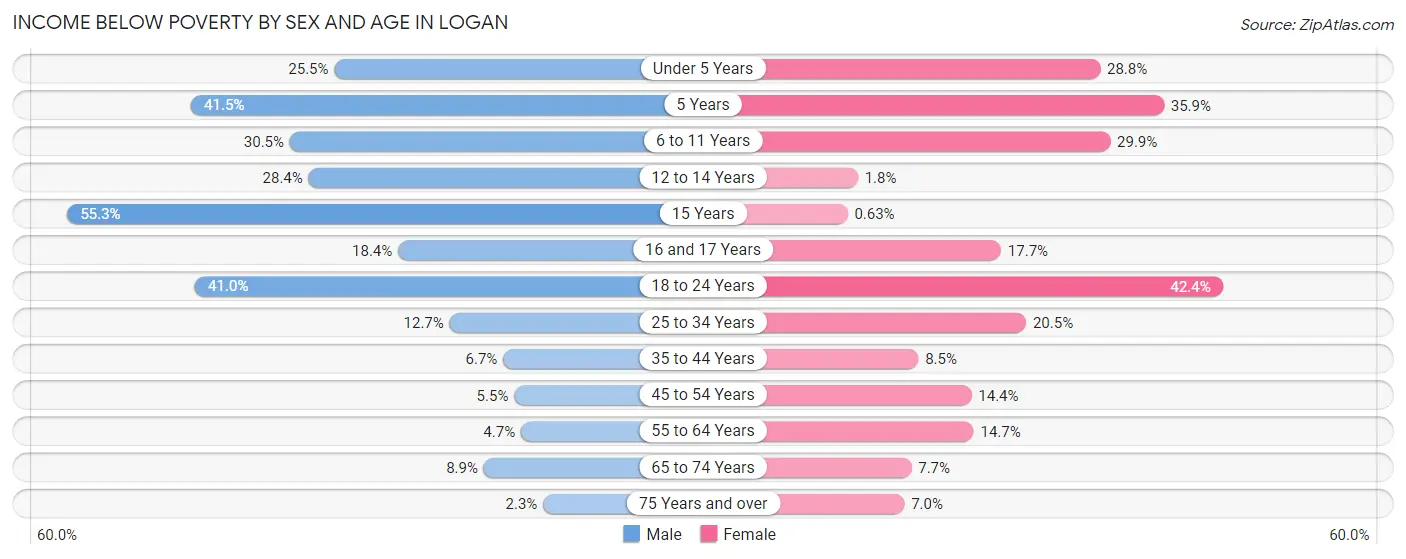
| Age Bracket | Male | Female |
| Under 5 Years | 527 (25.5%) | 579 (28.8%) |
| 5 Years | 114 (41.4%) | 104 (35.9%) |
| 6 to 11 Years | 601 (30.5%) | 608 (29.9%) |
| 12 to 14 Years | 204 (28.4%) | 13 (1.8%) |
| 15 Years | 258 (55.2%) | 2 (0.6%) |
| 16 and 17 Years | 124 (18.4%) | 95 (17.7%) |
| 18 to 24 Years | 2,754 (41.0%) | 3,367 (42.4%) |
| 25 to 34 Years | 685 (12.7%) | 808 (20.5%) |
| 35 to 44 Years | 155 (6.7%) | 194 (8.5%) |
| 45 to 54 Years | 90 (5.5%) | 220 (14.4%) |
| 55 to 64 Years | 51 (4.7%) | 206 (14.7%) |
| 65 to 74 Years | 77 (8.9%) | 73 (7.7%) |
| 75 Years and over | 17 (2.2%) | 59 (7.0%) |
| Total | 5,657 (22.7%) | 6,328 (25.5%) |
Income Above Poverty by Sex and Age in Logan
According to the poverty statistics in Logan, males aged 75 years and over and females aged 15 years are the age groups that are most secure financially, with 97.8% of males and 99.4% of females in these age groups living above the poverty line.
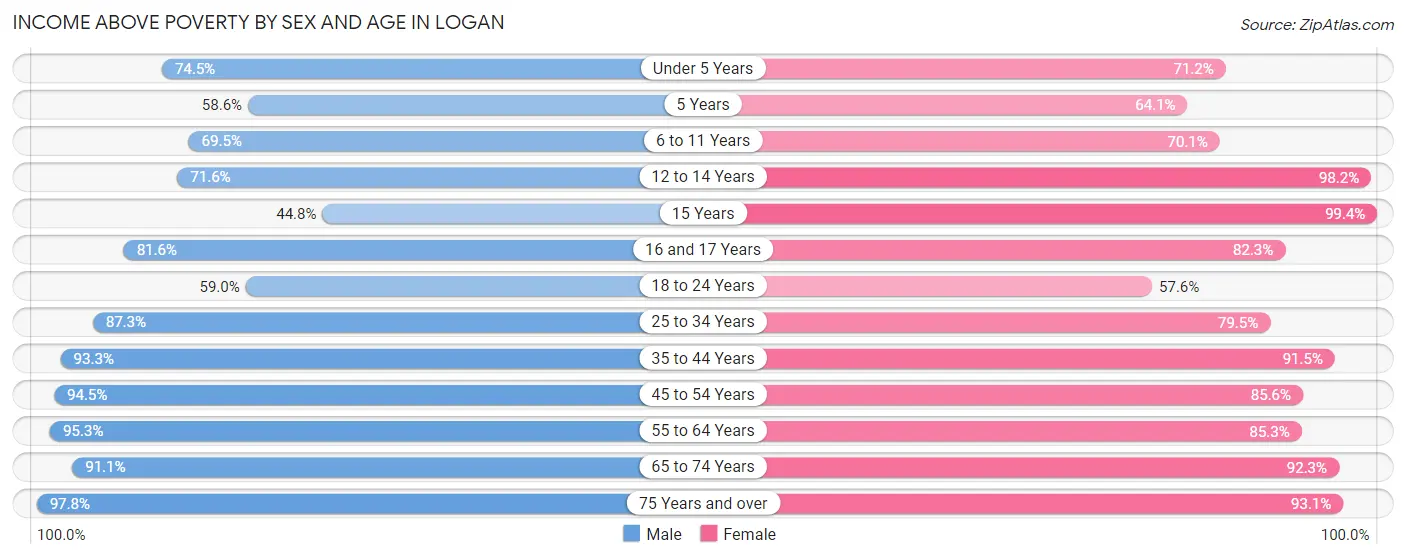
| Age Bracket | Male | Female |
| Under 5 Years | 1,540 (74.5%) | 1,434 (71.2%) |
| 5 Years | 161 (58.6%) | 186 (64.1%) |
| 6 to 11 Years | 1,372 (69.5%) | 1,427 (70.1%) |
| 12 to 14 Years | 515 (71.6%) | 720 (98.2%) |
| 15 Years | 209 (44.8%) | 317 (99.4%) |
| 16 and 17 Years | 550 (81.6%) | 441 (82.3%) |
| 18 to 24 Years | 3,961 (59.0%) | 4,574 (57.6%) |
| 25 to 34 Years | 4,720 (87.3%) | 3,131 (79.5%) |
| 35 to 44 Years | 2,160 (93.3%) | 2,085 (91.5%) |
| 45 to 54 Years | 1,556 (94.5%) | 1,305 (85.6%) |
| 55 to 64 Years | 1,029 (95.3%) | 1,198 (85.3%) |
| 65 to 74 Years | 792 (91.1%) | 870 (92.3%) |
| 75 Years and over | 739 (97.8%) | 790 (93.0%) |
| Total | 19,304 (77.3%) | 18,478 (74.5%) |
Income Below Poverty Among Married-Couple Families in Logan
The poverty statistics for married-couple families in Logan show that 12.1% or 1,097 of the total 9,055 families live below the poverty line. Families with 3 or 4 children have the highest poverty rate of 21.6%, comprising of 265 families. On the other hand, families with 5 or more children have the lowest poverty rate of 5.0%, which includes 8 families.
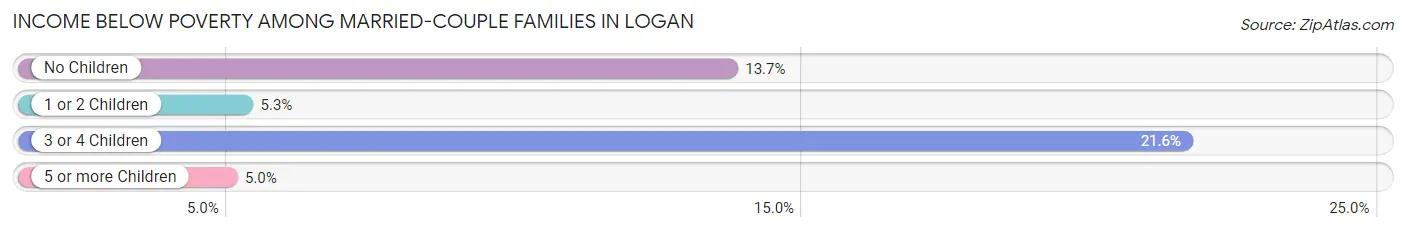
| Children | Above Poverty | Below Poverty |
| No Children | 4,291 (86.3%) | 682 (13.7%) |
| 1 or 2 Children | 2,554 (94.7%) | 142 (5.3%) |
| 3 or 4 Children | 961 (78.4%) | 265 (21.6%) |
| 5 or more Children | 152 (95.0%) | 8 (5.0%) |
| Total | 7,958 (87.9%) | 1,097 (12.1%) |
Income Below Poverty Among Single-Parent Households in Logan
According to the poverty data in Logan, 10.5% or 67 single-father households and 29.8% or 577 single-mother households are living below the poverty line. Among single-father households, those with 1 or 2 children have the highest poverty rate, with 32 households (12.1%) experiencing poverty. Likewise, among single-mother households, those with 5 or more children have the highest poverty rate, with 91 households (100.0%) falling below the poverty line.
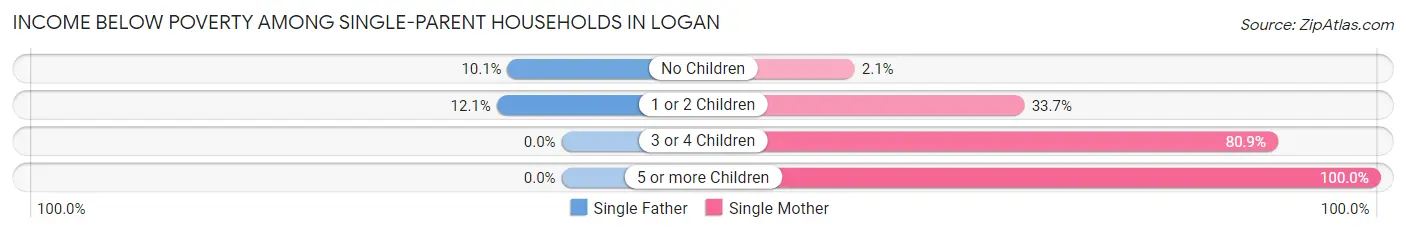
| Children | Single Father | Single Mother |
| No Children | 35 (10.1%) | 14 (2.1%) |
| 1 or 2 Children | 32 (12.1%) | 341 (33.7%) |
| 3 or 4 Children | 0 (0.0%) | 131 (80.9%) |
| 5 or more Children | 0 (0.0%) | 91 (100.0%) |
| Total | 67 (10.5%) | 577 (29.8%) |
Income Below Poverty Among Married-Couple vs Single-Parent Households in Logan
The poverty data for Logan shows that 1,097 of the married-couple family households (12.1%) and 644 of the single-parent households (25.0%) are living below the poverty level. Within the married-couple family households, those with 3 or 4 children have the highest poverty rate, with 265 households (21.6%) falling below the poverty line. Among the single-parent households, those with 5 or more children have the highest poverty rate, with 91 household (91.9%) living below poverty.
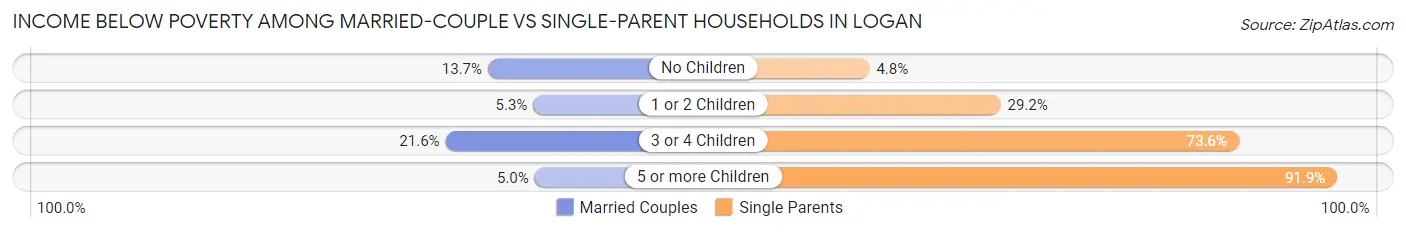
| Children | Married-Couple Families | Single-Parent Households |
| No Children | 682 (13.7%) | 49 (4.8%) |
| 1 or 2 Children | 142 (5.3%) | 373 (29.2%) |
| 3 or 4 Children | 265 (21.6%) | 131 (73.6%) |
| 5 or more Children | 8 (5.0%) | 91 (91.9%) |
| Total | 1,097 (12.1%) | 644 (25.0%) |
Race in Logan
The most populous races in Logan are White / Caucasian (44,290 | 83.2%), Hispanic or Latino (7,539 | 14.2%), and Two or more Races (3,712 | 7.0%).
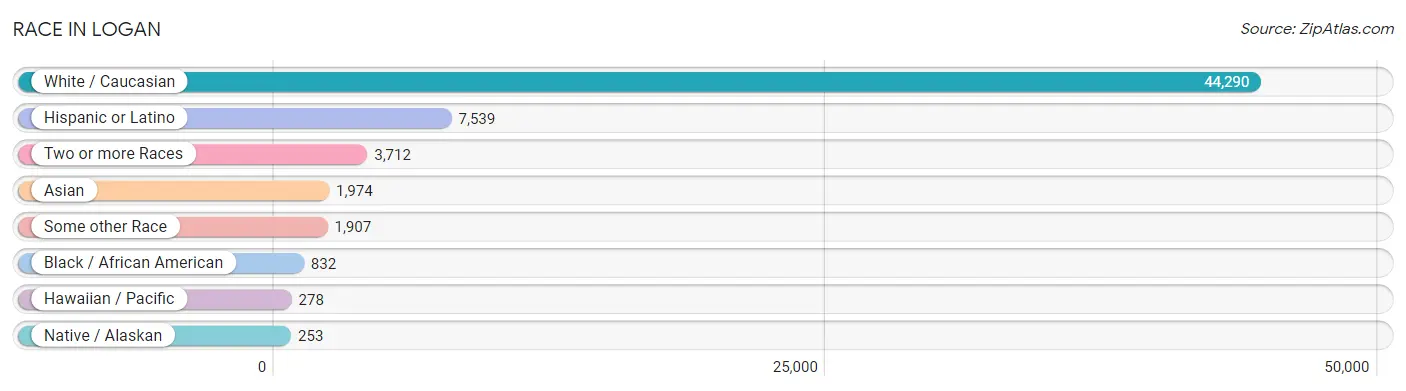
| Race | # Population | % Population |
| Asian | 1,974 | 3.7% |
| Black / African American | 832 | 1.6% |
| Hawaiian / Pacific | 278 | 0.5% |
| Hispanic or Latino | 7,539 | 14.2% |
| Native / Alaskan | 253 | 0.5% |
| White / Caucasian | 44,290 | 83.2% |
| Two or more Races | 3,712 | 7.0% |
| Some other Race | 1,907 | 3.6% |
| Total | 53,246 | 100.0% |
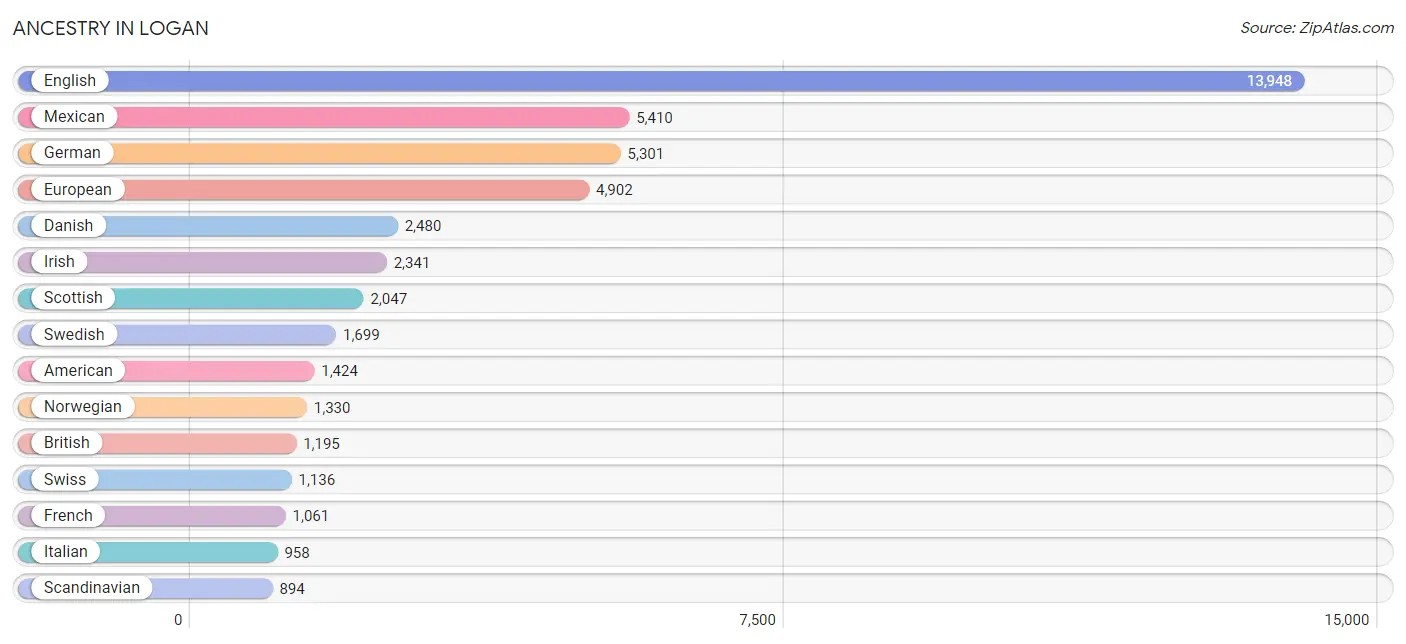
Ancestry in Logan
The most populous ancestries reported in Logan are English (13,948 | 26.2%), Mexican (5,410 | 10.2%), German (5,301 | 10.0%), European (4,902 | 9.2%), and Danish (2,480 | 4.7%), together accounting for 60.2% of all Logan residents.
| Ancestry | # Population | % Population |
| African | 414 | 0.8% |
| Alaska Native | 33 | 0.1% |
| American | 1,424 | 2.7% |
| Arab | 79 | 0.2% |
| Argentinean | 86 | 0.2% |
| Armenian | 4 | 0.0% |
| Australian | 22 | 0.0% |
| Austrian | 4 | 0.0% |
| Basque | 31 | 0.1% |
| Belgian | 26 | 0.1% |
| Bhutanese | 318 | 0.6% |
| Blackfeet | 81 | 0.2% |
| Bolivian | 54 | 0.1% |
| Brazilian | 57 | 0.1% |
| British | 1,195 | 2.2% |
| Burmese | 138 | 0.3% |
| Canadian | 193 | 0.4% |
| Central American | 497 | 0.9% |
| Cherokee | 8 | 0.0% |
| Cheyenne | 17 | 0.0% |
| Chickasaw | 82 | 0.2% |
| Chilean | 70 | 0.1% |
| Choctaw | 12 | 0.0% |
| Colombian | 101 | 0.2% |
| Costa Rican | 1 | 0.0% |
| Croatian | 17 | 0.0% |
| Crow | 122 | 0.2% |
| Cuban | 14 | 0.0% |
| Czech | 40 | 0.1% |
| Czechoslovakian | 63 | 0.1% |
| Danish | 2,480 | 4.7% |
| Delaware | 68 | 0.1% |
| Dutch | 714 | 1.3% |
| Dutch West Indian | 62 | 0.1% |
| Eastern European | 175 | 0.3% |
| Ecuadorian | 58 | 0.1% |
| Egyptian | 1 | 0.0% |
| English | 13,948 | 26.2% |
| Ethiopian | 95 | 0.2% |
| European | 4,902 | 9.2% |
| Fijian | 44 | 0.1% |
| Filipino | 38 | 0.1% |
| Finnish | 255 | 0.5% |
| French | 1,061 | 2.0% |
| French Canadian | 15 | 0.0% |
| German | 5,301 | 10.0% |
| Greek | 45 | 0.1% |
| Guamanian / Chamorro | 10 | 0.0% |
| Guatemalan | 226 | 0.4% |
| Haitian | 112 | 0.2% |
| Hungarian | 272 | 0.5% |
| Icelander | 71 | 0.1% |
| Indian (Asian) | 546 | 1.0% |
| Indonesian | 158 | 0.3% |
| Iranian | 18 | 0.0% |
| Irish | 2,341 | 4.4% |
| Iroquois | 21 | 0.0% |
| Italian | 958 | 1.8% |
| Jamaican | 16 | 0.0% |
| Japanese | 258 | 0.5% |
| Korean | 381 | 0.7% |
| Lithuanian | 14 | 0.0% |
| Mexican | 5,410 | 10.2% |
| Mexican American Indian | 140 | 0.3% |
| Moroccan | 7 | 0.0% |
| Native Hawaiian | 46 | 0.1% |
| Navajo | 224 | 0.4% |
| Nigerian | 114 | 0.2% |
| Northern European | 200 | 0.4% |
| Norwegian | 1,330 | 2.5% |
| Paiute | 4 | 0.0% |
| Pakistani | 192 | 0.4% |
| Pennsylvania German | 57 | 0.1% |
| Peruvian | 217 | 0.4% |
| Polish | 200 | 0.4% |
| Portuguese | 134 | 0.3% |
| Puerto Rican | 379 | 0.7% |
| Puget Sound Salish | 21 | 0.0% |
| Romanian | 6 | 0.0% |
| Russian | 377 | 0.7% |
| Salvadoran | 270 | 0.5% |
| Samoan | 111 | 0.2% |
| Scandinavian | 894 | 1.7% |
| Scotch-Irish | 421 | 0.8% |
| Scottish | 2,047 | 3.8% |
| Serbian | 38 | 0.1% |
| Shoshone | 38 | 0.1% |
| Sioux | 6 | 0.0% |
| Slovak | 15 | 0.0% |
| Slovene | 7 | 0.0% |
| Somali | 120 | 0.2% |
| South American | 666 | 1.3% |
| South American Indian | 51 | 0.1% |
| Spaniard | 151 | 0.3% |
| Spanish | 82 | 0.2% |
| Sri Lankan | 144 | 0.3% |
| Subsaharan African | 784 | 1.5% |
| Swedish | 1,699 | 3.2% |
| Swiss | 1,136 | 2.1% |
| Thai | 152 | 0.3% |
| Tongan | 61 | 0.1% |
| Turkish | 19 | 0.0% |
| Ukrainian | 80 | 0.2% |
| Ute | 10 | 0.0% |
| Venezuelan | 80 | 0.2% |
| Welsh | 884 | 1.7% |
| Yugoslavian | 7 | 0.0% | View All 107 Rows |
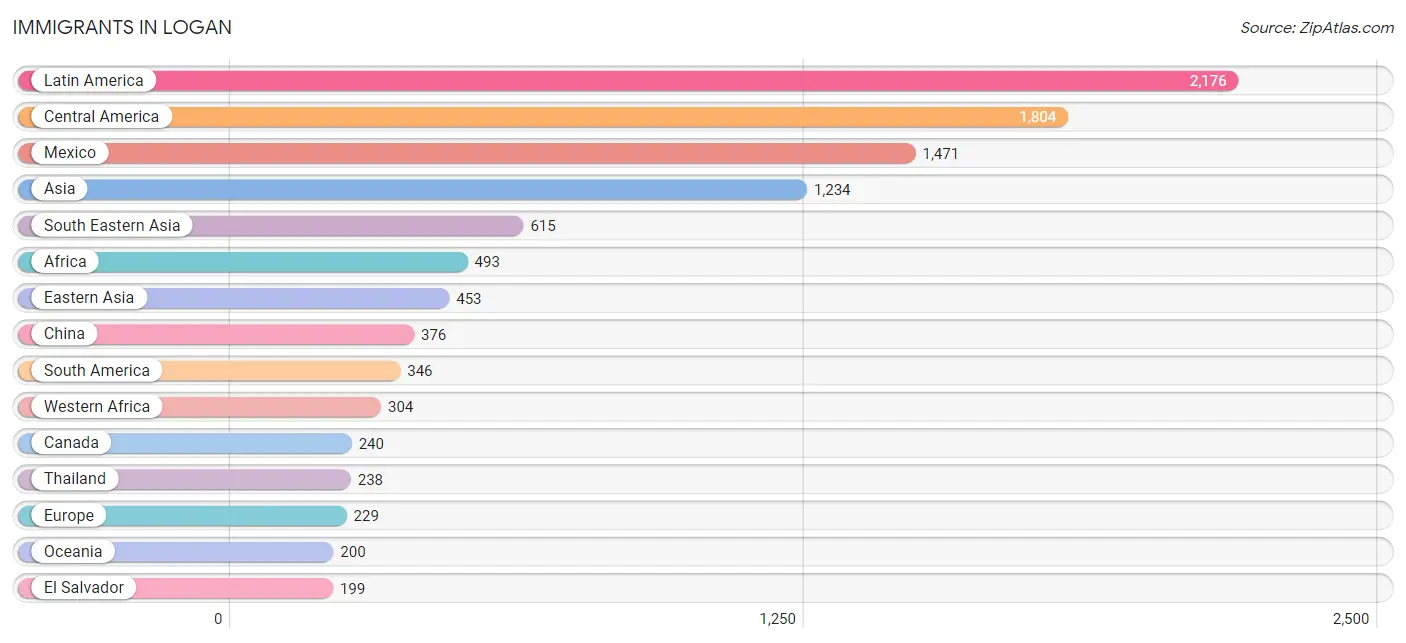
Immigrants in Logan
The most numerous immigrant groups reported in Logan came from Latin America (2,176 | 4.1%), Central America (1,804 | 3.4%), Mexico (1,471 | 2.8%), Asia (1,234 | 2.3%), and South Eastern Asia (615 | 1.2%), together accounting for 13.7% of all Logan residents.
| Immigration Origin | # Population | % Population |
| Africa | 493 | 0.9% |
| Argentina | 74 | 0.1% |
| Asia | 1,234 | 2.3% |
| Australia | 9 | 0.0% |
| Bangladesh | 19 | 0.0% |
| Bolivia | 21 | 0.0% |
| Brazil | 123 | 0.2% |
| Cambodia | 68 | 0.1% |
| Canada | 240 | 0.4% |
| Caribbean | 26 | 0.1% |
| Central America | 1,804 | 3.4% |
| Chile | 19 | 0.0% |
| China | 376 | 0.7% |
| Denmark | 14 | 0.0% |
| Dominican Republic | 21 | 0.0% |
| Eastern Africa | 173 | 0.3% |
| Eastern Asia | 453 | 0.9% |
| Eastern Europe | 17 | 0.0% |
| Ecuador | 17 | 0.0% |
| El Salvador | 199 | 0.4% |
| England | 18 | 0.0% |
| Ethiopia | 44 | 0.1% |
| Europe | 229 | 0.4% |
| France | 14 | 0.0% |
| Germany | 31 | 0.1% |
| Ghana | 129 | 0.2% |
| Guatemala | 134 | 0.3% |
| Hong Kong | 38 | 0.1% |
| India | 72 | 0.1% |
| Iraq | 18 | 0.0% |
| Ireland | 9 | 0.0% |
| Jamaica | 5 | 0.0% |
| Japan | 28 | 0.1% |
| Korea | 49 | 0.1% |
| Laos | 12 | 0.0% |
| Latin America | 2,176 | 4.1% |
| Mexico | 1,471 | 2.8% |
| Micronesia | 41 | 0.1% |
| Middle Africa | 16 | 0.0% |
| Nepal | 35 | 0.1% |
| Nigeria | 50 | 0.1% |
| Northern Europe | 116 | 0.2% |
| Oceania | 200 | 0.4% |
| Pakistan | 8 | 0.0% |
| Peru | 55 | 0.1% |
| Philippines | 43 | 0.1% |
| Poland | 10 | 0.0% |
| Russia | 7 | 0.0% |
| Scotland | 57 | 0.1% |
| Somalia | 120 | 0.2% |
| South America | 346 | 0.6% |
| South Central Asia | 134 | 0.3% |
| South Eastern Asia | 615 | 1.2% |
| Southern Europe | 45 | 0.1% |
| Spain | 45 | 0.1% |
| Sweden | 18 | 0.0% |
| Taiwan | 74 | 0.1% |
| Thailand | 238 | 0.4% |
| Turkey | 10 | 0.0% |
| Venezuela | 37 | 0.1% |
| Vietnam | 83 | 0.2% |
| Western Africa | 304 | 0.6% |
| Western Asia | 32 | 0.1% |
| Western Europe | 51 | 0.1% |
| Yemen | 4 | 0.0% |
| Zaire | 10 | 0.0% | View All 66 Rows |
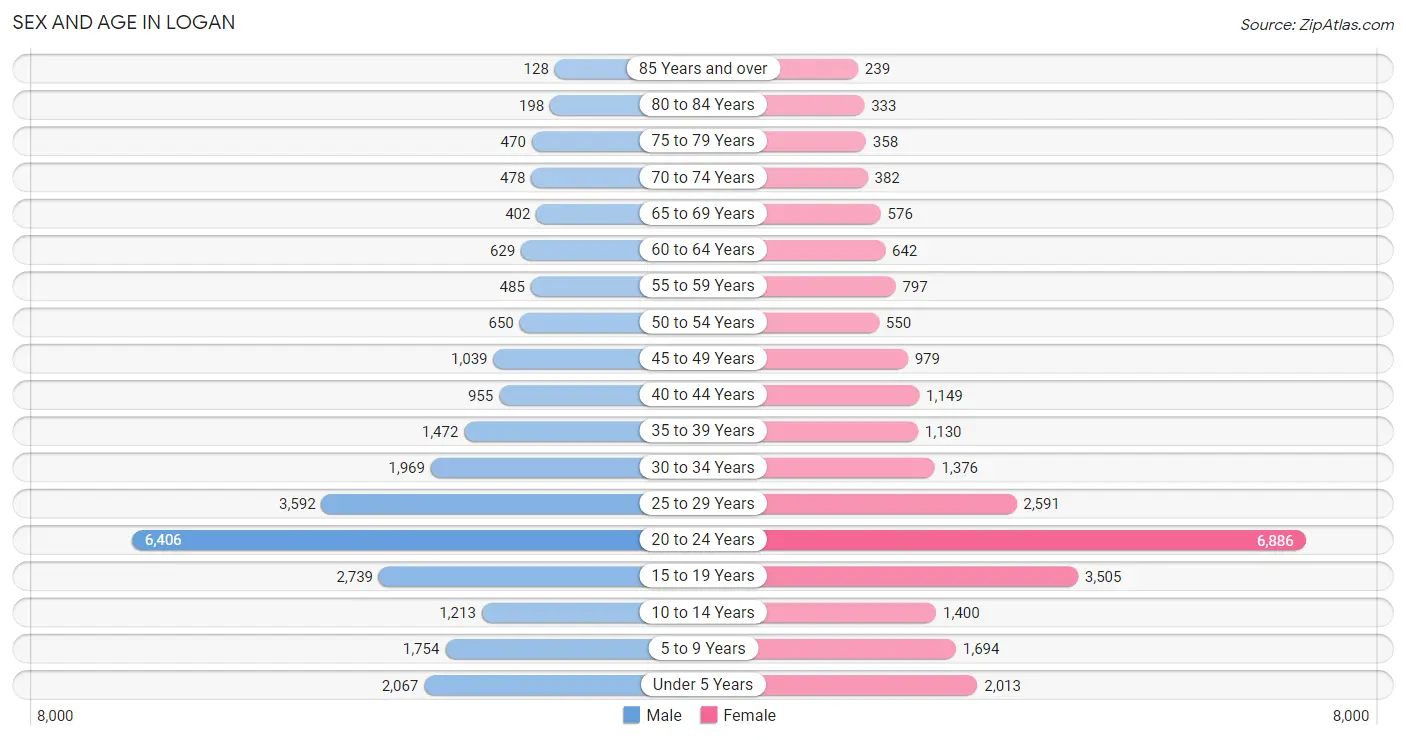
Sex and Age in Logan
Sex and Age in Logan
The most populous age groups in Logan are 20 to 24 Years (6,406 | 24.0%) for men and 20 to 24 Years (6,886 | 25.9%) for women.
| Age Bracket | Male | Female |
| Under 5 Years | 2,067 (7.8%) | 2,013 (7.6%) |
| 5 to 9 Years | 1,754 (6.6%) | 1,694 (6.4%) |
| 10 to 14 Years | 1,213 (4.5%) | 1,400 (5.3%) |
| 15 to 19 Years | 2,739 (10.3%) | 3,505 (13.2%) |
| 20 to 24 Years | 6,406 (24.0%) | 6,886 (25.9%) |
| 25 to 29 Years | 3,592 (13.5%) | 2,591 (9.7%) |
| 30 to 34 Years | 1,969 (7.4%) | 1,376 (5.2%) |
| 35 to 39 Years | 1,472 (5.5%) | 1,130 (4.3%) |
| 40 to 44 Years | 955 (3.6%) | 1,149 (4.3%) |
| 45 to 49 Years | 1,039 (3.9%) | 979 (3.7%) |
| 50 to 54 Years | 650 (2.4%) | 550 (2.1%) |
| 55 to 59 Years | 485 (1.8%) | 797 (3.0%) |
| 60 to 64 Years | 629 (2.4%) | 642 (2.4%) |
| 65 to 69 Years | 402 (1.5%) | 576 (2.2%) |
| 70 to 74 Years | 478 (1.8%) | 382 (1.4%) |
| 75 to 79 Years | 470 (1.8%) | 358 (1.3%) |
| 80 to 84 Years | 198 (0.7%) | 333 (1.3%) |
| 85 Years and over | 128 (0.5%) | 239 (0.9%) |
| Total | 26,646 (100.0%) | 26,600 (100.0%) |
Families and Households in Logan
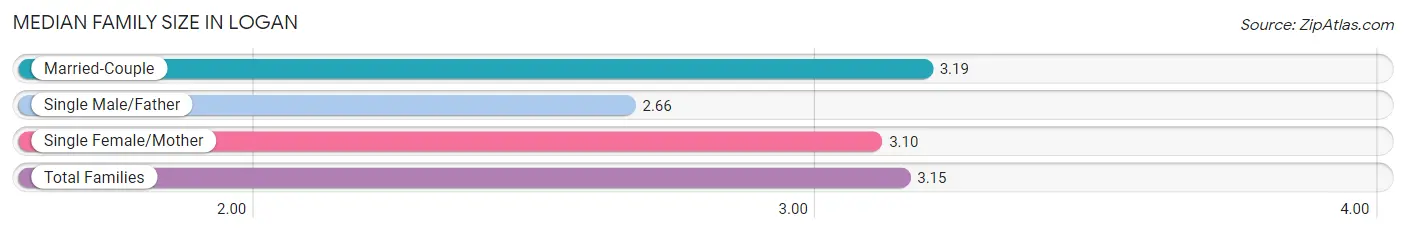
Median Family Size in Logan
The median family size in Logan is 3.15 persons per family, with married-couple families (9,055 | 77.9%) accounting for the largest median family size of 3.19 persons per family. On the other hand, single male/father families (637 | 5.5%) represent the smallest median family size with 2.66 persons per family.
| Family Type | # Families | Family Size |
| Married-Couple | 9,055 (77.9%) | 3.19 |
| Single Male/Father | 637 (5.5%) | 2.66 |
| Single Female/Mother | 1,937 (16.7%) | 3.10 |
| Total Families | 11,629 (100.0%) | 3.15 |
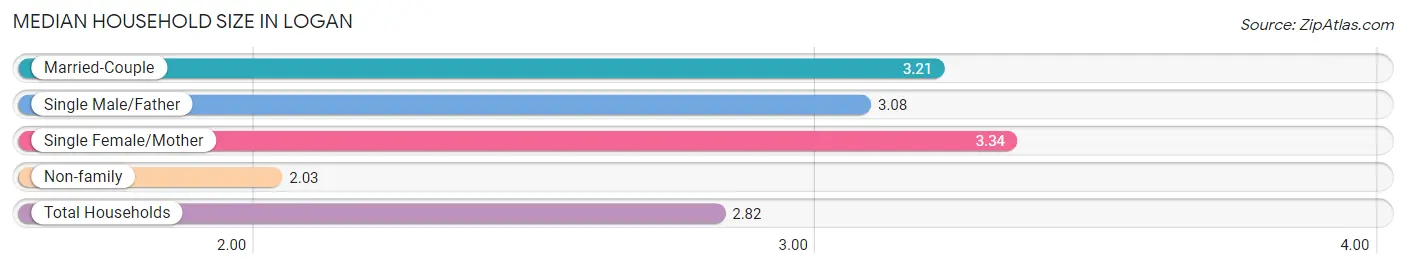
Median Household Size in Logan
The median household size in Logan is 2.82 persons per household, with single female/mother households (1,937 | 11.0%) accounting for the largest median household size of 3.34 persons per household. non-family households (6,008 | 34.1%) represent the smallest median household size with 2.03 persons per household.
| Household Type | # Households | Household Size |
| Married-Couple | 9,055 (51.3%) | 3.21 |
| Single Male/Father | 637 (3.6%) | 3.08 |
| Single Female/Mother | 1,937 (11.0%) | 3.34 |
| Non-family | 6,008 (34.1%) | 2.03 |
| Total Households | 17,637 (100.0%) | 2.82 |
Household Size by Marriage Status in Logan
Out of a total of 17,637 households in Logan, 11,629 (65.9%) are family households, while 6,008 (34.1%) are nonfamily households. The most numerous type of family households are 2-person households, comprising 5,514, and the most common type of nonfamily households are 1-person households, comprising 3,391.
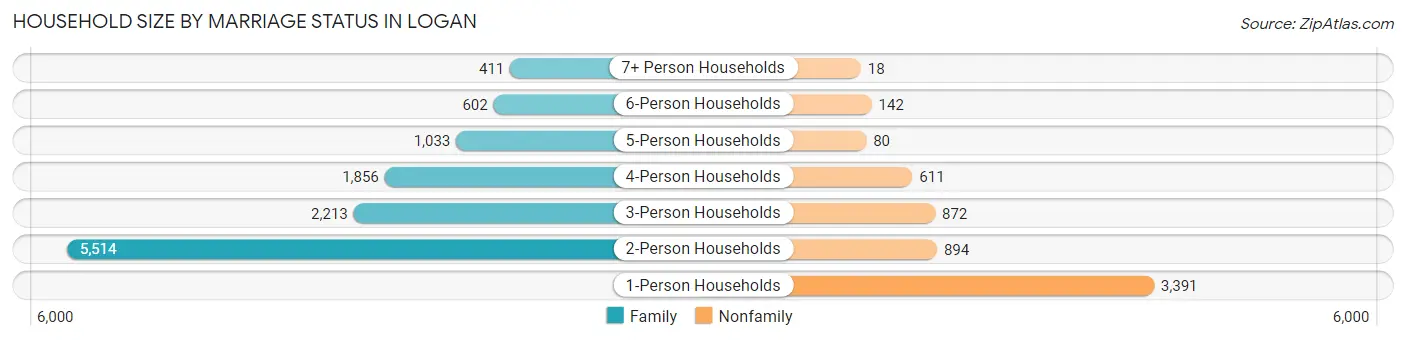
| Household Size | Family Households | Nonfamily Households |
| 1-Person Households | - | 3,391 (19.2%) |
| 2-Person Households | 5,514 (31.3%) | 894 (5.1%) |
| 3-Person Households | 2,213 (12.6%) | 872 (4.9%) |
| 4-Person Households | 1,856 (10.5%) | 611 (3.5%) |
| 5-Person Households | 1,033 (5.9%) | 80 (0.4%) |
| 6-Person Households | 602 (3.4%) | 142 (0.8%) |
| 7+ Person Households | 411 (2.3%) | 18 (0.1%) |
| Total | 11,629 (65.9%) | 6,008 (34.1%) |
Female Fertility in Logan
Fertility by Age in Logan
Average fertility rate in Logan is 67.0 births per 1,000 women. Women in the age bracket of 20 to 34 years have the highest fertility rate with 95.0 births per 1,000 women. Women in the age bracket of 20 to 34 years acount for 85.8% of all women with births.
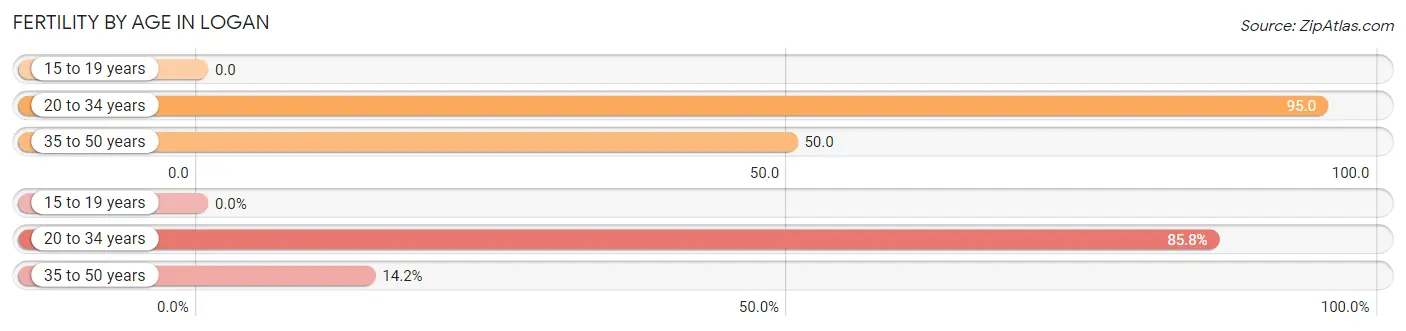
| Age Bracket | Women with Births | Births / 1,000 Women |
| 15 to 19 years | 0 (0.0%) | 0.0 |
| 20 to 34 years | 1,027 (85.8%) | 95.0 |
| 35 to 50 years | 170 (14.2%) | 50.0 |
| Total | 1,197 (100.0%) | 67.0 |
Fertility by Age by Marriage Status in Logan
87.1% of women with births (1,197) in Logan are married. The highest percentage of unmarried women with births falls into 35 to 50 years age bracket with 25.9% of them unmarried at the time of birth, while the lowest percentage of unmarried women with births belong to 20 to 34 years age bracket with 10.8% of them unmarried.
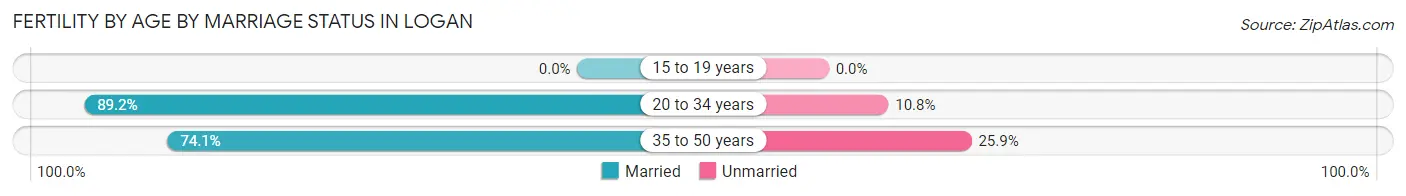
| Age Bracket | Married | Unmarried |
| 15 to 19 years | 0 (0.0%) | 0 (0.0%) |
| 20 to 34 years | 916 (89.2%) | 111 (10.8%) |
| 35 to 50 years | 126 (74.1%) | 44 (25.9%) |
| Total | 1,043 (87.1%) | 154 (12.9%) |
Fertility by Education in Logan
Average fertility rate in Logan is 67.0 births per 1,000 women. Women with the education attainment of bachelor's degree have the highest fertility rate of 123.0 births per 1,000 women, while women with the education attainment of college or associate's degree have the lowest fertility at 38.0 births per 1,000 women. Women with the education attainment of bachelor's degree represent 31.0% of all women with births.
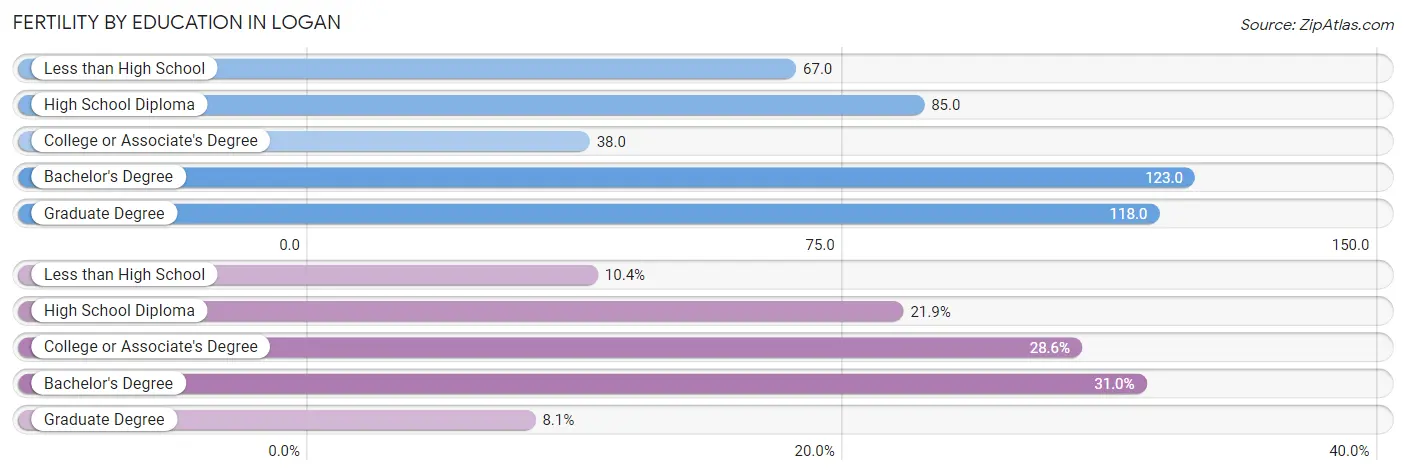
| Educational Attainment | Women with Births | Births / 1,000 Women |
| Less than High School | 125 (10.4%) | 67.0 |
| High School Diploma | 262 (21.9%) | 85.0 |
| College or Associate's Degree | 342 (28.6%) | 38.0 |
| Bachelor's Degree | 371 (31.0%) | 123.0 |
| Graduate Degree | 97 (8.1%) | 118.0 |
| Total | 1,197 (100.0%) | 67.0 |
Fertility by Education by Marriage Status in Logan
12.9% of women with births in Logan are unmarried. Women with the educational attainment of college or associate's degree are most likely to be married with 93.9% of them married at childbirth, while women with the educational attainment of high school diploma are least likely to be married with 34.4% of them unmarried at childbirth.
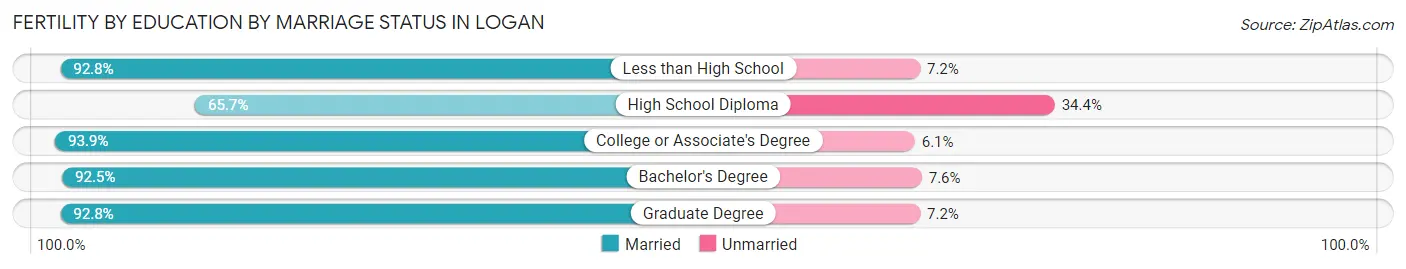
| Educational Attainment | Married | Unmarried |
| Less than High School | 116 (92.8%) | 9 (7.2%) |
| High School Diploma | 172 (65.6%) | 90 (34.4%) |
| College or Associate's Degree | 321 (93.9%) | 21 (6.1%) |
| Bachelor's Degree | 343 (92.4%) | 28 (7.5%) |
| Graduate Degree | 90 (92.8%) | 7 (7.2%) |
| Total | 1,043 (87.1%) | 154 (12.9%) |
Employment Characteristics in Logan
Employment by Class of Employer in Logan
Among the 29,762 employed individuals in Logan, private company employees (21,558 | 72.4%), state government employees (3,438 | 11.6%), and not-for-profit organizations (1,556 | 5.2%) make up the most common classes of employment.
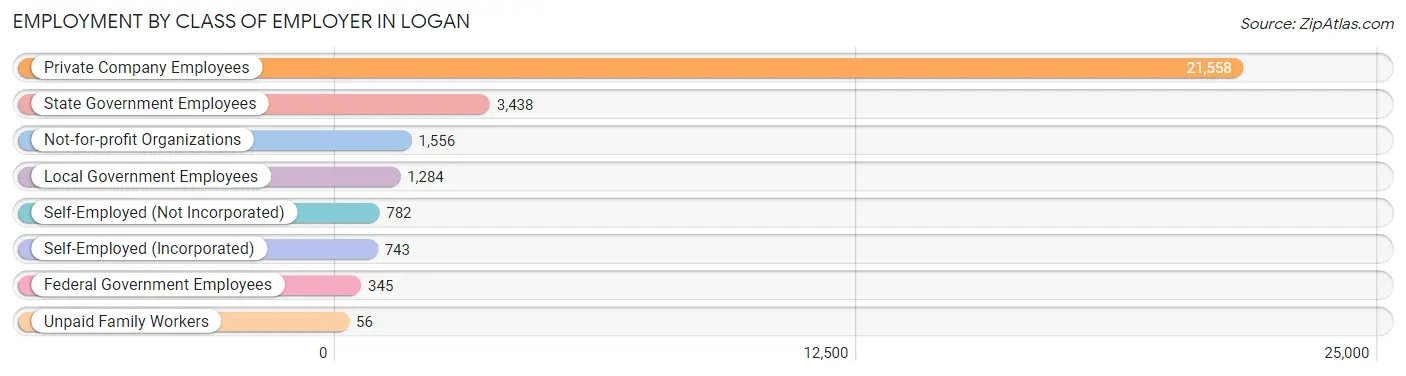
| Employer Class | # Employees | % Employees |
| Private Company Employees | 21,558 | 72.4% |
| Self-Employed (Incorporated) | 743 | 2.5% |
| Self-Employed (Not Incorporated) | 782 | 2.6% |
| Not-for-profit Organizations | 1,556 | 5.2% |
| Local Government Employees | 1,284 | 4.3% |
| State Government Employees | 3,438 | 11.6% |
| Federal Government Employees | 345 | 1.2% |
| Unpaid Family Workers | 56 | 0.2% |
| Total | 29,762 | 100.0% |
Employment Status by Age in Logan
According to the labor force statistics for Logan, out of the total population over 16 years of age (42,313), 73.5% or 31,100 individuals are in the labor force, with 2.5% or 778 of them unemployed. The age group with the highest labor force participation rate is 25 to 29 years, with 86.6% or 5,354 individuals in the labor force. Within the labor force, the 16 to 19 years age range has the highest percentage of unemployed individuals, with 6.8% or 222 of them being unemployed.
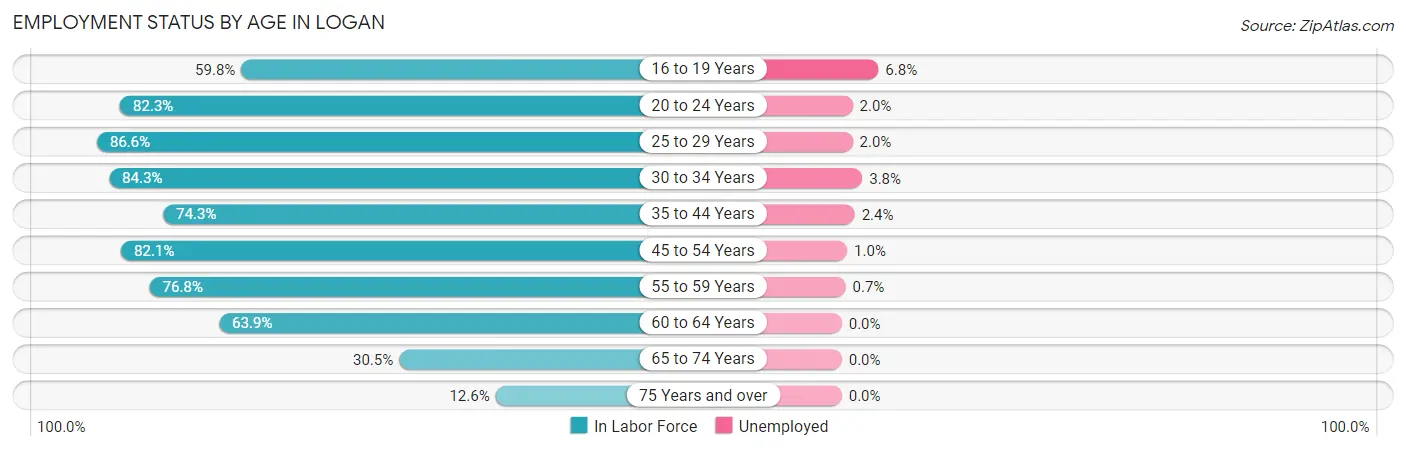
| Age Bracket | In Labor Force | Unemployed |
| 16 to 19 Years | 3,260 (59.8%) | 222 (6.8%) |
| 20 to 24 Years | 10,939 (82.3%) | 219 (2.0%) |
| 25 to 29 Years | 5,354 (86.6%) | 107 (2.0%) |
| 30 to 34 Years | 2,820 (84.3%) | 107 (3.8%) |
| 35 to 44 Years | 3,497 (74.3%) | 84 (2.4%) |
| 45 to 54 Years | 2,642 (82.1%) | 26 (1.0%) |
| 55 to 59 Years | 985 (76.8%) | 7 (0.7%) |
| 60 to 64 Years | 812 (63.9%) | 0 (0.0%) |
| 65 to 74 Years | 561 (30.5%) | 0 (0.0%) |
| 75 Years and over | 217 (12.6%) | 0 (0.0%) |
| Total | 31,100 (73.5%) | 778 (2.5%) |
Employment Status by Educational Attainment in Logan
According to labor force statistics for Logan, 80.5% of individuals (16,104) out of the total population between 25 and 64 years of age (20,005) are in the labor force, with 2.1% or 338 of them being unemployed. The group with the highest labor force participation rate are those with the educational attainment of bachelor's degree or higher, with 84.9% or 6,266 individuals in the labor force. Within the labor force, individuals with less than high school education have the highest percentage of unemployment, with 3.8% or 44 of them being unemployed.
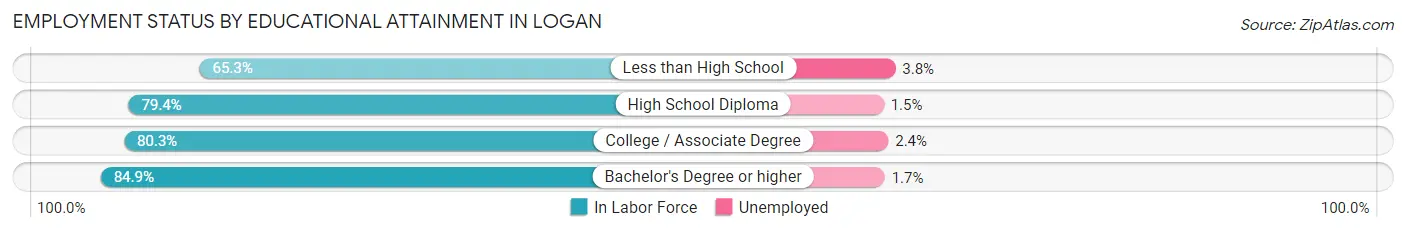
| Educational Attainment | In Labor Force | Unemployed |
| Less than High School | 1,149 (65.3%) | 67 (3.8%) |
| High School Diploma | 2,905 (79.4%) | 55 (1.5%) |
| College / Associate Degree | 5,786 (80.3%) | 173 (2.4%) |
| Bachelor's Degree or higher | 6,266 (84.9%) | 125 (1.7%) |
| Total | 16,104 (80.5%) | 420 (2.1%) |
Employment Occupations by Sex in Logan
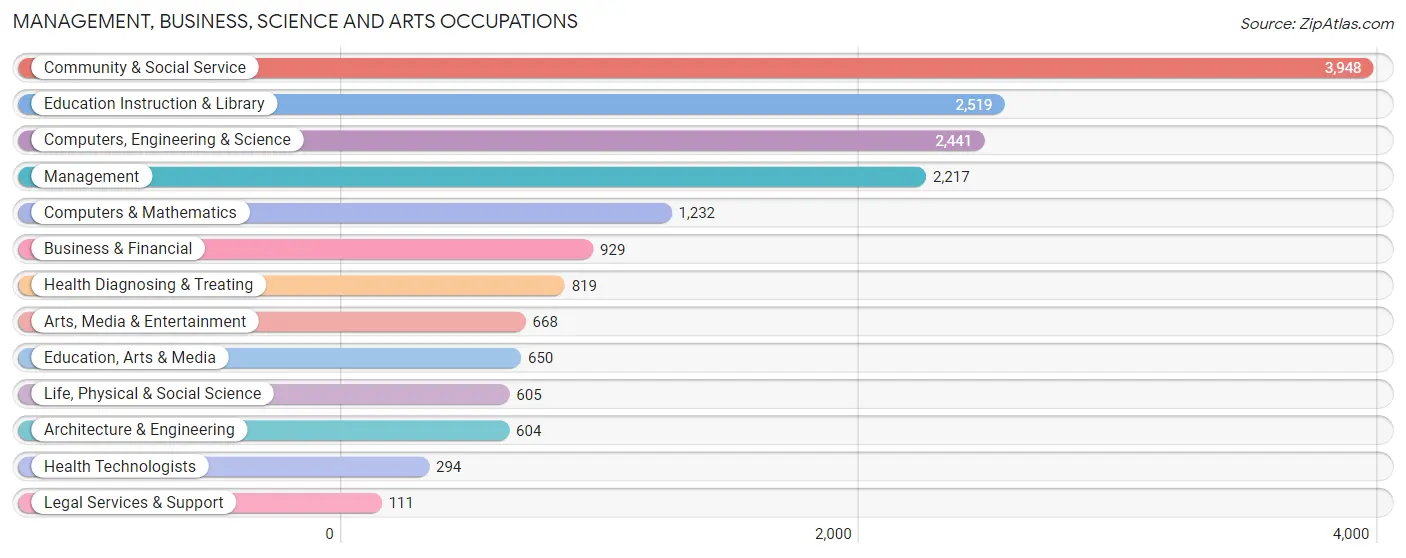
Management, Business, Science and Arts Occupations
The most common Management, Business, Science and Arts occupations in Logan are Community & Social Service (3,948 | 13.0%), Education Instruction & Library (2,519 | 8.3%), Computers, Engineering & Science (2,441 | 8.1%), Management (2,217 | 7.3%), and Computers & Mathematics (1,232 | 4.1%).
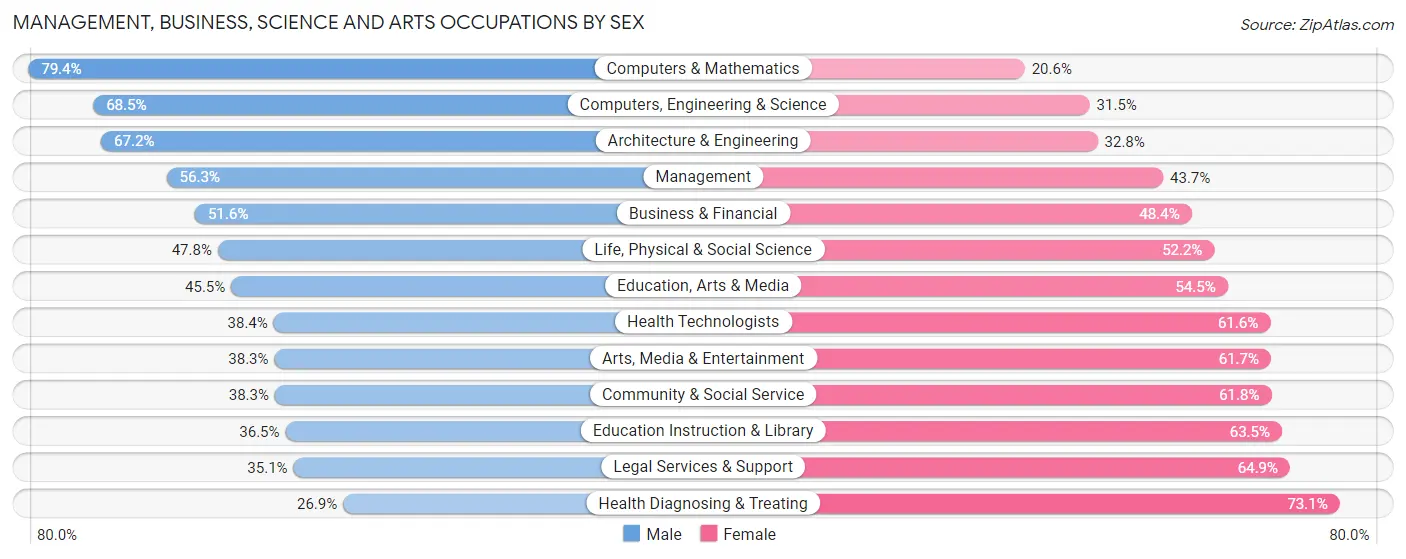
Management, Business, Science and Arts Occupations by Sex
Within the Management, Business, Science and Arts occupations in Logan, the most male-oriented occupations are Computers & Mathematics (79.4%), Computers, Engineering & Science (68.5%), and Architecture & Engineering (67.2%), while the most female-oriented occupations are Health Diagnosing & Treating (73.1%), Legal Services & Support (64.9%), and Education Instruction & Library (63.5%).
| Occupation | Male | Female |
| Management | 1,248 (56.3%) | 969 (43.7%) |
| Business & Financial | 479 (51.6%) | 450 (48.4%) |
| Computers, Engineering & Science | 1,673 (68.5%) | 768 (31.5%) |
| Computers & Mathematics | 978 (79.4%) | 254 (20.6%) |
| Architecture & Engineering | 406 (67.2%) | 198 (32.8%) |
| Life, Physical & Social Science | 289 (47.8%) | 316 (52.2%) |
| Community & Social Service | 1,510 (38.3%) | 2,438 (61.8%) |
| Education, Arts & Media | 296 (45.5%) | 354 (54.5%) |
| Legal Services & Support | 39 (35.1%) | 72 (64.9%) |
| Education Instruction & Library | 919 (36.5%) | 1,600 (63.5%) |
| Arts, Media & Entertainment | 256 (38.3%) | 412 (61.7%) |
| Health Diagnosing & Treating | 220 (26.9%) | 599 (73.1%) |
| Health Technologists | 113 (38.4%) | 181 (61.6%) |
| Total (Category) | 5,130 (49.5%) | 5,224 (50.4%) |
| Total (Overall) | 16,064 (53.0%) | 14,225 (47.0%) |
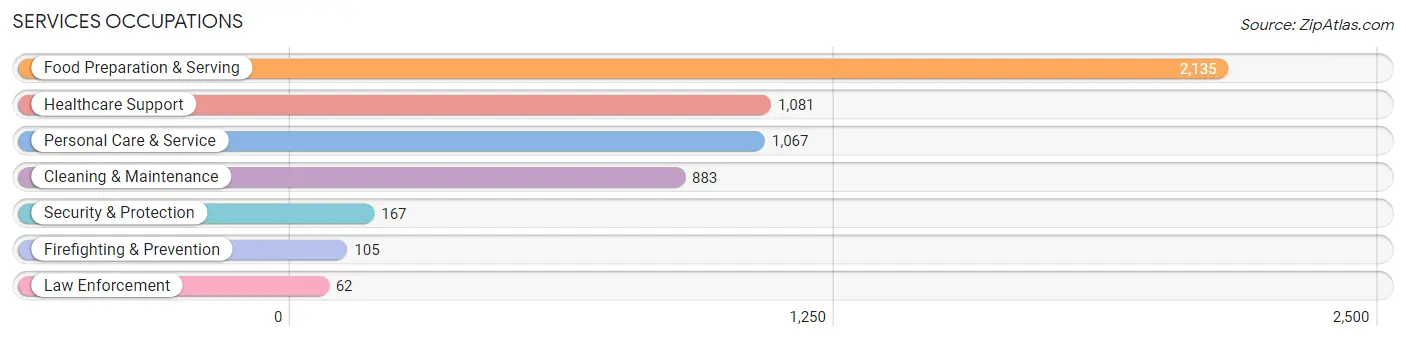
Services Occupations
The most common Services occupations in Logan are Food Preparation & Serving (2,135 | 7.0%), Healthcare Support (1,081 | 3.6%), Personal Care & Service (1,067 | 3.5%), Cleaning & Maintenance (883 | 2.9%), and Security & Protection (167 | 0.5%).
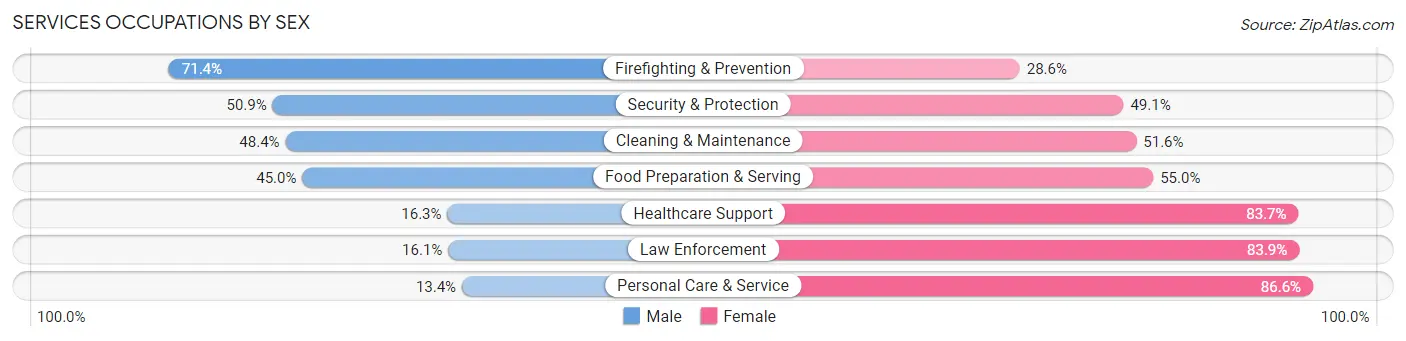
Services Occupations by Sex
Within the Services occupations in Logan, the most male-oriented occupations are Firefighting & Prevention (71.4%), Security & Protection (50.9%), and Cleaning & Maintenance (48.4%), while the most female-oriented occupations are Personal Care & Service (86.6%), Law Enforcement (83.9%), and Healthcare Support (83.7%).
| Occupation | Male | Female |
| Healthcare Support | 176 (16.3%) | 905 (83.7%) |
| Security & Protection | 85 (50.9%) | 82 (49.1%) |
| Firefighting & Prevention | 75 (71.4%) | 30 (28.6%) |
| Law Enforcement | 10 (16.1%) | 52 (83.9%) |
| Food Preparation & Serving | 961 (45.0%) | 1,174 (55.0%) |
| Cleaning & Maintenance | 427 (48.4%) | 456 (51.6%) |
| Personal Care & Service | 143 (13.4%) | 924 (86.6%) |
| Total (Category) | 1,792 (33.6%) | 3,541 (66.4%) |
| Total (Overall) | 16,064 (53.0%) | 14,225 (47.0%) |
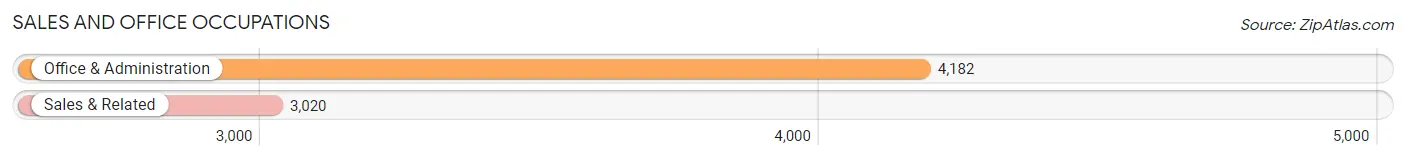
Sales and Office Occupations
The most common Sales and Office occupations in Logan are Office & Administration (4,182 | 13.8%), and Sales & Related (3,020 | 10.0%).
Sales and Office Occupations by Sex
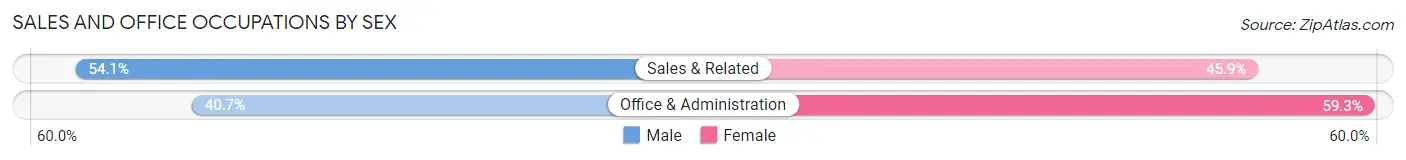
| Occupation | Male | Female |
| Sales & Related | 1,634 (54.1%) | 1,386 (45.9%) |
| Office & Administration | 1,702 (40.7%) | 2,480 (59.3%) |
| Total (Category) | 3,336 (46.3%) | 3,866 (53.7%) |
| Total (Overall) | 16,064 (53.0%) | 14,225 (47.0%) |
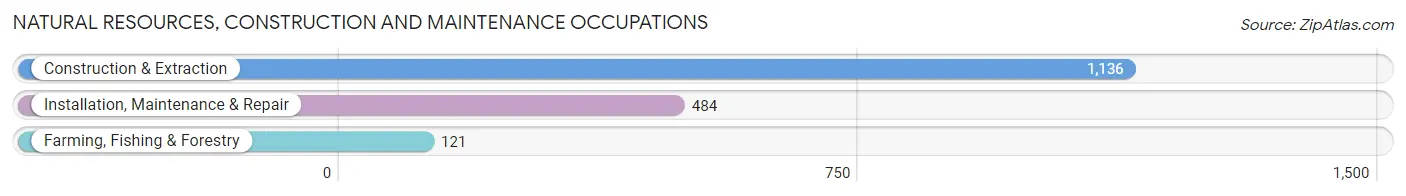
Natural Resources, Construction and Maintenance Occupations
The most common Natural Resources, Construction and Maintenance occupations in Logan are Construction & Extraction (1,136 | 3.7%), Installation, Maintenance & Repair (484 | 1.6%), and Farming, Fishing & Forestry (121 | 0.4%).
Natural Resources, Construction and Maintenance Occupations by Sex
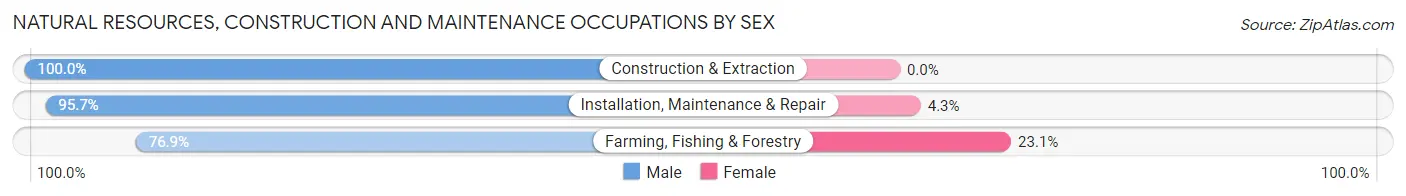
| Occupation | Male | Female |
| Farming, Fishing & Forestry | 93 (76.9%) | 28 (23.1%) |
| Construction & Extraction | 1,136 (100.0%) | 0 (0.0%) |
| Installation, Maintenance & Repair | 463 (95.7%) | 21 (4.3%) |
| Total (Category) | 1,692 (97.2%) | 49 (2.8%) |
| Total (Overall) | 16,064 (53.0%) | 14,225 (47.0%) |
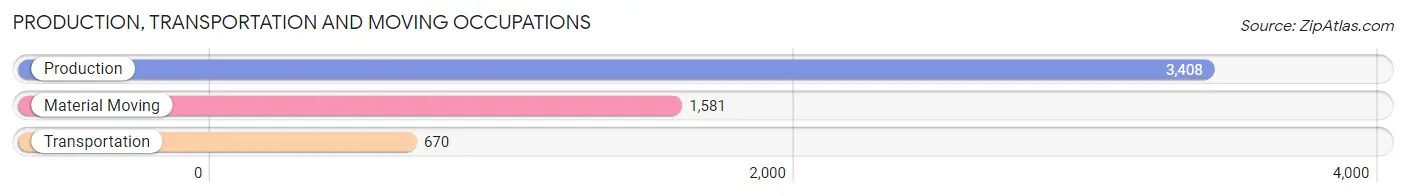
Production, Transportation and Moving Occupations
The most common Production, Transportation and Moving occupations in Logan are Production (3,408 | 11.3%), Material Moving (1,581 | 5.2%), and Transportation (670 | 2.2%).
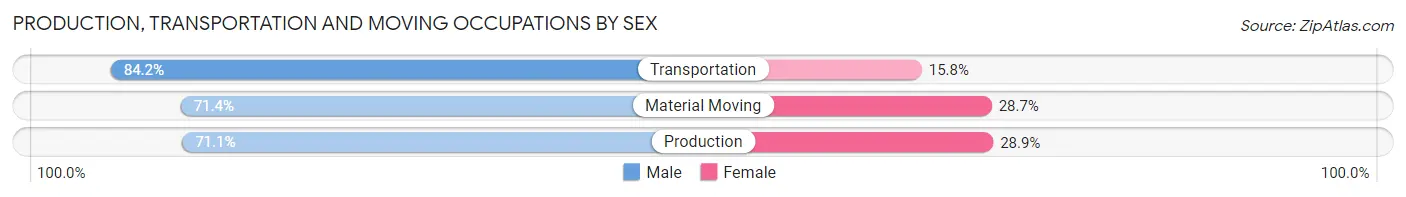
Production, Transportation and Moving Occupations by Sex
| Occupation | Male | Female |
| Production | 2,422 (71.1%) | 986 (28.9%) |
| Transportation | 564 (84.2%) | 106 (15.8%) |
| Material Moving | 1,128 (71.4%) | 453 (28.6%) |
| Total (Category) | 4,114 (72.7%) | 1,545 (27.3%) |
| Total (Overall) | 16,064 (53.0%) | 14,225 (47.0%) |
Employment Industries by Sex in Logan
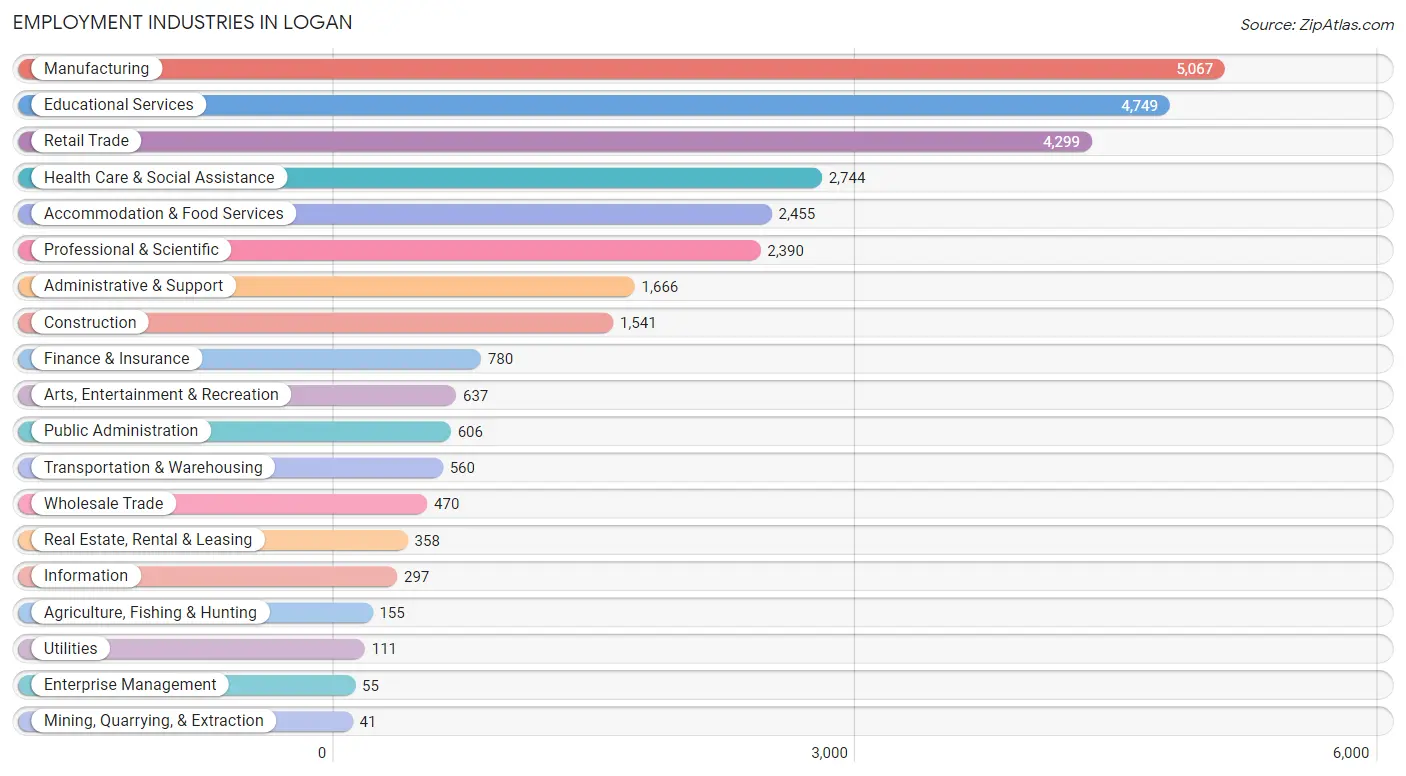
Employment Industries in Logan
The major employment industries in Logan include Manufacturing (5,067 | 16.7%), Educational Services (4,749 | 15.7%), Retail Trade (4,299 | 14.2%), Health Care & Social Assistance (2,744 | 9.1%), and Accommodation & Food Services (2,455 | 8.1%).
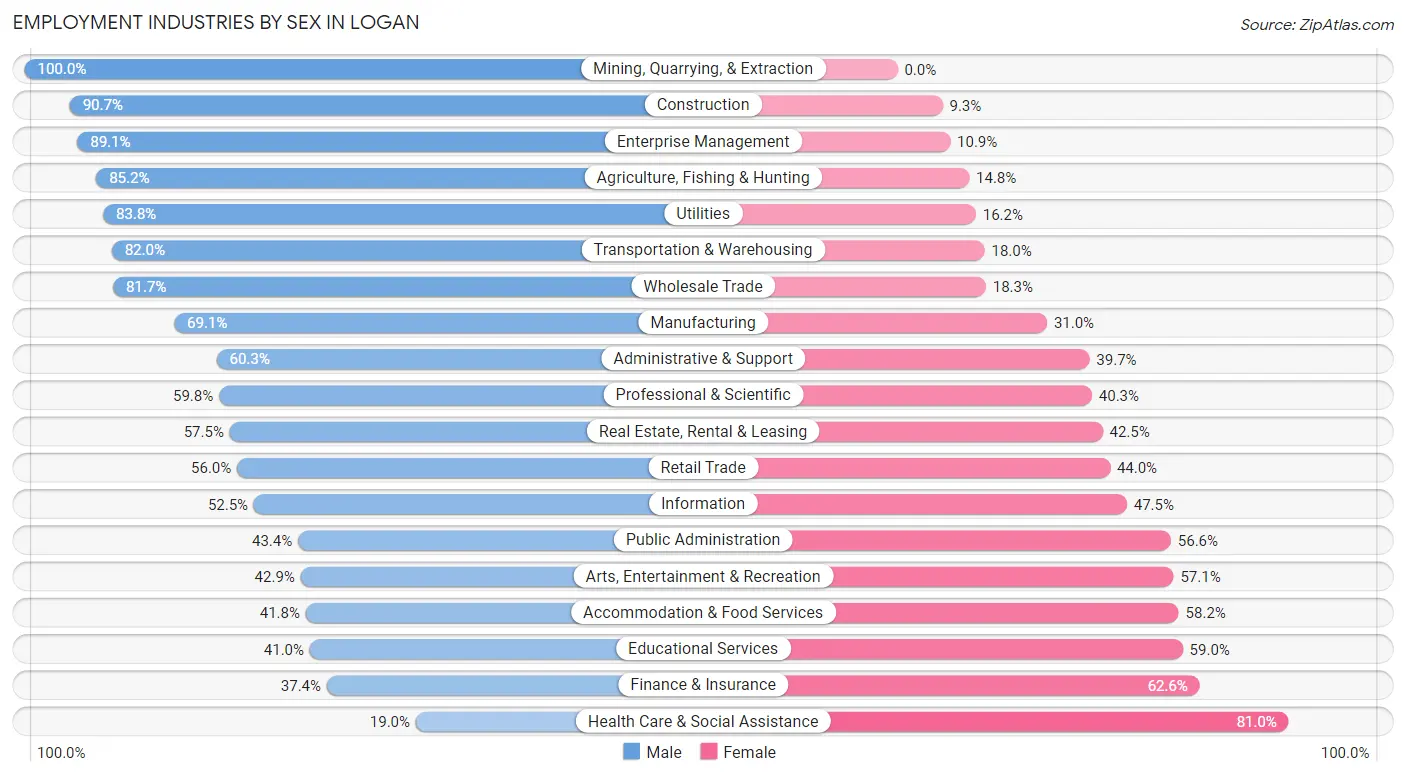
Employment Industries by Sex in Logan
The Logan industries that see more men than women are Mining, Quarrying, & Extraction (100.0%), Construction (90.7%), and Enterprise Management (89.1%), whereas the industries that tend to have a higher number of women are Health Care & Social Assistance (81.0%), Finance & Insurance (62.6%), and Educational Services (59.0%).
| Industry | Male | Female |
| Agriculture, Fishing & Hunting | 132 (85.2%) | 23 (14.8%) |
| Mining, Quarrying, & Extraction | 41 (100.0%) | 0 (0.0%) |
| Construction | 1,397 (90.7%) | 144 (9.3%) |
| Manufacturing | 3,499 (69.1%) | 1,568 (30.9%) |
| Wholesale Trade | 384 (81.7%) | 86 (18.3%) |
| Retail Trade | 2,408 (56.0%) | 1,891 (44.0%) |
| Transportation & Warehousing | 459 (82.0%) | 101 (18.0%) |
| Utilities | 93 (83.8%) | 18 (16.2%) |
| Information | 156 (52.5%) | 141 (47.5%) |
| Finance & Insurance | 292 (37.4%) | 488 (62.6%) |
| Real Estate, Rental & Leasing | 206 (57.5%) | 152 (42.5%) |
| Professional & Scientific | 1,428 (59.8%) | 962 (40.3%) |
| Enterprise Management | 49 (89.1%) | 6 (10.9%) |
| Administrative & Support | 1,004 (60.3%) | 662 (39.7%) |
| Educational Services | 1,945 (41.0%) | 2,804 (59.0%) |
| Health Care & Social Assistance | 522 (19.0%) | 2,222 (81.0%) |
| Arts, Entertainment & Recreation | 273 (42.9%) | 364 (57.1%) |
| Accommodation & Food Services | 1,026 (41.8%) | 1,429 (58.2%) |
| Public Administration | 263 (43.4%) | 343 (56.6%) |
| Total | 16,064 (53.0%) | 14,225 (47.0%) |
Education in Logan
School Enrollment in Logan
The most common levels of schooling among the 24,021 students in Logan are college / undergraduate (13,889 | 57.8%), elementary school (2,853 | 11.9%), and high school (2,603 | 10.8%).
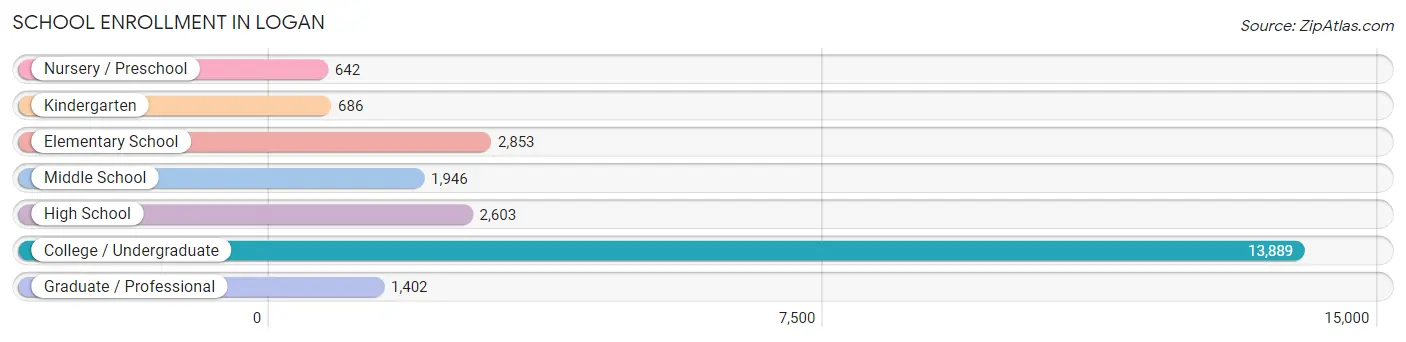
| School Level | # Students | % Students |
| Nursery / Preschool | 642 | 2.7% |
| Kindergarten | 686 | 2.9% |
| Elementary School | 2,853 | 11.9% |
| Middle School | 1,946 | 8.1% |
| High School | 2,603 | 10.8% |
| College / Undergraduate | 13,889 | 57.8% |
| Graduate / Professional | 1,402 | 5.8% |
| Total | 24,021 | 100.0% |
School Enrollment by Age by Funding Source in Logan
Out of a total of 24,021 students who are enrolled in schools in Logan, 1,513 (6.3%) attend a private institution, while the remaining 22,508 (93.7%) are enrolled in public schools. The age group of 3 to 4 year olds has the highest likelihood of being enrolled in private schools, with 160 (26.1% in the age bracket) enrolled. Conversely, the age group of 15 to 17 year olds has the lowest likelihood of being enrolled in a private school, with 1,846 (96.6% in the age bracket) attending a public institution.
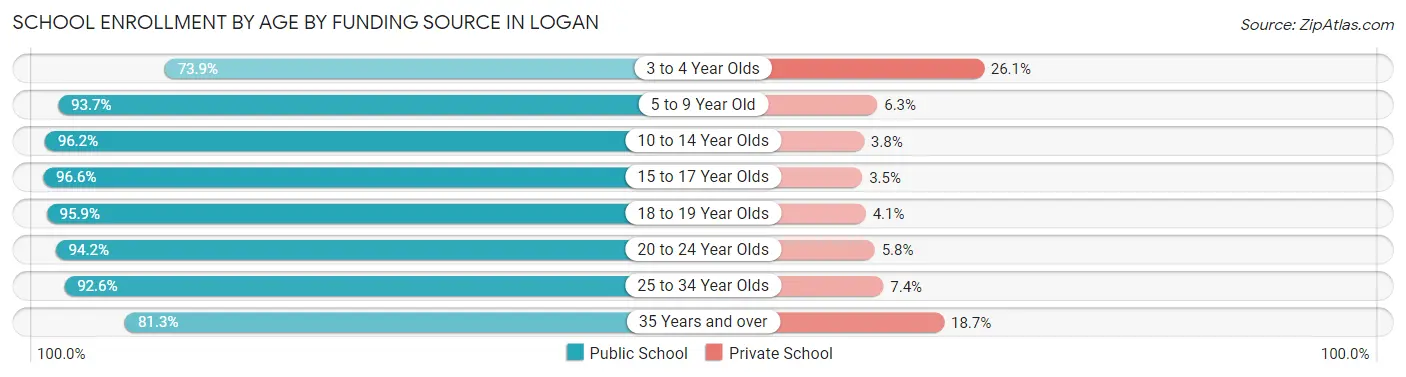
| Age Bracket | Public School | Private School |
| 3 to 4 Year Olds | 453 (73.9%) | 160 (26.1%) |
| 5 to 9 Year Old | 3,131 (93.7%) | 209 (6.3%) |
| 10 to 14 Year Olds | 2,422 (96.2%) | 95 (3.8%) |
| 15 to 17 Year Olds | 1,846 (96.6%) | 66 (3.5%) |
| 18 to 19 Year Olds | 3,217 (95.9%) | 138 (4.1%) |
| 20 to 24 Year Olds | 8,436 (94.2%) | 518 (5.8%) |
| 25 to 34 Year Olds | 2,470 (92.6%) | 197 (7.4%) |
| 35 Years and over | 539 (81.3%) | 124 (18.7%) |
| Total | 22,508 (93.7%) | 1,513 (6.3%) |
Educational Attainment by Field of Study in Logan
Business (1,408 | 13.9%), education (1,290 | 12.8%), science & technology (1,031 | 10.2%), bio, nature & agricultural (979 | 9.7%), and arts & humanities (860 | 8.5%) are the most common fields of study among 10,098 individuals in Logan who have obtained a bachelor's degree or higher.
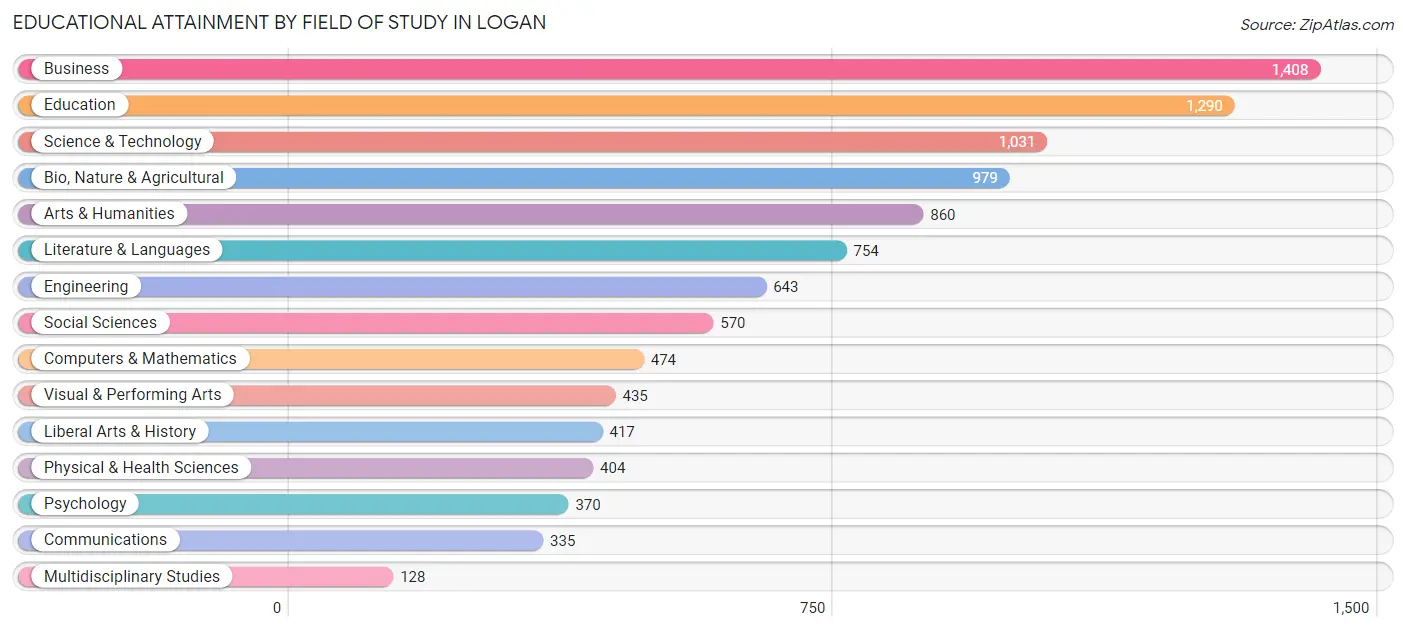
| Field of Study | # Graduates | % Graduates |
| Computers & Mathematics | 474 | 4.7% |
| Bio, Nature & Agricultural | 979 | 9.7% |
| Physical & Health Sciences | 404 | 4.0% |
| Psychology | 370 | 3.7% |
| Social Sciences | 570 | 5.6% |
| Engineering | 643 | 6.4% |
| Multidisciplinary Studies | 128 | 1.3% |
| Science & Technology | 1,031 | 10.2% |
| Business | 1,408 | 13.9% |
| Education | 1,290 | 12.8% |
| Literature & Languages | 754 | 7.5% |
| Liberal Arts & History | 417 | 4.1% |
| Visual & Performing Arts | 435 | 4.3% |
| Communications | 335 | 3.3% |
| Arts & Humanities | 860 | 8.5% |
| Total | 10,098 | 100.0% |
Transportation & Commute in Logan
Vehicle Availability by Sex in Logan
The most prevalent vehicle ownership categories in Logan are males with 2 vehicles (6,081, accounting for 40.2%) and females with 2 vehicles (5,334, making up 47.4%).
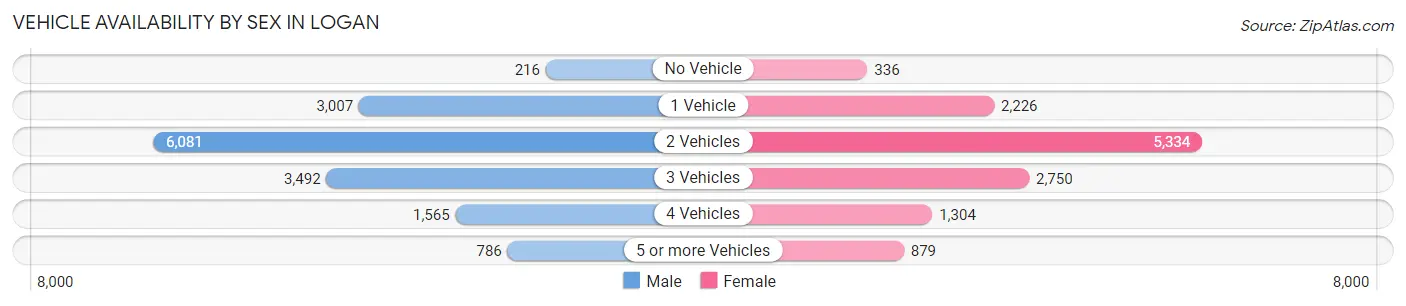
| Vehicles Available | Male | Female |
| No Vehicle | 216 (1.4%) | 336 (2.6%) |
| 1 Vehicle | 3,007 (19.9%) | 2,226 (17.3%) |
| 2 Vehicles | 6,081 (40.2%) | 5,334 (41.6%) |
| 3 Vehicles | 3,492 (23.1%) | 2,750 (21.4%) |
| 4 Vehicles | 1,565 (10.3%) | 1,304 (10.2%) |
| 5 or more Vehicles | 786 (5.2%) | 879 (6.9%) |
| Total | 15,147 (100.0%) | 12,829 (100.0%) |
Commute Time in Logan
The most frequently occuring commute durations in Logan are 10 to 14 minutes (7,749 commuters, 29.0%), 5 to 9 minutes (7,715 commuters, 28.8%), and 15 to 19 minutes (4,687 commuters, 17.5%).
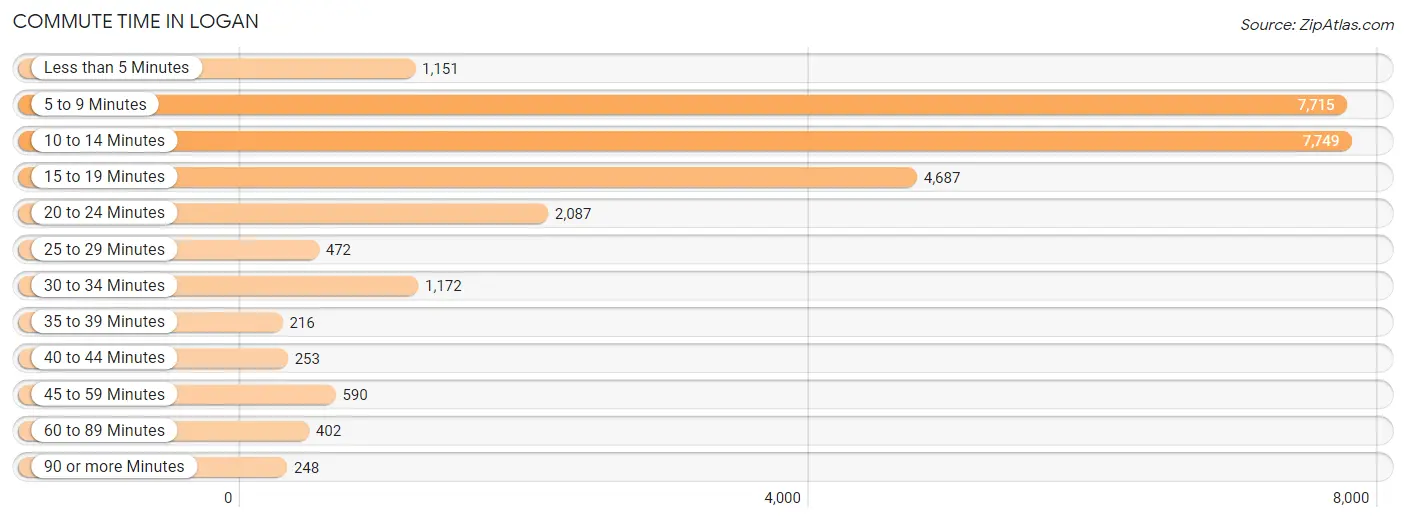
| Commute Time | # Commuters | % Commuters |
| Less than 5 Minutes | 1,151 | 4.3% |
| 5 to 9 Minutes | 7,715 | 28.8% |
| 10 to 14 Minutes | 7,749 | 29.0% |
| 15 to 19 Minutes | 4,687 | 17.5% |
| 20 to 24 Minutes | 2,087 | 7.8% |
| 25 to 29 Minutes | 472 | 1.8% |
| 30 to 34 Minutes | 1,172 | 4.4% |
| 35 to 39 Minutes | 216 | 0.8% |
| 40 to 44 Minutes | 253 | 0.9% |
| 45 to 59 Minutes | 590 | 2.2% |
| 60 to 89 Minutes | 402 | 1.5% |
| 90 or more Minutes | 248 | 0.9% |
Commute Time by Sex in Logan
The most common commute times in Logan are 10 to 14 minutes (3,897 commuters, 26.8%) for males and 10 to 14 minutes (3,852 commuters, 31.5%) for females.
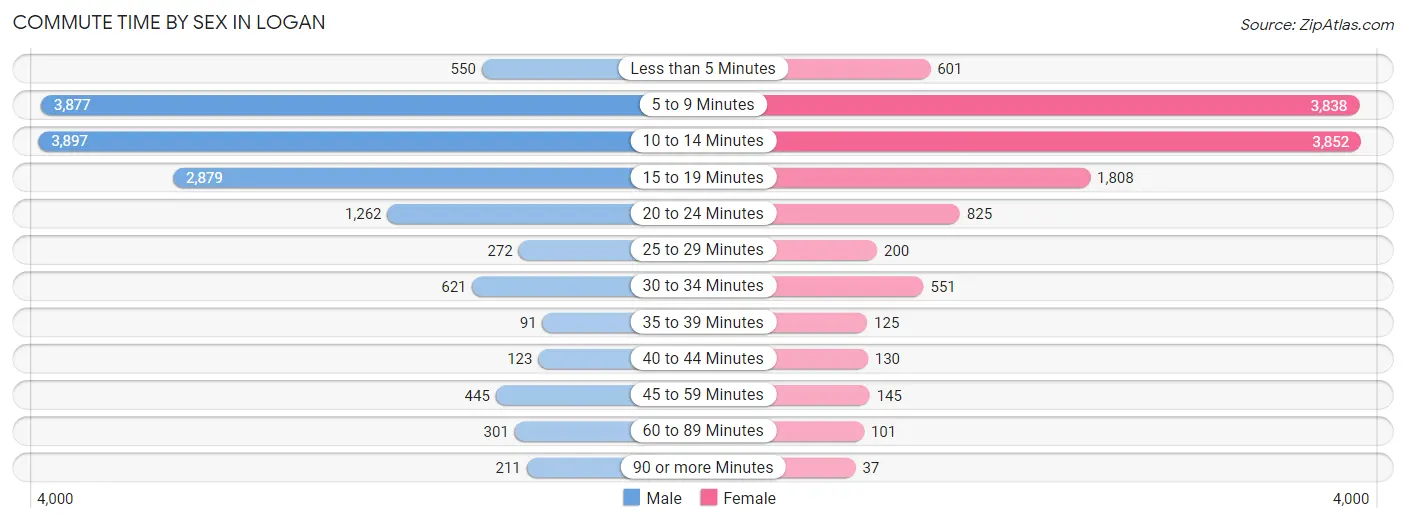
| Commute Time | Male | Female |
| Less than 5 Minutes | 550 (3.8%) | 601 (4.9%) |
| 5 to 9 Minutes | 3,877 (26.7%) | 3,838 (31.4%) |
| 10 to 14 Minutes | 3,897 (26.8%) | 3,852 (31.5%) |
| 15 to 19 Minutes | 2,879 (19.8%) | 1,808 (14.8%) |
| 20 to 24 Minutes | 1,262 (8.7%) | 825 (6.8%) |
| 25 to 29 Minutes | 272 (1.9%) | 200 (1.6%) |
| 30 to 34 Minutes | 621 (4.3%) | 551 (4.5%) |
| 35 to 39 Minutes | 91 (0.6%) | 125 (1.0%) |
| 40 to 44 Minutes | 123 (0.9%) | 130 (1.1%) |
| 45 to 59 Minutes | 445 (3.1%) | 145 (1.2%) |
| 60 to 89 Minutes | 301 (2.1%) | 101 (0.8%) |
| 90 or more Minutes | 211 (1.5%) | 37 (0.3%) |
Time of Departure to Work by Sex in Logan
The most frequent times of departure to work in Logan are 12:00 PM to 3:59 PM (2,350, 16.2%) for males and 12:00 PM to 3:59 PM (1,768, 14.5%) for females.
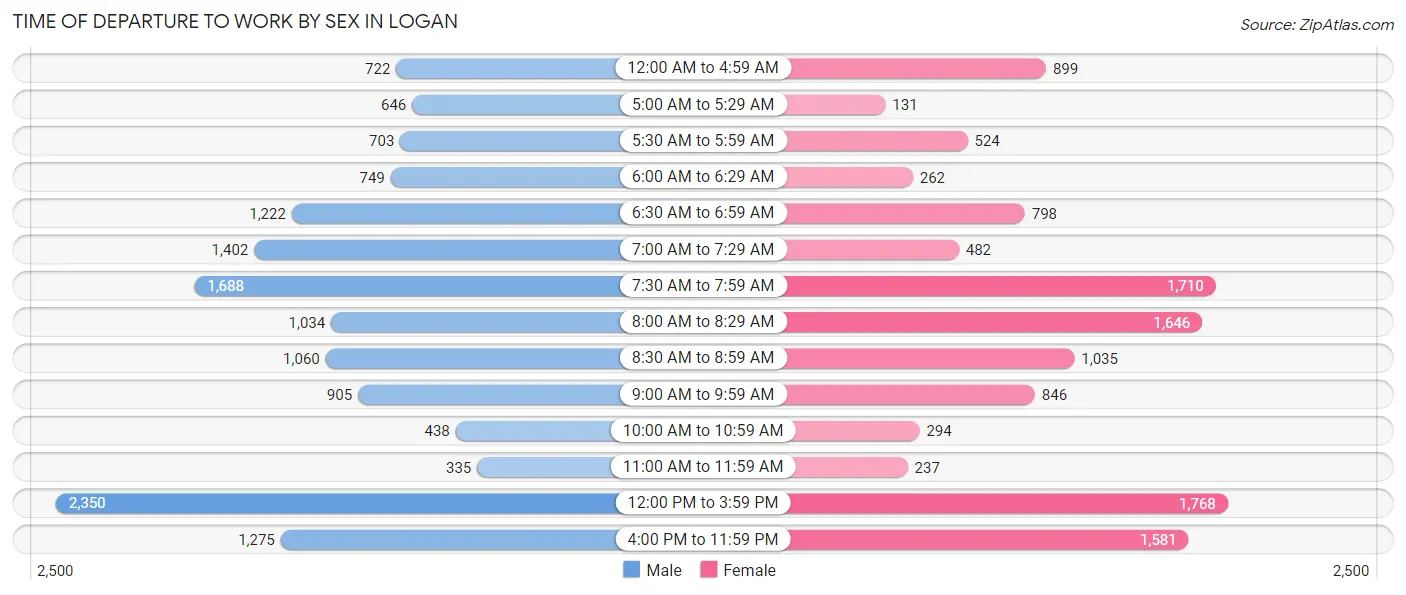
| Time of Departure | Male | Female |
| 12:00 AM to 4:59 AM | 722 (5.0%) | 899 (7.4%) |
| 5:00 AM to 5:29 AM | 646 (4.4%) | 131 (1.1%) |
| 5:30 AM to 5:59 AM | 703 (4.8%) | 524 (4.3%) |
| 6:00 AM to 6:29 AM | 749 (5.2%) | 262 (2.1%) |
| 6:30 AM to 6:59 AM | 1,222 (8.4%) | 798 (6.5%) |
| 7:00 AM to 7:29 AM | 1,402 (9.7%) | 482 (4.0%) |
| 7:30 AM to 7:59 AM | 1,688 (11.6%) | 1,710 (14.0%) |
| 8:00 AM to 8:29 AM | 1,034 (7.1%) | 1,646 (13.5%) |
| 8:30 AM to 8:59 AM | 1,060 (7.3%) | 1,035 (8.5%) |
| 9:00 AM to 9:59 AM | 905 (6.2%) | 846 (6.9%) |
| 10:00 AM to 10:59 AM | 438 (3.0%) | 294 (2.4%) |
| 11:00 AM to 11:59 AM | 335 (2.3%) | 237 (1.9%) |
| 12:00 PM to 3:59 PM | 2,350 (16.2%) | 1,768 (14.5%) |
| 4:00 PM to 11:59 PM | 1,275 (8.8%) | 1,581 (13.0%) |
| Total | 14,529 (100.0%) | 12,213 (100.0%) |
Housing Occupancy in Logan
Occupancy by Ownership in Logan
Of the total 17,637 dwellings in Logan, owner-occupied units account for 7,115 (40.3%), while renter-occupied units make up 10,522 (59.7%).
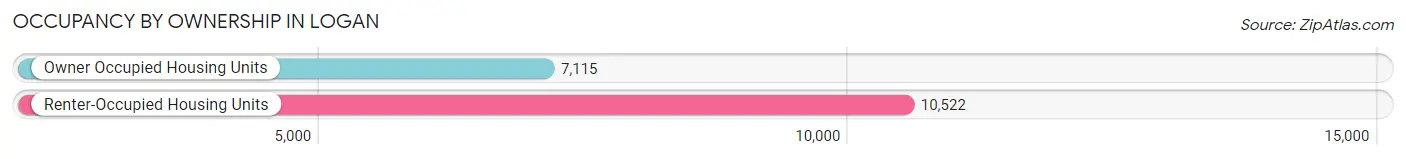
| Occupancy | # Housing Units | % Housing Units |
| Owner Occupied Housing Units | 7,115 | 40.3% |
| Renter-Occupied Housing Units | 10,522 | 59.7% |
| Total Occupied Housing Units | 17,637 | 100.0% |
Occupancy by Household Size in Logan
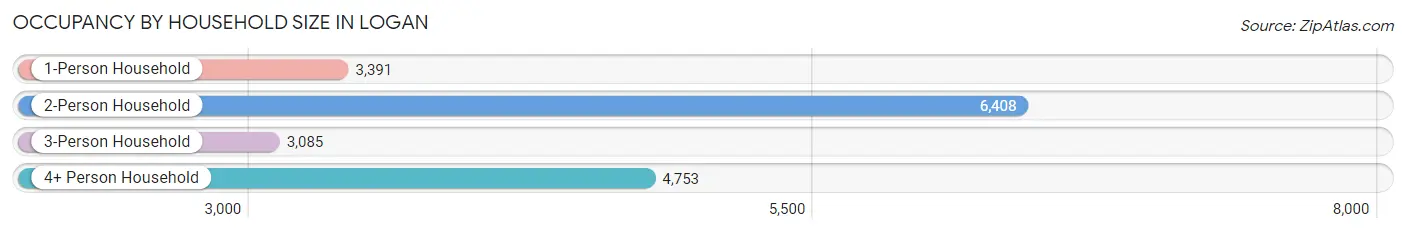
| Household Size | # Housing Units | % Housing Units |
| 1-Person Household | 3,391 | 19.2% |
| 2-Person Household | 6,408 | 36.3% |
| 3-Person Household | 3,085 | 17.5% |
| 4+ Person Household | 4,753 | 27.0% |
| Total Housing Units | 17,637 | 100.0% |
Occupancy by Ownership by Household Size in Logan
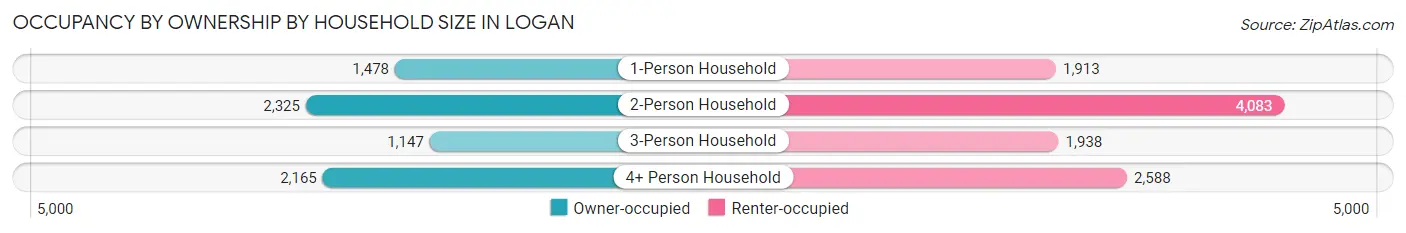
| Household Size | Owner-occupied | Renter-occupied |
| 1-Person Household | 1,478 (43.6%) | 1,913 (56.4%) |
| 2-Person Household | 2,325 (36.3%) | 4,083 (63.7%) |
| 3-Person Household | 1,147 (37.2%) | 1,938 (62.8%) |
| 4+ Person Household | 2,165 (45.6%) | 2,588 (54.4%) |
| Total Housing Units | 7,115 (40.3%) | 10,522 (59.7%) |
Occupancy by Educational Attainment in Logan
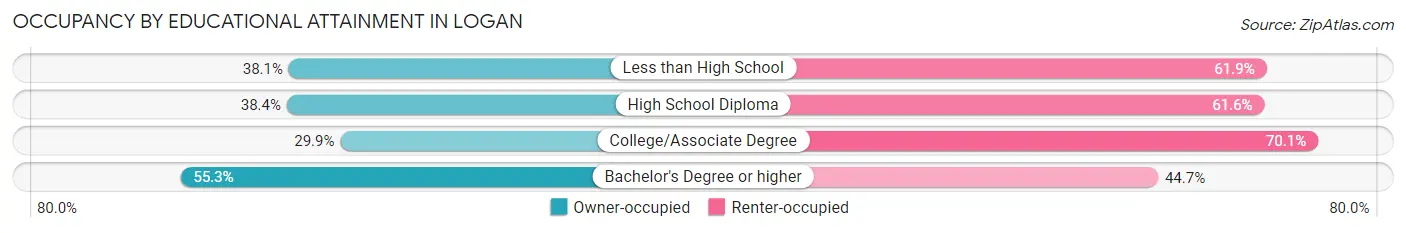
| Household Size | Owner-occupied | Renter-occupied |
| Less than High School | 368 (38.1%) | 598 (61.9%) |
| High School Diploma | 1,151 (38.4%) | 1,845 (61.6%) |
| College/Associate Degree | 2,317 (29.9%) | 5,428 (70.1%) |
| Bachelor's Degree or higher | 3,279 (55.3%) | 2,651 (44.7%) |
Occupancy by Age of Householder in Logan
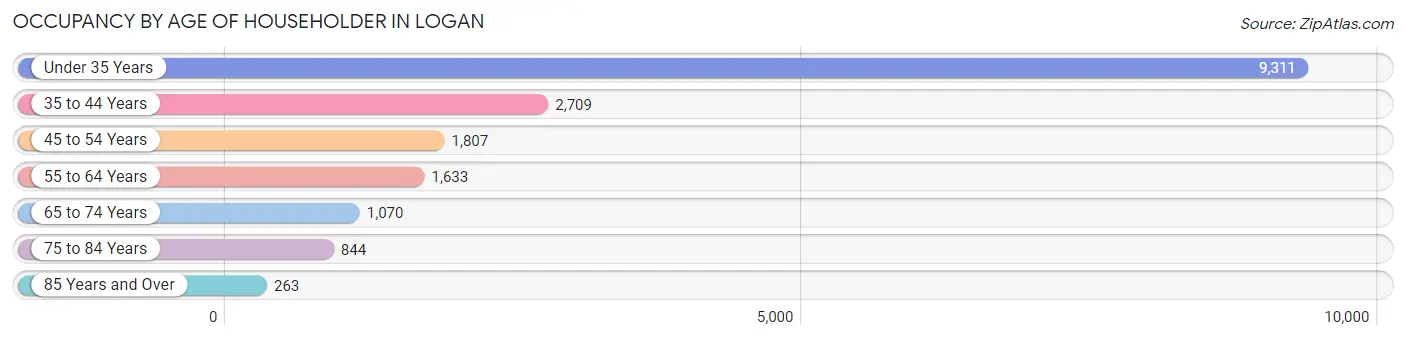
| Age Bracket | # Households | % Households |
| Under 35 Years | 9,311 | 52.8% |
| 35 to 44 Years | 2,709 | 15.4% |
| 45 to 54 Years | 1,807 | 10.2% |
| 55 to 64 Years | 1,633 | 9.3% |
| 65 to 74 Years | 1,070 | 6.1% |
| 75 to 84 Years | 844 | 4.8% |
| 85 Years and Over | 263 | 1.5% |
| Total | 17,637 | 100.0% |
Housing Finances in Logan
Median Income by Occupancy in Logan
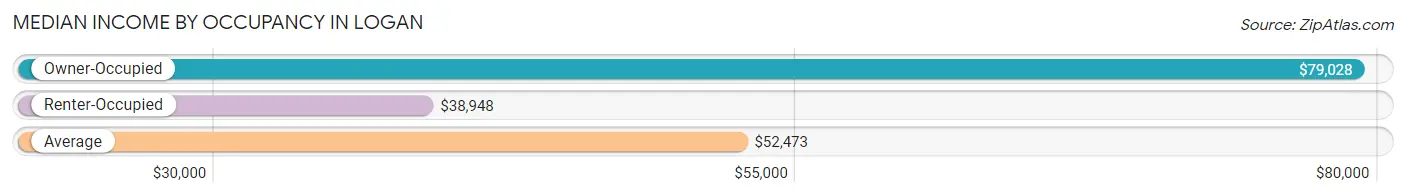
| Occupancy Type | # Households | Median Income |
| Owner-Occupied | 7,115 (40.3%) | $79,028 |
| Renter-Occupied | 10,522 (59.7%) | $38,948 |
| Average | 17,637 (100.0%) | $52,473 |
Occupancy by Householder Income Bracket in Logan
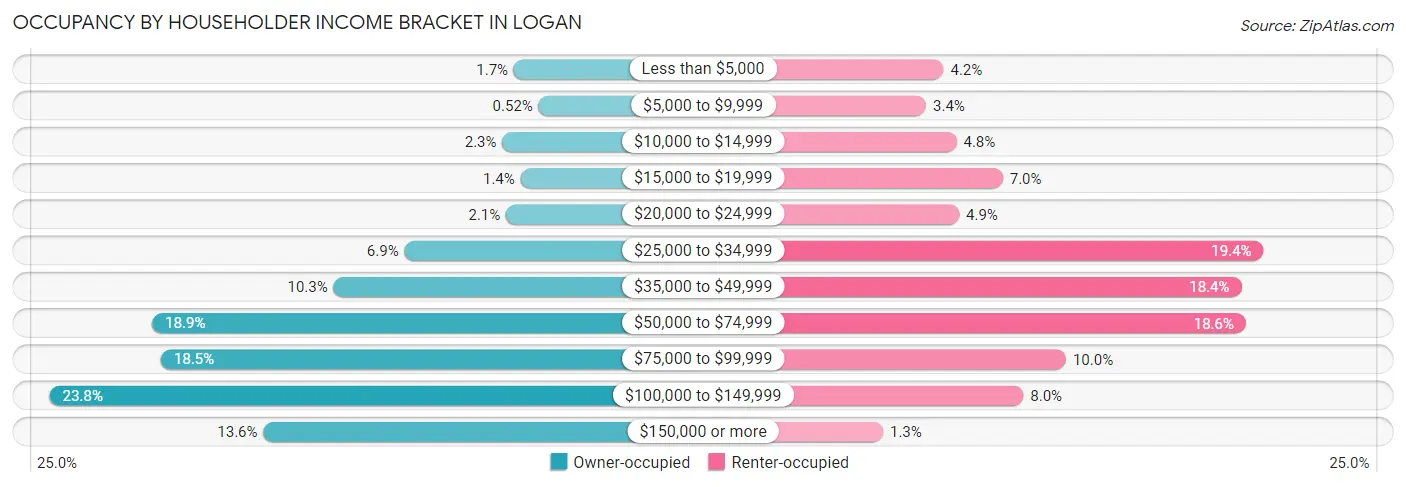
| Income Bracket | Owner-occupied | Renter-occupied |
| Less than $5,000 | 121 (1.7%) | 441 (4.2%) |
| $5,000 to $9,999 | 37 (0.5%) | 354 (3.4%) |
| $10,000 to $14,999 | 160 (2.2%) | 506 (4.8%) |
| $15,000 to $19,999 | 98 (1.4%) | 738 (7.0%) |
| $20,000 to $24,999 | 147 (2.1%) | 519 (4.9%) |
| $25,000 to $34,999 | 492 (6.9%) | 2,043 (19.4%) |
| $35,000 to $49,999 | 732 (10.3%) | 1,933 (18.4%) |
| $50,000 to $74,999 | 1,347 (18.9%) | 1,955 (18.6%) |
| $75,000 to $99,999 | 1,317 (18.5%) | 1,054 (10.0%) |
| $100,000 to $149,999 | 1,694 (23.8%) | 841 (8.0%) |
| $150,000 or more | 970 (13.6%) | 138 (1.3%) |
| Total | 7,115 (100.0%) | 10,522 (100.0%) |
Monthly Housing Cost Tiers in Logan
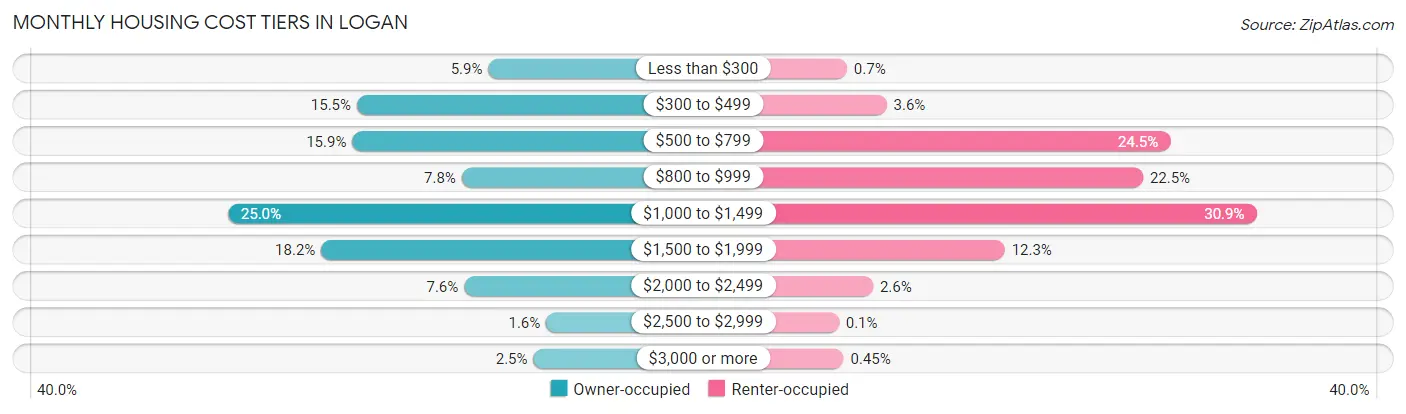
| Monthly Cost | Owner-occupied | Renter-occupied |
| Less than $300 | 416 (5.9%) | 74 (0.7%) |
| $300 to $499 | 1,105 (15.5%) | 381 (3.6%) |
| $500 to $799 | 1,129 (15.9%) | 2,578 (24.5%) |
| $800 to $999 | 556 (7.8%) | 2,367 (22.5%) |
| $1,000 to $1,499 | 1,781 (25.0%) | 3,246 (30.8%) |
| $1,500 to $1,999 | 1,292 (18.2%) | 1,296 (12.3%) |
| $2,000 to $2,499 | 543 (7.6%) | 276 (2.6%) |
| $2,500 to $2,999 | 113 (1.6%) | 11 (0.1%) |
| $3,000 or more | 180 (2.5%) | 47 (0.4%) |
| Total | 7,115 (100.0%) | 10,522 (100.0%) |
Physical Housing Characteristics in Logan
Housing Structures in Logan
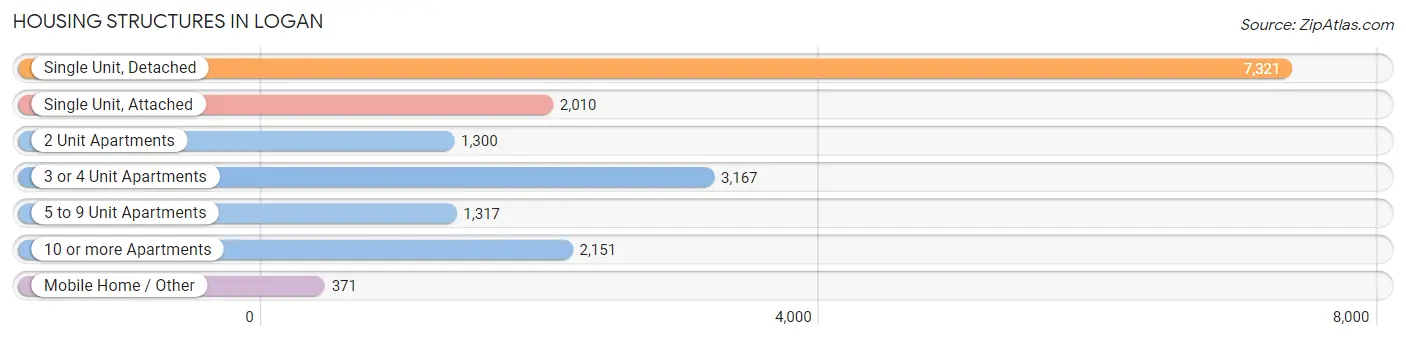
| Structure Type | # Housing Units | % Housing Units |
| Single Unit, Detached | 7,321 | 41.5% |
| Single Unit, Attached | 2,010 | 11.4% |
| 2 Unit Apartments | 1,300 | 7.4% |
| 3 or 4 Unit Apartments | 3,167 | 18.0% |
| 5 to 9 Unit Apartments | 1,317 | 7.5% |
| 10 or more Apartments | 2,151 | 12.2% |
| Mobile Home / Other | 371 | 2.1% |
| Total | 17,637 | 100.0% |
Housing Structures by Occupancy in Logan
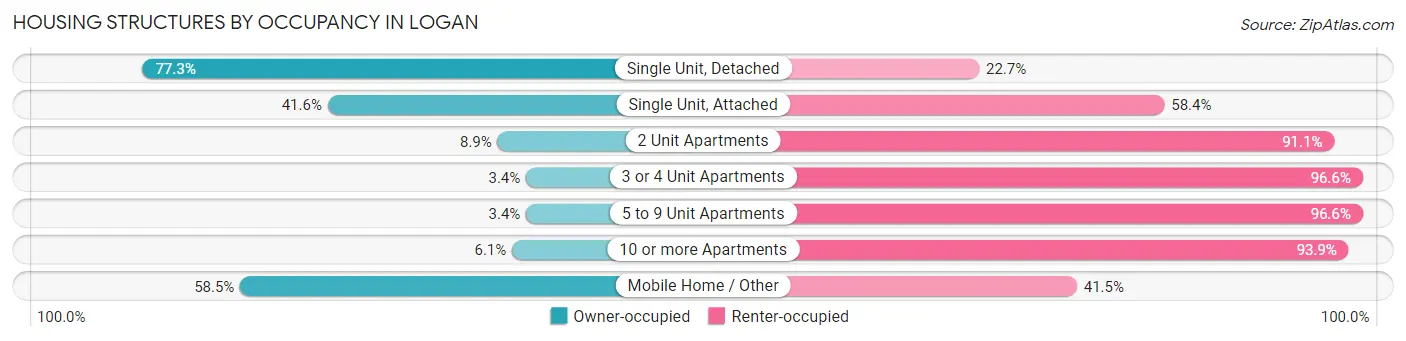
| Structure Type | Owner-occupied | Renter-occupied |
| Single Unit, Detached | 5,659 (77.3%) | 1,662 (22.7%) |
| Single Unit, Attached | 837 (41.6%) | 1,173 (58.4%) |
| 2 Unit Apartments | 116 (8.9%) | 1,184 (91.1%) |
| 3 or 4 Unit Apartments | 109 (3.4%) | 3,058 (96.6%) |
| 5 to 9 Unit Apartments | 45 (3.4%) | 1,272 (96.6%) |
| 10 or more Apartments | 132 (6.1%) | 2,019 (93.9%) |
| Mobile Home / Other | 217 (58.5%) | 154 (41.5%) |
| Total | 7,115 (40.3%) | 10,522 (59.7%) |
Housing Structures by Number of Rooms in Logan
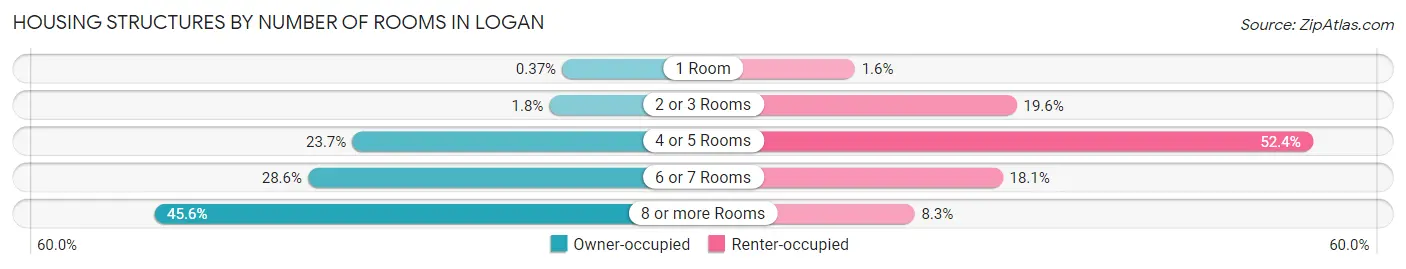
| Number of Rooms | Owner-occupied | Renter-occupied |
| 1 Room | 26 (0.4%) | 173 (1.6%) |
| 2 or 3 Rooms | 127 (1.8%) | 2,062 (19.6%) |
| 4 or 5 Rooms | 1,683 (23.6%) | 5,518 (52.4%) |
| 6 or 7 Rooms | 2,033 (28.6%) | 1,899 (18.0%) |
| 8 or more Rooms | 3,246 (45.6%) | 870 (8.3%) |
| Total | 7,115 (100.0%) | 10,522 (100.0%) |
Housing Structure by Heating Type in Logan
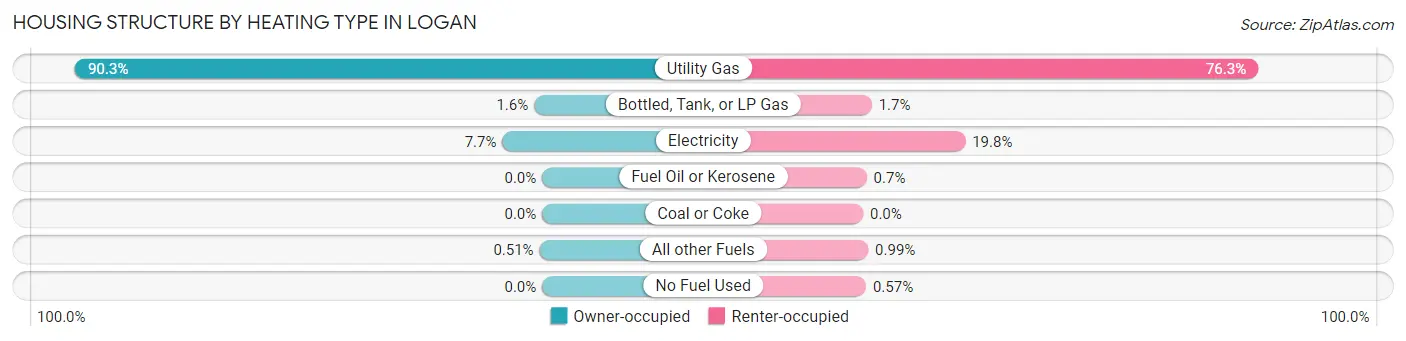
| Heating Type | Owner-occupied | Renter-occupied |
| Utility Gas | 6,422 (90.3%) | 8,029 (76.3%) |
| Bottled, Tank, or LP Gas | 110 (1.5%) | 177 (1.7%) |
| Electricity | 547 (7.7%) | 2,078 (19.8%) |
| Fuel Oil or Kerosene | 0 (0.0%) | 74 (0.7%) |
| Coal or Coke | 0 (0.0%) | 0 (0.0%) |
| All other Fuels | 36 (0.5%) | 104 (1.0%) |
| No Fuel Used | 0 (0.0%) | 60 (0.6%) |
| Total | 7,115 (100.0%) | 10,522 (100.0%) |
Household Vehicle Usage in Logan
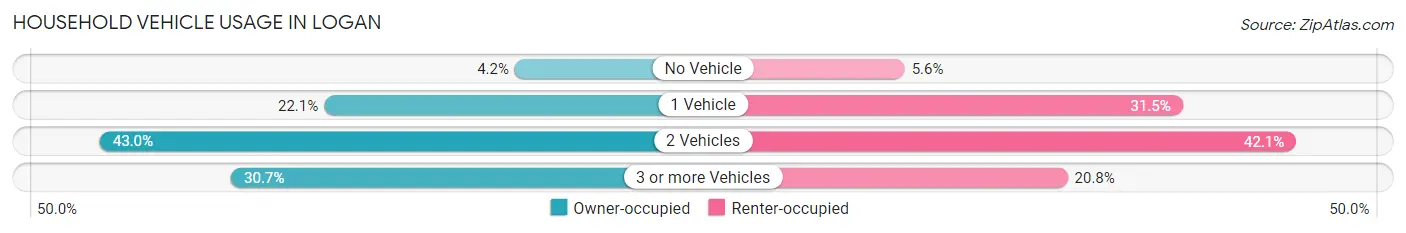
| Vehicles per Household | Owner-occupied | Renter-occupied |
| No Vehicle | 302 (4.2%) | 587 (5.6%) |
| 1 Vehicle | 1,569 (22.1%) | 3,317 (31.5%) |
| 2 Vehicles | 3,058 (43.0%) | 4,431 (42.1%) |
| 3 or more Vehicles | 2,186 (30.7%) | 2,187 (20.8%) |
| Total | 7,115 (100.0%) | 10,522 (100.0%) |
Real Estate & Mortgages in Logan
Real Estate and Mortgage Overview in Logan
| Characteristic | Without Mortgage | With Mortgage |
| Housing Units | 2,634 | 4,481 |
| Median Property Value | $299,300 | $287,200 |
| Median Household Income | $77,184 | $645 |
| Monthly Housing Costs | $474 | $171 |
| Real Estate Taxes | $1,689 | $152 |
Property Value by Mortgage Status in Logan
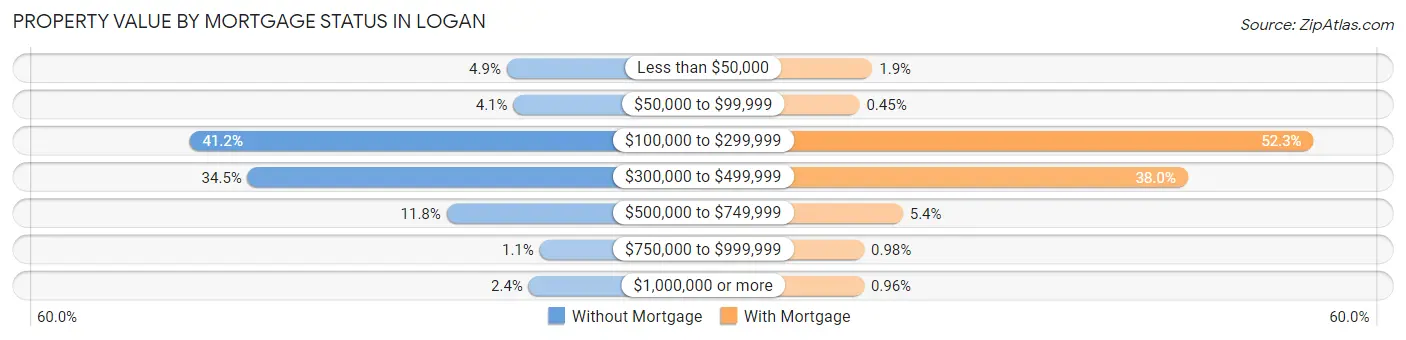
| Property Value | Without Mortgage | With Mortgage |
| Less than $50,000 | 129 (4.9%) | 86 (1.9%) |
| $50,000 to $99,999 | 109 (4.1%) | 20 (0.4%) |
| $100,000 to $299,999 | 1,084 (41.1%) | 2,345 (52.3%) |
| $300,000 to $499,999 | 909 (34.5%) | 1,701 (38.0%) |
| $500,000 to $749,999 | 310 (11.8%) | 242 (5.4%) |
| $750,000 to $999,999 | 30 (1.1%) | 44 (1.0%) |
| $1,000,000 or more | 63 (2.4%) | 43 (1.0%) |
| Total | 2,634 (100.0%) | 4,481 (100.0%) |
Household Income by Mortgage Status in Logan
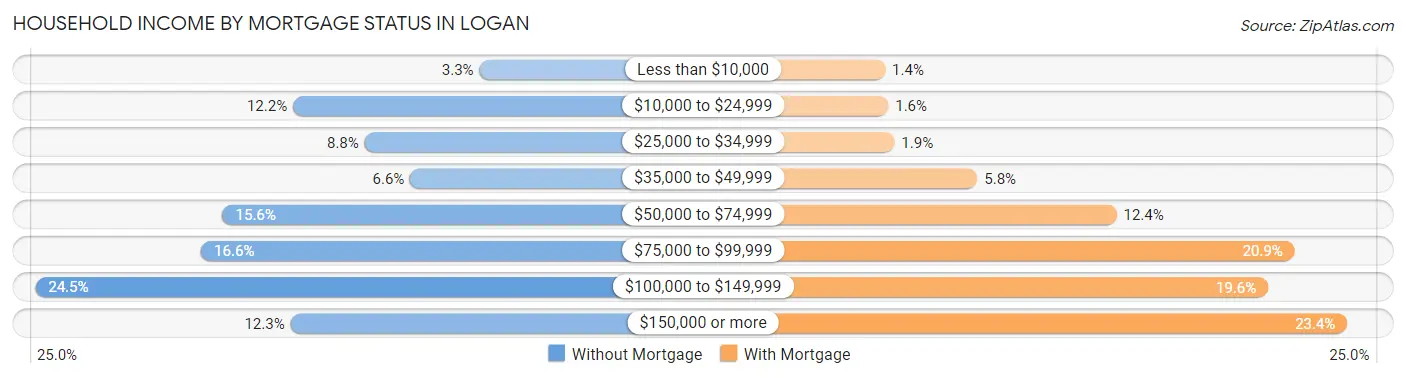
| Household Income | Without Mortgage | With Mortgage |
| Less than $10,000 | 88 (3.3%) | 63 (1.4%) |
| $10,000 to $24,999 | 322 (12.2%) | 70 (1.6%) |
| $25,000 to $34,999 | 232 (8.8%) | 83 (1.8%) |
| $35,000 to $49,999 | 175 (6.6%) | 260 (5.8%) |
| $50,000 to $74,999 | 410 (15.6%) | 557 (12.4%) |
| $75,000 to $99,999 | 437 (16.6%) | 937 (20.9%) |
| $100,000 to $149,999 | 645 (24.5%) | 880 (19.6%) |
| $150,000 or more | 325 (12.3%) | 1,049 (23.4%) |
| Total | 2,634 (100.0%) | 4,481 (100.0%) |
Property Value to Household Income Ratio in Logan
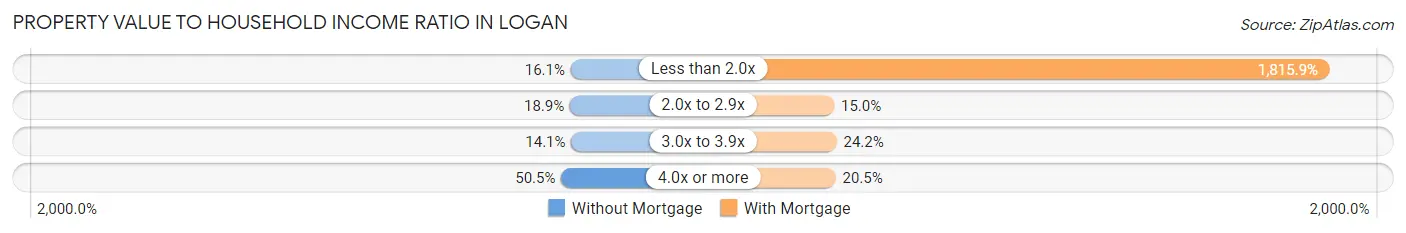
| Value-to-Income Ratio | Without Mortgage | With Mortgage |
| Less than 2.0x | 423 (16.1%) | 81,369 (1,815.9%) |
| 2.0x to 2.9x | 497 (18.9%) | 671 (15.0%) |
| 3.0x to 3.9x | 370 (14.1%) | 1,084 (24.2%) |
| 4.0x or more | 1,331 (50.5%) | 919 (20.5%) |
| Total | 2,634 (100.0%) | 4,481 (100.0%) |
Real Estate Taxes by Mortgage Status in Logan
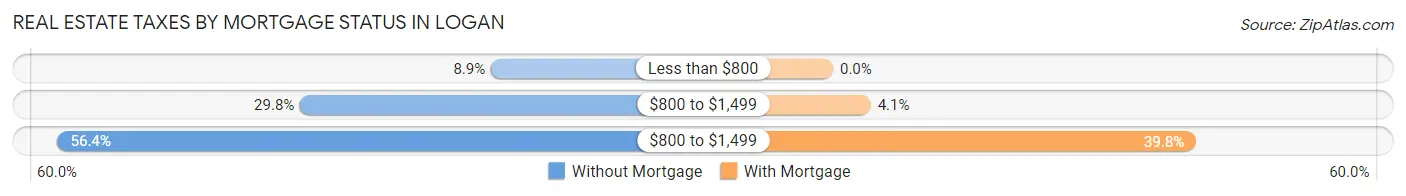
| Property Taxes | Without Mortgage | With Mortgage |
| Less than $800 | 234 (8.9%) | 0 (0.0%) |
| $800 to $1,499 | 785 (29.8%) | 185 (4.1%) |
| $800 to $1,499 | 1,485 (56.4%) | 1,783 (39.8%) |
| Total | 2,634 (100.0%) | 4,481 (100.0%) |
Health & Disability in Logan
Health Insurance Coverage by Age in Logan
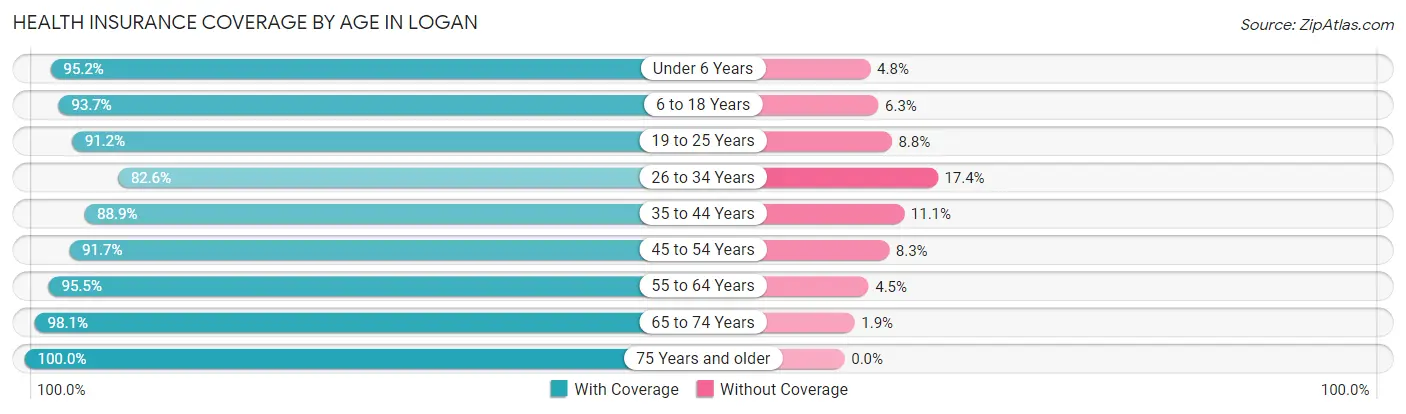
| Age Bracket | With Coverage | Without Coverage |
| Under 6 Years | 4,421 (95.2%) | 224 (4.8%) |
| 6 to 18 Years | 8,820 (93.7%) | 594 (6.3%) |
| 19 to 25 Years | 15,864 (91.2%) | 1,531 (8.8%) |
| 26 to 34 Years | 6,251 (82.6%) | 1,314 (17.4%) |
| 35 to 44 Years | 4,065 (88.9%) | 508 (11.1%) |
| 45 to 54 Years | 2,911 (91.7%) | 264 (8.3%) |
| 55 to 64 Years | 2,373 (95.5%) | 111 (4.5%) |
| 65 to 74 Years | 1,778 (98.1%) | 34 (1.9%) |
| 75 Years and older | 1,605 (100.0%) | 0 (0.0%) |
| Total | 48,088 (91.3%) | 4,580 (8.7%) |
Health Insurance Coverage by Citizenship Status in Logan
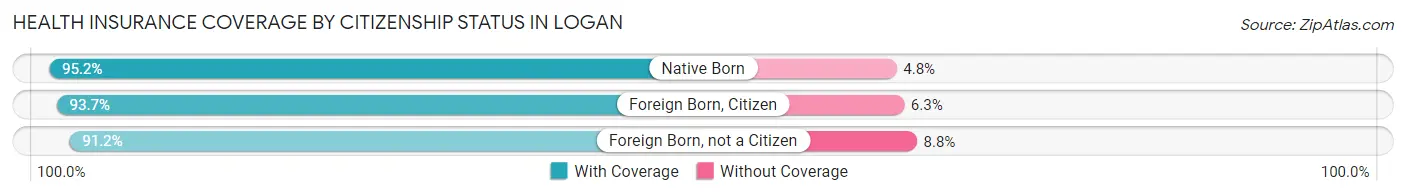
| Citizenship Status | With Coverage | Without Coverage |
| Native Born | 4,421 (95.2%) | 224 (4.8%) |
| Foreign Born, Citizen | 8,820 (93.7%) | 594 (6.3%) |
| Foreign Born, not a Citizen | 15,864 (91.2%) | 1,531 (8.8%) |
Health Insurance Coverage by Household Income in Logan
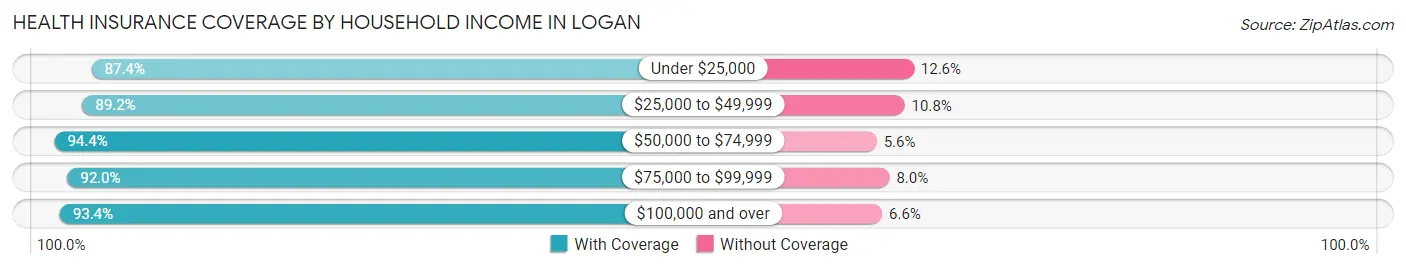
| Household Income | With Coverage | Without Coverage |
| Under $25,000 | 5,904 (87.4%) | 848 (12.6%) |
| $25,000 to $49,999 | 12,593 (89.2%) | 1,531 (10.8%) |
| $50,000 to $74,999 | 8,921 (94.4%) | 529 (5.6%) |
| $75,000 to $99,999 | 6,909 (92.0%) | 601 (8.0%) |
| $100,000 and over | 11,119 (93.4%) | 787 (6.6%) |
Public vs Private Health Insurance Coverage by Age in Logan
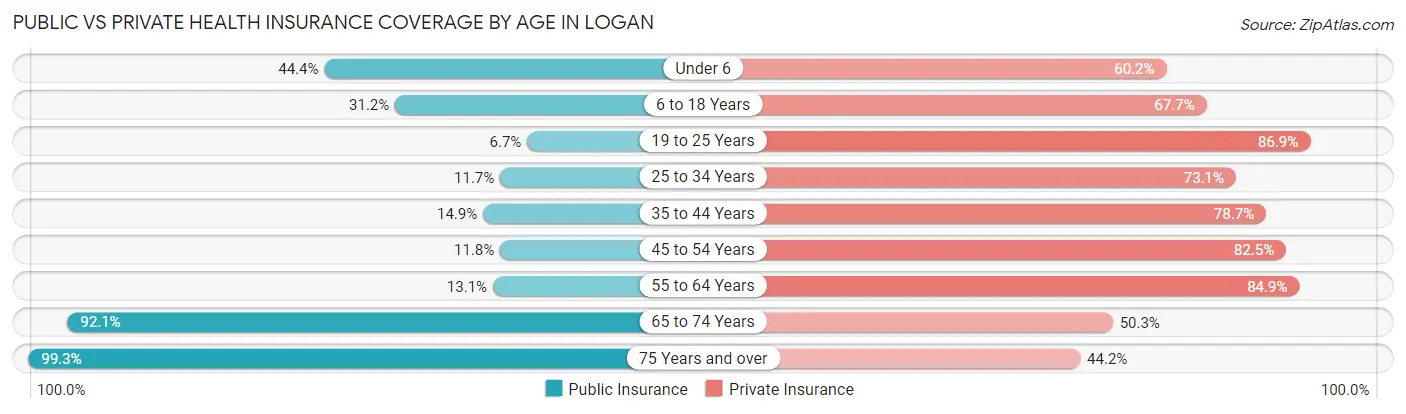
| Age Bracket | Public Insurance | Private Insurance |
| Under 6 | 2,061 (44.4%) | 2,797 (60.2%) |
| 6 to 18 Years | 2,940 (31.2%) | 6,372 (67.7%) |
| 19 to 25 Years | 1,167 (6.7%) | 15,118 (86.9%) |
| 25 to 34 Years | 888 (11.7%) | 5,533 (73.1%) |
| 35 to 44 Years | 682 (14.9%) | 3,601 (78.7%) |
| 45 to 54 Years | 373 (11.7%) | 2,618 (82.5%) |
| 55 to 64 Years | 325 (13.1%) | 2,109 (84.9%) |
| 65 to 74 Years | 1,668 (92.0%) | 911 (50.3%) |
| 75 Years and over | 1,594 (99.3%) | 710 (44.2%) |
| Total | 11,698 (22.2%) | 39,769 (75.5%) |
Disability Status by Sex by Age in Logan
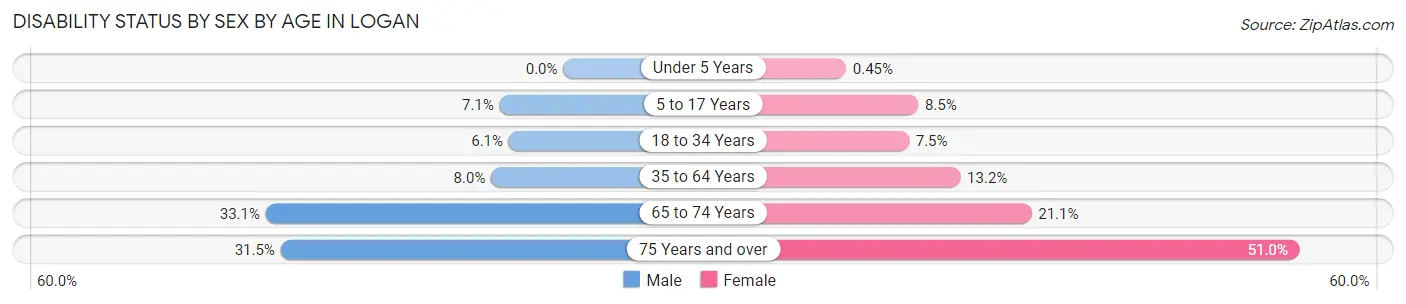
| Age Bracket | Male | Female |
| Under 5 Years | 0 (0.0%) | 9 (0.4%) |
| 5 to 17 Years | 293 (7.1%) | 338 (8.5%) |
| 18 to 34 Years | 813 (6.1%) | 1,003 (7.5%) |
| 35 to 64 Years | 403 (8.0%) | 687 (13.2%) |
| 65 to 74 Years | 288 (33.1%) | 199 (21.1%) |
| 75 Years and over | 238 (31.5%) | 433 (51.0%) |
Disability Class by Sex by Age in Logan
Disability Class: Hearing Difficulty
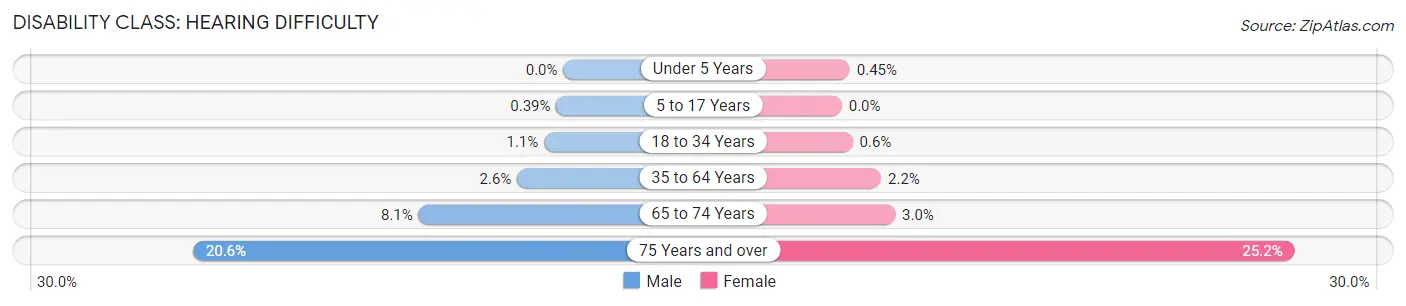
| Age Bracket | Male | Female |
| Under 5 Years | 0 (0.0%) | 9 (0.4%) |
| 5 to 17 Years | 16 (0.4%) | 0 (0.0%) |
| 18 to 34 Years | 143 (1.1%) | 80 (0.6%) |
| 35 to 64 Years | 129 (2.6%) | 114 (2.2%) |
| 65 to 74 Years | 70 (8.1%) | 28 (3.0%) |
| 75 Years and over | 156 (20.6%) | 214 (25.2%) |
Disability Class: Vision Difficulty
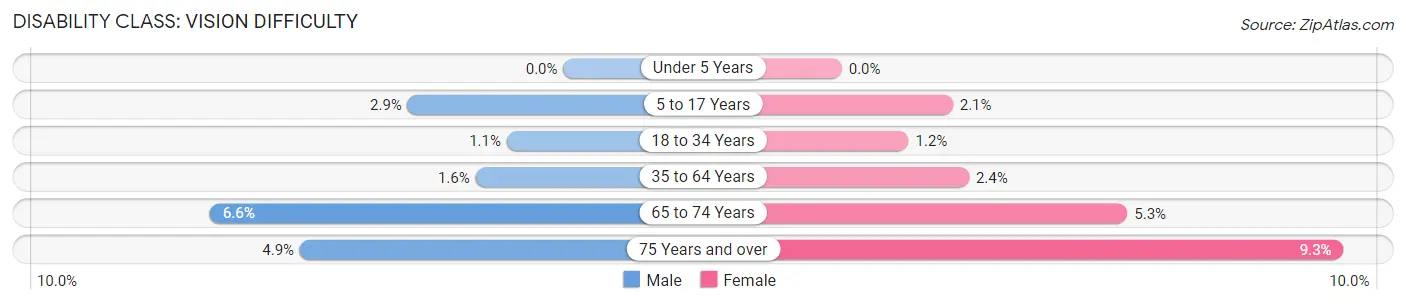
| Age Bracket | Male | Female |
| Under 5 Years | 0 (0.0%) | 0 (0.0%) |
| 5 to 17 Years | 119 (2.9%) | 82 (2.1%) |
| 18 to 34 Years | 140 (1.1%) | 167 (1.2%) |
| 35 to 64 Years | 82 (1.6%) | 123 (2.4%) |
| 65 to 74 Years | 57 (6.6%) | 50 (5.3%) |
| 75 Years and over | 37 (4.9%) | 79 (9.3%) |
Disability Class: Cognitive Difficulty
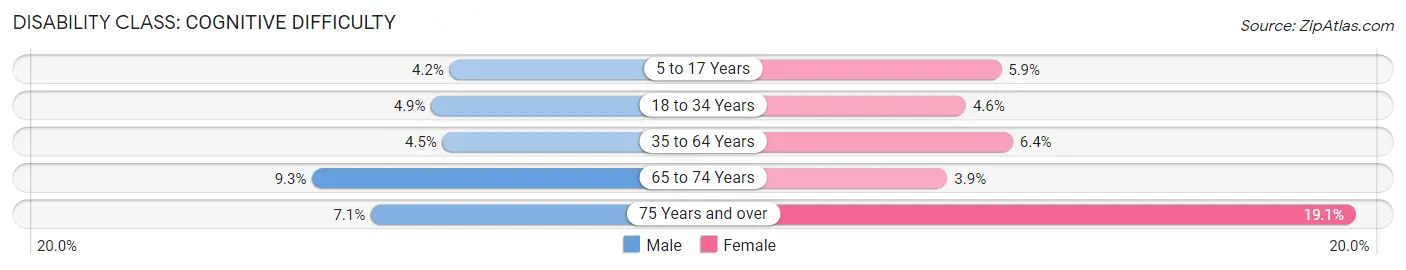
| Age Bracket | Male | Female |
| 5 to 17 Years | 174 (4.2%) | 236 (5.9%) |
| 18 to 34 Years | 656 (4.9%) | 619 (4.6%) |
| 35 to 64 Years | 225 (4.5%) | 331 (6.4%) |
| 65 to 74 Years | 81 (9.3%) | 37 (3.9%) |
| 75 Years and over | 54 (7.1%) | 162 (19.1%) |
Disability Class: Ambulatory Difficulty
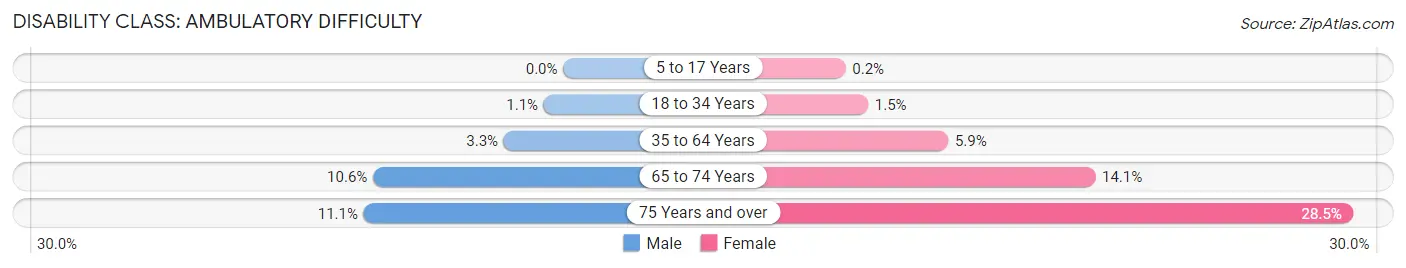
| Age Bracket | Male | Female |
| 5 to 17 Years | 0 (0.0%) | 8 (0.2%) |
| 18 to 34 Years | 144 (1.1%) | 195 (1.5%) |
| 35 to 64 Years | 166 (3.3%) | 308 (5.9%) |
| 65 to 74 Years | 92 (10.6%) | 133 (14.1%) |
| 75 Years and over | 84 (11.1%) | 242 (28.5%) |
Disability Class: Self-Care Difficulty
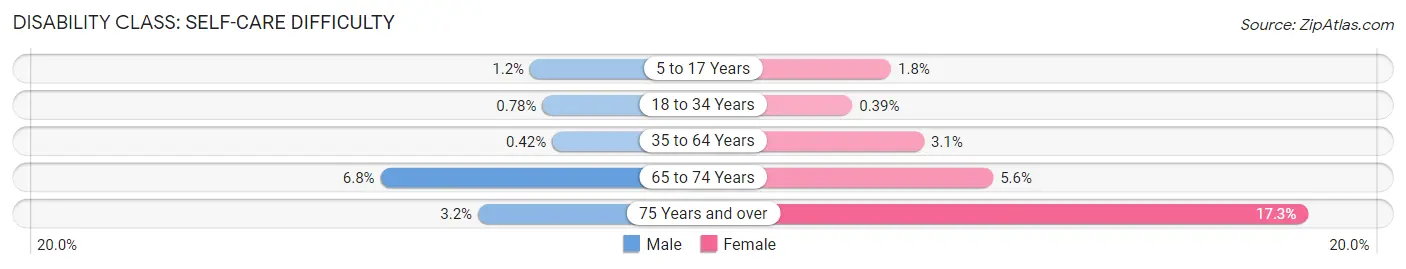
| Age Bracket | Male | Female |
| 5 to 17 Years | 51 (1.2%) | 73 (1.8%) |
| 18 to 34 Years | 105 (0.8%) | 52 (0.4%) |
| 35 to 64 Years | 21 (0.4%) | 159 (3.0%) |
| 65 to 74 Years | 59 (6.8%) | 53 (5.6%) |
| 75 Years and over | 24 (3.2%) | 147 (17.3%) |
Technology Access in Logan
Computing Device Access in Logan
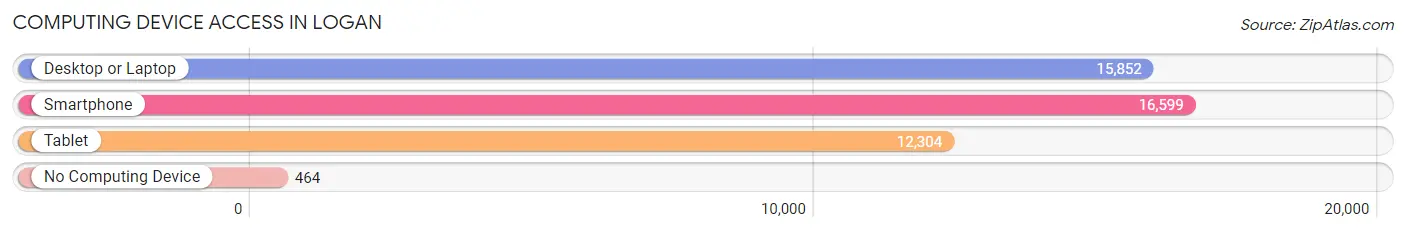
| Device Type | # Households | % Households |
| Desktop or Laptop | 15,852 | 89.9% |
| Smartphone | 16,599 | 94.1% |
| Tablet | 12,304 | 69.8% |
| No Computing Device | 464 | 2.6% |
| Total | 17,637 | 100.0% |
Internet Access in Logan
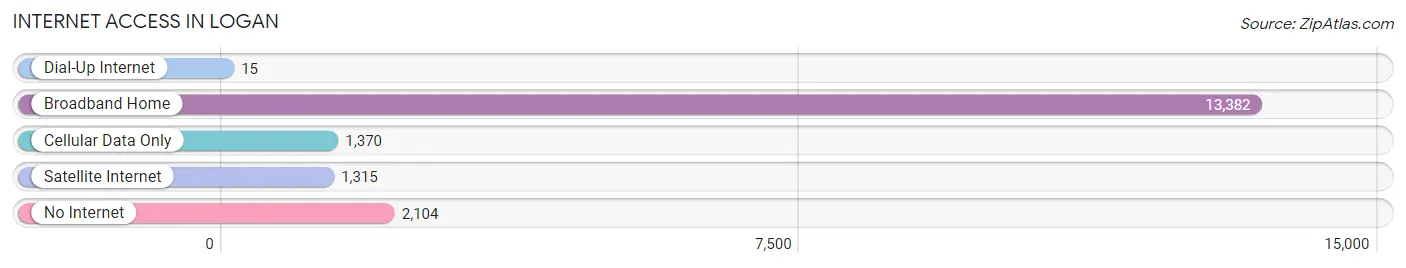
| Internet Type | # Households | % Households |
| Dial-Up Internet | 15 | 0.1% |
| Broadband Home | 13,382 | 75.9% |
| Cellular Data Only | 1,370 | 7.8% |
| Satellite Internet | 1,315 | 7.5% |
| No Internet | 2,104 | 11.9% |
| Total | 17,637 | 100.0% |
Logan Summary
Logan, Utah is a city located in Cache County, Utah, United States. It is the county seat of Cache County and the principal city of the Logan, UT-ID Metropolitan Statistical Area, which includes Cache County and Franklin County, Idaho. The population of Logan was estimated to be 48,174 in 2019, making it the second-largest city in the state of Utah after Salt Lake City.
History
The area that is now Logan was originally inhabited by the Shoshone and Ute Native American tribes. The first European settlers arrived in the area in 1859, led by Peter Maughan. Maughan and his group of settlers established a fort in the area, which was later named Logan after the leader of the group, Ephraim Logan.
The city of Logan was officially incorporated in 1866 and was designated as the county seat of Cache County. The city quickly grew in size and population, and by the early 1900s, it had become a major agricultural and commercial center in the region.
Geography
Logan is located in northern Utah, approximately 80 miles north of Salt Lake City. It is situated in the Cache Valley, which is surrounded by the Wasatch Mountains to the east and the Bear River Mountains to the west. The city is located at an elevation of 4,527 feet above sea level.
The climate in Logan is generally mild, with cold winters and hot summers. The average annual temperature is 45.2°F, and the average annual precipitation is 17.2 inches.
Economy
Logan's economy is largely based on agriculture, manufacturing, and education. The city is home to Utah State University, which is the state's largest public university. The university is a major employer in the city, and it also contributes to the local economy through research and development.
The city is also home to several manufacturing companies, including a large paper mill and a large food processing plant. Other major employers in the city include the Cache Valley Hospital, the Logan Regional Medical Center, and the Cache Valley School District.
Demographics
As of the 2019 census, the population of Logan was estimated to be 48,174. The racial makeup of the city was 91.2% White, 0.7% African American, 0.7% Native American, 1.3% Asian, 0.2% Pacific Islander, 3.2% from other races, and 2.8% from two or more races. Hispanic or Latino of any race were 8.2% of the population.
The median household income in Logan was $50,945 in 2019, and the median family income was $62,917. The per capita income in the city was $25,945. The poverty rate in Logan was 11.2% in 2019.
Common Questions
What is Per Capita Income in Logan?
Per Capita income in Logan is $23,391.
What is the Median Family Income in Logan?
Median Family Income in Logan is $60,717.
What is the Median Household income in Logan?
Median Household Income in Logan is $52,473.
What is Income or Wage Gap in Logan?
Income or Wage Gap in Logan is 43.0%.
Women in Logan earn 57.0 cents for every dollar earned by a man.
What is Family Income Deficit in Logan?
Family Income Deficit in Logan is $9,927.
Families that are below poverty line in Logan earn $9,927 less on average than the poverty threshold level.
What is Inequality or Gini Index in Logan?
Inequality or Gini Index in Logan is 0.42.
What is the Total Population of Logan?
Total Population of Logan is 53,246.
What is the Total Male Population of Logan?
Total Male Population of Logan is 26,646.
What is the Total Female Population of Logan?
Total Female Population of Logan is 26,600.
What is the Ratio of Males per 100 Females in Logan?
There are 100.17 Males per 100 Females in Logan.
What is the Ratio of Females per 100 Males in Logan?
There are 99.83 Females per 100 Males in Logan.
What is the Median Population Age in Logan?
Median Population Age in Logan is 23.7 Years.
What is the Average Family Size in Logan
Average Family Size in Logan is 3.1 People.
What is the Average Household Size in Logan
Average Household Size in Logan is 2.8 People.
How Large is the Labor Force in Logan?
There are 31,100 People in the Labor Forcein in Logan.
What is the Percentage of People in the Labor Force in Logan?
73.5% of People are in the Labor Force in Logan.
What is the Unemployment Rate in Logan?
Unemployment Rate in Logan is 2.5%.