Cannonville, UT Map & Demographics
Cannonville Map
Cannonville Overview
$23,167
PER CAPITA INCOME
$50,250
AVG HOUSEHOLD INCOME
37.0%
WAGE / INCOME GAP [ % ]
63.0¢/ $1
WAGE / INCOME GAP [ $ ]
0.45
INEQUALITY / GINI INDEX
265
TOTAL POPULATION
136
MALE POPULATION
129
FEMALE POPULATION
105.43
MALES / 100 FEMALES
94.85
FEMALES / 100 MALES
38.4
MEDIAN AGE
3.5
AVG FAMILY SIZE
2.4
AVG HOUSEHOLD SIZE
141
LABOR FORCE [ PEOPLE ]
66.5%
PERCENT IN LABOR FORCE
1.4%
UNEMPLOYMENT RATE
Cannonville Zip Codes
Cannonville Area Codes
Income in Cannonville
Income Overview in Cannonville
| Characteristic | Number | Measure |
| Per Capita Income | 265 | $23,167 |
| Median Family Income | 56 | $0 |
| Mean Family Income | 56 | $73,513 |
| Median Household Income | 110 | $50,250 |
| Mean Household Income | 110 | $50,260 |
| Income Deficit | 56 | $0 |
| Wage / Income Gap (%) | 265 | 36.99% |
| Wage / Income Gap ($) | 265 | 63.01¢ per $1 |
| Gini / Inequality Index | 265 | 0.45 |
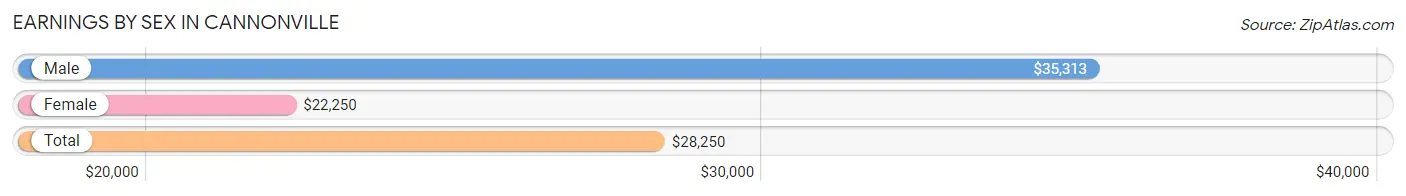
Earnings by Sex in Cannonville
Average Earnings in Cannonville are $28,250, $35,313 for men and $22,250 for women, a difference of 37.0%.
| Sex | Number | Average Earnings |
| Male | 95 (63.3%) | $35,313 |
| Female | 55 (36.7%) | $22,250 |
| Total | 150 (100.0%) | $28,250 |
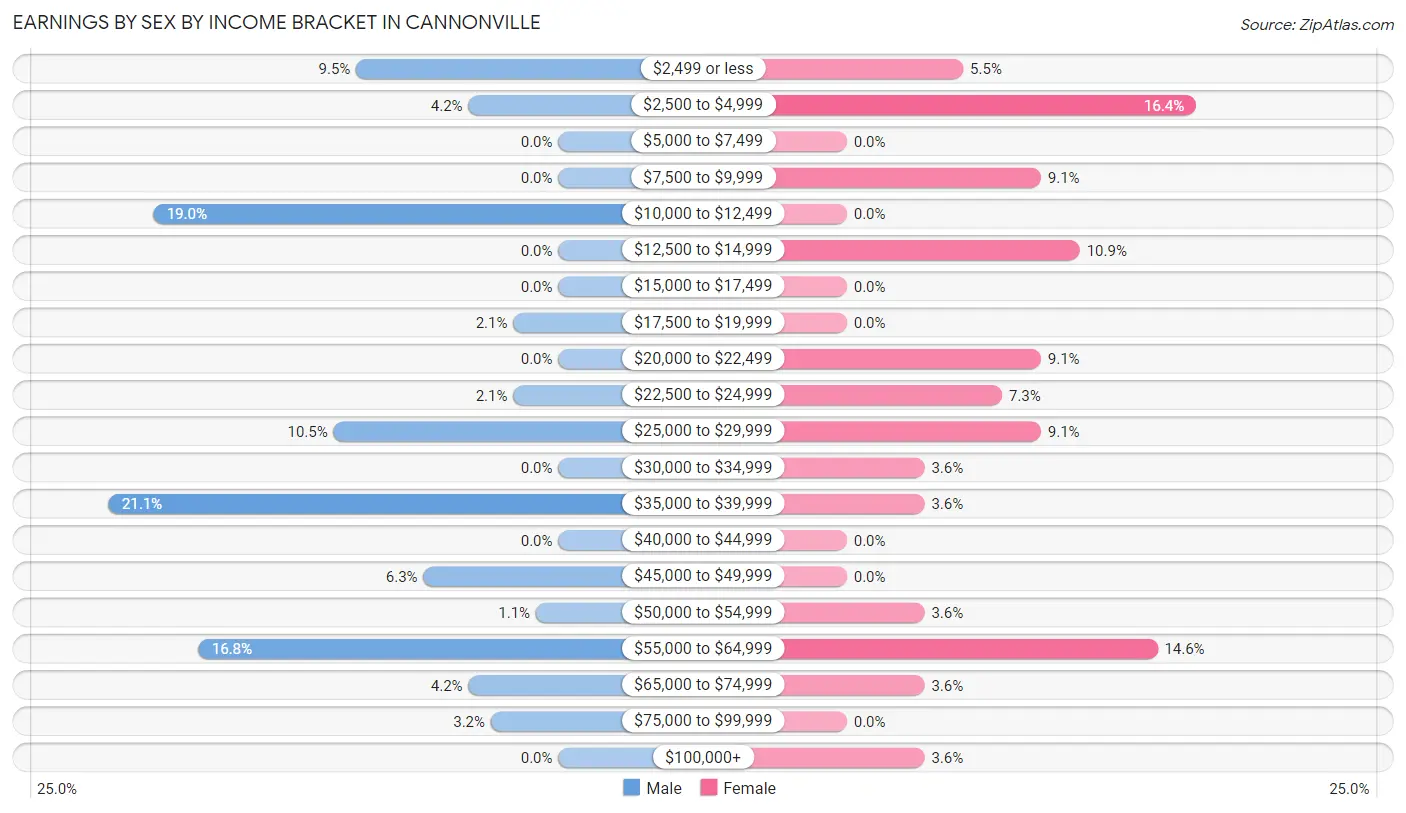
Earnings by Sex by Income Bracket in Cannonville
The most common earnings brackets in Cannonville are $35,000 to $39,999 for men (20 | 21.0%) and $2,500 to $4,999 for women (9 | 16.4%).
| Income | Male | Female |
| $2,499 or less | 9 (9.5%) | 3 (5.4%) |
| $2,500 to $4,999 | 4 (4.2%) | 9 (16.4%) |
| $5,000 to $7,499 | 0 (0.0%) | 0 (0.0%) |
| $7,500 to $9,999 | 0 (0.0%) | 5 (9.1%) |
| $10,000 to $12,499 | 18 (19.0%) | 0 (0.0%) |
| $12,500 to $14,999 | 0 (0.0%) | 6 (10.9%) |
| $15,000 to $17,499 | 0 (0.0%) | 0 (0.0%) |
| $17,500 to $19,999 | 2 (2.1%) | 0 (0.0%) |
| $20,000 to $22,499 | 0 (0.0%) | 5 (9.1%) |
| $22,500 to $24,999 | 2 (2.1%) | 4 (7.3%) |
| $25,000 to $29,999 | 10 (10.5%) | 5 (9.1%) |
| $30,000 to $34,999 | 0 (0.0%) | 2 (3.6%) |
| $35,000 to $39,999 | 20 (21.0%) | 2 (3.6%) |
| $40,000 to $44,999 | 0 (0.0%) | 0 (0.0%) |
| $45,000 to $49,999 | 6 (6.3%) | 0 (0.0%) |
| $50,000 to $54,999 | 1 (1.1%) | 2 (3.6%) |
| $55,000 to $64,999 | 16 (16.8%) | 8 (14.5%) |
| $65,000 to $74,999 | 4 (4.2%) | 2 (3.6%) |
| $75,000 to $99,999 | 3 (3.2%) | 0 (0.0%) |
| $100,000+ | 0 (0.0%) | 2 (3.6%) |
| Total | 95 (100.0%) | 55 (100.0%) |
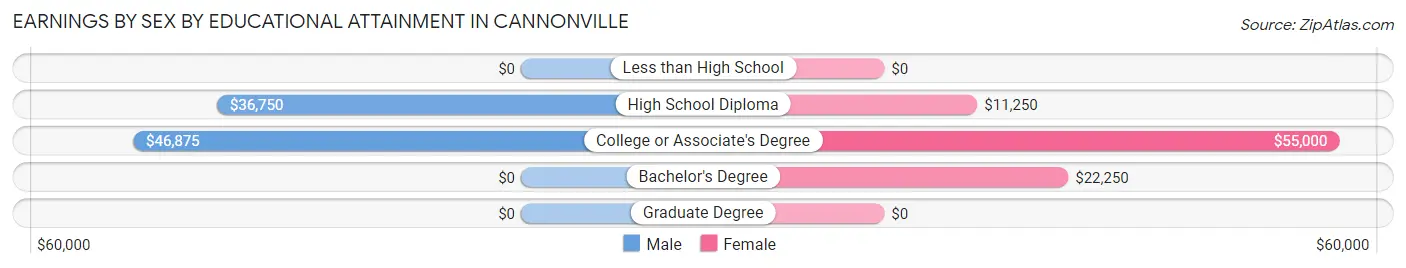
Earnings by Sex by Educational Attainment in Cannonville
Average earnings in Cannonville are $37,250 for men and $28,000 for women, a difference of 24.8%. Men with an educational attainment of college or associate's degree enjoy the highest average annual earnings of $46,875, while those with high school diploma education earn the least with $36,750. Women with an educational attainment of college or associate's degree earn the most with the average annual earnings of $55,000, while those with high school diploma education have the smallest earnings of $11,250.
| Educational Attainment | Male Income | Female Income |
| Less than High School | - | - |
| High School Diploma | $36,750 | $11,250 |
| College or Associate's Degree | $46,875 | $55,000 |
| Bachelor's Degree | - | - |
| Graduate Degree | - | - |
| Total | $37,250 | $28,000 |
Family Income in Cannonville
Family Income Brackets in Cannonville
According to the Cannonville family income data, there are 25 families falling into the $50,000 to $74,999 income range, which is the most common income bracket and makes up 44.6% of all families.
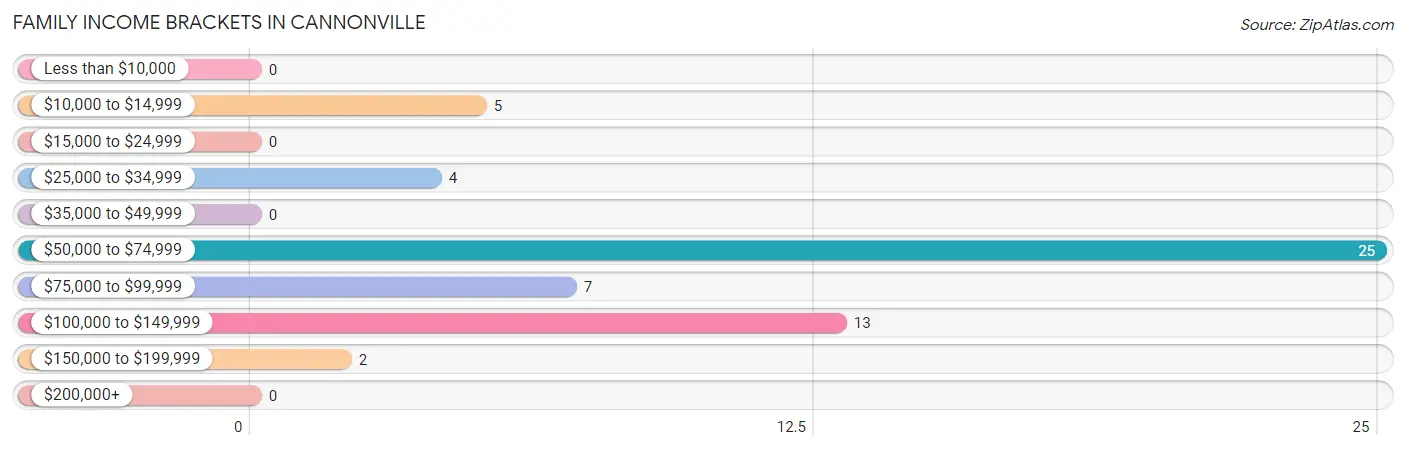
| Income Bracket | # Families | % Families |
| Less than $10,000 | 0 | 0.0% |
| $10,000 to $14,999 | 5 | 8.9% |
| $15,000 to $24,999 | 0 | 0.0% |
| $25,000 to $34,999 | 4 | 7.1% |
| $35,000 to $49,999 | 0 | 0.0% |
| $50,000 to $74,999 | 25 | 44.6% |
| $75,000 to $99,999 | 7 | 12.5% |
| $100,000 to $149,999 | 13 | 23.2% |
| $150,000 to $199,999 | 2 | 3.6% |
| $200,000+ | 0 | 0.0% |
Family Income by Famaliy Size in Cannonville
2-person families (20 | 35.7%) account for the highest median family income in Cannonville with $64,000 per family, while 2-person families (20 | 35.7%) have the highest median income of $32,000 per family member.
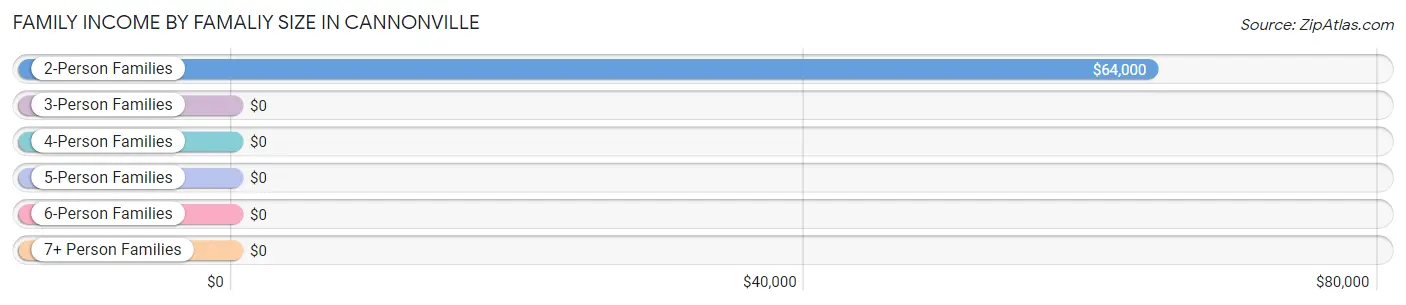
| Income Bracket | # Families | Median Income |
| 2-Person Families | 20 (35.7%) | $64,000 |
| 3-Person Families | 22 (39.3%) | $0 |
| 4-Person Families | 4 (7.1%) | $0 |
| 5-Person Families | 2 (3.6%) | $0 |
| 6-Person Families | 6 (10.7%) | $0 |
| 7+ Person Families | 2 (3.6%) | $0 |
| Total | 56 (100.0%) | $0 |
Family Income by Number of Earners in Cannonville
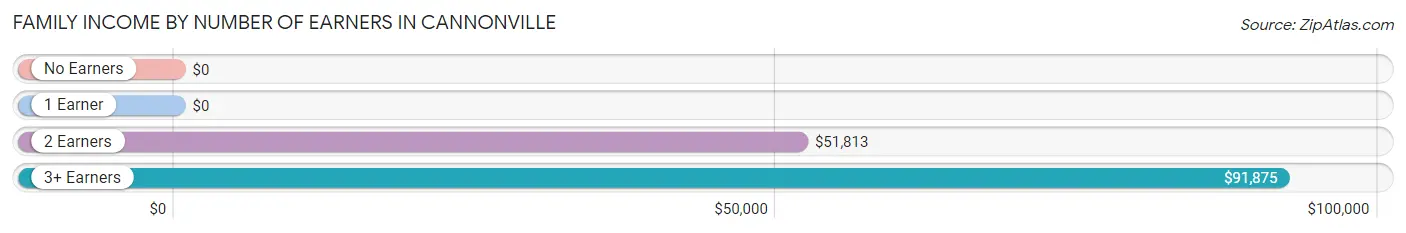
| Number of Earners | # Families | Median Income |
| No Earners | 3 (5.4%) | $0 |
| 1 Earner | 10 (17.9%) | $0 |
| 2 Earners | 29 (51.8%) | $51,813 |
| 3+ Earners | 14 (25.0%) | $91,875 |
| Total | 56 (100.0%) | $0 |
Household Income in Cannonville
Household Income Brackets in Cannonville
With 30 households falling in the category, the $50,000 to $74,999 income range is the most frequent in Cannonville, accounting for 27.3% of all households.
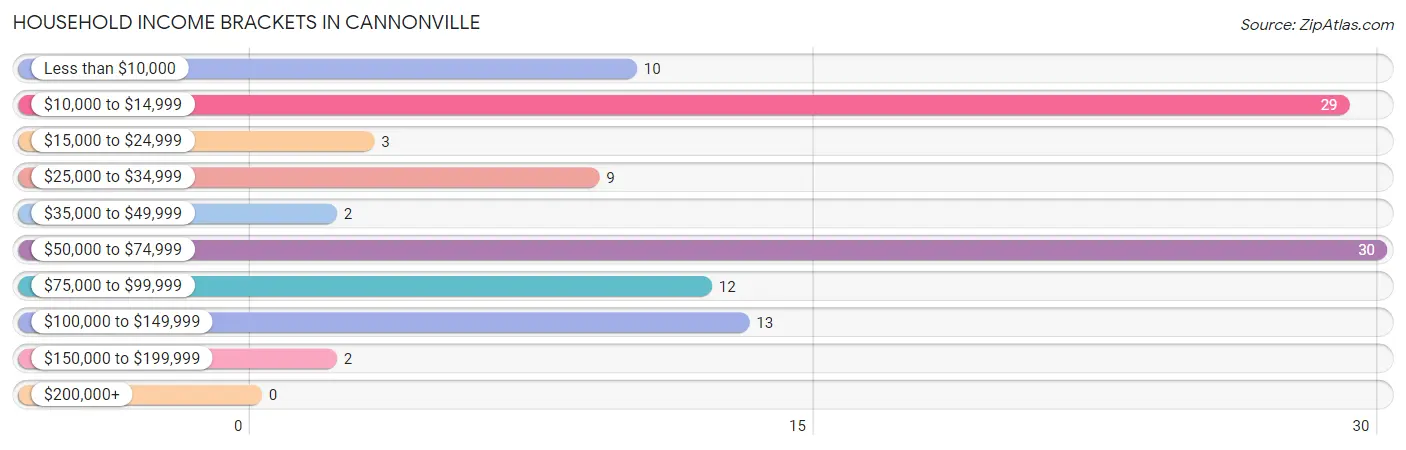
| Income Bracket | # Households | % Households |
| Less than $10,000 | 10 | 9.1% |
| $10,000 to $14,999 | 29 | 26.4% |
| $15,000 to $24,999 | 3 | 2.7% |
| $25,000 to $34,999 | 9 | 8.2% |
| $35,000 to $49,999 | 2 | 1.8% |
| $50,000 to $74,999 | 30 | 27.3% |
| $75,000 to $99,999 | 12 | 10.9% |
| $100,000 to $149,999 | 13 | 11.8% |
| $150,000 to $199,999 | 2 | 1.8% |
| $200,000+ | 0 | 0.0% |
Household Income by Householder Age in Cannonville
The median household income in Cannonville is $50,250, with the highest median household income of $83,750 found in the 45 to 64 years age bracket for the primary householder. A total of 16 households (14.5%) fall into this category.
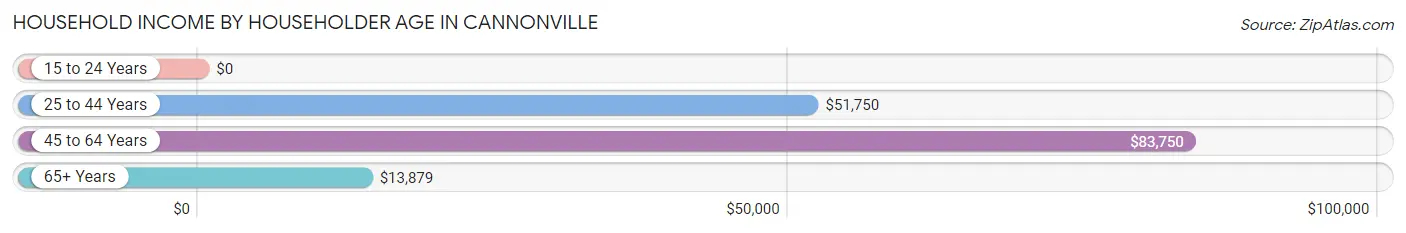
| Income Bracket | # Households | Median Income |
| 15 to 24 Years | 0 (0.0%) | $0 |
| 25 to 44 Years | 42 (38.2%) | $51,750 |
| 45 to 64 Years | 16 (14.5%) | $83,750 |
| 65+ Years | 52 (47.3%) | $13,879 |
| Total | 110 (100.0%) | $50,250 |
Poverty in Cannonville
Income Below Poverty by Sex and Age in Cannonville
With 15.4% poverty level for males and 14.7% for females among the residents of Cannonville, 75 year old and over males and 15 year old females are the most vulnerable to poverty, with 8 males (72.7%) and 6 females (100.0%) in their respective age groups living below the poverty level.
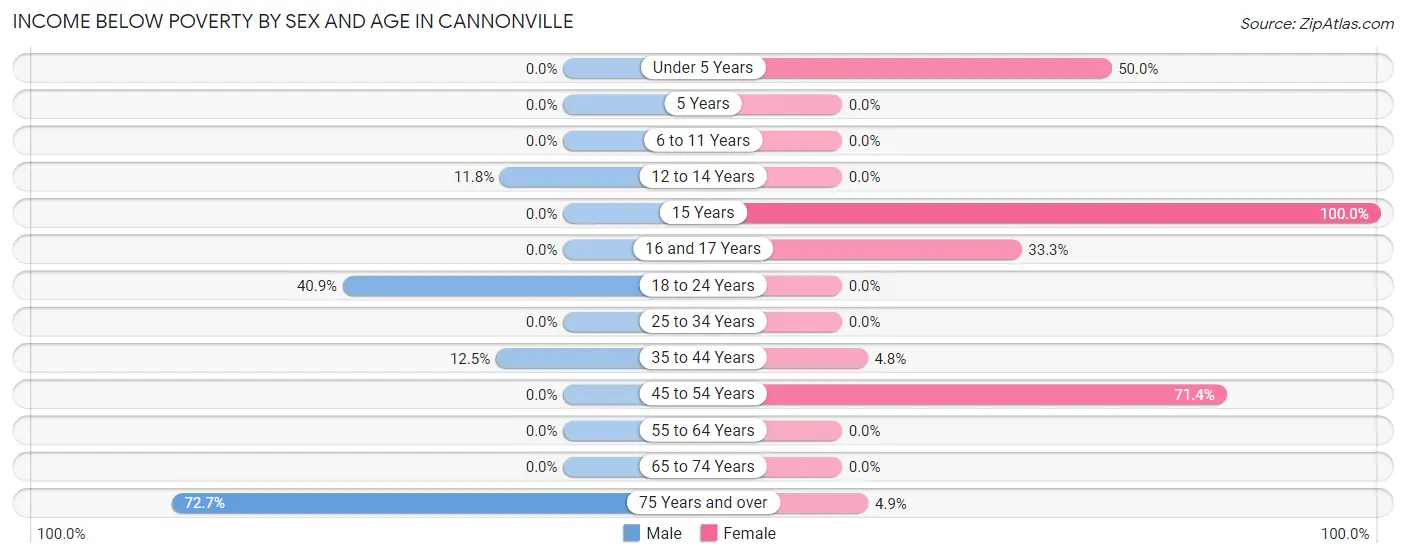
| Age Bracket | Male | Female |
| Under 5 Years | 0 (0.0%) | 3 (50.0%) |
| 5 Years | 0 (0.0%) | 0 (0.0%) |
| 6 to 11 Years | 0 (0.0%) | 0 (0.0%) |
| 12 to 14 Years | 2 (11.8%) | 0 (0.0%) |
| 15 Years | 0 (0.0%) | 6 (100.0%) |
| 16 and 17 Years | 0 (0.0%) | 2 (33.3%) |
| 18 to 24 Years | 9 (40.9%) | 0 (0.0%) |
| 25 to 34 Years | 0 (0.0%) | 0 (0.0%) |
| 35 to 44 Years | 2 (12.5%) | 1 (4.8%) |
| 45 to 54 Years | 0 (0.0%) | 5 (71.4%) |
| 55 to 64 Years | 0 (0.0%) | 0 (0.0%) |
| 65 to 74 Years | 0 (0.0%) | 0 (0.0%) |
| 75 Years and over | 8 (72.7%) | 2 (4.9%) |
| Total | 21 (15.4%) | 19 (14.7%) |
Income Above Poverty by Sex and Age in Cannonville
According to the poverty statistics in Cannonville, males aged under 5 years and females aged 6 to 11 years are the age groups that are most secure financially, with 100.0% of males and 100.0% of females in these age groups living above the poverty line.
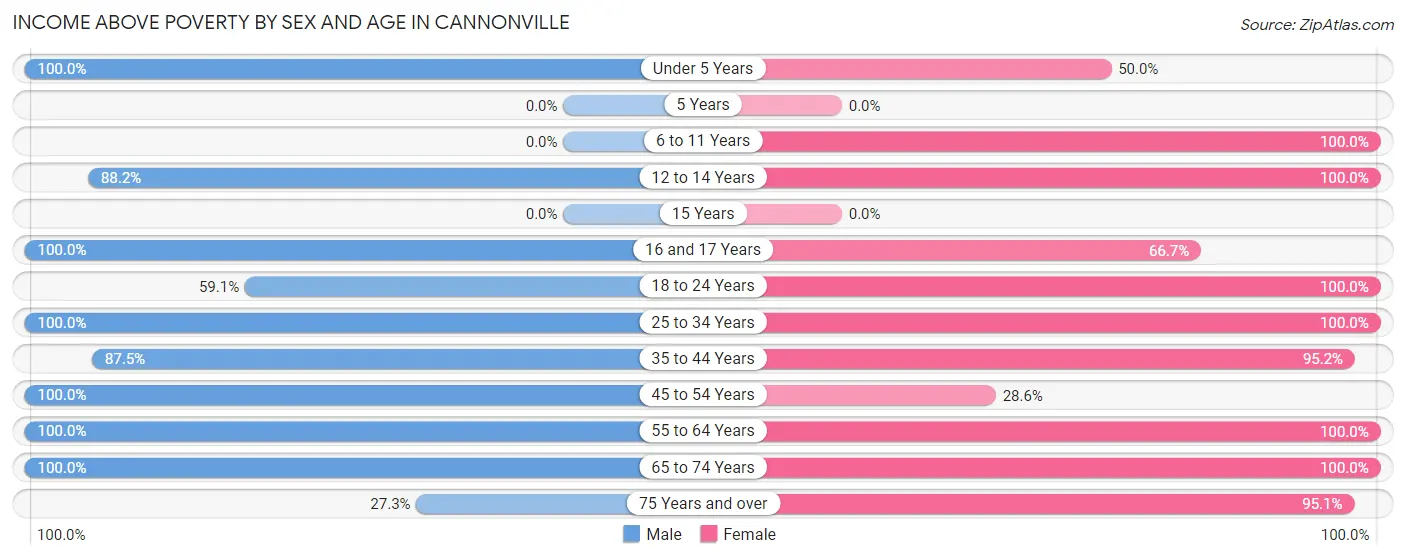
| Age Bracket | Male | Female |
| Under 5 Years | 8 (100.0%) | 3 (50.0%) |
| 5 Years | 0 (0.0%) | 0 (0.0%) |
| 6 to 11 Years | 0 (0.0%) | 12 (100.0%) |
| 12 to 14 Years | 15 (88.2%) | 4 (100.0%) |
| 15 Years | 0 (0.0%) | 0 (0.0%) |
| 16 and 17 Years | 9 (100.0%) | 4 (66.7%) |
| 18 to 24 Years | 13 (59.1%) | 5 (100.0%) |
| 25 to 34 Years | 25 (100.0%) | 10 (100.0%) |
| 35 to 44 Years | 14 (87.5%) | 20 (95.2%) |
| 45 to 54 Years | 18 (100.0%) | 2 (28.6%) |
| 55 to 64 Years | 7 (100.0%) | 4 (100.0%) |
| 65 to 74 Years | 3 (100.0%) | 7 (100.0%) |
| 75 Years and over | 3 (27.3%) | 39 (95.1%) |
| Total | 115 (84.6%) | 110 (85.3%) |
Income Below Poverty Among Married-Couple Families in Cannonville
The poverty statistics for married-couple families in Cannonville show that 4.3% or 2 of the total 46 families live below the poverty line. Families with 3 or 4 children have the highest poverty rate of 33.3%, comprising of 2 families. On the other hand, families with no children have the lowest poverty rate of 0.0%, which includes 0 families.
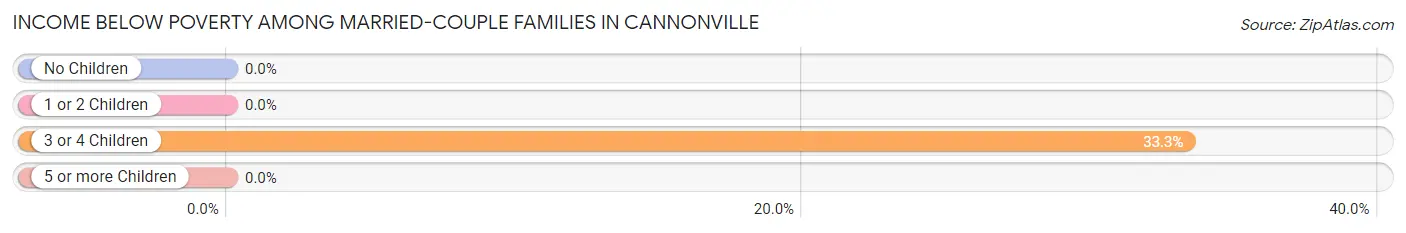
| Children | Above Poverty | Below Poverty |
| No Children | 12 (100.0%) | 0 (0.0%) |
| 1 or 2 Children | 26 (100.0%) | 0 (0.0%) |
| 3 or 4 Children | 4 (66.7%) | 2 (33.3%) |
| 5 or more Children | 2 (100.0%) | 0 (0.0%) |
| Total | 44 (95.7%) | 2 (4.3%) |
Income Below Poverty Among Single-Parent Households in Cannonville
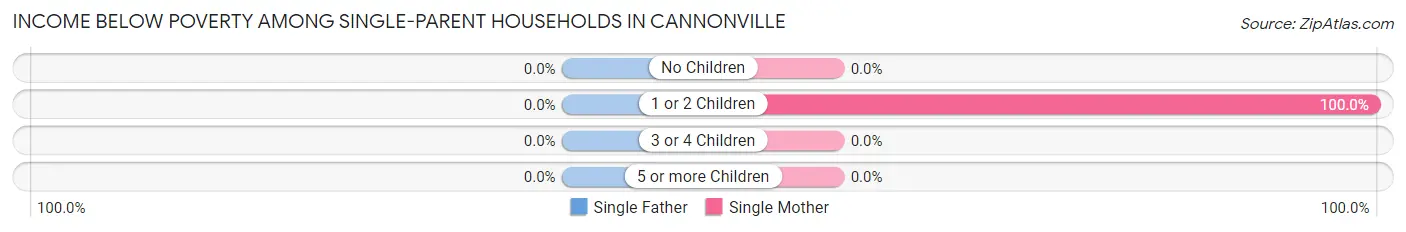
| Children | Single Father | Single Mother |
| No Children | 0 (0.0%) | 0 (0.0%) |
| 1 or 2 Children | 0 (0.0%) | 5 (100.0%) |
| 3 or 4 Children | 0 (0.0%) | 0 (0.0%) |
| 5 or more Children | 0 (0.0%) | 0 (0.0%) |
| Total | 0 (0.0%) | 5 (100.0%) |
Income Below Poverty Among Married-Couple vs Single-Parent Households in Cannonville
The poverty data for Cannonville shows that 2 of the married-couple family households (4.3%) and 5 of the single-parent households (50.0%) are living below the poverty level. Within the married-couple family households, those with 3 or 4 children have the highest poverty rate, with 2 households (33.3%) falling below the poverty line. Among the single-parent households, those with 1 or 2 children have the highest poverty rate, with 5 household (100.0%) living below poverty.
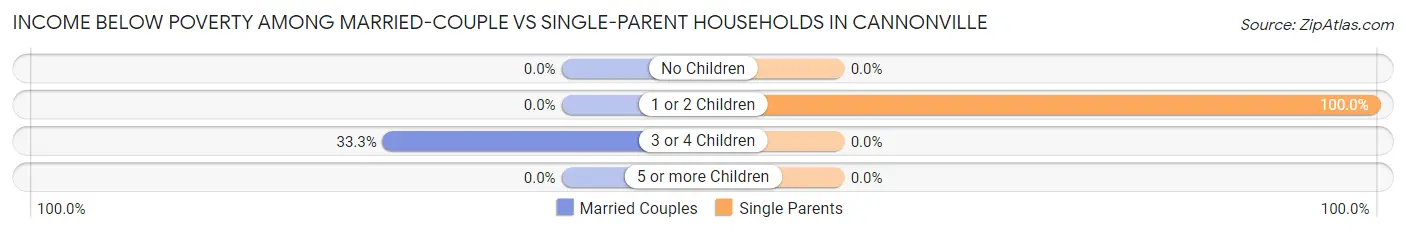
| Children | Married-Couple Families | Single-Parent Households |
| No Children | 0 (0.0%) | 0 (0.0%) |
| 1 or 2 Children | 0 (0.0%) | 5 (100.0%) |
| 3 or 4 Children | 2 (33.3%) | 0 (0.0%) |
| 5 or more Children | 0 (0.0%) | 0 (0.0%) |
| Total | 2 (4.3%) | 5 (50.0%) |
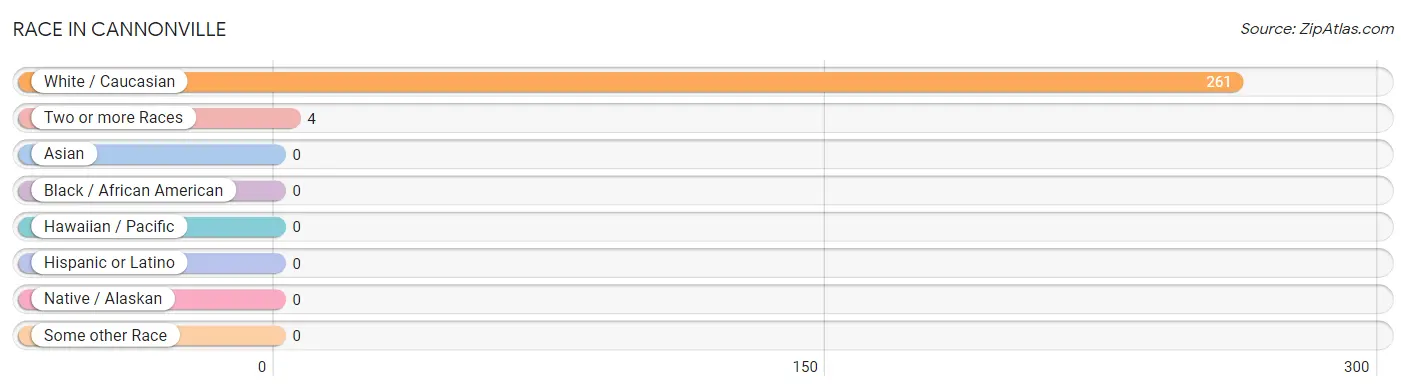
Race in Cannonville
The most populous races in Cannonville are White / Caucasian (261 | 98.5%), and Two or more Races (4 | 1.5%).
| Race | # Population | % Population |
| Asian | 0 | 0.0% |
| Black / African American | 0 | 0.0% |
| Hawaiian / Pacific | 0 | 0.0% |
| Hispanic or Latino | 0 | 0.0% |
| Native / Alaskan | 0 | 0.0% |
| White / Caucasian | 261 | 98.5% |
| Two or more Races | 4 | 1.5% |
| Some other Race | 0 | 0.0% |
| Total | 265 | 100.0% |
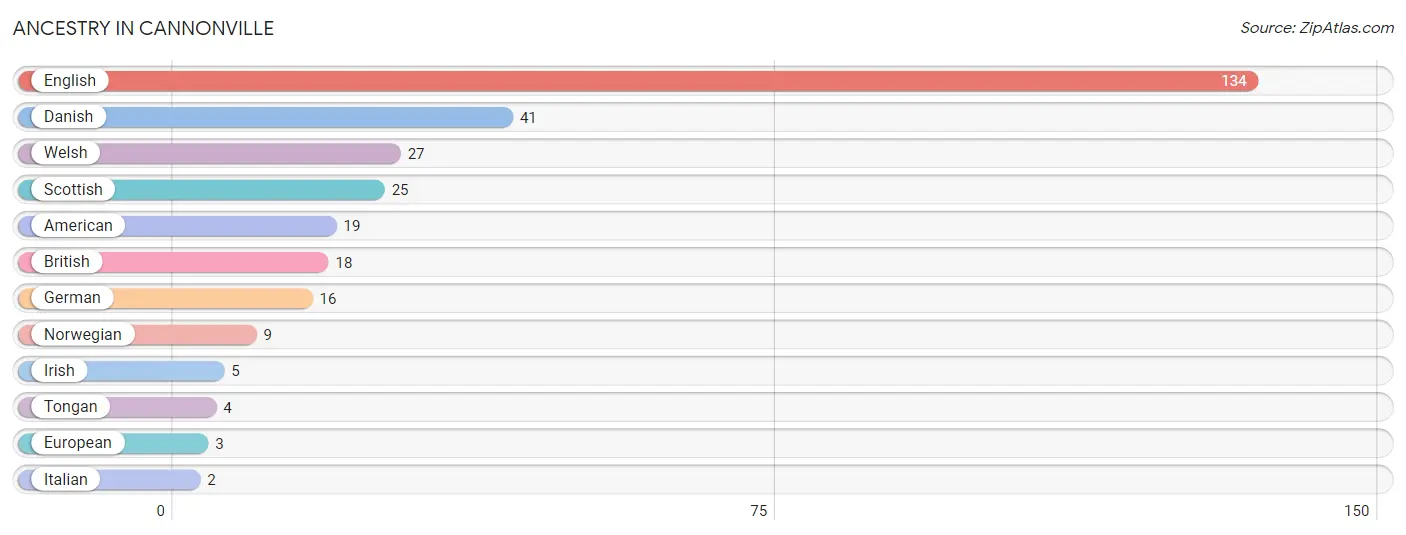
Ancestry in Cannonville
The most populous ancestries reported in Cannonville are English (134 | 50.6%), Danish (41 | 15.5%), Welsh (27 | 10.2%), Scottish (25 | 9.4%), and American (19 | 7.2%), together accounting for 92.8% of all Cannonville residents.
| Ancestry | # Population | % Population |
| American | 19 | 7.2% |
| British | 18 | 6.8% |
| Danish | 41 | 15.5% |
| English | 134 | 50.6% |
| European | 3 | 1.1% |
| German | 16 | 6.0% |
| Irish | 5 | 1.9% |
| Italian | 2 | 0.7% |
| Norwegian | 9 | 3.4% |
| Scottish | 25 | 9.4% |
| Tongan | 4 | 1.5% |
| Welsh | 27 | 10.2% | View All 12 Rows |
Immigrants in Cannonville
The most numerous immigrant groups reported in Cannonville came from Denmark (2 | 0.7%), Europe (2 | 0.7%), and Northern Europe (2 | 0.7%), together accounting for 2.2% of all Cannonville residents.
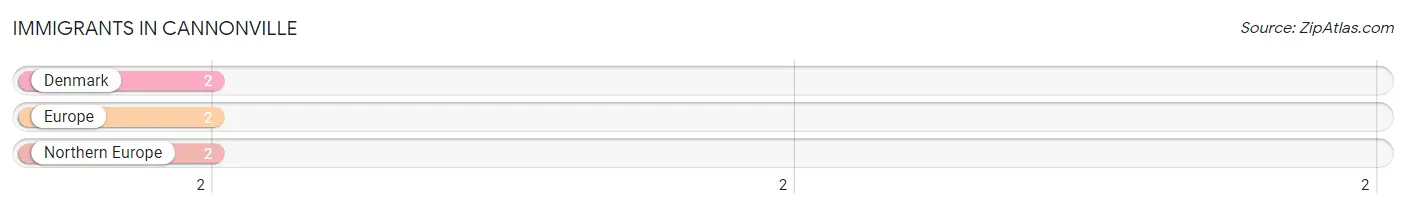
| Immigration Origin | # Population | % Population |
| Denmark | 2 | 0.7% |
| Europe | 2 | 0.7% |
| Northern Europe | 2 | 0.7% | View All 3 Rows |
Sex and Age in Cannonville
Sex and Age in Cannonville
The most populous age groups in Cannonville are 25 to 29 Years (20 | 14.7%) for men and 85 Years and over (34 | 26.4%) for women.
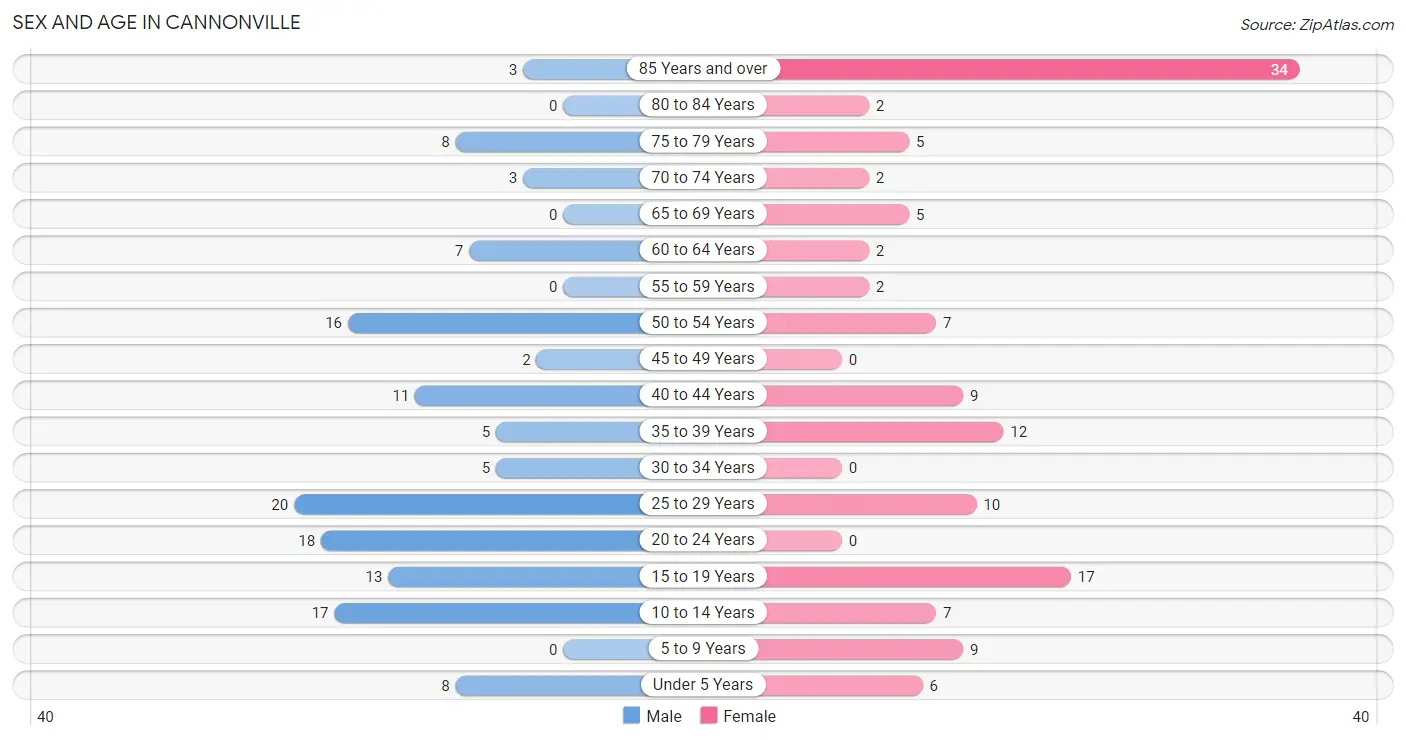
| Age Bracket | Male | Female |
| Under 5 Years | 8 (5.9%) | 6 (4.6%) |
| 5 to 9 Years | 0 (0.0%) | 9 (7.0%) |
| 10 to 14 Years | 17 (12.5%) | 7 (5.4%) |
| 15 to 19 Years | 13 (9.6%) | 17 (13.2%) |
| 20 to 24 Years | 18 (13.2%) | 0 (0.0%) |
| 25 to 29 Years | 20 (14.7%) | 10 (7.7%) |
| 30 to 34 Years | 5 (3.7%) | 0 (0.0%) |
| 35 to 39 Years | 5 (3.7%) | 12 (9.3%) |
| 40 to 44 Years | 11 (8.1%) | 9 (7.0%) |
| 45 to 49 Years | 2 (1.5%) | 0 (0.0%) |
| 50 to 54 Years | 16 (11.8%) | 7 (5.4%) |
| 55 to 59 Years | 0 (0.0%) | 2 (1.5%) |
| 60 to 64 Years | 7 (5.1%) | 2 (1.5%) |
| 65 to 69 Years | 0 (0.0%) | 5 (3.9%) |
| 70 to 74 Years | 3 (2.2%) | 2 (1.5%) |
| 75 to 79 Years | 8 (5.9%) | 5 (3.9%) |
| 80 to 84 Years | 0 (0.0%) | 2 (1.5%) |
| 85 Years and over | 3 (2.2%) | 34 (26.4%) |
| Total | 136 (100.0%) | 129 (100.0%) |
Families and Households in Cannonville
Median Family Size in Cannonville
The median family size in Cannonville is 3.55 persons per family, with married-couple families (46 | 82.1%) accounting for the largest median family size of 3.87 persons per family. On the other hand, single male/father families (5 | 8.9%) represent the smallest median family size with 2.00 persons per family.
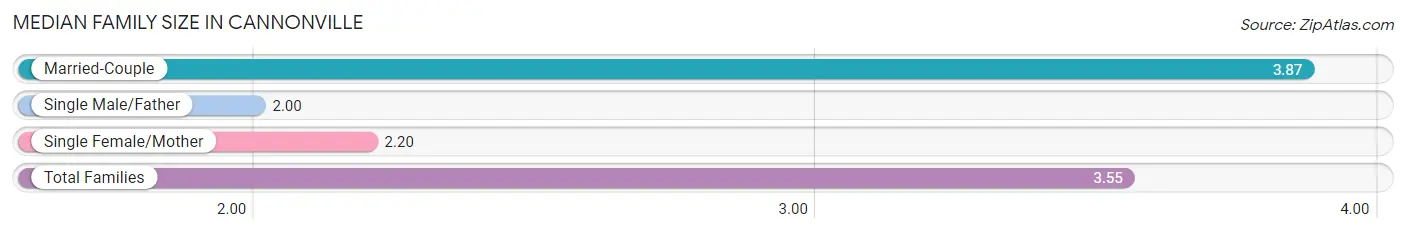
| Family Type | # Families | Family Size |
| Married-Couple | 46 (82.1%) | 3.87 |
| Single Male/Father | 5 (8.9%) | 2.00 |
| Single Female/Mother | 5 (8.9%) | 2.20 |
| Total Families | 56 (100.0%) | 3.55 |
Median Household Size in Cannonville
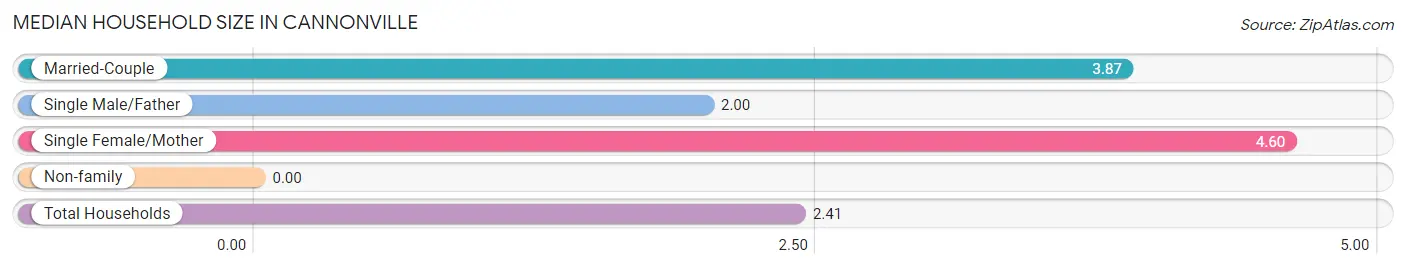
| Household Type | # Households | Household Size |
| Married-Couple | 46 (41.8%) | 3.87 |
| Single Male/Father | 5 (4.5%) | 2.00 |
| Single Female/Mother | 5 (4.5%) | 4.60 |
| Non-family | 54 (49.1%) | - |
| Total Households | 110 (100.0%) | 2.41 |
Household Size by Marriage Status in Cannonville
Out of a total of 110 households in Cannonville, 56 (50.9%) are family households, while 54 (49.1%) are nonfamily households. The most numerous type of family households are 3-person households, comprising 27, and the most common type of nonfamily households are 1-person households, comprising 54.
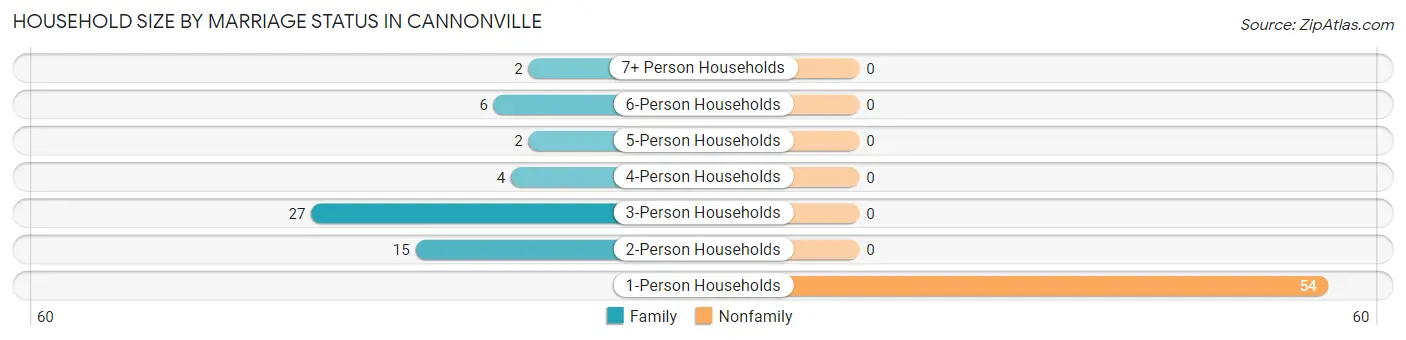
| Household Size | Family Households | Nonfamily Households |
| 1-Person Households | - | 54 (49.1%) |
| 2-Person Households | 15 (13.6%) | 0 (0.0%) |
| 3-Person Households | 27 (24.5%) | 0 (0.0%) |
| 4-Person Households | 4 (3.6%) | 0 (0.0%) |
| 5-Person Households | 2 (1.8%) | 0 (0.0%) |
| 6-Person Households | 6 (5.4%) | 0 (0.0%) |
| 7+ Person Households | 2 (1.8%) | 0 (0.0%) |
| Total | 56 (50.9%) | 54 (49.1%) |
Female Fertility in Cannonville
Fertility by Age in Cannonville
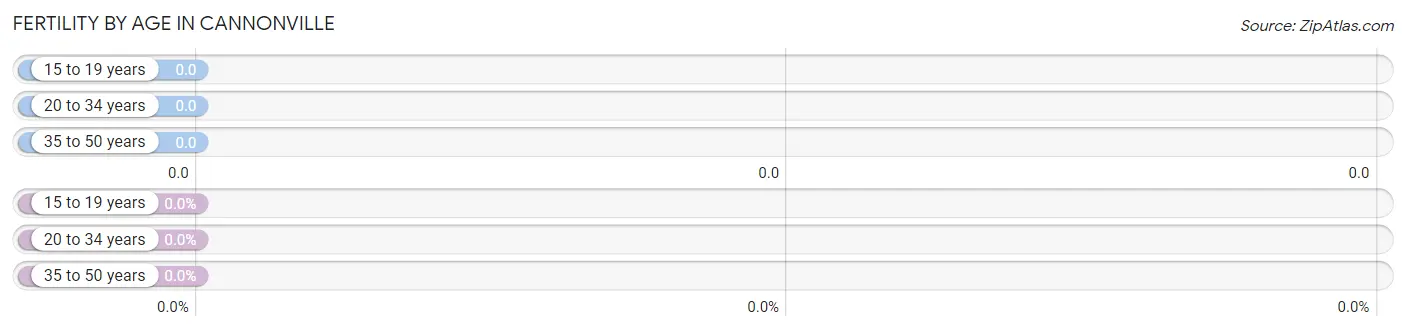
| Age Bracket | Women with Births | Births / 1,000 Women |
| 15 to 19 years | 0 (0.0%) | 0.0 |
| 20 to 34 years | 0 (0.0%) | 0.0 |
| 35 to 50 years | 0 (0.0%) | 0.0 |
| Total | 0 (0.0%) | 0.0 |
Fertility by Age by Marriage Status in Cannonville
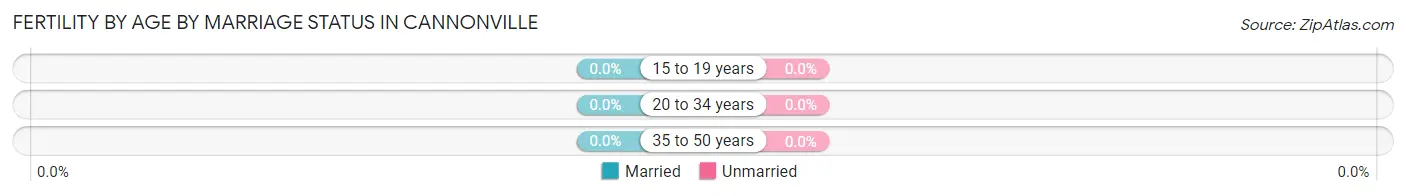
| Age Bracket | Married | Unmarried |
| 15 to 19 years | 0 (0.0%) | 0 (0.0%) |
| 20 to 34 years | 0 (0.0%) | 0 (0.0%) |
| 35 to 50 years | 0 (0.0%) | 0 (0.0%) |
| Total | 0 (0.0%) | 0 (0.0%) |
Fertility by Education in Cannonville
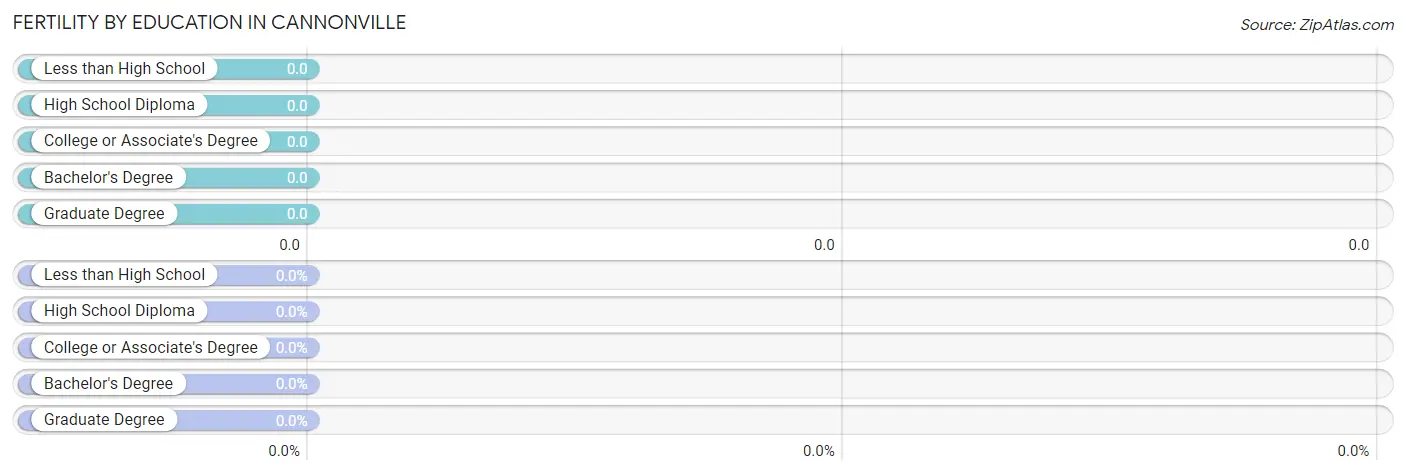
| Educational Attainment | Women with Births | Births / 1,000 Women |
| Less than High School | 0 (0.0%) | 0.0 |
| High School Diploma | 0 (0.0%) | 0.0 |
| College or Associate's Degree | 0 (0.0%) | 0.0 |
| Bachelor's Degree | 0 (0.0%) | 0.0 |
| Graduate Degree | 0 (0.0%) | 0.0 |
| Total | 0 (0.0%) | 0.0 |
Fertility by Education by Marriage Status in Cannonville
| Educational Attainment | Married | Unmarried |
| Less than High School | 0 (0.0%) | 0 (0.0%) |
| High School Diploma | 0 (0.0%) | 0 (0.0%) |
| College or Associate's Degree | 0 (0.0%) | 0 (0.0%) |
| Bachelor's Degree | 0 (0.0%) | 0 (0.0%) |
| Graduate Degree | 0 (0.0%) | 0 (0.0%) |
| Total | 0 (0.0%) | 0 (0.0%) |
Employment Characteristics in Cannonville
Employment by Class of Employer in Cannonville
Among the 137 employed individuals in Cannonville, private company employees (94 | 68.6%), self-employed (not incorporated) (16 | 11.7%), and not-for-profit organizations (7 | 5.1%) make up the most common classes of employment.
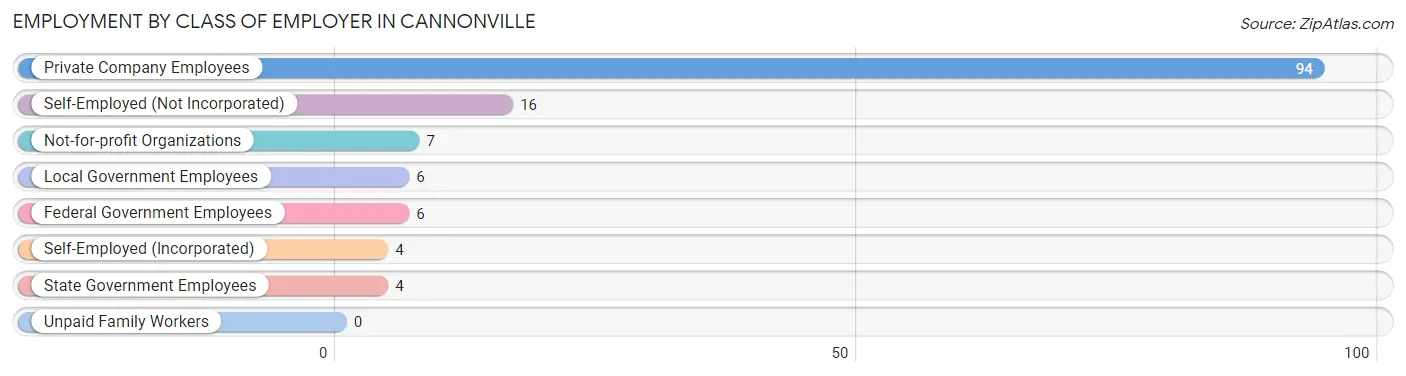
| Employer Class | # Employees | % Employees |
| Private Company Employees | 94 | 68.6% |
| Self-Employed (Incorporated) | 4 | 2.9% |
| Self-Employed (Not Incorporated) | 16 | 11.7% |
| Not-for-profit Organizations | 7 | 5.1% |
| Local Government Employees | 6 | 4.4% |
| State Government Employees | 4 | 2.9% |
| Federal Government Employees | 6 | 4.4% |
| Unpaid Family Workers | 0 | 0.0% |
| Total | 137 | 100.0% |
Employment Status by Age in Cannonville
According to the labor force statistics for Cannonville, out of the total population over 16 years of age (212), 66.5% or 141 individuals are in the labor force, with 1.4% or 2 of them unemployed. The age group with the highest labor force participation rate is 20 to 24 years, with 100.0% or 18 individuals in the labor force. Within the labor force, the 60 to 64 years age range has the highest percentage of unemployed individuals, with 28.6% or 2 of them being unemployed.
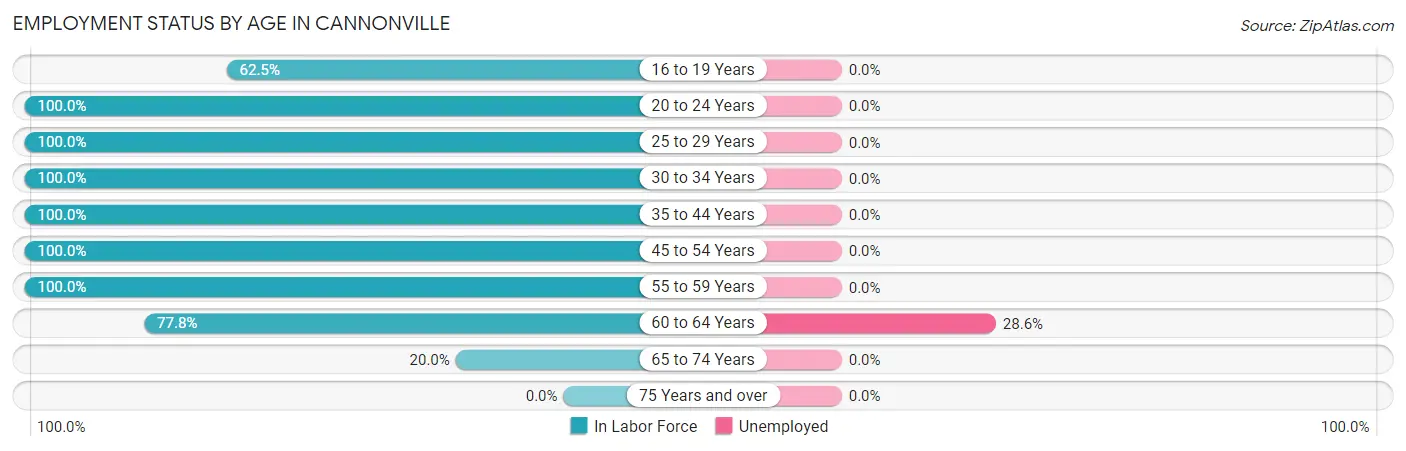
| Age Bracket | In Labor Force | Unemployed |
| 16 to 19 Years | 15 (62.5%) | 0 (0.0%) |
| 20 to 24 Years | 18 (100.0%) | 0 (0.0%) |
| 25 to 29 Years | 30 (100.0%) | 0 (0.0%) |
| 30 to 34 Years | 5 (100.0%) | 0 (0.0%) |
| 35 to 44 Years | 37 (100.0%) | 0 (0.0%) |
| 45 to 54 Years | 25 (100.0%) | 0 (0.0%) |
| 55 to 59 Years | 2 (100.0%) | 0 (0.0%) |
| 60 to 64 Years | 7 (77.8%) | 2 (28.6%) |
| 65 to 74 Years | 2 (20.0%) | 0 (0.0%) |
| 75 Years and over | 0 (0.0%) | 0 (0.0%) |
| Total | 141 (66.5%) | 2 (1.4%) |
Employment Status by Educational Attainment in Cannonville
According to labor force statistics for Cannonville, 98.1% of individuals (106) out of the total population between 25 and 64 years of age (108) are in the labor force, with 1.9% or 2 of them being unemployed. The group with the highest labor force participation rate are those with the educational attainment of less than high school, with 100.0% or 2 individuals in the labor force. Within the labor force, individuals with college / associate degree education have the highest percentage of unemployment, with 5.9% or 2 of them being unemployed.
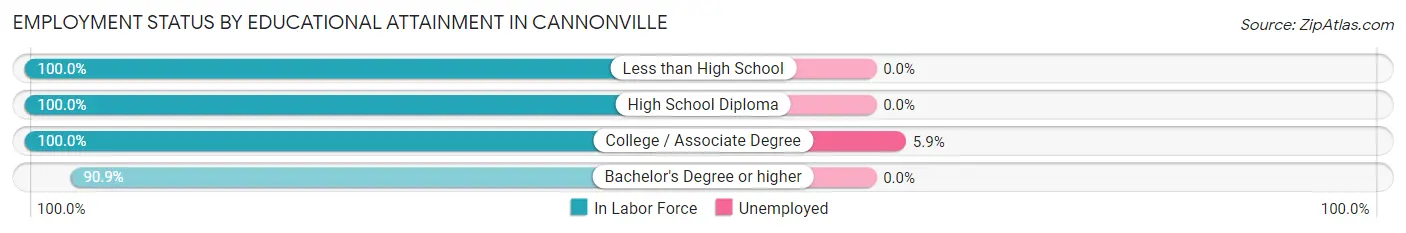
| Educational Attainment | In Labor Force | Unemployed |
| Less than High School | 2 (100.0%) | 0 (0.0%) |
| High School Diploma | 50 (100.0%) | 0 (0.0%) |
| College / Associate Degree | 34 (100.0%) | 2 (5.9%) |
| Bachelor's Degree or higher | 20 (90.9%) | 0 (0.0%) |
| Total | 106 (98.1%) | 2 (1.9%) |
Employment Occupations by Sex in Cannonville
Management, Business, Science and Arts Occupations
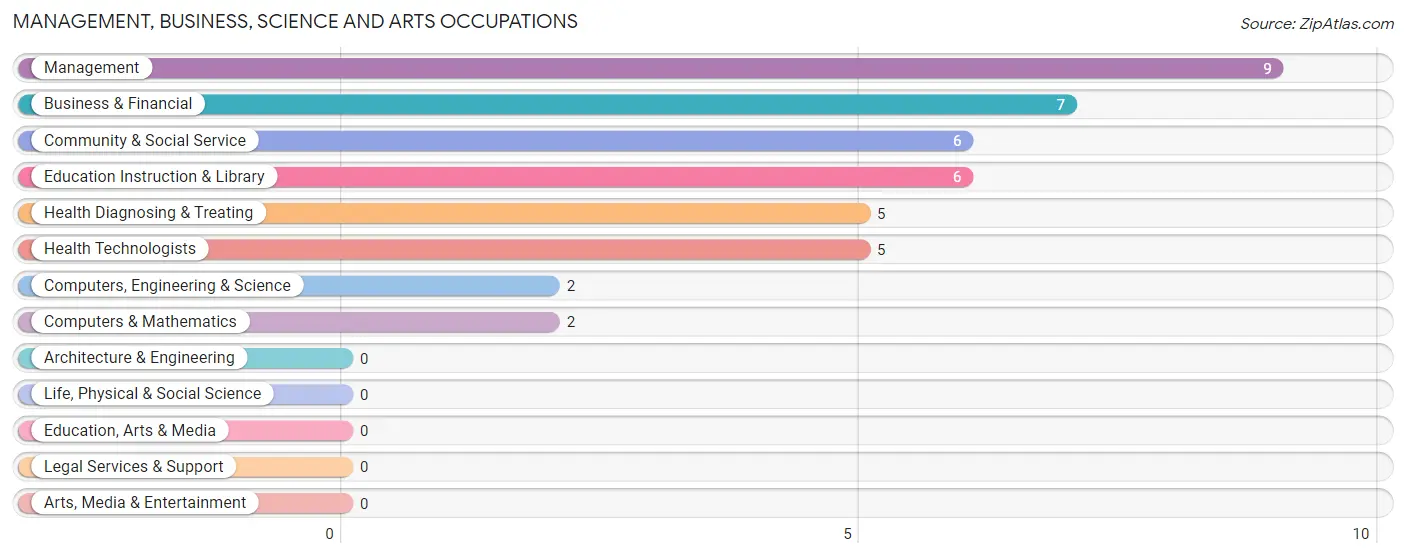
The most common Management, Business, Science and Arts occupations in Cannonville are Management (9 | 6.5%), Business & Financial (7 | 5.0%), Community & Social Service (6 | 4.3%), Education Instruction & Library (6 | 4.3%), and Health Diagnosing & Treating (5 | 3.6%).
Management, Business, Science and Arts Occupations by Sex
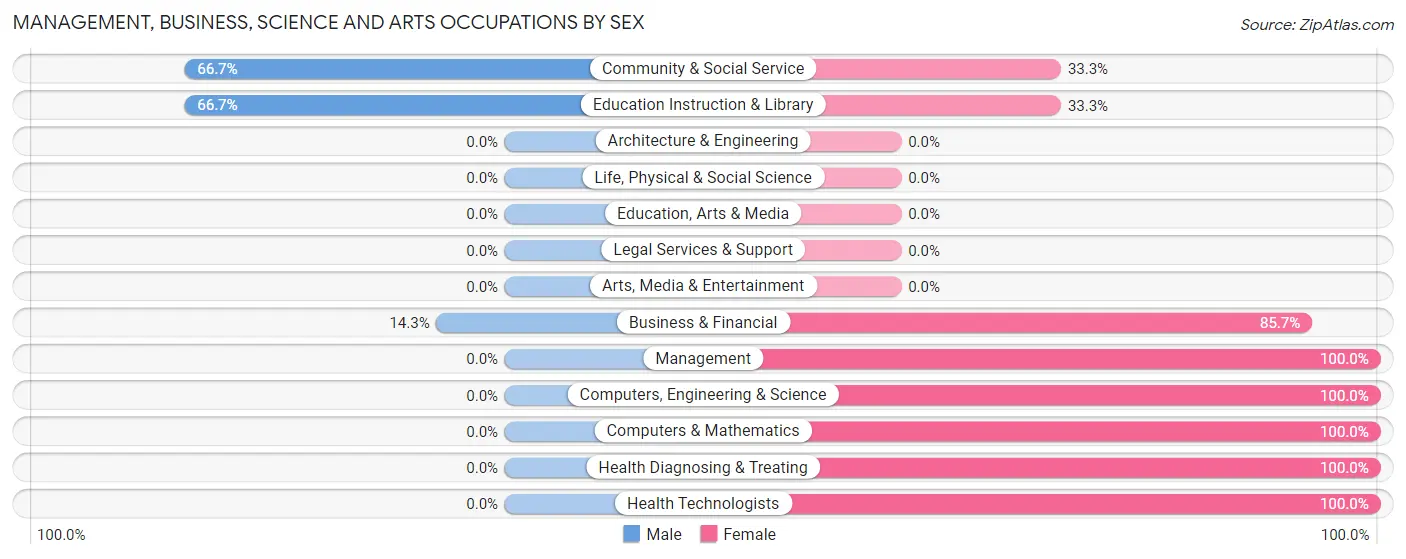
Within the Management, Business, Science and Arts occupations in Cannonville, the most male-oriented occupations are Community & Social Service (66.7%), Education Instruction & Library (66.7%), and Business & Financial (14.3%), while the most female-oriented occupations are Management (100.0%), Computers, Engineering & Science (100.0%), and Computers & Mathematics (100.0%).
| Occupation | Male | Female |
| Management | 0 (0.0%) | 9 (100.0%) |
| Business & Financial | 1 (14.3%) | 6 (85.7%) |
| Computers, Engineering & Science | 0 (0.0%) | 2 (100.0%) |
| Computers & Mathematics | 0 (0.0%) | 2 (100.0%) |
| Architecture & Engineering | 0 (0.0%) | 0 (0.0%) |
| Life, Physical & Social Science | 0 (0.0%) | 0 (0.0%) |
| Community & Social Service | 4 (66.7%) | 2 (33.3%) |
| Education, Arts & Media | 0 (0.0%) | 0 (0.0%) |
| Legal Services & Support | 0 (0.0%) | 0 (0.0%) |
| Education Instruction & Library | 4 (66.7%) | 2 (33.3%) |
| Arts, Media & Entertainment | 0 (0.0%) | 0 (0.0%) |
| Health Diagnosing & Treating | 0 (0.0%) | 5 (100.0%) |
| Health Technologists | 0 (0.0%) | 5 (100.0%) |
| Total (Category) | 5 (17.2%) | 24 (82.8%) |
| Total (Overall) | 84 (60.4%) | 55 (39.6%) |
Services Occupations
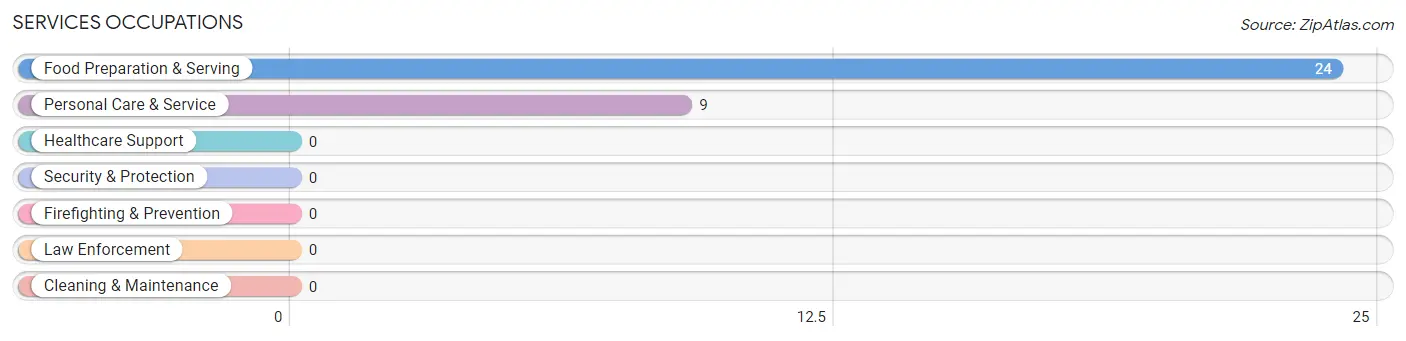
The most common Services occupations in Cannonville are Food Preparation & Serving (24 | 17.3%), and Personal Care & Service (9 | 6.5%).
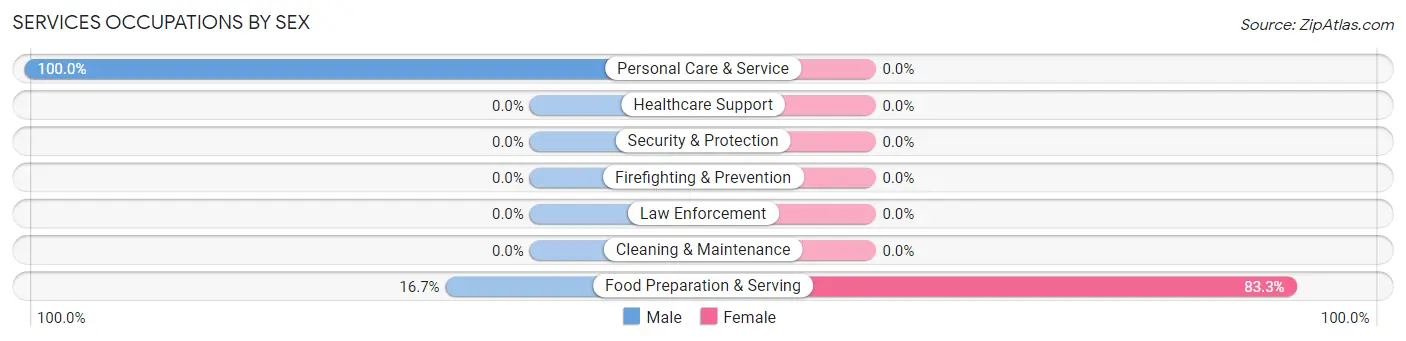
Services Occupations by Sex
| Occupation | Male | Female |
| Healthcare Support | 0 (0.0%) | 0 (0.0%) |
| Security & Protection | 0 (0.0%) | 0 (0.0%) |
| Firefighting & Prevention | 0 (0.0%) | 0 (0.0%) |
| Law Enforcement | 0 (0.0%) | 0 (0.0%) |
| Food Preparation & Serving | 4 (16.7%) | 20 (83.3%) |
| Cleaning & Maintenance | 0 (0.0%) | 0 (0.0%) |
| Personal Care & Service | 9 (100.0%) | 0 (0.0%) |
| Total (Category) | 13 (39.4%) | 20 (60.6%) |
| Total (Overall) | 84 (60.4%) | 55 (39.6%) |
Sales and Office Occupations
The most common Sales and Office occupations in Cannonville are Office & Administration (11 | 7.9%), and Sales & Related (4 | 2.9%).
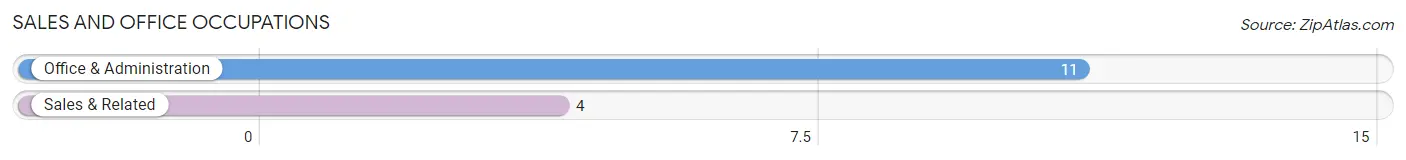
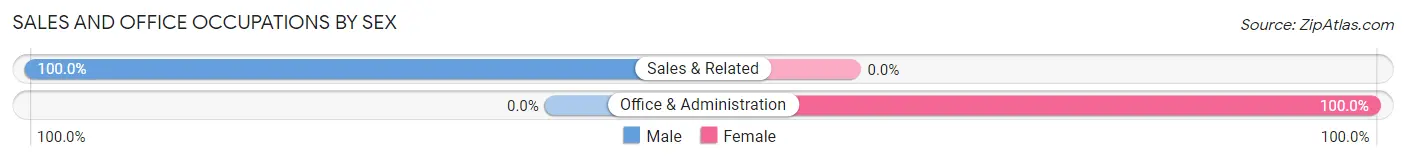
Sales and Office Occupations by Sex
| Occupation | Male | Female |
| Sales & Related | 4 (100.0%) | 0 (0.0%) |
| Office & Administration | 0 (0.0%) | 11 (100.0%) |
| Total (Category) | 4 (26.7%) | 11 (73.3%) |
| Total (Overall) | 84 (60.4%) | 55 (39.6%) |
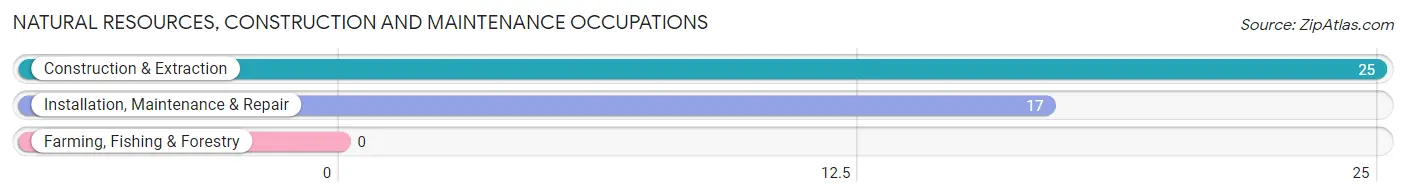
Natural Resources, Construction and Maintenance Occupations
The most common Natural Resources, Construction and Maintenance occupations in Cannonville are Construction & Extraction (25 | 18.0%), and Installation, Maintenance & Repair (17 | 12.2%).
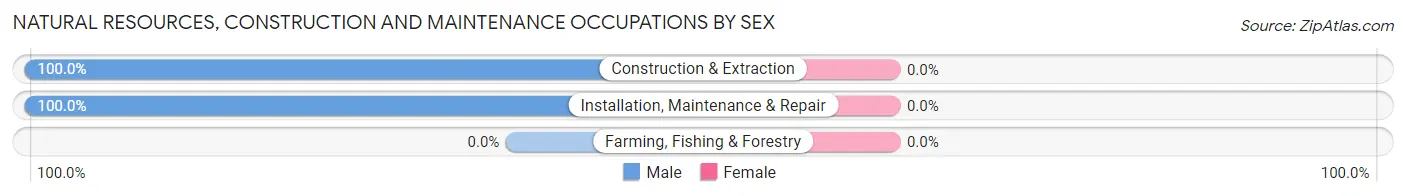
Natural Resources, Construction and Maintenance Occupations by Sex
| Occupation | Male | Female |
| Farming, Fishing & Forestry | 0 (0.0%) | 0 (0.0%) |
| Construction & Extraction | 25 (100.0%) | 0 (0.0%) |
| Installation, Maintenance & Repair | 17 (100.0%) | 0 (0.0%) |
| Total (Category) | 42 (100.0%) | 0 (0.0%) |
| Total (Overall) | 84 (60.4%) | 55 (39.6%) |
Production, Transportation and Moving Occupations
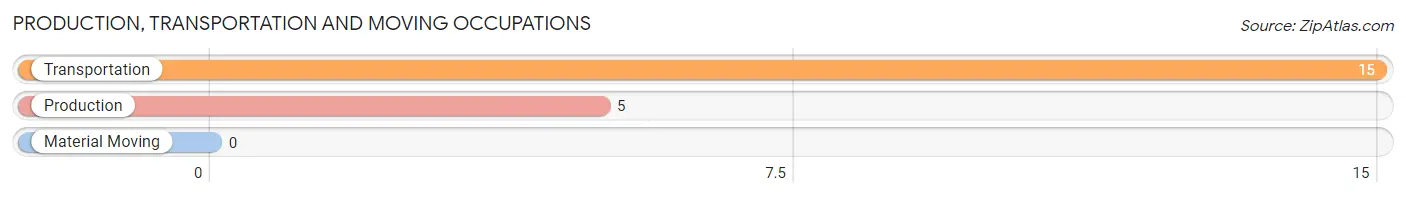
The most common Production, Transportation and Moving occupations in Cannonville are Transportation (15 | 10.8%), and Production (5 | 3.6%).
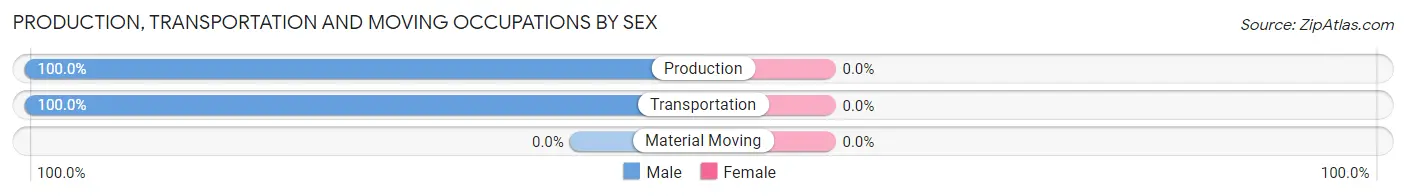
Production, Transportation and Moving Occupations by Sex
| Occupation | Male | Female |
| Production | 5 (100.0%) | 0 (0.0%) |
| Transportation | 15 (100.0%) | 0 (0.0%) |
| Material Moving | 0 (0.0%) | 0 (0.0%) |
| Total (Category) | 20 (100.0%) | 0 (0.0%) |
| Total (Overall) | 84 (60.4%) | 55 (39.6%) |
Employment Industries by Sex in Cannonville
Employment Industries in Cannonville
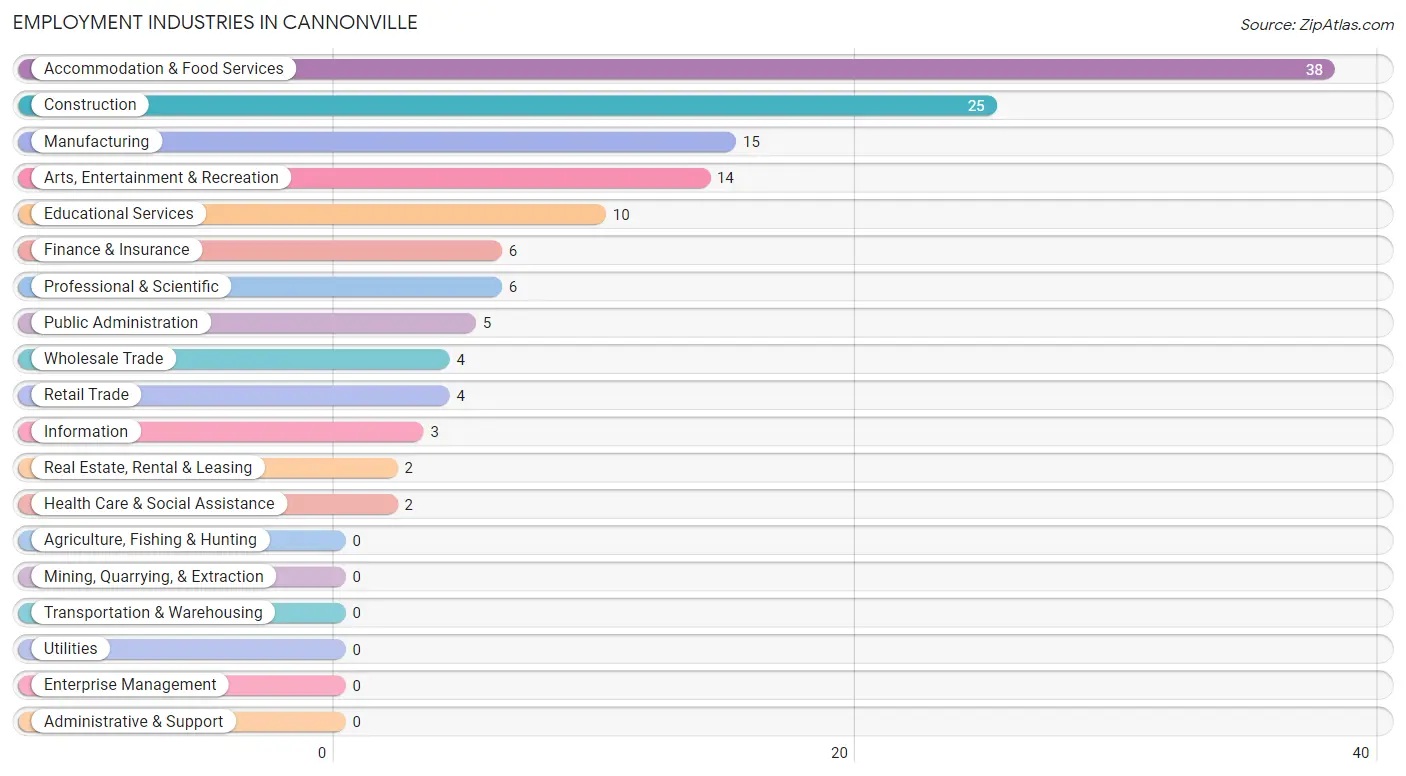
The major employment industries in Cannonville include Accommodation & Food Services (38 | 27.3%), Construction (25 | 18.0%), Manufacturing (15 | 10.8%), Arts, Entertainment & Recreation (14 | 10.1%), and Educational Services (10 | 7.2%).
Employment Industries by Sex in Cannonville
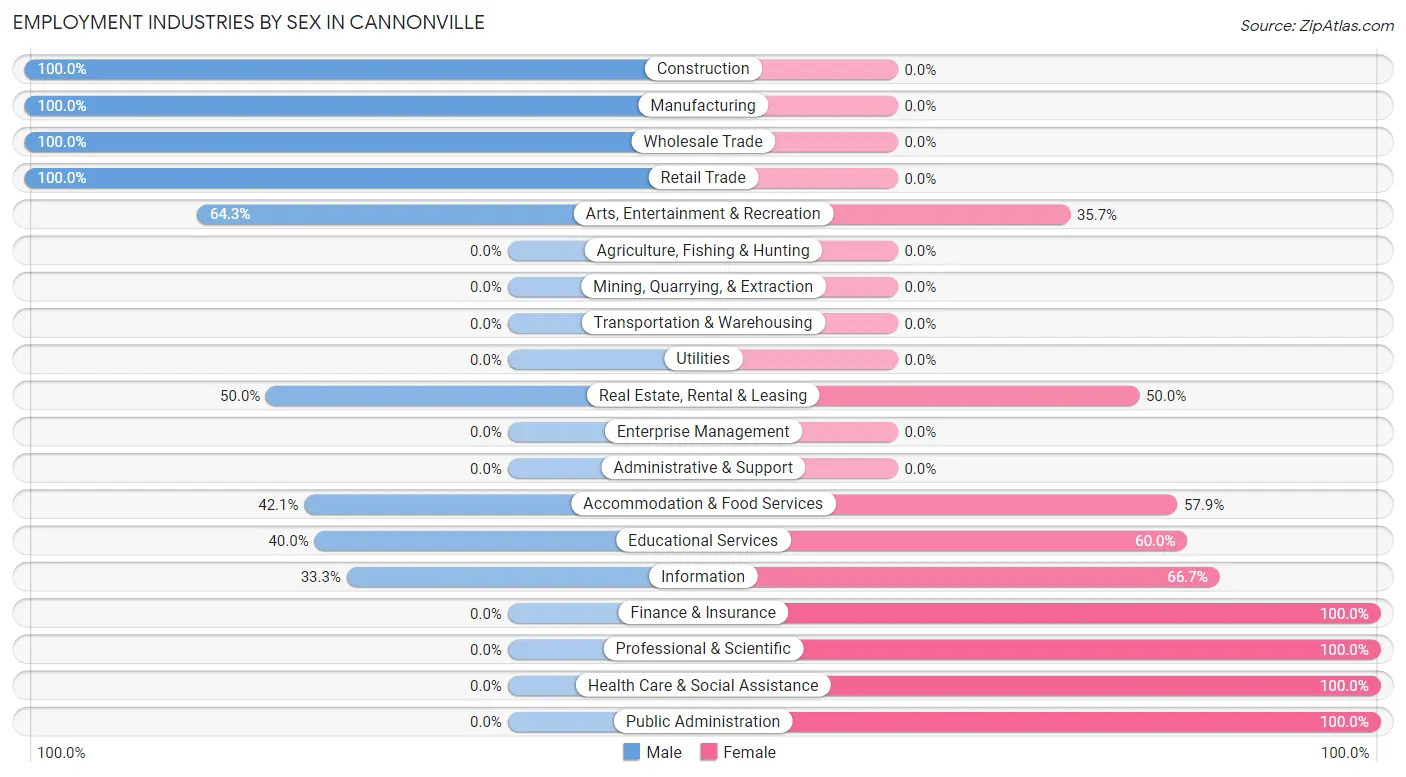
The Cannonville industries that see more men than women are Construction (100.0%), Manufacturing (100.0%), and Wholesale Trade (100.0%), whereas the industries that tend to have a higher number of women are Finance & Insurance (100.0%), Professional & Scientific (100.0%), and Health Care & Social Assistance (100.0%).
| Industry | Male | Female |
| Agriculture, Fishing & Hunting | 0 (0.0%) | 0 (0.0%) |
| Mining, Quarrying, & Extraction | 0 (0.0%) | 0 (0.0%) |
| Construction | 25 (100.0%) | 0 (0.0%) |
| Manufacturing | 15 (100.0%) | 0 (0.0%) |
| Wholesale Trade | 4 (100.0%) | 0 (0.0%) |
| Retail Trade | 4 (100.0%) | 0 (0.0%) |
| Transportation & Warehousing | 0 (0.0%) | 0 (0.0%) |
| Utilities | 0 (0.0%) | 0 (0.0%) |
| Information | 1 (33.3%) | 2 (66.7%) |
| Finance & Insurance | 0 (0.0%) | 6 (100.0%) |
| Real Estate, Rental & Leasing | 1 (50.0%) | 1 (50.0%) |
| Professional & Scientific | 0 (0.0%) | 6 (100.0%) |
| Enterprise Management | 0 (0.0%) | 0 (0.0%) |
| Administrative & Support | 0 (0.0%) | 0 (0.0%) |
| Educational Services | 4 (40.0%) | 6 (60.0%) |
| Health Care & Social Assistance | 0 (0.0%) | 2 (100.0%) |
| Arts, Entertainment & Recreation | 9 (64.3%) | 5 (35.7%) |
| Accommodation & Food Services | 16 (42.1%) | 22 (57.9%) |
| Public Administration | 0 (0.0%) | 5 (100.0%) |
| Total | 84 (60.4%) | 55 (39.6%) |
Education in Cannonville
School Enrollment in Cannonville
The most common levels of schooling among the 77 students in Cannonville are high school (25 | 32.5%), middle school (22 | 28.6%), and college / undergraduate (21 | 27.3%).
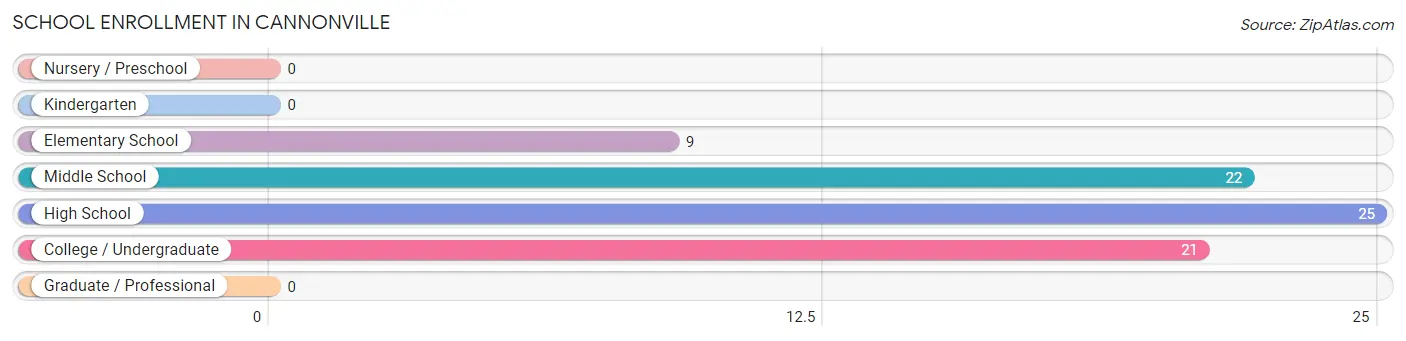
| School Level | # Students | % Students |
| Nursery / Preschool | 0 | 0.0% |
| Kindergarten | 0 | 0.0% |
| Elementary School | 9 | 11.7% |
| Middle School | 22 | 28.6% |
| High School | 25 | 32.5% |
| College / Undergraduate | 21 | 27.3% |
| Graduate / Professional | 0 | 0.0% |
| Total | 77 | 100.0% |
School Enrollment by Age by Funding Source in Cannonville
Out of a total of 77 students who are enrolled in schools in Cannonville, 2 (2.6%) attend a private institution, while the remaining 75 (97.4%) are enrolled in public schools. The age group of 35 years and over has the highest likelihood of being enrolled in private schools, with 2 (100.0% in the age bracket) enrolled. Conversely, the age group of 5 to 9 year old has the lowest likelihood of being enrolled in a private school, with 9 (100.0% in the age bracket) attending a public institution.
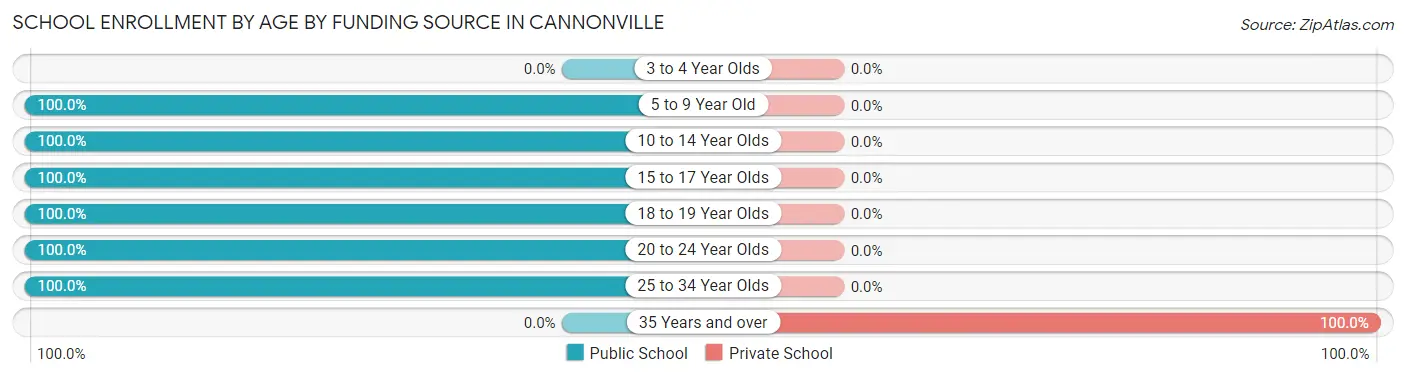
| Age Bracket | Public School | Private School |
| 3 to 4 Year Olds | 0 (0.0%) | 0 (0.0%) |
| 5 to 9 Year Old | 9 (100.0%) | 0 (0.0%) |
| 10 to 14 Year Olds | 24 (100.0%) | 0 (0.0%) |
| 15 to 17 Year Olds | 21 (100.0%) | 0 (0.0%) |
| 18 to 19 Year Olds | 7 (100.0%) | 0 (0.0%) |
| 20 to 24 Year Olds | 9 (100.0%) | 0 (0.0%) |
| 25 to 34 Year Olds | 5 (100.0%) | 0 (0.0%) |
| 35 Years and over | 0 (0.0%) | 2 (100.0%) |
| Total | 75 (97.4%) | 2 (2.6%) |
Educational Attainment by Field of Study in Cannonville
Visual & performing arts (8 | 25.0%), arts & humanities (7 | 21.9%), education (6 | 18.8%), business (5 | 15.6%), and bio, nature & agricultural (2 | 6.2%) are the most common fields of study among 32 individuals in Cannonville who have obtained a bachelor's degree or higher.
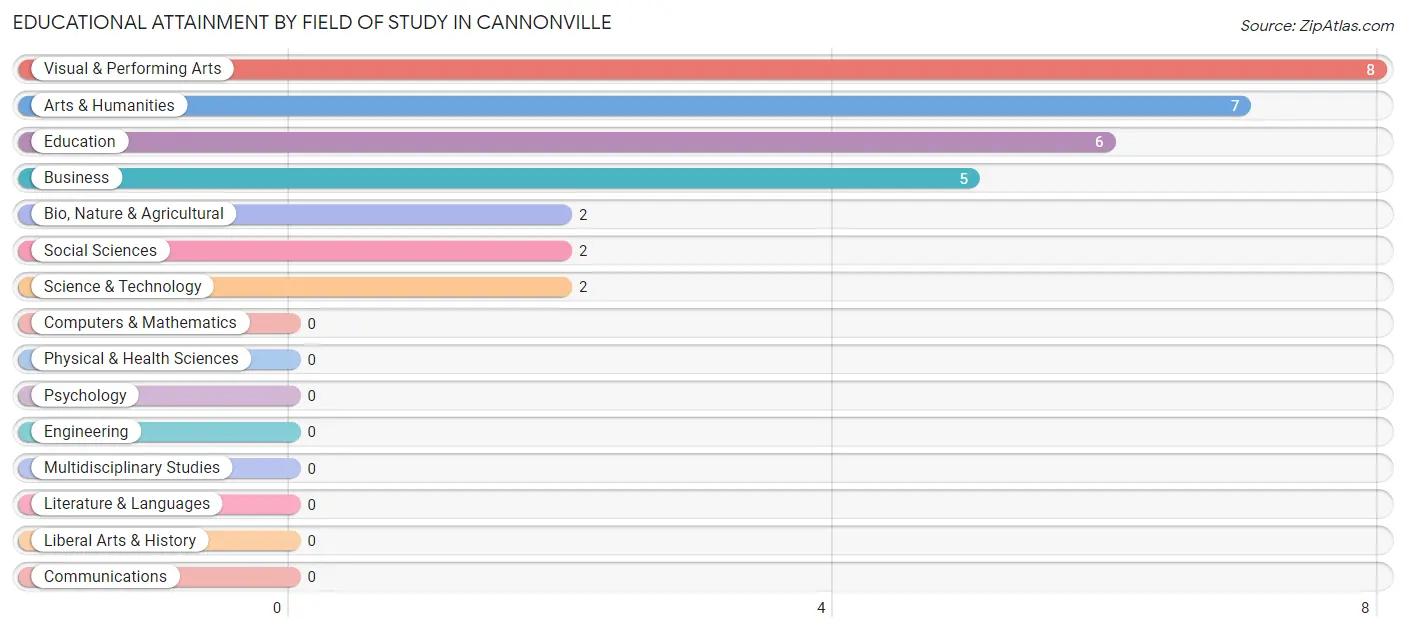
| Field of Study | # Graduates | % Graduates |
| Computers & Mathematics | 0 | 0.0% |
| Bio, Nature & Agricultural | 2 | 6.2% |
| Physical & Health Sciences | 0 | 0.0% |
| Psychology | 0 | 0.0% |
| Social Sciences | 2 | 6.2% |
| Engineering | 0 | 0.0% |
| Multidisciplinary Studies | 0 | 0.0% |
| Science & Technology | 2 | 6.2% |
| Business | 5 | 15.6% |
| Education | 6 | 18.8% |
| Literature & Languages | 0 | 0.0% |
| Liberal Arts & History | 0 | 0.0% |
| Visual & Performing Arts | 8 | 25.0% |
| Communications | 0 | 0.0% |
| Arts & Humanities | 7 | 21.9% |
| Total | 32 | 100.0% |
Transportation & Commute in Cannonville
Vehicle Availability by Sex in Cannonville
The most prevalent vehicle ownership categories in Cannonville are males with 3 vehicles (37, accounting for 44.1%) and females with 3 vehicles (11, making up 69.8%).
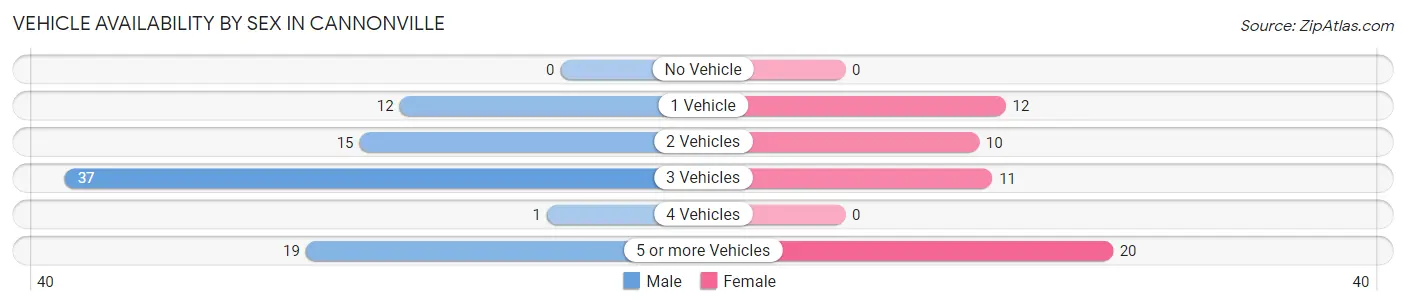
| Vehicles Available | Male | Female |
| No Vehicle | 0 (0.0%) | 0 (0.0%) |
| 1 Vehicle | 12 (14.3%) | 12 (22.6%) |
| 2 Vehicles | 15 (17.9%) | 10 (18.9%) |
| 3 Vehicles | 37 (44.1%) | 11 (20.7%) |
| 4 Vehicles | 1 (1.2%) | 0 (0.0%) |
| 5 or more Vehicles | 19 (22.6%) | 20 (37.7%) |
| Total | 84 (100.0%) | 53 (100.0%) |
Commute Time in Cannonville
The most frequently occuring commute durations in Cannonville are 5 to 9 minutes (31 commuters, 23.0%), 15 to 19 minutes (24 commuters, 17.8%), and less than 5 minutes (21 commuters, 15.6%).
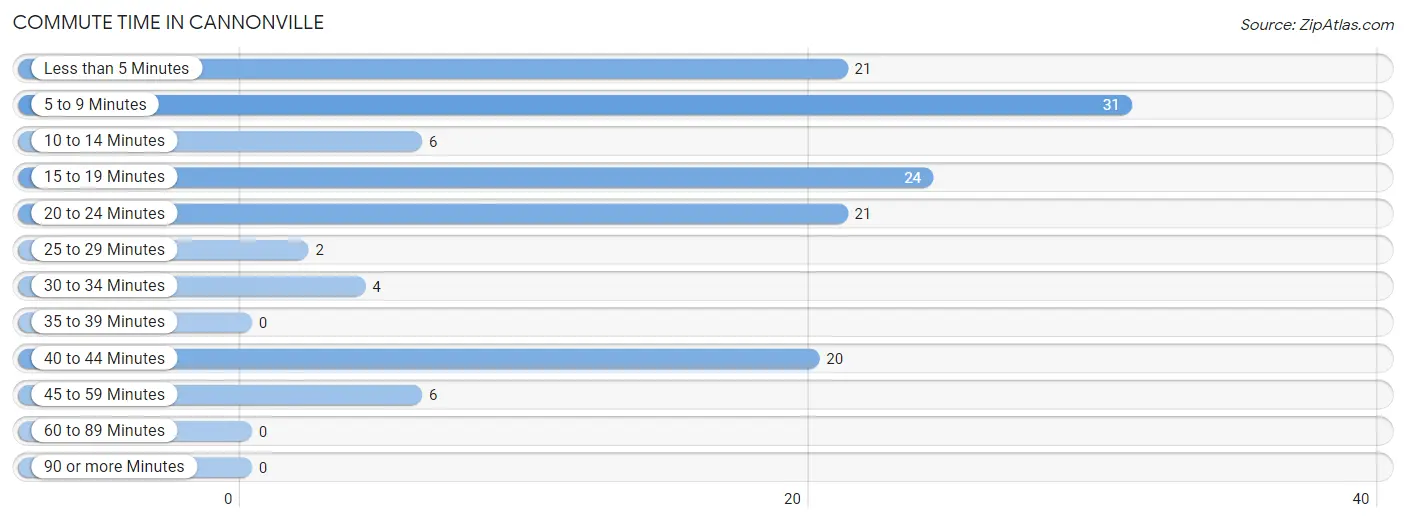
| Commute Time | # Commuters | % Commuters |
| Less than 5 Minutes | 21 | 15.6% |
| 5 to 9 Minutes | 31 | 23.0% |
| 10 to 14 Minutes | 6 | 4.4% |
| 15 to 19 Minutes | 24 | 17.8% |
| 20 to 24 Minutes | 21 | 15.6% |
| 25 to 29 Minutes | 2 | 1.5% |
| 30 to 34 Minutes | 4 | 3.0% |
| 35 to 39 Minutes | 0 | 0.0% |
| 40 to 44 Minutes | 20 | 14.8% |
| 45 to 59 Minutes | 6 | 4.4% |
| 60 to 89 Minutes | 0 | 0.0% |
| 90 or more Minutes | 0 | 0.0% |
Commute Time by Sex in Cannonville
The most common commute times in Cannonville are 20 to 24 minutes (21 commuters, 25.0%) for males and 5 to 9 minutes (27 commuters, 52.9%) for females.
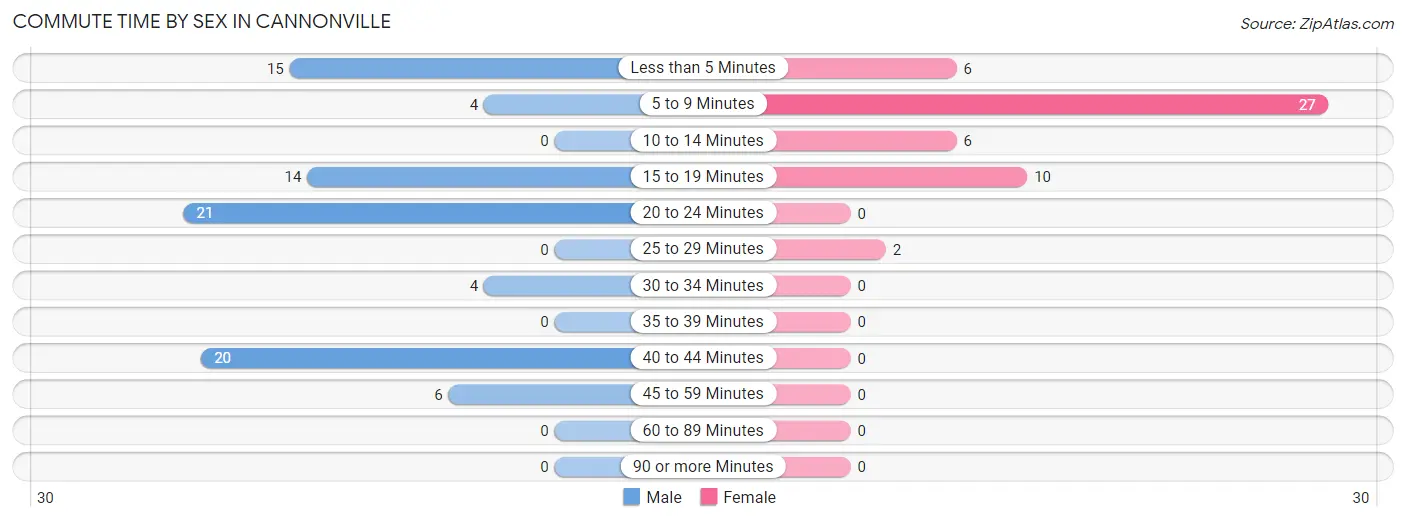
| Commute Time | Male | Female |
| Less than 5 Minutes | 15 (17.9%) | 6 (11.8%) |
| 5 to 9 Minutes | 4 (4.8%) | 27 (52.9%) |
| 10 to 14 Minutes | 0 (0.0%) | 6 (11.8%) |
| 15 to 19 Minutes | 14 (16.7%) | 10 (19.6%) |
| 20 to 24 Minutes | 21 (25.0%) | 0 (0.0%) |
| 25 to 29 Minutes | 0 (0.0%) | 2 (3.9%) |
| 30 to 34 Minutes | 4 (4.8%) | 0 (0.0%) |
| 35 to 39 Minutes | 0 (0.0%) | 0 (0.0%) |
| 40 to 44 Minutes | 20 (23.8%) | 0 (0.0%) |
| 45 to 59 Minutes | 6 (7.1%) | 0 (0.0%) |
| 60 to 89 Minutes | 0 (0.0%) | 0 (0.0%) |
| 90 or more Minutes | 0 (0.0%) | 0 (0.0%) |
Time of Departure to Work by Sex in Cannonville
The most frequent times of departure to work in Cannonville are 6:00 AM to 6:29 AM (29, 34.5%) for males and 4:00 PM to 11:59 PM (14, 27.5%) for females.
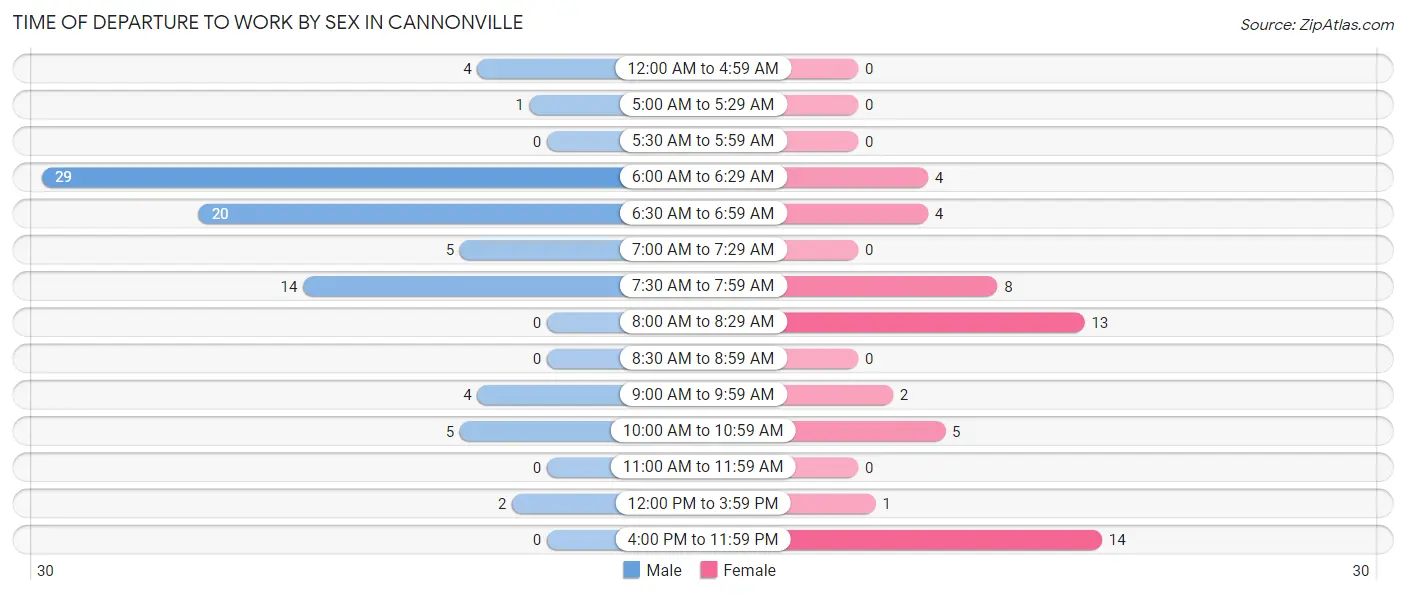
| Time of Departure | Male | Female |
| 12:00 AM to 4:59 AM | 4 (4.8%) | 0 (0.0%) |
| 5:00 AM to 5:29 AM | 1 (1.2%) | 0 (0.0%) |
| 5:30 AM to 5:59 AM | 0 (0.0%) | 0 (0.0%) |
| 6:00 AM to 6:29 AM | 29 (34.5%) | 4 (7.8%) |
| 6:30 AM to 6:59 AM | 20 (23.8%) | 4 (7.8%) |
| 7:00 AM to 7:29 AM | 5 (5.9%) | 0 (0.0%) |
| 7:30 AM to 7:59 AM | 14 (16.7%) | 8 (15.7%) |
| 8:00 AM to 8:29 AM | 0 (0.0%) | 13 (25.5%) |
| 8:30 AM to 8:59 AM | 0 (0.0%) | 0 (0.0%) |
| 9:00 AM to 9:59 AM | 4 (4.8%) | 2 (3.9%) |
| 10:00 AM to 10:59 AM | 5 (5.9%) | 5 (9.8%) |
| 11:00 AM to 11:59 AM | 0 (0.0%) | 0 (0.0%) |
| 12:00 PM to 3:59 PM | 2 (2.4%) | 1 (2.0%) |
| 4:00 PM to 11:59 PM | 0 (0.0%) | 14 (27.5%) |
| Total | 84 (100.0%) | 51 (100.0%) |
Housing Occupancy in Cannonville
Occupancy by Ownership in Cannonville
Of the total 110 dwellings in Cannonville, owner-occupied units account for 75 (68.2%), while renter-occupied units make up 35 (31.8%).
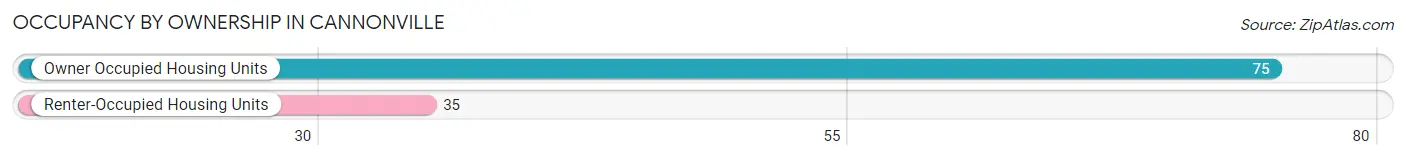
| Occupancy | # Housing Units | % Housing Units |
| Owner Occupied Housing Units | 75 | 68.2% |
| Renter-Occupied Housing Units | 35 | 31.8% |
| Total Occupied Housing Units | 110 | 100.0% |
Occupancy by Household Size in Cannonville
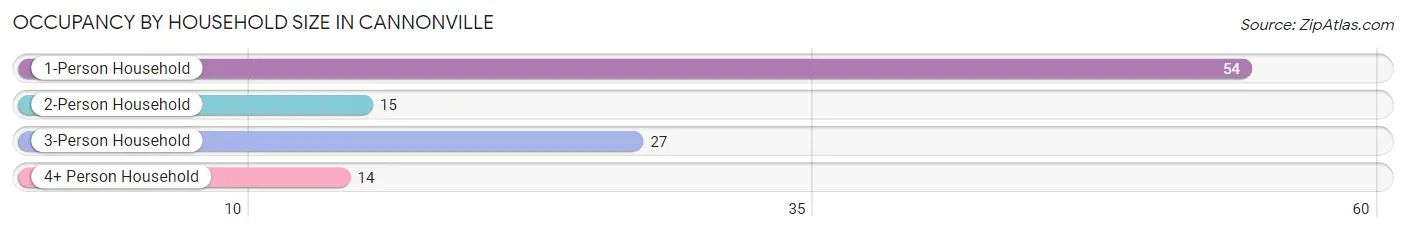
| Household Size | # Housing Units | % Housing Units |
| 1-Person Household | 54 | 49.1% |
| 2-Person Household | 15 | 13.6% |
| 3-Person Household | 27 | 24.5% |
| 4+ Person Household | 14 | 12.7% |
| Total Housing Units | 110 | 100.0% |
Occupancy by Ownership by Household Size in Cannonville
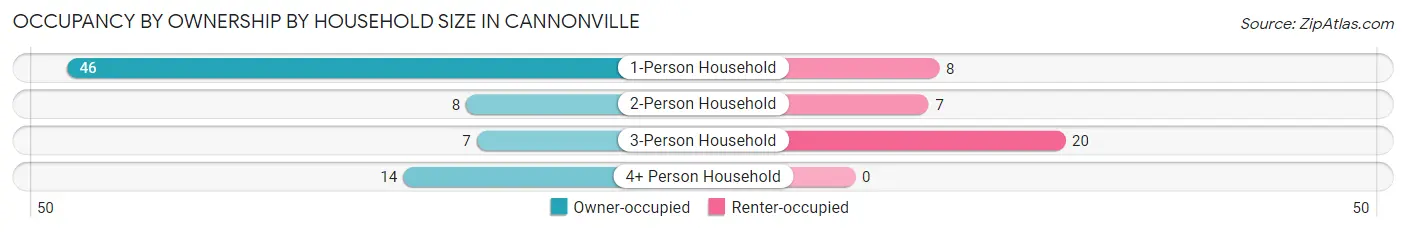
| Household Size | Owner-occupied | Renter-occupied |
| 1-Person Household | 46 (85.2%) | 8 (14.8%) |
| 2-Person Household | 8 (53.3%) | 7 (46.7%) |
| 3-Person Household | 7 (25.9%) | 20 (74.1%) |
| 4+ Person Household | 14 (100.0%) | 0 (0.0%) |
| Total Housing Units | 75 (68.2%) | 35 (31.8%) |
Occupancy by Educational Attainment in Cannonville
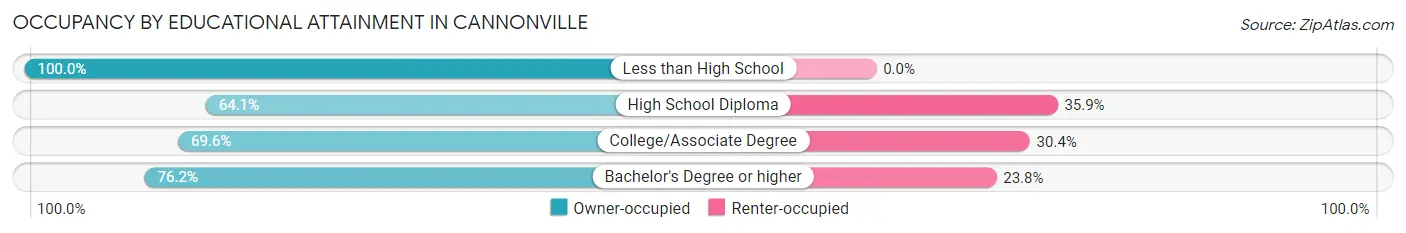
| Household Size | Owner-occupied | Renter-occupied |
| Less than High School | 2 (100.0%) | 0 (0.0%) |
| High School Diploma | 41 (64.1%) | 23 (35.9%) |
| College/Associate Degree | 16 (69.6%) | 7 (30.4%) |
| Bachelor's Degree or higher | 16 (76.2%) | 5 (23.8%) |
Occupancy by Age of Householder in Cannonville
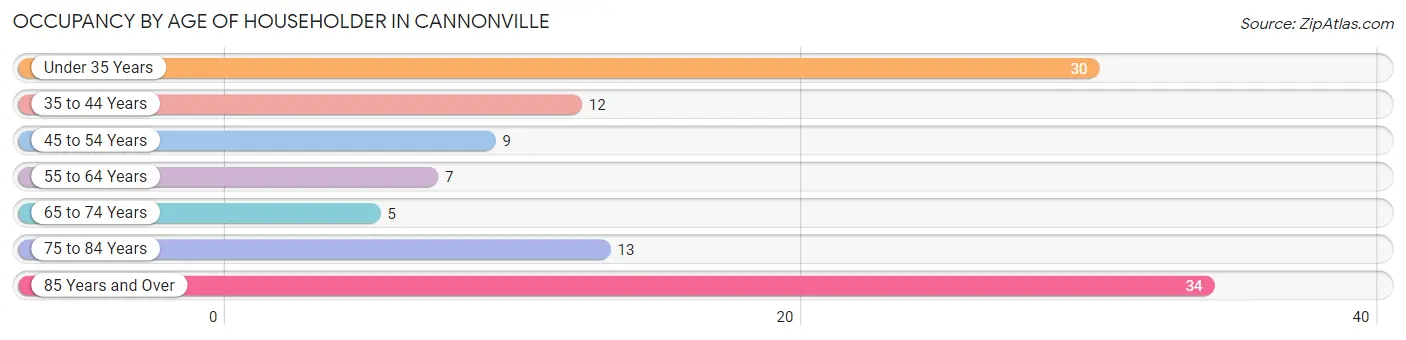
| Age Bracket | # Households | % Households |
| Under 35 Years | 30 | 27.3% |
| 35 to 44 Years | 12 | 10.9% |
| 45 to 54 Years | 9 | 8.2% |
| 55 to 64 Years | 7 | 6.4% |
| 65 to 74 Years | 5 | 4.5% |
| 75 to 84 Years | 13 | 11.8% |
| 85 Years and Over | 34 | 30.9% |
| Total | 110 | 100.0% |
Housing Finances in Cannonville
Median Income by Occupancy in Cannonville
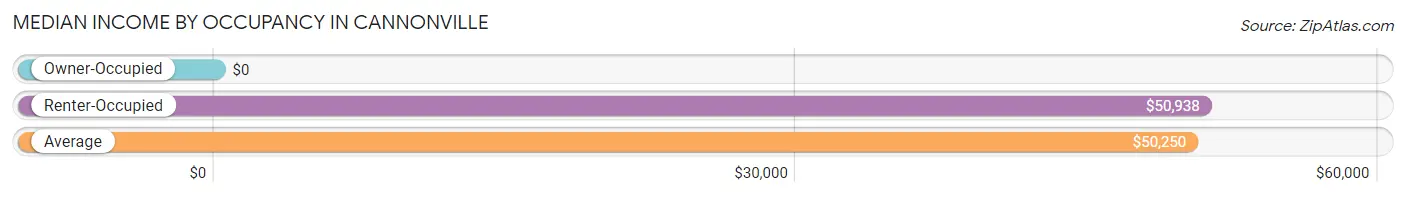
| Occupancy Type | # Households | Median Income |
| Owner-Occupied | 75 (68.2%) | $0 |
| Renter-Occupied | 35 (31.8%) | $50,938 |
| Average | 110 (100.0%) | $50,250 |
Occupancy by Householder Income Bracket in Cannonville
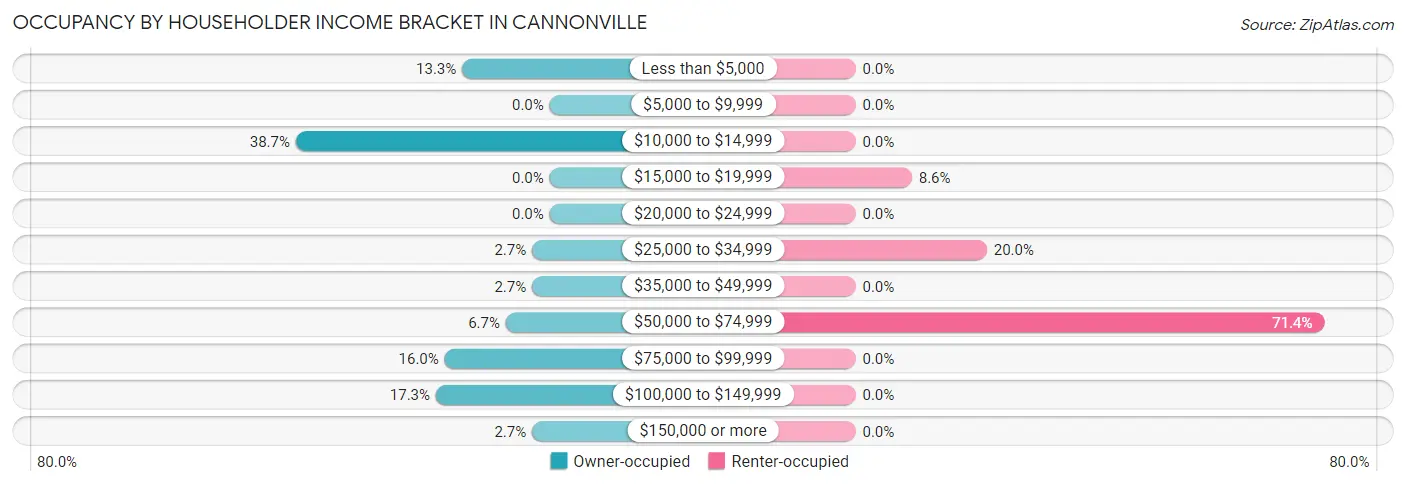
| Income Bracket | Owner-occupied | Renter-occupied |
| Less than $5,000 | 10 (13.3%) | 0 (0.0%) |
| $5,000 to $9,999 | 0 (0.0%) | 0 (0.0%) |
| $10,000 to $14,999 | 29 (38.7%) | 0 (0.0%) |
| $15,000 to $19,999 | 0 (0.0%) | 3 (8.6%) |
| $20,000 to $24,999 | 0 (0.0%) | 0 (0.0%) |
| $25,000 to $34,999 | 2 (2.7%) | 7 (20.0%) |
| $35,000 to $49,999 | 2 (2.7%) | 0 (0.0%) |
| $50,000 to $74,999 | 5 (6.7%) | 25 (71.4%) |
| $75,000 to $99,999 | 12 (16.0%) | 0 (0.0%) |
| $100,000 to $149,999 | 13 (17.3%) | 0 (0.0%) |
| $150,000 or more | 2 (2.7%) | 0 (0.0%) |
| Total | 75 (100.0%) | 35 (100.0%) |
Monthly Housing Cost Tiers in Cannonville
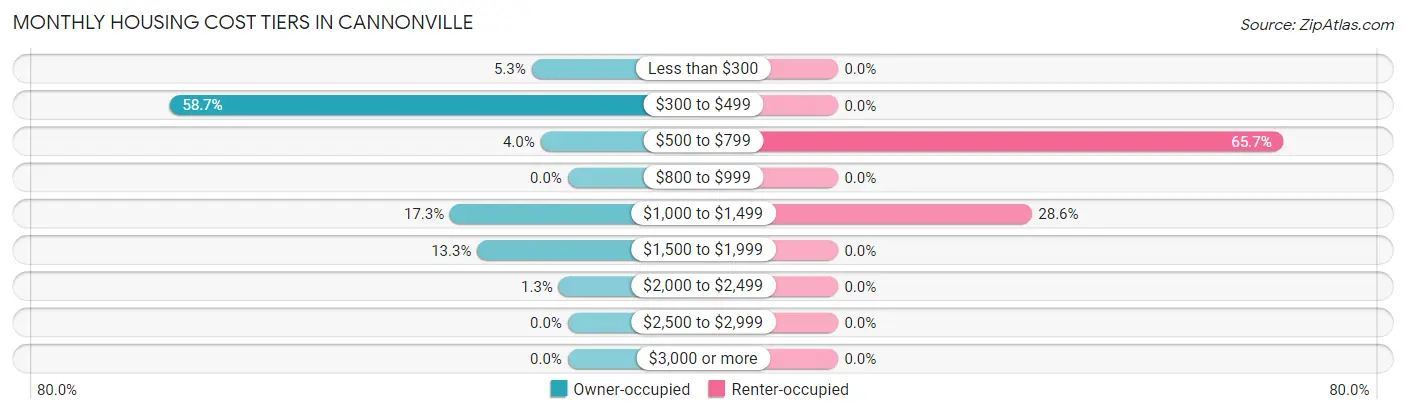
| Monthly Cost | Owner-occupied | Renter-occupied |
| Less than $300 | 4 (5.3%) | 0 (0.0%) |
| $300 to $499 | 44 (58.7%) | 0 (0.0%) |
| $500 to $799 | 3 (4.0%) | 23 (65.7%) |
| $800 to $999 | 0 (0.0%) | 0 (0.0%) |
| $1,000 to $1,499 | 13 (17.3%) | 10 (28.6%) |
| $1,500 to $1,999 | 10 (13.3%) | 0 (0.0%) |
| $2,000 to $2,499 | 1 (1.3%) | 0 (0.0%) |
| $2,500 to $2,999 | 0 (0.0%) | 0 (0.0%) |
| $3,000 or more | 0 (0.0%) | 0 (0.0%) |
| Total | 75 (100.0%) | 35 (100.0%) |
Physical Housing Characteristics in Cannonville
Housing Structures in Cannonville
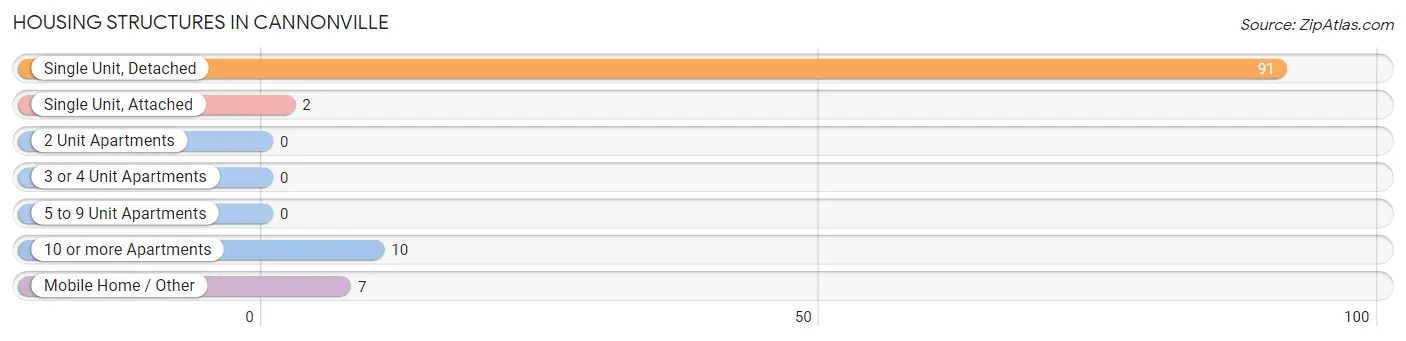
| Structure Type | # Housing Units | % Housing Units |
| Single Unit, Detached | 91 | 82.7% |
| Single Unit, Attached | 2 | 1.8% |
| 2 Unit Apartments | 0 | 0.0% |
| 3 or 4 Unit Apartments | 0 | 0.0% |
| 5 to 9 Unit Apartments | 0 | 0.0% |
| 10 or more Apartments | 10 | 9.1% |
| Mobile Home / Other | 7 | 6.4% |
| Total | 110 | 100.0% |
Housing Structures by Occupancy in Cannonville
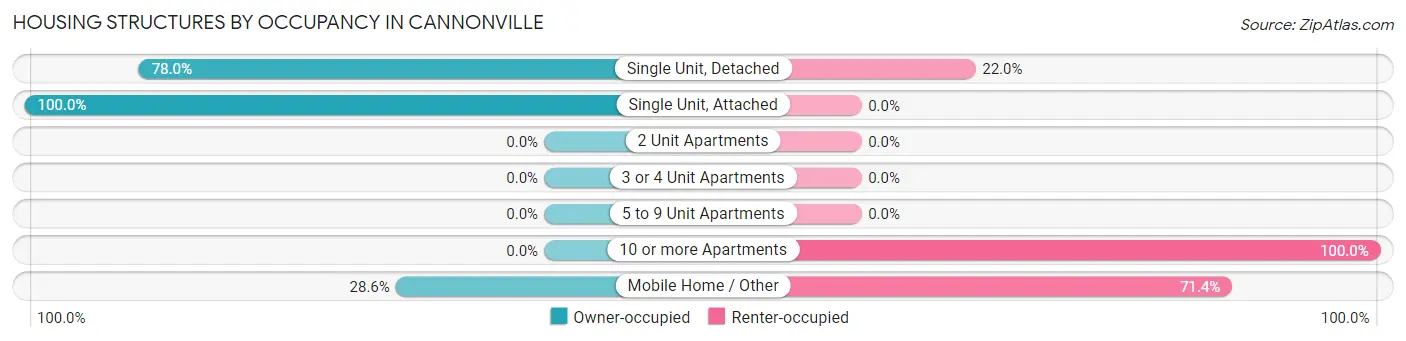
| Structure Type | Owner-occupied | Renter-occupied |
| Single Unit, Detached | 71 (78.0%) | 20 (22.0%) |
| Single Unit, Attached | 2 (100.0%) | 0 (0.0%) |
| 2 Unit Apartments | 0 (0.0%) | 0 (0.0%) |
| 3 or 4 Unit Apartments | 0 (0.0%) | 0 (0.0%) |
| 5 to 9 Unit Apartments | 0 (0.0%) | 0 (0.0%) |
| 10 or more Apartments | 0 (0.0%) | 10 (100.0%) |
| Mobile Home / Other | 2 (28.6%) | 5 (71.4%) |
| Total | 75 (68.2%) | 35 (31.8%) |
Housing Structures by Number of Rooms in Cannonville
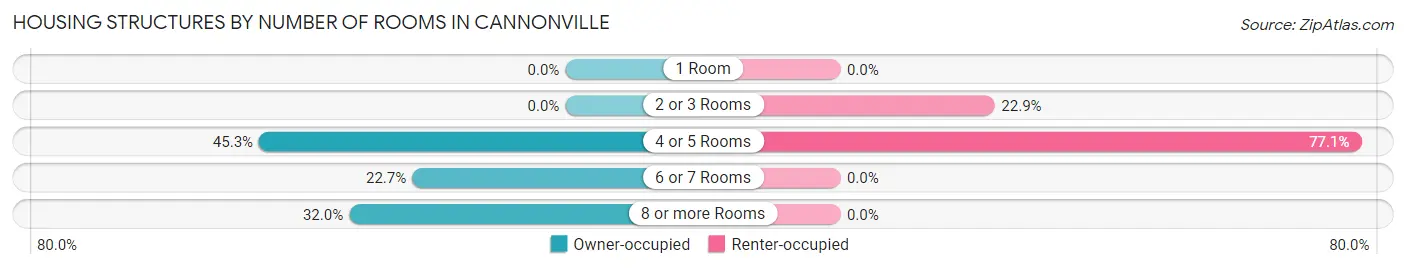
| Number of Rooms | Owner-occupied | Renter-occupied |
| 1 Room | 0 (0.0%) | 0 (0.0%) |
| 2 or 3 Rooms | 0 (0.0%) | 8 (22.9%) |
| 4 or 5 Rooms | 34 (45.3%) | 27 (77.1%) |
| 6 or 7 Rooms | 17 (22.7%) | 0 (0.0%) |
| 8 or more Rooms | 24 (32.0%) | 0 (0.0%) |
| Total | 75 (100.0%) | 35 (100.0%) |
Housing Structure by Heating Type in Cannonville
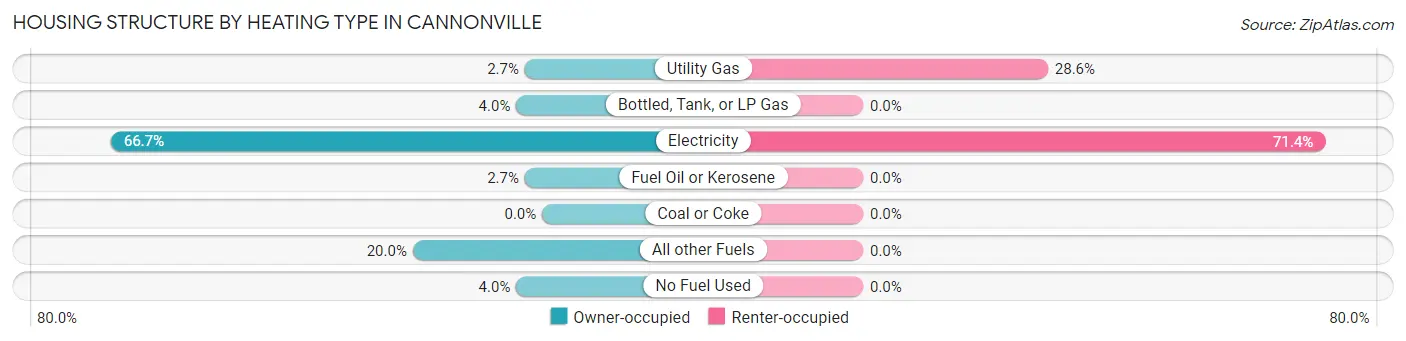
| Heating Type | Owner-occupied | Renter-occupied |
| Utility Gas | 2 (2.7%) | 10 (28.6%) |
| Bottled, Tank, or LP Gas | 3 (4.0%) | 0 (0.0%) |
| Electricity | 50 (66.7%) | 25 (71.4%) |
| Fuel Oil or Kerosene | 2 (2.7%) | 0 (0.0%) |
| Coal or Coke | 0 (0.0%) | 0 (0.0%) |
| All other Fuels | 15 (20.0%) | 0 (0.0%) |
| No Fuel Used | 3 (4.0%) | 0 (0.0%) |
| Total | 75 (100.0%) | 35 (100.0%) |
Household Vehicle Usage in Cannonville
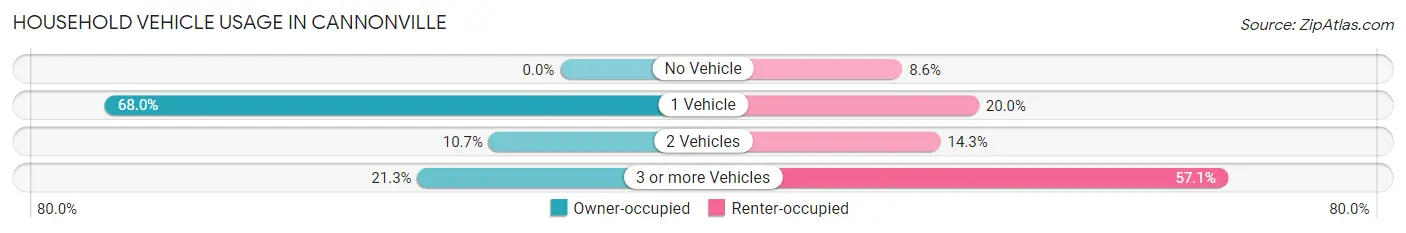
| Vehicles per Household | Owner-occupied | Renter-occupied |
| No Vehicle | 0 (0.0%) | 3 (8.6%) |
| 1 Vehicle | 51 (68.0%) | 7 (20.0%) |
| 2 Vehicles | 8 (10.7%) | 5 (14.3%) |
| 3 or more Vehicles | 16 (21.3%) | 20 (57.1%) |
| Total | 75 (100.0%) | 35 (100.0%) |
Real Estate & Mortgages in Cannonville
Real Estate and Mortgage Overview in Cannonville
| Characteristic | Without Mortgage | With Mortgage |
| Housing Units | 53 | 22 |
| Median Property Value | - | - |
| Median Household Income | $13,922 | $0 |
| Monthly Housing Costs | $339 | $0 |
| Real Estate Taxes | $948 | $2 |
Property Value by Mortgage Status in Cannonville
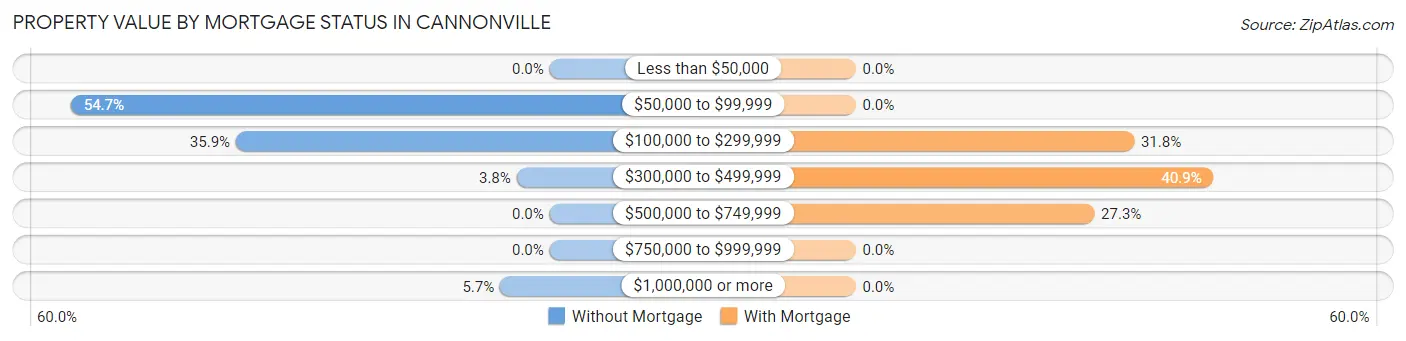
| Property Value | Without Mortgage | With Mortgage |
| Less than $50,000 | 0 (0.0%) | 0 (0.0%) |
| $50,000 to $99,999 | 29 (54.7%) | 0 (0.0%) |
| $100,000 to $299,999 | 19 (35.8%) | 7 (31.8%) |
| $300,000 to $499,999 | 2 (3.8%) | 9 (40.9%) |
| $500,000 to $749,999 | 0 (0.0%) | 6 (27.3%) |
| $750,000 to $999,999 | 0 (0.0%) | 0 (0.0%) |
| $1,000,000 or more | 3 (5.7%) | 0 (0.0%) |
| Total | 53 (100.0%) | 22 (100.0%) |
Household Income by Mortgage Status in Cannonville
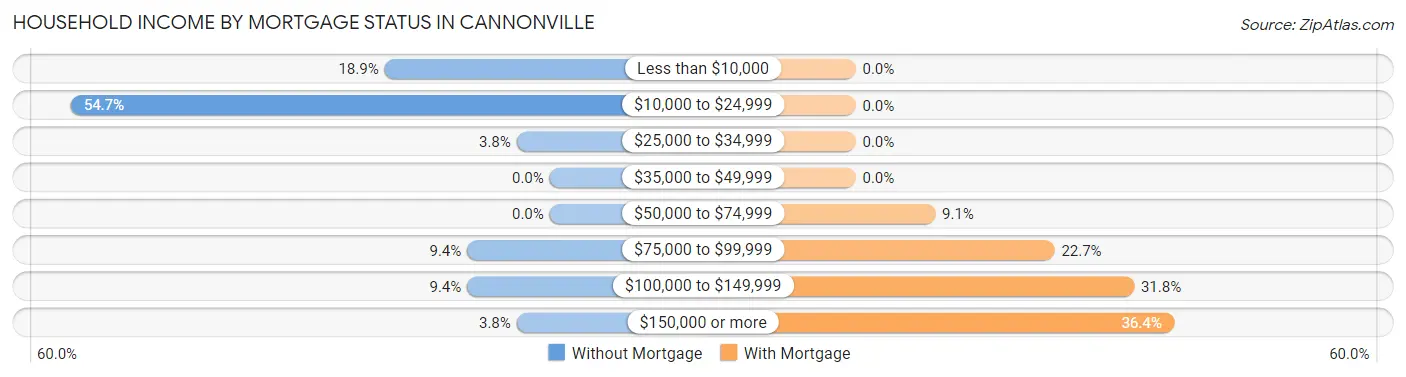
| Household Income | Without Mortgage | With Mortgage |
| Less than $10,000 | 10 (18.9%) | 0 (0.0%) |
| $10,000 to $24,999 | 29 (54.7%) | 0 (0.0%) |
| $25,000 to $34,999 | 2 (3.8%) | 0 (0.0%) |
| $35,000 to $49,999 | 0 (0.0%) | 0 (0.0%) |
| $50,000 to $74,999 | 0 (0.0%) | 2 (9.1%) |
| $75,000 to $99,999 | 5 (9.4%) | 5 (22.7%) |
| $100,000 to $149,999 | 5 (9.4%) | 7 (31.8%) |
| $150,000 or more | 2 (3.8%) | 8 (36.4%) |
| Total | 53 (100.0%) | 22 (100.0%) |
Property Value to Household Income Ratio in Cannonville
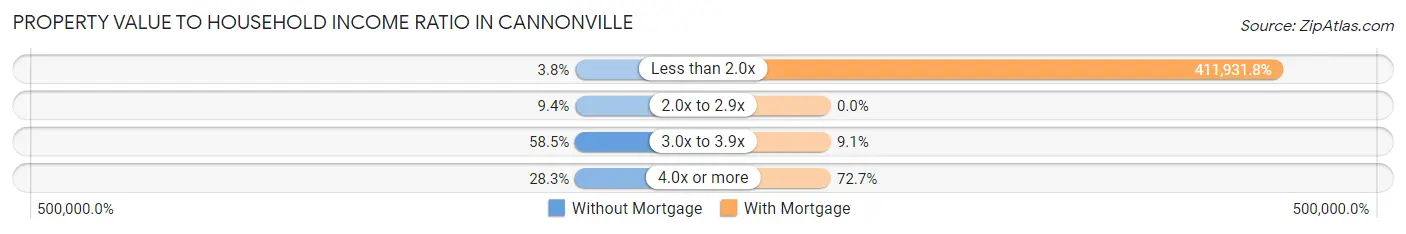
| Value-to-Income Ratio | Without Mortgage | With Mortgage |
| Less than 2.0x | 2 (3.8%) | 90,625 (411,931.8%) |
| 2.0x to 2.9x | 5 (9.4%) | 0 (0.0%) |
| 3.0x to 3.9x | 31 (58.5%) | 2 (9.1%) |
| 4.0x or more | 15 (28.3%) | 16 (72.7%) |
| Total | 53 (100.0%) | 22 (100.0%) |
Real Estate Taxes by Mortgage Status in Cannonville
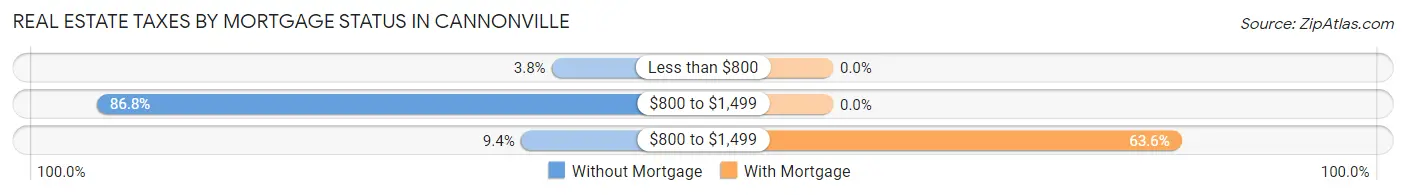
| Property Taxes | Without Mortgage | With Mortgage |
| Less than $800 | 2 (3.8%) | 0 (0.0%) |
| $800 to $1,499 | 46 (86.8%) | 0 (0.0%) |
| $800 to $1,499 | 5 (9.4%) | 14 (63.6%) |
| Total | 53 (100.0%) | 22 (100.0%) |
Health & Disability in Cannonville
Health Insurance Coverage by Age in Cannonville
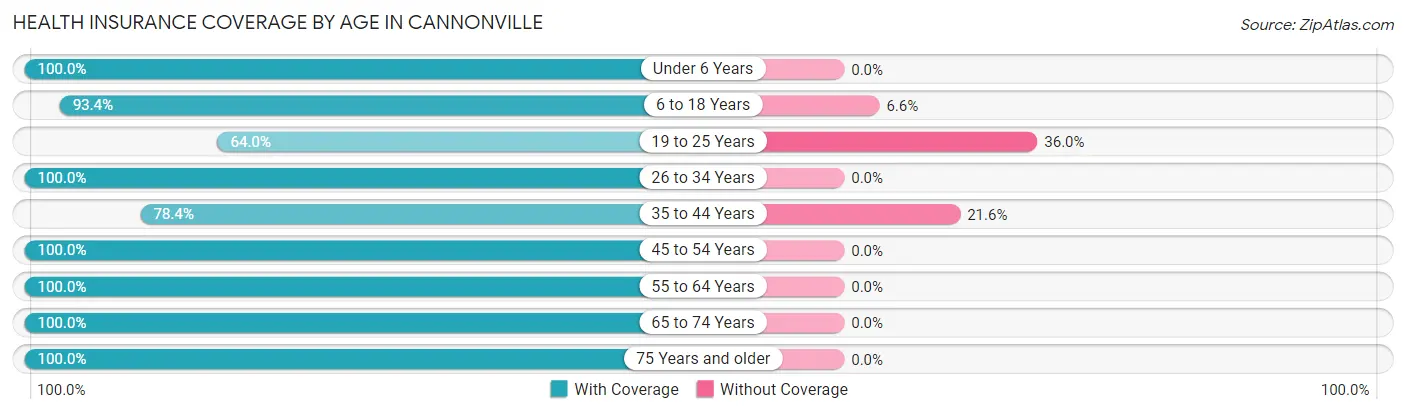
| Age Bracket | With Coverage | Without Coverage |
| Under 6 Years | 14 (100.0%) | 0 (0.0%) |
| 6 to 18 Years | 57 (93.4%) | 4 (6.6%) |
| 19 to 25 Years | 16 (64.0%) | 9 (36.0%) |
| 26 to 34 Years | 30 (100.0%) | 0 (0.0%) |
| 35 to 44 Years | 29 (78.4%) | 8 (21.6%) |
| 45 to 54 Years | 25 (100.0%) | 0 (0.0%) |
| 55 to 64 Years | 11 (100.0%) | 0 (0.0%) |
| 65 to 74 Years | 10 (100.0%) | 0 (0.0%) |
| 75 Years and older | 52 (100.0%) | 0 (0.0%) |
| Total | 244 (92.1%) | 21 (7.9%) |
Health Insurance Coverage by Citizenship Status in Cannonville
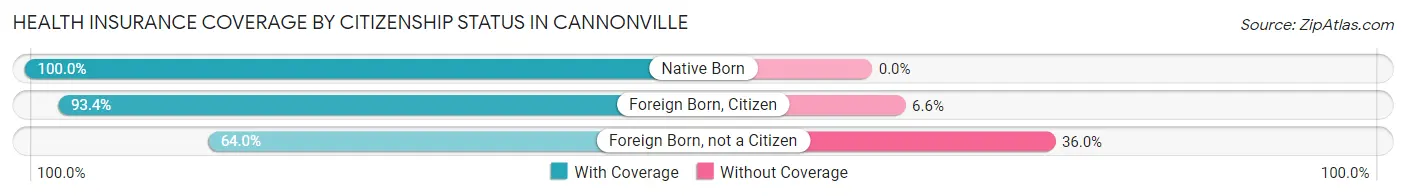
| Citizenship Status | With Coverage | Without Coverage |
| Native Born | 14 (100.0%) | 0 (0.0%) |
| Foreign Born, Citizen | 57 (93.4%) | 4 (6.6%) |
| Foreign Born, not a Citizen | 16 (64.0%) | 9 (36.0%) |
Health Insurance Coverage by Household Income in Cannonville
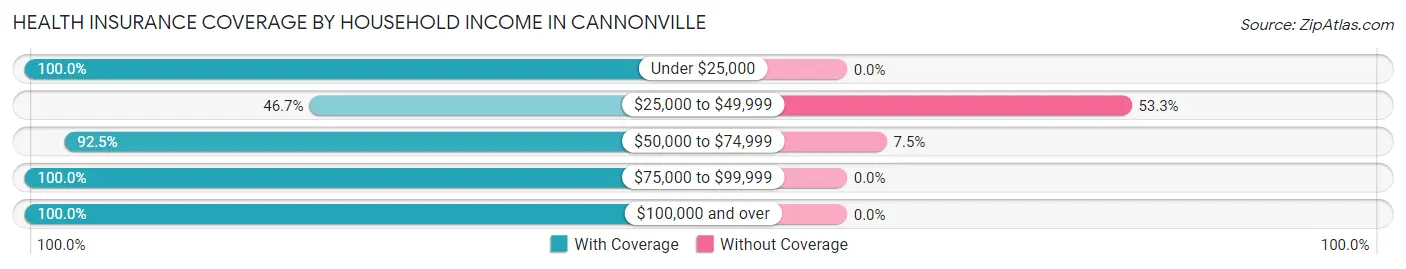
| Household Income | With Coverage | Without Coverage |
| Under $25,000 | 42 (100.0%) | 0 (0.0%) |
| $25,000 to $49,999 | 14 (46.7%) | 16 (53.3%) |
| $50,000 to $74,999 | 62 (92.5%) | 5 (7.5%) |
| $75,000 to $99,999 | 57 (100.0%) | 0 (0.0%) |
| $100,000 and over | 69 (100.0%) | 0 (0.0%) |
Public vs Private Health Insurance Coverage by Age in Cannonville
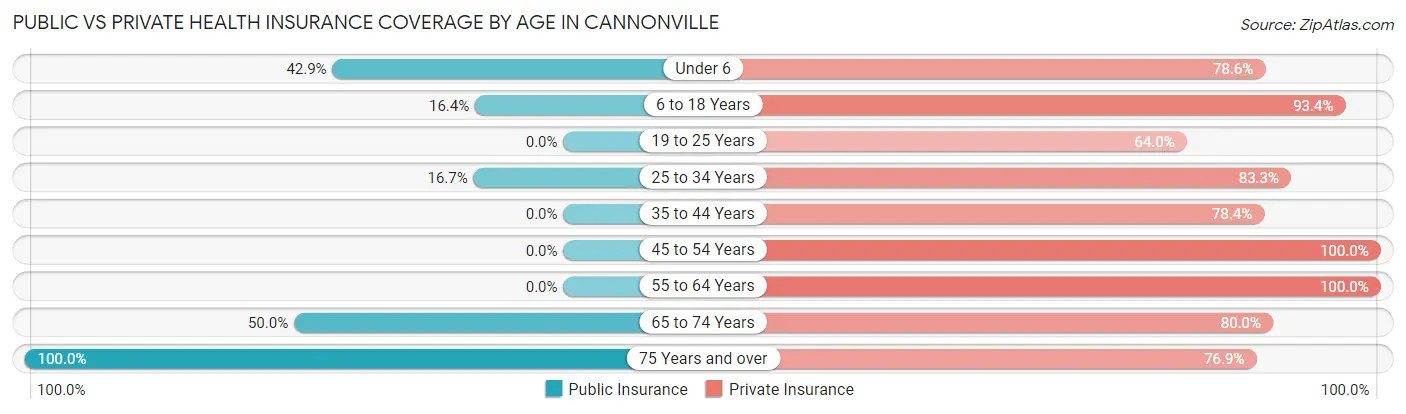
| Age Bracket | Public Insurance | Private Insurance |
| Under 6 | 6 (42.9%) | 11 (78.6%) |
| 6 to 18 Years | 10 (16.4%) | 57 (93.4%) |
| 19 to 25 Years | 0 (0.0%) | 16 (64.0%) |
| 25 to 34 Years | 5 (16.7%) | 25 (83.3%) |
| 35 to 44 Years | 0 (0.0%) | 29 (78.4%) |
| 45 to 54 Years | 0 (0.0%) | 25 (100.0%) |
| 55 to 64 Years | 0 (0.0%) | 11 (100.0%) |
| 65 to 74 Years | 5 (50.0%) | 8 (80.0%) |
| 75 Years and over | 52 (100.0%) | 40 (76.9%) |
| Total | 78 (29.4%) | 222 (83.8%) |
Disability Status by Sex by Age in Cannonville
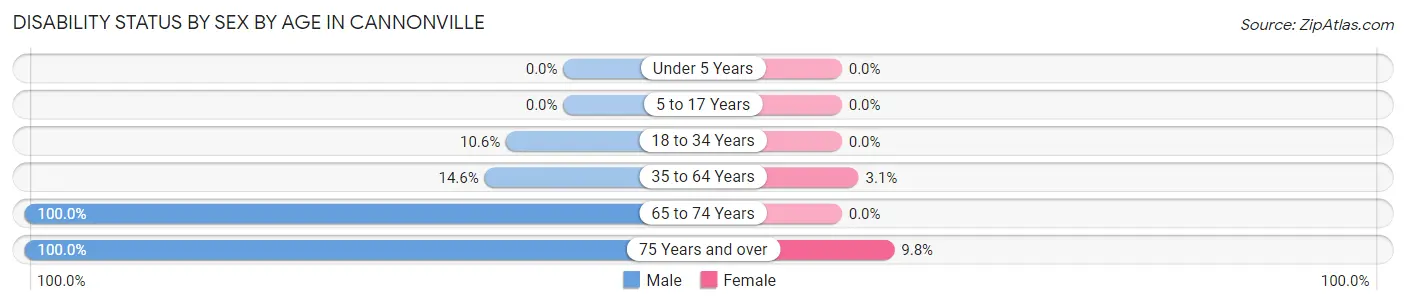
| Age Bracket | Male | Female |
| Under 5 Years | 0 (0.0%) | 0 (0.0%) |
| 5 to 17 Years | 0 (0.0%) | 0 (0.0%) |
| 18 to 34 Years | 5 (10.6%) | 0 (0.0%) |
| 35 to 64 Years | 6 (14.6%) | 1 (3.1%) |
| 65 to 74 Years | 3 (100.0%) | 0 (0.0%) |
| 75 Years and over | 11 (100.0%) | 4 (9.8%) |
Disability Class by Sex by Age in Cannonville
Disability Class: Hearing Difficulty
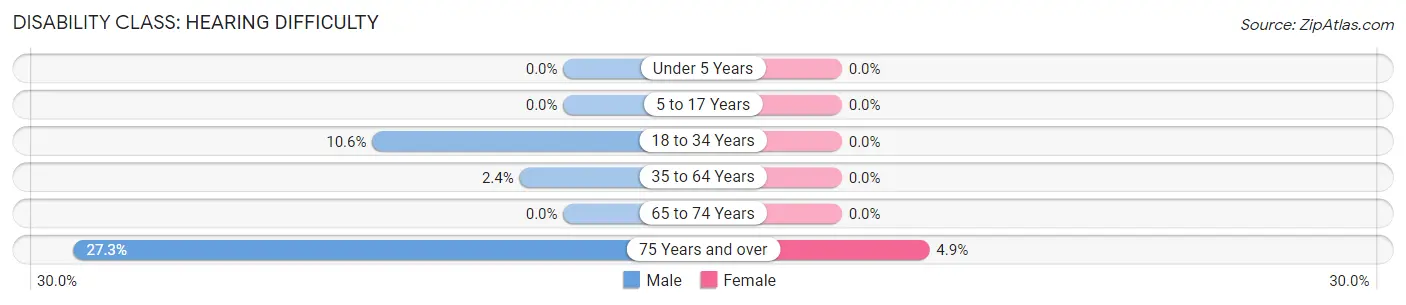
| Age Bracket | Male | Female |
| Under 5 Years | 0 (0.0%) | 0 (0.0%) |
| 5 to 17 Years | 0 (0.0%) | 0 (0.0%) |
| 18 to 34 Years | 5 (10.6%) | 0 (0.0%) |
| 35 to 64 Years | 1 (2.4%) | 0 (0.0%) |
| 65 to 74 Years | 0 (0.0%) | 0 (0.0%) |
| 75 Years and over | 3 (27.3%) | 2 (4.9%) |
Disability Class: Vision Difficulty
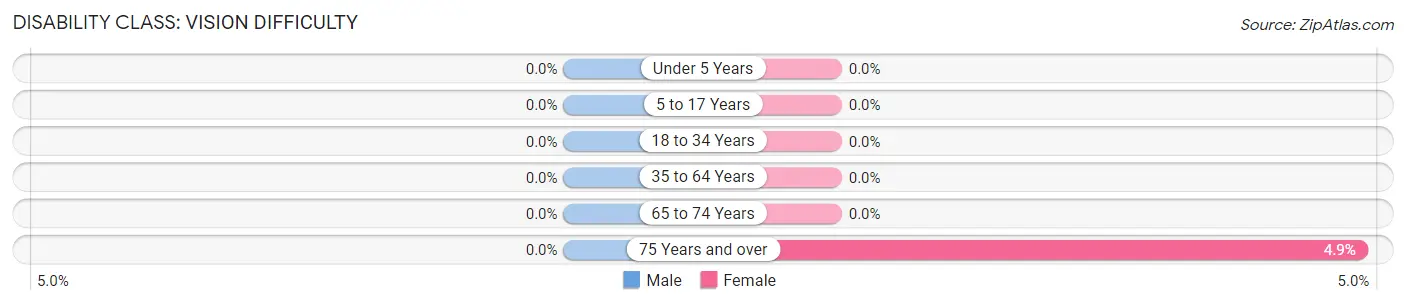
| Age Bracket | Male | Female |
| Under 5 Years | 0 (0.0%) | 0 (0.0%) |
| 5 to 17 Years | 0 (0.0%) | 0 (0.0%) |
| 18 to 34 Years | 0 (0.0%) | 0 (0.0%) |
| 35 to 64 Years | 0 (0.0%) | 0 (0.0%) |
| 65 to 74 Years | 0 (0.0%) | 0 (0.0%) |
| 75 Years and over | 0 (0.0%) | 2 (4.9%) |
Disability Class: Cognitive Difficulty
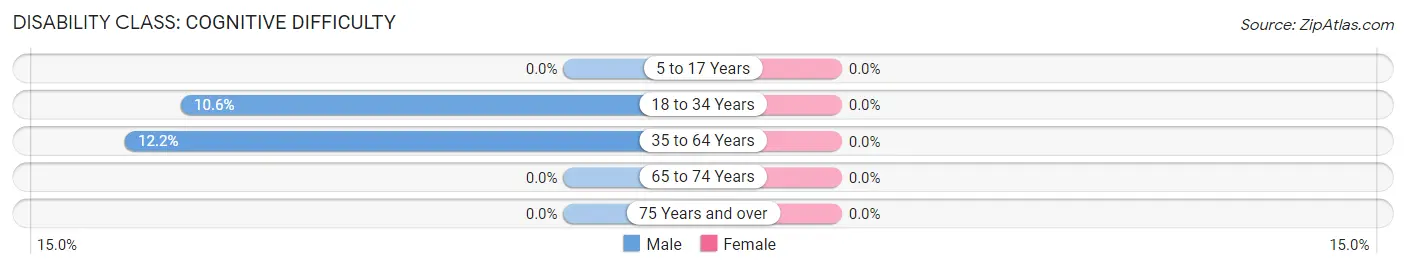
| Age Bracket | Male | Female |
| 5 to 17 Years | 0 (0.0%) | 0 (0.0%) |
| 18 to 34 Years | 5 (10.6%) | 0 (0.0%) |
| 35 to 64 Years | 5 (12.2%) | 0 (0.0%) |
| 65 to 74 Years | 0 (0.0%) | 0 (0.0%) |
| 75 Years and over | 0 (0.0%) | 0 (0.0%) |
Disability Class: Ambulatory Difficulty
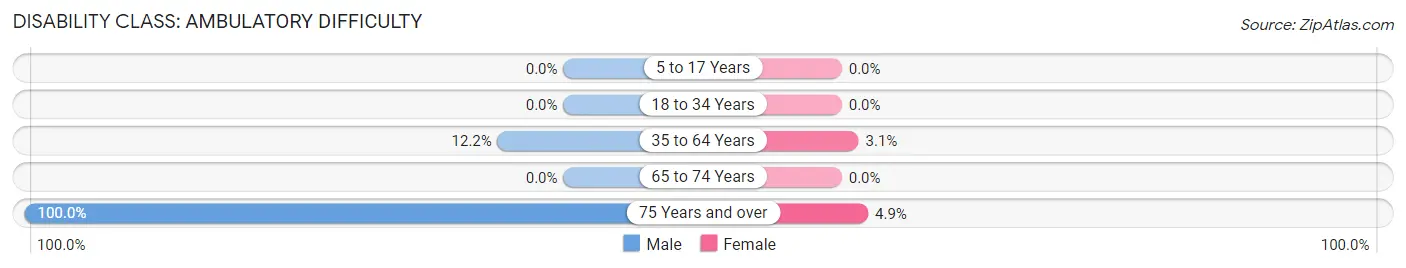
| Age Bracket | Male | Female |
| 5 to 17 Years | 0 (0.0%) | 0 (0.0%) |
| 18 to 34 Years | 0 (0.0%) | 0 (0.0%) |
| 35 to 64 Years | 5 (12.2%) | 1 (3.1%) |
| 65 to 74 Years | 0 (0.0%) | 0 (0.0%) |
| 75 Years and over | 11 (100.0%) | 2 (4.9%) |
Disability Class: Self-Care Difficulty
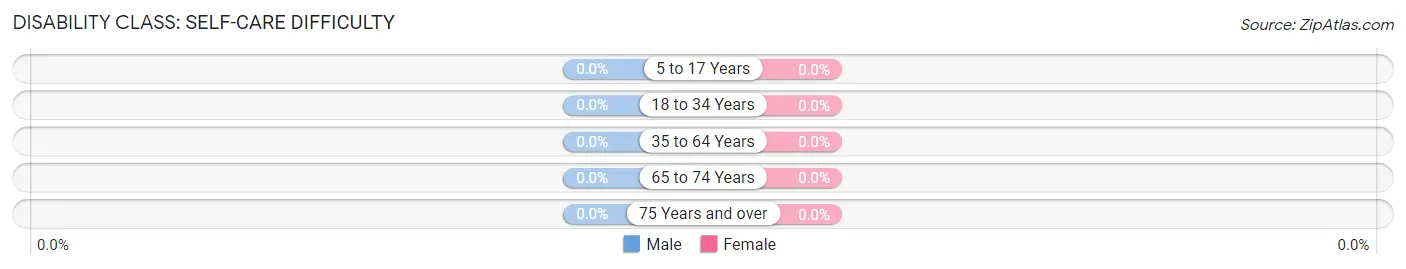
| Age Bracket | Male | Female |
| 5 to 17 Years | 0 (0.0%) | 0 (0.0%) |
| 18 to 34 Years | 0 (0.0%) | 0 (0.0%) |
| 35 to 64 Years | 0 (0.0%) | 0 (0.0%) |
| 65 to 74 Years | 0 (0.0%) | 0 (0.0%) |
| 75 Years and over | 0 (0.0%) | 0 (0.0%) |
Technology Access in Cannonville
Computing Device Access in Cannonville
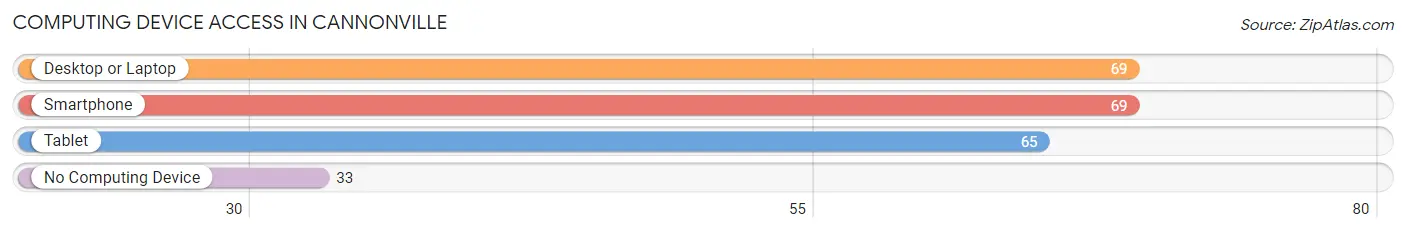
| Device Type | # Households | % Households |
| Desktop or Laptop | 69 | 62.7% |
| Smartphone | 69 | 62.7% |
| Tablet | 65 | 59.1% |
| No Computing Device | 33 | 30.0% |
| Total | 110 | 100.0% |
Internet Access in Cannonville
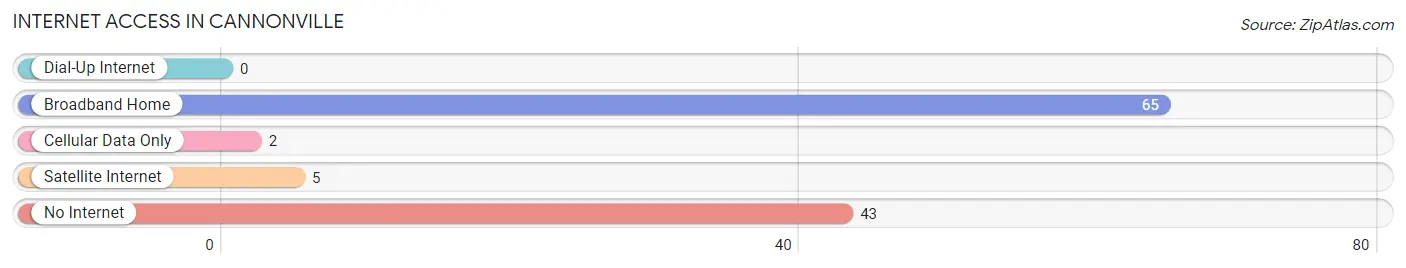
| Internet Type | # Households | % Households |
| Dial-Up Internet | 0 | 0.0% |
| Broadband Home | 65 | 59.1% |
| Cellular Data Only | 2 | 1.8% |
| Satellite Internet | 5 | 4.5% |
| No Internet | 43 | 39.1% |
| Total | 110 | 100.0% |
Cannonville Summary
Cannonville is a small town located in the south-central part of Utah, in the heart of the Grand Staircase-Escalante National Monument. It is situated in the Garfield County, and is part of the larger Kane County. The town is located at the junction of U.S. Route 89 and State Route 12, and is approximately 20 miles south of the city of Escalante. The population of Cannonville was estimated to be around 200 people in 2020.
History
Cannonville was first settled in the late 1800s by Mormon pioneers. The town was named after the Cannon family, who were among the first settlers in the area. The town was originally known as "Cannonville Station" due to its location on the Utah and Arizona Railway. The town was officially incorporated in 1909.
In the early 1900s, Cannonville was a thriving agricultural community, with many farms and ranches in the area. The town was also home to a number of businesses, including a general store, a hotel, a blacksmith shop, and a post office.
Geography
Cannonville is located in the south-central part of Utah, in the heart of the Grand Staircase-Escalante National Monument. The town is situated in the Garfield County, and is part of the larger Kane County. The town is located at the junction of U.S. Route 89 and State Route 12, and is approximately 20 miles south of the city of Escalante.
The town is situated in a semi-arid desert climate, with hot summers and cold winters. The average annual temperature is around 50°F, with an average high of around 90°F in the summer and an average low of around 10°F in the winter. The average annual precipitation is around 8 inches.
Economy
Cannonville is a small, rural town with a limited economy. The town is home to a few small businesses, including a general store, a hotel, and a post office. The town is also home to a number of farms and ranches, which provide employment for many of the town's residents.
The town is also home to a number of tourist attractions, including the Grand Staircase-Escalante National Monument, which is a popular destination for hikers, campers, and other outdoor enthusiasts. The town is also home to a number of art galleries, which feature the work of local artists.
Demographics
As of the 2020 census, the population of Cannonville was estimated to be around 200 people. The town is predominantly white, with a small Hispanic population. The median household income is around $35,000, and the median home value is around $150,000. The town has a high rate of homeownership, with around 80% of the population owning their own homes. The town also has a high rate of educational attainment, with around 90% of the population having at least a high school diploma.
Common Questions
What is Per Capita Income in Cannonville?
Per Capita income in Cannonville is $23,167.
What is the Median Household income in Cannonville?
Median Household Income in Cannonville is $50,250.
What is Income or Wage Gap in Cannonville?
Income or Wage Gap in Cannonville is 37.0%.
Women in Cannonville earn 63.0 cents for every dollar earned by a man.
What is Inequality or Gini Index in Cannonville?
Inequality or Gini Index in Cannonville is 0.45.
What is the Total Population of Cannonville?
Total Population of Cannonville is 265.
What is the Total Male Population of Cannonville?
Total Male Population of Cannonville is 136.
What is the Total Female Population of Cannonville?
Total Female Population of Cannonville is 129.
What is the Ratio of Males per 100 Females in Cannonville?
There are 105.43 Males per 100 Females in Cannonville.
What is the Ratio of Females per 100 Males in Cannonville?
There are 94.85 Females per 100 Males in Cannonville.
What is the Median Population Age in Cannonville?
Median Population Age in Cannonville is 38.4 Years.
What is the Average Family Size in Cannonville
Average Family Size in Cannonville is 3.5 People.
What is the Average Household Size in Cannonville
Average Household Size in Cannonville is 2.4 People.
How Large is the Labor Force in Cannonville?
There are 141 People in the Labor Forcein in Cannonville.
What is the Percentage of People in the Labor Force in Cannonville?
66.5% of People are in the Labor Force in Cannonville.
What is the Unemployment Rate in Cannonville?
Unemployment Rate in Cannonville is 1.4%.