Emery, UT Map & Demographics
Emery Map
Emery Overview
$22,713
PER CAPITA INCOME
$86,875
AVG FAMILY INCOME
$68,333
AVG HOUSEHOLD INCOME
0.37
INEQUALITY / GINI INDEX
373
TOTAL POPULATION
226
MALE POPULATION
147
FEMALE POPULATION
153.74
MALES / 100 FEMALES
65.04
FEMALES / 100 MALES
40.8
MEDIAN AGE
4.4
AVG FAMILY SIZE
3.1
AVG HOUSEHOLD SIZE
179
LABOR FORCE [ PEOPLE ]
65.1%
PERCENT IN LABOR FORCE
2.2%
UNEMPLOYMENT RATE
Emery Zip Codes
Emery Area Codes
Income in Emery
Income Overview in Emery
Per Capita Income in Emery is $22,713, while median incomes of families and households are $86,875 and $68,333 respectively.
| Characteristic | Number | Measure |
| Per Capita Income | 373 | $22,713 |
| Median Family Income | 67 | $86,875 |
| Mean Family Income | 67 | $101,564 |
| Median Household Income | 110 | $68,333 |
| Mean Household Income | 110 | $77,534 |
| Income Deficit | 67 | $0 |
| Wage / Income Gap (%) | 373 | 0.00% |
| Wage / Income Gap ($) | 373 | 100.00¢ per $1 |
| Gini / Inequality Index | 373 | 0.37 |
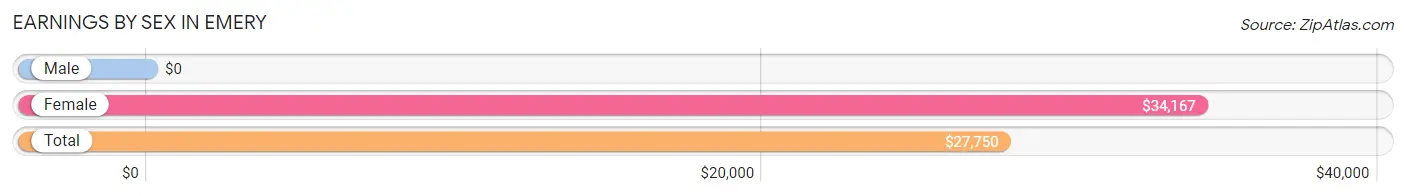
Earnings by Sex in Emery
| Sex | Number | Average Earnings |
| Male | 115 (59.0%) | $0 |
| Female | 80 (41.0%) | $34,167 |
| Total | 195 (100.0%) | $27,750 |
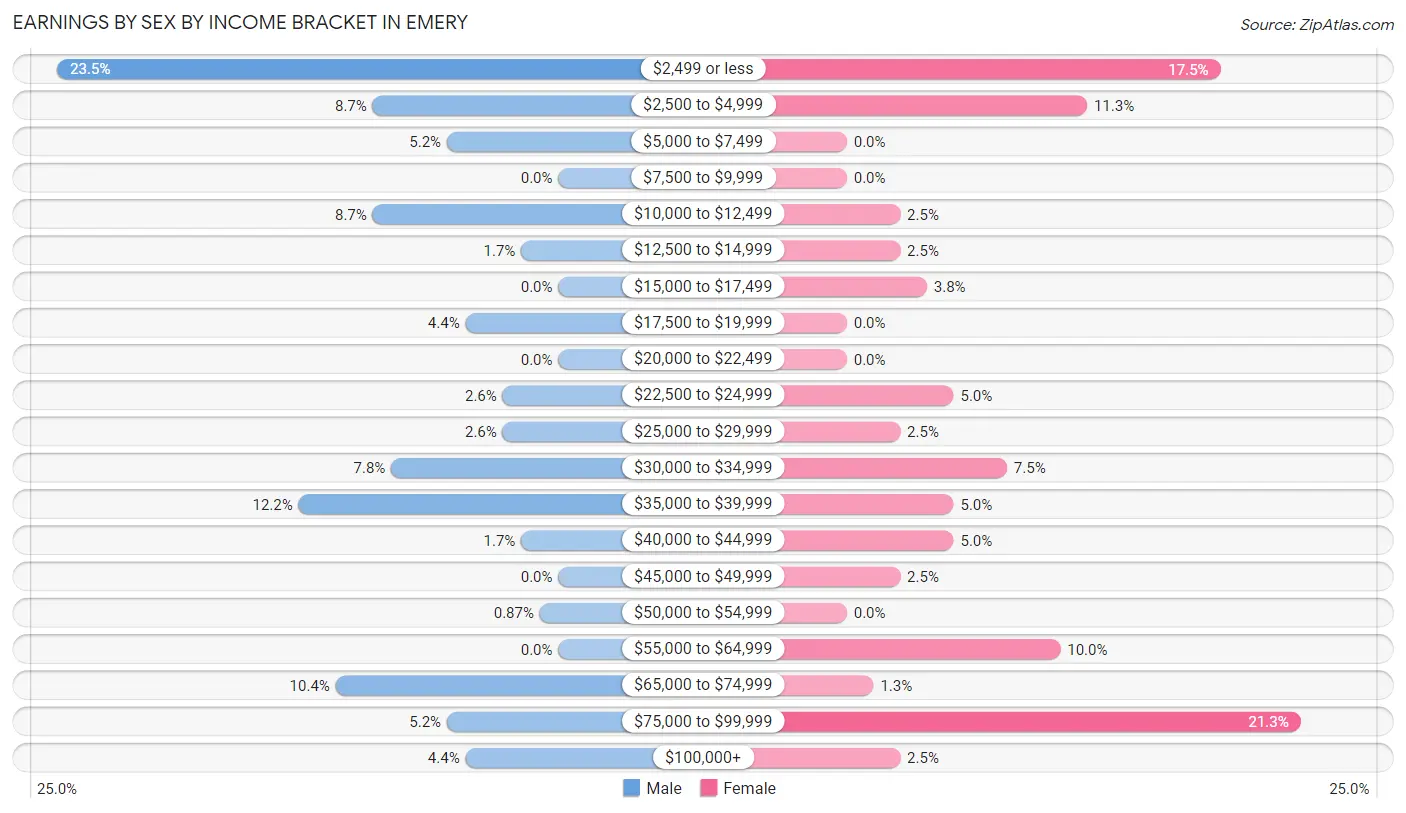
Earnings by Sex by Income Bracket in Emery
The most common earnings brackets in Emery are $2,499 or less for men (27 | 23.5%) and $75,000 to $99,999 for women (17 | 21.2%).
| Income | Male | Female |
| $2,499 or less | 27 (23.5%) | 14 (17.5%) |
| $2,500 to $4,999 | 10 (8.7%) | 9 (11.3%) |
| $5,000 to $7,499 | 6 (5.2%) | 0 (0.0%) |
| $7,500 to $9,999 | 0 (0.0%) | 0 (0.0%) |
| $10,000 to $12,499 | 10 (8.7%) | 2 (2.5%) |
| $12,500 to $14,999 | 2 (1.7%) | 2 (2.5%) |
| $15,000 to $17,499 | 0 (0.0%) | 3 (3.7%) |
| $17,500 to $19,999 | 5 (4.3%) | 0 (0.0%) |
| $20,000 to $22,499 | 0 (0.0%) | 0 (0.0%) |
| $22,500 to $24,999 | 3 (2.6%) | 4 (5.0%) |
| $25,000 to $29,999 | 3 (2.6%) | 2 (2.5%) |
| $30,000 to $34,999 | 9 (7.8%) | 6 (7.5%) |
| $35,000 to $39,999 | 14 (12.2%) | 4 (5.0%) |
| $40,000 to $44,999 | 2 (1.7%) | 4 (5.0%) |
| $45,000 to $49,999 | 0 (0.0%) | 2 (2.5%) |
| $50,000 to $54,999 | 1 (0.9%) | 0 (0.0%) |
| $55,000 to $64,999 | 0 (0.0%) | 8 (10.0%) |
| $65,000 to $74,999 | 12 (10.4%) | 1 (1.3%) |
| $75,000 to $99,999 | 6 (5.2%) | 17 (21.2%) |
| $100,000+ | 5 (4.3%) | 2 (2.5%) |
| Total | 115 (100.0%) | 80 (100.0%) |
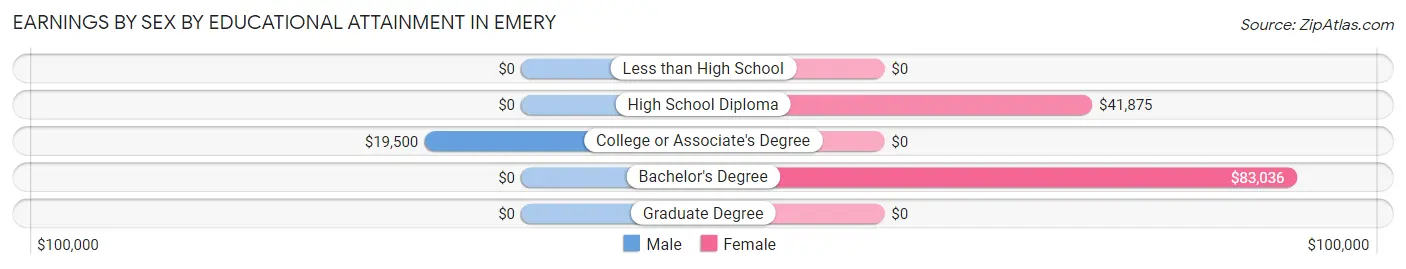
Earnings by Sex by Educational Attainment in Emery
Average earnings in Emery are $37,083 for men and $37,500 for women, a difference of 1.1%. Men with an educational attainment of college or associate's degree enjoy the highest average annual earnings of $19,500, while those with college or associate's degree education earn the least with $19,500. Women with an educational attainment of bachelor's degree earn the most with the average annual earnings of $83,036, while those with high school diploma education have the smallest earnings of $41,875.
| Educational Attainment | Male Income | Female Income |
| Less than High School | - | - |
| High School Diploma | - | - |
| College or Associate's Degree | $19,500 | $0 |
| Bachelor's Degree | - | - |
| Graduate Degree | - | - |
| Total | $37,083 | $37,500 |
Family Income in Emery
Family Income Brackets in Emery
According to the Emery family income data, there are 17 families falling into the $50,000 to $74,999 income range, which is the most common income bracket and makes up 25.4% of all families.
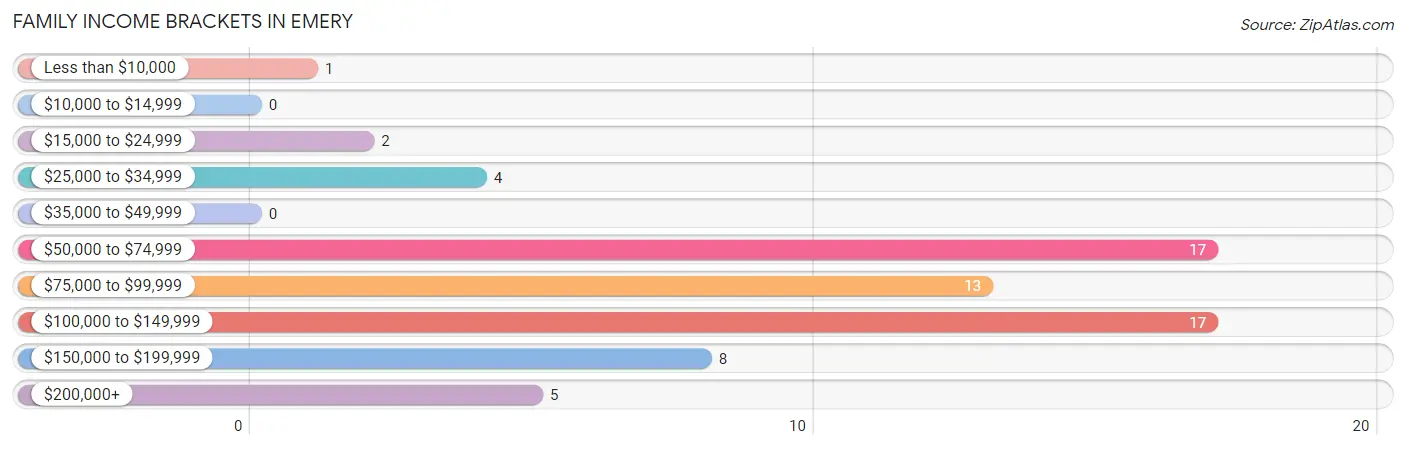
| Income Bracket | # Families | % Families |
| Less than $10,000 | 1 | 1.5% |
| $10,000 to $14,999 | 0 | 0.0% |
| $15,000 to $24,999 | 2 | 3.0% |
| $25,000 to $34,999 | 4 | 6.0% |
| $35,000 to $49,999 | 0 | 0.0% |
| $50,000 to $74,999 | 17 | 25.4% |
| $75,000 to $99,999 | 13 | 19.4% |
| $100,000 to $149,999 | 17 | 25.4% |
| $150,000 to $199,999 | 8 | 11.9% |
| $200,000+ | 5 | 7.5% |
Family Income by Famaliy Size in Emery
5-person families (11 | 16.4%) account for the highest median family income in Emery with $157,708 per family, while 2-person families (17 | 25.4%) have the highest median income of $40,208 per family member.
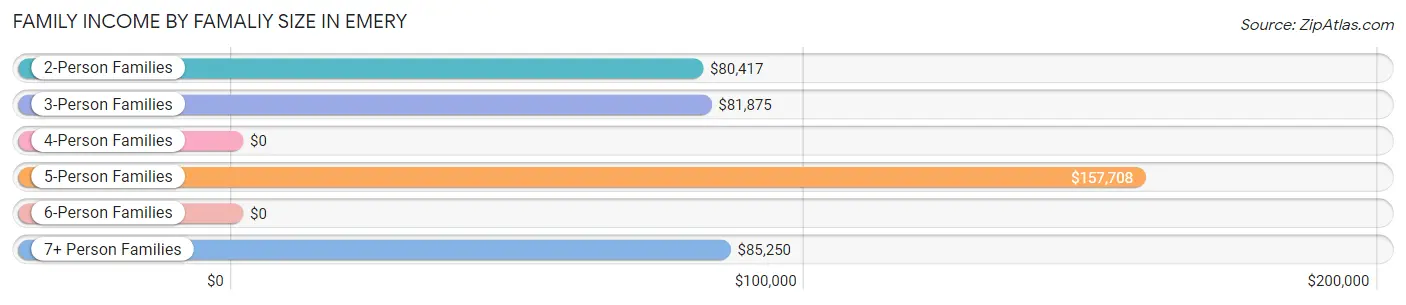
| Income Bracket | # Families | Median Income |
| 2-Person Families | 17 (25.4%) | $80,417 |
| 3-Person Families | 23 (34.3%) | $81,875 |
| 4-Person Families | 7 (10.4%) | $0 |
| 5-Person Families | 11 (16.4%) | $157,708 |
| 6-Person Families | 0 (0.0%) | $0 |
| 7+ Person Families | 9 (13.4%) | $85,250 |
| Total | 67 (100.0%) | $86,875 |
Family Income by Number of Earners in Emery
The median family income in Emery is $86,875, with families comprising 3+ earners (30) having the highest median family income of $123,571, while families with no earners (5) have the lowest median family income of $31,875, accounting for 44.8% and 7.5% of families, respectively.
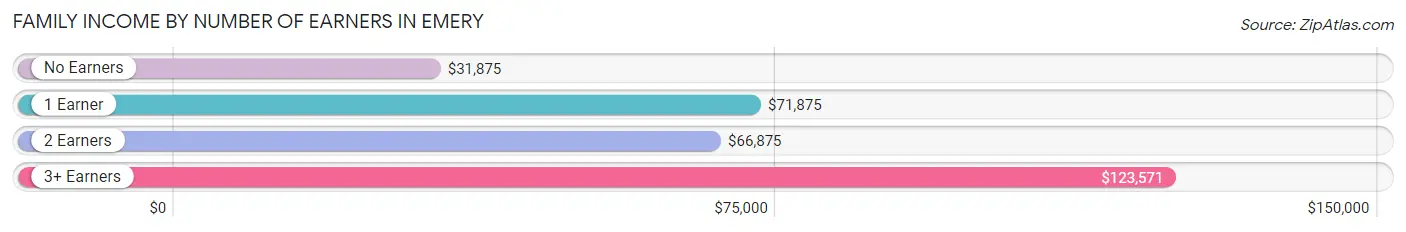
| Number of Earners | # Families | Median Income |
| No Earners | 5 (7.5%) | $31,875 |
| 1 Earner | 19 (28.4%) | $71,875 |
| 2 Earners | 13 (19.4%) | $66,875 |
| 3+ Earners | 30 (44.8%) | $123,571 |
| Total | 67 (100.0%) | $86,875 |
Household Income in Emery
Household Income Brackets in Emery
With 32 households falling in the category, the $50,000 to $74,999 income range is the most frequent in Emery, accounting for 29.1% of all households.
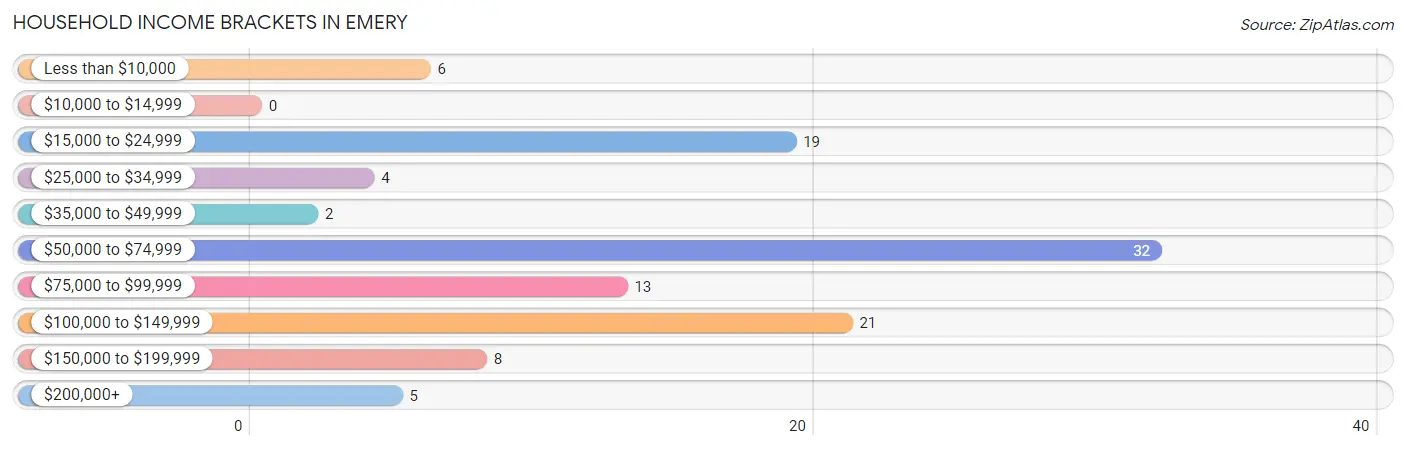
| Income Bracket | # Households | % Households |
| Less than $10,000 | 6 | 5.5% |
| $10,000 to $14,999 | 0 | 0.0% |
| $15,000 to $24,999 | 19 | 17.3% |
| $25,000 to $34,999 | 4 | 3.6% |
| $35,000 to $49,999 | 2 | 1.8% |
| $50,000 to $74,999 | 32 | 29.1% |
| $75,000 to $99,999 | 13 | 11.8% |
| $100,000 to $149,999 | 21 | 19.1% |
| $150,000 to $199,999 | 8 | 7.3% |
| $200,000+ | 5 | 4.5% |
Household Income by Householder Age in Emery
The median household income in Emery is $68,333, with the highest median household income of $86,750 found in the 25 to 44 years age bracket for the primary householder. A total of 37 households (33.6%) fall into this category.
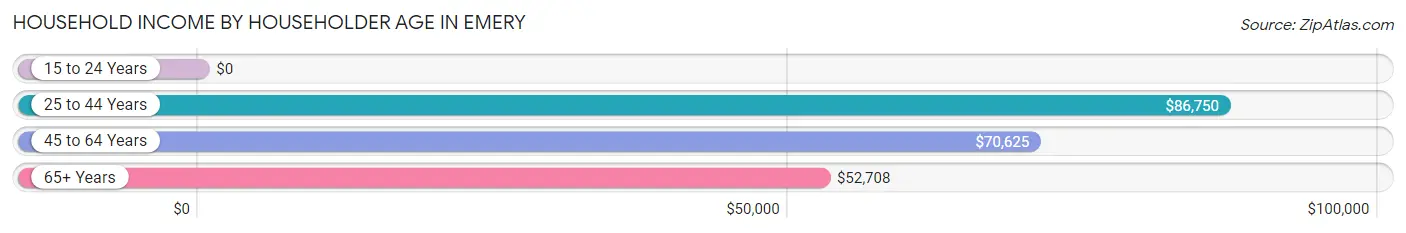
| Income Bracket | # Households | Median Income |
| 15 to 24 Years | 0 (0.0%) | $0 |
| 25 to 44 Years | 37 (33.6%) | $86,750 |
| 45 to 64 Years | 34 (30.9%) | $70,625 |
| 65+ Years | 39 (35.4%) | $52,708 |
| Total | 110 (100.0%) | $68,333 |
Poverty in Emery
Income Below Poverty by Sex and Age in Emery
With 23.0% poverty level for males and 31.3% for females among the residents of Emery, 12 to 14 year old males and 15 year old females are the most vulnerable to poverty, with 8 males (44.4%) and 8 females (100.0%) in their respective age groups living below the poverty level.
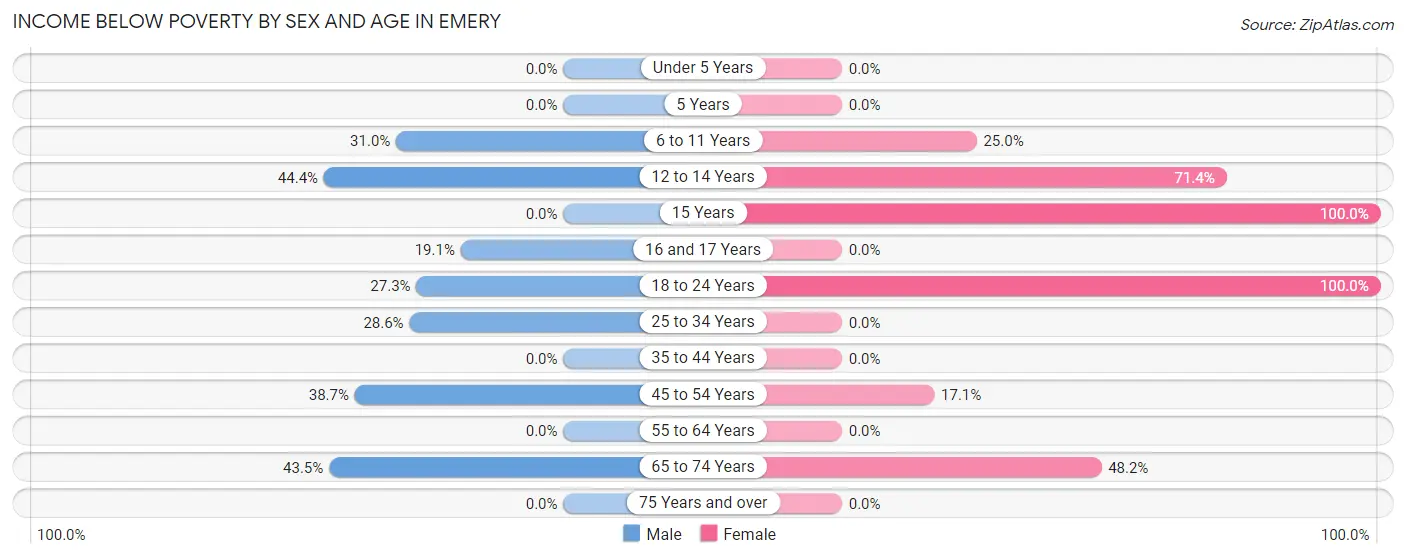
| Age Bracket | Male | Female |
| Under 5 Years | 0 (0.0%) | 0 (0.0%) |
| 5 Years | 0 (0.0%) | 0 (0.0%) |
| 6 to 11 Years | 9 (31.0%) | 1 (25.0%) |
| 12 to 14 Years | 8 (44.4%) | 10 (71.4%) |
| 15 Years | 0 (0.0%) | 8 (100.0%) |
| 16 and 17 Years | 8 (19.1%) | 0 (0.0%) |
| 18 to 24 Years | 3 (27.3%) | 8 (100.0%) |
| 25 to 34 Years | 2 (28.6%) | 0 (0.0%) |
| 35 to 44 Years | 0 (0.0%) | 0 (0.0%) |
| 45 to 54 Years | 12 (38.7%) | 6 (17.1%) |
| 55 to 64 Years | 0 (0.0%) | 0 (0.0%) |
| 65 to 74 Years | 10 (43.5%) | 13 (48.1%) |
| 75 Years and over | 0 (0.0%) | 0 (0.0%) |
| Total | 52 (23.0%) | 46 (31.3%) |
Income Above Poverty by Sex and Age in Emery
According to the poverty statistics in Emery, males aged under 5 years and females aged 25 to 34 years are the age groups that are most secure financially, with 100.0% of males and 100.0% of females in these age groups living above the poverty line.
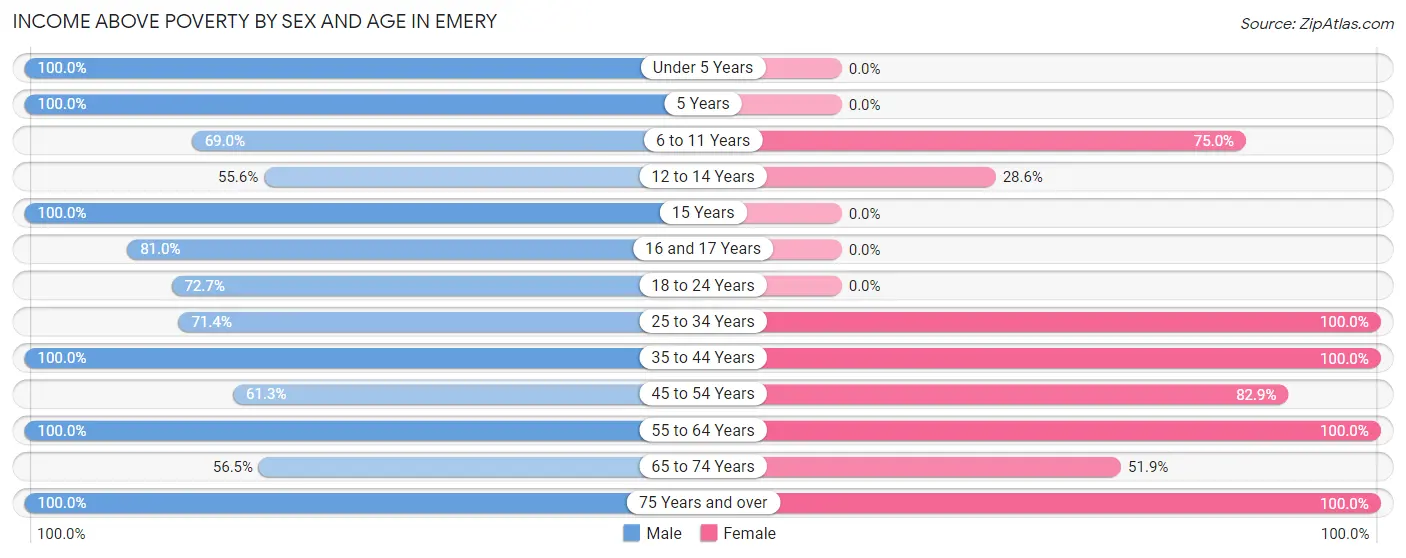
| Age Bracket | Male | Female |
| Under 5 Years | 3 (100.0%) | 0 (0.0%) |
| 5 Years | 5 (100.0%) | 0 (0.0%) |
| 6 to 11 Years | 20 (69.0%) | 3 (75.0%) |
| 12 to 14 Years | 10 (55.6%) | 4 (28.6%) |
| 15 Years | 17 (100.0%) | 0 (0.0%) |
| 16 and 17 Years | 34 (80.9%) | 0 (0.0%) |
| 18 to 24 Years | 8 (72.7%) | 0 (0.0%) |
| 25 to 34 Years | 5 (71.4%) | 2 (100.0%) |
| 35 to 44 Years | 20 (100.0%) | 31 (100.0%) |
| 45 to 54 Years | 19 (61.3%) | 29 (82.9%) |
| 55 to 64 Years | 15 (100.0%) | 6 (100.0%) |
| 65 to 74 Years | 13 (56.5%) | 14 (51.8%) |
| 75 Years and over | 5 (100.0%) | 12 (100.0%) |
| Total | 174 (77.0%) | 101 (68.7%) |
Income Below Poverty Among Married-Couple Families in Emery
The poverty statistics for married-couple families in Emery show that 4.7% or 3 of the total 64 families live below the poverty line. Families with 5 or more children have the highest poverty rate of 22.2%, comprising of 2 families. On the other hand, families with 1 or 2 children have the lowest poverty rate of 0.0%, which includes 0 families.
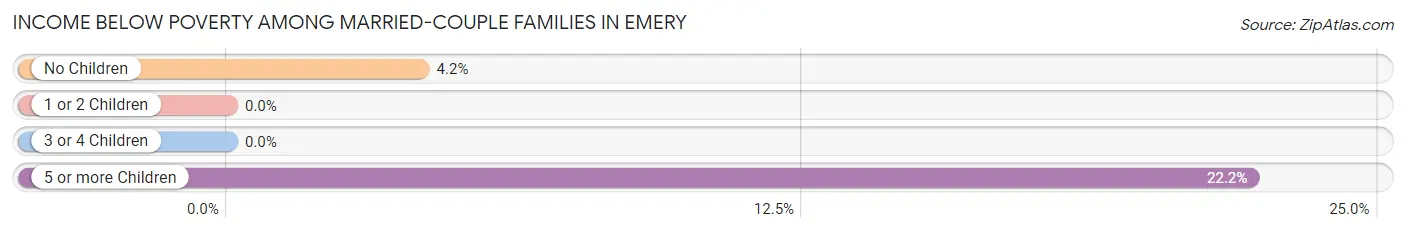
| Children | Above Poverty | Below Poverty |
| No Children | 23 (95.8%) | 1 (4.2%) |
| 1 or 2 Children | 28 (100.0%) | 0 (0.0%) |
| 3 or 4 Children | 3 (100.0%) | 0 (0.0%) |
| 5 or more Children | 7 (77.8%) | 2 (22.2%) |
| Total | 61 (95.3%) | 3 (4.7%) |
Income Below Poverty Among Single-Parent Households in Emery
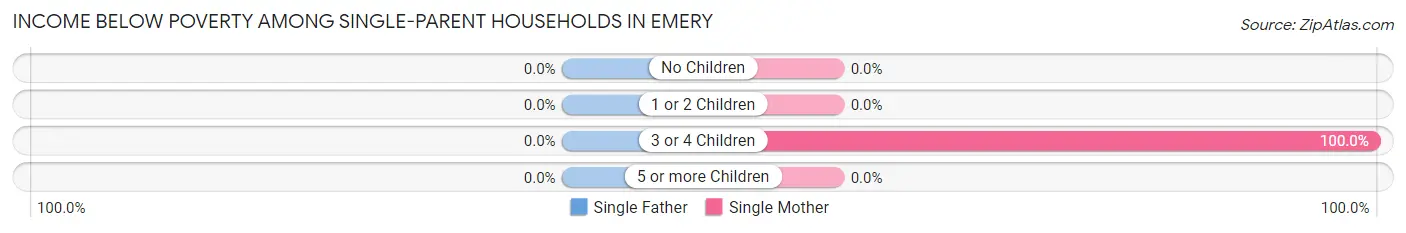
| Children | Single Father | Single Mother |
| No Children | 0 (0.0%) | 0 (0.0%) |
| 1 or 2 Children | 0 (0.0%) | 0 (0.0%) |
| 3 or 4 Children | 0 (0.0%) | 2 (100.0%) |
| 5 or more Children | 0 (0.0%) | 0 (0.0%) |
| Total | 0 (0.0%) | 2 (66.7%) |
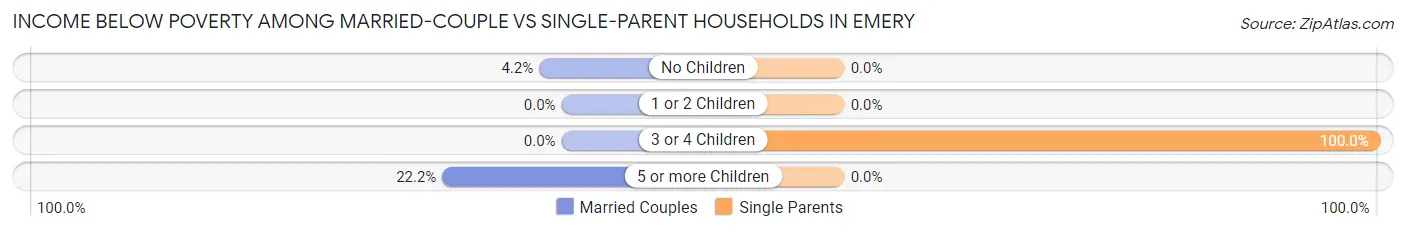
Income Below Poverty Among Married-Couple vs Single-Parent Households in Emery
The poverty data for Emery shows that 3 of the married-couple family households (4.7%) and 2 of the single-parent households (66.7%) are living below the poverty level. Within the married-couple family households, those with 5 or more children have the highest poverty rate, with 2 households (22.2%) falling below the poverty line. Among the single-parent households, those with 3 or 4 children have the highest poverty rate, with 2 household (100.0%) living below poverty.
| Children | Married-Couple Families | Single-Parent Households |
| No Children | 1 (4.2%) | 0 (0.0%) |
| 1 or 2 Children | 0 (0.0%) | 0 (0.0%) |
| 3 or 4 Children | 0 (0.0%) | 2 (100.0%) |
| 5 or more Children | 2 (22.2%) | 0 (0.0%) |
| Total | 3 (4.7%) | 2 (66.7%) |
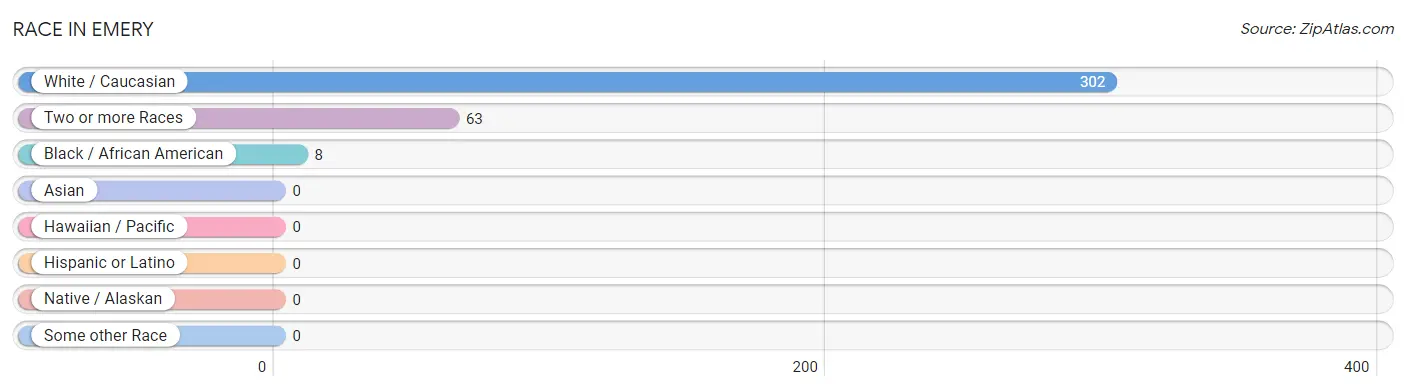
Race in Emery
The most populous races in Emery are White / Caucasian (302 | 81.0%), Two or more Races (63 | 16.9%), and Black / African American (8 | 2.1%).
| Race | # Population | % Population |
| Asian | 0 | 0.0% |
| Black / African American | 8 | 2.1% |
| Hawaiian / Pacific | 0 | 0.0% |
| Hispanic or Latino | 0 | 0.0% |
| Native / Alaskan | 0 | 0.0% |
| White / Caucasian | 302 | 81.0% |
| Two or more Races | 63 | 16.9% |
| Some other Race | 0 | 0.0% |
| Total | 373 | 100.0% |
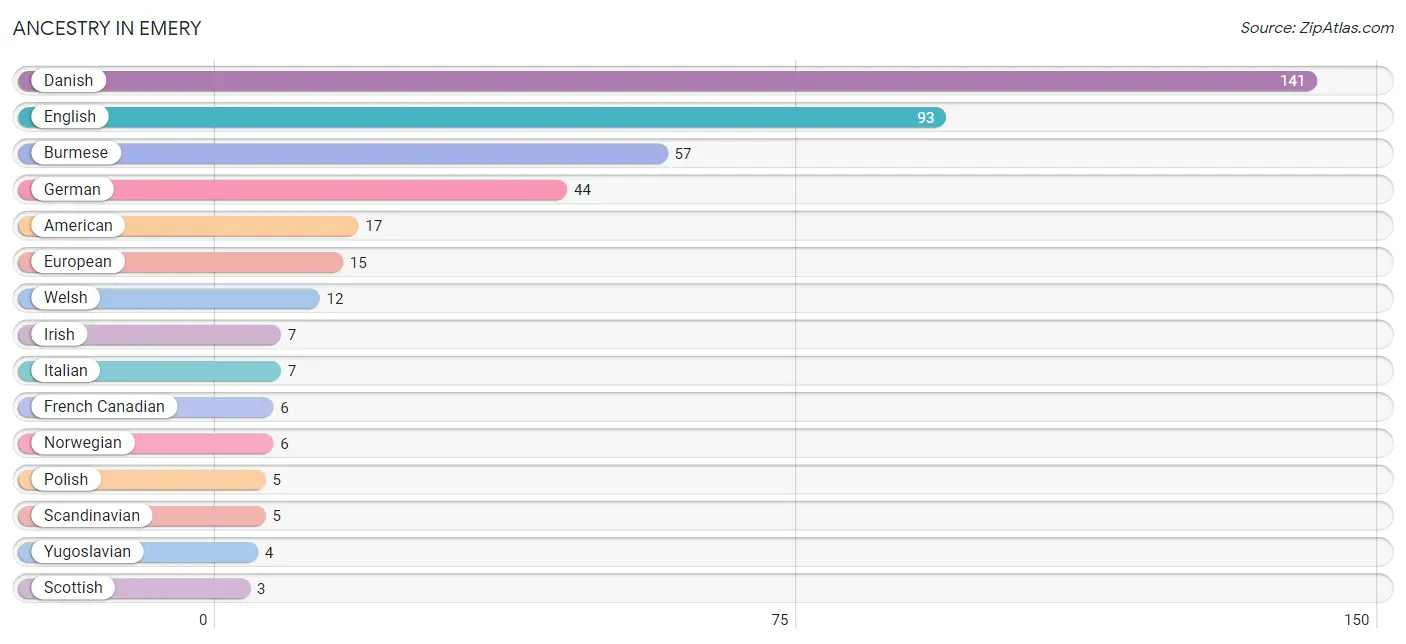
Ancestry in Emery
The most populous ancestries reported in Emery are Danish (141 | 37.8%), English (93 | 24.9%), Burmese (57 | 15.3%), German (44 | 11.8%), and American (17 | 4.6%), together accounting for 94.4% of all Emery residents.
| Ancestry | # Population | % Population |
| American | 17 | 4.6% |
| Burmese | 57 | 15.3% |
| Croatian | 1 | 0.3% |
| Danish | 141 | 37.8% |
| Dutch | 1 | 0.3% |
| English | 93 | 24.9% |
| European | 15 | 4.0% |
| French | 2 | 0.5% |
| French Canadian | 6 | 1.6% |
| German | 44 | 11.8% |
| Irish | 7 | 1.9% |
| Italian | 7 | 1.9% |
| Norwegian | 6 | 1.6% |
| Polish | 5 | 1.3% |
| Scandinavian | 5 | 1.3% |
| Scottish | 3 | 0.8% |
| Swedish | 3 | 0.8% |
| Swiss | 1 | 0.3% |
| Welsh | 12 | 3.2% |
| Yugoslavian | 4 | 1.1% | View All 20 Rows |
Immigrants in Emery

| Immigration Origin | # Population | % Population | View All 0 Rows |
Sex and Age in Emery
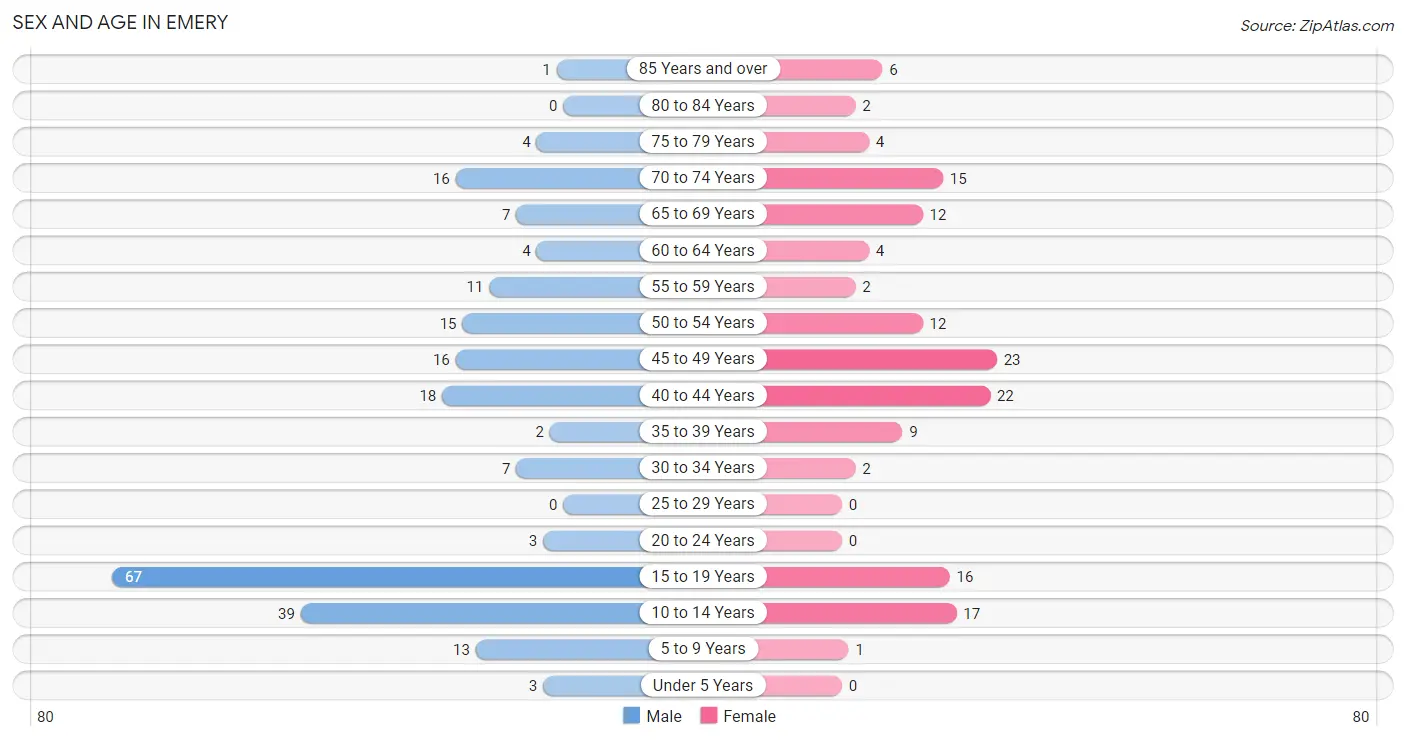
Sex and Age in Emery
The most populous age groups in Emery are 15 to 19 Years (67 | 29.6%) for men and 45 to 49 Years (23 | 15.7%) for women.
| Age Bracket | Male | Female |
| Under 5 Years | 3 (1.3%) | 0 (0.0%) |
| 5 to 9 Years | 13 (5.8%) | 1 (0.7%) |
| 10 to 14 Years | 39 (17.3%) | 17 (11.6%) |
| 15 to 19 Years | 67 (29.6%) | 16 (10.9%) |
| 20 to 24 Years | 3 (1.3%) | 0 (0.0%) |
| 25 to 29 Years | 0 (0.0%) | 0 (0.0%) |
| 30 to 34 Years | 7 (3.1%) | 2 (1.4%) |
| 35 to 39 Years | 2 (0.9%) | 9 (6.1%) |
| 40 to 44 Years | 18 (8.0%) | 22 (15.0%) |
| 45 to 49 Years | 16 (7.1%) | 23 (15.7%) |
| 50 to 54 Years | 15 (6.6%) | 12 (8.2%) |
| 55 to 59 Years | 11 (4.9%) | 2 (1.4%) |
| 60 to 64 Years | 4 (1.8%) | 4 (2.7%) |
| 65 to 69 Years | 7 (3.1%) | 12 (8.2%) |
| 70 to 74 Years | 16 (7.1%) | 15 (10.2%) |
| 75 to 79 Years | 4 (1.8%) | 4 (2.7%) |
| 80 to 84 Years | 0 (0.0%) | 2 (1.4%) |
| 85 Years and over | 1 (0.4%) | 6 (4.1%) |
| Total | 226 (100.0%) | 147 (100.0%) |
Families and Households in Emery
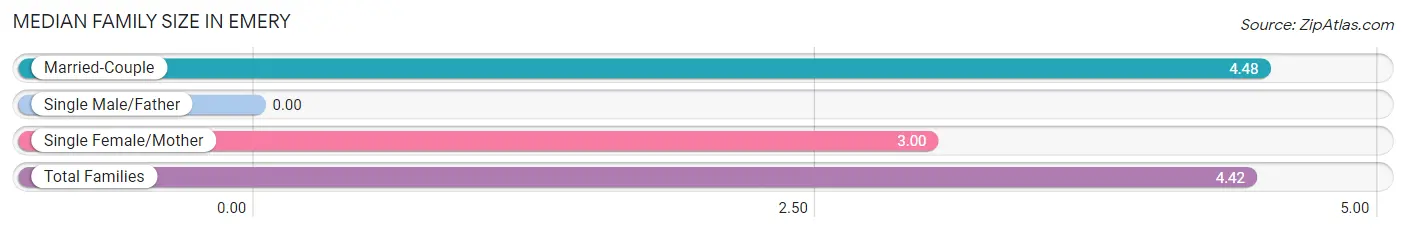
Median Family Size in Emery
| Family Type | # Families | Family Size |
| Married-Couple | 64 (95.5%) | 4.48 |
| Single Male/Father | 0 (0.0%) | - |
| Single Female/Mother | 3 (4.5%) | 3.00 |
| Total Families | 67 (100.0%) | 4.42 |
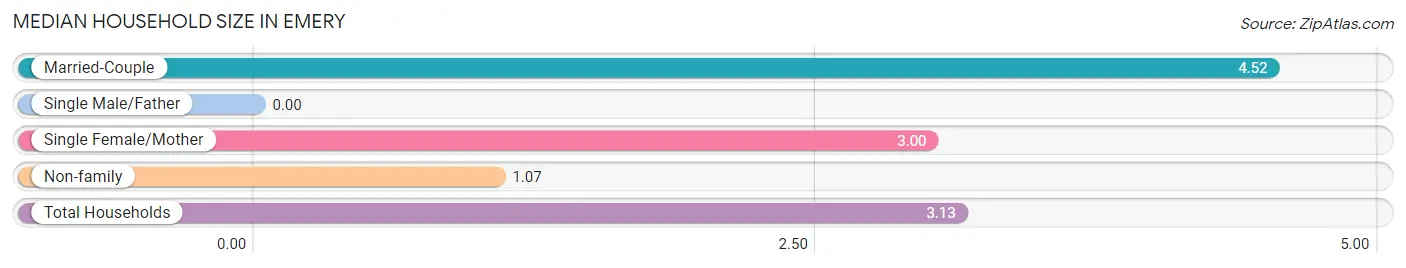
Median Household Size in Emery
| Household Type | # Households | Household Size |
| Married-Couple | 64 (58.2%) | 4.52 |
| Single Male/Father | 0 (0.0%) | - |
| Single Female/Mother | 3 (2.7%) | 3.00 |
| Non-family | 43 (39.1%) | 1.07 |
| Total Households | 110 (100.0%) | 3.13 |
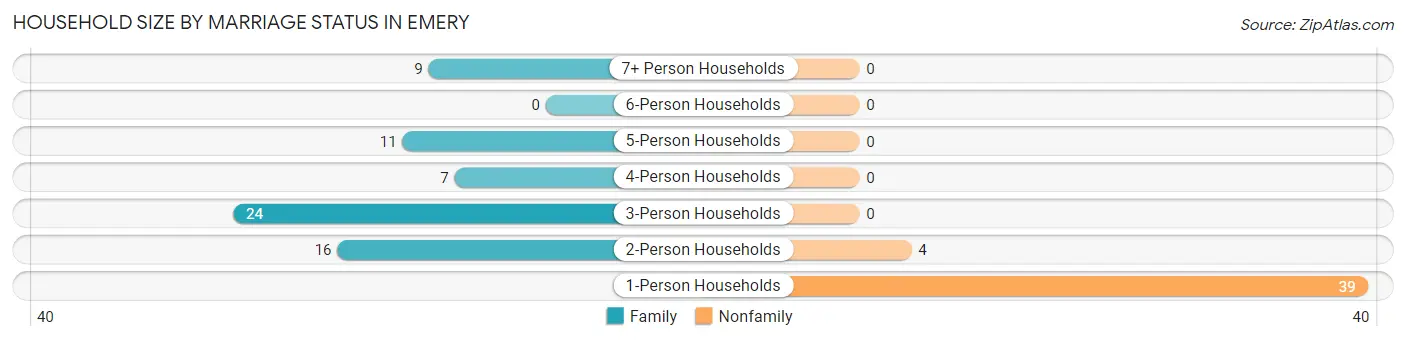
Household Size by Marriage Status in Emery
Out of a total of 110 households in Emery, 67 (60.9%) are family households, while 43 (39.1%) are nonfamily households. The most numerous type of family households are 3-person households, comprising 24, and the most common type of nonfamily households are 1-person households, comprising 39.
| Household Size | Family Households | Nonfamily Households |
| 1-Person Households | - | 39 (35.4%) |
| 2-Person Households | 16 (14.5%) | 4 (3.6%) |
| 3-Person Households | 24 (21.8%) | 0 (0.0%) |
| 4-Person Households | 7 (6.4%) | 0 (0.0%) |
| 5-Person Households | 11 (10.0%) | 0 (0.0%) |
| 6-Person Households | 0 (0.0%) | 0 (0.0%) |
| 7+ Person Households | 9 (8.2%) | 0 (0.0%) |
| Total | 67 (60.9%) | 43 (39.1%) |
Female Fertility in Emery
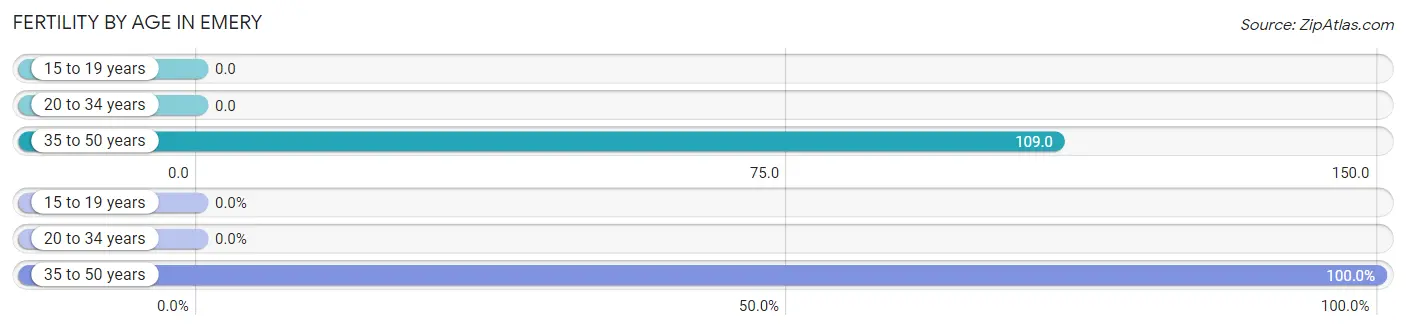
Fertility by Age in Emery
Average fertility rate in Emery is 82.0 births per 1,000 women. Women in the age bracket of 35 to 50 years have the highest fertility rate with 109.0 births per 1,000 women. Women in the age bracket of 35 to 50 years acount for 100.0% of all women with births.
| Age Bracket | Women with Births | Births / 1,000 Women |
| 15 to 19 years | 0 (0.0%) | 0.0 |
| 20 to 34 years | 0 (0.0%) | 0.0 |
| 35 to 50 years | 6 (100.0%) | 109.0 |
| Total | 6 (100.0%) | 82.0 |
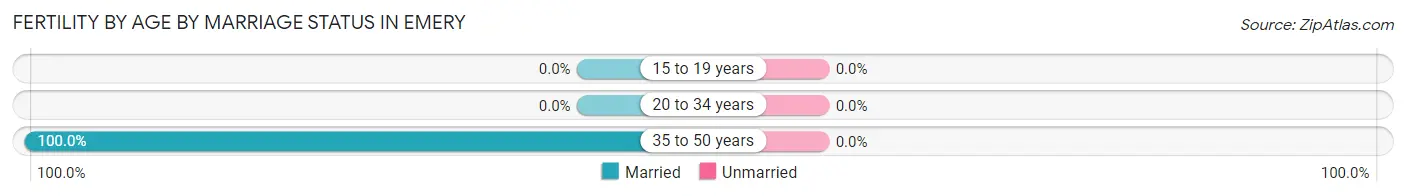
Fertility by Age by Marriage Status in Emery
| Age Bracket | Married | Unmarried |
| 15 to 19 years | 0 (0.0%) | 0 (0.0%) |
| 20 to 34 years | 0 (0.0%) | 0 (0.0%) |
| 35 to 50 years | 6 (100.0%) | 0 (0.0%) |
| Total | 6 (100.0%) | 0 (0.0%) |
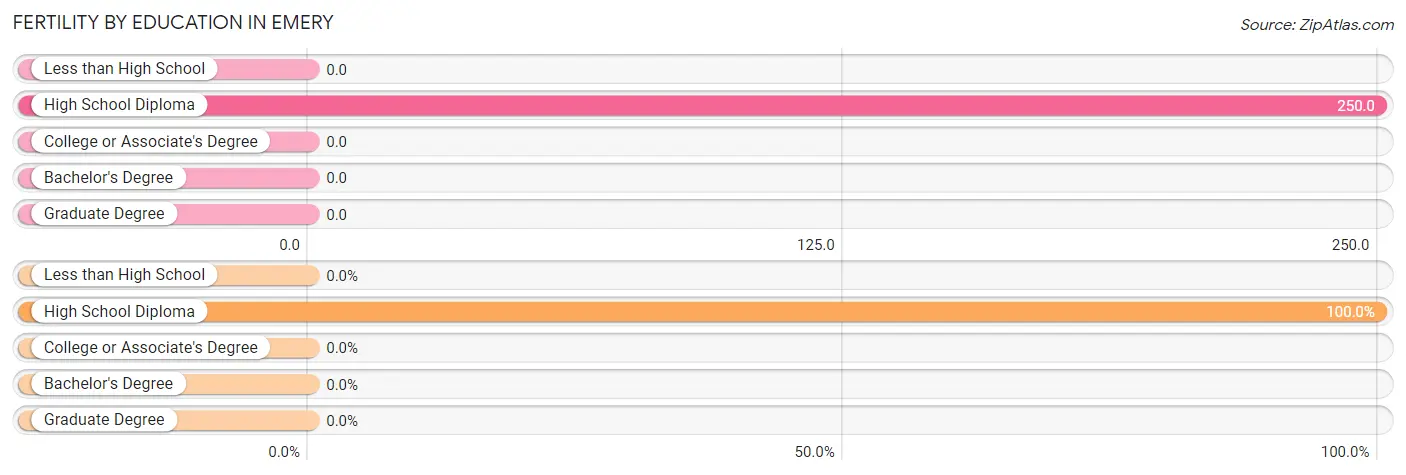
Fertility by Education in Emery
| Educational Attainment | Women with Births | Births / 1,000 Women |
| Less than High School | 0 (0.0%) | 0.0 |
| High School Diploma | 6 (100.0%) | 250.0 |
| College or Associate's Degree | 0 (0.0%) | 0.0 |
| Bachelor's Degree | 0 (0.0%) | 0.0 |
| Graduate Degree | 0 (0.0%) | 0.0 |
| Total | 6 (100.0%) | 82.0 |
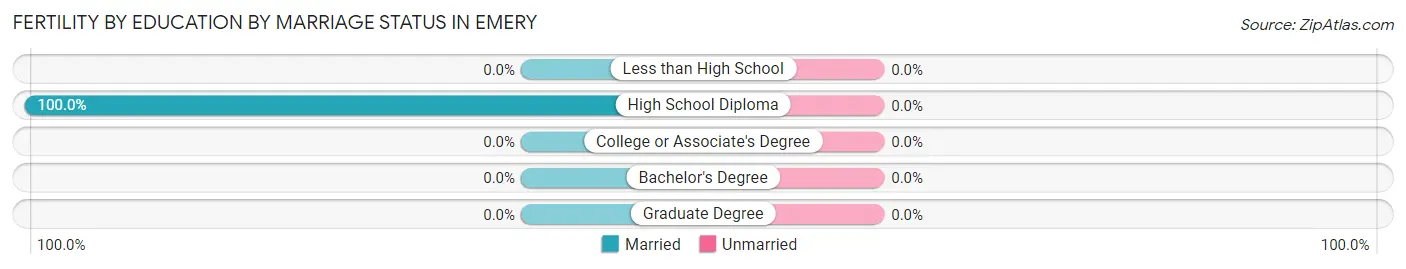
Fertility by Education by Marriage Status in Emery
| Educational Attainment | Married | Unmarried |
| Less than High School | 0 (0.0%) | 0 (0.0%) |
| High School Diploma | 6 (100.0%) | 0 (0.0%) |
| College or Associate's Degree | 0 (0.0%) | 0 (0.0%) |
| Bachelor's Degree | 0 (0.0%) | 0 (0.0%) |
| Graduate Degree | 0 (0.0%) | 0 (0.0%) |
| Total | 6 (100.0%) | 0 (0.0%) |
Employment Characteristics in Emery
Employment by Class of Employer in Emery
Among the 175 employed individuals in Emery, private company employees (119 | 68.0%), self-employed (not incorporated) (18 | 10.3%), and federal government employees (13 | 7.4%) make up the most common classes of employment.
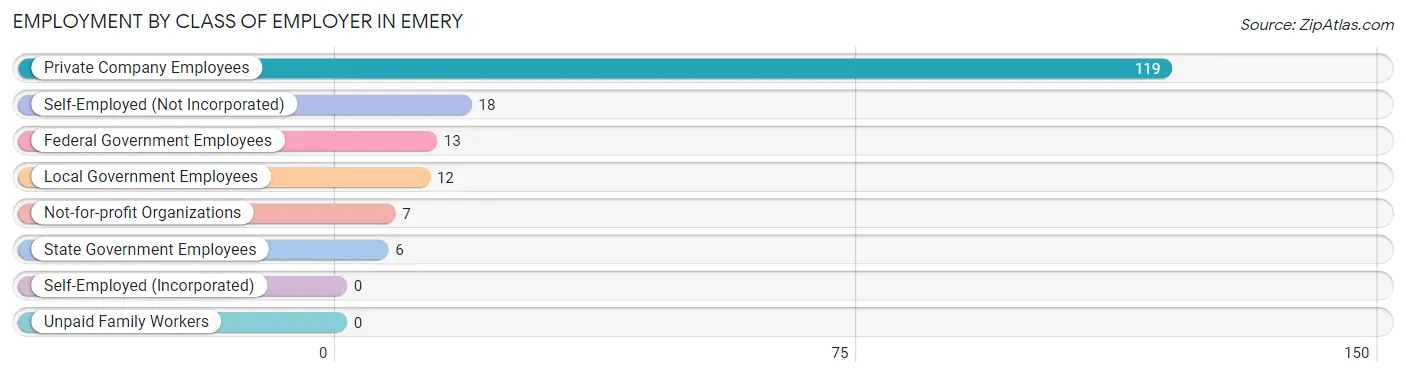
| Employer Class | # Employees | % Employees |
| Private Company Employees | 119 | 68.0% |
| Self-Employed (Incorporated) | 0 | 0.0% |
| Self-Employed (Not Incorporated) | 18 | 10.3% |
| Not-for-profit Organizations | 7 | 4.0% |
| Local Government Employees | 12 | 6.9% |
| State Government Employees | 6 | 3.4% |
| Federal Government Employees | 13 | 7.4% |
| Unpaid Family Workers | 0 | 0.0% |
| Total | 175 | 100.0% |
Employment Status by Age in Emery
According to the labor force statistics for Emery, out of the total population over 16 years of age (275), 65.1% or 179 individuals are in the labor force, with 2.2% or 4 of them unemployed. The age group with the highest labor force participation rate is 20 to 24 years, with 100.0% or 3 individuals in the labor force. Within the labor force, the 65 to 74 years age range has the highest percentage of unemployed individuals, with 15.4% or 4 of them being unemployed.
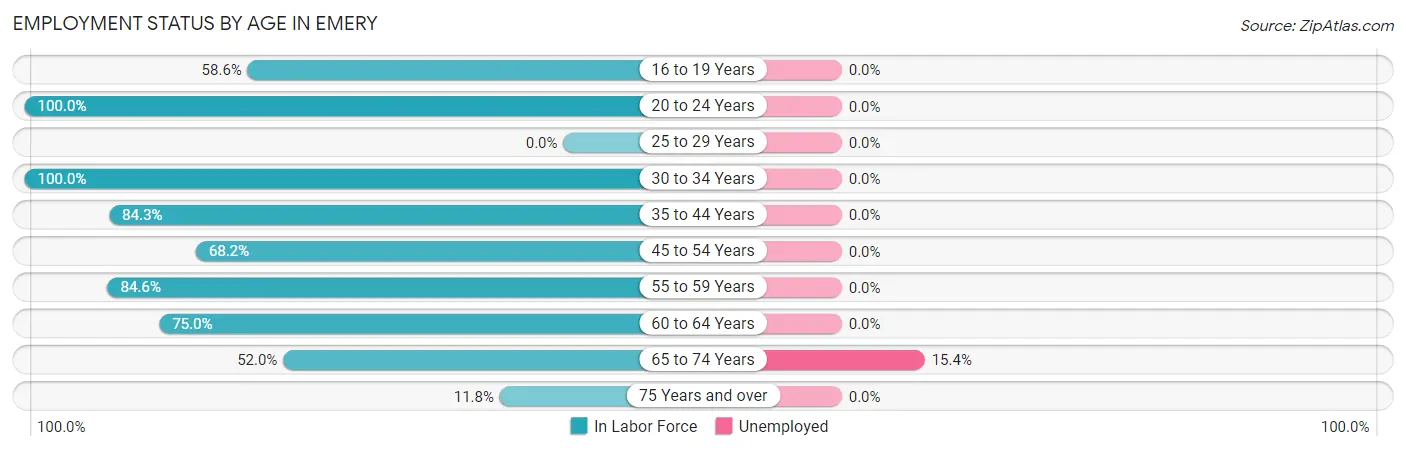
| Age Bracket | In Labor Force | Unemployed |
| 16 to 19 Years | 34 (58.6%) | 0 (0.0%) |
| 20 to 24 Years | 3 (100.0%) | 0 (0.0%) |
| 25 to 29 Years | 0 (0.0%) | 0 (0.0%) |
| 30 to 34 Years | 9 (100.0%) | 0 (0.0%) |
| 35 to 44 Years | 43 (84.3%) | 0 (0.0%) |
| 45 to 54 Years | 45 (68.2%) | 0 (0.0%) |
| 55 to 59 Years | 11 (84.6%) | 0 (0.0%) |
| 60 to 64 Years | 6 (75.0%) | 0 (0.0%) |
| 65 to 74 Years | 26 (52.0%) | 4 (15.4%) |
| 75 Years and over | 2 (11.8%) | 0 (0.0%) |
| Total | 179 (65.1%) | 4 (2.2%) |
Employment Status by Educational Attainment in Emery
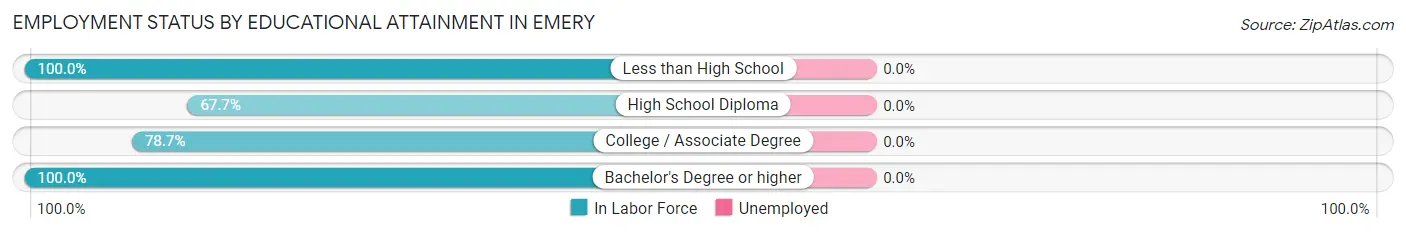
| Educational Attainment | In Labor Force | Unemployed |
| Less than High School | 1 (100.0%) | 0 (0.0%) |
| High School Diploma | 42 (67.7%) | 0 (0.0%) |
| College / Associate Degree | 48 (78.7%) | 0 (0.0%) |
| Bachelor's Degree or higher | 23 (100.0%) | 0 (0.0%) |
| Total | 114 (77.6%) | 0 (0.0%) |
Employment Occupations by Sex in Emery
Management, Business, Science and Arts Occupations
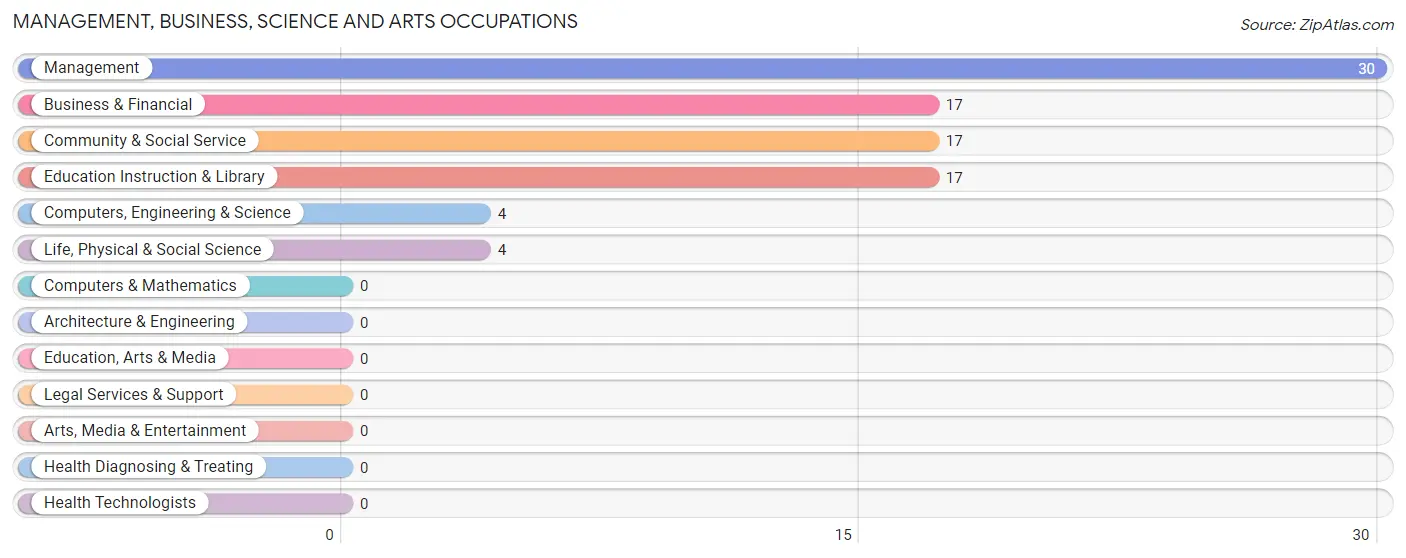
The most common Management, Business, Science and Arts occupations in Emery are Management (30 | 17.1%), Business & Financial (17 | 9.7%), Community & Social Service (17 | 9.7%), Education Instruction & Library (17 | 9.7%), and Computers, Engineering & Science (4 | 2.3%).
Management, Business, Science and Arts Occupations by Sex
Within the Management, Business, Science and Arts occupations in Emery, the most male-oriented occupations are Computers, Engineering & Science (100.0%), Life, Physical & Social Science (100.0%), and Community & Social Service (47.1%), while the most female-oriented occupations are Business & Financial (100.0%), Management (63.3%), and Community & Social Service (52.9%).
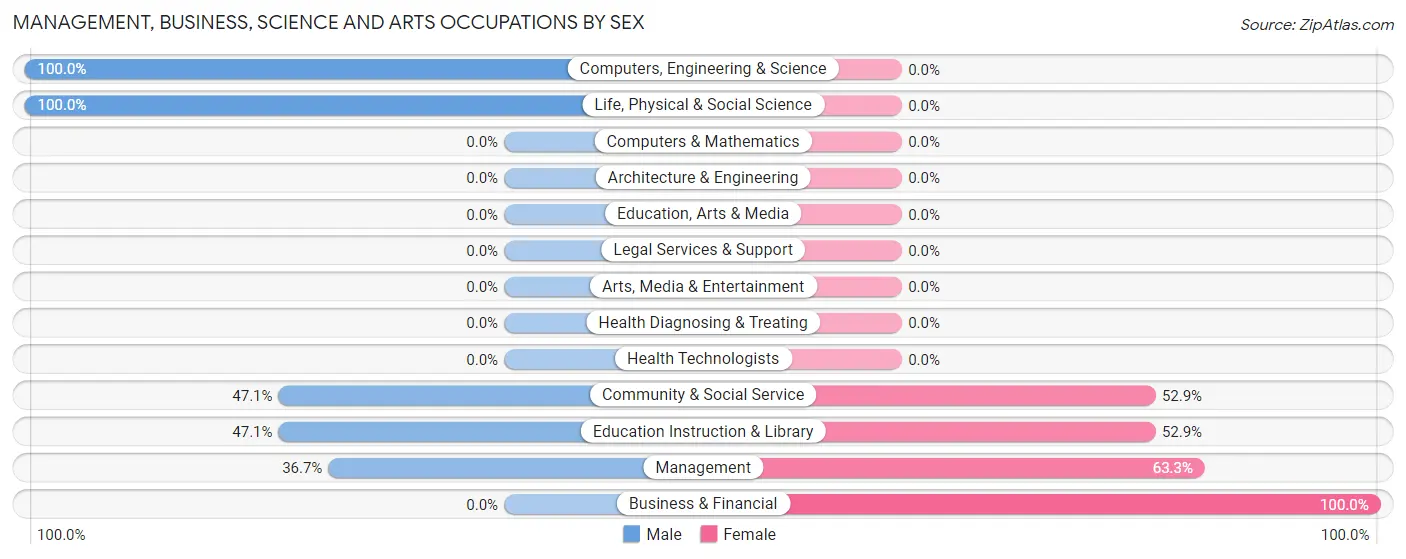
| Occupation | Male | Female |
| Management | 11 (36.7%) | 19 (63.3%) |
| Business & Financial | 0 (0.0%) | 17 (100.0%) |
| Computers, Engineering & Science | 4 (100.0%) | 0 (0.0%) |
| Computers & Mathematics | 0 (0.0%) | 0 (0.0%) |
| Architecture & Engineering | 0 (0.0%) | 0 (0.0%) |
| Life, Physical & Social Science | 4 (100.0%) | 0 (0.0%) |
| Community & Social Service | 8 (47.1%) | 9 (52.9%) |
| Education, Arts & Media | 0 (0.0%) | 0 (0.0%) |
| Legal Services & Support | 0 (0.0%) | 0 (0.0%) |
| Education Instruction & Library | 8 (47.1%) | 9 (52.9%) |
| Arts, Media & Entertainment | 0 (0.0%) | 0 (0.0%) |
| Health Diagnosing & Treating | 0 (0.0%) | 0 (0.0%) |
| Health Technologists | 0 (0.0%) | 0 (0.0%) |
| Total (Category) | 23 (33.8%) | 45 (66.2%) |
| Total (Overall) | 95 (54.3%) | 80 (45.7%) |
Services Occupations
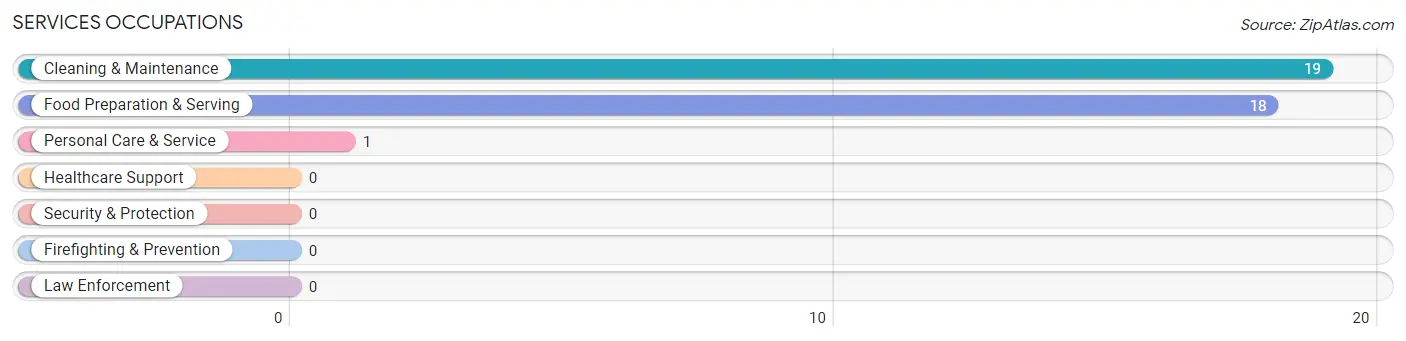
The most common Services occupations in Emery are Cleaning & Maintenance (19 | 10.9%), Food Preparation & Serving (18 | 10.3%), and Personal Care & Service (1 | 0.6%).
Services Occupations by Sex
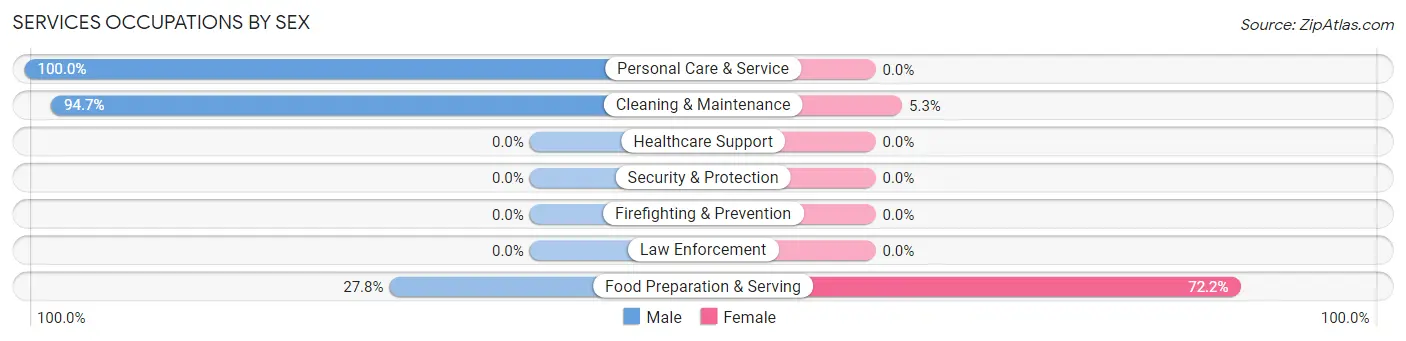
Within the Services occupations in Emery, the most male-oriented occupations are Personal Care & Service (100.0%), Cleaning & Maintenance (94.7%), and Food Preparation & Serving (27.8%), while the most female-oriented occupations are Food Preparation & Serving (72.2%), and Cleaning & Maintenance (5.3%).
| Occupation | Male | Female |
| Healthcare Support | 0 (0.0%) | 0 (0.0%) |
| Security & Protection | 0 (0.0%) | 0 (0.0%) |
| Firefighting & Prevention | 0 (0.0%) | 0 (0.0%) |
| Law Enforcement | 0 (0.0%) | 0 (0.0%) |
| Food Preparation & Serving | 5 (27.8%) | 13 (72.2%) |
| Cleaning & Maintenance | 18 (94.7%) | 1 (5.3%) |
| Personal Care & Service | 1 (100.0%) | 0 (0.0%) |
| Total (Category) | 24 (63.2%) | 14 (36.8%) |
| Total (Overall) | 95 (54.3%) | 80 (45.7%) |
Sales and Office Occupations
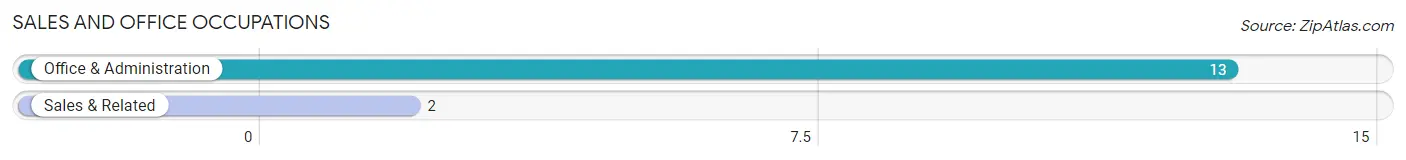
The most common Sales and Office occupations in Emery are Office & Administration (13 | 7.4%), and Sales & Related (2 | 1.1%).
Sales and Office Occupations by Sex
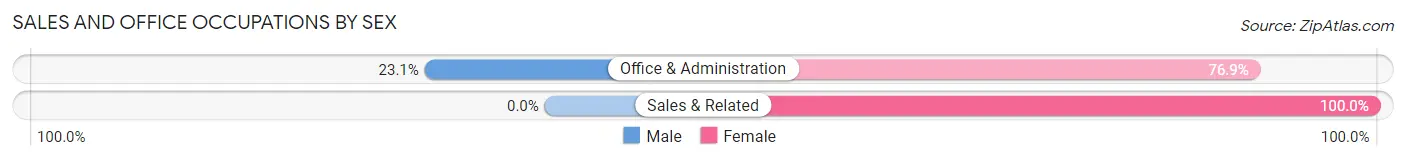
| Occupation | Male | Female |
| Sales & Related | 0 (0.0%) | 2 (100.0%) |
| Office & Administration | 3 (23.1%) | 10 (76.9%) |
| Total (Category) | 3 (20.0%) | 12 (80.0%) |
| Total (Overall) | 95 (54.3%) | 80 (45.7%) |
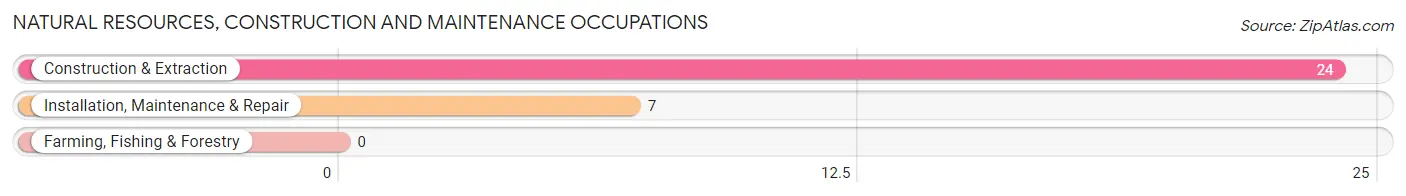
Natural Resources, Construction and Maintenance Occupations
The most common Natural Resources, Construction and Maintenance occupations in Emery are Construction & Extraction (24 | 13.7%), and Installation, Maintenance & Repair (7 | 4.0%).
Natural Resources, Construction and Maintenance Occupations by Sex
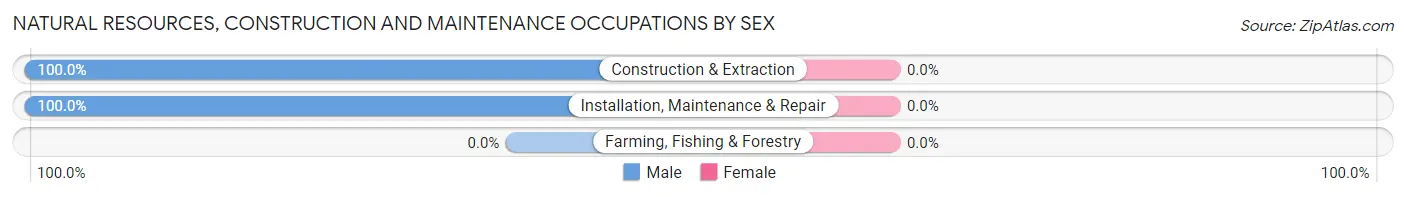
| Occupation | Male | Female |
| Farming, Fishing & Forestry | 0 (0.0%) | 0 (0.0%) |
| Construction & Extraction | 24 (100.0%) | 0 (0.0%) |
| Installation, Maintenance & Repair | 7 (100.0%) | 0 (0.0%) |
| Total (Category) | 31 (100.0%) | 0 (0.0%) |
| Total (Overall) | 95 (54.3%) | 80 (45.7%) |
Production, Transportation and Moving Occupations
The most common Production, Transportation and Moving occupations in Emery are Material Moving (12 | 6.9%), Transportation (10 | 5.7%), and Production (1 | 0.6%).
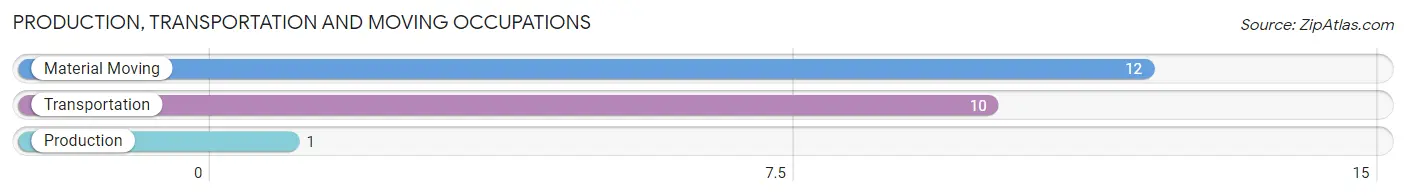
Production, Transportation and Moving Occupations by Sex
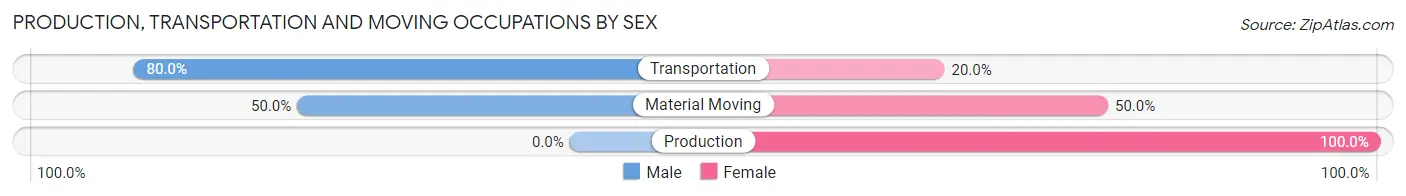
| Occupation | Male | Female |
| Production | 0 (0.0%) | 1 (100.0%) |
| Transportation | 8 (80.0%) | 2 (20.0%) |
| Material Moving | 6 (50.0%) | 6 (50.0%) |
| Total (Category) | 14 (60.9%) | 9 (39.1%) |
| Total (Overall) | 95 (54.3%) | 80 (45.7%) |
Employment Industries by Sex in Emery
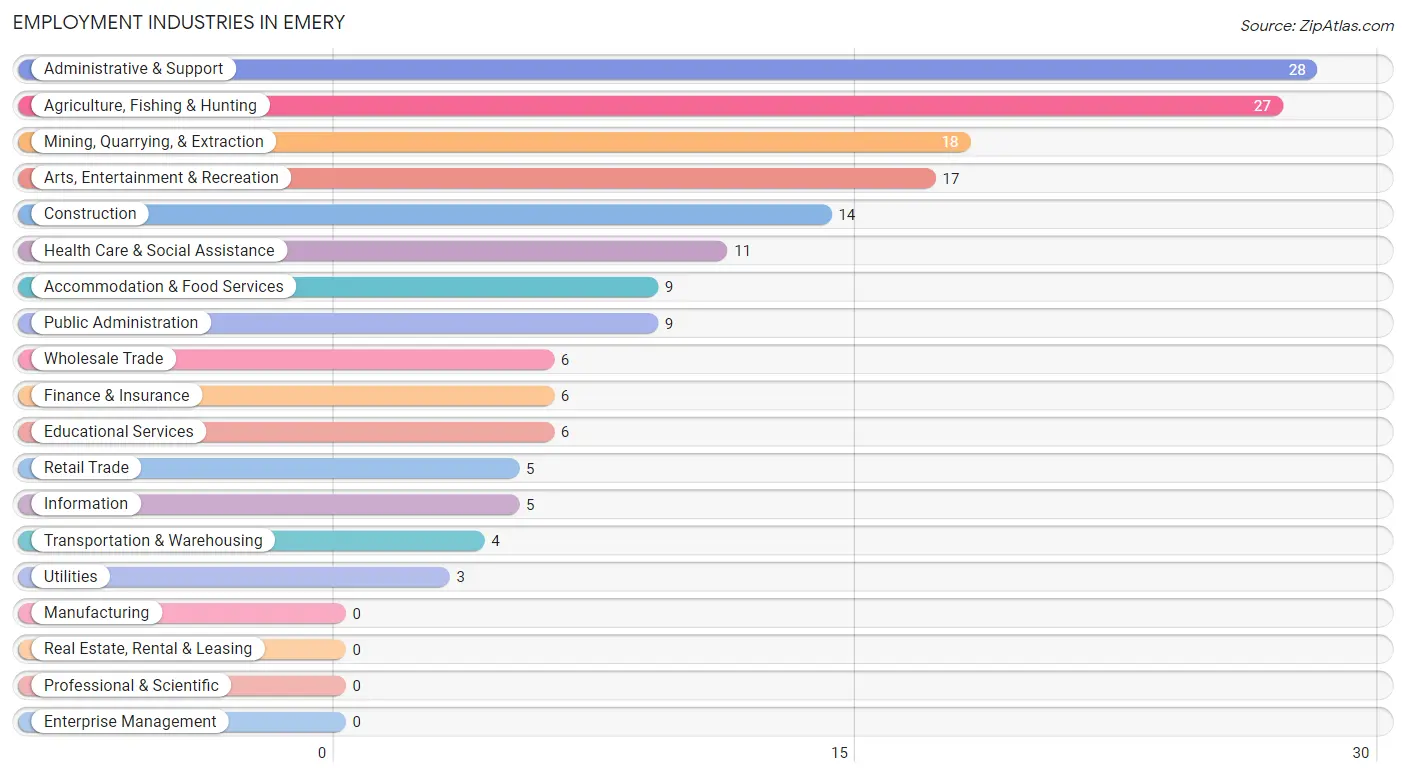
Employment Industries in Emery
The major employment industries in Emery include Administrative & Support (28 | 16.0%), Agriculture, Fishing & Hunting (27 | 15.4%), Mining, Quarrying, & Extraction (18 | 10.3%), Arts, Entertainment & Recreation (17 | 9.7%), and Construction (14 | 8.0%).
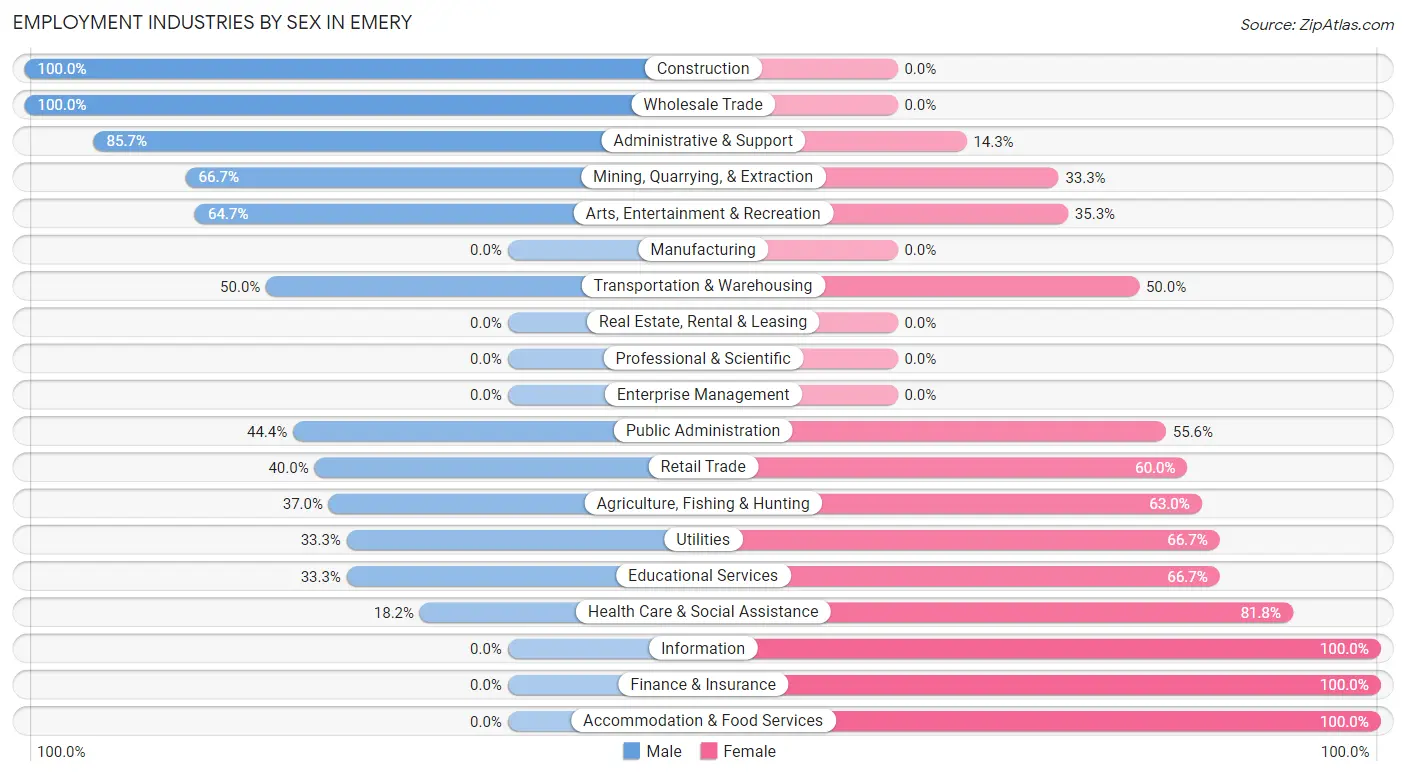
Employment Industries by Sex in Emery
The Emery industries that see more men than women are Construction (100.0%), Wholesale Trade (100.0%), and Administrative & Support (85.7%), whereas the industries that tend to have a higher number of women are Information (100.0%), Finance & Insurance (100.0%), and Accommodation & Food Services (100.0%).
| Industry | Male | Female |
| Agriculture, Fishing & Hunting | 10 (37.0%) | 17 (63.0%) |
| Mining, Quarrying, & Extraction | 12 (66.7%) | 6 (33.3%) |
| Construction | 14 (100.0%) | 0 (0.0%) |
| Manufacturing | 0 (0.0%) | 0 (0.0%) |
| Wholesale Trade | 6 (100.0%) | 0 (0.0%) |
| Retail Trade | 2 (40.0%) | 3 (60.0%) |
| Transportation & Warehousing | 2 (50.0%) | 2 (50.0%) |
| Utilities | 1 (33.3%) | 2 (66.7%) |
| Information | 0 (0.0%) | 5 (100.0%) |
| Finance & Insurance | 0 (0.0%) | 6 (100.0%) |
| Real Estate, Rental & Leasing | 0 (0.0%) | 0 (0.0%) |
| Professional & Scientific | 0 (0.0%) | 0 (0.0%) |
| Enterprise Management | 0 (0.0%) | 0 (0.0%) |
| Administrative & Support | 24 (85.7%) | 4 (14.3%) |
| Educational Services | 2 (33.3%) | 4 (66.7%) |
| Health Care & Social Assistance | 2 (18.2%) | 9 (81.8%) |
| Arts, Entertainment & Recreation | 11 (64.7%) | 6 (35.3%) |
| Accommodation & Food Services | 0 (0.0%) | 9 (100.0%) |
| Public Administration | 4 (44.4%) | 5 (55.6%) |
| Total | 95 (54.3%) | 80 (45.7%) |
Education in Emery
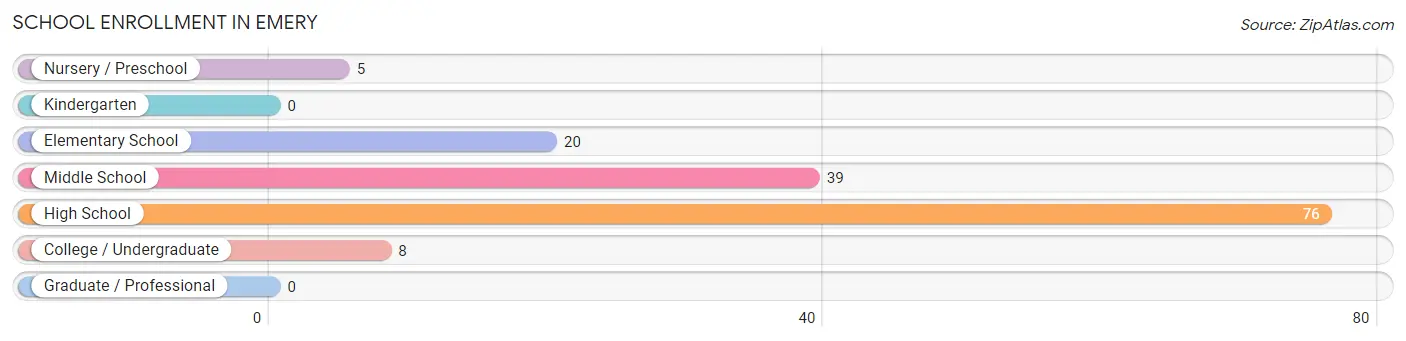
School Enrollment in Emery
The most common levels of schooling among the 148 students in Emery are high school (76 | 51.3%), middle school (39 | 26.4%), and elementary school (20 | 13.5%).
| School Level | # Students | % Students |
| Nursery / Preschool | 5 | 3.4% |
| Kindergarten | 0 | 0.0% |
| Elementary School | 20 | 13.5% |
| Middle School | 39 | 26.4% |
| High School | 76 | 51.3% |
| College / Undergraduate | 8 | 5.4% |
| Graduate / Professional | 0 | 0.0% |
| Total | 148 | 100.0% |
School Enrollment by Age by Funding Source in Emery
Out of a total of 148 students who are enrolled in schools in Emery, 9 (6.1%) attend a private institution, while the remaining 139 (93.9%) are enrolled in public schools. The age group of 5 to 9 year old has the highest likelihood of being enrolled in private schools, with 5 (35.7% in the age bracket) enrolled. Conversely, the age group of 15 to 17 year olds has the lowest likelihood of being enrolled in a private school, with 67 (100.0% in the age bracket) attending a public institution.
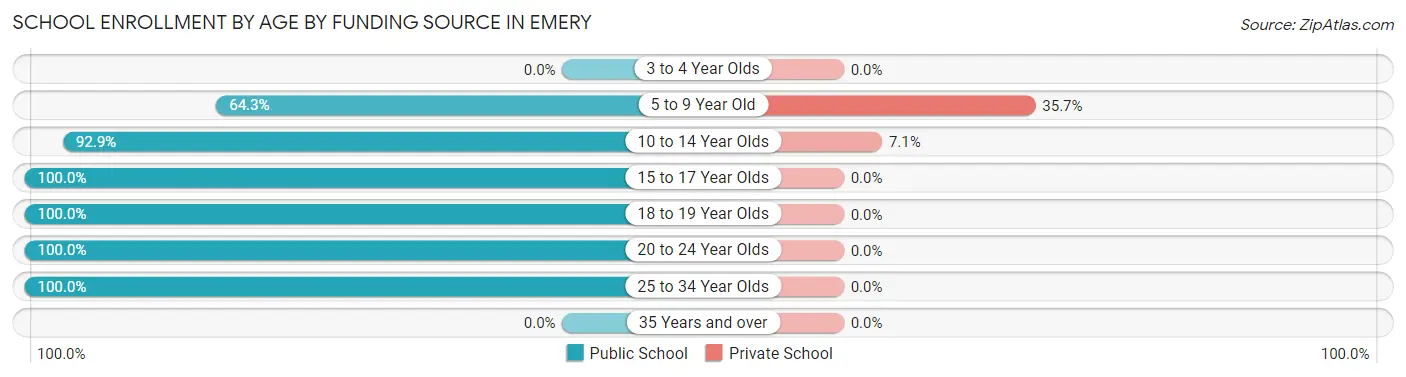
| Age Bracket | Public School | Private School |
| 3 to 4 Year Olds | 0 (0.0%) | 0 (0.0%) |
| 5 to 9 Year Old | 9 (64.3%) | 5 (35.7%) |
| 10 to 14 Year Olds | 52 (92.9%) | 4 (7.1%) |
| 15 to 17 Year Olds | 67 (100.0%) | 0 (0.0%) |
| 18 to 19 Year Olds | 3 (100.0%) | 0 (0.0%) |
| 20 to 24 Year Olds | 3 (100.0%) | 0 (0.0%) |
| 25 to 34 Year Olds | 5 (100.0%) | 0 (0.0%) |
| 35 Years and over | 0 (0.0%) | 0 (0.0%) |
| Total | 139 (93.9%) | 9 (6.1%) |
Educational Attainment by Field of Study in Emery
Bio, nature & agricultural (11 | 31.4%), education (7 | 20.0%), social sciences (6 | 17.1%), business (4 | 11.4%), and arts & humanities (3 | 8.6%) are the most common fields of study among 35 individuals in Emery who have obtained a bachelor's degree or higher.
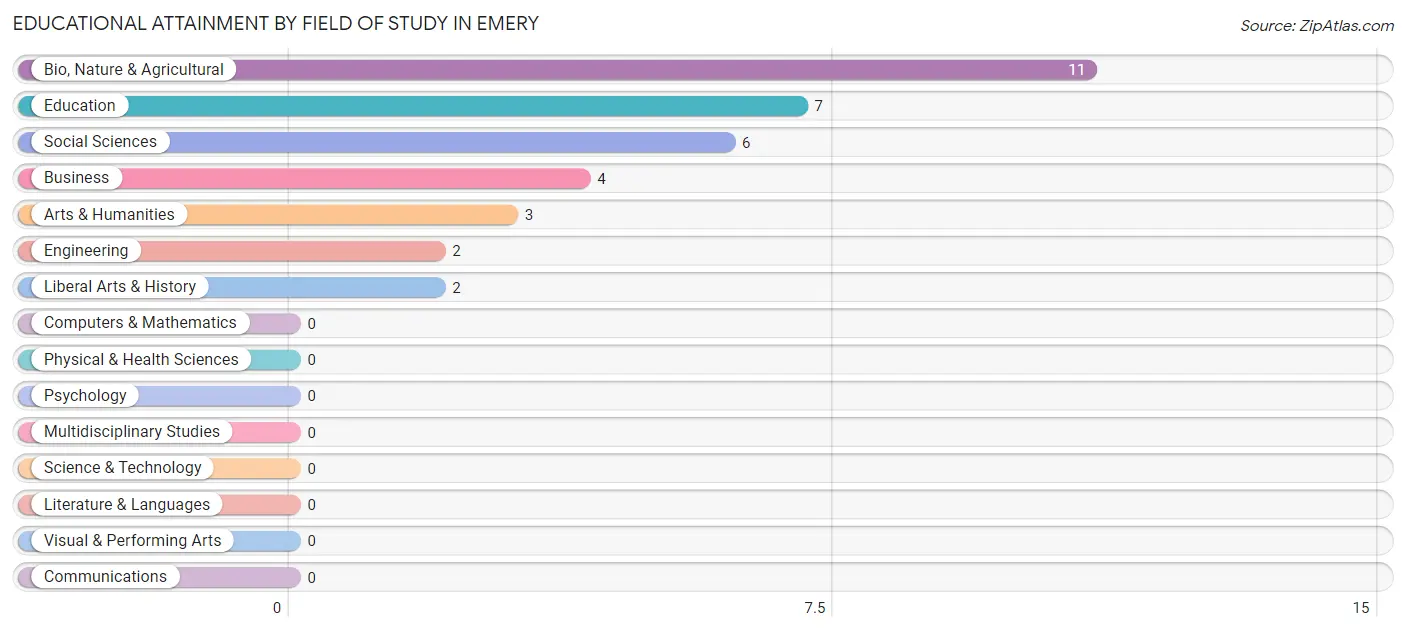
| Field of Study | # Graduates | % Graduates |
| Computers & Mathematics | 0 | 0.0% |
| Bio, Nature & Agricultural | 11 | 31.4% |
| Physical & Health Sciences | 0 | 0.0% |
| Psychology | 0 | 0.0% |
| Social Sciences | 6 | 17.1% |
| Engineering | 2 | 5.7% |
| Multidisciplinary Studies | 0 | 0.0% |
| Science & Technology | 0 | 0.0% |
| Business | 4 | 11.4% |
| Education | 7 | 20.0% |
| Literature & Languages | 0 | 0.0% |
| Liberal Arts & History | 2 | 5.7% |
| Visual & Performing Arts | 0 | 0.0% |
| Communications | 0 | 0.0% |
| Arts & Humanities | 3 | 8.6% |
| Total | 35 | 100.0% |
Transportation & Commute in Emery
Vehicle Availability by Sex in Emery
The most prevalent vehicle ownership categories in Emery are males with 5 or more vehicles (28, accounting for 33.7%) and females with 5 or more vehicles (21, making up 35.0%).
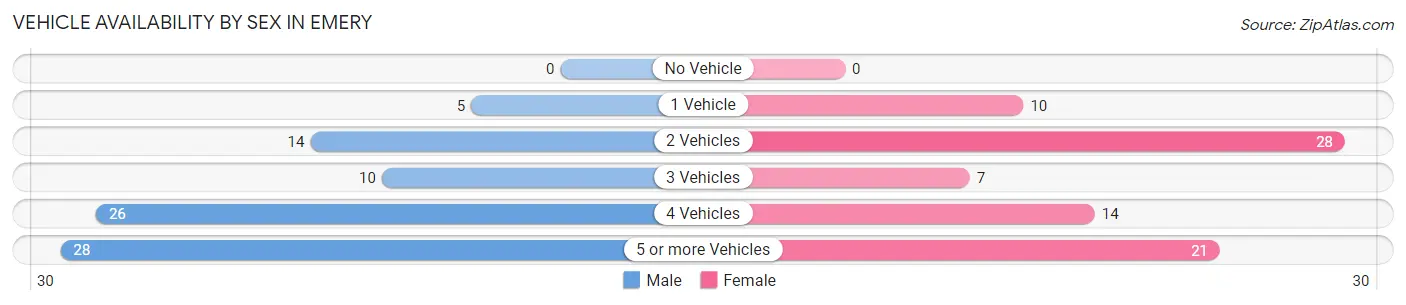
| Vehicles Available | Male | Female |
| No Vehicle | 0 (0.0%) | 0 (0.0%) |
| 1 Vehicle | 5 (6.0%) | 10 (12.5%) |
| 2 Vehicles | 14 (16.9%) | 28 (35.0%) |
| 3 Vehicles | 10 (12.0%) | 7 (8.7%) |
| 4 Vehicles | 26 (31.3%) | 14 (17.5%) |
| 5 or more Vehicles | 28 (33.7%) | 21 (26.3%) |
| Total | 83 (100.0%) | 80 (100.0%) |
Commute Time in Emery
The most frequently occuring commute durations in Emery are 15 to 19 minutes (33 commuters, 21.7%), 30 to 34 minutes (31 commuters, 20.4%), and 10 to 14 minutes (21 commuters, 13.8%).
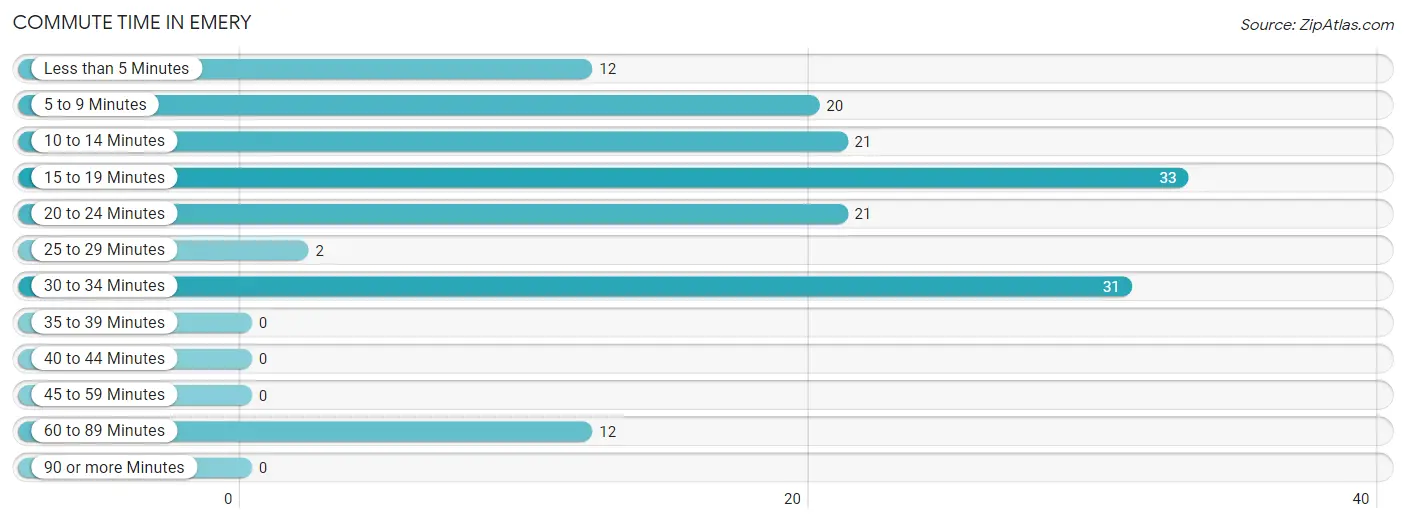
| Commute Time | # Commuters | % Commuters |
| Less than 5 Minutes | 12 | 7.9% |
| 5 to 9 Minutes | 20 | 13.2% |
| 10 to 14 Minutes | 21 | 13.8% |
| 15 to 19 Minutes | 33 | 21.7% |
| 20 to 24 Minutes | 21 | 13.8% |
| 25 to 29 Minutes | 2 | 1.3% |
| 30 to 34 Minutes | 31 | 20.4% |
| 35 to 39 Minutes | 0 | 0.0% |
| 40 to 44 Minutes | 0 | 0.0% |
| 45 to 59 Minutes | 0 | 0.0% |
| 60 to 89 Minutes | 12 | 7.9% |
| 90 or more Minutes | 0 | 0.0% |
Commute Time by Sex in Emery
The most common commute times in Emery are 15 to 19 minutes (31 commuters, 33.0%) for males and 5 to 9 minutes (17 commuters, 29.3%) for females.
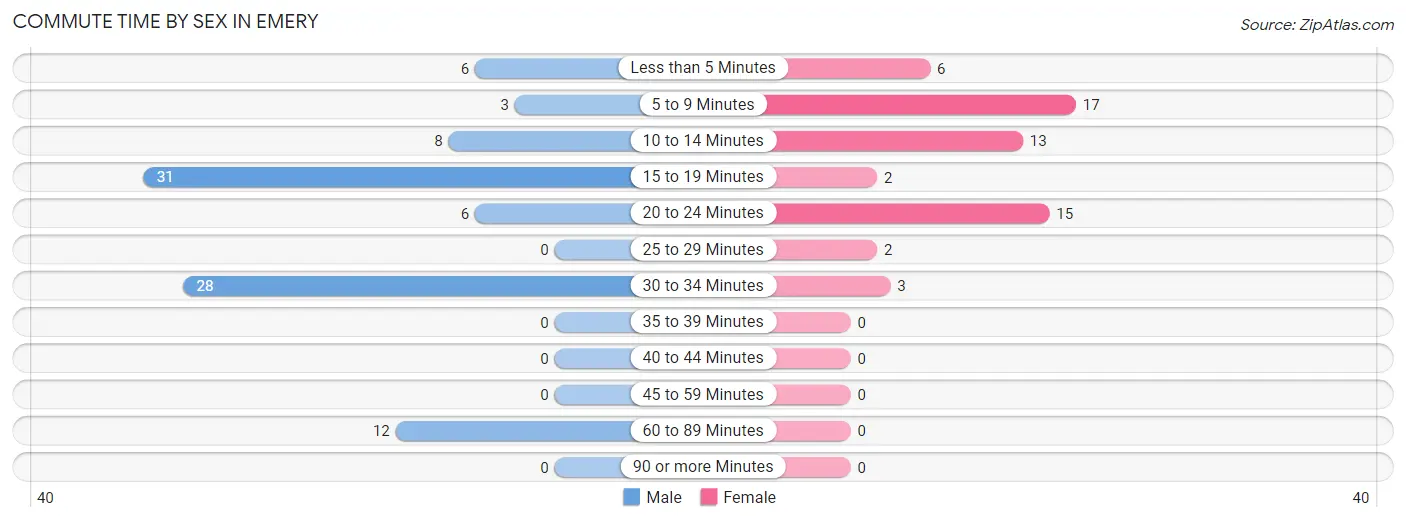
| Commute Time | Male | Female |
| Less than 5 Minutes | 6 (6.4%) | 6 (10.3%) |
| 5 to 9 Minutes | 3 (3.2%) | 17 (29.3%) |
| 10 to 14 Minutes | 8 (8.5%) | 13 (22.4%) |
| 15 to 19 Minutes | 31 (33.0%) | 2 (3.5%) |
| 20 to 24 Minutes | 6 (6.4%) | 15 (25.9%) |
| 25 to 29 Minutes | 0 (0.0%) | 2 (3.5%) |
| 30 to 34 Minutes | 28 (29.8%) | 3 (5.2%) |
| 35 to 39 Minutes | 0 (0.0%) | 0 (0.0%) |
| 40 to 44 Minutes | 0 (0.0%) | 0 (0.0%) |
| 45 to 59 Minutes | 0 (0.0%) | 0 (0.0%) |
| 60 to 89 Minutes | 12 (12.8%) | 0 (0.0%) |
| 90 or more Minutes | 0 (0.0%) | 0 (0.0%) |
Time of Departure to Work by Sex in Emery
The most frequent times of departure to work in Emery are 9:00 AM to 9:59 AM (19, 20.2%) for males and 6:30 AM to 6:59 AM (14, 24.1%) for females.
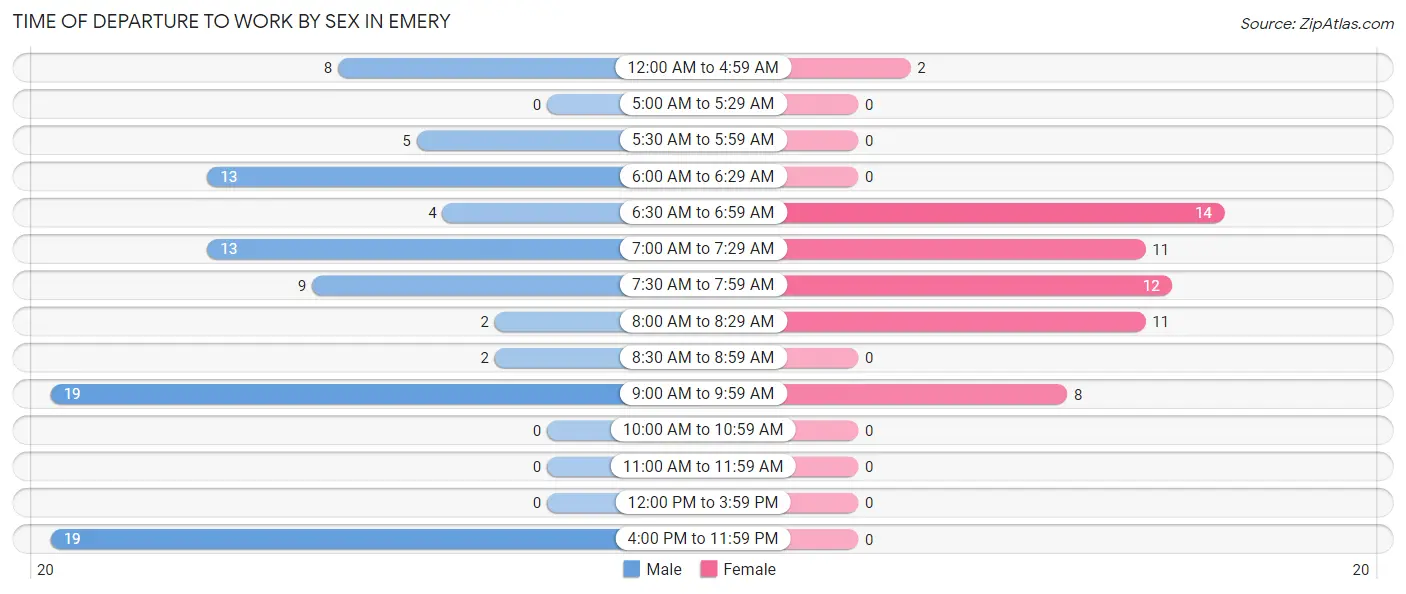
| Time of Departure | Male | Female |
| 12:00 AM to 4:59 AM | 8 (8.5%) | 2 (3.5%) |
| 5:00 AM to 5:29 AM | 0 (0.0%) | 0 (0.0%) |
| 5:30 AM to 5:59 AM | 5 (5.3%) | 0 (0.0%) |
| 6:00 AM to 6:29 AM | 13 (13.8%) | 0 (0.0%) |
| 6:30 AM to 6:59 AM | 4 (4.3%) | 14 (24.1%) |
| 7:00 AM to 7:29 AM | 13 (13.8%) | 11 (19.0%) |
| 7:30 AM to 7:59 AM | 9 (9.6%) | 12 (20.7%) |
| 8:00 AM to 8:29 AM | 2 (2.1%) | 11 (19.0%) |
| 8:30 AM to 8:59 AM | 2 (2.1%) | 0 (0.0%) |
| 9:00 AM to 9:59 AM | 19 (20.2%) | 8 (13.8%) |
| 10:00 AM to 10:59 AM | 0 (0.0%) | 0 (0.0%) |
| 11:00 AM to 11:59 AM | 0 (0.0%) | 0 (0.0%) |
| 12:00 PM to 3:59 PM | 0 (0.0%) | 0 (0.0%) |
| 4:00 PM to 11:59 PM | 19 (20.2%) | 0 (0.0%) |
| Total | 94 (100.0%) | 58 (100.0%) |
Housing Occupancy in Emery
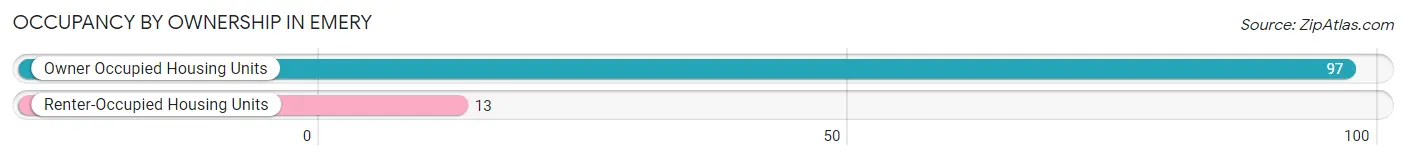
Occupancy by Ownership in Emery
Of the total 110 dwellings in Emery, owner-occupied units account for 97 (88.2%), while renter-occupied units make up 13 (11.8%).
| Occupancy | # Housing Units | % Housing Units |
| Owner Occupied Housing Units | 97 | 88.2% |
| Renter-Occupied Housing Units | 13 | 11.8% |
| Total Occupied Housing Units | 110 | 100.0% |
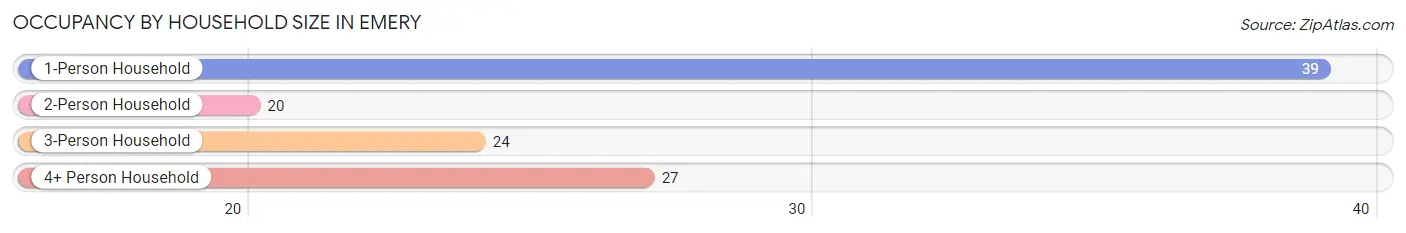
Occupancy by Household Size in Emery
| Household Size | # Housing Units | % Housing Units |
| 1-Person Household | 39 | 35.4% |
| 2-Person Household | 20 | 18.2% |
| 3-Person Household | 24 | 21.8% |
| 4+ Person Household | 27 | 24.5% |
| Total Housing Units | 110 | 100.0% |
Occupancy by Ownership by Household Size in Emery
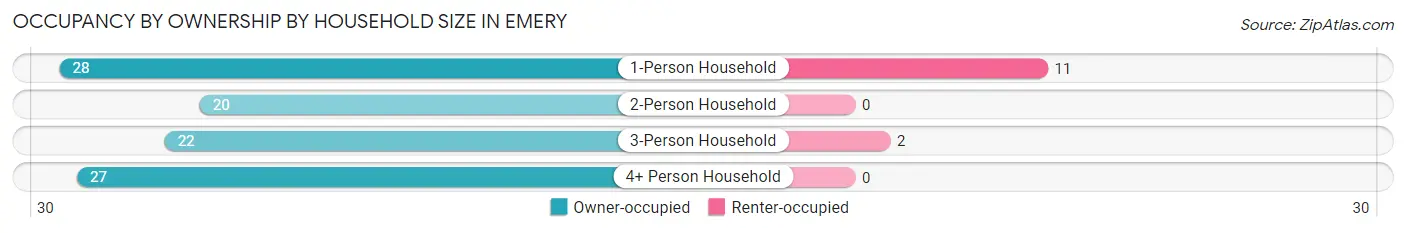
| Household Size | Owner-occupied | Renter-occupied |
| 1-Person Household | 28 (71.8%) | 11 (28.2%) |
| 2-Person Household | 20 (100.0%) | 0 (0.0%) |
| 3-Person Household | 22 (91.7%) | 2 (8.3%) |
| 4+ Person Household | 27 (100.0%) | 0 (0.0%) |
| Total Housing Units | 97 (88.2%) | 13 (11.8%) |
Occupancy by Educational Attainment in Emery
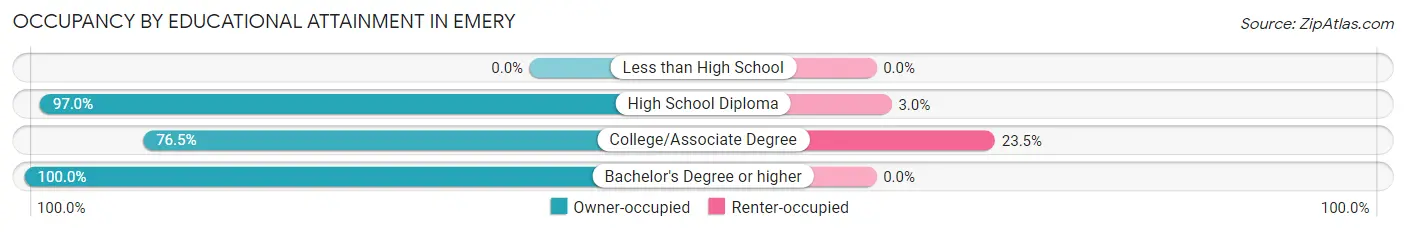
| Household Size | Owner-occupied | Renter-occupied |
| Less than High School | 0 (0.0%) | 0 (0.0%) |
| High School Diploma | 32 (97.0%) | 1 (3.0%) |
| College/Associate Degree | 39 (76.5%) | 12 (23.5%) |
| Bachelor's Degree or higher | 26 (100.0%) | 0 (0.0%) |
Occupancy by Age of Householder in Emery
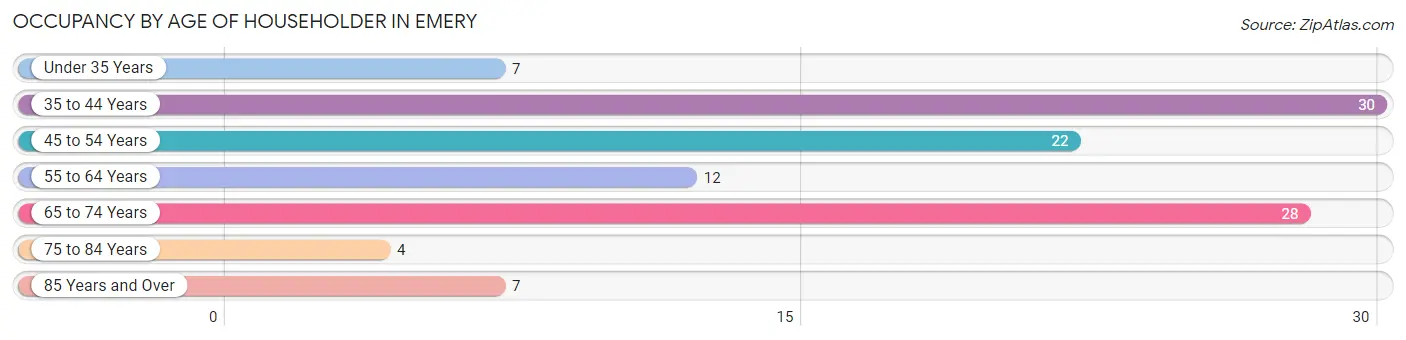
| Age Bracket | # Households | % Households |
| Under 35 Years | 7 | 6.4% |
| 35 to 44 Years | 30 | 27.3% |
| 45 to 54 Years | 22 | 20.0% |
| 55 to 64 Years | 12 | 10.9% |
| 65 to 74 Years | 28 | 25.5% |
| 75 to 84 Years | 4 | 3.6% |
| 85 Years and Over | 7 | 6.4% |
| Total | 110 | 100.0% |
Housing Finances in Emery
Median Income by Occupancy in Emery
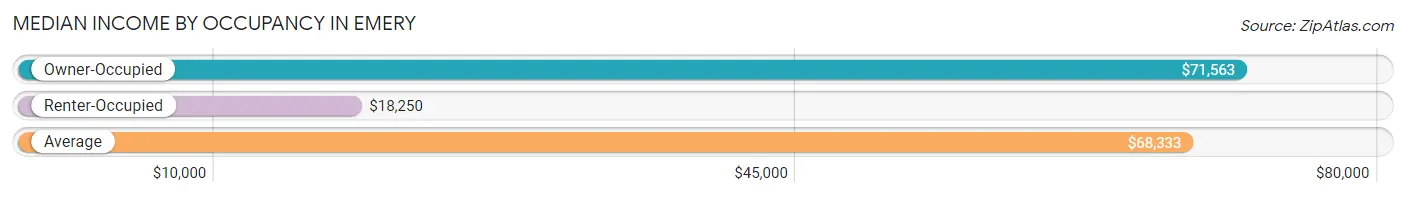
| Occupancy Type | # Households | Median Income |
| Owner-Occupied | 97 (88.2%) | $71,563 |
| Renter-Occupied | 13 (11.8%) | $18,250 |
| Average | 110 (100.0%) | $68,333 |
Occupancy by Householder Income Bracket in Emery
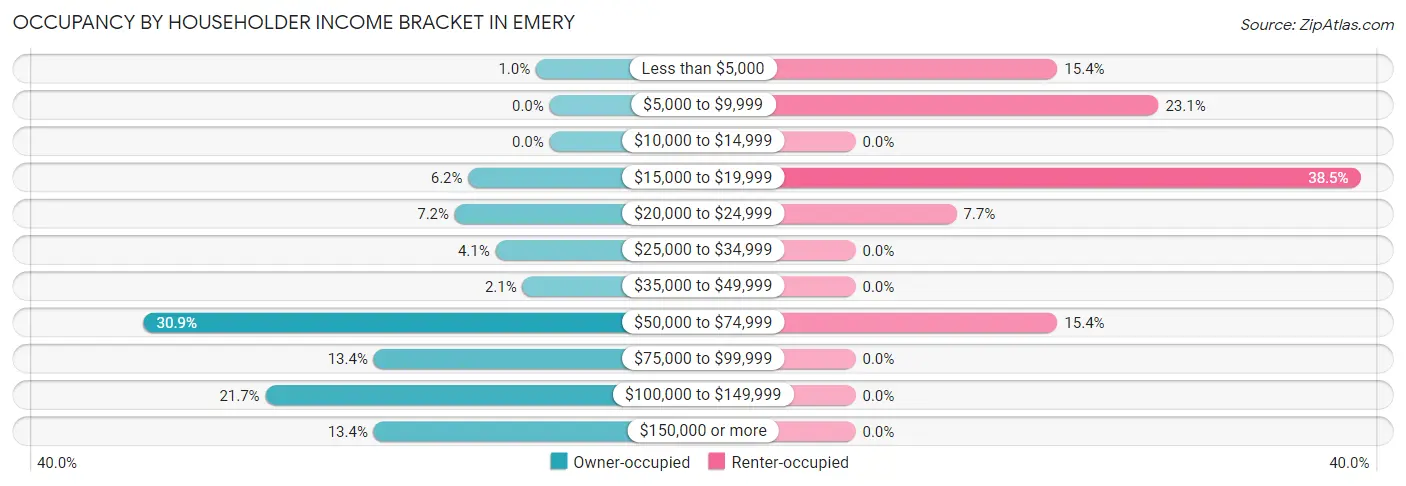
| Income Bracket | Owner-occupied | Renter-occupied |
| Less than $5,000 | 1 (1.0%) | 2 (15.4%) |
| $5,000 to $9,999 | 0 (0.0%) | 3 (23.1%) |
| $10,000 to $14,999 | 0 (0.0%) | 0 (0.0%) |
| $15,000 to $19,999 | 6 (6.2%) | 5 (38.5%) |
| $20,000 to $24,999 | 7 (7.2%) | 1 (7.7%) |
| $25,000 to $34,999 | 4 (4.1%) | 0 (0.0%) |
| $35,000 to $49,999 | 2 (2.1%) | 0 (0.0%) |
| $50,000 to $74,999 | 30 (30.9%) | 2 (15.4%) |
| $75,000 to $99,999 | 13 (13.4%) | 0 (0.0%) |
| $100,000 to $149,999 | 21 (21.6%) | 0 (0.0%) |
| $150,000 or more | 13 (13.4%) | 0 (0.0%) |
| Total | 97 (100.0%) | 13 (100.0%) |
Monthly Housing Cost Tiers in Emery
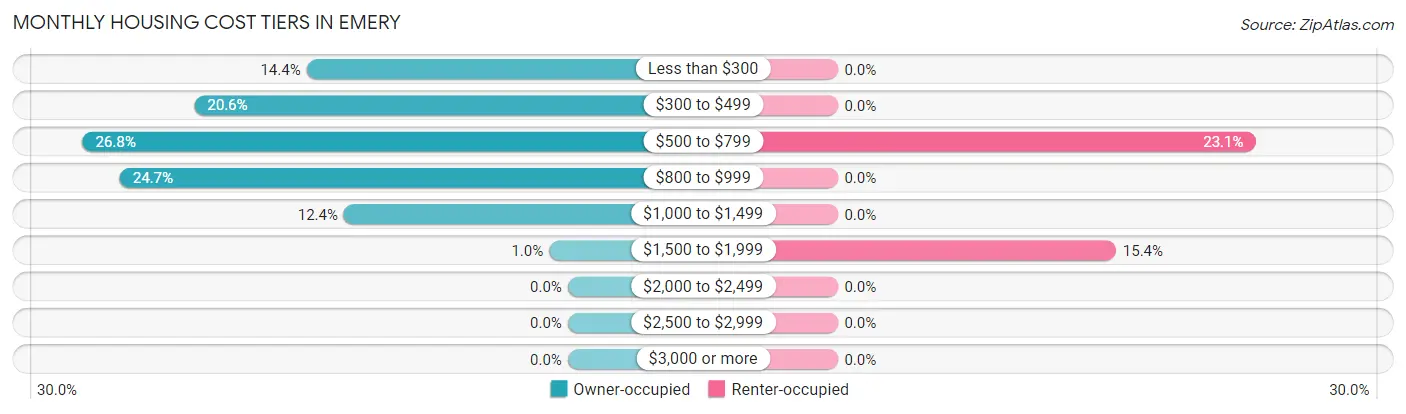
| Monthly Cost | Owner-occupied | Renter-occupied |
| Less than $300 | 14 (14.4%) | 0 (0.0%) |
| $300 to $499 | 20 (20.6%) | 0 (0.0%) |
| $500 to $799 | 26 (26.8%) | 3 (23.1%) |
| $800 to $999 | 24 (24.7%) | 0 (0.0%) |
| $1,000 to $1,499 | 12 (12.4%) | 0 (0.0%) |
| $1,500 to $1,999 | 1 (1.0%) | 2 (15.4%) |
| $2,000 to $2,499 | 0 (0.0%) | 0 (0.0%) |
| $2,500 to $2,999 | 0 (0.0%) | 0 (0.0%) |
| $3,000 or more | 0 (0.0%) | 0 (0.0%) |
| Total | 97 (100.0%) | 13 (100.0%) |
Physical Housing Characteristics in Emery
Housing Structures in Emery
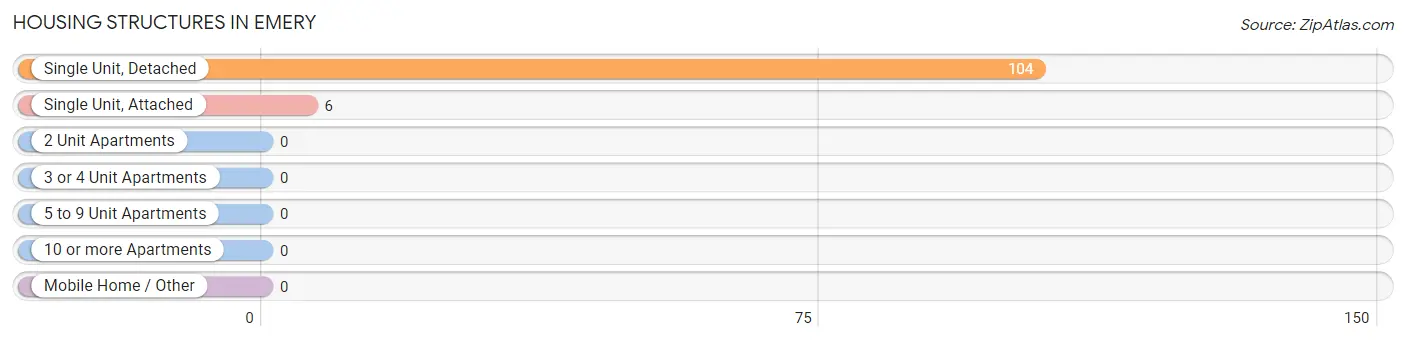
| Structure Type | # Housing Units | % Housing Units |
| Single Unit, Detached | 104 | 94.6% |
| Single Unit, Attached | 6 | 5.4% |
| 2 Unit Apartments | 0 | 0.0% |
| 3 or 4 Unit Apartments | 0 | 0.0% |
| 5 to 9 Unit Apartments | 0 | 0.0% |
| 10 or more Apartments | 0 | 0.0% |
| Mobile Home / Other | 0 | 0.0% |
| Total | 110 | 100.0% |
Housing Structures by Occupancy in Emery
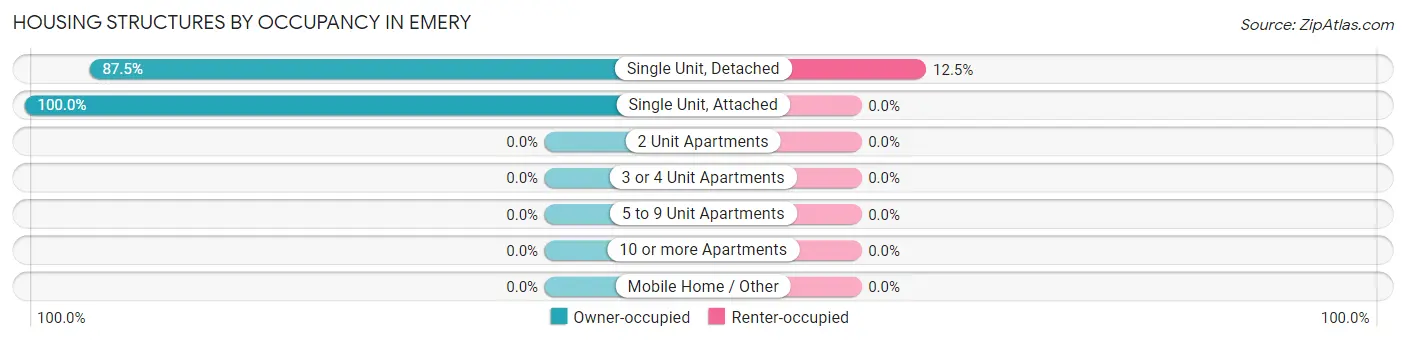
| Structure Type | Owner-occupied | Renter-occupied |
| Single Unit, Detached | 91 (87.5%) | 13 (12.5%) |
| Single Unit, Attached | 6 (100.0%) | 0 (0.0%) |
| 2 Unit Apartments | 0 (0.0%) | 0 (0.0%) |
| 3 or 4 Unit Apartments | 0 (0.0%) | 0 (0.0%) |
| 5 to 9 Unit Apartments | 0 (0.0%) | 0 (0.0%) |
| 10 or more Apartments | 0 (0.0%) | 0 (0.0%) |
| Mobile Home / Other | 0 (0.0%) | 0 (0.0%) |
| Total | 97 (88.2%) | 13 (11.8%) |
Housing Structures by Number of Rooms in Emery
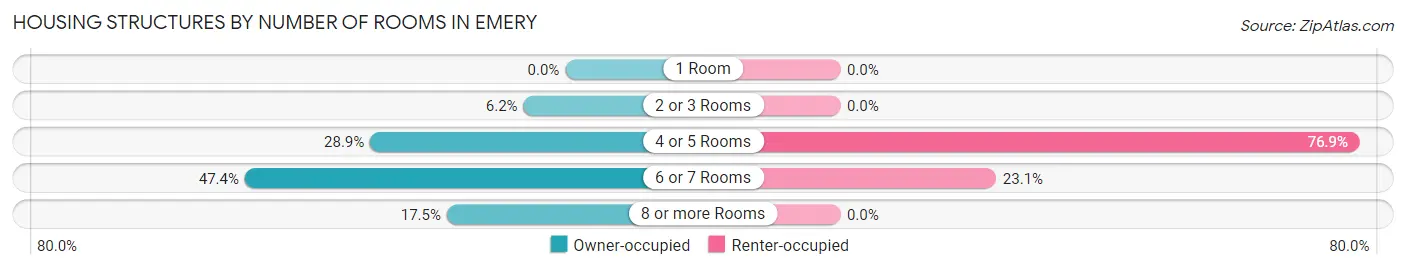
| Number of Rooms | Owner-occupied | Renter-occupied |
| 1 Room | 0 (0.0%) | 0 (0.0%) |
| 2 or 3 Rooms | 6 (6.2%) | 0 (0.0%) |
| 4 or 5 Rooms | 28 (28.9%) | 10 (76.9%) |
| 6 or 7 Rooms | 46 (47.4%) | 3 (23.1%) |
| 8 or more Rooms | 17 (17.5%) | 0 (0.0%) |
| Total | 97 (100.0%) | 13 (100.0%) |
Housing Structure by Heating Type in Emery
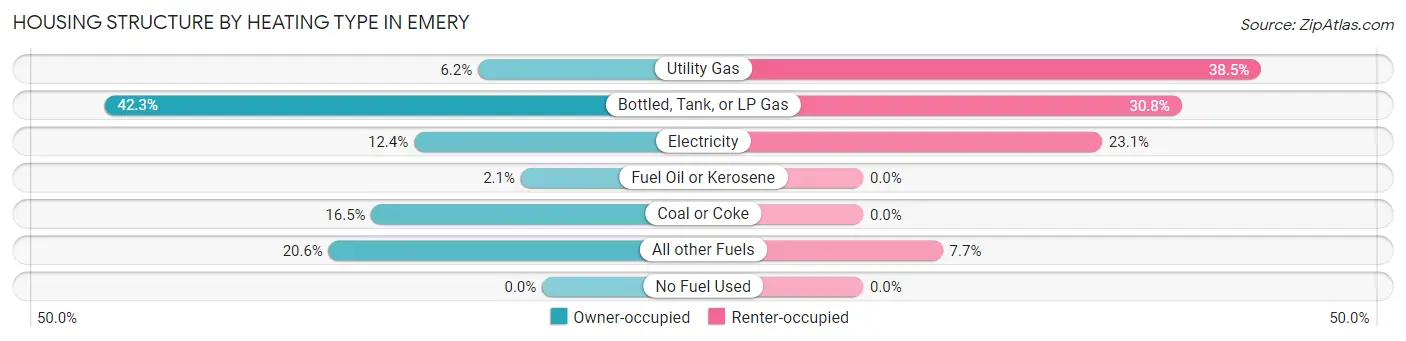
| Heating Type | Owner-occupied | Renter-occupied |
| Utility Gas | 6 (6.2%) | 5 (38.5%) |
| Bottled, Tank, or LP Gas | 41 (42.3%) | 4 (30.8%) |
| Electricity | 12 (12.4%) | 3 (23.1%) |
| Fuel Oil or Kerosene | 2 (2.1%) | 0 (0.0%) |
| Coal or Coke | 16 (16.5%) | 0 (0.0%) |
| All other Fuels | 20 (20.6%) | 1 (7.7%) |
| No Fuel Used | 0 (0.0%) | 0 (0.0%) |
| Total | 97 (100.0%) | 13 (100.0%) |
Household Vehicle Usage in Emery
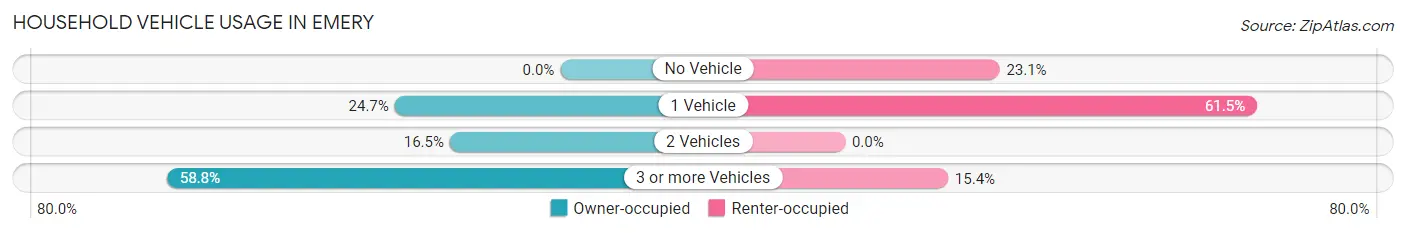
| Vehicles per Household | Owner-occupied | Renter-occupied |
| No Vehicle | 0 (0.0%) | 3 (23.1%) |
| 1 Vehicle | 24 (24.7%) | 8 (61.5%) |
| 2 Vehicles | 16 (16.5%) | 0 (0.0%) |
| 3 or more Vehicles | 57 (58.8%) | 2 (15.4%) |
| Total | 97 (100.0%) | 13 (100.0%) |
Real Estate & Mortgages in Emery
Real Estate and Mortgage Overview in Emery
| Characteristic | Without Mortgage | With Mortgage |
| Housing Units | 50 | 47 |
| Median Property Value | $105,000 | $114,800 |
| Median Household Income | $71,250 | $2 |
| Monthly Housing Costs | $380 | $0 |
| Real Estate Taxes | $711 | $0 |
Property Value by Mortgage Status in Emery
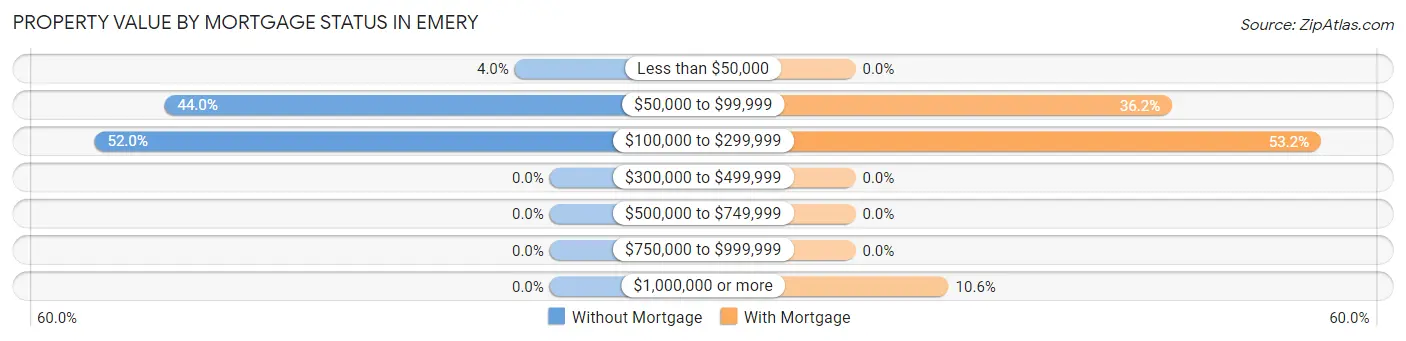
| Property Value | Without Mortgage | With Mortgage |
| Less than $50,000 | 2 (4.0%) | 0 (0.0%) |
| $50,000 to $99,999 | 22 (44.0%) | 17 (36.2%) |
| $100,000 to $299,999 | 26 (52.0%) | 25 (53.2%) |
| $300,000 to $499,999 | 0 (0.0%) | 0 (0.0%) |
| $500,000 to $749,999 | 0 (0.0%) | 0 (0.0%) |
| $750,000 to $999,999 | 0 (0.0%) | 0 (0.0%) |
| $1,000,000 or more | 0 (0.0%) | 5 (10.6%) |
| Total | 50 (100.0%) | 47 (100.0%) |
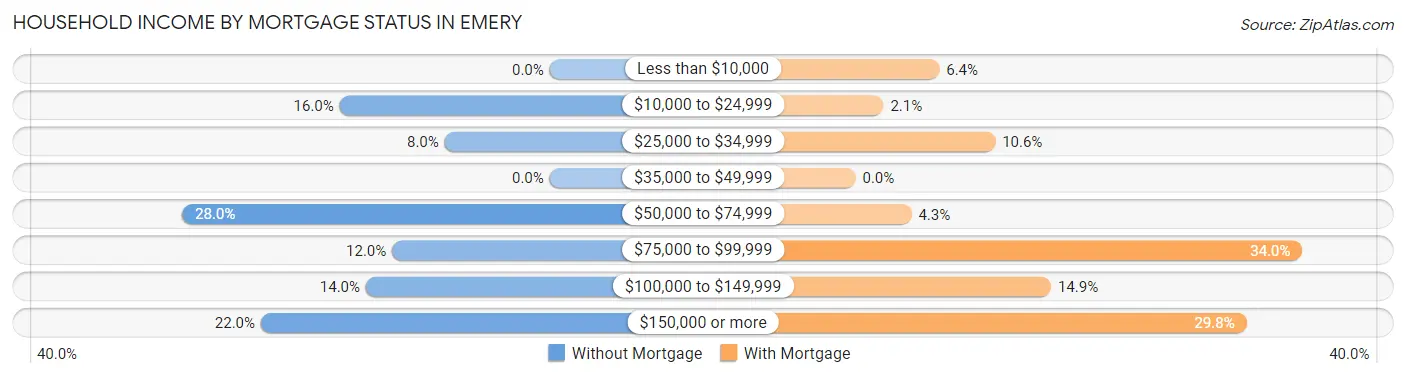
Household Income by Mortgage Status in Emery
| Household Income | Without Mortgage | With Mortgage |
| Less than $10,000 | 0 (0.0%) | 3 (6.4%) |
| $10,000 to $24,999 | 8 (16.0%) | 1 (2.1%) |
| $25,000 to $34,999 | 4 (8.0%) | 5 (10.6%) |
| $35,000 to $49,999 | 0 (0.0%) | 0 (0.0%) |
| $50,000 to $74,999 | 14 (28.0%) | 2 (4.3%) |
| $75,000 to $99,999 | 6 (12.0%) | 16 (34.0%) |
| $100,000 to $149,999 | 7 (14.0%) | 7 (14.9%) |
| $150,000 or more | 11 (22.0%) | 14 (29.8%) |
| Total | 50 (100.0%) | 47 (100.0%) |
Property Value to Household Income Ratio in Emery
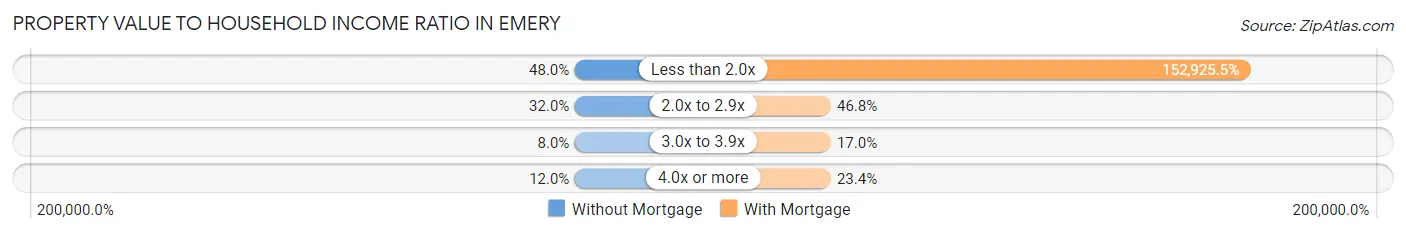
| Value-to-Income Ratio | Without Mortgage | With Mortgage |
| Less than 2.0x | 24 (48.0%) | 71,875 (152,925.5%) |
| 2.0x to 2.9x | 16 (32.0%) | 22 (46.8%) |
| 3.0x to 3.9x | 4 (8.0%) | 8 (17.0%) |
| 4.0x or more | 6 (12.0%) | 11 (23.4%) |
| Total | 50 (100.0%) | 47 (100.0%) |
Real Estate Taxes by Mortgage Status in Emery
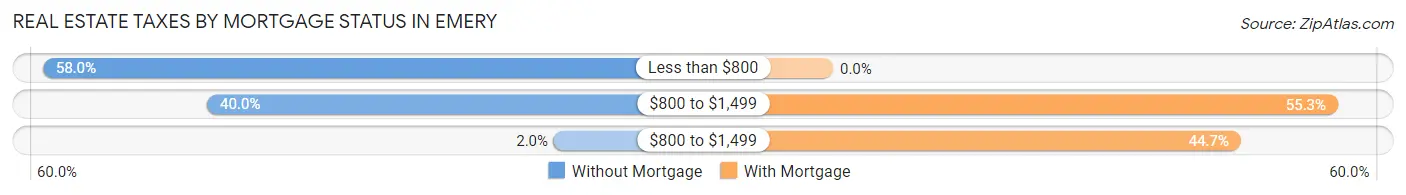
| Property Taxes | Without Mortgage | With Mortgage |
| Less than $800 | 29 (58.0%) | 0 (0.0%) |
| $800 to $1,499 | 20 (40.0%) | 26 (55.3%) |
| $800 to $1,499 | 1 (2.0%) | 21 (44.7%) |
| Total | 50 (100.0%) | 47 (100.0%) |
Health & Disability in Emery
Health Insurance Coverage by Age in Emery
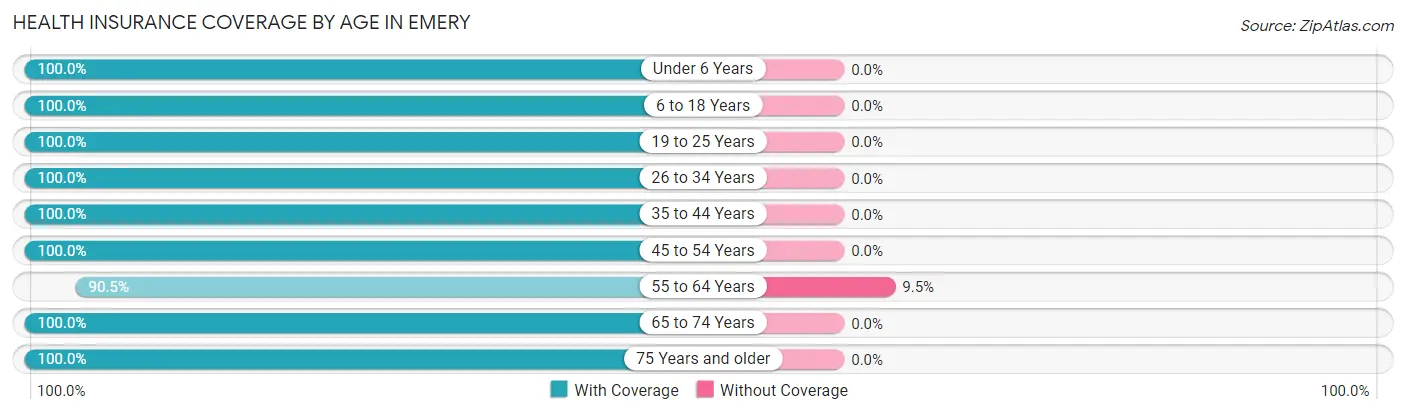
| Age Bracket | With Coverage | Without Coverage |
| Under 6 Years | 8 (100.0%) | 0 (0.0%) |
| 6 to 18 Years | 143 (100.0%) | 0 (0.0%) |
| 19 to 25 Years | 8 (100.0%) | 0 (0.0%) |
| 26 to 34 Years | 9 (100.0%) | 0 (0.0%) |
| 35 to 44 Years | 51 (100.0%) | 0 (0.0%) |
| 45 to 54 Years | 66 (100.0%) | 0 (0.0%) |
| 55 to 64 Years | 19 (90.5%) | 2 (9.5%) |
| 65 to 74 Years | 50 (100.0%) | 0 (0.0%) |
| 75 Years and older | 17 (100.0%) | 0 (0.0%) |
| Total | 371 (99.5%) | 2 (0.5%) |
Health Insurance Coverage by Citizenship Status in Emery
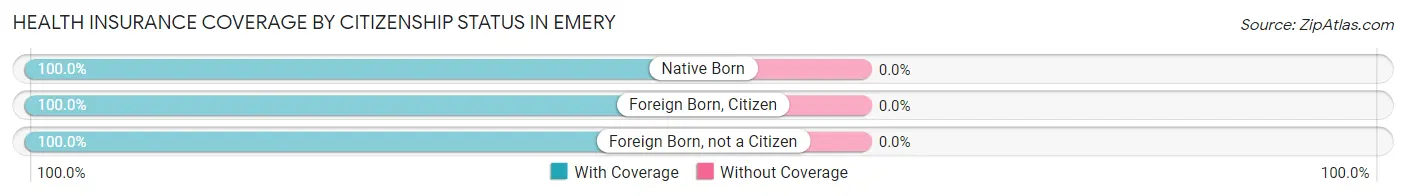
| Citizenship Status | With Coverage | Without Coverage |
| Native Born | 8 (100.0%) | 0 (0.0%) |
| Foreign Born, Citizen | 143 (100.0%) | 0 (0.0%) |
| Foreign Born, not a Citizen | 8 (100.0%) | 0 (0.0%) |
Health Insurance Coverage by Household Income in Emery
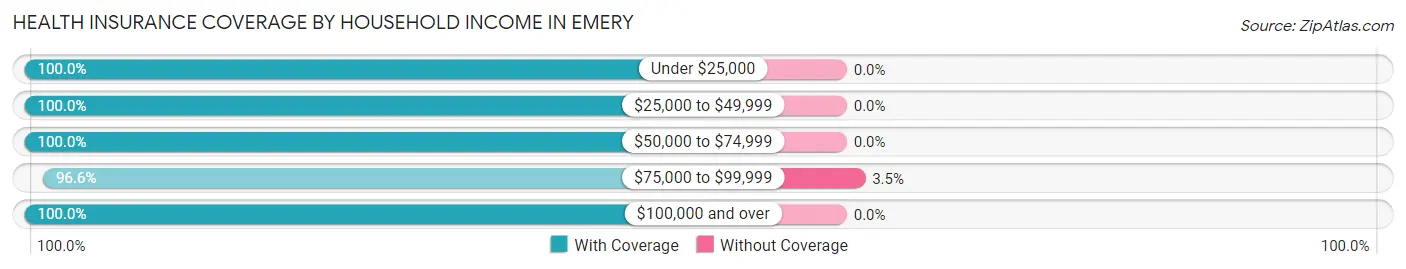
| Household Income | With Coverage | Without Coverage |
| Under $25,000 | 31 (100.0%) | 0 (0.0%) |
| $25,000 to $49,999 | 66 (100.0%) | 0 (0.0%) |
| $50,000 to $74,999 | 65 (100.0%) | 0 (0.0%) |
| $75,000 to $99,999 | 56 (96.6%) | 2 (3.5%) |
| $100,000 and over | 124 (100.0%) | 0 (0.0%) |
Public vs Private Health Insurance Coverage by Age in Emery
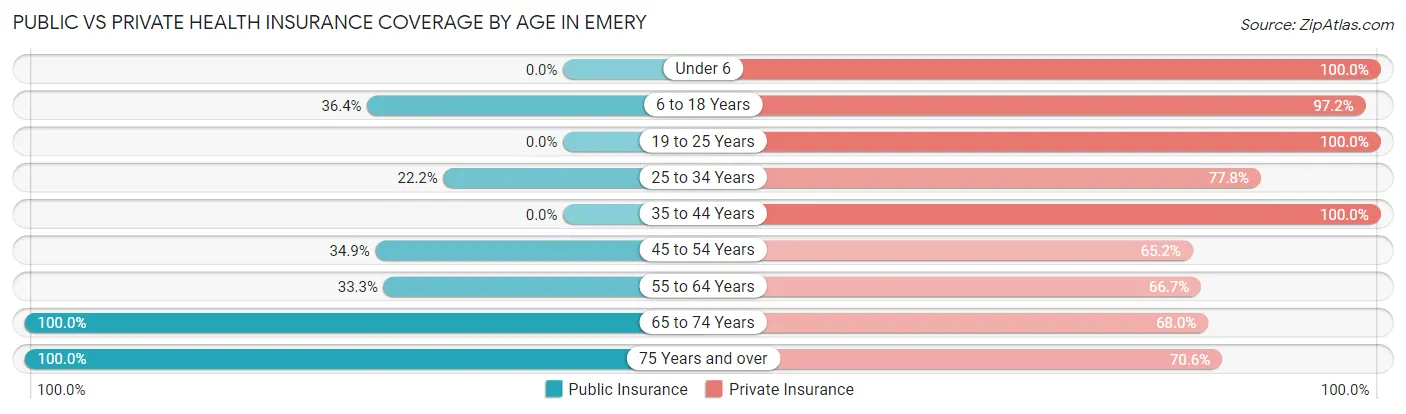
| Age Bracket | Public Insurance | Private Insurance |
| Under 6 | 0 (0.0%) | 8 (100.0%) |
| 6 to 18 Years | 52 (36.4%) | 139 (97.2%) |
| 19 to 25 Years | 0 (0.0%) | 8 (100.0%) |
| 25 to 34 Years | 2 (22.2%) | 7 (77.8%) |
| 35 to 44 Years | 0 (0.0%) | 51 (100.0%) |
| 45 to 54 Years | 23 (34.8%) | 43 (65.1%) |
| 55 to 64 Years | 7 (33.3%) | 14 (66.7%) |
| 65 to 74 Years | 50 (100.0%) | 34 (68.0%) |
| 75 Years and over | 17 (100.0%) | 12 (70.6%) |
| Total | 151 (40.5%) | 316 (84.7%) |
Disability Status by Sex by Age in Emery
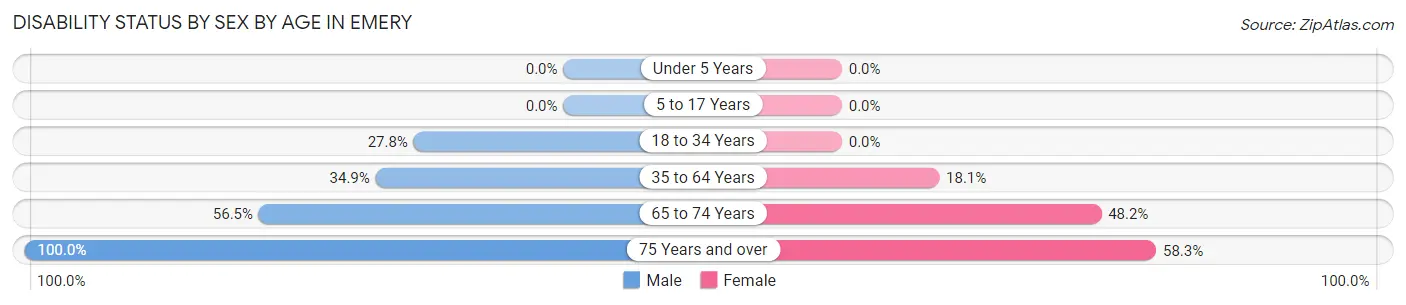
| Age Bracket | Male | Female |
| Under 5 Years | 0 (0.0%) | 0 (0.0%) |
| 5 to 17 Years | 0 (0.0%) | 0 (0.0%) |
| 18 to 34 Years | 5 (27.8%) | 0 (0.0%) |
| 35 to 64 Years | 23 (34.8%) | 13 (18.1%) |
| 65 to 74 Years | 13 (56.5%) | 13 (48.1%) |
| 75 Years and over | 5 (100.0%) | 7 (58.3%) |
Disability Class by Sex by Age in Emery
Disability Class: Hearing Difficulty
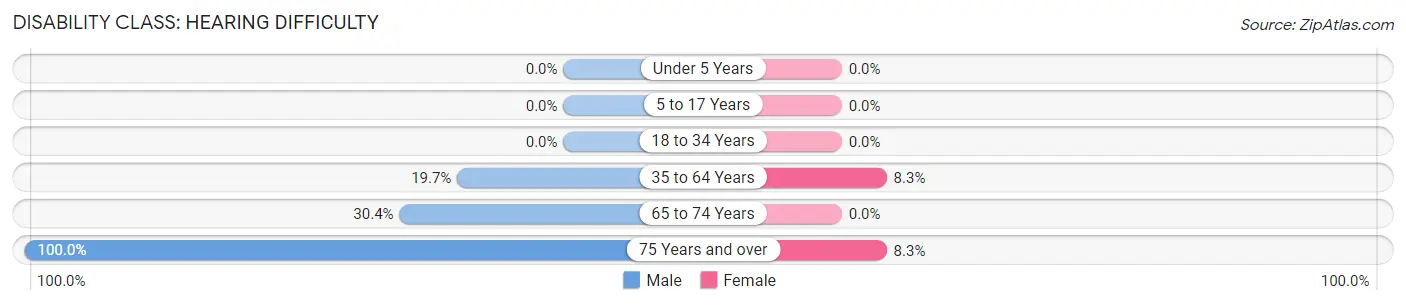
| Age Bracket | Male | Female |
| Under 5 Years | 0 (0.0%) | 0 (0.0%) |
| 5 to 17 Years | 0 (0.0%) | 0 (0.0%) |
| 18 to 34 Years | 0 (0.0%) | 0 (0.0%) |
| 35 to 64 Years | 13 (19.7%) | 6 (8.3%) |
| 65 to 74 Years | 7 (30.4%) | 0 (0.0%) |
| 75 Years and over | 5 (100.0%) | 1 (8.3%) |
Disability Class: Vision Difficulty
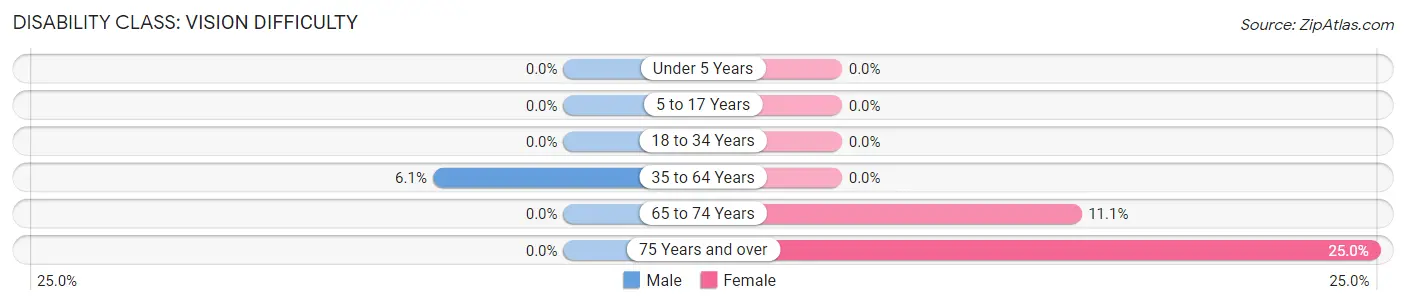
| Age Bracket | Male | Female |
| Under 5 Years | 0 (0.0%) | 0 (0.0%) |
| 5 to 17 Years | 0 (0.0%) | 0 (0.0%) |
| 18 to 34 Years | 0 (0.0%) | 0 (0.0%) |
| 35 to 64 Years | 4 (6.1%) | 0 (0.0%) |
| 65 to 74 Years | 0 (0.0%) | 3 (11.1%) |
| 75 Years and over | 0 (0.0%) | 3 (25.0%) |
Disability Class: Cognitive Difficulty
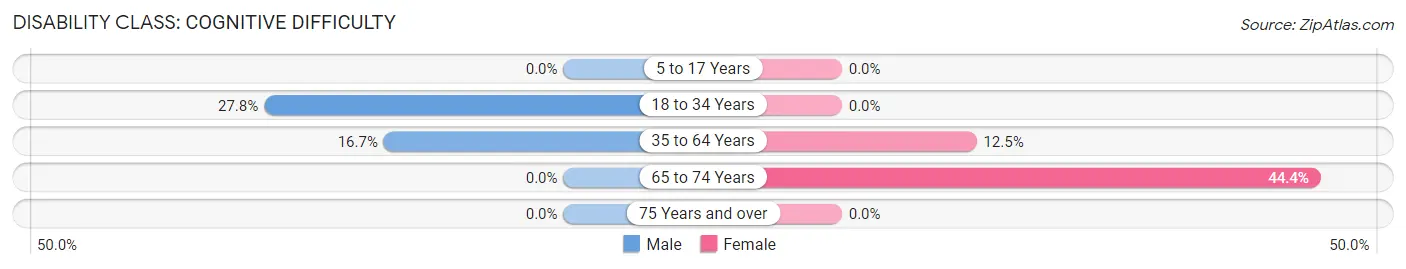
| Age Bracket | Male | Female |
| 5 to 17 Years | 0 (0.0%) | 0 (0.0%) |
| 18 to 34 Years | 5 (27.8%) | 0 (0.0%) |
| 35 to 64 Years | 11 (16.7%) | 9 (12.5%) |
| 65 to 74 Years | 0 (0.0%) | 12 (44.4%) |
| 75 Years and over | 0 (0.0%) | 0 (0.0%) |
Disability Class: Ambulatory Difficulty
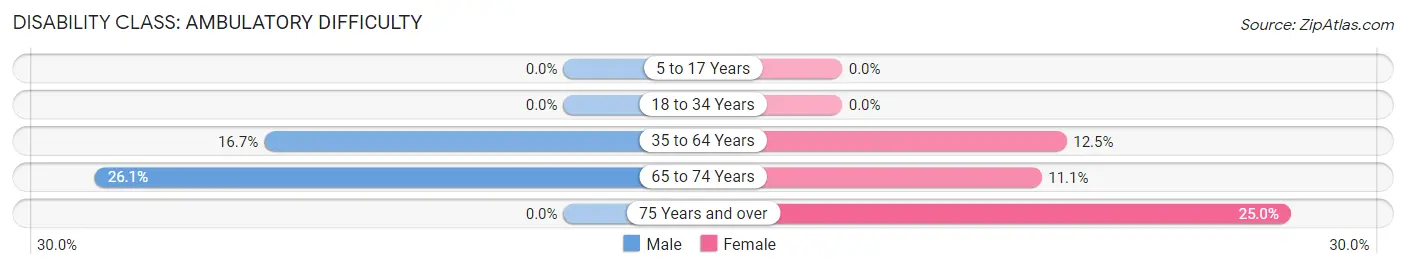
| Age Bracket | Male | Female |
| 5 to 17 Years | 0 (0.0%) | 0 (0.0%) |
| 18 to 34 Years | 0 (0.0%) | 0 (0.0%) |
| 35 to 64 Years | 11 (16.7%) | 9 (12.5%) |
| 65 to 74 Years | 6 (26.1%) | 3 (11.1%) |
| 75 Years and over | 0 (0.0%) | 3 (25.0%) |
Disability Class: Self-Care Difficulty
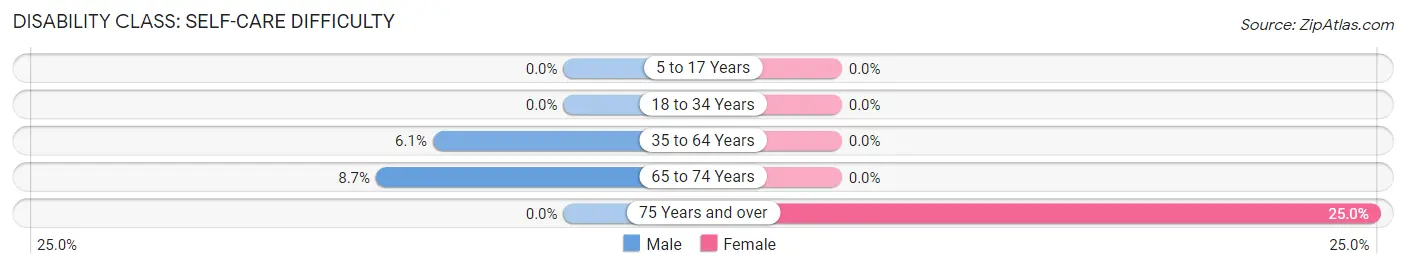
| Age Bracket | Male | Female |
| 5 to 17 Years | 0 (0.0%) | 0 (0.0%) |
| 18 to 34 Years | 0 (0.0%) | 0 (0.0%) |
| 35 to 64 Years | 4 (6.1%) | 0 (0.0%) |
| 65 to 74 Years | 2 (8.7%) | 0 (0.0%) |
| 75 Years and over | 0 (0.0%) | 3 (25.0%) |
Technology Access in Emery
Computing Device Access in Emery
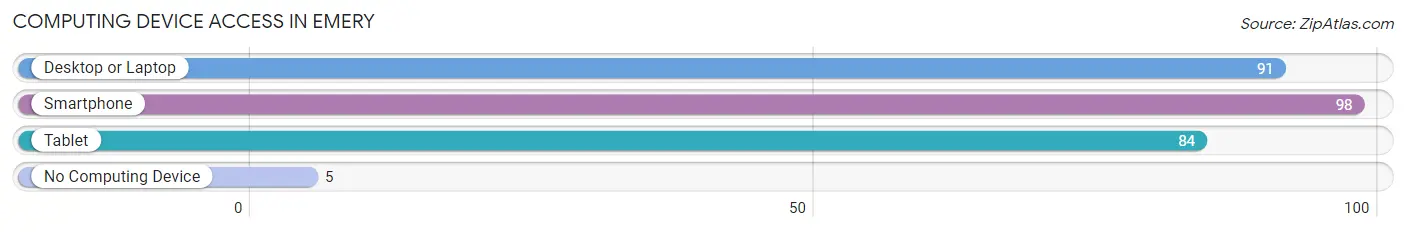
| Device Type | # Households | % Households |
| Desktop or Laptop | 91 | 82.7% |
| Smartphone | 98 | 89.1% |
| Tablet | 84 | 76.4% |
| No Computing Device | 5 | 4.5% |
| Total | 110 | 100.0% |
Internet Access in Emery
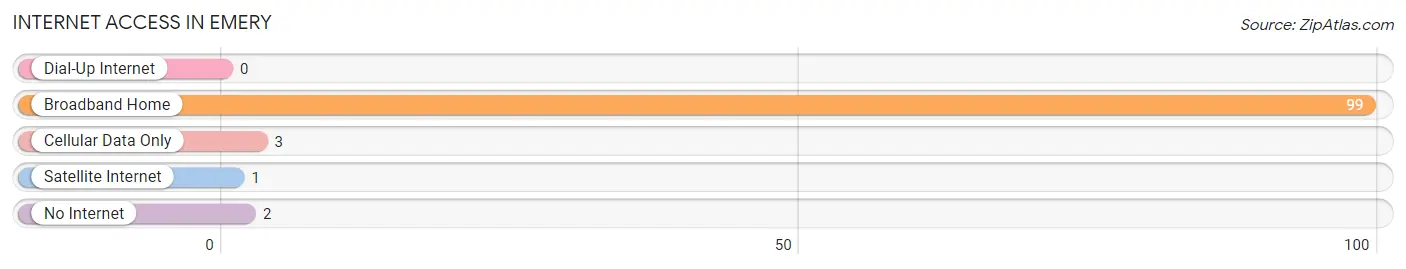
| Internet Type | # Households | % Households |
| Dial-Up Internet | 0 | 0.0% |
| Broadband Home | 99 | 90.0% |
| Cellular Data Only | 3 | 2.7% |
| Satellite Internet | 1 | 0.9% |
| No Internet | 2 | 1.8% |
| Total | 110 | 100.0% |
Emery Summary
Emery is a small town located in the central part of Emery County, Utah. It is situated in the San Rafael Swell, a large geological formation in the Colorado Plateau. The town is located at the intersection of State Route 29 and State Route 10, and is the county seat of Emery County. The population of Emery was 1,717 at the 2010 census.
History
The area around Emery was first settled in the late 1800s by Mormon pioneers. The town was originally known as Huntington, after the nearby Huntington Creek. In 1881, the town was renamed Emery in honor of George W. Emery, a prominent local leader and the first president of the Emery Stake of the Church of Jesus Christ of Latter-day Saints.
Geography
Emery is located at the intersection of State Route 29 and State Route 10, in the San Rafael Swell. The town is situated at an elevation of 5,845 feet (1,782 m). The area around Emery is mostly flat, with some rolling hills. The climate is semi-arid, with hot summers and cold winters.
Economy
The economy of Emery is largely based on agriculture and mining. The town is home to several large farms, which produce hay, alfalfa, and other crops. The nearby coal mines provide employment for many of the town's residents. The town is also home to several small businesses, including restaurants, stores, and service providers.
Demographics
As of the 2010 census, there were 1,717 people, 645 households, and 463 families residing in Emery. The population density was 545.3 people per square mile (210.9/km2). The racial makeup of the town was 97.2% White, 0.2% African American, 0.2% Native American, 0.2% Asian, 0.2% Pacific Islander, 0.7% from other races, and 1.1% from two or more races. Hispanic or Latino of any race were 2.2% of the population.
The median income for a household in Emery was $37,917, and the median income for a family was $45,000. Males had a median income of $35,000 versus $21,250 for females. The per capita income for the town was $17,845. About 8.2% of families and 10.2% of the population were below the poverty line, including 11.2% of those under age 18 and 8.3% of those age 65 or over.
Common Questions
What is Per Capita Income in Emery?
Per Capita income in Emery is $22,713.
What is the Median Family Income in Emery?
Median Family Income in Emery is $86,875.
What is the Median Household income in Emery?
Median Household Income in Emery is $68,333.
What is Inequality or Gini Index in Emery?
Inequality or Gini Index in Emery is 0.37.
What is the Total Population of Emery?
Total Population of Emery is 373.
What is the Total Male Population of Emery?
Total Male Population of Emery is 226.
What is the Total Female Population of Emery?
Total Female Population of Emery is 147.
What is the Ratio of Males per 100 Females in Emery?
There are 153.74 Males per 100 Females in Emery.
What is the Ratio of Females per 100 Males in Emery?
There are 65.04 Females per 100 Males in Emery.
What is the Median Population Age in Emery?
Median Population Age in Emery is 40.8 Years.
What is the Average Family Size in Emery
Average Family Size in Emery is 4.4 People.
What is the Average Household Size in Emery
Average Household Size in Emery is 3.1 People.
How Large is the Labor Force in Emery?
There are 179 People in the Labor Forcein in Emery.
What is the Percentage of People in the Labor Force in Emery?
65.1% of People are in the Labor Force in Emery.
What is the Unemployment Rate in Emery?
Unemployment Rate in Emery is 2.2%.