Navajo Mountain, UT Map & Demographics
Navajo Mountain Map
Navajo Mountain Overview
$13,650
PER CAPITA INCOME
$12,192
AVG FAMILY INCOME
0.50
INEQUALITY / GINI INDEX
663
TOTAL POPULATION
324
MALE POPULATION
339
FEMALE POPULATION
95.58
MALES / 100 FEMALES
104.63
FEMALES / 100 MALES
20.7
MEDIAN AGE
4.5
AVG FAMILY SIZE
3.2
AVG HOUSEHOLD SIZE
315
LABOR FORCE [ PEOPLE ]
50.6%
PERCENT IN LABOR FORCE
48.6%
UNEMPLOYMENT RATE
Income in Navajo Mountain
Income Overview in Navajo Mountain
| Characteristic | Number | Measure |
| Per Capita Income | 663 | $13,650 |
| Median Family Income | 121 | $12,192 |
| Mean Family Income | 121 | $21,585 |
| Median Household Income | 210 | $0 |
| Mean Household Income | 210 | $41,812 |
| Income Deficit | 121 | $0 |
| Wage / Income Gap (%) | 663 | 0.00% |
| Wage / Income Gap ($) | 663 | 100.00¢ per $1 |
| Gini / Inequality Index | 663 | 0.50 |
Earnings by Sex in Navajo Mountain
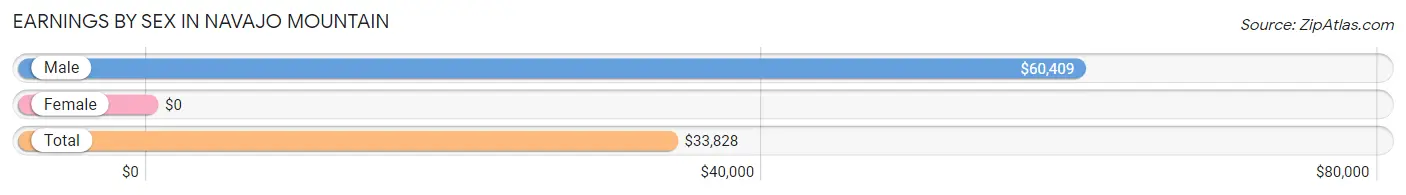
| Sex | Number | Average Earnings |
| Male | 116 (62.0%) | $60,409 |
| Female | 71 (38.0%) | $0 |
| Total | 187 (100.0%) | $33,828 |
Earnings by Sex by Income Bracket in Navajo Mountain
The most common earnings brackets in Navajo Mountain are $55,000 to $64,999 for men (55 | 47.4%) and $30,000 to $34,999 for women (20 | 28.2%).
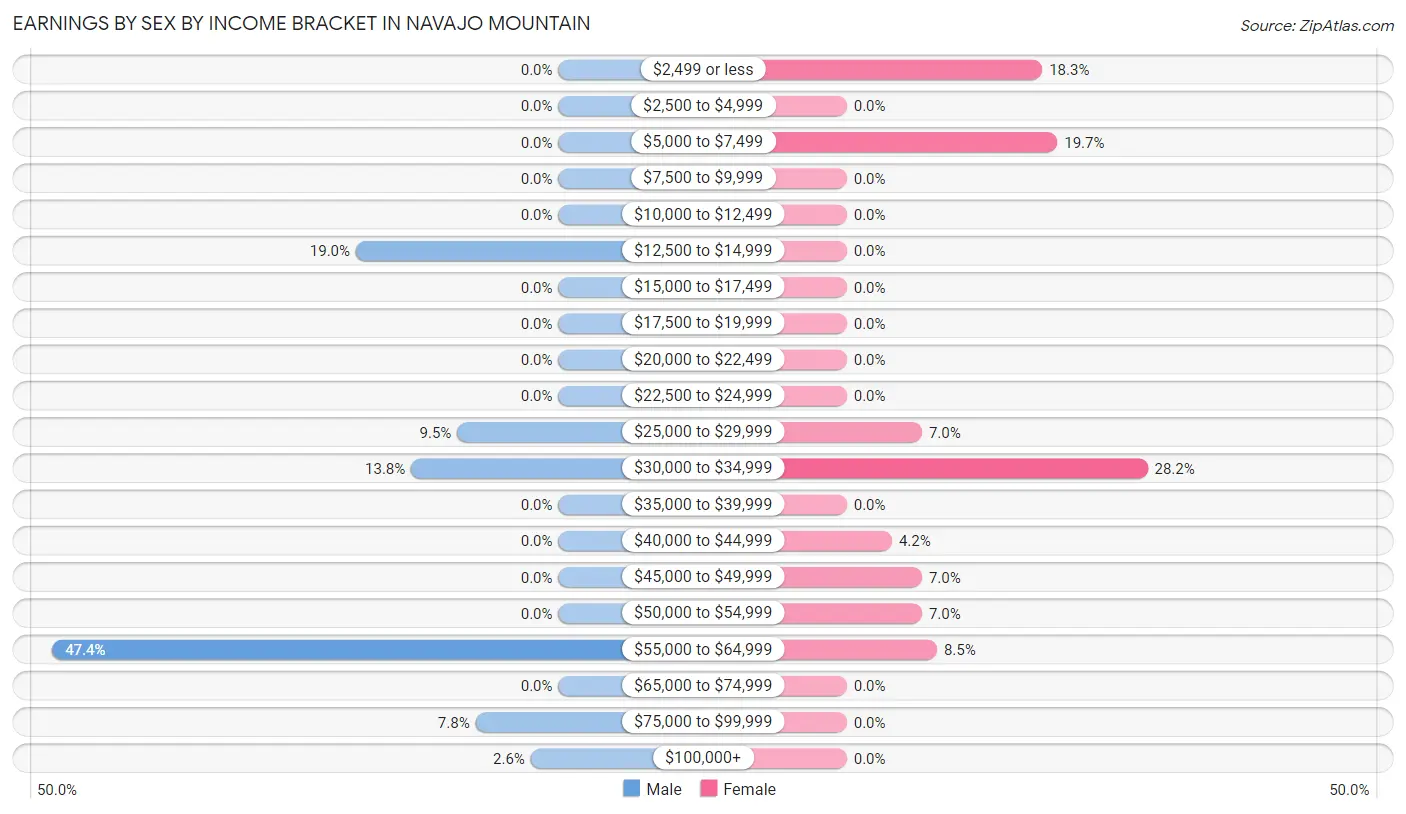
| Income | Male | Female |
| $2,499 or less | 0 (0.0%) | 13 (18.3%) |
| $2,500 to $4,999 | 0 (0.0%) | 0 (0.0%) |
| $5,000 to $7,499 | 0 (0.0%) | 14 (19.7%) |
| $7,500 to $9,999 | 0 (0.0%) | 0 (0.0%) |
| $10,000 to $12,499 | 0 (0.0%) | 0 (0.0%) |
| $12,500 to $14,999 | 22 (19.0%) | 0 (0.0%) |
| $15,000 to $17,499 | 0 (0.0%) | 0 (0.0%) |
| $17,500 to $19,999 | 0 (0.0%) | 0 (0.0%) |
| $20,000 to $22,499 | 0 (0.0%) | 0 (0.0%) |
| $22,500 to $24,999 | 0 (0.0%) | 0 (0.0%) |
| $25,000 to $29,999 | 11 (9.5%) | 5 (7.0%) |
| $30,000 to $34,999 | 16 (13.8%) | 20 (28.2%) |
| $35,000 to $39,999 | 0 (0.0%) | 0 (0.0%) |
| $40,000 to $44,999 | 0 (0.0%) | 3 (4.2%) |
| $45,000 to $49,999 | 0 (0.0%) | 5 (7.0%) |
| $50,000 to $54,999 | 0 (0.0%) | 5 (7.0%) |
| $55,000 to $64,999 | 55 (47.4%) | 6 (8.5%) |
| $65,000 to $74,999 | 0 (0.0%) | 0 (0.0%) |
| $75,000 to $99,999 | 9 (7.8%) | 0 (0.0%) |
| $100,000+ | 3 (2.6%) | 0 (0.0%) |
| Total | 116 (100.0%) | 71 (100.0%) |
Earnings by Sex by Educational Attainment in Navajo Mountain
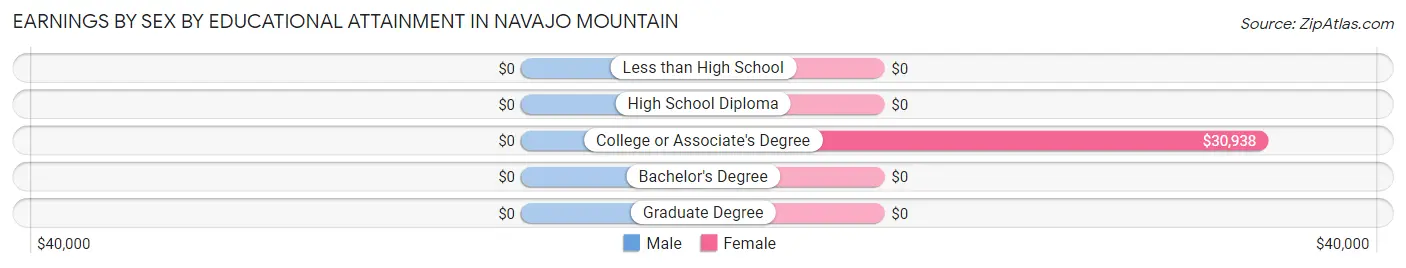
| Educational Attainment | Male Income | Female Income |
| Less than High School | - | - |
| High School Diploma | - | - |
| College or Associate's Degree | - | - |
| Bachelor's Degree | - | - |
| Graduate Degree | - | - |
| Total | $61,273 | $30,813 |
Family Income in Navajo Mountain
Family Income Brackets in Navajo Mountain
According to the Navajo Mountain family income data, there are 85 families falling into the $10,000 to $14,999 income range, which is the most common income bracket and makes up 70.3% of all families.
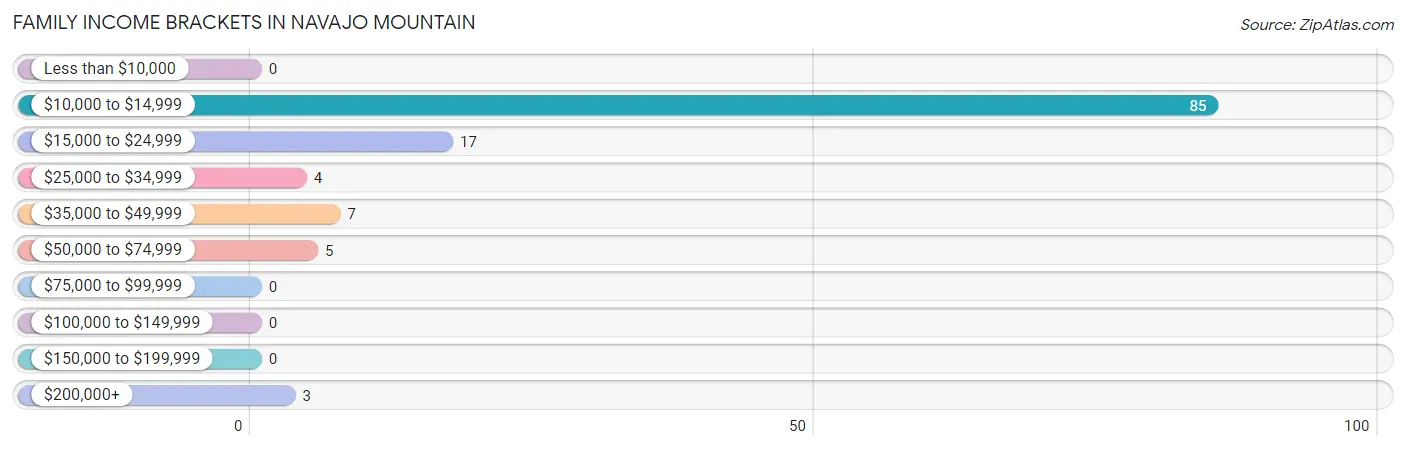
| Income Bracket | # Families | % Families |
| Less than $10,000 | 0 | 0.0% |
| $10,000 to $14,999 | 85 | 70.2% |
| $15,000 to $24,999 | 17 | 14.0% |
| $25,000 to $34,999 | 4 | 3.3% |
| $35,000 to $49,999 | 7 | 5.8% |
| $50,000 to $74,999 | 5 | 4.1% |
| $75,000 to $99,999 | 0 | 0.0% |
| $100,000 to $149,999 | 0 | 0.0% |
| $150,000 to $199,999 | 0 | 0.0% |
| $200,000+ | 3 | 2.5% |
Family Income by Famaliy Size in Navajo Mountain
4-person families (82 | 67.8%) account for the highest median family income in Navajo Mountain with $11,486 per family, while 4-person families (82 | 67.8%) have the highest median income of $2,872 per family member.
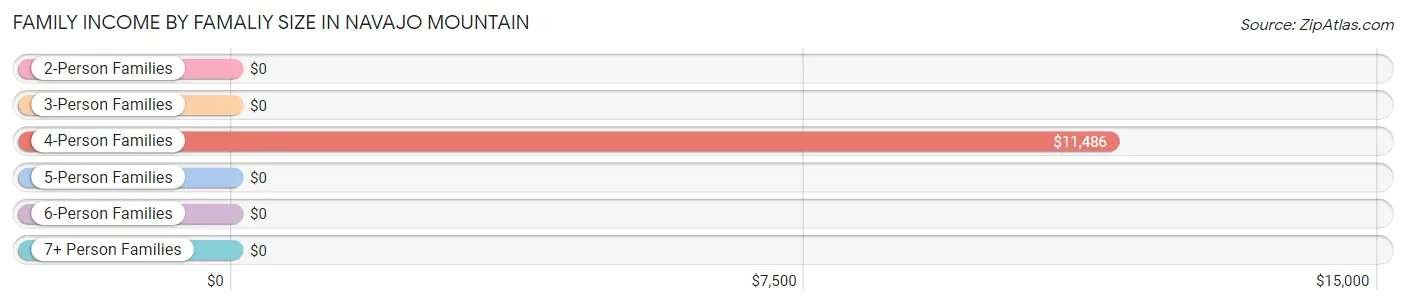
| Income Bracket | # Families | Median Income |
| 2-Person Families | 20 (16.5%) | $0 |
| 3-Person Families | 7 (5.8%) | $0 |
| 4-Person Families | 82 (67.8%) | $11,486 |
| 5-Person Families | 12 (9.9%) | $0 |
| 6-Person Families | 0 (0.0%) | $0 |
| 7+ Person Families | 0 (0.0%) | $0 |
| Total | 121 (100.0%) | $12,192 |
Family Income by Number of Earners in Navajo Mountain
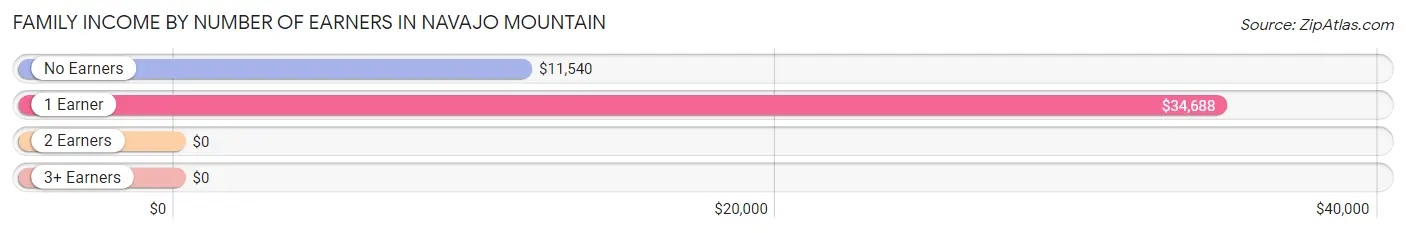
| Number of Earners | # Families | Median Income |
| No Earners | 85 (70.3%) | $11,540 |
| 1 Earner | 25 (20.7%) | $34,688 |
| 2 Earners | 11 (9.1%) | $0 |
| 3+ Earners | 0 (0.0%) | $0 |
| Total | 121 (100.0%) | $12,192 |
Household Income in Navajo Mountain
Household Income Brackets in Navajo Mountain
With 85 households falling in the category, the $10,000 to $14,999 income range is the most frequent in Navajo Mountain, accounting for 40.5% of all households.
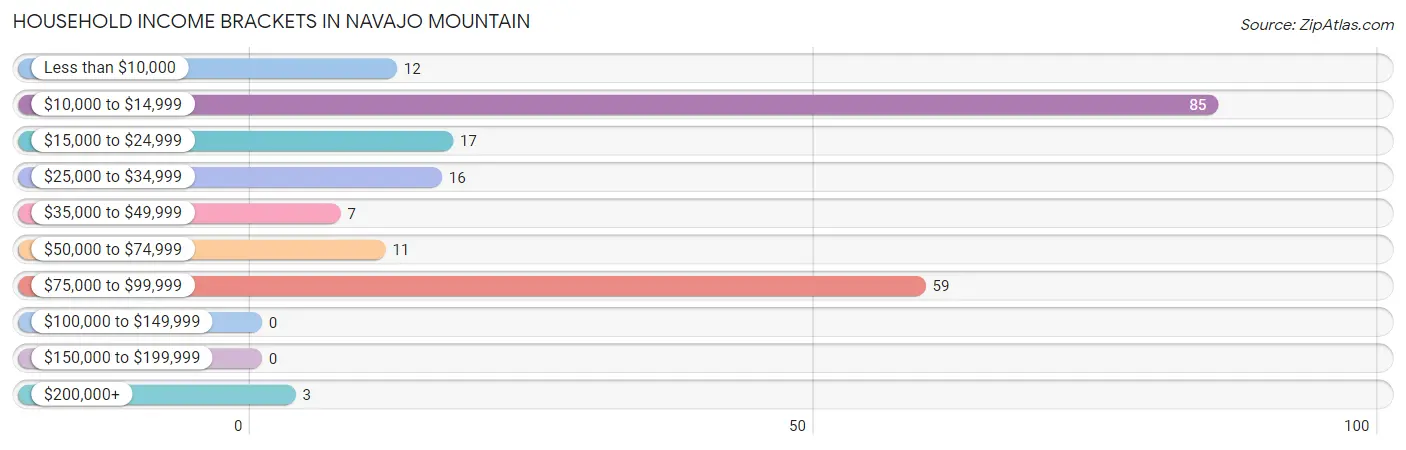
| Income Bracket | # Households | % Households |
| Less than $10,000 | 12 | 5.7% |
| $10,000 to $14,999 | 85 | 40.5% |
| $15,000 to $24,999 | 17 | 8.1% |
| $25,000 to $34,999 | 16 | 7.6% |
| $35,000 to $49,999 | 7 | 3.3% |
| $50,000 to $74,999 | 11 | 5.2% |
| $75,000 to $99,999 | 59 | 28.1% |
| $100,000 to $149,999 | 0 | 0.0% |
| $150,000 to $199,999 | 0 | 0.0% |
| $200,000+ | 3 | 1.4% |
Household Income by Householder Age in Navajo Mountain
The median household income in Navajo Mountain is $0, with the highest median household income of $11,685 found in the 45 to 64 years age bracket for the primary householder. A total of 99 households (47.1%) fall into this category.
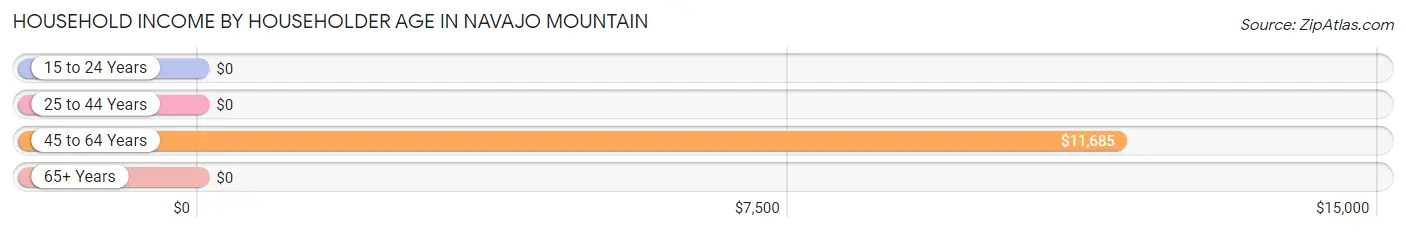
| Income Bracket | # Households | Median Income |
| 15 to 24 Years | 0 (0.0%) | $0 |
| 25 to 44 Years | 27 (12.9%) | $0 |
| 45 to 64 Years | 99 (47.1%) | $11,685 |
| 65+ Years | 84 (40.0%) | $0 |
| Total | 210 (100.0%) | $0 |
Poverty in Navajo Mountain
Income Below Poverty by Sex and Age in Navajo Mountain
With 61.4% poverty level for males and 81.1% for females among the residents of Navajo Mountain, under 5 year old males and under 5 year old females are the most vulnerable to poverty, with 7 males (100.0%) and 4 females (100.0%) in their respective age groups living below the poverty level.
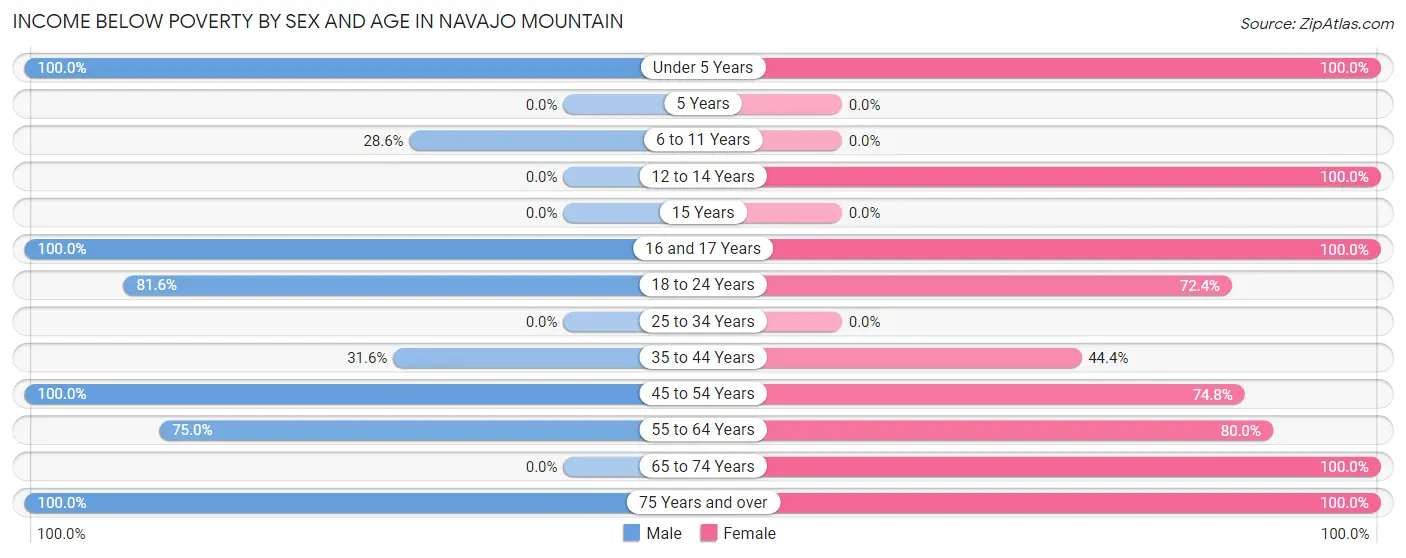
| Age Bracket | Male | Female |
| Under 5 Years | 7 (100.0%) | 4 (100.0%) |
| 5 Years | 0 (0.0%) | 0 (0.0%) |
| 6 to 11 Years | 6 (28.6%) | 0 (0.0%) |
| 12 to 14 Years | 0 (0.0%) | 9 (100.0%) |
| 15 Years | 0 (0.0%) | 0 (0.0%) |
| 16 and 17 Years | 22 (100.0%) | 73 (100.0%) |
| 18 to 24 Years | 142 (81.6%) | 42 (72.4%) |
| 25 to 34 Years | 0 (0.0%) | 0 (0.0%) |
| 35 to 44 Years | 6 (31.6%) | 8 (44.4%) |
| 45 to 54 Years | 3 (100.0%) | 86 (74.8%) |
| 55 to 64 Years | 9 (75.0%) | 24 (80.0%) |
| 65 to 74 Years | 0 (0.0%) | 6 (100.0%) |
| 75 Years and over | 4 (100.0%) | 23 (100.0%) |
| Total | 199 (61.4%) | 275 (81.1%) |
Income Above Poverty by Sex and Age in Navajo Mountain
According to the poverty statistics in Navajo Mountain, males aged 25 to 34 years and females aged 25 to 34 years are the age groups that are most secure financially, with 100.0% of males and 100.0% of females in these age groups living above the poverty line.
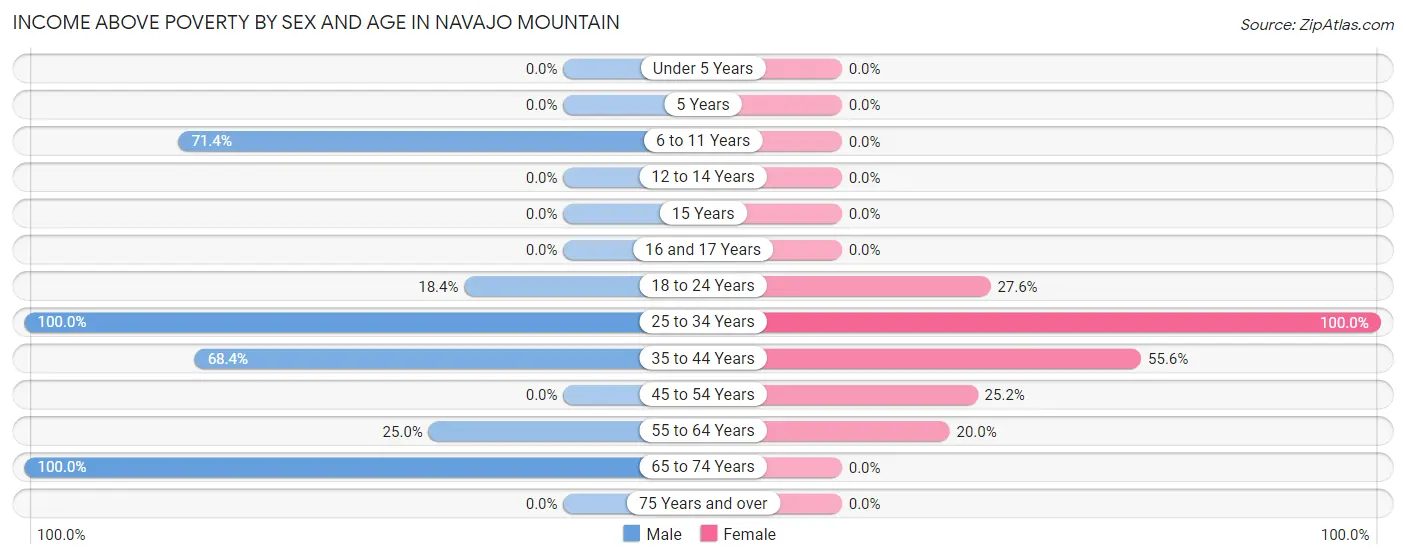
| Age Bracket | Male | Female |
| Under 5 Years | 0 (0.0%) | 0 (0.0%) |
| 5 Years | 0 (0.0%) | 0 (0.0%) |
| 6 to 11 Years | 15 (71.4%) | 0 (0.0%) |
| 12 to 14 Years | 0 (0.0%) | 0 (0.0%) |
| 15 Years | 0 (0.0%) | 0 (0.0%) |
| 16 and 17 Years | 0 (0.0%) | 0 (0.0%) |
| 18 to 24 Years | 32 (18.4%) | 16 (27.6%) |
| 25 to 34 Years | 7 (100.0%) | 3 (100.0%) |
| 35 to 44 Years | 13 (68.4%) | 10 (55.6%) |
| 45 to 54 Years | 0 (0.0%) | 29 (25.2%) |
| 55 to 64 Years | 3 (25.0%) | 6 (20.0%) |
| 65 to 74 Years | 55 (100.0%) | 0 (0.0%) |
| 75 Years and over | 0 (0.0%) | 0 (0.0%) |
| Total | 125 (38.6%) | 64 (18.9%) |
Income Below Poverty Among Married-Couple Families in Navajo Mountain
The poverty statistics for married-couple families in Navajo Mountain show that 72.7% or 8 of the total 11 families live below the poverty line. Families with no children have the highest poverty rate of 72.7%, comprising of 8 families. On the other hand, families with no children have the lowest poverty rate of 72.7%, which includes 8 families.
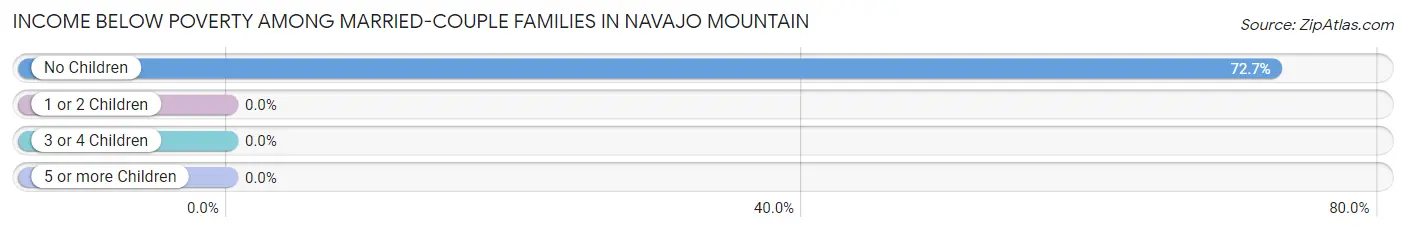
| Children | Above Poverty | Below Poverty |
| No Children | 3 (27.3%) | 8 (72.7%) |
| 1 or 2 Children | 0 (0.0%) | 0 (0.0%) |
| 3 or 4 Children | 0 (0.0%) | 0 (0.0%) |
| 5 or more Children | 0 (0.0%) | 0 (0.0%) |
| Total | 3 (27.3%) | 8 (72.7%) |
Income Below Poverty Among Single-Parent Households in Navajo Mountain
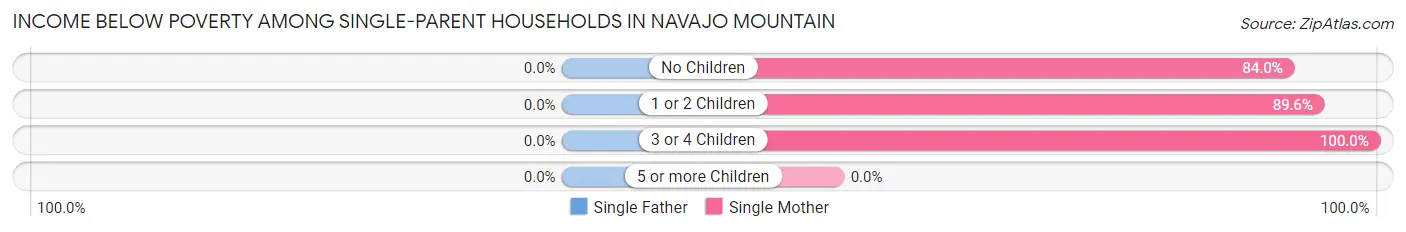
| Children | Single Father | Single Mother |
| No Children | 0 (0.0%) | 21 (84.0%) |
| 1 or 2 Children | 0 (0.0%) | 69 (89.6%) |
| 3 or 4 Children | 0 (0.0%) | 8 (100.0%) |
| 5 or more Children | 0 (0.0%) | 0 (0.0%) |
| Total | 0 (0.0%) | 98 (89.1%) |
Income Below Poverty Among Married-Couple vs Single-Parent Households in Navajo Mountain
The poverty data for Navajo Mountain shows that 8 of the married-couple family households (72.7%) and 98 of the single-parent households (89.1%) are living below the poverty level. Within the married-couple family households, those with no children have the highest poverty rate, with 8 households (72.7%) falling below the poverty line. Among the single-parent households, those with 3 or 4 children have the highest poverty rate, with 8 household (100.0%) living below poverty.
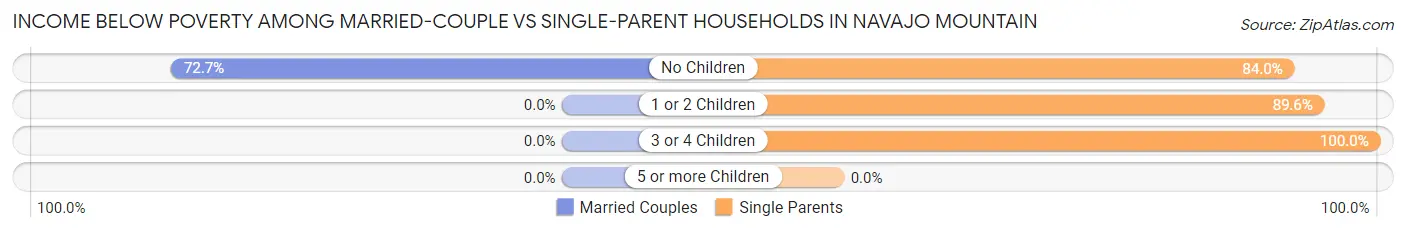
| Children | Married-Couple Families | Single-Parent Households |
| No Children | 8 (72.7%) | 21 (84.0%) |
| 1 or 2 Children | 0 (0.0%) | 69 (89.6%) |
| 3 or 4 Children | 0 (0.0%) | 8 (100.0%) |
| 5 or more Children | 0 (0.0%) | 0 (0.0%) |
| Total | 8 (72.7%) | 98 (89.1%) |
Race in Navajo Mountain
The most populous races in Navajo Mountain are Native / Alaskan (374 | 56.4%), Two or more Races (277 | 41.8%), and Hispanic or Latino (133 | 20.1%).
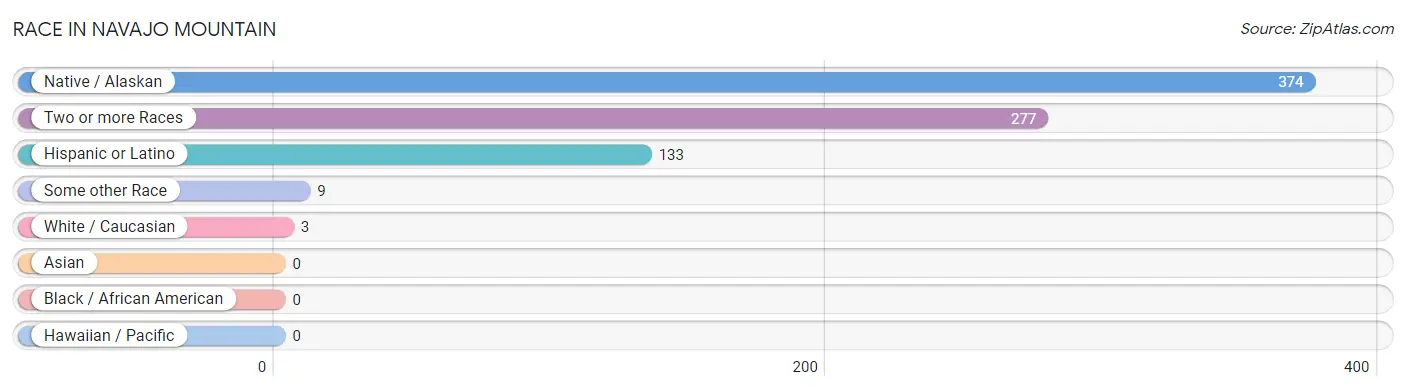
| Race | # Population | % Population |
| Asian | 0 | 0.0% |
| Black / African American | 0 | 0.0% |
| Hawaiian / Pacific | 0 | 0.0% |
| Hispanic or Latino | 133 | 20.1% |
| Native / Alaskan | 374 | 56.4% |
| White / Caucasian | 3 | 0.4% |
| Two or more Races | 277 | 41.8% |
| Some other Race | 9 | 1.4% |
| Total | 663 | 100.0% |
Ancestry in Navajo Mountain
The most populous ancestries reported in Navajo Mountain are Navajo (619 | 93.4%), Mexican (72 | 10.9%), Paiute (25 | 3.8%), South American (9 | 1.4%), and Venezuelan (9 | 1.4%), together accounting for 110.7% of all Navajo Mountain residents.
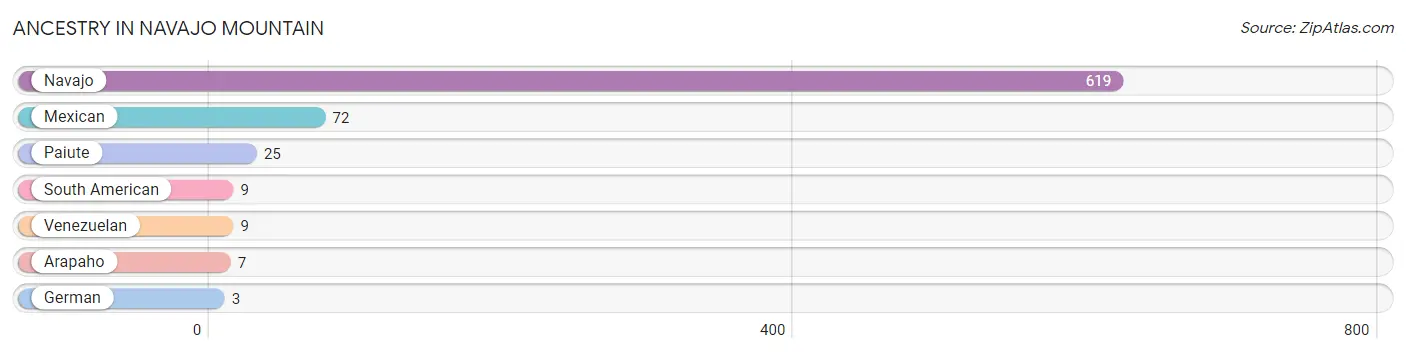
| Ancestry | # Population | % Population |
| Arapaho | 7 | 1.1% |
| German | 3 | 0.4% |
| Mexican | 72 | 10.9% |
| Navajo | 619 | 93.4% |
| Paiute | 25 | 3.8% |
| South American | 9 | 1.4% |
| Venezuelan | 9 | 1.4% | View All 7 Rows |
Immigrants in Navajo Mountain
The most numerous immigrant groups reported in Navajo Mountain came from Latin America (9 | 1.4%), South America (9 | 1.4%), and Venezuela (9 | 1.4%), together accounting for 4.1% of all Navajo Mountain residents.
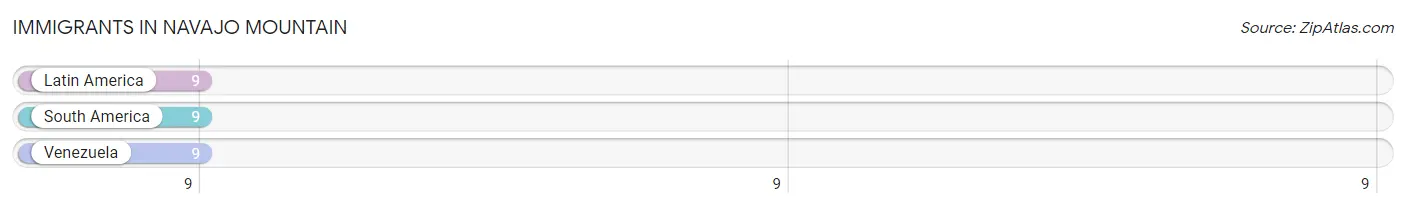
| Immigration Origin | # Population | % Population |
| Latin America | 9 | 1.4% |
| South America | 9 | 1.4% |
| Venezuela | 9 | 1.4% | View All 3 Rows |
Sex and Age in Navajo Mountain
Sex and Age in Navajo Mountain
The most populous age groups in Navajo Mountain are 15 to 19 Years (120 | 37.0%) for men and 15 to 19 Years (131 | 38.6%) for women.
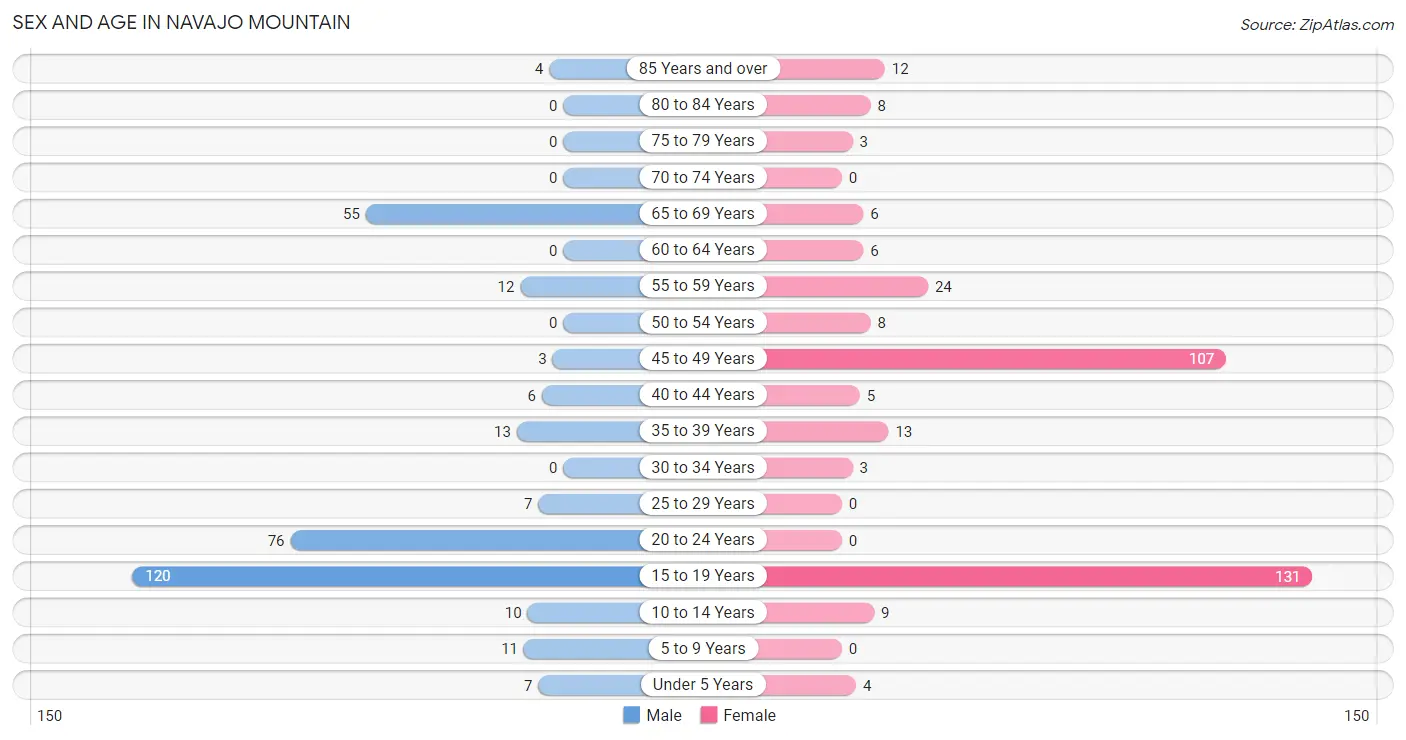
| Age Bracket | Male | Female |
| Under 5 Years | 7 (2.2%) | 4 (1.2%) |
| 5 to 9 Years | 11 (3.4%) | 0 (0.0%) |
| 10 to 14 Years | 10 (3.1%) | 9 (2.6%) |
| 15 to 19 Years | 120 (37.0%) | 131 (38.6%) |
| 20 to 24 Years | 76 (23.5%) | 0 (0.0%) |
| 25 to 29 Years | 7 (2.2%) | 0 (0.0%) |
| 30 to 34 Years | 0 (0.0%) | 3 (0.9%) |
| 35 to 39 Years | 13 (4.0%) | 13 (3.8%) |
| 40 to 44 Years | 6 (1.8%) | 5 (1.5%) |
| 45 to 49 Years | 3 (0.9%) | 107 (31.6%) |
| 50 to 54 Years | 0 (0.0%) | 8 (2.4%) |
| 55 to 59 Years | 12 (3.7%) | 24 (7.1%) |
| 60 to 64 Years | 0 (0.0%) | 6 (1.8%) |
| 65 to 69 Years | 55 (17.0%) | 6 (1.8%) |
| 70 to 74 Years | 0 (0.0%) | 0 (0.0%) |
| 75 to 79 Years | 0 (0.0%) | 3 (0.9%) |
| 80 to 84 Years | 0 (0.0%) | 8 (2.4%) |
| 85 Years and over | 4 (1.2%) | 12 (3.5%) |
| Total | 324 (100.0%) | 339 (100.0%) |
Families and Households in Navajo Mountain
Median Family Size in Navajo Mountain
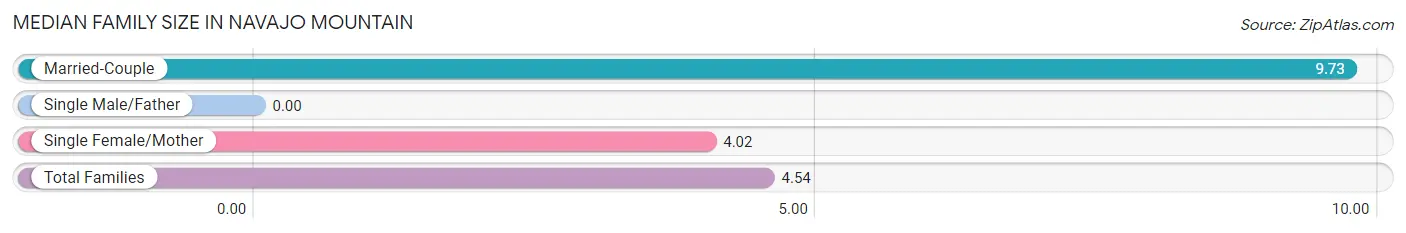
| Family Type | # Families | Family Size |
| Married-Couple | 11 (9.1%) | 9.73 |
| Single Male/Father | 0 (0.0%) | - |
| Single Female/Mother | 110 (90.9%) | 4.02 |
| Total Families | 121 (100.0%) | 4.54 |
Median Household Size in Navajo Mountain
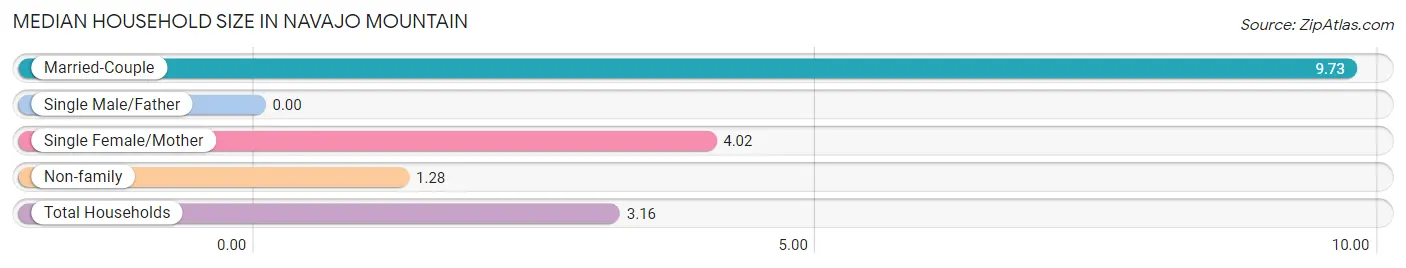
| Household Type | # Households | Household Size |
| Married-Couple | 11 (5.2%) | 9.73 |
| Single Male/Father | 0 (0.0%) | - |
| Single Female/Mother | 110 (52.4%) | 4.02 |
| Non-family | 89 (42.4%) | 1.28 |
| Total Households | 210 (100.0%) | 3.16 |
Household Size by Marriage Status in Navajo Mountain
Out of a total of 210 households in Navajo Mountain, 121 (57.6%) are family households, while 89 (42.4%) are nonfamily households. The most numerous type of family households are 4-person households, comprising 82, and the most common type of nonfamily households are 2-person households, comprising 59.
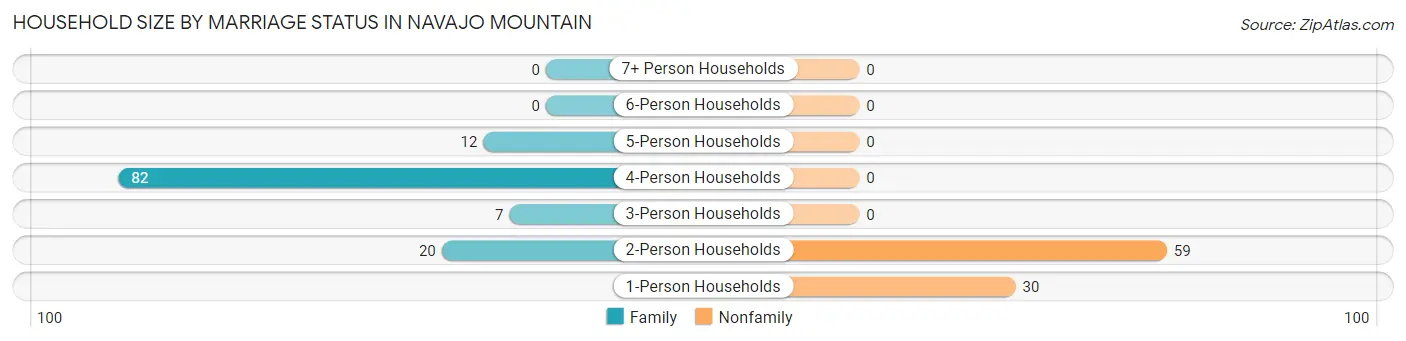
| Household Size | Family Households | Nonfamily Households |
| 1-Person Households | - | 30 (14.3%) |
| 2-Person Households | 20 (9.5%) | 59 (28.1%) |
| 3-Person Households | 7 (3.3%) | 0 (0.0%) |
| 4-Person Households | 82 (39.1%) | 0 (0.0%) |
| 5-Person Households | 12 (5.7%) | 0 (0.0%) |
| 6-Person Households | 0 (0.0%) | 0 (0.0%) |
| 7+ Person Households | 0 (0.0%) | 0 (0.0%) |
| Total | 121 (57.6%) | 89 (42.4%) |
Female Fertility in Navajo Mountain
Fertility by Age in Navajo Mountain
Average fertility rate in Navajo Mountain is 66.0 births per 1,000 women. Women in the age bracket of 35 to 50 years have the highest fertility rate with 136.0 births per 1,000 women. Women in the age bracket of 35 to 50 years acount for 100.0% of all women with births.
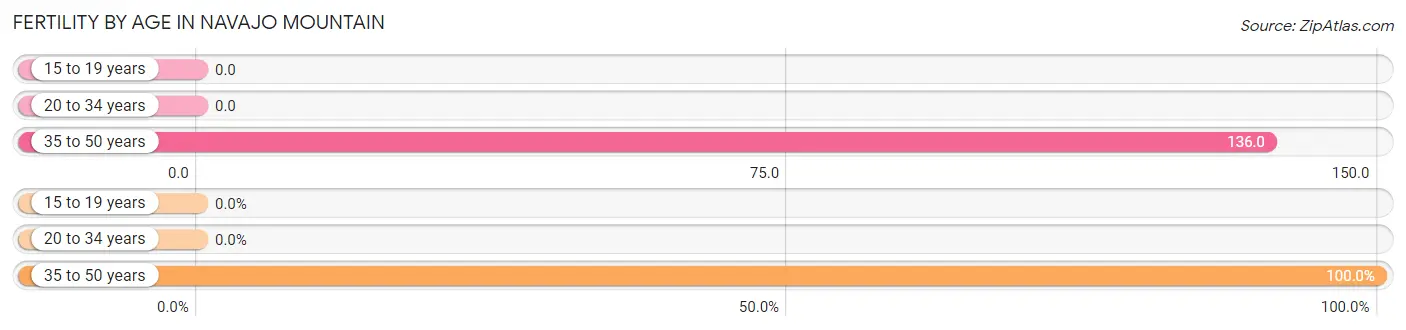
| Age Bracket | Women with Births | Births / 1,000 Women |
| 15 to 19 years | 0 (0.0%) | 0.0 |
| 20 to 34 years | 0 (0.0%) | 0.0 |
| 35 to 50 years | 17 (100.0%) | 136.0 |
| Total | 17 (100.0%) | 66.0 |
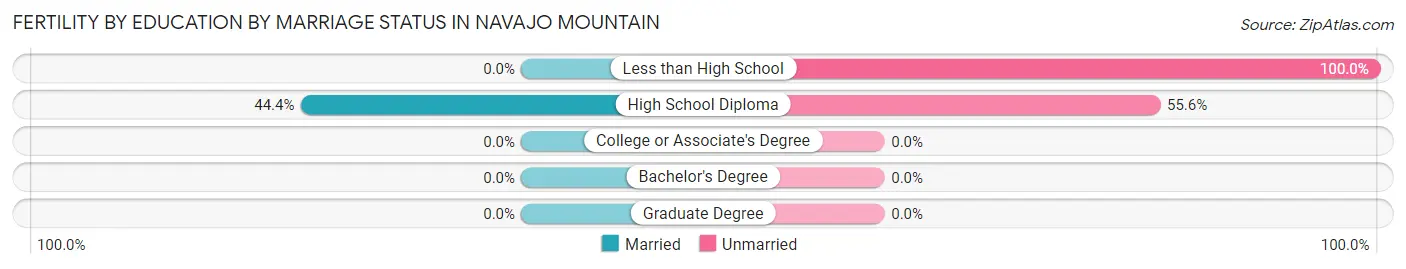
Fertility by Age by Marriage Status in Navajo Mountain
23.5% of women with births (17) in Navajo Mountain are married. The highest percentage of unmarried women with births falls into 35 to 50 years age bracket with 76.5% of them unmarried at the time of birth, while the lowest percentage of unmarried women with births belong to 35 to 50 years age bracket with 76.5% of them unmarried.
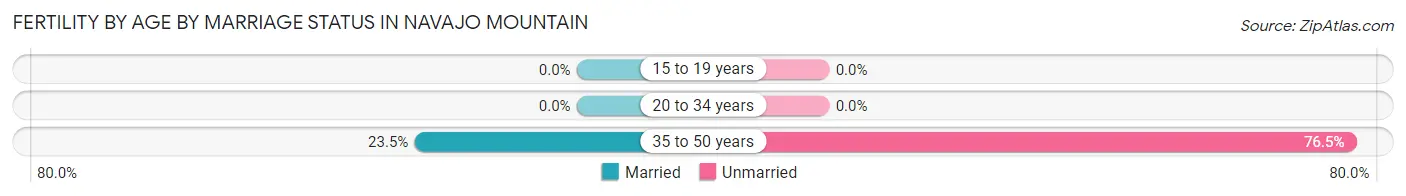
| Age Bracket | Married | Unmarried |
| 15 to 19 years | 0 (0.0%) | 0 (0.0%) |
| 20 to 34 years | 0 (0.0%) | 0 (0.0%) |
| 35 to 50 years | 4 (23.5%) | 13 (76.5%) |
| Total | 4 (23.5%) | 13 (76.5%) |
Fertility by Education in Navajo Mountain
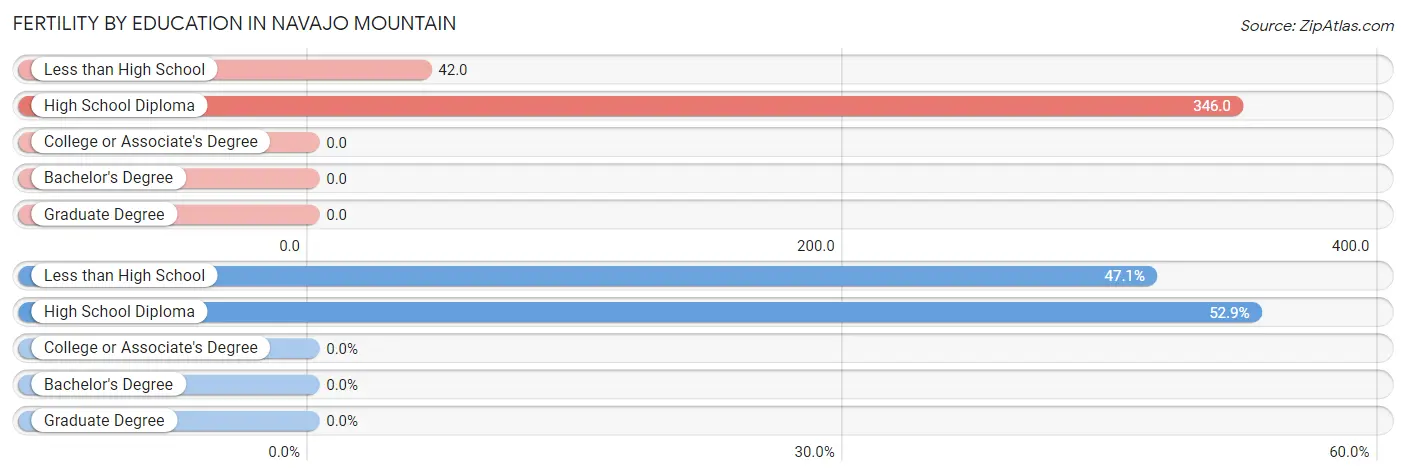
| Educational Attainment | Women with Births | Births / 1,000 Women |
| Less than High School | 8 (47.1%) | 42.0 |
| High School Diploma | 9 (52.9%) | 346.0 |
| College or Associate's Degree | 0 (0.0%) | 0.0 |
| Bachelor's Degree | 0 (0.0%) | 0.0 |
| Graduate Degree | 0 (0.0%) | 0.0 |
| Total | 17 (100.0%) | 66.0 |
Fertility by Education by Marriage Status in Navajo Mountain
76.5% of women with births in Navajo Mountain are unmarried. Women with the educational attainment of high school diploma are most likely to be married with 44.4% of them married at childbirth, while women with the educational attainment of less than high school are least likely to be married with 100.0% of them unmarried at childbirth.
| Educational Attainment | Married | Unmarried |
| Less than High School | 0 (0.0%) | 8 (100.0%) |
| High School Diploma | 4 (44.4%) | 5 (55.6%) |
| College or Associate's Degree | 0 (0.0%) | 0 (0.0%) |
| Bachelor's Degree | 0 (0.0%) | 0 (0.0%) |
| Graduate Degree | 0 (0.0%) | 0 (0.0%) |
| Total | 4 (23.5%) | 13 (76.5%) |
Employment Characteristics in Navajo Mountain
Employment by Class of Employer in Navajo Mountain
Among the 162 employed individuals in Navajo Mountain, state government employees (75 | 46.3%), private company employees (61 | 37.7%), and federal government employees (26 | 16.1%) make up the most common classes of employment.
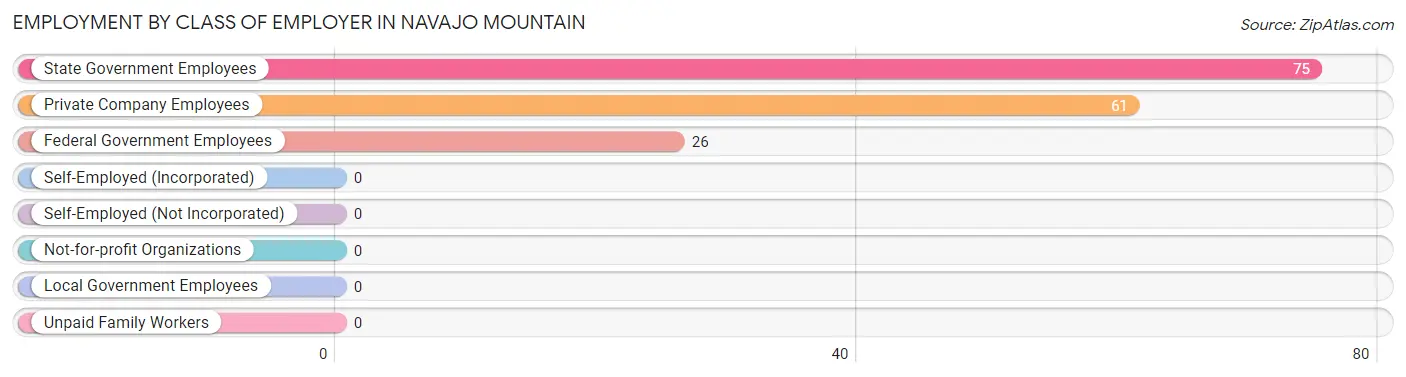
| Employer Class | # Employees | % Employees |
| Private Company Employees | 61 | 37.7% |
| Self-Employed (Incorporated) | 0 | 0.0% |
| Self-Employed (Not Incorporated) | 0 | 0.0% |
| Not-for-profit Organizations | 0 | 0.0% |
| Local Government Employees | 0 | 0.0% |
| State Government Employees | 75 | 46.3% |
| Federal Government Employees | 26 | 16.1% |
| Unpaid Family Workers | 0 | 0.0% |
| Total | 162 | 100.0% |
Employment Status by Age in Navajo Mountain
According to the labor force statistics for Navajo Mountain, out of the total population over 16 years of age (622), 50.6% or 315 individuals are in the labor force, with 48.6% or 153 of them unemployed. The age group with the highest labor force participation rate is 25 to 29 years, with 100.0% or 7 individuals in the labor force. Within the labor force, the 20 to 24 years age range has the highest percentage of unemployed individuals, with 100.0% or 12 of them being unemployed.
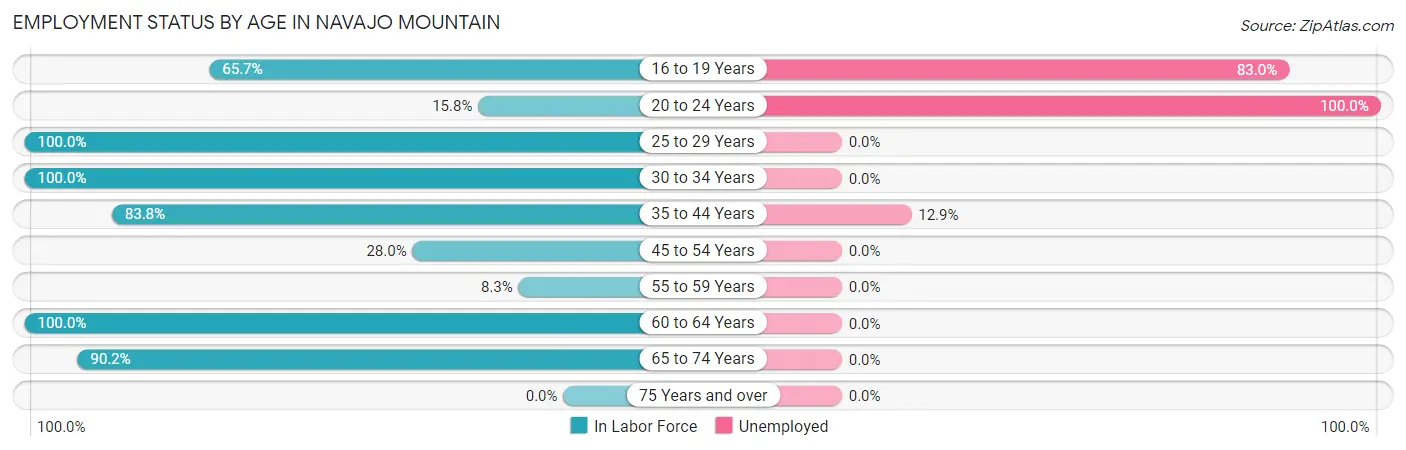
| Age Bracket | In Labor Force | Unemployed |
| 16 to 19 Years | 165 (65.7%) | 137 (83.0%) |
| 20 to 24 Years | 12 (15.8%) | 12 (100.0%) |
| 25 to 29 Years | 7 (100.0%) | 0 (0.0%) |
| 30 to 34 Years | 3 (100.0%) | 0 (0.0%) |
| 35 to 44 Years | 31 (83.8%) | 4 (12.9%) |
| 45 to 54 Years | 33 (28.0%) | 0 (0.0%) |
| 55 to 59 Years | 3 (8.3%) | 0 (0.0%) |
| 60 to 64 Years | 6 (100.0%) | 0 (0.0%) |
| 65 to 74 Years | 55 (90.2%) | 0 (0.0%) |
| 75 Years and over | 0 (0.0%) | 0 (0.0%) |
| Total | 315 (50.6%) | 153 (48.6%) |
Employment Status by Educational Attainment in Navajo Mountain
According to labor force statistics for Navajo Mountain, 40.1% of individuals (83) out of the total population between 25 and 64 years of age (207) are in the labor force, with 4.8% or 4 of them being unemployed. The group with the highest labor force participation rate are those with the educational attainment of college / associate degree, with 87.2% or 41 individuals in the labor force. Within the labor force, individuals with high school diploma education have the highest percentage of unemployment, with 15.4% or 4 of them being unemployed.
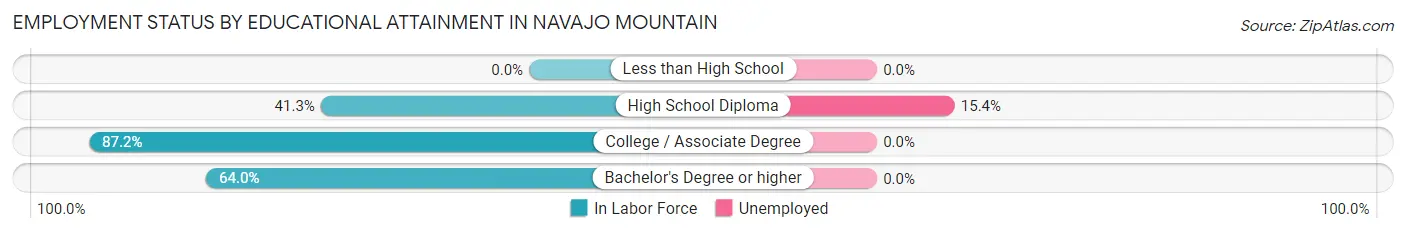
| Educational Attainment | In Labor Force | Unemployed |
| Less than High School | 0 (0.0%) | 0 (0.0%) |
| High School Diploma | 26 (41.3%) | 10 (15.4%) |
| College / Associate Degree | 41 (87.2%) | 0 (0.0%) |
| Bachelor's Degree or higher | 16 (64.0%) | 0 (0.0%) |
| Total | 83 (40.1%) | 10 (4.8%) |
Employment Occupations by Sex in Navajo Mountain
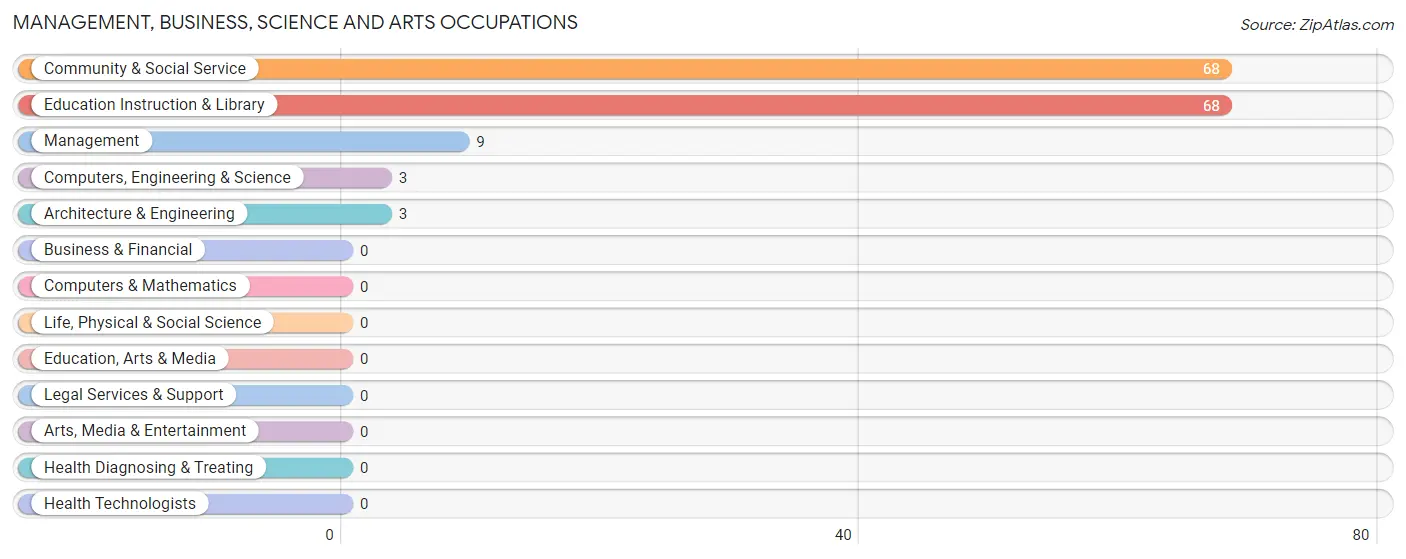
Management, Business, Science and Arts Occupations
The most common Management, Business, Science and Arts occupations in Navajo Mountain are Community & Social Service (68 | 42.0%), Education Instruction & Library (68 | 42.0%), Management (9 | 5.6%), Computers, Engineering & Science (3 | 1.8%), and Architecture & Engineering (3 | 1.8%).
Management, Business, Science and Arts Occupations by Sex
Within the Management, Business, Science and Arts occupations in Navajo Mountain, the most male-oriented occupations are Management (100.0%), Computers, Engineering & Science (100.0%), and Architecture & Engineering (100.0%), while the most female-oriented occupations are Community & Social Service (8.8%), and Education Instruction & Library (8.8%).
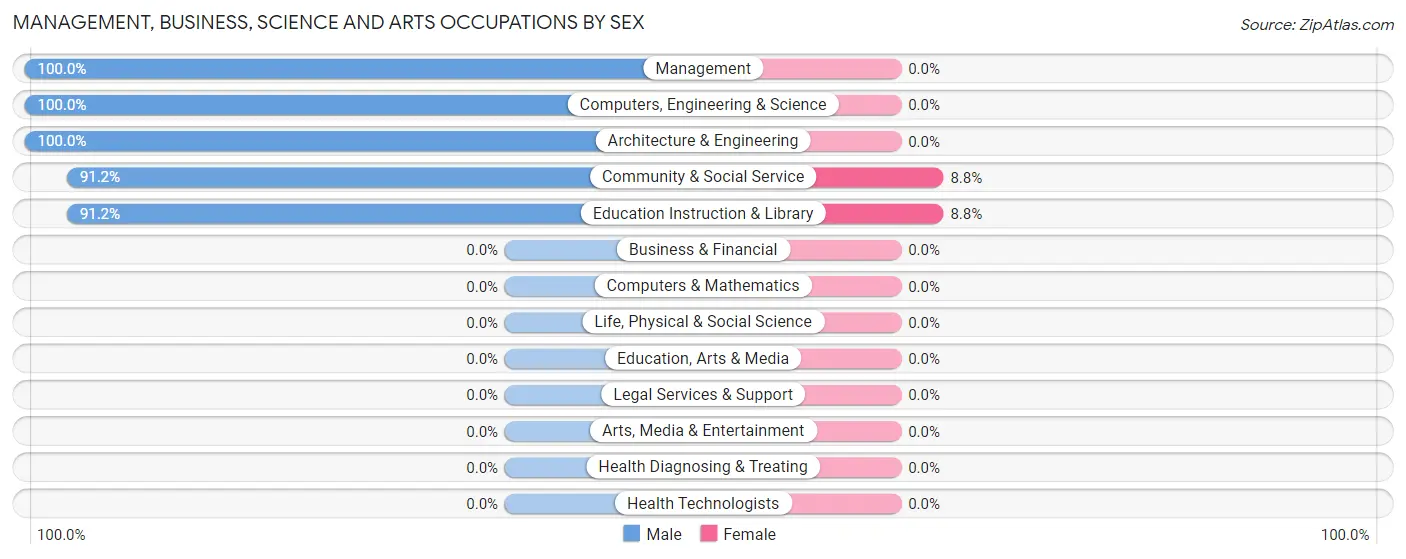
| Occupation | Male | Female |
| Management | 9 (100.0%) | 0 (0.0%) |
| Business & Financial | 0 (0.0%) | 0 (0.0%) |
| Computers, Engineering & Science | 3 (100.0%) | 0 (0.0%) |
| Computers & Mathematics | 0 (0.0%) | 0 (0.0%) |
| Architecture & Engineering | 3 (100.0%) | 0 (0.0%) |
| Life, Physical & Social Science | 0 (0.0%) | 0 (0.0%) |
| Community & Social Service | 62 (91.2%) | 6 (8.8%) |
| Education, Arts & Media | 0 (0.0%) | 0 (0.0%) |
| Legal Services & Support | 0 (0.0%) | 0 (0.0%) |
| Education Instruction & Library | 62 (91.2%) | 6 (8.8%) |
| Arts, Media & Entertainment | 0 (0.0%) | 0 (0.0%) |
| Health Diagnosing & Treating | 0 (0.0%) | 0 (0.0%) |
| Health Technologists | 0 (0.0%) | 0 (0.0%) |
| Total (Category) | 74 (92.5%) | 6 (7.5%) |
| Total (Overall) | 96 (59.3%) | 66 (40.7%) |
Services Occupations
The most common Services occupations in Navajo Mountain are Food Preparation & Serving (22 | 13.6%), Cleaning & Maintenance (14 | 8.6%), Healthcare Support (13 | 8.0%), and Personal Care & Service (5 | 3.1%).
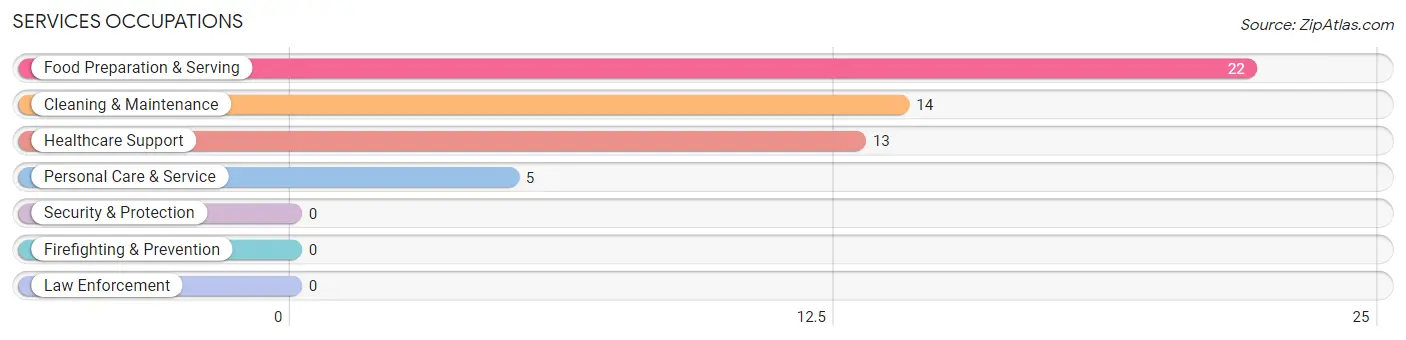
Services Occupations by Sex
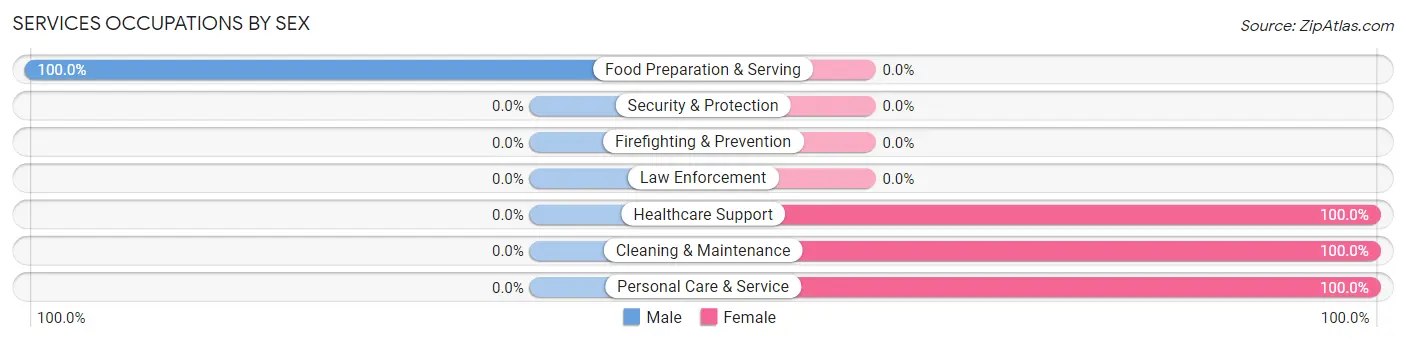
| Occupation | Male | Female |
| Healthcare Support | 0 (0.0%) | 13 (100.0%) |
| Security & Protection | 0 (0.0%) | 0 (0.0%) |
| Firefighting & Prevention | 0 (0.0%) | 0 (0.0%) |
| Law Enforcement | 0 (0.0%) | 0 (0.0%) |
| Food Preparation & Serving | 22 (100.0%) | 0 (0.0%) |
| Cleaning & Maintenance | 0 (0.0%) | 14 (100.0%) |
| Personal Care & Service | 0 (0.0%) | 5 (100.0%) |
| Total (Category) | 22 (40.7%) | 32 (59.3%) |
| Total (Overall) | 96 (59.3%) | 66 (40.7%) |
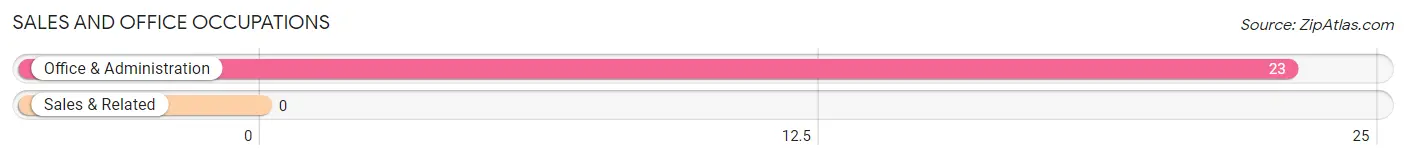
Sales and Office Occupations
The most common Sales and Office occupations in Navajo Mountain are , and Office & Administration (23 | 14.2%).
Sales and Office Occupations by Sex
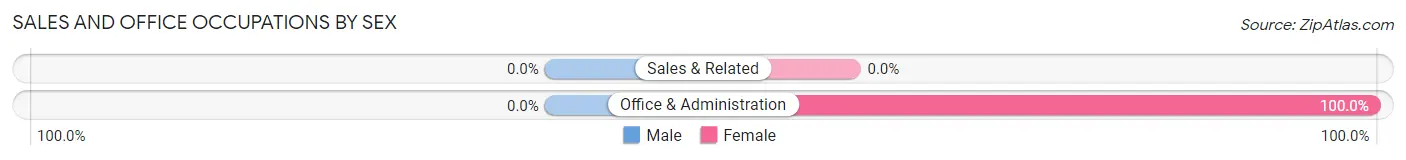
| Occupation | Male | Female |
| Sales & Related | 0 (0.0%) | 0 (0.0%) |
| Office & Administration | 0 (0.0%) | 23 (100.0%) |
| Total (Category) | 0 (0.0%) | 23 (100.0%) |
| Total (Overall) | 96 (59.3%) | 66 (40.7%) |
Natural Resources, Construction and Maintenance Occupations
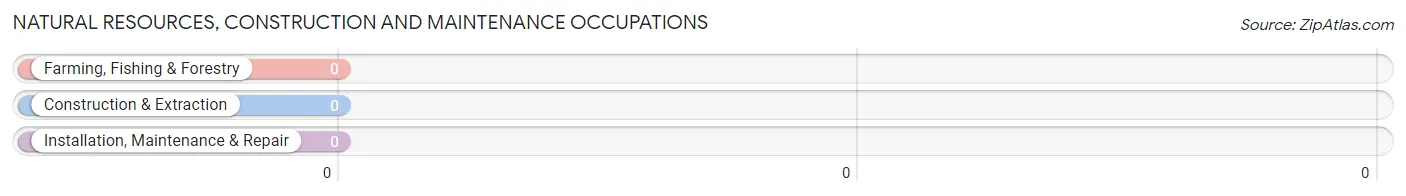
Natural Resources, Construction and Maintenance Occupations by Sex
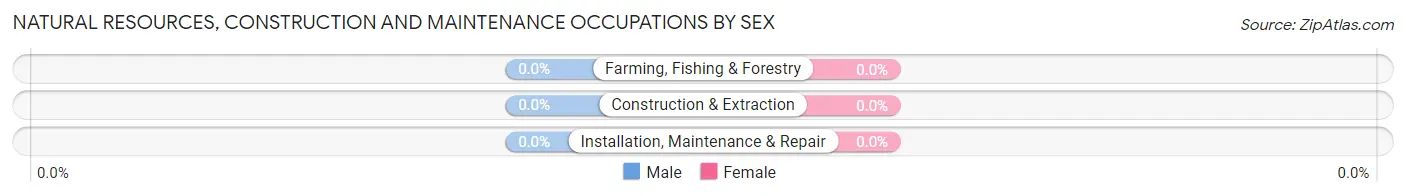
| Occupation | Male | Female |
| Farming, Fishing & Forestry | 0 (0.0%) | 0 (0.0%) |
| Construction & Extraction | 0 (0.0%) | 0 (0.0%) |
| Installation, Maintenance & Repair | 0 (0.0%) | 0 (0.0%) |
| Total (Category) | 0 (0.0%) | 0 (0.0%) |
| Total (Overall) | 96 (59.3%) | 66 (40.7%) |
Production, Transportation and Moving Occupations
The most common Production, Transportation and Moving occupations in Navajo Mountain are , and Transportation (5 | 3.1%).
Production, Transportation and Moving Occupations by Sex
| Occupation | Male | Female |
| Production | 0 (0.0%) | 0 (0.0%) |
| Transportation | 0 (0.0%) | 5 (100.0%) |
| Material Moving | 0 (0.0%) | 0 (0.0%) |
| Total (Category) | 0 (0.0%) | 5 (100.0%) |
| Total (Overall) | 96 (59.3%) | 66 (40.7%) |
Employment Industries by Sex in Navajo Mountain
Employment Industries in Navajo Mountain
The major employment industries in Navajo Mountain include Educational Services (101 | 62.4%), Accommodation & Food Services (36 | 22.2%), Health Care & Social Assistance (13 | 8.0%), Retail Trade (9 | 5.6%), and Manufacturing (3 | 1.8%).
Employment Industries by Sex in Navajo Mountain
The Navajo Mountain industries that see more men than women are Manufacturing (100.0%), Retail Trade (100.0%), and Educational Services (61.4%), whereas the industries that tend to have a higher number of women are Health Care & Social Assistance (100.0%), Accommodation & Food Services (38.9%), and Educational Services (38.6%).
| Industry | Male | Female |
| Agriculture, Fishing & Hunting | 0 (0.0%) | 0 (0.0%) |
| Mining, Quarrying, & Extraction | 0 (0.0%) | 0 (0.0%) |
| Construction | 0 (0.0%) | 0 (0.0%) |
| Manufacturing | 3 (100.0%) | 0 (0.0%) |
| Wholesale Trade | 0 (0.0%) | 0 (0.0%) |
| Retail Trade | 9 (100.0%) | 0 (0.0%) |
| Transportation & Warehousing | 0 (0.0%) | 0 (0.0%) |
| Utilities | 0 (0.0%) | 0 (0.0%) |
| Information | 0 (0.0%) | 0 (0.0%) |
| Finance & Insurance | 0 (0.0%) | 0 (0.0%) |
| Real Estate, Rental & Leasing | 0 (0.0%) | 0 (0.0%) |
| Professional & Scientific | 0 (0.0%) | 0 (0.0%) |
| Enterprise Management | 0 (0.0%) | 0 (0.0%) |
| Administrative & Support | 0 (0.0%) | 0 (0.0%) |
| Educational Services | 62 (61.4%) | 39 (38.6%) |
| Health Care & Social Assistance | 0 (0.0%) | 13 (100.0%) |
| Arts, Entertainment & Recreation | 0 (0.0%) | 0 (0.0%) |
| Accommodation & Food Services | 22 (61.1%) | 14 (38.9%) |
| Public Administration | 0 (0.0%) | 0 (0.0%) |
| Total | 96 (59.3%) | 66 (40.7%) |
Education in Navajo Mountain
School Enrollment in Navajo Mountain
The most common levels of schooling among the 246 students in Navajo Mountain are high school (222 | 90.2%), elementary school (16 | 6.5%), and middle school (5 | 2.0%).
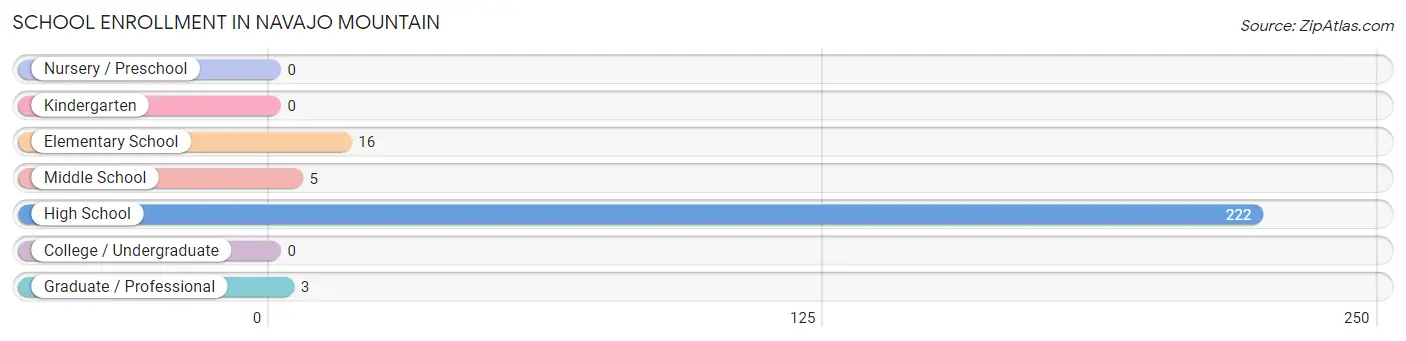
| School Level | # Students | % Students |
| Nursery / Preschool | 0 | 0.0% |
| Kindergarten | 0 | 0.0% |
| Elementary School | 16 | 6.5% |
| Middle School | 5 | 2.0% |
| High School | 222 | 90.2% |
| College / Undergraduate | 0 | 0.0% |
| Graduate / Professional | 3 | 1.2% |
| Total | 246 | 100.0% |
School Enrollment by Age by Funding Source in Navajo Mountain
Out of a total of 246 students who are enrolled in schools in Navajo Mountain, 23 (9.3%) attend a private institution, while the remaining 223 (90.7%) are enrolled in public schools. The age group of 18 to 19 year olds has the highest likelihood of being enrolled in private schools, with 23 (19.5% in the age bracket) enrolled. Conversely, the age group of 5 to 9 year old has the lowest likelihood of being enrolled in a private school, with 11 (100.0% in the age bracket) attending a public institution.
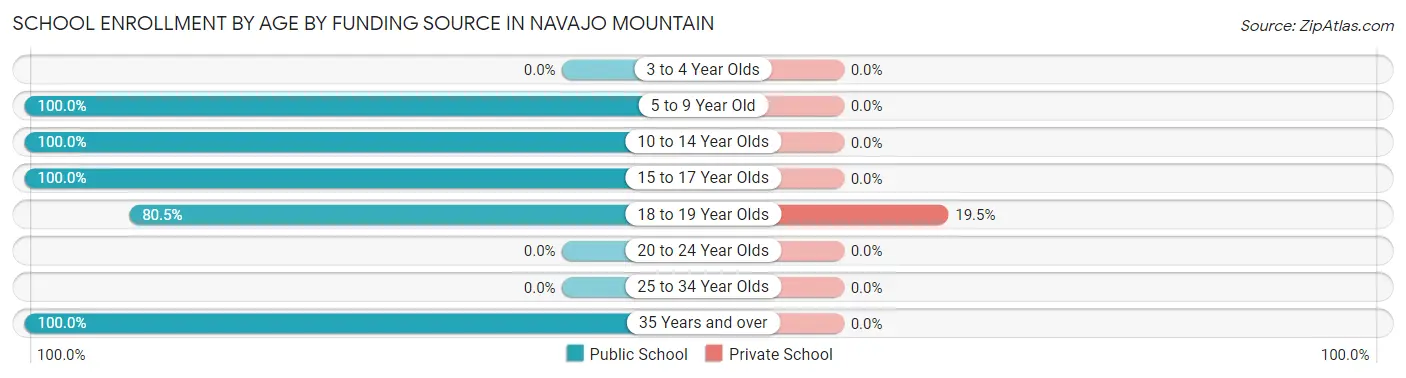
| Age Bracket | Public School | Private School |
| 3 to 4 Year Olds | 0 (0.0%) | 0 (0.0%) |
| 5 to 9 Year Old | 11 (100.0%) | 0 (0.0%) |
| 10 to 14 Year Olds | 19 (100.0%) | 0 (0.0%) |
| 15 to 17 Year Olds | 95 (100.0%) | 0 (0.0%) |
| 18 to 19 Year Olds | 95 (80.5%) | 23 (19.5%) |
| 20 to 24 Year Olds | 0 (0.0%) | 0 (0.0%) |
| 25 to 34 Year Olds | 0 (0.0%) | 0 (0.0%) |
| 35 Years and over | 3 (100.0%) | 0 (0.0%) |
| Total | 223 (90.7%) | 23 (9.3%) |
Educational Attainment by Field of Study in Navajo Mountain
Education (13 | 52.0%), social sciences (9 | 36.0%), and engineering (3 | 12.0%) are the most common fields of study among 25 individuals in Navajo Mountain who have obtained a bachelor's degree or higher.
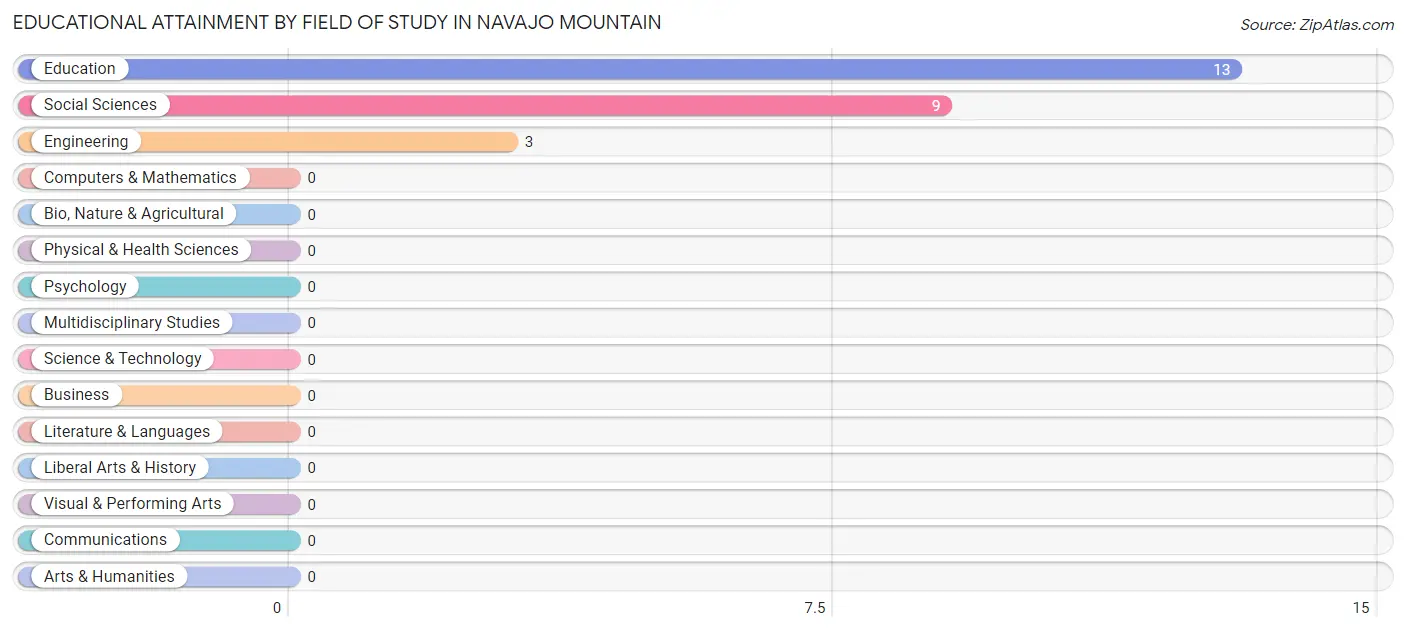
| Field of Study | # Graduates | % Graduates |
| Computers & Mathematics | 0 | 0.0% |
| Bio, Nature & Agricultural | 0 | 0.0% |
| Physical & Health Sciences | 0 | 0.0% |
| Psychology | 0 | 0.0% |
| Social Sciences | 9 | 36.0% |
| Engineering | 3 | 12.0% |
| Multidisciplinary Studies | 0 | 0.0% |
| Science & Technology | 0 | 0.0% |
| Business | 0 | 0.0% |
| Education | 13 | 52.0% |
| Literature & Languages | 0 | 0.0% |
| Liberal Arts & History | 0 | 0.0% |
| Visual & Performing Arts | 0 | 0.0% |
| Communications | 0 | 0.0% |
| Arts & Humanities | 0 | 0.0% |
| Total | 25 | 100.0% |
Transportation & Commute in Navajo Mountain
Vehicle Availability by Sex in Navajo Mountain
The most prevalent vehicle ownership categories in Navajo Mountain are males with 3 vehicles (55, accounting for 57.3%) and females with 3 vehicles (20, making up 83.3%).
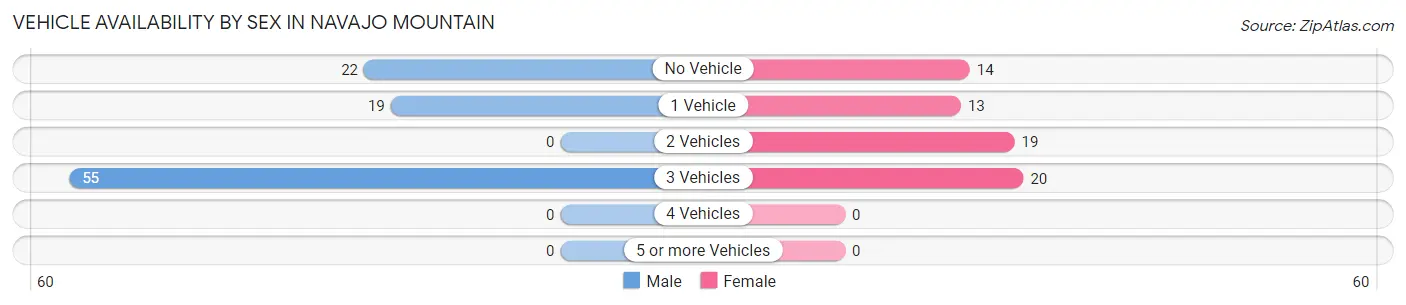
| Vehicles Available | Male | Female |
| No Vehicle | 22 (22.9%) | 14 (21.2%) |
| 1 Vehicle | 19 (19.8%) | 13 (19.7%) |
| 2 Vehicles | 0 (0.0%) | 19 (28.8%) |
| 3 Vehicles | 55 (57.3%) | 20 (30.3%) |
| 4 Vehicles | 0 (0.0%) | 0 (0.0%) |
| 5 or more Vehicles | 0 (0.0%) | 0 (0.0%) |
| Total | 96 (100.0%) | 66 (100.0%) |
Commute Time in Navajo Mountain
The most frequently occuring commute durations in Navajo Mountain are less than 5 minutes (91 commuters, 59.1%), 5 to 9 minutes (22 commuters, 14.3%), and 45 to 59 minutes (22 commuters, 14.3%).
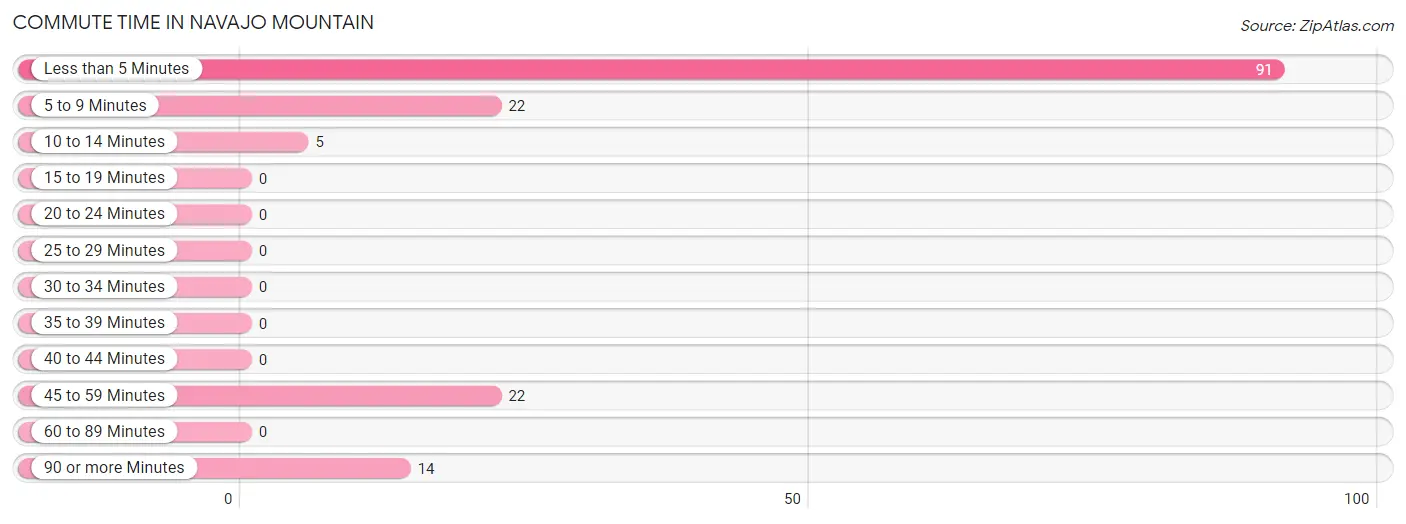
| Commute Time | # Commuters | % Commuters |
| Less than 5 Minutes | 91 | 59.1% |
| 5 to 9 Minutes | 22 | 14.3% |
| 10 to 14 Minutes | 5 | 3.3% |
| 15 to 19 Minutes | 0 | 0.0% |
| 20 to 24 Minutes | 0 | 0.0% |
| 25 to 29 Minutes | 0 | 0.0% |
| 30 to 34 Minutes | 0 | 0.0% |
| 35 to 39 Minutes | 0 | 0.0% |
| 40 to 44 Minutes | 0 | 0.0% |
| 45 to 59 Minutes | 22 | 14.3% |
| 60 to 89 Minutes | 0 | 0.0% |
| 90 or more Minutes | 14 | 9.1% |
Commute Time by Sex in Navajo Mountain
The most common commute times in Navajo Mountain are less than 5 minutes (55 commuters, 57.3%) for males and less than 5 minutes (36 commuters, 62.1%) for females.
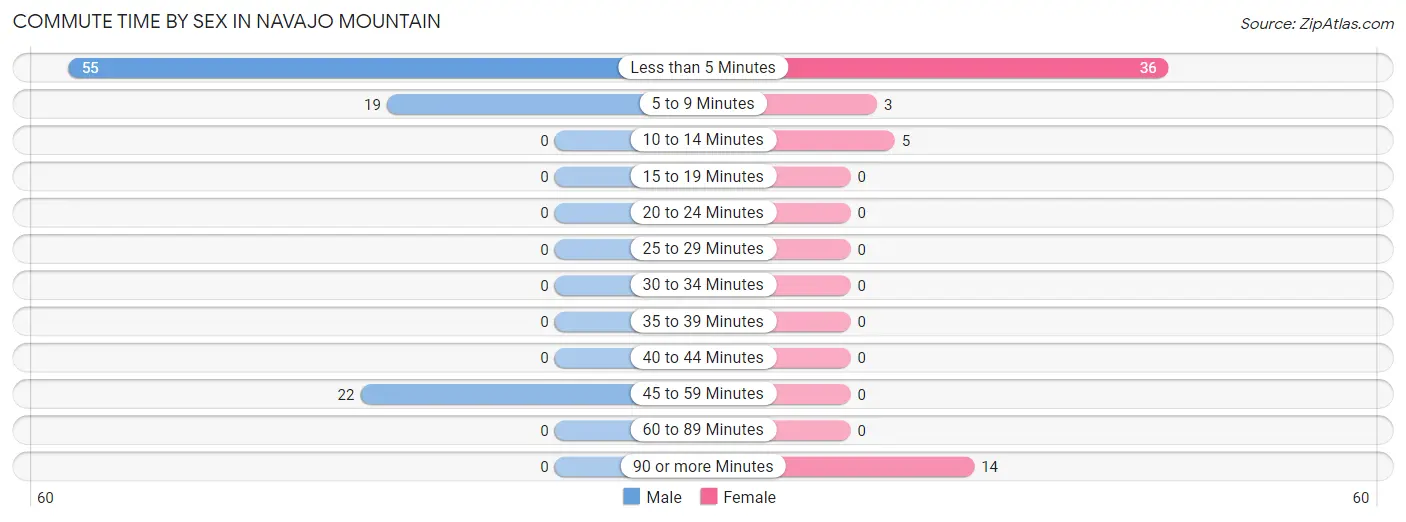
| Commute Time | Male | Female |
| Less than 5 Minutes | 55 (57.3%) | 36 (62.1%) |
| 5 to 9 Minutes | 19 (19.8%) | 3 (5.2%) |
| 10 to 14 Minutes | 0 (0.0%) | 5 (8.6%) |
| 15 to 19 Minutes | 0 (0.0%) | 0 (0.0%) |
| 20 to 24 Minutes | 0 (0.0%) | 0 (0.0%) |
| 25 to 29 Minutes | 0 (0.0%) | 0 (0.0%) |
| 30 to 34 Minutes | 0 (0.0%) | 0 (0.0%) |
| 35 to 39 Minutes | 0 (0.0%) | 0 (0.0%) |
| 40 to 44 Minutes | 0 (0.0%) | 0 (0.0%) |
| 45 to 59 Minutes | 22 (22.9%) | 0 (0.0%) |
| 60 to 89 Minutes | 0 (0.0%) | 0 (0.0%) |
| 90 or more Minutes | 0 (0.0%) | 14 (24.1%) |
Time of Departure to Work by Sex in Navajo Mountain
The most frequent times of departure to work in Navajo Mountain are 7:00 AM to 7:29 AM (74, 77.1%) for males and 7:00 AM to 7:29 AM (20, 34.5%) for females.
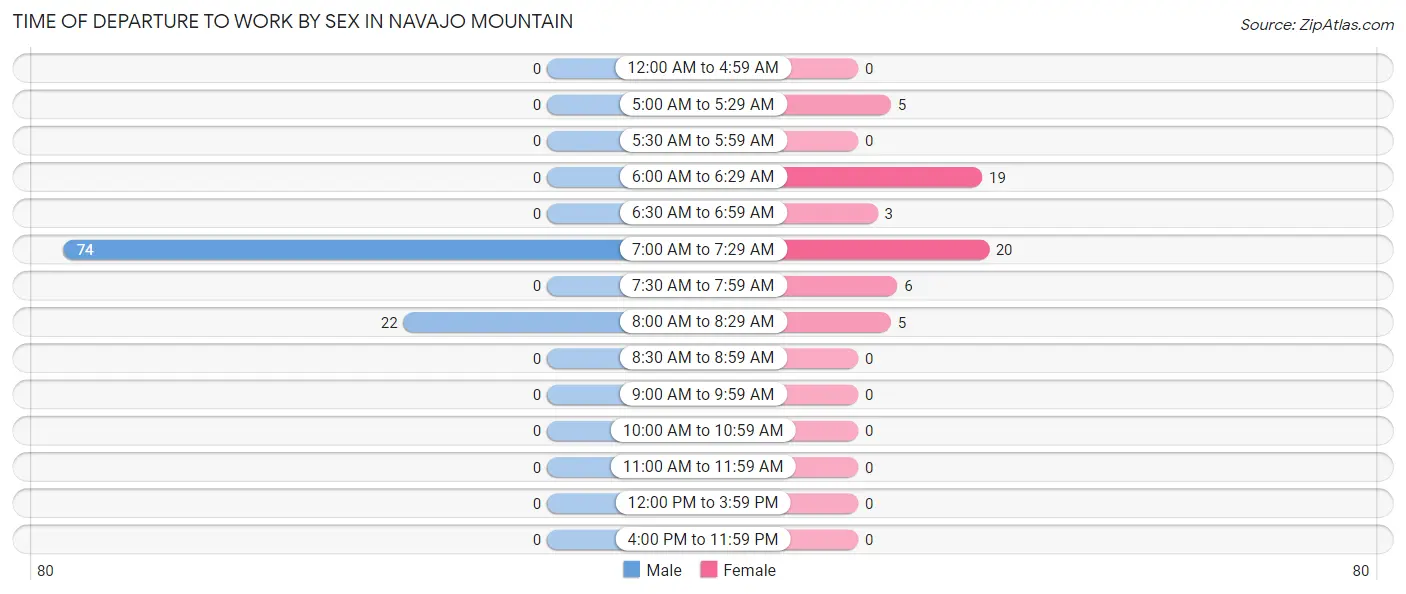
| Time of Departure | Male | Female |
| 12:00 AM to 4:59 AM | 0 (0.0%) | 0 (0.0%) |
| 5:00 AM to 5:29 AM | 0 (0.0%) | 5 (8.6%) |
| 5:30 AM to 5:59 AM | 0 (0.0%) | 0 (0.0%) |
| 6:00 AM to 6:29 AM | 0 (0.0%) | 19 (32.8%) |
| 6:30 AM to 6:59 AM | 0 (0.0%) | 3 (5.2%) |
| 7:00 AM to 7:29 AM | 74 (77.1%) | 20 (34.5%) |
| 7:30 AM to 7:59 AM | 0 (0.0%) | 6 (10.3%) |
| 8:00 AM to 8:29 AM | 22 (22.9%) | 5 (8.6%) |
| 8:30 AM to 8:59 AM | 0 (0.0%) | 0 (0.0%) |
| 9:00 AM to 9:59 AM | 0 (0.0%) | 0 (0.0%) |
| 10:00 AM to 10:59 AM | 0 (0.0%) | 0 (0.0%) |
| 11:00 AM to 11:59 AM | 0 (0.0%) | 0 (0.0%) |
| 12:00 PM to 3:59 PM | 0 (0.0%) | 0 (0.0%) |
| 4:00 PM to 11:59 PM | 0 (0.0%) | 0 (0.0%) |
| Total | 96 (100.0%) | 58 (100.0%) |
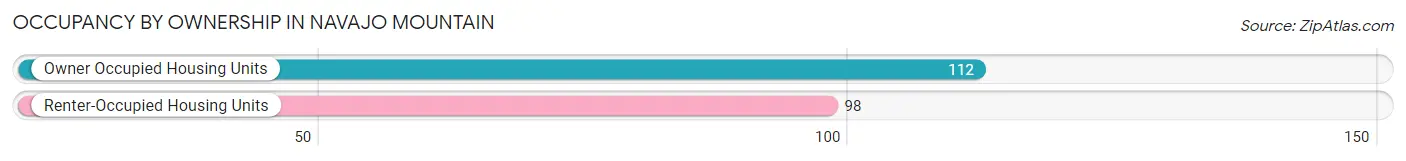
Housing Occupancy in Navajo Mountain
Occupancy by Ownership in Navajo Mountain
Of the total 210 dwellings in Navajo Mountain, owner-occupied units account for 112 (53.3%), while renter-occupied units make up 98 (46.7%).
| Occupancy | # Housing Units | % Housing Units |
| Owner Occupied Housing Units | 112 | 53.3% |
| Renter-Occupied Housing Units | 98 | 46.7% |
| Total Occupied Housing Units | 210 | 100.0% |
Occupancy by Household Size in Navajo Mountain
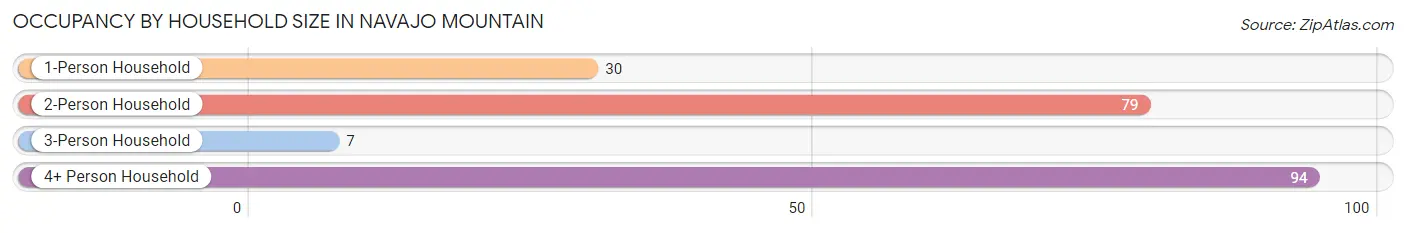
| Household Size | # Housing Units | % Housing Units |
| 1-Person Household | 30 | 14.3% |
| 2-Person Household | 79 | 37.6% |
| 3-Person Household | 7 | 3.3% |
| 4+ Person Household | 94 | 44.8% |
| Total Housing Units | 210 | 100.0% |
Occupancy by Ownership by Household Size in Navajo Mountain
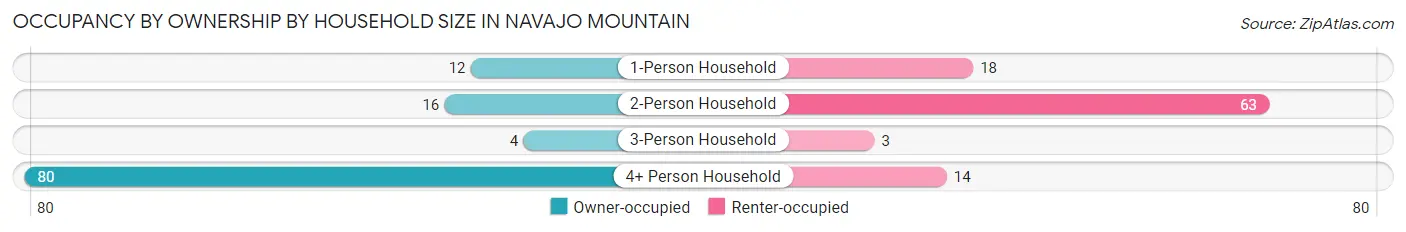
| Household Size | Owner-occupied | Renter-occupied |
| 1-Person Household | 12 (40.0%) | 18 (60.0%) |
| 2-Person Household | 16 (20.3%) | 63 (79.7%) |
| 3-Person Household | 4 (57.1%) | 3 (42.9%) |
| 4+ Person Household | 80 (85.1%) | 14 (14.9%) |
| Total Housing Units | 112 (53.3%) | 98 (46.7%) |
Occupancy by Educational Attainment in Navajo Mountain
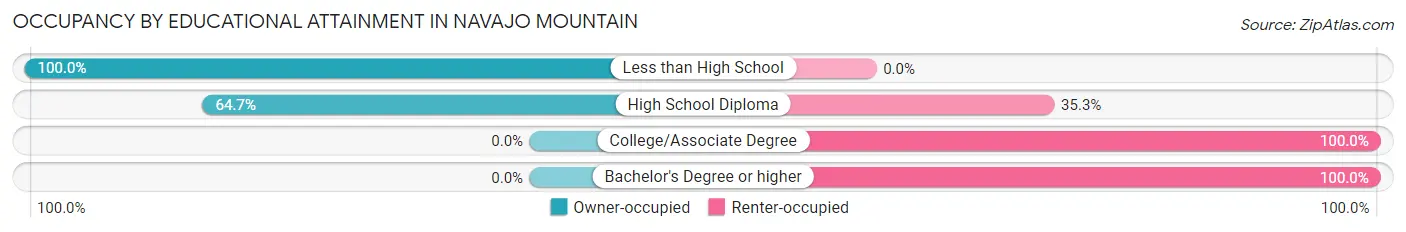
| Household Size | Owner-occupied | Renter-occupied |
| Less than High School | 101 (100.0%) | 0 (0.0%) |
| High School Diploma | 11 (64.7%) | 6 (35.3%) |
| College/Associate Degree | 0 (0.0%) | 76 (100.0%) |
| Bachelor's Degree or higher | 0 (0.0%) | 16 (100.0%) |
Occupancy by Age of Householder in Navajo Mountain
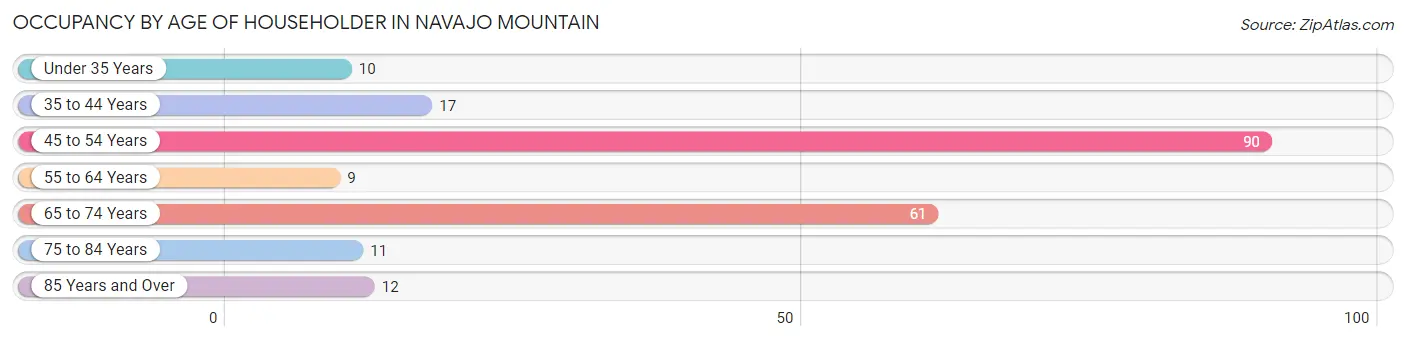
| Age Bracket | # Households | % Households |
| Under 35 Years | 10 | 4.8% |
| 35 to 44 Years | 17 | 8.1% |
| 45 to 54 Years | 90 | 42.9% |
| 55 to 64 Years | 9 | 4.3% |
| 65 to 74 Years | 61 | 29.0% |
| 75 to 84 Years | 11 | 5.2% |
| 85 Years and Over | 12 | 5.7% |
| Total | 210 | 100.0% |
Housing Finances in Navajo Mountain
Median Income by Occupancy in Navajo Mountain
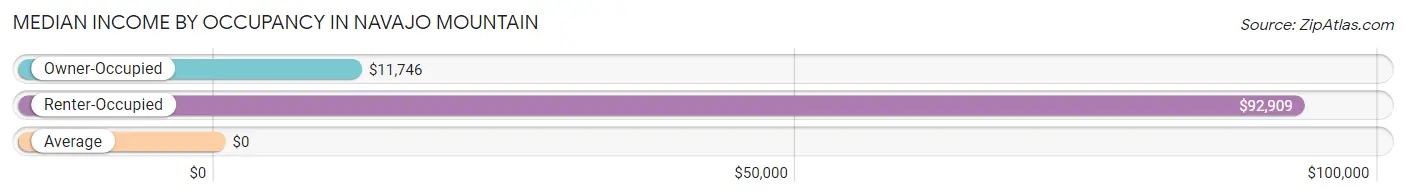
| Occupancy Type | # Households | Median Income |
| Owner-Occupied | 112 (53.3%) | $11,746 |
| Renter-Occupied | 98 (46.7%) | $92,909 |
| Average | 210 (100.0%) | $0 |
Occupancy by Householder Income Bracket in Navajo Mountain
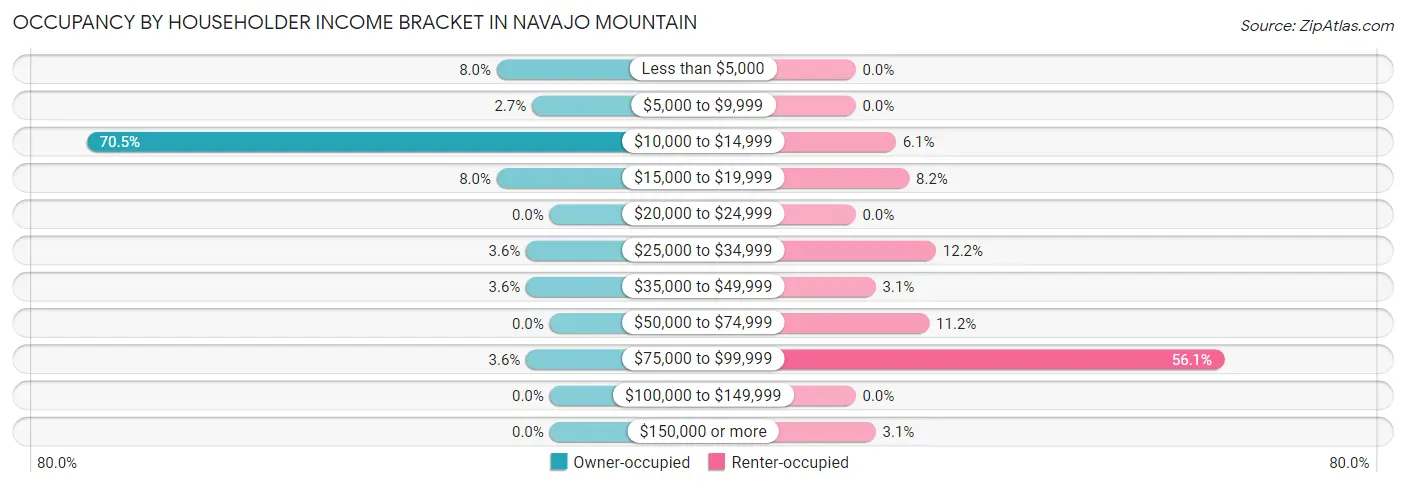
| Income Bracket | Owner-occupied | Renter-occupied |
| Less than $5,000 | 9 (8.0%) | 0 (0.0%) |
| $5,000 to $9,999 | 3 (2.7%) | 0 (0.0%) |
| $10,000 to $14,999 | 79 (70.5%) | 6 (6.1%) |
| $15,000 to $19,999 | 9 (8.0%) | 8 (8.2%) |
| $20,000 to $24,999 | 0 (0.0%) | 0 (0.0%) |
| $25,000 to $34,999 | 4 (3.6%) | 12 (12.2%) |
| $35,000 to $49,999 | 4 (3.6%) | 3 (3.1%) |
| $50,000 to $74,999 | 0 (0.0%) | 11 (11.2%) |
| $75,000 to $99,999 | 4 (3.6%) | 55 (56.1%) |
| $100,000 to $149,999 | 0 (0.0%) | 0 (0.0%) |
| $150,000 or more | 0 (0.0%) | 3 (3.1%) |
| Total | 112 (100.0%) | 98 (100.0%) |
Monthly Housing Cost Tiers in Navajo Mountain
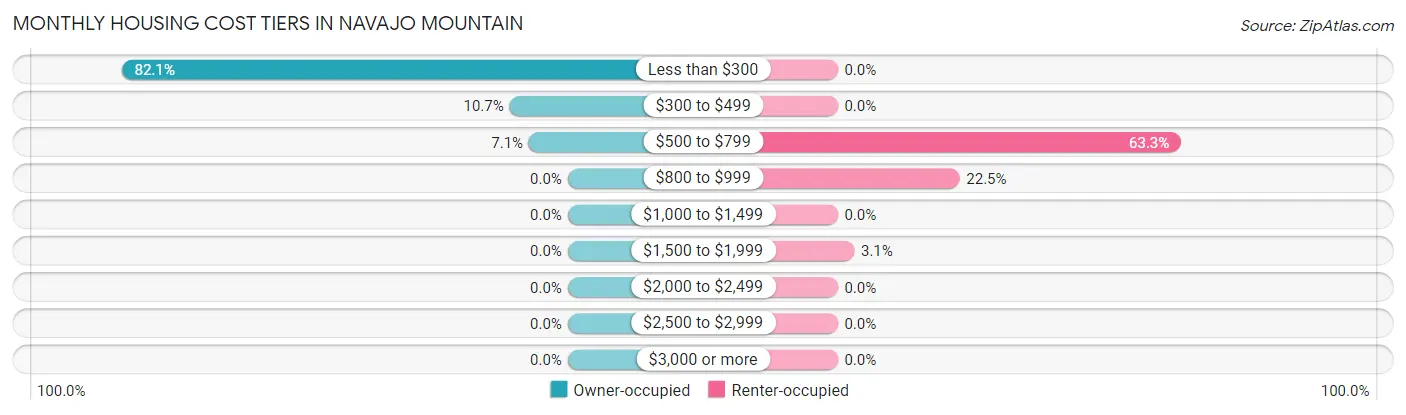
| Monthly Cost | Owner-occupied | Renter-occupied |
| Less than $300 | 92 (82.1%) | 0 (0.0%) |
| $300 to $499 | 12 (10.7%) | 0 (0.0%) |
| $500 to $799 | 8 (7.1%) | 62 (63.3%) |
| $800 to $999 | 0 (0.0%) | 22 (22.5%) |
| $1,000 to $1,499 | 0 (0.0%) | 0 (0.0%) |
| $1,500 to $1,999 | 0 (0.0%) | 3 (3.1%) |
| $2,000 to $2,499 | 0 (0.0%) | 0 (0.0%) |
| $2,500 to $2,999 | 0 (0.0%) | 0 (0.0%) |
| $3,000 or more | 0 (0.0%) | 0 (0.0%) |
| Total | 112 (100.0%) | 98 (100.0%) |
Physical Housing Characteristics in Navajo Mountain
Housing Structures in Navajo Mountain
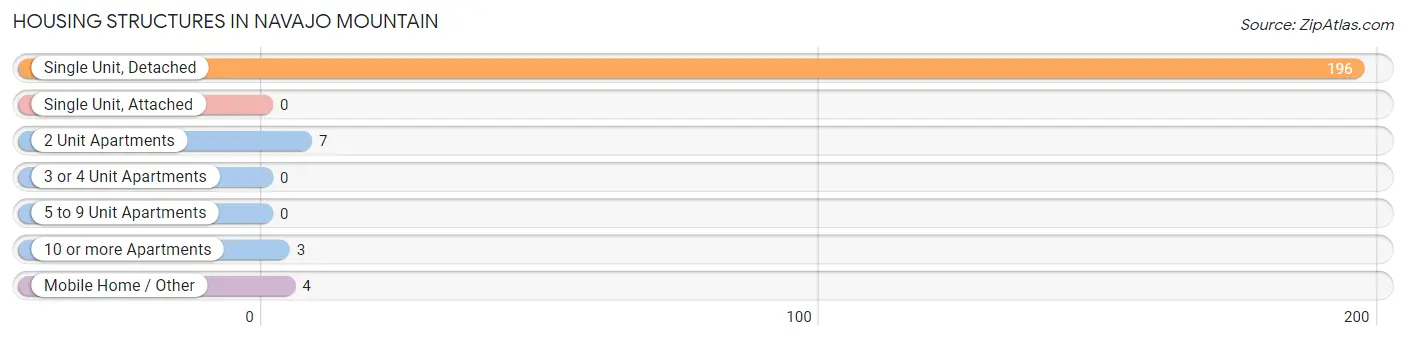
| Structure Type | # Housing Units | % Housing Units |
| Single Unit, Detached | 196 | 93.3% |
| Single Unit, Attached | 0 | 0.0% |
| 2 Unit Apartments | 7 | 3.3% |
| 3 or 4 Unit Apartments | 0 | 0.0% |
| 5 to 9 Unit Apartments | 0 | 0.0% |
| 10 or more Apartments | 3 | 1.4% |
| Mobile Home / Other | 4 | 1.9% |
| Total | 210 | 100.0% |
Housing Structures by Occupancy in Navajo Mountain
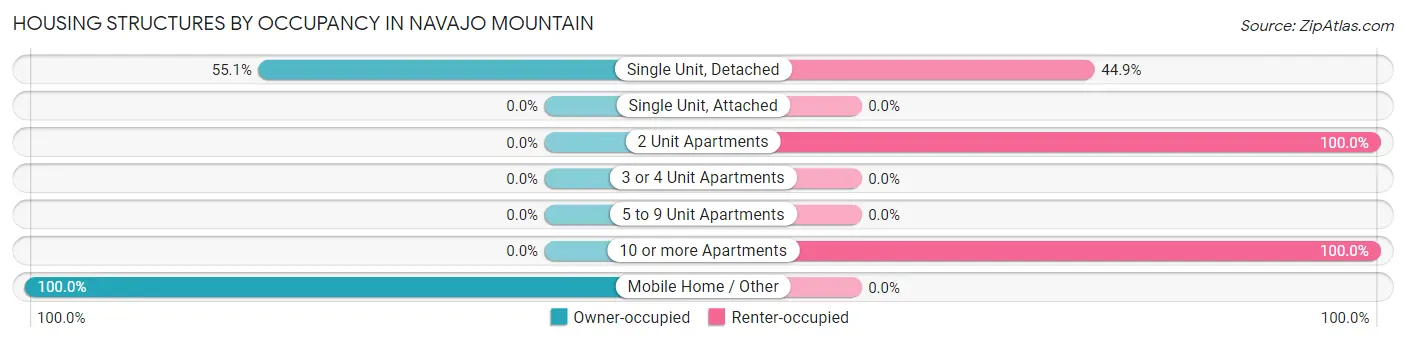
| Structure Type | Owner-occupied | Renter-occupied |
| Single Unit, Detached | 108 (55.1%) | 88 (44.9%) |
| Single Unit, Attached | 0 (0.0%) | 0 (0.0%) |
| 2 Unit Apartments | 0 (0.0%) | 7 (100.0%) |
| 3 or 4 Unit Apartments | 0 (0.0%) | 0 (0.0%) |
| 5 to 9 Unit Apartments | 0 (0.0%) | 0 (0.0%) |
| 10 or more Apartments | 0 (0.0%) | 3 (100.0%) |
| Mobile Home / Other | 4 (100.0%) | 0 (0.0%) |
| Total | 112 (53.3%) | 98 (46.7%) |
Housing Structures by Number of Rooms in Navajo Mountain
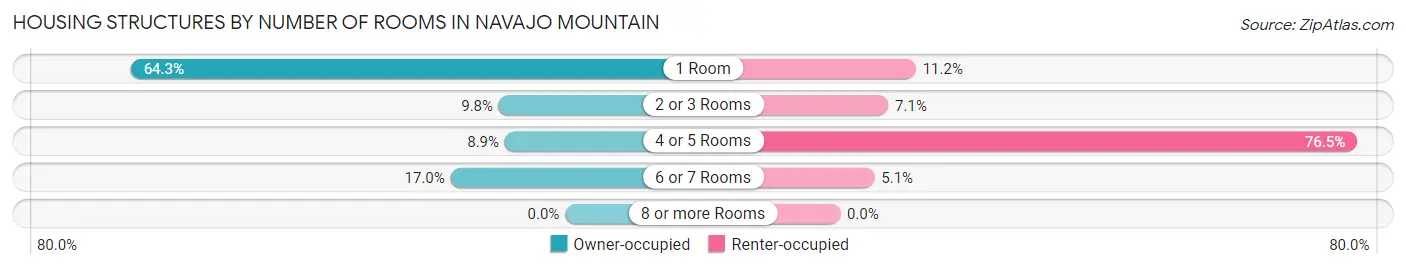
| Number of Rooms | Owner-occupied | Renter-occupied |
| 1 Room | 72 (64.3%) | 11 (11.2%) |
| 2 or 3 Rooms | 11 (9.8%) | 7 (7.1%) |
| 4 or 5 Rooms | 10 (8.9%) | 75 (76.5%) |
| 6 or 7 Rooms | 19 (17.0%) | 5 (5.1%) |
| 8 or more Rooms | 0 (0.0%) | 0 (0.0%) |
| Total | 112 (100.0%) | 98 (100.0%) |
Housing Structure by Heating Type in Navajo Mountain
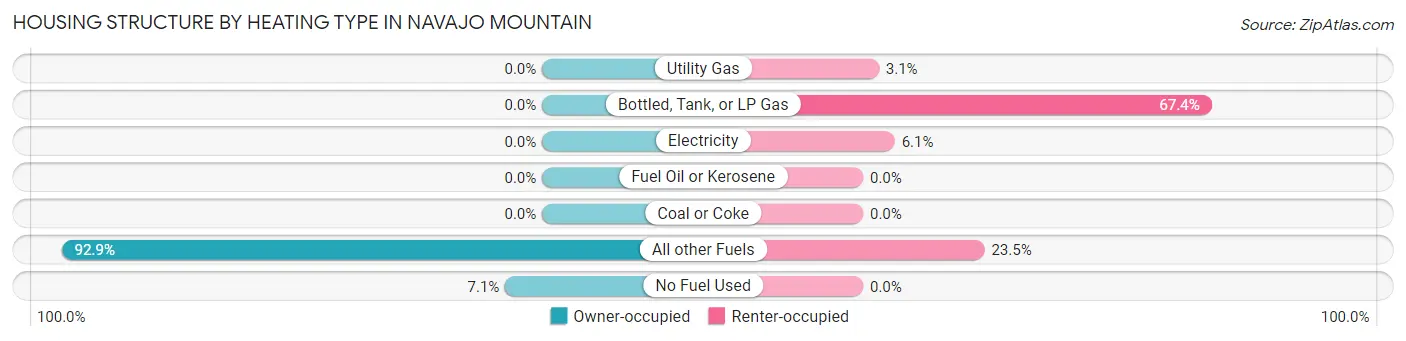
| Heating Type | Owner-occupied | Renter-occupied |
| Utility Gas | 0 (0.0%) | 3 (3.1%) |
| Bottled, Tank, or LP Gas | 0 (0.0%) | 66 (67.3%) |
| Electricity | 0 (0.0%) | 6 (6.1%) |
| Fuel Oil or Kerosene | 0 (0.0%) | 0 (0.0%) |
| Coal or Coke | 0 (0.0%) | 0 (0.0%) |
| All other Fuels | 104 (92.9%) | 23 (23.5%) |
| No Fuel Used | 8 (7.1%) | 0 (0.0%) |
| Total | 112 (100.0%) | 98 (100.0%) |
Household Vehicle Usage in Navajo Mountain
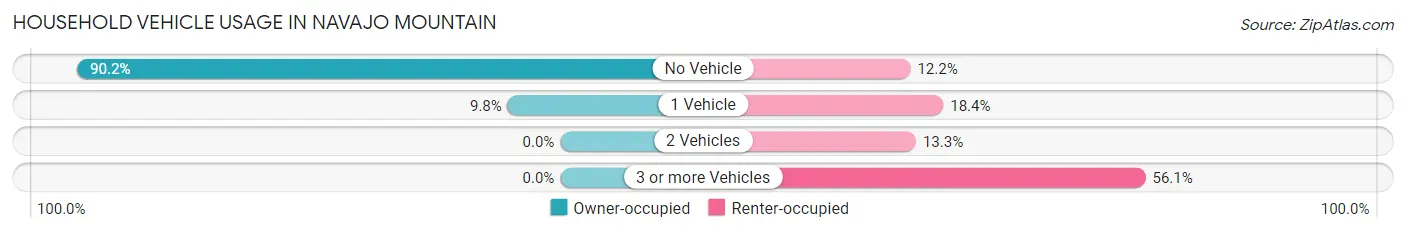
| Vehicles per Household | Owner-occupied | Renter-occupied |
| No Vehicle | 101 (90.2%) | 12 (12.2%) |
| 1 Vehicle | 11 (9.8%) | 18 (18.4%) |
| 2 Vehicles | 0 (0.0%) | 13 (13.3%) |
| 3 or more Vehicles | 0 (0.0%) | 55 (56.1%) |
| Total | 112 (100.0%) | 98 (100.0%) |
Real Estate & Mortgages in Navajo Mountain
Real Estate and Mortgage Overview in Navajo Mountain
| Characteristic | Without Mortgage | With Mortgage |
| Housing Units | 112 | 0 |
| Median Property Value | $9,999 | $0 |
| Median Household Income | $11,746 | $0 |
| Monthly Housing Costs | $147 | $0 |
| Real Estate Taxes | - | - |
Property Value by Mortgage Status in Navajo Mountain
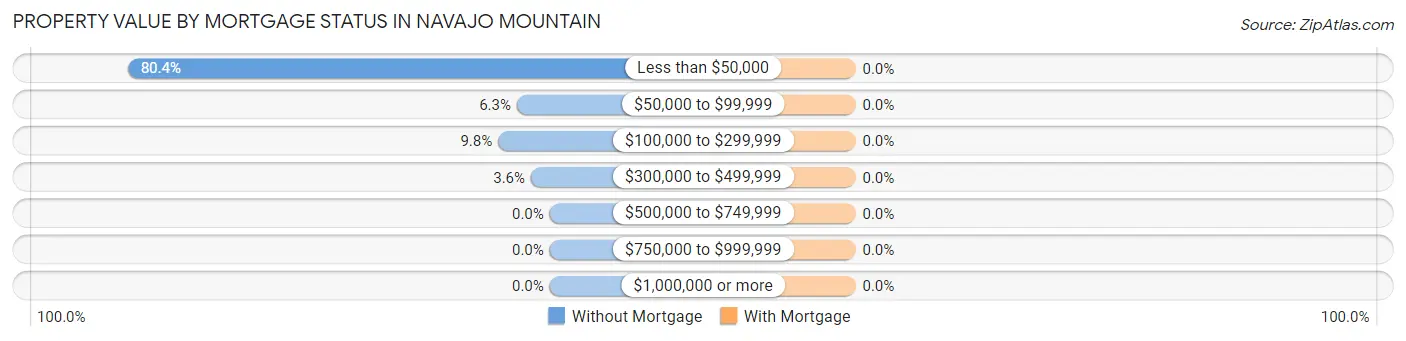
| Property Value | Without Mortgage | With Mortgage |
| Less than $50,000 | 90 (80.4%) | 0 (0.0%) |
| $50,000 to $99,999 | 7 (6.2%) | 0 (0.0%) |
| $100,000 to $299,999 | 11 (9.8%) | 0 (0.0%) |
| $300,000 to $499,999 | 4 (3.6%) | 0 (0.0%) |
| $500,000 to $749,999 | 0 (0.0%) | 0 (0.0%) |
| $750,000 to $999,999 | 0 (0.0%) | 0 (0.0%) |
| $1,000,000 or more | 0 (0.0%) | 0 (0.0%) |
| Total | 112 (100.0%) | 0 (0.0%) |
Household Income by Mortgage Status in Navajo Mountain
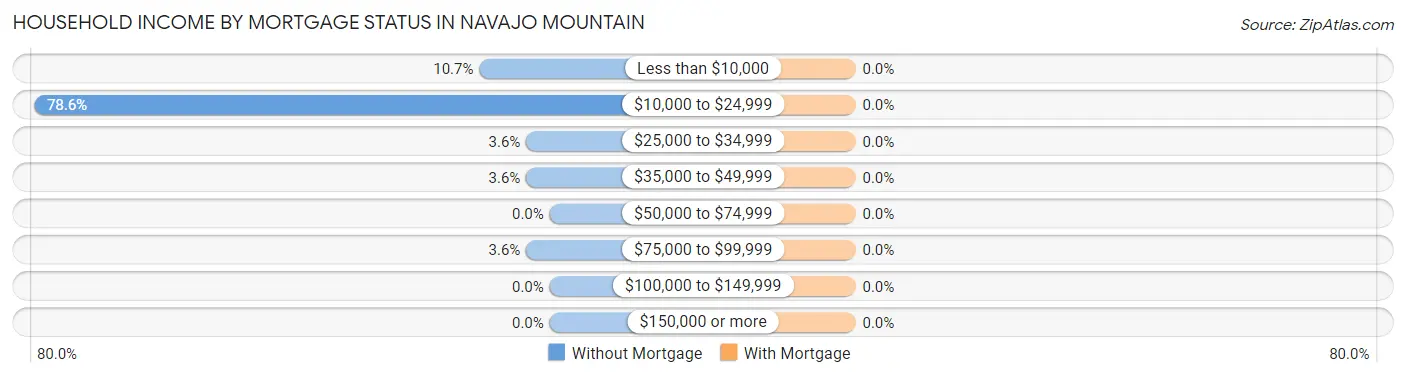
| Household Income | Without Mortgage | With Mortgage |
| Less than $10,000 | 12 (10.7%) | 0 (0.0%) |
| $10,000 to $24,999 | 88 (78.6%) | 0 (0.0%) |
| $25,000 to $34,999 | 4 (3.6%) | 0 (0.0%) |
| $35,000 to $49,999 | 4 (3.6%) | 0 (0.0%) |
| $50,000 to $74,999 | 0 (0.0%) | 0 (0.0%) |
| $75,000 to $99,999 | 4 (3.6%) | 0 (0.0%) |
| $100,000 to $149,999 | 0 (0.0%) | 0 (0.0%) |
| $150,000 or more | 0 (0.0%) | 0 (0.0%) |
| Total | 112 (100.0%) | 0 (0.0%) |
Property Value to Household Income Ratio in Navajo Mountain
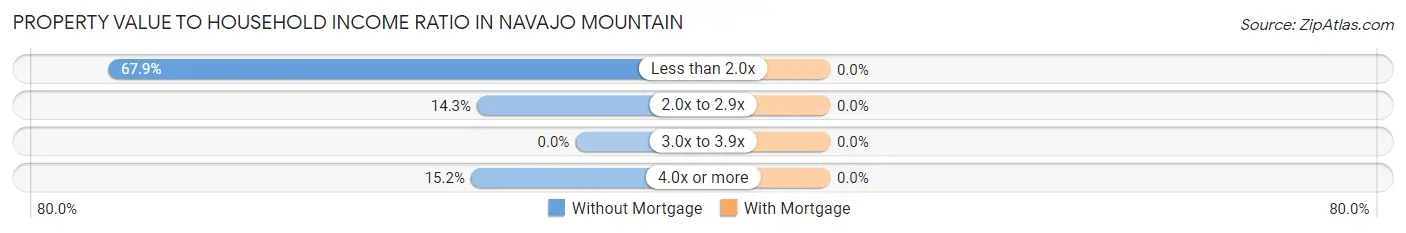
| Value-to-Income Ratio | Without Mortgage | With Mortgage |
| Less than 2.0x | 76 (67.9%) | 0 (0.0%) |
| 2.0x to 2.9x | 16 (14.3%) | 0 (0.0%) |
| 3.0x to 3.9x | 0 (0.0%) | 0 (0.0%) |
| 4.0x or more | 17 (15.2%) | 0 (0.0%) |
| Total | 112 (100.0%) | 0 (0.0%) |
Real Estate Taxes by Mortgage Status in Navajo Mountain
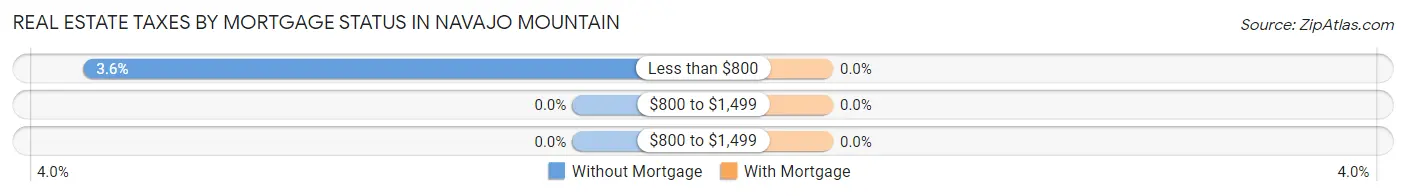
| Property Taxes | Without Mortgage | With Mortgage |
| Less than $800 | 4 (3.6%) | 0 (0.0%) |
| $800 to $1,499 | 0 (0.0%) | 0 (0.0%) |
| $800 to $1,499 | 0 (0.0%) | 0 (0.0%) |
| Total | 112 (100.0%) | 0 (0.0%) |
Health & Disability in Navajo Mountain
Health Insurance Coverage by Age in Navajo Mountain
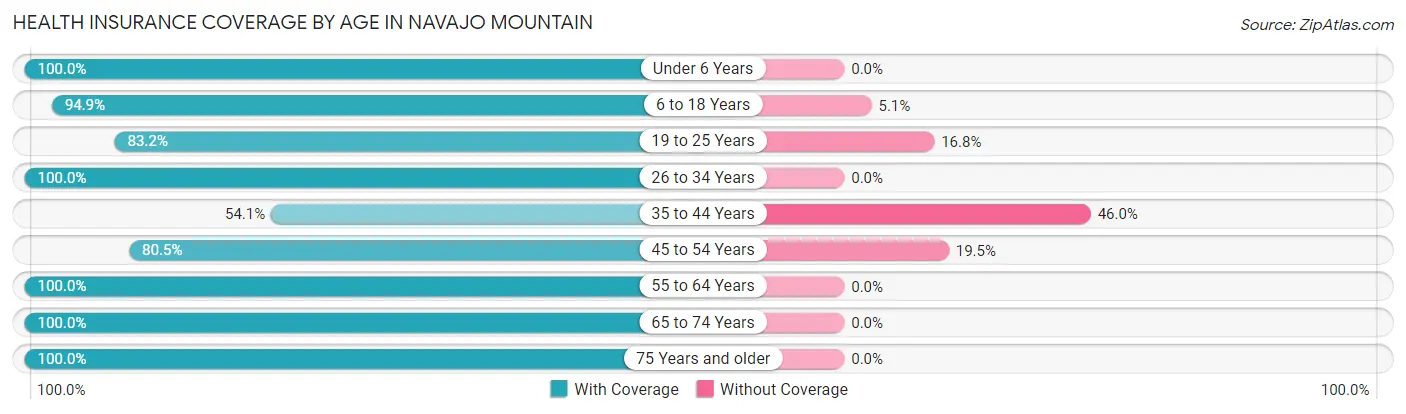
| Age Bracket | With Coverage | Without Coverage |
| Under 6 Years | 11 (100.0%) | 0 (0.0%) |
| 6 to 18 Years | 187 (94.9%) | 10 (5.1%) |
| 19 to 25 Years | 139 (83.2%) | 28 (16.8%) |
| 26 to 34 Years | 3 (100.0%) | 0 (0.0%) |
| 35 to 44 Years | 20 (54.0%) | 17 (46.0%) |
| 45 to 54 Years | 95 (80.5%) | 23 (19.5%) |
| 55 to 64 Years | 42 (100.0%) | 0 (0.0%) |
| 65 to 74 Years | 61 (100.0%) | 0 (0.0%) |
| 75 Years and older | 27 (100.0%) | 0 (0.0%) |
| Total | 585 (88.2%) | 78 (11.8%) |
Health Insurance Coverage by Citizenship Status in Navajo Mountain
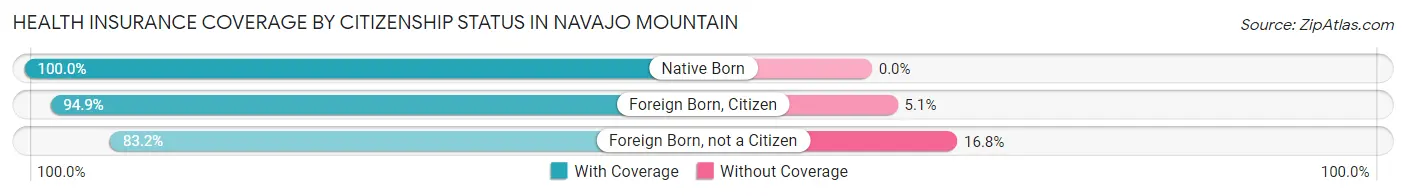
| Citizenship Status | With Coverage | Without Coverage |
| Native Born | 11 (100.0%) | 0 (0.0%) |
| Foreign Born, Citizen | 187 (94.9%) | 10 (5.1%) |
| Foreign Born, not a Citizen | 139 (83.2%) | 28 (16.8%) |
Health Insurance Coverage by Household Income in Navajo Mountain
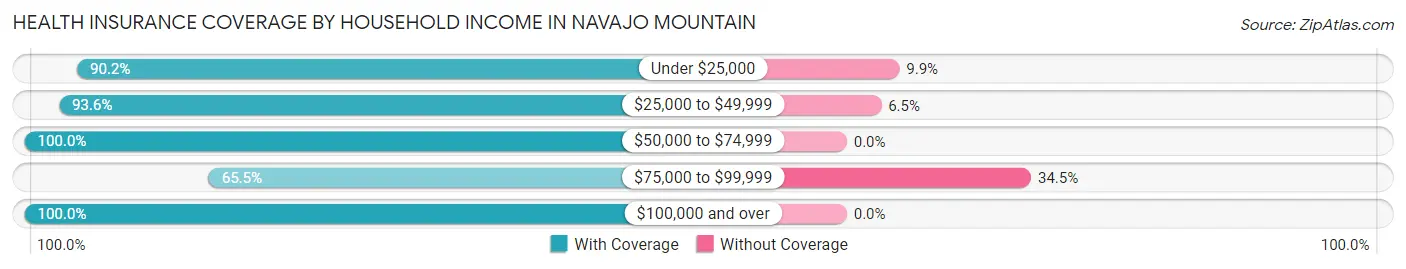
| Household Income | With Coverage | Without Coverage |
| Under $25,000 | 357 (90.1%) | 39 (9.9%) |
| $25,000 to $49,999 | 145 (93.5%) | 10 (6.5%) |
| $50,000 to $74,999 | 16 (100.0%) | 0 (0.0%) |
| $75,000 to $99,999 | 55 (65.5%) | 29 (34.5%) |
| $100,000 and over | 12 (100.0%) | 0 (0.0%) |
Public vs Private Health Insurance Coverage by Age in Navajo Mountain
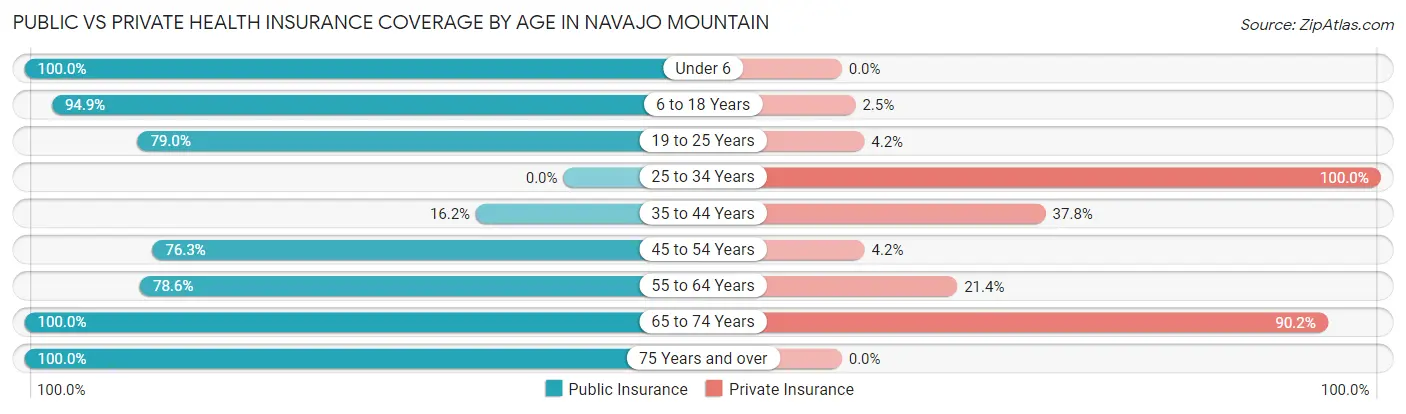
| Age Bracket | Public Insurance | Private Insurance |
| Under 6 | 11 (100.0%) | 0 (0.0%) |
| 6 to 18 Years | 187 (94.9%) | 5 (2.5%) |
| 19 to 25 Years | 132 (79.0%) | 7 (4.2%) |
| 25 to 34 Years | 0 (0.0%) | 3 (100.0%) |
| 35 to 44 Years | 6 (16.2%) | 14 (37.8%) |
| 45 to 54 Years | 90 (76.3%) | 5 (4.2%) |
| 55 to 64 Years | 33 (78.6%) | 9 (21.4%) |
| 65 to 74 Years | 61 (100.0%) | 55 (90.2%) |
| 75 Years and over | 27 (100.0%) | 0 (0.0%) |
| Total | 547 (82.5%) | 98 (14.8%) |
Disability Status by Sex by Age in Navajo Mountain
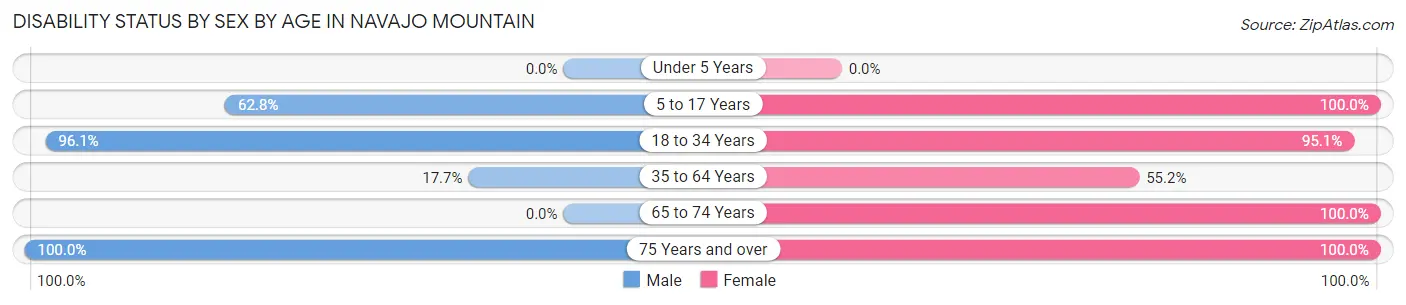
| Age Bracket | Male | Female |
| Under 5 Years | 0 (0.0%) | 0 (0.0%) |
| 5 to 17 Years | 27 (62.8%) | 82 (100.0%) |
| 18 to 34 Years | 174 (96.1%) | 58 (95.1%) |
| 35 to 64 Years | 6 (17.6%) | 90 (55.2%) |
| 65 to 74 Years | 0 (0.0%) | 6 (100.0%) |
| 75 Years and over | 4 (100.0%) | 23 (100.0%) |
Disability Class by Sex by Age in Navajo Mountain
Disability Class: Hearing Difficulty
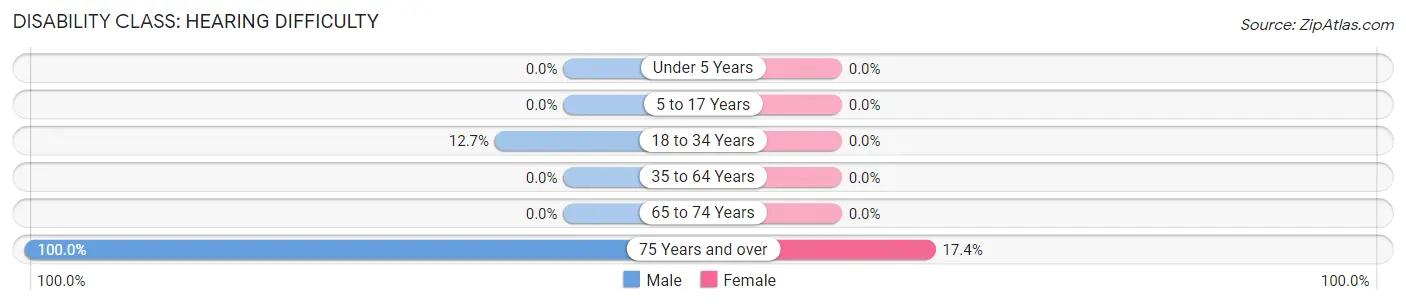
| Age Bracket | Male | Female |
| Under 5 Years | 0 (0.0%) | 0 (0.0%) |
| 5 to 17 Years | 0 (0.0%) | 0 (0.0%) |
| 18 to 34 Years | 23 (12.7%) | 0 (0.0%) |
| 35 to 64 Years | 0 (0.0%) | 0 (0.0%) |
| 65 to 74 Years | 0 (0.0%) | 0 (0.0%) |
| 75 Years and over | 4 (100.0%) | 4 (17.4%) |
Disability Class: Vision Difficulty
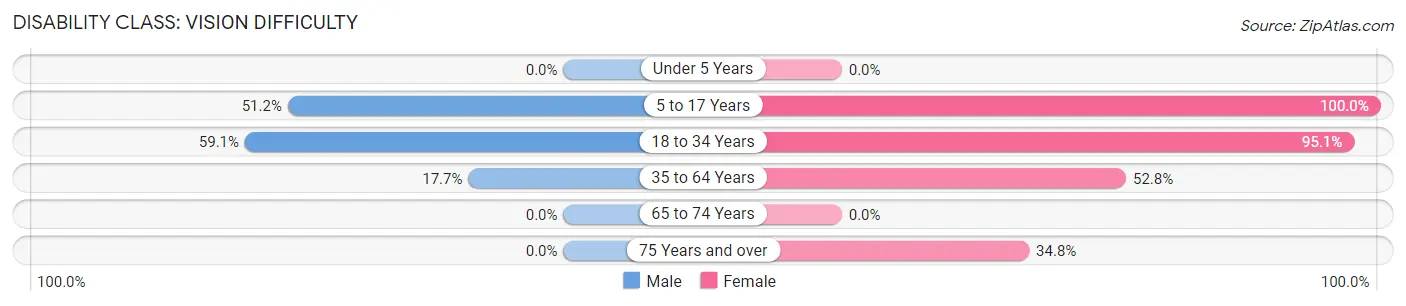
| Age Bracket | Male | Female |
| Under 5 Years | 0 (0.0%) | 0 (0.0%) |
| 5 to 17 Years | 22 (51.2%) | 82 (100.0%) |
| 18 to 34 Years | 107 (59.1%) | 58 (95.1%) |
| 35 to 64 Years | 6 (17.6%) | 86 (52.8%) |
| 65 to 74 Years | 0 (0.0%) | 0 (0.0%) |
| 75 Years and over | 0 (0.0%) | 8 (34.8%) |
Disability Class: Cognitive Difficulty
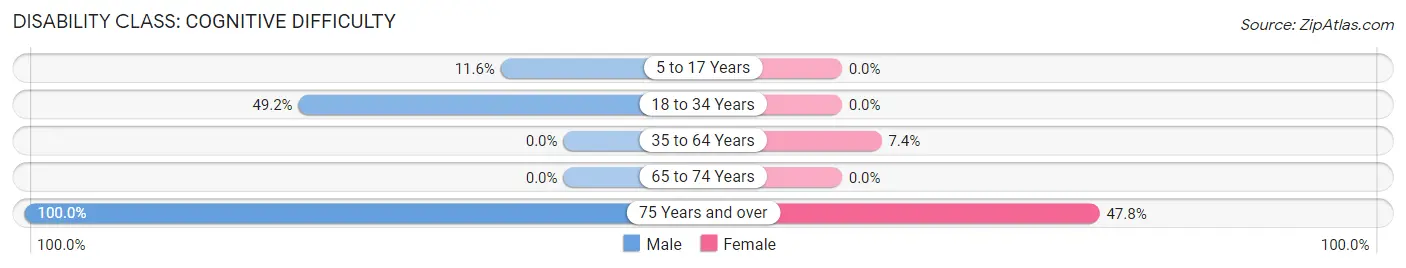
| Age Bracket | Male | Female |
| 5 to 17 Years | 5 (11.6%) | 0 (0.0%) |
| 18 to 34 Years | 89 (49.2%) | 0 (0.0%) |
| 35 to 64 Years | 0 (0.0%) | 12 (7.4%) |
| 65 to 74 Years | 0 (0.0%) | 0 (0.0%) |
| 75 Years and over | 4 (100.0%) | 11 (47.8%) |
Disability Class: Ambulatory Difficulty
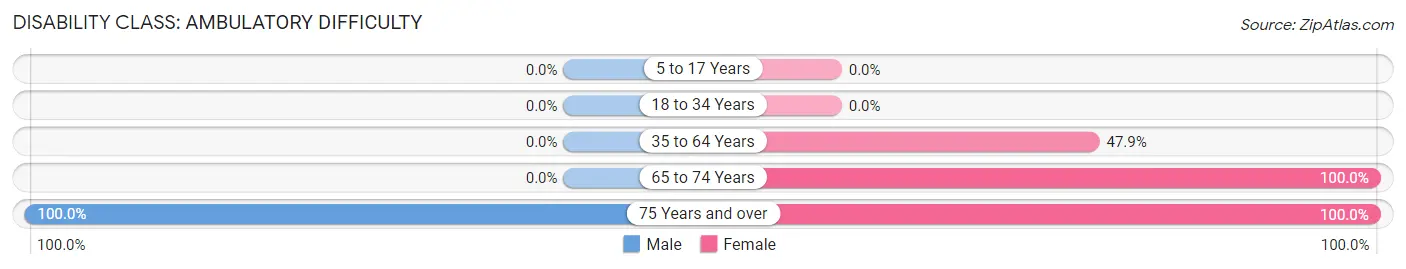
| Age Bracket | Male | Female |
| 5 to 17 Years | 0 (0.0%) | 0 (0.0%) |
| 18 to 34 Years | 0 (0.0%) | 0 (0.0%) |
| 35 to 64 Years | 0 (0.0%) | 78 (47.8%) |
| 65 to 74 Years | 0 (0.0%) | 6 (100.0%) |
| 75 Years and over | 4 (100.0%) | 23 (100.0%) |
Disability Class: Self-Care Difficulty
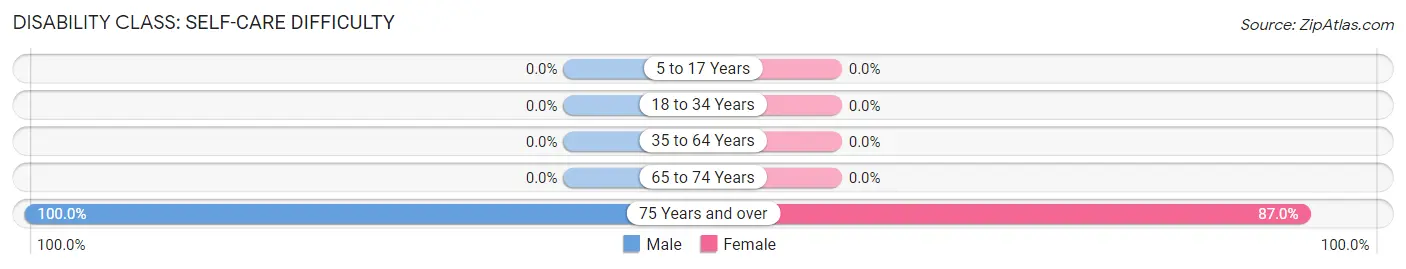
| Age Bracket | Male | Female |
| 5 to 17 Years | 0 (0.0%) | 0 (0.0%) |
| 18 to 34 Years | 0 (0.0%) | 0 (0.0%) |
| 35 to 64 Years | 0 (0.0%) | 0 (0.0%) |
| 65 to 74 Years | 0 (0.0%) | 0 (0.0%) |
| 75 Years and over | 4 (100.0%) | 20 (87.0%) |
Technology Access in Navajo Mountain
Computing Device Access in Navajo Mountain
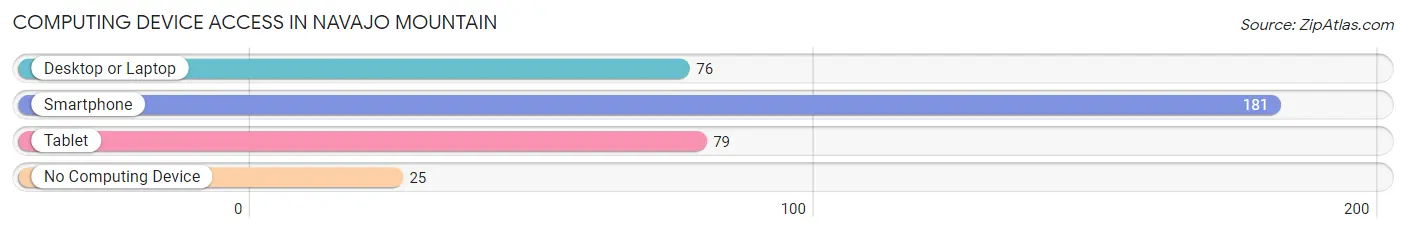
| Device Type | # Households | % Households |
| Desktop or Laptop | 76 | 36.2% |
| Smartphone | 181 | 86.2% |
| Tablet | 79 | 37.6% |
| No Computing Device | 25 | 11.9% |
| Total | 210 | 100.0% |
Internet Access in Navajo Mountain
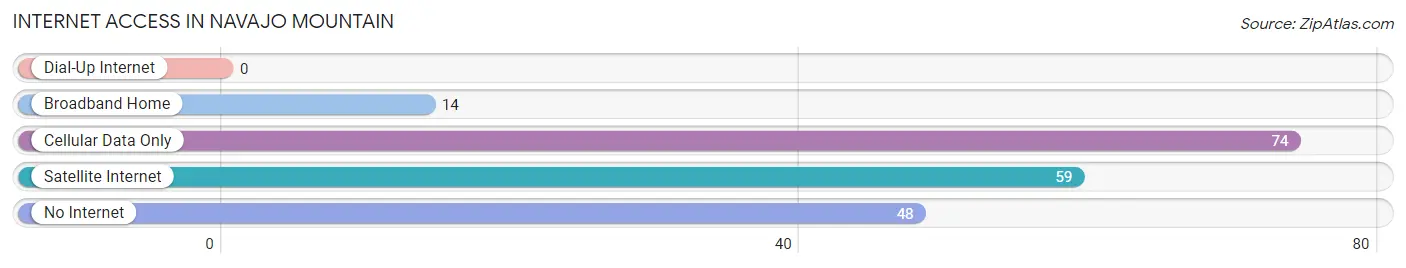
| Internet Type | # Households | % Households |
| Dial-Up Internet | 0 | 0.0% |
| Broadband Home | 14 | 6.7% |
| Cellular Data Only | 74 | 35.2% |
| Satellite Internet | 59 | 28.1% |
| No Internet | 48 | 22.9% |
| Total | 210 | 100.0% |
Navajo Mountain Summary
Navajo Mountain is a small community located in the southeastern corner of Utah, near the Arizona border. It is part of the Navajo Nation, the largest Native American reservation in the United States. The community is located in San Juan County, and is home to approximately 500 people.
Geography
Navajo Mountain is located in the Four Corners region of the United States, where the states of Utah, Arizona, Colorado, and New Mexico meet. The community is situated in the Navajo Nation, which covers a total area of 27,425 square miles. Navajo Mountain is located in the southeastern corner of the reservation, near the Arizona border. The community is situated at an elevation of 6,000 feet, and is surrounded by the Navajo Mountain Range. The area is characterized by rugged terrain, with deep canyons and mesas.
The climate in Navajo Mountain is semi-arid, with hot summers and cold winters. The average annual temperature is around 50 degrees Fahrenheit, and the average annual precipitation is around 8 inches.
History
Navajo Mountain has been inhabited by Native Americans for centuries. The area was first settled by the Navajo people in the late 1800s. The community was originally known as “Tse’ Bit’a’i”, which means “rock with water” in the Navajo language.
The area was first explored by non-Native Americans in the late 1800s. In the early 1900s, the area was opened up to homesteaders, and the community of Navajo Mountain was established. The community was named after the nearby mountain range.
In the early 1900s, the area was used for cattle ranching and farming. The community was also home to a trading post, which served as a hub for local commerce.
Economy
The economy of Navajo Mountain is largely based on agriculture and tourism. The area is home to several farms, which produce a variety of crops, including corn, beans, squash, and melons. The area is also home to several ranches, which raise cattle and sheep.
Tourism is an important part of the local economy. The area is home to several attractions, including the Navajo National Monument, which is a popular destination for visitors. The area is also home to several outdoor recreation opportunities, including hiking, camping, and fishing.
Demographics
As of the 2010 census, the population of Navajo Mountain was 498. The population is primarily Native American, with the majority of residents being Navajo. The median age of the population is 33.5 years, and the median household income is $25,000.
Conclusion
Navajo Mountain is a small community located in the southeastern corner of Utah, near the Arizona border. It is part of the Navajo Nation, the largest Native American reservation in the United States. The community is home to approximately 500 people, and is characterized by rugged terrain and a semi-arid climate. The economy of Navajo Mountain is largely based on agriculture and tourism, and the population is primarily Native American.
Common Questions
What is Per Capita Income in Navajo Mountain?
Per Capita income in Navajo Mountain is $13,650.
What is the Median Family Income in Navajo Mountain?
Median Family Income in Navajo Mountain is $12,192.
What is Inequality or Gini Index in Navajo Mountain?
Inequality or Gini Index in Navajo Mountain is 0.50.
What is the Total Population of Navajo Mountain?
Total Population of Navajo Mountain is 663.
What is the Total Male Population of Navajo Mountain?
Total Male Population of Navajo Mountain is 324.
What is the Total Female Population of Navajo Mountain?
Total Female Population of Navajo Mountain is 339.
What is the Ratio of Males per 100 Females in Navajo Mountain?
There are 95.58 Males per 100 Females in Navajo Mountain.
What is the Ratio of Females per 100 Males in Navajo Mountain?
There are 104.63 Females per 100 Males in Navajo Mountain.
What is the Median Population Age in Navajo Mountain?
Median Population Age in Navajo Mountain is 20.7 Years.
What is the Average Family Size in Navajo Mountain
Average Family Size in Navajo Mountain is 4.5 People.
What is the Average Household Size in Navajo Mountain
Average Household Size in Navajo Mountain is 3.2 People.
How Large is the Labor Force in Navajo Mountain?
There are 315 People in the Labor Forcein in Navajo Mountain.
What is the Percentage of People in the Labor Force in Navajo Mountain?
50.6% of People are in the Labor Force in Navajo Mountain.
What is the Unemployment Rate in Navajo Mountain?
Unemployment Rate in Navajo Mountain is 48.6%.