Snyderville, UT Map & Demographics
Snyderville Map
Snyderville Overview
$74,186
PER CAPITA INCOME
$181,250
AVG FAMILY INCOME
$135,132
AVG HOUSEHOLD INCOME
24.8%
WAGE / INCOME GAP [ % ]
75.2¢/ $1
WAGE / INCOME GAP [ $ ]
0.46
INEQUALITY / GINI INDEX
5,730
TOTAL POPULATION
3,038
MALE POPULATION
2,692
FEMALE POPULATION
112.85
MALES / 100 FEMALES
88.61
FEMALES / 100 MALES
44.6
MEDIAN AGE
3.2
AVG FAMILY SIZE
2.7
AVG HOUSEHOLD SIZE
3,220
LABOR FORCE [ PEOPLE ]
68.8%
PERCENT IN LABOR FORCE
1.0%
UNEMPLOYMENT RATE
Snyderville Area Codes
Income in Snyderville
Income Overview in Snyderville
Per Capita Income in Snyderville is $74,186, while median incomes of families and households are $181,250 and $135,132 respectively.
| Characteristic | Number | Measure |
| Per Capita Income | 5,730 | $74,186 |
| Median Family Income | 1,353 | $181,250 |
| Mean Family Income | 1,353 | $226,125 |
| Median Household Income | 2,130 | $135,132 |
| Mean Household Income | 2,130 | $181,540 |
| Income Deficit | 1,353 | $0 |
| Wage / Income Gap (%) | 5,730 | 24.78% |
| Wage / Income Gap ($) | 5,730 | 75.22¢ per $1 |
| Gini / Inequality Index | 5,730 | 0.46 |
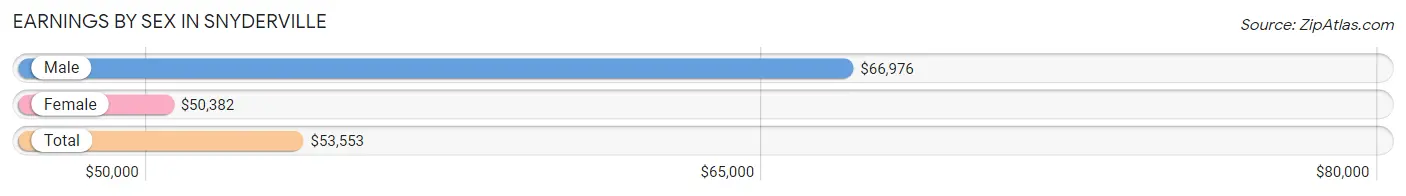
Earnings by Sex in Snyderville
Average Earnings in Snyderville are $53,553, $66,976 for men and $50,382 for women, a difference of 24.8%.
| Sex | Number | Average Earnings |
| Male | 2,033 (57.0%) | $66,976 |
| Female | 1,533 (43.0%) | $50,382 |
| Total | 3,566 (100.0%) | $53,553 |
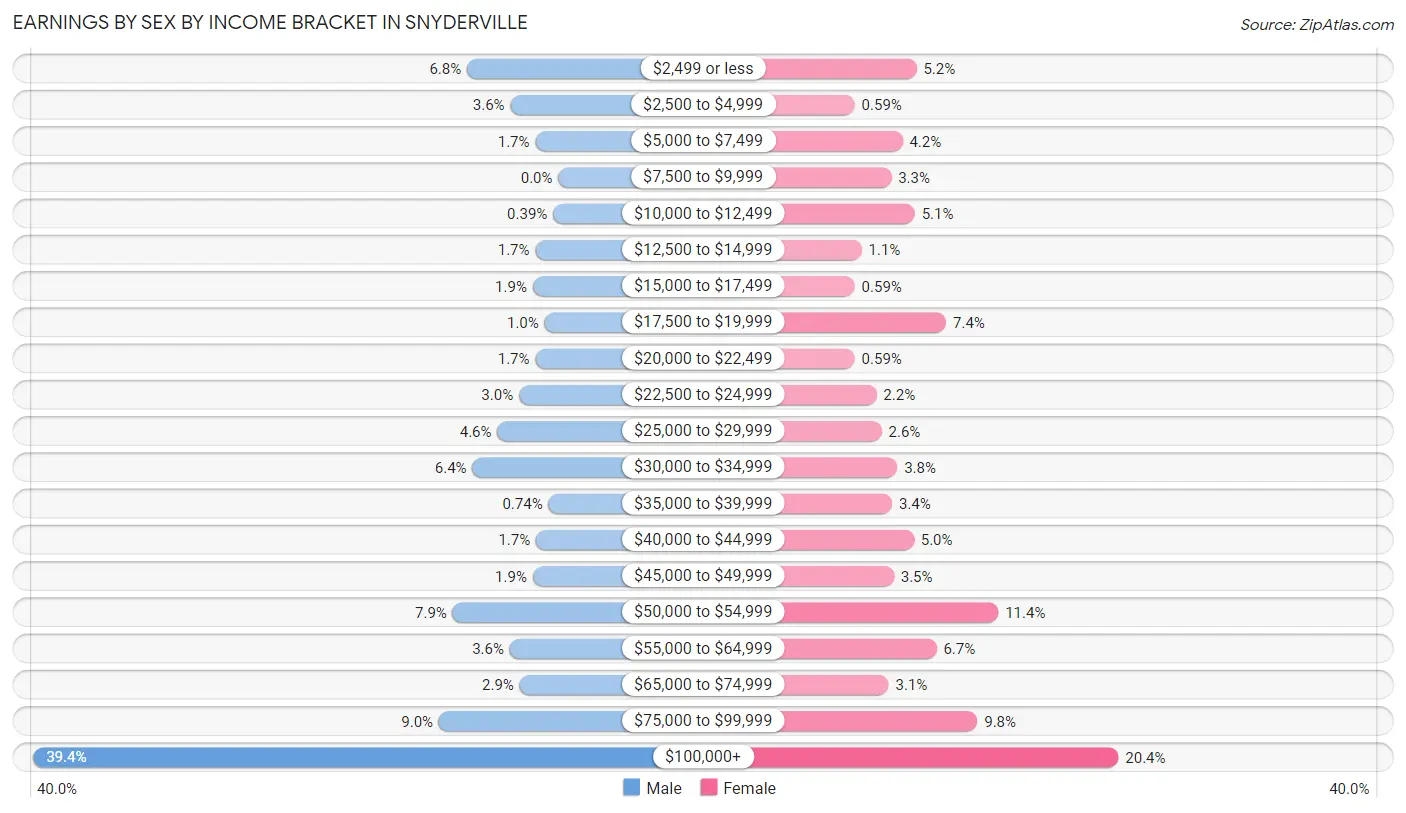
Earnings by Sex by Income Bracket in Snyderville
The most common earnings brackets in Snyderville are $100,000+ for men (800 | 39.4%) and $100,000+ for women (312 | 20.3%).
| Income | Male | Female |
| $2,499 or less | 139 (6.8%) | 80 (5.2%) |
| $2,500 to $4,999 | 73 (3.6%) | 9 (0.6%) |
| $5,000 to $7,499 | 35 (1.7%) | 64 (4.2%) |
| $7,500 to $9,999 | 0 (0.0%) | 51 (3.3%) |
| $10,000 to $12,499 | 8 (0.4%) | 78 (5.1%) |
| $12,500 to $14,999 | 35 (1.7%) | 17 (1.1%) |
| $15,000 to $17,499 | 39 (1.9%) | 9 (0.6%) |
| $17,500 to $19,999 | 21 (1.0%) | 114 (7.4%) |
| $20,000 to $22,499 | 35 (1.7%) | 9 (0.6%) |
| $22,500 to $24,999 | 60 (2.9%) | 34 (2.2%) |
| $25,000 to $29,999 | 93 (4.6%) | 40 (2.6%) |
| $30,000 to $34,999 | 131 (6.4%) | 58 (3.8%) |
| $35,000 to $39,999 | 15 (0.7%) | 52 (3.4%) |
| $40,000 to $44,999 | 34 (1.7%) | 77 (5.0%) |
| $45,000 to $49,999 | 39 (1.9%) | 54 (3.5%) |
| $50,000 to $54,999 | 161 (7.9%) | 174 (11.4%) |
| $55,000 to $64,999 | 74 (3.6%) | 103 (6.7%) |
| $65,000 to $74,999 | 59 (2.9%) | 48 (3.1%) |
| $75,000 to $99,999 | 182 (8.9%) | 150 (9.8%) |
| $100,000+ | 800 (39.4%) | 312 (20.3%) |
| Total | 2,033 (100.0%) | 1,533 (100.0%) |
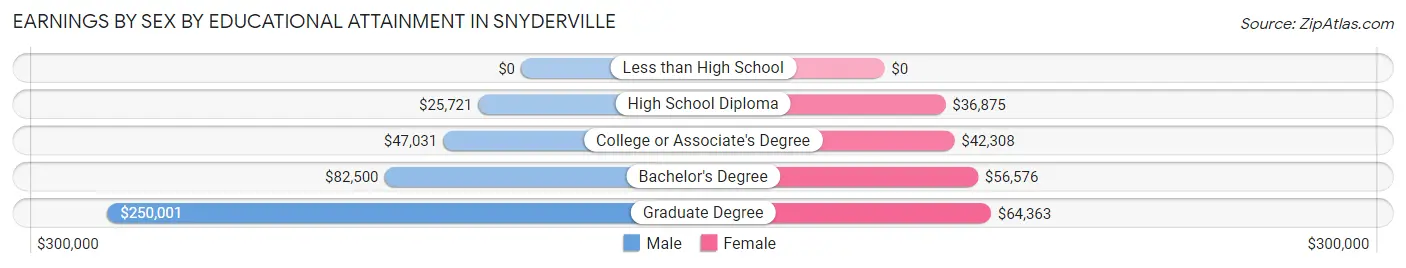
Earnings by Sex by Educational Attainment in Snyderville
Average earnings in Snyderville are $79,899 for men and $51,614 for women, a difference of 35.4%. Men with an educational attainment of graduate degree enjoy the highest average annual earnings of $250,001, while those with high school diploma education earn the least with $25,721. Women with an educational attainment of graduate degree earn the most with the average annual earnings of $64,363, while those with high school diploma education have the smallest earnings of $36,875.
| Educational Attainment | Male Income | Female Income |
| Less than High School | - | - |
| High School Diploma | $25,721 | $36,875 |
| College or Associate's Degree | $47,031 | $42,308 |
| Bachelor's Degree | $82,500 | $56,576 |
| Graduate Degree | $250,001 | $64,363 |
| Total | $79,899 | $51,614 |
Family Income in Snyderville
Family Income Brackets in Snyderville
According to the Snyderville family income data, there are 591 families falling into the $200,000+ income range, which is the most common income bracket and makes up 43.7% of all families.
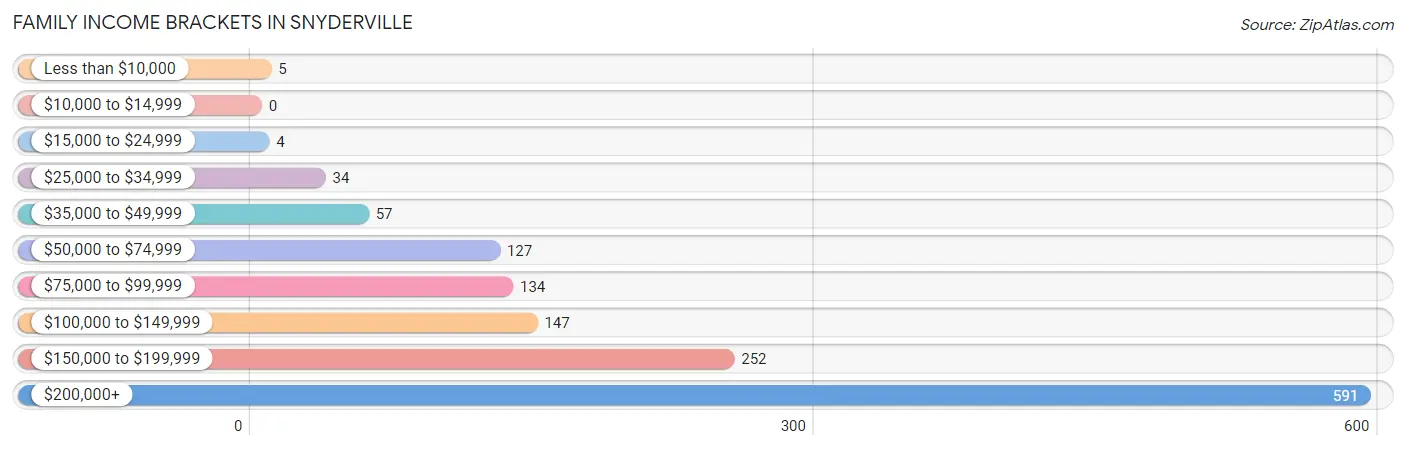
| Income Bracket | # Families | % Families |
| Less than $10,000 | 5 | 0.4% |
| $10,000 to $14,999 | 0 | 0.0% |
| $15,000 to $24,999 | 4 | 0.3% |
| $25,000 to $34,999 | 34 | 2.5% |
| $35,000 to $49,999 | 57 | 4.2% |
| $50,000 to $74,999 | 127 | 9.4% |
| $75,000 to $99,999 | 134 | 9.9% |
| $100,000 to $149,999 | 147 | 10.9% |
| $150,000 to $199,999 | 252 | 18.6% |
| $200,000+ | 591 | 43.7% |
Family Income by Famaliy Size in Snyderville
4-person families (283 | 20.9%) account for the highest median family income in Snyderville with $250,001 per family, while 2-person families (681 | 50.3%) have the highest median income of $76,193 per family member.
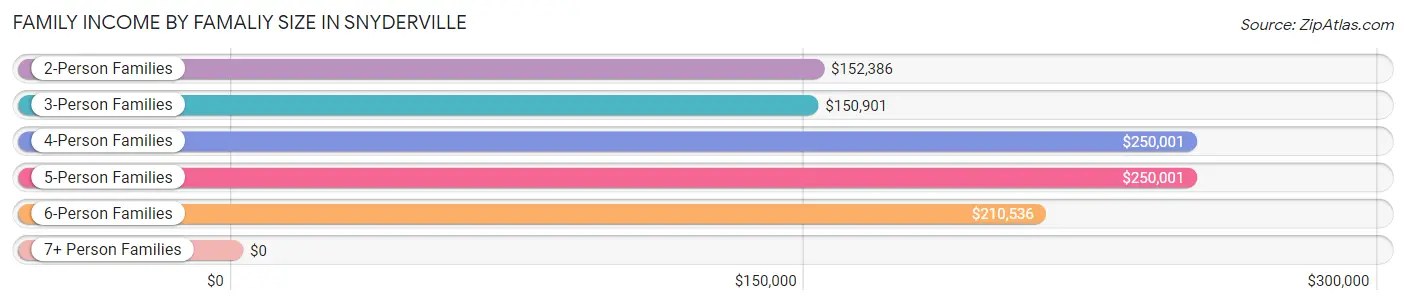
| Income Bracket | # Families | Median Income |
| 2-Person Families | 681 (50.3%) | $152,386 |
| 3-Person Families | 279 (20.6%) | $150,901 |
| 4-Person Families | 283 (20.9%) | $250,001 |
| 5-Person Families | 81 (6.0%) | $250,001 |
| 6-Person Families | 17 (1.3%) | $210,536 |
| 7+ Person Families | 12 (0.9%) | $0 |
| Total | 1,353 (100.0%) | $181,250 |
Family Income by Number of Earners in Snyderville
The median family income in Snyderville is $181,250, with families comprising 3+ earners (143) having the highest median family income of $210,893, while families with no earners (132) have the lowest median family income of $136,389, accounting for 10.6% and 9.8% of families, respectively.
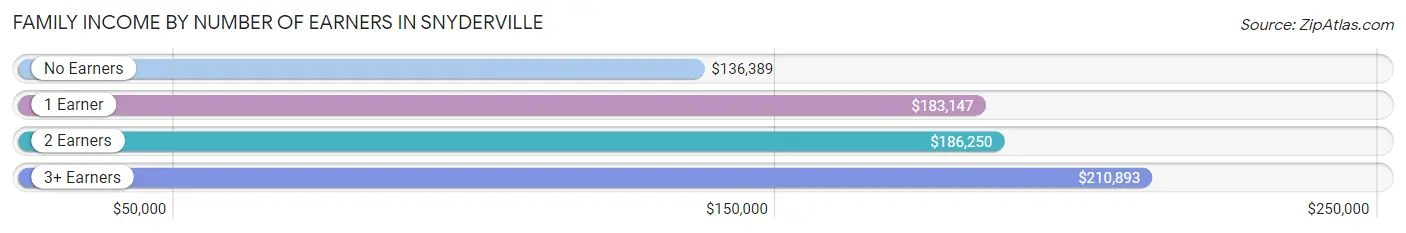
| Number of Earners | # Families | Median Income |
| No Earners | 132 (9.8%) | $136,389 |
| 1 Earner | 403 (29.8%) | $183,147 |
| 2 Earners | 675 (49.9%) | $186,250 |
| 3+ Earners | 143 (10.6%) | $210,893 |
| Total | 1,353 (100.0%) | $181,250 |
Household Income in Snyderville
Household Income Brackets in Snyderville
With 718 households falling in the category, the $200,000+ income range is the most frequent in Snyderville, accounting for 33.7% of all households. In contrast, only 9 households (0.4%) fall into the $10,000 to $14,999 income bracket, making it the least populous group.
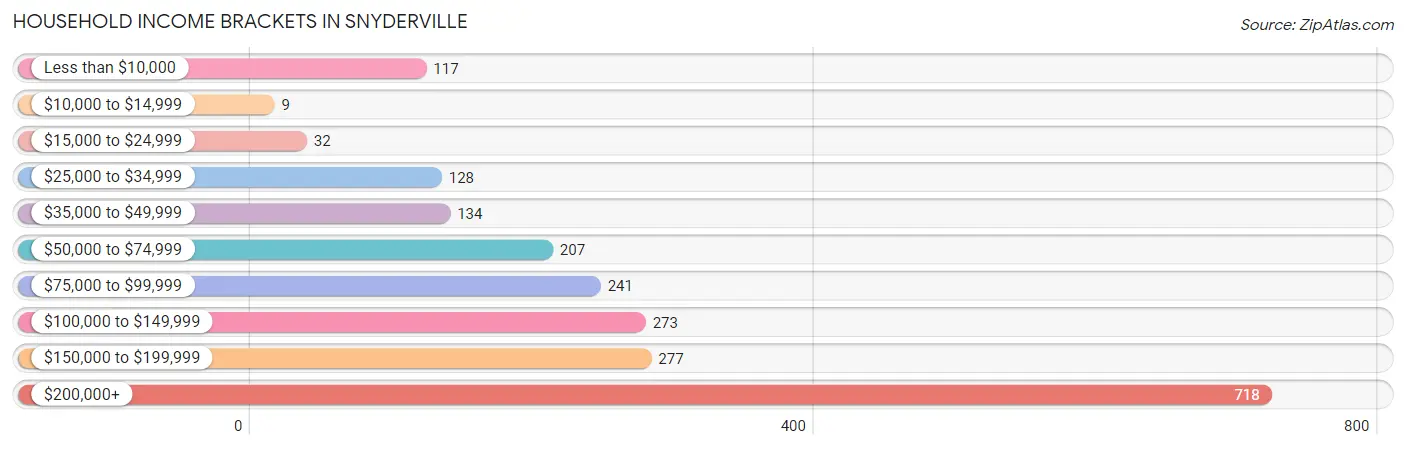
| Income Bracket | # Households | % Households |
| Less than $10,000 | 117 | 5.5% |
| $10,000 to $14,999 | 9 | 0.4% |
| $15,000 to $24,999 | 32 | 1.5% |
| $25,000 to $34,999 | 128 | 6.0% |
| $35,000 to $49,999 | 134 | 6.3% |
| $50,000 to $74,999 | 207 | 9.7% |
| $75,000 to $99,999 | 241 | 11.3% |
| $100,000 to $149,999 | 273 | 12.8% |
| $150,000 to $199,999 | 277 | 13.0% |
| $200,000+ | 718 | 33.7% |
Household Income by Householder Age in Snyderville
The median household income in Snyderville is $135,132, with the highest median household income of $178,088 found in the 25 to 44 years age bracket for the primary householder. A total of 478 households (22.4%) fall into this category. Meanwhile, the 15 to 24 years age bracket for the primary householder has the lowest median household income of $0, with 52 households (2.4%) in this group.
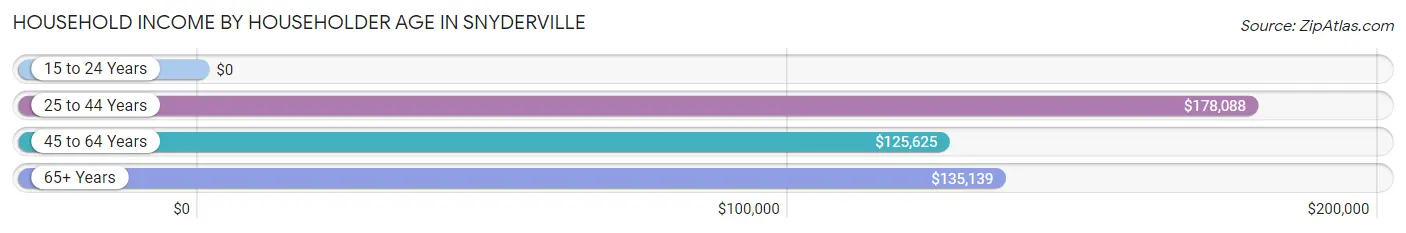
| Income Bracket | # Households | Median Income |
| 15 to 24 Years | 52 (2.4%) | $0 |
| 25 to 44 Years | 478 (22.4%) | $178,088 |
| 45 to 64 Years | 1,195 (56.1%) | $125,625 |
| 65+ Years | 405 (19.0%) | $135,139 |
| Total | 2,130 (100.0%) | $135,132 |
Poverty in Snyderville
Income Below Poverty by Sex and Age in Snyderville
With 4.1% poverty level for males and 7.1% for females among the residents of Snyderville, 18 to 24 year old males and 55 to 64 year old females are the most vulnerable to poverty, with 37 males (17.8%) and 89 females (20.0%) in their respective age groups living below the poverty level.
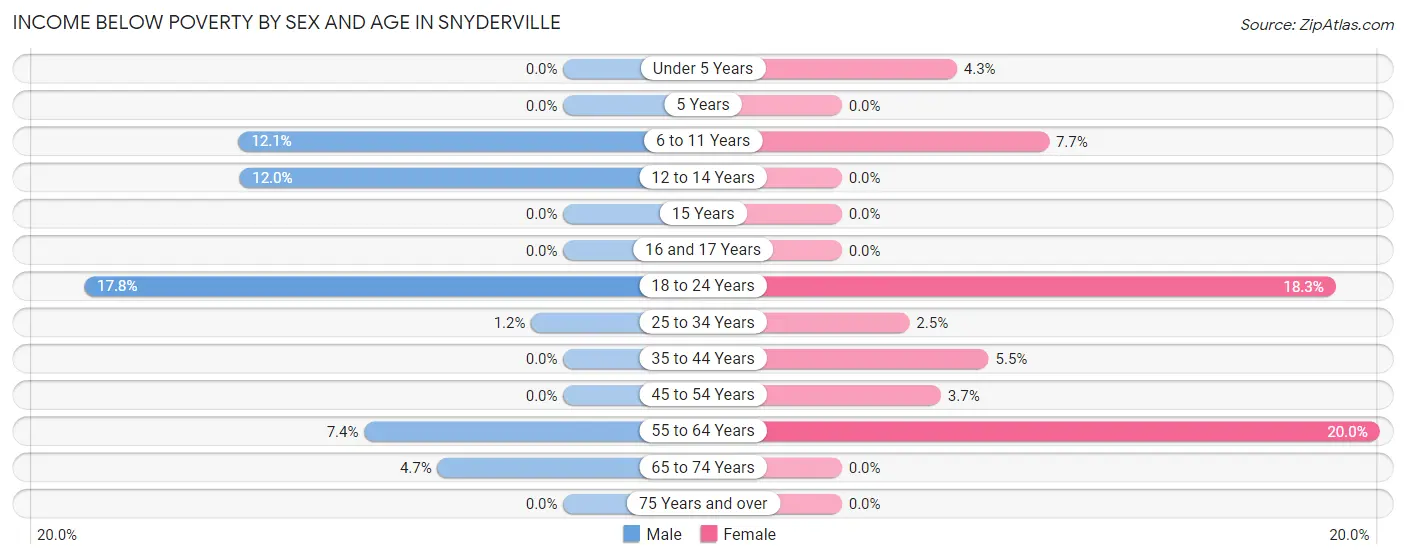
| Age Bracket | Male | Female |
| Under 5 Years | 0 (0.0%) | 5 (4.3%) |
| 5 Years | 0 (0.0%) | 0 (0.0%) |
| 6 to 11 Years | 24 (12.1%) | 15 (7.7%) |
| 12 to 14 Years | 16 (12.0%) | 0 (0.0%) |
| 15 Years | 0 (0.0%) | 0 (0.0%) |
| 16 and 17 Years | 0 (0.0%) | 0 (0.0%) |
| 18 to 24 Years | 37 (17.8%) | 33 (18.3%) |
| 25 to 34 Years | 4 (1.2%) | 7 (2.5%) |
| 35 to 44 Years | 0 (0.0%) | 23 (5.4%) |
| 45 to 54 Years | 0 (0.0%) | 19 (3.7%) |
| 55 to 64 Years | 32 (7.4%) | 89 (20.0%) |
| 65 to 74 Years | 10 (4.7%) | 0 (0.0%) |
| 75 Years and over | 0 (0.0%) | 0 (0.0%) |
| Total | 123 (4.1%) | 191 (7.1%) |
Income Above Poverty by Sex and Age in Snyderville
According to the poverty statistics in Snyderville, males aged under 5 years and females aged 12 to 14 years are the age groups that are most secure financially, with 100.0% of males and 100.0% of females in these age groups living above the poverty line.
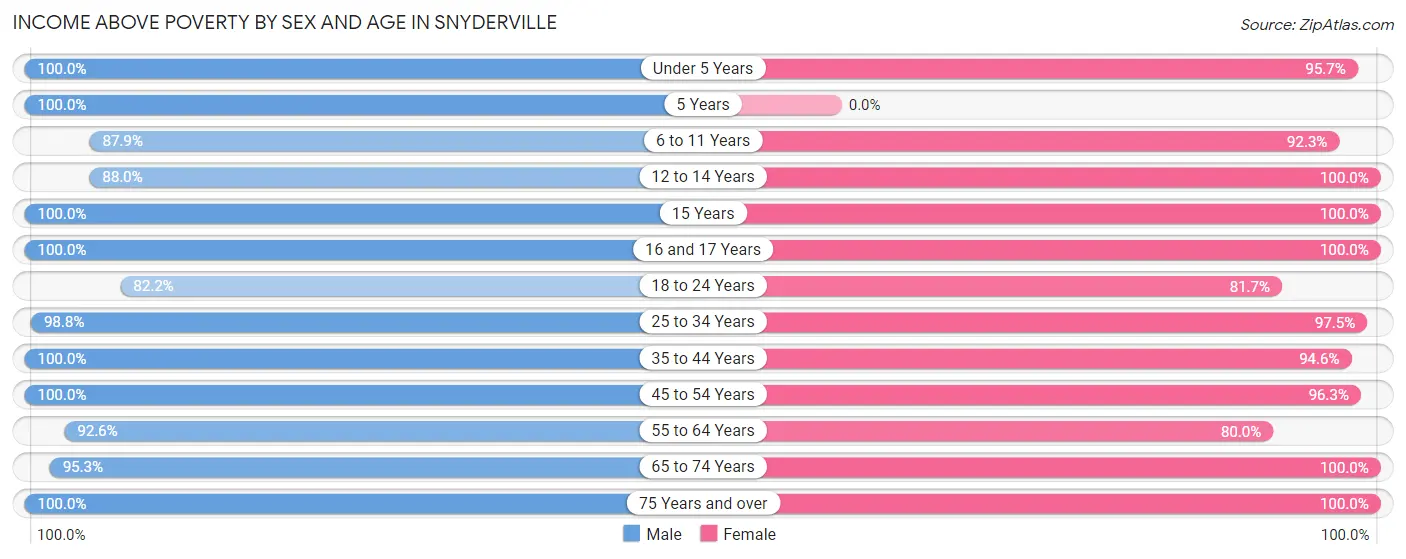
| Age Bracket | Male | Female |
| Under 5 Years | 168 (100.0%) | 112 (95.7%) |
| 5 Years | 5 (100.0%) | 0 (0.0%) |
| 6 to 11 Years | 175 (87.9%) | 180 (92.3%) |
| 12 to 14 Years | 117 (88.0%) | 148 (100.0%) |
| 15 Years | 22 (100.0%) | 63 (100.0%) |
| 16 and 17 Years | 121 (100.0%) | 16 (100.0%) |
| 18 to 24 Years | 171 (82.2%) | 147 (81.7%) |
| 25 to 34 Years | 333 (98.8%) | 272 (97.5%) |
| 35 to 44 Years | 303 (100.0%) | 399 (94.6%) |
| 45 to 54 Years | 728 (100.0%) | 497 (96.3%) |
| 55 to 64 Years | 401 (92.6%) | 357 (80.0%) |
| 65 to 74 Years | 204 (95.3%) | 177 (100.0%) |
| 75 Years and over | 167 (100.0%) | 133 (100.0%) |
| Total | 2,915 (96.0%) | 2,501 (92.9%) |
Income Below Poverty Among Married-Couple Families in Snyderville
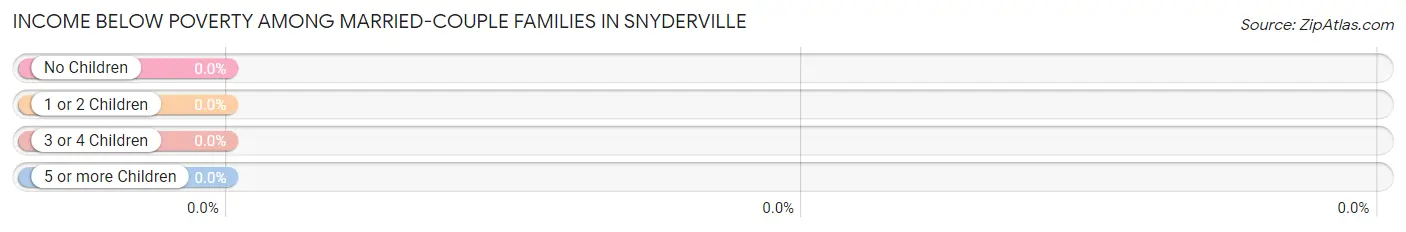
| Children | Above Poverty | Below Poverty |
| No Children | 660 (100.0%) | 0 (0.0%) |
| 1 or 2 Children | 425 (100.0%) | 0 (0.0%) |
| 3 or 4 Children | 76 (100.0%) | 0 (0.0%) |
| 5 or more Children | 0 (0.0%) | 0 (0.0%) |
| Total | 1,161 (100.0%) | 0 (0.0%) |
Income Below Poverty Among Single-Parent Households in Snyderville
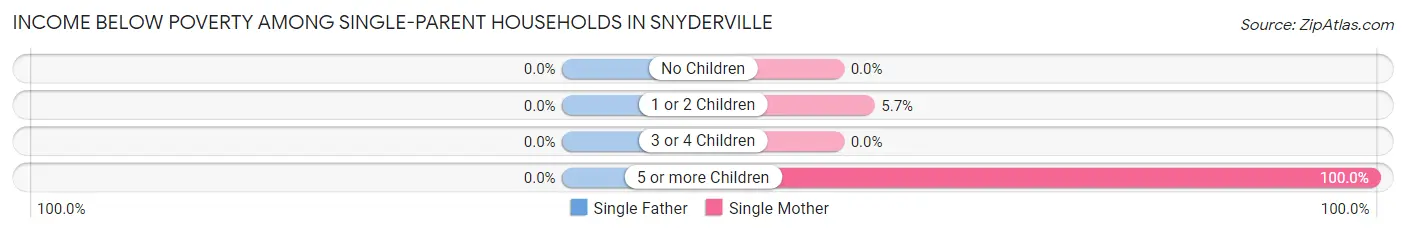
| Children | Single Father | Single Mother |
| No Children | 0 (0.0%) | 0 (0.0%) |
| 1 or 2 Children | 0 (0.0%) | 4 (5.7%) |
| 3 or 4 Children | 0 (0.0%) | 0 (0.0%) |
| 5 or more Children | 0 (0.0%) | 6 (100.0%) |
| Total | 0 (0.0%) | 10 (7.3%) |
Income Below Poverty Among Married-Couple vs Single-Parent Households in Snyderville
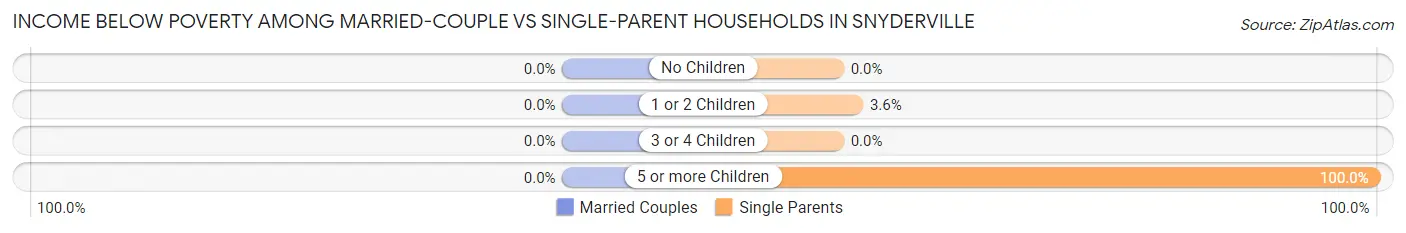
| Children | Married-Couple Families | Single-Parent Households |
| No Children | 0 (0.0%) | 0 (0.0%) |
| 1 or 2 Children | 0 (0.0%) | 4 (3.6%) |
| 3 or 4 Children | 0 (0.0%) | 0 (0.0%) |
| 5 or more Children | 0 (0.0%) | 6 (100.0%) |
| Total | 0 (0.0%) | 10 (5.2%) |
Race in Snyderville
The most populous races in Snyderville are White / Caucasian (4,960 | 86.6%), Asian (301 | 5.2%), and Hispanic or Latino (236 | 4.1%).
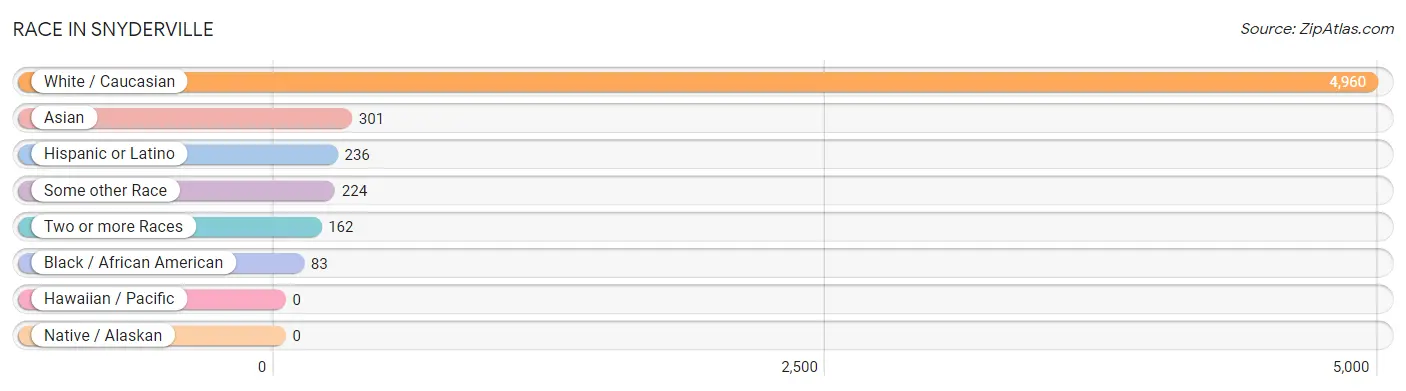
| Race | # Population | % Population |
| Asian | 301 | 5.2% |
| Black / African American | 83 | 1.5% |
| Hawaiian / Pacific | 0 | 0.0% |
| Hispanic or Latino | 236 | 4.1% |
| Native / Alaskan | 0 | 0.0% |
| White / Caucasian | 4,960 | 86.6% |
| Two or more Races | 162 | 2.8% |
| Some other Race | 224 | 3.9% |
| Total | 5,730 | 100.0% |
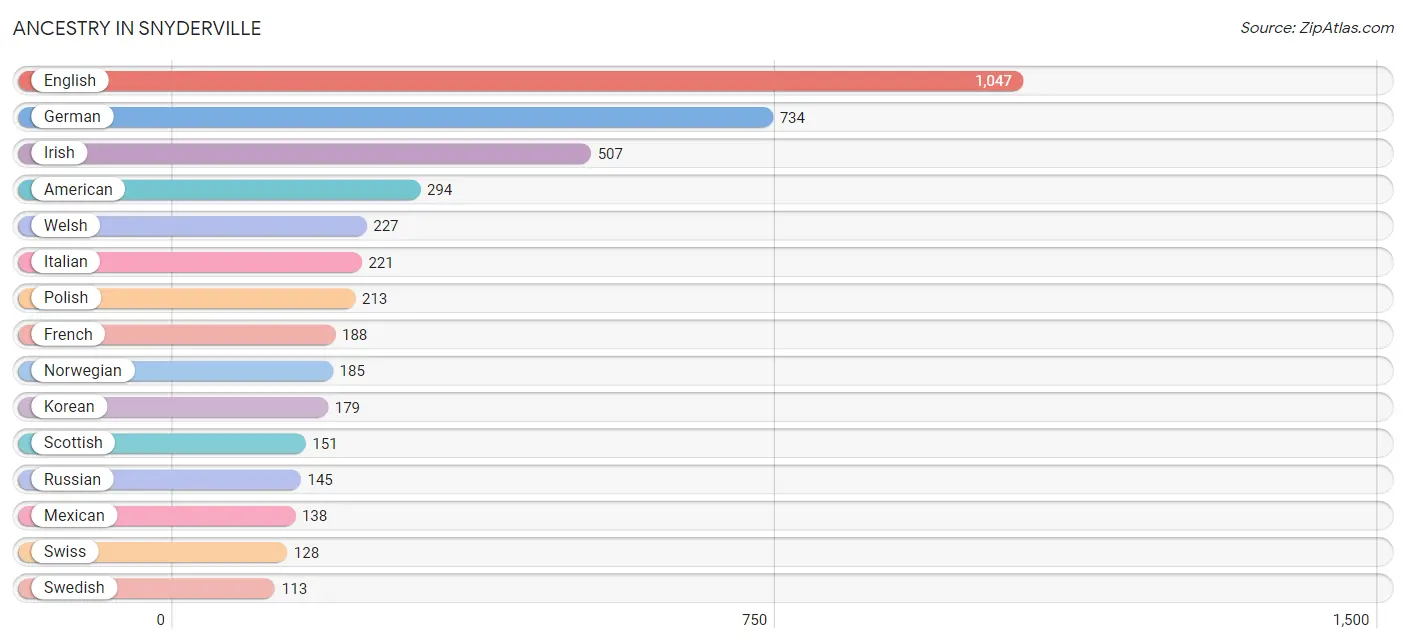
Ancestry in Snyderville
The most populous ancestries reported in Snyderville are English (1,047 | 18.3%), German (734 | 12.8%), Irish (507 | 8.8%), American (294 | 5.1%), and Welsh (227 | 4.0%), together accounting for 49.0% of all Snyderville residents.
| Ancestry | # Population | % Population |
| American | 294 | 5.1% |
| Arab | 69 | 1.2% |
| Austrian | 9 | 0.2% |
| Bahamian | 10 | 0.2% |
| Basque | 4 | 0.1% |
| Belgian | 18 | 0.3% |
| Bhutanese | 21 | 0.4% |
| Brazilian | 2 | 0.0% |
| British | 95 | 1.7% |
| Burmese | 66 | 1.1% |
| Canadian | 91 | 1.6% |
| Central American | 21 | 0.4% |
| Colombian | 23 | 0.4% |
| Croatian | 5 | 0.1% |
| Cuban | 6 | 0.1% |
| Czech | 19 | 0.3% |
| Czechoslovakian | 22 | 0.4% |
| Danish | 70 | 1.2% |
| Dutch | 57 | 1.0% |
| Eastern European | 23 | 0.4% |
| English | 1,047 | 18.3% |
| European | 106 | 1.8% |
| Filipino | 17 | 0.3% |
| Finnish | 47 | 0.8% |
| French | 188 | 3.3% |
| French Canadian | 13 | 0.2% |
| German | 734 | 12.8% |
| Greek | 16 | 0.3% |
| Honduran | 21 | 0.4% |
| Hungarian | 11 | 0.2% |
| Indian (Asian) | 103 | 1.8% |
| Irish | 507 | 8.8% |
| Italian | 221 | 3.9% |
| Jamaican | 49 | 0.9% |
| Korean | 179 | 3.1% |
| Lebanese | 16 | 0.3% |
| Lithuanian | 28 | 0.5% |
| Mexican | 138 | 2.4% |
| Northern European | 17 | 0.3% |
| Norwegian | 185 | 3.2% |
| Pakistani | 5 | 0.1% |
| Polish | 213 | 3.7% |
| Portuguese | 12 | 0.2% |
| Puerto Rican | 7 | 0.1% |
| Romanian | 8 | 0.1% |
| Russian | 145 | 2.5% |
| Scandinavian | 86 | 1.5% |
| Scotch-Irish | 39 | 0.7% |
| Scottish | 151 | 2.6% |
| Serbian | 35 | 0.6% |
| Slavic | 2 | 0.0% |
| Slovene | 11 | 0.2% |
| South American | 23 | 0.4% |
| Spanish | 5 | 0.1% |
| Sri Lankan | 11 | 0.2% |
| Swedish | 113 | 2.0% |
| Swiss | 128 | 2.2% |
| Syrian | 53 | 0.9% |
| Thai | 40 | 0.7% |
| Welsh | 227 | 4.0% |
| Yugoslavian | 9 | 0.2% | View All 61 Rows |
Immigrants in Snyderville
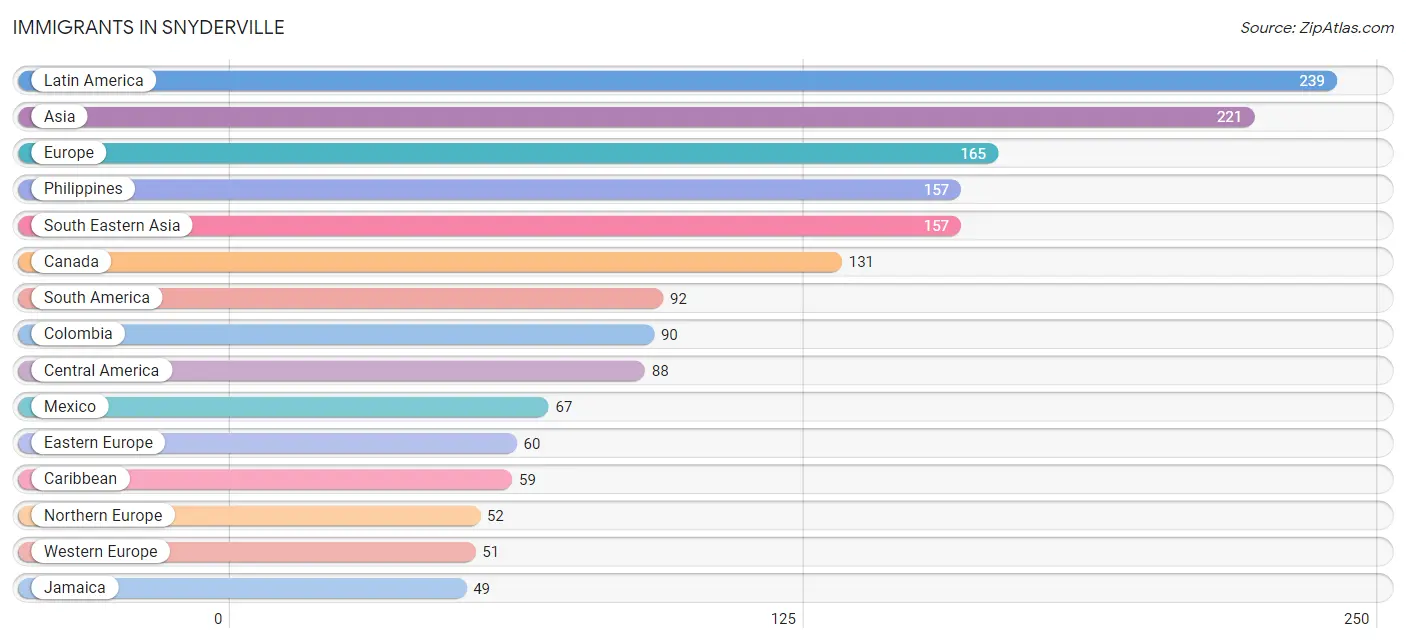
The most numerous immigrant groups reported in Snyderville came from Latin America (239 | 4.2%), Asia (221 | 3.9%), Europe (165 | 2.9%), Philippines (157 | 2.7%), and South Eastern Asia (157 | 2.7%), together accounting for 16.4% of all Snyderville residents.
| Immigration Origin | # Population | % Population |
| Asia | 221 | 3.9% |
| Australia | 11 | 0.2% |
| Bahamas | 10 | 0.2% |
| Brazil | 2 | 0.0% |
| Canada | 131 | 2.3% |
| Caribbean | 59 | 1.0% |
| Central America | 88 | 1.5% |
| China | 20 | 0.4% |
| Colombia | 90 | 1.6% |
| Eastern Asia | 39 | 0.7% |
| Eastern Europe | 60 | 1.1% |
| England | 22 | 0.4% |
| Europe | 165 | 2.9% |
| Germany | 29 | 0.5% |
| Honduras | 21 | 0.4% |
| Hong Kong | 6 | 0.1% |
| India | 8 | 0.1% |
| Iran | 5 | 0.1% |
| Ireland | 7 | 0.1% |
| Italy | 2 | 0.0% |
| Jamaica | 49 | 0.9% |
| Korea | 19 | 0.3% |
| Latin America | 239 | 4.2% |
| Mexico | 67 | 1.2% |
| Netherlands | 22 | 0.4% |
| Northern Europe | 52 | 0.9% |
| Oceania | 13 | 0.2% |
| Philippines | 157 | 2.7% |
| Poland | 16 | 0.3% |
| Russia | 33 | 0.6% |
| South America | 92 | 1.6% |
| South Central Asia | 13 | 0.2% |
| South Eastern Asia | 157 | 2.7% |
| Southern Europe | 2 | 0.0% |
| Sweden | 13 | 0.2% |
| Western Asia | 12 | 0.2% |
| Western Europe | 51 | 0.9% | View All 37 Rows |
Sex and Age in Snyderville
Sex and Age in Snyderville
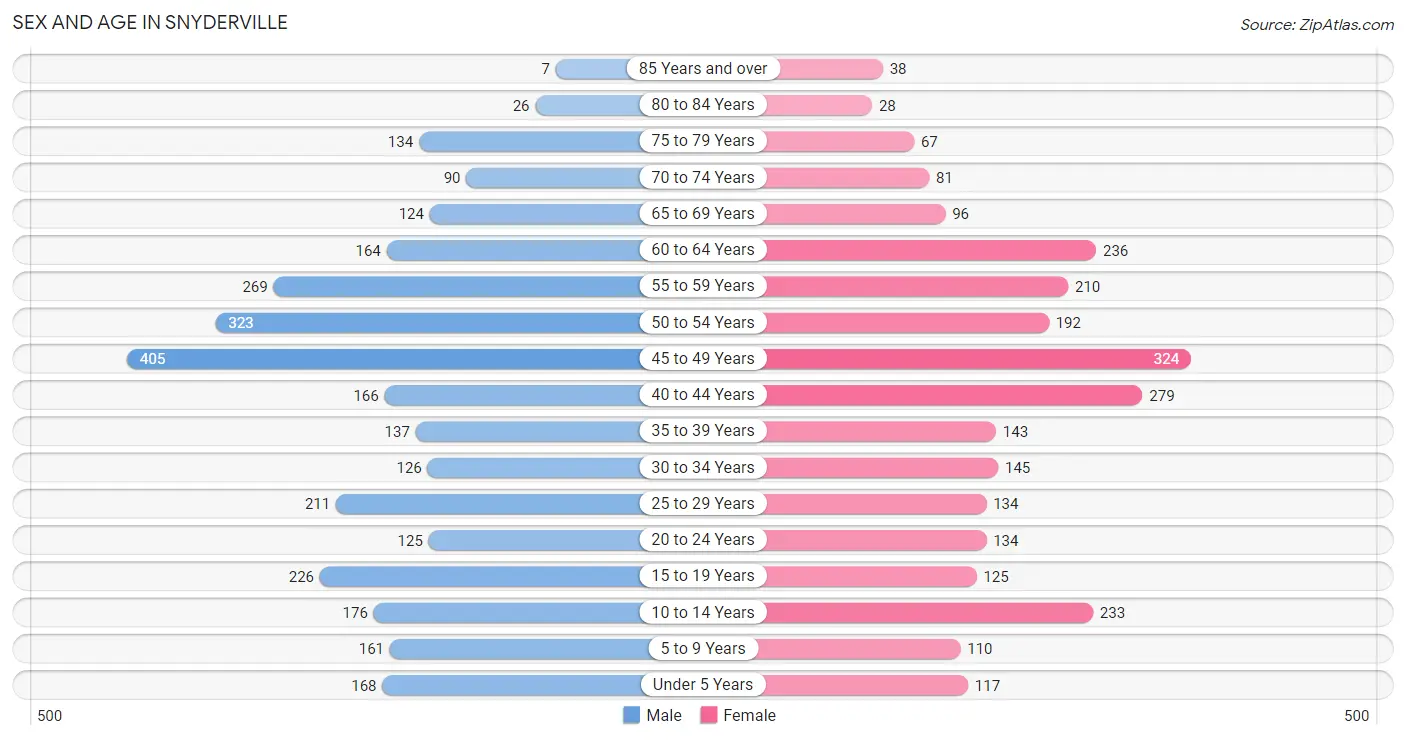
The most populous age groups in Snyderville are 45 to 49 Years (405 | 13.3%) for men and 45 to 49 Years (324 | 12.0%) for women.
| Age Bracket | Male | Female |
| Under 5 Years | 168 (5.5%) | 117 (4.3%) |
| 5 to 9 Years | 161 (5.3%) | 110 (4.1%) |
| 10 to 14 Years | 176 (5.8%) | 233 (8.7%) |
| 15 to 19 Years | 226 (7.4%) | 125 (4.6%) |
| 20 to 24 Years | 125 (4.1%) | 134 (5.0%) |
| 25 to 29 Years | 211 (7.0%) | 134 (5.0%) |
| 30 to 34 Years | 126 (4.2%) | 145 (5.4%) |
| 35 to 39 Years | 137 (4.5%) | 143 (5.3%) |
| 40 to 44 Years | 166 (5.5%) | 279 (10.4%) |
| 45 to 49 Years | 405 (13.3%) | 324 (12.0%) |
| 50 to 54 Years | 323 (10.6%) | 192 (7.1%) |
| 55 to 59 Years | 269 (8.8%) | 210 (7.8%) |
| 60 to 64 Years | 164 (5.4%) | 236 (8.8%) |
| 65 to 69 Years | 124 (4.1%) | 96 (3.6%) |
| 70 to 74 Years | 90 (3.0%) | 81 (3.0%) |
| 75 to 79 Years | 134 (4.4%) | 67 (2.5%) |
| 80 to 84 Years | 26 (0.9%) | 28 (1.0%) |
| 85 Years and over | 7 (0.2%) | 38 (1.4%) |
| Total | 3,038 (100.0%) | 2,692 (100.0%) |
Families and Households in Snyderville
Median Family Size in Snyderville
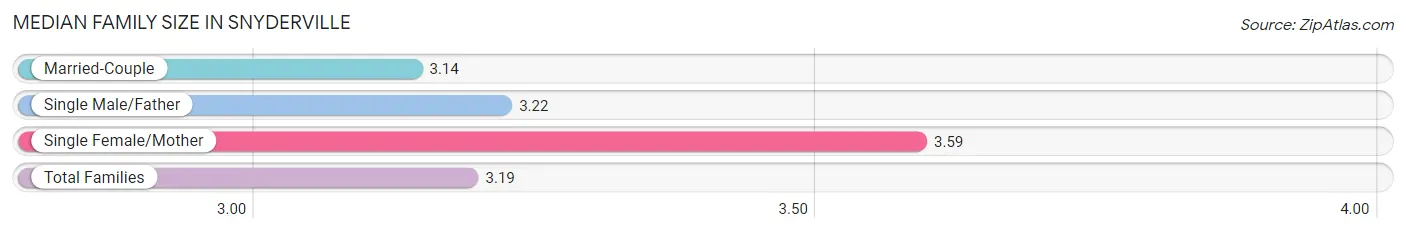
The median family size in Snyderville is 3.19 persons per family, with single female/mother families (137 | 10.1%) accounting for the largest median family size of 3.59 persons per family. On the other hand, married-couple families (1,161 | 85.8%) represent the smallest median family size with 3.14 persons per family.
| Family Type | # Families | Family Size |
| Married-Couple | 1,161 (85.8%) | 3.14 |
| Single Male/Father | 55 (4.1%) | 3.22 |
| Single Female/Mother | 137 (10.1%) | 3.59 |
| Total Families | 1,353 (100.0%) | 3.19 |
Median Household Size in Snyderville
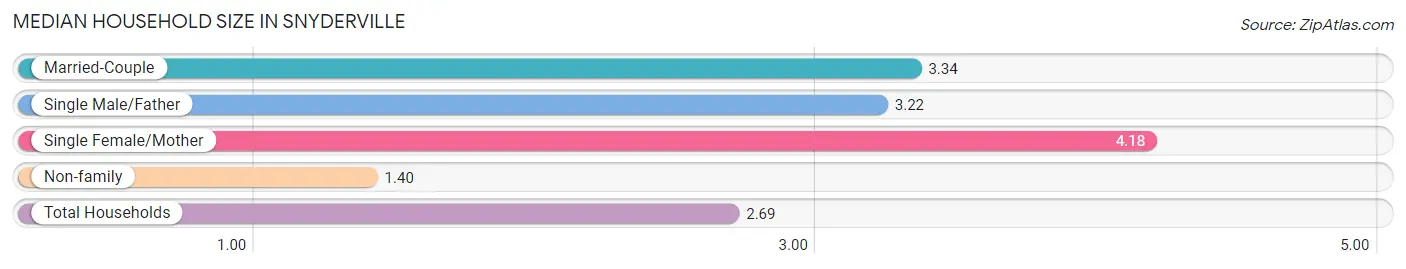
The median household size in Snyderville is 2.69 persons per household, with single female/mother households (137 | 6.4%) accounting for the largest median household size of 4.18 persons per household. non-family households (777 | 36.5%) represent the smallest median household size with 1.40 persons per household.
| Household Type | # Households | Household Size |
| Married-Couple | 1,161 (54.5%) | 3.34 |
| Single Male/Father | 55 (2.6%) | 3.22 |
| Single Female/Mother | 137 (6.4%) | 4.18 |
| Non-family | 777 (36.5%) | 1.40 |
| Total Households | 2,130 (100.0%) | 2.69 |
Household Size by Marriage Status in Snyderville
Out of a total of 2,130 households in Snyderville, 1,353 (63.5%) are family households, while 777 (36.5%) are nonfamily households. The most numerous type of family households are 2-person households, comprising 653, and the most common type of nonfamily households are 1-person households, comprising 649.
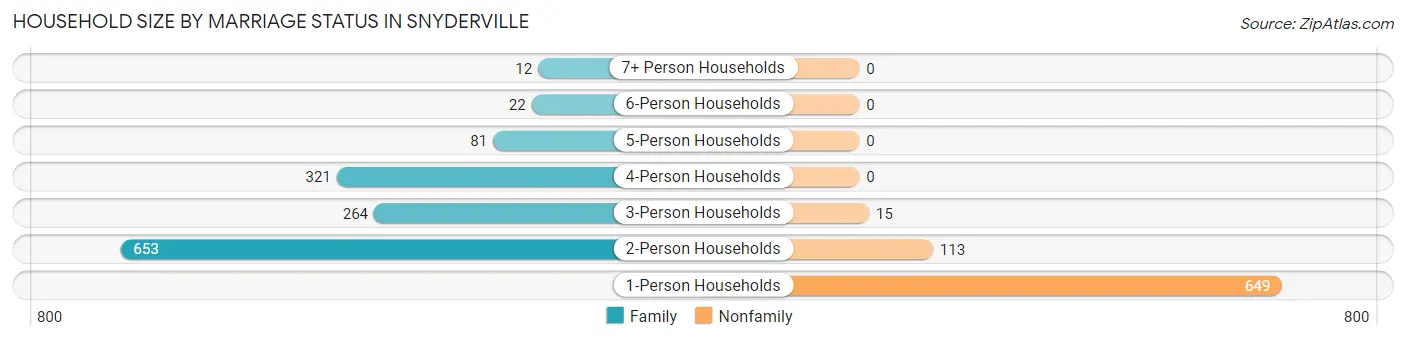
| Household Size | Family Households | Nonfamily Households |
| 1-Person Households | - | 649 (30.5%) |
| 2-Person Households | 653 (30.7%) | 113 (5.3%) |
| 3-Person Households | 264 (12.4%) | 15 (0.7%) |
| 4-Person Households | 321 (15.1%) | 0 (0.0%) |
| 5-Person Households | 81 (3.8%) | 0 (0.0%) |
| 6-Person Households | 22 (1.0%) | 0 (0.0%) |
| 7+ Person Households | 12 (0.6%) | 0 (0.0%) |
| Total | 1,353 (63.5%) | 777 (36.5%) |
Female Fertility in Snyderville
Fertility by Age in Snyderville
Average fertility rate in Snyderville is 20.0 births per 1,000 women. Women in the age bracket of 20 to 34 years have the highest fertility rate with 27.0 births per 1,000 women. Women in the age bracket of 35 to 50 years acount for 59.3% of all women with births.
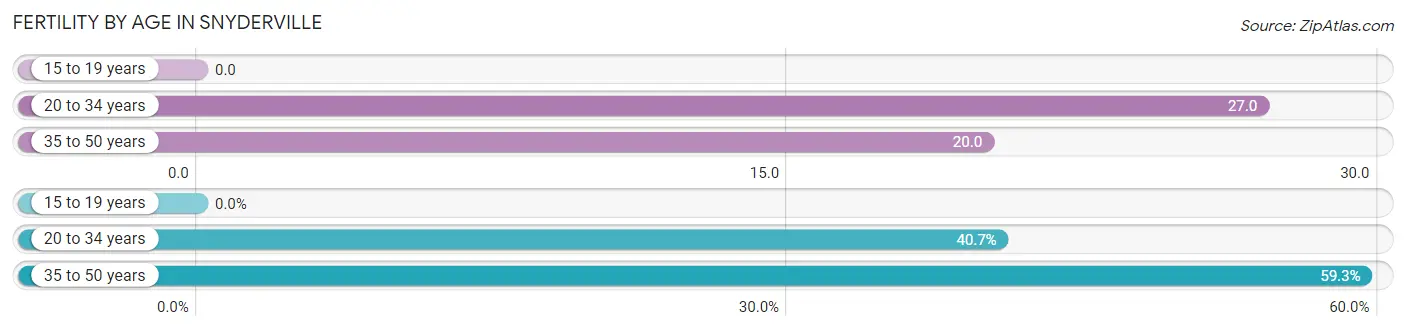
| Age Bracket | Women with Births | Births / 1,000 Women |
| 15 to 19 years | 0 (0.0%) | 0.0 |
| 20 to 34 years | 11 (40.7%) | 27.0 |
| 35 to 50 years | 16 (59.3%) | 20.0 |
| Total | 27 (100.0%) | 20.0 |
Fertility by Age by Marriage Status in Snyderville
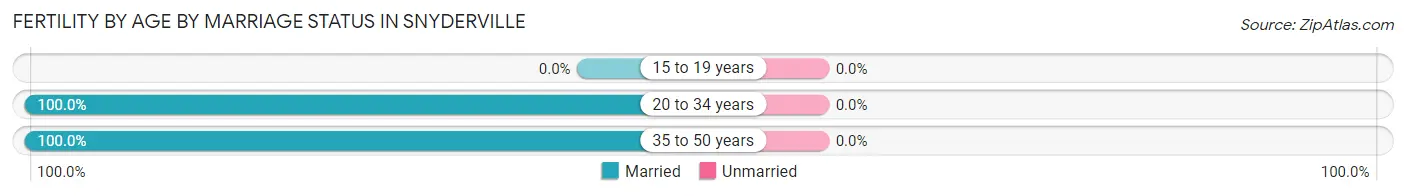
| Age Bracket | Married | Unmarried |
| 15 to 19 years | 0 (0.0%) | 0 (0.0%) |
| 20 to 34 years | 11 (100.0%) | 0 (0.0%) |
| 35 to 50 years | 16 (100.0%) | 0 (0.0%) |
| Total | 27 (100.0%) | 0 (0.0%) |
Fertility by Education in Snyderville
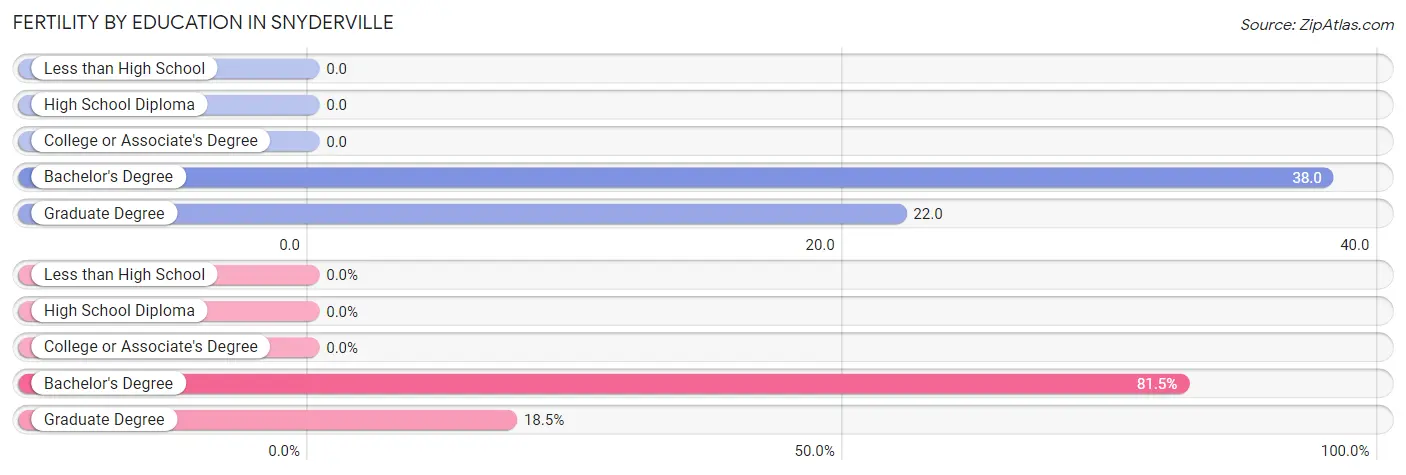
| Educational Attainment | Women with Births | Births / 1,000 Women |
| Less than High School | 0 (0.0%) | 0.0 |
| High School Diploma | 0 (0.0%) | 0.0 |
| College or Associate's Degree | 0 (0.0%) | 0.0 |
| Bachelor's Degree | 22 (81.5%) | 38.0 |
| Graduate Degree | 5 (18.5%) | 22.0 |
| Total | 27 (100.0%) | 20.0 |
Fertility by Education by Marriage Status in Snyderville
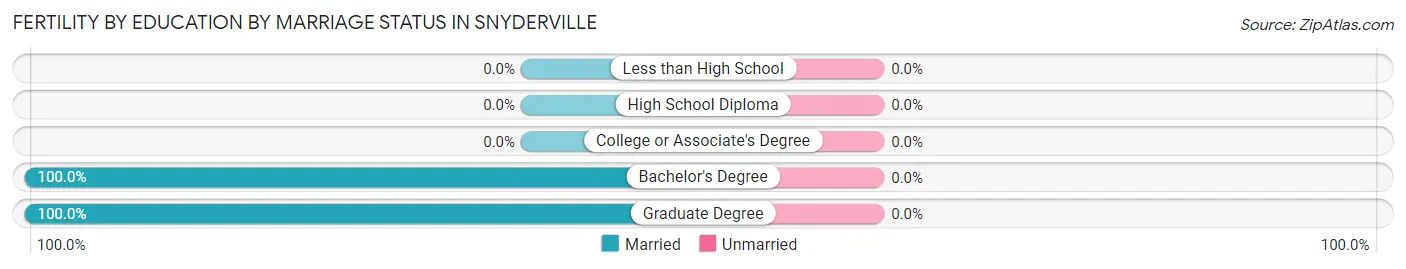
| Educational Attainment | Married | Unmarried |
| Less than High School | 0 (0.0%) | 0 (0.0%) |
| High School Diploma | 0 (0.0%) | 0 (0.0%) |
| College or Associate's Degree | 0 (0.0%) | 0 (0.0%) |
| Bachelor's Degree | 22 (100.0%) | 0 (0.0%) |
| Graduate Degree | 5 (100.0%) | 0 (0.0%) |
| Total | 27 (100.0%) | 0 (0.0%) |
Employment Characteristics in Snyderville
Employment by Class of Employer in Snyderville
Among the 3,164 employed individuals in Snyderville, private company employees (1,976 | 62.5%), self-employed (not incorporated) (419 | 13.2%), and not-for-profit organizations (265 | 8.4%) make up the most common classes of employment.
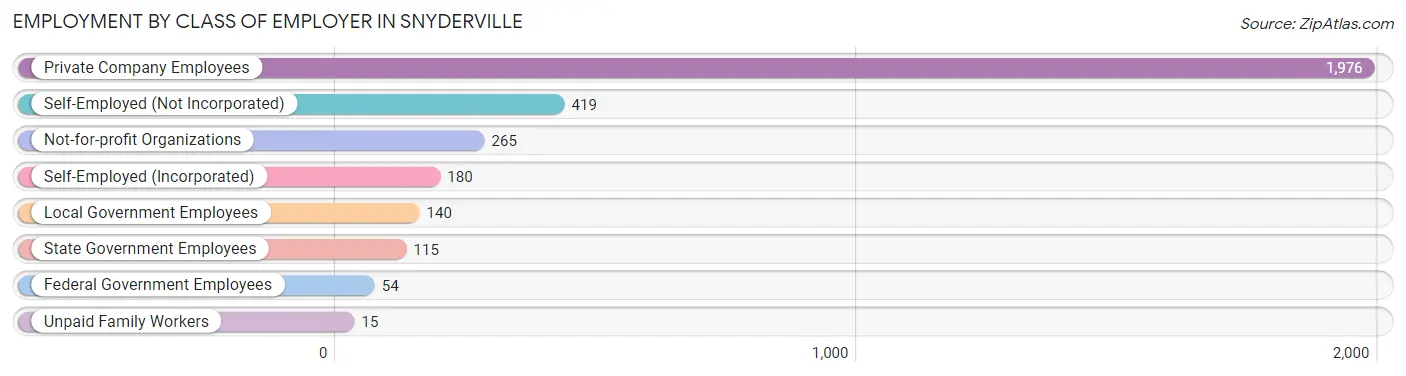
| Employer Class | # Employees | % Employees |
| Private Company Employees | 1,976 | 62.5% |
| Self-Employed (Incorporated) | 180 | 5.7% |
| Self-Employed (Not Incorporated) | 419 | 13.2% |
| Not-for-profit Organizations | 265 | 8.4% |
| Local Government Employees | 140 | 4.4% |
| State Government Employees | 115 | 3.6% |
| Federal Government Employees | 54 | 1.7% |
| Unpaid Family Workers | 15 | 0.5% |
| Total | 3,164 | 100.0% |
Employment Status by Age in Snyderville
According to the labor force statistics for Snyderville, out of the total population over 16 years of age (4,680), 68.8% or 3,220 individuals are in the labor force, with 1.0% or 32 of them unemployed. The age group with the highest labor force participation rate is 55 to 59 years, with 91.4% or 438 individuals in the labor force. Within the labor force, the 30 to 34 years age range has the highest percentage of unemployed individuals, with 3.8% or 8 of them being unemployed.
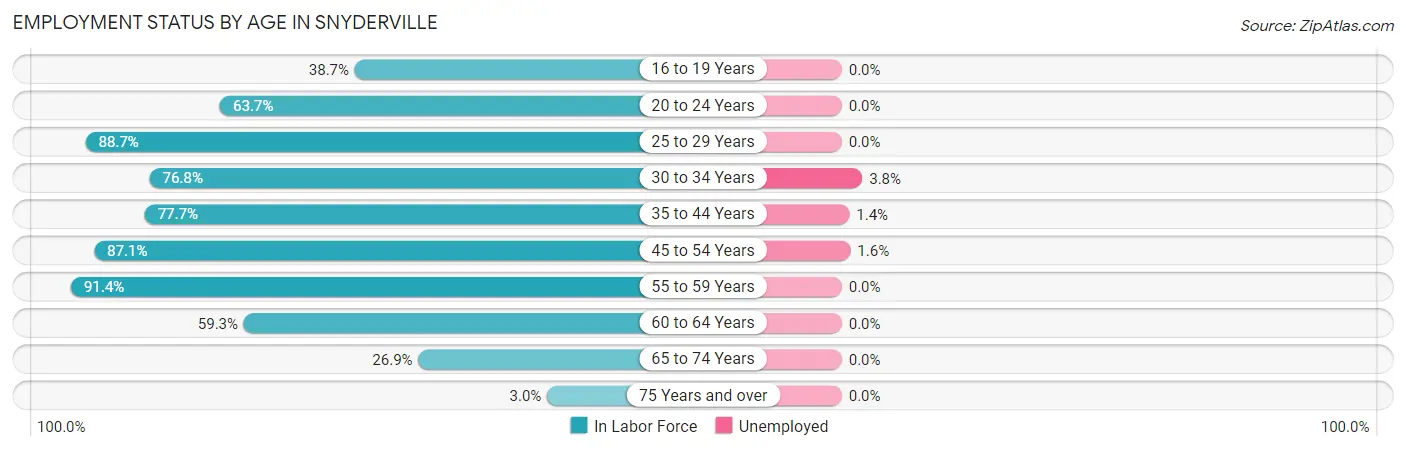
| Age Bracket | In Labor Force | Unemployed |
| 16 to 19 Years | 103 (38.7%) | 0 (0.0%) |
| 20 to 24 Years | 165 (63.7%) | 0 (0.0%) |
| 25 to 29 Years | 306 (88.7%) | 0 (0.0%) |
| 30 to 34 Years | 208 (76.8%) | 8 (3.8%) |
| 35 to 44 Years | 563 (77.7%) | 8 (1.4%) |
| 45 to 54 Years | 1,084 (87.1%) | 17 (1.6%) |
| 55 to 59 Years | 438 (91.4%) | 0 (0.0%) |
| 60 to 64 Years | 237 (59.3%) | 0 (0.0%) |
| 65 to 74 Years | 105 (26.9%) | 0 (0.0%) |
| 75 Years and over | 9 (3.0%) | 0 (0.0%) |
| Total | 3,220 (68.8%) | 32 (1.0%) |
Employment Status by Educational Attainment in Snyderville
According to labor force statistics for Snyderville, 81.9% of individuals (2,837) out of the total population between 25 and 64 years of age (3,464) are in the labor force, with 1.2% or 34 of them being unemployed. The group with the highest labor force participation rate are those with the educational attainment of high school diploma, with 87.5% or 217 individuals in the labor force. Within the labor force, individuals with high school diploma education have the highest percentage of unemployment, with 3.7% or 8 of them being unemployed.
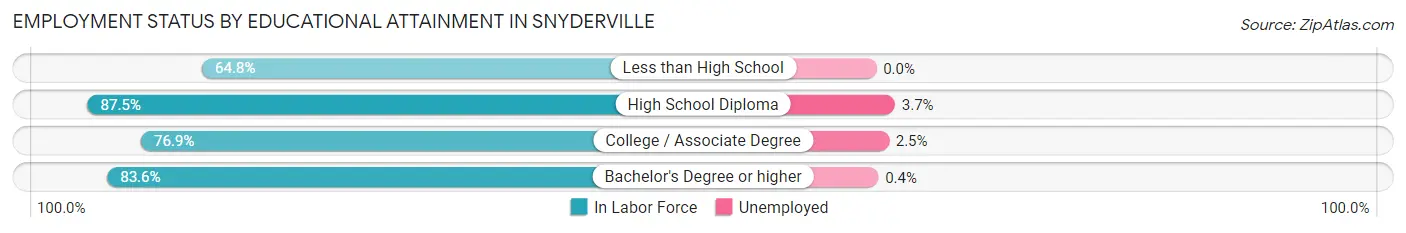
| Educational Attainment | In Labor Force | Unemployed |
| Less than High School | 35 (64.8%) | 0 (0.0%) |
| High School Diploma | 217 (87.5%) | 9 (3.7%) |
| College / Associate Degree | 688 (76.9%) | 22 (2.5%) |
| Bachelor's Degree or higher | 1,895 (83.6%) | 9 (0.4%) |
| Total | 2,837 (81.9%) | 42 (1.2%) |
Employment Occupations by Sex in Snyderville
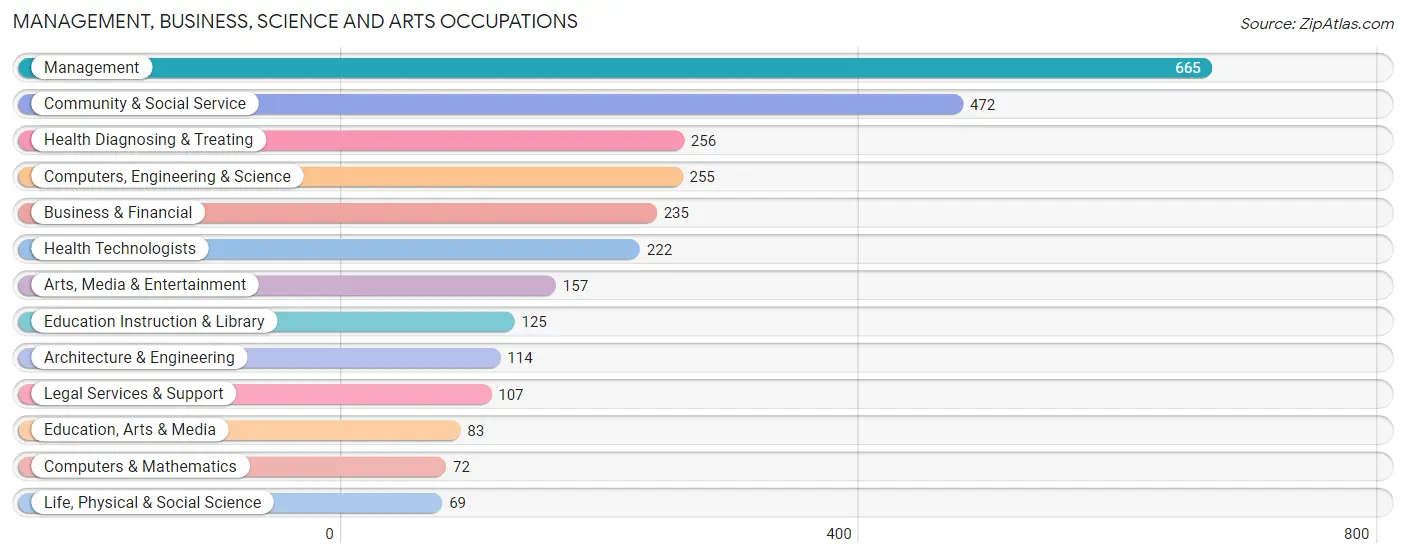
Management, Business, Science and Arts Occupations
The most common Management, Business, Science and Arts occupations in Snyderville are Management (665 | 20.9%), Community & Social Service (472 | 14.8%), Health Diagnosing & Treating (256 | 8.0%), Computers, Engineering & Science (255 | 8.0%), and Business & Financial (235 | 7.4%).
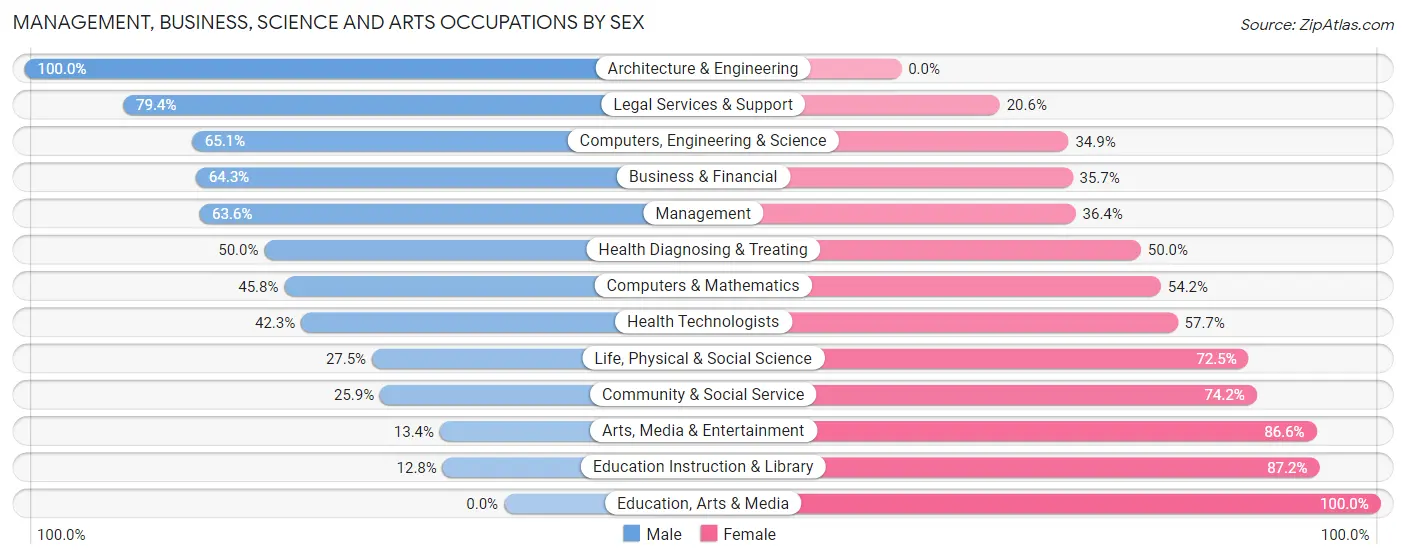
Management, Business, Science and Arts Occupations by Sex
Within the Management, Business, Science and Arts occupations in Snyderville, the most male-oriented occupations are Architecture & Engineering (100.0%), Legal Services & Support (79.4%), and Computers, Engineering & Science (65.1%), while the most female-oriented occupations are Education, Arts & Media (100.0%), Education Instruction & Library (87.2%), and Arts, Media & Entertainment (86.6%).
| Occupation | Male | Female |
| Management | 423 (63.6%) | 242 (36.4%) |
| Business & Financial | 151 (64.3%) | 84 (35.7%) |
| Computers, Engineering & Science | 166 (65.1%) | 89 (34.9%) |
| Computers & Mathematics | 33 (45.8%) | 39 (54.2%) |
| Architecture & Engineering | 114 (100.0%) | 0 (0.0%) |
| Life, Physical & Social Science | 19 (27.5%) | 50 (72.5%) |
| Community & Social Service | 122 (25.9%) | 350 (74.2%) |
| Education, Arts & Media | 0 (0.0%) | 83 (100.0%) |
| Legal Services & Support | 85 (79.4%) | 22 (20.6%) |
| Education Instruction & Library | 16 (12.8%) | 109 (87.2%) |
| Arts, Media & Entertainment | 21 (13.4%) | 136 (86.6%) |
| Health Diagnosing & Treating | 128 (50.0%) | 128 (50.0%) |
| Health Technologists | 94 (42.3%) | 128 (57.7%) |
| Total (Category) | 990 (52.6%) | 893 (47.4%) |
| Total (Overall) | 1,853 (58.2%) | 1,332 (41.8%) |
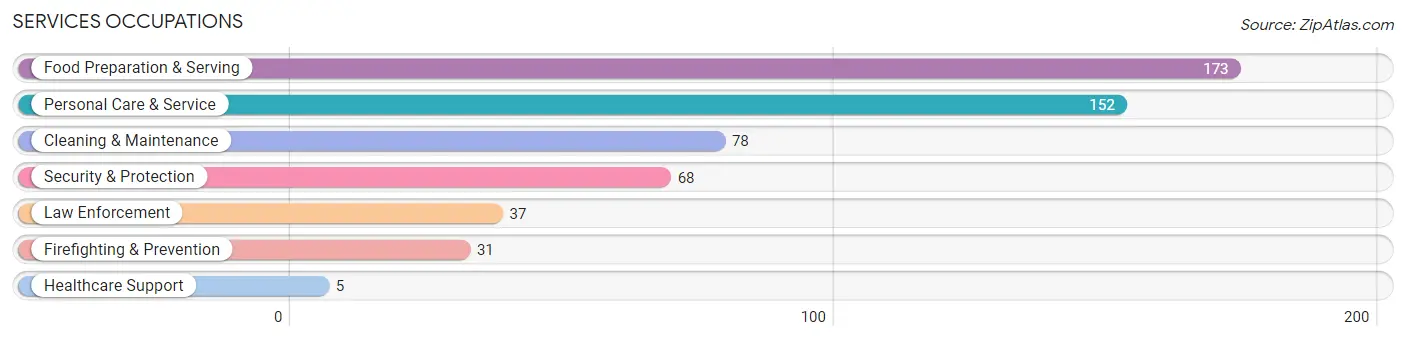
Services Occupations
The most common Services occupations in Snyderville are Food Preparation & Serving (173 | 5.4%), Personal Care & Service (152 | 4.8%), Cleaning & Maintenance (78 | 2.5%), Security & Protection (68 | 2.1%), and Law Enforcement (37 | 1.2%).
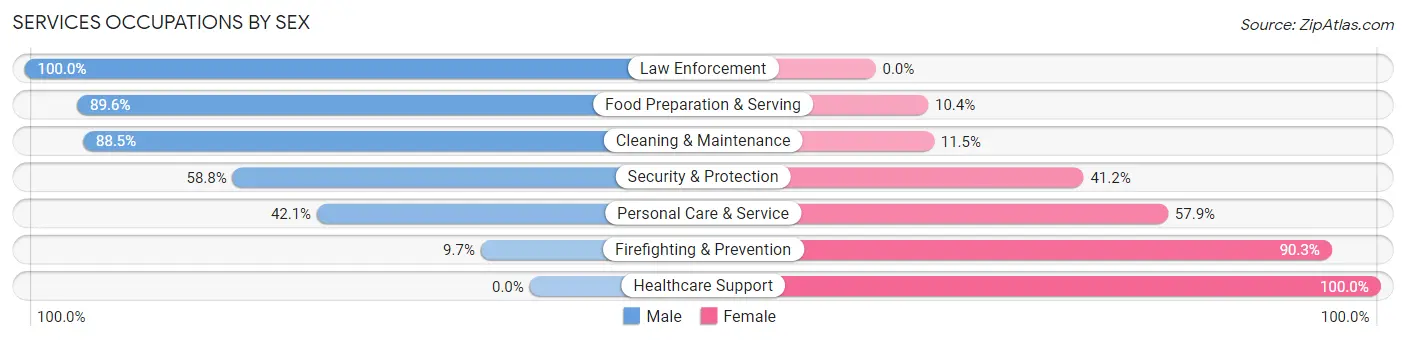
Services Occupations by Sex
Within the Services occupations in Snyderville, the most male-oriented occupations are Law Enforcement (100.0%), Food Preparation & Serving (89.6%), and Cleaning & Maintenance (88.5%), while the most female-oriented occupations are Healthcare Support (100.0%), Firefighting & Prevention (90.3%), and Personal Care & Service (57.9%).
| Occupation | Male | Female |
| Healthcare Support | 0 (0.0%) | 5 (100.0%) |
| Security & Protection | 40 (58.8%) | 28 (41.2%) |
| Firefighting & Prevention | 3 (9.7%) | 28 (90.3%) |
| Law Enforcement | 37 (100.0%) | 0 (0.0%) |
| Food Preparation & Serving | 155 (89.6%) | 18 (10.4%) |
| Cleaning & Maintenance | 69 (88.5%) | 9 (11.5%) |
| Personal Care & Service | 64 (42.1%) | 88 (57.9%) |
| Total (Category) | 328 (68.9%) | 148 (31.1%) |
| Total (Overall) | 1,853 (58.2%) | 1,332 (41.8%) |
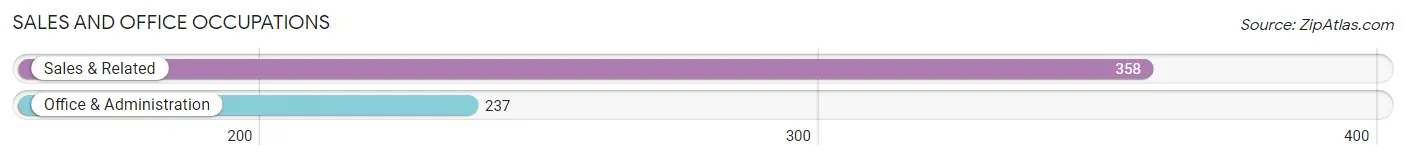
Sales and Office Occupations
The most common Sales and Office occupations in Snyderville are Sales & Related (358 | 11.2%), and Office & Administration (237 | 7.4%).
Sales and Office Occupations by Sex
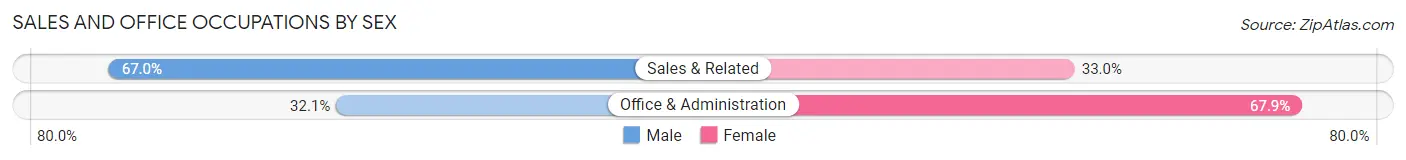
| Occupation | Male | Female |
| Sales & Related | 240 (67.0%) | 118 (33.0%) |
| Office & Administration | 76 (32.1%) | 161 (67.9%) |
| Total (Category) | 316 (53.1%) | 279 (46.9%) |
| Total (Overall) | 1,853 (58.2%) | 1,332 (41.8%) |
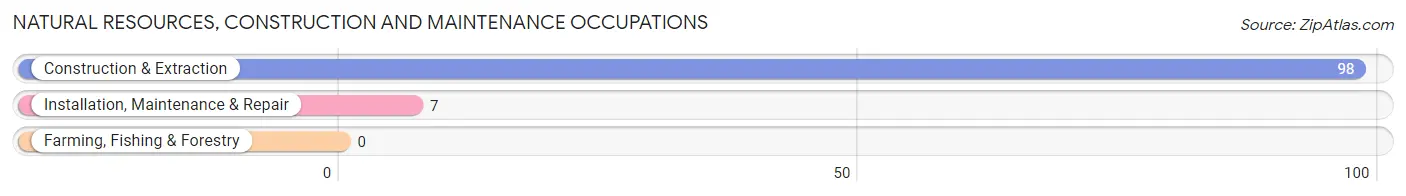
Natural Resources, Construction and Maintenance Occupations
The most common Natural Resources, Construction and Maintenance occupations in Snyderville are Construction & Extraction (98 | 3.1%), and Installation, Maintenance & Repair (7 | 0.2%).
Natural Resources, Construction and Maintenance Occupations by Sex
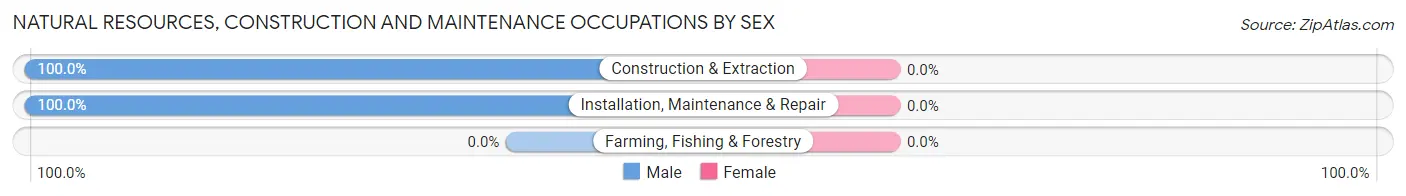
| Occupation | Male | Female |
| Farming, Fishing & Forestry | 0 (0.0%) | 0 (0.0%) |
| Construction & Extraction | 98 (100.0%) | 0 (0.0%) |
| Installation, Maintenance & Repair | 7 (100.0%) | 0 (0.0%) |
| Total (Category) | 105 (100.0%) | 0 (0.0%) |
| Total (Overall) | 1,853 (58.2%) | 1,332 (41.8%) |
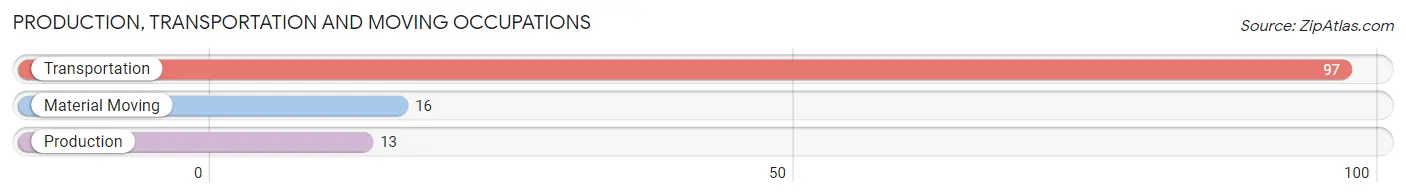
Production, Transportation and Moving Occupations
The most common Production, Transportation and Moving occupations in Snyderville are Transportation (97 | 3.0%), Material Moving (16 | 0.5%), and Production (13 | 0.4%).
Production, Transportation and Moving Occupations by Sex
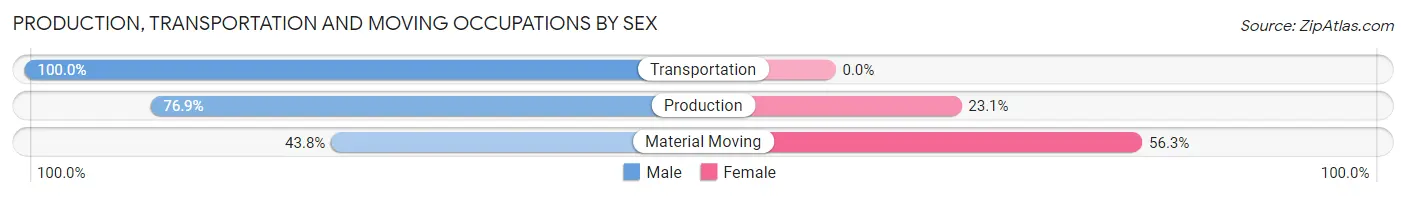
| Occupation | Male | Female |
| Production | 10 (76.9%) | 3 (23.1%) |
| Transportation | 97 (100.0%) | 0 (0.0%) |
| Material Moving | 7 (43.8%) | 9 (56.2%) |
| Total (Category) | 114 (90.5%) | 12 (9.5%) |
| Total (Overall) | 1,853 (58.2%) | 1,332 (41.8%) |
Employment Industries by Sex in Snyderville
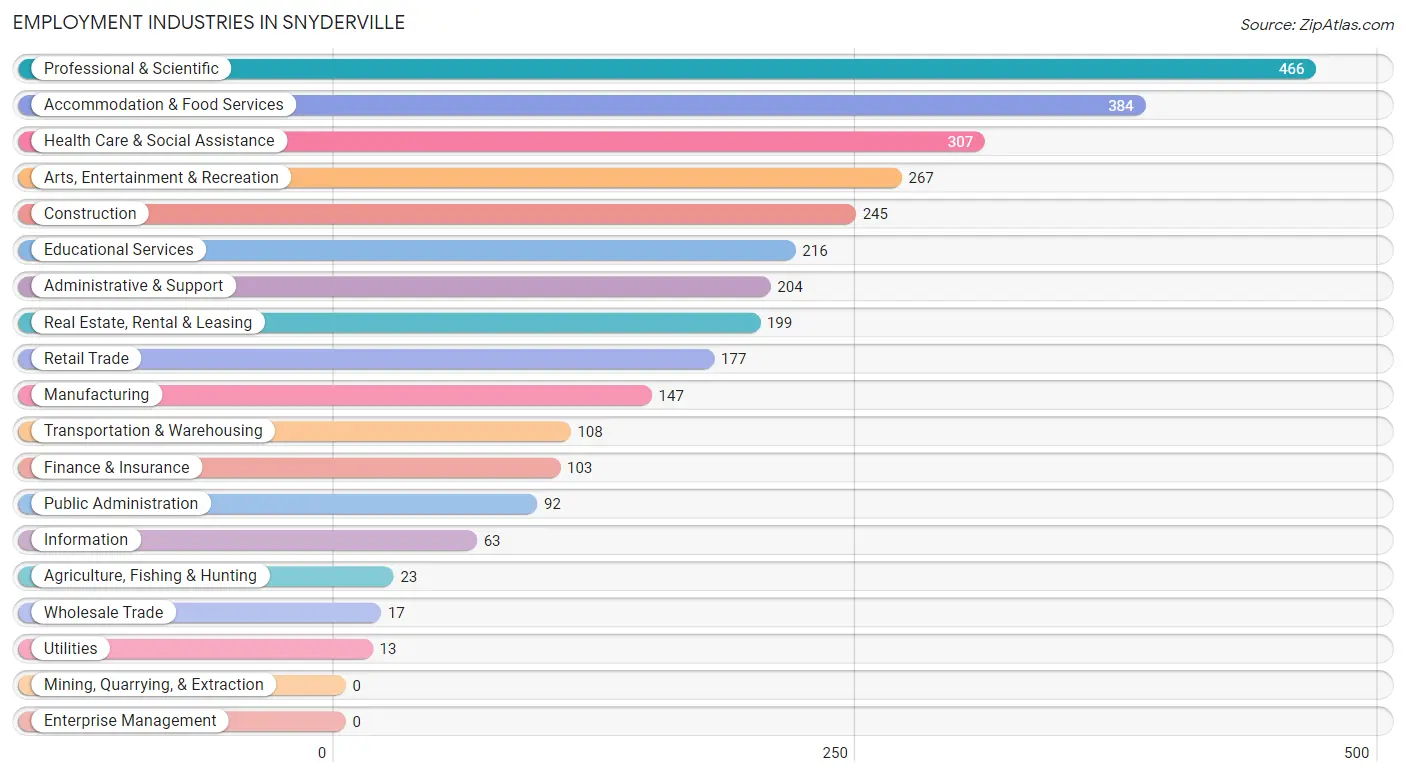
Employment Industries in Snyderville
The major employment industries in Snyderville include Professional & Scientific (466 | 14.6%), Accommodation & Food Services (384 | 12.1%), Health Care & Social Assistance (307 | 9.6%), Arts, Entertainment & Recreation (267 | 8.4%), and Construction (245 | 7.7%).
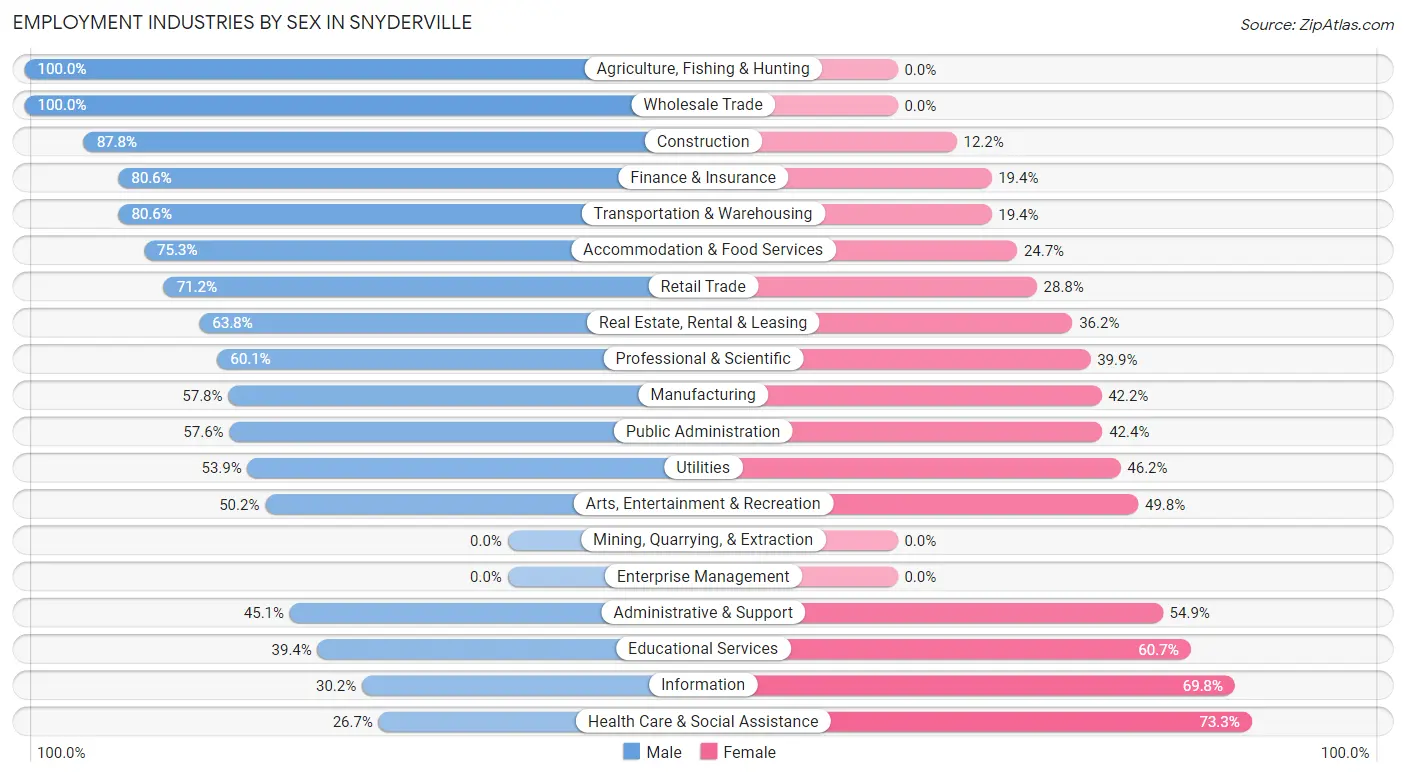
Employment Industries by Sex in Snyderville
The Snyderville industries that see more men than women are Agriculture, Fishing & Hunting (100.0%), Wholesale Trade (100.0%), and Construction (87.8%), whereas the industries that tend to have a higher number of women are Health Care & Social Assistance (73.3%), Information (69.8%), and Educational Services (60.7%).
| Industry | Male | Female |
| Agriculture, Fishing & Hunting | 23 (100.0%) | 0 (0.0%) |
| Mining, Quarrying, & Extraction | 0 (0.0%) | 0 (0.0%) |
| Construction | 215 (87.8%) | 30 (12.2%) |
| Manufacturing | 85 (57.8%) | 62 (42.2%) |
| Wholesale Trade | 17 (100.0%) | 0 (0.0%) |
| Retail Trade | 126 (71.2%) | 51 (28.8%) |
| Transportation & Warehousing | 87 (80.6%) | 21 (19.4%) |
| Utilities | 7 (53.8%) | 6 (46.2%) |
| Information | 19 (30.2%) | 44 (69.8%) |
| Finance & Insurance | 83 (80.6%) | 20 (19.4%) |
| Real Estate, Rental & Leasing | 127 (63.8%) | 72 (36.2%) |
| Professional & Scientific | 280 (60.1%) | 186 (39.9%) |
| Enterprise Management | 0 (0.0%) | 0 (0.0%) |
| Administrative & Support | 92 (45.1%) | 112 (54.9%) |
| Educational Services | 85 (39.4%) | 131 (60.7%) |
| Health Care & Social Assistance | 82 (26.7%) | 225 (73.3%) |
| Arts, Entertainment & Recreation | 134 (50.2%) | 133 (49.8%) |
| Accommodation & Food Services | 289 (75.3%) | 95 (24.7%) |
| Public Administration | 53 (57.6%) | 39 (42.4%) |
| Total | 1,853 (58.2%) | 1,332 (41.8%) |
Education in Snyderville
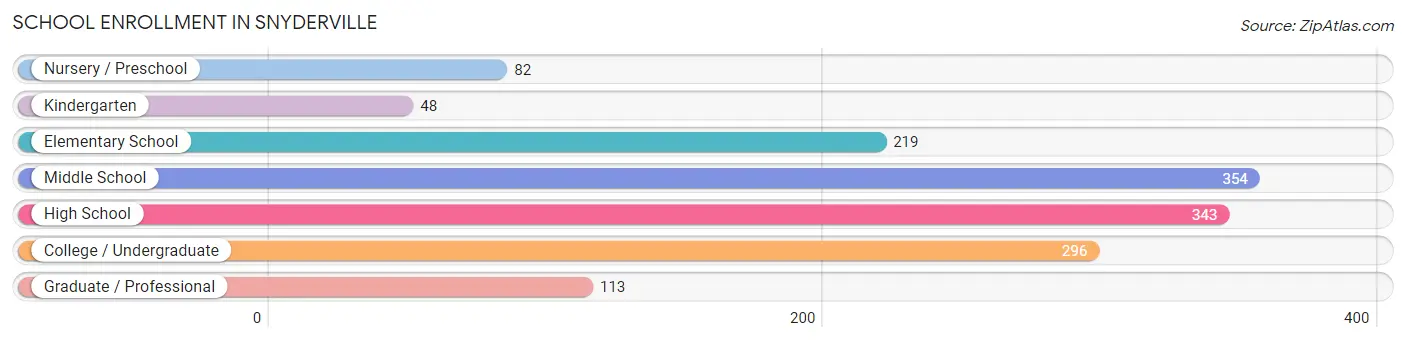
School Enrollment in Snyderville
The most common levels of schooling among the 1,455 students in Snyderville are middle school (354 | 24.3%), high school (343 | 23.6%), and college / undergraduate (296 | 20.3%).
| School Level | # Students | % Students |
| Nursery / Preschool | 82 | 5.6% |
| Kindergarten | 48 | 3.3% |
| Elementary School | 219 | 15.0% |
| Middle School | 354 | 24.3% |
| High School | 343 | 23.6% |
| College / Undergraduate | 296 | 20.3% |
| Graduate / Professional | 113 | 7.8% |
| Total | 1,455 | 100.0% |
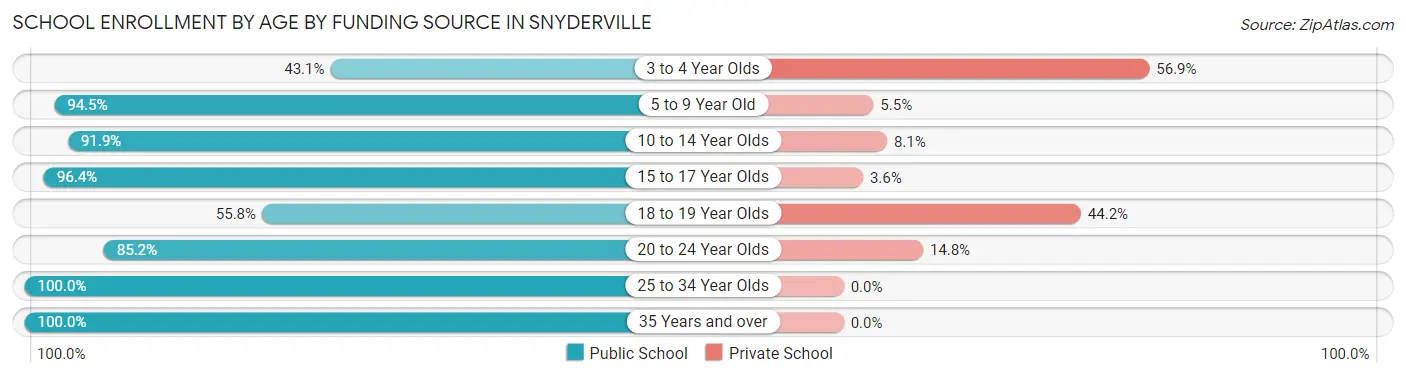
School Enrollment by Age by Funding Source in Snyderville
Out of a total of 1,455 students who are enrolled in schools in Snyderville, 167 (11.5%) attend a private institution, while the remaining 1,288 (88.5%) are enrolled in public schools. The age group of 3 to 4 year olds has the highest likelihood of being enrolled in private schools, with 41 (56.9% in the age bracket) enrolled. Conversely, the age group of 25 to 34 year olds has the lowest likelihood of being enrolled in a private school, with 92 (100.0% in the age bracket) attending a public institution.
| Age Bracket | Public School | Private School |
| 3 to 4 Year Olds | 31 (43.1%) | 41 (56.9%) |
| 5 to 9 Year Old | 256 (94.5%) | 15 (5.5%) |
| 10 to 14 Year Olds | 376 (91.9%) | 33 (8.1%) |
| 15 to 17 Year Olds | 214 (96.4%) | 8 (3.6%) |
| 18 to 19 Year Olds | 72 (55.8%) | 57 (44.2%) |
| 20 to 24 Year Olds | 75 (85.2%) | 13 (14.8%) |
| 25 to 34 Year Olds | 92 (100.0%) | 0 (0.0%) |
| 35 Years and over | 172 (100.0%) | 0 (0.0%) |
| Total | 1,288 (88.5%) | 167 (11.5%) |
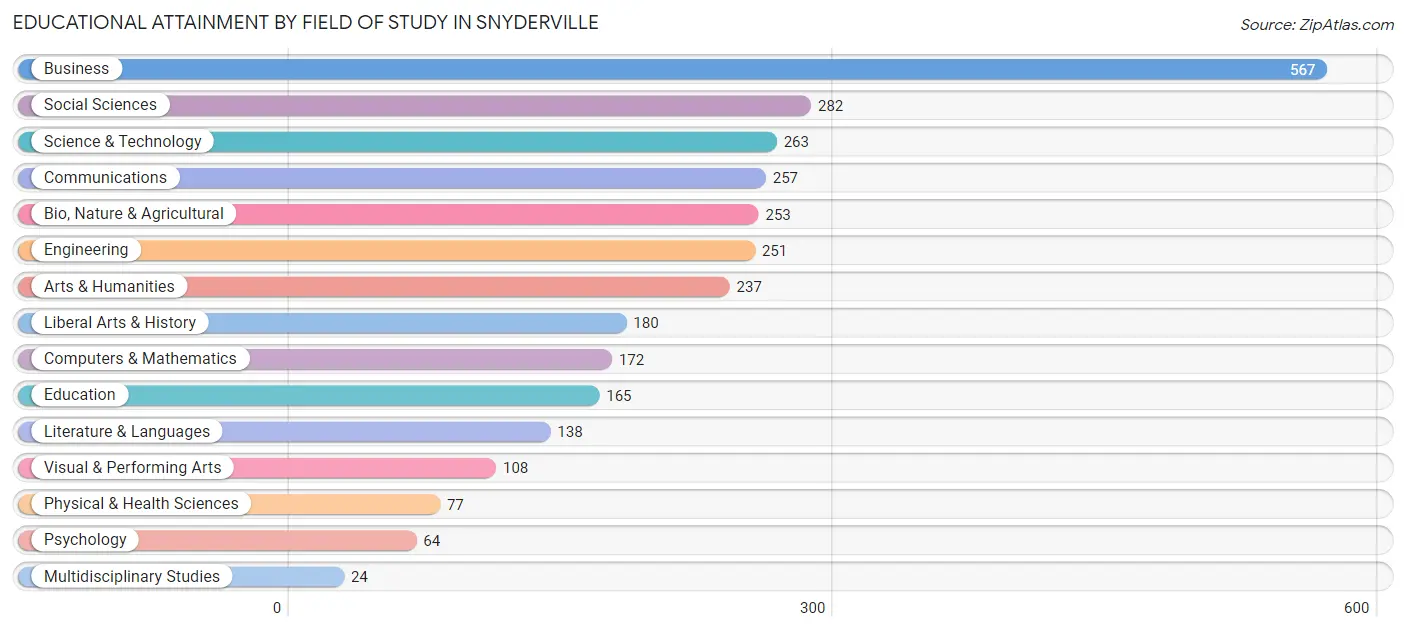
Educational Attainment by Field of Study in Snyderville
Business (567 | 18.7%), social sciences (282 | 9.3%), science & technology (263 | 8.7%), communications (257 | 8.5%), and bio, nature & agricultural (253 | 8.3%) are the most common fields of study among 3,038 individuals in Snyderville who have obtained a bachelor's degree or higher.
| Field of Study | # Graduates | % Graduates |
| Computers & Mathematics | 172 | 5.7% |
| Bio, Nature & Agricultural | 253 | 8.3% |
| Physical & Health Sciences | 77 | 2.5% |
| Psychology | 64 | 2.1% |
| Social Sciences | 282 | 9.3% |
| Engineering | 251 | 8.3% |
| Multidisciplinary Studies | 24 | 0.8% |
| Science & Technology | 263 | 8.7% |
| Business | 567 | 18.7% |
| Education | 165 | 5.4% |
| Literature & Languages | 138 | 4.5% |
| Liberal Arts & History | 180 | 5.9% |
| Visual & Performing Arts | 108 | 3.5% |
| Communications | 257 | 8.5% |
| Arts & Humanities | 237 | 7.8% |
| Total | 3,038 | 100.0% |
Transportation & Commute in Snyderville
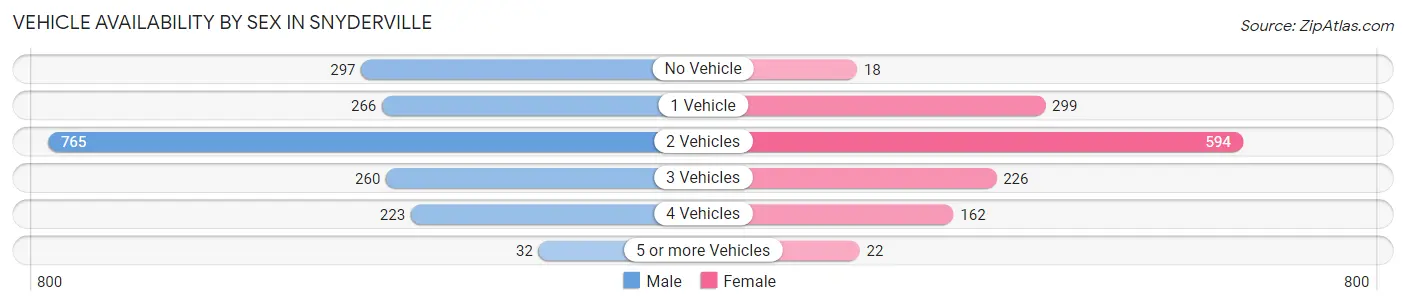
Vehicle Availability by Sex in Snyderville
The most prevalent vehicle ownership categories in Snyderville are males with 2 vehicles (765, accounting for 41.5%) and females with 2 vehicles (594, making up 57.9%).
| Vehicles Available | Male | Female |
| No Vehicle | 297 (16.1%) | 18 (1.4%) |
| 1 Vehicle | 266 (14.4%) | 299 (22.6%) |
| 2 Vehicles | 765 (41.5%) | 594 (45.0%) |
| 3 Vehicles | 260 (14.1%) | 226 (17.1%) |
| 4 Vehicles | 223 (12.1%) | 162 (12.3%) |
| 5 or more Vehicles | 32 (1.7%) | 22 (1.7%) |
| Total | 1,843 (100.0%) | 1,321 (100.0%) |
Commute Time in Snyderville
The most frequently occuring commute durations in Snyderville are 10 to 14 minutes (570 commuters, 25.4%), 30 to 34 minutes (330 commuters, 14.7%), and 5 to 9 minutes (277 commuters, 12.3%).
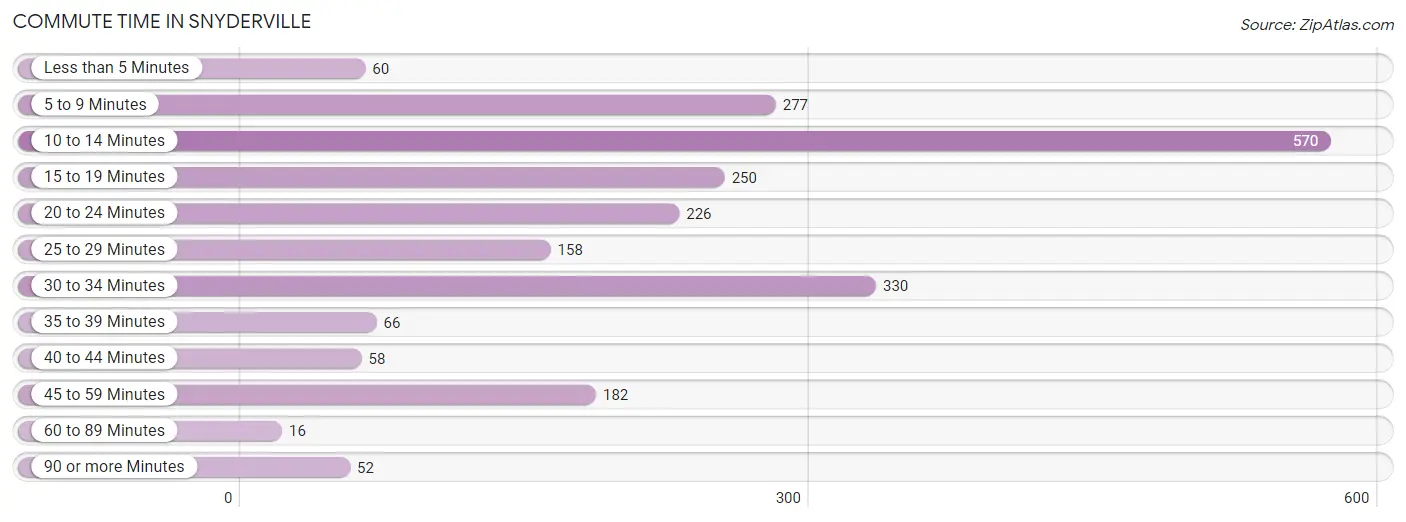
| Commute Time | # Commuters | % Commuters |
| Less than 5 Minutes | 60 | 2.7% |
| 5 to 9 Minutes | 277 | 12.3% |
| 10 to 14 Minutes | 570 | 25.4% |
| 15 to 19 Minutes | 250 | 11.1% |
| 20 to 24 Minutes | 226 | 10.1% |
| 25 to 29 Minutes | 158 | 7.0% |
| 30 to 34 Minutes | 330 | 14.7% |
| 35 to 39 Minutes | 66 | 2.9% |
| 40 to 44 Minutes | 58 | 2.6% |
| 45 to 59 Minutes | 182 | 8.1% |
| 60 to 89 Minutes | 16 | 0.7% |
| 90 or more Minutes | 52 | 2.3% |
Commute Time by Sex in Snyderville
The most common commute times in Snyderville are 10 to 14 minutes (319 commuters, 23.8%) for males and 10 to 14 minutes (251 commuters, 27.8%) for females.
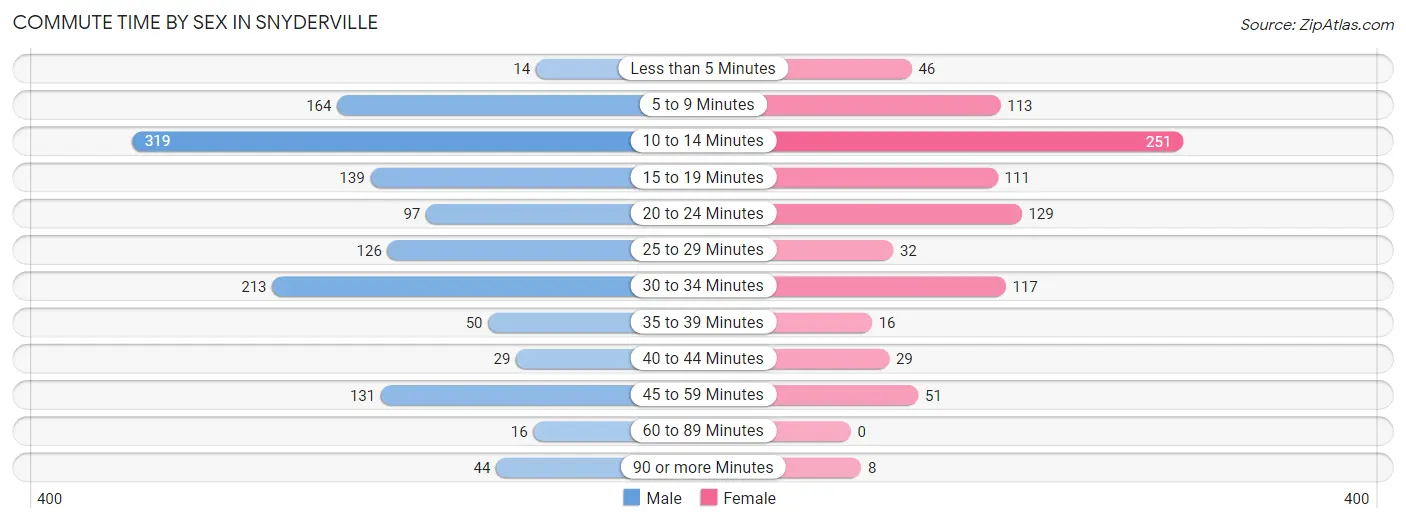
| Commute Time | Male | Female |
| Less than 5 Minutes | 14 (1.0%) | 46 (5.1%) |
| 5 to 9 Minutes | 164 (12.2%) | 113 (12.5%) |
| 10 to 14 Minutes | 319 (23.8%) | 251 (27.8%) |
| 15 to 19 Minutes | 139 (10.4%) | 111 (12.3%) |
| 20 to 24 Minutes | 97 (7.2%) | 129 (14.3%) |
| 25 to 29 Minutes | 126 (9.4%) | 32 (3.5%) |
| 30 to 34 Minutes | 213 (15.9%) | 117 (13.0%) |
| 35 to 39 Minutes | 50 (3.7%) | 16 (1.8%) |
| 40 to 44 Minutes | 29 (2.2%) | 29 (3.2%) |
| 45 to 59 Minutes | 131 (9.8%) | 51 (5.7%) |
| 60 to 89 Minutes | 16 (1.2%) | 0 (0.0%) |
| 90 or more Minutes | 44 (3.3%) | 8 (0.9%) |
Time of Departure to Work by Sex in Snyderville
The most frequent times of departure to work in Snyderville are 8:00 AM to 8:29 AM (411, 30.6%) for males and 8:00 AM to 8:29 AM (255, 28.2%) for females.
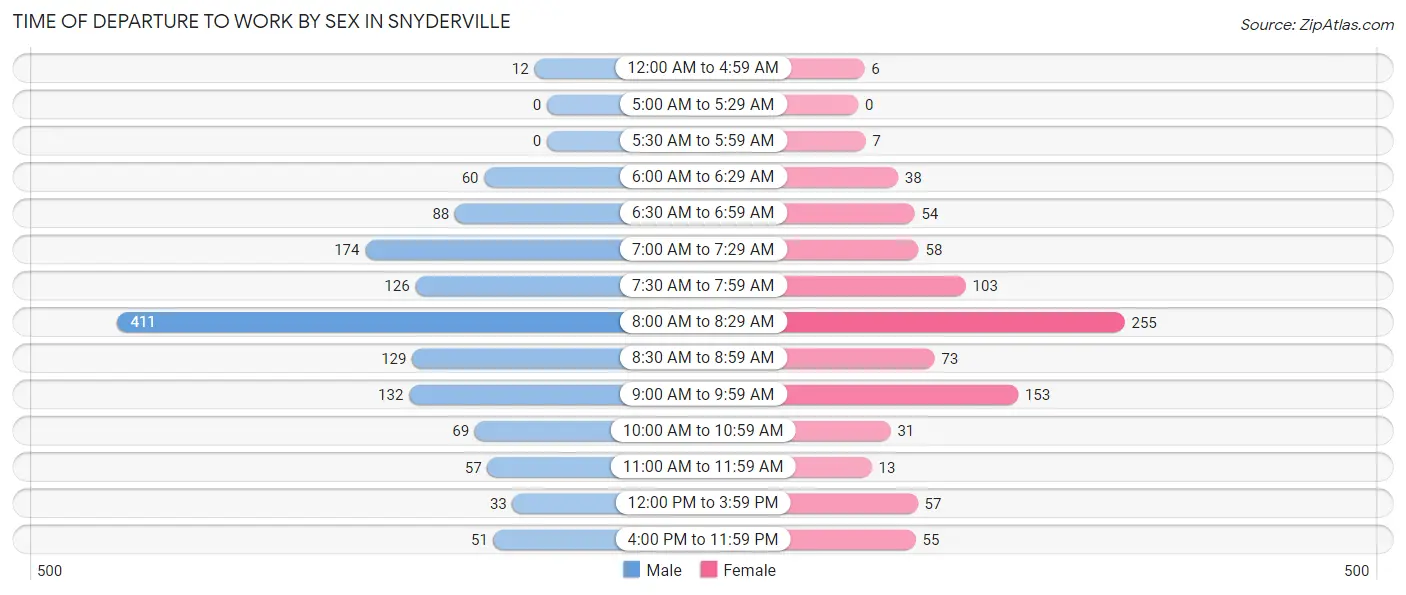
| Time of Departure | Male | Female |
| 12:00 AM to 4:59 AM | 12 (0.9%) | 6 (0.7%) |
| 5:00 AM to 5:29 AM | 0 (0.0%) | 0 (0.0%) |
| 5:30 AM to 5:59 AM | 0 (0.0%) | 7 (0.8%) |
| 6:00 AM to 6:29 AM | 60 (4.5%) | 38 (4.2%) |
| 6:30 AM to 6:59 AM | 88 (6.6%) | 54 (6.0%) |
| 7:00 AM to 7:29 AM | 174 (13.0%) | 58 (6.4%) |
| 7:30 AM to 7:59 AM | 126 (9.4%) | 103 (11.4%) |
| 8:00 AM to 8:29 AM | 411 (30.6%) | 255 (28.2%) |
| 8:30 AM to 8:59 AM | 129 (9.6%) | 73 (8.1%) |
| 9:00 AM to 9:59 AM | 132 (9.8%) | 153 (16.9%) |
| 10:00 AM to 10:59 AM | 69 (5.1%) | 31 (3.4%) |
| 11:00 AM to 11:59 AM | 57 (4.3%) | 13 (1.4%) |
| 12:00 PM to 3:59 PM | 33 (2.5%) | 57 (6.3%) |
| 4:00 PM to 11:59 PM | 51 (3.8%) | 55 (6.1%) |
| Total | 1,342 (100.0%) | 903 (100.0%) |
Housing Occupancy in Snyderville
Occupancy by Ownership in Snyderville
Of the total 2,130 dwellings in Snyderville, owner-occupied units account for 1,654 (77.6%), while renter-occupied units make up 476 (22.4%).
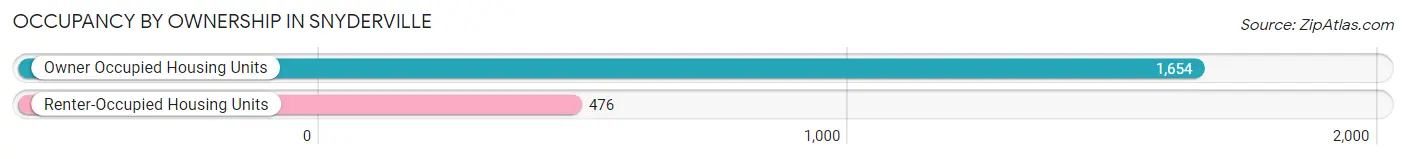
| Occupancy | # Housing Units | % Housing Units |
| Owner Occupied Housing Units | 1,654 | 77.6% |
| Renter-Occupied Housing Units | 476 | 22.4% |
| Total Occupied Housing Units | 2,130 | 100.0% |
Occupancy by Household Size in Snyderville
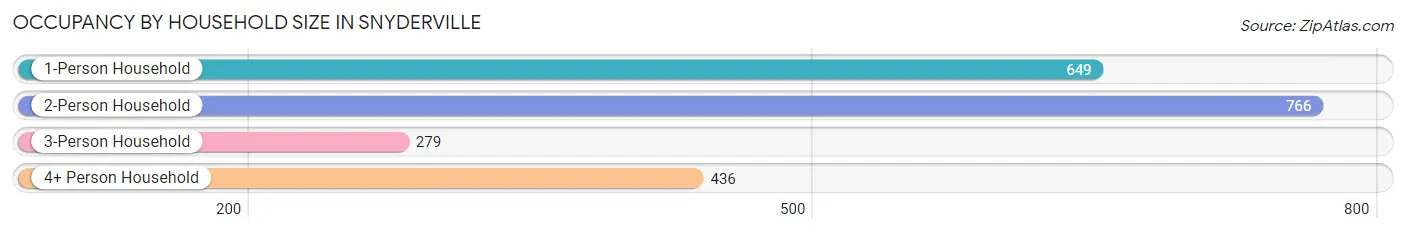
| Household Size | # Housing Units | % Housing Units |
| 1-Person Household | 649 | 30.5% |
| 2-Person Household | 766 | 36.0% |
| 3-Person Household | 279 | 13.1% |
| 4+ Person Household | 436 | 20.5% |
| Total Housing Units | 2,130 | 100.0% |
Occupancy by Ownership by Household Size in Snyderville
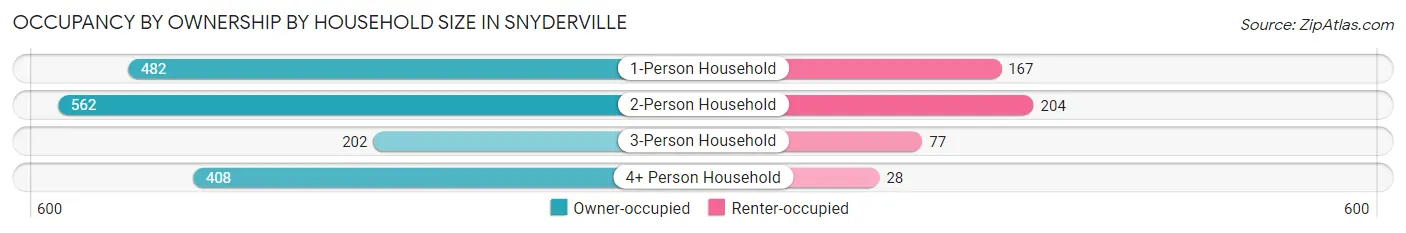
| Household Size | Owner-occupied | Renter-occupied |
| 1-Person Household | 482 (74.3%) | 167 (25.7%) |
| 2-Person Household | 562 (73.4%) | 204 (26.6%) |
| 3-Person Household | 202 (72.4%) | 77 (27.6%) |
| 4+ Person Household | 408 (93.6%) | 28 (6.4%) |
| Total Housing Units | 1,654 (77.6%) | 476 (22.4%) |
Occupancy by Educational Attainment in Snyderville
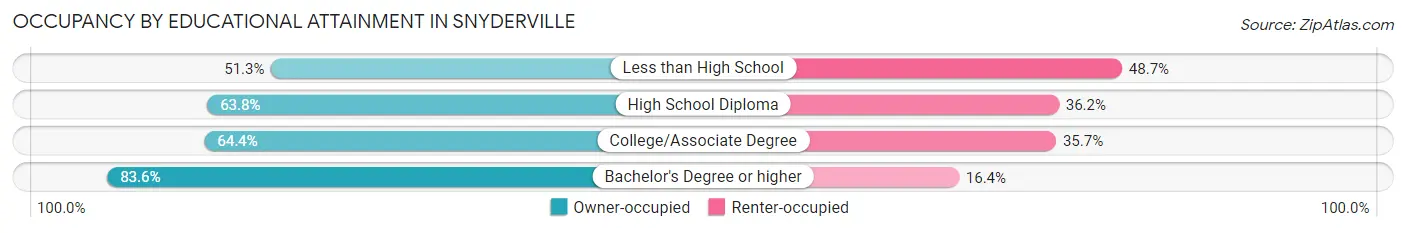
| Household Size | Owner-occupied | Renter-occupied |
| Less than High School | 20 (51.3%) | 19 (48.7%) |
| High School Diploma | 74 (63.8%) | 42 (36.2%) |
| College/Associate Degree | 305 (64.3%) | 169 (35.6%) |
| Bachelor's Degree or higher | 1,255 (83.6%) | 246 (16.4%) |
Occupancy by Age of Householder in Snyderville
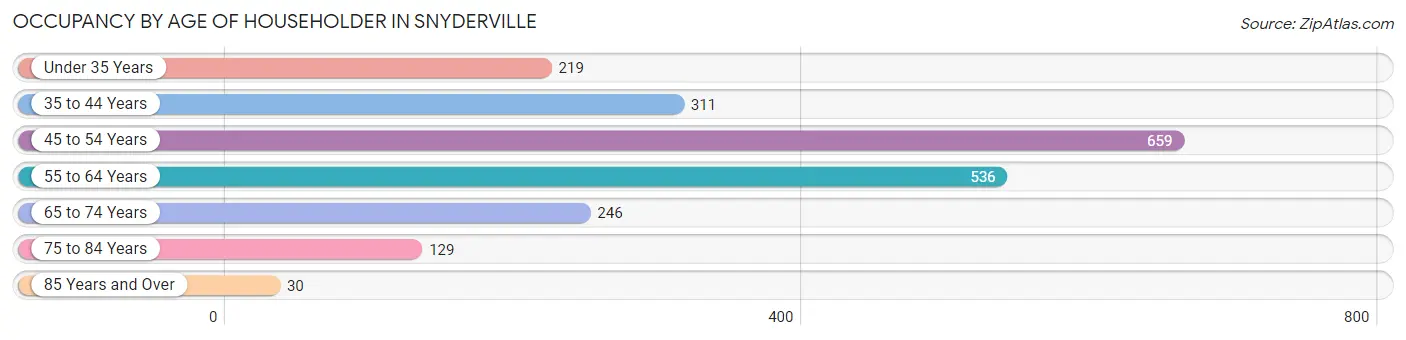
| Age Bracket | # Households | % Households |
| Under 35 Years | 219 | 10.3% |
| 35 to 44 Years | 311 | 14.6% |
| 45 to 54 Years | 659 | 30.9% |
| 55 to 64 Years | 536 | 25.2% |
| 65 to 74 Years | 246 | 11.6% |
| 75 to 84 Years | 129 | 6.1% |
| 85 Years and Over | 30 | 1.4% |
| Total | 2,130 | 100.0% |
Housing Finances in Snyderville
Median Income by Occupancy in Snyderville
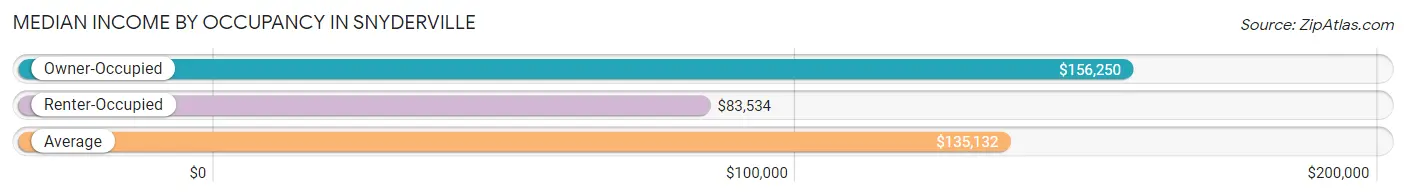
| Occupancy Type | # Households | Median Income |
| Owner-Occupied | 1,654 (77.6%) | $156,250 |
| Renter-Occupied | 476 (22.4%) | $83,534 |
| Average | 2,130 (100.0%) | $135,132 |
Occupancy by Householder Income Bracket in Snyderville
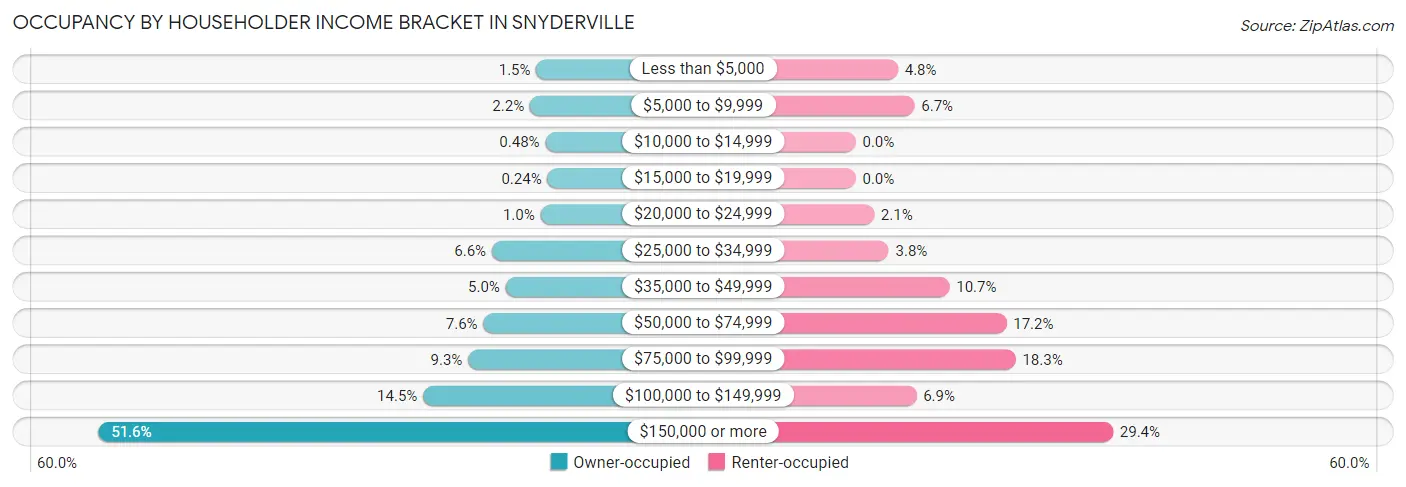
| Income Bracket | Owner-occupied | Renter-occupied |
| Less than $5,000 | 25 (1.5%) | 23 (4.8%) |
| $5,000 to $9,999 | 37 (2.2%) | 32 (6.7%) |
| $10,000 to $14,999 | 8 (0.5%) | 0 (0.0%) |
| $15,000 to $19,999 | 4 (0.2%) | 0 (0.0%) |
| $20,000 to $24,999 | 17 (1.0%) | 10 (2.1%) |
| $25,000 to $34,999 | 109 (6.6%) | 18 (3.8%) |
| $35,000 to $49,999 | 83 (5.0%) | 51 (10.7%) |
| $50,000 to $74,999 | 125 (7.6%) | 82 (17.2%) |
| $75,000 to $99,999 | 154 (9.3%) | 87 (18.3%) |
| $100,000 to $149,999 | 239 (14.4%) | 33 (6.9%) |
| $150,000 or more | 853 (51.6%) | 140 (29.4%) |
| Total | 1,654 (100.0%) | 476 (100.0%) |
Monthly Housing Cost Tiers in Snyderville
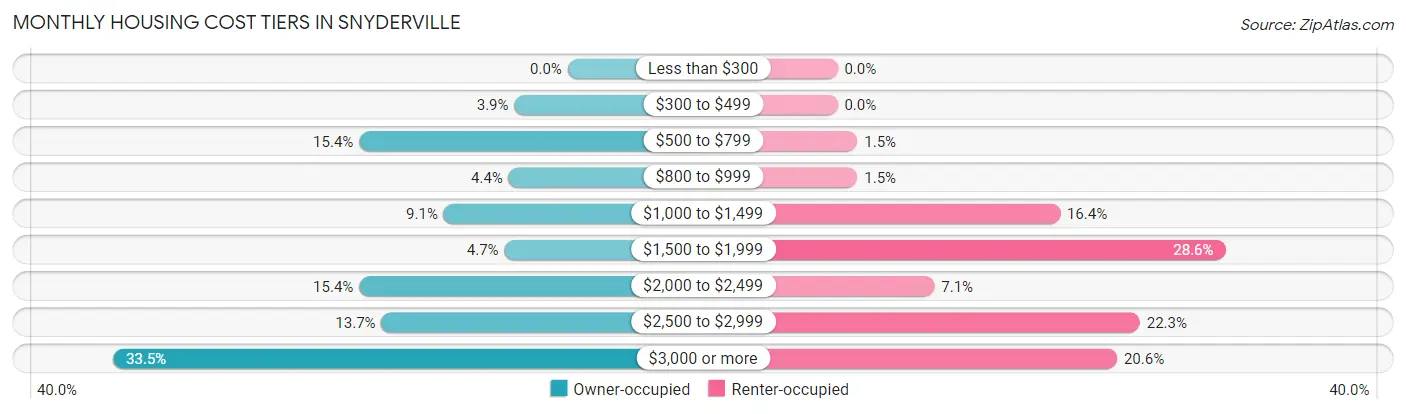
| Monthly Cost | Owner-occupied | Renter-occupied |
| Less than $300 | 0 (0.0%) | 0 (0.0%) |
| $300 to $499 | 65 (3.9%) | 0 (0.0%) |
| $500 to $799 | 254 (15.4%) | 7 (1.5%) |
| $800 to $999 | 72 (4.3%) | 7 (1.5%) |
| $1,000 to $1,499 | 151 (9.1%) | 78 (16.4%) |
| $1,500 to $1,999 | 77 (4.7%) | 136 (28.6%) |
| $2,000 to $2,499 | 254 (15.4%) | 34 (7.1%) |
| $2,500 to $2,999 | 227 (13.7%) | 106 (22.3%) |
| $3,000 or more | 554 (33.5%) | 98 (20.6%) |
| Total | 1,654 (100.0%) | 476 (100.0%) |
Physical Housing Characteristics in Snyderville
Housing Structures in Snyderville
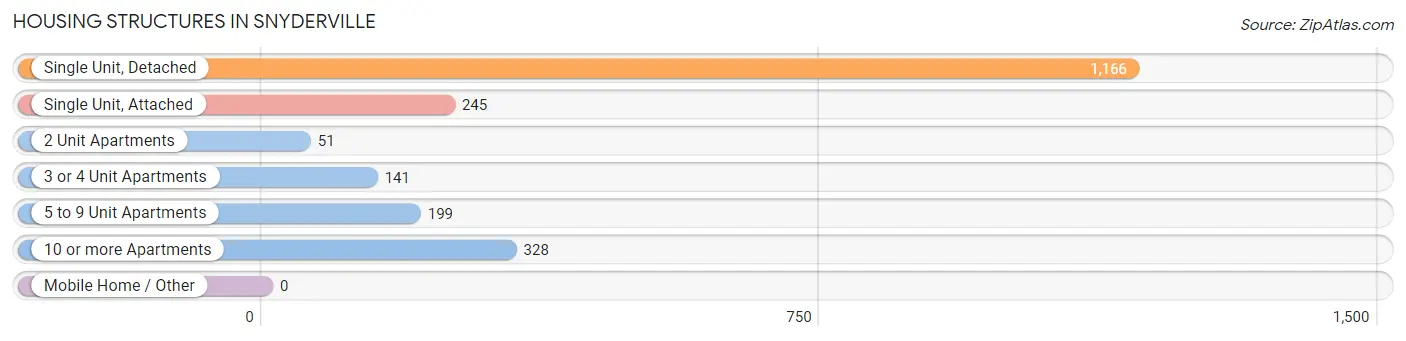
| Structure Type | # Housing Units | % Housing Units |
| Single Unit, Detached | 1,166 | 54.7% |
| Single Unit, Attached | 245 | 11.5% |
| 2 Unit Apartments | 51 | 2.4% |
| 3 or 4 Unit Apartments | 141 | 6.6% |
| 5 to 9 Unit Apartments | 199 | 9.3% |
| 10 or more Apartments | 328 | 15.4% |
| Mobile Home / Other | 0 | 0.0% |
| Total | 2,130 | 100.0% |
Housing Structures by Occupancy in Snyderville
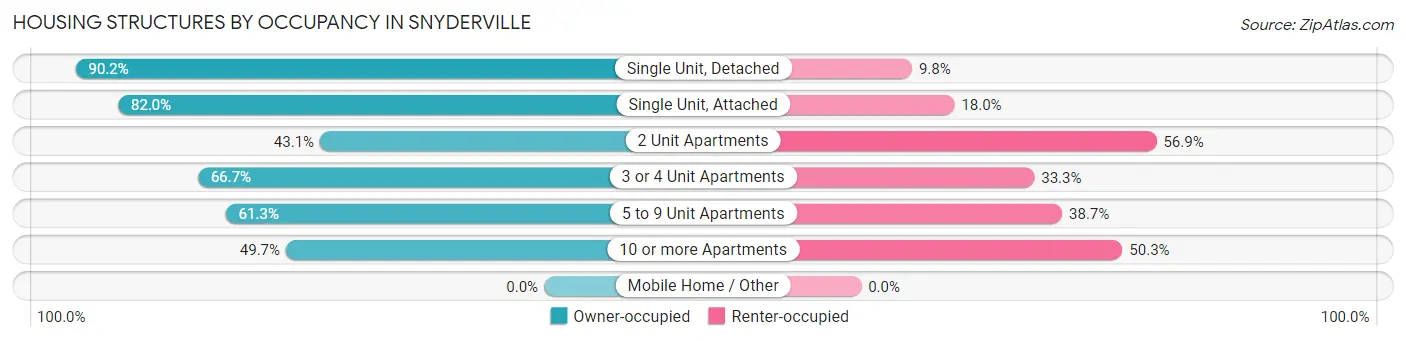
| Structure Type | Owner-occupied | Renter-occupied |
| Single Unit, Detached | 1,052 (90.2%) | 114 (9.8%) |
| Single Unit, Attached | 201 (82.0%) | 44 (18.0%) |
| 2 Unit Apartments | 22 (43.1%) | 29 (56.9%) |
| 3 or 4 Unit Apartments | 94 (66.7%) | 47 (33.3%) |
| 5 to 9 Unit Apartments | 122 (61.3%) | 77 (38.7%) |
| 10 or more Apartments | 163 (49.7%) | 165 (50.3%) |
| Mobile Home / Other | 0 (0.0%) | 0 (0.0%) |
| Total | 1,654 (77.6%) | 476 (22.4%) |
Housing Structures by Number of Rooms in Snyderville
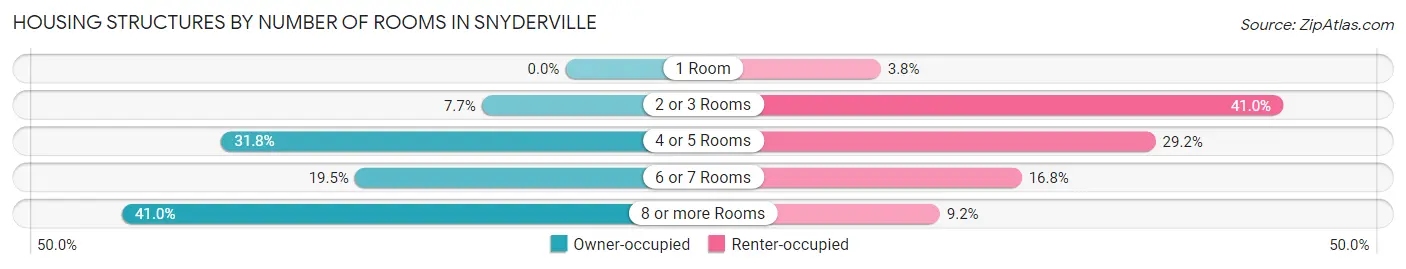
| Number of Rooms | Owner-occupied | Renter-occupied |
| 1 Room | 0 (0.0%) | 18 (3.8%) |
| 2 or 3 Rooms | 128 (7.7%) | 195 (41.0%) |
| 4 or 5 Rooms | 526 (31.8%) | 139 (29.2%) |
| 6 or 7 Rooms | 322 (19.5%) | 80 (16.8%) |
| 8 or more Rooms | 678 (41.0%) | 44 (9.2%) |
| Total | 1,654 (100.0%) | 476 (100.0%) |
Housing Structure by Heating Type in Snyderville
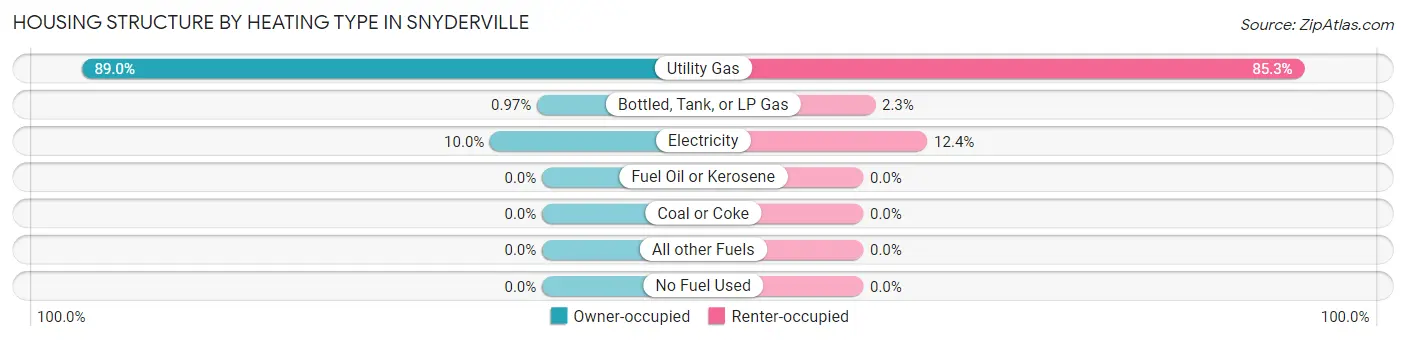
| Heating Type | Owner-occupied | Renter-occupied |
| Utility Gas | 1,472 (89.0%) | 406 (85.3%) |
| Bottled, Tank, or LP Gas | 16 (1.0%) | 11 (2.3%) |
| Electricity | 166 (10.0%) | 59 (12.4%) |
| Fuel Oil or Kerosene | 0 (0.0%) | 0 (0.0%) |
| Coal or Coke | 0 (0.0%) | 0 (0.0%) |
| All other Fuels | 0 (0.0%) | 0 (0.0%) |
| No Fuel Used | 0 (0.0%) | 0 (0.0%) |
| Total | 1,654 (100.0%) | 476 (100.0%) |
Household Vehicle Usage in Snyderville
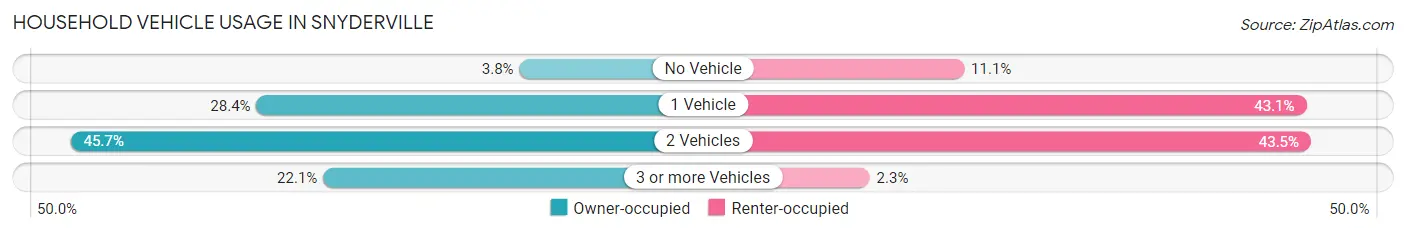
| Vehicles per Household | Owner-occupied | Renter-occupied |
| No Vehicle | 63 (3.8%) | 53 (11.1%) |
| 1 Vehicle | 469 (28.4%) | 205 (43.1%) |
| 2 Vehicles | 756 (45.7%) | 207 (43.5%) |
| 3 or more Vehicles | 366 (22.1%) | 11 (2.3%) |
| Total | 1,654 (100.0%) | 476 (100.0%) |
Real Estate & Mortgages in Snyderville
Real Estate and Mortgage Overview in Snyderville
| Characteristic | Without Mortgage | With Mortgage |
| Housing Units | 493 | 1,161 |
| Median Property Value | $744,600 | $1,046,400 |
| Median Household Income | $126,250 | $653 |
| Monthly Housing Costs | $684 | $550 |
| Real Estate Taxes | $3,281 | $9 |
Property Value by Mortgage Status in Snyderville
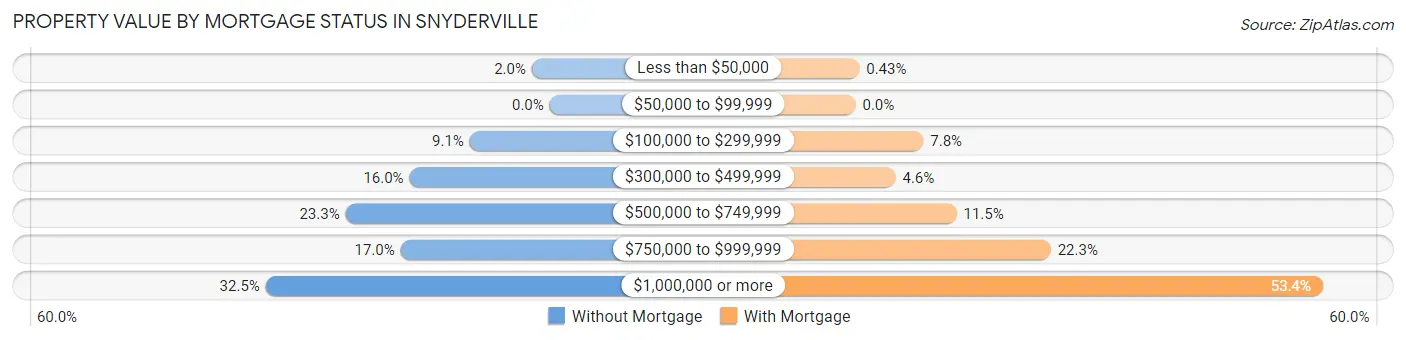
| Property Value | Without Mortgage | With Mortgage |
| Less than $50,000 | 10 (2.0%) | 5 (0.4%) |
| $50,000 to $99,999 | 0 (0.0%) | 0 (0.0%) |
| $100,000 to $299,999 | 45 (9.1%) | 90 (7.7%) |
| $300,000 to $499,999 | 79 (16.0%) | 53 (4.6%) |
| $500,000 to $749,999 | 115 (23.3%) | 134 (11.5%) |
| $750,000 to $999,999 | 84 (17.0%) | 259 (22.3%) |
| $1,000,000 or more | 160 (32.5%) | 620 (53.4%) |
| Total | 493 (100.0%) | 1,161 (100.0%) |
Household Income by Mortgage Status in Snyderville
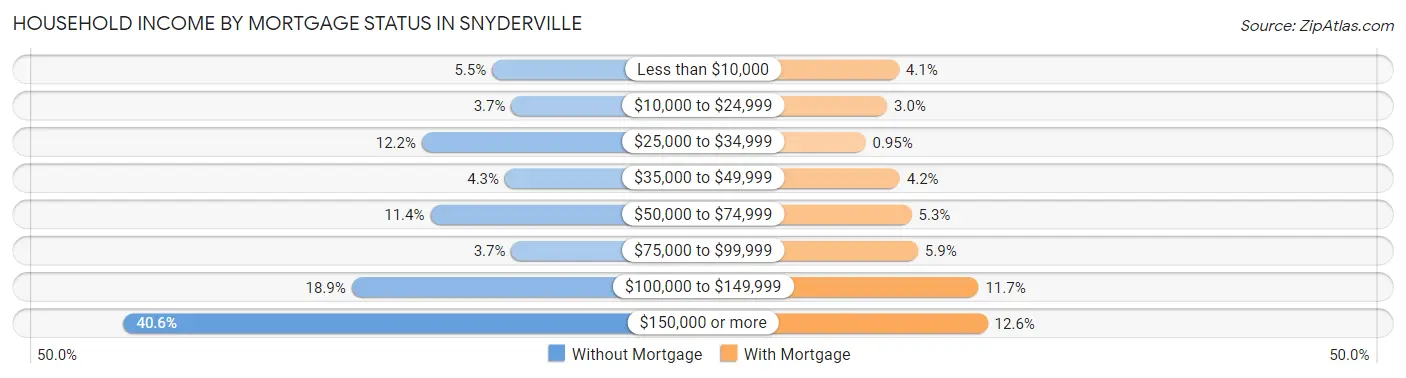
| Household Income | Without Mortgage | With Mortgage |
| Less than $10,000 | 27 (5.5%) | 48 (4.1%) |
| $10,000 to $24,999 | 18 (3.6%) | 35 (3.0%) |
| $25,000 to $34,999 | 60 (12.2%) | 11 (0.9%) |
| $35,000 to $49,999 | 21 (4.3%) | 49 (4.2%) |
| $50,000 to $74,999 | 56 (11.4%) | 62 (5.3%) |
| $75,000 to $99,999 | 18 (3.6%) | 69 (5.9%) |
| $100,000 to $149,999 | 93 (18.9%) | 136 (11.7%) |
| $150,000 or more | 200 (40.6%) | 146 (12.6%) |
| Total | 493 (100.0%) | 1,161 (100.0%) |
Property Value to Household Income Ratio in Snyderville
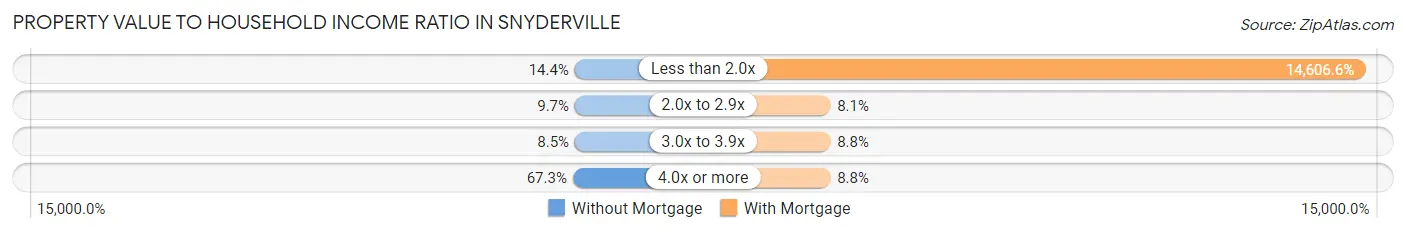
| Value-to-Income Ratio | Without Mortgage | With Mortgage |
| Less than 2.0x | 71 (14.4%) | 169,583 (14,606.6%) |
| 2.0x to 2.9x | 48 (9.7%) | 94 (8.1%) |
| 3.0x to 3.9x | 42 (8.5%) | 102 (8.8%) |
| 4.0x or more | 332 (67.3%) | 102 (8.8%) |
| Total | 493 (100.0%) | 1,161 (100.0%) |
Real Estate Taxes by Mortgage Status in Snyderville
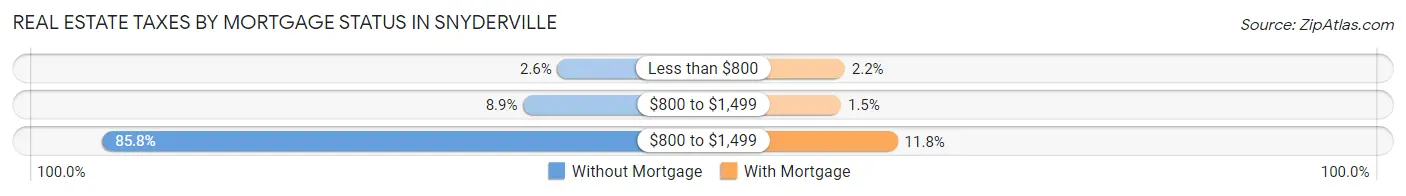
| Property Taxes | Without Mortgage | With Mortgage |
| Less than $800 | 13 (2.6%) | 25 (2.1%) |
| $800 to $1,499 | 44 (8.9%) | 17 (1.5%) |
| $800 to $1,499 | 423 (85.8%) | 137 (11.8%) |
| Total | 493 (100.0%) | 1,161 (100.0%) |
Health & Disability in Snyderville
Health Insurance Coverage by Age in Snyderville
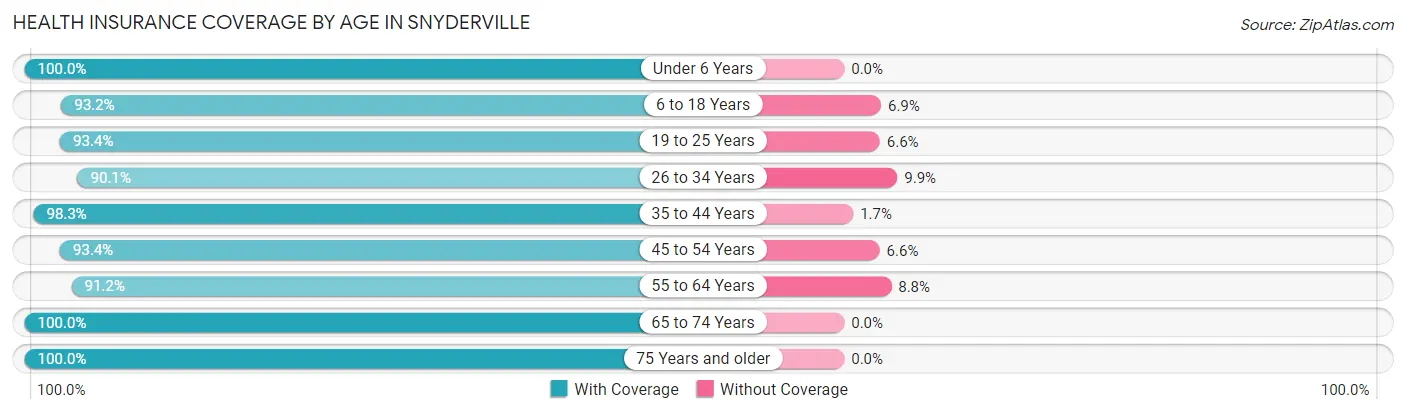
| Age Bracket | With Coverage | Without Coverage |
| Under 6 Years | 290 (100.0%) | 0 (0.0%) |
| 6 to 18 Years | 939 (93.1%) | 69 (6.9%) |
| 19 to 25 Years | 324 (93.4%) | 23 (6.6%) |
| 26 to 34 Years | 492 (90.1%) | 54 (9.9%) |
| 35 to 44 Years | 713 (98.3%) | 12 (1.7%) |
| 45 to 54 Years | 1,162 (93.4%) | 82 (6.6%) |
| 55 to 64 Years | 802 (91.2%) | 77 (8.8%) |
| 65 to 74 Years | 391 (100.0%) | 0 (0.0%) |
| 75 Years and older | 300 (100.0%) | 0 (0.0%) |
| Total | 5,413 (94.5%) | 317 (5.5%) |
Health Insurance Coverage by Citizenship Status in Snyderville
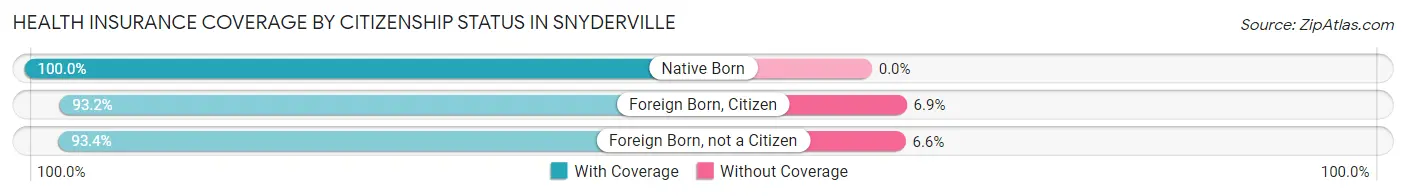
| Citizenship Status | With Coverage | Without Coverage |
| Native Born | 290 (100.0%) | 0 (0.0%) |
| Foreign Born, Citizen | 939 (93.1%) | 69 (6.9%) |
| Foreign Born, not a Citizen | 324 (93.4%) | 23 (6.6%) |
Health Insurance Coverage by Household Income in Snyderville
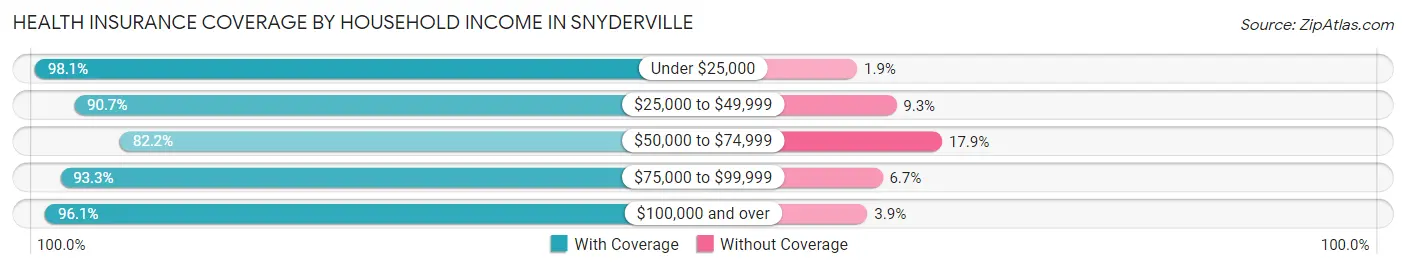
| Household Income | With Coverage | Without Coverage |
| Under $25,000 | 203 (98.1%) | 4 (1.9%) |
| $25,000 to $49,999 | 342 (90.7%) | 35 (9.3%) |
| $50,000 to $74,999 | 382 (82.2%) | 83 (17.8%) |
| $75,000 to $99,999 | 489 (93.3%) | 35 (6.7%) |
| $100,000 and over | 3,988 (96.1%) | 160 (3.9%) |
Public vs Private Health Insurance Coverage by Age in Snyderville
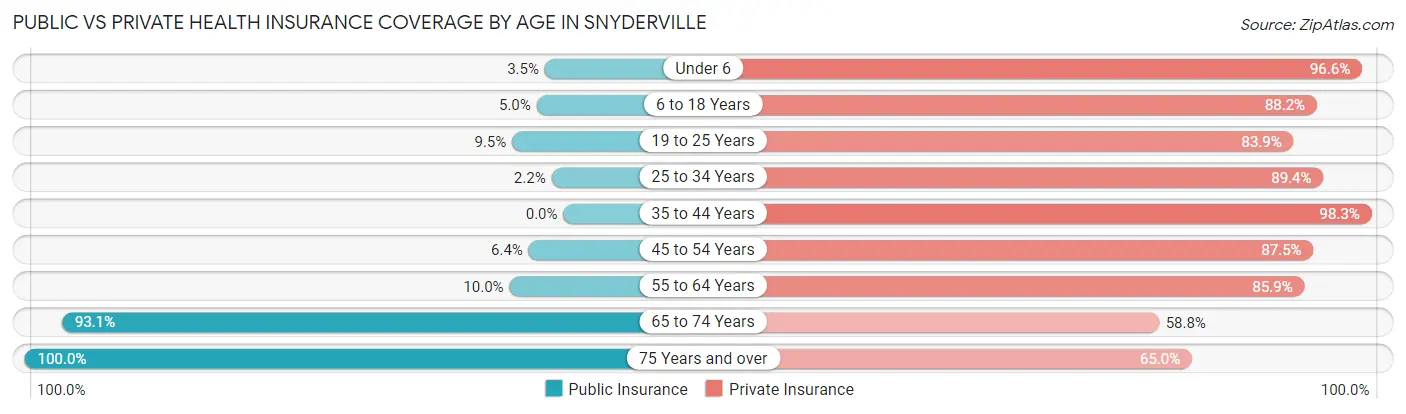
| Age Bracket | Public Insurance | Private Insurance |
| Under 6 | 10 (3.5%) | 280 (96.6%) |
| 6 to 18 Years | 50 (5.0%) | 889 (88.2%) |
| 19 to 25 Years | 33 (9.5%) | 291 (83.9%) |
| 25 to 34 Years | 12 (2.2%) | 488 (89.4%) |
| 35 to 44 Years | 0 (0.0%) | 713 (98.3%) |
| 45 to 54 Years | 80 (6.4%) | 1,089 (87.5%) |
| 55 to 64 Years | 88 (10.0%) | 755 (85.9%) |
| 65 to 74 Years | 364 (93.1%) | 230 (58.8%) |
| 75 Years and over | 300 (100.0%) | 195 (65.0%) |
| Total | 937 (16.4%) | 4,930 (86.0%) |
Disability Status by Sex by Age in Snyderville
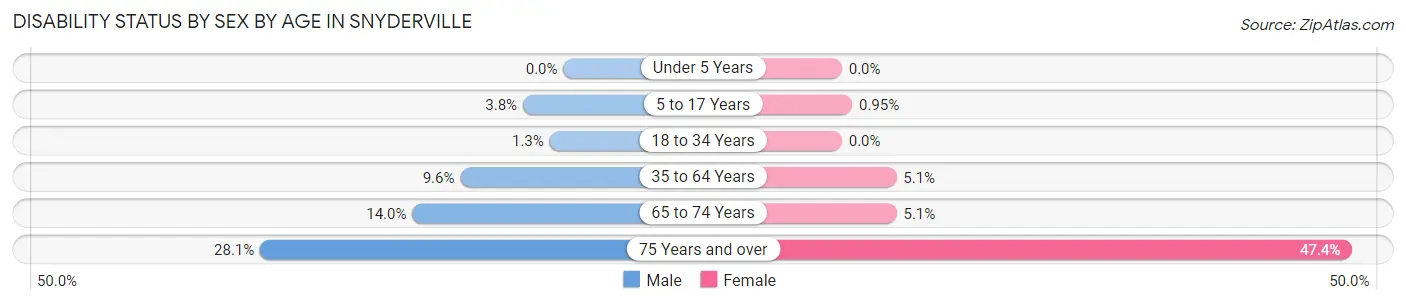
| Age Bracket | Male | Female |
| Under 5 Years | 0 (0.0%) | 0 (0.0%) |
| 5 to 17 Years | 18 (3.7%) | 4 (0.9%) |
| 18 to 34 Years | 7 (1.3%) | 0 (0.0%) |
| 35 to 64 Years | 140 (9.6%) | 70 (5.1%) |
| 65 to 74 Years | 30 (14.0%) | 9 (5.1%) |
| 75 Years and over | 47 (28.1%) | 63 (47.4%) |
Disability Class by Sex by Age in Snyderville
Disability Class: Hearing Difficulty
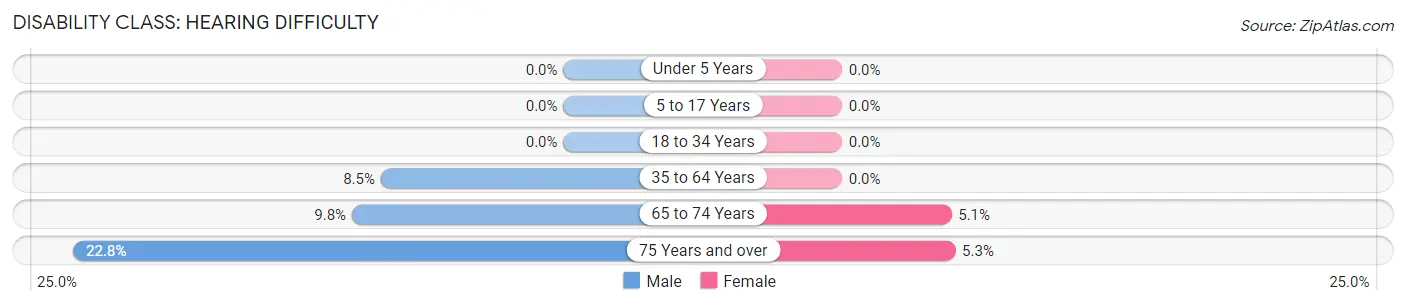
| Age Bracket | Male | Female |
| Under 5 Years | 0 (0.0%) | 0 (0.0%) |
| 5 to 17 Years | 0 (0.0%) | 0 (0.0%) |
| 18 to 34 Years | 0 (0.0%) | 0 (0.0%) |
| 35 to 64 Years | 124 (8.5%) | 0 (0.0%) |
| 65 to 74 Years | 21 (9.8%) | 9 (5.1%) |
| 75 Years and over | 38 (22.8%) | 7 (5.3%) |
Disability Class: Vision Difficulty
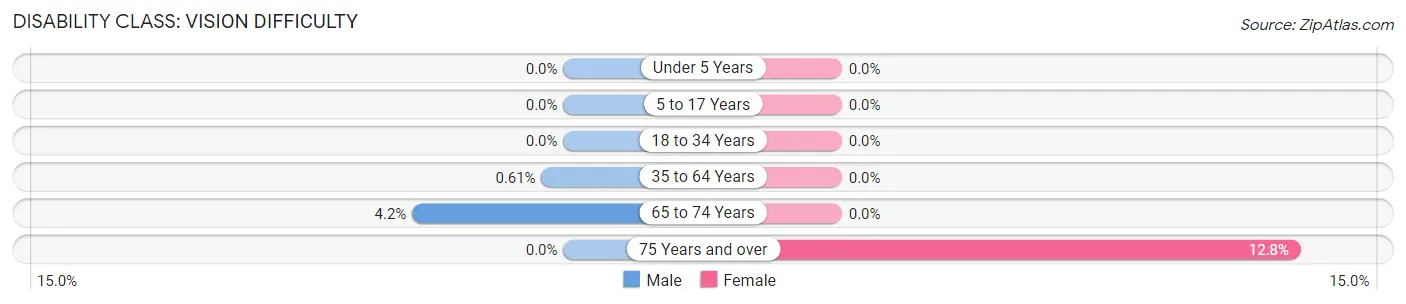
| Age Bracket | Male | Female |
| Under 5 Years | 0 (0.0%) | 0 (0.0%) |
| 5 to 17 Years | 0 (0.0%) | 0 (0.0%) |
| 18 to 34 Years | 0 (0.0%) | 0 (0.0%) |
| 35 to 64 Years | 9 (0.6%) | 0 (0.0%) |
| 65 to 74 Years | 9 (4.2%) | 0 (0.0%) |
| 75 Years and over | 0 (0.0%) | 17 (12.8%) |
Disability Class: Cognitive Difficulty
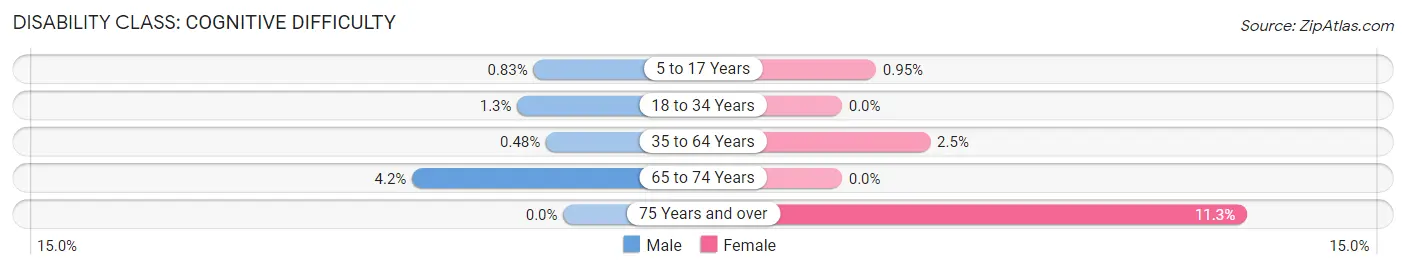
| Age Bracket | Male | Female |
| 5 to 17 Years | 4 (0.8%) | 4 (0.9%) |
| 18 to 34 Years | 7 (1.3%) | 0 (0.0%) |
| 35 to 64 Years | 7 (0.5%) | 34 (2.5%) |
| 65 to 74 Years | 9 (4.2%) | 0 (0.0%) |
| 75 Years and over | 0 (0.0%) | 15 (11.3%) |
Disability Class: Ambulatory Difficulty
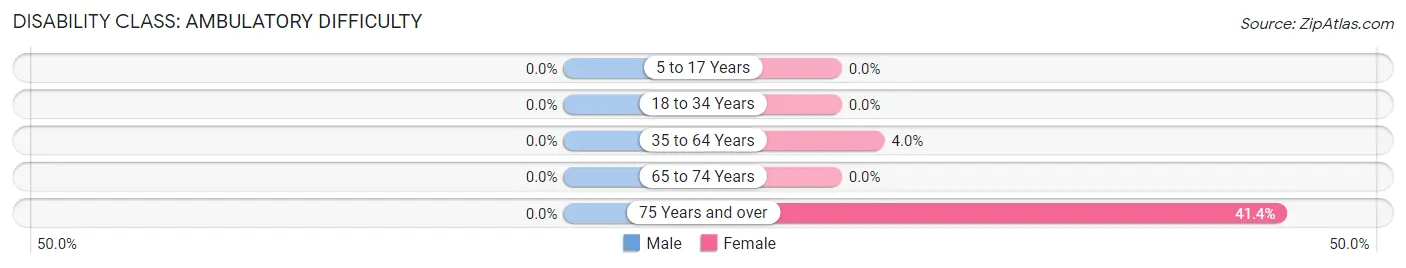
| Age Bracket | Male | Female |
| 5 to 17 Years | 0 (0.0%) | 0 (0.0%) |
| 18 to 34 Years | 0 (0.0%) | 0 (0.0%) |
| 35 to 64 Years | 0 (0.0%) | 55 (4.0%) |
| 65 to 74 Years | 0 (0.0%) | 0 (0.0%) |
| 75 Years and over | 0 (0.0%) | 55 (41.3%) |
Disability Class: Self-Care Difficulty
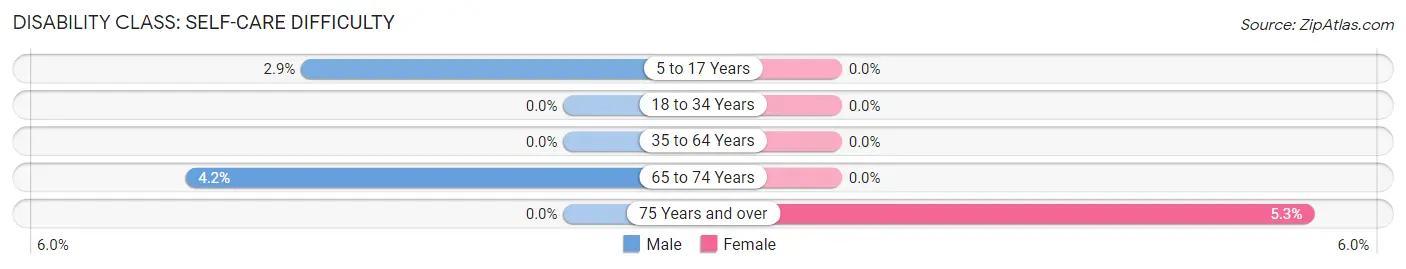
| Age Bracket | Male | Female |
| 5 to 17 Years | 14 (2.9%) | 0 (0.0%) |
| 18 to 34 Years | 0 (0.0%) | 0 (0.0%) |
| 35 to 64 Years | 0 (0.0%) | 0 (0.0%) |
| 65 to 74 Years | 9 (4.2%) | 0 (0.0%) |
| 75 Years and over | 0 (0.0%) | 7 (5.3%) |
Technology Access in Snyderville
Computing Device Access in Snyderville
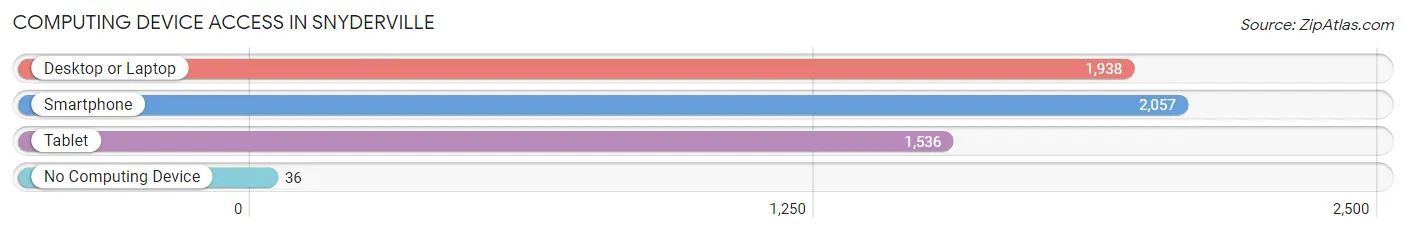
| Device Type | # Households | % Households |
| Desktop or Laptop | 1,938 | 91.0% |
| Smartphone | 2,057 | 96.6% |
| Tablet | 1,536 | 72.1% |
| No Computing Device | 36 | 1.7% |
| Total | 2,130 | 100.0% |
Internet Access in Snyderville
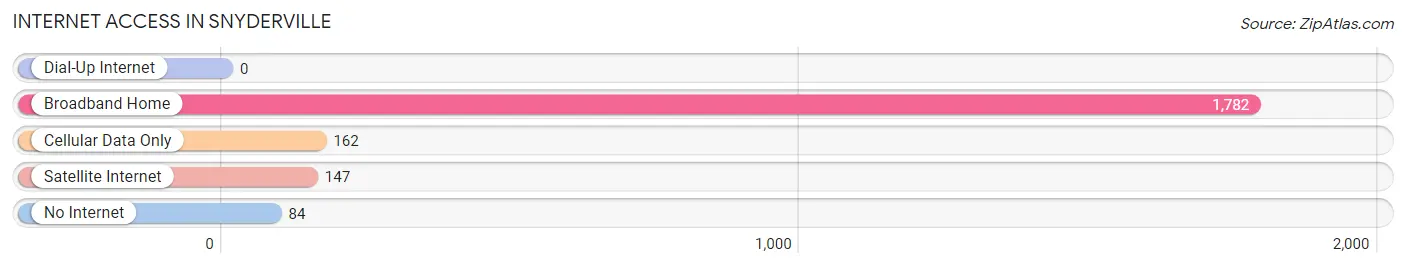
| Internet Type | # Households | % Households |
| Dial-Up Internet | 0 | 0.0% |
| Broadband Home | 1,782 | 83.7% |
| Cellular Data Only | 162 | 7.6% |
| Satellite Internet | 147 | 6.9% |
| No Internet | 84 | 3.9% |
| Total | 2,130 | 100.0% |
Snyderville Summary
Snyderville, Utah is a small unincorporated community located in Summit County, Utah. It is situated in the Wasatch Mountains, approximately 8 miles east of Park City and 30 miles east of Salt Lake City. The population of Snyderville was estimated to be 1,845 in 2019.
History
Snyderville was first settled in the late 1800s by Mormon pioneers. The area was originally known as “Snyderville Station”, named after the Snyders, a family of early settlers. The Snyders were among the first to settle in the area and were instrumental in the development of the community.
In the early 1900s, the area was primarily used for ranching and farming. In the 1950s, the area began to experience rapid growth due to the development of the nearby ski resorts. This growth continued throughout the 1970s and 1980s, and Snyderville was officially incorporated in 1988.
Geography
Snyderville is located in the Wasatch Mountains, at an elevation of 6,400 feet. The area is characterized by steep terrain and is home to several ski resorts, including Park City Mountain Resort, Deer Valley Resort, and The Canyons. The area is also home to several hiking trails, including the popular Wasatch Crest Trail.
The climate in Snyderville is generally mild, with cold winters and warm summers. The average annual temperature is approximately 40°F, with an average high of 68°F in the summer and an average low of 22°F in the winter.
Economy
The economy of Snyderville is largely driven by tourism. The area is home to several ski resorts, which attract visitors from around the world. In addition, the area is home to several restaurants, bars, and shops, which cater to both locals and tourists.
The area is also home to several businesses, including construction companies, real estate firms, and financial services. The area is also home to several technology companies, including the software company Adobe Systems.
Demographics
The population of Snyderville was estimated to be 1,845 in 2019. The population is primarily white (90.2%), with a small percentage of Hispanic (4.2%) and Asian (2.3%) residents. The median household income is $90,000, and the median age is 38.
Snyderville is a small, close-knit community with a strong sense of community. The area is home to several churches, schools, and parks, and is known for its outdoor recreation opportunities. The area is also home to several art galleries, museums, and theaters, which attract visitors from around the world.
Common Questions
What is Per Capita Income in Snyderville?
Per Capita income in Snyderville is $74,186.
What is the Median Family Income in Snyderville?
Median Family Income in Snyderville is $181,250.
What is the Median Household income in Snyderville?
Median Household Income in Snyderville is $135,132.
What is Income or Wage Gap in Snyderville?
Income or Wage Gap in Snyderville is 24.8%.
Women in Snyderville earn 75.2 cents for every dollar earned by a man.
What is Inequality or Gini Index in Snyderville?
Inequality or Gini Index in Snyderville is 0.46.
What is the Total Population of Snyderville?
Total Population of Snyderville is 5,730.
What is the Total Male Population of Snyderville?
Total Male Population of Snyderville is 3,038.
What is the Total Female Population of Snyderville?
Total Female Population of Snyderville is 2,692.
What is the Ratio of Males per 100 Females in Snyderville?
There are 112.85 Males per 100 Females in Snyderville.
What is the Ratio of Females per 100 Males in Snyderville?
There are 88.61 Females per 100 Males in Snyderville.
What is the Median Population Age in Snyderville?
Median Population Age in Snyderville is 44.6 Years.
What is the Average Family Size in Snyderville
Average Family Size in Snyderville is 3.2 People.
What is the Average Household Size in Snyderville
Average Household Size in Snyderville is 2.7 People.
How Large is the Labor Force in Snyderville?
There are 3,220 People in the Labor Forcein in Snyderville.
What is the Percentage of People in the Labor Force in Snyderville?
68.8% of People are in the Labor Force in Snyderville.
What is the Unemployment Rate in Snyderville?
Unemployment Rate in Snyderville is 1.0%.