Zip Codes with the Highest Percentage of Population Employed in Food Preparation & Serving in Saint George, UT
RELATED REPORTS & OPTIONS
Food Preparation & Serving
Saint George
Compare Zip Codes
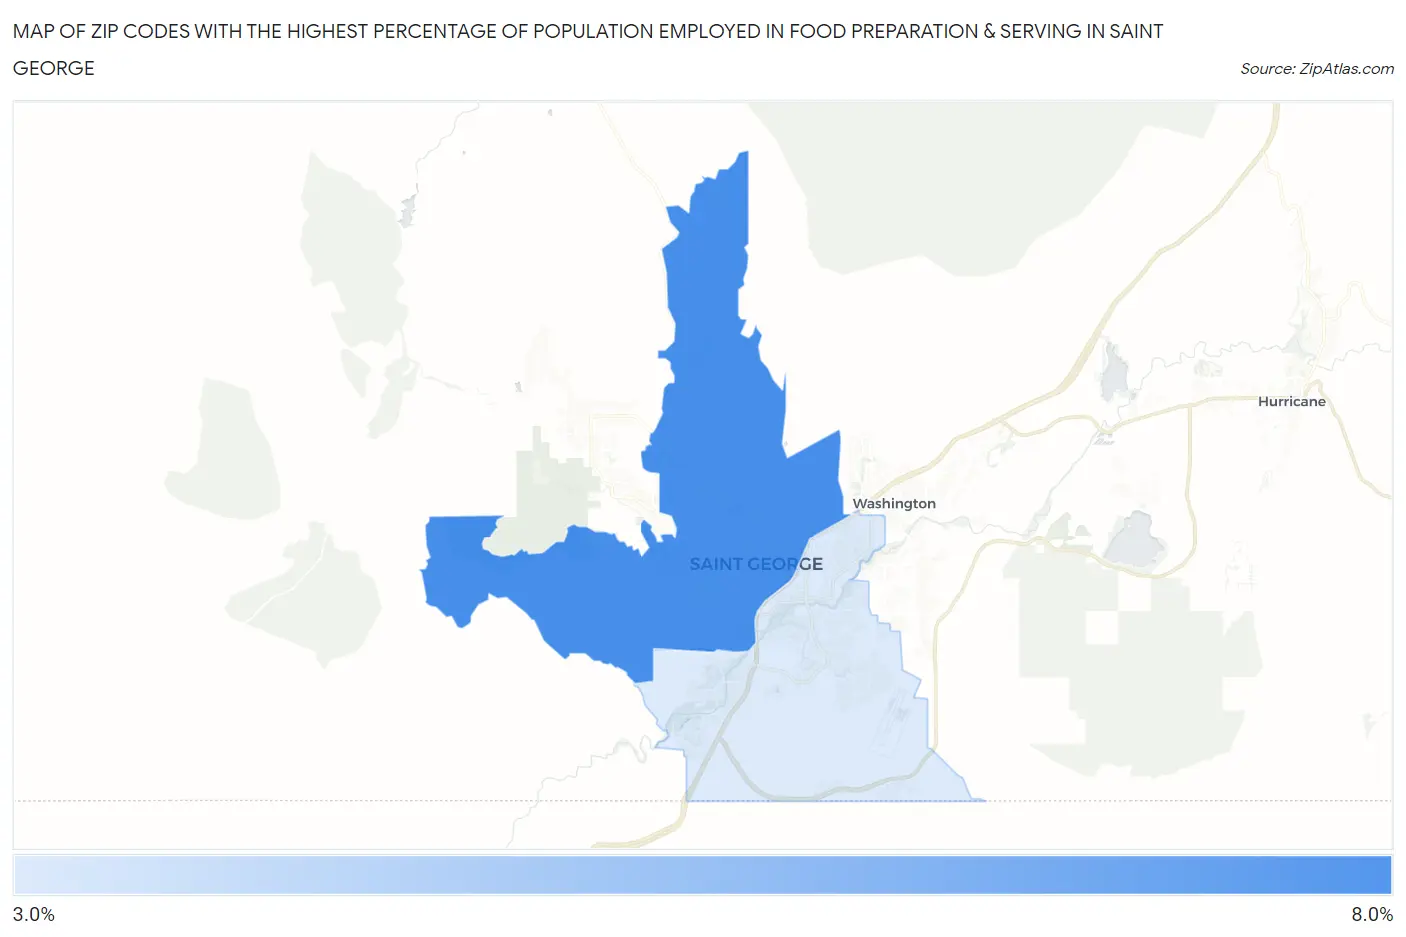
Map of Zip Codes with the Highest Percentage of Population Employed in Food Preparation & Serving in Saint George
4.0%
7.6%
Zip Codes with the Highest Percentage of Population Employed in Food Preparation & Serving in Saint George, UT
| Zip Code | % Employed | vs State | vs National | |
| 1. | 84770 | 7.6% | 4.5%(+3.04)#35 | 5.3%(+2.29)#5,414 |
| 2. | 84790 | 4.0% | 4.5%(-0.568)#128 | 5.3%(-1.32)#17,243 |
1
Common Questions
What are the Top Zip Codes with the Highest Percentage of Population Employed in Food Preparation & Serving in Saint George, UT?
Top Zip Codes with the Highest Percentage of Population Employed in Food Preparation & Serving in Saint George, UT are:
What zip code has the Highest Percentage of Population Employed in Food Preparation & Serving in Saint George, UT?
84770 has the Highest Percentage of Population Employed in Food Preparation & Serving in Saint George, UT with 7.6%.
What is the Percentage of Population Employed in Food Preparation & Serving in Utah?
Percentage of Population Employed in Food Preparation & Serving in Utah is 4.5%.
What is the Percentage of Population Employed in Food Preparation & Serving in the United States?
Percentage of Population Employed in Food Preparation & Serving in the United States is 5.3%.